INSEEGO CORP.
10-Ks and 10-Qs
|
|
|
|
|
|
|
|
|
|
|
|
|
|
|
|
|
|
|
|
|
|
|
|
|
|
|
|
|
|
|
|
|
|
|
|
|
|
|
|
|
|
|
|
|
|
|
|
|
|
|
|
|
|
|
|
|
|
|
|
|
|
UNITED STATES
SECURITIES AND EXCHANGE COMMISSION
Washington, DC 20549
FORM 10-K
|
x
|
ANNUAL REPORT PURSUANT TO SECTION 13 OR 15(d) OF THE SECURITIES EXCHANGE ACT OF 1934
|
For fiscal year ended
December 31, 2016
OR
|
¨
|
TRANSITION REPORT PURSUANT TO SECTION 13 OR 15(d) OF THE SECURITIES EXCHANGE ACT OF 1934
|
For the transition period from
to
Commission file number: 000-31659
INSEEGO CORP.
(Exact name of registrant as specified in its charter)
|
Delaware
|
|
81-3377646
|
|
(State or Other Jurisdiction
of Incorporation or Organization)
|
|
(I.R.S. Employer
Identification No.)
|
|
9605 Scranton Road, Suite 300
San Diego, California
|
|
92121
|
|
(Address of Principal Executive Offices)
|
|
(Zip Code)
|
Registrant’s telephone number, including area code: (858) 812-3400
Securities registered pursuant to Section 12(b) of the Act:
Common Stock, par value $0.001 per share
Securities registered pursuant to Section 12(g) of the Act: None
Indicate by check mark if the registrant is a well-known seasoned issuer, as defined in Rule 405 of the Securities Act. Yes
¨
No
x
Indicate by check mark if the registrant is not required to file reports pursuant to Section 13 or Section 15(d) of the Act. Yes
¨
No
x
Indicate by check mark whether the registrant (1) has filed all reports required to be filed by Section 13 or 15(d) of the Securities Exchange Act of 1934 during the preceding 12 months (or for such shorter period that the registrant was required to file such reports), and (2) has been subject to such filing requirements for the past 90 days. Yes
x
No
¨
Indicate by check mark whether the registrant has submitted electronically and posted on its corporate Website, if any, every Interactive Data File required to be submitted and posted pursuant to Rule 405 of Regulation S-T during the preceding 12 months (or for such shorter period that the registrant was required to submit and post such files). Yes
x
No
¨
Indicate by check mark if disclosure of delinquent filers pursuant to Item 405 of Regulation S-K is not contained herein, and will not be contained, to the best of registrant’s knowledge, in definitive proxy or information statements incorporated by reference in Part III of this Form 10-K or any amendment to this Form 10-K.
x
Indicate by check mark whether the registrant is a large accelerated filer, an accelerated filer, a non-accelerated filer, or a smaller reporting company. See the definitions of “large accelerated filer,” “accelerated filer” and “smaller reporting company” in Rule 12b-2 of the Exchange Act. (Check one):
Large accelerated filer
¨
Accelerated filer
x
Non-Accelerated filer
¨
Smaller Reporting Company
¨
Indicate by check mark whether the registrant is a shell company (as defined in Rule 12b-2 of the Exchange Act). Yes
¨
No
x
The aggregate market value of the voting common stock held by non-affiliates of the registrant, based on the closing price of the registrant’s common stock on June 30,
2016
, as reported by The Nasdaq Global Select Market, was approximately
$63.4 million
. For the purposes of this calculation, shares owned by officers and directors (and their affiliates) have been excluded. This exclusion is not intended, nor shall it be deemed, to be an admission that such persons are affiliates of the registrant. The registrant does not have any non-voting stock issued or outstanding.
The number of shares of the registrant’s common stock outstanding as of March 23,
2017
was
55,955,067
.
DOCUMENTS INCORPORATED BY REFERENCE
Portions of the registrant’s definitive proxy statement for the
2017
Annual Meeting of Stockholders to be filed with the Securities and Exchange Commission pursuant to Regulation 14A are incorporated by reference into Part III of this Form 10-K to the extent stated herein.
TABLE OF CONTENTS
|
|
Page
|
|
|
PART I
|
||
|
Item 1.
|
||
|
Item 1A.
|
||
|
Item 1B.
|
||
|
Item 2.
|
||
|
Item 3.
|
||
|
Item 4.
|
||
|
PART II
|
||
|
Item 5.
|
||
|
Item 6.
|
||
|
Item 7.
|
||
|
Item 7A.
|
||
|
Item 8.
|
||
|
Item 9.
|
||
|
Item 9A.
|
||
|
Item 9B.
|
||
|
PART III
|
||
|
Item 10.
|
||
|
Item 11.
|
||
|
Item 12.
|
||
|
Item 13.
|
||
|
Item 14.
|
||
|
PART IV
|
||
|
Item 15.
|
||
|
Item 16.
|
Form 10-K Summary
|
|
Forward-Looking Statements
This report contains forward-looking statements within the meaning of Section 27A of the Securities Act of 1933, as amended (the “Securities Act”) and Section 21E of the Securities Exchange Act of 1934, as amended. You should not place undue reliance on these statements. These forward-looking statements include statements that reflect the views of our senior management with respect to our current expectations, assumptions, estimates and projections about Inseego Corp. (the “Company” or “Inseego”) and our industry. These forward-looking statements speak only as of the date of this report. We disclaim any undertaking to publicly update or revise any forward-looking statements contained herein to reflect any change in our expectations with regard thereto or any change in events, conditions or circumstances on which any such statement is based. Statements that include the words “may,” “could,” “should,” “would,” “estimate,” “anticipate,” “believe,” “expect,” “preliminary,” “intend,” “plan,” “project,” “outlook,” “will” and similar words and phrases identify forward-looking statements. Forward-looking statements address matters that involve risks and uncertainties that could cause actual results to differ materially from those anticipated in these forward-looking statements as of the date of this report. We believe that these factors include those related to:
|
•
|
our ability to compete in the market for wireless broadband data access products, machine-to-machine (“M2M”) products, and telematics, vehicle tracking and fleet management products;
|
|
•
|
our ability to develop and timely introduce new products successfully;
|
|
•
|
our dependence on a small number of customers for a substantial portion of our revenues;
|
|
•
|
our ability to integrate the operations of R.E.R. Enterprises, Inc. (and its wholly-owned subsidiary and principal operating asset, Feeney Wireless, LLC (“FW”)), DigiCore Holdings Limited (“DigiCore” or “Ctrack”), and any business, products, technologies or personnel that we may acquire in the future, including: (i) our ability to retain key personnel from the acquired company or business and (ii) our ability to realize the anticipated benefits of the acquisition;
|
|
•
|
our ability to realize the benefits of recent divestiture and reorganization transactions;
|
|
•
|
our ability to introduce and sell new products that comply with current and evolving industry standards and government regulations;
|
|
•
|
our ability to develop and maintain strategic relationships to expand into new markets;
|
|
•
|
our ability to properly manage the growth of our business to avoid significant strains on our management and operations and disruptions to our business;
|
|
•
|
our reliance on third parties to manufacture our products;
|
|
•
|
our ability to accurately forecast customer demand and order the manufacture and timely delivery of sufficient product quantities;
|
|
•
|
our reliance on sole source suppliers for some products used in our solutions;
|
|
•
|
the continuing impact of uncertain global economic conditions on the demand for our products;
|
|
•
|
our ability to be cost competitive while meeting time-to-market requirements for our customers;
|
|
•
|
our ability to meet the product performance needs of our customers in M2M markets;
|
|
•
|
demand for fleet and vehicle management software-as-a-service telematics solutions;
|
|
•
|
our dependence on wireless telecommunication operators delivering acceptable wireless services;
|
|
•
|
the outcome of any pending or future litigation, including intellectual property litigation;
|
|
•
|
infringement claims with respect to intellectual property contained in our products;
|
|
•
|
our continued ability to license necessary third-party technology for the development and sale of our products;
|
|
•
|
the introduction of new products that could contain errors or defects;
|
|
•
|
doing business abroad, including foreign currency risks;
|
|
•
|
our ability to make focused investments in research and development; and
|
|
•
|
our ability to hire, retain and manage additional qualified personnel to maintain and expand our business.
|
The foregoing factors should not be construed as exhaustive and should be read together with the other cautionary statements included in this and other reports we file with the Securities and Exchange Commission (the “SEC”), including the
information in “Item 1A. Risk Factors” in Part I of this report. If one or more events related to these or other risks or uncertainties materialize, or if our underlying assumptions prove to be incorrect, actual results may differ materially from what we anticipate. Unless the context requires otherwise, in this Annual Report on Form 10-K the terms “we,” “us,” “our,” the “Company” and “Inseego” refer to Inseego Corp., a Delaware corporation, and its wholly owned subsidiaries.
Trademarks
“Inseego”, the Inseego logo, “Enfora”, the Enfora logo, “Spider”, “Enabling Information Anywhere”, “Enabler” and “N4A” are trademarks or registered trademarks of Inseego. “Novatel Wireless”, the Novatel Wireless logo, “MiFi”, “MiFi Intelligent Mobile Hotspot”, “MiFi OS”, “MiFi Powered”, “MiFi Home”, “MobiLink”, “Ovation”, “Expedite” and “MiFi Freedom. My Way.” are trademarks or registered trademarks of Novatel Wireless, Inc. (“Novatel Wireless”). “DigiCore”, “Ctrack” and the Ctrack logo are trademarks or registered trademarks of DigiCore. “FW”, “Crossroads” and the Feeney Wireless logo are trademarks or registered trademarks of FW.
Other trademarks, trade names or service marks used in this report are the property of their respective owners.
Item 1.
Business
Overview
Inseego Corp. is a leading global provider of software-as-a-service (“SaaS”) and solutions for the Internet of Things (“IoT”). We sell telematics solutions globally under the Ctrack™ brand, including our fleet management, asset tracking and monitoring, stolen vehicle recovery and usage-based insurance platforms. We also sell connectivity solutions and device management services. Our products and solutions provide anywhere, anytime communications and analytics for consumers and businesses of all sizes, with approximately
620,000
global subscribers, including
432,000
subscribers for our Ctrack branded fleet management and vehicle telematics solutions and
188,000
subscribers for our connectivity and device management services.
We have invented and reinvented ways in which the world stays connected and accesses information. With multiple first-to-market innovations and a strong and growing portfolio of hardware and software innovations for IoT, our companies have been advancing technology and driving industry transformation for over 30 years. It is this proven expertise and commitment to quality and innovation that makes us a preferred global partner of operators, distributors, system integrators, businesses and consumers.
Inseego is a Delaware corporation formed in 2016 and is the successor to Novatel Wireless, a Delaware corporation formed in 1996, as a result of an internal reorganization that was completed in November 2016 (the “Reorganization”) to separate the Company’s MiFi branded hotspots and USB modem product lines (the “MiFi Business”) from the assets and liabilities associated with our Ctrack fleet and vehicle telematics solutions and our business connectivity and device management solutions. Upon completion of the Reorganization, Novatel Wireless became a wholly-owned subsidiary of Inseego and Novatel Wireless’s former stockholders became stockholders of Inseego, with shares of Inseego common stock trading on The NASDAQ Global Select Market under the trading symbol “INSG.”
Recent and Pending Divestitures
On April 11, 2016, we signed a definitive Asset Purchase Agreement with Telit Technologies (Cyprus) Limited and Telit Wireless Solutions, Inc. (collectively, “Telit”) pursuant to which we sold, and Telit acquired, certain hardware modules and related assets (the “Modules Business”). With subsequent modifications pursuant to a Final Resolution Letter Agreement dated September 29, 2016, the aggregate purchase consideration for the Modules Business totaled $11.7 million, which consisted of $11.3 million in cash and $0.4 million in net settled company liabilities.
On September 21, 2016, we entered into a Stock Purchase Agreement (the “Purchase Agreement”), by and among Inseego and Novatel Wireless, on the one hand, and T.C.L. Industries Holdings (H.K.) Limited and Jade Ocean Global Limited (collectively, the “Purchasers”) on the other hand. The Purchase Agreement relates to the pending sale of our subsidiary, Novatel Wireless, which includes the MiFi Business, to the Purchasers for $50.0 million in cash, subject to potential adjustment for Novatel Wireless’s working capital as of the closing date. The sale may not close until all of the closing conditions set forth in the Purchase Agreement have been satisfied. One of the closing conditions is the approval of the Committee on Foreign Investment in the United States (“CFIUS”). CFIUS has identified national security concerns relating to our sale of the MiFi Business to the Purchasers. In early February 2017, the Company and the Purchasers voluntarily withdrew and re-filed their notice to CFIUS in order to obtain additional time to provide further information to CFIUS and explore potential mitigation measures that may allow the transaction to proceed. In early March 2017, CFIUS provided a draft mitigation agreement which, if finalized, would allow CFIUS approval to be granted. Negotiations between CFIUS and the Purchasers regarding the final terms of such mitigation agreement remain ongoing.
Our Sources of Revenue
For the years ended December 31,
2016
,
2015
and
2014
, the Company’s total net revenues were
$243.6 million
,
$220.9 million
and
$185.2 million
, respectively, including our divested Modules Business. Our MiFi Business generated solely hardware revenues during the years ended December 31,
2016
,
2015
and
2014
, with net revenues of $145.3 million, $152.4 million and $148.6 million, respectively. Our divested Modules Business also generated solely hardware revenues during the years ended December 31,
2016
,
2015
and
2014
, with net revenues of $4.5 million, $12.3 million and $11.6 million, respectively.
SaaS, Software and Services
Inseego sells SaaS, software and services solutions across multiple IoT vertical markets, including fleet management and vehicle telematics, usage-based insurance, stolen vehicle recovery, asset tracking and monitoring, business connectivity and
5
device management. Our platforms are device-agnostic and provide a standardized, scalable way to order, connect and manage remote assets and improve business operations. The platforms are flexible and support both on-premise server or cloud-based deployments and are the basis for the delivery of a wide range of IoT services.
Our SaaS delivery platforms include (i) our Ctrack platforms, which provide fleet, vehicle, asset and other SaaS telematics, (ii) our Crossroads™ platform, which provides easy IoT device management and service enablement and (iii) our Device Management Solutions (“DMS”), a hosted SaaS platform that helps organizations manage the selection, deployment and spend of their wireless assets, saving money on personnel and telecom expenses.
IoT Hardware
Our integrated telematics and mobile tracking hardware is predominantly sold as an enabler for our Ctrack SaaS delivery platforms. Our telematics and mobile tracking hardware devices collect and control critical vehicle data and driver behaviors, and can reliably deliver that information to the cloud, all managed by our services enablement platforms. Our wireless routers are sold both as stand-alone devices and as part of a bundled business connectivity solution, including our Crossroads platform and wireless connectivity services via our carrier partners.
MiFi Business
We are in the process of divesting our MiFi Business. See “
Recent and Pending Divestitures
.” While the sale is pending, we are continuing to operate the MiFi Business through our subsidiary, Novatel Wireless. The MiFi Business designs, develops and manufactures through third party contract manufacturers, markets and sells mobile hotspots, USB modems and routers which provide subscribers with secure and convenient high-speed access to corporate, public and personal information through the Internet and enterprise networks via wireless cellular networks. Development and testing of our MiFi hardware products is primarily done in-house by our engineering team in San Diego, California, with some contract work done by unaffiliated third parties overseas. We do not have our own manufacturing facilities for MiFi hardware products. We predominantly rely on Inventec Appliances Corporation, located in China, to build our MiFi hardware products. Our MiFi hardware products are sold by our direct sales force, predominantly in the United States and predominantly to a single customer, Verizon Wireless, although we also sell some MiFi hardware to United States Cellular Corporation, Bell Canada and Verizon Wireless distributors.
Historically, the MiFi hardware business accounted for a majority of our revenues and a majority of our expenses. This business, however, has relatively low gross margins and operates in a very competitive market environment. While our MiFi hotspot products tend to have advanced features which often enable them to be sold at premium prices when they are first introduced, we also have higher costs than most of our competitors due to our small scale and heavy use of U.S.-based engineers in product development. Most of our competitors have substantially greater resources and scale, as would be expected in the relatively mature, consumer electronics product categories which comprise our MiFi Business. Our wireless data modem and mobile hotspots, for example, compete against similar products offered by Huawei, ZTE, Sierra Wireless, TCL, Franklin Wireless and NetGear. More broadly, those products also compete against wireless handset manufacturers such as HTC, Apple, LG and Samsung, which all offer mobile hotspot capability as a feature of their cellular smartphones.
Because the MiFi Business is not expected to be part of our business going forward, the description of our business below will focus on the portions of our business that we expect to retain going forward.
Our Business
Telematics Solutions
Inseego entered the telematics software and services industry by acquiring Ctrack and its Ctrack-branded products on October 5, 2015. Prior to its acquisition of Ctrack, Inseego sold telematics hardware through its subsidiary, Enfora, Inc. (“Enfora”). Inseego exited the business of selling stand-alone telematics hardware in 2016 and now offers telematics solutions only through Ctrack. Ctrack was founded in South Africa in 1985, and today our operations span over 50 countries on six continents. Through successful global acquisitions, the Ctrack group broadened its international reach by expanding into countries such as the United Kingdom, The Netherlands and Australia and by identifying strong and capable distributors in emerging markets such as Asia, Africa and Europe.
With over 30 years of experience, we are recognized as a leading global provider of advanced fleet management telematics solutions that add value to a global base of customers with mobile assets. We design and develop a robust range of asset management and monitoring systems using GPS satellite positioning, GSM cellular communication and other advanced communication and sensory technologies. The result is innovative solutions ranging from basic track-and-trace, with stolen vehicle response services, to complete integrated enterprise-level solutions for large fleet owners across the globe.
6
Our continued emphasis on researching and developing next-generation products drives Ctrack ahead of the market, meeting demands for value-added, flexible, feature-rich and cost-effective technology. Our superior solutions, coupled with a proven record in successfully rolling out and supporting projects of all sizes worldwide, provide Ctrack with its competitive edge in attracting customers and distribution partners.
Business Connectivity and Device Management Solutions
Inseego acquired R.E.R. Enterprises, Inc. and its wholly-owned subsidiary and principal operating asset, FW, on March 27, 2015. Located in Eugene, Oregon, FW is a leader in IoT services and solutions. FW leverages its 17 years of IoT expertise to deliver IoT solutions to a number of vertical market applications, such as security and surveillance, asset management solutions, high-capacity wireless communications, fleet management, and remote monitoring and control.
FW’s software suite is comprised of service delivery platforms that ease the development, deployment and operation of device, asset and fleet management applications. The FW suite includes Crossroads
,
an adaptable IoT application framework that turns field data into easy-to-read charts and graphs, and DMS
,
a hosted SaaS platform for helping organizations manage the selection, deployment and spend of their wireless assets and content management, that tailors information to customer specific needs.
FW also designs IoT hardware and sells these devices to carriers and enterprises either as stand-alone devices or bundled offerings that can include the Crossroads platform, wireless connectivity packages via our carrier partners and Pro-Premium services. FW IoT hardware designs include stand-alone industrial, USB-based cellular modems with multiple SIM sockets to enable quick switching between carrier networks, in addition to rugged and non-rugged cellular routers with WiFi and Ethernet LAN connectivity. In concert with the hardware offerings, Inseego offers a cloud-based system to manage remote devices, provide timely performance data on remote devices and detailed analytics to enable optimum data use.
Telematics Solutions
Fleet Management
For commercial customers of small, medium or large fleets, our GPS/GSM tracking technology and proprietary software enables us to deliver some of the world’s most advanced and complete fleet management solutions. Ctrack’s fleet management products offer customers fuel and maintenance cost savings, real-time visibility, operational control and efficiency and productivity improvements, as well as enhanced safety and security for fleet vehicles and mobile assets. Customers may also receive environmental benefits from route optimization and CO
2
emission reporting. Standard and customized reporting, combined with dashboard views, gives fleet operators automated or on-demand information on an entire fleet or individual vehicle. As fleet operations often rely on a variety of systems for operational effectiveness and efficiency, we focus on providing seamless integration of Ctrack systems that connect and share data with third-party systems. This in turn helps customers increase their competitiveness.
Workforce Tracking
Ctrack enables customers to accurately monitor and assess the movement and behavior of their mobile workforces. As a result, Ctrack helps its customers manage their workforces in real-time for greatly improved planning and delivery, utilization, service levels and customer satisfaction. Additional workforce and driver benefits have been introduced through Ctrack’s Fleet Protector™. Fleet Protector gives employees 24-hour access to an emergency call center with transport costs covered and guaranteed hospital acceptance following an accident.
Government, Local Council and Municipality Asset Management
The Ctrack Government, Local Council and Municipalities Monitoring and Tracking System allows local authorities and utility providers to scrutinize, assess and act on information in real time to limit theft and abuse of equipment and maximize the safety and productivity of employees. Using a Ctrack tracking system, local authorities and utility companies can streamline workflow management by verifying route completion, identifying and dispatching the most appropriate vehicle to a job to reduce unnecessary mileage and react more quickly to customer requirements. This not only increases the number of completed jobs per day by optimizing mobile resources, but also reduces overhead and realizes substantial environmental benefits by improving fuel efficiency. Furthermore, our driver behavior solutions have a considerable operational impact by improving the way employees drive in order to enhance levels of efficiency and responsibility, as well as protect public perception and corporate image.
7
Advanced Data Analytics and Lifecycle Asset Management
Ctrack’s Lifecycle Asset Management Division helps customers derive enhanced value from the vast amounts of data generated from their fleet management systems. Using rich fleet analytics and the sophisticated interpretation of data, Ctrack Fleet Analytics™ provides the information needed for critical and proactive decision making, from cost savings to future fleet investments. This outsourced solution enables customers to receive expert analysis without the overhead of employing analysts. Ctrack’s comprehensive analytics software solutions provide access to an array of tools to manage routing, scheduling and every other aspect of a customer’s fleet.
Insurance Telematics
Big data analytics can enable advancements and innovation in the short-term vehicle insurance industry, addressing both top-line growth opportunities and bottom-line risk and cost management challenges. Ctrack’s Insurance Telematics Division provides insurance companies with factual reports on driving frequency, times and routes of the insured, as well as insights into their client’s driving behavior, such as harsh acceleration, braking, cornering and other pertinent information. This rich, contextual, vehicle-use confirmation is a key enabler for actuaries to effectively build risk models and calculate scorecards for individual and collective driver-behavior analysis. Risk profiling and real-time monitoring, along with Ctrack’s accident analysis reports, are also helping insurance companies accelerate the claims process, reduce payouts related to fraudulent claims, and significantly improve their loss ratios.
Airport Asset Tracking
Ctrack’s Airport Solution gives airport ground support equipment service providers a GPS-based airport equipment management solution that provides controlled access to their equipment, as well as real-time visibility, through a web-based SaaS platform. Our comprehensive solution is designed to meet the demands of airport authorities while also improving services to their clients, including air service providers and logistics companies. Our solutions ensure accuracy in the administrative processes, as well as the ability to select additional services, such as visibility into equipment usage, access control and geo-location. With a planning and visibility tool, ground service equipment service providers always know who is using what, when and where. Our solution also gives such providers the ability to provide exact invoices based on the usage per client, per cost center and even per individual.
Vehicle Tracking
Ctrack’s vehicle tracking products offer a high level of functionality that provide safety and security for vehicles, families and businesses, as well as other lifestyle benefits, all contributing to greater peace of mind and convenience. Customers can locate their vehicles using mobile phones and smart devices such as tablets, view trip details on Ctrack’s advanced internet applications, keep an electronic tax logbook, and even receive support from emergency services following an accident. We are continually developing our portfolio of value-added safety and security features and services to deliver peace-of-mind for our customers. Additional features and services range from panic buttons and medical and roadside assistance to home-drive and legal services. Ctrack’s driver-style profiling system also detects abnormal driving patterns and unauthorized drivers, allowing the support center to proactively respond to possible emergency, vehicle theft or accident situations.
Other Industry-Specific Solutions
Ctrack is working closely with a number of industries to understand their unique challenges and requirements. Through Ctrack Industry Solutions, companies are increasing their competitive advantage and benefiting from telematics solutions. Sectors currently supported include:
|
l
|
Service and installation
|
l
|
Government, local authorities and municipalities
|
|
|
l
|
Light delivery
|
l
|
Industrial vehicles and equipment
|
|
|
l
|
Long-haul trucking and trailers
|
l
|
Original equipment manufacturers and dealers
|
|
|
l
|
Utilities
|
l
|
Professional services
|
|
|
l
|
Mining
|
l
|
Agriculture
|
|
|
l
|
Fuel and chemical
|
l
|
Transport and car rental
|
|
|
l
|
Fleet maintenance lease
|
l
|
Containers
|
|
|
l
|
Police and security
|
l
|
Refrigeration
|
|
|
l
|
Construction
|
|||
8
Business Connectivity and Device Management Solutions
Business Connectivity Solutions
We deliver business connectivity solutions to a number of vertical market applications, such as security and surveillance, asset management solutions, high-capacity wireless communications, fleet management and remote monitoring and control. These solutions typically consist of either stand-alone IoT routers or bundled sales of our wireless routers together with the Crossroads platform, wireless connectivity packages via our carrier partners and Pro-Premium services. Crossroads is an adaptable IoT application framework that turns field data into easy-to-read charts and graphs.
Device Management Solutions
DMS is a hosted SaaS platform that helps organizations manage the selection and deployment of, and expenses related to, their wireless assets and content management, tailoring information to customer specific needs to facilitate savings on personnel and telecom expenses. Our DMS solutions are decentralized procurement systems with centralized controls. To the end-user, the DMS system is a SaaS system to allow procurement, provisioning, maintenance, tracking and billing analysis. For our carrier customers, the DMS solution enables the management of multiple customers from a centralized SaaS system to allow unique offerings and processes to individual customers. Our DMS solutions are targeted toward three customer markets: customized ordering and management portals, self-service management and plan maintenance, and online reporting systems for the carriers and their customers.
Our Strategy
Our objective is to be a leading global provider of IoT SaaS and solutions. In furtherance of that objective, we will continue to focus on our recurring revenue from IoT solutions such as our Ctrack telematics solutions, including fleet management, usage-based insurance, stolen-vehicle recovery, and asset tracking and monitoring, and our business connectivity and device management platforms.
The key elements of our strategy are to:
|
•
|
Improve SaaS Penetration
. Through our Ctrack telematics solutions and our business connectivity and device management platforms, we enable our customers with SaaS solutions and applications to support their specific business needs.
|
|
•
|
Capitalize on Our Direct Relationships with Wireless Operators, Original Equipment Manufacturers (“OEMs”) and Component Suppliers.
We intend to continue to capitalize on our direct and long-standing relationships with wireless operators, OEMs and component suppliers in order to increase our worldwide market position.
|
|
•
|
Increase the Value of Our Offerings
. We will continue to add new features, functionality and intellectual property to our portfolio and develop new services and software applications to enhance the overall value and ease of use that our solutions provide to our customers and end users.
|
|
•
|
Increase Geographical Footprint via Partnerships and Third Party Distribution
. We continually evaluate attractive global regions for expansion and evaluate potential parties to distribute our SaaS platforms and IoT solutions.
|
|
•
|
Continue to Pioneer Data Analytics Solutions.
As we seek to capitalize on potential growth opportunities, we are also deploying and developing derivative, next-generation telematics solutions that provide even greater depth and utility to the data collected by our SaaS platforms. For instance, in our fleet management business, we offer a fleet monitoring service to provide fleet managers with added insights to improve the effectiveness and efficiency of their fleet operation. In addition, our Fleet Connect product applies proprietary data analytics and algorithms to help fleet owners manage their equipment more efficiently. And finally, with our usage based insurance offerings, we are disrupting the industry standard UBI business model by incorporating robust data analytics platforms and developing unique go-to-market strategies and value propositions.
|
Key Partners and Customers
We have strategic technology, development and marketing relationships with several of our customers and partners. Our strong customer and partner relationships provide us with the opportunity to expand our market reach and sales. We partner with leading OEMs, telecom groups and installation partners which allows us to offer customers integrated and holistic solutions. Ctrack uses leading cellular providers such as AT&T, Sprint, T-Mobile, Vodafone, MTN, Telstra and Optus to ensure the optimal real-time visibility of tracked vehicles and systems, supported by accurate and sophisticated mapping services such as the HERE Open Location Platform.
9
Customers for our products include transportation companies, industrial companies, governmental agencies, manufacturers, application service providers, system integrators and distributors, and enterprises in various industries, including fleet and vehicle transportation, finance and insurance, energy and industrial automation, security and safety, medical monitoring and government.
Our telematics customer base is comprised of wireless operators, distributors, OEMs and various companies in vertical markets. Fleet management customers include global enterprises such as BHP Billiton, Super Group, Mammoet and Australia Post. Customers of our Government, Local Council and Municipality Monitoring and Tracking System platforms include Thames Water and the City of Ekurhuleni. Airport Solution customers include KLM Equipment Services and Hanover Airport. Usage-based insurance customers include Discovery Insure and Cross Country Insurance Consultants. Our largest vehicle tracking customer is the South African Police Service.
Our customers for our business connectivity products include EnerNOC, Creative Mobile Technologies, Fastenal, T-Mobile, Sprint and Verizon Wireless. Our customers for our device management solutions include T-Mobile and Sprint.
A significant portion of our revenue during the year ended December 31,
2016
came from one customer, Verizon Wireless, due to this customer driving the large majority of sales for the MiFi Business, the sale of which is pending as of the filing date of this report. Our revenues from sales to Verizon Wireless represented approximately
54%
of our total revenues for the year ended December 31,
2016
.
Sales and Marketing
We sell our IoT and telematics solutions and services primarily to enterprises and tier-one carriers in the following industries: transportation, government and local municipalities, mining, agriculture, construction, professional services, finance and insurance, energy and industrial automation, and security and safety. These products and solutions are sold by our direct sales force, including our call centers, and through distributors.
We engage in a wide variety of sales and marketing activities, driving market leadership and global demand through integrated marketing campaigns. This includes product marketing, corporate communications, brand marketing and demand generation.
A substantial majority of our revenue during the year ended December 31,
2016
was derived from sales in the United States. See Note
13
,
Geographic Information and Concentrations of Risk
, to our consolidated financial statements for a discussion of our revenue and asset concentrations by geographic location. In 2017 and beyond, we expect the majority of our revenue to be derived from sales outside the United States, assuming the successful divestiture of the MiFi Business. For information regarding risks related to our foreign operations, see the information in “Item 1A. Risk Factors” in Part 1 of this report.
Research and Development
Our research and development efforts are focused on developing innovative IoT and telematics solutions and services, and improving the functionality, design and performance of our products and solutions. Our research and development expenses for the years ended December 31,
2016
,
2015
and
2014
were approximately
$30.7 million
,
$35.4 million
and
$34.3 million
, respectively. These research and development expenses include expenses associated with our MiFi Business and divested Modules Business.
We intend to continue to identify and respond to our customers’ needs by introducing new SaaS and IoT solutions and product designs that meet our market and customers’ needs, with an emphasis on creating easy-to-use products and services that enable customers to connect, track, and manage their business systems and assets.
We manage our research and development through a structured life-cycle process, from identifying initial customer requirements through development and commercial introduction to eventual phase-out. During product development, emphasis is placed on quality, reliability, performance, time-to-market, meeting industry standards and customer-product specifications, ease of integration, cost reduction, and manufacturability.
Manufacturing and Operations
The hardware used in our solutions is produced by contract manufacturers. Our current contract manufacturers include
Inventec Appliances Corporation and AsiaTelco Technologies Co
. Under our manufacturing agreements, contract manufacturers provide us with services including component procurement, product manufacturing, final assembly, testing, quality control and fulfillment. These contract manufacturers are located in China and South Africa and are able to produce our products using modern state-of-the-art equipment and facilities with relatively low-cost labor.
10
We outsource our higher volume manufacturing in an effort to:
|
•
|
focus on our core competencies of design, development and marketing;
|
|
•
|
minimize our capital expenditures and lease obligations;
|
|
•
|
realize manufacturing economies of scale;
|
|
•
|
achieve production scalability by adjusting manufacturing volumes to meet changes in demand; and
|
|
•
|
access best-in-class component procurement and manufacturing resources.
|
Our operations team manages our relationships with the contract manufacturers as well as other key suppliers. Our operations team focuses on supply chain management, quality, cost optimization, customer order management and new product introduction.
Intellectual Property
Our solutions rely on and benefit from our portfolio of intellectual property, including patents and trademarks. We currently own 36 United States patents and 29 foreign patents. In addition, we currently have 34 patent applications pending. The patents that we currently own expire at various times between 2021 and 2034.
We, along with our subsidiaries, also hold a number of trademarks or registered trademarks including “Inseego”, the Inseego logo, “DigiCore”, “Ctrack”, the Ctrack logo, “FW”, “Crossroads”, the FW logo, “Novatel Wireless”, the Novatel Wireless logo, “MiFi”, “MiFi Intelligent Mobile Hotspot”, “MiFi OS”, “MiFi Powered”, “MiFi Home”, “MobiLink”, “Ovation”, “Expedite”, “MiFi Freedom. My Way.”, “Enfora”, “Spider”, “Enabling Information Anywhere”, “Enabler” and “N4A”.
Backlog
We do not believe that backlog is currently a meaningful indicator of our future business prospects due to many variables, some of which are outside of our control, which could cause the actual volume of our product shipments to differ from those that comprise our backlog. Additionally, we sometimes have relatively short lead times between receipt of customer purchase orders and shipment of products.
Competition
The market for IoT and telematics services and solutions is rapidly evolving and highly competitive. It is likely to continue to be significantly affected by new product introductions and industry participants.
We believe the principal competitive factors impacting the market for our products are features and functionality, performance, quality and brand. To maintain and improve our competitive position, we must continue to expand our customer base, grow our distribution network, and leverage our strategic relationships.
Our products compete with a variety of telematics solutions providers and IoT solutions suppliers. Our current competitors include:
|
•
|
fleet management SaaS and services providers, such as Fleetmatics, Masternaut, TomTom, Telogis, MiX Telematics and Cartrack;
|
|
•
|
IoT solution providers, such as Cradlepoint and Sierra Wireless; and
|
|
•
|
customer experience software solutions and services providers such as Amdocs.
|
We believe that we have advantages over our primary competitors due in varying measure to the broad range of customized solutions that we offer, the ease-of-use of our products, and our ability to adapt our products to specific customer needs. As the market for IoT solutions and services expands, other entrants may seek to compete with us either directly or indirectly.
Employees
At December 31,
2016
, we had 1,173 employees. We also use the services of consultants and temporary workers from time to time. Our employees are not represented by any collective bargaining unit and we consider our relationship with our employees to be good.
Website Access to SEC Filings
We maintain an Internet website at
www.inseego.com
. The information contained on our website or that can be accessed through our website does not constitute a part of this report. We make available, free of charge through our Internet website, our Annual Reports on Form 10-K, Quarterly Reports on Form 10-Q, Current Reports on Form 8-K and amendments to those
11
reports filed or furnished pursuant to Section 13(a) or 15(d) of the Securities Exchange Act of 1934, as amended (the “Exchange Act”), as soon as reasonably practicable after we electronically file or furnish this information to the SEC.
Item 1A.
Risk Factors
The risks and uncertainties described below are those that we currently deem to be material, and do not represent all of the risks that we face. Additional risks and uncertainties not presently known to us or that we currently do not consider material may in the future become material and impair our business operations. Some of the risks and uncertainties described herein have been grouped so that related risks can be viewed together. You should not draw conclusions regarding the relative magnitude or likelihood of any risk based on the order in which risks or uncertainties are presented herein. If any of the following risks actually occur, our business could be materially harmed, and our financial condition and results of operations could be materially and adversely affected. As a result, the trading price of our securities could decline. You should also refer to the other information contained in this Annual Report on Form 10-K, including our consolidated financial statements and the related notes.
GENERAL RISK FACTORS RELATING TO OUR BUSINESS
Our quarterly operating results have fluctuated in the past and may fluctuate in the future, which could cause declines or volatility in the price of our common stock.
Our quarterly operating results have fluctuated in the past and may fluctuate in the future as a result of a variety of factors, many of which are outside of our control. If our quarterly operating results or guidance fall below the expectations of research analysts or investors, the price of our common stock could decline substantially. The following factors, among others, could cause fluctuations in our quarterly operating results:
|
•
|
our ability to successfully and timely complete the divestiture of our MiFi Business;
|
|
•
|
our ability to attract new customers and retain existing customers;
|
|
•
|
our ability to accurately forecast revenue and appropriately plan our expenses;
|
|
•
|
our ability to introduce new features, including integration of our existing solutions with third-party software and devices;
|
|
•
|
the actions of our competitors, including consolidation within the industry, pricing changes or the introduction of new services;
|
|
•
|
our ability to effectively manage our growth;
|
|
•
|
our ability to successfully manage and realize the anticipated benefits of any future acquisitions of businesses, solutions, or technologies;
|
|
•
|
our ability to successfully launch new services or solutions or sell existing services or solutions into additional geographies or vertical markets;
|
|
•
|
the timing and cost of developing or acquiring technologies, services, or businesses;
|
|
•
|
the timing, operating costs, and capital expenditures related to the operation, maintenance, and expansion of our business;
|
|
•
|
service outages or security breaches and any related occurrences which could impact our reputation;
|
|
•
|
the impact of worldwide economic, industry, and market conditions, including disruptions in financial markets and the deterioration of the underlying economic conditions in some countries, and those conditions specific to Internet usage and online businesses;
|
|
•
|
fluctuations in currency exchange rates, particularly the South African Rand to U.S. Dollar exchange rate;
|
|
•
|
trade protection measures (such as tariffs and duties) and import or export licensing requirements;
|
|
•
|
costs associated with defending intellectual property infringement and other claims;
|
|
•
|
changes in law and regulations affecting our business; and
|
|
•
|
provision of fleet management solutions from cellular carrier-controlled or OEM-controlled channels from which Inseego may be excluded.
|
We believe that our quarterly revenue and operating results may vary significantly in the future and that period-to-period comparisons of our operating results may not be meaningful. You should not rely on the results of any quarter as an indication of future performance.
12
We have an accumulated deficit and may not be able to achieve or sustain profitability, which may negatively impact our ability to achieve our business objectives.
We have reported net losses in each of the last three fiscal years, and we cannot predict when we will become profitable or if such profitability can be sustained. We expect to continue making significant expenditures to develop and expand our business. Any growth in our revenue or customer base for our telematics solutions may not be sustainable, and we may not generate sufficient revenue to become profitable. We may incur significant losses in the future for a number of reasons, including the other risks described in this section, and we may encounter unforeseen expenses, difficulties, complications and delays and other unknown events. Accordingly, we may not be able to achieve or sustain profitability, and the failure to fund our capital requirements may negatively impact our ability to achieve our business objectives.
The reorganized company resulting from the acquisitions of FW and Ctrack and the recent and pending divestitures of our hardware business lines may not perform as we or the market expects, which could have an adverse effect on the price of our common stock.
The reorganized company resulting from the acquisitions of FW and Ctrack in 2015 and the recently completed and pending divestitures of our hardware business lines may not perform as we or the market expects. Risks associated with the reorganized company following these acquisitions and divestitures include:
|
•
|
integrating new business acquisitions and divesting existing lines of business is a difficult, expensive and time-consuming process and the failure to successfully manage such transitions could adversely affect our financial condition and results of operations;
|
|
•
|
the acquisitions of FW and Ctrack changed the nature of the business in which we historically operated from primarily selling communications-related hardware to a solutions and software business in the emerging IoT market; if we are not able to effectively adjust to these changes in the fundamental nature of our business, our financial condition and results of operations may be adversely affected;
|
|
•
|
it is possible that our key employees might decide not to remain with us as a result of these changes in our business or for other reasons, and the loss of such personnel could have a material adverse effect on our financial condition, results of operations and growth prospects;
|
|
•
|
relationships with third parties, including key vendors and customers, may be affected by changes in our business resulting from these acquisitions and divestitures; any adverse changes in these third party relationships could adversely affect our business, financial condition and results of operations; and
|
|
•
|
the price of our common stock may be affected by factors different from those that affected the price of our common stock prior to these acquisitions and/or divestitures.
|
In addition, a significant portion of our historical revenues have been attributable to businesses, such as the MiFi Business, that is in the process of being divested. As a result, our historical operating results may not be a reliable indicator of how the Company will perform in the future. We cannot provide any assurances with respect to the accuracy of our assumptions with respect to future revenues or revenue growth rates, if any, of the reorganized company, and we cannot provide assurances with respect to our ability to realize any expected operating synergies or cost savings from these acquisitions and divestitures.
Entry into new lines of business, and our offering of new products and services, resulting from the acquisitions of Ctrack and FW may result in exposure to new risks.
Ctrack operates primarily in the areas of SaaS telematics, vehicle tracking and fleet management and FW operates in the areas of telematics and telemetry services, which are areas in which we did not previously conduct business. In addition, Ctrack and FW have business models, customers, sales cycles and operating activities that are substantially different from our traditional hardware business that existed prior to these acquisitions. New lines of business, products or services could have a significant impact on the effectiveness of our system of internal controls and could reduce our revenues or increase our expenses and potentially generate losses. Introducing new products and services, or entering new markets, may require substantial time, resources and capital, and profitability targets may not be achieved. Entry into new markets entails inherent risks associated with our inexperience, which may result in costly decisions that could harm our profit and operating results. There are material inherent risks and uncertainties associated with offering new products and services, especially when new markets are not fully developed or when the laws and regulations regarding a new product or solution are not mature. Factors outside of our control, such as developing laws and regulations, regulatory orders, competitive product offerings and changes in commercial and consumer demand for products or services may also materially impact the successful implementation of new products or services. Failure to manage these risks, or failure of any product or service offerings to be successful and profitable, could have a material adverse effect on our financial condition and results of operations.
13
If we fail to develop and timely introduce new products and services or enter new markets for our products and services successfully, we may not achieve our revenue targets or we may lose key customers or sales and our business could be harmed.
The development of new solutions for mobile broadband data, vehicle tracking, fleet management and telemetry applications can be difficult, time-consuming and costly. As we introduce new products or solutions, our current customers may not require or desire the features of these new offerings and may not purchase them or might purchase them in smaller quantities than we had expected. We may face similar risks that our products or solutions will not be accepted by customers as we enter new markets for our solutions, both in the United States and overseas.
Further, as part of our business, we may enter into contracts with some customers in which we would agree to develop products or solutions that we would sell to such customers. Our ability to generate future revenue and operating income under any such contracts would depend upon, among other factors, our ability to timely and profitably develop products or solutions that can be cost-effectively deployed and that meet required design, technical and performance specifications.
If we are unable to successfully manage these risks or meet required delivery specifications or deadlines in connection with one or more of our key contracts, we may lose key customers or orders and our business could be harmed.
An assertion by a third party that we are infringing its intellectual property could subject us to costly and time- consuming litigation or expensive licenses and our business could be harmed.
The technology industries involving mobile data communications, IoT devices, software and services are characterized by the existence of a large number of patents, copyrights, trademarks and trade secrets and by frequent litigation based on allegations of infringement or other violations of intellectual property rights. Much of this litigation involves patent holding companies or other adverse patent owners who have no relevant product revenues of their own, and against whom our own patent portfolio may provide little or no deterrence. For example, one such entity, Carucel Investments, L.P. (“Carucel”) has filed a claim seeking approximately $43.0 million in royalties and damages related to past sales of MiFi mobile hotspots, which is scheduled to go to trial in April 2017. This is one of several patent infringement lawsuits from non-practicing entities that are brought against us or our subsidiaries each year in the ordinary course of business.
We cannot assure you that we or our subsidiaries will prevail in any current or future intellectual property infringement or other litigation given the complex technical issues and inherent uncertainties in such litigation. Defending such claims, regardless of their merit, could be time-consuming and distracting to management, result in costly litigation or settlement, cause development delays, or require us or our subsidiaries to enter into royalty or licensing agreements. In addition, we or our subsidiaries could be obligated to indemnify our customers against third parties’ claims of intellectual property infringement based on our products or solutions, as is the case in the Carucel litigation for which Novatel Wireless may be obligated to indemnify its customer, Verizon Wireless. If our products or solutions violate any third-party intellectual property rights, we could be required to withdraw them from the market, re-develop them or seek to obtain licenses from third parties, which might not be available on reasonable terms or at all. Any efforts to re-develop our products or solutions, obtain licenses from third parties on favorable terms or license a substitute technology might not be successful and, in any case, might substantially increase our costs and harm our business, financial condition and operating results. Withdrawal of any of our products or solutions from the market could harm our business, financial condition and operating results.
In addition, we incorporate open source software into our products and solutions. Given the nature of open source software, third parties might assert copyright and other intellectual property infringement claims against us based on our use of certain open source software programs. The terms of many open source licenses to which we are subject have not been interpreted by U.S. courts or courts of other jurisdictions, and there is a risk that those licenses could be construed in a manner that imposes unanticipated conditions or restrictions on our ability to commercialize our products and solutions. In that event, we could be required to seek licenses from third parties in order to continue offering our products and solutions, to re-develop our solutions, to discontinue sales of our solutions, or to release our proprietary software source code under the terms of an open source license, any of which could adversely affect our business.
If we are unable to protect our intellectual property and proprietary rights, our competitive position and our business could be harmed.
We rely on a combination of patent laws, trademark laws, copyright laws, trade secrets, confidentiality procedures and contractual provisions to protect our intellectual property and proprietary rights. However, our issued patents and any future patents that may issue may not survive a legal challenge to their scope, validity or enforceability, or provide significant protection for us. The failure of our patents to adequately protect our technology might make it easier for our competitors to offer similar products or technologies. In addition, patents may not issue from any of our current or any future applications and significant portions of our intellectual property is held in the form of trade secrets which are not protected by patents.
14
Monitoring unauthorized use of our intellectual property is difficult and costly. The steps we have taken to protect our proprietary rights may not be adequate to prevent misappropriation of our intellectual property. We may not be able to detect unauthorized use of, or take appropriate steps to enforce, our intellectual property rights. Our competitors may also independently develop similar technology. In addition, the laws of many countries do not protect our proprietary rights to as great an extent as do the laws of the United States. Any failure by us to meaningfully protect our intellectual property could result in competitors offering products that incorporate our most technologically advanced features, which could seriously reduce demand for our products and solutions. In addition, we may in the future need to initiate infringement claims or litigation. Litigation, whether we are a plaintiff or a defendant, can be expensive, time consuming and may divert the efforts of our technical staff and managerial personnel, which could harm our business, whether or not such litigation results in a determination favorable to us.
We may not be able to maintain and expand our business if we are not able to hire, retain and manage additional qualified personnel.
Our success in the future depends in part on the continued contribution of our executive, technical, engineering, sales, marketing, operations and administrative personnel. Recruiting and retaining skilled personnel in the industries in which we operate, including engineers and other technical staff and skilled sales and marketing personnel, is highly competitive. In addition, the success of any acquisition depends in part on our retention and integration of key personnel from the acquired company or business.
Although we may enter into employment agreements with members of our senior management and other key personnel, these arrangements do not prevent any of our management or key personnel from leaving the company. If we are not able to attract or retain qualified personnel in the future, or if we experience delays in hiring required personnel, particularly qualified technical and sales personnel, we may not be able to maintain and expand our business.
While our management believes that it is probable that the sale of the MiFi Business to the Purchasers will be completed, if the sale of the MiFi Business to the Purchasers is not completed as expected, then our business and financial performance may be adversely affected.
The completion of the sale of the MiFi Business to the Purchasers is subject to the satisfaction or waiver of various conditions, including the approval of the transaction by CFIUS, which may not be satisfied in a timely manner or at all.
While awaiting satisfaction of such conditions, we are continuing to incur expenses and liabilities relating to the MiFi Business as a result of our obligations under the Purchase Agreement to maintain the MiFi Business for the Purchasers’ benefit and are restricted by the terms of the Purchase Agreement in our ability to pursue alternative transactions in which we would sell all or a significant part of the MiFi Business to any party other than the Purchasers. We are also incurring significant third party transaction costs in pursuing approval of the transaction from CFIUS. While our management believes that it is probable that the sale of the MiFi Business to the Purchasers will be completed, if the sale of the MiFi Business to the Purchasers is not completed as expected, then we will have incurred such expenses and liabilities without receiving the anticipated infusion of cash with which to pay them. In addition, our directors, executive officers and other employees will have expended extensive time and effort and will have experienced significant distractions from their work during the pendency of the sale without any commensurate benefit to the Company, which may have a material and adverse effect on our stock price and results of operations.
If the sale of the MiFi Business to the Purchasers is not completed, our Board of Directors, in discharging its fiduciary obligations to our stockholders, may evaluate other strategic alternatives including, but not limited to, an alternative sale transaction relating to the MiFi Business, incurrence of additional debt or the commencement of a Chapter 11 proceeding with or without a pre-arranged plan of reorganization. An alternative sale transaction, if available, may yield lower consideration than the proposed sale to the Purchasers, be on less favorable terms and conditions than those contained in the Purchase Agreement and involve significant delay. Any future sale of substantially all of our assets or other transactions may be subject to further stockholder approval.
Finally, while our management believes that it is probable that the sale of the MiFi Business to the Purchasers will be completed, if the sale of the MiFi Business to the Purchasers is not completed as expected, then the announcement of the termination of the Purchase Agreement may adversely affect our relationships with customers, suppliers and employees, which could have a material adverse impact on our ability to effectively operate the MiFi Business or our other businesses, each of which could have further adverse effects on our business, results of operations and the trading price of our common stock.
15
A protracted financial restructuring could cause us to lose key management employees and otherwise adversely affect our business.
While our management believes that it is probable that the sale of the MiFi Business to the Purchasers will be completed, if the sale of the MiFi Business to the Purchasers is not completed as expected, then any alternative we pursue may take substantially longer to consummate than the planned divestiture. A protracted financial restructuring could disrupt our business and would divert the attention of our management from the operation of our business and implementation of our business plan. It is possible that such a prolonged financial restructuring or bankruptcy proceeding would cause us to lose many of our key management employees. Such losses of key management employees would likely make it difficult for us to complete a financial restructuring and may make it less likely that we will be able to continue as a viable business.
The uncertainty surrounding a prolonged financial restructuring could also have other adverse effects on us. For example, it could also adversely affect:
|
•
|
our ability to raise additional capital;
|
|
•
|
our ability to capitalize on business opportunities and react to competitive pressures;
|
|
•
|
our ability to attract and retain employees;
|
|
•
|
our liquidity;
|
|
•
|
how our business is viewed by investors, lenders, strategic partners or customers; and
|
|
•
|
our enterprise value.
|
Servicing our debt requires a significant amount of cash, and we may not have sufficient cash flow from our business to pay our substantial debt.
Our ability to make scheduled payments of the principal of, to pay interest on, or to refinance our indebtedness, including our 5.50% convertible senior notes due 2022 (the “
Inseego Notes
”), depends on our future performance, which is subject to economic, financial, competitive and other factors beyond our control. Our business may not generate cash flow from operations in the future sufficient to service our debt and other fixed charges, fund working capital needs and make necessary capital expenditures. If we are unable to generate such cash flow, we may be required to adopt one or more alternatives, such as selling assets, restructuring debt or obtaining additional equity capital on terms that may be onerous or highly dilutive. Our ability to refinance our indebtedness will depend on the capital markets and our financial condition at such time. We may not be able to engage in any of these activities or engage in these activities on desirable terms, which could result in a default on our debt obligations.
If we are unable to generate sufficient cash flow or otherwise obtain funds necessary to make required payments, or if we fail to comply with the various requirements of our existing indebtedness or any other indebtedness which we may incur in the future, we would be in default, which could permit the holders of our indebtedness, including the
Inseego Notes
, to accelerate the maturity of such indebtedness. Any default under such indebtedness could have a material adverse effect on our business, results of operations and financial condition.
The Revolver contains customary operational covenants, our failure to comply with which could result in a default under the Revolver as well as a cross-default under the indenture governing the Inseego Notes.
The Revolver contains usual and customary restrictive covenants relating to the management and operation of our business, and it is likely that any future debt arrangements we may enter into would contain similar covenants. Failure to comply with any of the covenants under the Revolver or any other debt agreement providing for borrowings in excess of $5.0 million could result in a default under such an agreement and a cross-default under the indenture, dated as of January 9, 2017, by and between Inseego and Wilmington Trust, National Association, as trustee (the “Inseego Indenture”), which governs the Inseego Notes, which could cause the holders of the Inseego Notes to accelerate the maturity of such indebtedness. Any default or cross-default under such indebtedness could have a material adverse effect on our business, results of operations and financial results.
Despite our current consolidated debt levels, we may incur additional debt in compliance with our existing obligations.
Despite our current consolidated debt levels, we and our subsidiaries may be able to incur additional debt in the future, including secured debt. The Inseego Indenture contains covenants, that are effective until June 15, 2020, limiting our and our subsidiaries’ ability to incur additional secured indebtedness in the future, but it will not completely prohibit the incurrence of such secured debt. Although the terms of the Inseego Indenture contain restrictions on the incurrence of additional indebtedness, those restrictions are subject to a number of significant qualifications and exceptions and the amount of capital indebtedness that could be incurred in connection with those exceptions could be substantial.
16
RISKS RELATED TO CORPORATE DEVELOPMENT ACTIVITIES
If we do not properly manage the development of our business, we may experience significant strains on our management and operations and disruptions in our business.
Various risks arise if companies and industries quickly grow or evolve. If our business or industry develops more quickly than our ability to respond, our ability to meet customer demand in a timely and efficient manner could be challenged. We may also experience development, certification or production delays as we seek to meet demand for our products or unanticipated product requirements. Our failure to properly manage the developments that we or our industry might experience could negatively impact our ability to execute on our operating plan and, accordingly, could have an adverse impact on our business, our cash flow and results of operations and our reputation with our current or potential customers.
Our corporate development activities could disrupt our business and harm our financial condition and results of operations.
As part of our business strategy, we review and intend to continue to review, acquisition and divestiture opportunities that we believe would be advantageous or complementary to the development of our business. Based on these opportunities, we may acquire additional businesses, assets, or technologies in the future. Alternatively, we may divest businesses, assets or technologies. All of these activities are subject to risks and uncertainties and could disrupt or harm our business. For example, if we make an acquisition, we could take any or all of the following actions, any one of which could adversely affect our business, financial condition, results of operations or stock price:
|
•
|
use a substantial portion of our available cash;
|
|
•
|
incur substantial debt, which may not be available to us on favorable terms and may adversely affect our liquidity;
|
|
•
|
issue equity or equity-based securities that would dilute the percentage ownership of existing stockholders;
|
|
•
|
assume contingent liabilities; and
|
|
•
|
take substantial charges in connection with acquired assets.
|
Acquired businesses may have liabilities or adverse operating issues that we fail to discover through due diligence prior to the acquisition. In particular, to the extent that prior owners of any acquired businesses or properties failed to comply with or otherwise violated applicable laws or regulations, or failed to fulfill their contractual obligations to customers, we, as the successor owner, may be financially responsible for these violations and failures and may suffer reputational harm or otherwise be adversely affected. Acquisitions also frequently result in the recording of goodwill and other intangible assets which are subject to potential impairment in the future that could harm our financial results. In addition, if we finance acquisitions by issuing convertible debt or equity securities, our existing stockholders may be diluted, which could affect the market price of our stock. Acquisitions and/or related equity financings could also impact our ability to utilize our net operating loss carryforwards.
Numerous other risks of engaging in acquisitions include: difficulties in assimilating acquired operations, products, technologies and personnel; unanticipated costs; diversion of management’s attention from existing operations; adverse effects on existing business relationships with suppliers and customers; risks of entering markets in which we have limited or no prior experience; and potential loss of key employees from either our existing business or the acquired organization. Acquisitions may result in substantial accounting charges for restructuring and other expenses, amortization of purchased technology and intangible assets and stock-based compensation expense, any of which could materially adversely affect our operating results.
Conversely, there are many risks associated with corporate divestitures, including the pending sale of our MiFi Business. The numerous risks of engaging in sales of assets, technology or portions of our business include: difficulties separating divested operations from ongoing operations; loss of sales, marketing and operating synergies; loss of key employees and know-how related to the on-going portions of the business; unanticipated costs; diversion of management’s attention from existing operations; and adverse effects on existing business relationships with suppliers and customers. Similar to discontinued operations, divestitures may be disruptive and result in substantial accounting charges for any related restructuring.
As a result, if we fail to properly evaluate or implement acquisitions or divestitures, including the pending sale of our MiFi Business, we may not achieve the anticipated benefits of any such transactions, and we may incur unanticipated costs, either of which could harm our business and operating results.
If we complete the sale of our MiFi Business to the Purchasers, we will become subject to three-year non-competition and non-solicitation covenants, which may limit our ability to effectively operate our business in certain respects or sell the Company to a third-party acquirer.
If we complete the sale of our MiFi Business to the Purchasers, we will become subject to three-year non-competition and non- solicitation covenants. During such three-year period, we will be restricted from designing, developing, manufacturing, marketing or selling on a standalone basis products of the MiFi Business as of the closing of the sale, subject to certain
17
exceptions, and from soliciting for employment persons who were employees of the MiFi Business as of the closing of the sale.
These limitations may negatively impact the scope and/or volume of our business, which may adversely affect our financial condition and results of operations. In addition, under certain circumstances, a third-party acquirer may also be subject to these limitations, which may inhibit a future sale transaction of the Company that may otherwise be favorable to our stockholders.
If we complete the sale of our MiFi Business to the Purchasers, we may become obligated to incur certain post-closing defense costs in connection with certain intellectual property-related litigation matters related to the MiFi Business, and may become obligated to indemnify Purchasers for certain losses relating to the MiFi Business.
Under the Purchase Agreement, following the sale of our MiFi Business to the Purchasers, we will retain responsibility for the defense costs for pending litigation matters for intellectual property used in the MiFi Business, and may be partially responsible for defense costs relating to certain future litigation matters relating to intellectual property used in the MiFi Business, should proceedings be initiated. Similarly, we may be responsible for all or a portion of any judgment or settlement associated with intellectual property disputes or litigation related to the MiFi Business. In addition, we have agreed to indemnify Purchasers for certain types of losses relating to the MiFi Business, such as product liability and product recall costs. Moreover, we remain responsible for certain obligations of the MiFi Business that arose prior to the closing of the sale, such as warranty claims for products that we sold to Verizon Wireless and other customers prior to the closing. The amounts of these current and potential future liabilities are currently indeterminable, but if they turn out to be significant, they could adversely affect our business, financial condition and results of operations.
If we complete the sale of our MiFi Business to the Purchasers, our actual financial and operating results could differ materially from any expectations or guidance provided by us concerning future results.
We currently expect to realize material cost savings and increased gross profit, but also a significant decrease in revenue, as a result of the sale of our MiFi Business. Excluding upfront non-recurring charges and transaction-related expenses, such disposition is expected to improve some of the key financial metrics associated with our results of operations. However, these expectations are subject to numerous assumptions, including, without limitation, projections of the future revenues and product margins of our ongoing businesses; projected acquisition and retention of customers of our ongoing businesses; anticipated personnel and manufacturing cost savings associated with the sale; and certain accounting adjustments that we expect to record in our financial statements in connection with the disposition.
We cannot provide any assurances with respect to the accuracy of the assumptions on which our financial expectations or guidance are based. Any failure to realize the financial benefits we currently anticipate from the sale could have a material adverse impact on our future operating results and financial condition and could materially and adversely affect the trading price or trading volume of our common stock.
RISKS RELATED TO COMPETITION
The market for the products and services that we offer is rapidly evolving and highly competitive. We may be unable to compete effectively.
The market for the products and services that we offer is rapidly evolving and highly competitive. We expect competition to continue to increase and intensify. Many of our competitors or potential competitors have significantly greater financial, technical, operational and marketing resources than we do. These competitors, for example, may be able to respond more rapidly or more effectively than we can to new or emerging technologies, changes in customer requirements, supplier related developments, or a shift in the business landscape. They also may devote greater or more effective resources than we do to the development, manufacture, promotion, sale, and post-sale support of their respective products and services.
Many of our current and potential competitors have more extensive customer bases and broader customer, supplier and other industry relationships that they can leverage to establish competitive dealings with many of our current and potential customers. Some of these companies also have more established and larger customer support organizations than we do. In addition, these companies may adopt more aggressive pricing policies or offer more attractive terms to customers than they currently do, or than we are able to do. They may bundle their competitive products with broader product offerings and may introduce new products, services and enhancements. Current and potential competitors might merge or otherwise establish cooperative relationships among themselves or with third parties to enhance their products, services or market position. In addition, at any time any given customer or supplier of ours could elect to enter our then existing line of business and thereafter compete with us, whether directly or indirectly. As a result, it is possible that new competitors or new or otherwise enhanced relationships among existing competitors may emerge and rapidly acquire significant market share to the detriment of our business.
18
Our products compete with a variety of devices, including other wireless modems and mobile hotspots, wireless handsets, wireless handheld computing devices and IoT wireless solutions. Our current competitors include:
|
•
|
fleet management SaaS and services providers, such as Fleetmatics, MiX Telematics and Cartrack;
|
|
•
|
wireless data modem and mobile hotspot providers, such as Huawei, ZTE, Sierra Wireless, PCD, LG Innotek, Samsung, Franklin Wireless and NetGear; and
|
|
•
|
wireless handset manufacturers, such as HTC, Apple and Samsung.
|
We expect our competitors to continue to improve the features and performance of their current products and to introduce new products, services and technologies which, if successful, could reduce our sales and the market acceptance of our products, generate increased price competition and make our products obsolete. For our products to remain competitive, we must, among other things, continue to invest significant resources (financial, human and otherwise) in, among other things, research and development, sales and marketing, and customer support. We cannot be sure that we will have or will continue to have sufficient resources to make these investments or that we will be able to make the technological advances in the marketplace, meet changing customer requirements, achieve market acceptance and respond to our competitors’ products.
The market for fleet management solutions and the markets for telemetry and tracking solutions are all highly fragmented and competitive, with low barriers to entry. If we do not compete effectively, our operating results may be harmed.
The market for fleet management solutions and the markets for telemetry and tracking solutions are all highly fragmented, consisting of a significant number of vendors, competitive and rapidly changing product and service offerings, with relatively low barriers to entry. Competition in all these markets is based primarily on the level of difficulty in installing, using and maintaining solutions, total cost of ownership, product performance, functionality, interoperability, brand and reputation, distribution channels, industries and the financial resources of the vendor. We expect competition to intensify in the future with the introduction of new technologies and market entrants. For example, in the telematics market, mobile service and software providers, such as Google and makers of GPS navigation devices, such as Garmin, provide limited services at lower prices or at no charge, such as basic GPS- based mapping, tracking and turn-by-turn directions that could be expanded or further developed to more directly compete with our fleet management solutions. In addition, wireless carriers, such as Verizon Wireless, have begun to offer fleet management solutions that benefit from the carrier’s scale and cost advantages which we are unable to match. Similarly, vehicle OEM’s may provide factory-installed devices and effectively compete against us directly or indirectly by partnering with other fleet management suppliers. We can provide no assurances that we will be able to compete effectively as this ecosystem as the competitive landscape continues to develop. Competition could result in reduced operating margins, increased sales and marketing expenses and the loss of market share, any of which would likely cause serious harm to our operating results.
Industry consolidation may result in increased competition, which could result in a loss of customers or a reduction in revenue.
Some of our competitors have made or may make acquisitions or may enter into partnerships or other strategic relationships to offer more comprehensive services than they individually had offered or achieve greater economies of scale. In addition, new entrants not currently considered to be competitors may enter our market through acquisitions, partnerships or strategic relationships. We expect these trends to continue as companies attempt to strengthen or maintain their market positions. Many of the potential entrants may have competitive advantages over us, such as greater name recognition, longer operating histories, more varied services and larger marketing budgets, as well as greater financial, technical and other resources. These pressures could result in a substantial loss of our customers, a reduction in our revenue or increased costs as we seek ways to become more competitive.
RISKS RELATED TO OUR CUSTOMERS AND DEMAND FOR OUR SOLUTIONS
Our inability to adapt to rapid technological change in our markets
could impair our ability to remain competitive and adversely affect our results of operations.
All of the markets in which we operate are characterized by rapid technological change, frequent introductions of new products, services and solutions and evolving customer demands. In addition, we are affected by changes in the many industries related to the products or services we offer, including the automotive, telematics, wireless telemetry, GPS navigation device and work flow software industries. As the technologies used in each of these industries evolves, we will face new integration and competition challenges. For example, as automobile manufacturers evolve in-vehicle technology, GPS tracking devices may become standard equipment in new vehicles and compete against some segments of our telematics or asset tracking service offerings. If we are unable to adapt to rapid technological change, it could adversely affect our results of operations and our ability to remain competitive.
19
If we fail to develop and maintain strategic relationships, we may not be able to penetrate new markets.
A key element of our business strategy is to penetrate new markets by developing new service offerings through strategic relationships with industry participants. We are currently investing, and plan to continue to invest, significant resources to develop these relationships. We believe that our success in penetrating new markets for our products will depend, in part, on our ability to develop and maintain these relationships and to cultivate additional or alternative relationships. There can be no assurance, however, that we will be able to develop additional strategic relationships, that existing relationships will survive and successfully achieve their purposes or that the companies with whom we have strategic relationships will not form competing arrangements with others or determine to compete unilaterally with us.
Until we complete the sale of our MiFi Business, we will continue to depend upon Verizon Wireless for a substantial portion of our revenues, and our business would be negatively affected by an adverse change in our dealings with this customer.
Historically, as a result of the significant revenues associated with our MiFi Business, sales to Verizon Wireless accounted for
54%
,
54%
and
52%
of our consolidated net revenues for the years ended December 31,
2016
,
2015
and
2014
, respectively. Until we complete the sale of our MiFi Business, we expect that Verizon Wireless will continue to account for a substantial portion of our net revenues, and any impairment of our relationship with Verizon Wireless would adversely affect our business.
If we fail to effectively and efficiently attract, sell to and retain SMB customers, our operating results would be adversely affected.
We market and sell our telematics and telemetry solutions in significant part to small and medium-sized businesses (“SMBs”). SMB customers are challenging to reach, acquire and retain in a cost-effective manner. To grow our revenue, we must add new customers, sell additional functionality to existing customers and encourage existing customers to renew their subscriptions. Selling to and retaining SMB customers is more difficult than selling to and retaining enterprise customers because SMB customers generally:
|
•
|
have high failure rates;
|
|
•
|
are often more price sensitive;
|
|
•
|
are difficult to reach with targeted sales campaigns;
|
|
•
|
have higher churn rates in part because of the scale of their businesses and the ease of switching services; and
|
|
•
|
generate less revenue per customer and per transaction.
|
If we are unable to market and sell our solutions to SMBs with competitive pricing and in a cost-effective manner, our ability to grow our revenue and maintain and grow our profitability will be harmed.
We may not be able to retain and increase sales to our existing customers, which could negatively impact our financial results.
We generally license our solutions pursuant to customer agreements with an initial term of 36 months for fleet management customers and 24 months for telemetry subscription service customers. However, our customers have no obligation to renew these agreements after their initial term expires. We also actively seek to sell additional solutions to our existing customers. If our efforts to satisfy our existing customers are not successful, we may not be able to retain them or sell additional functionality to them and, as a result, our revenue and ability to grow could be adversely affected. Customers may choose not to renew their subscriptions for many reasons, including the belief that our service is not required for their business needs or is otherwise not cost-effective, a desire to reduce discretionary spending, or a belief that our competitors’ services provide better value. Additionally, our customers may not renew for reasons entirely out of our control, such as the dissolution of their business, which is particularly common for SMB customers, or an economic downturn in their industry. A significant increase in our churn rate would have an adverse effect on our business, financial condition, and operating results.
A part of our growth strategy is to sell additional new features and solutions to our existing customers. Our ability to sell new features to customers will depend in significant part on our ability to anticipate industry evolution, practices and standards and to continue to enhance existing solutions, such as integration with fuel cards and GPS navigation devices, or introduce or acquire new solutions on a timely basis to keep pace with technological developments both within our industry and in related industries, and to remain compliant with any regulations mandated by federal agencies, such as the Federal Motor Carrier Safety Administration, or state-mandated or foreign government regulations as they pertain to our subscribers. However, we may prove unsuccessful either in developing new features or in expanding the third-party software and products with which our solutions integrate. In addition, the success of any enhancement or new feature depends on several factors, including the timely completion, introduction and market acceptance of the enhancement or feature. Any new solutions we develop or acquire might not be introduced in a timely or cost-effective manner and might not achieve the broad market acceptance necessary to generate significant revenue. If any of our competitors implements new technologies before we are able to implement them or better anticipates the innovation and integration opportunities in related industries, those competitors may be able to provide more
20
effective or cheaper solutions than ours.
Another part of our growth strategy is to sell additional subscriptions to existing customers as their fleet sizes increase. We cannot be assured that our customers’ fleet sizes will continue to increase. A significant decrease in our ability to sell existing customers additional functionality or subscriptions could have an adverse effect on our business, financial condition, and operating results.
Loss of, or a significant reduction in subscriptions from, one or more enterprise or government customers could adversely affect our revenue and profitability.
Loss of one or more of our large enterprise or government customers could result in a meaningful decrease in revenue and profitability, as well as a material increase in our customer churn rate. Because of the variability of industries in which our enterprise and government customers operate and the unpredictability of economic conditions in any particular industry which comprises a significant number of our enterprise or government customers, the composition of, and the number of subscriptions from, our enterprise and government customers is likely to change over time. If we lose one or more large enterprise or government customers, or if we experience a significant reduction in subscriptions from one or more large enterprise or government customers, there is no assurance that we would be able to replace those customers to generate comparable revenue over a short time period, which could harm our operating results and profitability.
Adverse economic conditions or reduced spending on information technology solutions, particularly by SMBs, may adversely impact our revenue and profitability.
Uncertainty about future economic conditions makes it difficult for us to forecast operating results and to make decisions about future investments. We are unable to predict the likely duration and severity of adverse economic conditions in the United States and other countries, but the longer the duration, the greater risks we face in operating our business. Furthermore, many of our solutions are designed for SMBs, which frequently have limited budgets and may be more likely to be significantly affected by economic downturns and other macroeconomic factors affecting spending behavior than larger enterprises or government customers. SMB customers may choose to spend the limited funds that they have on items other than our solutions and may experience higher failure and bankruptcy rates, which would negatively affect the overall demand for our products and increase customer attrition, which could cause our revenue to decline. We cannot assure you that current economic conditions, worsening economic conditions or prolonged poor economic conditions will not have a significant adverse impact on the demand for our solutions, and consequently on our results of operations and prospects.
The marketability of our products may suffer if wireless telecommunications operators do not deliver acceptable wireless services.
The success of our business depends, in part, on the capacity, affordability, reliability and prevalence of wireless data networks provided by wireless telecommunications operators and on which our IoT hardware products operate. Currently, various wireless telecommunications operators, either individually or jointly with us, sell our products in connection with the sale of their wireless data services to their customers. Growth in demand for wireless data access may be limited if, for example, wireless telecommunications operators cease or materially curtail operations, fail to offer services that customers consider valuable at acceptable prices, fail to maintain sufficient capacity to meet demand for wireless data access, delay the expansion of their wireless networks and services, fail to offer and maintain reliable wireless network services or fail to market their services effectively.
Changes in practices of insurance companies in the markets in which we provide our solutions could materially and adversely affect demand for products and services.
We depend in part on the practices of insurance companies in some of our markets to support demand for certain of our products and services. For example, in South Africa, which is currently the largest market for our products and services, insurance companies either mandate the installation of tracking devices as a prerequisite for providing insurance coverage to owners of certain vehicles, or provide insurance premium discounts to encourage vehicle owners to subscribe to vehicle tracking and mobile asset recovery solutions such as ours. We benefit from insurance companies' continued practice in the South African and certain other markets of:
|
•
|
accepting mobile asset location technologies such as ours as a preferred security product;
|
|
•
|
providing premium discounts for using location and recovery products and services such as ours; and
|
|
•
|
mandating the use of our products and services, or similar products and services, for certain vehicles.
|
If any of these policies or practices change, revenues from sale of our products and services could decline, which would materially and adversely affect our business, results of operations and financial condition.
21
Reduction in regulation in certain markets may adversely impact demand for certain of our solutions by reducing the necessity for, or desirability of, our solutions.
Regulatory compliance and reporting is driven by legislation and requirements, which are often subject to change, from regulatory authorities in nearly every jurisdiction globally. For example, in the United States, fleet operators can face numerous complex regulatory requirements, including mandatory Compliance, Safety and Accountability driver safety scoring, hours of service, compliance and fuel tax reporting. The reduction in regulation in certain markets may adversely impact demand for certain of our solutions, which could materially and adversely affect our business, financial condition and results of operations.
RISKS RELATED TO DEVELOPING, MANUFACTURING AND DELIVERING OUR SOLUTIONS
We currently rely on third parties to manufacture and warehouse many of our products, which exposes us to a number of risks and uncertainties outside our control.
We currently outsource the manufacturing of many of our products to companies including
Inventec Appliances Corporation and AsiaTelco Technologies Co
. In addition, in 2016 we sold portions of our IoT modules business to Telit, and we now rely on Telit to supply us with modules that are critical to the functionality of some of our telematics hardware devices, including devices sold or deployed by Ctrack. If one of these third-party manufacturers were to experience delays, disruptions, capacity constraints or quality control problems in its manufacturing operations, product shipments to our customers could be delayed or rejected or our customers could consequently elect to cancel the underlying subscription. These disruptions would negatively impact our revenues, competitive position and reputation. Further, if we are unable to manage successfully our relationship with a manufacturer, the quality and availability of products used in our services and solutions may be harmed. None of our third-party manufacturers is obligated to supply us with a specific quantity of products, except as may be provided in a particular purchase order that we have submitted to, and that has been accepted by, such third-party manufacturer. Our third-party manufacturers could, under some circumstances, decline to accept new purchase orders from us or otherwise reduce their business with us. If a manufacturer stopped manufacturing our products for any reason or reduced manufacturing capacity, we may be unable to replace the lost manufacturing capacity on a timely and comparatively cost effective basis, which would adversely impact our operations. In addition, we generally do not enter into long-term contracts with our manufacturers. As a result, we are subject to price increases due to availability, and subsequent price volatility, in the marketplace of the components and materials needed to manufacture our products. If a third-party manufacturer were to negatively change the product pricing and other terms under which it agrees to manufacture for us and we were unable to locate a suitable alternative manufacturer, our manufacturing costs could significantly increase.
Because we outsource the manufacturing of so many of our products, the cost, quality and availability of third-party manufacturing operations is essential to the successful production and sale of our products. Our reliance on third-party manufacturers exposes us to a number of risks which are outside our control, including:
|
•
|
unexpected increases in manufacturing costs;
|
|
•
|
interruptions in shipments if a third-party manufacturer is unable to complete production in a timely manner;
|
|
•
|
inability to control quality of finished products;
|
|
•
|
inability to control delivery schedules;
|
|
•
|
inability to control production levels and to meet minimum volume commitments to our customers;
|
|
•
|
inability to control manufacturing yield;
|
|
•
|
inability to maintain adequate manufacturing capacity; and
|
|
•
|
inability to secure adequate volumes of acceptable components at suitable prices or in a timely manner.
|
Although we promote ethical business practices and our operations personnel periodically visit and monitor the operations of our manufacturers, we do not control the manufacturers or their labor and other legal compliance practices. If our current manufacturers, or any other third-party manufacturer which we may use in the future, violate U.S. or foreign laws or regulations, we may be subjected to extra duties, significant monetary penalties, adverse publicity, the seizure and forfeiture of products that we are attempting to import or the loss of our import privileges. The effects of these factors could render the conduct of our business in a particular country undesirable or impractical and have a negative impact on our operating results.
We depend on sole source suppliers for some products used in our services. The availability and sale of those services would be harmed if any of these suppliers is not able to meet our demand and alternative suitable products are not available on acceptable terms, or at all.
Our services use hardware and software from various third parties, some of which are procured from single suppliers. For example, some of our vehicle tracking and fleet management solutions rely on telecommunications modules procured from Telit and our MiFi mobile hotspots rely substantially on chipsets from Qualcomm. From time to time, certain components used
22
in our products or certain products used in our solutions have been in short supply or their anticipated commercial introduction has been delayed or their availability has been subsequently interrupted for reasons outside our control. If there is a shortage or interruption in the availability to us of any such components or products and we cannot timely obtain a commercially and technologically suitable substitute or make sufficient and timely design or other modifications to permit the use of such a substitute component or product, we may not be able to timely deliver sufficient quantities of our products or solutions to satisfy our contractual obligations and may not be able to meet particular revenue expectations. Moreover, even if we timely locate a substitute part or product, but its price materially exceeds the original cost of the component or product, then our results of operations could be adversely affected.
Product liability, product replacement, or recall costs could adversely affect our business and financial performance.
We are subject to product liability and product recall claims if any of our products and services are alleged to have resulted in injury to persons or damage to property. If any of our products proves to be defective, we may need to recall and/or redesign them. In addition, any claim or product recall that results in significant adverse publicity may negatively affect our business, financial condition, or results of operations. We maintain product liability insurance, but this insurance may not adequately cover losses related to product liability claims brought against us. We may also be a defendant in class action litigation, for which no insurance is available. Product liability insurance could become more expensive and difficult to maintain and may not be available on commercially reasonable terms, if at all. In addition, we do not maintain any product recall insurance, so any product recall we are required to initiate could have a significant impact on our financial position, results of operations or cash flows.
We rely on third-party software and other intellectual property to develop and provide our solutions and significant increases in licensing costs or defects in third-party software could harm our business.
We rely on software and other intellectual property licensed from third parties to develop and offer our solutions, including mapping software and data required to provide solutions to our customers. In addition, we may need to obtain future licenses from third parties to use software or other intellectual property associated with our solutions. We cannot assure you that these licenses will be available to us on acceptable terms, without significant price increases or at all. Any loss of the right to use any such software or other intellectual property required for the development and maintenance of our solutions could result in delays in the provision of our solutions until equivalent technology is either developed by us, or, if available from others, is identified, obtained, and integrated, which could harm our business. Any errors or defects in third-party software could result in errors or a failure of our solutions, which could harm our business.
Our solutions integrate with third-party technologies and if our solutions become incompatible with these technologies, our solutions would lose functionality and our customer acquisition and retention could be adversely affected.
Our solutions integrate with third-party software and devices to allow our solutions to perform key functions. Errors, viruses or bugs may be present in third-party software that our customers use in conjunction with our solutions. Changes to third-party software that our customers use in conjunction with our solutions could also render our solutions inoperable. Customers may conclude that our software is the cause of these errors, bugs or viruses and terminate their subscriptions. The inability to easily integrate with, or any defects in, any third-party software could result in increased costs, or in delays in software releases or updates to our products until such issues have been resolved, which could have a material adverse effect on our business, financial condition, results of operations, cash flows and future prospects and could damage our reputation.
Our software may contain undetected errors, defects or other software problems, and if we fail to correct any defect or other software problems we could lose customers or incur significant costs, which could result in damage to our reputation or harm to our operating results.
Although we warrant that our software will be free of defects for various periods of time, our software platform and its underlying infrastructure are inherently complex and may contain material defects or errors. We must update our solutions quickly to keep pace with the rapidly changing market and the third-party software and devices with which our solutions integrate. We have from time to time found defects in our software and may discover additional defects in the future, particularly as we continue to migrate our product offerings to new platforms or use new devices in connection with our services and solutions. We may not be able to detect and correct defects or errors before customers begin to use our platform or its applications. Consequently, our solutions could contain undetected errors or defects, especially when first introduced or when new versions are released or when new hardware or software is integrated into our solutions. We implement bug fixes and upgrades as part of our regular system maintenance, which may lead to system downtime. Even if we are able to implement the bug fixes and upgrades in a timely manner, any history of defects or inaccuracies in the performance of our software for our customers could result in damage to our reputation or harm to our operating results.
23
Our solutions rely on cellular and GPS networks and any disruption, failure or increase in costs could impede our profitability and harm our financial results.
Two critical links in our current solutions are between in-vehicle devices and GPS satellites and between in-vehicle devices or customer premise equipment and cellular networks, which allow us to obtain location data and transmit it to our system. Increases in the fees charged by cellular carriers for data transmission or changes in the cellular networks, such as a cellular carrier discontinuing support of the network currently used by our in-vehicle devices or customer premise equipment, requiring retrofitting of our devices could increase our costs and impact our profitability. In addition, technologies that rely on GPS depend on the use of radio frequency bands and any modification of the permitted uses of these bands may adversely affect the functionality of GPS and, in turn, our solutions.
Any significant disruption in service on our websites or in our computer systems could damage our reputation and result in a loss of customers, which would harm our business and operating results.
Our brand, reputation, and ability to attract, retain, and serve our customers are dependent upon the reliable performance of our services and our customers’ ability to access our solutions at all times. Our customers rely on our solutions to make operating decisions related to their businesses, as well as to measure, store and analyze valuable data regarding their businesses. Our solutions are vulnerable to interruption and our data centers are vulnerable to damage or interruption from human error, intentional bad acts, computer viruses or hackers, earthquakes, hurricanes, floods, fires, war, terrorist attacks, power losses, hardware failures, systems failures, telecommunications failures, and similar events, any of which could limit our customers’ ability to access our solutions. Prolonged delays or unforeseen difficulties in connection with adding capacity or upgrading our network architecture may cause our service quality to suffer. Any event that significantly disrupts our service or exposes our data to misuse could damage our reputation and harm our business and operating results, including reducing our revenue, causing us to issue credits to customers, subjecting us to potential liability, harming our churn rates, or increasing our cost of acquiring new customers.
We host our solutions and serve our South African customers from our network servers, which are located at our data center facilities in South Africa. In other geographies, we host our solutions and serve our customers from network servers hosted by third parties, which are located at data center facilities in the United States, Europe and Australia. If these data centers are unable to keep up with our growing needs for capacity, this could have an adverse effect on our business. Our disaster recovery systems are located at third-party hosting facilities, except in South Africa where we manage our own disaster recovery system at an offsite facility. While we are increasing redundancy, our systems have not been tested under actual disaster conditions and may not have sufficient capacity to recover all data and services in the event of an outage. In the event of a disaster in which our disaster recovery systems are irreparably damaged or destroyed, we would experience interruptions in access to our products. Any changes in third-party service levels at our data centers or any errors, defects, disruptions, or other performance problems with our solutions could harm our reputation and may damage our data. Interruptions in our services might reduce our revenue, cause us to issue credits or refunds to customers, subject us to potential liability, or harm our churn rates.
We provide minimum service level commitments to certain of our customers, and our failure to meet them could require us to issue credits for future subscriptions or pay penalties, which could harm our results of operations.
Certain of our customer agreements currently, and may in the future, provide minimum service level commitments regarding items such as uptime, functionality or performance. If we are unable to meet the stated service level commitments for these customers or suffer extended periods of service unavailability, we are or may be contractually obligated to provide these customers with credits for future subscriptions, provide services at no cost, or pay other penalties which could adversely impact our revenue. We do not currently have any reserves on our balance sheet for these commitments
.
Failure to maintain the security of our information and technology networks, including information relating to our customers and employees, could adversely affect us. Furthermore, if security breaches in connection with the delivery of our services allow unauthorized third parties to obtain control or access of our fleet management and telemetry solutions, our reputation, business, results of operations and financial condition could be harmed.
We are dependent on information technology networks and systems, including the Internet, to process, transmit and store electronic information and, in the normal course of our business, we collect and retain certain information pertaining to our customers and employees. The protection of customer and employee data is critical to us. We devote significant resources to addressing security vulnerabilities in our products and information technology systems, however, the security measures put in place by us cannot provide absolute security, and our information technology infrastructure may be vulnerable to criminal cyber-attacks or data security incidents due to employee or customer error, malfeasance, or other vulnerabilities. Cybersecurity attacks are increasingly sophisticated, change frequently, and often go undetected until after an attack has been launched. We may fail to identify these new and complex methods of attack, or fail to invest sufficient resources in security measures. We cannot be certain that advances in cyber-capabilities or other developments will not compromise or breach the technology
24
protecting the networks that access our services.
If a security breach occurs, our reputation, business, results of operations and financial condition could be harmed. We may also be subject to costly notification and remediation requirements if we, or a third party, determines that we have been the subject of a data breach involving personal information of individuals. Though it is difficult to determine what harm may directly result from any specific interruption or security breach, any failure or perceived failure to maintain performance, reliability, security and availability of systems or the actual or potential theft, loss, fraudulent use or misuse of our products or the personally identifiable data of a customer or employee, could result in harm to our reputation or brand, which could lead some customers to seek to stop using certain of our services, reduce or delay future purchases of our services, use competing services, or materially and adversely affect the overall market perception of the security and reliability of our services.
RISKS RELATED TO INTERNATIONAL OPERATIONS
Due to the global nature of our operations, we are subject to political and economic risks of doing business internationally.
Our largest subsidiary, Ctrack, is headquartered in South Africa and conducts business in over 50 countries. Most of our employees are located outside the United States, and international revenue represents a significant percentage of our worldwide revenue. The risks inherent in global operations include:
|
•
|
difficulty managing sales, product development and logistics and support across continents;
|
|
•
|
limitations on ownership or participation in local enterprises;
|
|
•
|
lack of familiarity with, and unexpected changes in, foreign laws, regulations and legal standards, including employment laws, product liability laws, privacy laws and environmental laws, which may vary widely across the countries in which we operate;
|
|
•
|
increased expense to comply with U.S. laws that apply to foreign operations, including the U.S. Foreign Corrupt Practices Act (the “FCPA”) and Office of Foreign Assets Control regulations;
|
|
•
|
compliance with, and potentially adverse tax consequences of, foreign tax regimes;
|
|
•
|
fluctuations in currency exchange rates, currency exchange controls, price controls and limitations on repatriation of earnings;
|
|
•
|
transportation delays and interruptions;
|
|
•
|
local economic conditions;
|
|
•
|
political, social and economic instability and disruptions;
|
|
•
|
acts of terrorism and other security concerns;
|
|
•
|
government embargoes or foreign trade restrictions such as tariffs, duties, taxes or other controls;
|
|
•
|
import and export controls;
|
|
•
|
increased product development costs due to differences among countries’ safety regulations and radio frequency allocation schemes and standards;
|
|
•
|
increased expense related to localization of products and development of foreign language marketing and sales materials;
|
|
•
|
longer sales cycles;
|
|
•
|
longer accounts receivable payment cycles and difficulty in collecting accounts receivable in foreign countries;
|
|
•
|
increased financial accounting and reporting burdens and complexities;
|
|
•
|
workforce reorganizations in various locations;
|
|
•
|
restrictive employment regulations;
|
|
•
|
difficulties in staffing and managing multi-national operations;
|
|
•
|
difficulties and increased expense in implementing corporate policies and controls;
|
|
•
|
international intellectual property laws, which may be more restrictive or offer lower levels of protection than U.S. law;
|
|
•
|
compliance with differing and changing local laws and regulations in multiple international locations, including regional data privacy laws, as well as compliance with U.S. laws and regulations where applicable in these international locations; and
|
|
•
|
limitations on our ability to enforce legal rights and remedies.
|
If we are unable to successfully manage these and other risks associated with managing and expanding our international business, the risks could have a material adverse effect on our business, results of operations or financial condition. Further,
25
operating in international markets requires significant management attention and financial resources. Due to the additional uncertainties and risks of doing business in foreign jurisdictions, international acquisitions tend to entail risks and require additional oversight and management attention that are typically not attendant to acquisitions made within the United States. We cannot be certain that the investment and additional resources required to establish, acquire or integrate operations in other countries will produce desired levels of revenue or profitability.
Weakness or deterioration in global economic conditions or jurisdictions where we have significant foreign operations could have a material adverse effect on our results of operations and financial condition.
As a result of weak or deteriorating economic conditions globally, or in certain jurisdictions where we have significant foreign operations such as South Africa, we could experience lower demand for our products, which could adversely impact our results of operations. Additionally, there could be a number of related effects on our business resulting from weak economic conditions, including the insolvency of one or more of our suppliers resulting in product launch or product delivery delays, customer insolvencies resulting in that customer’s inability to order products from us or pay for already delivered products, and reduced demand by the ultimate end-users of our products. Although we continue to monitor market conditions, we cannot predict future market conditions or their impact on demand for our products.
Fluctuations in foreign currency exchange rates, especially the South African Rand against the U.S. Dollar, could adversely affect our results of operations.
A significant portion of our revenues are generated from sales agreements denominated in foreign currencies, and we expect to enter into additional such agreements as we expand our international customer base. In addition, we employ a significant number of employees outside the United States, and the associated employment and facilities costs are denominated in foreign currencies. As a result, we are exposed to changes in foreign currency exchange rates. We have particularly large exposure in South Africa where our Ctrack subsidiary is headquartered and the costs of operating in South Africa are subject to the effects of exchange fluctuations of the South African Rand against the U.S. Dollar. Fluctuations in the value of foreign currencies, particularly the South African Rand against the U.S. Dollar, will create greater uncertainty in our revenues and can significantly and adversely affect our operating results.
At times, we may attempt to manage this risk, in part, by minimizing the effects of volatility on cash flows by identifying forecasted transactions exposed to these risks and using foreign exchange forward contracts. Since there is a high correlation between the hedging instruments and the underlying exposures, the gains and losses on these underlying exposures are generally offset by reciprocal changes in the value of the hedging instruments. We may use derivative financial instruments as risk management tools and not for trading or speculative purposes. Nevertheless, there can be no assurance that we will not incur foreign currency losses or that foreign exchange forward contracts we may enter into to reduce the risk of such losses will be successful.
RISKS RELATED TO REGULATIONS, TAXATION AND ACCOUNTING MATTERS
Our substantial international operations may increase our exposure to potential liability under anti-corruption, trade protection, tax and other laws and regulations.
The FCPA and other anti-corruption laws and regulations (“Anti-Corruption Laws”) prohibit corrupt payments by our employees, vendors or agents. From time to time, we may receive inquiries from authorities in the United States and elsewhere about our business activities outside of the United States and our compliance with Anti-Corruption Laws. While we devote substantial resources to our global compliance programs and have implemented policies, training and internal controls designed to reduce the risk of corrupt payments, our employees, vendors or agents may violate our policies.
Our failure to comply with Anti-Corruption Laws could result in significant fines and penalties, criminal sanctions against us, our officers or our employees, prohibitions on the conduct of our business, and damage to our reputation. Operations outside of the United States may be affected by changes in trade protection laws, policies and measures, and other regulatory requirements affecting trade and investment.
As a result of our international operations we are subject to foreign tax regulations. Such regulations may not be clear, not consistently applied and subject to sudden change, particularly with regard to international transfer pricing. Our earnings could be reduced by the uncertain and changing nature of such tax regulations.
Our software contains encryption technologies, certain types of which are subject to U.S. and foreign export control regulations and, in some foreign countries, restrictions on importation and/or use. Any failure on our part to comply with encryption or other applicable export control requirements could result in financial penalties or other sanctions under the U.S. or foreign export regulations, including restrictions on future export activities, which could harm our business and
26
operating results. Regulatory restrictions could impair our access to technologies needed to improve our solutions and may also limit or reduce the demand for our solutions outside of the United States.
If we do not achieve applicable black economic empowerment objectives in our South African businesses, we risk not being able to renew certain of our existing contracts which service South African government and quasi-governmental customers, as well as not being awarded future corporate and governmental contracts which would result in the loss of revenue.
The South African government, through the Broad-Based Black Economic Empowerment Act, No. 53 of 2003, and the codes of good practice and industry charters published pursuant thereto (collectively “BBBEE”), has established a legislative framework for the promotion of broad-based black economic empowerment. Achievement of BBBEE objectives is measured by a scorecard which establishes a weighting for the various components of BBBEE. BBBEE objectives are pursued in significant part by requiring parties who contract with corporate, governmental or quasi-governmental entities in South Africa to achieve BBBEE compliance through satisfaction of an applicable scorecard. Parties improve their BBBEE score when contracting with businesses that have earned good BBBEE ratings in relation to their scorecards (this includes black-owned businesses).
Ctrack has material contracts with governmental entities that require it to maintain minimum BBBEE rating levels as measured under the BBBEE scorecard. Failure to achieve applicable BBBEE objectives could jeopardize our ability to maintain existing business or to secure future business from these and other corporate, governmental or quasi-governmental customers that could materially and adversely affect our business, financial condition and results of operations.
We are required to comply with South African labor laws with respect to certain of our employees and face the risk of disruption from labor disputes in South Africa, which could result in additional operating costs.
South African laws relating to labor that regulate work time, provide for mandatory compensation in the event of termination of employment for operational reasons, and impose monetary penalties for non-compliance with administrative and reporting requirements in respect of affirmative action policies, could result in additional operating costs. In addition, future changes to South African legislation and regulations relating to labor may increase our costs or alter our relationship with our employees and result in labor disruptions. Resulting disruptions could materially and adversely affect our business, results of operations and financial condition.
Evolving regulations and changes in applicable laws relating to data privacy may increase our expenditures related to compliance efforts or otherwise limit the solutions we can offer, which may harm our business and adversely affect our financial condition.
Our products and solutions enable us to collect, manage and store a wide range of data related to vehicle tracking and fleet management such as vehicle location and fuel usage, speed and mileage. Some of the data we collect or use in our business is subject to data privacy laws, which are complex and increase our cost of doing business. The U.S. federal government and various state governments have adopted or proposed limitations on the collection, distribution and use of personal information. Many foreign jurisdictions, including the European Union and the United Kingdom, have adopted legislation (including directives or regulations) that increase or change the requirements governing data collection and storage in these jurisdictions. Ctrack markets its products in over 50 countries, and accordingly, we are subject to many different, and potentially conflicting, privacy laws. If our privacy or data security measures fail to comply, or are perceived to fail to comply, with current or future laws and regulations, we may be subject to litigation, regulatory investigations or other liabilities.
Moreover, if future laws and regulations limit our ability to use and share this data or our ability to store, process and share data with our clients over the Internet, demand for our solutions could decrease and our costs could increase. We might also have to limit the manner in which we collect information, the types of information that we collect, or the solutions we offer. Any of these could materially and adversely affect our business, results of operations and financial condition.
If we fail to maintain an effective system of internal controls over financial reporting, including remediating a known material weakness in our internal controls as of December 31, 2016, we may not be able to report our financial results timely and accurately, which could adversely affect investor confidence in the Company, and in turn, our results of operations and our stock price.
Effective internal controls are necessary for us to provide reliable financial reports and operate successfully as a public company. Section 404 of the Sarbanes-Oxley Act of 2002 requires that companies evaluate and report on their systems of internal control over financial reporting. In addition, our independent registered public accounting firm must report on its evaluation of those controls.
As disclosed in more detail in Item 9A, Controls and Procedures in Part II of this report, we have identified a material weakness as of December 31, 2016, in our internal controls over financial reporting resulting from a lack of sufficient resources in key accounting and financial reporting roles within the organization necessary to prepare financial statements in time to meet
27
regulatory filing requirements. This lack of sufficient resources was the result of a significant number of unusual and one-time challenges to the Company’s personnel and financial reporting processes, including, but not limited to, implementing the Reorganization, preparing for the divestiture of the MiFi Business and closure of the Company’s accounting function in Eugene, Oregon. Due to this material weakness in our internal control over financial reporting, we have also concluded our disclosure controls and procedures were not effective as of December 31, 2016. Notwithstanding the material weakness that existed as of December 31, 2016, management has concluded that the consolidated financial statements included in this report present fairly, in all material respects, the financial position, results of operations and cash flows of the Company in accordance with U.S. generally accepted accounting principles (GAAP).
We are evaluating measures to remediate the material weakness by continuing to augment our existing resources with additional consultants or employees to assist in financial statement preparation and the analysis and recording of complex accounting transactions. Although we believe that this corrective step will enable management to conclude that the internal controls over our financial reporting are effective, we cannot provide assurance that these steps will be sufficient and we may be required to expend additional resources to remediate the material weakness. A failure to maintain effective internal controls could cause a delay in compliance with our reporting obligations, SEC rules and regulations or Section 404 of the Sarbanes Oxley Act of 2002, which could subject us to a variety of administrative sanctions, including, but not limited to, SEC enforcement action, ineligibility for short form registration, the suspension or delisting of our common stock from the stock exchange on which it is listed and the inability of registered broker-dealers to make a market in our common stock, which could adversely affect our business and the trading price of our common stock.
If the accounting estimates we make, and the assumptions on which we rely, in preparing our financial statements prove inaccurate, our actual results may be adversely affected.
Our financial statements have been prepared in accordance with accounting principles generally accepted in the United States. The preparation of these financial statements requires us to make estimates and judgments about, among other things,
allowance for doubtful accounts receivable, provision for excess and obsolete inventory, valuation of intangible and long-lived assets, valuation of goodwill, valuation of debt obligations, royalty costs, accruals relating to litigation and restructuring, provision for warranty costs, income taxes, share-based compensation expense and the Company’s ability to continue as a going concern.
These estimates and judgments affect the reported amounts of our assets, liabilities, revenues and expenses, the amounts of charges accrued by us, and related disclosure of contingent assets and liabilities. We base our estimates on historical experience and on various other assumptions that we believe to be reasonable under the circumstances and at the time they are made. If our estimates or the assumptions underlying them are not correct, actual results may differ materially from our estimates and we may need to, among other things, accrue additional charges that could adversely affect our results of operations, which in turn could adversely affect our stock price. In addition, new accounting pronouncements and interpretations of accounting pronouncements have occurred and may occur in the future that could adversely affect our reported financial results.
Any changes to existing accounting pronouncements or taxation rules or practices may cause adverse fluctuations in our reported results of operations or affect how we conduct our business.
A change in accounting pronouncements or taxation rules or practices can have a significant effect on our reported results and may affect our reporting of transactions completed before the change is effective. New accounting pronouncements, taxation rules and varying interpretations of accounting pronouncements or taxation rules have occurred in the past and may occur in the future. The change to existing rules, future changes, if any, or the need for us to modify a current tax position may adversely affect our reported financial results or the way we conduct our business.
RISKS RELATED TO OWNING OUR SECURITIES
Our share price has been highly volatile in the past and could be highly volatile in the future.
The market price of our common stock can be highly volatile due to the risks and uncertainties described in this report, as well as other factors, including: comments by securities analysts; announcements by us or others regarding, among other things, operating results, additions or departures of key personnel, and acquisitions or divestitures; additional equity or debt financing; technological innovations; introductions of new products; litigation; price and volume fluctuations in the overall stock market, and particularly with respect to market prices and trading volumes of other high technology stocks; and our failure to meet market expectations.
In addition, the stock market has from time to time experienced extreme price and volume fluctuations that were unrelated to the operating performance of particular companies. In the past, companies that have experienced volatility have sometimes subsequently become the subject of securities class action litigation. If litigation were instituted on this basis, it could result in substantial costs and a diversion of management’s attention and resources.
28
Our future capital needs are uncertain and we may need to raise additional funds in the future. We may not be able to raise such additional funds on acceptable terms or at all.
We may need to raise substantial additional capital in the future to fund our operations, develop and commercialize new products and solutions or acquire companies. If we require additional funds in the future, we may not be able to obtain those funds on acceptable terms, or at all. If we raise additional funds by issuing equity securities, our stockholders may experience dilution. Debt financing, if available, may involve covenants restricting our operations or our ability to incur additional debt. Any debt or additional equity financing that we raise may contain terms that are not favorable to us or our stockholders. In addition, restrictions in our existing debt agreements may limit the amount and/or type of indebtedness that we are able to incur.
If we do not have, or are not able to obtain, sufficient funds, we may have to delay development or commercialization of our products and solutions, liquidate some or all of our assets, or delay, reduce the scope of or eliminate some or all of our sales and marketing expansion programs. Any of these actions could harm our operating results.
If financial or industry analysts do not publish research or reports about our business, or if they issue negative or misleading evaluations of our stock, our stock price and trading volume could decline.
The trading market for our common stock will be influenced by the research and reports that industry or financial analysts publish about us or our business. We do not control these analysts or the content and opinions included in their reports. If one or more of the analysts who cover us were to adversely change their recommendation regarding our stock, or provide more favorable relative recommendations about our competitors, our stock price could decline. If one or more of the analysts who cover us cease coverage of our company or fail to publish reports on us regularly, we could lose visibility in the financial markets, which in turn could cause our stock price or trading volume to decline.
Future issuances of our common stock to holders of warrants may materially and adversely affect the price of our common stock and cause dilution to our existing stockholders.
As of December 31, 2016, we had outstanding warrants to purchase 1,886,630 shares of our common stock. These warrants are generally only exercisable on a cash basis, but may be exercised on a cashless basis if and only if a registration statement relating to the issuance of the shares underlying the warrants is not then effective or an exemption from registration is not available for the resale of such shares. Any such net exercise will dilute the ownership interests of existing stockholders without any corresponding benefit to the Company of a cash payment for the exercise price of such warrant.
Future settlements of any conversion obligations with respect to the
Inseego Notes
may result in dilution to existing stockholders, lower prevailing market prices for our common stock or require a significant cash outlay.
Prior to December 15, 2021, holders may convert their
Inseego Notes
only if certain conditions are met. On or after December 15, 2021, until close of business on the business day immediately preceding the maturity date, holders may convert their
Inseego Notes
at any time. The
Inseego Notes
are convertible into cash, shares of the Company’s common stock, or a combination thereof, at the election of the Company, and are initially convertible into 25,478,728 shares of the Company’s common stock, based on an initial conversion rate of 212.7660 shares of common stock per $1,000 principal amount of
Inseego Notes
(which is equivalent to an initial conversion price of $4.70 per share of common stock). The conversion rate is subject to adjustment if certain events occur, but in no event will the conversion rate exceed 387.5968 shares of common stock per $1,000 principal amount of
Inseego Notes
(which is equivalent to a conversion price of $2.58 per share of common stock). If we elect to settle conversions of the
Inseego Notes
with common stock, this may cause significant dilution to our existing stockholders. Any sales in the public market of the common stock issued upon such conversion could adversely affect prevailing market prices of our common stock. If we do not elect to settle conversion of the
Inseego Notes
solely with common stock, we would be required to settle a portion, or all, of our conversion obligation through the payment of cash, which could adversely affect our liquidity.
Certain provisions in the Inseego Indenture could delay or prevent an otherwise beneficial takeover or takeover attempt of us.
Certain provisions in the Inseego Indenture could make it more difficult or more expensive for a third party to acquire us. For example, if a takeover would constitute a fundamental change, holders of the
Inseego Notes
will have the right to require us to repurchase their
Inseego Notes
in cash. In addition, if a takeover constitutes a make-whole fundamental change (as defined in the Inseego Indenture), we may be required to increase the conversion rate for holders who convert their
Inseego Notes
in connection with such takeover. In either case, and in other cases, our obligations under the
Inseego Notes
and the Indenture could increase the cost of acquiring us or otherwise discourage a third party from acquiring us.
29
Item 1B.
Unresolved Staff Comments
None.
Item 2.
Properties
Our principal executive offices are located in San Diego, California where we lease approximately 41,000 square feet under an arrangement that expires in December 2019 and approximately 12,000 square feet under an arrangement that expires in June 2020. We also currently lease approximately 36,000 square feet in Eugene, Oregon under a lease arrangement that expires in January 2018, and own property in Centurion, South Africa with approximately 28,000 square feet. We further lease space in various geographic locations abroad primarily for sales and support personnel, for research and development, or for temporary facilities. We believe that our existing facilities are adequate to meet our current needs and that we can renew our existing leases or obtain alternative space on terms that would not have a material impact on our financial condition.
Item 3.
Legal Proceedings
On May 27, 2015, a patent infringement action was brought against Novatel Wireless, Inc. (“Novatel Wireless”) and its customers, AT&T and Verizon Wireless, in the Southern District of Florida by Carucel Investments, L.P. (“Carucel”), a non-practicing entity (
Carucel Investments, L.P. v. Novatel Wireless, Inc., et al., U.S.D.C. S.D. Florida, Civil Action No. 0:15-cv-61116-BB
). The complaint alleges that certain MiFi mobile hotspots manufactured by Novatel Wireless infringe claims of patents owned by Carucel. Venue in the case was subsequently transferred to the Southern District of California, and AT&T was later dismissed as a defendant. The litigation is proceeding against Novatel Wireless and Verizon Wireless, and a jury trial is scheduled for April 2017. Carucel is currently seeking royalty damages of approximately $43 million, and the Company has certain indemnification obligations with respect to Verizon Wireless. As this case has approached trial, over the past five months Carucel has significantly increased the amount of damages it is seeking. Novatel Wireless does not believe its MiFi mobile hotspot devices infringe any valid claim in Carucel’s patents, and does not believe that the damages sought in this case represent reasonable royalty amounts even if such infringement existed. Novatel Wireless has vigorously denied any liability. However, there can be no assurance as to the ultimate outcome of this litigation, and an adverse judgment could have a material adverse effect on our business, results of operations, financial condition and cash flows.
We are engaged in other legal actions arising in the ordinary course of our business. In general, while there can be no assurance, we believe that the ultimate outcome of these other legal actions will not have a material adverse effect on our business, results of operations, financial condition or cash flows.
The disclosure in Note
12
,
Commitments and Contingencies
, in the accompanying consolidated financial statements includes a discussion of our legal proceedings and is incorporated herein by reference.
Item 4.
Mine Safety Disclosures
None.
30
Item 5.
Market for Registrant’s Common Equity, Related Stockholder Matters and Issuer Purchases of Equity Securities
Common Stock Data
Shares of our common stock are currently quoted and traded on The Nasdaq Global Select Market under the symbol “INSG” and, prior to November 9, 2016, were quoted on The Nasdaq Global Select Market under the symbol “MIFI”. The following table sets forth, for the periods indicated, the high and low sales prices of our common stock as reported by The Nasdaq Global Select Market.
|
High
($)
|
Low
($)
|
||||||
|
2016
|
|||||||
|
First quarter
|
$
|
1.79
|
|
$
|
0.84
|
|
|
|
Second quarter
|
$
|
1.82
|
|
$
|
1.06
|
|
|
|
Third quarter
|
$
|
3.80
|
|
$
|
1.40
|
|
|
|
Fourth quarter
|
$
|
3.18
|
|
$
|
2.22
|
|
|
|
2015
|
|||||||
|
First quarter
|
$
|
5.90
|
|
$
|
3.06
|
|
|
|
Second quarter
|
$
|
6.89
|
|
$
|
3.09
|
|
|
|
Third quarter
|
$
|
3.28
|
|
$
|
1.90
|
|
|
|
Fourth quarter
|
$
|
2.63
|
|
$
|
1.58
|
|
|
Number of Stockholders of Record
Our outstanding capital stock consists of a single class of common stock. As of March 23, 2017, there were approximately 48 holders of record of our common stock. Because many of the shares of our common stock are held by brokers and other institutions on behalf of stockholders, we are unable to estimate the total number of stockholders represented by these record holders.
Dividends
We have never declared or paid cash dividends on any shares of our capital stock. We currently intend to retain all available funds for use in the operation and development of our business and, therefore, do not anticipate paying any cash dividends in the foreseeable future. Any future determination relating to our dividend policy will be made at the discretion of our board of directors and will depend on a number of factors, including future earnings, capital requirements, financial condition and future prospects and other factors the board of directors may deem relevant. Under the terms of our Revolver, we are prohibited from declaring or paying any cash dividends on our common stock.
31
Performance Graph
The following graph compares the cumulative total stockholder return on the Company’s common stock between December 31,
2011
and December 31,
2016
with the cumulative total return of (i) the Nasdaq Stock Market (U.S.) Index or the Nasdaq Composite Index and (ii) the Nasdaq Telecommunications Index, or the Nasdaq Telecom Index, over the same period. This graph assumes the investment of $100.00 on December 31,
2011
in the common stock of the Company, the Nasdaq Composite Index and the Nasdaq Telecom Index and assumes the reinvestment of any dividends. The stockholder return shown on the graph below should not be considered indicative of future stockholder returns and the Company will not make or endorse any predictions as to future stockholder returns.
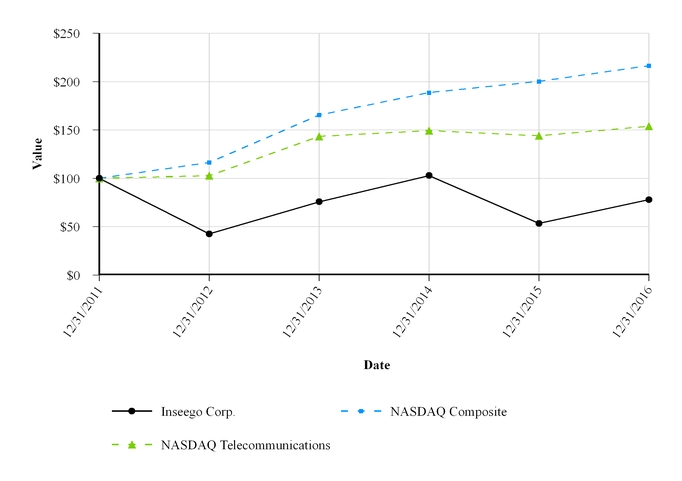
Unregistered Sales of Equity Securities
None.
32
Item 6.
Selected Financial Data
The following selected financial data should be read in conjunction with our consolidated financial statements and the related notes and “Management’s Discussion and Analysis of Financial Condition and Results of Operations” appearing elsewhere in this report. The selected consolidated statements of operations data presented below for each of the years ended December 31,
2016
,
2015
and
2014
, and the consolidated balance sheet data at December 31,
2016
and
2015
are derived from our consolidated financial statements included elsewhere in this report. The selected consolidated statements of operations data for the years ended December 31,
2013
and
2012
and consolidated balance sheet data at December 31,
2014
,
2013
and
2012
are derived from the audited consolidated financial statements not included in this report.
|
|
Year Ended December 31,
|
||||||||||||||||||
|
|
2016
|
2015
|
2014
|
2013
|
2012
|
||||||||||||||
|
Consolidated Statements of Operations Data:
|
(in thousands, except share and per share data)
|
||||||||||||||||||
|
Net revenues
|
$
|
243,555
|
|
$
|
220,942
|
|
$
|
185,245
|
|
$
|
335,053
|
|
$
|
344,288
|
|
||||
|
Cost of net revenues
|
167,227
|
|
161,989
|
|
148,198
|
|
266,759
|
|
271,845
|
|
|||||||||
|
Gross profit
|
76,328
|
|
58,953
|
|
37,047
|
|
68,294
|
|
72,443
|
|
|||||||||
|
Operating costs and expenses:
|
|||||||||||||||||||
|
Research and development
|
30,655
|
|
35,446
|
|
34,314
|
|
48,246
|
|
60,422
|
|
|||||||||
|
Sales and marketing
|
29,782
|
|
20,899
|
|
13,792
|
|
20,898
|
|
27,501
|
|
|||||||||
|
General and administrative
|
52,387
|
|
34,452
|
|
15,402
|
|
24,179
|
|
22,668
|
|
|||||||||
|
Amortization of purchased intangible assets
|
3,927
|
|
2,126
|
|
562
|
|
562
|
|
1,074
|
|
|||||||||
|
Impairment of goodwill and intangible assets
|
2,594
|
|
—
|
|
—
|
|
—
|
|
49,521
|
|
|||||||||
|
Shareholder litigation loss
|
—
|
|
—
|
|
790
|
|
14,326
|
|
—
|
|
|||||||||
|
Restructuring charges, net of recoveries
|
1,987
|
|
3,821
|
|
7,760
|
|
3,304
|
|
—
|
|
|||||||||
|
Total operating costs and expenses
|
121,332
|
|
96,744
|
|
72,620
|
|
111,515
|
|
161,186
|
|
|||||||||
|
Operating loss
|
(45,004
|
)
|
(37,791
|
)
|
(35,573
|
)
|
(43,221
|
)
|
(88,743
|
)
|
|||||||||
|
Other income (expense):
|
|||||||||||||||||||
|
Change in fair value of warrant liability
|
—
|
|
—
|
|
(3,280
|
)
|
—
|
|
—
|
|
|||||||||
|
Non-cash change in acquisition-related escrow
|
—
|
|
(8,286
|
)
|
—
|
|
—
|
|
—
|
|
|||||||||
|
Interest income (expense), net
|
(15,597
|
)
|
(7,164
|
)
|
(85
|
)
|
113
|
|
291
|
|
|||||||||
|
Other income (expense), net
|
414
|
|
1,128
|
|
(167
|
)
|
(222
|
)
|
(203
|
)
|
|||||||||
|
Loss before income taxes
|
(60,187
|
)
|
(52,113
|
)
|
(39,105
|
)
|
(43,330
|
)
|
(88,655
|
)
|
|||||||||
|
Income tax provision
|
381
|
|
181
|
|
124
|
|
83
|
|
611
|
|
|||||||||
|
Net loss
|
(60,568
|
)
|
(52,294
|
)
|
(39,229
|
)
|
(43,413
|
)
|
(89,266
|
)
|
|||||||||
|
Less: Net loss (income) attributable to noncontrolling interests
|
(5
|
)
|
8
|
|
—
|
|
—
|
|
—
|
|
|||||||||
|
Net loss attributable to Inseego Corp.
|
(60,573
|
)
|
(52,286
|
)
|
(39,229
|
)
|
(43,413
|
)
|
(89,266
|
)
|
|||||||||
|
Recognition of beneficial conversion feature
|
—
|
|
—
|
|
(445
|
)
|
—
|
|
—
|
|
|||||||||
|
Net loss attributable to common shareholders
|
$
|
(60,573
|
)
|
$
|
(52,286
|
)
|
$
|
(39,674
|
)
|
$
|
(43,413
|
)
|
$
|
(89,266
|
)
|
||||
|
Net loss per share attributable to common shareholders:
|
|||||||||||||||||||
|
Basic and diluted
|
$
|
(1.12
|
)
|
$
|
(0.99
|
)
|
$
|
(1.05
|
)
|
$
|
(1.28
|
)
|
$
|
(2.72
|
)
|
||||
|
Weighted-average common shares outstanding:
|
|||||||||||||||||||
|
Basic and diluted
|
53,911,270
|
|
52,767,230
|
|
37,958,846
|
|
33,947,935
|
|
32,852,053
|
|
|||||||||
|
|
December 31,
|
||||||||||||||||||
|
|
2016
|
2015
|
2014
|
2013
|
2012
|
||||||||||||||
|
Consolidated Balance Sheet Data:
|
(in thousands)
|
||||||||||||||||||
|
Cash and cash equivalents and marketable securities
(1)
|
$
|
9,894
|
|
$
|
12,570
|
|
$
|
17,853
|
|
$
|
25,532
|
|
$
|
55,309
|
|
||||
|
Working capital
|
6,070
|
|
46,764
|
|
29,397
|
|
40,928
|
|
67,199
|
|
|||||||||
|
Total assets
|
158,716
|
|
198,753
|
|
95,020
|
|
111,465
|
|
161,531
|
|
|||||||||
|
Total long-term liabilities
|
114,066
|
|
104,078
|
|
6,090
|
|
11,848
|
|
2,552
|
|
|||||||||
|
Total stockholders’ equity (deficit)
|
(17,727
|
)
|
30,463
|
|
30,546
|
|
44,916
|
|
85,447
|
|
|||||||||
|
(1)
|
At December 31, 2013, includes restricted marketable securities.
|
33
Item 7.
Management’s Discussion and Analysis of Financial Condition and Results of Operations
The following discussion of our consolidated financial condition and results of operations should be read in conjunction with our consolidated financial statements and related notes included elsewhere in this report. This report contains certain forward-looking statements relating to future events or our future financial performance. These statements are subject to risks and uncertainties which could cause actual results to differ materially from those discussed in this report. You are cautioned not to place undue reliance on this information which speaks only as of the date of this report. We are not obligated to update this information, whether as a result of new information, future events or otherwise, except to the extent we are required to by law. For a discussion of the important risks related to our business and future operating performance, see the discussion under the caption “Item 1A. Risk Factors” and under the caption “Factors Which May Influence Future Results of Operations” below. In light of these risks, uncertainties and assumptions, the forward-looking events discussed in this report might not occur.
Business Overview and Background
We are a leading global provider of software-as-a-service (“SaaS”) and solutions for the Internet of Things (“IoT”). We sell telematics solutions globally under the Ctrack brand, including our fleet management, asset tracking and monitoring, stolen vehicle recovery and usage-based insurance platforms. We also sell connectivity solutions and device management services. Our products and solutions provide anywhere, anytime communications and analytics for consumers and businesses of all sizes, with approximately 620,000 global subscribers, including 432,000 subscribers for our Ctrack branded fleet management and vehicle telematics solutions and 188,000 subscribers for our connectivity and device management services.
We have invented and reinvented ways in which the world stays connected and accesses information. With multiple first-to-market innovations and a strong and growing portfolio of hardware and software innovations for IoT, our companies have been advancing technology and driving industry transformation for over 30 years. It is this proven expertise and commitment to quality and innovation that makes us a preferred global partner of operators, distributors, system integrators, businesses and consumers.
We sell SaaS, software and services solutions across multiple IoT vertical markets, including fleet management and vehicle telematics, usage-based insurance, stolen vehicle recovery, asset tracking and monitoring, business connectivity, and device management. Our platforms are device-agnostic and provide a standardized, scalable way to order, connect and manage remote assets and improve business operations. The platforms are flexible and support both on-premise server or cloud-based deployments and are the basis for the delivery of a wide range of IoT services.
Our SaaS delivery platforms include (i) our Ctrack platforms, which provide fleet, vehicle, asset and other SaaS telematics, (ii) our Crossroads™ platform, which provides easy IoT device management and service enablement and (iii) our Device Management Solutions (“DMS”), a hosted SaaS platform that helps organizations manage the selection, deployment, and spend of their wireless assets, saving money on personnel and telecom expenses.
Our integrated telematics and mobile tracking hardware is predominantly sold as an enabler for our Ctrack SaaS delivery platforms. Our telematics and mobile tracking hardware devices collect and control critical vehicle data and driver behaviors, and can reliably deliver that information to the cloud, all managed by our services enablement platforms. Our wireless routers are sold both as stand-alone devices and as part of a bundled business connectivity solution, including our Crossroads platform and wireless connectivity services via our carrier partners.
Our telematics customer base is comprised of wireless operators, distributors, OEMs and companies in various vertical markets. Fleet management customers include global enterprises such as BHP Billiton, Super Group, Mammoet, and Australia Post. Customers of our government, local council and municipality asset management platforms include Thames Water and the City of Ekurhuleni. Airport asset tracking customers include KLM Equipment Services and Hanover Airport. Usage-based insurances customers include Discovery Insure and Cross Country Insurance Consultants. Our largest vehicle tracking customer is the South African Police Service.
We have strategic technology, development and marketing relationships with several of our customers and partners. Our strong customer and partner relationships provide us with the opportunity to expand our market reach and sales. We partner with leading OEMs, telecom groups and installation partners which allows us to offer customers integrated and holistic solutions. Ctrack uses leading cellular providers such as AT&T, Sprint, T-Mobile, Vodafone, MTN, Telstra and Optus to ensure the optimal real-time visibility of tracked vehicles and systems, supported by accurate and sophisticated mapping services such as the HERE Open Location Platform.
The hardware used in our solutions is produced by contract manufacturers. Their services include component procurement, assembly, testing, quality control and fulfillment. Our contract manufacturers include
Inventec Appliances
34
Corporation and AsiaTelco Technologies Co
. Under our manufacturing agreements, contract manufacturers provide us with services including component procurement, product manufacturing, final assembly, testing, quality control and fulfillment.
Merger, Acquisition and Divestiture Activities
Acquisitions
DigiCore Holdings Limited (DBA Ctrack)
On June 18, 2015, we entered into a transaction implementation agreement (the “TIA”) with DigiCore. Pursuant to the terms of the TIA, we acquired
100%
of the issued and outstanding ordinary shares of DigiCore (with the exception of certain excluded shares, including treasury shares) for
4.40
South African Rand per ordinary share outstanding.
On October 5, 2015, the transaction was completed.
The total preliminary purchase price was approximately
$80.0 million
and included (i) cash consideration of
$79.4 million
for all of the outstanding ordinary shares of DigiCore and the purchase of in-the-money vested stock options held by Ctrack employees on the closing date and (ii)
$0.6 million
for the portion of the fair value of replacement equity awards issued to Ctrack employees that related to services performed prior to the closing date. Upon consummation of the acquisition, Ctrack became an indirect wholly-owned subsidiary of the Company.
R.E.R. Enterprises, Inc. (DBA Feeney Wireless)
On March 27, 2015, we acquired all of the issued and outstanding shares of R.E.R. Enterprises, Inc. (“RER”) and its wholly-owned subsidiary and principal operating asset, FW. The total purchase price was approximately
$24.8 million
and included a cash payment at closing of approximately
$9.3 million
, including
$1.5 million
which was placed into an escrow fund to serve as partial security for the indemnification obligations of RER and its former shareholders, the Company’s assumption of
$0.5 million
in certain transaction-related expenses incurred by FW, and the future issuance of shares of our common stock valued at
$15.0 million
to RER’s former shareholders, which would have been payable in March 2016.
The total consideration of
$24.8 million
paid by the Company for FW did not include amounts, if any, payable under an earn-out arrangement pursuant to which we may have been required to pay up to an additional $25.0 million to the former shareholders of RER contingent upon FW’s achievement of certain financial targets for the years ending December 31, 2015, 2016, and 2017 (the “Earn-Out Arrangement”).
On January 5, 2016, the Company and RER amended certain payment terms related to the Company’s acquisition of RER (the “RER Amendment”). Under the RER Amendment, the $1.5 million placed into escrow on the date of acquisition was released to RER and its former shareholders on January 8, 2016, and the $15.0 million that was payable in shares of our common stock in March 2016 will now be paid in five cash installments over a four-year period, beginning in March 2016. Under the RER Amendment, the Earn-Out Arrangement has been amended (the “Amended Earn-Out Arrangement”) as follows: (a) any amount earned under the Earn-Out Arrangement for the achievement of financial targets for the year ended December 31, 2015 will now be paid in five cash installments over a four-year period, beginning in March 2016 and (b) in replacement of the potential earn-out contingent upon FW’s achievement of certain financial targets for the years ended December 31, 2016 and 2017, we will issue to the former shareholders of RER approximately 2.9 million shares of our common stock in three equal installments over a three-year period, beginning in March 2017.
We recognized approximately
$7.9 million
in expense during the year ended
December 31, 2016
in connection with the earn-out payment due to the former shareholders of RER in the form of 2.9 million shares of our common stock. As of
December 31, 2016
, the total amount earned pursuant to the Amended Earn-Out Arrangement was
$14.0 million
,
$12.5 million
of which remained outstanding as of
December 31, 2016
and is included in accrued expenses and other current liabilities and in other long-term liabilities in the consolidated balance sheets.
Recent and Pending Divestitures
Modules Business
On April 11, 2016, we signed a definitive asset purchase agreement with Telit Technologies (Cyprus) Limited and Telit Wireless Solutions, Inc. (collectively, “Telit”) pursuant to which we sold, and Telit acquired, certain hardware modules and related assets (the “Modules Business”) for an initial purchase price of
$11.0 million
in cash, which included
$9.0 million
that was paid to us on the closing date of the transaction,
$1.0 million
that would be paid to us in equal quarterly installments over a two-year period in connection with the provision by us of certain transition services and
$1.0 million
that would be paid to us following the satisfaction of certain conditions by us, including the assignment of specified contracts and the delivery of certain certifications and approvals. We also had the potential to receive an additional cash payment of approximately
$3.8 million
from Telit related to their purchase of module product inventory from us,
$1.0 million
of which would be paid to us in equal quarterly installments over the two-year period following the closing date in connection with the provision by us of certain
35
transition services. In addition to the above, we may have been entitled to receive a subsequent earn-out payment following the closing of the transaction if certain conditions are met.
On September 29, 2016, we entered into a Final Resolution Letter Agreement (the “Final Resolution”) with Telit. Per the Final Resolution, Telit agreed to pay us
$2.1 million
in full satisfaction of their payment obligations under certain sections of the original purchase agreement, including all installment payments, and we agreed to ship the remainder of the hardware modules and related assets as soon as practicable. Under the Final Resolution, the aggregate purchase consideration totaled
$11.7 million
, which consisted of
$11.3 million
in cash and
$0.4 million
in net settled Company liabilities.
During the year ended
December 31, 2016
, we recognized a gain of approximately
$5.0 million
in connection with the fulfillment of certain obligations pursuant to the asset purchase agreement, as amended, which is included in other income (expense), net, in the consolidated statements of operations. As of
December 31, 2016
, we recorded a liability of
$0.5 million
for the fair value of the remaining hardware and related assets due to Telit, which is included in accrued expenses and other current liabilities in the consolidated balance sheets.
MiFi Business
On September 21, 2016, we entered into a Stock Purchase Agreement (the “Purchase Agreement”), by and among Inseego and Novatel Wireless, on the one hand, and T.C.L. Industries Holdings (H.K.) Limited and Jade Ocean Global Limited (collectively, the “Purchasers”) on the other hand. The Purchase Agreement relates to the pending sale of our subsidiary, Novatel Wireless, which includes the Company’s MiFi branded hotspots and USB modem product lines (the “MiFi Business”), to the Purchasers for $50.0 million in cash, subject to potential adjustment for Novatel Wireless’s working capital as of the closing date. The sale may not close until all of the closing conditions set forth in the Purchase Agreement have been satisfied. One of the closing conditions is the approval of the Committee on Foreign Investment in the United States (“CFIUS”). CFIUS has identified national security concerns relating to our sale of the MiFi Business to the Purchasers. In early February 2017, the Company and the Purchasers voluntarily withdrew and re-filed their notice to CFIUS in order to obtain additional time to provide further information to CFIUS and explore potential mitigation measures that may allow the transaction to proceed. In early March 2017, CFIUS provided a draft mitigation agreement which, if finalized, would allow CFIUS approval to be granted. Negotiations between CFIUS and the Purchasers regarding the final terms of such mitigation agreement remain ongoing.
In order to facilitate our sale of Novatel Wireless, we completed an internal Reorganization in November 2016. The first step of the Reorganization was the formation of Inseego (formerly known as Vanilla Technologies, Inc.) as a direct, wholly owned subsidiary of Novatel Wireless. Inseego then formed Vanilla Merger Sub, Inc., a Delaware corporation and direct, wholly owned subsidiary of Inseego (“Merger Sub”). Merger Sub was formed solely for the purpose of effecting the Reorganization.
Novatel Wireless then contributed all of its assets and liabilities (other than the MiFi Business), including its equity interests in DigiCore, FW, Novatel Wireless Solutions, Inc., Enfora Comercio de Eletronicos LTDA and each of their direct and indirect subsidiaries, to Inseego.
Finally, Merger Sub was merged with and into Novatel Wireless, with Novatel Wireless surviving as a direct, wholly owned subsidiary of Inseego. Upon completion of the Reorganization, each share of Novatel Wireless common stock was automatically converted into a corresponding share of Inseego common stock, having the same rights and limitations as the corresponding share of Novatel Wireless common stock that was converted. Accordingly, at such time, Novatel Wireless’s former stockholders became stockholders of Inseego.
The purpose and effect of the Reorganization was to separate the MiFi Business from the assets and liabilities associated with the Ctrack fleet and vehicle telematics solutions and stolen vehicle recovery and FW telemetry and connectivity solutions businesses.
Business Segment Reporting
We do not provide separate segment reporting for our various lines of business. Our Chief Executive Officer, who is also our Chief Operating Decision Maker, evaluates the business as a single entity and reviews financial information and makes business decisions based on the overall results of the business. As such, the Company's operations constitute a single operating segment and one reportable segment.
36
Factors Which May Influence Future Results of Operations
Net Revenues.
We believe that our future net revenues will be influenced largely by the global demand for SaaS solutions for telematics, including our Ctrack fleet management, asset tracking and monitoring, stolen vehicle recovery, and usage-based insurance platforms. Our future net revenues will also be influenced by the demand in North America for our business connectivity solutions and device management services, as well as customer acceptance of our new products that address our markets and our ability to meet customer demand. Factors that could potentially affect customer demand for our products include the following:
|
•
|
economic environment and related market conditions;
|
|
•
|
increased competition from other fleet and vehicle telematics solutions, as well as suppliers of emerging devices that contain wireless data access or device management feature;
|
|
•
|
rate of change to new products;
|
|
•
|
product pricing; and
|
|
•
|
changes in technologies.
|
Our revenues are also significantly dependent upon the availability of materials and components used in our hardware products.
We anticipate introducing additional products during the next twelve months, including SaaS telematics solutions and additional service offerings. We continue to develop and maintain strategic relationships with wireless industry leaders such as Verizon Wireless, T-Mobile, AT&T, Sprint, Vodafone, MTN, Telstra and Optus. Through strategic relationships, we have been able to maintain market penetration by leveraging the resources of our channel partners, including their access to distribution resources, increased sales opportunities and market opportunities.
Our future net revenues will also be affected by the consummation of the sale of our Modules Business and the pending sale of our MiFi Business.
Cost of Net Revenues.
Cost of net revenues includes all costs associated with our contract manufacturers, distribution, fulfillment and repair services, delivery of SaaS services, warranty costs, amortization of intangible assets, royalties, operations overhead, costs associated with our cancellation of purchase orders, and costs related to outside services. Also included in cost of net revenues are costs related to inventory adjustments, including the FW and Ctrack acquisition-related amortization of the fair value of inventory, as well as any write downs for excess and obsolete inventory and abandoned product lines. Inventory adjustments are impacted primarily by demand for our products, which is influenced by the factors discussed above.
Operating Costs and Expenses.
Our operating costs consist of three primary categories: research and development; sales and marketing; and general and administrative costs.
Research and development is at the core of our ability to produce innovative, leading-edge products. These expenses consist primarily of engineers and technicians who design and test our highly complex products and the procurement of testing and certification services.
Sales and marketing expenses consist primarily of our sales force and product-marketing professionals. In order to maintain strong sales relationships, we provide co-marketing, trade show support and product training. We are also engaged in a wide variety of activities, such as awareness and lead generation programs as well as product marketing. Other marketing initiatives include public relations, seminars and co-branding with partners.
General and administrative expenses include primarily corporate functions such as accounting, human resources, legal, administrative support, and professional fees. This category also includes the expenses needed to operate as a publicly-traded company, including compliance with the Sarbanes-Oxley Act of 2002, as amended, SEC filings, stock exchange fees, and investor relations expense. Although general and administrative expenses are not directly related to revenue levels, certain expenses such as legal expenses and provisions for bad debts may cause significant volatility in future general and administrative expenses.
We have undertaken certain restructuring activities and cost reduction initiatives in an effort to better align our organizational structure and costs with our strategy. Restructuring charges consist primarily of severance costs incurred in connection with the reduction of our workforce and facility exit related costs.
As part of our business strategy, we review, and intend to continue to review, acquisition opportunities that we believe would be advantageous or complementary to the development of our business. Given our current cash position and recent losses, any additional acquisitions we make would likely involve issuing stock and/or borrowing additional funds in order to
37
provide the purchase consideration for the acquisitions. If we make any additional acquisitions, we may incur substantial expenditures in conjunction with the acquisition process and the subsequent assimilation of any acquired business, products, technologies or personnel.
Results of Operations
The following table sets forth our consolidated statements of operations expressed as a percentage of net revenues for the periods indicated.
|
|
Year Ended December 31,
|
||||||||
|
|
2016
|
2015
|
2014
|
||||||
|
Net revenues:
|
(as a percent of net revenues)
|
||||||||
|
Hardware
|
76.9
|
%
|
92.0
|
%
|
99.3
|
%
|
|||
|
SaaS, software and services
|
23.1
|
|
8.0
|
|
0.7
|
|
|||
|
Total net revenues
|
100.0
|
|
100.0
|
|
100.0
|
|
|||
|
Cost of net revenues:
|
|||||||||
|
Hardware
|
56.2
|
|
69.6
|
|
80.0
|
|
|||
|
SaaS, software and services
|
7.7
|
|
3.7
|
|
—
|
|
|||
|
Impairment of abandoned product line
|
4.7
|
|
—
|
|
—
|
|
|||
|
Total cost of net revenues
|
68.7
|
|
73.3
|
|
80.0
|
|
|||
|
Gross profit
|
31.3
|
|
26.7
|
|
20.0
|
|
|||
|
Operating costs and expenses:
|
|||||||||
|
Research and development
|
12.6
|
|
16.0
|
|
18.5
|
|
|||
|
Sales and marketing
|
12.2
|
|
9.5
|
|
7.4
|
|
|||
|
General and administrative
|
21.5
|
|
15.6
|
|
8.3
|
|
|||
|
Amortization of purchased intangible assets
|
1.6
|
|
1.0
|
|
0.3
|
|
|||
|
Impairment of purchased intangible assets
|
1.1
|
|
—
|
|
—
|
|
|||
|
Shareholder litigation loss
|
—
|
|
—
|
|
0.4
|
|
|||
|
Restructuring charges, net of recoveries
|
0.8
|
|
1.7
|
|
4.2
|
|
|||
|
Total operating costs and expenses
|
49.8
|
|
43.8
|
|
39.2
|
|
|||
|
Operating loss
|
(18.5
|
)
|
(17.1
|
)
|
(19.2
|
)
|
|||
|
Other income (expense):
|
|||||||||
|
Change in fair value of warrant liability
|
—
|
|
—
|
|
(1.8
|
)
|
|||
|
Non-cash change in acquisition-related escrow
|
—
|
|
(3.8
|
)
|
—
|
|
|||
|
Interest expense, net
|
(6.4
|
)
|
(3.2
|
)
|
—
|
|
|||
|
Other income (expense), net
|
0.2
|
|
0.5
|
|
(0.1
|
)
|
|||
|
Loss before income taxes
|
(24.7
|
)
|
(23.6
|
)
|
(21.1
|
)
|
|||
|
Income tax provision
|
0.2
|
|
0.1
|
|
0.1
|
|
|||
|
Net loss
|
(24.9
|
)
|
(23.7
|
)
|
(21.2
|
)
|
|||
|
Less: Net loss (income) attributable to noncontrolling interests
|
—
|
|
—
|
|
—
|
|
|||
|
Net loss attributable to Inseego Corp.
|
(24.9
|
)
|
(23.7
|
)
|
(21.2
|
)
|
|||
|
Recognition of beneficial conversion feature
|
—
|
|
—
|
|
(0.2
|
)
|
|||
|
Net loss attributable to common shareholders
|
(24.9
|
)%
|
(23.7
|
)%
|
(21.4
|
)%
|
|||
38
Year Ended December 31,
2016
Compared to Year Ended December 31,
2015
Net revenues
. Net revenues for the year ended
December 31, 2016
were
$243.6 million
,
an increase
of
$22.6 million
, or
10.2%
, compared to the same period in
2015
.
The following table summarizes net revenues by our two product categories (in thousands):
|
Year Ended December 31,
|
Change
|
||||||||||||||
|
Product Category
|
2016
|
2015
|
$
|
%
|
|||||||||||
|
Hardware
|
$
|
187,375
|
|
$
|
203,281
|
|
$
|
(15,906
|
)
|
(7.8
|
)%
|
||||
|
SaaS, software and services
|
56,180
|
|
17,661
|
|
38,519
|
|
218.1
|
%
|
|||||||
|
Total
|
$
|
243,555
|
|
$
|
220,942
|
|
$
|
22,613
|
|
10.2
|
%
|
||||
Hardware
.
The
decrease
in hardware net revenues is primarily a result of the divestiture of our Modules Business and our strategic focus on reducing the volume of our lower margin, standalone hardware sales, partially offset by the acquisition of Ctrack with its hardware net revenues.
SaaS, Software and Services
.
The
increase
in SaaS, software and services net revenues is primarily a result of our acquisition of Ctrack with its subscription-based solutions and our strategic focus on increasing our higher margin, SaaS, software and services revenues.
Cost of net revenues.
Cost of net revenues for the year ended
December 31, 2016
was
$167.2 million
, or
68.7%
of net revenues, compared to
$162.0 million
, or
73.3%
of net revenues, for the same period in
2015
.
The following table summarizes cost of net revenues by our two product categories (in thousands):
|
Year Ended
December 31, |
Change
|
||||||||||||||
|
Product Category
|
2016
|
2015
|
$
|
%
|
|||||||||||
|
Hardware
|
$
|
136,936
|
|
$
|
153,815
|
|
$
|
(16,879
|
)
|
(11.0
|
)%
|
||||
|
SaaS, software and services
|
18,751
|
|
8,174
|
|
10,577
|
|
129.4
|
%
|
|||||||
|
Impairment of abandoned product line
|
11,540
|
|
—
|
|
11,540
|
|
100.0
|
%
|
|||||||
|
Total
|
$
|
167,227
|
|
$
|
161,989
|
|
$
|
5,238
|
|
3.2
|
%
|
||||
Hardware
.
The
decrease
in hardware cost of net revenues is primarily a result of the divestiture of our Modules Business and our strategic focus on reducing the volume of our lower margin, standalone hardware sales, partially offset by the acquisition of Ctrack with its hardware cost of net revenues.
SaaS, software and services
.
The
increase
in SaaS, software and services cost of net revenues is primarily a result of our acquisition of Ctrack with its SaaS, software and services cost of net revenues and our strategic focus on increasing our higher margin, SaaS, software and services revenues.
Impairment of abandoned product line
. The impairment of abandoned product line includes the write down of the value of certain Enfora inventory related to product lines the Company decided to abandon during the year ended
December 31, 2016
.
Gross profit.
Gross profit for the year ended
December 31, 2016
was
$76.3 million
, or a gross margin of
31.3%
, compared to
$59.0 million
, or a gross margin of
26.7%
, for the same period in
2015
. The
increase
in gross profit and gross margin was primarily due to the changes in net revenues and cost of net revenues as discussed above, as the Company sought to transition its revenue mix toward more highly profitable SaaS, software and services business.
Research and development expenses.
Research and development expenses for the year ended
December 31, 2016
were
$30.7 million
, or
12.6%
of net revenues, compared to
$35.4 million
, or
16.0%
of net revenues, for the same period in
2015
. Research and development expenses
decrease
d for the year ended
December 31, 2016
as compared to the same period in
2015
as a result of our expense reduction activities in 2016, including headcount reductions, partially offset by our acquisition of Ctrack with its research and development expenses.
Sales and marketing expenses.
Sales and marketing expenses for the year ended
December 31, 2016
were
$29.8 million
, or
12.2%
of net revenues, compared to
$20.9 million
, or
9.5%
of net revenues, for the same period in
2015
. The
increase
was primarily due to our acquisition of Ctrack with its sales and marketing expenses, partially offset by the release of certain marketing development fund liabilities.
39
General and administrative expenses.
General and administrative expenses for the year ended
December 31, 2016
were
$52.4 million
, or
21.5%
of net revenues, compared to
$34.5 million
, or
15.6%
of net revenues, for the same period in
2015
. General and administrative expenses
increase
d for the year ended
December 31, 2016
primarily as a result of the acquisitions of Ctrack and FW, including non-cash equity earn-out expense, as well as a legal settlement entered into during the year, partially offset by our cost containment initiatives and the lack of an all-employee retention bonus that was paid in 2015.
Amortization of purchased intangible assets
.
The amortization of purchased intangible assets for the years ended
December 31, 2016
and
2015
was
$3.9 million
and
$2.1 million
, respectively. Amortization of purchased intangible assets for the year ended
December 31, 2016
includes the amortization of intangible assets purchased through the acquisitions of Ctrack and FW.
Impairment of purchased intangible assets.
During the year ended
December 31, 2016
, we recorded an impairment loss of
$2.6 million
primarily related to the developed technologies acquired through our acquisition of FW. We did not have an impairment loss during the year ended December 31,
2015
.
Restructuring charges.
Restructuring expenses for the years ended
December 31, 2016
and
2015
were
$2.0 million
and
$3.8 million
, respectively, and predominantly consisted of severance costs incurred in connection with the reduction of our workforce, as well as facility exit related costs.
Non-cash change in acquisition-related escrow
.
During the year ended December 31, 2015, we recorded a non-cash loss of $8.3 million related to an acquisition-related escrow account for the purchase of Ctrack due to the weakening of the South African Rand compared to the U.S. Dollar. We did not have an acquisition-related escrow account during the year ended
December 31, 2016
.
Interest expense, net
.
Interest
expense
, net for the year ended
December 31, 2016
was
$15.6 million
, as compared to
$7.2 million
for the same period in
2015
. The increase in interest expense is primarily a result of the interest expense related to the
$120.0 million
of
5.50%
convertible senior notes due 2020 that Novatel Wireless issued on June 10, 2015 (the “
Novatel Wireless Notes
”) and includes the amortization of the debt discount and debt issuance costs.
Other income (expense), net
.
Other
income
, net, for the year ended
December 31, 2016
was
$0.4 million
, as compared to other income, net, of
$1.1 million
for the same period in
2015
. Other
income
, net, for the year ended
December 31, 2016
primarily related to a
$5.0 million
gain recorded in connection with the sale of our Modules Business, partially offset by net foreign currency transaction losses, including unrealized foreign currency losses on outstanding intercompany loans that Ctrack has with certain of its subsidiaries, which are remeasured at each reporting period. Other income, net, for the year ended December 31,
2015
primarily consisted of unrealized foreign currency gains on outstanding intercompany loans that Ctrack has with certain of its subsidiaries.
Income tax provision.
Income tax expense for the year ended
December 31, 2016
was
$0.4 million
as compared to
$0.2 million
for the same period in
2015
.
The effective tax rate for the year ended
December 31, 2016
is different than the U.S. statutory rate primarily due to a valuation allowance recorded against additional tax assets generated during the year.
Net (income) loss attributable to noncontrolling interests.
Net income attributable to noncontrolling interests for the year ended
December 31, 2016
was
$5,000
as compared to net loss attributable to noncontrolling interests of
$8,000
for the same period in
2015
.
40
Year Ended December 31,
2015
Compared to Year Ended December 31,
2014
Net revenues
. Net revenues were approximately
$220.9 million
during
2015
,
an increase
of approximately
$35.7 million
or
19.3%
compared to
2014
.
The following table summarizes net revenues by our two product categories during the years ended December 31,
2015
and
2014
(in thousands):
|
Year Ended December 31,
|
Change
|
||||||||||||||
|
Product Category
|
2015
|
2014
|
$
|
%
|
|||||||||||
|
Hardware
|
$
|
203,281
|
|
$
|
183,976
|
|
$
|
19,305
|
|
10.5
|
%
|
||||
|
SaaS, Software and Services
|
17,661
|
|
1,269
|
|
16,392
|
|
1,291.7
|
%
|
|||||||
|
Total
|
$
|
220,942
|
|
$
|
185,245
|
|
$
|
35,697
|
|
19.3
|
%
|
||||
Hardware
.
The
increase
in hardware net revenues is primarily a result of the acquisitions of Ctrack and FW and their associated hardware net revenues.
SaaS, software and services
.
The
increase
in SaaS, software and services net revenues is primarily a result of our acquisitions of Ctrack and FW and their associated SaaS, software and services net revenues.
Cost of net revenues.
Cost of net revenues for the year ended December 31,
2015
was approximately
$162.0 million
, or
73.3%
of net revenues, as compared to approximately
$148.2 million
, or
80.0%
of net revenues in
2014
.
The following table summarizes cost of net revenues by our two product categories (in thousands):
|
Year Ended
December 31, |
Change
|
||||||||||||||
|
Product Category
|
2015
|
2014
|
$
|
%
|
|||||||||||
|
Hardware
|
$
|
153,815
|
|
$
|
148,141
|
|
$
|
5,674
|
|
3.8
|
%
|
||||
|
SaaS, software and services
|
8,174
|
|
57
|
|
8,117
|
|
14,240.4
|
%
|
|||||||
|
Total
|
$
|
161,989
|
|
$
|
148,198
|
|
$
|
13,791
|
|
9.3
|
%
|
||||
Hardware
.
The
increase
in hardware cost of net revenues is primarily a result of the acquisition of Ctrack and FW and their associated hardware cost of net revenues.
SaaS, software and services
.
The
increase
in SaaS, software and services cost of net revenues is primarily a result of our acquisitions of Ctrack and FW and their associated SaaS, software and services cost of net revenues.
Gross profit.
Gross profit for the year ended December 31,
2015
was approximately
$59.0 million
, or
26.7%
of net revenues, as compared to approximately
$37.0 million
, or
20.0%
of net revenues, in
2014
. The
increase
in gross profit and gross margin was primarily due to the changes in net revenues and cost of net revenues as discussed above, as the Company acquired Ctrack and FW to transition its revenue mix toward more highly profitable SaaS, software and services business revenue.
Research and development expenses.
Research and development expenses for the year ended December 31,
2015
were approximately
$35.4 million
, or
16.0%
of net revenues, compared to approximately
$34.3 million
, or
18.5%
of net revenues, in
2014
. Research and development expenses for the year ended December 31,
2015
increase
d as compared to the same period in
2014
primarily as a result of our acquisitions of Ctrack and FW, partially offset by our expense reduction activities in 2015, including headcount reductions.
Sales and marketing expenses.
Sales and marketing expenses for the year ended December 31,
2015
were approximately
$20.9 million
, or
9.5%
of net revenues, compared to approximately
$13.8 million
, or
7.4%
of net revenues, in
2014
. Sales and marketing expenses
increase
d as compared to the same period in
2014
, primarily as a result of our acquisitions of Ctrack and FW.
General and administrative expenses.
General and administrative expenses for the year ended December 31,
2015
were approximately
$34.5 million
, or
15.6%
of net revenues, compared to approximately
$15.4 million
, or
8.3%
of net revenues, in
2014
. General and administrative expenses for the year ended December 31,
2015
include acquisition-related charges, including professional, legal, due diligence and other related expenses, contingent earn-out expense, which is treated as compensation expense, and the general and administrative expenses of Ctrack and FW.
41
Amortization of purchased intangible assets
.
The amortization of purchased intangible assets for the years ended December 31,
2015
and
2014
was approximately
$2.1 million
and
$0.6 million
, respectively. Amortization of purchased intangible assets for the year ended December 31, 2015 includes the amortization of intangible assets purchased through the acquisitions of Ctrack and FW for the period following their applicable dates of acquisition through December 31, 2015.
Shareholder litigation loss.
The shareholder litigation loss for the year ended December 31, 2014 was approximately
$0.8 million
and related to the
In re Novatel Wireless Securities Litigation
described in Note
12
,
Commitments and Contingencies
, in the accompanying consolidated financial statements. We did not have shareholder litigation loss for the year ended December 31, 2015.
Restructuring charges.
Restructuring expenses for the year ended December 31,
2015
were approximately
$3.8 million
as compared to approximately
$7.8 million
for the same period in
2014
. Restructuring charges predominantly consisted of severance costs incurred in connection with the reduction of our workforce, as well as facility exit related costs.
Change in fair value of warrant liability.
During the year ended December 31, 2014, we incurred a non-cash loss of $3.3 million related to the 2014 Warrant (as defined below) that we issued in connection with the financing transaction on September 8, 2014, primarily as a result of an increase in the market value of our common stock from September 8, 2014 to November 17, 2014, the date the 2014 Warrant was reclassified to additional paid-in-capital as it was no longer deemed a liability. We did not have a warrant liability during the year ended December 31, 2015.
Interest expense, net.
Interest
expense
, net, for the year ended December 31,
2015
was
$7.2 million
as compared to
$0.1 million
for the same period in
2014
. The increase in interest expense is primarily a result of the interest expense related to the
Novatel Wireless Notes
and includes the amortization of the debt discount and debt issuance costs.
Other income (expense), net.
Other
income
, net, for the year ended December 31,
2015
was
$1.1 million
as compared to other expense, net, of
$0.2 million
for the same period in
2014
. The increase in other income, net, is primarily a result of unrealized foreign currency gains on outstanding intercompany loans that Ctrack has with certain of its subsidiaries, partially offset by the effect of exchange rates on cash and cash equivalents during the period.
Income tax provision.
Income tax expense was approximately
$0.2 million
for the year ended December 31,
2015
, as compared to
$0.1 million
for the same period in
2014
.
Recognition of beneficial conversion feature.
For the year ended December 31, 2014, we recognized the fair value of an embedded beneficial conversion feature for
$0.4 million
on the convertible Series C preferred shares issued in connection with the financing transaction that closed on September 8, 2014. We did not have an embedded beneficial conversion feature during the year ended December 31, 2015.
Liquidity and Capital Resources
Our principal sources of liquidity are our existing cash and cash equivalents and cash generated from operations.
Financing Transaction
On September 3, 2014, we entered into a purchase agreement (the “Purchase Agreement”) with HC2 Holdings 2, Inc., a Delaware corporation (the “Investor”), pursuant to which, on September 8, 2014, we sold to the Investor (i) 7,363,334 shares of our common stock, par value $0.001 per share, (ii) a warrant to purchase 4,117,647 shares of our common stock at an exercise price of $2.26 per share (the “2014 Warrant”) and (iii) 87,196 shares of our Series C Preferred Stock, all at a purchase price of (a) $1.75 per share of common stock plus, in each case, the related 2014 Warrant and (b) $17.50 per share of Series C Preferred Stock, for aggregate gross proceeds of approximately $14.4 million. On November 17, 2014, each share of Series C Preferred Stock then outstanding automatically converted into ten shares of common stock.
On March 26, 2015, the Investor exercised a portion of the 2014 Warrant to purchase 3,824,600 shares of our common stock at an exercise price of $2.26 per share for total proceeds of $8.6 million.
On March 26, 2015, in order to induce the Investor to exercise the 2014 Warrant for cash in connection with the acquisition of FW, we issued to the Investor a new warrant to purchase 1,593,583 shares of our common stock at an exercise price of $5.50 per share.
Revolving Credit Facility
On October 31, 2014, we entered into a senior secured revolving credit facility with Wells Fargo Bank, NA (the “Revolver”) in the amount of $25.0 million. Concurrently with the acquisition of FW, we amended the Revolver to include FW as a borrower and Loan Party, as defined by the agreement. On November 17, 2015, the Revolver was amended to increase the
42
maximum borrowing capacity to $48.0 million. The amount of borrowings that may be made under the Revolver are based on a borrowing base and are comprised of a specified percentage of eligible receivables. If, at any time during the term of the Revolver, the amount of borrowings outstanding under the Revolver exceeds the borrowing base then in effect, we would be required to repay such borrowings in an amount sufficient to eliminate such excess. The Revolver includes
$3.0 million
available for letters of credit,
$0.7 million
of which was available for letters of credit at
December 31, 2016
. As of
December 31, 2016
, there was
no
outstanding balance on the Revolver and we had available borrowings of approximately
$4.7 million
.
On March 20, 2017, subsequent to the balance sheet date, the Revolver was amended (the “Amendment”). The Amendment, made at the Company’s request, amended and updated the financial covenants with respect to liquidity requirements and EBITDA targets, among other things, in order to enable draw-downs by the Company from time to time. In exchange for such accommodations, the Amendment also decreased the aggregate amount available under the Revolver from $48.0 million to
$10.0 million
and increased the applicable margin to
4.00%
when interest is based on the daily three month LIBOR rate and
1.5%
when interest is based on the prime rate.
Convertible Senior Notes
On June 10, 2015, Novatel Wireless issued $120.0 million of the
Novatel Wireless Notes
, which are governed by the terms of the Novatel Wireless Indenture among Novatel Wireless, as issuer, Inseego and Wilmington Trust, National Association, as trustee, as amended by certain supplemental indentures. The
Novatel Wireless Notes
are senior unsecured obligations of Novatel Wireless and bear interest at a rate of 5.50% per year, payable semi-annually in arrears on June 15 and December 15 of each year, beginning on December 15, 2015. The
Novatel Wireless Notes
will mature on June 15, 2020, unless earlier repurchased or converted. The
Novatel Wireless Notes
will be convertible into cash, shares of our common stock, or a combination thereof, at our election, at an initial conversion price of $5.00 per share of our common stock.
On January 9, 2017, subsequent to the balance sheet date, in connection with the settlement of an exchange offer and consent solicitation with respect to the
Novatel Wireless Notes
, the Company issued $119.8 million aggregate principal amount of 5.50% convertible senior notes due 2022 (the “Inseego Notes”). The Inseego Notes were issued in exchange for the $119.8 million aggregate principal amount of outstanding
Novatel Wireless Notes
that were validly tendered and accepted for exchange and subsequently canceled.
As of the filing date of this report, the following aggregate principal amounts remain outstanding (in thousands):
|
Inseego Notes
|
$
|
119,750
|
|
|
Novatel Wireless Notes
|
250
|
|
|
|
Total
|
$
|
120,000
|
|
DigiCore Mortgage Bond
DigiCore has a mortgage bond with Absa Bank Limited in South Africa (“Absa”) that is secured by certain property of DigiCore. The mortgage bond has a
ten
year term, expiring in December 2018, and bears interest at the South Africa prime rate minus
1.75%
(
8.75%
at
December 31, 2016
). At
December 31, 2016
,
$0.6 million
remained outstanding under the mortgage bond.
DigiCore Secured Banking Facility
DigiCore has a secured banking facility with Absa, which had a maximum borrowing capacity of
$1.7 million
at
December 31, 2016
. The facility bears interest at the South Africa prime interest rate less
0.10%
(
10.40%
at
December 31, 2016
) and is subject to renewal annually in
April
. At
December 31, 2016
,
$1.7 million
remained outstanding under this facility.
DigiCore Secured Overdraft Facility
DigiCore has a secured overdraft facility with Grindrod Bank in South Africa, which had a maximum borrowing capacity of
$1.5 million
at
December 31, 2016
. The facility bears interest at the South Africa prime interest rate plus
1.00%
(
11.50%
at
December 31, 2016
), requires monthly interest and, in certain instances, minimum principal payments. The facility is subject to renewal annually in
September
. At
December 31, 2016
,
$1.5 million
remained outstanding under this facility.
RER Amendment
Pursuant to the RER Amendment, we are obligated to pay a total of $15.0 million in five cash installments over a four-year period, beginning in March 2016. We are also obligated to pay a total of approximately $6.1 million in cash over a four-year period, beginning in March 2016, related to the Amended Earn-Out Arrangement. As of the filing date of this report, the March 2017 cash installment has not been paid.
43
We believe that our cash and cash equivalents and availability under our Revolver, together with anticipated cash flows from operations and
proceeds from the completion of the pending sale of the MiFi Business
, will be sufficient to meet these obligations. While our management believes that it is probable that the sale of the MiFi Business will be completed, see “
Other Liquidity Needs
” below for discussion of management’s plans if the sale of the MiFi Business is not completed as expected.
Historical Cash Flows
The following table summarizes our consolidated statements of cash flows for the periods indicated (in thousands):
|
|
Year Ended December 31,
|
||||||
|
|
2016
|
2015
|
|||||
|
Net cash used in operating activities
|
$
|
(6,579
|
)
|
$
|
(26,936
|
)
|
|
|
Net cash provided by (used in) investing activities
|
5,035
|
|
(97,087
|
)
|
|||
|
Net cash provided by (used in) financing activities
|
(1,291
|
)
|
119,167
|
|
|||
|
Effect of exchange rates on cash and cash equivalents
|
159
|
|
(427
|
)
|
|||
|
Net decrease in cash and cash equivalents
|
(2,676
|
)
|
(5,283
|
)
|
|||
|
Cash and cash equivalents, beginning of period
|
12,570
|
|
17,853
|
|
|||
|
Cash and cash equivalents, end of period
|
$
|
9,894
|
|
$
|
12,570
|
|
|
Operating activities.
Net cash
used in
operating activities was
$6.6 million
for the year ended
December 31, 2016
compared to
$26.9 million
for the same period in
2015
. Net cash
used in
operating activities for the year ended
December 31, 2016
was primarily attributable to the net losses incurred during the period, partially offset by non-cash charges related to the acquisitions of Ctrack and FW, depreciation and amortization, including that of the debt discount and debt issuance costs, the impairment of certain product lines the Company decided to abandon and certain purchased intangible assets, the reversal of certain market development fund accruals and share-based compensation expense. Net cash
used in
operating activities for the year ended
December 31, 2015
was primarily attributable to net losses in the period and the unfavorable working capital impacts, partially offset by non-cash charges related to the acquisitions of Ctrack and FW, depreciation and amortization, and share-based compensation expense.
Investing activities.
Net cash
provided by
investing activities during the year ended
December 31, 2016
was
$5.0 million
compared to
$97.1 million
used in
investing activities for the same period in
2015
. Cash
provided by
investing activities during the year ended
December 31, 2016
was primarily attributable to proceeds from the sale of our Modules Business, partially offset by payments made pursuant to the RER Amendment and additions to capitalized software development costs. Cash
used in
investing activities during the year ended
December 31, 2015
was primarily attributable to our acquisitions of Ctrack and FW.
Financing activities.
Net cash
used in
financing activities during the year ended
December 31, 2016
was
$1.3 million
, compared to net cash
provided by
financing activities of
$119.2 million
for the same period in
2015
. Net cash
used in
financing activities during the year ended
December 31, 2016
was primarily attributable to net repayments of DigiCore bank facilities and capital lease obligations, partially offset by proceeds from stock option exercises and purchases under the employee stock purchase plan. Net cash
provided by
financing activities during the year ended
December 31, 2015
was primarily attributable to gross proceeds from the issuance of the Novatel Wireless Notes and the exercise of the 2014 Warrant, partially offset by the payment of issuance costs related to the Novatel Wireless Notes, net repayments on our Revolver and the payoff of the FW assumed credit line and certain capital lease obligations.
44
Contractual Obligations and Commercial Commitments
The following table summarizes our contractual obligations and commercial commitments at
December 31, 2016
, and the effect such obligations could have on our liquidity and cash flow in future periods (in thousands):
|
|
Payments Due by Period
|
||||||||||||||||||
|
|
Total
|
< 1 Year
|
1 - 3 Years
|
4 - 5 Years
|
> 5 Years
|
||||||||||||||
|
Novatel Wireless Notes
(1)
|
$
|
143,100
|
|
$
|
6,600
|
|
$
|
13,200
|
|
$
|
123,300
|
|
$
|
—
|
|
||||
|
DigiCore mortgage bond
(2)
|
585
|
|
238
|
|
347
|
|
—
|
|
—
|
|
|||||||||
|
DigiCore bank facilities
(2)
|
3,238
|
|
3,238
|
|
—
|
|
—
|
|
—
|
|
|||||||||
|
RER Amendment and Amended Earn-Out Arrangement
|
15,823
|
|
5,274
|
|
10,549
|
|
—
|
|
—
|
|
|||||||||
|
Capital lease obligations
(2)
|
1,967
|
|
952
|
|
1,015
|
|
—
|
|
—
|
|
|||||||||
|
Operating lease obligations
(2)
|
7,886
|
|
3,082
|
|
4,475
|
|
329
|
|
—
|
|
|||||||||
|
Total
|
$
|
172,599
|
|
$
|
19,384
|
|
$
|
29,586
|
|
$
|
123,629
|
|
$
|
—
|
|
||||
|
(1)
|
Represents the outstanding borrowings and contractually required interest payments to Novatel Wireless Note holders at
December 31, 2016
, assuming no repurchases or conversions of the Novatel Wireless Notes prior to June 15, 2020, the maturity date. On January 9, 2017, subsequent to the balance sheet date, the Company issued $119.8 million aggregate principal amount of Inseego Notes in exchange for the $119.8 million aggregate principal amount of outstanding
Novatel Wireless Notes
that were validly tendered and accepted for exchange and subsequently canceled.
|
|
(2)
|
Assumes applicable foreign currency exchange rates at
December 31, 2016
remain unchanged.
|
Other Liquidity Needs
We have recently incurred operating losses and had a net loss of
$60.6 million
during the year ended
December 31, 2016
. At
December 31, 2016
, we had available cash and cash equivalents totaling
$9.9 million
, working capital of
$6.1 million
and available borrowings under the Revolver of approximately
$4.7 million
.
Our ability to transition to attaining profitable operations is dependent upon achieving a level of revenues adequate to support our cost structure. If events or circumstances occur such that we do not meet our operating plan as expected, we may be required to reduce planned research and development activities, incur additional restructuring charges or reduce other operating expenses which could have an adverse impact on our ability to achieve our intended business objectives. We believe that our cash and cash equivalents and availability under our Revolver, together with anticipated cash flows from operations and
proceeds from the completion of the pending sale of the MiFi Business
, will be sufficient to meet our working capital needs for the next twelve months
following the filing date of this report
.
Our historical operating results, primarily those related to the MiFi Business, indicate that substantial doubt exists related to the Company’s ability to continue as a going concern. We believe that the closing of the sale of the MiFi Business is probable of occurring and mitigating the substantial doubt raised by our historical operating results and will satisfy our estimated liquidity needs for the twelve months
following the filing date of this report
. In the unlikely event that the sale of the MiFi Business does not close, we would require an alternative source of financing in order to divest the MiFi Business elsewhere or to otherwise streamline the MiFi Business as may be needed. In order to obtain such alternative financing, we must comply with certain requirements under the Revolver and the Inseego Indenture. We have had discussions with potential financing sources, and we believe that
it is probable that such financing would be available to the Company based on terms that have been presented to the Company by financial sources
.
We cannot predict, with certainty, the outcome of the sale of the MiFi Business or any other activities to generate liquidity, including the availability of additional financing. If we are not able to generate additional liquidity through the mechanisms described above or through some combination of other actions, while not expected, we may not be able to access funds under our Revolver, and we may need to secure additional sources of funds, which may not be available on terms that are favorable to us, or at all. Additionally, a failure to generate additional liquidity could negatively impact our access to production, inventory or services that are important to the operation of our business.
Additionally, our liquidity could be impaired if there is any interruption in our business operations, a material failure to satisfy our contractual commitments or a failure to generate revenue from new or existing products.
We may also raise additional funds to accelerate development of new and existing services and products, to respond to competitive pressures or to acquire complementary products, businesses or technologies. There can be no assurance that any required additional financing will be available on terms favorable to us, or at all. In addition, in order to obtain additional borrowings, we must comply with certain requirements under the Revolver and the Inseego Indenture. If additional funds are raised by the issuance of equity securities, our shareholders could experience dilution of their ownership interests and securities
45
issued may have rights senior to those of the holders of our common stock. If additional funds are raised by the issuance of debt securities, we may be subject to certain limitations on our operations. If adequate funds are not available or not available on acceptable terms, we may be unable to take advantage of acquisition opportunities, develop or enhance products or respond to competitive pressures, any of which could have a material adverse effect on our business, financial condition and results of operations.
Off-Balance Sheet Arrangements
We do not have any off-balance sheet arrangements that are material to our results of operations, financial conditions or liquidity.
Critical Accounting Policies and Estimates
The preparation of financial statements in conformity with accounting principles generally accepted in the United States requires management to make estimates and assumptions. These estimates and assumptions affect the reported amounts of assets, liabilities, revenues, expenses and disclosures of contingent assets and liabilities. Actual results could differ from these estimates.
Revenue Recognition.
We generate revenues from the sale of wireless modems to wireless operators, OEM customers and value added resellers and distributors. In addition, we generate revenue from the sale of asset-management solutions utilizing wireless technology and M2M communication devices to transportation and industrial companies, medical device manufacturers and security system providers. Revenue from product sales is generally recognized upon the later of transfer of title or delivery of the product to the customer. Where the transfer of title or risk of loss is contingent on the customer’s acceptance of the product, we will not recognize revenue until both title and risk of loss have transferred to the customer. We recognize revenues from SaaS services pro-rata over the contract term. We record deferred revenue for cash payments received from customers in advance of when revenue recognition criteria are met. We have granted price protection to certain customers in accordance with the provisions of the respective contracts and track pricing and other terms offered to customers buying similar products to assess compliance with these provisions. We estimate the amount of price protection for current period product sales utilizing historical experience and information regarding customer inventory levels. To date, we have not incurred material price protection obligations. Revenues from sales to certain customers are subject to cooperative advertising allowances. Cooperative advertising allowances are recorded as an operating expense to the extent that the advertising benefit is separable from the revenue transaction and the fair value of that advertising benefit is determinable. To the extent that such allowances either do not provide a separable benefit to us, or the fair value of the advertising benefit cannot be reliably estimated, such amounts are recorded as a reduction of revenue. We establish reserves for estimated product returns allowances in the period in which revenue is recognized. In estimating future product returns, we consider various factors, including our stated return policies and practices and historical trends.
We record our hardware revenue associated with the agreed upon price on hardware sales, and accrue any estimated costs of post-delivery performance obligations, such as warranty obligations. We consider the four basic revenue recognition criteria discussed under Staff Accounting Bulletin No. 104 when assessing appropriate revenue recognition as follows:
Criterion #1 — Persuasive evidence of an arrangement must exist;
Criterion #2 — Delivery has occurred;
Criterion #3 — Our price to the buyer must be fixed or determinable; and,
Criterion #4 — Collectability is reasonably assured.
For multiple element arrangements, total consideration received from customers is allocated to the elements. This may include hardware, non-essential software elements and/or essential software, based on a relative selling price. The accounting guidance establishes a hierarchy to determine the selling price to be used for allocating revenue to deliverables as follows: (i) vendors specific objective evidence (“VSOE”), (ii) third party evidence (“TPE”), and (iii) best estimate of selling price (“BESP”). Because we have neither VSOE nor TPE, revenue has been based on our BESP. Amounts allocated to the delivered hardware and the related essential software are recognized at the time of the sale provided all other revenue recognition criteria have been met. Amounts allocated to other deliverables based upon BESP are recognized in the period the revenue recognition criteria have been met.
Our process for determining BESP for deliverables without VSOE or TPE considers multiple factors that may vary depending upon the unique facts and circumstances related to each deliverable. Our prices are determined based upon cost to produce our products, expected order quantities and acceptance in the marketplace. In addition, when developing BESPs for products, we may consider other factors as appropriate, including the pricing of competitive alternatives (if they exist) and product-specific business objectives.
46
We account for multiple element arrangements that primarily consist of software licenses and post contract support (“PCS”) by recognizing revenue for such arrangements ratably over the term of the PCS as we have not established VSOE for the PCS element.
We provide SaaS subscriptions for our fleet and vehicle management solutions in which customers are provided with the ability to wirelessly communicate with monitoring devices installed in vehicles and other mobile assets via software applications hosted by us. The customer has the option to purchase the monitoring device or lease it over the term of the contract. If the customer purchases the monitoring device, we recognize the revenue at the time of purchase. If the customer chooses to lease the monitoring device, we recognize the revenue for the monitoring device over the term of the contract. The Company records such revenue in accordance with the Financial Accounting Standards Board (“FASB”) Accounting Standards Codification (“ASC”) 840,
Leases
, as we have determined that they qualify as operating leases. We recognize revenues from SaaS services over the term of the contract.
Certain of our revenue is based on contractual arrangements. In such instances, management considers the nature of the Company's contractual arrangements in determining whether to recognize certain types of revenue on the basis of the gross amount billed or net amount retained after payments are made to providers of certain services related to the product or service offering. The main factors we use to determine whether to record revenue on a gross or net basis are whether:
|
•
|
we are primarily responsible for the service to the customer;
|
|
•
|
we have discretion in establishing fees paid by the customer; and
|
|
•
|
we are involved in the determination of product or service specifications.
|
When the customer’s fee includes a portion of charges that are paid to another party and we are primarily responsible for providing the service to the customer, revenue is recognized on a gross basis in an amount equal to the fee paid by the customer. The cost of revenues recognized is the amount due to the other party and is recorded as cost of revenues in the consolidated statements of operations. In instances in which another party is primarily responsible for providing the service to the customer, revenue is recognized in the net amount retained by the Company. The portion of the fees that we collect from the customer and remit to the other party are considered pass through amounts and accordingly are not a component of net revenues or cost of net revenues.
Allowance for Doubtful Accounts Receivable.
We provide an allowance for our accounts receivable for estimated losses that may result from our customers’ inability to pay. We determine the amount of the allowance by analyzing known uncollectible accounts, aged receivables, economic conditions, historical losses, and changes in customer payment cycles and our customers’ credit-worthiness. Amounts later determined and specifically identified to be uncollectible are charged or written off against this allowance. To minimize the likelihood of uncollectibility, we review our customers’ credit-worthiness periodically based on credit scores generated by independent credit reporting services, our experience with our customers and the economic condition of our customers’ industries. Material differences may result in the amount and timing of expense for any period if we were to make different judgments or utilize different estimates. If the financial condition of our customers deteriorates resulting in an impairment of their ability to make payments, additional allowances may be required.
Provision for Excess and Obsolete Inventory.
Inventories are stated at the lower of cost (first-in, first-out method) or market. We review the components of our inventory and our inventory purchase commitments on a regular basis for excess and obsolete inventory based on estimated future usage and sales. Write-downs in inventory value or losses on inventory purchase commitments depend on various items, including factors related to customer demand, economic and competitive conditions, technological advances or new product introductions by us or our customers that vary from our current expectations. Whenever inventory is written down, a new cost basis is established and the inventory is not subsequently written up if market conditions improve.
We believe that, when made, the estimates we use in calculating the inventory provision are reasonable and properly reflect the risk of excess and obsolete inventory. If customer demand for our inventory is substantially less than our estimates, inventory write-downs may be required, which could have a material adverse effect on our consolidated financial statements.
Acquisitions.
When acquiring companies, we recognize separately from goodwill the assets acquired and the liabilities assumed at their acquisition date fair values. Goodwill as of the acquisition date is measured as the excess of consideration transferred and the net of the acquisition date fair values of the assets acquired and the liabilities assumed. While we use our best estimates and assumptions as a part of the purchase price allocation process to accurately value assets acquired and liabilities assumed at the acquisition date, our estimates are inherently uncertain and subject to refinement. As a result, during the measurement period, which may be up to one year from the acquisition date, we record adjustments to the assets acquired and liabilities assumed, with the corresponding offset to goodwill. Upon the conclusion of the measurement period or final determination of the values of assets acquired or liabilities assumed, whichever comes first, any subsequent adjustments are recorded to the condensed consolidated statements of operations.
47
Accounting for business combinations requires management to make significant estimates and assumptions, especially at the acquisition date with respect to intangible assets, support liabilities assumed, and pre-acquisition contingencies. Although we believe the assumptions and estimates we have made in the past have been reasonable and appropriate, they are based in part on historical experience, market data and information obtained from the management of the acquired companies and are inherently uncertain.
Examples of critical estimates in valuing certain of the intangible assets the Company has acquired include but are not limited to: (i) future expected cash flows from customer relationships; (ii) estimates to develop or use technology; and (iii) discount rates.
If management determines that a pre-acquisition contingency is probable in nature and estimable as of the acquisition date, we record our best estimate for such a contingency as a part of the preliminary fair value allocation. We continue to gather information for and evaluate pre-acquisition contingencies throughout the measurement period and if we make changes to the amounts recorded or if we identify additional pre-acquisition contingencies during the measurement period, such amounts will be included in the fair value allocation during the measurement period and, subsequently, in our results of operations.
We may be required to pay future consideration to the former shareholders of acquired companies, depending on the terms of the applicable purchase agreements, which may be contingent upon the achievement of certain financial and operating targets, as well as the retention of key employees. If the future consideration is considered to be compensation, amounts will be expensed when incurred.
Purchased Intangible Assets.
In determining the fair value allocation for our acquisitions, we considered, among other factors, our intended uses of the acquired assets and the historical and estimated future demand for the acquired company's products and services. The estimated fair value of intangible assets was determined using the income approach. The income approach relies on an estimation of the present value of the future monetary benefits expected to flow to the owner of an asset during its remaining economic life. This approach requires a projection of the cash flow that the asset is expected to generate in the future. The projected cash flow is discounted to its present value using a rate of return, or discount rate that accounts for the time value of money and the degree of risks inherent in the asset. The expected future cash flow that is projected should include all of the economic benefits attributable to the asset, including the tax savings associated with the amortization of the intangible asset value over the tax life of the asset. The income approach may take the form of a “relief from royalty” methodology, a cost savings methodology, a “with and without” methodology, or excess earnings methodology, depending on the specific asset under consideration.
Long-Lived Assets
. We periodically evaluate the carrying value of the unamortized balances of our long-lived assets, including property, plant and equipment, rental assets and intangible assets, which requires us to make assumptions and judgments regarding the carrying value of these assets. We consider assets to be impaired if the carrying value may not be recoverable based upon our assessment of the following events or changes in circumstances: the asset’s ability to continue to generate income from operations and positive cash flow in future periods; loss of legal ownership or title to the asset; significant changes in our strategic business objectives and utilization of the asset; or significant negative industry or economic trends.
Our assessment includes comparing the carrying amounts of long-lived assets to their associated undiscounted expected future cash flows, which are determined using an expected cash flow model. This model requires estimates of our future revenues, profits, capital expenditures, working capital and other relevant factors. We estimate these amounts by evaluating our historical trends, current budgets, operating plans and other industry data. If the assets are considered to be impaired, the impairment charge recognized is the amount by which the asset’s carrying value exceeds its estimated fair value.
The timing and frequency of our impairment test is based on an ongoing assessment of triggering events that could reduce the fair value of our long-lived assets below their carrying value. We monitor our long-lived asset balances and conduct formal tests on at least an annual basis or earlier when impairment indicators are present. We believe that the assumptions and estimates we used to value long-lived assets were appropriate based on the information available to management. The majority of our long-lived assets are being amortized or depreciated over approximately two to ten years. As most of these assets are associated with technology or trade conditions that may change rapidly; such changes could have an immediate impact on our impairment analysis.
Valuation of Goodwill.
Our goodwill resulted from our acquisitions of FW and Ctrack during 2015. In accordance with the ASC 350,
Intangibles—Goodwill and Other
, we will review goodwill for impairment at least annually at the beginning of the fourth quarter of each year, and more frequently if events or changes in circumstances occur that indicate a potential reduction in the fair value of the reporting unit to which the goodwill has been assigned below its carrying value.
Convertible Debt.
We account for convertible debt instruments that are settleable in cash upon conversion (including partial cash settlement) by separating the liability and equity components of the instruments in a manner that reflects our
48
nonconvertible debt borrowing rate. We determine the carrying amount of the liability component by measuring the fair value of similar debt instruments that do not have the conversion feature. If a similar debt instrument does not exist, we estimate the fair value by using assumptions that market participants would use in pricing a debt instrument, including market interest rates, credit standing, yield curves and volatilities. Determining the fair value of the debt component requires the use of accounting estimates and assumptions. These estimates and assumptions are judgmental in nature and could have a significant impact on the determination of the debt component and the associated non-cash interest expense.
Upon issuance, we assign a value to the debt component equal to the estimated fair value of similar debt instruments without the conversion feature, which could result in our recording the debt instrument at a discount. If the debt instrument is recorded at a discount, we amortize the debt discount over the life of the debt instrument as additional non-cash interest expense utilizing the effective interest method.
Provision for Warranty Costs.
We accrue warranty costs based on estimates of future warranty related replacement, repairs or rework of products. Our warranty policy generally provides between one and three years of coverage for products following the date of purchase. Our policy is to accrue the estimated cost of warranty coverage as a component of cost of revenue in the consolidated statements of operations at the time revenue is recognized. In estimating our future warranty obligations we consider various relevant factors, including the historical frequency and volume of claims, and the cost to replace or repair products under warranty. The warranty provision for our products is determined by using a financial model to estimate future warranty costs. Our financial model takes into consideration actual product failure rates; estimated replacement over the contractual warranty period, repair or rework expenses; and potential risks associated with our different products. The risk levels, warranty cost information, and failure rates used within this model are reviewed throughout the year and updated, if and when, these inputs change.
We actively engage in product improvement programs and processes to limit our warranty costs, but our warranty obligation is affected by the complexity of our product, product failure rates and costs incurred to correct those product failures. The industry in which we operate is subject to rapid technological change, and as a result, we periodically introduce newer, more complex products. Depending on the quality of our product design and manufacturing, actual product failure rates or actual warranty costs could be materially greater than our estimates, which could harm our financial condition and results of operations.
Litigation.
We are currently involved in certain legal proceedings. We will record a loss when we determine information available prior to the issuance of the financial statements indicates the loss is both probable and estimable. Where a liability is probable and there is a range of estimated loss with no best estimate in the range, we record the minimum estimated liability related to the claim. As additional information becomes available, we assess the potential liability related to our pending litigation and revise our estimates, if necessary. Our policy is to expense litigation costs as incurred.
Share-based Compensation.
We have stock incentive plans under which stock options and restricted stock units have been granted to employees and non-employee members of our Board of Directors. We also have an employee stock purchase plan for all eligible employees. Share-based payments to employees, including grants of employee stock options, restricted stock units and employee stock purchase rights, are recognized in the financial statements based upon their respective grant date fair values.
We estimate the fair value of stock option awards and stock purchase rights on the date of grant using an option-pricing model. The value of the portion of the award that is ultimately expected to vest is principally recognized as expense ratably over the requisite service periods. We have estimated the fair value of stock options and stock purchase rights as of the date of grant or assumption using the Black-Scholes option-pricing model, which was developed for use in estimating the value of traded options that have no vesting restrictions and that are freely transferable. The Black-Scholes model considers, among other factors, the expected life of the award and the expected volatility of our stock price. We evaluate the assumptions used to value stock options and stock purchase rights on a quarterly basis. Although the Black-Scholes model is an acceptable model, the fair values generated by the model may not be indicative of the actual fair values of our equity awards, as it does not consider other factors important to those awards to employees, such as continued employment, periodic vesting requirements and limited transferability.
Compensation cost associated with grants of restricted stock units are measured at fair value, which has historically been the closing price of our stock on the date of the grant.
49
Item 7A.
Quantitative and Qualitative Disclosures About Market Risk
Interest Rate Risk
Our investment portfolio is maintained in accordance with our investment policy that defines allowable investments, specifies credit quality standards and limits our credit exposure to any single issuer. The fair value of our cash equivalents and marketable debt securities is subject to change as a result of changes in market interest rates and investment risk related to the issuers’ credit worthiness. At December 31,
2016
, we had
$9.9 million
in cash and cash equivalents. Changes in market interest rates would not be expected to have a material impact on the fair value of our
$35,000
in cash equivalents at December 31,
2016
, as these consisted of money market funds with the value determined based on Level 1 inputs.
As of December 31,
2016
, we do not hold any debt securities nor do we utilize derivative instruments or other financial contracts to manage our exposure to changes in interest rates in our investment portfolio.
Credit Risk
We maintain our cash and cash equivalents and our marketable debt securities, which include various security holdings, types and maturities, with a number of financial institutions. As of the date of this report, we have not identified any significant credit risk associated with any of the financial institutions that maintain our portfolio of cash and cash equivalents and our marketable securities. However, our ability to support our working capital needs depends, in part, on our available cash, cash equivalents, and marketable securities. As a result, any significant decrease in the value of our investments may materially adversely impact our ability to support our working capital needs.
We place our cash investments in instruments that meet credit quality standards specified in our investment policy guidelines at the time the investments are made. At December 31,
2016
, we had cash and cash equivalents of
$9.9 million
, all of which are stated at fair value, including
$35,000
in money market funds.
Money market funds attempt to maintain a net asset value (“NAV”), of $1 per unit of investment. Should the underlying investments held by these money market funds suffer significant losses to market value due to interest rate changes or perceived counterparty risk, the NAV of these money market funds may suffer declines below the targeted $1 NAV. We hold money market funds that target a balance of investment return and preservation of invested capital through diversified holdings. As such, we do not believe we currently have significant exposure to NAV declines for our money market holdings.
Foreign Currency Exchange Rate Risk
Foreign currency transaction exposure results primarily from intercompany transactions and transactions with customers or vendors denominated in currencies other than the functional currency of the legal entity in which the transaction is recorded by us. Assets and liabilities arising from such transactions are translated into the legal entity’s functional currency using the exchange rate in effect at the balance sheet date. Any gain or loss resulting from currency fluctuations is recorded as other income (expense) in our consolidated statements of operations, except for the non-cash change in acquisition-related escrow which is shown as a separate line item in our consolidated statements of operations. Net foreign currency transaction
losses
of approximately
$3.6 million
were recorded for the year ended December 31,
2016
.
For the year ended December 31,
2016
, approximately 26.4% of our revenues and approximately 35.2% of our operating expenses were generated by subsidiaries whose functional currency is not the U.S. Dollar and therefore are subject to foreign currency translation exposure. These foreign functional currencies consist of the South African Rand, Great British Pound, Euro, Malaysian Ringgit and Australian Dollar (collectively, the “Foreign Functional Currencies”). A 10% change in the value of the U.S. Dollar relative to the Foreign Functional Currencies during 2016 would have changed our revenue by approximately $6.4 million and our operating loss by approximately $0.4 million. A 10% change in the value of the U.S. Dollar relative to any of the other currencies in which we receive revenues or incur operating expenses would not have had a material impact on our foreign currency transaction gains or losses.
Foreign currency translation exposure results from the translation of the financial statements of our subsidiaries whose functional currency is not the U.S. Dollar into U.S. Dollars for consolidated reporting purposes. The balance sheets of these subsidiaries are translated into U.S. Dollars using period end exchange rates and their income statements are translated into U.S. Dollars using the average exchange rate over the period. Resulting currency translation adjustments are recorded in accumulated other comprehensive income (loss) in our consolidated balance sheets. Net foreign currency translation gains of
$7.1 million
were recorded for the year ended December 31,
2016
.
As of December 31,
2016
, approximately
54.9%
of our assets and approximately 9.9% of our liabilities were subject to foreign currency translation exposure. A 10% change in the value of the U.S. Dollar relative to the Foreign Functional
50
Currencies or any of the other currencies in which our assets or liabilities are denominated would not have had a material impact on our net foreign currency translation gain or loss.
The Company continuously monitors opportunities to reduce potential monetary risks that may arise from our foreign operations.
Item 8.
Financial Statements and Supplementary Data
Our consolidated financial statements and the Report of Independent Registered Public Accounting Firm appears in Part IV of this report.
Item 9.
Changes in and Disagreements With Accountants on Accounting and Financial Disclosure
None.
Item 9A.
Controls and Procedures
Evaluation of Disclosure Controls and Procedures
We maintain disclosure controls and procedures (as defined in Rule 13a-15(e) under the Securities Exchange Act of 1934, as amended) that are designed to provide reasonable assurance that information required to be disclosed in our reports to the SEC is recorded, processed, summarized and reported within the time periods specified in the SEC’s rules and forms, and that such information is accumulated and communicated to our management, including our principal executive officer and our principal financial and accounting officer, as appropriate, to allow timely decisions regarding required disclosure.
As required by SEC rules, we carried out an evaluation, under the supervision and with the participation of our management, including our principal executive officer and our principal financial and accounting officer, of the effectiveness of the design and operation of our disclosure controls and procedures as of December 31,
2016
, the end of the period covered by this report. Based on the foregoing, our principal executive officer and principal financial and accounting officer concluded that our disclosure controls and procedures were not effective as of December 31,
2016
as a result of the material weakness in internal control over financial reporting described below.
Changes in Internal Control Over Financial Reporting
An evaluation was also performed under the supervision and with the participation of our management, including our principal executive officer and our principal financial and accounting officer, of any change in our internal control over financial reporting that occurred during our last fiscal quarter and that has materially affected, or is reasonably likely to materially affect, our internal control over financial reporting. The evaluation did not identify any change in our internal control over financial reporting that occurred during our latest fiscal quarter and that has materially affected, or is reasonably likely to materially affect, our internal control over financial reporting.
Management’s Annual Report on Internal Control Over Financial Reporting
Our management is responsible for establishing and maintaining adequate internal control over financial reporting, as such term is defined in Exchange Act Rules 13a-15(f) and 15d-15(f). Our internal control over financial reporting is a process designed to provide reasonable assurance regarding the reliability of financial reporting and the preparation of the financial statements for external purposes in accordance with generally accepted accounting principles. Because of its inherent limitations, internal control over financial reporting may not prevent or detect misstatements. Also, projections of any evaluation of effectiveness to future periods are subject to the risk that internal controls may become inadequate because of changes in conditions, or that the degree of compliance with policies and procedures may deteriorate.
Under the supervision and with the participation of our management, including our principal executive officer and principal financial officer, we conducted an evaluation of the effectiveness of our internal control over financial reporting based on the framework set forth in by the Committee of Sponsoring Organizations of the Treadway Commission (COSO) (2013 framework) in
Internal Control—Integrated Framework
. Based on our evaluation under the framework in
Internal Control—Integrated Framework
, our management concluded that our internal control over financial reporting was ineffective as of December 31,
2016
because of a material weakness existing as of such date resulting from a lack of sufficient resources in key accounting and financial reporting roles within the organization necessary to prepare financial statements in time to meet regulatory filing requirements. This lack of sufficient resources was the result of a significant number of unusual and one-time challenges to the Company’s personnel and financial reporting processes, including, but not limited to, implementing the Reorganization, preparing for the divestiture of the MiFi Business and closure of the Company’s accounting function in Eugene, Oregon.
51
We are evaluating measures to remediate the material weakness by continuing to augment our existing resources with additional consultants or employees to assist in financial statement preparation and the analysis and recording of complex accounting transactions. Although we believe that this corrective step will enable management to conclude that the internal controls over our financial reporting are effective, we cannot provide assurance that these steps will be sufficient and we may be required to expend additional resources to remediate the material weakness.
Mayer Hoffman McCann P.C., the independent registered public accounting firm that audited the consolidated financial statements included in this Annual Report on Form 10-K, has also audited our internal control over financial reporting as of December 31,
2016
, as stated in their report which is included herein.
Item 9B.
Other Information
None.
52
Report of Independent Registered Public Accounting Firm
To the Board of Directors and Stockholders
Inseego Corp.
We have audited Inseego Corp.’s (the “Company”) internal control over financial reporting as of December 31, 2016, based on criteria established in
Internal Control-Integrated Framework
issued by the Committee of Sponsoring Organizations of the Treadway Commission (2013 framework) (the COSO criteria). Inseego Corp.’s management is responsible for maintaining effective internal control over financial reporting, and for its assessment of the effectiveness of internal control over financial reporting included in the accompanying Management’s Report on Internal Control over Financial Reporting. Our responsibility is to express an opinion on the Company’s internal control over financial reporting based on our audit.
We conducted our audit in accordance with the standards of the Public Company Accounting Oversight Board (United States). Those standards require that we plan and perform the audit to obtain reasonable assurance about whether effective internal control over financial reporting was maintained in all material respects. Our audit included obtaining an understanding of internal control over financial reporting, assessing the risk that a material weakness exists, testing and evaluating the design and operating effectiveness of internal control based on the assessed risk, and performing such other procedures as we considered necessary in the circumstances. We believe that our audit provides a reasonable basis for our opinion.
A company’s internal control over financial reporting is a process designed to provide reasonable assurance regarding the reliability of financial reporting and the preparation of financial statements for external purposes in accordance with generally accepted accounting principles. A company’s internal control over financial reporting includes those policies and procedures that (1) pertain to the maintenance of records that, in reasonable detail, accurately and fairly reflect the transactions and dispositions of the assets of the company; (2) provide reasonable assurance that transactions are recorded as necessary to permit preparation of financial statements in accordance with generally accepted accounting principles, and that receipts and expenditures of the company are being made only in accordance with authorizations of management and directors of the company; and (3) provide reasonable assurance regarding prevention or timely detection of unauthorized acquisition, use, or disposition of the company’s assets that could have a material effect on the financial statements.
Because of its inherent limitations, internal control over financial reporting may not prevent or detect misstatements. Also, projections of any evaluation of effectiveness to future periods are subject to the risk that controls may become inadequate because of changes in conditions, or that the degree of compliance with the policies or procedures may deteriorate.
A material weakness is a deficiency, or a combination of deficiencies, in internal control over financial reporting, such that there is a reasonable possibility that a material misstatement of the company’s annual or interim financial statements will not be prevented or detected on a timely basis. A material weakness related to ineffective controls resulting from a lack of sufficient resources to prepare financial statements in time to meet regulatory filing requirements has been identified and included in management’s assessment.
We also have audited, in accordance with the standards of the Public Company Accounting Oversight Board (United States), the consolidated balance sheet of Inseego Corp. as of December 31, 2016, and the related consolidated statements of operations, comprehensive loss, stockholders’ equity (deficit), and cash flows for the year then ended. The material weakness was considered in determining the nature, timing, and extent of audit tests applied in our audit of the 2016 consolidated financial statements, and this report does not affect our report dated March 31, 2017, which expressed an unqualified opinion on those consolidated financial statements.
In our opinion, because of the effect of the aforementioned material weakness on the achievement of the objectives of the control criteria, Inseego Corp. has not maintained effective internal control over financial reporting as of December 31, 2016, based on the COSO criteria.
/s/ MAYER HOFFMAN MCCANN P.C.
San Diego, California
March 31, 2017
53
Items 10, 11, 12, 13 and 14.
The information required by Items 10, 11, 12, 13 and 14 is incorporated by reference from the Company’s definitive proxy statement for the
2017
Annual Meeting of Stockholders, which the Company intends to file with the SEC within 120 days of the end of the fiscal year end to which this report relates.
Item 15.
Exhibits and Financial Statement Schedules
|
(a)(1)
|
The Company’s consolidated financial statements and report of the Mayer Hoffman McCann P.C., Independent Registered Public Accounting Firm, are included in Section IV of this report beginning on page F-1.
|
|
(a)(2)
|
The following financial statement schedules for the years ended December 31,
2016
,
2015
and
2014
should be read in conjunction with the consolidated financial statements, and related notes thereto.
|
|
Schedule
|
Page
|
|
Schedule II—Valuation and Qualifying Accounts
|
|
Schedules not listed above have been omitted because they are not applicable or are not required or the information required to be set forth therein is included in the consolidated financial statements or related notes thereto.
|
(b)
|
Exhibits
|
The following Exhibits are filed as part of, or incorporated by reference into this report:
|
Exhibit No.
|
Description
|
|
|
2.1
|
Agreement and Plan of Merger, dated March 27, 2015, by and among Novatel Wireless, Inc., Duck Acquisition, Inc., R.E.R. Enterprises, Inc., the stockholders of R.E.R. Enterprises, Inc. and Ethan Ralston, as the representative of the stockholders (incorporated by reference to Exhibit 2.1 to the Company’s Current Report on Form 8-K, filed April 1, 2015).
|
|
|
2.2
|
Amendment No. 1 to Agreement and Plan of Merger, dated January 5, 2016, by and among Novatel Wireless, Inc., Duck Acquisition, Inc., R.E.R. Enterprises, Inc., certain stockholders of R.E.R. Enterprises, Inc. and Ethan Ralston, as the representative of the R.E.R. stockholders (incorporated by reference to Exhibit 2.1 to the Company’s Current Report on Form 8-K, filed January 11, 2016).
|
|
|
2.3
|
Transaction Implementation Agreement, by and between Novatel Wireless, Inc. and DigiCore Holdings Limited, dated June 18, 2015 (incorporated by reference to Exhibit 2.1 to the Company’s Current Report on Form 8-K, filed on June 24, 2015).
|
|
|
2.4
|
Asset Purchase Agreement, dated April 11, 2016, by and among Novatel Wireless, Inc. and Telit Technologies (Cyprus) Limited and Telit Wireless Solutions, Inc. (incorporated by reference to Exhibit 2.5 to the Company’s Quarterly Report on Form 10-Q for the period ended March 31, 2016, filed on May 10, 2016).
|
|
|
2.5
|
Final Resolution Letter Agreement, dated September 29, 2016, by and among Novatel Wireless, Inc. and Telit Technologies (Cyprus) Limited and Telit Wireless Solutions, Inc. (incorporated by reference to Exhibit 2.5 to the Company’s Quarterly Report on Form 10-Q for the period ended September 30, 2016, filed on November 7, 2016).
|
|
|
2.6
|
Stock Purchase Agreement, dated as of September 21, 2016, among Vanilla Technologies, Inc., Novatel Wireless, Inc., T.C.L. Industries Holdings (H.K.) Limited and Jade Ocean Global Limited (incorporated by reference to Exhibit 2.1 to the Company’s Current Report on Form 8-K, filed September 22, 2016).
|
|
|
2.7
|
Agreement and Plan of Merger, dated as of November 7, 2016, among Vanilla Technologies, Inc., Novatel Wireless, Inc. and Vanilla Merger Sub, Inc. (incorporated by reference to Exhibit 2.1 to the Company’s Current Report on Form 8-K, filed November 9, 2016).
|
|
|
3.1
|
Amended and Restated Certificate of Incorporation (incorporated by reference to Exhibit 3.1 to the Company’s Current Report on Form 8-K, filed November 9, 2016).
|
|
|
3.2
|
Amended and Restated Bylaws of Inseego Corp. (incorporated by reference to Exhibit 3.2 to the Company’s Current Report on Form 8-K, filed November 9, 2016).
|
|
|
4.1
|
Form of Inseego Corp. Common Stock Certificate (incorporated by reference to Exhibit 4.1 to the Company’s Current Report on Form 8-K filed November 9, 2016).
|
|
54
|
Exhibit No.
|
Description
|
|
|
4.2
|
Investors’ Rights Agreement, dated September 8, 2014, by and between Novatel Wireless, Inc. and HC2 Holdings 2, Inc. (incorporated by reference to Exhibit 4.2 to the Company’s Current Report on Form 8-K, filed September 8, 2014).
|
|
|
4.3
|
Warrant to Purchase Common Stock issued to HC2 Holdings 2, Inc., dated September 8, 2014 (incorporated by reference to Exhibit 4.1 to the Company’s Current Report on Form 8-K, filed September 8, 2014).
|
|
|
4.4
|
Warrant to Purchase Common Stock issued to HC2 Holdings 2, Inc. on March 26, 2015 (incorporated by reference to Exhibit 4.1 to the Company’s Current Report on Form 8-K, filed April 1, 2015).
|
|
|
4.5
|
Indenture, dated January 9, 2017, between Inseego Corp. and Wilmington Trust, National Association, as Trustee (incorporated by reference to Exhibit 4.2 to the Company’s Current Report on Form 8-K, filed January 10, 2017).
|
|
|
4.6
|
Form of Inseego Corp.’s 5.50% Convertible Senior Note due 2022 (incorporated by reference to Exhibit 4.2 to the Company’s Current Report on Form 8-K, filed January 10, 2017).
|
|
|
4.7
|
Indenture, dated June 10, 2015, between Novatel Wireless, Inc. and Wilmington Trust, National Association, as Trustee (incorporated by reference to Exhibit 4.1 to the Company’s Current Report on Form 8-K, filed June 10, 2015).
|
|
|
4.8
|
First Supplemental Indenture, dated November 8, 2016, among Novatel Wireless, Inc., Inseego Corp. and Wilmington Trust, National Association, as Trustee (incorporated by reference to Exhibit 4.2 to the Company’s Current Report on Form 8-K, filed November 9, 2016).
|
|
|
4.9
|
Second Supplemental Indenture, dated January 6, 2017, between Novatel Wireless, Inc. and Wilmington Trust, National Association, as Trustee (incorporated by reference to Exhibit 4.1 to the Company’s Current Report on Form 8-K, filed January 10, 2017).
|
|
|
4.10
|
Form of Novatel Wireless, Inc.’s 5.50% Convertible Senior Note due 2020 (incorporated by reference to Exhibit 4.2 to the Company’s Current Report on Form 8-K, filed June 10, 2015).
|
|
|
10.1
|
Credit and Security Agreement, dated as of October 31, 2014, by and among Novatel Wireless, Inc., Enfora, Inc. and Feeney Wireless, LLC, as Borrowers, R.E.R. Enterprises, Inc. and Feeney Wireless IC-DISC, Inc., as Guarantors, and Wells Fargo Bank, National Association, as Lender, as amended through June 11, 2015 (incorporated by reference to Exhibit 10.7 to the Company’s Quarterly Report on Form 10-Q for the period ended June 30, 2015, filed August 7, 2015).
|
|
|
10.2
|
Fifth Amendment to Credit and Security Agreement, dated October 5, 2015, by and among Novatel Wireless, Inc., Enfora, Inc., Feeney Wireless, LLC and Wells Fargo Bank, National Association (incorporated by reference to Exhibit 10.1 to the Company’s Quarterly Report on Form 10-Q for the period ended September 30, 2015, filed on November 9, 2015.)
|
|
|
10.3
|
Sixth Amendment to Credit and Security Agreement, dated as of November 17, 2015, by and among Novatel Wireless, Inc., Enfora, Inc. and Feeney Wireless, as Borrowers, R.E.R. Enterprises, Inc. and Feeney Wireless IC-DISC, Inc., as Guarantors, and Wells Fargo Bank, National Association, as Lender (incorporated by reference to Exhibit 10.1 to the Company’s Current Report on Form 8-K, filed November 18, 2015).
|
|
|
10.4
|
Seventh Amendment to Credit and Security Agreement, dated as of January 5, 2016, by and among Novatel Wireless, Inc., Enfora, Inc. and Feeney Wireless, LLC, as Borrowers, R.E.R. Enterprises, Inc. and Feeney Wireless IC-DISC, Inc., as Guarantors, and Wells Fargo Bank, National Association, as Lender (incorporated by reference to Exhibit 10.1 to the Company’s Current Report on Form 8-K, filed January 11, 2016).
|
|
|
10.5
|
Eighth Amendment to Credit and Security Agreement, dated as of June 29, 2016, by and among Novatel Wireless, Inc., Enfora, Inc. and Feeney Wireless, LLC, as Borrowers, R.E.R. Enterprises, Inc. and Feeney Wireless IC-DISC, Inc., as Guarantors, and Wells Fargo Bank, National Association, as Lender (incorporated by reference to Exhibit 10.1 to the Company’s Quarterly Report on Form 10-Q for the period ended September 30, 2016, filed November 7, 2016).
|
|
|
10.6
|
Ninth Amendment to Credit and Security Agreement, dated as of September 28, 2016, by and among Novatel Wireless, Inc., Enfora, Inc. and Feeney Wireless, LLC, as Borrowers, R.E.R. Enterprises, Inc. and Feeney Wireless IC-DISC, Inc., as Guarantors, and Wells Fargo Bank, National Association, as Lender (incorporated by reference to Exhibit 10.2 to the Company’s Quarterly Report on Form 10-Q for the period ended September 30, 2016, filed November 7, 2016).
|
|
55
|
Exhibit No.
|
Description
|
|
|
10.7
|
Joinder and Tenth Amendment to Credit and Security Agreement, dated as of September 28, 2016, by and among Inseego Corp., Novatel Wireless, Inc., Enfora, Inc. and Feeney Wireless, LLC, as Borrowers, R.E.R. Enterprises, Inc. and Feeney Wireless IC-DISC, Inc., as Guarantors, and Wells Fargo Bank, National Association, as Lender (incorporated by reference to Exhibit 10.2 to the Company’s Current Report on Form 8-K, filed November 9, 2016).
|
|
|
10.8**
|
Eleventh Amendment to Credit and Security Agreement, dated as of December 27, 2016, by and among Novatel Wireless, Inc., Enfora, Inc. and Feeney Wireless, LLC, as Borrowers, R.E.R. Enterprises, Inc. and Feeney Wireless IC-DISC, Inc., as Guarantors, and Wells Fargo Bank, National Association, as Lender.
|
|
|
10.9*
|
Amended and Restated Novatel Wireless, Inc. 2000 Stock Incentive Plan (“2000 Plan”) (incorporated by reference to Exhibit 10.1 to the Company’s Quarterly Report on Form 10-Q for the period ended June 30, 2007, filed August 9, 2007).
|
|
|
10.10*
|
Form of Executive Officer Stock Option Agreement under the 2000 Plan (incorporated by reference to Exhibit 10.3 to the Company’s Annual Report on Form 10-K for the year ended December 31, 2005, filed March 16, 2006).
|
|
|
10.11*
|
Form of Director Stock Option Agreement under the 2000 Plan (incorporated by reference to Exhibit 10.4 to the Company’s Annual Report on Form 10-K for the year ended December 31, 2005, filed March 16, 2006).
|
|
|
10.12*
|
Form of Amendment of Stock Option Agreements, dated July 20, 2006, by and between the Company and Optionee with respect to the 2000 Plan (incorporated by reference to Exhibit 10.3 to the Company’s Quarterly Report on Form 10-Q for the period ended September 30, 2006, filed November 9, 2006).
|
|
|
10.13*
|
Form of Amendment of Stock Option Agreements, dated July 20, 2006, by and between the Company and Optionee with respect to the 2000 Plan and grants made pursuant thereto in 2004 and subsequently (incorporated by reference to Exhibit 10.4 to the Company’s Quarterly Report on Form 10-Q for the period ended September 30, 2006, filed November 9, 2006).
|
|
|
10.14*
|
Amended and Restated Novatel Wireless, Inc. 2000 Employee Stock Purchase Plan (incorporated by reference to Appendix A to the Company’s Proxy Statement on Schedule 14A filed April 30, 2013).
|
|
|
10.15*
|
Form of Restricted Share Award Agreement for restricted stock granted to non-employee directors (incorporated by reference to Exhibit 10.10 to the Company’s Quarterly Report on Form 10-Q for the period ended June 30, 2006, filed August 9, 2006).
|
|
|
10.16*
|
Form of Restricted Share Award Agreement for restricted stock granted to executive officers (incorporated by reference to Exhibit 10.11 to the Company’s Quarterly Report on Form 10-Q for the period ended June 30, 2006, filed August 9, 2006).
|
|
|
10.17*
|
Form of Indemnification Agreement (incorporated by reference to Exhibit 10.2 to the Company’s Current Report on Form 8-K, filed November 6, 2014).
|
|
|
10.18*
|
Offer Letter, dated November 2, 2014, by and between Novatel Wireless, Inc. and Alex Mashinsky (incorporated by reference to Exhibit 10.3 to the Company’s Current Report on Form 8-K, filed November 6, 2014).
|
|
|
10.19*
|
Offer Letter, effective September 2, 2014, by and between the Company and Michael Newman (incorporated by reference to Exhibit 10.1 to the Company’s Current Report on Form 8-K, filed September 4, 2014).
|
|
|
10.20*
|
Amended and Restated Change in Control and Severance Agreement, dated April 22, 2015, by and between the Company and Michael Newman (incorporated by reference to Exhibit 10.3 to the Company’s Current Report on Form 8-K, filed on April 23, 2015).
|
|
|
10.21*
|
Offer Letter, dated April 17, 2015, by and between the Company and Dr. Slim Souissi (incorporated by reference to Exhibit 10.1 to the Company’s Current Report on Form 8-K, filed on April 23, 2015).
|
|
|
10.22*
|
Change in Control and Severance Agreement, dated April 17, 2015, by and between the Company and Dr. Slim Souissi (incorporated by reference to Exhibit 10.2 to the Company’s Current Report on Form 8-K, filed on April 23, 2015).
|
|
|
10.23*
|
Change in Control and Severance Agreement, dated April 13, 2015, by and between Novatel Wireless, Inc. and Stephen Sek (incorporated by reference to Exhibit 10.4 to the Company’s Quarterly Report on Form 10-Q for the period ended June 30, 2015, filed on August 10, 2015).
|
|
|
10.24*
|
Change in Control and Severance Agreement, dated April 13, 2015, by and between Novatel Wireless, Inc. and John Carney (incorporated by reference to Exhibit 10.4 to the Company’s Quarterly Report on Form 10-Q for the period ended June 30, 2015, filed on August 10, 2015).
|
|
56
|
Exhibit No.
|
Description
|
|
|
10.25*
|
Change in Control and Severance Agreement, dated May 7, 2015, by and between Novatel Wireless, Inc. and Lance Bridges (incorporated by reference to Exhibit 10.4 to the Company’s Quarterly Report on Form 10-Q for the period ended June 30, 2015, filed on August 10, 2015).
|
|
|
10.26*
|
Offer Letter, dated December 11, 2015, by and between the Company and Sue Swenson (incorporated by reference from the Company’s Annual Report on Form 10-K for the year ended December 31, 2015, filed March 14, 2016).
|
|
|
10.27*
|
Corporate Bonus Plan, effective April 1, 2015 (incorporated by reference to Exhibit 10.3 to the Company’s Current Report on Form 8-K, filed on April 1, 2015).
|
|
|
10.28*
|
2016 Corporate Bonus Plan for Novatel Wireless, Inc. Employees (incorporated by reference to Exhibit 4.1 to the Company’s Quarterly Report on Form 10-Q for the period ended March 31, 2016, filed on May 10, 2016).
|
|
|
10.29*
|
Amended and Restated Novatel Wireless, Inc. 2009 Omnibus Incentive Compensation Plan (incorporated by reference to Exhibit 10.1 to the Company’s Current Report on Form 8-K, filed on June 20, 2016).
|
|
|
10.30*
|
Novatel Wireless, Inc. 2015 Incentive Compensation Plan (incorporated by reference to Exhibit 4.3 to the Company’s Registration Statement on Form S-8, filed on October 1, 2015).
|
|
|
10.31*
|
Form of Nonstatutory Stock Option Agreement under the Novatel Wireless, Inc. 2015 Incentive Compensation Plan (incorporated by reference to Exhibit 4.4 to the Company’s Registration Statement on Form S-8, filed on October 1, 2015).
|
|
|
10.32
|
Contribution Agreement, dated November 8, 2016, by and between Novatel Wireless, Inc. and Inseego Corp. (incorporated by reference to Exhibit 10.1 to the Company’s Current Report on Form 8-K, filed on November 9, 2016).
|
|
|
21**
|
Subsidiaries of Inseego Corp.
|
|
|
23.1**
|
Consent of Independent Registered Public Accounting Firm (Mayer Hoffman McCann P.C.).
|
|
|
23.2**
|
Consent of Independent Registered Public Accounting Firm (Ernst & Young LLP).
|
|
|
24**
|
Power of Attorney (See signature page).
|
|
|
31.1**
|
|
Certification of our Principal Executive Officer adopted pursuant to Section 302 of the Sarbanes-Oxley Act of 2002.
|
|
31.2**
|
|
Certification of our Principal Financial Officer adopted pursuant to Section 302 of the Sarbanes-Oxley Act of 2002.
|
|
32.1**
|
|
Certification of Principal Executive Officer pursuant to 18 U.S.C. Section 1350, as adopted pursuant to Section 906 of the Sarbanes-Oxley Act of 2002.
|
|
32.2**
|
|
Certification of Principal Financial Officer pursuant to 18 U.S.C. Section 1350, as adopted pursuant to Section 906 of the Sarbanes-Oxley Act of 2002.
|
|
101**
|
|
The following financial statements and footnotes from the Inseego Corp. Annual Report on Form 10-K for the year ended December 31, 2016 formatted in eXtensible Business Reporting Language (XBRL): (i) Consolidated Balance Sheets; (ii) Consolidated Statements of Operations; (iii) Consolidated Statements of Comprehensive Loss; (iv) Consolidated Statements of Stockholders’ Equity; (v) Consolidated Statements of Cash Flows; and (vi) the Notes to Consolidated Financial Statements.
|
|
*
|
Management contract, compensatory plan or arrangement
|
|
|
**
|
Filed herewith
|
|
None.
57
SIGNATURES
Pursuant to the requirements of Section 13 or 15(d) of the Securities Exchange Act of 1934, the Registrant has duly caused this report to be signed on its behalf by the undersigned, thereunto duly authorized.
|
Date: March 31, 2017
|
|
INSEEGO CORP.
|
||
|
|
By
|
/s/
S
UE
S
WENSON
|
||
|
|
|
Sue Swenson
|
||
|
|
|
Chief Executive Officer
(Principal Executive Officer)
|
||
POWER OF ATTORNEY
Know all men by these presents, that each person whose signature appears below constitutes and appoints Sue Swenson and Michael Newman, or either of them, as his or her true and lawful attorneys-in-fact and agents, with full power of substitution, for him or her and in his or her name, place and stead, in any and all capacities, to sign any and all amendments to this Annual Report on Form 10-K, and to file the same, with all exhibits thereto, and other documents in connection therewith, with the Securities and Exchange Commission, granting unto said attorneys-in-fact and agents, full power and authority to do and perform each and every act and thing requisite and necessary to be done in connection therewith as fully to all intents and purposes as he or she might or could do in person, hereby ratifying and confirming all that said attorneys-in-fact and agents, or their substitute or substitutes may lawfully do or cause to be done by virtue hereof.
Pursuant to the requirements of the Securities Exchange Act of 1934, this Annual Report on Form 10-K has been signed below by the following persons on behalf of the Registrant and in the capacities and on the dates indicated.
|
Signature
|
|
Title
|
|
Date
|
|
/s/
S
UE
S
WENSON
|
|
Chief Executive Officer
(Principal Executive Officer and Director)
|
|
March 31, 2017
|
|
Sue Swenson
|
||||
|
/s/
M
ICHAEL
N
EWMAN
|
|
Chief Financial Officer
(Principal Financial and Accounting Officer)
|
|
March 31, 2017
|
|
Michael Newman
|
||||
|
/s/
P
HILIP
F
ALCONE
|
|
Director
|
|
March 31, 2017
|
|
Philip Falcone
|
||||
|
/s/
J
AMES
L
EDWITH
|
|
Director
|
|
March 31, 2017
|
|
James Ledwith
|
||||
|
/s/
R
OBERT
P
ONS
|
|
Director
|
|
March 31, 2017
|
|
Robert Pons
|
||||
|
/s/
D
AVID
W
ERNER
|
|
Director
|
|
March 31, 2017
|
|
David Werner
|
||||
58
INDEX TO CONSOLIDATED FINANCIAL STATEMENTS
|
Consolidated Statements of Operations
|
|
F-1
Report of Independent Registered Public Accounting Firm
To the Board of Directors and Stockholders
Inseego Corp.
We have audited the accompanying consolidated balance sheet of Inseego Corp. as of December 31, 2016, and the related consolidated statements of operations, comprehensive loss, stockholders’ equity (deficit), and cash flows for the year then ended. Our audit also included the financial statement schedule listed in the index at Item 15(a). These financial statements and schedule are the responsibility of the Company's management. Our responsibility is to express an opinion on these financial statements and schedule based on our audit.
We conducted our audit in accordance with the standards of the Public Company Accounting Oversight Board (United States). Those standards require that we plan and perform the audit to obtain reasonable assurance about whether the financial statements are free of material misstatement. An audit includes examining, on a test basis, evidence supporting the amounts and disclosures in the financial statements. An audit also includes assessing the accounting principles used and significant estimates made by management, as well as evaluating the overall financial statement presentation. We believe that our audit provides a reasonable basis for our opinion.
In our opinion, the financial statements referred to above present fairly, in all material respects, the consolidated financial position of Inseego Corp. at December 31, 2016, and the consolidated results of its operations and its cash flows for the year then ended, in conformity with U.S. generally accepted accounting principles. Also, in our opinion, the related financial statement schedule, when considered in relation to the basic financial statements taken as a whole, presents fairly in all material respects the information set forth therein.
We also have audited, in accordance with the standards of the Public Company Accounting Oversight Board (United States), Inseego Corp.’s internal control over financial reporting as of December 31, 2016, based on criteria established in Internal Control - Integrated Framework issued by the Committee of Sponsoring Organizations of the Treadway Commission (2013 framework), and our report dated March 31, 2017, expressed an adverse opinion on the effectiveness of Inseego Corp.’s internal control over financial reporting.
/s/ MAYER HOFFMAN MCCANN P.C.
San Diego, California
March 31, 2017
F-2
Report of Independent Registered Public Accounting Firm
The Board of Directors and Stockholders
Novatel Wireless, Inc. (predecessor issuer to Inseego Corp.)
We have audited the accompanying consolidated balance sheet of Novatel Wireless, Inc. as of December 31, 2015, and the related consolidated statements of operations, comprehensive loss, stockholders’ equity and cash flows for each of the two years in the period ended December 31, 2015. These financial statements are the responsibility of the Company's management. Our responsibility is to express an opinion on these financial statements based on our audits.
We conducted our audits in accordance with the standards of the Public Company Accounting Oversight Board (United States). Those standards require that we plan and perform the audit to obtain reasonable assurance about whether the financial statements are free of material misstatement. An audit includes examining, on a test basis, evidence supporting the amounts and disclosures in the financial statements. An audit also includes assessing the accounting principles used and significant estimates made by management, as well as evaluating the overall financial statement presentation. We believe that our audits provide a reasonable basis for our opinion.
In our opinion, the financial statements referred to above present fairly, in all material respects, the consolidated financial position of Novatel Wireless, Inc. at December 31, 2015, and the consolidated results of its operations and its cash flows for each of the two years in the period ended December 31, 2015, in conformity with U.S. generally accepted accounting principles.
/s/ ERNST & YOUNG LLP
San Diego, California
March 14, 2016
F-3
INSEEGO CORP.
(in thousands, except share and per share data)
|
|
December 31,
|
||||||
|
|
2016
|
2015
|
|||||
|
ASSETS
|
|||||||
|
Current assets:
|
|||||||
|
Cash and cash equivalents
|
$
|
9,894
|
|
$
|
12,570
|
|
|
|
Accounts receivable, net of allowance for doubtful accounts of $1,660 and $601, respectively
|
22,203
|
|
35,263
|
|
|||
|
Short-term investments
|
—
|
|
1,267
|
|
|||
|
Inventories, net
|
31,142
|
|
55,837
|
|
|||
|
Prepaid expenses and other
|
5,208
|
|
6,039
|
|
|||
|
Total current assets
|
68,447
|
|
110,976
|
|
|||
|
Property, plant and equipment, net
|
8,392
|
|
8,812
|
|
|||
|
Rental assets, net
|
7,003
|
|
6,155
|
|
|||
|
Intangible assets, net
|
40,283
|
|
43,089
|
|
|||
|
Goodwill
|
34,428
|
|
29,520
|
|
|||
|
Other assets
|
163
|
|
201
|
|
|||
|
Total assets
|
$
|
158,716
|
|
$
|
198,753
|
|
|
|
LIABILITIES AND STOCKHOLDERS’ EQUITY (DEFICIT)
|
|||||||
|
Current liabilities:
|
|||||||
|
Accounts payable
|
$
|
31,242
|
|
$
|
35,286
|
|
|
|
Accrued expenses and other current liabilities
|
27,897
|
|
25,613
|
|
|||
|
DigiCore bank facilities
|
3,238
|
|
3,313
|
|
|||
|
Total current liabilities
|
62,377
|
|
64,212
|
|
|||
|
Long-term liabilities:
|
|||||||
|
Convertible senior notes, net
|
90,908
|
|
82,461
|
|
|||
|
Revolving credit facility
|
—
|
|
—
|
|
|||
|
Deferred tax liabilities, net
|
4,439
|
|
3,475
|
|
|||
|
Other long-term liabilities
|
18,719
|
|
18,142
|
|
|||
|
Total liabilities
|
176,443
|
|
168,290
|
|
|||
|
Commitments and Contingencies
|
|
|
|||||
|
Stockholders’ equity (deficit):
|
|||||||
|
Preferred stock, par value $0.001; 2,000,000 shares authorized and none outstanding
|
—
|
|
—
|
|
|||
|
Common stock, par value $0.001; 150,000,000 shares authorized, 54,372,080 and 53,165,024 shares issued and outstanding, respectively
|
54
|
|
53
|
|
|||
|
Additional paid-in capital
|
507,616
|
|
502,337
|
|
|||
|
Accumulated other comprehensive loss
|
(1,409
|
)
|
(8,507
|
)
|
|||
|
Accumulated deficit
|
(524,024
|
)
|
(463,451
|
)
|
|||
|
Total stockholders’ equity (deficit) attributable to Inseego Corp.
|
(17,763
|
)
|
30,432
|
|
|||
|
Noncontrolling interests
|
36
|
|
31
|
|
|||
|
Total stockholders’ equity (deficit)
|
(17,727
|
)
|
30,463
|
|
|||
|
Total liabilities and stockholders’ equity (deficit)
|
$
|
158,716
|
|
$
|
198,753
|
|
|
See accompanying notes to consolidated financial statements.
F-4
INSEEGO CORP.
(in thousands, except share and per share data)
|
|
Year Ended December 31,
|
||||||||||
|
|
2016
|
2015
|
2014
|
||||||||
|
Net revenues:
|
|||||||||||
|
Hardware
|
$
|
187,375
|
|
$
|
203,281
|
|
$
|
183,976
|
|
||
|
SaaS, software and services
|
56,180
|
|
17,661
|
|
1,269
|
|
|||||
|
Total net revenues
|
243,555
|
|
220,942
|
|
185,245
|
|
|||||
|
Cost of net revenues:
|
|||||||||||
|
Hardware
|
136,936
|
|
153,815
|
|
148,141
|
|
|||||
|
SaaS, software and services
|
18,751
|
|
8,174
|
|
57
|
|
|||||
|
Impairment of abandoned product line
|
11,540
|
|
—
|
|
—
|
|
|||||
|
Total cost of net revenues
|
167,227
|
|
161,989
|
|
148,198
|
|
|||||
|
Gross profit
|
76,328
|
|
58,953
|
|
37,047
|
|
|||||
|
Operating costs and expenses:
|
|||||||||||
|
Research and development
|
30,655
|
|
35,446
|
|
34,314
|
|
|||||
|
Sales and marketing
|
29,782
|
|
20,899
|
|
13,792
|
|
|||||
|
General and administrative
|
52,387
|
|
34,452
|
|
15,402
|
|
|||||
|
Amortization of purchased intangible assets
|
3,927
|
|
2,126
|
|
562
|
|
|||||
|
Impairment of purchased intangible assets
|
2,594
|
|
—
|
|
—
|
|
|||||
|
Shareholder litigation loss
|
—
|
|
—
|
|
790
|
|
|||||
|
Restructuring charges, net of recoveries
|
1,987
|
|
3,821
|
|
7,760
|
|
|||||
|
Total operating costs and expenses
|
121,332
|
|
96,744
|
|
72,620
|
|
|||||
|
Operating loss
|
(45,004
|
)
|
(37,791
|
)
|
(35,573
|
)
|
|||||
|
Other income (expense):
|
|||||||||||
|
Change in fair value of warrant liability
|
—
|
|
—
|
|
(3,280
|
)
|
|||||
|
Non-cash change in acquisition-related escrow
|
—
|
|
(8,286
|
)
|
—
|
|
|||||
|
Interest expense, net
|
(15,597
|
)
|
(7,164
|
)
|
(85
|
)
|
|||||
|
Other income (expense), net
|
414
|
|
1,128
|
|
(167
|
)
|
|||||
|
Loss before income taxes
|
(60,187
|
)
|
(52,113
|
)
|
(39,105
|
)
|
|||||
|
Income tax provision
|
381
|
|
181
|
|
124
|
|
|||||
|
Net loss
|
(60,568
|
)
|
(52,294
|
)
|
(39,229
|
)
|
|||||
|
Less: Net loss (income) attributable to noncontrolling interests
|
(5
|
)
|
8
|
|
—
|
|
|||||
|
Net loss attributable to Inseego Corp.
|
(60,573
|
)
|
(52,286
|
)
|
(39,229
|
)
|
|||||
|
Recognition of beneficial conversion feature
|
—
|
|
—
|
|
(445
|
)
|
|||||
|
Net loss attributable to common shareholders
|
$
|
(60,573
|
)
|
$
|
(52,286
|
)
|
$
|
(39,674
|
)
|
||
|
Per share data:
|
|||||||||||
|
Net loss per share attributable to common shareholders:
|
|||||||||||
|
Basic and diluted
|
$
|
(1.12
|
)
|
$
|
(0.99
|
)
|
$
|
(1.05
|
)
|
||
|
Weighted-average common shares outstanding:
|
|||||||||||
|
Basic and diluted
|
53,911,270
|
|
52,767,230
|
|
37,958,846
|
|
|||||
See accompanying notes to consolidated financial statements.
F-5
INSEEGO CORP.
CONSOLIDATED STATEMENTS OF COMPREHENSIVE LOSS
(in thousands)
|
|
Year Ended December 31,
|
||||||||||
|
|
2016
|
2015
|
2014
|
||||||||
|
Net loss
|
$
|
(60,568
|
)
|
$
|
(52,294
|
)
|
$
|
(39,229
|
)
|
||
|
Other comprehensive gain (loss):
|
|||||||||||
|
Foreign currency translation adjustment
|
7,098
|
|
(8,507
|
)
|
—
|
|
|||||
|
Unrealized loss on marketable securities, net of tax
|
—
|
|
—
|
|
(5
|
)
|
|||||
|
Total comprehensive loss
|
$
|
(53,470
|
)
|
$
|
(60,801
|
)
|
$
|
(39,234
|
)
|
||
See accompanying notes to consolidated financial statements.
F-6
INSEEGO CORP.
CONSOLIDATED STATEMENTS OF STOCKHOLDERS’ EQUITY (DEFICIT)
(in thousands)
|
Common Stock
|
Additional
Paid-in Capital
|
Treasury Stock
|
Accumulated Deficit
|
Accumulated
Other
Comprehensive Income (Loss)
|
Noncontrolling Interests
|
Total
Stockholders’ Equity (Deficit)
|
||||||||||||||||||||||||
|
|
Shares
|
Amount
|
||||||||||||||||||||||||||||
|
Balance, December 31, 2013
|
34,097
|
|
$
|
34
|
|
$
|
441,368
|
|
$
|
(25,000
|
)
|
$
|
(371,491
|
)
|
$
|
5
|
|
$
|
—
|
|
$
|
44,916
|
|
|||||||
|
Net loss
|
—
|
|
—
|
|
—
|
|
—
|
|
(39,229
|
)
|
—
|
|
—
|
|
(39,229
|
)
|
||||||||||||||
|
Unrealized loss on marketable securities, net of tax
|
—
|
|
—
|
|
—
|
|
—
|
|
—
|
|
(5
|
)
|
—
|
|
(5
|
)
|
||||||||||||||
|
Exercise of stock options, vesting of restricted stock units and stock issued under employee stock purchase plan
|
689
|
|
2
|
|
246
|
|
—
|
|
—
|
|
—
|
|
—
|
|
248
|
|
||||||||||||||
|
Taxes withheld on net settled vesting of restricted stock units
|
—
|
|
—
|
|
(1,067
|
)
|
—
|
|
—
|
|
—
|
|
—
|
|
(1,067
|
)
|
||||||||||||||
|
Issuance of common stock in connection with litigation settlement
|
2,407
|
|
2
|
|
4,998
|
|
—
|
|
—
|
|
—
|
|
—
|
|
5,000
|
|
||||||||||||||
|
Issuance of common stock in connection with financing transaction, net of issuance costs
|
7,363
|
|
7
|
|
7,929
|
|
—
|
|
—
|
|
—
|
|
—
|
|
7,936
|
|
||||||||||||||
|
Issuance of common stock in connection with the conversion of Series C preferred stock
|
872
|
|
1
|
|
939
|
|
—
|
|
—
|
|
—
|
|
—
|
|
940
|
|
||||||||||||||
|
Beneficial conversion feature of convertible Series C preferred stock
|
—
|
|
—
|
|
445
|
|
—
|
|
(445
|
)
|
—
|
|
—
|
|
—
|
|
||||||||||||||
|
Reclassification of warrant liability
|
—
|
|
—
|
|
8,219
|
|
—
|
|
—
|
|
—
|
|
—
|
|
8,219
|
|
||||||||||||||
|
Share-based compensation
|
314
|
|
—
|
|
3,588
|
|
—
|
|
—
|
|
—
|
|
—
|
|
3,588
|
|
||||||||||||||
|
Balance, December 31, 2014
|
45,742
|
|
46
|
|
466,665
|
|
(25,000
|
)
|
(411,165
|
)
|
—
|
|
—
|
|
30,546
|
|
||||||||||||||
|
Net loss
|
—
|
|
—
|
|
—
|
|
—
|
|
(52,286
|
)
|
—
|
|
(8
|
)
|
(52,294
|
)
|
||||||||||||||
|
Foreign currency translation adjustment
|
—
|
|
—
|
|
—
|
|
—
|
|
—
|
|
(8,507
|
)
|
—
|
|
(8,507
|
)
|
||||||||||||||
|
Noncontrolling interest acquired in Ctrack acquisition
|
—
|
|
—
|
|
—
|
|
—
|
|
—
|
|
—
|
|
39
|
|
39
|
|
||||||||||||||
|
Exercise of stock options, vesting of restricted stock units and stock issued under employee stock purchase plan
|
1,257
|
|
1
|
|
1,763
|
|
—
|
|
—
|
|
—
|
|
—
|
|
1,764
|
|
||||||||||||||
|
Taxes withheld on net settled vesting of restricted stock units
|
—
|
|
—
|
|
(757
|
)
|
—
|
|
—
|
|
—
|
|
—
|
|
(757
|
)
|
||||||||||||||
|
Exercise of a portion of 2014 Warrant
|
3,825
|
|
4
|
|
8,640
|
|
8,644
|
|
||||||||||||||||||||||
|
Net shares issued for retention bonus
|
2,158
|
|
2
|
|
5,748
|
|
5,750
|
|
||||||||||||||||||||||
|
Share-based compensation
|
183
|
|
—
|
|
6,350
|
|
—
|
|
—
|
|
—
|
|
—
|
|
6,350
|
|
||||||||||||||
|
Discount on convertible senior notes
|
—
|
|
—
|
|
38,305
|
|
—
|
|
—
|
|
—
|
|
—
|
|
38,305
|
|
||||||||||||||
|
Fair value of DigiCore replacement options granted
|
—
|
|
—
|
|
623
|
|
—
|
|
—
|
|
—
|
|
—
|
|
623
|
|
||||||||||||||
|
Retirement of treasury stock
|
—
|
|
—
|
|
(25,000
|
)
|
25,000
|
|
—
|
|
—
|
|
—
|
|
—
|
|
||||||||||||||
|
Balance, December 31, 2015
|
53,165
|
|
53
|
|
502,337
|
|
—
|
|
(463,451
|
)
|
(8,507
|
)
|
31
|
|
30,463
|
|
||||||||||||||
|
Net loss
|
—
|
|
—
|
|
—
|
|
—
|
|
(60,573
|
)
|
—
|
|
5
|
|
(60,568
|
)
|
||||||||||||||
|
Foreign currency translation adjustment
|
—
|
|
—
|
|
—
|
|
—
|
|
—
|
|
7,098
|
|
—
|
|
7,098
|
|
||||||||||||||
|
Exercise of stock options, vesting of restricted stock units and stock issued under employee stock purchase plan
|
1,207
|
|
1
|
|
942
|
|
—
|
|
—
|
|
—
|
|
—
|
|
943
|
|
||||||||||||||
|
Taxes withheld on net settled vesting of restricted stock units
|
—
|
|
—
|
|
(251
|
)
|
—
|
|
—
|
|
—
|
|
—
|
|
(251
|
)
|
||||||||||||||
|
Share-based compensation
|
—
|
|
—
|
|
4,588
|
|
—
|
|
—
|
|
—
|
|
—
|
|
4,588
|
|
||||||||||||||
|
Balance, December 31, 2016
|
54,372
|
|
$
|
54
|
|
$
|
507,616
|
|
$
|
—
|
|
$
|
(524,024
|
)
|
$
|
(1,409
|
)
|
$
|
36
|
|
$
|
(17,727
|
)
|
|||||||
See accompanying notes to consolidated financial statements.
F-7
INSEEGO CORP.
(in thousands)
|
|
Year Ended December 31,
|
||||||||||
|
|
2016
|
2015
|
2014
|
||||||||
|
Cash flows from operating activities:
|
|||||||||||
|
Net loss
|
$
|
(60,568
|
)
|
$
|
(52,294
|
)
|
$
|
(39,229
|
)
|
||
|
Adjustments to reconcile net loss to net cash used in operating activities:
|
|||||||||||
|
Depreciation and amortization
|
14,053
|
|
8,323
|
|
7,408
|
|
|||||
|
Amortization of acquisition-related inventory step-up
|
1,829
|
|
4,097
|
|
—
|
|
|||||
|
Loss on impairment of purchased intangible assets
|
2,594
|
|
—
|
|
—
|
|
|||||
|
Provision for bad debts, net of recoveries
|
1,136
|
|
422
|
|
86
|
|
|||||
|
Loss on impairment of abandoned product line
|
11,540
|
|
—
|
|
—
|
|
|||||
|
Provision for excess and obsolete inventory
|
3,257
|
|
1,043
|
|
3,382
|
|
|||||
|
Share-based compensation expense
|
4,588
|
|
6,350
|
|
3,588
|
|
|||||
|
Amortization of debt discount and debt issuance costs
|
8,447
|
|
4,692
|
|
—
|
|
|||||
|
Gain on divestiture and sale of other assets, net of loss on disposal of assets
|
(4,742
|
)
|
(50
|
)
|
—
|
|
|||||
|
Change in fair value of warrant liability
|
—
|
|
—
|
|
3,280
|
|
|||||
|
Non-cash change in acquisition-related escrow
|
—
|
|
8,286
|
|
—
|
|
|||||
|
Deferred income taxes
|
196
|
|
106
|
|
87
|
|
|||||
|
Non-cash equity earn-out compensation expense
|
7,913
|
|
—
|
|
—
|
|
|||||
|
Reversal of market development fund accrual
|
(2,109
|
)
|
—
|
|
—
|
|
|||||
|
Unrealized foreign currency transaction loss (gain), net
|
3,513
|
|
(1,298
|
)
|
—
|
|
|||||
|
Other
|
270
|
|
225
|
|
—
|
|
|||||
|
Changes in assets and liabilities, net of effects from acquisitions and divestiture:
|
|||||||||||
|
Accounts receivable
|
11,616
|
|
4,760
|
|
15,688
|
|
|||||
|
Inventories
|
(3,159
|
)
|
(3,960
|
)
|
(13,392
|
)
|
|||||
|
Prepaid expenses and other assets
|
869
|
|
2,683
|
|
(2,403
|
)
|
|||||
|
Accounts payable
|
(7,825
|
)
|
(11,187
|
)
|
10,036
|
|
|||||
|
Accrued expenses, income taxes, and other
|
3
|
|
866
|
|
(4,798
|
)
|
|||||
|
Net cash used in operating activities
|
(6,579
|
)
|
(26,936
|
)
|
(16,267
|
)
|
|||||
|
Cash flows from investing activities:
|
|||||||||||
|
Acquisition-related escrow
|
—
|
|
(8,275
|
)
|
—
|
|
|||||
|
Acquisitions, net of cash acquired
|
(3,750
|
)
|
(85,991
|
)
|
—
|
|
|||||
|
Purchases of property, plant and equipment
|
(1,439
|
)
|
(1,975
|
)
|
(1,753
|
)
|
|||||
|
Proceeds from the sale of property, plant and equipment
|
629
|
|
46
|
|
—
|
|
|||||
|
Proceeds from the sale of divested assets
|
11,300
|
|
—
|
|
—
|
|
|||||
|
Purchases of intangible assets and additions to capitalized software development costs
|
(2,915
|
)
|
(1,157
|
)
|
(431
|
)
|
|||||
|
Proceeds from the sale of short-term investments
|
1,210
|
|
265
|
|
—
|
|
|||||
|
Purchases of marketable securities
|
—
|
|
—
|
|
(1,359
|
)
|
|||||
|
Marketable securities maturities / sales
|
—
|
|
—
|
|
23,975
|
|
|||||
|
Net cash provided by (used in) investing activities
|
5,035
|
|
(97,087
|
)
|
20,432
|
|
|||||
|
Cash flows from financing activities:
|
|||||||||||
|
Gross proceeds from the issuance of convertible senior notes
|
—
|
|
120,000
|
|
—
|
|
|||||
|
Payment of issuance costs related to convertible senior notes
|
—
|
|
(3,927
|
)
|
—
|
|
|||||
|
Proceeds from the exercise of warrant to purchase common stock
|
—
|
|
8,644
|
|
—
|
|
|||||
|
Net borrowings from (repayments of) DigiCore bank facilities
|
(840
|
)
|
1,581
|
|
—
|
|
|||||
|
Net borrowings from (repayments of) revolving credit facility
|
—
|
|
(5,158
|
)
|
5,158
|
|
|||||
|
Payoff of acquisition-related assumed liabilities
|
—
|
|
(2,633
|
)
|
—
|
|
|||||
|
Principal payments under capital lease obligations
|
(903
|
)
|
(288
|
)
|
—
|
|
|||||
|
Principal payments on mortgage bond
|
(240
|
)
|
(59
|
)
|
—
|
|
|||||
|
Proceeds from the issuance of Series C preferred stock and common stock, net of issuance costs
|
—
|
|
—
|
|
14,163
|
|
|||||
|
Principal repayments of short-term debt
|
—
|
|
—
|
|
(2,566
|
)
|
|||||
|
Repayment of litigation settlement note payable, including interest
|
—
|
|
—
|
|
(5,026
|
)
|
|||||
|
Proceeds from stock option exercises and employee stock purchase plan, net of taxes paid on vested restricted stock units
|
692
|
|
1,007
|
|
(821
|
)
|
|||||
|
Net cash provided by (used in) financing activities
|
(1,291
|
)
|
119,167
|
|
10,908
|
|
|||||
|
Effect of exchange rates on cash and cash equivalents
|
159
|
|
(427
|
)
|
(131
|
)
|
|||||
|
Net decrease in cash and cash equivalents
|
(2,676
|
)
|
(5,283
|
)
|
14,942
|
|
|||||
|
Cash and cash equivalents, beginning of period
|
12,570
|
|
17,853
|
|
2,911
|
|
|||||
|
Cash and cash equivalents, end of period
|
$
|
9,894
|
|
$
|
12,570
|
|
$
|
17,853
|
|
||
|
Supplemental disclosures of cash flow information:
|
|||||||||||
|
Cash paid during the year for:
|
|||||||||||
|
Interest
|
$
|
7,137
|
|
$
|
3,640
|
|
$
|
119
|
|
||
|
Income taxes
|
$
|
115
|
|
$
|
139
|
|
$
|
108
|
|
||
|
Supplemental disclosures of non-cash activities:
|
|||||||||||
|
Transfer of inventories to rental assets
|
$
|
5,568
|
|
$
|
1,032
|
|
$
|
—
|
|
||
|
Issuance of common stock for litigation settlement
|
$
|
—
|
|
$
|
—
|
|
$
|
5,000
|
|
||
|
Initial fair value of warrant liability recorded upon issuance of Series C preferred and common stock
|
$
|
—
|
|
$
|
—
|
|
$
|
4,939
|
|
||
|
Issuance of common stock for conversion of Series C preferred stock
|
$
|
—
|
|
$
|
—
|
|
$
|
940
|
|
||
See accompanying notes to consolidated financial statements.
F-8
INSEEGO CORP.
NOTES TO CONSOLIDATED FINANCIAL STATEMENTS
1
. Nature of Business and Significant Accounting Policies
Inseego Corp. (the “Company” or “Inseego”) is a leading global provider of software-as-a-service (“SaaS”) and solutions for the Internet of Things (“IoT”). The Company sells telematics solutions globally under the Ctrack™ brand, including its fleet management, asset tracking and monitoring, stolen vehicle recovery and usage-based insurance platforms. The Company also sells connectivity solutions and device management services.
Inseego is a Delaware corporation formed in 2016 and is the successor to Novatel Wireless, Inc., a Delaware corporation formed in 1996 (“Novatel Wireless”), as a result of an internal reorganization that was completed in November 2016 (the “Reorganization”) to separate the Company’s MiFi branded hotspots and USB modem product lines (the “MiFi Business”) from the assets and liabilities associated with its Ctrack fleet and vehicle telematics solutions and its business connectivity and device management solutions (see Note
2
). Upon completion of the Reorganization, Novatel Wireless became a wholly-owned subsidiary of Inseego and Novatel Wireless’s former stockholders became stockholders of Inseego, with shares of Inseego common stock trading on The NASDAQ Global Select Market under the trading symbol “INSG.”
Basis of Presentation
The Company has recently incurred operating losses and had a net loss attributable to common shareholders of
$60.6 million
during the year ended
December 31, 2016
. As of
December 31, 2016
, the Company had available cash and cash equivalents totaling
$9.9 million
, and working capital of
$6.1 million
. The Company’s ability to transition towards attaining profitable operations is dependent upon achieving a level of revenues adequate to support its cost structure. If events or circumstances occur such that the Company does not meet its operating plan as expected, the Company may be required to reduce planned research and development activities, incur additional restructuring charges or reduce other operating expenses which could have an adverse impact on its ability to achieve its intended business objectives. These additional reductions in expenditures, if required, could have an adverse impact on the Company’s ability to achieve certain of its business objectives. The Company’s management believes that its cash and cash equivalents and availability under its revolving credit facility, together with anticipated cash flows from operations and
proceeds from the completion of the pending sale of the MiFi Business
, will be sufficient to meet its working capital needs for the next twelve months
following the filing date of this report
.
The Company’s historical operating results, primarily those related to the MiFi Business, indicate that substantial doubt exists related to the Company’s ability to continue as a going concern. The Company’s management believes that the closing of the sale of the MiFi Business is probable of occurring and mitigating the substantial doubt raised by the Company’s historical operating results and will satisfy its liquidity needs for the twelve months
following the filing date of this report
. In the unlikely event that the sale of the MiFi Business does not close, the Company would require an alternative source of financing to divest the MiFi Business elsewhere or to otherwise streamline the MiFi Business as may be needed. The Company has had discussions with potential financing sources, and the Company’s management believes that
it is probable that such financing would be available to the Company based on terms that have been presented to the Company by financial sources
.
The Company cannot predict, with certainty, the outcome of the sale of the MiFi Business or any other activities to generate liquidity, including the availability of additional financing. If the Company is not able to generate additional liquidity through the mechanisms described above or through some combination of other actions, while not expected, the Company may not be able to access funds under its Revolver, and may need to secure additional sources of funds, which may or may not be available to the Company. Additionally, a failure to generate additional liquidity could negatively impact the Company’s access to production, inventory or services that are important to the operation of its business.
Principles of Consolidation
The consolidated financial statements include the accounts of the Company and its wholly-owned subsidiaries. All intercompany transactions and balances have been eliminated in consolidation.
Use of Estimates
The preparation of financial statements in conformity with accounting principles generally accepted in the United States requires management to make estimates and assumptions. These estimates and assumptions affect the reported amounts of assets, liabilities, revenues and expenses, and disclosure of contingent liabilities. Actual results could differ materially from these estimates. Significant estimates include
allowance for doubtful accounts receivable, provision for excess and obsolete inventory, valuation of intangible and long-lived assets, valuation of goodwill, valuation of debt obligations, royalty costs, accruals relating to litigation and restructuring, provision for warranty costs, income taxes, share-based compensation expense and the Company’s ability to continue as a going concern.
F-9
INSEEGO CORP.
NOTES TO CONSOLIDATED FINANCIAL STATEMENTS
Segment Information
The Company does not provide separate segment reporting for its various lines of business. The Chief Executive Officer, who is also the Chief Operating Decision Maker, evaluates the business as a single entity and reviews financial information and makes business decisions based on the overall results of the business. As such, the Company's operations constitute a single operating segment and
one
reportable segment.
Cash and Cash Equivalents
Cash and cash equivalents include highly liquid investments with original maturities of three months or less. The Company’s cash and cash equivalents consist of money market funds. Cash and cash equivalents are recorded at market value, which approximates cost. Gains and losses associated with the Company’s foreign currency denominated demand deposits are recorded as a component of other income (expense), net, in the consolidated statements of operations.
Allowance for Doubtful Accounts Receivable
The Company provides an allowance for its accounts receivable for estimated losses that may result from its customers’ inability to pay. The Company determines the amount of the allowance by analyzing known uncollectible accounts, aged receivables, economic conditions, historical losses, and changes in customer payment cycles and its customers’ credit-worthiness. Amounts later determined and specifically identified to be uncollectible are charged or written off against this allowance. To minimize the likelihood of uncollectibility, the Company reviews its customers’ credit-worthiness periodically based on credit scores generated by independent credit reporting services, its experience with its customers and the economic condition of its customers’ industries. Material differences may result in the amount and timing of expense for any period if the Company were to make different judgments or utilize different estimates.
Inventories and Provision for Excess and Obsolete Inventory
Inventories are stated at the lower of cost (first-in, first-out method) or market. Shipping and handling costs are classified as a component of cost of net revenues in the consolidated statements of operations. The Company reviews the components of its inventory and its inventory purchase commitments on a regular basis for excess and obsolete inventory based on estimated future usage and sales. Write-downs in inventory value or losses on inventory purchase commitments depend on various items, including factors related to customer demand, economic and competitive conditions, technological advances or new product introductions by the Company or its customers that vary from its current expectations. Whenever inventory is written down, a new cost basis is established and the inventory is not subsequently written up if market conditions improve.
The Company believes that, when made, the estimates used in calculating the inventory provision are reasonable and properly reflect the risk of excess and obsolete inventory. If customer demand for the Company’s inventory is substantially less than its estimates, inventory write-downs may be required, which could have a material adverse effect on its consolidated financial statements.
Property, Plant and Equipment
Property, plant and equipment are initially stated at cost and depreciated using the straight-line method. Test equipment, computer equipment, purchased software, furniture and fixtures, product tooling and vehicles are depreciated over lives ranging from
eighteen
months to
six
years. Leasehold improvements are depreciated over the shorter of the related remaining lease period or useful life. Buildings are depreciated over
50
years. Land is not depreciated. Amortization of equipment under capital leases is included in depreciation expense.
Expenditures for repairs and maintenance are expensed as incurred. Expenditures for major renewals and betterments that extend the useful lives of existing property, plant and equipment are capitalized and depreciated. Upon retirement or disposition of property, plant and equipment, any resulting gain or loss is recognized in other income (expense), net, in the consolidated statements of operations.
Rental Assets
The cost of rental assets, which represents fleet management and vehicle tracking solutions installed in customers’ vehicles where hardware is provided as part of a fixed term contract with the customer, is capitalized and disclosed separately in the consolidated balance sheets. The Company depreciates rental assets to costs of net revenues on a straight-line basis over the term of the contract, generally
three
to
four
years, commencing on installation of the rental asset.
F-10
INSEEGO CORP.
NOTES TO CONSOLIDATED FINANCIAL STATEMENTS
Software Development Costs
Software development costs are expensed as incurred until technological feasibility has been established, at which time those costs are capitalized as intangible assets until the software is implemented into products sold to customers. Capitalized software development costs are amortized on a straight-line basis over the estimated useful life of the software (see Note
4
). Costs incurred to enhance existing software or after the implementation of the software into a product are expensed in the period they are incurred and included in research and development expense in the consolidated statements of operations.
Internal Use Software
Costs incurred in the preliminary stages of development are expensed as incurred and included in research and development expense in the consolidated statements of operations. Once an application has reached the development stage, internal and external costs, if direct and incremental, are capitalized until the software is substantially complete and ready for its intended use. Capitalization ceases upon completion of all substantial testing performed to ensure the product is ready for its intended use. The Company also capitalizes costs related to specific upgrades and enhancements of internal-use software when it is probable that the expenditures will result in additional functionality. Maintenance and training costs are expensed as incurred. Capitalized internal-use software costs are recorded as part of property, plant and equipment and are amortized on a straight-line basis over the estimated useful life of the software, which is generally
five
years. The Company does not capitalize pilot projects and projects for which it believes that the future economic benefits are less than probable. The Company tests these assets for impairment whenever events or circumstances occur that could impact their recoverability.
Intangible Assets
Intangible assets include purchased finite-lived and indefinite-lived intangible assets resulting from the acquisitions of DigiCore Holdings Limited (“DigiCore” or “Ctrack”), Feeney Wireless, LLC (“FW”) and Enfora, Inc. (“Enfora”), along with the costs of non-exclusive and perpetual worldwide software technology licenses and capitalized software developments costs. Finite-lived intangible assets are amortized on on a straight-line basis over the estimated useful lives of the assets (see Note
4
).
Indefinite-lived assets, including goodwill, in-process research and development and in-process capitalized software development costs, are not amortized; however, they are tested for impairment annually and between annual tests if certain events occur indicating that the carrying amounts may be impaired. If a qualitative assessment is used and the Company determines that the fair value of an indefinite-lived intangible asset is more likely than not (i.e., a likelihood of more than 50%) less than its carrying amount, a quantitative impairment test will be performed. If indefinite-lived intangible assets are quantitatively assessed for impairment, a two-step approach is applied. First, the Company compares the estimated fair value of the indefinite-lived intangible asset to its carrying value. The second step, if necessary, measures the amount of such impairment by comparing the implied fair value of the asset to its carrying value.
No
impairment of indefinite-lived intangible assets was recognized during the years ended December 31,
2016
,
2015
and
2014
.
Long-Lived Assets
The Company periodically evaluates the carrying value of the unamortized balances of its long-lived assets, including property, plant and equipment, rental assets and intangible assets, to determine whether impairment of these assets has occurred or whether a revision to the related amortization periods should be made. When the carrying value of an asset exceeds the associated undiscounted expected future cash flows, it is considered to be impaired and is written down to fair value. Fair value is determined based on an evaluation of the assets associated undiscounted future cash flows or appraised value
.
This evaluation is based on management’s projections of the undiscounted future cash flows associated with each class of asset. If management’s evaluation indicates that the carrying values of these assets are impaired, such impairment is recognized by a reduction of the applicable asset carrying value to its estimated fair value and the impairment is expensed as a part of continuing operations. For the year ended
December 31, 2016
, the Company recorded an impairment loss related to long-lived assets of approximately
$2.7 million
, which is included in impairment of purchased intangibles and other income (expense), net, in the consolidated statements of operations. For the year ended December 31,
2015
, the Company recorded an impairment loss related to long-lived assets of approximately
$27,000
, which is included in cost of net revenues in the consolidated statements of operations.
No
impairment of long-lived assets was recognized during the year ended December 31,
2014
.
F-11
INSEEGO CORP.
NOTES TO CONSOLIDATED FINANCIAL STATEMENTS
Derivative Financial Instruments
The Company evaluates stock options, stock warrants and other contracts to determine if those contracts or embedded components of those contracts qualify as derivative financial instruments to be separately accounted for under the relevant sections of the Financial Accounting Standards Board (“FASB”) Accounting Standards Codification (“ASC”). The result of this accounting treatment could be that the fair value of a financial instrument is classified as a derivative financial instrument and is marked-to-market at each balance sheet date and recorded as an asset or liability. In the event that the fair value is recorded as an asset or liability, the change in fair value is recorded in the statement of operations as other income or other expense. Upon conversion, exercise or expiration of a derivative financial instrument, the instrument is marked to fair value and then that fair value is reclassified to equity.
Acquisitions
When acquiring companies, the Company recognizes separately from goodwill the assets acquired and the liabilities assumed at their acquisition date fair values. Goodwill as of the acquisition date is measured as the excess of consideration transferred and the net of the acquisition date fair values of the assets acquired and the liabilities assumed. While the Company uses its best estimates and assumptions as a part of the purchase price allocation process to accurately value assets acquired and liabilities assumed at the acquisition date, the Company’s estimates are inherently uncertain and subject to refinement. As a result, during the measurement period, which may be up to one year from the acquisition date, the Company records adjustments to the assets acquired and liabilities assumed, with the corresponding offset to goodwill. Upon the conclusion of the measurement period or final determination of the values of assets acquired or liabilities assumed, whichever comes first, any subsequent adjustments are recorded to the consolidated statements of operations.
Accounting for business combinations requires the Company’s management to make significant estimates and assumptions, especially at the acquisition date with respect to intangible assets, support liabilities assumed, and pre-acquisition contingencies. Although the Company believes the assumptions and estimates it has made in the past have been reasonable and appropriate, they are based in part on historical experience, market data and information obtained from the management of the acquired companies and are inherently uncertain.
Examples of critical estimates in valuing certain of the intangible assets the Company has acquired include but are not limited to: (i) future expected cash flows from customer relationships; (ii) estimates to develop or use technology; and (iii) discount rates.
If the Company determines that a pre-acquisition contingency is probable in nature and estimable as of the acquisition date, the Company records its best estimate for such a contingency as a part of the preliminary fair value allocation. The Company continues to gather information for and evaluate pre-acquisition contingencies throughout the measurement period and if the Company makes changes to the amounts recorded or if the Company identifies additional pre-acquisition contingencies during the measurement period, such amounts will be included in the fair value allocation during the measurement period and, subsequently, in the Company’s results of operations.
The Company may be required to pay future consideration to the former shareholders of acquired companies, depending on the terms of the applicable purchase agreements, which may be contingent upon the achievement of certain financial and operating targets, as well as the retention of key employees. If the future consideration is considered to be compensation, amounts will be expensed when incurred.
Divestitures
Gains or losses from divested operations and assets that do not qualify for treatment as discontinued operations under ASC 205-20,
Presentation of Financial Statements—Discontinued Operations
, are recorded as other income (expense), net, in the consolidated statements of operations.
Restructuring
The Company accounts for facility exit costs in accordance with ASC 420,
Exit or Disposal Cost Obligations
, which requires that a liability for such costs be recognized and measured initially at fair value on the cease-use date based on remaining lease rentals, adjusted for the effects of any prepaid or deferred items recognized, reduced by the estimated sublease rentals that could be reasonably obtained even if the Company does not intend to sublease the facilities.
The Company is required to estimate future sublease income and future net operating expenses of the facilities, among other expenses. The most significant of these estimates relate to the timing and extent of future sublease income which reduce
F-12
INSEEGO CORP.
NOTES TO CONSOLIDATED FINANCIAL STATEMENTS
lease obligations, and the probability that such sublease income will be realized. The Company based estimates of sublease income, in part, on information from third party real estate experts, current market conditions and rental rates, an assessment of the time period over which reasonable estimates could be made, and the location of the respective facility, among other factors. Further adjustments to the facility exit liability accrual will be required in future periods if actual exit costs or sublease income differ from current estimates. Exit costs recorded by the Company under these provisions are neither associated with, nor do they benefit, continuing activities.
Convertible Debt
The Company accounts for its convertible debt instruments that are settleable in cash upon conversion (including partial cash settlement) by separating the liability and equity components of the instruments in a manner that reflects the Company’s nonconvertible debt borrowing rate. The Company determines the carrying amount of the liability component by measuring the fair value of similar debt instruments that do not have the conversion feature. If a similar debt instrument does not exist, the Company estimates the fair value by using assumptions that market participants would use in pricing a debt instrument, including market interest rates, credit standing, yield curves and volatilities. Determining the fair value of the debt component requires the use of accounting estimates and assumptions. These estimates and assumptions are judgmental in nature and could have a significant impact on the determination of the debt component and the associated non-cash interest expense.
Upon issuance, the Company assigns a value to the debt component equal to the estimated fair value of similar debt instruments without the conversion feature, which could result in the Company recording the debt instrument at a discount. If the debt instrument is recorded at a discount, the Company amortizes the debt discount over the life of the debt instrument as additional non-cash interest expense utilizing the effective interest method.
Revenue Recognition
During the year ended December 31, 2016, the Company generated a portion of its revenue from the sale of wireless modems to wireless operators, OEM customers and value added resellers and distributors. In addition, the Company generates revenue from the sale of asset-management solutions utilizing wireless technology and M2M communication devices predominantly to transportation and industrial companies, medical device manufacturers and security system providers. Revenue from product sales is generally recognized upon the later of transfer of title or delivery of the product to the customer. Where the transfer of title or risk of loss is contingent on the customer’s acceptance of the product, the Company will not recognize revenue until both title and risk of loss have transferred to the customer. Revenues from SaaS services are recognized pro-rata over the contract term. The Company records deferred revenue for cash payments received from customers in advance of when revenue recognition criteria are met. The Company has granted price protection to certain customers in accordance with the provisions of the respective contracts and tracks pricing and other terms offered to customers buying similar products to assess compliance with these provisions. The Company estimates the amount of price protection for current period product sales utilizing historical experience and information regarding customer inventory levels. To date, the Company has not incurred material price protection obligations. Revenues from sales to certain customers are subject to cooperative advertising allowances. Cooperative advertising allowances are recorded as an operating expense to the extent that the advertising benefit is separable from the revenue transaction and the fair value of that advertising benefit is determinable. To the extent that such allowances either do not provide a separable benefit to the Company, or the fair value of the advertising benefit cannot be reliably estimated, such amounts are recorded as a reduction of revenue. The Company establishes a reserve for estimated product returns allowances in the period in which revenue is recognized. In estimating future product returns, the Company considers various factors, including its stated return policies and practices and historical trends.
Certain of the Company’s revenues represent the sale of hardware with accompanied software that is essential to the functionality of the hardware. In such instances, the Company records revenue associated with the agreed upon price on hardware sales, and accrues any estimated costs of post-delivery performance obligations such as warranty obligations. The Company considers the four basic revenue recognition criteria when assessing appropriate revenue recognition as follows:
Criterion #1 — Persuasive evidence of an arrangement must exist;
Criterion #2 — Delivery has occurred;
Criterion #3 — The seller’s price to the buyer must be fixed or determinable; and
Criterion #4 — Collectability is reasonably assured.
For multiple element arrangements, total consideration received from customers is allocated to the elements. This may include hardware, leased elements, non-essential software elements and/or essential software, based on a relative selling price. The accounting guidance establishes a hierarchy to determine the selling price to be used for allocating revenue to deliverables
F-13
INSEEGO CORP.
NOTES TO CONSOLIDATED FINANCIAL STATEMENTS
as follows: (i) vendors specific objective evidence (“VSOE”), (ii) third party evidence (“TPE”), and (iii) best estimate of selling price (“BESP”). Because the Company has neither VSOE nor TPE, revenue has been based on the Company’s BESP. Amounts allocated to the delivered hardware and the related essential software are recognized at the time of the sale provided all other revenue recognition criteria have been met. Amounts allocated to other deliverables based upon BESP are recognized in the period the revenue recognition criteria have been met.
The Company’s process for determining its BESP for deliverables without VSOE or TPE considers multiple factors that may vary depending upon the unique facts and circumstances related to each deliverable. The Company’s prices are determined based upon cost to produce the products, expected order quantities, acceptance in the marketplace and internal pricing parameters. In addition, when developing BESPs for products the Company may consider other factors as appropriate including the pricing of competitive alternatives if they exist, and product-specific business objectives.
The Company accounts for nonessential software licenses and related post contract support (“PCS”) under multiple element arrangements by recognizing revenue for such arrangements ratably over the term of the PCS as it has not established VSOE for the PCS element.
The Company provides SaaS subscriptions for its fleet management and vehicle finance applications in which customers are provided with the ability to wirelessly communicate with monitoring devices installed in vehicles and other mobile assets via software applications hosted by the Company. The customer has the option to purchase the monitoring device or lease it over the term of the contract. If the customer purchases the monitoring device, the Company recognizes the revenue at the time of purchase. If the customer chooses to lease the monitoring device, the Company recognizes the revenue for the monitoring device over the term of the contract, which is generally three years. The Company records such revenue in accordance with ASC 840,
Leases
, as it has determined that they qualify as operating leases. The Company recognizes revenues from SaaS services over the term of the contract.
Certain of the Company’s revenue is based on contractual arrangements. In such instances, management considers the nature of the Company's contractual arrangements in determining whether to recognize certain types of revenue on the basis of the gross amount billed or net amount retained after payments are made to providers of certain services related to the product or service offering. The main factors the Company uses to determine whether to record revenue on a gross or net basis are whether:
|
•
|
the Company is primarily responsible for the service to the customer;
|
|
•
|
the Company has discretion in establishing fees paid by the customer; and
|
|
•
|
the Company is involved in the determination of product or service specifications.
|
When the customer’s fee includes a portion of charges that are paid to another party and the Company is primarily responsible for providing the service to the customer, revenue is recognized on a gross basis in an amount equal to the fee paid by the customer. The cost of revenues recognized is the amount due to the other party and is recorded as cost of revenues in the consolidated statements of operations. In instances in which another party is primarily responsible for providing the service to the customer, revenue is recognized in the net amount retained by the Company. The portion of the fees that are collected from the customer by the Company and remitted to the other party are considered pass through amounts and accordingly are not a component of net revenues or cost of net revenues.
The Company occasionally enters into transactions where it provides consideration to its customers in the form of credits for certain raw materials received that are used in the finished goods purchased by the same customer. The Company accounts for such credits to customers as a reduction of net revenues because it is unable to demonstrate the receipt of a benefit that is identifiable and sufficiently separable from the revenue transaction and reasonably estimate the fair value of the benefit identified. Significant management judgment and estimates must be used to determine the fair value of the benefit received in any period.
Provision for Warranty Costs
The Company accrues warranty costs based on estimates of future warranty related replacement, repairs or rework of products. The Company’s warranty policy generally provides
one
to
three
years of coverage for products following the date of purchase. The Company’s policy is to accrue the estimated cost of warranty coverage as a component of cost of revenue in the accompanying consolidated statements of operations at the time revenue is recognized. In estimating its future warranty obligations, the Company considers various factors, including the historical frequency and volume of claims and cost to replace or repair products under warranty. The warranty provision for the Company’s products is determined by using a financial model to estimate future warranty costs. The Company’s financial model takes into consideration actual product failure rates;
F-14
INSEEGO CORP.
NOTES TO CONSOLIDATED FINANCIAL STATEMENTS
estimated replacement, repair or rework expenses; and potential risks associated with its different products. The risk levels, warranty cost information and failure rates used within this model are reviewed throughout the year and updated, if and when, these inputs change.
Foreign Currency Transactions
Foreign currency transactions are transactions denominated in a currency other than a subsidiary’s functional currency. A change in the exchange rates between a subsidiary’s functional currency and the currency in which a transaction is denominated increases or decreases the expected amount of functional currency cash flows upon settlement of the transaction. That increase or decrease in expected functional currency cash flows is reported by the Company as a foreign currency transaction gain (loss). The primary component of the Company’s foreign currency transaction gain (loss) is due to agreements in place with certain subsidiaries in foreign countries regarding intercompany transactions. Based upon historical experience, the Company anticipates repayment of these transactions in the foreseeable future, and recognizes the realized and unrealized gains (losses) on these transactions that result from foreign currency changes in the period in which they occur as foreign currency transaction gain (loss), which is recorded as other income (expense), net, in the consolidated statements of operations.
Foreign Currency Translation
Assets and liabilities of the Company’s international subsidiaries in which the local currency is the functional currency are translated into U.S. Dollars at period-end exchange rates. Income and expenses are translated into U.S. Dollars at the average exchange rates during the period. The resulting translation adjustments are included in the Company’s consolidated balance sheets as a component of accumulated other comprehensive loss.
Income Taxes
The Company recognizes federal, state and foreign current tax liabilities or assets based on its estimate of taxes payable to or refundable by tax authorities in the current fiscal year. The Company also recognizes federal, state and foreign deferred tax liabilities or assets based on the Company’s estimate of future tax effects attributable to temporary differences and carryforwards. Deferred tax assets and liabilities are measured using enacted tax rates expected to apply to taxable income in the years in which those temporary differences are expected to be recovered or settled.
Deferred tax assets are reduced by valuation allowances if, based on the consideration of all available evidence, it is more likely than not that some portion of the deferred tax asset will not be realized. The Company evaluates deferred income taxes on a quarterly basis to determine if valuation allowances are required by considering available evidence. If the Company is unable to generate sufficient future taxable income in certain tax jurisdictions, or if there is a material change in the actual effective tax rates or time period within which the underlying temporary differences become taxable or deductible, the Company could be required to increase its valuation allowance against its deferred tax assets which could result in an increase in the Company’s effective tax rate and an adverse impact on operating results. The Company will continue to evaluate the necessity of the valuation allowance based on the remaining deferred tax assets.
The Company follows the accounting guidance related to financial statement recognition, measurement and disclosure of uncertain tax positions. The Company recognizes the impact of an uncertain income tax position on an income tax return at the largest amount that is more-likely-than-not to be sustained upon audit by the relevant taxing authority. An uncertain income tax position will not be recognized if it has less than a 50% likelihood of being sustained. Uncertain tax positions are recognized in the first subsequent financial reporting period in which that threshold is met or from changes in circumstances such as the expiration of applicable statutes of limitations.
Share-Based Compensation
The Company has granted stock options to employees and restricted stock units. The Company also has an employee stock purchase plan (“ESPP”) for eligible employees. The Company measures the compensation cost associated with all share-based payments based on grant date fair values. The fair value of each employee stock option and employee stock purchase right is estimated on the date of grant using an option pricing model that meets certain requirements. The Company generally uses the Black-Scholes option pricing model to estimate the fair value of its stock options and stock purchase rights. The Black-Scholes model is considered an acceptable model but the fair values generated by it may not be indicative of the actual fair values of the Company’s equity awards as it does not consider certain factors important to those awards to employees, such as continued employment and periodic vesting requirements as well as limited transferability. The determination of the fair value of share-based payment awards utilizing the Black-Scholes model is affected by the Company’s stock price and a number of assumptions, including expected volatility, expected term, risk-free interest rate and expected dividends.
F-15
INSEEGO CORP.
NOTES TO CONSOLIDATED FINANCIAL STATEMENTS
For grants of stock options, the Company uses a blend of historical and implied volatility for traded options on its stock in order to estimate the expected volatility assumption required in the Black-Scholes model. The Company’s use of a blended volatility estimate in computing the expected volatility assumption for stock options is based on its belief that while the implied volatility is representative of expected future volatility, the historical volatility over the expected term of the award is also an indicator of expected future volatility. Due to the short duration of employee stock purchase rights under the Company’s ESPP, the Company utilizes historical volatility in order to estimate the expected volatility assumption of the Black-Scholes model.
The expected term of stock options granted is estimated using historical experience. The risk-free interest rate assumption is based on observed interest rates appropriate for the expected terms of the Company’s stock options and employee stock purchase rights. The dividend yield assumption is based on the Company’s history and expectation of no dividend payouts. The Company estimates forfeitures at the time of grant and revises these estimates, if necessary, in subsequent periods if actual forfeitures differ from those estimates. The Company estimates its forfeiture rate assumption for all types of share-based compensation awards based historical forfeiture rates related to each category of award.
Compensation cost associated with grants of restricted stock units are measured at fair value, which has historically been the closing price of the Company’s stock on the date of grant.
The Company recognizes share-based compensation expense over the requisite service period of each individual award, which generally equals the vesting period, using the straight-line method for awards that contain only service conditions. For awards that contain performance conditions, the Company recognizes the share-based compensation expense on a straight-line basis for each vesting tranche.
The Company evaluates the assumptions used to value stock awards on a quarterly basis. If factors change and the Company employs different assumptions, share-based compensation expense may differ significantly from what it has recorded in the past. If there are any modifications or cancellations of the underlying unvested securities, the Company may be required to accelerate, increase or cancel any remaining unearned share-based compensation expense.
Net Loss Per Share Attributable to Common Shareholders
The Company computes basic and diluted per share data for all periods for which a statement of operations is presented. Basic net loss per share excludes dilution and is computed by dividing the net loss by the weighted-average number of shares that were outstanding during the period. Diluted EPS reflects the potential dilution that could occur if securities or other contracts to acquire common stock were exercised or converted into common stock. Potential dilutive securities are excluded from the diluted EPS computation in loss periods as their effect would be anti-dilutive. For all periods presented, there is no difference in the number of shares used to calculate basic and diluted shares outstanding due to the Company’s net loss position.
Fair Value of Financial Instruments
The Company’s fair value measurements relate to its cash equivalents, marketable debt securities, and marketable equity securities, which are classified pursuant to authoritative guidance for fair value measurements. The Company places its cash equivalents and marketable debt securities in instruments that meet credit quality standards, as specified in its investment policy guidelines. These guidelines also limit the amount of credit exposure to any one issue, issuer or type of instrument.
The Company’s financial instruments consist principally of cash and cash equivalents, short-term investments and long-term debt. The Company’s cash and cash equivalents consist of its investments in money market funds. From time to time, the Company may utilize foreign exchange forward contracts. These contracts are valued using pricing models that take into account the currency rates as of the balance sheet date.
Comprehensive Loss
Comprehensive loss consists of net earnings, foreign currency translation adjustments and unrealized gains and losses on available-for-sale securities.
Recent Accounting Pronouncements
From time to time, new accounting pronouncements are issued by the FASB, which are adopted by the Company as of the specified date. Unless otherwise discussed, management believes the impact of recently issued standards, which are not yet effective, will not have a material impact on its consolidated financial statements upon adoption.
In January 2017, the FASB issued Accounting Standards Update (“ASU”) 2017-04,
Intangibles
—
Goodwill and Other (Topic 350): Simplifying the Test for Goodwill Impairment
, which simplifies the measurement of goodwill by eliminating the
F-16
INSEEGO CORP.
NOTES TO CONSOLIDATED FINANCIAL STATEMENTS
second step from the goodwill impairment test, which requires the comparison of the implied fair value of goodwill with the current carrying amount of goodwill. Instead, under the amendments in this guidance, an entity shall perform a goodwill impairment test by comparing the fair value of each reporting unit with its carrying amount and an impairment charge is to be recorded for the amount, if any, in which the carrying value exceeds the reporting unit’s fair value. This guidance should be applied prospectively and is effective for fiscal years beginning after December 15, 2019. Early adoption is permitted. The Company is currently assessing the impact of this guidance.
In August 2016, the FASB issued ASU 2016-15,
Statement of Cash Flows (Topic 230): Classification of Certain Cash Receipts and Cash Payments
, which clarifies how companies present and classify certain cash receipts and cash payments in the statement of cash flows. This guidance is effective for fiscal years beginning after December 15, 2017, including interim periods within those fiscal years. Early adoption is permitted. The Company is currently assessing the impact of this guidance.
In June 2016, the FASB issued ASU 2016-13,
Financial Instruments
—
Credit Losses (Topic 326): Measurement of Credit Losses on Financial Instruments
, which requires measurement and recognition of expected credit losses for financial assets held. This guidance is effective for interim and annual reporting periods beginning after December 15, 2019. Early adoption is permitted. The Company is currently assessing the impact of this guidance.
In March 2016, the FASB issued ASU 2016-09,
Improvements to Employee Share-Based Payment Accounting
, which affects entities that issue share-based payment awards to their employees. The guidance is designed to identify areas for simplification involving several aspects of accounting for share-based payment transactions, including the income tax consequences, classification of awards as either equity or liabilities, an option to recognize gross stock compensation expense with actual forfeitures recognized as they occur, as well as certain classifications on the statement of cash flows. This guidance is effective prospectively for interim and annual periods beginning after December 15, 2016. Early adoption is permitted. The Company is currently assessing the impact of this guidance.
In February 2016, the FASB issued ASU 2016-02,
Leases (Topic 842)
, which establishes the principles to report transparent and economically neutral information about the assets and liabilities that arise from leases. This guidance results in the Company providing a more faithful representation of the rights and obligations arising from operating and capital leases by requiring lessees to recognize the lease assets and lease liabilities that arise from leases in the statement of financial position and to disclose qualitative and quantitative information about lease transactions, such as information about variable lease payments and options to renew and terminate leases. This guidance is effective prospectively for interim and annual periods beginning after December 15, 2018. Early adoption is permitted. The Company is currently assessing the impact of this guidance.
In September 2015, the FASB issued ASU 2015-16,
Business Combinations (Topic 805): Simplifying the Accounting for Measurement-Period Adjustments
(“ASU 2015-16”), which eliminates the requirement for an acquirer to retrospectively adjust provisional amounts recorded in a business combination to reflect new information about the facts and circumstances that existed as of the acquisition date and that, if known, would have affected the measurement or recognition of amounts initially recognized. As an alternative, the update requires that an acquirer recognize adjustments to provisional amounts that are identified during the measurement period in the reporting period in which the adjustment amounts are determined. The update requires that the acquirer record, in the financial statements of the period in which adjustments to provisional amounts are determined, the effect on earnings of changes in depreciation, amortization, or other income effects, if any, as a result of the change to the provisional amounts, calculated as if the accounting had been completed at the acquisition date. The Company implemented this guidance during the first quarter of 2016. This guidance did not have a material impact on the Company’s consolidated financial statements upon adoption.
In April 2015, the FASB issued ASU 2015-05,
Intangibles
—
Goodwill and Other
—
Internal-Use Software (Subtopic 350-40): Customer’s Accounting for Fees Paid in a Cloud Computing Arrangement
. Under this standard, if a cloud computing arrangement includes a software license, the software license element of the arrangement should be accounted for consistent with the acquisition of other software licenses. If a cloud computing arrangement does not include a software license, the arrangement should be accounted for as a service contract. The Company implemented this guidance during the first quarter of 2016. This guidance did not have a material impact on the Company’s consolidated financial statements upon adoption.
In May 2014, the FASB issued ASU 2014-09,
Revenue from Contracts with Customers
(“ASU 2014-09”), which provides guidance for revenue recognition. The new standard will require revenue recognized to represent the transfer of promised goods or services to customers in an amount that reflects the consideration the company expects to receive in exchange for those goods or services. The standard also requires new, expanded disclosures regarding revenue recognition. In August 2015, the FASB issued ASU 2015-14,
Revenue from Contracts with Customers: Deferral of Effective Date
, which deferred the effective
F-17
INSEEGO CORP.
NOTES TO CONSOLIDATED FINANCIAL STATEMENTS
date of adoption of ASU 2014-09 to interim and annual reporting periods beginning after December 15, 2017. Early adoption is permitted but not before the original effective date of December 15, 2016. In April 2016, the FASB issued ASU 2016-10,
Revenue from Contracts with Customers (Topic 606): Identifying Performance Obligations and Licensing
, which clarifies aspects of ASU 2014-09 pertaining to the identification of performance obligations and the licensing implementation guidance, while retaining the related principles for those areas. There are two adoption methods available for implementation of this guidance. Under one method, the guidance is applied retrospectively to contracts for each reporting period presented, subject to allowable practical expedients. Under the other method, the guidance is applied only to the most current period presented, recognizing the cumulative effect of the change as an adjustment to the beginning balance of retained earnings, and also requires additional disclosures comparing the results to the previous guidance.
The Company is evaluating the impact of the new standard on its accounting policies, processes and systems. The Company has assigned internal resources, is in the process of engaging a third-party service provider and has a preliminary project plan to finalize the evaluation and complete the implementation.
The Company has preliminarily identified potential impacts to the timing of revenue recognition and the amortization period of costs to obtain contracts. The Company’s decision on the adoption method will be based on various factors including the significance of the impact of the new standard on the Company’s financial results and system capabilities. The Company has not yet completed the evaluation of these impacts and the adoption method has not been determined.
2
. Acquisitions and Divestitures
Acquisitions
DigiCore Holdings Limited (DBA Ctrack)
On June 18, 2015, the Company entered into a transaction implementation agreement (the “TIA”) with DigiCore. Pursuant to the terms of the TIA, the Company acquired
100%
of the issued and outstanding ordinary shares of DigiCore (with the exception of certain excluded shares, including treasury shares) for
4.40
South African Rand per ordinary share outstanding on October 5, 2015, with the total consideration not to exceed
1,094,223,363
South African Rand (the “Maximum Consideration”), which amount was placed into escrow upon signing of the TIA. Upon consummation of the acquisition, DigiCore became an indirect wholly-owned subsidiary of the Company.
From the date of execution of the TIA through the date the transaction closed, the Maximum Consideration Amount placed into escrow experienced a non-cash loss of
$8.3 million
due to the weakening of the South African Rand against the U.S. Dollar. This amount is included in non-cash change in acquisition-related escrow in the consolidated statement of operations.
Upon the closing of the transaction, holders of unvested in-the-money DigiCore stock options received stock options to purchase shares of the Company’s common stock as replacement awards.
During the year ended December 31, 2015, the Company incurred
$1.7 million
in costs and expenses related to the Company’s acquisition of Ctrack that are included in general and administrative expenses in the consolidated statements of operations.
Purchase Price
The total purchase price was approximately
$80.0 million
and included a cash payment for all of the outstanding ordinary shares of DigiCore and the purchase of in-the-money vested stock options held by Ctrack employees on the closing date of the transaction and the portion of the fair value of replacement equity awards issued to Ctrack employees that related to services performed prior to the date the transaction closed.
Set forth below is supplemental purchase consideration information related to the Ctrack acquisition (in thousands):
|
Year Ended December 31, 2015
|
||||
|
Cash payments
|
$
|
79,365
|
|
|
|
Fair value of replacement equity awards issued to Ctrack employees for preacquisition services
|
623
|
|
||
|
Total purchase price
|
$
|
79,988
|
|
|
F-18
INSEEGO CORP.
NOTES TO CONSOLIDATED FINANCIAL STATEMENTS
Allocation of Fair Value
The Company accounted for the transaction using the acquisition method and, accordingly, the consideration has been allocated to the tangible and intangible assets acquired and liabilities assumed on the basis of their respective estimated fair values on the acquisition date. Goodwill resulting from this acquisition is largely attributable to the experienced workforce of Ctrack and synergies expected to arise after the integration of Ctrack’s products and operations into those of the Company. Goodwill resulting from this acquisition is not deductible for tax purposes. Identifiable intangible assets acquired as part of the acquisition included finite-lived intangible assets for developed technologies, customer relationships and trade names, which are being amortized using the straight-line method over their estimated useful lives, as well as indefinite-lived intangible assets. Liabilities assumed from DigiCore included a mortgage bond and capital lease obligations.
The fair value has been allocated based on the estimated fair values of assets acquired and liabilities assumed as follows (in thousands):
|
October 5, 2015
|
||||
|
Cash
|
$
|
2,437
|
|
|
|
Accounts receivable
|
15,052
|
|
||
|
Inventory
|
11,361
|
|
||
|
Property, plant and equipment
|
5,924
|
|
||
|
Rental assets
|
6,603
|
|
||
|
Intangible assets
|
28,270
|
|
||
|
Goodwill
|
29,273
|
|
||
|
Other assets
|
5,695
|
|
||
|
Bank facilities
|
(2,124
|
)
|
||
|
Accounts payable
|
(7,446
|
)
|
||
|
Accrued and other liabilities
|
(15,018
|
)
|
||
|
Noncontrolling interests
|
(39
|
)
|
||
|
Net assets acquired
|
$
|
79,988
|
|
|
Valuation of Intangible Assets Acquired
The following table sets forth the components of intangible assets acquired in connection with the Ctrack acquisition (dollars in thousands):
|
Amount Assigned
|
Amortization Period
(in years)
|
|||||
|
Finite-lived intangible assets:
|
||||||
|
Developed technologies
|
$
|
10,170
|
|
6.0
|
||
|
Trade name
|
14,030
|
|
10.0
|
|||
|
Customer relationships
|
4,070
|
|
5.0
|
|||
|
Total intangible assets acquired
|
$
|
28,270
|
|
|||
R.E.R. Enterprises, Inc. (DBA Feeney Wireless)
On March 27, 2015, the Company acquired all of the issued and outstanding shares of RER and its wholly-owned subsidiary and principal operating asset, FW, an Oregon limited liability company, which develops and sells IoT solutions that integrate wireless communications into business processes. This strategic acquisition expanded the Company’s product and solutions offerings to include private labeled cellular routers, in-house designed and assembled cellular routers, high-end wireless surveillance systems, modems, computers and software, along with associated hardware, purchased from major industry suppliers. Additionally, FW’s services portfolio includes consulting, systems integration and device management services.
In connection with the acquisition, the Company incurred
$0.9 million
in total costs and expenses, which are included in general and administrative expenses in the consolidated statements of operations for the year ended December 31, 2015.
F-19
INSEEGO CORP.
NOTES TO CONSOLIDATED FINANCIAL STATEMENTS
Purchase Price
The total purchase price was approximately
$24.8 million
and included a cash payment at closing of approximately
$9.3 million
,
$1.5 million
of which was placed into an escrow fund to serve as partial security for the indemnification obligations of RER and its former shareholders, the Company’s assumption of
$0.5 million
in certain transaction-related expenses incurred by FW, and the future issuance of shares of the Company’s common stock valued at
$15.0 million
, which would have been payable in March 2016.
The total consideration of
$24.8 million
does not include amounts, if any, payable under an earn-out arrangement under which the Company may have been required to pay up to an additional
$25.0 million
to the former shareholders of RER contingent upon FW’s achievement of certain financial targets for the years ending December 31, 2015, 2016 and 2017 (the “Earn-Out Arrangement”). Such payments, if any, under the Earn-Out Arrangement would have been payable in either cash or shares of the Company’s common stock at the discretion of the Company, and would have been recorded as compensation expense during the service period earned.
Set forth below is supplemental purchase consideration information related to the FW acquisition (in thousands):
|
Cash payments
|
$
|
9,268
|
|
|
|
Future issuance of common stock
|
15,000
|
|
||
|
Other assumed liabilities
|
509
|
|
||
|
Total purchase price
|
$
|
24,777
|
|
|
On January 5, 2016, the Company and RER amended certain payment terms. Under the amended agreements, the
$1.5 million
placed into escrow on the date of acquisition was released to RER and its former shareholders on January 8, 2016, and the
$15.0 million
that was payable in shares of the Company’s common stock in March 2016 will now be paid in
five
cash installments over a
four
-year period, beginning in March 2016. In addition, the Earn-Out Arrangement has been amended (the “Amended Earn-Out Arrangement”) as follows: (a) any amount earned under the Earn-Out Arrangement for the achievement of financial targets for the year ended December 31, 2015 will now be paid in
five
cash installments over a
four
-year period, beginning in March 2016 and (b) in replacement of the potential earn-out contingent upon FW’s achievement of certain financial targets for the years ended December 31, 2016 and 2017 the Company will issue to the former shareholders of RER approximately
2.9 million
shares of the Company’s common stock in
three
equal installments over a
three
-year period, beginning in March 2017.
The Company recognized approximately
$7.9 million
in expense during the year ended
December 31, 2016
in connection with the earn-out payment due to the former shareholders of RER in the form of shares of the Company’s common stock. As of
December 31, 2016
, the total amount earned pursuant to the Amended Earn-Out Arrangement was
$14.0 million
,
$12.5 million
of which remained outstanding as of
December 31, 2016
and is included in accrued expenses and other current liabilities and in other long-term liabilities in the consolidated balance sheets.
Allocation of Fair Value
The Company accounted for the transaction using the acquisition method and, accordingly, the consideration has been allocated to the tangible and intangible assets acquired and liabilities assumed on the basis of their respective estimated fair values on the acquisition date as set forth below. Goodwill resulting from this acquisition is largely attributable to the experienced workforce of FW and synergies expected to arise after the integration of FW’s products and operations into those of the Company. Goodwill resulting from this acquisition is deductible for tax purposes. Identifiable intangible assets acquired as part of the acquisition included finite-lived intangible assets for developed technologies, customer relationships, and trademarks, which are being amortized using the straight-line method over their estimated useful lives, as well as indefinite-lived intangible assets, including in-process research and development. Liabilities assumed from FW included a term loan and capital lease obligations. The term loan and certain capital lease obligations were paid in full by the Company immediately following the closing of the acquisition on
March 27, 2015
.
F-20
INSEEGO CORP.
NOTES TO CONSOLIDATED FINANCIAL STATEMENTS
The fair value has been allocated based on the estimated fair values of assets acquired and liabilities assumed as follows (in thousands):
|
March 27, 2015
|
||||
|
Cash
|
$
|
205
|
|
|
|
Accounts receivable
|
3,331
|
|
||
|
Inventory
|
10,008
|
|
||
|
Property, plant and equipment
|
535
|
|
||
|
Intangible assets
|
18,880
|
|
||
|
Goodwill
(1)
|
3,949
|
|
||
|
Other assets
|
544
|
|
||
|
Accounts payable
|
(7,494
|
)
|
||
|
Accrued and other liabilities
(1)
|
(1,916
|
)
|
||
|
Deferred revenues
|
(270
|
)
|
||
|
Note payable
|
(2,575
|
)
|
||
|
Capital lease obligations
|
(420
|
)
|
||
|
Net assets acquired
|
$
|
24,777
|
|
|
|
(1)
|
Reflects measurement-period adjustments recorded by the Company in accordance with ASU 2015-16. During the year ended December 31, 2016, the Company recorded a measurement-period adjustment to the allocation of fair value resulting in a
$0.2 million
increase to accrued and other liabilities and a corresponding
$0.2 million
increase to goodwill.
|
Valuation of Intangible Assets Acquired
The following table sets forth the components of intangible assets acquired in connection with the FW acquisition (dollars in thousands):
|
Amount Assigned
|
Amortization Period
(in years)
|
|||||
|
Finite-lived intangible assets:
|
||||||
|
Developed technologies
|
$
|
3,660
|
|
6.0
|
||
|
Trademarks
|
4,700
|
|
10.0
|
|||
|
Customer relationships
|
8,500
|
|
10.0
|
|||
|
Indefinite-lived intangible assets:
|
||||||
|
In-process research and development
|
2,020
|
|
|
|||
|
Total intangible assets acquired
|
$
|
18,880
|
|
|||
During the year ended
December 31, 2016
, the Company recorded an impairment loss related to developed technologies acquired in connection with the FW acquisition of approximately
$2.6 million
, which is included in impairment of purchased intangibles in the consolidated statements of operations.
Pro Forma Summary
The unaudited consolidated pro forma results for the years ended
December 31, 2016
and
2015
are set forth in the table below (in thousands). These pro forma consolidated results combine the results of operations of the Company, Ctrack and FW as though Ctrack and FW had been acquired as of January 1, 2015 and include amortization charges for the acquired intangibles for both acquisitions and interest expense related to the Company’s borrowings to finance the Ctrack acquisition. The pro forma financial information is presented for informational purposes only and is not necessarily indicative of the results of operations that would have been achieved if the acquisitions had taken place at the beginning of 2015.
|
|
Year Ended December 31,
|
||||||
|
2016
|
2015
|
||||||
|
Net revenues
|
$
|
243,555
|
|
$
|
276,115
|
|
|
|
Net loss
|
$
|
(60,568
|
)
|
$
|
(48,105
|
)
|
|
F-21
INSEEGO CORP.
NOTES TO CONSOLIDATED FINANCIAL STATEMENTS
Recent and Pending Divestitures
Modules Business
On April 11, 2016, the Company signed a definitive Asset Purchase Agreement with Telit Technologies (Cyprus) Limited and Telit Wireless Solutions, Inc. (collectively, “Telit”) pursuant to which the Company sold, and Telit acquired, certain hardware modules and related assets for an initial purchase price of
$11.0 million
in cash, which included
$9.0 million
that was paid to the Company on the closing date of the transaction,
$1.0 million
that would be paid to the Company in equal quarterly installments over a
two
-year period in connection with the provision by the Company of certain transition services and
$1.0 million
that would be paid to the Company following the satisfaction of certain conditions by the Company, including the assignment of specified contracts and the delivery of certain certifications and approvals. The Company also had the potential to receive an additional cash payment of approximately
$3.8 million
from Telit related to their purchase of module product inventory from the Company,
$1.0 million
of which would be paid to the Company in equal quarterly installments over the
two
-year period following the closing date in connection with the provision by the Company of certain transition services. In addition to the above, the Company may have been entitled to receive a subsequent earn-out payment following the closing of the transaction if certain conditions were met.
On September 29, 2016, the Company entered into a Final Resolution Letter Agreement (the “Final Resolution”) with Telit. Per the Final Resolution, Telit agreed to pay the Company
$2.1 million
in full satisfaction of their payment obligations under certain sections of the original purchase agreement, including all installment payments, and the Company agreed to ship the remainder of the hardware modules and related assets as soon as practicable. Under the Final Resolution, the aggregate purchase consideration totaled
$11.7 million
, which consisted of
$11.3 million
in cash and
$0.4 million
in net settled Company liabilities.
During the year ended
December 31, 2016
, the Company recognized a gain of approximately
$5.0 million
in connection with the fulfillment of certain obligations pursuant to the asset purchase agreement, as amended, which is included in other income (expense), net, in the consolidated statements of operations. As of
December 31, 2016
, the Company recorded a liability of
$0.5 million
for the fair value of the remaining hardware and related assets due to Telit, which is included in accrued expenses and other current liabilities in the consolidated balance sheets.
MiFi Business
On September 21, 2016, the Company entered into a Stock Purchase Agreement (the “Purchase Agreement”), by and among Inseego and Novatel Wireless, on the one hand, and T.C.L. Industries Holdings (H.K.) Limited and Jade Ocean Global Limited (collectively, the “Purchasers”) on the other hand. The Purchase Agreement relates to the pending sale of the Company’s subsidiary, Novatel Wireless, which includes the Company’s MiFi branded hotspots and USB modem product lines (the “MiFi Business”), to the Purchasers for
$50.0 million
in cash, subject to potential adjustment for Novatel Wireless’s working capital as of the closing date. The sale may not close until all of the closing conditions set forth in the Purchase Agreement have been satisfied. One of the closing conditions is the approval of the Committee on Foreign Investment in the United States (“CFIUS”). CFIUS has identified national security concerns relating to the Company’s sale of the MiFi Business to the Purchasers. In early February 2017, the Company and the Purchasers voluntarily withdrew and re-filed their notice to CFIUS in order to obtain additional time to provide further information to CFIUS and explore potential mitigation measures that may allow the transaction to proceed. In early March 2017, CFIUS provided a draft mitigation agreement which, if finalized, would allow CFIUS approval to be granted. Negotiations between CFIUS and the Purchasers regarding the final terms of such mitigation agreement remain ongoing.
In order to facilitate the sale of Novatel Wireless, the Company completed an internal Reorganization in November 2016. The first step of the Reorganization was the formation of Inseego (formerly known as Vanilla Technologies, Inc.) as a direct, wholly owned subsidiary of Novatel Wireless. Inseego then formed Vanilla Merger Sub, Inc., a Delaware corporation and direct, wholly owned subsidiary of Inseego (“Merger Sub”). Merger Sub was formed solely for the purpose of effecting the Reorganization.
Novatel Wireless then contributed all of its assets and liabilities (other than the MiFi Business), including its equity interests in DigiCore, FW, Novatel Wireless Solutions, Inc., Enfora Comercio de Eletronicos LTDA and each of their direct and indirect subsidiaries, to Inseego.
Finally, Merger Sub was merged with and into Novatel Wireless, with Novatel Wireless surviving as a direct, wholly owned subsidiary of Inseego. Upon completion of the Reorganization, each share of Novatel Wireless common stock was automatically converted into a corresponding share of Inseego common stock, having the same rights and limitations as the
F-22
INSEEGO CORP.
NOTES TO CONSOLIDATED FINANCIAL STATEMENTS
corresponding share of Novatel Wireless common stock that was converted. Accordingly, at such time, Novatel Wireless’s former stockholders became stockholders of Inseego.
The purpose and effect of the Reorganization was to separate the MiFi Business from the assets and liabilities associated with the Ctrack fleet and vehicle telematics solutions and stolen vehicle recovery and FW telemetry and connectivity solutions businesses.
3
. Financial Statement Details
Short-term investments
The Company acquired certain short-term investments in trading securities through its acquisition of Ctrack. The Company recognized a gain of approximately
$0.2 million
and
$0.1 million
on such securities during the years ended December 31,
2016
and 2015, respectively, which is included in other income (expense), net, in the consolidated statements of operations.
Inventories
Inventories consist of the following (in thousands):
|
December 31,
|
|||||||
|
|
2016
|
2015
|
|||||
|
Finished goods
|
$
|
19,277
|
|
$
|
47,094
|
|
|
|
Raw materials and components
|
11,865
|
|
8,743
|
|
|||
|
$
|
31,142
|
|
$
|
55,837
|
|
||
Property, Plant and Equipment
Property, plant and equipment consists of the following (in thousands):
|
|
December 31,
|
||||||
|
|
2016
|
2015
|
|||||
|
Land
|
$
|
260
|
|
$
|
229
|
|
|
|
Buildings
|
2,363
|
|
2,084
|
|
|||
|
Test equipment
|
23,115
|
|
47,243
|
|
|||
|
Computer equipment and purchased software
|
4,373
|
|
11,399
|
|
|||
|
Product tooling
|
409
|
|
3,832
|
|
|||
|
Furniture and fixtures
|
915
|
|
2,151
|
|
|||
|
Vehicles
|
1,746
|
|
1,042
|
|
|||
|
Leasehold improvements
|
243
|
|
3,664
|
|
|||
|
33,424
|
|
71,644
|
|
||||
|
Less—accumulated depreciation and amortization
|
(25,032
|
)
|
(62,832
|
)
|
|||
|
$
|
8,392
|
|
$
|
8,812
|
|
||
At
December 31, 2016
, the Company had vehicles and equipment under capital leases of
$1.8 million
, net of accumulated amortization of
$1.1 million
. At December 31,
2015
, the Company had vehicles and equipment under capital leases of
$1.5 million
, net of accumulated amortization of
$0.2 million
.
Rental Assets
Rental assets consist of the following (in thousands):
|
|
December 31,
|
||||||
|
|
2016
|
2015
|
|||||
|
Rental assets
|
$
|
11,115
|
|
$
|
7,189
|
|
|
|
Less—accumulated depreciation
|
(4,112
|
)
|
(1,034
|
)
|
|||
|
$
|
7,003
|
|
$
|
6,155
|
|
||
F-23
INSEEGO CORP.
NOTES TO CONSOLIDATED FINANCIAL STATEMENTS
Depreciation and amortization expense related to property, plant and equipment, including equipment under capital leases, and rental assets was
$7.8 million
,
$5.0 million
and
$6.3 million
for the years ended
December 31, 2016
,
2015
and
2014
, respectively.
Accrued Expenses and Other Current Liabilities
Accrued expenses and other current liabilities consist of the following (in thousands):
|
December 31,
|
|||||||
|
|
2016
|
2015
|
|||||
|
Royalties
|
$
|
1,544
|
|
$
|
2,740
|
|
|
|
Payroll and related expenses
|
5,315
|
|
4,406
|
|
|||
|
Warranty obligations
|
480
|
|
932
|
|
|||
|
Market development funds and price protection
|
320
|
|
2,805
|
|
|||
|
Professional fees
|
4,793
|
|
1,060
|
|
|||
|
Deferred revenue
|
1,656
|
|
1,836
|
|
|||
|
Restructuring
|
837
|
|
1,044
|
|
|||
|
Acquisition-related liabilities
|
7,912
|
|
5,274
|
|
|||
|
Divestiture-related liabilities
|
463
|
|
—
|
|
|||
|
Other
|
4,577
|
|
5,516
|
|
|||
|
$
|
27,897
|
|
$
|
25,613
|
|
||
Accrued Warranty Obligations
Accrued warranty obligations consist of the following (in thousands):
|
|
Year Ended December 31,
|
||||||
|
2016
|
2015
|
||||||
|
Accrued warranty obligations at beginning of period
|
$
|
932
|
|
$
|
1,196
|
|
|
|
Additions charged to operations
|
821
|
|
1,090
|
|
|||
|
Deductions from liability
|
(1,262
|
)
|
(1,354
|
)
|
|||
|
Effect of change in foreign currency exchange rates
|
(11
|
)
|
—
|
|
|||
|
Accrued warranty obligations at end of period
|
$
|
480
|
|
$
|
932
|
|
|
4
.
Goodwill and Other Intangible Assets
A summary of the activity in goodwill is presented below (in thousands):
|
Balance at December 31, 2014
|
$
|
—
|
|
|
Acquisition of Ctrack
|
29,273
|
|
|
|
Acquisition of FW
|
3,754
|
|
|
|
Effect of change in foreign currency exchange rates
|
(3,507
|
)
|
|
|
Balance at December 31, 2015
|
$
|
29,520
|
|
|
Ctrack adjustment
(1)
|
1,236
|
|
|
|
FW adjustment
|
195
|
|
|
|
Effect of change in foreign currency exchange rates
|
3,477
|
|
|
|
Balance at December 31, 2016
|
$
|
34,428
|
|
|
(1)
|
During the year ended December 31, 2016, the Company identified the need for an immaterial adjustment in the recording of net assets and goodwill in the accounting for the acquisition of Ctrack. As a result, the Company has recorded an adjustment during the year ended December 31, 2016 that increased goodwill and decreased accounts receivable. There was no change in reported cash flows in any period related to this adjustment.
|
F-24
INSEEGO CORP.
NOTES TO CONSOLIDATED FINANCIAL STATEMENTS
The Company’s intangible assets are comprised of the following (in thousands):
|
December 31, 2016
|
|||||||||||||
|
|
Weighted-Average Life
(in years) |
Gross Carrying Value
|
Accumulated Amortization
|
Net Carrying Value
|
|||||||||
|
Finite-lived intangible assets:
|
|||||||||||||
|
Developed technologies
|
5.5
|
$
|
17,247
|
|
$
|
(7,042
|
)
|
$
|
10,205
|
|
|||
|
Trademarks and trade names
|
9.2
|
23,043
|
|
(6,905
|
)
|
16,138
|
|
||||||
|
Customer relationships
|
8.3
|
13,046
|
|
(2,993
|
)
|
10,053
|
|
||||||
|
Capitalized software development costs
|
5.0
|
3,579
|
|
(511
|
)
|
3,068
|
|
||||||
|
Other
|
2.7
|
828
|
|
(545
|
)
|
283
|
|
||||||
|
Total finite-lived intangible assets
|
$
|
57,743
|
|
$
|
(17,996
|
)
|
39,747
|
|
|||||
|
Indefinite-lived intangible assets:
|
|||||||||||||
|
In-process capitalized software development costs
|
536
|
|
|||||||||||
|
Total intangible assets
|
$
|
40,283
|
|
||||||||||
|
December 31, 2015
|
|||||||||||||
|
|
Weighted-Average Life
(in years) |
Gross Carrying Value
|
Accumulated Amortization
|
Net Carrying Value
|
|||||||||
|
Finite-lived intangible assets:
|
|||||||||||||
|
Developed technologies
|
5.3
|
$
|
19,065
|
|
$
|
(7,307
|
)
|
$
|
11,758
|
|
|||
|
Trademarks and trade names
|
9.2
|
21,267
|
|
(4,383
|
)
|
16,884
|
|
||||||
|
Customer relationships
|
8.4
|
12,562
|
|
(1,270
|
)
|
11,292
|
|
||||||
|
Capitalized software development costs
|
5.0
|
1,010
|
|
(181
|
)
|
829
|
|
||||||
|
Other
|
1.9
|
4,545
|
|
(4,239
|
)
|
306
|
|
||||||
|
Total finite-lived intangible assets
|
$
|
58,449
|
|
$
|
(17,380
|
)
|
41,069
|
|
|||||
|
Indefinite-lived intangible assets:
|
|||||||||||||
|
In-process research and development
|
2,020
|
|
|||||||||||
|
Total intangible assets
|
$
|
43,089
|
|
||||||||||
During the year ended December 31, 2016, in-process research and development acquired in connection with the FW acquisition was completed and reclassified to developed technologies where it is being amortized over its estimated useful life.
Amortization expense for the years ended December 31,
2016
,
2015
and
2014
was approximately
$6.2 million
,
$3.3 million
and
$1.0 million
, respectively, including approximately
$0.3 million
and
$25,000
related to capitalized software development costs for the years ended December 31,
2016
and
2015
, respectively. The Company did not have amortization expense related to capitalized software development costs for the year ended December 31,
2014
.
During the year ended
December 31, 2016
, the Company recorded an impairment loss on intangible assets of approximately
$2.7 million
, which is included in impairment of purchased intangibles and other income (expense), net, in the consolidated statements of operations.
F-25
INSEEGO CORP.
NOTES TO CONSOLIDATED FINANCIAL STATEMENTS
The following table represents details of the amortization of finite-lived intangible assets that is estimated to be expensed in the future (in thousands):
|
2017
|
$
|
6,451
|
|
|
2018
|
6,336
|
|
|
|
2019
|
6,251
|
|
|
|
2020
|
6,046
|
|
|
|
2021
|
4,881
|
|
|
|
Thereafter
|
9,782
|
|
|
|
Total
|
$
|
39,747
|
|
5
. Fair Value Measurement of Assets and Liabilities
Fair value is defined as the price that would be received to sell an asset or paid to transfer a liability in an orderly transaction between market participants at the measurement date (exit price). A fair value measurement reflects the assumptions market participants would use in pricing an asset or liability based on the best available information. These assumptions include the risk inherent in a particular valuation technique (such as a pricing model) and the risks inherent in the inputs to the model.
The Company classifies inputs to measure fair value using a three-level hierarchy that maximizes the use of observable inputs and minimizes the use of unobservable inputs by requiring that the most observable inputs be used when available. The categorization of financial instruments within the valuation hierarchy is based upon the lowest level of input that is significant to the fair value measurement. The hierarchy is prioritized into three levels (with Level 3 being the lowest) and is defined as follows:
|
Level 1:
|
Pricing inputs are based on quoted market prices for identical assets or liabilities in active markets (e.g., NYSE or NASDAQ). Active markets are those in which transactions for the asset or liability occur in sufficient frequency and volume to provide pricing information on an ongoing basis.
|
|
Level 2:
|
Pricing inputs include benchmark yields, trade data, reported trades and broker dealer quotes, two-sided markets and industry and economic events, yield to maturity, Municipal Securities Rule Making Board reported trades and vendor trading platform data. Level 2 includes those financial instruments that are valued using various pricing services and broker pricing information including Electronic Communication Networks and broker feeds.
|
|
Level 3:
|
Pricing inputs include significant inputs that are generally less observable from objective sources, including the Company’s own assumptions.
|
The Company reviews the fair value hierarchy classification on a quarterly basis. Changes in the observability of valuation inputs may result in a reclassification of levels for certain securities within the fair value hierarchy. There have been no transfers of assets or liabilities between fair value measurement classifications during the year ended
December 31, 2016
.
The following table summarizes the Company’s financial instruments measured at fair value on a recurring basis in accordance with the authoritative guidance for fair value measurements as of
December 31, 2016
(in thousands):
|
Balance as of
December 31, 2016 |
Level 1
|
|||||||
|
Assets:
|
||||||||
|
Cash equivalents
|
||||||||
|
Money market funds
|
$
|
35
|
|
$
|
35
|
|
||
|
Total cash equivalents
|
35
|
|
35
|
|
||||
F-26
INSEEGO CORP.
NOTES TO CONSOLIDATED FINANCIAL STATEMENTS
The following table summarizes the Company’s financial instruments measured at fair value on a recurring basis in accordance with the authoritative guidance for fair value measurements as of
December 31, 2015
(in thousands):
|
Balance as of
December 31, 2015 |
Level 1
|
|||||||
|
Assets:
|
||||||||
|
Cash equivalents
|
||||||||
|
Money market funds
|
$
|
35
|
|
$
|
35
|
|
||
|
Total cash equivalents
|
35
|
|
35
|
|
||||
|
Short-term investments
|
1,267
|
|
1,267
|
|
||||
|
Total assets at fair value
|
$
|
1,302
|
|
$
|
1,302
|
|
||
As of
December 31, 2016
and
2015
, the Company had
no
outstanding foreign currency exchange forward contracts.
During the years ended
December 31, 2016
and
2015
, the Company recorded net foreign currency transaction
losses
and
gains
, respectively, of approximately
$3.6 million
and
$1.1 million
, net of the non-cash change in acquisition-related escrow, respectively, primarily related to outstanding intercompany loans that Ctrack has with certain of its subsidiaries, which are remeasured at each reporting period and
payable upon demand
. During the year ended December 31,
2014
the Company recorded net foreign currency transaction
losses
of approximately
$0.2 million
, primarily related to foreign currency losses on foreign currency denominated bank accounts.
All recorded gains and losses on foreign currency transactions are recorded in other income (expense), net, in the consolidated statements of operations.
Other Financial Instruments
On June 10, 2015, the Company issued
$120.0 million
of
5.50%
convertible senior notes due 2020 (the “
Novatel Wireless Notes
”) (see Note
6
). The Company carries the
Novatel Wireless Notes
at amortized cost. The debt and equity components of the
Novatel Wireless Notes
were measured using Level 3 inputs and are not measured on a recurring basis. The fair value of the liability component, which approximates the carrying value, of the
Novatel Wireless Notes
was
$90.9 million
and
$82.5 million
as of
December 31, 2016
and
2015
, respectively. On January 9, 2017,
$119.8 million
of the Novatel Wireless Notes were exchanged for newly issued
5.50%
convertible senior notes due 2022 (the “Inseego Notes”) (see Note
6
).
6
. Debt
Short-Term Borrowings
DigiCore Secured Banking Facility
DigiCore has a secured banking facility with Absa Bank Limited in South Africa (“Absa”), which had a maximum borrowing capacity of
$1.7 million
at December 31,
2016
. The facility bears interest at the South Africa prime interest rate less
0.10%
(
10.40%
at December 31,
2016
) and is subject to renewal annually in
April
. At December 31,
2016
and
2015
,
$1.7 million
and
$1.5 million
, respectively, was outstanding under this facility.
DigiCore Secured Overdraft Facility
DigiCore has a secured overdraft facility with Grindrod Bank Limited in South Africa, which had a maximum borrowing capacity of
$1.5 million
at December 31,
2016
. The facility bears interest at the South Africa prime interest rate plus
1.00%
(
11.50%
at December 31,
2016
), requires monthly interest and, in certain instances, minimum principal payments. The facility is subject to renewal annually in
September
. At December 31,
2016
and
2015
,
$1.5 million
and
$1.8 million
, respectively, was outstanding under this facility.
Revolving Credit Facility
On October 31, 2014, the Company and one of its subsidiaries entered into a
five
-year senior secured revolving credit facility in the amount of
$25.0 million
(the “Revolver”) with Wells Fargo Bank, NA, as lender. Concurrently with the acquisition of FW, the Company amended the Revolver to include FW as a borrower and Loan Party, as defined by the agreement. On November 17, 2015, the Revolver was amended to increase the maximum borrowing capacity to
$48.0 million
.
F-27
INSEEGO CORP.
NOTES TO CONSOLIDATED FINANCIAL STATEMENTS
The amount of borrowings that may be made under the Revolver is based on a borrowing base comprised of a specified percentage of eligible receivables. If, at any time during the term of the Revolver, the amount of borrowings outstanding under the Revolver exceeds the borrowing base then in effect, the Company is required to repay such borrowings in an amount sufficient to eliminate such excess. The Revolver includes
$3.0 million
available for letters of credit,
$0.7 million
of which was available for letters of credit at
December 31, 2016
.
The Company may borrow funds under the Revolver from time to time, with interest payable monthly at a base rate determined by using the daily three month LIBOR rate, plus an applicable margin of
3.00%
to
3.50%
depending on the Company’s liquidity as determined on the last day of each calendar month. The Revolver is secured by a first priority lien on substantially all of the assets of the Company and certain of its subsidiaries, subject to certain exceptions and permitted liens. The Revolver includes customary representations and warranties, as well as customary reporting and financial covenants.
There was
no
outstanding balance on the Revolver at
December 31, 2016
and
2015
. As of
December 31, 2016
, the Company had available borrowings of approximately
$4.7 million
and was in compliance with all financial covenants contained in the credit agreement.
On March 20, 2017, subsequent to the balance sheet date, the Revolver was amended (the “Amendment”). The Amendment, made at the Company’s request, amended and updated the financial covenants with respect to the liquidity requirements and EBITDA targets, among other things, in order to enable draw-downs by the Company from time to time. In exchange for such accommodations, the Amendment also decreased the aggregate amount available under the Revolver from
$48.0 million
to
$10.0 million
and increased the applicable margin to
4.00%
when interest is based on the daily three month LIBOR rate and
1.5%
when interest is based on the prime rate.
Convertible Senior Notes
On June 10, 2015, Novatel Wireless issued
$120.0 million
aggregate principal amount of
Novatel Wireless Notes
. The Company incurred issuance costs of approximately
$3.9 million
. The Company used a portion of the proceeds from the offering to finance its acquisition of Ctrack, to pay fees and expenses related to the acquisition, and for general corporate purposes.
The
Novatel Wireless Notes
are governed by the terms of an indenture, dated June 10, 2015 (the “Novatel Wireless Indenture”), entered into between Novatel Wireless, as issuer, Inseego Corp. and Wilmington Trust, National Association, as trustee (the “Trustee”). The
Novatel Wireless Notes
are senior unsecured obligations of Novatel Wireless and bear interest at a rate of
5.50%
per year, payable semi-annually in arrears on June 15 and December 15 of each year, beginning on December 15, 2015. The
Novatel Wireless Notes
will mature on June 15, 2020, unless earlier repurchased or converted. The
Novatel Wireless Notes
will be convertible into cash, shares of the Company’s common stock, or a combination thereof, at the election of the Company, at an initial conversion rate of
200.0000
shares of common stock per
$1,000
principal amount of the
Novatel Wireless Notes
, which corresponds to an initial conversion price of
$5.00
per share of the Company’s common stock.
The conversion rate is subject to adjustment from time to time upon the occurrence of certain events, including, but not limited to, the issuance of stock dividends and payment of cash dividends. At any time prior to the close of business on the business day immediately preceding December 15, 2019, holders may convert their
Novatel Wireless Notes
at their option only under the following circumstances:
|
(i)
|
during any calendar quarter commencing after the calendar quarter ended on September 30, 2015 (and only during such calendar quarter), if the last reported sale price of the Company’s common stock for at least
20
trading days (whether or not consecutive) during a period of
30
consecutive trading days ending on the last trading day of the immediately preceding calendar quarter equals or exceeds
130%
of the conversion price on each applicable trading day;
|
|
(ii)
|
during the
five
consecutive business day period immediately after any
five
consecutive trading day period (the “Measurement Period”) in which the trading price per
$1,000
principal amount of the
Novatel Wireless Notes
for each trading day of the Measurement Period was less than
98%
of the product of the last reported sale price of the Company’s common stock and the conversion rate on each such trading day;
|
|
(iii)
|
upon the occurrence of certain corporate events specified in the Novatel Wireless Indenture; or
|
|
(iv)
|
if the Company has called the
Novatel Wireless Notes
for redemption.
|
On or after December 15, 2019, the holders may convert any of their
Novatel Wireless Notes
at any time prior to the close of business on the business day immediately preceding the maturity date.
The Company may redeem all or a portion of the
Novatel Wireless Notes
at its option on or after June 15, 2018 if the last
F-28
INSEEGO CORP.
NOTES TO CONSOLIDATED FINANCIAL STATEMENTS
reported sale price per share of the Company’s common stock equals or exceeds
140%
of the conversion price for each of at least
20
trading days (whether or not consecutive) during the
30
consecutive trading days ending on, and including, the trading day immediately prior to the date on which the Company provides written notice of redemption, at a redemption price equal to
100%
of the principal amount of the
Novatel Wireless Notes
to be redeemed, plus any accrued and unpaid interest on such
Novatel Wireless Notes
, subject to the right of holders as of the close of business on an interest record date to receive the related interest. In addition, if the Company calls the
Novatel Wireless Notes
for redemption, a “make-whole fundamental change” (as defined in the Novatel Wireless Indenture) will be deemed to occur. As a result, the Company will, in certain circumstances, increase the conversion rate for holders who convert their
Novatel Wireless Notes
in connection with such redemption.
No “sinking fund” is provided for the
Novatel Wireless Notes
, which means that the Company is not required to periodically redeem or retire the
Novatel Wireless Notes
. If the Company undergoes a “fundamental change” (as defined in the Novatel Wireless Indenture), subject to certain conditions, holders may require the Company to repurchase for cash all or part of their
Novatel Wireless Notes
in principal amounts of
$1,000
, or an integral multiple of
$1,000
in excess thereof. The fundamental change repurchase price will be equal to
100%
of the principal amount of the
Novatel Wireless Notes
to be repurchased, plus accrued and unpaid interest to, but excluding, the fundamental change repurchase date, subject to the right of holders as of the close of business on an interest record date to receive the related interest. In addition, every fundamental change is a make-whole fundamental change. As a result, the Company will, in certain circumstances, increase the conversion rate for holders who convert their
Novatel Wireless Notes
in connection with such fundamental change.
The Novatel Wireless Indenture also provides for customary events of default. If an event of default (other than certain events of bankruptcy, insolvency or reorganization involving the Company) occurs and is continuing, the Trustee, by notice to the Company, or the holders of at least
25%
in principal amount of the outstanding
Novatel Wireless Notes
, by notice to the Company and the Trustee, may declare the principal and accrued and unpaid interest on the outstanding
Novatel Wireless Notes
to be immediately due and payable. Upon the occurrence of certain events of bankruptcy, insolvency or reorganization involving the Company,
100%
of the principal and accrued and unpaid interest of the
Novatel Wireless Notes
will automatically become immediately due and payable. Notwithstanding the foregoing, the Novatel Wireless Indenture provides that, to the extent the Company elects and for up to
60
days, the sole remedy for an event of default relating to certain failures by the Company to comply with certain reporting covenants consists exclusively of the right to receive special interest on the
Novatel Wireless Notes
at a rate equal to
0.50%
per annum on the principal amount of the outstanding
Novatel Wireless Notes
.
In accordance with accounting guidance for debt with conversion and other options, the Company separately accounts for the liability and equity components of the
Novatel Wireless Notes
by allocating the proceeds between the liability component and the embedded conversion option, or equity component, due to its ability to settle the
Novatel Wireless Notes
in cash, common stock, or a combination of cash and common stock, at the Company’s option. The carrying amount of the liability component was calculated by measuring the fair value of a similar instrument that does not have an associated convertible feature. The allocation was performed in a manner that reflected the Company’s non-convertible debt borrowing rate for similar debt. The equity component of the
Novatel Wireless Notes
was recognized as a debt discount and represents the difference between the aggregate proceeds from the issuance of the
Novatel Wireless Notes
and the fair value of the liability of the
Novatel Wireless Notes
on the date of issuance. The excess of the aggregate principal amount of the liability component over its carrying amount, or debt discount, is amortized to interest expense using the effective interest method over five years, or the life of the
Novatel Wireless Notes
. The equity component is not remeasured as long as it continues to meet the conditions for equity classification.
The
Novatel Wireless Notes
consisted of the following at
December 31, 2016
(in thousands):
|
Liability component:
|
|||
|
Principal
|
$
|
120,000
|
|
|
Less: unamortized debt discount and debt issuance costs
|
(29,092
|
)
|
|
|
Net carrying amount
|
$
|
90,908
|
|
|
Equity component
|
$
|
38,305
|
|
In connection with the issuance of the
Novatel Wireless Notes
, the Company incurred approximately
$3.9 million
of issuance costs, which primarily consisted of underwriting, legal and other professional fees, and allocated the costs to the liability and equity components based on the allocation of the proceeds. Of the approximately
$3.9 million
of issuance costs, approximately
$1.3 million
were allocated to the equity component and recorded as a reduction to additional paid-in capital and
$2.6 million
were allocated to the liability component and recorded as a decrease to the carrying amount of the liability
F-29
INSEEGO CORP.
NOTES TO CONSOLIDATED FINANCIAL STATEMENTS
component on the unaudited condensed consolidated balance sheet. The portion allocated to the liability component is amortized to interest expense over the expected life of the
Novatel Wireless Notes
using the effective interest method.
The Company determined the expected life of the debt was equal to the
five
-year term of the
Novatel Wireless Notes
. The effective interest rate on the liability component was
16.55%
for the year ended
December 31, 2016
. The following table sets forth total interest expense recognized related to the
Novatel Wireless Notes
during the year ended
December 31, 2016
(in thousands):
|
Year Ended
December 31, |
|||||||
|
2016
|
2015
|
||||||
|
Contractual interest expense
|
$
|
6,600
|
|
$
|
3,667
|
|
|
|
Amortization of debt discount
|
7,920
|
|
4,400
|
|
|||
|
Amortization of debt issuance costs
|
527
|
|
292
|
|
|||
|
Total interest expense
|
$
|
15,047
|
|
$
|
8,359
|
|
|
On January 9, 2017, subsequent to the balance sheet date, in connection with the settlement of an exchange offer and consent solicitation with respect to the Novatel Wireless Notes, the Company issued approximately
$119.8 million
aggregate principal amount of the Inseego Notes. The Inseego Notes were issued in exchange for the approximately
$119.8 million
aggregate principal amount of outstanding Novatel Wireless Notes that were validly tendered and accepted for exchange and subsequently canceled. The Inseego Notes, and the common stock issuable upon conversion of such notes, were registered under the Securities Act of 1933, as amended, pursuant to a Registration Statement on Form S-4 (No. 333-214966) which was filed with the SEC on December 7, 2016 and declared effective by the SEC on January 4, 2017.
The Inseego Notes are governed by the terms of an indenture, dated January 9, 2017, between the Company, as issuer, and Wilmington Trust, National Association, as trustee (the “Trustee”). The Inseego Notes are senior unsecured obligations of the Company and bear interest from, and including, December 15, 2016, at a rate of
5.50%
per year, payable semi-annually in arrears on June 15 and December 15 of each year, beginning on June 15, 2017. The Inseego Notes will mature on June 15, 2022, unless earlier converted, redeemed or repurchased.
The Inseego Notes are subject to repurchase by the Company at the option of the holders on June 15, 2020 at a repurchase price in cash equal to
100%
of the principal amount of the Inseego Notes to be repurchased, plus accrued and unpaid interest to, but excluding, the optional repurchase date, subject to the right of holders of the Inseego Notes on a record date to receive interest through the corresponding interest payment date.
Because the exchange of the Novatel Wireless Notes for the Inseego Notes described above was treated as a debt modification in accordance with applicable FASB guidance (it was between a parent and a subsidiary company and for substantially identical notes), the Company did not recognize a gain or loss with respect to the issuance of the Inseego Notes. During the year ended
December 31, 2016
, the Company incurred approximately
$1.1 million
in connection with the issuance of the Inseego Notes, which is included in general and administrative expenses in the consolidated statements of operations.
Following the settlement of the exchange offer and consent solicitation, approximately
$0.2 million
aggregate principal amount of Novatel Wireless Notes remain outstanding. In connection with the exchange offer and consent solicitation, the Novatel Wireless Indenture and the Novatel Wireless Notes were amended to, among other things, eliminate certain events of default and substantially all of the restrictive covenants in the Novatel Wireless Indenture and the Novatel Wireless Notes, including the merger covenant, which sets forth certain requirements that must be met for Novatel Wireless to consolidate, merge or sell all or substantially all of its assets, and the reporting covenant, which requires Novatel Wireless to provide certain periodic reports to noteholders. The Novatel Wireless Indenture, as amended, also provides that the form of settlement of any conversions of the Novatel Wireless Notes will be elected by the Company.
DigiCore Mortgage Bond
DigiCore has a mortgage bond with Absa that is secured by certain property of DigiCore. The mortgage bond has a
ten
year term, expiring in December 2018, and bears interest at the South Africa prime rate minus
1.75%
(
8.75%
at December 31,
2016
). At December 31,
2016
and
2015
,
$0.6 million
and
$0.7 million
, respectively, remained outstanding under the mortgage bond.
F-30
INSEEGO CORP.
NOTES TO CONSOLIDATED FINANCIAL STATEMENTS
At December 31,
2016
, the minimum calendar year principal payments and maturities of long-term debt were as follows (in thousands):
|
2017
|
$
|
238
|
|
|
2018
|
347
|
|
|
|
2019
|
—
|
|
|
|
2020
|
120,000
|
|
|
|
2021
|
—
|
|
|
|
Thereafter
|
—
|
|
|
|
Total
|
$
|
120,585
|
|
7
. Income Taxes
Loss before income taxes for the years ended December 31,
2016
,
2015
and
2014
is comprised of the following (in thousands):
|
|
Year Ended December 31,
|
||||||||||
|
|
2016
|
2015
|
2014
|
||||||||
|
Domestic
|
$
|
(51,265
|
)
|
$
|
(48,965
|
)
|
$
|
(39,513
|
)
|
||
|
Foreign
|
(8,922
|
)
|
(3,148
|
)
|
408
|
|
|||||
|
Loss before income taxes
|
$
|
(60,187
|
)
|
$
|
(52,113
|
)
|
$
|
(39,105
|
)
|
||
The provision for income taxes for the years ended December 31,
2016
,
2015
and
2014
is comprised of the following (in thousands):
|
|
Year Ended December 31,
|
||||||||||
|
|
2016
|
2015
|
2014
|
||||||||
|
Current:
|
|||||||||||
|
Federal
|
$
|
—
|
|
$
|
—
|
|
$
|
—
|
|
||
|
State
|
—
|
|
(6
|
)
|
21
|
|
|||||
|
Foreign
|
185
|
|
81
|
|
16
|
|
|||||
|
Total current
|
185
|
|
75
|
|
37
|
|
|||||
|
Deferred:
|
|||||||||||
|
Federal
|
156
|
|
—
|
|
—
|
|
|||||
|
State
|
—
|
|
—
|
|
—
|
|
|||||
|
Foreign
|
40
|
|
106
|
|
87
|
|
|||||
|
Total deferred
|
196
|
|
106
|
|
87
|
|
|||||
|
Provision for income taxes
|
$
|
381
|
|
$
|
181
|
|
$
|
124
|
|
||
F-31
INSEEGO CORP.
NOTES TO CONSOLIDATED FINANCIAL STATEMENTS
The Company’s net deferred tax liabilities consist of the following (in thousands):
|
|
December 31,
|
||||||
|
|
2016
|
2015
|
|||||
|
Deferred tax assets:
|
|||||||
|
Accrued expenses
|
$
|
2,881
|
|
$
|
3,455
|
|
|
|
Provision for excess and obsolete inventory
|
4,913
|
|
1,576
|
|
|||
|
Depreciation and amortization
|
9,655
|
|
5,613
|
|
|||
|
Net operating loss and tax credit carryforwards
|
105,143
|
|
96,848
|
|
|||
|
Share-based compensation
|
2,203
|
|
1,685
|
|
|||
|
Unrecognized tax benefits
|
1,510
|
|
1,407
|
|
|||
|
Deferred tax assets
|
126,305
|
|
110,584
|
|
|||
|
Deferred tax liabilities:
|
|
||||||
|
Convertible senior notes
|
(9,535
|
)
|
(12,207
|
)
|
|||
|
Purchased intangible assets
|
(6,790
|
)
|
(6,868
|
)
|
|||
|
Deferred tax liabilities
|
(16,325
|
)
|
(19,075
|
)
|
|||
|
Valuation allowance
|
(114,419
|
)
|
(94,984
|
)
|
|||
|
Net deferred tax liabilities
|
$
|
(4,439
|
)
|
$
|
(3,475
|
)
|
|
The Company recognizes federal, state and foreign current tax liabilities or assets based on its estimate of taxes payable to or refundable by tax authorities in the current fiscal year. The Company also recognizes federal, state and foreign deferred tax liabilities or assets based on the Company’s estimate of future tax effects attributable to temporary differences and carryforwards. The Company records a valuation allowance to reduce any deferred tax assets by the amount of any tax benefits that, based on available evidence and judgment, are not expected to be realized.
The Company assesses whether a valuation allowance should be recorded against its deferred tax assets based on the consideration of all available evidence, using a “more likely than not” realization standard. The four sources of taxable income that must be considered in determining whether deferred tax assets will be realized are: (1) future reversals of existing taxable temporary differences (i.e., offset of gross deferred tax assets against gross deferred tax liabilities); (2) taxable income in prior carryback years, if carryback is permitted under the applicable tax law; (3) tax planning strategies; and (4) future taxable income exclusive of reversing temporary differences and carryforwards.
After a review of the four sources of taxable income described above and after being in a three year cumulative loss position at the end of 2015, the Company recognized a full valuation allowance against all of its U.S.-based and some foreign-based deferred tax assets.
At December 31,
2016
and
2015
, the Company recognized valuation allowances of
$19.3 million
and
$15.4 million
, respectively, related to its deferred tax assets created in those respective years. As a result, no net income tax benefits resulted in the Company’s statements for operations from the operating losses created during those years.
F-32
INSEEGO CORP.
NOTES TO CONSOLIDATED FINANCIAL STATEMENTS
The provision for income taxes reconciles to the amount computed by applying the statutory federal income tax rate of
34%
in
2016
,
2015
and
2014
to loss before income taxes as follows (in thousands):
|
|
Year Ended December 31,
|
||||||||||
|
|
2016
|
2015
|
2014
|
||||||||
|
Federal tax benefit, at statutory rate
|
$
|
(20,463
|
)
|
$
|
(17,718
|
)
|
$
|
(13,447
|
)
|
||
|
State benefit, net of federal benefit
|
(293
|
)
|
(280
|
)
|
(1,054
|
)
|
|||||
|
Foreign tax rate difference
|
681
|
|
222
|
|
—
|
|
|||||
|
Change in valuation allowance
|
19,341
|
|
15,389
|
|
11,316
|
|
|||||
|
Change in fair value of warrant liability
|
—
|
|
—
|
|
1,203
|
|
|||||
|
Beneficial conversion feature
|
—
|
|
—
|
|
163
|
|
|||||
|
Research and development credits
|
(1,010
|
)
|
(796
|
)
|
3
|
|
|||||
|
Share-based compensation
|
418
|
|
752
|
|
2,402
|
|
|||||
|
Uncertain tax positions
|
—
|
|
—
|
|
(62
|
)
|
|||||
|
Change in state apportionment
|
—
|
|
2,561
|
|
(347
|
)
|
|||||
|
Other
|
1,707
|
|
51
|
|
(53
|
)
|
|||||
|
Provision for income taxes
|
$
|
381
|
|
$
|
181
|
|
$
|
124
|
|
||
At December 31,
2016
, the Company has U.S. federal net operating loss carryforwards of approximately
$239.3 million
. Federal net operating loss carryforwards expire at various dates from
2029 through 2036
. The Company has California net operating loss carryforwards of approximately
$40.6 million
, which expire at various dates from
2017 through 2036
. The Company has Oregon net operating loss carryforwards of approximately
$2.5 million
, which begin to expire at various dates from
2030 through 2031
. The Company has foreign net operating losses of approximately
$35.7 million
. Foreign net operating losses have no expiration date. The Company has California and Oregon research and development tax credit carryforwards of approximately
$6.2 million
and
$0.1 million
, respectively. The California tax credits have no expiration date. The Oregon tax credits begin to
expire in 2020
. The Company also has federal research and development tax credit carryforwards of approximately
$4.8 million
. The federal tax credits expire at various dates from
2027 through 2036
.
Pursuant to Internal Revenue Code (“IRC”) Sections 382 and 383,
annual use of the Company’s net operating loss and research and development credit carryforwards may be limited in the event a cumulative change in ownership of more than 50% occurs within a rolling three-year period
. The analysis was performed for the period through September 15, 2016. The analysis did not identify any events of cumulative change in ownership during the review period. The Company will continue monitoring any future changes in stock ownership.
It is the Company’s intention to reinvest undistributed earnings of its foreign subsidiaries and thereby indefinitely postpone their remittance. Accordingly, no provision has been made for foreign withholding taxes on United States income taxes which may become payable if undistributed earnings of the foreign subsidiary were paid as dividends to the Company.
The Company follows the accounting guidance related to financial statement recognition, measurement and disclosure of uncertain tax positions. The Company recognizes the impact of an uncertain income tax position on an income tax return at the largest amount that is more-likely-than-not to be sustained upon audit by the relevant taxing authority. An uncertain income tax position will not be recognized if it has less than a 50% likelihood of being sustained.
No
income tax benefit was recognized during the years ended December 31,
2016
and
2015
. At December 31,
2016
and
2015
, the Company did not have interest expense related to uncertain tax positions or a liability for unrecognized tax benefits. The Company does not expect changes to its uncertain tax position in the next twelve months.
F-33
INSEEGO CORP.
NOTES TO CONSOLIDATED FINANCIAL STATEMENTS
A reconciliation of the beginning and ending amounts of unrecognized tax benefits is as follows (in thousands):
|
Balance at December 31, 2013
|
$
|
35,500
|
|
|
Increases related to current and prior year tax positions
|
204
|
|
|
|
Settlements and lapses in statutes of limitations
|
(61
|
)
|
|
|
Balance at December 31, 2014
|
35,643
|
|
|
|
Increases related to current and prior year tax positions
|
160
|
|
|
|
Balance at December 31, 2015
|
35,803
|
|
|
|
Increases related to current and prior year tax positions
|
488
|
|
|
|
Balance at December 31, 2016
|
$
|
36,291
|
|
There are no tax benefits that, if recognized, would affect the effective tax rate that are included in the balances of unrecognized tax benefits at December 31,
2016
.
The Company and its subsidiaries file U.S., state, and foreign income tax returns in jurisdictions with various statutes of limitations. The Company is also subject to various federal income tax examinations for the 2003 through 2015 calendar years due to the availability of net operating loss carryforwards. The Company believes appropriate provisions for all outstanding issues have been made for all jurisdictions and all open years. However, because audit outcomes and the timing of audit settlements are subject to significant uncertainty, the Company’s current estimate of the total amounts of unrecognized tax benefits could increase or decrease for all open years.
8
. Stockholders’ Equity
Preferred Stock
The Company has a total of
2,000,000
shares of preferred stock authorized for issuance at a par value of
$0.001
per share.
No
preferred shares are currently issued or outstanding.
Common Shares Reserved for Future Issuance
The Company had reserved shares of common stock for possible future issuance as of December 31,
2016
and
2015
as follows:
|
|
December 31,
|
||||
|
|
2016
|
2015
|
|||
|
Common stock warrants outstanding
|
1,886,630
|
|
1,886,630
|
|
|
|
Stock options outstanding
|
6,356,203
|
|
6,084,836
|
|
|
|
Restricted stock units outstanding
|
2,975,800
|
|
960,203
|
|
|
|
Shares available for issuance pursuant to Novatel Wireless Notes
|
30,000,000
|
|
30,000,000
|
|
|
|
Shares available for future grants of awards under the 2015 Incentive Compensation Plan
|
1,332,035
|
|
1,074,602
|
|
|
|
Shares available for future grants of awards under the 2009 Omnibus Incentive Compensation Plan
|
3,871,666
|
|
3,956,060
|
|
|
|
Shares available under the 2000 Employee Stock Purchase Plan
|
89,676
|
|
879,241
|
|
|
|
Total shares of common stock reserved for issuance
|
46,512,010
|
|
44,841,572
|
|
|
9
. Share-based Compensation
During the year ended
December 31, 2016
, the Company granted awards under the Amended and Restated 2009 Omnibus Incentive Compensation Plan (the “2009 Plan”). The Compensation Committee of the Board of Directors administers the plans.
Under the 2015 Incentive Compensation Plan (the “2015 Plan”) and the 2009 Plan, a maximum of
4,000,000
shares and
15,323,000
shares, respectively, of common stock may be issued upon the exercise of stock options, in the form of restricted stock, or in settlement of restricted stock units or other awards, including awards with alternative vesting schedules such as performance-based criteria.
F-34
INSEEGO CORP.
NOTES TO CONSOLIDATED FINANCIAL STATEMENTS
For the years ended
December 31, 2016
,
2015
and
2014
, the following table presents total share-based compensation expense in each functional line item on the consolidated statements of operations (in thousands):
|
|
Year Ended December 31,
|
||||||||||
|
|
2016
|
2015
|
2014
|
||||||||
|
Cost of revenues
|
$
|
235
|
|
$
|
233
|
|
$
|
5
|
|
||
|
Research and development
|
868
|
|
1,003
|
|
654
|
|
|||||
|
Sales and marketing
|
707
|
|
579
|
|
247
|
|
|||||
|
General and administrative
|
2,778
|
|
2,963
|
|
1,384
|
|
|||||
|
Restructuring charges
|
—
|
|
1,572
|
|
1,298
|
|
|||||
|
Total
|
$
|
4,588
|
|
$
|
6,350
|
|
$
|
3,588
|
|
||
Stock Options
The Compensation Committee of the Board of Directors determines eligibility, vesting schedules and exercise prices for stock options granted. Stock options generally have a term of
ten
years and vest over a
three
- to
four
-year period.
In connection with the acquisition of FW, the Company granted inducement stock options to FW employees to acquire an aggregate of
323,000
shares of the Company’s common stock under the 2009 Plan. The inducement awards became effective upon the closing of the acquisition. These stock options granted to FW employees have an exercise price of
$4.65
per share. The options have a
ten
-year term and will vest over a
four
-year period. In the event of termination of employment, all unvested options will terminate.
In connection with the acquisition of Ctrack, the Company assumed a number of employee stock options granted to both executive and non-executive employees of Ctrack. Under the 2015 Plan, the Company granted stock options to employees of Ctrack to replace the stock options previously granted by DigiCore (the “Replacement Options”). The Company adjusted the exercise price and number of shares originally granted by DigiCore in order to preserve the intrinsic value and stock-exercise ratio of such awards. For Replacement Options granted to executives, the vesting schedule was reset to
four
years and the expiration date was extended to
ten
years from the date of acquisition. For Replacement Options granted to non-executives, the vesting schedule remain unchanged and the expiration date was extended to
ten
years from the date of acquisition.
As a result of the Company granting Replacement Options at an exercise price that preserved the value of the options, these options were valued as in-the-money options. Due to limitations in the Black-Scholes model related to in-the-money options, the Company elected to value the options using the Hull-White I lattice model. The inherent advantage of a lattice model relative to the Black-Scholes model is that option exercises are modeled as being dependent on the evolution of the stock price and not solely on the amount of time that has passed since the grant date. The Hull-White I lattice model uses the same assumptions as the Black-Scholes model except it replaces the expected term with the suboptimal exercise factor and includes an additional assumption regarding the post-vesting termination rate.
Under the 2015 Plan, the Company also granted additional bonus stock options to Ctrack executives with a exercise price equal to the market price on the date of grant, a four-year vesting schedule, and an expiration date that occurs ten years from the acquisition date. The fair value of these options was determined using the Black-Scholes valuation model. No other shares have been granted under the 2015 Plan.
The following table presents the weighted-average assumptions used in the Hull-White I valuation model and the Black-Scholes valuation model by the Company in calculating the fair value of each Replacement Option and executive bonus stock option, respectively, granted under the 2015 Plan for the year ended December 31, 2015:
|
Hull-White I
|
||||||||
|
|
Executive
|
Non-executive
|
Black-Scholes
|
|||||
|
Expected dividend yield
|
—
|
%
|
—
|
%
|
—
|
%
|
||
|
Risk-free interest rate
|
2.1
|
%
|
2.1
|
%
|
1.4
|
%
|
||
|
Volatility
|
64
|
%
|
64
|
%
|
67
|
%
|
||
|
Expected term (in years)
|
n/a
|
|
n/a
|
|
5.0
|
|
||
|
Suboptimal exercise factor
|
2.570
|
|
1.626
|
|
n/a
|
|
||
|
Post-vesting termination rate
|
3
|
%
|
3
|
%
|
n/a
|
|
||
F-35
INSEEGO CORP.
NOTES TO CONSOLIDATED FINANCIAL STATEMENTS
The following table presents the weighted-average assumptions used in the Black-Scholes valuation model by the Company in calculating the fair value of each stock option granted under the 2009 Plan:
|
|
Year Ended December 31,
|
|||||||
|
|
2016
|
2015
|
2014
|
|||||
|
Expected dividend yield
|
—
|
%
|
—
|
%
|
—
|
%
|
||
|
Risk-free interest rate
|
1.7
|
%
|
1.4
|
%
|
1.4
|
%
|
||
|
Volatility
|
79
|
%
|
69
|
%
|
80
|
%
|
||
|
Expected term (in years)
|
5.0
|
|
4.5
|
|
4.6
|
|
||
The weighted-average fair value of stock option awards granted under all plans during the years ended December 31,
2016
,
2015
and
2014
was
$1.05
,
$1.63
and
$1.48
, respectively.
The following table summarizes the Company’s stock option activity under all plans for the years ended December 31,
2016
and
2015
(dollars in thousands, except per share data):
|
Stock
Options Outstanding |
Weighted-Average
Exercise Price Per Option |
Weighted-Average
Remaining Contractual Term (in years) |
Aggregate
Intrinsic Value |
|||||||||
|
Outstanding — December 31, 2014
|
3,064,880
|
|
$
|
5.27
|
|
|||||||
|
Granted
|
6,656,737
|
|
3.02
|
|
||||||||
|
Exercised
|
(273,005
|
)
|
2.26
|
|
||||||||
|
Canceled
|
(3,363,776
|
)
|
5.14
|
|
||||||||
|
Outstanding — December 31, 2015
|
6,084,836
|
|
3.01
|
|
||||||||
|
Granted
|
1,051,550
|
|
1.65
|
|
||||||||
|
Exercised
|
(78,384
|
)
|
1.12
|
|
||||||||
|
Canceled
|
(701,799
|
)
|
4.35
|
|
||||||||
|
Outstanding — December 31, 2016
|
6,356,203
|
|
$
|
2.64
|
|
7.94
|
$
|
3,592
|
|
|||
|
Vested and Expected to Vest — December 31, 2016
|
5,729,553
|
|
$
|
2.72
|
|
7.84
|
$
|
3,180
|
|
|||
|
Exercisable — December 31, 2016
|
2,461,614
|
|
$
|
3.69
|
|
6.58
|
$
|
1,023
|
|
|||
The total intrinsic value of stock options exercised to purchase common stock during the years ended December 31,
2016
,
2015
and
2014
was approximately
$0.1 million
,
$0.9 million
and
$0.1 million
, respectively. As of December 31,
2016
, total unrecognized share-based compensation expense related to non-vested stock options was
$4.1 million
, which is expected to be recognized over a weighted-average period of approximately
2.6
years. The Company recognized approximately
$2.2 million
,
$3.2 million
and
$0.8 million
of share-based compensation expense related to the vesting of stock option awards during the years ended December 31,
2016
,
2015
and
2014
, respectively.
Restricted Stock Units
Pursuant to the 2015 Plan and the 2009 Plan, the Company may issue RSUs that, upon satisfaction of vesting conditions, allow for employees and non-employee directors to receive common stock. Issuances of such awards reduce common stock available under the 2015 Plan and 2009 Plan for stock incentive awards. The Company measures compensation cost associated with grants of RSUs at fair value, which is generally the closing price of the Company’s stock on the date of grant. RSUs generally vest over a
three
- to
four
-year period.
F-36
INSEEGO CORP.
NOTES TO CONSOLIDATED FINANCIAL STATEMENTS
A summary of restricted stock unit activity under all plans for the year ended December 31,
2016
is presented below:
|
Number of Shares
|
Weighted-Average Grant-Date Fair Value
|
|||||
|
Non-vested — December 31, 2015
|
960,203
|
|
$
|
3.39
|
|
|
|
Granted
|
2,914,000
|
|
1.62
|
|
||
|
Vested
|
(461,866
|
)
|
3.30
|
|
||
|
Forfeited
|
(436,537
|
)
|
2.03
|
|
||
|
Non-vested — December 31, 2016
|
2,975,800
|
|
$
|
1.87
|
|
|
During the years ended December 31,
2015
and
2014
, the weighted-average grant-date fair value of RSUs granted was
$4.55
(net of immediately vesting RSUs granted as payment to the Company’s U.S. employees for their retention bonus in the third quarter of 2015) and
$2.16
, respectively. During the years ended December 31,
2016
,
2015
and
2014
, the total fair value of shares vested was
$0.9 million
,
$3.1 million
(net of immediately vesting RSUs granted as payment to the Company’s U.S. employees for their retention bonus in the third quarter of 2015) and
$3.0 million
, respectively.
As of December 31,
2016
, there was
$3.1 million
of unrecognized share-based compensation expense related to non-vested RSUs, which is expected to be recognized over a weighted-average period of
2.7
years. The Company recognized approximately
$2.0 million
,
$2.8 million
and
$2.9 million
of share-based compensation expense related to the vesting of RSUs during the years ended December 31,
2016
,
2015
and
2014
, respectively.
2000 Employee Stock Purchase Plan
The ESPP permits eligible employees of the Company to purchase newly issued shares of common stock, at a price equal to
85%
of the lower of the fair market value on (i) the first day of the offering period or (ii) the last day of each
six
-month purchase period, through payroll deductions of up to
10%
of their annual cash compensation. Under the ESPP, a maximum of
4,074,000
shares of common stock may be purchased by eligible employees.
The Company terminated the ESPP in 2012 due to a lack of available shares but subsequently reinstated the ESPP in August 2014. During the years ended December 31,
2016
,
2015
and
2014
, the Company issued
789,565
shares,
506,100
shares and
114,791
shares, respectively, under the ESPP. The Company recognized approximately
$0.4 million
,
$0.4 million
and
$0.1 million
of share-based compensation expense related to the ESPP during the years ended December 31,
2016
,
2015
and
2014
, respectively.
10
. Earnings Per Share
Basic earnings per share (“EPS”) excludes dilution and is computed by dividing net income (loss) attributable to common shareholders by the weighted-average number of common shares outstanding for the period. Diluted EPS reflects the potential dilution that could occur if securities or other contracts to issue common stock were exercised or converted into common stock using the treasury stock method. Potentially dilutive securities (consisting of warrants, stock options and RSUs calculated using the treasury stock method) are excluded from the diluted EPS computation in loss periods and when the applicable exercise price is greater than the market price on the period end date as their effect would be anti-dilutive.
The calculation of basic and diluted earnings per share was as follows (in thousands, except share and per share data):
|
|
Year Ended December 31,
|
||||||||||
|
|
2016
|
2015
|
2014
|
||||||||
|
Net loss attributable to common shareholders
|
$
|
(60,573
|
)
|
$
|
(52,286
|
)
|
$
|
(39,674
|
)
|
||
|
Weighted-average common shares outstanding
|
53,911,270
|
|
52,767,230
|
|
37,958,846
|
|
|||||
|
Basic and diluted net loss per share attributable to common shareholders
|
$
|
(1.12
|
)
|
$
|
(0.99
|
)
|
$
|
(1.05
|
)
|
||
For the years ended
December 31, 2016
,
2015
and
2014
the computation of diluted EPS excluded
11,218,633
shares,
8,931,669
shares and
8,810,706
shares, respectively, related to warrants, stock options and RSUs as their effect would have been anti-dilutive.
F-37
INSEEGO CORP.
NOTES TO CONSOLIDATED FINANCIAL STATEMENTS
11
. Securities Purchase Agreement and Warrant Issues
On September 3, 2014, the Company entered into a Purchase Agreement (the “Purchase Agreement”) with HC2 Holdings 2, Inc., a Delaware corporation (the “Investor”), pursuant to which, on September 8, 2014, the Company sold to the Investor (i)
7,363,334
shares of the Company’s common stock, par value
$0.001
per share, (ii) a warrant to purchase
4,117,647
shares of the Company’s common stock at an exercise price of
$2.26
per share (the “2014 Warrant”) and (iii)
87,196
shares of the Company’s Series C Convertible Preferred Stock, par value
$0.001
per share (the “Series C Preferred Stock”), all at a purchase price of (a)
$1.75
per share of common stock plus, in each case, the related 2014 Warrant and (b)
$17.50
per share of Series C Preferred Stock, for aggregate gross proceeds of approximately
$14.4 million
(collectively, the “Financing”).
Due to insufficient authorized shares to satisfy the exercise of the instrument in full at the time of issuance, the Company determined that the instrument should be treated as a derivative instrument as of September 30, 2014. Liability classification was required because share settlement was not within the control of the Company and the 2014 Warrant was not considered to be “indexed to the company’s own stock” and therefore did not qualify for the exemptions provided by ASC 815,
Derivatives and Hedges
(“ASC 815”). As such the warrants were recorded at fair value with any changes in fair value being recognized in earnings.
On November 17, 2014 (the “Approval Date”), at a Special Meeting of the Stockholders, the Company received stockholder approval to increase the number of authorized shares of the Company’s common stock. With this approval, the Company had a sufficient amount of authorized shares to satisfy the exercise of the instrument in full. As a result, the Company performed a final re-measurement of the 2014 Warrant to fair value and then reclassified the fair value to additional paid-in capital.
Because the 2014 Warrant had no comparable market data to determine fair value, the Company hired an independent valuation firm to assist with the valuation of the 2014 Warrant at the measurement date and as of the Approval Date. The primary factors used to determine the fair value included: (i) the fair value of the Company’s common stock; (ii) the volatility of the Company’s common stock; (iii) the risk free interest rate; (iv) the estimated likelihood and timing of exercise; and (v) the estimated likelihood and timing of a future financing arrangement. Increases in the market value of the Company’s common stock and volatility, which have the most impact on the fair value of the 2014 Warrant, would cause the fair value of the 2014 Warrant to change. While classified as a liability, the 2014 Warrant was measured at fair value on a recurring basis and any unrealized losses were recognized in earnings as other expense. During the year ended December 31, 2014, the Company recorded a change in fair value of
$3.3 million
related to the 2014 Warrant, primarily as a result of an increase in the market value of the Company’s common stock.
The following table shows the change to the fair value of the 2014 Warrant during the year ended December 31, 2014 (in thousands):
|
Balance at September 8, 2014 (Transaction Date)
|
$
|
4,939
|
|
|
|
Change in fair value
|
3,280
|
|
||
|
Balance at November 17, 2014 (Approval Date)
|
8,219
|
|
||
|
Reclassification to additional paid-in-capital
|
(8,219
|
)
|
||
|
Balance at December 31, 2014
|
$
|
—
|
|
|
On March 26, 2015, the Investor exercised a portion of the 2014 Warrant to purchase
3,824,600
shares of the Company’s common stock at an exercise price of
$2.26
per share for total proceeds of
$8.6 million
.
On March 26, 2015, in order to induce the Investor to exercise the 2014 Warrant for cash in connection with the acquisition of FW, the Company issued to the Investor a new warrant (the “2015 Warrant”) to purchase
1,593,583
shares of the Company’s common stock at an exercise price of
$5.50
per share.
The 2015 Warrant will be exercisable into shares of the Company’s common stock during the period commencing on September 26, 2015 and ending on March 26, 2020, the expiration date of the 2015 Warrant. The 2015 Warrant will generally only be exercisable on a cash basis; provided, however, that the 2015 Warrant may be exercised on a cashless basis if and only if a registration statement relating to the issuance of the shares underlying the 2015 Warrant is not then effective or an exemption from registration is not available for the resale of such shares. The 2015 Warrant may be exercised by surrendering to the Company the certificate evidencing the 2015 Warrant to be exercised with the accompanying exercise notice, appropriately completed, duly signed and delivered, together with cash payment of the exercise price, if applicable.
F-38
INSEEGO CORP.
NOTES TO CONSOLIDATED FINANCIAL STATEMENTS
The Company reviewed the terms of the 2015 Warrant to determine whether or not it met the criteria of a derivative instrument under ASC 815. Pursuant to this guidance, the Company has determined that the 2015 Warrant does not require liability accounting and has classified the warrant as equity.
Because the 2015 Warrant has no comparable market data to determine fair value, the Company hired an independent valuation firm to assist with the valuation of the 2015 Warrant at March 26, 2015, the issuance date of the warrant. The primary factors used to determine the fair value include: (i) the fair value of the Company’s common stock; (ii) the volatility of the Company’s common stock; (iii) the risk free interest rate and (iv) the estimated likelihood and timing of exercise.
The 2015 Warrant was issued in connection with the cash exercise of the 2014 Warrant, and accordingly, the fair value of the 2015 Warrant of
$3.5 million
was considered cost of capital and netted against the $8.6 million aggregate proceeds received from the exercise of the 2014 Warrant.
Contingently Redeemable Convertible Series C Preferred Stock
In connection with the Financing the Company issued
87,196
shares of Series C Preferred Stock at
$17.50
per share, initially convertible, subject to adjustments, into
871,960
shares of common stock.
On November 17, 2014, at a Special Meeting of the Stockholders, the Company received stockholder approval to increase the number of authorized shares of the Company’s common stock from
50,000,000
shares to
100,000,000
shares and each share of Series C Preferred Stock then outstanding automatically converted into
ten
shares of common stock. Upon conversion, the Company reclassified the Series C Preferred Stock out of mezzanine equity into permanent equity and recognized a beneficial conversion feature (“BCF”) of
$0.4 million
in equity due to the resolution of the contingent BCF embedded within the Series C Preferred Stock.
12
. Commitments and Contingencies
Capital Leases
The Company has vehicles and equipment under capital leases that were assumed through its acquisitions of Ctrack. The future minimum payments under capital leases were as follows at December 31,
2016
(in thousands):
|
2017
|
$
|
952
|
|
|
2018
|
509
|
|
|
|
2019
|
506
|
|
|
|
Total minimum capital lease payments
|
1,967
|
|
|
|
Less: amounts representing interest
|
(235
|
)
|
|
|
Present value of net minimum capital lease payments
|
1,732
|
|
|
|
Less: current portion
|
(465
|
)
|
|
|
Long-term portion
|
$
|
1,267
|
|
Operating Leases
The Company leases its office space and certain equipment under non-cancellable operating leases with various terms through 2020. The minimum annual rent on the Company’s office space is subject to increases based on stated rental adjustment terms, property taxes and operating costs and contains rent concessions. For financial reporting purposes, rent expense is recognized on a straight-line basis over the term of the lease. Accordingly, rent expense recognized in excess of rent paid is reflected as deferred rent. During the years ended December 31,
2016
,
2015
and
2014
, rent expense under operating leases was
$4.1 million
,
$3.3 million
and
$3.0 million
, respectively. The Company’s office space lease contains incentives in the form of reimbursement from the landlord for a portion of the costs of leasehold improvements incurred by the Company which are recorded to rent expense on a straight-line basis over the term of the lease.
F-39
INSEEGO CORP.
NOTES TO CONSOLIDATED FINANCIAL STATEMENTS
The future minimum payments under non-cancellable operating leases were as follows at December 31,
2016
(in thousands):
|
2017
|
$
|
3,082
|
|
|
2018
|
2,469
|
|
|
|
2019
|
2,006
|
|
|
|
2020
|
329
|
|
|
|
Total
|
$
|
7,886
|
|
Employee Retention Matters
In connection with the Company’s turnaround efforts, and to retain and encourage employees to assist the Company with its efforts, the Company’s Compensation Committee approved an all-employee retention bonus plan in 2014 (“2014 Retention Bonus Plan”) based on achieving certain financial and cash targets. The financial metrics had to be met for
two
consecutive quarter periods during the three quarter periods ending March 31, 2015. At December 31, 2014, the Company accrued approximately
$5.5 million
of the maximum total target bonus expense based on the Company’s financial results for the quarter ended December 31, 2014 and the assessment of the probability of the achievement of the remaining metrics in March 31, 2015. The total bonus expense of approximately
$10.7 million
was recognized over the requisite service period,
$5.2 million
of which was recognized during the year ended December 31, 2015. In the third quarter of 2015, the Company paid U.S. employees their bonuses with
2,158,436
net shares of the Company’s common stock. Non-U.S. employees receive cash bonus payments.
Legal
The Company is, from time to time, party to various legal proceedings arising in the ordinary course of business. The Company records a loss when information indicates that a loss is both probable and estimable. Where a liability is probable and there is a range of estimated loss with no best estimate in the range, the Company records the minimum estimated liability related to the claim. As additional information becomes available, the Company assesses the potential liability related to the Company’s pending litigation and revises its estimates, if necessary. The Company expenses litigation costs as incurred.
The Company is currently named as a defendant or co-defendant in some patent infringement lawsuits in the United States and is indirectly participating in other U.S. patent infringement actions pursuant to its contractual indemnification obligations to certain customers. Based on an evaluation of these matters and discussions with the Company’s intellectual property litigation counsel, the Company believes that liabilities arising from or sums paid in settlement of these existing matters would not have a material adverse effect on its consolidated results of operations or financial condition, other than those discussed below.
On September 15, 2008 and September 18, 2008, two putative securities class action lawsuits were filed in the U.S. District Court for the Southern District of California (the “Court”) on behalf of alleged stockholders of the Company. On December 11, 2008, these lawsuits were consolidated into a single action and in May 2010, the consolidated lawsuits were captioned the case
In re Novatel Wireless Securities Litigation
(the “Litigation”). The Litigation was filed on behalf of persons who purchased the Company’s common stock between February 27, 2007 and September 15, 2008.
On June 23, 2014, the Court entered its judgment approving a final settlement agreement with respect to the Litigation. The settlement agreement does not admit any liability, and the Company and the individual defendants continue to deny any and all liability. Under the terms of the settlement agreement, the plaintiff class agreed to settle all claims asserted in the Litigation and granted the defendants and released parties a full and complete release in exchange for (i) a cash payment of
$6.0 million
to the plaintiff’s class, approximately
$1.7 million
of which was to be funded by the Company’s insurers, (ii) the issuance of unrestricted and freely tradable shares of the Company’s stock with an aggregate value of
$5.0 million
and (iii) the issuance of a
$5.0 million
secured promissory note, which such note shall have a
30
-month maturity, carrying interest at
5%
per annum, payable quarterly, and being secured by the accounts receivable of the Company.
On July 1, 2014, the Company and the individual defendants filed a motion to amend the judgment entered on June 23, 2014, specifically requesting the Court to amend the effective date of such judgment to June 20, 2014, the date the court held the final approval hearing. The Court granted this motion on July 8, 2014, and the judgment date was deemed entered on June 20, 2014.
On July 8, 2014, the Company funded the cash portion of the settlement with
$4.3 million
of Company cash and
$1.7 million
previously funded into escrow by the Company’s insurers. On July 17, 2014, the Company issued
F-40
INSEEGO CORP.
NOTES TO CONSOLIDATED FINANCIAL STATEMENTS
2,407,318
unrestricted shares of the Company’s common stock to the class members in satisfaction of the
$5.0 million
stock payment. The Company also issued a
$5.0 million
secured promissory note on July 8, 2014, which was paid off by the Company during the fourth quarter of 2014.
On November 17, 2014, the Court granted Plaintiff’s motion to enforce the Settlement and the Court agreed with the Plaintiffs to use an intra-day trading price of the Company’s stock for valuation purposes and not the closing price, and accordingly, the Company owed
$0.8 million
which was paid by the Company on December 16, 2014.
As of December 31, 2015, there were no further liabilities accrued in connection with the Litigation.
On May 27, 2015, a patent infringement action was brought against Novatel Wireless and its customers, AT&T and Verizon Wireless, in the Southern District of Florida by Carucel Investments, L.P. (“Carucel”), a non-practicing entity (
Carucel Investments, L.P. v. Novatel Wireless, Inc., et al., U.S.D.C. S.D. Florida, Civil Action No. 0:15-cv-61116-BB
). The complaint alleges that certain MiFi mobile hotspots manufactured by Novatel Wireless infringe claims of patents owned by Carucel. Venue in the case was subsequently transferred to the Court, and AT&T was later dismissed as a defendant. The litigation is proceeding against Novatel Wireless and Verizon Wireless, and a jury trial is scheduled for April 2017. Carucel is currently seeking royalty damages of approximately
$43 million
, and the Company has certain indemnification obligations with respect to Verizon Wireless. As this case has approached trial, over the past five months Carucel has significantly increased the amount of damages it is seeking. Novatel Wireless does not believe its MiFi mobile hotspot devices infringe any valid claim in Carucel’s patents, and does not believe that the damages sought in this case represent reasonable royalty amounts even if such infringement existed. Novatel Wireless has vigorously denied any liability. However, there can be no assurance as to the ultimate outcome of this litigation, and an adverse judgment could have a material adverse effect on our business, results of operations, financial condition and cash flows. The Company determined that a loss is neither probable nor estimable and therefore a liability related to this case has not been recorded.
On September 26, 2016, the Company settled a breach of contract claim alleging that the Company had failed to pay certain royalties on hardware products sold by its subsidiary, Enfora, Inc. Under the terms of the settlement agreement, the Company is required to pay an aggregate settlement amount of
$2.8 million
,
$2.1 million
of which remained outstanding as of
December 31, 2016
and is included in accrued expenses and other current liabilities and in other long-term liabilities in the consolidated balance sheets, and is payable in
eight
equal quarterly installments. The contract underlying the claim has now been terminated.
13
.
Geographic Information and Concentrations of Risk
Geographic Information
The following table details the geographic concentration of the Company’s assets (in thousands):
|
|
December 31,
|
||||||
|
|
2016
|
2015
|
|||||
|
United States and Canada
|
$
|
71,564
|
|
$
|
112,424
|
|
|
|
South Africa
|
63,693
|
|
60,580
|
|
|||
|
Other
|
23,459
|
|
25,749
|
|
|||
|
$
|
158,716
|
|
$
|
198,753
|
|
||
The following table details the geographic concentration of the Company’s net revenues based on shipping destination:
|
|
Year Ended December 31,
|
|||||||
|
|
2016
|
2015
|
2014
|
|||||
|
United States and Canada
|
72.9
|
%
|
89.1
|
%
|
91.2
|
%
|
||
|
South Africa
|
16.6
|
|
4.6
|
|
—
|
|
||
|
Other
|
10.5
|
|
6.3
|
|
8.8
|
|
||
|
100.0
|
%
|
100.0
|
%
|
100.0
|
%
|
|||
F-41
INSEEGO CORP.
NOTES TO CONSOLIDATED FINANCIAL STATEMENTS
Concentrations of Risk
For the years ended December 31,
2016
,
2015
and
2014
, one customer accounted for
53.9%
,
53.6%
and
51.6%
of net revenues, respectively. At December 31,
2016
and
2015
, one customer accounted for
42.8%
and
17.4%
of total accounts receivable, respectively.
14
. Retirement Savings Plan
The Company has a defined contribution 401(k) retirement savings plan (the “Plan”). Substantially all of the Company’s U.S. employees are eligible to participate in the Plan after meeting certain minimum age and service requirements. The Company suspended the employer matching program on August 1, 2014. Effective January 1, 2016, the Company reinstated the employer matching program and matches
50%
of the first
6%
of an employee’s designated deferral of their eligible compensation. Employees may make discretionary contributions to the Plan subject to Internal Revenue Service limitations. Employer matching contributions under the Plan amounted to approximately
$0.6 million
and
$0.6 million
for the years ended December 31,
2016
and
2014
, respectively. Employer matching contributions vested over a
two
-year period prior to January 1, 2016 and vest immediately beginning January 1, 2016.
15
. Restructuring
In September 2013, the Company commenced certain restructuring initiatives including the closure of the Company’s development site in Calgary, Canada, and the consolidation of certain supply chain management activities (the “2013 Initiatives”). The 2013 Initiatives cost a total of approximately
$6.6 million
and were completed in December 2016.
In August 2015, the Company approved a restructuring initiative to better position the Company to operate in current market conditions and more closely align operating expenses with revenues, which included employee severance costs and facility exit related costs. In the fourth quarter of 2015, the Company commenced certain initiatives relating to the reorganization of executive level management, which included, among other actions, the replacement of the former Chief Executive Officer (collectively, the “2015 Initiatives”). The Company continued these initiatives in 2016 with a reduction-in-force and the completion of the closure of its facility in Richardson, TX. The 2015 Initiatives are expected to cost a total of approximately
$5.0 million
and be completed when the Richardson, TX lease expires in June 2020.
In April 2016, the Company commenced certain restructuring initiatives to consolidate the operations of Ctrack with those of the Company, including the closure of the Company’s manufacturing operations in Durban, South Africa resulting in a reduction-in-force. In July 2016, the Company commenced certain restructuring initiatives intended to improve its strategic focus on its most profitable business lines while de-prioritizing certain hardware-only product lines to non-carrier customers, including a reduction-in-force (collectively with the Durban facility closure, the “2016 Initiatives”). The 2016 Initiatives cost a total of approximately
$1.0 million
and were completed in December 2016.
The following table sets forth activity in the restructuring liability for the year ended
December 31, 2016
(in thousands):
|
Balance at December 31, 2015
|
Costs Incurred
|
Payments
|
Non-cash
|
Translation Adjustment
|
Balance at December 31, 2016
|
Cumulative Costs Incurred to Date
|
||||||||||||||||||||||
|
2013 Initiatives
|
||||||||||||||||||||||||||||
|
Employee Severance Costs
|
$
|
—
|
|
$
|
—
|
|
$
|
—
|
|
$
|
—
|
|
$
|
—
|
|
$
|
—
|
|
$
|
3,986
|
|
|||||||
|
Facility Exit Related Costs
|
72
|
|
5
|
|
(77
|
)
|
—
|
|
—
|
|
—
|
|
2,630
|
|
||||||||||||||
|
2015 Initiatives
|
||||||||||||||||||||||||||||
|
Employee Severance Costs
|
1,330
|
|
539
|
|
(1,428
|
)
|
—
|
|
14
|
|
455
|
|
4,130
|
|
||||||||||||||
|
Facility Exit Related Costs
|
328
|
|
485
|
|
(384
|
)
|
159
|
|
—
|
|
588
|
|
866
|
|
||||||||||||||
|
2016 Initiatives
|
||||||||||||||||||||||||||||
|
Employee Severance Costs
|
—
|
|
958
|
|
(958
|
)
|
—
|
|
—
|
|
—
|
|
958
|
|
||||||||||||||
|
Total
|
$
|
1,730
|
|
$
|
1,987
|
|
$
|
(2,847
|
)
|
$
|
159
|
|
$
|
14
|
|
$
|
1,043
|
|
$
|
12,570
|
|
|||||||
F-42
INSEEGO CORP.
NOTES TO CONSOLIDATED FINANCIAL STATEMENTS
The balance of the restructuring liability at
December 31, 2016
consists of approximately
$0.8 million
included in accrued expenses and other current liabilities in the consolidated balance sheet and approximately
$0.2 million
included in long-term liabilities in the consolidated balance sheet.
In the fourth quarter of 2016, the Company wrote down the value of certain inventory by approximately
$11.5 million
related to the abandonment of certain Enfora product lines that management decided to exit. The Company accounted for the adjustment in accordance with the ASC 330,
Inventory
, and included the adjustment in impairment of abandoned product line within cost of net revenues in the consolidated statements of operations
.
In February 2017, subsequent to the balance sheet date, the Company commenced certain restructuring initiatives intended to continue to improve its strategic focus on its most profitable business lines and consolidate operations of its subsidiaries with those of the Company, including a reduction-in-force (the “2017 Initiative”). The 2017 Initiative is expected to cost a total of approximately
$0.9 million
and be completed in September 2017.
16
. Quarterly Financial Information (Unaudited)
The following is a summary of unaudited quarterly results of operations for the years ended December 31,
2016
and
2015
:
|
|
2016
|
||||||||||||||
|
|
First Quarter
|
Second Quarter
|
Third Quarter
|
Fourth Quarter
|
|||||||||||
|
|
(in thousands, except per share amounts)
|
||||||||||||||
|
Net revenues
|
$
|
66,944
|
|
$
|
62,811
|
|
$
|
60,881
|
|
$
|
52,919
|
|
|||
|
Gross profit
|
21,183
|
|
23,238
|
|
22,924
|
|
8,983
|
|
|||||||
|
Net loss attributable to common shareholders
|
(11,904
|
)
|
(2,701
|
)
|
(18,567
|
)
|
(27,401
|
)
|
|||||||
|
Basic and diluted net loss per share attributable to common shareholders
|
$
|
(0.22
|
)
|
$
|
(0.05
|
)
|
$
|
(0.34
|
)
|
$
|
(0.50
|
)
|
|||
|
2015
|
|||||||||||||||
|
First Quarter
|
Second Quarter
|
Third Quarter
|
Fourth Quarter
|
||||||||||||
|
(in thousands, except per share amounts)
|
|||||||||||||||
|
Net revenues
(1)
|
$
|
53,494
|
|
$
|
51,667
|
|
$
|
54,267
|
|
$
|
61,514
|
|
|||
|
Gross profit
|
12,634
|
|
15,323
|
|
14,468
|
|
16,528
|
|
|||||||
|
Net loss attributable to common shareholders
|
(7,826
|
)
|
(9,220
|
)
|
(20,847
|
)
|
(14,393
|
)
|
|||||||
|
Basic and diluted net loss per share attributable to common shareholders
|
$
|
(0.17
|
)
|
$
|
(0.17
|
)
|
$
|
(0.38
|
)
|
$
|
(0.26
|
)
|
|||
|
(1)
|
Net revenues for the second and third quarter of 2015 have been retrospectively revised by
$3.1 million
and
$0.3 million
, respectively, to correct an immaterial error of certain contra revenue, previously reported within costs of net revenues, as a decrease to net revenues.
|
F-43
INSEEGO CORP.
SCHEDULE II—Valuation and Qualifying Accounts
(in thousands)
|
Balance At Beginning of Year
|
Additions Charged to Operations
|
Deductions
|
Effect of Change in Foreign Currency Exchange Rates
|
Balance At End of Year
|
|||||||||||||||
|
Allowance for Doubtful Accounts:
|
|||||||||||||||||||
|
December 31, 2016
|
$
|
601
|
|
$
|
1,136
|
|
$
|
(112
|
)
|
$
|
35
|
|
$
|
1,660
|
|
||||
|
December 31, 2015
|
217
|
|
422
|
|
(38
|
)
|
—
|
|
601
|
|
|||||||||
|
December 31, 2014
|
2,449
|
|
86
|
|
(2,318
|
)
|
—
|
|
217
|
|
|||||||||
|
Reserve for Excess and Obsolete Inventory:
|
|||||||||||||||||||
|
December 31, 2016
|
4,169
|
|
14,797
|
|
(4,961
|
)
|
34
|
|
14,039
|
|
|||||||||
|
December 31, 2015
|
5,468
|
|
1,043
|
|
(2,342
|
)
|
—
|
|
4,169
|
|
|||||||||
|
December 31, 2014
|
8,132
|
|
3,382
|
|
(6,046
|
)
|
—
|
|
5,468
|
|
|||||||||
|
Deferred Tax Asset Valuation Allowance:
|
|||||||||||||||||||
|
December 31, 2016
|
94,984
|
|
19,341
|
|
—
|
|
94
|
|
114,419
|
|
|||||||||
|
December 31, 2015
|
90,774
|
|
17,903
|
|
(13,693
|
)
|
—
|
|
94,984
|
|
|||||||||
|
December 31, 2014
|
79,458
|
|
11,316
|
|
—
|
|
—
|
|
90,774
|
|
|||||||||
F-44
TABLE OF CONTENTS
Part IItem 1. BusinessItem 1A. Risk FactorsItem 1B. Unresolved Staff CommentsItem 2. PropertiesItem 3. Legal ProceedingsItem 4. Mine Safety DisclosuresPart IIItem 5. Market For Registrant S Common Equity, Related Stockholder Matters and Issuer Purchases Of Equity SecuritiesItem 6. Selected Financial DataItem 7. Management S Discussion and Analysis Of Financial Condition and Results Of OperationsItem 7A. Quantitative and Qualitative Disclosures About Market RiskItem 8. Financial Statements and Supplementary DataItem 9. Changes in and Disagreements with Accountants on Accounting and Financial DisclosureItem 9A. Controls and ProceduresItem 9B. Other InformationPart IIIPart IVItem 15. Exhibits and Financial Statement SchedulesItem 16. Form 10-k Summary