INTEL CORP
10-Ks and 10-Qs
|
|
|
|
|
|
|
|
|
|
|
|
|
|
|
|
|
|
|
|
|
|
|
|
|
|
|
|
|
|
|
|
|
|
|
|
|
|
|
|
|
|
|
|
|
|
|
|
|
|
|
|
|
UNITED STATES SECURITIES AND EXCHANGE COMMISSION
Washington, D.C. 20549
FORM 10-K
(Mark One)
|
x
|
ANNUAL REPORT PURSUANT TO SECTION 13 OR 15(d) OF THE SECURITIES EXCHANGE ACT OF 1934
|
|
For the fiscal year ended December 28, 2013.
|
|
|
or
|
|
|
¨
|
TRANSITION REPORT PURSUANT TO SECTION 13 OR 15(d) OF THE SECURITIES EXCHANGE ACT OF 1934
|
|
For the transition period from
to
.
|
|
Commission File Number 000-06217

INTEL CORPORATION
(Exact name of registrant as specified in its charter)
|
Delaware
|
94-1672743
|
|
|
State or other jurisdiction of
incorporation or organization
|
(I.R.S. Employer
Identification No.)
|
|
|
2200 Mission College Boulevard, Santa Clara, California
|
95054-1549
|
|
|
(Address of principal executive offices)
|
(Zip Code)
|
|
Registrant’s telephone number, including area code
(408) 765-8080
Securities registered pursuant to Section 12(b) of the Act:
|
Title of each class
|
Name of each exchange on which registered
|
|
|
Common stock, $0.001 par value
|
The NASDAQ Global Select Market*
|
|
Securities registered pursuant to Section 12(g) of the Act:
None
Indicate by check mark if the registrant is a well-known seasoned issuer, as defined in Rule 405 of the Securities Act. Yes
x
No
¨
Indicate by check mark if the registrant is not required to file reports pursuant to Section 13 or Section 15(d) of the Act. Yes
¨
No
x
Indicate by check mark whether the registrant (1) has filed all reports required to be filed by Section 13 or 15(d) of the Securities Exchange Act of 1934 during the preceding 12 months (or for such shorter period that the registrant was required to file such reports), and (2) has been subject to such filing requirements for the past 90 days. Yes
x
No
¨
Indicate by check mark whether the registrant has submitted electronically and posted on its corporate Web site, if any, every Interactive Data File required to be submitted and posted pursuant to Rule 405 of Regulation S-T (§ 232.405 of this chapter) during the preceding 12 months (or for such shorter period that the registrant was required to submit and post such files). Yes
x
No
¨
Indicate by check mark if disclosure of delinquent filers pursuant to Item 405 of Regulation S-K (§229.405 of this chapter) is not contained herein, and will not be contained, to the best of registrant’s knowledge, in definitive proxy or information statements incorporated by reference in Part III of this Form 10-K or any amendment to this Form 10-K.
¨
Indicate by check mark whether the registrant is a large accelerated filer, an accelerated filer, a non-accelerated filer, or a smaller reporting company. See the definitions of “large accelerated filer,” “accelerated filer” and “smaller reporting company” in Rule 12b-2 of the Exchange Act.
|
Large accelerated filer
x
|
Accelerated filer
¨
|
Non-accelerated filer
¨
|
Smaller reporting company
¨
|
|||
|
|
(Do not check if a smaller reporting company)
|
|||||
Indicate by check mark whether the registrant is a shell company (as defined in Rule 12b-2 of the Act). Yes
¨
No
x
Aggregate market value of voting and non-voting common equity held by non-affiliates of the registrant as of
June 28, 2013
, based upon the closing price of the common stock as reported by The NASDAQ Global Select Market* on such date, was
$120.6 billion
4,972 million
shares of common stock outstanding as of
February 7, 2014
DOCUMENTS INCORPORATED BY REFERENCE
Portions of the registrant’s Proxy Statement related to its
2014
Annual Stockholders’ Meeting to be filed subsequently are incorporated by reference into Part III of this Annual Report on Form 10-K. Except as expressly incorporated by reference, the registrant’s Proxy Statement shall not be deemed to be part of this report.
INTEL CORPORATION
FORM 10-K
FOR THE FISCAL YEAR ENDED
DECEMBER 28, 2013
INDEX
|
|
Page
|
|
|
Item 1.
|
||
|
Item 1A.
|
||
|
Item 1B.
|
||
|
Item 2.
|
||
|
Item 3.
|
||
|
Item 4.
|
||
|
Item 5.
|
||
|
Item 6.
|
||
|
Item 7.
|
||
|
Item 7A.
|
||
|
Item 8.
|
||
|
Item 9.
|
||
|
Item 9A.
|
||
|
Item 9B.
|
||
|
Item 10.
|
||
|
Item 11.
|
||
|
Item 12.
|
||
|
Item 13.
|
||
|
Item 14.
|
||
|
Item 15.
|
||
|
ITEM 1.
|
BUSINESS
|
Company Overview
We design and manufacture advanced integrated digital technology platforms. A platform consists of a microprocessor and chipset, and may be enhanced by additional hardware, software, and services. We sell these platforms primarily to original equipment manufacturers (OEMs), original design manufacturers (ODMs), and industrial and communications equipment manufacturers in the computing and communications industries. Our platforms are used in a wide range of computing applications, such as notebooks (including Ultrabook™ devices and 2 in 1 systems), desktops, servers, tablets, smartphones, automobile infotainment systems, automated factory systems, and medical devices. We also develop and sell software and services primarily focused on security and technology integration. We were incorporated in California in 1968 and reincorporated in Delaware in 1989.
Company Strategy
Our goal is to be the preeminent computing solutions company that powers the worldwide digital economy. Over time, the number of devices connected to the Internet and each other has grown from hundreds of millions to billions, and the variety of devices also continues to increase. The combination of embedding computing into devices and connecting them to the Internet, known as the Internet of Things, as well as a build-out of the cloud infrastructure supporting these devices is driving fundamental changes in the computing industry. As a result, we are transforming our primary focus from the design and manufacture of semiconductor chips for personal computing (PC) and servers to the delivery of solutions consisting of hardware and software platforms and supporting services across a wide range of computing devices. Examples of these solutions can be seen across the computing continuum, from the teraflops of operations per second for high performance computing (HPC) to the milliwatts of energy consumed by an embedded application. Additionally, computing is becoming an increasingly mobile, personal, and ubiquitous experience. End users value consistency across devices that connect seamlessly and securely to the Internet and to each other. We enable this experience by innovating around energy-efficient performance, connectivity, and security.
To succeed in this changing computing environment, we have the following key objectives:
|
•
|
strive to ensure that Intel
®
technology is the best choice for any computing device, including PCs, data centers, cloud computing, ultra-mobile devices, and wearables;
|
|
•
|
be the platform of choice for any operating system;
|
|
•
|
maximize and extend our manufacturing technology leadership;
|
|
•
|
extend to adjacent services such as security, cloud, and foundry;
|
|
•
|
expand platforms into adjacent market segments to bring compelling new System-on-Chip (SoC) solutions and user experiences to ultra-mobile form factors including smartphones and tablets, as well as notebooks (including Ultrabook devices and 2 in 1 systems), embedded systems, and microserver applications;
|
|
•
|
develop platforms to enable devices that connect to the Internet of Things and to each other to create a computing continuum offering consumers a set of secure, consistent, engaging, and personalized forms of computing; and
|
|
•
|
strive to lower the footprint of our products and operations as well as be an asset to the communities we work in.
|
1
We use our core assets to meet these objectives. Our core assets include our silicon and manufacturing technology leadership, our architecture and platforms, our software and services, our security solutions, our customer orientation, our strategic investments, and our corporate stewardship. We believe that applying these core assets to our key objectives provides us with the scale, capacity, and global reach to establish new technologies and respond to customers’ needs quickly. Our core assets and key objectives include the following:
|
•
|
Silicon and Manufacturing Technology Leadership.
We have long been a leader in silicon process technology and manufacturing, and we aim to continue our lead through investment and innovation in this critical area. We drive a regular two-year upgrade cycle—introducing a new microarchitecture approximately every two years and ramping the next generation of silicon process technology in the intervening years. We refer to this as our “tick-tock” technology development cadence. With our continued focus on silicon and manufacturing technology leadership, we are collaborating on the development of 450-millimeter (mm) wafer technology and extreme ultraviolet lithography (EUV). We expect larger silicon wafers and enhanced lithography technologies with EUV to allow Moore’s Law to continue. Moore’s Law predicted that transistor density on integrated circuits would double about every two years. We aim to have the best process technology, and unlike many semiconductor companies, we primarily manufacture our products in our own facilities. This in-house manufacturing capability allows us to optimize performance, shorten our time to market, and scale new products more rapidly. We believe this competitive advantage will be extended in the future as the costs to build leading-edge fabrication facilities increase, and as fewer semiconductor companies will be able to combine platform design and manufacturing.
|
|
•
|
Architecture and Platforms.
We are developing a wide range of solutions for devices that span the computing continuum and allow for computing experiences from notebooks (including Ultrabook devices and 2 in 1 systems), desktops, tablets, and smartphones to in-vehicle infotainment systems and beyond. We believe that users want consistent computing experiences and interoperable devices and that users and developers value consistency of architecture. This provides a common framework that results in shortened time to market, and the ability to leverage technologies across multiple form factors. We believe that we can meet the needs of users and developers to offer computing solutions across the computing continuum through our partnership with the industry on open, standards-based platform innovation around Intel
®
architecture. We continue to invest in improving Intel architecture to deliver increased value to our customers and expand the capabilities of the architecture in adjacent market segments. For example, we focus on delivering improved energy-efficient performance, which involves balancing higher performance with lower power consumption. In addition, we are focusing on perceptual computing, which brings exciting user experiences through devices that sense and perceive the user’s actions.
|
|
•
|
Software and Services.
We offer software and services that provide solutions through a combination of hardware and software for consumer, ultra-mobile, and corporate environments. Additionally, we seek to enable and advance the computing ecosystem by providing development tools and support to help software developers create software applications and operating systems that take advantage of our platforms. We seek to expedite growth in various market segments, such as the embedded market segment, through our software offerings. We continue to collaborate with companies to develop software platforms optimized for our Intel processors and that support multiple hardware architectures and operating systems.
|
|
•
|
Security
. Through our expertise in hardware and software, we are able to embed security into many facets of computing. We expect to bring unique hardware, software, and end-to-end security solutions to the market in order to offer increased protection against security risks for consumers and businesses worldwide.
|
|
•
|
Customer Orientation.
Our strategy focuses on developing our next generation of products based on the needs and expectations of our customers. In turn, our products help enable the design and development of new user experiences, form factors, and usage models for businesses and consumers. We offer platforms that incorporate various components and capabilities designed and configured to work together to provide an optimized solution that customers can easily integrate into their end products. Additionally, we promote industry standards that we believe will yield innovation and improved technologies for users.
|
2
|
•
|
Strategic Investments.
We make investments in companies around the world that we believe will further our strategic objectives, support our key business initiatives, and generate financial returns. Our investments—including those made through our Intel Capital program—generally focus on investing in companies and initiatives that we believe will stimulate growth in the digital economy, create new business opportunities for Intel, and expand global markets for our products. Additionally, we plan to continue to purchase and license intellectual property to support our current and expanding business.
|
|
•
|
Corporate Stewardship.
We are committed to developing energy-efficient technology solutions that can be used to address major global problems while reducing our environmental impact. We are also committed to empowering people and expanding economic opportunity through education and technology, driven by our corporate and Intel Foundation programs, policy leadership, and collaborative engagements. In addition, we strive to cultivate a work environment in which engaged, energized employees can thrive in their jobs and in their communities.
|
Our continued investment in developing our assets and execution in key focus areas is intended to help strengthen our competitive position as we enter and expand into adjacent market segments, such as smartphones and tablets. These market segments change rapidly, and we need to adapt to this environment. A key characteristic of these adjacent market segments is low-power consumption based on SoC products. We are making significant investments in this area with the accelerated development of our SoC solutions based on the 64-bit Intel
®
Atom
™
microarchitecture. We are also optimizing our server products for energy-efficient performance as we believe that increased Internet traffic and the use of ultra-mobile devices, the Internet of Things, and cloud computing has created the need for an improved server infrastructure.
At the 2013 Intel Developer Forum, we introduced the Intel
®
Quark SoC family of products. Designed for applications where low power and size take priority over high performance, the Intel
Quark SoC offers extremely low power consumption and a high level of integration in a low-cost package to be used in the next wave of intelligent connected devices. In addition, we also announced the Arduino*-compatible Intel
®
Galileo microcontroller board and the Intel
®
Edison development board at the Maker Faire* in Rome and the International Consumer Electronics Show, respectively. When combined with Intel
Quark SoC, these systems provide an open-source platform for customers to design products such as, but not limited to, automation for home appliances or industrial manufacturing, home media centers, and robots. In combination with the continued build out of the cloud and the announcement of the Intel Quark technologies, we expect to be on the forefront of the acceleration and proliferation of the Internet of Things.
3
Business Organization
As of
December 28, 2013
, we managed our business through the following operating segments:
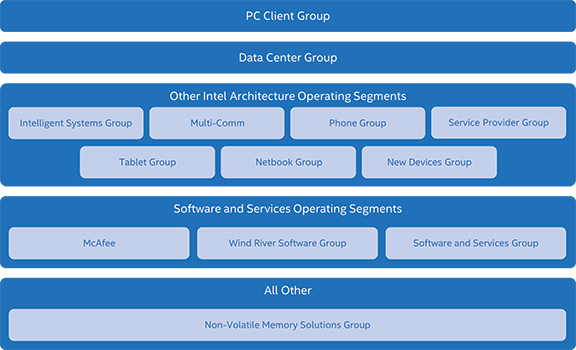
For a description of our operating segments, see “
Note 27: Operating Segments and Geographic Information
,” in Part II, Item 8 of this Form 10-K.
Products
Platforms
We offer platforms that incorporate various components and technologies, including a microprocessor and chipset, a stand-alone SoC, or multichip package. Additionally, a platform may be enhanced by additional hardware, software, and services.
A microprocessor—the central processing unit (CPU) of a computer system—processes system data and controls other devices in the system. We offer microprocessors with one or multiple processor cores. Multi-core microprocessors can enable improved multitasking and energy-efficient performance by distributing computing tasks across two or more cores. Our 2nd, 3rd, 4th, and expected-to-be-released 5th generation Intel
®
Core
™
(code-named "Broadwell") processor families integrate graphics functionality onto the processor die. In contrast, some of our previous-generation processors incorporated a separate graphics chip inside the processor package. Processor packages may also integrate a memory controller.
A chipset sends data between the microprocessor and input, display, and storage devices, such as the keyboard, mouse, monitor, hard drive or solid-state drive, and optical disc drives. Chipsets extend the audio, video, and other capabilities of many systems and perform essential logic functions, such as balancing the performance of the system and removing bottlenecks.
We offer and continue to develop SoC products that integrate our core processing functions with other system components, such as graphics, audio, and video, onto a single chip. SoC products are designed to reduce total cost of ownership, provide improved performance due to higher integration and lower power consumption, and enable ultra-mobile form factors such as smartphones, tablets, Ultrabook devices, and 2 in 1 systems, as well as notebooks, desktops, embedded systems and microserver applications.
4
With the release of our 4th generation Intel Core
processor in 2013, we introduced a multichip package that integrates the chipset on one die with the CPU and graphics on another die, connected via a lower power on-package interface. Similar to a SoC, the multichip package can provide improved performance due to higher integration coupled with lower power consumption, which enables smaller form factors.
We also offer features designed to improve our platform capabilities. For example, Intel
®
vPro
™
technology is a computer hardware-based security technology for the notebook and desktop market segments. Intel vPro is designed to provide businesses with increased manageability, upgradeability, energy-efficient performance, and security while lowering the total cost of ownership. We also offer Intel
®
Iris
™
technology, which provides graphics enhancements for 4th and expected-to-be-released 5th generation Intel Core processors.
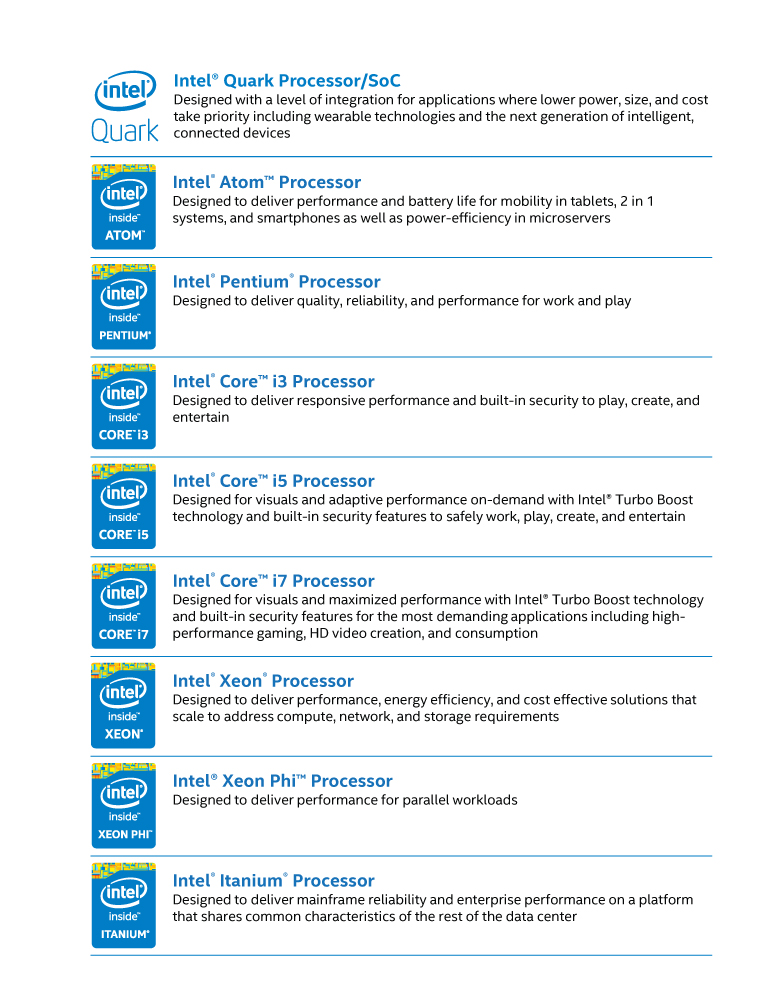
We offer a range of platforms based upon the following microprocessors:
McAfee, Inc.
McAfee, Inc. (McAfee) has the objective of improving the overall security of our platforms. McAfee offers software products that provide security solutions designed to protect systems in consumer, mobile, and corporate environments from malicious virus attacks as well as loss of data. McAfee’s products include software solutions for end-point security, network and content security, risk and compliance, and consumer and mobile security.
5
Phone and Tablet Components
We offer components for smartphones, tablets, and connected devices which include baseband processors, radio frequency transceivers, and power management integrated circuits. We also offer comprehensive smartphone and tablet platforms, including multimode Long Term Evolution (LTE*) modems,
Bluetooth
®
wireless technology and Global Positioning System (GPS) receivers, software solutions, customization, and essential interoperability tests. Our mobile phone solutions, which are based on multiple industry standards, help enable mobile voice and high-speed data communications for a broad range of devices around the world.
Non-Volatile Memory Solutions
We offer NAND flash memory products primarily used in solid-state drives. Our NAND flash memory products are manufactured by IM Flash Technologies, LLC (IMFT). We also purchase NAND flash components from Micron Technology, Inc. (Micron).
Intel Custom Foundry
We offer our silicon and manufacturing technology leadership as a service for our customers. Our foundry offerings include semi-custom services (using Intel architecture and silicon with our customer's intellectual property) and fully custom foundry services.
Products and Product Strategy by Operating Segment
Our
PC Client Group
operating segment offers products that are incorporated in notebook (including Ultrabook devices and 2 in 1 systems) and desktop computers for consumers and businesses. In 2013, we introduced the 4th generation Intel Core processor family for use in notebooks, desktops, 2 in 1 systems, and tablets. These processors use 22-nanometer (nm) transistors and our Tri-Gate transistor processor technology. Our Tri-Gate transistor technology extends Moore’s Law and is the world’s first 3-D Tri-Gate transistor on a production technology. In combination, these enhancements can provide significant power savings and performance gains when compared to previous-generation technologies.
Notebook
Our strategy for the notebook computing market segment is to offer notebook technologies designed to bring exciting new user experiences to life and improve performance, battery life, wireless connectivity, manageability and security. In addition, we are designing for smaller, lighter, and thinner form factors. In the second half of 2014, we expect to introduce our 5th generation Intel Core processor family. We believe these processors will continue to deliver increasing levels of battery life and graphics performance, as well as provide OEMs and end users with more choice in operating system compatibility, energy efficiency, processor cores, and graphics performance.
In addition to offering notebooks, we have worked with our customers to help them develop a new class of personal computing devices that includes Ultrabook devices and 2 in 1 systems. These computers combine the energy-efficient performance and capabilities of today’s notebooks and tablets with enhanced graphics and improved user interfaces such as touch and voice in a thin, light form factor that is highly responsive and secure, and that can seamlessly connect to the Internet. We believe the renewed innovation in the PC industry that we fostered with Ultrabook devices and expanded to 2 in 1 systems will continue.
Desktop
Our strategy for the desktop computing market segment is to offer exciting new user experiences and products that provide increased manageability, security, and energy-efficient performance. We are also focused on lowering the total cost of ownership for businesses. The desktop computing market segment includes all-in-one desktop products, which combine traditionally separate desktop components into one form factor. Additionally, all-in-one computers have transformed into portable and flexible form factors that offer users increased portability and new multi-user applications and uses. For desktop consumers, we also focus on the design of products for high-end enthusiast PCs and mainstream PCs with rapidly increasing audio and media capabilities.
Our
Data Center Group
operating segment offers products designed to provide leading energy-efficient performance for all compute, network and storage platforms. In addition, the Data Center Group (DCG) focuses on specific optimizations for the Enterprise, Cloud, Communications Infrastructure and Technical Computing segments. DCG is continuing to ramp the many-core Intel
®
Xeon Phi
™
coprocessor with 60 or more high-performance, low-power Intel processor cores. The Intel Xeon Phi coprocessors are positioned to boost the power of the world’s most advanced supercomputers, allowing for trillions of calculations per second. We recently introduced new Intel
®
Xeon
®
6
processors incorporating Intel’s industry leading 22nm process technology. The 22nm Intel Xeon processors provide improved performance and better power consumption across the compute, network and storage portfolio. We also announced the second generation 64-bit Intel Atom microarchitecture-based SoC solutions to focus on storage, networking and highly dense, low-power server configurations.
Our
other Intel architecture operating segments
offer products designed to be used in the Internet of Things, mobile communications, tablet, smartphone, service provider, netbook, and ultra-low power market segments.
|
•
|
Our strategy for the mobile communications market segment is to offer a portfolio of products that covers a broad range of wireless connectivity options by combining Intel WiFi technology with our 2G, 3G, and 4G LTE technologies. These products feature low power consumption, innovative designs, and multi-standard platform solutions.
|
|
•
|
Our strategy for the embedded market segment, addressed by our Intelligent Systems Group (ISG), is to lead the Internet of Things evolution by delivering new user experiences, business efficiencies, and productivity utilizing Intel architecture based solutions that provide long life-cycle support, software and architectural scalability, and platform integration.
|
|
•
|
Our strategy for the tablet market segment is to offer Intel architecture solutions optimized for multiple operating systems and application ecosystems. We are accelerating the process technology development for our Intel Atom processor product line to deliver increased battery life, performance, and feature integration.
|
|
•
|
Our strategy for the smartphone device market segment is to offer Intel Atom microarchitecture-based products that enable smartphones to deliver innovative content and services. These products are designed to deliver increased performance and system responsiveness while also enabling longer battery life.
|
|
•
|
Our strategy for the ultra-low power market segment is to offer Intel Quark SoCs designed for wearable and other emerging compute devices.
|
Our
software and services operating segments
seek to create differentiated user experiences on Intel-based platforms. We differentiate by combining Intel platform features and enhanced software and services. Our three primary initiatives are:
|
•
|
enabling platforms that can be used across multiple operating systems, applications, and services across all Intel products;
|
|
•
|
optimizing features and performance by enabling the software ecosystem to quickly take advantage of new platform features and capabilities; and
|
|
•
|
delivering comprehensive solutions by using software, services, and hardware to enable a more secure online experience, such as our McAfee LiveSAFE* technology platform, which provides a comprehensive security suite that offers consumer protection across a range of devices such as PCs, tablets, and smartphones.
|
7
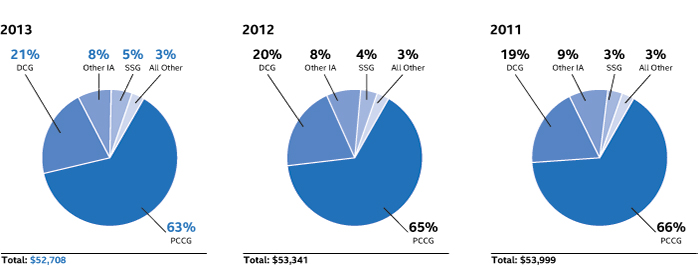
Revenue by Major Operating Segment
Net revenue for the PC Client Group (PCCG) operating segment, the DCG operating segment, the other Intel architecture (Other IA) operating segments, and the software and services (SSG) operating segments is presented as a percentage of our consolidated net revenue. Other IA includes ISG, Multi-Comm, the Phone Group, the Service Provider Group, the Tablet Group, the Netbook Group, and the New Devices Group operating segments. SSG includes McAfee, the Wind River Software Group, and the Software and Services Group operating segments. All other consists primarily of revenue from the Non-Volatile Memory Solutions Group.
Percentage of Revenue by Major Operating Segment
(Dollars in Millions)
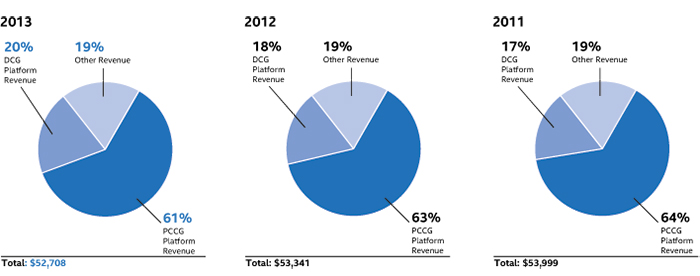
Percentage of Revenue by Principal Product from Reportable Segments
(Dollars in Millions)
Competition
The computing industry continuously evolves with new and enhanced technologies and products from existing and new providers. The markets for current and planned technologies can change quickly in response to the introduction of such technologies and products and other factors such as changes in consumer tastes.
Intel faces significant competition in the development and market acceptance of technologies and products in this environment. Our platforms, based on Intel architecture, are positioned to compete across the spectrum of Internet-connected computing devices, from the lowest-power portable devices to the most powerful data center servers.
8
We are a leading provider in the PC and server segments, where we face existing and emerging competition. In the PC segment, smaller mobile devices, such as tablets and smartphones, offered by numerous vendors have become significant competitors to PCs for many usages. Most of these small devices currently use applications processors based on the ARM* architecture; feature low-power, long battery-life operation; and are built in SoC formats which integrate numerous functions on one chip. In the server segment, our data center products and platforms face emerging competition from many new entrants using ARM architecture or other technologies.
We are a relatively new entrant to the segments for tablets, smartphones and similar mobile devices. We have adjusted our product roadmaps to emphasize the development of low-power SoC chips for these and other devices. The boundaries between the various segments are changing as the industry evolves and new segments emerge.
We have a long-standing position as a supplier of components and software for embedded products and this marketplace is significantly expanding with increasing types and numbers of Internet-connected devices for industrial, commercial and consumer uses, which we refer to as the Internet of Things. We face numerous large and small incumbent competitors as well as new entrants in this growing market segment that use ARM architecture as well as other operating systems and software.
Our products primarily compete based on performance, energy efficiency, integration, innovative design, features, price, quality, reliability, brand recognition and availability. The importance of these items will vary by the type of end system for the products. For example, performance might be among the most important factors for our products for servers, while price and integration might be among the most important factors for our products for tablets and smartphones.
We are the owner of McAfee, a major provider of digital security products and services to businesses and consumers. There are numerous competitors offering security products and services, and we seek to offer competitive differentiation by integrating hardware and software security features in many of our offerings and to have security offerings in numerous market segments including mobile and embedded devices and for data centers.
The ability of our products to operate on multiple operating systems in end-user products and platforms operated or sold by third parties, including OEMs, is a key competitive advantage. We seek to optimize our products for multiple operating systems and invest substantial resources working with third parties to do so, but such investments are risky given that it is not clear which products will succeed in the market.
We have competitors in each of the market segments including other companies that make and sell microprocessors, SoCs, other silicon components, software and platforms to businesses which build and sell computing and communications devices to end-users. We also compete against others selling these goods and services to businesses that utilize the products for their internal processes (e.g., businesses running large data centers). We also face competition from OEMs that, to some degree, choose to vertically integrate their own proprietary semiconductor and software assets. By doing so, these OEMs may be attempting to offer greater differentiation in their products and to increase their share of the profits for each finished product they sell.
Continuing changes in the industry such as acquisitions, business collaborations or licensing scenarios (such as injunctions or other litigation outcomes), could have a significant impact on our competitive position.
One of our important competitive advantages is the combination of our network of manufacturing, assembly and test facilities with our global architecture design teams. We have made significant capital and research and development (R&D) investments into t
his integrated manufacturing network, which enables us to have more direct control over our processes, quality control, product cost, production timing, performance, power consumption, and manufacturing yield. The increased cost of constructing new fabrication facilities supporting smaller transistor geometries and larger wafers has led to a smaller pool of companies that can afford to build and equip leading-edge manufacturing facilities. Most of our competitors rely on third-party foundries and subcontractors such as Taiwan Semiconductor Manufacturing Company, Ltd. and GlobalFoundries Inc. for manufacturing and assembly and test needs. We have recently start
ed providing foundry services as an alternative to such foundries.
9
Manufacturing and Assembly and Test
As of
December 28, 2013
,
46%
of our wafer fabrication, including microprocessors and chipsets, was conducted within the U.S. at our facilities in New Mexico, Arizona, Oregon, and Massachusetts. The remaining
54%
of our wafer fabrication was conducted outside the U.S. at our facilities in Israel and China. Our fabrication facility in Ireland is currently transitioning to a newer process technology node, with manufacturing expected to recommence in 2015. Wafer fabrication conducted within and outside the U.S. may be impacted by the timing of a facility’s transition to a newer process technology, as well as a facility’s capacity utilization.
As of
December 28, 2013
, we primarily manufactured our products in wafer fabrication facilities at the following locations:
|
Products
|
Wafer Size
|
Process Technology
|
Locations
|
|||
|
Microprocessors
|
300mm
|
22nm
|
Israel, Arizona, Oregon
|
|||
|
Microprocessors and chipsets
|
300mm
|
32nm
|
New Mexico
|
|||
|
Microprocessors
|
300mm
|
45nm
|
New Mexico
|
|||
|
Chipsets
|
300mm
|
65nm
|
China
|
|||
|
Chipsets and other products
|
300mm
|
90nm
|
China
|
|||
|
Chipsets
|
200mm
|
130nm
|
Massachusetts
|
|||
As of
December 28, 2013
, most of our microprocessors were manufactured on 300mm wafers using our 22nm and 32nm process technology. Our Massachusetts fabrication facility is our last manufacturing on 200mm wafers and is expected to cease production by the end of 2014. As we move to each succeeding generation of manufacturing process technology, we incur significant start-up costs to prepare each factory for manufacturing. However, continuing to advance our process technology provides benefits that we believe justify these costs. The benefits of moving to each succeeding generation of manufacturing process technology can include using less space per transistor, reducing heat output from each transistor, and increasing the number of integrated features on each chip. These advancements can result in microprocessors that are higher performing, consume less power, and cost less to manufacture. In addition, with each shift to a new process technology, we are able to produce more microprocessors per square foot of our wafer fabrication facilities. The costs to develop our process technology are significantly less than adding capacity by building additional wafer fabrication facilities using older process technology.
We use third-party foundries to manufacture wafers for certain components, including networking and communications products. In addition, we primarily use subcontractors to manufacture board-level products and systems. We purchase certain communications networking products and mobile phone components from external vendors primarily in the Asia-Pacific region.
Following the manufacturing process, the majority of our components are subject to assembly and test. We perform our components assembly and test at facilities in
Malaysia, China, Costa Rica, and Vietnam
. To augment capacity, we use subcontractors to perform assembly of certain products, primarily chipsets and networking and communications products. In addition, we use subcontractors to perform assembly and test of our mobile phone components.
Our NAND flash memory products are manufactured by IMFT and Micron using 20nm, 25nm, or 34nm process technology, and assembly and test of these products is performed by Micron and other external subcontractors. For further information, see “
Note 5: Cash and Investments
” in Part II, Item 8 of this Form 10-K.
Our employment practices are consistent with, and we expect our suppliers and subcontractors to abide by, local country law. In addition, we impose a minimum employee age requirement as well as progressive Environmental, Health, and Safety (EHS) requirements, regardless of local law.
We have thousands of suppliers, including subcontractors, providing our various materials and service needs. We set expectations for supplier performance and reinforce those expectations with periodic assessments. We communicate those expectations to our suppliers regularly and work with them to implement improvements when necessary. Where possible, we seek to have several sources of supply for all of these materials and resources, but we may rely on a single or limited number of suppliers, or upon suppliers in a single country. In those cases, we develop and implement plans and actions to reduce the exposure that would result from a disruption in supply. We have entered into long-term contracts with certain suppliers to ensure a portion of our silicon supply.
10
Our products are typically manufactured at multiple Intel facilities around the world or by subcontractors. However, some products are manufactured in only one Intel or subcontractor facility, and we seek to implement action plans to reduce the exposure that would result from a disruption at any such facility. See “Risk Factors” in Part I, Item 1A of this Form 10-K.
Research and Development
We are committed to investing in world-class technology development, particularly in the design and manufacture of integrated circuits. R&D expenditures were
$10.6 billion
in
2013
(
$10.1 billion
in
2012
and
$8.4 billion
in
2011
).
Our R&D activities are directed toward the delivery of solutions consisting of hardware and software platforms and supporting services across a wide range of computing devices. We are focused on developing the technology innovations that we believe will deliver our next generation of products, which will in turn enable new form factors and usage models for businesses and consumers. We focus our R&D efforts on advanced computing technologies, developing new microarchitectures, advancing our silicon manufacturing process technology, delivering the next generation of platforms, improving our platform initiatives, developing new solutions in emerging technologies including wearable devices and embedded applications, and developing software solutions and tools. Our R&D efforts are intended to enable new levels of performance and address areas such as energy efficiency, security, scalability for multi-core architectures, system manageability, and ease of use.
As part of our R&D efforts, we plan to introduce a new Intel Core microarchitecture for desktops, notebooks (including Ultrabook devices and 2 in 1 systems), and Intel Xeon processors approximately every two years and ramp the next generation of silicon process technology in the intervening years. We refer to this as our “tick-tock” technology development cadence as subsequently illustrated.
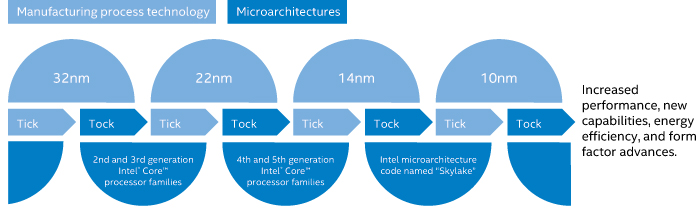
Advances in our silicon technology have enabled us to continue making Moore’s Law a reality. We expect to begin manufacturing products using our 14nm process technology in Q1 2014. We are currently developing our 5th generation Intel Core processor family (code-named “Broadwell”) using our 14nm process technology, expected to be released in the second half of 2014. We are also developing 10nm manufacturing process technology, our next-generation process technology.
We have continued expanding on the advances anticipated by Moore’s Law by bringing new capabilities into silicon and producing new products optimized for a wider variety of applications. We have accelerated the Intel Atom processor-based SoC roadmap for ultra-mobile form factors, including smartphones and tablets, as well as notebooks (including Ultrabook devices and 2 in 1 systems), embedded systems, and microserver applications, from 32nm through 22nm to 14nm. We intend that Intel Atom processors for ultra-mobile form factors will eventually be on the same process technology as our leading-edge products. We expect that this acceleration will result in a significant reduction in transistor leakage, lower active power, and an increase in transistor density to enable more powerful, feature-rich smartphones and tablets with longer battery life. Intel
Quark SoC, our newest technology announced in Q3 2013, is an ultra-low power and low-cost architecture designed for the Internet of Things, from industrial machines to wearable devices.
With our continued focus on silicon and manufacturing technology leadership, we entered into a series of agreements with ASML Holding N.V. (ASML) in 2012. These agreements, in which Intel purchased ASML securities and agreed to provide R&D funding over five years, are intended to accelerate the development of 450mm wafer technology and EUV lithography.
11
Our R&D activities range from designing and developing new products and manufacturing processes to researching future technologies and products. We continue to make significant R&D investments in the development of SoCs to enable growth in ultra-mobile form factors. In addition, we continue to make significant investments in wireless technologies including our work to develop a high-speed LTE solution for smartphones. Our second generation VoLTE product with LTE-advanced features, such as carrier aggregation, is expected to be available in the first half of 2014. We also continue to invest in graphics and HPC.
Our R&D model is based on a global organization that emphasizes a collaborative approach to identifying and developing new technologies, leading standards initiatives, and influencing regulatory policies to accelerate the adoption of new technologies, including joint pathfinding conducted between researchers at Intel Labs and our business groups. We centrally manage key cross-business group product initiatives to align and prioritize our R&D activities across these groups. In addition, we may augment our R&D activities by investing in companies or entering into agreements with companies that have similar R&D focus areas, as well as directly purchasing or licensing technology applicable to our R&D initiatives.
Employees
As of
December 28, 2013
, we had
107,600
employees worldwide (
105,000
as of
December 29, 2012
), with approximately
51%
of those employees located in the U.S. (
51%
as of
December 29, 2012
).
Sales and Marketing
Customers
We sell our products primarily to OEMs and ODMs. ODMs provide design and manufacturing services to branded and unbranded private-label resellers. In addition, we sell our products to other manufacturers, including makers of a wide range of industrial and communications equipment. Our customers also include those who buy PC components and our other products through distributor, reseller, retail, and OEM channels throughout the world.
Our worldwide reseller sales channel consists of thousands of indirect customers—systems builders that purchase Intel microprocessors and other products from our distributors. We have a boxed processor program that allows distributors to sell our microprocessors in small quantities to customers of systems builders; boxed processors are also available in direct retail outlets.
In
2013
, Hewlett-Packard Company accounted for
17%
of our net revenue (
18%
in
2012
and
19%
in
2011
), Dell Inc. accounted for
15%
of our net revenue (
14%
in
2012
and
15%
in
2011
), and Lenovo Group Limited accounted for
12%
of our net revenue (
11%
in
2012
and
9%
in
2011
). No other customer accounted for more than 10% of our net revenue during such periods. For information about net revenue and operating income by operating segment, and net revenue from unaffiliated customers by country, see “
Note 27: Operating Segments and Geographic Information
” in Part II, Item 8 of this Form 10-K.
Sales Arrangements
Our products are sold through sales offices throughout the world. Sales of our products are typically made via purchase order acknowledgments that contain standard terms and conditions covering matters such as pricing, payment terms, and warranties, as well as indemnities for issues specific to our products, such as patent and copyright indemnities. From time to time, we may enter into additional agreements with customers covering, for example, changes from our standard terms and conditions, new product development and marketing, private-label branding, and other matters. Most of our sales are made using electronic and web-based processes that allow the customer to review inventory availability and track the progress of specific goods ordered. Pricing on particular products may vary based on volumes ordered and other factors. We also offer discounts, rebates, and other incentives to customers to increase acceptance of our products and technology.
Our products are typically shipped under terms that transfer title to the customer, even in arrangements for which the recognition of revenue and related cost of sales is deferred. Our standard terms and conditions of sale typically provide that payment is due at a later date, generally 30 days after shipment or delivery. Our credit department sets accounts receivable and shipping limits for individual customers to control credit risk to Intel arising from outstanding account balances. We assess credit risk through quantitative and qualitative analysis, and from this analysis, we establish credit limits and determine whether we will use one or more credit support devices, such as a parent guarantee or standby letter of credit, or credit insurance. Credit losses may still be incurred due to bankruptcy, fraud, or other failure of the customer to pay. For information about our allowance for doubtful receivables, see “Schedule II—Valuation and Qualifying Accounts” in Part IV of this Form 10-K.
12
Most of our sales to distributors are made under agreements allowing for price protection on unsold merchandise and a right of return on stipulated quantities of unsold merchandise. Under the price protection program, we give distributors credits for the difference between the original price paid and the current price that we offer. On most products, there is no contractual limit on the amount of price protection, nor is there a limit on the time horizon under which price protection is granted. The right of return granted generally consists of a stock rotation program in which distributors are able to exchange certain products based on the number of qualified purchases made by the distributor. We have the option to grant credit for, repair, or replace defective products, and there is no contractual limit on the amount of credit that may be granted to a distributor for defective products.
Distribution
Distributors typically handle a wide variety of products, including those that compete with our products, and fill orders for many customers. We also utilize third-party sales representatives who generally do not offer directly competitive products but may carry complementary items manufactured by others. Sales representatives do not maintain a product inventory; instead, their customers place orders directly with us or through distributors. We have several distribution warehouses that are located in proximity to key customers.
Backlog
Over time, our larger customers have generally moved to lean-inventory or just-in-time operations rather than maintaining larger inventories of our products. As our customers continue to lower their inventories, our processes to fulfill their orders have evolved to meet their needs. As a result, our manufacturing production is based on estimates and advance non-binding commitments from customers as to future purchases. Our order backlog as of any particular date is a mix of these commitments and specific firm orders that are primarily made pursuant to standard purchase orders for delivery of products. Only a small portion of our orders is non-cancelable, and the dollar amount associated with the non-cancelable portion is not significant.
Seasonal Trends
Historically, our platform sales have generally been higher in the second half of the year than in the first half of the year, accelerating in the third quarter and peaking in the fourth quarter.
Marketing
Our corporate marketing objectives are to build a strong, well-known Intel corporate brand that connects with businesses and consumers, and to offer a limited number of meaningful and valuable brands in our portfolio to aid businesses and consumers in making informed choices about technology purchases. The Intel Core processor family and the Intel Atom, Intel
®
Pentium
®
, Intel Xeon, Intel Xeon Phi and Intel
®
Itanium
®
trademarks make up our processor brands.
We promote brand awareness and generate demand through our own direct marketing as well as through co-marketing programs. Our direct marketing activities include television, print, and Internet advertising, as well as press relations and social media, consumer and trade events, and industry and consumer communications. We market to consumer and business audiences, and focus on building awareness and generating demand for new form factors such as Ultrabook and 2 in 1 systems, and for increased performance, improved energy efficiency, and other capabilities such as Internet connectivity and security.
Purchases by customers often allow them to participate in cooperative advertising and marketing programs such as the Intel Inside
®
Program. This program broadens the reach of our brands beyond the scope of our own direct marketing. Through the Intel Inside Program, certain customers are licensed to place Intel logos on computing devices containing our microprocessors and processor technologies, and to use our brands in their marketing activities. The program includes a market development component that accrues funds based on purchases and partially reimburses the OEMs for marketing activities for products featuring Intel brands, subject to the OEMs meeting defined criteria. These marketing activities primarily include television, print, and Internet marketing. We have also entered into joint marketing arrangements with certain customers.
13
Intellectual Property Rights and Licensing
Intel owns significant intellectual property (IP) around the world that relates to our products, services, research and development, and other activities and assets. Our IP portfolio includes patents, copyrights, trade secrets, trademarks, trade dress rights, and maskwork rights. We actively seek to protect our global IP rights and to deter unauthorized use of our IP and other assets. Such efforts can be difficult, however, particularly in countries that provide less protection to IP rights and in the absence of harmonized international IP standards. See “Risk Factors” in Part I, Item 1A, and “
Note 26: Contingencies
” in Part II, Item 8 of this Form 10-K.
We have obtained patents in the U.S. and other countries. While our patents are an important element of our success, our business as a whole is not significantly dependent on any one patent. Because of the fast pace of innovation and product development, and the comparative pace of governments’ patenting processes, our products are often obsolete before the patents related to them expire; in some cases, our products may be obsolete before the patents related to them are granted. As we expand our products into new industries, we also seek to extend our patent development efforts to patent such products. In addition to developing patents based on our own research and development efforts, we purchase patents from third parties to supplement our patent portfolio. Established competitors in existing and new industries, as well as companies that purchase and enforce patents and other IP, may already have patents covering similar products. There is no assurance that we will be able to obtain patents covering our own products, or that we will be able to obtain licenses from other companies on favorable terms or at all.
The software that we distribute, including software embedded in our component-level and platform products, is entitled to copyright and other IP protection. To distinguish our products from our competitors’ products, we have obtained trademarks and trade names for our products, and we maintain cooperative advertising programs with customers to promote our brands and to identify products containing genuine Intel components. We also protect details about our processes, products, and strategies as trade secrets, keeping confidential the information that we believe provides us with a competitive advantage.
Compliance with Environmental, Health, and Safety Regulations
Our compliance efforts focus on monitoring regulatory and resource trends and setting company-wide performance targets for key resources and emissions. These targets address several parameters, including product design; chemical, energy, and water use; waste recycling; the source of certain minerals used in our products; climate change; and emissions.
As a company, we focus on reducing natural resource use, the solid and chemical waste by-products of our manufacturing processes, and the environmental impact of our products. We currently use a variety of materials in our manufacturing process that have the potential to adversely impact the environment and are subject to a variety of EHS laws and regulations. Over the past several years, we have significantly reduced the use of lead and halogenated flame retardants in our products and manufacturing processes.
We work with the U.S. Environmental Protection Agency (EPA), non-governmental organizations (NGOs), OEMs, and retailers to help manage e-waste (including electronic products nearing the end of their useful lives) and to promote recycling. The European Union requires producers of certain electrical and electronic equipment to develop programs that let consumers return products for recycling. Many states in the U.S. have similar e-waste take-back laws. Although these laws are typically targeted at the end electronic product and not the component products that we manufacture, the inconsistency of many e-waste take-back laws and the lack of local e-waste management options in many areas pose a challenge for our compliance efforts.
We are an industry leader in our efforts to build ethical sourcing of minerals for our products, including “conflict minerals” from the Democratic Republic of the Congo (DRC) and adjoining countries. In 2013, we accomplished our goal to manufacture microprocessors that are DRC conflict free for tantalum, tin, tungsten, and gold. In 2014, we will continue our work to establish DRC conflict free supply chains for these minerals for our company and our industry.
14
We seek to reduce our global greenhouse gas emissions by investing in energy conservation projects in our factories and working with suppliers to improve energy efficiency. We take a holistic approach to power management, addressing the challenge at the silicon, package, circuit, micro-architecture, macro architecture, platform, and software levels. We recognize that climate change may cause general economic risk. For further information on the risks of climate change, see “Risk Factors” in Part I, Item 1A of this Form 10-K. We see a potential for higher energy costs driven by climate change regulations. This could include items applied to utility companies that are passed along to customers, such as carbon taxes or costs associated with obtaining permits for our manufacturing operations, emission cap and trade programs, or renewable portfolio standards.
We are committed to sustainability and take a leadership position in promoting voluntary environmental initiatives and working proactively with governments, environmental groups, and industry to promote global environmental sustainability. We believe that technology will be fundamental to finding solutions to the world’s environmental challenges, and we are joining forces with industry, business, and governments to find and promote ways that technology can be used as a tool to combat climate change.
We have been purchasing wind power and other forms of renewable energy at some of our major sites for several years. We purchase renewable energy certificates under a multi-year contract. This purchase has placed Intel at the top of the EPA’s Green Power Partnership for the past four years and is intended to help stimulate the market for green power, leading to additional generating capacity and, ultimately, lower costs.
Distribution of Company Information
Our Internet address is
www.intel.com
. We publish voluntary reports on our web site that outline our performance with respect to corporate responsibility, including EHS compliance.
We use our Investor Relations web site,
www.intc.com,
as a routine channel for distribution of important information, including news releases, analyst presentations, and financial information. We post filings on our web site the same day they are electronically filed with, or furnished to, the U.S. Securities and Exchange Commission (SEC), including our annual and quarterly reports on Forms 10-K and 10-Q and current reports on Form 8-K; our proxy statements; and any amendments to those reports or statements. We post our quarterly and annual earnings results on our Investor Relations website, at
www.intc.com/results.cfm
, and do not distribute our financial results via a news wire service. All such postings and filings are available on our Investor Relations web site free of charge. In addition, our Investor Relations web site allows interested persons to sign up to automatically receive e-mail alerts when we post news releases and financial information. The SEC’s web site,
www.sec.gov,
contains reports, proxy and information statements, and other information regarding issuers that file electronically with the SEC. The content on any web site referred to in this Form 10-K is not incorporated by reference in this Form 10-K unless expressly noted.
15
Executive Officers of the Registrant
The following sets forth certain information with regard to our executive officers as of
February 14, 2014
(ages are as of
December 28, 2013
):
|
Andy D. Bryant
, age 63
|
Brian M. Krzanich
, age 53
|
|||||
|
•
2012 – present,
|
Chairman of the Board
|
•
2013 – present,
|
Chief Executive Officer
|
|||
|
•
2011 – 2012,
|
Vice Chairman of the Board, Executive VP, Technology, Manufacturing and Enterprise Services, Chief Administrative Officer
|
•
2012 – 2013,
|
Executive VP, Chief Operating Officer
|
|||
|
•
2010 – 2012,
|
Senior VP, GM, Manufacturing and Supply Chain
|
|||||
|
•
2009 – 2011,
|
Executive VP, Technology, Manufacturing, and Enterprise Services, Chief Administrative Officer
|
•
2006 – 2010,
|
VP, GM, Assembly and Test
|
|||
|
•
Joined Intel in 1982
|
||||||
|
•
2007 – 2009,
|
Executive VP, Finance and Enterprise Services, Chief Administrative Officer
|
A. Douglas Melamed
, age 68
|
||||
|
•
2009 – present,
|
Senior VP, General Counsel
|
|||||
|
•
2001 – 2007,
|
Executive VP, Chief Financial and Enterprise Services Officer
|
•
2001 – 2009,
|
Partner, Wilmer Cutler Pickering Hale and Dorr LLP
|
|||
|
•
Member of Intel Corporation Board of Directors
|
•
Joined Intel in 2009
|
|||||
|
•
Member of Columbia Sportswear Company Board of Directors
|
||||||
|
Stacy J. Smith
, age 51
|
||||||
|
•
Member of McKesson Corporation Board of Directors
|
•
2012 – present,
|
Executive VP, Chief Financial Officer
|
||||
|
•
Joined Intel in 1981
|
•
2010 – 2012,
|
Senior VP, Chief Financial Officer
|
||||
|
•
2007 – 2010,
|
VP, Chief Financial Officer
|
|||||
|
William M. Holt
, age 61
|
•
2006 – 2007,
|
VP, Assistant Chief Financial Officer
|
||||
|
•
2013 – present,
|
Executive VP, GM, Technology and Manufacturing Group
|
•
2004 – 2006,
|
VP, Finance and Enterprise Services, Chief Information Officer
|
|||
|
•
2006 – 2013,
|
Senior VP, GM, Technology and Manufacturing Group
|
•
Member of Autodesk, Inc. Board of Directors
|
||||
|
•
Member of Gevo, Inc. Board of Directors
|
||||||
|
•
2005 – 2006,
|
VP, Co-GM, Technology and Manufacturing Group
|
•
Joined Intel in 1988
|
||||
|
•
Joined Intel in 1974
|
Arvind Sodhani
, age 59
|
|||||
|
•
2007 – present,
|
Executive VP, President of Intel Capital
|
|||||
|
Renee J. James
, age 49
|
•
2005 – 2007,
|
Senior VP, President of Intel Capital
|
||||
|
•
2013 – present,
|
President
|
•
Joined Intel in 1981
|
||||
|
•
2012 – 2013,
|
Executive VP, GM, Software and Services Group
|
|||||
|
•
2005 – 2012,
|
Senior VP, GM, Software and Services Group
|
|||||
|
•
2002 – 2005,
|
VP, Developer Programs
|
|||||
|
•
Member of Vodafone Group plc Board of Directors
|
||||||
|
•
Joined Intel in 1988
|
||||||
|
Thomas M. Kilroy
, age 56
|
||||||
|
•
2013 – present,
|
Executive VP, GM, Sales and Marketing Group
|
|||||
|
•
2010 – 2013,
|
Senior VP, GM, Sales and Marketing Group
|
|||||
|
•
2009 – 2010,
|
VP, GM, Sales and Marketing Group
|
|||||
|
•
2005 – 2009,
|
VP, GM, Digital Enterprise Group
|
|||||
|
•
Joined Intel in 1990
|
||||||
16
|
ITEM 1A.
|
RISK FACTORS
|
Changes in product demand may harm our financial results and are hard to predict.
If product demand decreases, our revenue and profit could be harmed. Important factors that could cause demand for our products to decrease include changes in:
|
•
|
business conditions, including downturns in the computing industry, regional economies, and the overall economy;
|
|
•
|
consumer confidence or income levels caused by changes in market conditions, including changes in government borrowing, taxation, or spending policies; the credit market; or expected inflation, employment, and energy or other commodity prices;
|
|
•
|
the level of customers’ inventories;
|
|
•
|
competitive and pricing pressures, including actions taken by competitors;
|
|
•
|
customer product needs;
|
|
•
|
market acceptance of our products and maturing product cycles; and
|
|
•
|
the technology supply chain, including supply constraints caused by natural disasters or other events.
|
Our operations have high costs—including costs related to facility construction and equipment, R&D, and employment and training of a highly skilled workforce—that are either fixed or difficult to reduce in the short term. At the same time, demand for our products is highly variable and, in recent years, we have experienced declining orders in the traditional PC market segment, which has been negatively impacted by the growth in ultra-mobile devices such as tablets and smartphones
.
If product demand decreases or we fail to forecast demand accurately, we could be required to write off inventory or record excess capacity charges, which would lower our gross margin. Our manufacturing or assembly and test capacity could be underutilized, and we may be required to write down our long-lived assets, which would increase our expenses. Factory-planning decisions may shorten the useful lives of facilities and equipment and cause us to accelerate depreciation. If product demand increases, we may be unable to add capacity fast enough to meet market demand. Our revenue and gross margin percentage can also be affected by the timing of our product introductions and related expenses, including marketing expenses. Changes in product demand, and changes in our customers’ product needs, could negatively affect our competitive position and may reduce our revenue, increase our costs, lower our gross margin percentage, or require us to write down our assets.
We operate in highly competitive industries, and our failure to anticipate and respond to technological and market developments could harm our ability to compete.
We operate in highly competitive industries that experience rapid technological and market developments, changes in industry standards, changes in customer needs, and frequent product introductions and improvements. If we are unable to anticipate and respond to these developments, we might weaken our competitive position, and our products or technologies might be uncompetitive or obsolete. As computing market segments emerge, such as smartphones, tablets, and consumer electronics devices, we face new sources of competition and customers with needs different from those of customers in the PC market segment. Some of our competitors are pursuing a vertical integration strategy, incorporating their SoC solutions into the smartphones and tablets they offer, which could make it less likely that they will adopt our SoC solutions. To be successful, we need to cultivate new industry relationships in these market segments. As the number and variety of Internet-connected devices increase, we need to continuously improve the cost, connectivity, integration, features, energy efficiency, and security of our platforms, among other things, to succeed in these market segments. In addition, we need to expand our software capabilities to provide customers with comprehensive computing solutions.
To compete successfully, we must maintain a successful R&D effort, develop new products and production processes, and improve our existing products and processes ahead of competitors. For example, we invest substantially in our network of manufacturing, assembly and test facilities, including the construction of new fabrication facilities to support smaller transistor geometries and larger wafers. Our R&D efforts are critical to our success and are aimed at solving complex problems, and we do not expect all of our projects to be successful. We may be unable to develop and market new products successfully, and the products we invest in and develop may not be well received by customers. Our R&D investments may not generate significant operating income or contribute to our future operating results for several years and such contributions may not meet our expectations or even cover the costs of such investments. Additionally, the products and technologies offered by others may affect demand for or pricing of our products. These types of events could negatively affect our competitive position and may reduce revenue, increase costs, lower gross margin percentage, or require us to impair our assets.
17
Changes in the mix of products sold may harm our financial results.
Because of the wide price differences of platform average selling prices among our data center, PC client, and Other IA platforms, a change in the mix of platforms among these market segments may impact our revenue and gross margin. For example, our PC client platforms that are incorporated in notebook and desktop computers tend to have lower average selling prices and gross margin than our data center platforms that are incorporated in servers, workstations and storage products. Therefore, if there is less demand for our data center platforms, and a resulting mix shift to our PC client platforms, our gross margins and revenue would decrease. Also, more recently introduced products tend to have higher costs because of initial development costs and lower production volumes relative to the previous product generation, which can impact gross margin.
Our global operations subject us to risks that may harm our results of operations and financial condition.
We have sales offices, R&D, manufacturing, assembly and test facilities, and other facilities in many countries, and some business activities may be concentrated in one or more geographic areas. As a result, our ability to manufacture, assemble and test, design, develop, or sell products may be affected by:
|
•
|
security concerns, such as armed conflict and civil or military unrest, crime, political instability, and terrorist activity;
|
|
•
|
natural disasters and health concerns;
|
|
•
|
inefficient and limited infrastructure and disruptions, such as supply chain interruptions and large-scale outages or interruptions of service from utilities, transportation, or telecommunications providers;
|
|
•
|
restrictions on our operations by governments seeking to support local industries, nationalization of our operations, and restrictions on our ability to repatriate earnings;
|
|
•
|
differing employment practices and labor issues; and
|
|
•
|
local business and cultural factors that differ from our normal standards and practices, including business practices that we are prohibited from engaging in by the Foreign Corrupt Practices Act (FCPA) and other anti-corruption laws and regulations.
|
Legal and regulatory requirements differ among jurisdictions worldwide. Violations of these laws and regulations could result in fines; criminal sanctions against us, our officers, or our employees; prohibitions on the conduct of our business; and damage to our reputation. Although we have policies, controls, and procedures designed to ensure compliance with these laws, our employees, contractors, or agents may violate our policies.
Although most of our sales occur in U.S. dollars, expenses such as payroll, utilities, tax, and marketing expenses may be paid in local currencies. We also conduct certain investing and financing activities in local currencies. Our hedging programs reduce, but do not eliminate, the impact of currency exchange rate movements; therefore, changes in exchange rates could harm our results of operations and financial condition. Changes in tariff and import regulations and in U.S. and non-U.S. monetary policies may harm our results of operations and financial condition by increasing our expenses and reducing revenue. Differing tax rates in various jurisdictions could harm our results of operations and financial condition by increasing our overall tax rate.
We maintain a program of insurance coverage for a variety of property, casualty, and other risks. We place our insurance coverage with multiple carriers in numerous jurisdictions. However, one or more of our insurance providers may be unable or unwilling to pay a claim. The types and amounts of insurance we obtain vary depending on availability, cost, and decisions with respect to risk retention. The policies have deductibles and exclusions that result in us retaining a level of self-insurance. Losses not covered by insurance may be large, which could harm our results of operations and financial condition.
Failure to meet our production targets, resulting in undersupply or oversupply of products, may harm our business and results of operations.
Production of integrated circuits is a complex process. Disruptions in this process can result from errors, difficulties in our development and implementation of new processes, defects in materials, disruptions in our supply of materials or resources, and disruptions at our fabrication and assembly and test facilities due to accidents, maintenance issues, or unsafe working conditions—all of which could affect the timing of production ramps and yields. We may not be successful or efficient in developing or implementing new production processes. Production issues may result in our failure to meet or increase production as desired, resulting in higher costs or large decreases in yields, which could affect our ability to produce sufficient volume to meet product demand. The unavailability or reduced availability of products could make it more difficult to deliver computing platforms. The occurrence of these events could harm our business and results of operations.
18
We may have difficulties obtaining the resources or products we need for manufacturing, assembling and testing our products, or operating other aspects of our business, which could harm our ability to meet demand and increase our costs.
We have thousands of suppliers providing materials that we use in production and other aspects of our business, and where possible, we seek to have several sources of supply for all of those materials. However, we may rely on a single or a limited number of suppliers, or upon suppliers in a single location, for these materials. The inability of suppliers to deliver adequate supplies of production materials or other supplies could disrupt our production processes or make it more difficult for us to implement our business strategy. Production could be disrupted by the unavailability of resources used in production, such as water, silicon, electricity, gases, and other materials. Future environmental regulations could restrict the supply or increase the cost of materials that we use in our business and make it more difficult to obtain permits to build or modify manufacturing capacity to meet demand. The unavailability or reduced availability of materials or resources may require us to reduce production or incur additional costs. The occurrence of these events could harm our business and results of operations.
Costs related to product defects and errata may harm our results of operations and business.
Costs of product defects and errata (deviations from published specifications) due to, for example, problems in our design and manufacturing processes, could include:
|
•
|
writing off the value of inventory;
|
|
•
|
disposing of products that cannot be fixed;
|
|
•
|
recalling products that have been shipped;
|
|
•
|
providing product replacements or modifications; and
|
|
•
|
defending against litigation.
|
These costs could be large and may increase expenses and lower gross margin. Our reputation with customers or end users could be damaged as a result of product defects and errata, and product demand could be reduced. The announcement of product defects and errata could cause customers to purchase products from competitors as a result of possible shortages of Intel components or for other reasons. These factors could harm our business and financial results.
Third parties might attempt to gain unauthorized access to our network or seek to compromise our products and services, which could damage our reputation and financial results.
We regularly face attempts by others to gain unauthorized access through the Internet or to introduce malicious software to our IT systems. Additionally, malicious hackers may attempt to gain unauthorized access and corrupt the processes of hardware and software products that we manufacture and services we provide. These attempts might be the result of industrial or other espionage or actions by hackers seeking to harm our company, our products and services, or users of our products and services. Due to the widespread use of our products and due to the high profile of our McAfee subsidiary, we or our products and services are a frequent target of computer hackers and organizations that intend to sabotage, take control of, or otherwise corrupt our manufacturing or other processes, products and services. We are also a target of malicious attackers who attempt to gain access to our network or data centers or those of our customers or end users; steal proprietary information related to our business, products, employees and customers; or interrupt our systems and services or those of our customers or others. We believe such attempts are increasing in number and in technical sophistication. These attacks are sometimes successful; and in some instances, we, our customers, and the users of our products and services might be unaware of an incident or its magnitude and effects. We seek to detect and investigate such attempts and incidents and to prevent their recurrence where practicable through changes to our internal processes and tools and/or changes or patches to our products and services, but in some cases preventive and remedial action might not be successful. Such attacks, whether successful or unsuccessful, could result in our incurring costs related to, for example, rebuilding internal systems, reduced inventory value, providing modifications to our products and services, defending against litigation, responding to regulatory inquiries or actions, paying damages, or taking other remedial steps with respect to third parties. Publicity about vulnerabilities and attempted or successful incursions could damage our reputation with customers or users and reduce demand for our products and services.
19
We may be subject to theft, loss or misuse of personal data about us or our employees, customers or other third parties, which could increase our expenses, damage our reputation or result in litigation.
Global privacy legislation, enforcement, and policy activity are rapidly expanding and creating a complex compliance environment. The theft, loss, or misuse of personal data collected, used, stored, or transferred by us to run our business could result in increased security costs or costs related to defending legal claims. Costs to comply with and implement privacy-related and data protection measures could be significant. Our failure to comply with federal, state, or international privacy-related or data protection laws and regulations could result in proceedings against us by governmental entities or others.
Third parties may claim infringement of IP rights, which could harm our business.
We may face IP rights infringement claims from individuals and companies, including those who have acquired patent portfolios to assert claims against other companies. We are engaged in a number of litigation matters involving IP rights. Claims that our products or processes infringe the IP rights of others could cause us to incur large costs to respond to, defend, and resolve the claims, and they may divert the efforts and attention of management and technical personnel. As a result of IP rights infringement claims, we could:
|
•
|
pay monetary damages for infringement claims;
|
|
•
|
stop manufacturing, using, selling, offering to sell or importing products or technology subject to infringement claims;
|
|
•
|
develop other products or technology not subject to infringement claims, which could be time-consuming, costly or impossible; or
|
|
•
|
license technology from the party claiming infringement, which license may not be available on commercially reasonable terms.
|
These actions could harm our competitive position, result in expenses, or require us to impair our assets. If we alter or stop production of affected items, our revenue could be harmed.
We may be unable to enforce or protect our IP rights, which may harm our ability to compete and may harm our business.
Our ability to enforce our patents, copyrights, software licenses, and other IP rights is subject to general litigation risks, as well as uncertainty as to the enforceability of our IP rights in various countries. When we seek to enforce our rights, we are often subject to claims that the IP rights are invalid, not enforceable, or licensed to the opposing party. Our assertion of IP rights often results in the other party seeking to assert claims against us, which could harm our business. Governments may adopt regulations—and governments or courts may render decisions—requiring compulsory licensing of IP rights, or governments may require products to meet standards that serve to favor local companies. Our inability to enforce our IP rights under these circumstances may harm our competitive position and business.
We may be subject to IP theft or misuse, which could result in claims against us and harm our business and results of operations.
The theft or unauthorized use or publication of our trade secrets and other confidential business information could harm our competitive position and reduce acceptance of our products; the value of our investment in R&D, product development, and marketing could be reduced. In addition, the theft or unauthorized use or publication of third party trade secrets and other confidential business information that we obtain in conducting our business might lead to third-party claims against us related to the loss of the confidential or proprietary information or end-user data. Any such incidents and claims could severely disrupt our business, and we could suffer losses, including the cost of product recalls and returns and reputational harm.
Our licenses with other companies and participation in industry initiatives may allow competitors to use our patent rights.
Companies in the computing industry often bilaterally license patents between each other to settle disputes or as part of business agreements between them. Our competitors may have licenses to our patents, and under current case law, some of the licenses may permit these competitors to pass our patent rights on to others under some circumstances. Our participation in industry standards organizations or with other industry initiatives may require us to license our patents to companies that adopt industry-standard specifications. Depending on the rules of the organization, we might have to grant these licenses to our patents for little or no cost, and as a result, we may be unable to enforce certain patents against others, our costs of enforcing our licenses or protecting our patents may increase, and the value of our IP rights may be impaired. In addition, we may not be able to obtain licenses on fair, reasonable and non-discriminatory terms to patents asserted to be essential to standards that we implement in our products.
20
Litigation or regulatory proceedings could harm our business.
We may face legal claims or regulatory matters involving stockholder, consumer, competition, and other issues on a global basis. As described in “
Note 26: Contingencies
” in Part II, Item 8 of this Form 10-K, we are engaged in a number of litigation and regulatory matters. Litigation and regulatory proceedings are inherently uncertain, and adverse rulings could occur, including monetary damages, or an injunction stopping us from manufacturing or selling products, engaging in business practices, or requiring other remedies, such as compulsory licensing of patents.
We face risks related to sales through distributors and other third parties.
We sell a portion of our products through third parties such as distributors, value-added resellers, OEMs, Internet service providers, and channel partners (collectively referred to as distributors). Using third parties for distribution exposes us to many risks, including competitive pressure, concentration, credit risk, and compliance risks. Distributors may sell products that compete with our products, and we may need to provide financial and other incentives to focus distributors on the sale of our products. We may rely on one or more key distributors for a product, and the loss of these distributors could reduce our revenue. Distributors may face financial difficulties, including bankruptcy, which could harm our collection of accounts receivable and financial results. Violations of FCPA or similar laws by distributors or other third-party intermediaries could have a material impact on our business. Failing to manage risks related to our use of distributors may reduce sales, increase expenses, and weaken our competitive position.
We face risks related to sales to government entities.
We derive a portion of our revenue from sales to government entities and their respective agencies. Government demand and payment for our products may be affected by public sector budgetary cycles and funding authorizations. Government contracts are subject to oversight, including special rules on accounting, expenses, reviews, and security. Failing to comply with these rules could result in civil and criminal penalties and sanctions, including termination of contracts, fines and suspensions, or debarment from future government business.
We invest in companies for strategic reasons and may not realize a return on our investments.
We make investments in companies around the world to further our strategic objectives and support key business initiatives. These investments include equity or debt instruments of public or private companies, and many of these instruments are non-marketable at the time of our initial investment. Companies range from early-stage companies that are still defining their strategic direction to more mature companies with established revenue streams and business models. The companies in which we invest may fail because they are unable to secure additional funding, obtain favorable terms for future financings, or participate in liquidity events such as public offerings, mergers, and private sales. If any of these companies fail, we could lose all or part of our investment. If we determine that an other-than-temporary decline in the fair value exists for an investment, we write down the investment to its fair value and recognize a loss, impacting gains (losses) on equity investments, net.
Our results of operations could vary as a result of the methods, estimates, and judgments that we use in applying accounting policies.
The methods, estimates, and judgments that we use in applying accounting policies have a large impact on our results of operations. For more information, see “Critical Accounting Estimates” in Part II, Item 7 of this Form 10-K. These methods, estimates, and judgments are subject to large risks, uncertainties, and assumptions, and changes could affect our results of operations.
Changes in our effective tax rate may harm our results of operations.
A number of factors may increase our effective tax rates, which could reduce our net income, including:
|
•
|
the jurisdictions in which profits are determined to be earned and taxed;
|
|
•
|
the resolution of issues arising from tax audits;
|
|
•
|
changes in the valuation of our deferred tax assets and liabilities, and in deferred tax valuation allowances;
|
|
•
|
adjustments to income taxes upon finalization of tax returns;
|
|
•
|
increases in expenses not deductible for tax purposes, including write-offs of acquired in-process research and development and impairments of goodwill;
|
|
•
|
changes in available tax credits;
|
|
•
|
changes in tax laws or their interpretation, including changes in the U.S. to the taxation of non-U.S income and expenses;
|
|
•
|
changes in U.S. generally accepted accounting principles; and
|
|
•
|
our decision to repatriate non-U.S. earnings for which we have not previously provided for U.S. taxes.
|
21
Decisions about the scope of operations of our business could affect our results of operations and financial condition.
Changes in the business environment could lead to changes in the scope of our operations, resulting in restructuring and asset impairment charges in addition to those announced in the last twelve months. Factors that could affect our results of operations and financial condition due to a change in the scope of our operations include:
|
•
|
timing and execution of plans and programs subject to local labor law requirements, including consultation with work councils;
|
|
•
|
changes in assumptions related to severance and postretirement costs;
|
|
•
|
divestitures;
|
|
•
|
new business initiatives and changes in product roadmap, development, and manufacturing;
|
|
•
|
changes in employment levels and turnover rates;
|
|
•
|
changes in product demand and the business environment; and
|
|
•
|
changes in the fair value of long-lived assets.
|
Our acquisitions, divestitures, and other transactions could disrupt our ongoing business and harm our results of operations.
In pursuing our business strategy, we routinely conduct discussions, evaluate opportunities, and enter into agreements for possible investments, acquisitions, divestitures, and other transactions, such as joint ventures. Acquisitions and other transactions involve large challenges and risks, including risks that:
|
•
|
we may be unable to identify opportunities on terms acceptable to us;
|
|
•
|
the transaction may not advance our business strategy;
|
|
•
|
we may not realize a satisfactory return;
|
|
•
|
we may be unable to retain key personnel;
|
|
•
|
we may experience difficulty in integrating new employees, business systems, and technology;
|
|
•
|
acquired businesses may not have adequate controls, processes, and procedures to ensure compliance with laws and regulations, and our due diligence process may not identify compliance issues or other liabilities;
|
|
•
|
we may have difficulty entering new market segments; or
|
|
•
|
we may be unable to retain the customers and partners of acquired businesses.
|
When we decide to sell assets or a business, we may have difficulty selling on acceptable terms in a timely manner, and the agreed-upon terms and financing arrangements could be renegotiated due to changes in business or market conditions. These circumstances could delay the achievement of our strategic objectives or cause us to incur added expense, or we may sell a business at a price or on terms that are less favorable than we had anticipated, resulting in a loss on the transaction.
If we do enter into agreements with respect to acquisitions, divestitures, or other transactions, we may fail to complete them due to factors such as:
|
•
|
failure to obtain regulatory or other approvals;
|
|
•
|
IP disputes or other litigation; or
|
|
•
|
difficulties obtaining financing for the transaction.
|
Our failure to comply with environmental laws and regulations could harm our business and results of operations.
The manufacturing and assembly and test of our products require the use of hazardous materials that are subject to a broad array of EHS laws and regulations. Our failure to comply with these laws or regulations could result in:
|
•
|
regulatory penalties, fines, and legal liabilities;
|
|
•
|
suspension of production;
|
|
•
|
alteration of our fabrication and assembly and test processes;
|
|
•
|
reputational challenges; and
|
|
•
|
restrictions on our operations or sales.
|
Our failure to manage the use, transportation, emissions, discharge, storage, recycling, or disposal of hazardous materials could lead to increased costs or future liabilities. Environmental laws and regulations could also require us to acquire pollution abatement or remediation equipment, modify product designs, or incur other expenses. Many new materials that we are evaluating for use in our operations may be subject to regulation under environmental laws and regulations. These restrictions could harm our business and results of operations by increasing our expenses or requiring us to alter manufacturing and assembly and test processes.
22
In addition, the SEC has adopted disclosure rules for companies that use conflict minerals (commonly referred to as tantalum, tin, tungsten, and gold) in their products, with substantial supply chain verification requirements in the event that the materials come from the DRC or adjoining countries. The European Union and other foreign jurisdictions may in the future also enact rules regarding conflict minerals, which could potentially cover additional minerals or locations where minerals originate. Due to the complexity of our supply chain, we may face reputational challenges with our customers, stockholders and other stakeholders if we are unable to sufficiently verify the origins of the conflict minerals used in our products.
Climate change poses both regulatory and physical risks that could harm our results of operations and affect the way we conduct business.
In addition to the possible direct economic impact that climate change could have on us, climate change mitigation programs and regulations can increase our costs. The cost of perfluorocompounds (PFCs)—a gas that we use in manufacturing—could increase under some climate-change-focused emissions trading programs that may be imposed through regulation. If the use of PFCs is prohibited, we would need to obtain substitute materials that may cost more or be less available for our manufacturing operations. Air-quality permit requirements for our manufacturing operations could become more burdensome and cause delays in our ability to modify or build additional manufacturing capacity. Under recently adopted greenhouse gas regulations in the U.S., many of our manufacturing facilities have become “major” sources under the Clean Air Act. At a minimum, this change in status results in some uncertainty as the EPA adopts guidance on its greenhouse gas regulations. Due to the dynamic nature of our operations, these regulations will likely result in increased costs for our U.S. operations. These cost increases could be associated with new air pollution control requirements, and increased or new monitoring, recordkeeping, and reporting of greenhouse gas emissions. We also see the potential for higher energy costs driven by climate change regulations. Our costs could increase if utility companies pass on their costs, such as those associated with carbon taxes, emission cap and trade programs, or renewable portfolio standards. While we maintain business recovery plans that are intended to allow us to recover from natural disasters or other events that can be disruptive to our business, we cannot be sure that our plans will fully protect us from all such disasters or events. Many of our operations are located in semi-arid regions, such as Israel and the southwestern U.S. Some scenarios predict that these regions may become even more vulnerable to prolonged droughts due to climate change.
In order to compete, we must attract, retain, and motivate key employees, and our failure to do so could harm our results of operations.
In order to compete, we must attract, retain, and motivate executives and other key employees. Hiring and retaining qualified executives, scientists, engineers, technical staff, and sales representatives are critical to our business, and competition for experienced employees in the semiconductor industry can be intense. To help attract, retain, and motivate qualified employees, we use share-based incentive awards such as employee stock options and non-vested share units (restricted stock units). If the value of such stock awards does not appreciate as measured by the performance of the price of our common stock, or if our share-based compensation otherwise ceases to be viewed as a valuable benefit, our ability to attract, retain, and motivate employees could be weakened, which could harm our results of operations.
A number of factors could lower interest and other, net harming our results of operations.
Factors that could lower interest and other, net in our consolidated statements of income include changes in fixed-income, equity, and credit markets; foreign currency exchange rates; interest rates; credit standing of financial instrument counterparties; our cash and investment balances; and our indebtedness.
There are inherent limitations on the effectiveness of our controls.
We do not expect that our disclosure controls or our internal control over financial reporting will prevent or detect all error and all fraud. A control system, no matter how well designed and operated, can provide only reasonable, not absolute, assurance that the control system’s objectives will be met. The design of a control system must reflect the fact that there are resource constraints, and the benefits of controls must be considered relative to their costs. Further, because of the inherent limitations in all control systems, no evaluation of controls can provide absolute assurance that misstatements due to error or fraud will not occur or that all control issues and instances of fraud, if any, have been detected. The design of any system of controls is based in part on certain assumptions about the likelihood of future events, and there can be no assurance that any design will succeed in achieving its stated goals under all potential future conditions. Projections of any evaluation of the effectiveness of controls to future periods are subject to risks. Over time, controls may become inadequate because of changes in conditions or deterioration in the degree of compliance with policies or procedures.
23
|
ITEM 1B.
|
UNRESOLVED STAFF COMMENTS
|
Not applicable.
|
ITEM 2.
|
PROPERTIES
|
As of
December 28, 2013
, our major facilities consisted of:
|
(Square Feet in Millions)
|
United
States
|
Other
Countries
|
Total
|
||||||
|
Owned facilities
1
|
29.9
|
|
16.7
|
|
46.6
|
|
|||
|
Leased facilities
2
|
2.3
|
|
6.0
|
|
8.3
|
|
|||
|
Total facilities
|
32.2
|
|
22.7
|
|
54.9
|
|
|||
|
1
|
Leases on portions of the land used for these facilities expire on varying dates through
2062
.
|
|
2
|
Leases expire on varying dates through
2028
and generally include renewals at our option.
|
Our principal executive offices are located in the U.S. and a significant amount of our wafer fabrication activities are also located in the U.S. In addition to our current facilities, we are building a development fabrication facility in Oregon which began R&D start-up in 2013. We expect that this new facility will allow us to widen our process technology lead. We also completed construction of a large-scale fabrication building in Arizona in 2013, which is currently not in use and is not being depreciated. We recently announced that we plan to delay equipment installation in this building and leverage existing fabrication facilities, reserving this new facility for additional capacity and future technologies. Outside the U.S., we have wafer fabrication facilities in Israel, China, and Ireland. Our fabrication facility in Ireland is currently transitioning to a newer process technology node, with manufacturing expected to recommence in 2015. Our assembly and test facilities are located in
Malaysia, China, Costa Rica, and Vietnam
. In addition, we have sales and marketing offices worldwide that are generally located near major concentrations of customers.
We believe that the facilities described above are suitable and adequate for our present purposes and that the productive capacity in our facilities is substantially being utilized or we have plans to utilize it.
We do not identify or allocate assets by operating segment. For information on net property, plant and equipment by country, see “
Note 27: Operating Segments and Geographic Information
” in Part II, Item 8 of this Form 10-K.
|
ITEM 3.
|
LEGAL PROCEEDINGS
|
For a discussion of legal proceedings, see “
Note 26: Contingencies
” in Part II, Item 8 of this Form 10-K.
|
ITEM 4.
|
MINE SAFETY DISCLOSURES
|
Not applicable.
24
|
ITEM 5.
|
MARKET FOR REGISTRANT’S COMMON EQUITY, RELATED STOCKHOLDER MATTERS AND ISSUER PURCHASES OF EQUITY SECURITIES
|
Information regarding the principal U.S. market in which Intel common stock is traded, including the market price range of Intel common stock and dividend information, can be found in “Financial Information by Quarter (Unaudited)” in Part II, Item 8 of this Form 10-K.
As of
February 7, 2014
, there were approximately
144,000
registered holders of record of Intel’s common stock. A substantially greater number of holders of Intel common stock are “street name” or beneficial holders, whose shares of record are held by banks, brokers, and other financial institutions.
Issuer Purchases of Equity Securities
We have an ongoing authorization, originally approved by our Board of Directors in October 2005, and subsequently amended,
to repurchase up to
$45 billion
in shares of our common stock in open market purchases or negotiated transactions. As of
December 28, 2013
,
$3.2 billion
remained available for repurchase under the existing repurchase authorization limit.
Common stock repurchase activity under our publicly announced stock repurchase plan during each quarter of
2013
was as follows:
|
Period
|
Total Number of
Shares Purchased
(In Millions)
|
Average Price
Paid Per Share
|
Dollar Value of
Shares That May
Yet Be Purchased
(In Millions)
|
||||||||
|
December 30, 2012 – March 30, 2013
|
25.2
|
|
$
|
21.13
|
|
$
|
4,799
|
|
|||
|
March 31, 2013 – June 29, 2013
|
23.3
|
|
$
|
23.58
|
|
$
|
4,249
|
|
|||
|
June 30, 2013 – September 28, 2013
|
23.6
|
|
$
|
22.79
|
|
$
|
3,713
|
|
|||
|
September 29, 2013 – December 28, 2013
|
22.0
|
|
$
|
24.02
|
|
$
|
3,185
|
|
|||
|
Total
|
94.1
|
|
$
|
22.83
|
|
||||||
Common stock repurchase activity under our publicly announced stock repurchase plan during the fourth quarter of
2013
was as follows:
|
Period
|
Total Number of
Shares Purchased
(In Millions)
|
Average Price
Paid Per Share
|
Dollar Value of
Shares That May
Yet Be Purchased
Under the Plans
(In Millions)
|
||||||||
|
September 29, 2013 – October 26, 2013
|
6.4
|
|
$
|
23.16
|
|
$
|
3,565
|
|
|||
|
October 27, 2013 – November 23, 2013
|
6.7
|
|
$
|
24.30
|
|
$
|
3,402
|
|
|||
|
November 24, 2013 – December 28, 2013
|
8.9
|
|
$
|
24.43
|
|
$
|
3,185
|
|
|||
|
Total
|
22.0
|
|
$
|
24.02
|
|
||||||
In our consolidated financial statements, we also treat shares withheld for tax purposes on behalf of our employees in connection with the vesting of restricted stock units as common stock repurchases because they reduce the number of shares that would have been issued upon vesting. These withheld shares are not considered common stock repurchases under our authorized common stock repurchase plan
and accordingly are not included in the common stock repurchase totals in the preceding table.
For further discussion, see “
Note 20: Common Stock Repurchases
” in Part II, Item 8 of this Form 10-K.
25
Stock Performance Graph
The line graph that follows compares the cumulative total stockholder return on our common stock with the cumulative total return of the Dow Jones U.S. Technology Index* and the Standard & Poor’s S&P 500* Index for the five years ended
December 28, 2013
. The graph and table assume that $100 was invested on December 26, 2008 (the last day of trading for the fiscal year ended December 27, 2008) in each of our common stock, the Dow Jones U.S. Technology Index, and the S&P 500 Index, and that all dividends were reinvested. Cumulative total stockholder returns for our common stock, the Dow Jones U.S. Technology Index, and the S&P 500 Index are based on our fiscal year.
Comparison of Five-Year Cumulative Return for Intel,
the Dow Jones U.S. Technology Index*, and the S&P 500* Index
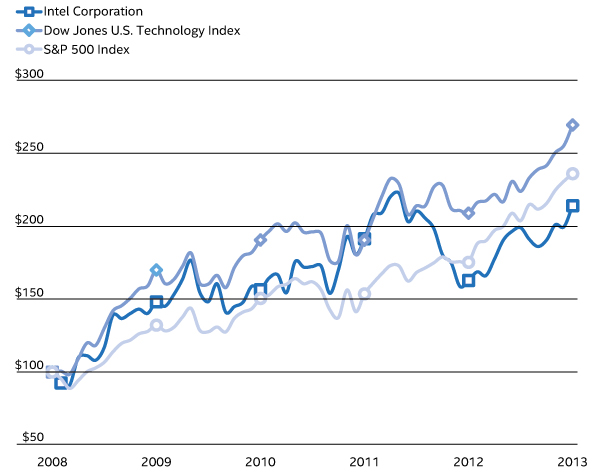
|
|
2008
|
2009
|
2010
|
2011
|
2012
|
2013
|
||||||||||||||||||
|
Intel Corporation
|
$
|
100
|
|
$
|
148
|
|
$
|
157
|
|
$
|
191
|
|
$
|
163
|
|
$
|
214
|
|
||||||
|
Dow Jones U.S. Technology Index
|
$
|
100
|
|
$
|
170
|
|
$
|
191
|
|
$
|
191
|
|
$
|
209
|
|
$
|
270
|
|
||||||
|
S&P 500 Index
|
$
|
100
|
|
$
|
132
|
|
$
|
151
|
|
$
|
154
|
|
$
|
175
|
|
$
|
236
|
|
||||||
26
|
ITEM 6.
|
SELECTED FINANCIAL DATA
|
|
(Dollars in Millions, Except Per Share Amounts)
|
2013
|
2012
|
2011
|
2010
|
2009
|
|||||||||||||||
|
Net revenue
|
$
|
52,708
|
|
$
|
53,341
|
|
$
|
53,999
|
|
$
|
43,623
|
|
$
|
35,127
|
|
|||||
|
Gross margin
|
$
|
31,521
|
|
$
|
33,151
|
|
$
|
33,757
|
|
$
|
28,491
|
|
$
|
19,561
|
|
|||||
|
Gross margin percentage
|
59.8
|
%
|
62.1
|
%
|
62.5
|
%
|
65.3
|
%
|
55.7
|
%
|
||||||||||
|
Research and development (R&D)
|
$
|
10,611
|
|
$
|
10,148
|
|
$
|
8,350
|
|
$
|
6,576
|
|
$
|
5,653
|
|
|||||
|
Marketing, general and administrative (MG&A)
|
$
|
8,088
|
|
$
|
8,057
|
|
$
|
7,670
|
|
$
|
6,309
|
|
$
|
7,931
|
|
|||||
|
R&D and MG&A as percentage of revenue
|
35.5
|
%
|
34.1
|
%
|
29.7
|
%
|
29.5
|
%
|
38.7
|
%
|
||||||||||
|
Operating income
|
$
|
12,291
|
|
$
|
14,638
|
|
$
|
17,477
|
|
$
|
15,588
|
|
$
|
5,711
|
|
|||||
|
Net income
|
$
|
9,620
|
|
$
|
11,005
|
|
$
|
12,942
|
|
$
|
11,464
|
|
$
|
4,369
|
|
|||||
|
Earnings per common share
|
||||||||||||||||||||
|
Basic
|
$
|
1.94
|
|
$
|
2.20
|
|
$
|
2.46
|
|
$
|
2.06
|
|
$
|
0.79
|
|
|||||
|
Diluted
|
$
|
1.89
|
|
$
|
2.13
|
|
$
|
2.39
|
|
$
|
2.01
|
|
$
|
0.77
|
|
|||||
|
Weighted average diluted common shares outstanding
|
5,097
|
|
5,160
|
|
5,411
|
|
5,696
|
|
5,645
|
|
||||||||||
|
Dividends per common share
|
||||||||||||||||||||
|
Declared
|
$
|
0.90
|
|
$
|
0.87
|
|
$
|
0.7824
|
|
$
|
0.63
|
|
$
|
0.56
|
|
|||||
|
Paid
|
$
|
0.90
|
|
$
|
0.87
|
|
$
|
0.7824
|
|
$
|
0.63
|
|
$
|
0.56
|
|
|||||
|
Net cash provided by operating activities
|
$
|
20,776
|
|
$
|
18,884
|
|
$
|
20,963
|
|
$
|
16,692
|
|
$
|
11,170
|
|
|||||
|
Additions to property, plant and equipment
|
$
|
10,711
|
|
$
|
11,027
|
|
$
|
10,764
|
|
$
|
5,207
|
|
$
|
4,515
|
|
|||||
|
Repurchase of common stock
|
$
|
2,440
|
|
$
|
5,110
|
|
$
|
14,340
|
|
$
|
1,736
|
|
$
|
1,762
|
|
|||||
|
Payment of dividends to stockholders
|
$
|
4,479
|
|
$
|
4,350
|
|
$
|
4,127
|
|
$
|
3,503
|
|
$
|
3,108
|
|
|||||
|
(Dollars in Millions)
|
Dec. 28, 2013
|
Dec. 29, 2012
|
Dec. 31, 2011
|
Dec. 25, 2010
|
Dec. 26, 2009
|
|||||||||||||||
|
Property, plant and equipment, net
|
$
|
31,428
|
|
$
|
27,983
|
|
$
|
23,627
|
|
$
|
17,899
|
|
$
|
17,225
|
|
|||||
|
Total assets
|
$
|
92,358
|
|
$
|
84,351
|
|
$
|
71,119
|
|
$
|
63,186
|
|
$
|
53,095
|
|
|||||
|
Long-term debt
|
$
|
13,165
|
|
$
|
13,136
|
|
$
|
7,084
|
|
$
|
2,077
|
|
$
|
2,049
|
|
|||||
|
Stockholders’ equity
|
$
|
58,256
|
|
$
|
51,203
|
|
$
|
45,911
|
|
$
|
49,430
|
|
$
|
41,704
|
|
|||||
|
Employees (in thousands)
|
107.6
|
|
105.0
|
|
100.1
|
|
82.5
|
|
79.8
|
|
||||||||||
During the third quarter of 2013, management approved and communicated several restructuring actions including targeted workforce reductions as well as exit of certain businesses and facilities. For further information, see "
Note 13: Restructuring and Asset Impairment Charges
" in Part II, Item 8 of this Form 10-K.
In 2011, we acquired McAfee and the Wireless Solutions (WLS) business of Infineon Technologies AG, which operates as part of our Multi-Comm and Phone Group operating segments. For further information, see “
Note 8: Acquisitions
” in Part II, Item 8 of this Form 10-K.
27
|
ITEM 7.
|
MANAGEMENT’S DISCUSSION AND ANALYSIS OF FINANCIAL CONDITION AND RESULTS OF OPERATIONS
|
Our Management’s Discussion and Analysis of Financial Condition and Results of Operations (MD&A) is provided in addition to the accompanying consolidated financial statements and notes to assist readers in understanding our results of operations, financial condition, and cash flows. MD&A is organized as follows:
|
•
|
Overview
. Discussion of our business and overall analysis of financial and other highlights affecting the company in order to provide context for the remainder of MD&A.
|
|
•
|
Critical Accounting Estimates
. Accounting estimates that we believe are most important to understanding the assumptions and judgments incorporated in our reported financial results and forecasts.
|
|
•
|
Results of Operations
. An analysis of our financial results comparing
2013
to
2012
and comparing
2012
to
2011
.
|
|
•
|
Liquidity and Capital Resources
. An analysis of changes in our balance sheets and cash flows, and discussion of our financial condition and potential sources of liquidity.
|
|
•
|
Fair Value of Financial Instruments
. Discussion of the methodologies used in the valuation of our financial instruments.
|
|
•
|
Contractual Obligations and Off-Balance-Sheet Arrangements
. Overview of contractual obligations, contingent liabilities, commitments, and off-balance-sheet arrangements outstanding as of
December 28, 2013
, including expected payment schedule.
|
The various sections of this MD&A contain a number of forward-looking statements that involve a number of risks and uncertainties. Words such as “anticipates,” “expects,” “intends,” “plans,” “believes,” “seeks,” “estimates,” “continues,” “may,” “will,” “should,” and variations of such words and similar expressions are intended to identify such forward-looking statements. In addition, any statements that refer to projections of our future financial performance, our anticipated growth and trends in our businesses, uncertain events or assumptions, and other characterizations of future events or circumstances are forward-looking statements. Such statements are based on our current expectations and could be affected by the uncertainties and risk factors described throughout this filing and particularly in “Risk Factors” in Part I, Item 1A of this Form 10-K. Our actual results may differ materially, and these forward-looking statements do not reflect the potential impact of any divestitures, mergers, acquisitions, or other business combinations that had not been completed as of
February 14, 2014
.
Overview
Our results of operations for each period were as follows:
|
|
Three Months Ended
|
Twelve Months Ended
|
||||||||||||||||||||||
|
(Dollars in Millions, Except Per Share Amounts)
|
Dec. 28,
2013
|
Sept. 28,
2013
|
Change
|
Dec. 28,
2013
|
Dec. 29,
2012
|
Change
|
||||||||||||||||||
|
Net revenue
|
$
|
13,834
|
|
$
|
13,483
|
|
$
|
351
|
|
$
|
52,708
|
|
$
|
53,341
|
|
$
|
(633
|
)
|
||||||
|
Gross margin
|
$
|
8,571
|
|
$
|
8,414
|
|
$
|
157
|
|
$
|
31,521
|
|
$
|
33,151
|
|
$
|
(1,630
|
)
|
||||||
|
Gross margin percentage
|
62.0
|
%
|
62.4
|
%
|
(0.4
|
)%
|
59.8
|
%
|
62.1
|
%
|
(2.3
|
)%
|
||||||||||||
|
Operating income
|
$
|
3,549
|
|
$
|
3,504
|
|
$
|
45
|
|
$
|
12,291
|
|
$
|
14,638
|
|
$
|
(2,347
|
)
|
||||||
|
Net income
|
$
|
2,625
|
|
$
|
2,950
|
|
$
|
(325
|
)
|
$
|
9,620
|
|
$
|
11,005
|
|
$
|
(1,385
|
)
|
||||||
|
Diluted earnings per common share
|
$
|
0.51
|
|
$
|
0.58
|
|
$
|
(0.07
|
)
|
$
|
1.89
|
|
$
|
2.13
|
|
$
|
(0.24
|
)
|
||||||
Revenue for 2013 was down 1% from 2012. PCCG experienced lower platform unit sales in the first half of the year, but saw offsetting growth in the back half as the PC market began to show signs of stabilization. DCG continued to benefit from the build out of Internet cloud computing and the strength of our product portfolio resulting in increased platform volumes for DCG for the year. Higher factory start-up costs for our next-generation 14nm process technology led to a decrease in gross margin compared to 2012. In response to the current business environment and to better align resources, management approved several restructuring actions including targeted workforce reductions as well as the exit of certain businesses and facilities. These actions resulted in restructuring and asset impairment charges of $240 million for 2013
.
28
MANAGEMENT’S DISCUSSION AND ANALYSIS OF FINANCIAL CONDITION AND RESULTS OF OPERATIONS (Continued)
Our Q4 2013 revenue of $13.8 billion was up 3% from Q3 2013. The sequential increase was a result of stabilization in the PC market which generated 3% higher platform unit sales for PCCG. Gross margin remained flat sequentially as lower platform unit costs were offset by higher factory start-up costs for our 14nm process technology. The platform unit cost decline is attributable to our 22nm process technology coming down the cost curve as we ramp the 4th generation Intel Core processor family products in multiple fabrication facilities.
In 2013, we introduced many new product technologies across all of our businesses. Our product launches included the 4th generation Intel Core processor family, Intel Xeon 22nm processors, and Intel Atom microarchitecture platforms. As 2013 progressed, we shifted our focus and investment strategy in order to increase our cadence for bringing innovative products to market. One example is the announcement of Intel Quark SoC which is an ultra-low power and cost architecture designed for the Internet of Things, from industrial machines to future wearable devices
.
The cash generation from our business remained strong with cash from operations of $20.8 billion in 2013. We ended the year with an investment portfolio of $20.1 billion, which consisted of cash and cash equivalents, short-term investments, and trading assets. We returned $4.5 billion to stockholders through dividends and repurchased $2.1 billion of common stock through our common stock repurchase program. We purchased $10.7 billion in capital assets as we continued making investments in new architectures and product offerings. In January 2014, the Board of Directors declared a cash dividend of $0.225 per common share to be paid in Q1 2014
.
Looking ahead to 2014, we expect revenue and gross margin to remain flat. We believe our product offerings and architectures will enable innovation and allow for future growth in the PC market through all-in-ones, 2 in 1s, convertibles and detachables. The launch of new low-power, high-performance products will continue to expand our footprint in tablets and our Internet of Things business. We also continue to make progress with the industry’s first 14nm manufacturing process and our second generation 3-D transistors (code-named “Broadwell”). Our second generation 3-D transistors will begin production in Q1 2014 and is expected to launch in the second half of 2014. As we continue to align resources to focus on tablets, low-power SoCs, and the data center, we will also streamline our overall investment position in order to hold spending flat for the year.
Our Business Outlook for Q1 2014 and full-year 2014 includes, where applicable, our current expectations for revenue, gross margin percentage, spending (R&D plus MG&A), and capital expenditures. We will keep our most current Business Outlook publicly available on our Investor Relations web site
www.intc.com
. This Business Outlook is not incorporated by reference in this Form 10-K. We expect that our corporate representatives will, from time to time, meet publicly or privately with investors and others, and may reiterate the forward-looking statements contained in the Business Outlook or in this Form 10-K.
The statements in the Business Outlook and forward-looking statements in this Form 10-K are subject to revision during the course of the year in our quarterly earnings releases and SEC filings and at other times. The forward-looking statements in the Business Outlook will be effective through the close of business on March 14, 2014, unless updated earlier. From the close of business on March 14, 2014, until our quarterly earnings release is published, currently scheduled for April 15, 2014, we will observe a “quiet period.” During the quiet period, the Business Outlook and other forward-looking statements first published in our Form 8-K filed on January 16, 2014, and other forward-looking statements disclosed in the company's news releases and filings with the SEC, as reiterated or updated as applicable in this Form 10-K, should be considered historical, speaking as of prior to the quiet period only and not subject to update. During the quiet period, our representatives will not comment on our Business Outlook or our financial results or expectations. The exact timing and duration of the routine quiet period, and any others that we utilize from time to time, may vary at our discretion.
29
MANAGEMENT’S DISCUSSION AND ANALYSIS OF FINANCIAL CONDITION AND RESULTS OF OPERATIONS (Continued)
Critical Accounting Estimates
The methods, estimates, and judgments that we use in applying our accounting policies have a significant impact on the results that we report in our consolidated financial statements. Some of our accounting policies require us to make difficult and subjective judgments, often as a result of the need to make estimates regarding matters that are inherently uncertain. Our most critical accounting estimates include:
|
•
|
the valuation of non-marketable equity investments and the determination of other-than-temporary impairments, which impact gains (losses) on equity investments, net when we record impairments;
|
|
•
|
the assessment of recoverability of long-lived assets (property, plant and equipment; goodwill; and identified intangibles), which impacts gross margin or operating expenses when we record asset impairments or accelerate their depreciation or amortization;
|
|
•
|
the recognition and measurement of current and deferred income taxes (including the measurement of uncertain tax positions), which impact our provision for taxes;
|
|
•
|
the valuation of inventory, which impacts gross margin; and
|
|
•
|
the recognition and measurement of loss contingencies, which impact gross margin or operating expenses when we recognize a loss contingency, revise the estimate for a loss contingency, or record an asset impairment.
|
In the following section, we discuss these policies further, as well as the estimates and judgments involved.
Non-Marketable Equity Investments
We regularly invest in non-marketable equity instruments of private companies, which range from early-stage companies that are often still defining their strategic direction to more mature companies with established revenue streams and business models. The carrying value of our non-marketable equity investment portfolio, excluding equity derivatives, totaled
$2.3 billion
as of
December 28, 2013
(
$2.2 billion
as of
December 29, 2012
).
Our non-marketable equity investments are recorded using the cost method or the equity method of accounting, depending on the facts and circumstances of each investment. Our non-marketable equity investments are classified within other long-term assets on the consolidated balance sheets.
Non-marketable equity investments are inherently risky, and their success depends on product development, market acceptance, operational efficiency, and other key business factors. The companies could fail or not be able to raise additional funds when needed, or they may receive lower valuations with less favorable investment terms than previous financings. These events could cause our investments to become impaired. In addition, financial market volatility could negatively affect our ability to realize value in our investments through liquidity events such as initial public offerings, mergers, and private sales. For further information about our investment portfolio risks, see “Risk Factors” in Part I, Item 1A of this Form 10-K.
We determine the fair value of our non-marketable equity investments portfolio quarterly for disclosure purposes; however, the investments are recorded at fair value only if an impairment charge is recognized. We determine the fair value of our non-marketable equity investments using the market and income approaches. The market approach includes the use of financial metrics and ratios of comparable public companies, such as projected revenue, earnings, and comparable performance multiples. The selection of comparable companies requires management judgment and is based on a number of factors, including comparable companies’ sizes, growth rates, industries, and development stages. The income approach includes the use of a discounted cash flow model, which requires significant estimates regarding the investees' revenue, costs, and discount rates based on the risk profile of comparable companies. Estimates of revenue and costs are developed using available market, historical, and forecast data. The valuation of these non-marketable equity investments also takes into account variables such as conditions reflected in the capital markets, recent financing activities by the investees, the investees’ capital structures, the terms of the investees’ issued interests, and the lack of marketability of the investments.
30
MANAGEMENT’S DISCUSSION AND ANALYSIS OF FINANCIAL CONDITION AND RESULTS OF OPERATIONS (Continued)
For non-marketable equity investments, the measurement of fair value requires significant judgment and includes quantitative and qualitative analysis of identified events or circumstances that impact the fair value of the investment, such as:
|
•
|
the investee’s revenue and earnings trends relative to pre-defined milestones and overall business prospects;
|
|
•
|
the technological feasibility of the investee’s products and technologies;
|
|
•
|
the general market conditions in the investee’s industry or geographic area, including adverse regulatory and economic changes;
|
|
•
|
factors related to the investee’s ability to remain in business, such as the investee’s liquidity, debt ratios, and the rate at which the investee is using its cash; and
|
|
•
|
the investee’s receipt of additional funding at a lower valuation.
|
If the fair value of an investment is below our carrying value, we determine whether the investment is other-than-temporarily impaired based on our quantitative and qualitative analysis, which includes assessing the severity and duration of the impairment and the likelihood of recovery before disposal. If the investment is considered to be other-than-temporarily impaired, we write down the investment to its fair value. Impairments of non-marketable equity investments were
$112 million
in
2013
(
$104 million
in
2012
and
$63 million
in
2011
).
Long-Lived Assets
Property, Plant and Equipment
We assess property, plant and equipment for impairment when events or changes in circumstances indicate that the carrying value of the assets or the asset grouping may not be recoverable. Factors that we consider in deciding when to perform an impairment review include significant under-performance of a business or product line in relation to expectations, significant negative industry or economic trends, and significant changes or planned changes in our use of the assets. We measure the recoverability of assets that we will continue to use in our operations by comparing the carrying value of the asset grouping to our estimate of the related total future undiscounted net cash flows. If an asset grouping’s carrying value is not recoverable through the related undiscounted cash flows, the asset grouping is considered to be impaired. We measure the impairment by comparing the difference between the asset grouping’s carrying value and its fair value. Property, plant and equipment is considered a non-financial asset and is recorded at fair value only if an impairment charge is recognized.
Impairments are determined for groups of assets related to the lowest level of identifiable independent cash flows. Due to our asset usage model and the interchangeable nature of our semiconductor manufacturing capacity, we must make subjective judgments in determining the independent cash flows that can be related to specific asset groupings. In addition, as we make manufacturing process conversions and other factory planning decisions, we must make subjective judgments regarding the remaining useful lives of assets, primarily process-specific semiconductor manufacturing tools and building improvements. When we determine that the useful lives of assets are shorter than we had originally estimated, we accelerate the rate of depreciation over the assets’ new, shorter useful lives. Based on our analysis, impairments and accelerated depreciation of our property, plant, and equipment was
$172 million
in
2013
(
$73 million
in
2012
and
$100 million
in
2011
).
Goodwill
Goodwill is recorded when the purchase price for an acquisition exceeds the estimated fair value of the net tangible and identified intangible assets acquired. Goodwill is allocated to our reporting units based on relative fair value of the future benefit of the purchased operations to our existing business units as well as the acquired business unit. Reporting units may be operating segments as a whole or an operation one level below an operating segment, referred to as a component. Our reporting units are consistent with the operating segments identified in “
Note 27: Operating Segments and Geographic Information
” in Part II, Item 8 of this Form 10-K.
We perform an annual impairment assessment in the fourth quarter of each year, or more frequently if indicators of potential impairment exist, to determine whether it is more likely than not that the fair value of a reporting unit in which goodwill resides is less than its carrying value. For reporting units in which this assessment concludes that it is more likely than not that the fair value is more than its carrying value, goodwill is not considered impaired and we are not required to perform the two-step goodwill impairment test. Qualitative factors considered in this assessment include industry and market considerations, overall financial performance, and other relevant events and factors affecting the reporting unit.
31
MANAGEMENT’S DISCUSSION AND ANALYSIS OF FINANCIAL CONDITION AND RESULTS OF OPERATIONS (Continued)
For reporting units in which the impairment assessment concludes that it is more likely than not that the fair value is less than its carrying value, we perform the first step of the goodwill impairment test, which compares the fair value of the reporting unit to its carrying value. If the fair value of the reporting unit exceeds the carrying value of the net assets assigned to that unit, goodwill is not considered impaired and we are not required to perform additional analysis. If the carrying value of the net assets assigned to the reporting unit exceeds the fair value of the reporting unit, then we must perform the second step of the goodwill impairment test to determine the implied fair value of the reporting unit’s goodwill. If we determine during the second step that the carrying value of a reporting unit’s goodwill exceeds its implied fair value, we record an impairment loss equal to the difference.
Determining the fair value of a reporting unit involves the use of significant estimates and assumptions. Our goodwill impairment test uses a weighting of the income method and the market method to estimate a reporting unit’s fair value. The income method is based on a discounted future cash flow approach that uses the following reporting unit estimates: revenue, based on assumed market segment growth rates and our assumed market segment share; estimated costs; and appropriate discount rates based on a reporting unit's weighted average cost of capital as determined by considering the observable weighted average cost of capital of comparable companies. Our estimates of market segment growth, our market segment share, and costs are based on historical data, various internal estimates, and a variety of external sources. These estimates are developed as part of our routine long-range planning process. The same estimates are also used in planning for our long-term manufacturing and assembly and test capacity needs as part of our capital budgeting process, and for long-term and short-term business planning and forecasting. We test the reasonableness of the inputs and outcomes of our discounted cash flow analysis against available comparable market data. The market method is based on financial multiples of comparable companies and applies a control premium. A reporting unit’s carrying value represents the assignment of various assets and liabilities, excluding certain corporate assets and liabilities, such as cash, investments, and debt.
For the annual impairment assessment in
2013
, we determined that for each of our reporting units with significant amounts of goodwill, it was more likely than not that the fair value of the reporting units exceeded the carrying value. As a result, we concluded that performing the first step of the goodwill impairment test was not necessary for those reporting units. During the fourth quarter of each of the prior three fiscal years, we have completed our annual impairment assessments and concluded that goodwill was not impaired in any of these years.
Identified Intangibles
We make judgments about the recoverability of purchased finite-lived intangible assets whenever events or changes in circumstances indicate that an impairment may exist. Recoverability of finite-lived intangible assets is measured by comparing the carrying amount of the asset to the future undiscounted cash flows that the asset is expected to generate. We perform an annual impairment assessment in the fourth quarter of each year for indefinite-lived intangible assets, or more frequently if indicators of potential impairment exist, to determine whether it is more likely than not that the carrying value of the assets may not be recoverable. Recoverability of indefinite-lived intangible assets is measured by comparing the carrying amount of the asset to the future discounted cash flows that the asset is expected to generate. If we determine that an individual asset is impaired, the amount of any impairment is measured as the difference between the carrying value and the fair value of the impaired asset.
The assumptions and estimates used to determine future values and remaining useful lives of our intangible and other long-lived assets are complex and subjective. They can be affected by various factors, including external factors such as industry and economic trends, and internal factors such as changes in our business strategy and our forecasts for specific product lines. Based on our impairment assessment, we recognized impairment charges of
$17 million
in
2013
(
$21 million
in
2012
and
$10 million
in
2011
).
Income Taxes
We must make estimates and judgments in determining the provision for taxes for financial statement purposes. These estimates and judgments occur in the calculation of tax credits, benefits, and deductions, and in the calculation of certain tax assets and liabilities that arise from differences in the timing of recognition of revenue and expense for tax and financial statement purposes, as well as the interest and penalties related to uncertain tax positions. Significant changes in these estimates may result in an increase or decrease to our tax provision in a subsequent period.
32
MANAGEMENT’S DISCUSSION AND ANALYSIS OF FINANCIAL CONDITION AND RESULTS OF OPERATIONS (Continued)
We must assess the likelihood that we will be able to recover our deferred tax assets. If recovery is not more likely than not, we must increase our provision for taxes by recording a valuation allowance against the deferred tax assets that we estimate will not ultimately be recoverable. We believe that we will ultimately recover the deferred tax assets recorded on our consolidated balance sheets. However, should a change occur in our ability to recover our deferred tax assets, our tax provision would increase in the period in which we determined that the recovery is not more likely than not. Recovery of a portion of our deferred tax assets is impacted by management’s plans with respect to holding or disposing of certain investments; therefore, changes in management’s plans with respect to holding or disposing of investments could affect our future provision for taxes.
We recognize liabilities for uncertain tax positions based on a two-step process. The first step is to evaluate the tax position for recognition by determining whether the weight of available evidence indicates that it is more likely than not that the position will be sustained on audit, including resolution of related appeals or litigation processes, if any. If we determine that a tax position will more likely than not be sustained on audit, the second step requires us to estimate and measure the tax benefit as the largest amount that is more than
50%
likely to be realized upon ultimate settlement. We consider many factors when evaluating and estimating our tax positions and tax benefits, which may require periodic adjustments and may not accurately forecast actual outcomes. Determining whether an uncertain tax position is effectively settled requires judgment. Such a change in recognition or measurement would result in the recognition of a tax benefit or an additional charge to the tax provision.
We have not recognized U.S. deferred income taxes on certain undistributed non-U.S. earnings because we plan to indefinitely reinvest such earnings outside the U.S. Remittances of non-U.S. earnings are based on estimates and judgments of projected cash flow needs as well as the working capital and investment requirements of our non-U.S. and U.S. operations. Material changes in our estimates of cash, working capital, and investment needs in the various jurisdictions could require repatriation of indefinitely reinvested non-U.S. earnings, which would be subject to U.S. income taxes and applicable non-U.S. income and withholding taxes.
Inventory
Intel has a product development lifecycle that corresponds with substantive engineering milestones. These engineering milestones are regularly and consistently applied in assessing the point at which our activities, and associated costs, change in nature from R&D to cost of sales. In order for a product to be manufactured in high volumes and sold to our customers under our standard warranty, it must meet our rigorous technical quality specifications. This milestone is known as product release qualification (PRQ). We have identified PRQ as the point at which the costs incurred to manufacture our products are included in the valuation of inventory.
To determine which costs can be included in the valuation of inventory, we must determine normal capacity at our manufacturing and assembly and test facilities, based on historical loadings compared to total available capacity. If the factory loadings are below the established normal capacity level, a portion of our manufacturing overhead costs would not be included in the cost of inventory; therefore, it would be recognized as cost of sales in that period, which would negatively impact our gross margin. We refer to these costs as excess capacity charges. Excess capacity charges were
$319 million
in
2013
(
$540 million
in
2012
and
$46 million
in
2011
).
Inventory is valued at the lower of cost or market based upon assumptions about future demand and market conditions. Product-specific facts and circumstances reviewed in the inventory valuation process include a review of our customer base, the stage of the product life cycle of our products, consumer confidence, customer acceptance of our products, and an assessment of selling price in relation to product cost. If the estimated market value of the inventory is less than the carrying value, we write down the inventory and record the difference as a charge to cost of sales.
The valuation of inventory also requires us to estimate obsolete and excess inventory as well as inventory that is not of saleable quality. The demand forecast is utilized in the development of our short-term manufacturing plans to enable consistency between inventory valuation and build decisions. The estimate of future demand is compared to work-in-process and finished goods inventory levels to determine the amount, if any, of obsolete or excess inventory. If our demand forecast for specific products is greater than actual demand and we fail to reduce manufacturing output accordingly, we could be required to write off inventory, which would negatively impact our gross margin.
33
MANAGEMENT’S DISCUSSION AND ANALYSIS OF FINANCIAL CONDITION AND RESULTS OF OPERATIONS (Continued)
Loss Contingencies
We are subject to various legal and administrative proceedings and asserted and potential claims, as well as accruals related to repair or replacement of parts in connection with product errata and product warranties that arise in the ordinary course of business. An estimated loss from such contingencies is recognized as a charge to income if it is probable that a liability has been incurred and the amount of the loss can be reasonably estimated. Disclosure of a loss contingency is required if there is at least a reasonable possibility that a material loss has been incurred. The outcomes of legal and administrative proceedings and claims, and the estimation of product warranties and asset impairments, are subject to significant uncertainty. Significant judgment is required in both the determination of probability and the determination as to whether a loss is reasonably estimable. With respect to estimating the losses associated with repairing and replacing parts in connection with product errata, we make judgments with respect to the return rates to our customers, our customers' return rates, and the costs to repair or replace parts. At least quarterly, we review the status of each significant matter, and we may revise our estimates. These revisions could have a material impact on our results of operations and financial position.
Accounting Changes
For a description of accounting changes, see “
Note 3: Accounting Changes
” in Part II, Item 8 of this Form 10-K.
Results of Operations
Certain consolidated statements of income data as a percentage of net revenue for each period were as follows:
|
|
2013
|
2012
|
2011
|
||||||||||||||||||
|
(Dollars in Millions, Except Per Share Amounts)
|
Dollars
|
% of Net
Revenue
|
Dollars
|
% of Net
Revenue
|
Dollars
|
% of Net
Revenue
|
|||||||||||||||
|
Net revenue
|
$
|
52,708
|
|
100.0
|
%
|
$
|
53,341
|
|
100.0
|
%
|
$
|
53,999
|
|
100.0
|
%
|
||||||
|
Cost of sales
|
21,187
|
|
40.2
|
%
|
20,190
|
|
37.9
|
%
|
20,242
|
|
37.5
|
%
|
|||||||||
|
Gross margin
|
31,521
|
|
59.8
|
%
|
33,151
|
|
62.1
|
%
|
33,757
|
|
62.5
|
%
|
|||||||||
|
Research and development
|
10,611
|
|
20.1
|
%
|
10,148
|
|
19.0
|
%
|
8,350
|
|
15.4
|
%
|
|||||||||
|
Marketing, general and administrative
|
8,088
|
|
15.3
|
%
|
8,057
|
|
15.1
|
%
|
7,670
|
|
14.2
|
%
|
|||||||||
|
Restructuring and asset impairment charges
|
240
|
|
0.5
|
%
|
—
|
|
—
|
%
|
—
|
|
—
|
%
|
|||||||||
|
Amortization of acquisition-related intangibles
|
291
|
|
0.6
|
%
|
308
|
|
0.6
|
%
|
260
|
|
0.5
|
%
|
|||||||||
|
Operating income
|
12,291
|
|
23.3
|
%
|
14,638
|
|
27.4
|
%
|
17,477
|
|
32.4
|
%
|
|||||||||
|
Gains (losses) on equity investments, net
|
471
|
|
0.9
|
%
|
141
|
|
0.3
|
%
|
112
|
|
0.2
|
%
|
|||||||||
|
Interest and other, net
|
(151
|
)
|
(0.3
|
)%
|
94
|
|
0.2
|
%
|
192
|
|
0.3
|
%
|
|||||||||
|
Income before taxes
|
12,611
|
|
23.9
|
%
|
14,873
|
|
27.9
|
%
|
17,781
|
|
32.9
|
%
|
|||||||||
|
Provision for taxes
|
2,991
|
|
5.7
|
%
|
3,868
|
|
7.3
|
%
|
4,839
|
|
8.9
|
%
|
|||||||||
|
Net income
|
$
|
9,620
|
|
18.3
|
%
|
$
|
11,005
|
|
20.6
|
%
|
$
|
12,942
|
|
24.0
|
%
|
||||||
|
Diluted earnings per common share
|
$
|
1.89
|
|
$
|
2.13
|
|
$
|
2.39
|
|
||||||||||||
Our net revenue for 2013 decreased by $633 million, or 1%, compared to 2012. The PCCG and DCG platform unit sales decreased by 3%. Additionally, lower netbook platform and feature and entry phone component unit sales contributed to the decrease. These decreases were partially offset by higher PCCG and DCG platform average selling prices, which were up 2%, as well as higher ISG platform average selling prices.
Our overall gross margin dollars for 2013 decreased by $1.6 billion, or 5%, compared to 2012. The decrease was due in large part to $1.8 billion of higher factory start-up costs primarily for our next-generation 14nm process technology. To a lesser extent, lower overall revenue from our Other IA operating segments, primarily in our phone and mobile component businesses and netbook group, as well as lower PCCG and DCG platform revenue contributed to the decrease. These decreases were partially offset by higher ISG platform revenue, approximately $325 million of lower PCCG and DCG platform unit costs, and $221 million of lower excess capacity charges.
34
MANAGEMENT’S DISCUSSION AND ANALYSIS OF FINANCIAL CONDITION AND RESULTS OF OPERATIONS (Continued)
Our overall gross margin percentage decreased to 59.8% in 2013 from 62.1% in 2012. The decrease in the gross margin percentage was primarily due to the gross margin percentage decrease in PCCG. We derived most of our overall gross margin dollars in 2013 and 2012 from the sale of platforms in the PCCG and DCG operating segments.
Our net revenue for 2012, which included 52 weeks, decreased by $658 million, or 1%, compared to 2011, which included 53 weeks. The PCCG and DCG platform unit sales decreased 1% while average selling prices were unchanged. Additionally, lower netbook platform unit sales and Multi-Comm average selling prices, primarily discrete modems, contributed to the decrease. These decreases were partially offset by our McAfee operating segment, which we acquired in the Q1 2011. McAfee contributed $469 million of additional revenue in 2012 compared to 2011.
Our overall gross margin dollars for 2012 decreased by $606 million, or 2%, compared to 2011. The decrease was due in large part to $494 million of excess capacity charges, as well as lower revenue from the PCCG and DCG platform. To a lesser extent, approximately $390 million of higher unit costs on the PCCG and DCG platform as well as lower netbook and Multi-Comm revenue contributed to the decrease. The decrease was partially offset by $643 million of lower factory start-up costs as we transition from our 22nm process technology to R&D of our next-generation 14nm process technology, as well as $422 million of charges recorded in 2011 to repair and replace materials and systems impacted by a design issue related to our Intel
®
6 Series Express Chipset family. The decrease was also partially offset by the two additional months of results from our acquisition of McAfee, which occurred on February 28, 2011, contributing approximately $334 million of additional gross margin dollars in 2012 compared to 2011. The amortization of acquisition-related intangibles resulted in a $557 million reduction to our overall gross margin dollars in 2012, compared to $482 million in 2011, primarily due to acquisitions completed in Q1 2011.
Our overall gross margin percentage in 2012 was flat from 2011 as higher excess capacity charges and higher unit costs on the PCCG and DCG platform were offset by lower factory start-up costs and no impact in 2012 for a design issue related to our Intel 6 Series Express Chipset family. We derived a substantial majority of our overall gross margin dollars in 2012 and 2011 from the sale of platforms in the PCCG and DCG operating segments.
PC Client Group
The revenue and operating income for the PCCG operating segment for each period were as follows:
|
(In Millions)
|
2013
|
2012
|
2011
|
|||||||||
|
Net revenue
|
$
|
33,039
|
|
$
|
34,504
|
|
$
|
35,624
|
|
|||
|
Operating income
|
$
|
11,827
|
|
$
|
13,106
|
|
$
|
14,840
|
|
|||
Net revenue for the PCCG operating segment decreased by $1.5 billion, or 4%, in 2013 compared to 2012. PCCG platform unit sales were down 3% primarily on softness in traditional PC demand during the first nine months of the year. The decrease in revenue was driven by lower notebook and desktop platform unit sales which were down 4% and 2%, respectively. PCCG platform average selling prices were flat, with 6% higher desktop platform average selling prices offset by 4% lower notebook platform average selling prices.
Operating income decreased by $1.3 billion, or 10%, in 2013 compared to 2012, which was driven by $1.5 billion of lower gross margin, partially offset by $200 million of lower operating expenses. The decrease in gross margin was driven by $1.5 billion of higher factory start-up costs primarily on our next-generation 14nm process technology as well as lower PCCG platform revenue. These decreases were partially offset by approximately $520 million of lower PCCG platform unit costs, $260 million of lower excess capacity charges, and higher sell-through of previously non-qualified units.
Net revenue for the PCCG operating segment decreased by $1.1 billion, or 3%, in 2012 compared to 2011. PCCG revenue was negatively impacted by the growth of tablets as these devices compete with PCs for consumer sales. Platform average selling prices and unit sales decreased 2% and 1%, respectively. The decrease was driven by 6% lower notebook platform average selling prices and 5% lower desktop platform unit sales. These decreases were partially offset by a 4% increase in desktop platform average selling prices and a 2% increase in notebook platform unit sales.
35
MANAGEMENT’S DISCUSSION AND ANALYSIS OF FINANCIAL CONDITION AND RESULTS OF OPERATIONS (Continued)
Operating income decreased by $1.7 billion, or 12%, in 2012 compared to 2011 driven by $644 million of lower gross margin and $1.1 billion of higher operating expenses. The decrease in gross margin was primarily due to lower platform revenue. Additionally, $457 million of higher excess capacity charges and approximately $350 million of higher platform unit costs contributed to the decrease. These decreases were partially offset by $785 million of lower factory start-up costs as we transition from manufacturing start-up costs related to our 22nm process technology to R&D of our next-generation 14nm process technology. Additionally, the first half of 2011 included $
422 million
of charges recorded to repair and replace materials and systems impacted by the design issue related to our Intel 6 Series Express Chipset family.
Data Center Group
The revenue and operating income for the DCG operating segment for each period were as follows:
|
(In Millions)
|
2013
|
2012
|
2011
|
|||||||||
|
Net revenue
|
$
|
11,238
|
|
$
|
10,511
|
|
$
|
9,911
|
|
|||
|
Operating income
|
$
|
5,164
|
|
$
|
5,020
|
|
$
|
5,053
|
|
|||
Net revenue for the DCG operating segment increased by $727 million, or 7%, in 2013 compared to 2012. DCG platform average selling prices and unit sales were up 4% and 3%, respectively. Our platform unit sales continued to benefit from growth in the Internet cloud computing and high performance computing market segments.
Operating income increased $144 million, or 3%, in 2013 compared to 2012 with $148 million of higher gross margin offset by higher operating expenses. Gross margin was positively impacted by higher platform revenue, partially offset by $274 million of higher factory start-up costs for our next-generation 14nm process technology, and approximately $190 million of higher DCG platform unit costs.
Net revenue for the DCG operating segment increased by $600 million, or 6%, in 2012 compared to 2011. The increase in revenue was due to 6% higher platform average selling prices, slightly offset by 1% lower platform unit sales. Our platform average selling prices benefited from significant growth in the Internet cloud computing and high performance computing market segments. This was offset by weakness in the enterprise server market segment.
Operating income decreased by $33 million in 2012 compared to 2011 as $356 million of higher gross margin was more than offset by $389 million of higher operating expenses. The increase in gross margin was primarily due to higher platform revenue.
Other Intel Architecture Operating Segments
The revenue and operating income (loss) for the other Intel architecture operating segments, including ISG, Multi-Comm, the Tablet Group, the Phone Group, the Service Provider Group, the Netbook Group, and the New Devices Group for each period were as follows:
|
(In Millions)
|
2013
|
2012
|
2011
|
|||||||||
|
Net revenue
|
$
|
4,092
|
|
$
|
4,378
|
|
$
|
5,005
|
|
|||
|
Operating income (loss)
|
$
|
(2,445
|
)
|
$
|
(1,377
|
)
|
$
|
(577
|
)
|
|||
Net revenue for the Other IA operating segments decreased by $286 million, or 7%, in 2013 compared to 2012. The decrease was primarily due to lower netbook platform, feature and entry phone components, and Multi-Comm unit sales. To a lesser extent, lower Multi-Comm average selling prices contributed to the decrease. These decreases were partially offset by higher ISG revenue on increased platform average selling prices.
Operating results for the Other IA operating segments decreased by $1.1 billion in 2013 compared to 2012. The decline in operating results was primarily due to approximately $590 million of higher operating expenses in the Other IA operating segments on R&D investments in our smartphone and tablet products as well as higher cost of sales as we ramp our tablet business. Additionally, lower netbook platform and Multi-Comm revenue contributed to the decrease. These decreases were partially offset by higher ISG revenue.
36
MANAGEMENT’S DISCUSSION AND ANALYSIS OF FINANCIAL CONDITION AND RESULTS OF OPERATIONS (Continued)
Net revenue for the Other IA operating segments decreased by $627 million, or 13%, in 2012 compared to 2011. The decrease was primarily due to lower netbook platform unit sales and lower Multi-Comm average selling prices. To a lesser extent, lower netbook platform average selling prices contributed to the decrease. These decreases were partially offset by higher ISG platform average selling prices.
Operating results for the Other IA operating segments decreased by $800 million from an operating loss of $577 million in 2011 to an operating loss of $1.4 billion in 2012. The decline in operating results was primarily due to lower netbook revenue and higher operating expenses in the Other IA operating segments. To a lesser extent, lower Multi-Comm revenue contributed to the decrease.
Software and Services Operating Segments
The revenue and operating income (loss) for the SSG operating segments, including McAfee, the Wind River Software Group, and the Software and Services Group, for each period were as follows:
|
(In Millions)
|
2013
|
2012
|
2011
|
|||||||||
|
Net revenue
|
$
|
2,502
|
|
$
|
2,381
|
|
$
|
1,870
|
|
|||
|
Operating income (loss)
|
$
|
1
|
|
$
|
(11
|
)
|
$
|
(32
|
)
|
|||
Net revenue for the SSG operating segments increased by $121 million in 2013 compared to 2012. The increase was primarily driven by higher McAfee revenue.
The operating results for the SSG operating segments increased by $12 million in 2013 compared to 2012. The increase was primarily driven by higher McAfee revenue, partially offset by higher McAfee operating expenses.
Net revenue for the SSG operating segments increased by $511 million in 2012 compared to 2011. The increase was primarily due to two months of incremental revenue from McAfee of $469 million. McAfee was acquired on February 28, 2011.
The operating results for the SSG operating segments increased by $21 million in 2012 compared to 2011. The increase was primarily due to higher McAfee revenue, partially offset by higher McAfee operating expenses.
Operating Expenses
Operating expenses for each period were as follows:
|
(Dollars In Millions)
|
2013
|
2012
|
2011
|
|||||||||
|
Research and development (R&D)
|
$
|
10,611
|
|
$
|
10,148
|
|
$
|
8,350
|
|
|||
|
Marketing, general and administrative (MG&A)
|
$
|
8,088
|
|
$
|
8,057
|
|
$
|
7,670
|
|
|||
|
R&D and MG&A as percentage of net revenue
|
35
|
%
|
34
|
%
|
30
|
%
|
||||||
|
Restructuring and asset impairment charges
|
$
|
240
|
|
$
|
—
|
|
$
|
—
|
|
|||
|
Amortization of acquisition-related intangibles
|
$
|
291
|
|
$
|
308
|
|
$
|
260
|
|
|||
Research and Development.
R&D spending
increased
by
$463 million
, or
5%
, in
2013
compared to
2012
. The
increase
was driven by higher investments in our products, primarily smartphones and tablets, as well higher compensation expenses due to annual salary increases. This
increase
was partially offset by lower process development costs as we transitioned from R&D to manufacturing for our 14nm process technology.
R&D spending
increased
by
$1.8 billion
, or
22%
, in
2012
compared to
2011
. The
increase
was driven by investments in our products for smartphones, tablets, Ultrabook devices, and data centers. Additionally, R&D spending increased due to higher process development costs for our 14nm process technology, higher compensation expenses mainly due to annual salary increases, additional expenses for acquisitions made in Q1 2011, and higher costs related to the development of 450mm wafer technology.
Marketing, General and Administrative.
MG&A expenses
increased
by
$31 million
in
2013
compared to
2012
, and
increased
by
$387 million
, or
5%
, in
2012
compared to
2011
. The
increase
in
2012
compared to
2011
was primarily due to two additional months of McAfee expenses in 2012 and higher compensation expenses, due to annual salary increases as well as an increase in the number of employees.
37
MANAGEMENT’S DISCUSSION AND ANALYSIS OF FINANCIAL CONDITION AND RESULTS OF OPERATIONS (Continued)
Restructuring and Asset Impairment Charges.
In response to the current business environment, during 2013, management approved several restructuring actions including targeted workforce reductions as well as exit of certain businesses and facilities. These actions include the wind down of our
200mm
wafer fabrication facility in Massachusetts, which we expect to cease production by the end of 2014. These targeted reductions will enable the company to better align our resources in areas providing the greatest benefit in the changing market
.
Restructuring and asset impairment charges for each period were as follows:
|
(In Millions)
|
2013
|
2012
|
2011
|
|||||||||
|
Employee severance and benefit arrangements
|
$
|
201
|
|
$
|
—
|
|
$
|
—
|
|
|||
|
Asset impairments
|
39
|
|
—
|
|
—
|
|
||||||
|
Total restructuring and asset impairment charges
|
$
|
240
|
|
$
|
—
|
|
$
|
—
|
|
|||
The restructuring and asset impairment activity for
2013
was as follows:
|
(In Millions)
|
Employee Severance and Benefits
|
Asset Impairments
|
Total
|
|||||||||
|
Accrued restructuring balance as of December 29, 2012
|
$
|
—
|
|
$
|
—
|
|
$
|
—
|
|
|||
|
Additional accruals
|
195
|
|
39
|
|
234
|
|
||||||
|
Adjustments
|
6
|
|
—
|
|
6
|
|
||||||
|
Cash payments
|
(18
|
)
|
—
|
|
(18
|
)
|
||||||
|
Non-cash settlements
|
—
|
|
(39
|
)
|
(39
|
)
|
||||||
|
Accrued restructuring balance as of December 28, 2013
|
$
|
183
|
|
$
|
—
|
|
$
|
183
|
|
|||
We recorded the additional accruals and adjustments as restructuring and asset impairment charges in the consolidated statements of income within the “all other” operating segment. The charges incurred during
2013
include
$201 million
related to employee severance and benefit arrangements, which impacted approximately
3,900
employees. The accrued restructuring balance as of
December 28, 2013
,
relates to employee severance and benefits which are expected to be paid within the next 12 months and was recorded as a current liability within accrued compensation and benefits in the consolidated balance sheets.
We estimate that employee severance and benefit charges to date will result in gross annual savings of approximately
$400 million
, which will be realized within R&D, cost of sales, and MG&A. We began to realize these savings in Q4 2013 and expect to fully realize these savings by Q1 2015.
We may incur additional charges in the future for employee severance and benefit arrangements, as well as facility-related or other exit activities, as we continue to align our resources to meet the needs of the business.
Amortization of Acquisition-Related Intangibles.
Amortization of acquisition-related intangibles
decreased
by
$17 million
, or
6%
, in
2013
compared to
2012
and
increased
by
$48 million
, or
18%
, in
2012
compared to
2011
. The
increase
in
2012
compared to
2011
was primarily due to the full year of amortization of intangibles in
2012
related to the acquisitions of McAfee and the WLS business of Infineon, both completed in Q1 2011. For further information, see “
Note 8: Acquisitions
” and “
Note 11: Identified Intangible Assets
” in Part II, Item 8 of this Form 10-K.
38
MANAGEMENT’S DISCUSSION AND ANALYSIS OF FINANCIAL CONDITION AND RESULTS OF OPERATIONS (Continued)
Share-Based Compensation
Share-based compensation totaled
$1.1 billion
in
2013
(
$1.1 billion
in
2012
and
$1.1 billion
in
2011
). Share-based compensation was included in cost of sales and operating expenses.
As of
December 28, 2013
, unrecognized share-based compensation costs and the weighted average periods over which the costs are expected to be recognized were as follows:
|
(Dollars in Millions)
|
Unrecognized
Share-Based
Compensation
Costs
|
Weighted
Average
Period
|
||||
|
Stock options
|
$
|
75
|
|
1.1 years
|
||
|
Restricted stock units
|
$
|
1,625
|
|
1.2 years
|
||
As of
December 28, 2013
, there was
$13 million
in unrecognized share-based compensation costs related to the rights to acquire common stock under our stock purchase plan. We expect to recognize those costs over a period of approximately one and a half months.
Gains (Losses) on Equity Investments and Interest and Other
Gains (losses) on equity investments, net and interest and other, net for each period were as follows:
|
(In Millions)
|
2013
|
2012
|
2011
|
|||||||||
|
Gains (losses) on equity investments, net
|
$
|
471
|
|
$
|
141
|
|
$
|
112
|
|
|||
|
Interest and other, net
|
$
|
(151
|
)
|
$
|
94
|
|
$
|
192
|
|
|||
We recognized higher net gains on equity investments in 2013 compared to 2012 due to higher gains on sales of equity investments, partially offset by lower gains on third-party merger transactions. Net gains on equity investments were higher in 2012 compared to 2011 due to lower equity method losses and higher gains on third-party merger transactions, partially offset by lower gains on sales of equity investments.
Net gains on equity investments for 2013 included gains of
$439 million
on the sales of our interest in Clearwire Communications, LLC (Clearwire LLC) and our shares in Clearwire Corporation in Q3 2013. For further information on these transactions, see "
Note 5: Cash and Investments
" in Part II, Item 8 of this Form 10-K. Net gains on equity investments for 2011 included a gain of
$150 million
on the sale of shares in VMware, Inc. Our share of equity method investee losses recognized in 2011 was primarily related to Clearwire LLC (
$145 million
) and these losses reduced our carrying value in Clearwire LLC to zero.
We recognized an interest and other net loss in 2013 compared to a net gain in 2012. We recognized a net loss in 2013 due to an increase in interest expense related to the issuance of our
$6.2 billion
aggregate principal amount of senior unsecured notes in Q4 2012. Additionally, in Q2 2012 we received proceeds from an insurance claim related to the floods in Thailand.
Interest and other, net decreased in 2012 compared to 2011, primarily due to a
$164 million
gain recognized upon formation of the Intel-GE Care Innovations, LLC (Care Innovations) joint venture in Q1 2011 and higher interest expense in 2012.
39
MANAGEMENT’S DISCUSSION AND ANALYSIS OF FINANCIAL CONDITION AND RESULTS OF OPERATIONS (Continued)
Provision for Taxes
Our provision for taxes and effective tax rate for each period were as follows:
|
(Dollars in Millions)
|
2013
|
2012
|
2011
|
|||||||||
|
Income before taxes
|
$
|
12,611
|
|
$
|
14,873
|
|
$
|
17,781
|
|
|||
|
Provision for taxes
|
$
|
2,991
|
|
$
|
3,868
|
|
$
|
4,839
|
|
|||
|
Effective tax rate
|
23.7
|
%
|
26.0
|
%
|
27.2
|
%
|
||||||
The U.S. R&D tax credit was reenacted in January 2013 retroactive to the beginning of 2012. The majority of the decrease in our effective tax rate was driven by the recognition of the 2012 U.S R&D tax credit in Q1 2013. The effective tax rate was also positively impacted by the recognition of the 2013 impact of the U.S. R&D tax credit, partially offset by a lower percentage of our profits generated in lower tax jurisdictions in
2013
compared to
2012
.
We generated a higher percentage of our profits from lower tax jurisdictions in
2012
compared to
2011
, positively impacting our effective tax rate for
2012
. This impact was partially offset by the U.S. R&D tax credit that was not reinstated during 2012.
Liquidity and Capital Resources
|
(Dollars in Millions)
|
Dec 28,
2013 |
Dec 29,
2012 |
||||||
|
Cash and cash equivalents, short-term investments, and marketable debt instruments included in trading assets
|
$
|
20,087
|
|
$
|
18,162
|
|
||
|
Other long-term investments, and reverse repurchase agreements with original maturities greater than approximately three months
|
$
|
1,873
|
|
$
|
543
|
|
||
|
Short-term and long-term debt
|
$
|
13,446
|
|
$
|
13,448
|
|
||
|
Debt as percentage of stockholders’ equity
|
23.1
|
%
|
26.3
|
%
|
||||
40
MANAGEMENT’S DISCUSSION AND ANALYSIS OF FINANCIAL CONDITION AND RESULTS OF OPERATIONS (Continued)
Sources and Uses of Cash
(In Millions)
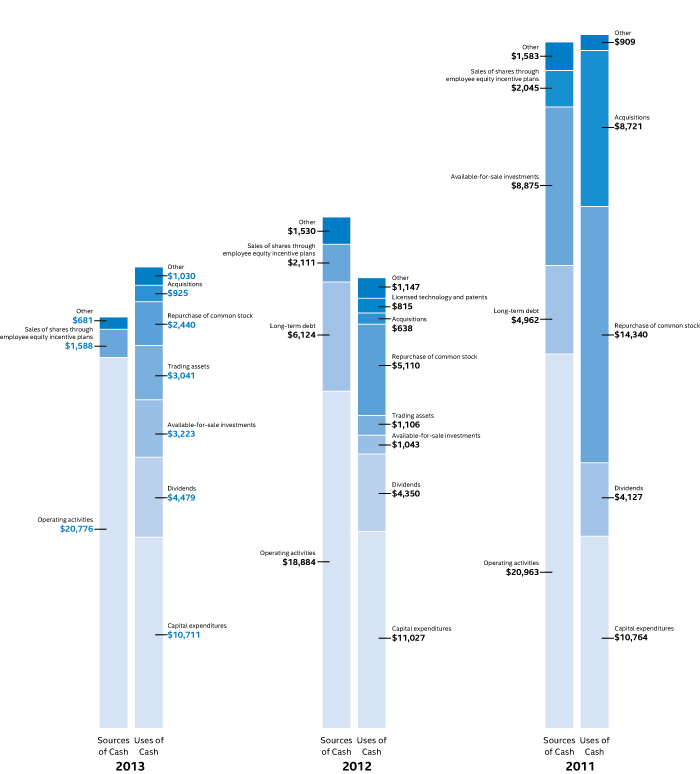
41
MANAGEMENT’S DISCUSSION AND ANALYSIS OF FINANCIAL CONDITION AND RESULTS OF OPERATIONS (Continued)
In summary, our cash flows for each period were as follows:
|
(In Millions)
|
2013
|
2012
|
2011
|
|||||||||
|
Net cash provided by operating activities
|
$
|
20,776
|
|
$
|
18,884
|
|
$
|
20,963
|
|
|||
|
Net cash used for investing activities
|
(18,073
|
)
|
(14,060
|
)
|
(10,301
|
)
|
||||||
|
Net cash used for financing activities
|
(5,498
|
)
|
(1,408
|
)
|
(11,100
|
)
|
||||||
|
Effect of exchange rate fluctuations on cash and cash equivalents
|
(9
|
)
|
(3
|
)
|
5
|
|
||||||
|
Net increase (decrease) in cash and cash equivalents
|
$
|
(2,804
|
)
|
$
|
3,413
|
|
$
|
(433
|
)
|
|||
Operating Activities
Cash
provided by
operating activities is net income adjusted for certain non-cash items and changes in certain assets and liabilities.
For
2013
compared to
2012
, the
$1.9 billion
increase
in cash provided by operating activities was due to changes in working capital, partially offset by lower net income in 2013. Income taxes paid, net of refunds, in 2013 compared to 2012 were
$1.1 billion
lower
due to lower income before taxes in 2013 and 2012 income tax overpayments.
Changes in assets and liabilities as of
December 28, 2013
, compared to
December 29, 2012
, included lower income taxes payable and receivable resulting from a reduction in taxes due in 2013, and lower inventories due to the sell-through of older-generation products, partially offset by the ramp of 4th generation Intel Core Processor family products.
For
2013
, our three largest customers accounted for
44%
of our net revenue (
43%
in
2012
and
2011
), with Hewlett-Packard Company accounting for
17%
of our net revenue (
18%
in
2012
and
19%
in
2011
), Dell accounting for
15%
of our net revenue (
14%
in
2012
and
15%
in
2011
), and Lenovo accounting for
12%
of our net revenue (
11%
in
2012
and
9%
in
2011
). These three customers accounted for
34%
of our accounts receivable as of
December 28, 2013
(
33%
as of
December 29, 2012
).
For
2012
compared to
2011
, the
$2.1 billion
decrease in cash provided by operating activities was due to lower net income and changes in our working capital, partially offset by adjustments for non-cash items. The adjustments for noncash items were higher due primarily to higher depreciation in 2012 compared to 2011, partially offset by increases in non-acquisition-related deferred tax liabilities as of December 31, 2011.
Investing Activities
Investing cash flows consist primarily of capital expenditures; investment purchases, sales, maturities, and disposals; as well as cash used for acquisitions.
The
increase
in cash used for investing activities in
2013
compared to
2012
was primarily due to an increase in purchases of available-for-sale investments and a decrease in maturities and sales of trading assets, partially offset by an increase in maturities and sales of available-for-sale investments and a decrease in purchases of licensed technology and patents. Our capital expenditures were
$10.7 billion
in
2013
(
$11.0 billion
in
2012
and
$10.8 billion
in
2011
).
Cash used for investing activities increased in
2012
compared to
2011
primarily due to net purchases of available-for-sale investments and trading assets in 2012, as compared to net maturities and sales of available-for-sale investments and trading assets in 2011, partially offset by a decrease in cash paid for acquisitions. Net purchases of available-for-sale investments in 2012 included our purchase of
$3.2 billion
of equity securities in ASML in Q3 2012.
Financing Activities
Financing cash flows consist primarily of repurchases of common stock, payment of dividends to stockholders, issuance and repayment of long-term debt, and proceeds from the sale of shares through employee equity incentive plans.
42
MANAGEMENT’S DISCUSSION AND ANALYSIS OF FINANCIAL CONDITION AND RESULTS OF OPERATIONS (Continued)
The
increase
in cash used for financing activities in
2013
compared to
2012
was primarily due to the issuance of long-term debt in 2012 and fewer repurchases of common stock under our authorized common stock repurchase program in 2013.
We have an ongoing authorization, originally approved by our Board of Directors in October 2005, and subsequently amended,
to repurchase up to
$45 billion
in shares of our common stock in the open market or negotiated transactions. During
2013
, we repurchased
$2.1 billion
of common stock under our authorized common stock repurchase program compared to
$4.8 billion
in
2012
. As of
December 28, 2013
,
$3.2 billion
remained available for repurchase under the existing repurchase authorization limit. We base our level of common stock repurchases on internal cash management decisions, and this level may fluctuate. Proceeds from the sale of shares through employee equity incentive plans totaled
$1.6 billion
in
2013
compared to
$2.1 billion
in
2012
. Our total dividend payments were
$4.5 billion
in
2013
compared to
$4.4 billion
in
2012
. We have paid a cash dividend in each of the past
85
quarters. In January
2014
, our Board of Directors declared a cash dividend of
$0.225
per common share for Q1
2014
. The dividend is payable on March 1,
2014
to stockholders of record on February 7,
2014
.
The decrease in cash used for financing activities in
2012
compared to
2011
, was primarily due to fewer repurchases of common stock under our authorized common stock repurchase program and, to a lesser extent, the issuance of a higher amount of long-term debt in 2012 compared to 2011.
Liquidity
Cash generated by operations is our primary source of liquidity. We maintain a diverse investment portfolio that we continually analyze based on issuer, industry, and country. As of
December 28, 2013
, cash and cash equivalents, short-term investments, and marketable debt instruments included in trading assets totaled
$20.1 billion
(
$18.2 billion
as of
December 29, 2012
). In addition to the
$20.1 billion
, we have
$1.9 billion
in other long-term investments, and reverse repurchase agreements with original maturities greater than approximately three months that we include when assessing our sources of liquidity.
Most
of our investments in debt instruments are in
A/A2 or better
rated issuances, and
the majority
of the issuances are rated
AA-/Aa3 or better
.
Our commercial paper program provides another potential source of liquidity. We have an ongoing authorization from our Board of Directors to borrow up to
$3.0 billion
, including through the issuance of commercial paper. Maximum borrowings under our commercial paper program during
2013
were
$300 million
, although no commercial paper remained outstanding as of
December 28, 2013
. Our commercial paper was rated
A-1+
by Standard & Poor’s and
P-1
by Moody’s as of
December 28, 2013
. We also have an automatic shelf registration statement on file with the SEC, pursuant to which we may offer an unspecified amount of debt, equity, and other securities. In 2012, we utilized this shelf registration statement and issued
$6.2 billion
aggregate principal amount of senior unsecured notes. The proceeds from the sale of these notes were used for general corporate purposes and to repurchase shares of our common stock pursuant to our authorized common stock repurchase program. For further information on the terms of the notes, see “
Note 16: Borrowings
” in Part II, Item 8 of this Form 10-K.
As of
December 28, 2013
,
$11.3 billion
of our cash and cash equivalents, short-term investments, and marketable debt instruments included in trading assets was held by our non-U.S. subsidiaries. Of the
$11.3 billion
held by our non-U.S. subsidiaries, approximately
$2.1 billion
was available for use in the U.S. without incurring additional U.S. income taxes in excess of the amounts already accrued in our financial statements as of
December 28, 2013
. The remaining amount of non-U.S. cash and cash equivalents, short-term investments, and marketable debt instruments included in trading assets has been indefinitely reinvested and, therefore, no U.S. current or deferred taxes have been accrued and this amount is earmarked for near-term investment in our operations outside the U.S. and future acquisitions of non-U.S. entities. We believe our U.S. sources of cash and liquidity are sufficient to meet our business needs in the U.S. and do not expect that we will need to repatriate the funds we have designated as indefinitely reinvested outside the U.S. Under current tax laws, should our plans change and we were to choose to repatriate some or all of the funds we have designated as indefinitely reinvested outside the U.S., such amounts would be subject to U.S. income taxes and applicable non-U.S. income and withholding taxes.
We believe that we have the financial resources needed to meet business requirements for the next 12 months, including capital expenditures for worldwide manufacturing and assembly and test; working capital requirements; and potential dividends, common stock repurchases, acquisitions, and strategic investments.
43
MANAGEMENT’S DISCUSSION AND ANALYSIS OF FINANCIAL CONDITION AND RESULTS OF OPERATIONS (Continued)
Fair Value of Financial Instruments
When determining fair value, we consider the principal or most advantageous market in which we would transact, and we consider assumptions, such as an obligor’s credit risk, that market participants would use when pricing the asset or liability. For further information, see “Fair Value” in “
Note 2: Accounting Policies
” in Part II, Item 8 of this Form 10-K.
Marketable Debt Instruments
As of
December 28, 2013
, our assets measured and recorded at fair value on a recurring basis included
$20.3 billion
of marketable debt instruments. Of these instruments,
$7.2 billion
was classified as Level 1,
$13.0 billion
as Level 2, and
$59 million
as Level 3.
Our balance of marketable debt instruments that are measured and recorded at fair value on a recurring basis and classified as Level 1 was classified as such due to the use of observable market prices for identical securities that are traded in active markets. We evaluate security-specific market data when determining whether the market for a debt security is active.
Of the
$13.0 billion
of marketable debt instruments measured and recorded at fair value on a recurring basis and classified as Level 2, approximately
60%
was classified as Level 2 due to the use of a discounted cash flow model, and approximately
40%
was classified as such due to the use of non-binding market consensus prices that were corroborated with observable market data.
Our marketable debt instruments that are measured and recorded at fair value on a recurring basis and classified as Level 3, are
classified as such because the fair values are generally derived from discounted cash flow models, performed either by us or our pricing providers, using inputs that we are unable to corroborate with observable market data. We monitor and review the inputs and results of these valuation models to ensure the fair value measurements are reasonable and consistent with market experience in similar asset classes.
Loans Receivable and Reverse Repurchase Agreements
As of
December 28, 2013
, our assets measured and recorded at fair value on a recurring basis included
$805 million
of loans receivable and
$400 million
of reverse repurchase agreements. All of these investments were classified as Level 2, as the fair value is determined using a discounted cash flow model with all significant inputs derived from or corroborated with observable market data.
Marketable Equity Securities
As of
December 28, 2013
, our assets measured and recorded at fair value on a recurring basis included
$6.2 billion
of marketable equity securities. All of these securities were classified as Level 1 because the valuations were based on quoted prices for identical securities in active markets. Our assessment of an active market for our marketable equity securities generally takes into consideration the number of days that each individual equity security trades over a specified period.
44
MANAGEMENT’S DISCUSSION AND ANALYSIS OF FINANCIAL CONDITION AND RESULTS OF OPERATIONS (Continued)
Contractual Obligations
The following table summarizes our significant contractual obligations as of
December 28, 2013
:
|
|
Payments Due by Period
|
|||||||||||||||||||
|
(In Millions)
|
Total
|
Less Than
1 Year
|
1–3 Years
|
3–5 Years
|
More Than
5 Years
|
|||||||||||||||
|
Operating lease obligations
|
$
|
870
|
|
$
|
208
|
|
$
|
298
|
|
$
|
166
|
|
$
|
198
|
|
|||||
|
Capital purchase obligations
1
|
5,503
|
|
5,375
|
|
125
|
|
—
|
|
3
|
|
||||||||||
|
Other purchase obligations and commitments
2
|
1,859
|
|
772
|
|
744
|
|
307
|
|
36
|
|
||||||||||
|
Long-term debt obligations
3
|
22,372
|
|
429
|
|
2,360
|
|
3,761
|
|
15,822
|
|
||||||||||
|
Other long-term liabilities
4, 5
|
1,496
|
|
569
|
|
663
|
|
144
|
|
120
|
|
||||||||||
|
Total
6
|
$
|
32,100
|
|
$
|
7,353
|
|
$
|
4,190
|
|
$
|
4,378
|
|
$
|
16,179
|
|
|||||
|
1
|
Capital purchase obligations represent commitments for the construction or purchase of property, plant and equipment. They were not recorded as liabilities on our consolidated balance sheets as of
December 28, 2013
, as we had not yet received the related goods or taken title to the property.
|
|
2
|
Other purchase obligations and commitments include payments due under various types of licenses and agreements to purchase goods or services, as well as payments due under non-contingent funding obligations. Funding obligations include agreements to fund various projects with other companies.
|
|
3
|
Amounts represent principal and interest cash payments over the life of the debt obligations, including anticipated interest payments that are not recorded on our consolidated balance sheets. Any future settlement of convertible debt would impact our cash payments.
|
|
4
|
We are unable to reliably estimate the timing of future payments related to uncertain tax positions; therefore,
$188 million
of long-term income taxes payable has been excluded from the preceding table. However, long-term income taxes payable, recorded on our consolidated balance sheets, included these uncertain tax positions, reduced by the associated federal deduction for state taxes and U.S. tax credits arising from non-U.S. income taxes.
|
|
5
|
Amounts represent future cash payments to satisfy other long-term liabilities recorded on our consolidated balance sheets, including the short-term portion of these long-term liabilities. Expected required contributions to our U.S. and non-U.S. pension plans and other postretirement benefit plans of
$62 million
to be made during
2014
are also included; however, funding projections beyond
2014
are not practicable to estimate.
|
|
6
|
Total excludes contractual obligations already recorded on our consolidated balance sheets as current liabilities except for the short-term portions of long-term debt obligations and other long-term liabilities.
|
Contractual obligations for purchases of goods or services, included in other purchase obligations and commitments in the preceding table, include agreements that are enforceable and legally binding on Intel and that specify all significant terms, including fixed or minimum quantities to be purchased; fixed, minimum, or variable price provisions; and the approximate timing of the transaction. For obligations with cancellation provisions, the amounts included in the preceding table were limited to the non-cancelable portion of the agreement terms or the minimum cancellation fee.
We have entered into certain agreements for the purchase of raw materials that specify minimum prices and quantities based on a percentage of the total available market or based on a percentage of our future purchasing requirements. Due to the uncertainty of the future market and our future purchasing requirements, as well as the non-binding nature of these agreements, obligations under these agreements are not included in the preceding table. Our purchase orders for other products are based on our current manufacturing needs and are fulfilled by our vendors within short time horizons. In addition, some of our purchase orders represent authorizations to purchase rather than binding agreements.
45
MANAGEMENT’S DISCUSSION AND ANALYSIS OF FINANCIAL CONDITION AND RESULTS OF OPERATIONS (Continued)
Contractual obligations that are contingent upon the achievement of certain milestones are not included in the preceding table. These obligations include milestone-based co-marketing agreements, contingent funding/payment obligations, and milestone-based equity investment funding. These arrangements are not considered contractual obligations until the milestone is met by the third party.
During 2012, we entered into a series of agreements with ASML intended to accelerate the development of 450mm wafer technology and
EUV lithography
. Intel agreed to provide R&D funding totaling
€829 million
over five years and committed to advance purchase orders for a specified number of tools from ASML.
Our remaining obligation, contingent upon ASML achieving certain milestones, is approximately
€738 million
, or
$1.0 billion
, as of
December 28, 2013
. As our obligation is contingent upon ASML achieving certain milestones, we have not included this obligation in the preceding
table.
For the majority of restricted stock units granted, the number of shares issued on the date the restricted stock units vest is net of the minimum statutory withholding requirements that we pay in cash to the appropriate taxing authorities on behalf of our employees. The obligation to pay the relevant taxing authority is not included in the preceding table, as the amount is contingent upon continued employment. In addition, the amount of the obligation is unknown, as it is based in part on the market price of our common stock when the awards vest.
The expected timing of payments of the obligations in the preceding table is estimated based on current information. Timing of payments and actual amounts paid may be different, depending on the time of receipt of goods or services, or changes to agreed-upon amounts for some obligations.
Off-Balance-Sheet Arrangements
As of
December 28, 2013
, we did not have any significant off-balance-sheet arrangements, as defined in Item 303(a)(4)(ii) of SEC Regulation S-K.
46
|
ITEM 7A.
|
QUANTITATIVE AND QUALITATIVE DISCLOSURES ABOUT MARKET RISK
|
We are affected by changes in non-U.S. currency exchange rates, interest rates, and equity prices. All of the potential changes presented below are based on sensitivity analyses performed on our financial positions as of
December 28, 2013
, and
December 29, 2012
. Actual results may differ materially.
Currency Exchange Rates
In general, we economically hedge currency risks of non-U.S.-dollar-denominated investments in debt instruments and loans receivable with currency forward contracts or currency interest rate swaps. Gains and losses on these non-U.S.-currency investments are generally offset by corresponding losses and gains on the related hedging instruments.
Substantially all of our revenue is transacted in U.S. dollars. However, a significant amount of our operating expenditures and capital purchases is incurred in or exposed to other currencies, primarily the euro, the Japanese yen, and the Israeli shekel. We have established balance sheet and forecasted transaction currency risk management programs to protect against fluctuations in fair value and the volatility of the functional currency equivalent of future cash flows caused by changes in exchange rates.
We generally utilize currency forward contracts in these hedging programs.
These programs reduce, but do not eliminate, the impact of currency exchange movements
. For further information, see “Risk Factors” in Part I, Item 1A of this Form 10-K. We considered the historical trends in currency exchange rates and determined that it was reasonably possible that a weighted average adverse change of
20%
in currency exchange rates could be experienced in the near term. Such an adverse change, after taking into account balance sheet hedges only and offsetting recorded monetary asset and liability positions, would have resulted in an adverse impact on income before taxes of less than
$40 million
as of
December 28, 2013
(less than
$80 million
as of
December 29, 2012
).
Interest Rates
We generally hedge interest rate risks of fixed-rate debt instruments with interest rate swaps. Gains and losses on these investments are generally offset by corresponding losses and gains on the related hedging instruments.
We are exposed to interest rate risk related to our investment portfolio and indebtedness. Our indebtedness includes our debt issuances and the liability associated with a long-term patent cross-license agreement with NVIDIA Corporation. The primary objective of our investments in debt instruments is to preserve principal while maximizing yields, which generally track the U.S. dollar three-month LIBOR. A hypothetical decrease in interest rates of up to
1.0%
would have resulted in an increase in the fair value of our indebtedness of approximately
$1.1 billion
as of
December 28, 2013
(an increase of approximately
$1.5 billion
as of
December 29, 2012
). A hypothetical decrease in benchmark interest rates of up to
1.0%
, after taking into account investment hedges, would have resulted in an increase in the fair value of our investment portfolio of approximately
$10 million
as of
December 28, 2013
(an increase of approximately
$10 million
as of
December 29, 2012
). The fluctuations in fair value of our investment portfolio and indebtedness reflect only the direct impact of the change in interest rates. Other economic variables, such as equity market fluctuations and changes in relative credit risk, could result in a significantly higher decline in the fair value of our net investment position. For further information on how credit risk is factored into the valuation of our investment portfolio and debt issuances, see “
Note 4: Fair Value
” in Part II, Item 8 of this Form 10-K.
Equity Prices
Our investments include marketable equity securities and equity derivative instruments. We typically do not attempt to reduce or eliminate our equity market exposure through hedging activities at the inception of the investment. Before we enter into hedge arrangements, we evaluate legal, market, and economic factors, as well as the expected timing of disposal to determine whether hedging is appropriate. Our equity market risk management program may include equity derivatives with or without hedge accounting designation that utilize warrants, equity options, or other equity derivatives.
We also utilize total return swaps to offset changes in liabilities related to the equity market risks of certain deferred compensation arrangements. Gains and losses from changes in fair value of these total return swaps are generally offset by the losses and gains on the related liabilities
.
47
As of
December 28, 2013
, the fair value of our marketable equity investments and our equity derivative instruments, including hedging positions, was
$6.3 billion
(
$4.4 billion
as of
December 29, 2012
). Our marketable equity investment in ASML was carried at a total fair market value of
$5.9 billion
, or
94%
of our marketable equity portfolio, as of
December 28, 2013
. Our marketable equity method investments are excluded from our analysis, as the carrying value does not fluctuate based on market price changes unless an other-than-temporary impairment is deemed necessary. To determine reasonably possible decreases in the market value of our marketable equity investments, we have analyzed the historical market price sensitivity of our marketable equity investment portfolio. Assuming a loss of
25%
in market prices, and after reflecting the impact of hedges and offsetting positions, the aggregate value of our marketable equity investments could decrease by approximately
$1.6 billion
, based on the value as of
December 28, 2013
(a decrease in value of approximately
$1.6 billion
, based on the value as of
December 29, 2012
using an assumed loss of
35%
).
Many of the same factors that could result in an adverse movement of equity market prices affect our non-marketable equity investments, although we cannot always quantify the impact directly. Financial markets are volatile, which could negatively affect the prospects of the companies we invest in, their ability to raise additional capital, and the likelihood of our ability to realize value in our investments through liquidity events such as initial public offerings, mergers, and private sales. These types of investments involve a great deal of risk, and there can be no assurance that any specific company will grow or become successful; consequently, we could lose all or part of our investment. Our non-marketable equity investments, excluding investments accounted for under the equity method, had a carrying amount of
$1.3 billion
as of
December 28, 2013
(
$1.2 billion
as of
December 29, 2012
). The carrying amount of our non-marketable equity method investments was
$1.0 billion
as of
December 28, 2013
(
$1.0 billion
as of
December 29, 2012
). The majority of our non-marketable equity method investments balance as of
December 28, 2013
, was concentrated in our IMFT investment of
$646 million
(
$642 million
as of
December 29, 2012
).
48
|
ITEM 8.
|
FINANCIAL STATEMENTS AND SUPPLEMENTARY DATA
|
INDEX TO CONSOLIDATED FINANCIAL STATEMENTS
|
|
Page
|
49
INTEL CORPORATION
|
Three Years Ended December 28, 2013
(In Millions, Except Per Share Amounts)
|
2013
|
2012
|
2011
|
|||||||||
|
Net revenue
|
$
|
52,708
|
|
$
|
53,341
|
|
$
|
53,999
|
|
|||
|
Cost of sales
|
21,187
|
|
20,190
|
|
20,242
|
|
||||||
|
Gross margin
|
31,521
|
|
33,151
|
|
33,757
|
|
||||||
|
Research and development
|
10,611
|
|
10,148
|
|
8,350
|
|
||||||
|
Marketing, general and administrative
|
8,088
|
|
8,057
|
|
7,670
|
|
||||||
|
Restructuring and asset impairment charges
|
240
|
|
—
|
|
—
|
|
||||||
|
Amortization of acquisition-related intangibles
|
291
|
|
308
|
|
260
|
|
||||||
|
Operating expenses
|
19,230
|
|
18,513
|
|
16,280
|
|
||||||
|
Operating income
|
12,291
|
|
14,638
|
|
17,477
|
|
||||||
|
Gains (losses) on equity investments, net
|
471
|
|
141
|
|
112
|
|
||||||
|
Interest and other, net
|
(151
|
)
|
94
|
|
192
|
|
||||||
|
Income before taxes
|
12,611
|
|
14,873
|
|
17,781
|
|
||||||
|
Provision for taxes
|
2,991
|
|
3,868
|
|
4,839
|
|
||||||
|
Net income
|
$
|
9,620
|
|
$
|
11,005
|
|
$
|
12,942
|
|
|||
|
Basic earnings per common share
|
$
|
1.94
|
|
$
|
2.20
|
|
$
|
2.46
|
|
|||
|
Diluted earnings per common share
|
$
|
1.89
|
|
$
|
2.13
|
|
$
|
2.39
|
|
|||
|
Weighted average common shares outstanding:
|
||||||||||||
|
Basic
|
4,970
|
|
4,996
|
|
5,256
|
|
||||||
|
Diluted
|
5,097
|
|
5,160
|
|
5,411
|
|
||||||
See accompanying notes.
50
INTEL CORPORATION
CONSOLIDATED STATEMENTS OF COMPREHENSIVE INCOME
|
Three Years Ended December 28, 2013
(In Millions)
|
2013
|
2012
|
2011
|
|||||||||
|
Net income
|
$
|
9,620
|
|
$
|
11,005
|
|
$
|
12,942
|
|
|||
|
Other comprehensive income, net of tax:
|
||||||||||||
|
Change in net unrealized holding gains (losses) on available-for-sale investments
|
1,181
|
|
470
|
|
(170
|
)
|
||||||
|
Change in net deferred tax asset valuation allowance
|
(26
|
)
|
(11
|
)
|
(99
|
)
|
||||||
|
Change in net unrealized holding gains (losses) on derivatives
|
(89
|
)
|
85
|
|
(119
|
)
|
||||||
|
Change in net prior service costs
|
18
|
|
—
|
|
4
|
|
||||||
|
Change in actuarial valuation
|
520
|
|
(172
|
)
|
(588
|
)
|
||||||
|
Change in net foreign currency translation adjustment
|
38
|
|
10
|
|
(142
|
)
|
||||||
|
Other comprehensive income (loss)
|
1,642
|
|
382
|
|
(1,114
|
)
|
||||||
|
Total comprehensive income
|
$
|
11,262
|
|
$
|
11,387
|
|
$
|
11,828
|
|
|||
See accompanying notes.
51
INTEL CORPORATION
|
December 28, 2013, and December 29, 2012
(In Millions, Except Par Value)
|
2013
|
2012
|
||||||
|
Assets
|
||||||||
|
Current assets:
|
||||||||
|
Cash and cash equivalents
|
$
|
5,674
|
|
$
|
8,478
|
|
||
|
Short-term investments
|
5,972
|
|
3,999
|
|
||||
|
Trading assets
|
8,441
|
|
5,685
|
|
||||
|
Accounts receivable, net of allowance for doubtful accounts of $38 ($38 in 2012)
|
3,582
|
|
3,833
|
|
||||
|
Inventories
|
4,172
|
|
4,734
|
|
||||
|
Deferred tax assets
|
2,594
|
|
2,117
|
|
||||
|
Other current assets
|
1,649
|
|
2,512
|
|
||||
|
Total current assets
|
32,084
|
|
31,358
|
|
||||
|
Property, plant and equipment, net
|
31,428
|
|
27,983
|
|
||||
|
Marketable equity securities
|
6,221
|
|
4,424
|
|
||||
|
Other long-term investments
|
1,473
|
|
493
|
|
||||
|
Goodwill
|
10,513
|
|
9,710
|
|
||||
|
Identified intangible assets, net
|
5,150
|
|
6,235
|
|
||||
|
Other long-term assets
|
5,489
|
|
4,148
|
|
||||
|
Total assets
|
$
|
92,358
|
|
$
|
84,351
|
|
||
|
Liabilities and stockholders’ equity
|
||||||||
|
Current liabilities:
|
||||||||
|
Short-term debt
|
$
|
281
|
|
$
|
312
|
|
||
|
Accounts payable
|
2,969
|
|
3,023
|
|
||||
|
Accrued compensation and benefits
|
3,123
|
|
2,972
|
|
||||
|
Accrued advertising
|
1,021
|
|
1,015
|
|
||||
|
Deferred income
|
2,096
|
|
1,932
|
|
||||
|
Other accrued liabilities
|
4,078
|
|
3,644
|
|
||||
|
Total current liabilities
|
13,568
|
|
12,898
|
|
||||
|
Long-term debt
|
13,165
|
|
13,136
|
|
||||
|
Long-term deferred tax liabilities
|
4,397
|
|
3,412
|
|
||||
|
Other long-term liabilities
|
2,972
|
|
3,702
|
|
||||
|
Commitments and contingencies (Notes 18 and 26)
|
||||||||
|
Stockholders’ equity:
|
||||||||
|
Preferred stock, $0.001 par value, 50 shares authorized; none issued
|
—
|
|
—
|
|
||||
|
Common stock, $0.001 par value, 10,000 shares authorized; 4,967 issued and outstanding (4,944 issued and outstanding in 2012) and capital in excess of par value
|
21,536
|
|
19,464
|
|
||||
|
Accumulated other comprehensive income (loss)
|
1,243
|
|
(399
|
)
|
||||
|
Retained earnings
|
35,477
|
|
32,138
|
|
||||
|
Total stockholders’ equity
|
58,256
|
|
51,203
|
|
||||
|
Total liabilities and stockholders’ equity
|
$
|
92,358
|
|
$
|
84,351
|
|
||
See accompanying notes.
52
INTEL CORPORATION
|
Three Years Ended December 28, 2013
(In Millions)
|
2013
|
2012
|
2011
|
|||||||||
|
Cash and cash equivalents, beginning of year
|
$
|
8,478
|
|
$
|
5,065
|
|
$
|
5,498
|
|
|||
|
Cash flows provided by (used for) operating activities:
|
||||||||||||
|
Net income
|
9,620
|
|
11,005
|
|
12,942
|
|
||||||
|
Adjustments to reconcile net income to net cash provided by operating activities:
|
||||||||||||
|
Depreciation
|
6,790
|
|
6,357
|
|
5,141
|
|
||||||
|
Share-based compensation
|
1,118
|
|
1,102
|
|
1,053
|
|
||||||
|
Restructuring and asset impairment charges
|
240
|
|
—
|
|
—
|
|
||||||
|
Excess tax benefit from share-based payment arrangements
|
(49
|
)
|
(142
|
)
|
(37
|
)
|
||||||
|
Amortization of intangibles
|
1,242
|
|
1,165
|
|
923
|
|
||||||
|
(Gains) losses on equity investments, net
|
(425
|
)
|
(141
|
)
|
(112
|
)
|
||||||
|
(Gains) losses on divestitures
|
—
|
|
—
|
|
(164
|
)
|
||||||
|
Deferred taxes
|
(900
|
)
|
(242
|
)
|
790
|
|
||||||
|
Changes in assets and liabilities:
|
||||||||||||
|
Accounts receivable
|
271
|
|
(176
|
)
|
(678
|
)
|
||||||
|
Inventories
|
563
|
|
(626
|
)
|
(243
|
)
|
||||||
|
Accounts payable
|
267
|
|
67
|
|
596
|
|
||||||
|
Accrued compensation and benefits
|
155
|
|
192
|
|
(95
|
)
|
||||||
|
Income taxes payable and receivable
|
1,019
|
|
229
|
|
660
|
|
||||||
|
Other assets and liabilities
|
865
|
|
94
|
|
187
|
|
||||||
|
Total adjustments
|
11,156
|
|
7,879
|
|
8,021
|
|
||||||
|
Net cash provided by operating activities
|
20,776
|
|
18,884
|
|
20,963
|
|
||||||
|
Cash flows provided by (used for) investing activities:
|
||||||||||||
|
Additions to property, plant and equipment
|
(10,711
|
)
|
(11,027
|
)
|
(10,764
|
)
|
||||||
|
Acquisitions, net of cash acquired
|
(925
|
)
|
(638
|
)
|
(8,721
|
)
|
||||||
|
Purchases of available-for-sale investments
|
(12,493
|
)
|
(8,694
|
)
|
(11,230
|
)
|
||||||
|
Sales of available-for-sale investments
|
934
|
|
2,282
|
|
9,076
|
|
||||||
|
Maturities of available-for-sale investments
|
8,336
|
|
5,369
|
|
11,029
|
|
||||||
|
Purchases of trading assets
|
(16,718
|
)
|
(16,892
|
)
|
(11,314
|
)
|
||||||
|
Maturities and sales of trading assets
|
13,677
|
|
15,786
|
|
11,771
|
|
||||||
|
Collection of loans receivable
|
132
|
|
149
|
|
134
|
|
||||||
|
Origination of loans receivable
|
(200
|
)
|
(216
|
)
|
(206
|
)
|
||||||
|
Investments in non-marketable equity investments
|
(440
|
)
|
(475
|
)
|
(693
|
)
|
||||||
|
Proceeds from the sale of IM Flash Singapore, LLP assets and certain IM Flash Technologies, LLC assets
|
—
|
|
605
|
|
—
|
|
||||||
|
Return of equity method investments
|
45
|
|
137
|
|
263
|
|
||||||
|
Purchases of licensed technology and patents
|
(36
|
)
|
(815
|
)
|
(66
|
)
|
||||||
|
Proceeds from divestitures
|
—
|
|
—
|
|
50
|
|
||||||
|
Other investing
|
326
|
|
369
|
|
370
|
|
||||||
|
Net cash used for investing activities
|
(18,073
|
)
|
(14,060
|
)
|
(10,301
|
)
|
||||||
|
Cash flows provided by (used for) financing activities:
|
||||||||||||
|
Increase (decrease) in short-term debt, net
|
(31
|
)
|
65
|
|
209
|
|
||||||
|
Proceeds from government grants
|
129
|
|
63
|
|
124
|
|
||||||
|
Excess tax benefit from share-based payment arrangements
|
49
|
|
142
|
|
37
|
|
||||||
|
Issuance of long-term debt, net of issuance costs
|
—
|
|
6,124
|
|
4,962
|
|
||||||
|
Repayment of debt
|
—
|
|
(125
|
)
|
—
|
|
||||||
|
Proceeds from sales of shares through employee equity incentive plans
|
1,588
|
|
2,111
|
|
2,045
|
|
||||||
|
Repurchase of common stock
|
(2,440
|
)
|
(5,110
|
)
|
(14,340
|
)
|
||||||
|
Payment of dividends to stockholders
|
(4,479
|
)
|
(4,350
|
)
|
(4,127
|
)
|
||||||
|
Other financing
|
(314
|
)
|
(328
|
)
|
(10
|
)
|
||||||
|
Net cash used for financing activities
|
(5,498
|
)
|
(1,408
|
)
|
(11,100
|
)
|
||||||
|
Effect of exchange rate fluctuations on cash and cash equivalents
|
(9
|
)
|
(3
|
)
|
5
|
|
||||||
|
Net increase (decrease) in cash and cash equivalents
|
(2,804
|
)
|
3,413
|
|
(433
|
)
|
||||||
|
Cash and cash equivalents, end of year
|
$
|
5,674
|
|
$
|
8,478
|
|
$
|
5,065
|
|
|||
|
Supplemental disclosures of cash flow information:
|
||||||||||||
|
Cash paid during the year for:
|
||||||||||||
|
Interest, net of capitalized interest
|
$
|
204
|
|
$
|
71
|
|
$
|
—
|
|
|||
|
Income taxes, net of refunds
|
$
|
2,874
|
|
$
|
3,930
|
|
$
|
3,338
|
|
|||
See accompanying notes.
53
INTEL CORPORATION
CONSOLIDATED STATEMENTS OF STOCKHOLDERS’ EQUITY
|
|
Common Stock and Capital
in Excess of Par Value
|
Accumulated
Other
Comprehensive
Income (Loss)
|
Retained
Earnings
|
Total
|
|||||||||||||||
|
Three Years Ended December 28, 2013
(In Millions, Except Per Share Amounts)
|
Number of
Shares
|
Amount
|
|||||||||||||||||
|
Balance as of December 25, 2010
|
5,511
|
|
$
|
16,178
|
|
$
|
333
|
|
$
|
32,919
|
|
$
|
49,430
|
|
|||||
|
Components of comprehensive income, net of tax:
|
|||||||||||||||||||
|
Net income
|
—
|
|
—
|
|
—
|
|
12,942
|
|
12,942
|
|
|||||||||
|
Other comprehensive income (loss)
|
—
|
|
—
|
|
(1,114
|
)
|
—
|
|
(1,114
|
)
|
|||||||||
|
Total comprehensive income
|
11,828
|
|
|||||||||||||||||
|
Proceeds from sales of shares through employee equity incentive plans, net tax deficiency, and other
|
142
|
|
2,019
|
|
—
|
|
—
|
|
2,019
|
|
|||||||||
|
Assumption of equity awards in connection with acquisitions
|
—
|
|
48
|
|
—
|
|
—
|
|
48
|
|
|||||||||
|
Share-based compensation
|
—
|
|
1,053
|
|
—
|
|
—
|
|
1,053
|
|
|||||||||
|
Repurchase of common stock
|
(653
|
)
|
(2,262
|
)
|
—
|
|
(12,078
|
)
|
(14,340
|
)
|
|||||||||
|
Cash dividends declared ($0.7824 per common share)
|
—
|
|
—
|
|
—
|
|
(4,127
|
)
|
(4,127
|
)
|
|||||||||
|
Balance as of December 31, 2011
|
5,000
|
|
17,036
|
|
(781
|
)
|
29,656
|
|
45,911
|
|
|||||||||
|
Components of comprehensive income, net of tax:
|
|||||||||||||||||||
|
Net income
|
—
|
|
—
|
|
—
|
|
11,005
|
|
11,005
|
|
|||||||||
|
Other comprehensive income (loss)
|
—
|
|
—
|
|
382
|
|
—
|
|
382
|
|
|||||||||
|
Total comprehensive income
|
11,387
|
|
|||||||||||||||||
|
Proceeds from sales of shares through employee equity incentive plans, net excess tax benefit, and other
|
148
|
|
2,257
|
|
—
|
|
—
|
|
2,257
|
|
|||||||||
|
Share-based compensation
|
—
|
|
1,108
|
|
—
|
|
—
|
|
1,108
|
|
|||||||||
|
Repurchase of common stock
|
(204
|
)
|
(937
|
)
|
—
|
|
(4,173
|
)
|
(5,110
|
)
|
|||||||||
|
Cash dividends declared ($0.87 per common share)
|
—
|
|
—
|
|
—
|
|
(4,350
|
)
|
(4,350
|
)
|
|||||||||
|
Balance as of December 29, 2012
|
4,944
|
|
19,464
|
|
(399
|
)
|
32,138
|
|
51,203
|
|
|||||||||
|
Components of comprehensive income, net of tax:
|
|||||||||||||||||||
|
Net income
|
—
|
|
—
|
|
—
|
|
9,620
|
|
9,620
|
|
|||||||||
|
Other comprehensive income (loss)
|
—
|
|
—
|
|
1,642
|
|
—
|
|
1,642
|
|
|||||||||
|
Total comprehensive income
|
11,262
|
|
|||||||||||||||||
|
Proceeds from sales of shares through employee equity incentive plans, net tax deficiency, and other
|
130
|
|
1,593
|
|
—
|
|
—
|
|
1,593
|
|
|||||||||
|
Share-based compensation
|
—
|
|
1,117
|
|
—
|
|
—
|
|
1,117
|
|
|||||||||
|
Repurchase of common stock
|
(107
|
)
|
(638
|
)
|
—
|
|
(1,802
|
)
|
(2,440
|
)
|
|||||||||
|
Cash dividends declared ($0.90 per common share)
|
—
|
|
—
|
|
—
|
|
(4,479
|
)
|
(4,479
|
)
|
|||||||||
|
Balance as of December 28, 2013
|
4,967
|
|
$
|
21,536
|
|
$
|
1,243
|
|
$
|
35,477
|
|
$
|
58,256
|
|
|||||
See accompanying notes.
54
INTEL CORPORATION
NOTES TO CONSOLIDATED FINANCIAL STATEMENTS
We have a 52- or 53-week fiscal year that ends on the last Saturday in December. Fiscal years 2013 and 2012 were 52-week years. Fiscal year 2011 was a 53-week year. The next 53-week year will end on December 31, 2016. Our consolidated financial statements include the accounts of Intel Corporation and our subsidiaries. We have eliminated intercompany accounts and transactions. We use the equity method to account for equity investments in instances in which we own common stock or similar interests and have the ability to exercise significant influence, but not control, over the investee.
In the first quarter of 2011, we completed the acquisition of McAfee, Inc. (McAfee). For further information, see “
Note 8: Acquisitions
.” Certain of the operations acquired from McAfee have a functional currency other than the U.S. dollar. As a result, we have recorded translation adjustments through accumulated other comprehensive income (loss) beginning in 2011.
Use of Estimates
The preparation of consolidated financial statements in conformity with U.S. generally accepted accounting principles requires us to make estimates and judgments that affect the amounts reported in our consolidated financial statements and the accompanying notes. The accounting estimates that require our most significant, difficult, and subjective judgments include:
|
•
|
the valuation of non-marketable equity investments and the determination of other-than-temporary impairments;
|
|
•
|
the assessment of recoverability of long-lived assets (property, plant and equipment; goodwill; and identified intangibles);
|
|
•
|
the recognition and measurement of current and deferred income taxes (including the measurement of uncertain tax positions);
|
|
•
|
the valuation of inventory; and
|
|
•
|
the recognition and measurement of loss contingencies.
|
The actual results that we experience may differ materially from our estimates.
Fair Value
Fair value is the price that would be received from selling an asset or paid to transfer a liability in an orderly transaction between market participants at the measurement date. When determining fair value, we consider the principal or most advantageous market in which we would transact, and we consider assumptions that market participants would use when pricing the asset or liability. Our financial assets are measured and recorded at fair value, except for equity method investments, cost method investments, cost method loans receivable, and reverse repurchase agreements with original maturities greater than approximately three months. Most of our liabilities are not measured and recorded at fair value.
Fair Value Hierarchy
The three levels of inputs that may be used to measure fair value are as follows:
Level 1.
Quoted prices in active markets for identical assets or liabilities.
Level 2.
Observable inputs other than Level 1 prices, such as quoted prices for similar assets or liabilities, quoted prices in less active markets, or model-derived valuations in which all significant inputs are observable or can be derived principally from or corroborated with observable market data for substantially the full term of the assets or liabilities. Level 2 inputs also include non-binding market consensus prices that can be corroborated with observable market data, as well as quoted prices that were adjusted for security-specific restrictions.
Level 3.
Unobservable inputs to the valuation methodology that are significant to the measurement of the fair value of assets or liabilities. Level 3 inputs also include non-binding market consensus prices or non-binding broker quotes that we were unable to corroborate with observable market data.
For further discussion of fair value, see “
Note 4: Fair Value
” and “
Note 17: Retirement Benefit Plans
.”
55
Cash Equivalents
We consider all highly liquid debt investments with original maturities from the date of purchase of approximately three months or less as cash equivalents. Cash equivalents can
include investments such as asset-backed securities, bank deposits, commercial paper, corporate bonds, government bonds, money market fund deposits, municipal bonds, and reverse repurchase agreements classified as cash equivalents
. See "
Note 4: Fair Value
" for the instruments held as cash equivalents.
Trading Assets
Marketable debt instruments are generally designated as trading assets when a market risk is economically hedged at inception with a related derivative instrument, or when the marketable debt instrument itself is used to economically hedge foreign exchange rate risk from remeasurement. Investments designated as trading assets are reported at fair value. The gains or losses of these investments arising from changes in fair value due to interest rate and currency market fluctuations and credit market volatility, largely offset by losses or gains on the related derivative instruments and balance sheet remeasurement, are recorded in interest and other, net. We also designate certain floating-rate securitized financial instruments, primarily asset-backed securities, as trading assets.
Available-for-Sale Investments
We consider all liquid available-for-sale debt instruments with original maturities from the date of purchase of approximately three months or less to be cash and cash equivalents. Available-for-sale debt instruments with original maturities at the date of purchase greater than approximately three months and remaining maturities of less than one year are classified as short-term investments. Available-for-sale debt instruments with remaining maturities beyond one year are classified as other long-term investments.
Investments that we designate as available-for-sale are reported at fair value, with unrealized gains and losses, net of tax, recorded in accumulated other comprehensive income (loss), except as noted in the “Other-Than-Temporary Impairment” section that follows. We determine the cost of the investment sold based on an average cost basis at the individual security level. Our available-for-sale investments include:
|
•
|
Marketable debt instruments
when the interest rate and foreign currency risks are not hedged at the inception of the investment or when our criteria for designation as trading assets are not met. We generally hold these debt instruments to generate a return commensurate with the U.S.-dollar three-month LIBOR. We record the interest income and realized gains and losses on the sale of these instruments in interest and other, net.
|
|
•
|
Marketable equity securities
when there is no plan to sell or hedge the investment at the time of original classification. We acquire these equity investments to promote business and strategic objectives. To the extent that these investments continue to have strategic value, we typically do not attempt to reduce or eliminate the equity market risks through hedging activities. We record the realized gains or losses on the sale or exchange of marketable equity securities in gains (losses) on equity investments, net.
|
Non-Marketable and Other Equity Investments
Our non-marketable equity and other equity investments are included in other long-term assets. We account for non-marketable equity and other equity investments for which we do not have control over the investee as:
|
•
|
Equity method investments
when we have the ability to exercise significant influence, but not control, over the investee. Equity method investments include marketable and non-marketable investments. Our proportionate share of the income or loss is recognized on a one-quarter lag and is recorded in gains (losses) on equity investments, net.
|
|
•
|
Non-marketable cost method investments
when the equity method does not apply. We record the realized gains or losses on the sale of non-marketable cost method investments in gains (losses) on equity investments, net.
|
56
Other-Than-Temporary Impairment
Our available-for-sale investments and non-marketable and other equity investments are subject to a periodic impairment review. Investments are considered impaired when the fair value is below the investment’s adjusted cost basis. Impairments affect earnings as follows:
|
•
|
Marketable debt instruments
when the fair value is below amortized cost and we intend to sell the instrument, or when it is more likely than not that we will be required to sell the instrument before recovery of its amortized cost basis, or when we do not expect to recover the entire amortized cost basis of the instrument (that is, a credit loss exists). When we do not expect to recover the entire amortized cost basis of the instrument, we separate other-than-temporary impairments into amounts representing credit losses, which are recognized in interest and other, net, and amounts related to all other factors, which are recognized in other comprehensive income (loss).
|
|
•
|
Marketable equity securities
based on the specific facts and circumstances present at the time of assessment, which include the consideration of general market conditions, the duration and extent to which the fair value is below cost, and our ability and intent to hold the investment for a sufficient period of time to allow for recovery of value in the foreseeable future. We also consider specific adverse conditions related to the financial health of, and the business outlook for, the investee, which may include industry and sector performance, changes in technology, operational and financing cash flow factors, and changes in the investee’s credit rating. We record other-than-temporary impairment charges on marketable equity securities and marketable equity method investments in gains (losses) on equity investments, net.
|
|
•
|
Non-marketable equity investments
based on our assessment of the severity and duration of the impairment, and qualitative and quantitative analysis, including:
|
|
•
|
the investee’s revenue and earnings trends relative to pre-defined milestones and overall business prospects;
|
|
•
|
the technological feasibility of the investee’s products and technologies;
|
|
•
|
the general market conditions in the investee’s industry or geographic area, including adverse regulatory or economic changes;
|
|
•
|
factors related to the investee’s ability to remain in business, such as the investee’s liquidity and debt ratios, and the rate at which the investee is using its cash; and
|
|
•
|
the investee’s receipt of additional funding at a lower valuation.
|
We record other-than-temporary impairment charges for non-marketable cost method investments and equity method investments in gains (losses) on equity investments, net.
Derivative Financial Instruments
Our primary objective for holding derivative financial instruments is to manage currency exchange rate and interest rate risk, and, to a lesser extent, equity market risk, commodity price risk, and credit risk. Our derivative financial instruments are recorded at fair value and are included in other current assets, other long-term assets, other accrued liabilities, or other long-term liabilities.
Our accounting policies for derivative financial instruments are based on whether they meet the criteria for designation as a cash flow hedge. A designated hedge with exposure to variability in the functional currency equivalent of the future foreign currency cash flows of a forecasted transaction is one example of a cash flow hedge. The criteria for designating a derivative as a cash flow hedge include the assessment of the instrument’s effectiveness in risk reduction, matching of the derivative instrument to its underlying transaction, and the assessment of the probability that the underlying transaction will occur. For derivatives with cash flow hedge accounting designation, we report the after-tax gain or loss from the effective portion of the hedge as a component of accumulated other comprehensive income (loss) and reclassify it into earnings in the same period or periods in which the hedged transaction affects earnings, and in the same line item on the consolidated statements of income as the impact of the hedged transaction. Derivatives that we designate as cash flow hedges are classified in the consolidated statements of cash flows in the same section as the underlying item, primarily within cash flows from operating activities.
57
We recognize gains and losses from changes in fair value of derivatives that are not designated as hedges for accounting purposes in the line item on the consolidated statements of income most closely associated with the related exposures, primarily in interest and other, net and gains (losses) on equity investments, net. As part of our strategic investment program, we also acquire equity derivative instruments, such as equity conversion rights associated with debt instruments, that we do not designate as hedging instruments. We recognize the gains or losses from changes in fair value of these equity derivative instruments in gains (losses) on equity investments, net. Gains and losses from derivatives not designated as hedges are classified in the consolidated statements of cash flows within cash flows from operating activities.
Measurement of Effectiveness
|
•
|
Effectiveness for forwards
is generally measured by comparing the cumulative change in the fair value of the hedge contract with the cumulative change in the fair value of the forecasted cash flows of the hedged item. For currency forward contracts used in cash flow hedging strategies related to capital purchases, forward points are excluded, and effectiveness is measured using spot rates to value both the hedge contract and the hedged item. For currency forward contracts used in cash flow hedging strategies related to operating expenditures, forward points are included and effectiveness is measured using forward rates to value both the hedge contract and the hedged item.
|
|
•
|
Effectiveness for options
is generally measured by comparing the cumulative change in the intrinsic value of the hedge contract with the cumulative change in the intrinsic value of an option instrument representing the hedged risks in the hedged item. Time value is excluded and effectiveness is measured using spot rates to value both the hedge contract and the hedged item.
|
|
•
|
Effectiveness for interest rate swaps and commodity swaps
is generally measured by comparing the cumulative change in fair value of the swap with the cumulative change in the fair value of the hedged item.
|
If a cash flow hedge is discontinued because it is probable that the original hedged transaction will not occur as previously anticipated, the cumulative unrealized gain or loss on the related derivative is reclassified from accumulated other comprehensive income (loss) into earnings. Subsequent gains or losses on the related derivative instrument are recognized in interest and other, net in each period until the instrument matures, is terminated, is re-designated as a qualified cash flow hedge, or is sold. Ineffective portions of cash flow hedges, as well as amounts excluded from the assessment of effectiveness, are recognized in earnings in interest and other, net. For further discussion of our derivative instruments and risk management programs, see “
Note 6: Derivative Financial Instruments
.”
Securities Lending
We may enter into securities lending agreements with financial institutions, generally to facilitate hedging and certain investment transactions. Selected securities may be loaned, secured by collateral in the form of cash or securities. The loaned securities continue to be carried as investment assets on our consolidated balance sheets. For lending agreements collateralized by cash and cash equivalents, collateral is recorded as an asset with a corresponding liability. For lending agreements collateralized by other securities, we do not record the collateral as an asset or a liability, unless the collateral is repledged.
Loans Receivable
We make loans to third parties that are classified within other current assets or other long-term assets. We may elect the fair value option for loans when the interest rate or foreign currency exchange rate risk is economically hedged at inception with a related derivative instrument. We record the gains or losses on these loans arising from changes in fair value due to interest rate, currency, and counterparty credit changes, largely offset by losses or gains on the related derivative instruments, in interest and other, net. Loans that are denominated in U.S. dollars and have a floating-rate coupon are carried at amortized cost. We measure interest income for all loans receivable using the interest method, which is based on the effective yield of the loans rather than the stated coupon rate. For further discussion of our loans receivable, see “
Note 4: Fair Value
.”
58
Inventories
We compute inventory cost on a first-in, first-out basis. Costs incurred to manufacture our products are included in the valuation of inventory beginning in the quarter in which a product meets the technical criteria to qualify for sale to customers. Prior to qualification for sale, costs that do not meet the criteria for research and development (R&D) are included in cost of sales in the period incurred. Inventories at the end of each period were as follows:
|
(In Millions)
|
Dec 28,
2013 |
Dec 29,
2012 |
||||||
|
Raw materials
|
$
|
458
|
|
$
|
478
|
|
||
|
Work in process
|
1,998
|
|
2,219
|
|
||||
|
Finished goods
|
1,716
|
|
2,037
|
|
||||
|
Total inventories
|
$
|
4,172
|
|
$
|
4,734
|
|
||
Property, Plant and Equipment
Property, plant and equipment, net at the end of each period were as follows:
|
(In Millions)
|
Dec 28,
2013 |
Dec 29,
2012 |
||||||
|
Land and buildings
|
$
|
21,098
|
|
$
|
18,807
|
|
||
|
Machinery and equipment
|
40,540
|
|
39,033
|
|
||||
|
Construction in progress
|
11,778
|
|
8,206
|
|
||||
|
Total property, plant and equipment, gross
|
73,416
|
|
66,046
|
|
||||
|
Less:
accumulated depreciation
|
(41,988
|
)
|
(38,063
|
)
|
||||
|
Total property, plant and equipment, net
|
$
|
31,428
|
|
$
|
27,983
|
|
||
We compute depreciation for financial reporting purposes using the straight-line method. Substantially all of our depreciable property, plant and equipment assets are depreciated over the following estimated useful lives: machinery and equipment,
2
to
4
years; buildings,
10
to
25
years.
We capitalize a majority of interest on borrowings related to eligible capital expenditures. Capitalized interest is added to the cost of qualified assets and amortized over the estimated useful lives of the assets. We record capital-related government grants earned as a reduction to property, plant and equipment.
Goodwill
We record goodwill when the purchase price of an acquisition exceeds the fair value of the net tangible and identified intangible assets as of the date of acquisition, assigning the goodwill to our applicable reporting units based on the relative expected fair value provided by the acquisition. We perform a quarterly review of goodwill for indicators of impairment. During the fourth quarter of each year, we perform an impairment assessment for each reporting unit, and we perform impairment tests using a fair value approach when necessary. The reporting unit’s carrying value used in an impairment test represents the assignment of various assets and liabilities, excluding certain corporate assets and liabilities, such as cash, investments, and debt. For further discussion of goodwill, see “
Note 10: Goodwill
.”
Identified Intangible Assets
Licensed technology and patents are generally amortized on a straight-line basis over the periods of benefit. We amortize all acquisition-related intangible assets that are subject to amortization over their estimated useful life based on economic benefit. Acquisition-related in-process R&D assets represent the fair value of incomplete R&D projects that had not reached technological feasibility as of the date of acquisition; initially, these are classified as “other intangible assets” that are not subject to amortization. Assets related to projects that have been completed are transferred from “other intangible assets” to “acquisition-related developed technology;” these are subject to amortization, while assets related to projects that have been abandoned are impaired and expensed to R&D. In the quarter following the period in which identified intangible assets become fully amortized, we remove the fully amortized balances from the gross asset and accumulated amortization amounts.
59
The estimated useful life ranges for substantially all identified intangible assets that are subject to amortization as of
December 28, 2013
, were as follows:
|
(In Years)
|
Estimated
Useful Life
|
|||
|
Acquisition-related developed technology
|
4
|
–
|
9
|
|
|
Acquisition-related customer relationships
|
5
|
–
|
8
|
|
|
Acquisition-related trade names
|
4
|
–
|
8
|
|
|
Licensed technology and patents
|
5
|
–
|
17
|
|
We perform a quarterly review of finite-lived identified intangible assets to determine whether facts and circumstances indicate that the useful life is shorter than we had originally estimated or that the carrying amount of assets may not be recoverable. If such facts and circumstances exist, we assess recoverability by comparing the projected undiscounted net cash flows associated with the related asset or group of assets over their remaining lives against their respective carrying amounts. Impairments, if any, are based on the excess of the carrying amount over the fair value of those assets. If an asset’s useful life is shorter than originally estimated, we accelerate the rate of amortization and amortize the remaining carrying value over the new shorter useful life. We perform an annual impairment assessment in the fourth quarter of each year for indefinite-lived intangible assets, or more frequently if indicators of potential impairment exist, to determine whether it is more likely than not that the carrying value of the assets may not be recoverable. If necessary, a quantitative impairment test is performed to compare the fair value of the indefinite-lived intangible asset with its carrying value. Impairments, if any, are based on the excess of the carrying amount over the fair value of those assets.
For further discussion of identified intangible assets, see “
Note 11: Identified Intangible Assets
.”
Product Warranty
The vast majority of our products are sold with a limited warranty on product quality and a limited indemnification for customers against intellectual property (IP) rights infringement claims related to our products. The accrual and the related expense for known product warranty issues were not significant during the periods presented. Due to product testing, the short time typically between product shipment and the detection and correction of product failures, and the historical rate of payments on indemnification claims, the accrual and related expense for estimated incurred but unidentified issues were not significant during the periods presented.
Revenue Recognition
We recognize net product revenue when the earnings process is complete, as evidenced by an agreement with the customer, delivery has occurred, and acceptance, if applicable, as well as fixed pricing and probable collectibility. We record pricing allowances, including discounts based on contractual arrangements with customers, when we recognize revenue as a reduction to both accounts receivable and net revenue. Because of frequent sales price reductions and rapid technology obsolescence in the industry, we defer product revenue and related costs of sales from component sales made to distributors under agreements allowing price protection or right of return until the distributors sell the merchandise. The right of return granted generally consists of a stock rotation program in which distributors are able to exchange certain products based on the number of qualified purchases made by the distributor. Under the price protection program, we give distributors credits for the difference between the original price paid and the current price that we offer. We include shipping charges billed to customers in net revenue, and include the related shipping costs in cost of sales.
60
Revenue from license agreements with our McAfee business generally includes service and support agreements for which the related revenue is deferred and recognized ratably over the performance period. Revenue derived from online subscription products is deferred and recognized ratably over the performance period. Professional services revenue is recognized as services are performed or, if required, upon customer acceptance. For arrangements with multiple elements, including software licenses, maintenance, and/or services, revenue is allocated across the separately identified deliverables and may be recognized or deferred. When vendor-specific objective evidence (VSOE) does not exist for undelivered elements such as maintenance and support, the entire arrangement fee is recognized ratably over the performance period. Direct costs, such as costs related to revenue-sharing and royalty arrangements associated with license arrangements, as well as component costs associated with product revenue and sales commissions, are deferred and amortized over the same period that the related revenue is recognized.
We record deferred revenue offset by the related cost of sales on our consolidated balance sheets as deferred income.
Advertising
Cooperative advertising programs reimburse customers for marketing activities for certain of our products, subject to defined criteria. We accrue cooperative advertising obligations and record the costs at the same time that the related revenue is recognized. We record cooperative advertising costs as marketing, general and administrative (MG&A) expenses to the extent that an advertising benefit separate from the revenue transaction can be identified and the fair value of that advertising benefit received is determinable. We record any excess in cash paid over the fair value of the advertising benefit received as a reduction in revenue. Advertising costs, including direct marketing costs, recorded within MG&A expenses were
$1.9 billion
in
2013
(
$2.0 billion
in
2012
and
$2.1 billion
in
2011
).
Employee Equity Incentive Plans
We have employee equity incentive plans, which are described more fully in “
Note 19: Employee Equity Incentive Plans
.” We use the straight-line attribution method to recognize share-based compensation over the service period of the award. Upon exercise, cancellation, forfeiture, or expiration of stock options, or upon vesting or forfeiture of restricted stock units (RSUs), we eliminate deferred tax assets for options and restricted stock units with multiple vesting dates for each vesting period on a first-in, first-out basis as if each vesting period were a separate award.
Income Taxes
We compute the provision for income taxes using the asset and liability method, under which deferred tax assets and liabilities are recognized for the expected future tax consequences of temporary differences between the financial reporting and tax bases of assets and liabilities, and for operating losses and tax credit carryforwards. We measure deferred tax assets and liabilities using the currently enacted tax rates that apply to taxable income in effect for the years in which those tax assets are expected to be realized or settled. We record a valuation allowance to reduce deferred tax assets to the amount that it is believed more likely than not to be realized.
We recognize tax benefits from uncertain tax positions only if that tax position is more likely than not to be sustained on examination by the taxing authorities, based on the technical merits of the position. We then measure the tax benefits recognized in the financial statements from such positions based on the largest benefit that has a greater than 50% likelihood of being realized upon ultimate settlement. We recognize interest and penalties related to unrecognized tax benefits within the provision for taxes on the consolidated statements of income. For more information about income taxes, see “
Note 24: Income Taxes
.”
61
2012
In the first quarter of 2012, we adopted amended standards that increase the prominence of items reported in other comprehensive income. These amended standards eliminate the option to present components of other comprehensive income as part of the statement of changes in stockholders’ equity, and they require that all changes in stockholders’ equity—except investments by, and distributions to, owners—be presented either in a single continuous statement of comprehensive income or in two separate but consecutive statements. Our adoption of these amended standards impacted the presentation of other comprehensive income, as we have elected to present two separate but consecutive statements, but it did not have an impact on our financial position or results of operations.
In the fourth quarter of 2012, we adopted amended standards to simplify how we test indefinite-lived intangible assets for impairment; these amended standards improve consistency in impairment testing requirements among long-lived asset categories. The amended standards allow for an assessment of qualitative factors such that we can determine whether the fair value of an indefinite-lived intangible asset is more likely than not to be less than its carrying value. For assets in which this assessment concludes that the fair value is more likely than not to be more than its carrying value, these amended standards eliminate the requirement to perform quantitative impairment testing as outlined in the previously issued standards. Our adoption of these amended standards did not have an impact on our consolidated financial statements.
2011
In the first quarter of 2011, we adopted new standards for revenue recognition with multiple deliverables. These new standards change the determination of whether the individual deliverables included in a multiple-element arrangement may be treated as separate units for accounting purposes. Additionally, these new standards modify the method by which revenue is allocated to the separately identified deliverables. The adoption of these new standards did not have a significant impact on our consolidated financial statements.
In the first quarter of 2011, we adopted new standards that remove certain tangible products and associated software from the scope of the software revenue recognition guidance. The adoption of these new standards did not have a significant impact on our consolidated financial statements.
In the fourth quarter of 2011, we adopted amended standards that simplify how entities test goodwill for impairment. These amended standards allow for an assessment of qualitative factors such that we can determine whether the fair value of a reporting unit in which goodwill resides is more likely than not to be less than its carrying value. For reporting units in which this assessment concludes that the fair value is more likely than not to be more than its carrying value, these amended standards eliminate the requirement to perform goodwill impairment testing. Our adoption of these amended standards did not have an impact on our consolidated financial statements.
62
Assets/Liabilities Measured and Recorded at Fair Value on a Recurring Basis
Assets and liabilities measured and recorded at fair value on a recurring basis consisted of the following types of instruments at the end of each period were as follows:
|
|
December 28, 2013
|
December 29, 2012
|
||||||||||||||||||||||||||||||
|
|
Fair Value Measured and
Recorded at Reporting Date Using
|
Total
|
Fair Value Measured and
Recorded at Reporting Date Using
|
Total
|
||||||||||||||||||||||||||||
|
(In Millions)
|
Level 1
|
Level 2
|
Level 3
|
Level 1
|
Level 2
|
Level 3
|
||||||||||||||||||||||||||
|
Assets
|
||||||||||||||||||||||||||||||||
|
Cash equivalents:
|
||||||||||||||||||||||||||||||||
|
Bank deposits
|
$
|
—
|
|
$
|
1,017
|
|
$
|
—
|
|
$
|
1,017
|
|
$
|
—
|
|
$
|
822
|
|
$
|
—
|
|
$
|
822
|
|
||||||||
|
Commercial paper
|
—
|
|
2,341
|
|
—
|
|
2,341
|
|
—
|
|
2,711
|
|
—
|
|
2,711
|
|
||||||||||||||||
|
Corporate bonds
|
—
|
|
21
|
|
—
|
|
21
|
|
—
|
|
—
|
|
—
|
|
—
|
|
||||||||||||||||
|
Government bonds
|
—
|
|
—
|
|
—
|
|
—
|
|
400
|
|
66
|
|
—
|
|
466
|
|
||||||||||||||||
|
Money market fund deposits
|
1,041
|
|
—
|
|
—
|
|
1,041
|
|
1,086
|
|
—
|
|
—
|
|
1,086
|
|
||||||||||||||||
|
Reverse repurchase agreements
|
—
|
|
400
|
|
—
|
|
400
|
|
—
|
|
2,800
|
|
—
|
|
2,800
|
|
||||||||||||||||
|
Short-term investments:
|
||||||||||||||||||||||||||||||||
|
Bank deposits
|
—
|
|
1,782
|
|
—
|
|
1,782
|
|
—
|
|
540
|
|
—
|
|
540
|
|
||||||||||||||||
|
Commercial paper
|
—
|
|
2,123
|
|
—
|
|
2,123
|
|
—
|
|
1,474
|
|
—
|
|
1,474
|
|
||||||||||||||||
|
Corporate bonds
|
383
|
|
1,121
|
|
19
|
|
1,523
|
|
75
|
|
292
|
|
21
|
|
388
|
|
||||||||||||||||
|
Government bonds
|
268
|
|
276
|
|
—
|
|
544
|
|
1,307
|
|
290
|
|
—
|
|
1,597
|
|
||||||||||||||||
|
Trading assets:
|
||||||||||||||||||||||||||||||||
|
Asset-backed securities
|
—
|
|
684
|
|
4
|
|
688
|
|
—
|
|
—
|
|
68
|
|
68
|
|
||||||||||||||||
|
Bank deposits
|
—
|
|
92
|
|
—
|
|
92
|
|
—
|
|
247
|
|
—
|
|
247
|
|
||||||||||||||||
|
Commercial paper
|
—
|
|
240
|
|
—
|
|
240
|
|
—
|
|
336
|
|
—
|
|
336
|
|
||||||||||||||||
|
Corporate bonds
|
2,625
|
|
773
|
|
—
|
|
3,398
|
|
482
|
|
1,109
|
|
—
|
|
1,591
|
|
||||||||||||||||
|
Government bonds
|
2,267
|
|
1,618
|
|
—
|
|
3,885
|
|
1,743
|
|
1,479
|
|
—
|
|
3,222
|
|
||||||||||||||||
|
Money market fund deposits
|
82
|
|
—
|
|
—
|
|
82
|
|
18
|
|
—
|
|
—
|
|
18
|
|
||||||||||||||||
|
Municipal bonds
|
—
|
|
56
|
|
—
|
|
56
|
|
—
|
|
203
|
|
—
|
|
203
|
|
||||||||||||||||
|
Other current assets:
|
||||||||||||||||||||||||||||||||
|
Derivative assets
|
48
|
|
309
|
|
—
|
|
357
|
|
12
|
|
208
|
|
1
|
|
221
|
|
||||||||||||||||
|
Loans receivable
|
—
|
|
103
|
|
—
|
|
103
|
|
—
|
|
203
|
|
—
|
|
203
|
|
||||||||||||||||
|
Marketable equity securities
|
6,221
|
|
—
|
|
—
|
|
6,221
|
|
4,424
|
|
—
|
|
—
|
|
4,424
|
|
||||||||||||||||
|
Other long-term investments:
|
||||||||||||||||||||||||||||||||
|
Asset-backed securities
|
—
|
|
—
|
|
9
|
|
9
|
|
—
|
|
—
|
|
11
|
|
11
|
|
||||||||||||||||
|
Bank deposits
|
—
|
|
157
|
|
—
|
|
157
|
|
—
|
|
56
|
|
—
|
|
56
|
|
||||||||||||||||
|
Corporate bonds
|
282
|
|
518
|
|
27
|
|
827
|
|
10
|
|
218
|
|
26
|
|
254
|
|
||||||||||||||||
|
Government bonds
|
295
|
|
185
|
|
—
|
|
480
|
|
59
|
|
113
|
|
—
|
|
172
|
|
||||||||||||||||
|
Other long-term assets:
|
||||||||||||||||||||||||||||||||
|
Derivative assets
|
—
|
|
7
|
|
29
|
|
36
|
|
—
|
|
20
|
|
18
|
|
38
|
|
||||||||||||||||
|
Loans receivable
|
—
|
|
702
|
|
—
|
|
702
|
|
—
|
|
577
|
|
—
|
|
577
|
|
||||||||||||||||
|
Total assets measured and recorded at fair value
|
$
|
13,512
|
|
$
|
14,525
|
|
$
|
88
|
|
$
|
28,125
|
|
$
|
9,616
|
|
$
|
13,764
|
|
$
|
145
|
|
$
|
23,525
|
|
||||||||
|
Liabilities
|
||||||||||||||||||||||||||||||||
|
Other accrued liabilities:
|
||||||||||||||||||||||||||||||||
|
Derivative liabilities
|
$
|
—
|
|
$
|
372
|
|
$
|
—
|
|
$
|
372
|
|
$
|
1
|
|
$
|
291
|
|
$
|
—
|
|
$
|
292
|
|
||||||||
|
Other long-term liabilities:
|
||||||||||||||||||||||||||||||||
|
Derivative liabilities
|
—
|
|
50
|
|
—
|
|
50
|
|
—
|
|
20
|
|
—
|
|
20
|
|
||||||||||||||||
|
Total liabilities measured and recorded at fair value
|
$
|
—
|
|
$
|
422
|
|
$
|
—
|
|
$
|
422
|
|
$
|
1
|
|
$
|
311
|
|
$
|
—
|
|
$
|
312
|
|
||||||||
Government bonds include bonds issued or deemed to be guaranteed by government entities. Government bonds include instruments such as non-U.S. government bonds, U.S. agency securities, and U.S. Treasury securities.
63
Investments in Debt Securities
Debt securities reflected in the preceding table
include investments such as asset-backed securities, bank deposits, commercial paper, corporate bonds, government bonds, money market fund deposits, municipal bonds, and reverse repurchase agreements classified as cash equivalents
. When we use observable market prices for identical securities that are traded in less active markets, we classify our debt investments as Level 2. When observable market prices for identical securities are not available, we price our debt investments using non-binding market consensus prices that are corroborated with observable market data; quoted market prices for similar instruments; or pricing models, such as a discounted cash flow model, with all significant inputs derived from or corroborated with observable market data. Non-binding market consensus prices are based on the proprietary valuation models of pricing providers or brokers. These valuation models incorporate a number of inputs, including non-binding and binding broker quotes; observable market prices for identical or similar securities; and the internal assumptions of pricing providers or brokers that use observable market inputs and unobservable market inputs that we consider to be not significant. We corroborate non-binding market consensus prices with observable market data using statistical models when observable market data exists. The discounted cash flow model uses observable market inputs, such as LIBOR-based yield curves, currency spot and forward rates, and credit ratings.
Debt securities classified as Level 3, are
classified as such because the fair values are generally derived from discounted cash flow models, performed either by us or our pricing providers, using inputs that we are unable to corroborate with observable market data. We monitor and review the inputs and results of these valuation models to ensure the fair value measurements are reasonable and consistent with market experience in similar asset classes.
Fair Value Option for Loans Receivable
We elected the fair value option for loans receivable when the interest rate or currency exchange rate risk was hedged at inception with a related derivative instrument. As of
December 28, 2013
, the fair value of our loans receivable for which we elected the fair value option did not significantly differ from the contractual principal balance based on the contractual currency. Loans receivable are classified within other current assets and other long-term assets. Fair value is determined using a discounted cash flow model, with all significant inputs derived from or corroborated with observable market data. Gains and losses from changes in fair value on the loans receivable and related derivative instruments, as well as interest income, are recorded in interest and other, net. During all periods presented, changes in the fair value of our loans receivable were largely offset by changes in the related derivative instruments, resulting in an insignificant net impact on our consolidated statements of income. Gains and losses attributable to changes in credit risk are determined using observable credit default spreads for the issuer or comparable companies; these gains and losses were insignificant during all periods presented. We did not elect the fair value option for loans receivable when the interest rate or foreign exchange rate risk was not hedged at inception with a related derivative instrument. Loans receivable not measured and recorded at fair value are included in the "Financial Instruments Not Recorded at Fair Value on a Recurring Basis" section that follows.
Assets Measured and Recorded at Fair Value on a Non-Recurring Basis
Our non-marketable equity investments, marketable equity method investments, and non-financial assets, such as intangible assets and property, plant and equipment, are recorded at fair value only if an impairment charge is recognized.
A portion of our non-marketable equity investments has been measured and recorded at fair value due to events or circumstances that significantly impacted the fair value of those investments, resulting in other-than-temporary impairment charges. We classified these investments as Level 3, as we used unobservable inputs to the valuation methodologies that were significant to the fair value measurements, and the valuations required management judgment due to the absence of quoted market prices. Impairment charges recognized on non-marketable equity investments held as of
December 28, 2013
, were
$106 million
during
2013
(
$68 million
during
2012
on non-marketable equity investments held as of
December 29, 2012
and
$62 million
during
2011
on non-marketable equity investments held as of
December 31, 2011
). The fair value of the non-marketable equity investments impaired during
2013
was
$47 million
at the time of impairment (
$73 million
and
$69 million
for non-marketable equity investments impaired during
2012
and
2011
, respectively).
64
Financial Instruments Not Recorded at Fair Value on a Recurring Basis
On a quarterly basis, we measure the fair value of our non-marketable cost method investments, indebtedness carried at amortized cost, cost method loans receivable, grants receivable, and reverse repurchase agreements with original maturities greater than approximately three months; however, the assets are recorded at fair value only when an impairment charge is recognized. The carrying amounts and fair values of certain financial instruments not recorded at fair value on a recurring basis at the end of each period were as follows:
|
|
December 28, 2013
|
|||||||||||||||||||
|
|
Carrying
Amount
|
Fair Value Measured Using
|
Fair Value
|
|||||||||||||||||
|
(In Millions)
|
Level 1
|
Level 2
|
Level 3
|
|||||||||||||||||
|
Non-marketable cost method investments
|
$
|
1,270
|
|
$
|
—
|
|
$
|
—
|
|
$
|
2,105
|
|
$
|
2,105
|
|
|||||
|
Loans receivable
|
$
|
267
|
|
$
|
—
|
|
$
|
250
|
|
$
|
17
|
|
$
|
267
|
|
|||||
|
Reverse repurchase agreements
|
$
|
400
|
|
$
|
—
|
|
$
|
400
|
|
$
|
—
|
|
$
|
400
|
|
|||||
|
Grants receivable
|
$
|
416
|
|
$
|
—
|
|
$
|
481
|
|
$
|
—
|
|
$
|
481
|
|
|||||
|
Long-term debt
|
$
|
13,165
|
|
$
|
10,937
|
|
$
|
2,601
|
|
$
|
—
|
|
$
|
13,538
|
|
|||||
|
Short-term debt
|
$
|
24
|
|
$
|
—
|
|
$
|
24
|
|
$
|
—
|
|
$
|
24
|
|
|||||
|
NVIDIA Corporation cross-license agreement liability
|
$
|
587
|
|
$
|
—
|
|
$
|
597
|
|
$
|
—
|
|
$
|
597
|
|
|||||
|
|
December 29, 2012
|
|||||||||||||||||||
|
|
Carrying
Amount
|
Fair Value Measured Using
|
Fair Value
|
|||||||||||||||||
|
(In Millions)
|
Level 1
|
Level 2
|
Level 3
|
|||||||||||||||||
|
Non-marketable cost method investments
|
$
|
1,202
|
|
$
|
—
|
|
$
|
—
|
|
$
|
1,766
|
|
$
|
1,766
|
|
|||||
|
Loans receivable
|
$
|
199
|
|
$
|
—
|
|
$
|
150
|
|
$
|
48
|
|
$
|
198
|
|
|||||
|
Reverse repurchase agreements
|
$
|
50
|
|
$
|
—
|
|
$
|
50
|
|
$
|
—
|
|
$
|
50
|
|
|||||
|
Grants receivable
|
$
|
198
|
|
$
|
—
|
|
$
|
205
|
|
$
|
—
|
|
$
|
205
|
|
|||||
|
Long-term debt
|
$
|
13,136
|
|
$
|
11,442
|
|
$
|
2,926
|
|
$
|
—
|
|
$
|
14,368
|
|
|||||
|
Short-term debt
|
$
|
48
|
|
$
|
—
|
|
$
|
48
|
|
$
|
—
|
|
$
|
48
|
|
|||||
|
NVIDIA Corporation cross-license agreement liability
|
$
|
875
|
|
$
|
—
|
|
$
|
890
|
|
$
|
—
|
|
$
|
890
|
|
|||||
As of
December 28, 2013
, and
December 29, 2012
, the unrealized loss position of our non-marketable cost method investments was insignificant.
Our non-marketable cost method investments are valued using the market and income approaches. The market approach includes the use of financial metrics and ratios of comparable public companies. The selection of comparable companies requires management judgment and is based on a number of factors, including comparable companies’ sizes, growth rates, industries, and development stages. The income approach includes the use of a discounted cash flow model, which requires significant estimates regarding the investees’ revenue, costs, and discount rates based on the risk profile of comparable companies. Estimates of revenue and costs are developed using available market, historical, and forecast data. The valuation of these non-marketable cost method investments also takes into account variables such as conditions reflected in the capital markets, recent financing activities by the investees, the investees’ capital structure, the terms of the investees’ issued interests, and the lack of marketability of the investments.
The carrying amount and fair value of loans receivable exclude loans measured and recorded at a fair value of
$805 million
as of
December 28, 2013
(
$780 million
as of
December 29, 2012
). The carrying amount and fair value of short-term debt exclude drafts payable.
The fair value of our loans receivable and reverse repurchase agreements, including those held at fair value, is determined using a discounted cash flow model, with all significant inputs derived from or corroborated with observable market data, such as LIBOR-based yield curves, currency spot and forward rates, and credit ratings. The credit quality of these assets remains high, with credit ratings of
A+/A1 or better
for
a substantial majority
of our loans receivable and reverse repurchase agreements as of
December 28, 2013
.
65
The fair value of our grants receivable is determined using a discounted cash flow model, which discounts future cash flows using an appropriate yield curve. As of
December 28, 2013
, and
December 29, 2012
, the carrying amount of our grants receivable was classified within other current assets and other long-term assets, as applicable.
Our long-term debt recognized at amortized cost is comprised of our senior notes and our convertible debentures. The fair value of our senior notes is determined using active market prices, and it is therefore classified as Level 1. The fair value of our convertible long-term debt is determined using discounted cash flow models with observable market inputs, and it takes into consideration variables such as interest rate changes, comparable securities, subordination discount, and credit-rating changes, and it is therefore classified as Level 2.
The NVIDIA Corporation (NVIDIA) cross-license agreement liability in the preceding table was incurred as a result of entering into a long-term patent cross-license agreement with NVIDIA in January 2011. We agreed to make payments to NVIDIA over six years. As of
December 28, 2013
, and
December 29, 2012
, the carrying amount of the liability arising from the agreement was classified within other accrued liabilities and other long-term liabilities, as applicable. The fair value is determined using a discounted cash flow model, which discounts future cash flows using our incremental borrowing rates.
Note 5: Cash and Investments
Cash and investments at the end of each period were as follows:
|
(In Millions)
|
Dec 28,
2013 |
Dec 29,
2012 |
||||||
|
Available-for-sale investments
|
$
|
18,086
|
|
$
|
14,001
|
|
||
|
Cash
|
854
|
|
593
|
|
||||
|
Equity method investments
|
1,038
|
|
992
|
|
||||
|
Loans receivable
|
1,072
|
|
979
|
|
||||
|
Non-marketable cost method investments
|
1,270
|
|
1,202
|
|
||||
|
Reverse repurchase agreements
|
800
|
|
2,850
|
|
||||
|
Trading assets
|
8,441
|
|
5,685
|
|
||||
|
Total cash and investments
|
$
|
31,561
|
|
$
|
26,302
|
|
||
In the third quarter of 2013, we sold our shares in Clearwire Corporation, which had been accounted for as available-for-sale marketable equity securities, and our interest in Clearwire Communications, LLC (Clearwire LLC), which had been accounted for as an equity method investment. In total, we received proceeds of
$470 million
on these transactions and recognized a gain of
$439 million
, which is included in gains (losses) on equity investments, net on the consolidated statements of income. Proceeds received and gains recognized for each investment are included in the "Available-for-Sale Investments" and "Equity Method Investments" sections that follow.
66
Available-for-Sale Investments
Available-for-sale investments at the end of each period were as follows:
|
|
December 28, 2013
|
December 29, 2012
|
||||||||||||||||||||||||||||||
|
(In Millions)
|
Adjusted
Cost
|
Gross
Unrealized
Gains
|
Gross
Unrealized
Losses
|
Fair
Value
|
Adjusted
Cost
|
Gross
Unrealized
Gains
|
Gross
Unrealized
Losses
|
Fair
Value
|
||||||||||||||||||||||||
|
Asset-backed securities
|
$
|
11
|
|
$
|
—
|
|
$
|
(2
|
)
|
$
|
9
|
|
$
|
14
|
|
$
|
—
|
|
$
|
(3
|
)
|
$
|
11
|
|
||||||||
|
Bank deposits
|
2,951
|
|
6
|
|
(1
|
)
|
2,956
|
|
1,417
|
|
1
|
|
—
|
|
1,418
|
|
||||||||||||||||
|
Commercial paper
|
4,464
|
|
—
|
|
—
|
|
4,464
|
|
4,184
|
|
1
|
|
—
|
|
4,185
|
|
||||||||||||||||
|
Corporate bonds
|
2,359
|
|
15
|
|
(3
|
)
|
2,371
|
|
635
|
|
8
|
|
(1
|
)
|
642
|
|
||||||||||||||||
|
Government bonds
|
1,024
|
|
—
|
|
—
|
|
1,024
|
|
2,235
|
|
—
|
|
—
|
|
2,235
|
|
||||||||||||||||
|
Marketable equity securities
|
3,340
|
|
2,881
|
|
—
|
|
6,221
|
|
3,356
|
|
1,069
|
|
(1
|
)
|
4,424
|
|
||||||||||||||||
|
Money market fund deposits
|
1,042
|
|
—
|
|
(1
|
)
|
1,041
|
|
1,086
|
|
—
|
|
—
|
|
1,086
|
|
||||||||||||||||
|
Total available-for-sale investments
|
$
|
15,191
|
|
$
|
2,902
|
|
$
|
(7
|
)
|
$
|
18,086
|
|
$
|
12,927
|
|
$
|
1,079
|
|
$
|
(5
|
)
|
$
|
14,001
|
|
||||||||
In the preceding table, government bonds include bonds issued or deemed to be guaranteed by government entities. Government bonds include instruments such as non-U.S. government bonds, U.S. agency securities, and U.S. Treasury securities. Bank deposits were primarily held by institutions outside the U.S. as of
December 28, 2013
, and
December 29, 2012
.
During the third quarter of 2012, we purchased ASML Holding N.V. equity securities totaling
$3.2 billion
. This equity interest has been accounted for as an available-for-sale investment and is included as marketable equity securities in the preceding table.
For information on the unrealized holding gains (losses) on available-for-sale investments reclassified out of accumulated other comprehensive income into the consolidated statements of income, see "
Note 25: Other Comprehensive Income (Loss)
."
We sold available-for-sale investments for proceeds of
$934 million
in
2013
(
$2.3 billion
in
2012
and
$9.1 billion
in
2011
). Proceeds received in 2013 included
$142 million
from the sale of our shares in Clearwire Corporation, which are included in sales of available-for-sale investments within investing activities on the consolidated statements of cash flows. Substantially all of the proceeds in 2011 were from debt investments primarily used to fund our acquisition of McAfee. The gross realized gains on sales of available-for-sale investments were
$146 million
in
2013
(
$166 million
in
2012
and
$268 million
in
2011
). In 2013, we recognized a gain of
$111 million
on the sale of our shares in Clearwire Corporation, previously included as marketable equity securities in the preceding table. We determine the cost of an investment sold on an average cost basis at the individual security level. Impairment charges recognized on available-for-sale investments were
$14 million
in
2013
(
$36 million
in
2012
and
$73 million
in
2011
).
The amortized cost and fair value of available-for-sale debt investments, by contractual maturity, as of
December 28, 2013
, were as follows:
|
(In Millions)
|
Cost
|
Fair Value
|
||||||
|
Due in 1 year or less
|
$
|
9,170
|
|
$
|
9,188
|
|
||
|
Due in 1–2 years
|
979
|
|
978
|
|
||||
|
Due in 2–5 years
|
421
|
|
421
|
|
||||
|
Instruments not due at a single maturity date
|
1,281
|
|
1,278
|
|
||||
|
Total
|
$
|
11,851
|
|
$
|
11,865
|
|
||
Instruments not due at a single maturity date in the preceding table include all asset-backed securities, most callable government bonds, and all money market fund deposits.
67
Equity Method Investments
Equity method investments, classified within other long-term assets, at the end of each period were as follows:
|
|
December 28, 2013
|
December 29, 2012
|
||||||||||||
|
(Dollars In Millions)
|
Carrying
Value
|
Ownership
Percentage
|
Carrying
Value
|
Ownership
Percentage
|
||||||||||
|
IM Flash Technologies, LLC
|
$
|
646
|
|
49
|
%
|
$
|
642
|
|
49
|
%
|
||||
|
Intel-GE Care Innovations, LLC
|
117
|
|
50
|
%
|
146
|
|
50
|
%
|
||||||
|
Clearwire Communications, LLC
|
—
|
|
—
|
%
|
—
|
|
6
|
%
|
||||||
|
Other equity method investments
|
275
|
|
204
|
|
||||||||||
|
Total
|
$
|
1,038
|
|
$
|
992
|
|
||||||||
IM Flash Technologies, LLC and IM Flash Singapore, LLP
Micron Technology, Inc. (Micron) and Intel formed IM Flash Technologies, LLC (IMFT) in 2006 and IM Flash Singapore, LLP (IMFS) in 2007 to manufacture NAND flash memory products for Micron and Intel. During the second quarter of 2012, we entered into agreements with Micron that modified our joint venture relationship including an agreement to sell our ownership interest in IMFS. We received $
605 million
in the second quarter of 2012 from the sale of assets of IMFS and certain assets of IMFT to Micron.
As part of the agreements to modify our joint venture relationship, we also entered into an amended operating agreement for IMFT. This amended operating agreement extends the term of IMFT to 2024, unless earlier terminated under certain terms and conditions, and provides that IMFT may manufacture certain emerging memory technologies in addition to NAND flash memory. These agreements include a supply agreement for Micron to supply us with NAND flash memory products. We provided approximately
$365 million
to Micron in the second quarter of 2012, primarily for subsequent product purchases under the supply agreement with Micron. The agreements also extend and expand our NAND joint development program with Micron to include emerging memory technologies. Additionally, the amended agreement provides for certain rights that, beginning in 2015, will enable us to sell to Micron, or enable Micron to purchase from us, our interest in IMFT. If Intel exercises this right, Micron would set the closing date of the transaction within two years following such election and could elect to receive financing from Intel for one to two years.
IMFT is a variable interest entity. All costs of the IMFT joint venture will be passed on to Micron and Intel pursuant to our purchase agreements. Intel's portion of IMFT costs, primarily related to product purchases and production-related services, was approximately
$380 million
in
2013
(approximately
$705 million
in
2012
and approximately
$985 million
in
2011
for IMFT and IMFS). Subsequent to the sale of our ownership interest in IMFS in the second quarter of 2012, we no longer incur costs related to IMFS. The amount due to IMFT for product purchases and services provided was approximately
$75 million
as of
December 28, 2013
(approximately
$90 million
as of
December 29, 2012
). IMFT returned
$45 million
to Intel in
2013
, which is reflected as a return of equity method investment within investing activities on the consolidated statements of cash flows (
$137 million
in
2012
and
$263 million
in
2011
).
IMFT depends on Micron and Intel for any additional cash needs. Our known maximum exposure to loss approximated the carrying value of our investment balance in IMFT, which was
$646 million
as of
December 28, 2013
. Except for the amount due to IMFT for product purchases and services, we did not have any additional liabilities recognized on our consolidated balance sheets in connection with our interests in this joint venture as of
December 28, 2013
. In addition, our potential future losses could be higher than the carrying amount of our investment, as Intel and Micron are liable for other future operating costs or obligations of IMFT. Future cash calls could also increase our investment balance and the related exposure to loss. In addition, because we are currently committed to purchasing
49%
of IMFT’s production output and production-related services, we may be required to purchase products at a cost in excess of realizable value.
We have determined that we do not have the characteristics of a consolidating investor in the variable interest entity and, therefore, we account for our interest in IMFT (and accounted for our prior interest in IMFS) using the equity method of accounting.
68
Intel-GE Care Innovations, LLC
In the first quarter of 2011, Intel and General Electric Company (GE) formed Intel-GE Care Innovations, LLC (Care Innovations), an equally owned joint venture in the healthcare industry, that focuses on independent living and delivery of health-related services by means of telecommunications. The company was formed by combining assets of GE Healthcare’s Home Health division and Intel’s Digital Health Group. As a result of forming Care Innovations, we recognized a gain of
$164 million
in the first quarter of 2011, which is included in interest and other, net on the consolidated statements of income.
Care Innovations is a variable interest entity and depends on Intel and GE for any additional cash needs. Our known maximum exposure to loss approximated the carrying value of our investment balance in Care Innovations, which was
$117 million
as of
December 28, 2013
.
Intel and GE equally share the power to direct all of Care Innovations' activities that most significantly impact its economic performance. We have determined that we do not have the characteristics of a consolidating investor in the variable interest entity and, therefore, we account for our interest in Care Innovations using the equity method of accounting.
Clearwire Communications, LLC
In 2008, we invested in Clearwire LLC. We recognized our proportionate share of losses to the extent that our investment had a positive carrying value. We recognized equity method losses of
$145 million
in 2011. In the third quarter of 2013, we sold our interest in Clearwire LLC for proceeds of
$328 million
, which is included in other investing within investing activities on the consolidated statements of cash flows. We recognized a gain on the sale of our interest in Clearwire LLC of
$328 million
.
Non-marketable cost method investments
The carrying value of our non-marketable cost method investments was
$1.3 billion
as of
December 28, 2013
(
$1.2 billion
as of
December 29, 2012
). In
2013
, we recognized impairment charges of
$103 million
on non-marketable cost method investments, which is included within gains (losses) on equity investments, net on the consolidated statements of income (
$104 million
in
2012
and
$56 million
in
2011
).
Trading Assets
As of
December 28, 2013
, and
December 29, 2012
, all of our trading assets were marketable debt instruments. Net
losses
related to trading assets still held at the reporting date were
$70 million
in
2013
(net
gains
of
$16 million
in
2012
and net
losses
of
$71 million
in
2011
). Net
gains
on the related derivatives were
$86 million
in
2013
(net
gains
of
$11 million
in
2012
and
$58 million
in
2011
).
Our primary objective for holding derivative financial instruments is to manage currency exchange rate risk and interest rate risk, and, to a lesser extent, equity market risk and commodity price risk. We also enter into master netting arrangements with counterparties when possible to mitigate credit risk in derivative transactions. A master netting arrangement may allow counterparties to net settle amounts owed to each other as a result of multiple, separate derivative transactions. For presentation on our consolidated balance sheets, we do not offset fair value amounts recognized for derivative instruments under master netting arrangements.
Currency Exchange Rate Risk
We are exposed to currency exchange rate risk and generally hedge our exposures with currency forward contracts, currency interest rate swaps, or currency options.
Substantially all of our revenue is transacted in U.S. dollars. However, a significant amount of our operating expenditures and capital purchases is incurred in or exposed to other currencies, primarily the euro, the Japanese yen, and the Israeli shekel. We have established balance sheet and forecasted transaction currency risk management programs to protect against fluctuations in fair value and the volatility of the functional currency equivalent of future cash flows caused by changes in exchange rates.
Our non-U.S.-dollar-denominated investments in debt instruments and loans receivable are generally hedged with offsetting currency forward contracts or currency interest rate swaps. We may also hedge foreign currency risk arising from funding foreign currency denominated forecasted investments.
These programs reduce, but do not eliminate, the impact of currency exchange movements
.
69
Our currency risk management programs include:
|
•
|
Currency derivatives with cash flow hedge accounting designation
that utilize currency forward contracts and currency options to hedge exposures to the variability in the U.S.-dollar equivalent of anticipated non-U.S.-dollar-denominated cash flows. These instruments generally mature within 12 months. For these derivatives, we report the after-tax gain or loss from the effective portion of the hedge as a component of accumulated other comprehensive income (loss), and we reclassify it into earnings in the same period or periods in which the hedged transaction affects earnings, and in the same line item on the consolidated statements of income as the impact of the hedged transaction.
|
|
•
|
Currency derivatives without hedge accounting designation
that utilize currency forward contracts or currency interest rate swaps to economically hedge the functional currency equivalent cash flows of recognized monetary assets and liabilities, non-U.S.-dollar-denominated debt instruments classified as trading assets, and hedges of non-U.S.-dollar-denominated loans receivable recognized at fair value. The majority of these instruments mature within 12 months. Changes in the functional currency equivalent cash flows of the underlying assets and liabilities are approximately offset by the changes in fair value of the related derivatives. We record net gains or losses in the line item on the consolidated statements of income most closely associated with the related exposures, primarily in interest and other, net, except for equity-related gains or losses, which we primarily record in gains (losses) on equity investments, net.
|
Interest Rate Risk
Our primary objective for holding investments in debt instruments is to preserve principal while maximizing yields. We generally swap the returns on our investments in fixed-rate debt instruments with remaining maturities longer than six months into U.S. dollar three-month LIBOR-based returns, unless management specifically approves otherwise. These swaps are settled at various interest payment times involving cash payments at each interest and principal payment date, with the majority of the contracts having quarterly payments.
Our interest rate risk management programs include:
|
•
|
Interest rate derivatives with cash flow hedge accounting designation
that utilize interest rate swap agreements to modify the interest characteristics of debt instruments. For these derivatives, we report the after-tax gain or loss from the effective portion of the hedge as a component of accumulated other comprehensive income (loss), and we reclassify it into earnings in the same period or periods in which the hedged transaction affects earnings, and in the same line item on the consolidated statements of income as the impact of the hedged transaction.
|
|
•
|
Interest rate derivatives without hedge accounting designation
that utilize interest rate swaps and currency interest rate swaps in economic hedging transactions, including hedges of non-U.S.-dollar-denominated debt instruments classified as trading assets and hedges of non-U.S.-dollar-denominated loans receivable recognized at fair value. Floating interest rates on the swaps are reset on a quarterly basis. Changes in fair value of the debt instruments classified as trading assets and loans receivable recognized at fair value are generally offset by changes in fair value of the related derivatives, both of which are recorded in interest and other, net.
|
Equity Market Risk
Our investments include marketable equity securities and equity derivative instruments. We typically do not attempt to reduce or eliminate our equity market exposure through hedging activities at the inception of the investment. Before we enter into hedge arrangements, we evaluate legal, market, and economic factors, as well as the expected timing of disposal to determine whether hedging is appropriate. Our equity market risk management program may include equity derivatives with or without hedge accounting designation that utilize warrants, equity options, or other equity derivatives.
We recognize changes in the fair value of such derivatives in gains (losses) on equity investments, net.
We also utilize total return swaps to offset changes in liabilities related to the equity market risks of certain deferred compensation arrangements. Gains and losses from changes in fair value of these total return swaps are generally offset by the losses and gains on the related liabilities
, both of which are recorded in cost of sales and operating expenses.
Deferred compensation liabilities were
$1.1 billion
as of
December 28, 2013
(
$859 million
as of
December 29, 2012
), and are included in other accrued liabilities.
70
In 2010, we sold our ownership interest in Numonyx B.V. to Micron for consideration consisting of shares of Micron. We also entered into equity option transactions that economically hedged a portion of the ownership interest in Micron that we acquired. In the second quarter of 2011, we sold our remaining ownership interest in Micron and the related equity options matured.
Commodity Price Risk
We operate facilities that consume commodities and have established forecasted transaction risk management programs to protect against fluctuations in fair value and the volatility of future cash flows caused by changes in commodity prices, such as those for natural gas. These programs reduce, but do not always eliminate, the impact of commodity price movements.
Our commodity price risk management program includes commodity derivatives with cash flow hedge accounting designation that utilize commodity swap contracts to hedge future cash flow exposures to the variability in commodity prices. These instruments generally mature within 12 months. For these derivatives, we report the after-tax gain (loss) from the effective portion of the hedge as a component of accumulated other comprehensive income (loss) and reclassify it into earnings in the same period or periods in which the hedged transaction affects earnings, and in the same line item on the consolidated statements of income as the impact of the hedged transaction.
Volume of Derivative Activity
Total gross notional amounts for outstanding derivatives (recorded at fair value) at the end of each period were as follows:
|
(In Millions)
|
Dec 28,
2013 |
Dec 29,
2012 |
Dec 31,
2011 |
|||||||||
|
Currency forwards
|
$
|
13,404
|
|
$
|
13,117
|
|
$
|
11,203
|
|
|||
|
Currency interest rate swaps
|
4,377
|
|
2,711
|
|
1,650
|
|
||||||
|
Embedded debt derivatives
|
3,600
|
|
3,600
|
|
3,600
|
|
||||||
|
Interest rate swaps
|
1,377
|
|
1,101
|
|
1,837
|
|
||||||
|
Total return swaps
|
914
|
|
807
|
|
761
|
|
||||||
|
Other
|
67
|
|
127
|
|
182
|
|
||||||
|
Total
|
$
|
23,739
|
|
$
|
21,463
|
|
$
|
19,233
|
|
|||
The gross notional amounts for currency forwards and currency interest rate swaps (presented by currency) at the end of each period were as follows:
|
(In Millions)
|
Dec 28,
2013 |
Dec 29,
2012 |
Dec 31,
2011 |
|||||||||
|
British pound sterling
|
$
|
549
|
|
$
|
308
|
|
$
|
459
|
|
|||
|
Chinese yuan
|
1,116
|
|
647
|
|
688
|
|
||||||
|
Euro
|
6,874
|
|
5,994
|
|
3,904
|
|
||||||
|
Israeli shekel
|
2,244
|
|
2,256
|
|
2,168
|
|
||||||
|
Japanese yen
|
4,116
|
|
4,389
|
|
3,477
|
|
||||||
|
Malaysian ringgit
|
506
|
|
442
|
|
805
|
|
||||||
|
Swiss franc
|
1,189
|
|
657
|
|
209
|
|
||||||
|
Other
|
1,187
|
|
1,135
|
|
1,143
|
|
||||||
|
Total
|
$
|
17,781
|
|
$
|
15,828
|
|
$
|
12,853
|
|
|||
71
Fair Value of Derivative Instruments in the Consolidated Balance Sheets
The fair value of our derivative instruments at the end of each period were as follows:
|
|
December 28, 2013
|
December 29, 2012
|
||||||||||||||||||||||||||||||
|
(In Millions)
|
Other
Current
Assets
|
Other
Long-Term
Assets
|
Other
Accrued
Liabilities
|
Other
Long-Term
Liabilities
|
Other
Current
Assets
|
Other
Long-Term
Assets
|
Other
Accrued
Liabilities
|
Other
Long-Term
Liabilities
|
||||||||||||||||||||||||
|
Derivatives designated as hedging instruments:
|
||||||||||||||||||||||||||||||||
|
Currency forwards
|
$
|
114
|
|
$
|
1
|
|
$
|
118
|
|
$
|
2
|
|
$
|
91
|
|
$
|
2
|
|
$
|
127
|
|
$
|
—
|
|
||||||||
|
Total derivatives designated as hedging instruments
|
$
|
114
|
|
$
|
1
|
|
$
|
118
|
|
$
|
2
|
|
$
|
91
|
|
$
|
2
|
|
$
|
127
|
|
$
|
—
|
|
||||||||
|
Derivatives not designated as hedging instruments:
|
||||||||||||||||||||||||||||||||
|
Currency forwards
|
$
|
66
|
|
$
|
—
|
|
$
|
63
|
|
$
|
—
|
|
$
|
85
|
|
$
|
—
|
|
$
|
58
|
|
$
|
—
|
|
||||||||
|
Currency interest rate swaps
|
124
|
|
6
|
|
163
|
|
29
|
|
33
|
|
18
|
|
72
|
|
14
|
|
||||||||||||||||
|
Embedded debt derivatives
|
—
|
|
—
|
|
—
|
|
19
|
|
—
|
|
—
|
|
—
|
|
6
|
|
||||||||||||||||
|
Interest rate swaps
|
5
|
|
—
|
|
28
|
|
—
|
|
—
|
|
—
|
|
34
|
|
—
|
|
||||||||||||||||
|
Total return swaps
|
48
|
|
—
|
|
—
|
|
—
|
|
11
|
|
—
|
|
—
|
|
—
|
|
||||||||||||||||
|
Other
|
—
|
|
29
|
|
—
|
|
—
|
|
1
|
|
18
|
|
1
|
|
—
|
|
||||||||||||||||
|
Total derivatives not designated as hedging instruments
|
$
|
243
|
|
$
|
35
|
|
$
|
254
|
|
$
|
48
|
|
$
|
130
|
|
$
|
36
|
|
$
|
165
|
|
$
|
20
|
|
||||||||
|
Total derivatives
|
$
|
357
|
|
$
|
36
|
|
$
|
372
|
|
$
|
50
|
|
$
|
221
|
|
$
|
38
|
|
$
|
292
|
|
$
|
20
|
|
||||||||
Derivatives in Cash Flow Hedging Relationships
The before-tax gains (losses), attributed to the effective portion of cash flow hedges, recognized in other comprehensive income (loss) for each period were as follows:
|
|
Gains (Losses)
Recognized in OCI on
Derivatives (Effective Portion)
|
|||||||||||
|
(In Millions)
|
2013
|
2012
|
2011
|
|||||||||
|
Currency forwards
|
$
|
(167
|
)
|
$
|
4
|
|
$
|
20
|
|
|||
|
Other
|
1
|
|
9
|
|
—
|
|
||||||
|
Total
|
$
|
(166
|
)
|
$
|
13
|
|
$
|
20
|
|
|||
Gains and losses on derivative instruments in cash flow hedging relationships related to hedge ineffectiveness and amounts excluded from effectiveness testing were insignificant during all periods presented in the preceding tables. Additionally, for all periods presented, there was an insignificant impact on results of operations from discontinued cash flow hedges, which arises when forecasted transactions are probable of not occurring.
72
Derivatives Not Designated as Hedging Instruments
The effects of derivative instruments not designated as hedging instruments on the consolidated statements of income for each period were as follows:
|
(In Millions)
|
Location of Gains (Losses)
Recognized in Income on Derivatives
|
2013
|
2012
|
2011
|
||||||||||
|
Currency forwards
|
Interest and other, net
|
$
|
44
|
|
$
|
3
|
|
$
|
58
|
|
||||
|
Currency interest rate swaps
|
Interest and other, net
|
29
|
|
(71
|
)
|
(17
|
)
|
|||||||
|
Equity options
|
Gains (losses) on equity investments, net
|
1
|
|
(1
|
)
|
(67
|
)
|
|||||||
|
Interest rate swaps
|
Interest and other, net
|
—
|
|
31
|
|
(26
|
)
|
|||||||
|
Total return swaps
|
Various
|
140
|
|
77
|
|
(13
|
)
|
|||||||
|
Other
|
Gains (losses) on equity investments, net
|
5
|
|
(7
|
)
|
4
|
|
|||||||
|
Other
|
Interest and other, net
|
—
|
|
3
|
|
—
|
|
|||||||
|
Total
|
$
|
219
|
|
$
|
35
|
|
$
|
(61
|
)
|
|||||
Financial instruments that potentially subject us to concentrations of credit risk consist principally of investments in debt instruments, derivative financial instruments, loans receivable, and trade receivables. When possible, we enter into master netting arrangements with counterparties to mitigate credit risk in derivative transactions. A master netting arrangement may allow counterparties to net settle amounts owed to each other as a result of multiple, separate derivative transactions. For presentation on our consolidated balance sheets, we do not offset fair value amounts recognized for derivative instruments under master netting arrangements.
We generally place investments with high-credit-quality counterparties and, by policy, we limit the amount of credit exposure to any one counterparty based on our analysis of that counterparty’s relative credit standing.
Most
of our investments in debt instruments are in
A/A2 or better
rated issuances, and
the majority
of the issuances are rated
AA-/Aa3 or better
. Our investment policy requires substantially all investments with original maturities at the time of investment of up to six months to be rated at least A-2/P-2 by Standard & Poor’s/Moody’s, and specifies a higher minimum rating for investments with longer maturities. For instance, investments with maturities of greater than three years generally require a minimum rating of AA-/Aa3 at the time of investment. Government regulations imposed on investment alternatives of our non-U.S. subsidiaries, or the absence of A rated counterparties in certain countries, result in some minor exceptions. Credit-rating criteria for derivative instruments are similar to those for other investments. Due to master netting arrangements, the amounts subject to credit risk related to derivative instruments are generally limited to the amounts, if any, by which the counterparty’s obligations exceed our obligations with that counterparty. As of
December 28, 2013
, our total credit exposure to any single counterparty, excluding Japan government bonds, did not exceed
$750 million
. We obtain and secure available collateral from counterparties against obligations, including securities lending transactions, when we deem it appropriate.
A substantial majority of our trade receivables are derived from sales to original equipment manufacturers and original design manufacturers. We also have accounts receivable derived from sales to industrial and retail distributors. Our three largest customers accounted for
44%
of net revenue for
2013
(
43%
for
2012
and
2011
). Additionally, these three largest customers accounted for
34%
of our accounts receivable as of
December 28, 2013
(
33%
as of
December 29, 2012
). We believe that the receivable balances from these largest customers do not represent a significant credit risk based on cash flow forecasts, balance sheet analysis, and past collection experience.
We have adopted credit policies and standards intended to accommodate industry growth and inherent risk. We believe that credit risks are moderated by the financial stability of our major customers. We assess credit risk through quantitative and qualitative analysis, and from this analysis, we establish credit limits and determine whether we will seek to use one or more credit support devices, such as obtaining a parent guarantee or standby letter of credit, or obtaining credit insurance.
73
2013 Acquisitions
During 2013, we completed
12
acquisitions qualifying as business combinations in exchange for aggregate net cash consideration of
$925 million
. Most of the consideration was allocated to goodwill and acquisition-related developed technology intangible assets. Included in these acquisitions is our acquisition of Stonesoft Oyj (Stonesoft) to expand our network security solutions, specifically addressing next generation firewall products. We acquired Stonesoft in the third quarter of 2013 for net cash consideration of
$381 million
, substantially all of which was allocated to goodwill and acquisition-related developed technology intangible assets. Stonesoft's operating results are included in our software and services operating segments. For information on the assignment of goodwill to our operating segments for our acquisitions, see “
Note 10: Goodwill
,” and for information on the classification of intangible assets, see “
Note 11: Identified Intangible Assets
.” The completed acquisitions in 2013, both individually and in the aggregate, were not significant to our consolidated results of operations.
2012 Acquisitions
During 2012, we completed
15
acquisitions qualifying as business combinations in exchange for aggregate net cash consideration of
$638 million
. Substantially all of the consideration was allocated to goodwill and acquisition-related developed technology intangible assets. The completed acquisitions in 2012, both individually and in the aggregate, were not significant to our consolidated results of operations.
2011 Acquisitions
McAfee, Inc.
On
February 28, 2011
, we completed the acquisition of McAfee by acquiring all issued and outstanding common shares in exchange for cash. The acquired company continues to operate as McAfee and offers products for endpoint security, network and content security, risk and compliance, and consumer and mobile security. In addition to managing the existing McAfee business, the objective of the acquisition was to accelerate and enhance Intel’s combination of hardware and software security solutions, thereby improving the overall security of our platforms.
Total consideration to acquire McAfee was
$6.7 billion
(net of
$943 million
of cash and cash equivalents acquired) and comprised the following:
|
(In Millions)
|
|
||
|
Cash
|
$
|
6,652
|
|
|
Share-based awards assumed
|
48
|
|
|
|
Total
|
$
|
6,700
|
|
The fair value of the assets acquired and liabilities assumed by major class in the acquisition of McAfee was recognized as follows:
|
(In Millions)
|
|
||
|
Marketable debt securities
|
$
|
329
|
|
|
Goodwill
|
4,299
|
|
|
|
Identified intangible assets
|
3,552
|
|
|
|
Deferred tax assets
|
738
|
|
|
|
Other assets
|
417
|
|
|
|
Deferred income
|
(1,049
|
)
|
|
|
Deferred tax liabilities
|
(1,191
|
)
|
|
|
Other liabilities
|
(395
|
)
|
|
|
Total
|
$
|
6,700
|
|
74
The goodwill of
$4.3 billion
arising from the acquisition is primarily attributed to synergies to enable a single company to combine security and hardware for the protection of online devices, as well as the assembled workforce of McAfee. Substantially all of the goodwill recognized is not deductible for tax purposes. For information on the assignment of goodwill to our operating segments for the acquisition, see “
Note 10: Goodwill
.”
The identified intangible assets assumed in the acquisition of McAfee were recognized as follows based upon their fair value as of February 28, 2011:
|
|
Fair Value
(In Millions)
|
Estimated
Useful Life
(In Years)
|
||||||
|
Developed technology
|
$
|
1,221
|
|
4
|
||||
|
Customer relationships
|
1,418
|
|
2
|
–
|
7
|
|||
|
Total identified intangible assets subject to amortization
|
$
|
2,639
|
|
|||||
|
In-process research and development
|
92
|
|
||||||
|
Trade names
|
821
|
|
||||||
|
Total identified intangible assets
|
$
|
3,552
|
|
|||||
Acquired developed technology represents the fair value of McAfee products that have reached technological feasibility and were part of McAfee’s product offerings at the date of acquisition. Customer relationships represent the fair value of the underlying relationships and agreements with McAfee’s customers. In-process R&D represents the fair value of incomplete McAfee R&D projects that had not reached technological feasibility as of the date of acquisition. Incremental costs incurred for those projects are expensed as incurred in R&D. Since the acquisition was completed, most of the projects have been completed and the associated costs are being amortized. Trade names are indefinite-lived intangible assets and represent the fair value of brand and name recognition associated with the marketing of McAfee’s products and services.
Other 2011 Acquisitions
During 2011, in addition to the McAfee acquisition, we completed
13
acquisitions qualifying as business combinations in exchange for total consideration of
$2.1 billion
, substantially all cash consideration. Total net cash consideration to acquire the Wireless Solutions (WLS) business of Infineon Technologies AG, which operated as Intel Mobile Communications (IMC), was
$1.4 billion
. The WLS business offers mobile phone components such as baseband processors, radio frequency transceivers, and power management integrated circuits. In addition to managing the existing WLS business, the objective of the acquisition was to provide solutions that enable wireless connectivity for a broad range of computing applications. In 2013, we completed a reorganization of IMC into our Multi-Comm and existing Phone Group operating segments, see "
Note 27: Operating Segments and Geographic Information
."
The fair value of the assets acquired and liabilities assumed by major class in the acquisitions completed during 2011, excluding McAfee, was allocated as follows:
|
(In Millions)
|
|
||
|
Fair value of net tangible assets acquired
|
$
|
206
|
|
|
Goodwill
|
517
|
|
|
|
Identified intangible assets
|
1,409
|
|
|
|
Total
|
$
|
2,132
|
|
For information on the assignment of goodwill to our operating segments for the acquisitions, see “
Note 10: Goodwill
.”
75
The identified intangible assets assumed in the acquisitions completed during 2011, excluding McAfee, were recognized as follows:
|
|
Fair Value
(In Millions)
|
Estimated
Useful Life
(In Years)
|
||||||
|
Developed technology
|
$
|
1,102
|
|
3
|
–
|
9
|
||
|
Customer relationships
|
144
|
|
5
|
–
|
8
|
|||
|
Other intangible assets
|
44
|
|
2
|
–
|
7
|
|||
|
Total identified intangible assets subject to amortization
|
$
|
1,290
|
|
|||||
|
In-process research and development
|
119
|
|
||||||
|
Total identified intangible assets
|
$
|
1,409
|
|
|||||
Acquired developed technology represents the fair value of the acquirees’ products that have reached technological feasibility and are a part of the acquirees’ product lines at the time acquired. Customer relationships represent the fair value of the underlying relationships and agreements with the acquirees’ customers. In-process R&D represents the fair value of incomplete R&D projects that had not reached technological feasibility as of the date of acquisition. Since the acquisitions were completed, most of the projects have been completed and the associated costs are being amortized.
Actual and Pro Forma Results of Acquirees
Net revenue and net income attributable to acquisitions completed during 2011 have been included in our consolidated statements of income from their respective acquisition dates. The acquisitions completed during 2011 were not individually significant to our consolidated results of operations; however, they were significant in the aggregate. During 2011, the results of the businesses acquired in 2011 contributed approximately
$3.6 billion
to our net revenue and reduced our net income by approximately
$275 million
; substantially all of these impacts were attributable to McAfee and the former IMC and include the impacts of the amortization of acquired identified intangible assets.
McAfee is a non-reportable operating segment and is aggregated with similar non-reportable operating segments within the software and services operating segments category for segment reporting purposes. IMC has been reorganized into our Multi-Comm and existing Phone Group operating segments which are non-reportable operating segments and are aggregated with similar non-reportable operating segments within the other Intel architecture (Other IA) operating segments category for segment reporting purposes. For further information, see “
Note 27: Operating Segments and Geographic Information
.”
The unaudited pro forma financial results for 2011 combine the historical results of Intel for 2011 along with the historical results of the businesses acquired during 2011. The results include the effects of pro forma adjustments as if businesses acquired in 2011 were acquired on December 27, 2009.
The unaudited pro forma financial results presented below do not include any anticipated synergies or other expected benefits of the acquisitions. This is presented for informational purposes only and is not indicative of future operations or results that would have been achieved had the acquisitions been completed as of December 27, 2009.
|
(In Millions, Except Per Share Amounts—Unaudited)
|
2011
|
|||
|
Net revenue
|
$
|
54,738
|
|
|
|
Net income
|
$
|
13,028
|
|
|
|
Diluted earnings per share
|
$
|
2.41
|
|
|
76
In the first quarter of 2011, we completed the divestiture of our Digital Health Group by entering into an agreement with GE to form an equally owned joint venture to create a new healthcare company focused on independent living and delivery of health-related services via telecommunications. The new company, Care Innovations, was formed by combining assets of GE Healthcare’s Home Health division and Intel’s Digital Health Group. During the first quarter of 2011, as a result of the formation of Care Innovations, we recognized a gain of
$164 million
, within interest and other, net. For further information, see “
Note 5: Cash and Investments
.”
Goodwill activity for each period was as follows:
|
(In Millions)
|
PC Client Group
|
Data Center Group
|
Other Intel
Architecture
Operating
Segments
|
Software and Services Operating Segments
|
Total
|
|||||||||||||||
|
December 31, 2011
|
$
|
2,918
|
|
$
|
1,553
|
|
$
|
844
|
|
$
|
3,939
|
|
$
|
9,254
|
|
|||||
|
Additions due to acquisitions
|
44
|
|
286
|
|
78
|
|
44
|
|
452
|
|
||||||||||
|
Impairments
|
—
|
|
—
|
|
(6
|
)
|
—
|
|
(6
|
)
|
||||||||||
|
Effect of exchange rate fluctuations
|
—
|
|
—
|
|
—
|
|
10
|
|
10
|
|
||||||||||
|
December 29, 2012
|
$
|
2,962
|
|
$
|
1,839
|
|
$
|
916
|
|
$
|
3,993
|
|
$
|
9,710
|
|
|||||
|
Additions due to acquisitions
|
62
|
|
14
|
|
171
|
|
504
|
|
751
|
|
||||||||||
|
Transfers
|
34
|
|
(22
|
)
|
(12
|
)
|
—
|
|
—
|
|
||||||||||
|
Effect of exchange rate fluctuations
|
—
|
|
—
|
|
—
|
|
52
|
|
52
|
|
||||||||||
|
December 28, 2013
|
$
|
3,058
|
|
$
|
1,831
|
|
$
|
1,075
|
|
$
|
4,549
|
|
$
|
10,513
|
|
|||||
In 2013, we completed a reorganization of IMC into our Multi-Comm and existing Phone Group operating segments. Goodwill related to the former IMC was allocated between Multi-Comm and the Phone Group within the Other IA operating segments. Also in 2013, we completed a reorganization that transferred a portion of our wired connectivity business formerly included within the Data Center Group (DCG) to the PC Client Group (PCCG). Due to this reorganization, goodwill was transferred from DCG to PCCG.
In 2012, we reorganized and allocated goodwill from the Netbook and Tablet Group into three operating segments: Netbook Group, Tablet Group, and Service Provider Group. These three new operating segments are still included in the Other IA operating segments. Additionally, the former Ultra-Mobility Group is now the Phone Group.
For further information on these reorganizations, see “
Note 27: Operating Segments and Geographic Information
.”
During the fourth quarters of
2013
,
2012
, and
2011
, we completed our annual impairment assessments and we concluded that goodwill was not impaired in any of these years. The accumulated impairment losses as of
December 28, 2013
, were
$719 million
:
$346 million
associated with PCCG,
$275 million
associated with DCG, and $
98 million
associated with Other IA operating segments.
77
Identified intangible assets at the end of
December 28, 2013
, were as follows:
|
(In Millions)
|
Gross
Assets
|
Accumulated
Amortization
|
Net
|
|||||||||
|
Acquisition-related developed technology
|
$
|
2,922
|
|
$
|
(1,691
|
)
|
$
|
1,231
|
|
|||
|
Acquisition-related customer relationships
|
1,760
|
|
(828
|
)
|
932
|
|
||||||
|
Acquisition-related trade names
|
65
|
|
(44
|
)
|
21
|
|
||||||
|
Licensed technology and patents
|
3,093
|
|
(974
|
)
|
2,119
|
|
||||||
|
Identified intangible assets subject to amortization
|
7,840
|
|
(3,537
|
)
|
4,303
|
|
||||||
|
Acquisition-related trade names
|
818
|
|
—
|
|
818
|
|
||||||
|
Other intangible assets
|
29
|
|
—
|
|
29
|
|
||||||
|
Identified intangible assets not subject to amortization
|
847
|
|
—
|
|
847
|
|
||||||
|
Total identified intangible assets
|
$
|
8,687
|
|
$
|
(3,537
|
)
|
$
|
5,150
|
|
|||
As a result of our acquisitions in 2013, we recorded acquisition-related developed technology of
$114 million
with a weighted average useful life of
five
years and acquisition-related customer relationships of
$60 million
with a weighted average useful life of
seven
years. During 2013, we purchased licensed technology and patents of
$36 million
with a weighted average useful life of
10
years.
Identified intangible assets at the end of
December 29, 2012
were as follows:
|
(In Millions)
|
Gross
Assets
|
Accumulated
Amortization
|
Net
|
|||||||||
|
Acquisition-related developed technology
|
$
|
2,778
|
|
$
|
(1,116
|
)
|
$
|
1,662
|
|
|||
|
Acquisition-related customer relationships
|
1,712
|
|
(551
|
)
|
1,161
|
|
||||||
|
Acquisition-related trade names
|
68
|
|
(33
|
)
|
35
|
|
||||||
|
Licensed technology and patents
|
2,986
|
|
(699
|
)
|
2,287
|
|
||||||
|
Other intangible assets
|
238
|
|
(86
|
)
|
152
|
|
||||||
|
Identified intangible assets subject to amortization
|
7,782
|
|
(2,485
|
)
|
5,297
|
|
||||||
|
Acquisition-related trade names
|
809
|
|
—
|
|
809
|
|
||||||
|
Other intangible assets
|
129
|
|
—
|
|
129
|
|
||||||
|
Identified intangible assets not subject to amortization
|
938
|
|
—
|
|
938
|
|
||||||
|
Total identified intangible assets
|
$
|
8,720
|
|
$
|
(2,485
|
)
|
$
|
6,235
|
|
|||
As a result of our acquisitions in 2012, we recorded acquisition-related developed technology of
$168 million
with a weighted average useful life of
10
years. During 2012, we purchased licensed technology and patents of
$815 million
with a weighted average useful life of
nine
years, including wireless patents purchased from InterDigital, Inc. for
$375 million
to be amortized over approximately
10
years. Additionally, we recorded other intangible assets subject to amortization of
$238 million
associated with customer relationships, which was fully amortized in 2013.
78
In January 2011, we entered into a long-term patent cross-license agreement with NVIDIA. Under the agreement, we received a license to all of NVIDIA’s patents with a capture period that runs through March 2017 while NVIDIA products are licensed to our patents, subject to exclusions for x86 products, certain chipsets, and certain flash memory technology products. The agreement also included settlement of the existing litigation between the companies, as well as broad mutual general releases. We agreed to make payments totaling
$1.5 billion
to NVIDIA over six years (
$300 million
in each of January 2011, 2012, and 2013; and
$200 million
in each of January 2014, 2015, and 2016), which resulted in a liability totaling approximately
$1.4 billion
, on a discounted basis. In the fourth quarter of 2010, we recognized an expense of
$100 million
related to the litigation settlement. In the first quarter of 2011, we recognized the remaining amount of
$1.3 billion
as licensed technology, which will be amortized into cost of sales over its estimated useful life of
17
years. The initial recognition of the intangible asset and associated liability for future payments to NVIDIA was treated as a non-cash transaction and, therefore, had no impact on our consolidated statements of cash flows. Future payments are treated as cash used for financing activities. As of
December 28, 2013
, the remaining liability of
$587 million
is classified within other accrued liabilities and other long-term liabilities, based on the expected timing of the underlying payments.
We recorded amortization expense on the consolidated statements of income as follows: amortization of acquisition-related developed technology and licensed technology and patents is included in cost of sales, amortization of acquisition-related customer relationships and trade names is included in amortization of acquisition-related intangibles, and amortization of other intangible assets is recorded as a reduction of revenue.
Amortization expenses for each period were as follows:
|
(In Millions)
|
2013
|
2012
|
2011
|
|||||||||
|
Acquisition-related developed technology
|
$
|
576
|
|
$
|
557
|
|
$
|
482
|
|
|||
|
Acquisition-related customer relationships
|
279
|
|
296
|
|
250
|
|
||||||
|
Acquisition-related trade names
|
12
|
|
12
|
|
10
|
|
||||||
|
Licensed technology and patents
|
272
|
|
214
|
|
181
|
|
||||||
|
Other intangible assets
|
103
|
|
86
|
|
—
|
|
||||||
|
Total amortization expenses
|
$
|
1,242
|
|
$
|
1,165
|
|
$
|
923
|
|
|||
Based on identified intangible assets that are subject to amortization as of
December 28, 2013
, we expect future amortization expense for each period to be as follows:
|
(In Millions)
|
2014
|
2015
|
2016
|
2017
|
2018
|
|||||||||||||||
|
Acquisition-related developed technology
|
$
|
579
|
|
$
|
303
|
|
$
|
211
|
|
$
|
63
|
|
$
|
41
|
|
|||||
|
Acquisition-related customer relationships
|
268
|
|
251
|
|
233
|
|
142
|
|
29
|
|
||||||||||
|
Acquisition-related trade names
|
10
|
|
9
|
|
3
|
|
—
|
|
—
|
|
||||||||||
|
Licensed technology and patents
|
270
|
|
252
|
|
238
|
|
199
|
|
158
|
|
||||||||||
|
Total future amortization expenses
|
$
|
1,127
|
|
$
|
815
|
|
$
|
685
|
|
$
|
404
|
|
$
|
228
|
|
|||||
Other long-term assets at the end of each period were as follows:
|
(In Millions)
|
Dec 28,
2013 |
Dec 29,
2012 |
||||||
|
Equity method investments
|
$
|
1,038
|
|
$
|
992
|
|
||
|
Non-marketable cost method investments
|
1,270
|
|
1,202
|
|
||||
|
Non-current deferred tax assets
|
434
|
|
358
|
|
||||
|
Loans receivable
|
952
|
|
644
|
|
||||
|
Other
|
1,795
|
|
952
|
|
||||
|
Total other long-term assets
|
$
|
5,489
|
|
$
|
4,148
|
|
||
79
In response to the current business environment, during 2013, management approved several restructuring actions including targeted workforce reductions as well as exit of certain businesses and facilities. These actions include the wind down of our
200 millimeter (mm)
wafer fabrication facility in Massachusetts, which we expect to cease production by the end of 2014. These targeted reductions will enable the company to better align our resources in areas providing the greatest benefit in the changing market
.
Restructuring and asset impairment charges for each period were as follows:
|
(In Millions)
|
2013
|
2012
|
2011
|
|||||||||
|
Employee severance and benefit arrangements
|
$
|
201
|
|
$
|
—
|
|
$
|
—
|
|
|||
|
Asset impairments
|
39
|
|
—
|
|
—
|
|
||||||
|
Total restructuring and asset impairment charges
|
$
|
240
|
|
$
|
—
|
|
$
|
—
|
|
|||
The restructuring and asset impairment activity for
2013
was as follows:
|
(In Millions)
|
Employee Severance and Benefits
|
Asset Impairments
|
Total
|
|||||||||
|
Accrued restructuring balance as of December 29, 2012
|
$
|
—
|
|
$
|
—
|
|
$
|
—
|
|
|||
|
Additional accruals
|
195
|
|
39
|
|
234
|
|
||||||
|
Adjustments
|
6
|
|
—
|
|
6
|
|
||||||
|
Cash payments
|
(18
|
)
|
—
|
|
(18
|
)
|
||||||
|
Non-cash settlements
|
—
|
|
(39
|
)
|
(39
|
)
|
||||||
|
Accrued restructuring balance as of December 28, 2013
|
$
|
183
|
|
$
|
—
|
|
$
|
183
|
|
|||
We recorded the additional accruals and adjustments as restructuring and asset impairment charges in the consolidated statements of income within the “all other” operating segment. The charges incurred during
2013
included
$201 million
related to employee severance and benefit arrangements, which impacted approximately
3,900
employees. The accrued restructuring balance as of
December 28, 2013
,
relates to employee severance and benefits which are expected to be paid within the next 12 months and was recorded as a current liability within accrued compensation and benefits in the consolidated balance sheets.
We may incur additional charges in the future for employee severance and benefit arrangements, as well as facility-related or other exit activities, as we continue to align our resources to meet the needs of the business.
Deferred income at the end of each period was as follows:
|
(In Millions)
|
Dec 28,
2013 |
Dec 29,
2012 |
||||||
|
Deferred income on shipments of components to distributors
|
$
|
852
|
|
$
|
694
|
|
||
|
Deferred income from software and services operating segments
|
1,244
|
|
1,238
|
|
||||
|
Current deferred income
|
$
|
2,096
|
|
$
|
1,932
|
|
||
|
Non-current deferred income from software and services operating segments
|
506
|
|
473
|
|
||||
|
Total deferred income
|
$
|
2,602
|
|
$
|
2,405
|
|
||
We classify non-current deferred income from the software and services operating segments in other long-term liabilities.
80
In January 2011, as part of our ongoing quality assurance procedures, we identified a design issue with the Intel
®
6 Series Express Chipset family. The issue affected chipsets sold in the fourth quarter of 2010 and January 2011. We subsequently implemented a silicon fix and began shipping the updated version of the affected chipset in February 2011. The total cost in 2011 to repair and replace affected materials and systems, located with customers and in the market, was $
422 million
. We do not expect to have any significant future adjustments related to this issue.
Note 16: Borrowings
As of
December 28, 2013
, short-term debt consisted of drafts payable of
$257 million
and notes payable of
$24 million
(drafts payable of $
264 million
and notes payable of
$48 million
as of
December 29, 2012
). We have an ongoing authorization from our Board of Directors to borrow up to
$3.0 billion
, including through the issuance of commercial paper. Maximum borrowings under our commercial paper program during
2013
were
$300 million
(
$500 million
during
2012
). Our commercial paper was rated
A-1+
by Standard & Poor’s and
P-1
by Moody’s as of
December 28, 2013
.
Long-Term Debt
Our long-term debt at the end of each period was as follows:
|
(In Millions)
|
Dec 28,
2013 |
Dec 29,
2012 |
||||||
|
2012 Senior notes due 2017 at 1.35%
|
$
|
2,997
|
|
$
|
2,997
|
|
||
|
2012 Senior notes due 2022 at 2.70%
|
1,494
|
|
1,494
|
|
||||
|
2012 Senior notes due 2032 at 4.00%
|
744
|
|
743
|
|
||||
|
2012 Senior notes due 2042 at 4.25%
|
924
|
|
924
|
|
||||
|
2011 Senior notes due 2016 at 1.95%
|
1,499
|
|
1,498
|
|
||||
|
2011 Senior notes due 2021 at 3.30%
|
1,996
|
|
1,996
|
|
||||
|
2011 Senior notes due 2041 at 4.80%
|
1,490
|
|
1,489
|
|
||||
|
2009 Junior subordinated convertible debentures due 2039 at 3.25%
|
1,075
|
|
1,063
|
|
||||
|
2005 Junior subordinated convertible debentures due 2035 at 2.95%
|
946
|
|
932
|
|
||||
|
Total long-term debt
|
$
|
13,165
|
|
$
|
13,136
|
|
||
Senior Notes
In the fourth quarter of 2012, we issued
$6.2 billion
aggregate principal amount of senior unsecured notes for general corporate purposes and to repurchase shares of our common stock pursuant to our authorized common stock repurchase program. In the third quarter of 2011, we issued
$5.0 billion
aggregate principal amount of senior unsecured notes, primarily to repurchase shares of our common stock pursuant to our authorized common stock repurchase program, and for general corporate purposes.
Our senior notes pay a fixed rate of interest semiannually. We may redeem our senior notes, in whole or in part, at any time at our option at specified redemption prices. The senior notes rank equally in right of payment with all of our other existing and future senior unsecured indebtedness and will effectively rank junior to all liabilities of our subsidiaries.
81
Convertible Debentures
In 2009, we issued
$2.0 billion
of junior subordinated convertible debentures (the 2009 debentures). In 2005, we issued
$1.6 billion
of junior subordinated convertible debentures (the 2005 debentures). Both the 2009 and 2005 debentures pay a fixed rate of interest semiannually.
|
|
2009
Debentures
|
2005
Debentures
|
||||
|
Annual coupon interest rate
|
3.25
|
%
|
2.95
|
%
|
||
|
Annual effective interest rate
|
7.20
|
%
|
6.45
|
%
|
||
|
Maximum amount of contingent interest that will accrue per year
|
0.50
|
%
|
0.40
|
%
|
||
The effective interest rate is based on the rate for a similar instrument that does not have a conversion feature.
Both the 2009 and 2005 debentures have a contingent interest component that requires us to pay interest based on certain thresholds or for certain events, commencing on August 1, 2019 for the 2009 debentures. As of
December 28, 2013
, we have not met any of the thresholds or events related to the 2005 debentures. The fair values of the related embedded derivatives were
$10 million
and
$9 million
as of
December 28, 2013
, for the 2009 and 2005 debentures, respectively (
$6 million
and
zero
as of
December 29, 2012
for the 2009 and 2005 debentures, respectively).
Both the 2009 and 2005 debentures are convertible, subject to certain conditions, into shares of our common stock. Holders can surrender the 2009 debentures for conversion if the closing price of Intel common stock has been at least
130%
of the conversion price then in effect for at least
20
trading days during the
30
consecutive trading-day period ending on the last trading day of the preceding fiscal quarter. Holders can surrender the 2005 debentures for conversion at any time. We will settle any conversion or repurchase of the 2009 debentures in cash up to the face value, and any amount in excess of face value will be settled in cash or stock at our option. However, we can settle any conversion or repurchase of the 2005 debentures in cash or stock at our option. On or after August 5, 2019, we can redeem, for cash, all or part of the 2009 debentures for the principal amount, plus any accrued and unpaid interest, if the closing price of Intel common stock has been at least
150%
of the conversion price then in effect for at least
20
trading days during any
30
consecutive trading-day period prior to the date on which we provide notice of redemption. We can redeem, for cash, all or part of the 2005 debentures for the principal amount, plus any accrued and unpaid interest, if the closing price of Intel common stock has been at least
130%
of the conversion price then in effect for at least
20
trading days during any
30
consecutive trading-day period prior to the date on which we provide notice of redemption. If certain events occur in the future, the indentures governing the 2009 and 2005 debentures provide that each holder of the debentures can, for a pre-defined period of time, require us to repurchase the holder’s debentures for the principal amount plus any accrued and unpaid interest. Both the 2009 and 2005 debentures are subordinated in right of payment to any existing and future senior debt and to the other liabilities of our subsidiaries. We have concluded that both the 2009 and 2005 debentures are not conventional convertible debt instruments and that the embedded stock conversion options qualify as derivatives. In addition, we have concluded that the embedded conversion options would be classified in stockholders’ equity if they were freestanding derivative instruments. As such, the embedded conversion options are not accounted for separately as derivatives.
|
|
2009 Debentures
|
2005 Debentures
|
||||||||||||||
|
(In Millions, Except Per Share Amounts)
|
Dec 28,
2013 |
Dec 29,
2012 |
Dec 28,
2013 |
Dec 29,
2012 |
||||||||||||
|
Outstanding principal
|
$
|
2,000
|
|
$
|
2,000
|
|
$
|
1,600
|
|
$
|
1,600
|
|
||||
|
Equity component carrying amount
|
$
|
613
|
|
$
|
613
|
|
$
|
466
|
|
$
|
466
|
|
||||
|
Unamortized discount
|
$
|
910
|
|
$
|
922
|
|
$
|
643
|
|
$
|
656
|
|
||||
|
Net debt carrying amount
|
$
|
1,075
|
|
$
|
1,063
|
|
$
|
946
|
|
$
|
932
|
|
||||
|
Conversion rate (shares of common stock per $1,000 principal amount of debentures)
|
45.57
|
|
45.05
|
|
34.60
|
|
33.86
|
|
||||||||
|
Effective conversion price (per share of common stock)
|
$
|
21.94
|
|
$
|
22.20
|
|
$
|
28.90
|
|
$
|
29.53
|
|
||||
In the preceding table, the remaining amortization periods for the unamortized discounts for the 2009 and 2005 debentures are approximately
26
and
22
years, respectively, as of
December 28, 2013
.
82
The conversion rate adjusts for certain events outlined in the indentures governing the 2009 and 2005 debentures, such as quarterly dividend distributions in excess of
$0.14
and
$0.10
per share for the 2009 and 2005 debentures, respectively, but it does not adjust for accrued interest. In addition, the conversion rate will increase for a holder of either the 2009 or 2005 debentures who elects to convert the debentures in connection with certain share exchanges, mergers, or consolidations involving Intel.
Arizona Bonds
In 2007, we guaranteed repayment of principal and interest on bonds issued by the Industrial Development Authority of the City of Chandler, Arizona, which constituted an unsecured general obligation for Intel. The aggregate principal amount of the bonds issued in December 2007 was
$125 million
. The 2007 Arizona bonds were tendered and repaid in December 2012. These bonds bore interest at a fixed rate of
5.3%
. In the future, we may re-market the bonds as either fixed-rate bonds for a specified period or as variable-rate bonds until their final maturity on
December 1, 2037
.
Debt Maturities
Our aggregate debt maturities based on outstanding principal as of
December 28, 2013
, by year payable, were as follows:
|
(In Millions)
|
||||
|
2014
|
$
|
—
|
|
|
|
2015
|
—
|
|
||
|
2016
|
1,500
|
|
||
|
2017
|
3,000
|
|
||
|
2018
|
—
|
|
||
|
2019 and thereafter
|
10,275
|
|
||
|
Total
|
$
|
14,775
|
|
|
Substantially all of the difference between the total aggregate debt maturities in the preceding table and the total carrying amount of our debt is due to the unamortized discount of our convertible debentures.
Note 17: Retirement Benefit Plans
Retirement Contribution Plans
We provide tax-qualified retirement contribution plans for the benefit of eligible employees, former employees, and retirees in the U.S. and certain other countries. The plans are designed to provide employees with an accumulation of funds for retirement on a tax-deferred basis. Employees hired prior to January 1, 2011 are eligible for and receive discretionary employer contributions in the U.S. Intel Retirement Contribution Plan, while employees hired on or after January 1, 2011 receive discretionary employer contributions in the Intel 401(k) Savings Plan. Our Chief Executive Officer (CEO) determines the annual discretionary employer contribution amounts for the U.S. Intel Retirement Contribution Plan and the Intel 401(k) Savings Plan under delegation of authority from our Board of Directors, pursuant to the terms of the plans. As of
December 28, 2013
,
83%
of our U.S. Intel Retirement Contribution Plan assets were invested in equities, and
17%
were invested in fixed-income instruments. These assets are managed by external investment managers. The discretionary employer contributions made to the Intel 401(k) Savings Plan are participant-directed.
For the benefit of eligible U.S. employees, we also provide a non-tax-qualified supplemental deferred compensation plan for certain highly compensated employees. This plan is designed to permit certain discretionary employer contributions and to permit employee deferral of a portion of compensation in addition to their Intel 401(k) Savings Plan deferrals. This plan is unfunded.
We expensed
$298 million
for the qualified and non-qualified U.S. retirement contribution plans in
2013
(
$357 million
in
2012
and
$340 million
in
2011
). In the first quarter of
2014
, we funded
$288 million
for the
2013
contributions to the qualified U.S. retirement contribution plans.
83
Pension and Postretirement Benefit Plans
U.S. Pension Benefits.
For employees hired prior to January 1, 2011, we provide a tax-qualified defined-benefit pension plan, the U.S. Intel Minimum Pension Plan, for eligible employees, former employees, and retirees in the U.S. The U.S. Intel Minimum Pension Plan benefit is determined by a participant’s years of service and final average compensation as defined by the plan document. The plan generates a minimum pension benefit if the participants’ U.S. Intel Minimum Pension Plan benefit exceeds the annuitized value of their U.S. Intel Retirement Contribution Plan benefit. If participant balances in the U.S. Intel Retirement Contribution Plan do not grow sufficiently, the projected benefit obligation of the U.S. Intel Minimum Pension Plan could increase significantly. Consistent with applicable law, assets of the U.S. Intel Minimum Pension Plan are held in trust, solely for the benefit of plan participants, and are not available for general corporate purposes.
Non-U.S. Pension Benefits.
We also provide defined-benefit pension plans in certain other countries, most significantly Ireland, Israel, Germany and Japan. Consistent with the requirements of local law, we deposit funds for certain plans with insurance companies, with third-party trustees, or into government-managed accounts, and/or accrue for the unfunded portion of the obligation. Effective June 20, 2012, Ireland closed its pension plan to employees hired on or after this date.
U.S. Postretirement Medical Benefits.
Upon retirement, eligible U.S. employees who were hired prior to January 1, 2014, are credited with a defined dollar amount, based on years of service, into a U.S. Sheltered Employee Retirement Medical Account (SERMA). These credits can be used to pay all or a portion of the cost to purchase coverage in the retiree’s choice of medical plan. If the available credits are not sufficient to pay the entire cost of the coverage, the remaining cost is the retiree’s responsibility. Effective January 1, 2014, employees hired on or after January 1, 2014, are not eligible to earn a SERMA benefit.
Funding Policy.
Our practice is to fund the various pension plans and the U.S. postretirement medical benefits plan in amounts sufficient to meet the minimum requirements of applicable local laws and regulations. Additional funding may be provided as deemed appropriate. Depending on the design of the plan, local customs, and market circumstances, the liabilities of a plan may exceed qualified plan assets.
Benefit Obligation and Plan Assets
The changes in the projected benefit obligations and plan assets for the plans described above were as follows:
|
|
U.S. Pension Benefits
|
Non-U.S. Pension
Benefits
|
U.S. Postretirement
Medical Benefits
|
|||||||||||||||||||||
|
(In Millions)
|
2013
|
2012
|
2013
|
2012
|
2013
|
2012
|
||||||||||||||||||
|
Beginning projected benefit obligation
|
$
|
1,742
|
|
$
|
1,480
|
|
$
|
1,412
|
|
$
|
1,121
|
|
$
|
484
|
|
$
|
369
|
|
||||||
|
Service cost
|
119
|
|
98
|
|
78
|
|
64
|
|
27
|
|
30
|
|
||||||||||||
|
Interest cost
|
67
|
|
69
|
|
60
|
|
52
|
|
20
|
|
17
|
|
||||||||||||
|
Actuarial (gain) loss
|
(746
|
)
|
108
|
|
121
|
|
172
|
|
(56
|
)
|
75
|
|
||||||||||||
|
Other
|
(45
|
)
|
(13
|
)
|
24
|
|
3
|
|
34
|
|
(7
|
)
|
||||||||||||
|
Ending projected benefit obligation
|
$
|
1,137
|
|
$
|
1,742
|
|
$
|
1,695
|
|
$
|
1,412
|
|
$
|
509
|
|
$
|
484
|
|
||||||
|
|
U.S. Pension Benefits
|
Non-U.S. Pension
Benefits
|
U.S. Postretirement
Medical Benefits
|
|||||||||||||||||||||
|
(In Millions)
|
2013
|
2012
|
2013
|
2012
|
2013
|
2012
|
||||||||||||||||||
|
Beginning fair value of plan assets
|
$
|
684
|
|
$
|
648
|
|
$
|
838
|
|
$
|
722
|
|
$
|
191
|
|
$
|
116
|
|
||||||
|
Actual return on plan assets
|
10
|
|
49
|
|
81
|
|
70
|
|
49
|
|
—
|
|
||||||||||||
|
Employer contributions
|
—
|
|
—
|
|
65
|
|
52
|
|
162
|
|
82
|
|
||||||||||||
|
Other
|
(45
|
)
|
(13
|
)
|
21
|
|
(6
|
)
|
(7
|
)
|
(7
|
)
|
||||||||||||
|
Ending fair value of plan assets
|
$
|
649
|
|
$
|
684
|
|
$
|
1,005
|
|
$
|
838
|
|
$
|
395
|
|
$
|
191
|
|
||||||
84
The amounts recognized on the consolidated balance sheets at the end of each period were as follows:
|
|
U.S. Pension Benefits
|
Non-U.S. Pension
Benefits
|
U.S. Postretirement
Medical Benefits
|
|||||||||||||||||||||
|
(In Millions)
|
Dec 28,
2013 |
Dec 29,
2012 |
Dec 28,
2013 |
Dec 29,
2012 |
Dec 28,
2013 |
Dec 29,
2012 |
||||||||||||||||||
|
Other long-term assets
|
$
|
—
|
|
$
|
—
|
|
$
|
16
|
|
$
|
1
|
|
$
|
—
|
|
$
|
—
|
|
||||||
|
Other long-term liabilities
|
(488
|
)
|
(1,058
|
)
|
(706
|
)
|
(575
|
)
|
(114
|
)
|
(293
|
)
|
||||||||||||
|
Accumulated other comprehensive loss (income), before tax
|
255
|
|
1,050
|
|
520
|
|
477
|
|
43
|
|
138
|
|
||||||||||||
|
Net amount recognized
|
$
|
(233
|
)
|
$
|
(8
|
)
|
$
|
(170
|
)
|
$
|
(97
|
)
|
$
|
(71
|
)
|
$
|
(155
|
)
|
||||||
The amounts recorded in accumulated other comprehensive income (loss) before taxes at the end of each period were as follows:
|
|
U.S. Pension Benefits
|
Non-U.S. Pension
Benefits
|
U.S. Postretirement
Medical Benefits
|
|||||||||||||||||||||
|
(In Millions)
|
Dec 28,
2013 |
Dec 29,
2012 |
Dec 28,
2013 |
Dec 29,
2012 |
Dec 28,
2013 |
Dec 29,
2012 |
||||||||||||||||||
|
Net prior service credit (cost)
|
$
|
—
|
|
$
|
—
|
|
$
|
25
|
|
$
|
12
|
|
$
|
(54
|
)
|
$
|
(60
|
)
|
||||||
|
Net actuarial gain (loss)
|
(255
|
)
|
(1,050
|
)
|
(545
|
)
|
(489
|
)
|
11
|
|
(78
|
)
|
||||||||||||
|
Accumulated other comprehensive income (loss), before tax
|
$
|
(255
|
)
|
$
|
(1,050
|
)
|
$
|
(520
|
)
|
$
|
(477
|
)
|
$
|
(43
|
)
|
$
|
(138
|
)
|
||||||
As of
December 28, 2013
, the accumulated benefit obligation was
$497 million
for the U.S. Intel Minimum Pension Plan (
$562 million
as of
December 29, 2012
) and
$1.3 billion
for the non-U.S. defined-benefit pension plans (
$1.1 billion
as of
December 29, 2012
). Included in the aggregate data in the following tables are the amounts applicable to our pension plans, with accumulated benefit obligations in excess of plan assets, as well as plans with projected benefit obligations in excess of plan assets. Amounts related to such plans at the end of each period were as follows:
|
|
U.S. Pension Benefits
|
Non-U.S. Pension
Benefits
|
||||||||||||||
|
(In Millions)
|
Dec 28,
2013 |
Dec 29,
2012 |
Dec 28,
2013 |
Dec 29,
2012 |
||||||||||||
|
Plans with accumulated benefit obligations in excess of plan assets:
|
||||||||||||||||
|
Accumulated benefit obligations
|
$
|
—
|
|
$
|
—
|
|
$
|
900
|
|
$
|
813
|
|
||||
|
Plan assets
|
$
|
—
|
|
$
|
—
|
|
$
|
563
|
|
$
|
508
|
|
||||
|
Plans with projected benefit obligations in excess of plan assets:
|
||||||||||||||||
|
Projected benefit obligations
|
$
|
1,137
|
|
$
|
1,742
|
|
$
|
1,295
|
|
$
|
1,400
|
|
||||
|
Plan assets
|
$
|
649
|
|
$
|
684
|
|
$
|
588
|
|
$
|
825
|
|
||||
On a worldwide basis, our pension and postretirement benefit plans were
61%
funded as of
December 28, 2013
. The U.S. Intel Minimum Pension Plan, which accounts for approximately
34%
of the worldwide pension and postretirement benefit obligations, was
57%
funded. Funded status is not indicative of our ability to pay ongoing pension benefits or of our obligation to fund retirement trusts. Required pension funding for U.S. retirement plans is determined in accordance with the Employee Retirement Income Security Act (ERISA) which sets required minimum contributions. Cumulative company funding to the U.S. Intel Minimum Pension Plan currently exceeds the minimum ERISA funding requirements.
85
Assumptions
Weighted average actuarial assumptions used to determine benefit obligations for the plans at the end of each period were as follows:
|
|
U.S. Pension Benefits
|
Non-U.S. Pension
Benefits
|
U.S. Postretirement
Medical Benefits
|
|||||||||||||||
|
|
Dec 28,
2013 |
Dec 29,
2012 |
Dec 28,
2013 |
Dec 29,
2012 |
Dec 28,
2013 |
Dec 29,
2012 |
||||||||||||
|
Discount rate
|
4.8
|
%
|
3.9
|
%
|
4.0
|
%
|
4.2
|
%
|
4.6
|
%
|
3.6
|
%
|
||||||
|
Rate of compensation increase
|
3.8
|
%
|
4.1
|
%
|
3.9
|
%
|
4.0
|
%
|
n/a
|
|
n/a
|
|
||||||
Weighted average actuarial assumptions used to determine costs for the plans for each period were as follows:
|
|
U.S. Pension Benefits
|
Non-U.S. Pension Benefits
|
U.S. Postretirement
Medical Benefits
|
||||||||||||||||||||||||
|
|
2013
|
2012
|
2011
|
2013
|
2012
|
2011
|
2013
|
2012
|
2011
|
||||||||||||||||||
|
Discount rate
|
3.9
|
%
|
4.7
|
%
|
5.8
|
%
|
4.2
|
%
|
5.0
|
%
|
5.3
|
%
|
4.2
|
%
|
4.6
|
%
|
5.6
|
%
|
|||||||||
|
Expected long-term rate of return on plan assets
|
4.5
|
%
|
5.0
|
%
|
5.5
|
%
|
5.2
|
%
|
5.9
|
%
|
6.3
|
%
|
7.7
|
%
|
3.0
|
%
|
3.0
|
%
|
|||||||||
|
Rate of compensation increase
|
4.1
|
%
|
4.5
|
%
|
4.7
|
%
|
4.3
|
%
|
4.1
|
%
|
4.3
|
%
|
n/a
|
|
n/a
|
|
n/a
|
|
|||||||||
For the U.S. plans, we developed the discount rate by calculating the benefit payment streams by year to determine when benefit payments will be due. We then matched the benefit payment streams by year to the AA corporate bond rates to match the timing and amount of the expected benefit payments and discounted back to the measurement date to determine the appropriate discount rate. For the non-U.S. plans, we used two approaches to develop the discount rate. In certain countries, we used a model consisting of a theoretical bond portfolio for which the timing and amount of cash flows approximated the estimated benefit payments of our pension plans. In other countries, we analyzed current market long-term bond rates and matched the bond maturity with the average duration of the pension liabilities.
The expected long-term rate of return on plan assets assumptions takes into consideration both duration and risk of the investment portfolios, and is developed through consensus and building-block methodologies. The consensus methodology includes unadjusted estimates by the fund manager on future market expectations by broad asset classes and geography. The building-block approach determines the rates of return implied by historical risk premiums across asset classes. In addition, we analyze rates of return relevant to the country where each plan is in effect and the investments applicable to the plan, expectations of future returns, local actuarial projections, and the projected long-term rates of return from external investment managers. The expected long-term rate of return on plan assets shown for the non-U.S. plan assets is weighted to reflect each country’s relative portion of the non-U.S. plan assets.
Net Periodic Benefit Cost
In
2013
, the net periodic benefit cost for U.S. pension benefits, non-U.S. pension benefits, and U.S. postretirement medical benefits was
$230 million
(
$210 million
in
2012
and
$88 million
in
2011
),
$116 million
(
$88 million
in
2012
and
$80 million
in
2011
) and
$77 million
(
$50 million
in
2012
and
$39 million
in
2011
), respectively.
The increase in the U.S. and non-U.S. pension benefit costs is primarily attributed to an increase in service costs compared to 2012. The increase in the U.S. postretirement medical benefits compared to 2012 is primarily attributed to special one-time termination benefit costs incurred in 2013.
U.S. Pension Plan Assets
In general, the investment strategy for U.S. Intel Minimum Pension Plan assets is to maximize risk-adjusted returns, taking into consideration the investment horizon and expected volatility, to ensure that there are sufficient assets available to pay pension benefits as they come due. The allocation to each asset class will fluctuate with market conditions, such as volatility and liquidity concerns, and will typically be rebalanced when outside the target ranges, which are
60%
for fixed-income debt instrument investments and
40%
for equity investments in
2013
. The expected long-term rate of return for the U.S. Intel Minimum Pension Plan assets is
5.2%
.
86
U.S. Intel Minimum Pension Plan assets measured at fair value on a recurring basis consisted of the following investment categories at the end of each period were as follows:
|
|
December 28, 2013
|
Dec 29,
2012 |
||||||||||||||||||
|
|
Fair Value Measured at Reporting Date Using
|
|||||||||||||||||||
|
(In Millions)
|
Level 1
|
Level 2
|
Level 3
|
Total
|
Total
|
|||||||||||||||
|
Equity securities
|
$
|
15
|
|
$
|
205
|
|
$
|
—
|
|
$
|
220
|
|
$
|
92
|
|
|||||
|
Fixed income
|
88
|
|
255
|
|
72
|
|
415
|
|
582
|
|
||||||||||
|
Other investments
|
11
|
|
—
|
|
—
|
|
11
|
|
—
|
|
||||||||||
|
Total assets measured at fair value
|
$
|
114
|
|
$
|
460
|
|
$
|
72
|
|
$
|
646
|
|
$
|
674
|
|
|||||
|
Cash
|
3
|
|
10
|
|
||||||||||||||||
|
Total U.S. pension plan assets at fair value
|
$
|
649
|
|
$
|
684
|
|
||||||||||||||
A substantial majority of the fixed income investments in the preceding table are corporate bonds, government bonds, and asset-backed securities. Corporate bonds include both U.S. and non-U.S. bonds with the majority held in high-quality bonds. Government bonds include bonds issued or deemed to be guaranteed by government entities and include instruments such as non-U.S. government bonds, U.S. Treasury securities, and U.S. agency securities. The Level 3 investments relate to our asset-backed securities, as we used unobservable inputs to the valuations that were significant to the fair value measurements.
Non-U.S. Plan Assets
The investments of the non-U.S. plans are managed by insurance companies, third-party trustees, or pension funds, consistent with regulations or market practice of the country where the assets are invested. The investment manager makes investment decisions within the guidelines set by Intel or local regulations. The investment manager evaluates performance by comparing the actual rate of return to the return on similar assets. Investments managed by qualified insurance companies or pension funds under standard contracts follow local regulations, and we are not actively involved in their investment strategies. For the assets that we have discretion to set investment guidelines, the assets are invested in developed country equities and fixed-income debt instruments, either through index funds or direct investment. In general, the investment strategy is designed to accumulate a diversified portfolio among markets, asset classes, or individual securities to reduce market risk and to assure that the pension assets are available to pay benefits as they come due. The target allocation of the non-U.S. plan assets that we have control over is
80%
equity securities and
20%
fixed-income instruments. The average expected long-term rate of return for the non-U.S. plan assets is
5.7%
.
Non-U.S. plan assets measured at fair value on a recurring basis consisted of the following investment categories at the end of each period were as follows:
|
|
December 28, 2013
|
Dec 29,
2012 |
||||||||||||||||||
|
|
Fair Value Measured at Reporting Date Using
|
|||||||||||||||||||
|
(In Millions)
|
Level 1
|
Level 2
|
Level 3
|
Total
|
Total
|
|||||||||||||||
|
Equity securities
|
$
|
287
|
|
$
|
63
|
|
$
|
11
|
|
$
|
361
|
|
$
|
248
|
|
|||||
|
Fixed income
|
—
|
|
521
|
|
33
|
|
554
|
|
574
|
|
||||||||||
|
Total assets measured at fair value
|
$
|
287
|
|
$
|
584
|
|
$
|
44
|
|
$
|
915
|
|
$
|
822
|
|
|||||
|
Cash
|
90
|
|
16
|
|
||||||||||||||||
|
Total non-U.S. plan assets at fair value
|
$
|
1,005
|
|
$
|
838
|
|
||||||||||||||
Substantially all of the equity securities in the preceding table are invested in a diversified mix of equities of developed countries, including the U.S., and emerging markets throughout the world.
The majority of the fixed income securities in the preceding table are investments held by insurance companies and insurance contracts that are managed by qualified insurance companies. We do not have control over the target allocation or visibility of the investment strategies of those investments. Insurance contracts and investments held by insurance companies made up
38%
of total non-U.S. plan assets as of
December 28, 2013
(
40%
as of
December 29, 2012
).
87
U.S. Postretirement Medical Plan Assets
In general, the investment strategy for U.S. postretirement medical benefits plan assets is to invest primarily in liquid assets due to the level of expected future benefit payments. In 2012, we modified the investment strategy for plan assets from investing solely in a money market account to investing in a tax-aware global equity portfolio, which is actively managed by an external investment manager. The tax-aware global equity portfolio is comprised of a diversified mix of equities in developed countries, including the U.S., and emerging markets throughout the world. The expected long-term rate of return for the U.S. postretirement medical benefits plan assets is
7.4%
. As of
December 28, 2013
, substantially all of the U.S. postretirement medical benefits plan assets were invested in exchange-traded equity securities and were measured at fair value using Level 1 inputs.
Concentrations of Risk
We manage a variety of risks, including market, credit, and liquidity risks, across our plan assets through our investment managers. We define a concentration of risk as an undiversified exposure to one of the aforementioned risks that unnecessarily increases the exposure to a loss of plan assets. We monitor exposure to such risks in both the U.S. and non-U.S. plans by monitoring the magnitude of the risk in each plan and diversifying our exposure to such risks across a variety of instruments, markets, and counterparties. As of
December 28, 2013
, we did not have concentrations of risk in any single entity, manager, counterparty, sector, industry, or country.
Funding Expectations
Under applicable law for the U.S. Intel Minimum Pension Plan and the U.S. postretirement medical benefits plan, we are not required to make any contributions during
2014
. Our expected required funding for the non-U.S. plans during
2014
is approximately
$62 million
.
Estimated Future Benefit Payments
Estimated benefit payments over the next 10 fiscal years are as follows:
|
(In Millions)
|
U.S. Pension
Benefits
|
Non-U.S.
Pension
Benefits
|
U.S.
Postretirement
Medical
Benefits
|
|||||||||
|
2014
|
$
|
42
|
|
$
|
33
|
|
$
|
23
|
|
|||
|
2015
|
$
|
51
|
|
$
|
32
|
|
$
|
22
|
|
|||
|
2016
|
$
|
63
|
|
$
|
32
|
|
$
|
24
|
|
|||
|
2017
|
$
|
71
|
|
$
|
36
|
|
$
|
22
|
|
|||
|
2018
|
$
|
88
|
|
$
|
38
|
|
$
|
21
|
|
|||
|
2019-2023
|
$
|
691
|
|
$
|
219
|
|
$
|
99
|
|
|||
A portion of our capital equipment and certain facilities are under operating leases that expire at various dates through
2028
. Additionally, portions of our real property are under leases that expire at various dates through
2062
. Rental expense was
$270 million
in
2013
(
$214 million
in
2012
and
$178 million
in
2011
).
Minimum rental commitments under all non-cancelable leases with an initial term in excess of one year were as follows as of
December 28, 2013
:
|
(In Millions)
|
|
|||
|
2014
|
$
|
208
|
|
|
|
2015
|
172
|
|
||
|
2016
|
126
|
|
||
|
2017
|
97
|
|
||
|
2018
|
69
|
|
||
|
2019 and thereafter
|
198
|
|
||
|
Total
|
$
|
870
|
|
|
88
Commitments for construction or purchase of property, plant and equipment totaled
$5.5 billion
as of
December 28, 2013
(
$4.6 billion
as of
December 29, 2012
), substantially all of which will be due within the next year. Other purchase obligations and commitments totaled approximately
$1.9 billion
as of
December 28, 2013
(approximately
$2.0 billion
as of
December 29, 2012
). Other purchase obligations and commitments include payments due under various types of licenses and agreements to purchase goods or services, as well as payments due under non-contingent funding obligations. Funding obligations include agreements to fund various projects with other companies. In addition, we have various contractual commitments with Micron and IMFT. For further information on these contractual commitments, see “
Note 5: Cash and Investments
.”
During 2012, we entered into a series of agreements with ASML intended to accelerate the development of 450mm wafer technology and
extreme ultraviolet lithography (EUV)
. Intel agreed to provide R&D funding totaling
€829 million
over five years and committed to advance purchase orders for a specified number of tools from ASML.
Our remaining obligation, contingent upon ASML achieving certain milestones, is approximately
€738 million
, or
$1.0 billion
, as of
December 28, 2013
. As our obligation is contingent upon ASML achieving certain milestones, we have not included this obligation in the preceding
other purchase obligations and commitments total.
Note 19: Employee Equity Incentive Plans
Our equity incentive plans are broad-based, long-term programs intended to attract and retain talented employees and align stockholder and employee interests.
In May
2013
, stockholders approved an extension of the 2006 Equity Incentive Plan (the 2006 Plan). Stockholders approved
123 million
additional shares for issuance, increasing the total shares of common stock authorized for issuance as equity awards to employees and non-employee directors to
719 million
shares. The approval also extended the expiration date of the 2006 Plan to June 2016. A maximum of
517 million
of these shares can be awarded as non-vested shares (restricted stock) or non-vested share units (restricted stock units). As of
December 28, 2013
,
304 million
shares remained available for future grant under the 2006 Plan.
Going forward, we may assume the equity incentive plans and the outstanding equity awards of certain acquired companies. Once they are assumed, we do not grant additional shares under those plans. In connection with our completed acquisition of McAfee in 2011, we assumed McAfee’s equity incentive plan and issued replacement awards. The stock options and restricted stock units issued generally retain similar terms and conditions of the respective plan under which they were originally granted.
We issue restricted stock units with both a market condition and a service condition (market-based restricted stock units), referred to in our
2013
Proxy Statement as outperformance stock units, to a small group of senior officers and non-employee directors. For market-based restricted stock units issued in
2013
, the number of shares of Intel common stock to be received at vesting will range from
50%
to
200%
of the target amount, based on total stockholder return (TSR) on Intel common stock measured against the benchmark TSR of a peer group over a three-year period. TSR is a measure of stock price appreciation plus any dividends paid in this performance period. As of
December 28, 2013
,
3 million
market-based restricted stock units were outstanding. These market-based restricted stock units accrue dividend equivalents and generally vest three years and one month from the grant date.
Equity awards granted to employees in
2013
under our equity incentive plans generally vest over four years from the date of grant, and options expire seven years from the date of grant, with the exception of market-based restricted stock units, a small number of restricted stock units granted to executive-level employees, and replacement awards related to acquisitions.
The 2006 Stock Purchase Plan allows eligible employees to purchase shares of our common stock at
85%
of the value of our common stock on specific dates. In May 2011, stockholders approved an extension of the 2006 Stock Purchase Plan. Stockholders approved
133 million
additional shares for issuance, increasing the total shares of common stock available for issuance to
373 million
shares. The approval also extended the expiration date of the 2006 Stock Purchase Plan to August 2016. As of
December 28, 2013
,
216 million
shares were available for issuance under the 2006 Stock Purchase Plan.
89
Share-Based Compensation
Share-based compensation recognized in
2013
was
$1.1 billion
(
$1.1 billion
in
2012
and
$1.1 billion
in
2011
).
On a quarterly basis, we assess changes to our estimate of expected equity award forfeitures based on our review of recent forfeiture activity and expected future employee turnover. We recognize the effect of adjustments made to the forfeiture rates, if any, in the period that we change the forfeiture estimate. The effect of forfeiture adjustments in
2013
,
2012
, and
2011
was not significant.
The total share-based compensation cost capitalized as part of inventory as of
December 28, 2013
, was
$38 million
(
$41 million
as of
December 29, 2012
and
$38 million
as of
December 31, 2011
). During
2013
, the tax benefit that we realized for the tax deduction from share-based awards totaled
$385 million
(
$510 million
in
2012
and
$327 million
in
2011
).
We estimate the fair value of restricted stock unit awards with time-based vesting using the value of our common stock on the date of grant, reduced by the present value of dividends expected to be paid on our common stock prior to vesting. We estimate the fair value of market-based restricted stock units using a Monte Carlo simulation model on the date of grant. We based the weighted average estimated value of restricted stock unit grants, as well as the weighted average assumptions that we used in calculating the fair value, on estimates at the date of grant, for each period as follows:
|
|
2013
|
2012
|
2011
|
|||||||||
|
Estimated values
|
$
|
21.45
|
|
$
|
25.32
|
|
$
|
19.86
|
|
|||
|
Risk-free interest rate
|
0.2
|
%
|
0.3
|
%
|
0.7
|
%
|
||||||
|
Dividend yield
|
3.8
|
%
|
3.3
|
%
|
3.4
|
%
|
||||||
|
Volatility
|
25
|
%
|
26
|
%
|
27
|
%
|
||||||
We use the Black-Scholes option pricing model to estimate the fair value of options granted under our equity incentive plans and rights to acquire stock granted under our stock purchase plan. We based the weighted average estimated value of employee stock option grants and rights granted under the stock purchase plan, as well as the weighted average assumptions used in calculating the fair value, on estimates at the date of grant, for each period as follows:
|
|
Stock Options
|
Stock Purchase Plan
|
||||||||||||||||||||||
|
|
2013
|
2012
|
2011
|
2013
|
2012
|
2011
|
||||||||||||||||||
|
Estimated values
|
$
|
3.11
|
|
$
|
4.22
|
|
$
|
3.91
|
|
$
|
4.52
|
|
$
|
5.47
|
|
$
|
4.69
|
|
||||||
|
Expected life (in years)
|
5.2
|
|
5.3
|
|
5.4
|
|
0.5
|
|
0.5
|
|
0.5
|
|
||||||||||||
|
Risk-free interest rate
|
0.8
|
%
|
1.0
|
%
|
2.2
|
%
|
0.1
|
%
|
0.1
|
%
|
0.2
|
%
|
||||||||||||
|
Dividend yield
|
3.9
|
%
|
3.3
|
%
|
3.4
|
%
|
4.0
|
%
|
3.3
|
%
|
3.6
|
%
|
||||||||||||
|
Volatility
|
25
|
%
|
25
|
%
|
27
|
%
|
22
|
%
|
24
|
%
|
26
|
%
|
||||||||||||
We base the expected volatility on implied volatility because we have determined that implied volatility is more reflective of market conditions and a better indicator of expected volatility than historical volatility. Prior to 2011, we used the simplified method of calculating expected life due to significant differences in the vesting terms and contractual life of current option grants compared to our historical grants. In 2011, we began using historical option exercise data as the basis for determining expected life, as we believe that we have sufficient historical data to provide a reasonable basis upon which to estimate the expected life input for valuing options using the Black-Scholes model.
90
Restricted Stock Unit Awards
Information with respect to outstanding RSU activity for each period was as follows:
|
Number of
RSUs
(In Millions)
|
Weighted
Average
Grant-Date
Fair Value
|
||||||
|
December 25, 2010
|
99.8
|
|
$
|
18.56
|
|
||
|
Granted
|
43.3
|
|
$
|
19.86
|
|
||
|
Assumed in acquisition
|
5.8
|
|
$
|
20.80
|
|
||
|
Vested
|
(37.5
|
)
|
$
|
18.60
|
|
||
|
Forfeited
|
(4.4
|
)
|
$
|
19.07
|
|
||
|
December 31, 2011
|
107.0
|
|
$
|
19.18
|
|
||
|
Granted
|
49.9
|
|
$
|
25.32
|
|
||
|
Vested
|
(43.2
|
)
|
$
|
18.88
|
|
||
|
Forfeited
|
(4.4
|
)
|
$
|
20.93
|
|
||
|
December 29, 2012
|
109.3
|
|
$
|
22.03
|
|
||
|
Granted
|
53.4
|
|
$
|
21.45
|
|
||
|
Vested
|
(44.5
|
)
|
$
|
20.21
|
|
||
|
Forfeited
|
(4.9
|
)
|
$
|
22.06
|
|
||
|
December 28, 2013
|
113.3
|
|
$
|
22.47
|
|
||
|
Expected to vest as of December 28, 2013
|
107.3
|
|
$
|
22.49
|
|
||
The aggregate fair value of awards that vested in
2013
was
$1.0 billion
(
$1.2 billion
in
2012
and
$753 million
in
2011
), which represents the market value of Intel common stock on the date that the restricted stock units vested. The grant-date fair value of awards that vested in
2013
was
$899 million
(
$816 million
in
2012
and
$697 million
in
2011
). The number of restricted stock units vested includes shares that we withheld on behalf of employees to satisfy the minimum statutory tax withholding requirements. Restricted stock units that are expected to vest are net of estimated future forfeitures.
As of
December 28, 2013
, there was
$1.6 billion
in unrecognized compensation costs related to restricted stock units granted under our equity incentive plans. We expect to recognize those costs over a weighted average period of
1.2 years
.
Stock Option Awards
As of
December 28, 2013
, options outstanding that have vested and are expected to vest were as follows:
|
|
Number of
Options
(In Millions)
|
Weighted
Average
Exercise
Price
|
Weighted
Average
Remaining
Contractual
Term
(In Years)
|
Aggregate
Intrinsic
Value
(In Millions)
|
|||||||||
|
Vested
|
111.5
|
|
$
|
20.25
|
|
2.6
|
$
|
617
|
|
||||
|
Expected to vest
|
39.6
|
|
$
|
23.40
|
|
5.4
|
$
|
101
|
|
||||
|
Total
|
151.1
|
|
$
|
21.08
|
|
3.3
|
$
|
718
|
|
||||
Aggregate intrinsic value represents the difference between the exercise price and
$25.60
, the closing price of Intel common stock on December 27, 2013, as reported on The NASDAQ Global Select Market*, for all in-the-money options outstanding. Options outstanding that are expected to vest are net of estimated future option forfeitures.
Options with a fair value of
$186 million
completed vesting during
2013
(
$205 million
during
2012
and
$226 million
during
2011
). As of
December 28, 2013
, there was
$75 million
in unrecognized compensation costs related to stock options granted under our equity incentive plans. We expect to recognize those costs over a weighted average period of
1.1 years
.
91
Additional information with respect to stock option activity for each period was as follows:
|
Number of
Options
(In Millions)
|
Weighted
Average
Exercise
Price
|
||||||
|
December 25, 2010
|
386.4
|
|
$
|
20.45
|
|
||
|
Grants
|
14.7
|
|
$
|
21.49
|
|
||
|
Assumed in acquisition
|
12.0
|
|
$
|
15.80
|
|
||
|
Exercises
|
(86.3
|
)
|
$
|
20.06
|
|
||
|
Cancellations and forfeitures
|
(8.6
|
)
|
$
|
20.47
|
|
||
|
Expirations
|
(19.9
|
)
|
$
|
24.85
|
|
||
|
December 31, 2011
|
298.3
|
|
$
|
20.12
|
|
||
|
Grants
|
13.5
|
|
$
|
27.01
|
|
||
|
Exercises
|
(85.8
|
)
|
$
|
20.45
|
|
||
|
Cancellations and forfeitures
|
(3.9
|
)
|
$
|
21.17
|
|
||
|
Expirations
|
(19.3
|
)
|
$
|
22.45
|
|
||
|
December 29, 2012
|
202.8
|
|
$
|
20.20
|
|
||
|
Grants
|
20.1
|
|
$
|
22.99
|
|
||
|
Exercises
|
(65.0
|
)
|
$
|
18.76
|
|
||
|
Cancellations and forfeitures
|
(3.0
|
)
|
$
|
22.58
|
|
||
|
Expirations
|
(1.9
|
)
|
$
|
22.56
|
|
||
|
December 28, 2013
|
153.0
|
|
$
|
21.10
|
|
||
|
Options exercisable as of:
|
|||||||
|
December 31, 2011
|
203.6
|
|
$
|
20.44
|
|
||
|
December 29, 2012
|
139.8
|
|
$
|
19.76
|
|
||
|
December 28, 2013
|
111.5
|
|
$
|
20.25
|
|
||
The aggregate intrinsic value of stock option exercises in
2013
was
$265 million
(
$517 million
in
2012
and
$318 million
in
2011
), which represents the difference between the exercise price and the value of Intel common stock at the time of exercise.
The following table summarizes information about options outstanding as of
December 28, 2013
:
|
|
Outstanding Options
|
Exercisable Options
|
|||||||||||||||||||||
|
Range of Exercise Prices
|
Number of
Shares
(In Millions)
|
Weighted
Average
Remaining
Contractual
Life
(In Years)
|
Weighted
Average
Exercise
Price
|
Number of
Shares
(In Millions)
|
Weighted
Average
Exercise
Price
|
||||||||||||||||||
|
$
|
1.12
|
|
-
|
$
|
15.00
|
|
2.2
|
|
3.7
|
$
|
12.22
|
|
1.2
|
|
$
|
11.69
|
|
||||||
|
$
|
15.01
|
|
-
|
$
|
20.00
|
|
70.5
|
|
2.7
|
$
|
18.22
|
|
70.4
|
|
$
|
18.20
|
|
||||||
|
$
|
20.01
|
|
-
|
$
|
25.00
|
|
57.6
|
|
4.2
|
$
|
22.59
|
|
26.2
|
|
$
|
22.54
|
|
||||||
|
$
|
25.01
|
|
-
|
$
|
30.00
|
|
22.4
|
|
3.0
|
$
|
27.09
|
|
13.4
|
|
$
|
27.02
|
|
||||||
|
$
|
30.01
|
|
-
|
$
|
33.03
|
|
0.3
|
|
0.1
|
$
|
32.31
|
|
0.3
|
|
$
|
32.31
|
|
||||||
|
Total
|
153.0
|
|
3.3
|
$
|
21.10
|
|
111.5
|
|
$
|
20.25
|
|
||||||||||||
These options will expire if they are not exercised by specific dates through April 2021. Option exercise prices for options exercised during the three-year period ended
December 28, 2013
, ranged from
$1.12
to
$28.15
.
92
Stock Purchase Plan
Approximately
76%
of our employees were participating in our 2006 Stock Purchase Plan as of
December 28, 2013
(
72%
in
2012
and
70%
in
2011
). Employees purchased
20.5 million
shares in
2013
for
$369 million
under the 2006 Stock Purchase Plan (
17.4 million
shares for
$355 million
in
2012
and
18.5 million
shares for
$318 million
in
2011
). As of
December 28, 2013
, there was
$13 million
in unrecognized compensation costs related to rights to acquire common stock under our stock purchase plan. We expect to recognize those costs over a period of approximately one and a half months.
Common Stock Repurchase Program
We have an ongoing authorization, originally approved by our Board of Directors in October 2005, and subsequently amended,
to repurchase up to
$45 billion
in shares of our common stock in open market or negotiated transactions. As of
December 28, 2013
,
$3.2 billion
remained available for repurchase under the existing repurchase authorization limit. During
2013
, we repurchased
94.1 million
shares of common stock at a cost of
$2.1 billion
(
191.0 million
shares of common stock at a cost of
$4.8 billion
in
2012
and
642.3 million
shares of common stock at a cost of
$14.1 billion
in
2011
). We have repurchased
4.4 billion
shares at a cost of
$91 billion
since the program began in 1990.
Restricted Stock Unit Withholdings
We issue restricted stock units as part of our equity incentive plans. For the majority of restricted stock units granted, the number of shares issued on the date the restricted stock units vest is net of the minimum statutory withholding requirements that we pay in cash to the appropriate taxing authorities on behalf of our employees.
In our consolidated financial statements, we also treat shares withheld for tax purposes on behalf of our employees in connection with the vesting of restricted stock units as common stock repurchases because they reduce the number of shares that would have been issued upon vesting. These withheld shares are not considered common stock repurchases under our authorized common stock repurchase plan
. During
2013
, we withheld
13.1 million
shares to satisfy
$293 million
of employees’ tax obligations (
12.6 million
shares to satisfy
$345 million
during
2012
and
10.3 million
shares to satisfy
$207 million
during
2011
).
Gains (losses) on equity investments, net for each period were as follows:
|
(In Millions)
|
2013
|
2012
|
2011
|
|||||||||
|
Share of equity method investee losses, net
|
$
|
(69
|
)
|
$
|
(81
|
)
|
$
|
(204
|
)
|
|||
|
Impairment charges
|
(123
|
)
|
(154
|
)
|
(132
|
)
|
||||||
|
Gains on sales, net
|
515
|
|
183
|
|
303
|
|
||||||
|
Dividends
|
46
|
|
—
|
|
—
|
|
||||||
|
Other, net
|
102
|
|
193
|
|
145
|
|
||||||
|
Total gains (losses) on equity investments, net
|
$
|
471
|
|
$
|
141
|
|
$
|
112
|
|
|||
Gains on sales, net for 2013 included gains of
$439 million
on the sales of our interest in Clearwire LLC and our shares in Clearwire Corporation in the third quarter of 2013. For further information on these transactions, see "
Note 5: Cash and Investments
."
93
The components of interest and other, net for each period were as follows:
|
(In Millions)
|
2013
|
2012
|
2011
|
|||||||||
|
Interest income
|
$
|
104
|
|
$
|
97
|
|
$
|
98
|
|
|||
|
Interest expense
|
(244
|
)
|
(90
|
)
|
(41
|
)
|
||||||
|
Other, net
|
(11
|
)
|
87
|
|
135
|
|
||||||
|
Total interest and other, net
|
$
|
(151
|
)
|
$
|
94
|
|
$
|
192
|
|
|||
Interest expense in the preceding table is net of
$246 million
of interest capitalized in
2013
(
$240 million
in
2012
and
$150 million
in
2011
). In 2011, we recognized a gain upon forming the Intel and GE joint venture, Care Innovations, of
$164 million
, which is included within “other, net,” in the preceding table. For further information, see “
Note 5: Cash and Investments
.”
We computed our basic and diluted earnings per common share for each period as follows:
|
(In Millions, Except Per Share Amounts)
|
2013
|
2012
|
2011
|
|||||||||
|
Net income available to common stockholders
|
$
|
9,620
|
|
$
|
11,005
|
|
$
|
12,942
|
|
|||
|
Weighted average common shares outstanding—basic
|
4,970
|
|
4,996
|
|
5,256
|
|
||||||
|
Dilutive effect of employee equity incentive plans
|
68
|
|
100
|
|
101
|
|
||||||
|
Dilutive effect of convertible debt
|
59
|
|
64
|
|
54
|
|
||||||
|
Weighted average common shares outstanding—diluted
|
5,097
|
|
5,160
|
|
5,411
|
|
||||||
|
Basic earnings per common share
|
$
|
1.94
|
|
$
|
2.20
|
|
$
|
2.46
|
|
|||
|
Diluted earnings per common share
|
$
|
1.89
|
|
$
|
2.13
|
|
$
|
2.39
|
|
|||
We computed basic earnings per common share using net income available to common stockholders and the weighted average number of common shares outstanding during the period. We computed diluted earnings per common share using net income available to common stockholders and the weighted average number of common shares outstanding plus potentially dilutive common shares outstanding during the period. Net income available to participating securities was insignificant for all periods presented.
Potentially dilutive common shares from employee incentive plans are determined by applying the treasury stock method to the assumed exercise of outstanding stock options, the assumed vesting of outstanding restricted stock units, and the assumed issuance of common stock under the stock purchase plan. Potentially dilutive common shares are determined by applying the if-converted method for our 2005 debentures. However, as our 2009 debentures require settlement of the principal amount of the debt in cash upon conversion, with the conversion premium paid in cash or stock at our option, potentially dilutive common shares are determined by applying the treasury stock method. For further discussion on the specific conversion features of our 2005 and 2009 debentures, see “
Note 16: Borrowings
.”
In
2013
, we excluded on average
55 million
outstanding stock options and restricted stock units (
29 million
in
2012
and
90 million
in
2011
) from the computation of diluted earnings per common share because these would have been antidilutive. These options could potentially be included in the dilutive earnings per common share calculation in the future if the average market value of the common shares increases and is greater than the exercise price of these options.
In
2013
,
2012
, and
2011
, we included our 2009 debentures in the calculation of diluted earnings per common share because the average market price was above the conversion price. We could potentially exclude the 2009 debentures again in the future if the average market price is below the conversion price.
94
Income Tax Provision
Income before taxes and the provision for taxes consisted of the following:
|
(Dollars in Millions)
|
2013
|
2012
|
2011
|
|||||||||
|
Income before taxes:
|
||||||||||||
|
U.S.
|
$
|
9,374
|
|
$
|
10,042
|
|
$
|
14,659
|
|
|||
|
Non-U.S.
|
3,237
|
|
4,831
|
|
3,122
|
|
||||||
|
Total income before taxes
|
$
|
12,611
|
|
$
|
14,873
|
|
$
|
17,781
|
|
|||
|
Provision for taxes:
|
||||||||||||
|
Current:
|
||||||||||||
|
Federal
|
$
|
2,730
|
|
$
|
2,539
|
|
$
|
3,212
|
|
|||
|
State
|
68
|
|
52
|
|
104
|
|
||||||
|
Non-U.S.
|
716
|
|
1,135
|
|
374
|
|
||||||
|
Total current provision for taxes
|
$
|
3,514
|
|
$
|
3,726
|
|
$
|
3,690
|
|
|||
|
Deferred:
|
||||||||||||
|
Federal
|
$
|
(412
|
)
|
$
|
129
|
|
$
|
1,175
|
|
|||
|
Other
|
(111
|
)
|
13
|
|
(26
|
)
|
||||||
|
Total deferred provision for taxes
|
$
|
(523
|
)
|
$
|
142
|
|
$
|
1,149
|
|
|||
|
Total provision for taxes
|
$
|
2,991
|
|
$
|
3,868
|
|
$
|
4,839
|
|
|||
|
Effective tax rate
|
23.7
|
%
|
26.0
|
%
|
27.2
|
%
|
||||||
The difference between the tax provision at the statutory federal income tax rate and the tax provision as a percentage of income before income taxes (effective tax rate) for each period was as follows:
|
|
2013
|
2012
|
2011
|
||||||
|
Statutory federal income tax rate
|
35.0
|
%
|
35.0
|
%
|
35.0
|
%
|
|||
|
Increase (reduction) in rate resulting from:
|
|||||||||
|
Non-U.S. income taxed at different rates
|
(5.8
|
)
|
(7.3
|
)
|
(4.4
|
)
|
|||
|
Research and development tax credits
|
(3.5
|
)
|
—
|
|
(1.0
|
)
|
|||
|
Domestic manufacturing deduction benefit
|
(2.1
|
)
|
(2.1
|
)
|
(1.9
|
)
|
|||
|
Other
|
0.1
|
|
0.4
|
|
(0.5
|
)
|
|||
|
Effective tax rate
|
23.7
|
%
|
26.0
|
%
|
27.2
|
%
|
|||
The U.S. R&D tax credit was reenacted in January 2013 retroactive to the beginning of 2012. The full year 2012 impact of the U.S. R&D tax credit was recognized in the first quarter of 2013.
Income in certain non-U.S. countries is fully exempt from income taxes for a limited period of time due to eligible activities and certain capital investment actions. These full tax exemptions expire at various dates through
2020
; however, the exemptions in certain countries are eligible for renewal. In
2013
, the tax benefit attributable to tax holidays was
$213 million
(
$252 million
for
2012
and
$554 million
for
2011
) with a
$0.04
impact on diluted earnings per share (
$0.05
for
2012
and
$0.10
for
2011
).
During
2013
, net income tax
benefits
attributable to equity-based compensation transactions that were allocated to stockholders’ equity totaled
$3 million
(net
benefits
of
$137 million
in
2012
and net
deficiencies
of
$18 million
in
2011
).
95
Deferred and Current Income Taxes
Deferred income taxes reflect the net tax effects of temporary differences between the carrying amounts of assets and liabilities for financial reporting purposes and the amounts for income tax purposes. Significant components of our deferred tax assets and liabilities at the end of each period were as follows:
|
(In Millions)
|
Dec 28,
2013 |
Dec 29,
2012 |
||||||
|
Deferred tax assets:
|
||||||||
|
Accrued compensation and other benefits
|
$
|
1,047
|
|
$
|
1,125
|
|
||
|
Share-based compensation
|
564
|
|
638
|
|
||||
|
Deferred income
|
672
|
|
637
|
|
||||
|
Inventory
|
733
|
|
506
|
|
||||
|
Unrealized losses on investments and derivatives
|
—
|
|
36
|
|
||||
|
State credits and net operating losses
|
378
|
|
297
|
|
||||
|
Other, net
|
654
|
|
654
|
|
||||
|
Gross deferred tax assets
|
4,048
|
|
3,893
|
|
||||
|
Valuation allowance
|
(456
|
)
|
(389
|
)
|
||||
|
Total deferred tax assets
|
$
|
3,592
|
|
$
|
3,504
|
|
||
|
Deferred tax liabilities:
|
||||||||
|
Property, plant and equipment
|
$
|
(2,023
|
)
|
$
|
(2,325
|
)
|
||
|
Licenses and intangibles
|
(687
|
)
|
(778
|
)
|
||||
|
Convertible debt
|
(911
|
)
|
(856
|
)
|
||||
|
Unrealized gains on investments and derivatives
|
(815
|
)
|
—
|
|
||||
|
Investment in non-U.S. subsidiaries
|
(244
|
)
|
(213
|
)
|
||||
|
Other, net
|
(281
|
)
|
(269
|
)
|
||||
|
Total deferred tax liabilities
|
$
|
(4,961
|
)
|
$
|
(4,441
|
)
|
||
|
Net deferred tax assets (liabilities)
|
$
|
(1,369
|
)
|
$
|
(937
|
)
|
||
|
Reported as:
|
||||||||
|
Current deferred tax assets
|
$
|
2,594
|
|
$
|
2,117
|
|
||
|
Non-current deferred tax assets
|
434
|
|
358
|
|
||||
|
Non-current deferred tax liabilities
|
(4,397
|
)
|
(3,412
|
)
|
||||
|
Net deferred tax assets (liabilities)
|
$
|
(1,369
|
)
|
$
|
(937
|
)
|
||
Non-current deferred tax assets are included within other long-term assets on the consolidated balance sheets.
The valuation allowance is based on our assessment that it is more likely than not that certain deferred tax assets will not be realized in the foreseeable future. The valuation allowance as of
December 28, 2013
, included allowances related to unrealized state credit carryforwards of
$364 million
and matters related to our non-U.S. subsidiaries of
$92 million
.
As of
December 28, 2013
, our federal, state, and non-U.S. net operating loss carryforwards for income tax purposes were
$239 million
,
$353 million
, and
$647 million
, respectively. Approximately half of the non-U.S. net operating loss carryforwards have no expiration date. The remaining non-U.S. as well as the U.S. federal and state net operating loss carryforwards expire at various dates through
2033
. A significant amount of the net operating loss carryforwards in the U.S. relates to acquisitions and, as a result, is limited in the amount that can be recognized in any one year. The non-U.S. net operating loss carryforwards include
$342 million
that is not likely to be recovered and has been reduced by a valuation allowance.
As of
December 28, 2013
, we had not recognized U.S. deferred income taxes on a cumulative total of
$20.0 billion
of undistributed earnings for certain non-U.S. subsidiaries and
$2.4 billion
of other basis differences of our investments in certain non-U.S. subsidiaries primarily related to McAfee. Determining the unrecognized deferred tax liability related to investments in these non-U.S. subsidiaries that are indefinitely reinvested is not practicable. We currently intend to indefinitely reinvest those earnings and other basis differences in operations outside the U.S.
96
Current income taxes receivable of
$65 million
as of
December 28, 2013
, (
$866 million
as of
December 29, 2012
) is included in other current assets. Current income taxes payable of
$542 million
as of
December 28, 2013
, (
$711 million
as of
December 29, 2012
) is included in other accrued liabilities.
Long-term income taxes payable of
$188 million
as of
December 28, 2013
, (
$177 million
as of
December 29, 2012
) within other long-term liabilities, includes uncertain tax positions, reduced by the associated federal deduction for state taxes and non-U.S. tax credits, and may also include other long-term tax liabilities that are not uncertain but have not yet been paid.
Uncertain Tax Positions
The aggregate changes in the balance of gross unrecognized tax benefits for each period were as follows:
|
(In Millions)
|
2013
|
2012
|
2011
|
|||||||||
|
Beginning gross unrecognized tax benefits
|
$
|
189
|
|
$
|
212
|
|
$
|
216
|
|
|||
|
Settlements and effective settlements with tax authorities and related remeasurements
|
(2
|
)
|
(81
|
)
|
(63
|
)
|
||||||
|
Lapse of statute of limitations
|
—
|
|
(5
|
)
|
(17
|
)
|
||||||
|
Increases in balances related to tax positions taken during prior periods
|
21
|
|
56
|
|
91
|
|
||||||
|
Decreases in balances related to tax positions taken during prior periods
|
(9
|
)
|
(6
|
)
|
(21
|
)
|
||||||
|
Increases in balances related to tax positions taken during current period
|
8
|
|
13
|
|
6
|
|
||||||
|
Ending gross unrecognized tax benefits
|
$
|
207
|
|
$
|
189
|
|
$
|
212
|
|
|||
During
2013
, we settled and effectively settled matters with certain state and non-U.S. tax authorities relating to tax positions taken during prior periods. The result of the settlements, effective settlements, and re-measurements resulted in an insignificant reduction in the balance of our gross unrecognized tax benefits in
2013
(
$81 million
in
2012
and
$63 million
in
2011
). The related tax benefit for settlements, effective settlements, and re-measurements is insignificant for
2013
(
$7 million
for
2012
and
$61 million
for
2011
).
If the remaining balance of
$207 million
of unrecognized tax benefits as of
December 28, 2013
, (
$189 million
as of
December 29, 2012
) were realized in a future period, it would result in a tax benefit of
$81 million
and a reduction in the effective tax rate (
$66 million
as of
December 29, 2012
).
During all years presented, we recognized interest and penalties related to unrecognized tax benefits within the provision for taxes on the consolidated statements of income. Interest and penalties related to unrecognized tax benefits were
insignificant
in
2013
(
insignificant
in
2012
and
$24 million
in
2011
). As of
December 28, 2013
, we had
$73 million
of accrued interest and penalties related to unrecognized tax benefits (
$66 million
as of
December 29, 2012
).
Although the timing of the resolutions and/or closures of audits is highly uncertain, it is reasonably possible that certain non-U.S. tax audits may be concluded within the next 12 months which could significantly increase or decrease the balance of our gross unrecognized tax benefits. However, the estimated impact to income tax expense and net income is not expected to be significant.
We file federal, state, and non-U.S. tax returns. For state and non-U.S. tax returns, we are generally no longer subject to tax examinations for years prior to
2001
. For federal tax returns, we are no longer subject to tax examination for years prior to
2009
.
97
The components of other comprehensive income (loss) and related tax effects for each period were as follows:
|
|
2013
|
2012
|
2011
|
|||||||||||||||||||||||||||||||||
|
(In Millions)
|
Before
Tax
|
Tax
|
Net of
Tax
|
Before
Tax
|
Tax
|
Net of
Tax
|
Before
Tax
|
Tax
|
Net of
Tax
|
|||||||||||||||||||||||||||
|
Change in unrealized holding gains (losses) on available-for-sale investments
|
$
|
1,963
|
|
$
|
(687
|
)
|
$
|
1,276
|
|
$
|
909
|
|
$
|
(318
|
)
|
$
|
591
|
|
$
|
35
|
|
$
|
(13
|
)
|
$
|
22
|
|
|||||||||
|
Less:
adjustment for (gains) losses on available-for-sale investments included in net income
|
(146
|
)
|
51
|
|
(95
|
)
|
(187
|
)
|
66
|
|
(121
|
)
|
(299
|
)
|
107
|
|
(192
|
)
|
||||||||||||||||||
|
Less:
adjustment for (gains) losses on deferred tax asset valuation allowance included in net income
|
—
|
|
(26
|
)
|
(26
|
)
|
—
|
|
(11
|
)
|
(11
|
)
|
—
|
|
(99
|
)
|
(99
|
)
|
||||||||||||||||||
|
Change in unrealized holding gains (losses) on derivatives
|
(166
|
)
|
76
|
|
(90
|
)
|
12
|
|
8
|
|
20
|
|
20
|
|
(16
|
)
|
4
|
|
||||||||||||||||||
|
Less:
adjustment for amortization of (gains) losses on derivatives
|
30
|
|
(29
|
)
|
1
|
|
78
|
|
(13
|
)
|
65
|
|
(161
|
)
|
38
|
|
(123
|
)
|
||||||||||||||||||
|
Change in net prior service costs
|
17
|
|
(2
|
)
|
15
|
|
(4
|
)
|
1
|
|
(3
|
)
|
—
|
|
—
|
|
—
|
|
||||||||||||||||||
|
Less:
adjustment for amortization of net prior service costs
|
4
|
|
(1
|
)
|
3
|
|
5
|
|
(2
|
)
|
3
|
|
7
|
|
(3
|
)
|
4
|
|
||||||||||||||||||
|
Change in actuarial valuation
|
725
|
|
(275
|
)
|
450
|
|
(321
|
)
|
91
|
|
(230
|
)
|
(900
|
)
|
284
|
|
(616
|
)
|
||||||||||||||||||
|
Less:
adjustment for amortization of actuarial (gains) losses
|
101
|
|
(31
|
)
|
70
|
|
90
|
|
(32
|
)
|
58
|
|
43
|
|
(15
|
)
|
28
|
|
||||||||||||||||||
|
Change in net foreign currency translation adjustment
|
45
|
|
(7
|
)
|
38
|
|
12
|
|
(2
|
)
|
10
|
|
(155
|
)
|
13
|
|
(142
|
)
|
||||||||||||||||||
|
Other comprehensive income (loss)
|
$
|
2,573
|
|
$
|
(931
|
)
|
$
|
1,642
|
|
$
|
594
|
|
$
|
(212
|
)
|
$
|
382
|
|
$
|
(1,410
|
)
|
$
|
296
|
|
$
|
(1,114
|
)
|
|||||||||
In prior periods, we recorded a reversal of a portion of our deferred tax asset valuation allowance attributed to changes in unrealized holding gains on our available-for-sale investments. This amount is reduced and included in our provision for taxes as these investments mature or are sold, and is included in the preceding table as an adjustment for (gains) losses on deferred tax asset valuation allowance included in net income.
98
The changes in accumulated other comprehensive income (loss) by component and related tax effects for each period were as follows:
|
(In Millions)
|
Unrealized Holding Gains (Losses) on Available-for-Sale Investments
|
Deferred Tax Asset Valuation Allowance
|
Unrealized Holding Gains (Losses) on Derivatives
|
Prior Service Credits (Costs)
|
Actuarial Gains (Losses)
|
Foreign Currency Translation Adjustment
|
Total
|
|||||||||||||||||||||
|
December 31, 2011
|
$
|
231
|
|
$
|
104
|
|
$
|
8
|
|
$
|
(32
|
)
|
$
|
(950
|
)
|
$
|
(142
|
)
|
$
|
(781
|
)
|
|||||||
|
Other comprehensive income before reclassifications
|
909
|
|
—
|
|
12
|
|
(4
|
)
|
(321
|
)
|
12
|
|
608
|
|
||||||||||||||
|
Amounts reclassified out of accumulated other comprehensive income
|
(187
|
)
|
—
|
|
78
|
|
5
|
|
90
|
|
—
|
|
(14
|
)
|
||||||||||||||
|
Tax effects
|
(252
|
)
|
(11
|
)
|
(5
|
)
|
(1
|
)
|
59
|
|
(2
|
)
|
(212
|
)
|
||||||||||||||
|
Other comprehensive income (loss)
|
470
|
|
(11
|
)
|
85
|
|
—
|
|
(172
|
)
|
10
|
|
382
|
|
||||||||||||||
|
December 29, 2012
|
$
|
701
|
|
$
|
93
|
|
$
|
93
|
|
$
|
(32
|
)
|
$
|
(1,122
|
)
|
$
|
(132
|
)
|
$
|
(399
|
)
|
|||||||
|
Other comprehensive income before reclassifications
|
1,963
|
|
—
|
|
(166
|
)
|
17
|
|
725
|
|
45
|
|
2,584
|
|
||||||||||||||
|
Amounts reclassified out of accumulated other comprehensive income
|
(146
|
)
|
—
|
|
30
|
|
4
|
|
101
|
|
—
|
|
(11
|
)
|
||||||||||||||
|
Tax effects
|
(636
|
)
|
(26
|
)
|
47
|
|
(3
|
)
|
(306
|
)
|
(7
|
)
|
(931
|
)
|
||||||||||||||
|
Other comprehensive income (loss)
|
1,181
|
|
(26
|
)
|
(89
|
)
|
18
|
|
520
|
|
38
|
|
1,642
|
|
||||||||||||||
|
December 28, 2013
|
$
|
1,882
|
|
$
|
67
|
|
$
|
4
|
|
$
|
(14
|
)
|
$
|
(602
|
)
|
$
|
(94
|
)
|
$
|
1,243
|
|
|||||||
99
The amounts reclassified out of accumulated other comprehensive income into the consolidated statements of income, with presentation location, for each period were as follows:
|
2013
|
2012
|
2011
|
||||||||||||
|
Comprehensive Income Components
|
Income Before Taxes Impact (In Millions)
|
Location
|
||||||||||||
|
Unrealized holding gains (losses) on available-for-sale investments
|
||||||||||||||
|
$
|
8
|
|
$
|
(8
|
)
|
$
|
(7
|
)
|
Interest and other, net
|
|||||
|
138
|
|
195
|
|
306
|
|
Gains (losses) on equity investments, net
|
||||||||
|
146
|
|
187
|
|
299
|
|
|||||||||
|
Unrealized holding gains (losses) on derivatives
|
||||||||||||||
|
Currency forwards
|
(61
|
)
|
11
|
|
118
|
|
Cost of sales
|
|||||||
|
30
|
|
(63
|
)
|
20
|
|
Research and development
|
||||||||
|
—
|
|
(25
|
)
|
19
|
|
Marketing, general and administrative
|
||||||||
|
Other instruments
|
1
|
|
(1
|
)
|
4
|
|
Cost of sales
|
|||||||
|
(30
|
)
|
(78
|
)
|
161
|
|
|||||||||
|
Amortization of pension and postretirement benefit components
|
||||||||||||||
|
Prior service credits (costs)
|
(4
|
)
|
(5
|
)
|
(7
|
)
|
||||||||
|
Actuarial gains (losses)
|
(101
|
)
|
(90
|
)
|
(43
|
)
|
||||||||
|
(105
|
)
|
(95
|
)
|
(50
|
)
|
|||||||||
|
Total amounts reclassified out of accumulated other comprehensive income
|
$
|
11
|
|
$
|
14
|
|
$
|
410
|
|
|||||
The amortization of pension and postretirement benefit components are included in the "Net Periodic Benefit Cost" section of "
Note 17: Retirement Benefit Plans
". The estimated net prior service costs and net actuarial gains (losses) for the defined benefit plans that will be amortized from accumulated other comprehensive income (loss) into net periodic benefit cost during
2014
are
$4 million
and
$39 million
, respectively.
We estimate that we will reclassify approximately
$6 million
(before taxes) of net derivative losses included in accumulated other comprehensive income (loss) into earnings within the next 12 months.
Legal Proceedings
We are a party to various legal proceedings, including those noted in this section. Although management at present believes that the ultimate outcome of these proceedings, individually and in the aggregate, will not materially harm our financial position, results of operations, cash flows, or overall trends, legal proceedings and related government investigations are subject to inherent uncertainties, and unfavorable rulings or other events could occur. Unfavorable resolutions could include substantial monetary damages. In addition, in matters for which injunctive relief or other conduct remedies are sought, unfavorable resolutions could include an injunction or other order prohibiting us from selling one or more products at all or in particular ways, precluding particular business practices, or requiring other remedies. Were unfavorable outcomes to occur, the possibility exists for a material adverse impact on our business, results of operations, financial position, and overall trends. We might also conclude that settling one or more such matters is in the best interests of our stockholders, employees, and customers, and any such settlement could include substantial payments. However, we have not reached this conclusion with respect to any particular matter at this time.
100
A number of proceedings generally have challenged and continue to challenge certain of our competitive practices. The allegations in these proceedings vary and are described in more detail in the following paragraphs. In general, they contend that we improperly conditioned price rebates and other discounts on our microprocessors on exclusive or near-exclusive dealing by some of our customers; and they allege that our software compiler business unfairly preferred Intel
microprocessors over competing microprocessors and that, through the use of our compilers and other means, we have caused the dissemination of inaccurate and misleading benchmark results concerning our microprocessors. Based on the procedural posture of the various remaining competition matters, which we describe in subsequent paragraphs, our investment of resources to explain and defend our position has declined as compared to the period 2005-2011. Nonetheless, certain of the matters remain active, and these challenges could continue for a number of years, potentially requiring us to invest additional resources. We believe that we compete lawfully and that our marketing, business, intellectual property, and other challenged practices benefit our customers and our stockholders, and we will continue to conduct a vigorous defense in the remaining proceedings.
Government Competition Matters and Related Consumer Class Actions
In 2001, the European Commission (EC) commenced an investigation regarding claims by Advanced Micro Devices, Inc. (AMD) that we used unfair business practices to persuade customers to buy our microprocessors. We received numerous requests for information and documents from the EC and we responded to each of those requests. The EC issued a Statement of Objections in July 2007 and held a hearing on that Statement in March 2008. The EC issued a Supplemental Statement of Objections in July 2008.
In May 2009, the EC issued a decision finding that we had violated Article 82 of the EC Treaty and Article 54 of the European Economic Area Agreement. In general, the EC found that we violated Article 82 (later renumbered as Article 102 by a new treaty) by offering alleged
“
conditional rebates and payments
”
that required our customers to purchase all or most of their x86 microprocessors from us. The EC also found that we violated Article 82 by making alleged
“
payments to prevent sales of specific rival products.
”
The EC imposed a fine in the amount of
€1.06 billion
(
$1.447 billion
as of May 2009), which we subsequently paid during the third quarter of 2009, and ordered us to
“
immediately bring to an end the infringement referred to in
”
the EC decision. In the second quarter of 2009, we recorded the related charge within marketing, general and administrative. We strongly disagree with the EC
'
s decision, and we appealed the decision to the Court of First Instance (which has been renamed the General Court) in July 2009. The hearing of our appeal took place on July 3 through July 6, 2012. The court
'
s decision is expected in 2014.
The EC decision exceeds 500 pages but contains no specific direction on whether or how we should modify our business practices. Instead, the decision states that we should
“
cease and desist
”
from further conduct that, in the EC
'
s opinion, would violate applicable law. We have taken steps, which are subject to the EC
'
s ongoing review, to comply with that decision pending appeal. We had discussions with the EC to better understand the decision and to explain changes to our business practices. Based on our current understanding and expectations, we do not believe that any such changes will be material to our financial position, results, or cash flows.
In June
2005, we received an inquiry from the Korea Fair Trade Commission (KFTC) requesting documents from our Korean subsidiary related to marketing and rebate programs that we entered into with Korean PC manufacturers. In February 2006, the KFTC initiated an inspection of documents at our offices in Korea. In September 2007, the KFTC served on us an Examination Report alleging that sales to two customers during parts of 2002
-
2005 violated Korea
'
s Monopoly Regulation and Fair Trade Act. In December 2007, we submitted our written response to the KFTC. In February 2008, the KFTC
'
s examiner submitted a written reply to our response. In March 2008, we submitted a further response. In April 2008, we participated in a pre-hearing conference before the KFTC, and we participated in formal hearings in May and June 2008. In June 2008, the KFTC announced its intent to fine us approximately
$25 million
for providing discounts to Samsung Electronics Co., Ltd. and TriGem Computer Inc. In November 2008, the KFTC issued a final written decision concluding that our discounts had violated Korean antitrust law and imposing a fine on us of approximately
$20 million
, which we paid in January 2009. In December 2008, we appealed this decision by filing a lawsuit in the Seoul High Court seeking to overturn the KFTC
'
s decision. In June 2013, the Seoul High Court rejected Intel's appeal and affirmed the KFTC's findings, including the imposition of the fine.
101
At least 82 separate class-action lawsuits have been filed in the U.S. District Courts for the Northern District of California, Southern District of California, District of Idaho, District of Nebraska, District of New Mexico, District of Maine, and District of Delaware, as well as in various California, Kansas, and Tennessee state courts. These actions generally repeat the allegations made in a now-settled lawsuit filed against us by AMD in June 2005 in the U.S. District Court for the District of Delaware (AMD litigation). Like the AMD litigation, these class-action lawsuits allege that we engaged in various actions in violation of the Sherman Act and other laws by, among other things: providing discounts and rebates to our manufacturer and distributor customers conditioned on exclusive or near-exclusive dealing that allegedly unfairly interfered with AMD
'
s ability to sell its microprocessors; interfering with certain AMD product launches; and interfering with AMD
'
s participation in certain industry standards-setting groups. The class actions allege various consumer injuries, including that consumers in various states have been injured by paying higher prices for computers containing our microprocessors. We dispute these class-action claims and intend to defend the lawsuits vigorously.
All of the federal class actions and the Kansas and Tennessee state court class actions have been transferred by the Multidistrict Litigation Panel to the U.S. District Court in Delaware for all pre-trial proceedings and discovery (MDL proceedings). The Delaware district court appointed a Special Master to address issues in the MDL proceedings, as assigned by the court. In January 2010, the plaintiffs in the Delaware action filed a motion for sanctions for our alleged failure to preserve evidence. This motion largely copies a motion previously filed by AMD in the AMD litigation, which has settled. The plaintiffs in the MDL proceedings also moved for certification of a class of members who purchased certain PCs containing products sold by us. In July 2010, the Special Master issued a Report and Recommendation (Report) denying the motion to certify a class. The MDL plaintiffs filed objections to the Special Master
'
s Report, and a hearing on those objections was held in March 2011. In September 2012, the court ruled that an evidentiary hearing would be necessary to enable the court to rule on the objections to the Special Master
'
s Report, to resolve the motion to certify the class, and to resolve a separate motion to exclude certain testimony and evidence from the MDL plaintiffs
'
expert. The hearing occurred in July 2013, and we are awaiting the court's decision on the class certification issues.
All California class actions have been consolidated in the Superior Court of California in Santa Clara County. The plaintiffs in the California actions have moved for class certification, which we are in the process of opposing. At our request, the court in the California actions has agreed to delay ruling on this motion until after the Delaware district court rules on the similar motion in the MDL proceedings. Given the procedural posture and the nature of these cases, including the fact that the Delaware district court has not determined whether the matters before it may proceed as a class action, we are unable to make a reasonable estimate of the potential loss or range of losses, if any, arising from these matters.
In re High Tech Employee Antitrust Litigation
Between May and July 2011, former employees of Intel, Adobe Systems Incorporated, Apple Inc., Google Inc., Intuit Inc., Lucasfilm Ltd., and Pixar filed antitrust class action lawsuits in the California Superior Courts alleging that these companies had entered into a conspiracy to suppress the compensation of their employees. The California Superior Court lawsuits were removed to the United States District Court for the Northern District of California and were consolidated. The plaintiffs
’
allegations referenced the 2009 and 2010 investigation by the Department of Justice (DOJ) into employment practices in the technology industry, as well as the DOJ
’
s complaints and subsequent stipulated final judgments with the seven companies named as defendants in the lawsuits. The plaintiffs allege that the defendants entered into certain unlawful agreements not to cold call employees of particular other defendants and that there was an overarching conspiracy among the defendants. Plaintiffs assert one such agreement specific to Intel, namely that Intel and Google entered into an agreement starting no later than September 2007, not to cold call each other
’
s employees.
In September 2011, the plaintiffs filed a consolidated amended complaint, captioned
In re High Tech Employee Antitrust Litigation,
which asserts the same state law claims as the state court complaints, and also asserts claims under Section 1 of the Sherman Antitrust Act and Section 4 of the Clayton Antitrust Act. Plaintiffs
’
consolidated amended complaint seeks a declaration that the defendants
’
alleged actions violated the antitrust laws; damages, trebled as provided for by law under the Sherman Act or Clayton Act; restitution, and disgorgement; and attorneys
’
fees and costs. In April 2012, the court granted the defendants
’
motion to dismiss plaintiffs
’
state law claims but denied defendants
’
motion to dismiss the Sherman Act and Clayton Act claims.
102
In October 2013, the court certified a class consisting of approximately
66,000
current or former employees of the seven defendants. This so-called
“
technical class
”
consists of a group of current and former technical, creative, and R&D employees at each of the defendants. In January 2014, Intel filed a motion for summary judgment which is scheduled for hearing in March 2014. Trial is scheduled to begin in late May 2014. Given the procedural posture and the nature of this case, we are unable to make a reasonable estimate of the potential loss or range of losses, if any, that might arise from this matter. We dispute the plaintiffs
’
claims and intend to defend the lawsuit vigorously.
Lehman Brothers Holdings Inc. and Lehman Brothers OTC Derivatives Inc. v. Intel
In May 2013, Lehman Brothers OTC Derivatives Inc. (LOTC) and Lehman Brothers Holdings Inc. (LBHI) filed an adversary complaint in the United States Bankruptcy Court in the Southern District of New York asserting claims against us arising from a 2008 contract between Intel and LOTC. Under the terms of the 2008 contract, we prepaid
$1.0 billion
to LOTC, in exchange for which LOTC was required to deliver to us on or before September 29, 2008, quantities of Intel common stock and cash determined by a formula set forth in the contract. LOTC's performance under the contract was secured by
$1.0 billion
of cash collateral. Under the terms of the contract, LOTC was obligated to deliver approximately
50 million
shares of our common stock to us on September 29, 2008. LOTC failed to deliver any Intel common stock or cash, and we exercised our right of set-off against the
$1.0 billion
collateral. LOTC and LBHI acknowledge in their complaint that we were entitled to set off our losses against the collateral, but they assert that we withheld collateral in excess of our losses that should have been returned to LOTC. The complaint asserts a claim for breach of contract, a claim for “turnover” under section 542(a) of the Bankruptcy Code, and a claim for violation of the automatic stay under section 362(a)(3) of the Bankruptcy Code. The complaint does not expressly quantify the amount of damages claimed but does assert multiple theories of damages that impliedly seek up to
$312 million
of alleged excess collateral, plus interest based on LOTC's claimed cost of borrowing. In June 2013, we filed a motion to dismiss plaintiffs' bankruptcy claims and for a determination that the breach of contract claim is “non-core” under the Bankruptcy Code. The bankruptcy court granted our motion in its entirety in December 2013. In January 2014, based on the bankruptcy court’s ruling, we filed a motion in the United States District Court for the Southern District of New York requesting that the district court withdraw its reference to the bankruptcy court of plaintiffs’ adversary complaint. Given the procedural posture and the nature of this case, including that discovery has just begun, we are unable to make a reasonable estimate of the potential loss or range of losses, if any, that might arise from this matter. We believe that we acted in a manner consistent with our contractual rights, and we intend to defend against any claim to the contrary.
McAfee, Inc. Shareholder Litigation
On August 19, 2010, we announced that we had agreed to acquire all of McAfee’s common stock for
$48.00
per share. Four McAfee shareholders filed putative class-action lawsuits in Santa Clara County, California Superior Court challenging the proposed transaction. The cases were ordered consolidated in September 2010. Plaintiffs filed an amended complaint that named former McAfee board members, McAfee and Intel as defendants, and alleged that the McAfee board members breached their fiduciary duties and that McAfee and Intel aided and abetted those breaches of duty. The complaint requested rescission of the merger agreement, such other equitable relief as the court may deem proper, and an award of damages in an unspecified amount. In June 2012, the plaintiffs’ damages expert asserted that the value of a McAfee share for the purposes of assessing damages should be
$62.08
.
In January 2012, the court certified the action as a class action, appointed the Central Pension Laborers’ Fund to act as the class representative, and scheduled trial to begin in January 2013. In March 2012, defendants filed a petition with the California Court of Appeal for a writ of mandate to reverse the class certification order; the petition was denied in June 2012. In March 2012, at defendants’ request, the court held that plaintiffs were not entitled to a jury trial, and ordered a bench trial. In April 2012, plaintiffs filed a petition with the California Court of Appeal for a writ of mandate to reverse that order, which the court of appeal denied in July 2012. In August 2012, defendants filed a motion for summary judgment. The trial court granted that motion in November 2012, and entered final judgment in the case in February 2013. In April 2013, plaintiffs filed a notice of appeal. Because the resolution of the appeal may materially impact the scope and nature of the proceeding, we are unable to make a reasonable estimate of the potential loss or range of losses, if any, arising from this matter. We dispute the class-action claims and intend to continue to defend the lawsuit vigorously.
103
X2Y Attenuators, LLC v. Intel et al
In May 2011, X2Y Attenuators, LLC (X2Y) filed a patent infringement lawsuit in the U.S. District Court for the Western District of Pennsylvania and a complaint with the U.S. International Trade Commission (ITC) pursuant to Section 337 of the Tariff Act of 1930 against us and two of our customers, Apple and Hewlett-Packard Company, alleging infringement of five patents. X2Y subsequently added a sixth patent to both actions. The district court action is stayed pending resolution of the ITC proceeding. X2Y alleges that at least Intel
®
Core™
and Intel
®
Xeon
®
processor families infringe the asserted patents. X2Y also requests that the ITC issue permanent exclusion and cease-and-desist orders to, among other things, prohibit us from importing these microprocessors and Apple and Hewlett-Packard Company products that incorporate these microprocessors into the United States. In the district court action, X2Y seeks unspecified damages, including enhanced damages for alleged willful infringement, and injunctive relief. On June 13, 2012, the Administrative Law Judge issued an initial determination granting X2Y’s motion to partially terminate the ITC investigation with respect to three of the asserted patents. The Administrative Law Judge held a hearing on the remaining three patents in August 2012 and issued an initial determination in December 2012. In the initial determination, the Administrative Law Judge found that Intel, Apple, and Hewlett-Packard Company have not violated Section 337 of the Tariff Act of 1930 because they have not infringed any of the asserted claims of the three patents, and ruled that the asserted claims of two of the patents were invalid. In December 2012, the parties filed petitions for review of the initial determination by the ITC. In February 2013, the ITC determined to review in part the initial determination. On review, the ITC determined to reverse or vacate certain findings, and to terminate the investigation with a finding of no violation. In April 2013, X2Y filed a Notice of Appeal with the United States Court of Appeals for the Federal Circuit. Given the procedural posture and nature of the cases, including the fact that resolution of the appeal of the ITC
'
s decision may materially impact the scope and nature of the proceeding, the fact that monetary damages are not an available remedy in the ITC, and that discovery regarding X2Y’s claimed damages has not commenced in the stayed district court action, we are unable to make a reasonable estimate of the potential loss or range of losses, if any, arising from these matters. We dispute the claims and intend to defend the lawsuits vigorously.
Our operating segments in effect as of
December 28, 2013
, include:
|
•
PC Client Group
|
|
•
Software and services operating segments:
|
|
•
Data Center Group
|
|
•
McAfee
|
|
•
Other Intel architecture operating segments:
|
|
•
Wind River Software Group
|
|
•
Intelligent Systems Group
|
|
•
Software and Services Group
|
|
•
Multi-Comm
|
|
•
All other:
|
|
•
Phone Group
|
|
•
Non-Volatile Memory Solutions Group
|
|
•
Service Provider Group
|
|
|
|
•
Tablet Group
|
||
|
•
Netbook Group
|
||
|
•
New Devices Group
|
||
In 2013, we completed a reorganization that transferred a portion of our wired connectivity business formerly included within DCG to PCCG, as the technology from that portion of the business is primarily used for client connectivity. Prior period amounts have been adjusted retrospectively to reflect this new organization structure.
We reorganized our IMC businesses within the "other Intel architecture" operating segments to segment our focus on the phone business. As part of this reorganization, we separated the feature and entry phone component business into the existing Phone Group operating segment and renamed the remaining business, primarily discrete modems, as the Multi-Comm operating segment.
In May 2013, Brian Krzanich became our CEO and a member of Intel's Board of Directors, succeeding Paul S. Otellini, who retired from the Board and as CEO. Since his appointment as CEO, Mr. Krzanich made management organizational changes which did not result in a change to the businesses comprising our operating segments or to the conclusion that the Chief Operating Decision Maker (CODM) is the CEO. The CODM allocates resources to and assesses the performance of each operating segment using information about its revenue and operating income (loss).
104
PCCG and DCG are our reportable operating segments. We also aggregate and disclose the financial results of our non-reportable operating segments within “other Intel architecture operating segments” and “software and services operating segments” as shown in the above operating segments list. Each of these aggregated operating segments does not meet the quantitative thresholds to qualify as a reportable operating segment; however, we have elected to disclose the aggregation of these non-reportable operating segments. Revenue for our reportable and aggregated non-reportable operating segments is primarily related to the following product lines:
|
•
|
PC Client Group
. Includes platforms designed for the notebook (including Ultrabook
™
devices and 2 in 1 systems), desktop (including all-in-ones and high-end enthusiast PCs), and certain tablet market segments; and wireless and wired connectivity products.
|
|
•
|
Data Center Group.
Includes platforms designed for the server, workstation, and storage computing market segments; and wired network connectivity products.
|
|
•
|
Other Intel architecture operating segments.
Includes platforms designed for embedded applications for communications, medical, automotive, industrial, retail, and other market segments; mobile components such as baseband processors, radio frequency transceivers, WiFi,
Bluetooth
®
, global navigation satellite system, and power management chips; platforms designed for the tablet market segment; platforms designed for the smartphone market segment; gateway and set-top box components; and platforms designed for the netbook market segment; delivering reference devices and technology platforms ready to be used by customers as well as System-on-Chip architecture specifically designed for wearable and other emerging compute opportunities.
|
|
•
|
Software and services operating segments.
Includes software products for endpoint security, network and content security, risk and compliance, and consumer and mobile security from our McAfee business; software optimized products for the embedded and mobile market segments; and software products and services that promote Intel
architecture as the platform of choice for software development.
|
We have sales and marketing, manufacturing, finance, and administration groups. Expenses for these groups are generally allocated to the operating segments, and the expenses are included in the operating results reported below.
The “all other” category includes revenue, expenses, and charges such as:
|
•
|
results of operations from our Non-Volatile Memory Solutions Group that includes NAND flash memory products for use in a variety of devices;
|
|
•
|
amounts included within restructuring and asset impairment charges;
|
|
•
|
a portion of profit-dependent compensation and other expenses not allocated to the operating segments;
|
|
•
|
divested businesses for which discrete operating results are not reviewed by our CODM;
|
|
•
|
results of operations of start-up businesses that support our initiatives, including our foundry business; and
|
|
•
|
acquisition-related costs, including amortization and any impairment of acquisition-related intangibles and goodwill.
|
The CODM does not evaluate operating segments using discrete asset information. Based on the interchangeable nature of our manufacturing and assembly and test assets, most of the related depreciation expense is not directly identifiable within our operating segments as it is included in overhead cost pools and subsequently absorbed into inventory as each product passes through our manufacturing process. As our products are then sold across multiple operating segments, it is impracticable to determine the total depreciation expense included as a component of each operating segment’s operating income (loss) results. Operating segments do not record inter-segment revenue. We do not allocate gains and losses from equity investments, interest and other income, or taxes to operating segments. Although the CODM uses operating income to evaluate the segments, operating costs included in one segment may benefit other segments. Except for these differences, the accounting policies for segment reporting are the same as for Intel as a whole.
105
Net revenue and operating income (loss) for each period were as follows:
|
(In Millions)
|
2013
|
2012
|
2011
|
|||||||||
|
Net revenue:
|
||||||||||||
|
PC Client Group
|
$
|
33,039
|
|
$
|
34,504
|
|
$
|
35,624
|
|
|||
|
Data Center Group
|
11,238
|
|
10,511
|
|
9,911
|
|
||||||
|
Other Intel architecture operating segments
|
4,092
|
|
4,378
|
|
5,005
|
|
||||||
|
Software and services operating segments
|
2,502
|
|
2,381
|
|
1,870
|
|
||||||
|
All other
|
1,837
|
|
1,567
|
|
1,589
|
|
||||||
|
Total net revenue
|
$
|
52,708
|
|
$
|
53,341
|
|
$
|
53,999
|
|
|||
|
Operating income (loss):
|
||||||||||||
|
PC Client Group
|
$
|
11,827
|
|
$
|
13,106
|
|
$
|
14,840
|
|
|||
|
Data Center Group
|
5,164
|
|
5,020
|
|
5,053
|
|
||||||
|
Other Intel architecture operating segments
|
(2,445
|
)
|
(1,377
|
)
|
(577
|
)
|
||||||
|
Software and services operating segments
|
1
|
|
(11
|
)
|
(32
|
)
|
||||||
|
All other
|
(2,256
|
)
|
(2,100
|
)
|
(1,807
|
)
|
||||||
|
Total operating income
|
$
|
12,291
|
|
$
|
14,638
|
|
$
|
17,477
|
|
|||
In
2013
,
Hewlett-Packard Company
accounted for
17%
of our net revenue (
18%
in
2012
and
19%
in
2011
),
Dell Inc.
accounted for
15%
of our net revenue (
14%
in
2012
and
15%
in
2011
), and
Lenovo Group Limited
accounted for
12%
of our net revenue (
11%
in
2012
and
9%
in
2011
). The majority of the revenue from these customers was from the sale of platforms and other components by the PCCG and the DCG operating segments.
Most of our revenue in the PCCG and DCG operating segments is generated from the sale of platforms.
Net revenue by country for the three years ended
December 28, 2013
, is based on the billing location of the customer. Certain prior-period amounts have been reclassified to conform to the current year’s presentation. Revenue from unaffiliated customers for each period were as follows:
|
(In Millions)
|
2013
|
2012
|
2011
|
|||||||||
|
Singapore
|
$
|
10,997
|
|
$
|
12,622
|
|
$
|
13,626
|
|
|||
|
China (including Hong Kong)
|
9,890
|
|
8,299
|
|
7,133
|
|
||||||
|
United States
|
9,091
|
|
8,348
|
|
9,005
|
|
||||||
|
Taiwan
|
8,888
|
|
9,327
|
|
8,534
|
|
||||||
|
Japan
|
3,725
|
|
4,303
|
|
4,538
|
|
||||||
|
Other countries
|
10,117
|
|
10,442
|
|
11,163
|
|
||||||
|
Total net revenue
|
$
|
52,708
|
|
$
|
53,341
|
|
$
|
53,999
|
|
|||
Revenue from unaffiliated customers outside the U.S. totaled
$43.6 billion
in
2013
(
$45.0 billion
in
2012
and
$45.0 billion
in
2011
).
Net property, plant and equipment by country at the end of each period was as follows:
|
(In Millions)
|
Dec 28,
2013 |
Dec 29,
2012 |
Dec 31,
2011 |
|||||||||
|
United States
|
$
|
23,624
|
|
$
|
20,542
|
|
$
|
16,448
|
|
|||
|
Ireland
|
2,986
|
|
1,523
|
|
1,198
|
|
||||||
|
Israel
|
2,667
|
|
3,389
|
|
3,356
|
|
||||||
|
Other countries
|
2,151
|
|
2,529
|
|
2,625
|
|
||||||
|
Total property, plant and equipment, net
|
$
|
31,428
|
|
$
|
27,983
|
|
$
|
23,627
|
|
|||
Net property, plant and equipment outside the U.S. totaled
$7.8 billion
as of
December 28, 2013
(
$7.4 billion
as of
December 29, 2012
and
$7.2 billion
as of
December 31, 2011
).
106
REPORT OF INDEPENDENT REGISTERED PUBLIC ACCOUNTING FIRM
The Board of Directors and Stockholders of Intel Corporation
We have audited the accompanying consolidated balance sheets of Intel Corporation as of
December 28, 2013
and
December 29, 2012
, and the related consolidated statements of income and comprehensive income, stockholders’ equity, and cash flows for each of the three years in the period ended
December 28, 2013
. Our audits also included the financial statement schedule listed in the Index at Part IV, Item 15. These financial statements and schedule are the responsibility of the company’s management. Our responsibility is to express an opinion on these financial statements and schedule based on our audits.
We conducted our audits in accordance with the standards of the Public Company Accounting Oversight Board (United States). Those standards require that we plan and perform the audit to obtain reasonable assurance about whether the financial statements are free of material misstatement. An audit includes examining, on a test basis, evidence supporting the amounts and disclosures in the financial statements. An audit also includes assessing the accounting principles used and significant estimates made by management, as well as evaluating the overall financial statement presentation. We believe that our audits provide a reasonable basis for our opinion.
In our opinion, the financial statements referred to above present fairly, in all material respects, the consolidated financial position of Intel Corporation at
December 28, 2013
and
December 29, 2012
, and the consolidated results of its operations and its cash flows for each of the three years in the period ended
December 28, 2013
, in conformity with U.S. generally accepted accounting principles. Also, in our opinion, the related financial statement schedule, when considered in relation to the basic financial statements taken as a whole, presents fairly in all material respects the information set forth therein.
We also have audited, in accordance with the standards of the Public Company Accounting Oversight Board (United States), Intel Corporation’s internal control over financial reporting as of
December 28, 2013
, based on criteria established in Internal Control—Integrated Framework issued by the Committee of Sponsoring Organizations of the Treadway Commission (1992 Framework) and our report dated
February 14, 2014
expressed an unqualified opinion thereon.

San Jose, California
February 14, 2014
107
REPORT OF INDEPENDENT REGISTERED PUBLIC ACCOUNTING FIRM
The Board of Directors and Stockholders of Intel Corporation
We have audited Intel Corporation’s internal control over financial reporting as of
December 28, 2013
, based on criteria established in Internal Control—Integrated Framework issued by the Committee of Sponsoring Organizations of the Treadway Commission (1992 Framework) (the COSO criteria). Intel Corporation’s management is responsible for maintaining effective internal control over financial reporting, and for its assessment of the effectiveness of internal control over financial reporting included in the accompanying Management Report on Internal Control Over Financial Reporting. Our responsibility is to express an opinion on the company’s internal control over financial reporting based on our audit.
We conducted our audit in accordance with the standards of the Public Company Accounting Oversight Board (United States). Those standards require that we plan and perform the audit to obtain reasonable assurance about whether effective internal control over financial reporting was maintained in all material respects. Our audit included obtaining an understanding of internal control over financial reporting, assessing the risk that a material weakness exists, testing and evaluating the design and operating effectiveness of internal control based on the assessed risk, and performing such other procedures as we considered necessary in the circumstances. We believe that our audit provides a reasonable basis for our opinion.
A company’s internal control over financial reporting is a process designed to provide reasonable assurance regarding the reliability of financial reporting and the preparation of financial statements for external purposes in accordance with generally accepted accounting principles. A company’s internal control over financial reporting includes those policies and procedures that (1) pertain to the maintenance of records that, in reasonable detail, accurately and fairly reflect the transactions and dispositions of the assets of the company; (2) provide reasonable assurance that transactions are recorded as necessary to permit preparation of financial statements in accordance with generally accepted accounting principles, and that receipts and expenditures of the company are being made only in accordance with authorizations of management and directors of the company; and (3) provide reasonable assurance regarding prevention or timely detection of unauthorized acquisition, use, or disposition of the company’s assets that could have a material effect on the financial statements.
Because of its inherent limitations, internal control over financial reporting may not prevent or detect misstatements. Also, projections of any evaluation of effectiveness to future periods are subject to the risk that controls may become inadequate because of changes in conditions, or that the degree of compliance with the policies or procedures may deteriorate.
In our opinion, Intel Corporation maintained, in all material respects, effective internal control over financial reporting as of
December 28, 2013
, based on the COSO criteria.
We also have audited, in accordance with the standards of the Public Company Accounting Oversight Board (United States), the
2013
consolidated financial statements of Intel Corporation and our report dated
February 14, 2014
expressed an unqualified opinion thereon.
San Jose, California
February 14, 2014
108
INTEL CORPORATION
FINANCIAL INFORMATION BY QUARTER (UNAUDITED)
|
2013 for Quarter Ended
(In Millions, Except Per Share Amounts) |
December 28
|
September 28
|
June 29
|
March 30
|
||||||||||||
|
Net revenue
|
$
|
13,834
|
|
$
|
13,483
|
|
$
|
12,811
|
|
$
|
12,580
|
|
||||
|
Gross margin
|
$
|
8,571
|
|
$
|
8,414
|
|
$
|
7,470
|
|
$
|
7,066
|
|
||||
|
Net income
|
$
|
2,625
|
|
$
|
2,950
|
|
$
|
2,000
|
|
$
|
2,045
|
|
||||
|
Basic earnings per common share
|
$
|
0.53
|
|
$
|
0.59
|
|
$
|
0.40
|
|
$
|
0.41
|
|
||||
|
Diluted earnings per common share
|
$
|
0.51
|
|
$
|
0.58
|
|
$
|
0.39
|
|
$
|
0.40
|
|
||||
|
Dividends per common share:
|
||||||||||||||||
|
Declared
|
$
|
—
|
|
$
|
0.4500
|
|
$
|
—
|
|
$
|
0.4500
|
|
||||
|
Paid
|
$
|
0.2250
|
|
$
|
0.2250
|
|
$
|
0.2250
|
|
$
|
0.2250
|
|
||||
|
Market price range common stock
1
:
|
||||||||||||||||
|
High
|
$
|
25.70
|
|
$
|
24.25
|
|
$
|
25.47
|
|
$
|
22.68
|
|
||||
|
Low
|
$
|
22.48
|
|
$
|
21.92
|
|
$
|
20.94
|
|
$
|
20.23
|
|
||||
|
2012 for Quarter Ended
(In Millions, Except Per Share Amounts) |
December 29
|
September 29
|
June 30
|
March 31
|
||||||||||||
|
Net revenue
|
$
|
13,477
|
|
$
|
13,457
|
|
$
|
13,501
|
|
$
|
12,906
|
|
||||
|
Gross margin
|
$
|
7,817
|
|
$
|
8,515
|
|
$
|
8,554
|
|
$
|
8,265
|
|
||||
|
Net income
|
$
|
2,468
|
|
$
|
2,972
|
|
$
|
2,827
|
|
$
|
2,738
|
|
||||
|
Basic earnings per common share
|
$
|
0.50
|
|
$
|
0.59
|
|
$
|
0.56
|
|
$
|
0.55
|
|
||||
|
Diluted earnings per common share
|
$
|
0.48
|
|
$
|
0.58
|
|
$
|
0.54
|
|
$
|
0.53
|
|
||||
|
Dividends per common share:
|
||||||||||||||||
|
Declared
|
$
|
—
|
|
$
|
0.4500
|
|
$
|
—
|
|
$
|
0.4200
|
|
||||
|
Paid
|
$
|
0.2250
|
|
$
|
0.2250
|
|
$
|
0.2100
|
|
$
|
0.2100
|
|
||||
|
Market price range common stock
1
:
|
||||||||||||||||
|
High
|
$
|
22.84
|
|
$
|
26.88
|
|
$
|
29.18
|
|
$
|
28.19
|
|
||||
|
Low
|
$
|
19.36
|
|
$
|
22.54
|
|
$
|
25.04
|
|
$
|
24.54
|
|
||||
|
1
|
Intel’s common stock (symbol INTC) trades on The NASDAQ Global Select Market*. All stock prices are closing prices per The NASDAQ Global Select Market*.
|
109
|
ITEM 9.
|
CHANGES IN AND DISAGREEMENTS WITH ACCOUNTANTS ON ACCOUNTING AND FINANCIAL DISCLOSURE
|
Not applicable.
|
ITEM 9A.
|
CONTROLS AND PROCEDURES
|
Evaluation of Disclosure Controls and Procedures
Based on management’s evaluation (with the participation of our CEO and Chief Financial Officer (CFO)), as of the end of the period covered by this report, our CEO and CFO have concluded that our disclosure controls and procedures (as defined in Rules 13a-15(e) and 15d-15(e) under the Securities Exchange Act of 1934, as amended (the Exchange Act)), are effective to provide reasonable assurance that information required to be disclosed by us in reports that we file or submit under the Exchange Act is recorded, processed, summarized, and reported within the time periods specified in U.S. Securities and Exchange Commission (SEC) rules and forms, and is accumulated and communicated to management, including our principal executive officer and principal financial officer, as appropriate, to allow timely decisions regarding required disclosure.
Changes in Internal Control Over Financial Reporting
There were no changes to our internal control over financial reporting (as defined in Rules 13a-15(f) and 15d-15(f) under the Exchange Act) that occurred during the quarter ended
December 28, 2013
, that have materially affected, or are reasonably likely to materially affect, our internal control over financial reporting.
Management Report on Internal Control Over Financial Reporting
Our management is responsible for establishing and maintaining adequate internal control over financial reporting (as defined in Rules 13a-15(f) and 15d-15(f) under the Exchange Act) to provide reasonable assurance regarding the reliability of our financial reporting and the preparation of consolidated financial statements for external purposes in accordance with U.S. generally accepted accounting principles.
Management assessed our internal control over financial reporting as of
December 28, 2013
, the end of our fiscal year. Management based its assessment on criteria established in Internal Control—Integrated Framework issued by the Committee of Sponsoring Organizations of the Treadway Commission (1992 framework). Management’s assessment included evaluation of elements such as the design and operating effectiveness of key financial reporting controls, process documentation, accounting policies, and our overall control environment.
Based on this assessment, management has concluded that our internal control over financial reporting was effective as of the end of the fiscal year to provide reasonable assurance regarding the reliability of financial reporting and the preparation of consolidated financial statements for external reporting purposes in accordance with U.S. generally accepted accounting principles. We reviewed the results of management’s assessment with the Audit Committee of our Board of Directors.
Our independent registered public accounting firm, Ernst & Young LLP, independently assessed the effectiveness of the company’s internal control over financial reporting, as stated in the firm’s attestation report, which is included at the end of Part II, Item 8 of this Form 10-K.
Inherent Limitations on Effectiveness of Controls
Our management, including the CEO and CFO, does not expect that our disclosure controls or our internal control over financial reporting will prevent or detect all errors and all fraud. A control system, no matter how well designed and operated, can provide only reasonable, not absolute, assurance that the control system’s objectives will be met. The design of a control system must reflect the fact that there are resource constraints, and the benefits of controls must be considered relative to their costs. Further, because of the inherent limitations in all control systems, no evaluation of controls can provide absolute assurance that misstatements due to error or fraud will not occur or that all control issues and instances of fraud, if any, have been detected. The design of any system of controls is based in part on certain assumptions about the likelihood of future events, and there can be no assurance that any design will succeed in achieving its stated goals under all potential future conditions. Projections of any evaluation of the effectiveness of controls to future periods are subject to risks. Over time, controls may become inadequate because of changes in conditions or deterioration in the degree of compliance with policies or procedures.
|
ITEM 9B.
|
OTHER INFORMATION
|
None.
110
|
ITEM 10.
|
DIRECTORS, EXECUTIVE OFFICERS AND CORPORATE GOVERNANCE
|
The information in our
2014
Proxy Statement regarding directors and executive officers appearing under the headings “Proposal 1: Election of Directors” and “Other Matters—Section 16(a) Beneficial Ownership Reporting Compliance” is incorporated by reference in this section. The information under the heading “Executive Officers of the Registrant” in Part I, Item 1 of this Form 10-K is also incorporated by reference in this section. In addition, the information under the heading “Corporate Governance” in our
2014
Proxy Statement is incorporated by reference in this section.
The Intel Code of Conduct (the Code) is our code of ethics document applicable to all employees, including all officers, and including our independent directors, who are not employees of the company, with regard to their Intel-related activities. The Code incorporates our guidelines designed to deter wrongdoing and to promote honest and ethical conduct and compliance with applicable laws and regulations. The Code also incorporates our expectations of our employees that enable us to provide accurate and timely disclosure in our filings with the SEC and other public communications. In addition, the Code incorporates guidelines pertaining to topics such as complying with applicable laws, rules, and regulations; reporting Code violations; and maintaining accountability for adherence to the Code.
The full text of our Code is published on our Investor Relations web site at
www.intc.com
. We intend to disclose future amendments to certain provisions of our Code, or waivers of such provisions granted to executive officers and directors, on the web site within four business days following the date of such amendment or waiver.
|
ITEM 11.
|
EXECUTIVE COMPENSATION
|
The information appearing in our
2014
Proxy Statement under the headings “Director Compensation,” “Compensation Discussion and Analysis,” “Report of the Compensation Committee,” and “Executive Compensation” is incorporated by reference in this section.
111
|
ITEM 12.
|
SECURITY OWNERSHIP OF CERTAIN BENEFICIAL OWNERS AND MANAGEMENT AND RELATED STOCKHOLDER MATTERS
|
The information appearing in our 2014 Proxy Statement under the heading “Security Ownership of Certain Beneficial Owners and Management” is incorporated by reference in this section.
Equity Compensation Plan Information
Information as of
December 28, 2013
, regarding equity compensation plans approved and not approved by stockholders is summarized in the following table (shares in millions):
|
Plan Category
|
(A)
Number of Shares to Be Issued Upon Exercise of Outstanding Options and Rights
|
(B)
Weighted Average Exercise Price of Outstanding Options ($)¹
|
(C)
Number of Shares Remaining Available for Future Issuance Under Equity Incentive Plans
(Excluding Shares Reflected in Column A)
|
|||||||||
|
2006 Equity Incentive Plan
|
301.0
|
|
3
|
|||||||||
|
2006 Stock Purchase Plan
|
216.5
|
|
||||||||||
|
Equity incentive plans approved by stockholders
|
257.9
|
|
2
|
$
|
20.86
|
|
517.5
|
|
||||
|
Equity incentive plans not approved by stockholders
|
11.8
|
|
4
|
$
|
24.02
|
|
—
|
|
||||
|
Total
|
269.7
|
|
5
|
$
|
21.10
|
|
517.5
|
|
||||
|
1
|
The weighted average exercise price does not take into account the shares issuable upon outstanding RSUs vesting, which have no exercise price.
|
|
2
|
Includes
116.7 million
shares granted under the 2006 Equity Incentive Plan that are issuable upon RSUs vesting, including a maximum of
6.9 million
shares that could be issued at the end of the requisite period for outstanding OSUs. The remaining balance consists of outstanding stock option grants.
|
|
3
|
If it is assumed that shares will be issued at the target vesting amount for outstanding OSUs, an additional
3.4 million
shares would be included in the shares available for future issuance amount for a total of
304.4 million
shares, of which
231.2 million
shares can be issued as RSUs or restricted stock. A maximum of
517 million
shares could be granted as restricted stock or RSUs under the 2006 Equity Incentive Plan.
|
|
4
|
Includes shares available upon exercise of stock options granted under our 1997 Stock Option Plan, which was not required to be approved by stockholders. The 1997 Stock Option Plan was terminated as to future grants in May 2004. In addition, this includes
3.1 million
shares issuable under outstanding options, with a weighted average exercise price of
$15.65
, assumed in connection with acquisitions.
|
|
5
|
Assumes shares will be issued at the maximum vesting amount for outstanding OSUs. This number reflects a difference from the number of restricted stock units reported in "
|
The 1997 Stock Option Plan (1997 Plan) provided for the grant of stock options to employees other than officers and directors. The 1997 Plan, which was not approved by stockholders, was terminated as to future grants in May 2004. The 1997 Plan is administered by the Board’s Compensation Committee, which has the power to determine matters related to outstanding stock option awards under the 1997 Plan, including conditions of vesting and exercise. Stock options granted under the 1997 Plan expire no later than 10 years from the grant date. Stock options granted under the 1997 Plan generally vested in increments over four or five years from the date of grant. Grants to key employees may have contained delayed vesting provisions, generally beginning six years from the date of grant.
112
|
ITEM 13.
|
CERTAIN RELATIONSHIPS AND RELATED TRANSACTIONS, AND DIRECTOR INDEPENDENCE
|
The information appearing in our
2014
Proxy Statement under the headings “Corporate Governance” and “Certain Relationships and Related Transactions” is incorporated by reference in this section.
|
ITEM 14.
|
PRINCIPAL ACCOUNTING FEES AND SERVICES
|
The information appearing in our
2014
Proxy Statement under the headings “Report of the Audit Committee” and “Proposal 2: Ratification of Selection of Independent Registered Public Accounting Firm” is incorporated by reference in this section.
113
|
ITEM 15.
|
EXHIBITS, FINANCIAL STATEMENT SCHEDULES
|
|
1.
|
Financial Statements: See “Index to Consolidated Financial Statements” in Part II, Item 8 of this Form 10-K.
|
|
2.
|
Financial Statement Schedule: See “Schedule II—Valuation and Qualifying Accounts” in this section of this Form 10-K.
|
|
3.
|
Exhibits: The exhibits listed in the accompanying index to exhibits are filed, furnished, or incorporated by reference as part of this Form 10-K.
|
Certain of the agreements filed as exhibits to this Form 10-K contain representations and warranties by the parties to the agreements that have been made solely for the benefit of the parties to the agreement. These representations and warranties:
|
•
|
may have been qualified by disclosures that were made to the other parties in connection with the negotiation of the agreements, which disclosures are not necessarily reflected in the agreements;
|
|
•
|
may apply standards of materiality that differ from those of a reasonable investor; and
|
|
•
|
were made only as of specified dates contained in the agreements and are subject to subsequent developments and changed circumstances.
|
Accordingly, these representations and warranties may not describe the actual state of affairs as of the date that these representations and warranties were made or at any other time. Investors should not rely on them as statements of fact.
Intel, the Intel logo, Intel Core, Intel Atom, Intel Inside, the Intel Inside logo, Iris, Intel vPro, Intel Xeon, Intel Xeon Phi, Itanium, Pentium, and Ultrabook are trademarks of Intel Corporation in the U.S. and/or other countries.
* Other names and brands may be claimed as the property of others.
The Bluetooth® word mark is a registered trademark owned by Bluetooth SIG, Inc. and any use of such marks by Intel Corporation is under license.
114
INTEL CORPORATION
SCHEDULE II—VALUATION AND QUALIFYING ACCOUNTS
|
Three Years Ended December 28, 2013
(In Millions)
|
Balance at Beginning of Year
|
Additions Charged to Expenses/
Other Accounts
|
Net
(Deductions)
Recoveries
|
Balance at
End of Year
|
||||||||||||
|
Allowance for doubtful receivables
|
||||||||||||||||
|
2013
|
$
|
38
|
|
$
|
5
|
|
$
|
(5
|
)
|
$
|
38
|
|
||||
|
2012
|
$
|
36
|
|
$
|
3
|
|
$
|
(1
|
)
|
$
|
38
|
|
||||
|
2011
|
$
|
28
|
|
$
|
8
|
|
$
|
—
|
|
$
|
36
|
|
||||
|
Valuation allowance for deferred tax assets
|
||||||||||||||||
|
2013
|
$
|
389
|
|
$
|
88
|
|
$
|
(21
|
)
|
$
|
456
|
|
||||
|
2012
|
$
|
373
|
|
$
|
77
|
|
$
|
(61
|
)
|
$
|
389
|
|
||||
|
2011
|
$
|
252
|
|
$
|
121
|
|
$
|
—
|
|
$
|
373
|
|
||||
Deductions in allowance for doubtful receivables represent uncollectible accounts written off, net of recoveries.
115
|
Exhibit
Number
|
Incorporated by Reference
|
Filed or
Furnished
Herewith
|
|||||||||||
|
Exhibit Description
|
Form
|
File Number
|
Exhibit
|
Filing
Date
|
|||||||||
|
3.1
|
Intel Corporation Third Restated Certificate of Incorporation of Intel Corporation dated May 17, 2006
|
8-K
|
000-06217
|
3.1
|
|
5/22/2006
|
|||||||
|
3.2
|
Intel Corporation Bylaws, as amended and restated on July 26, 2011
|
8-K
|
000-06217
|
3.1
|
|
7/27/2011
|
|||||||
|
4.2.1
|
Indenture for the Registrant’s 2.95% Junior Subordinated Convertible Debentures due 2035 between Intel Corporation and Wells Fargo Bank, National Association (as successor to Citibank N.A.), dated as of December 16, 2005 (the “Convertible Note Indenture”)
|
10-K
|
000-06217
|
4.2
|
|
2/27/2006
|
|||||||
|
4.2.2
|
Indenture dated as of March 29, 2006 between Intel Corporation and Wells Fargo Bank, National Association (as successor to Citibank N.A.) (the “Open-Ended Indenture”)
|
S-3ASR
|
333-132865
|
4.4
|
|
3/30/2006
|
|||||||
|
4.2.3
|
First Supplemental Indenture to Convertible Note Indenture, dated as of July 25, 2007
|
10-K
|
000-06217
|
4.2.3
|
|
2/20/2008
|
|||||||
|
4.2.4
|
First Supplemental Indenture to Open-Ended Indenture, dated as of December 3, 2007
|
10-K
|
000-06217
|
4.2.4
|
|
2/20/2008
|
|||||||
|
4.2.5
|
Indenture for the Registrant’s 3.25% Junior Subordinated Convertible Debentures due 2039 between Intel Corporation and Wells Fargo Bank, National Association, dated as of July 27, 2009
|
10-Q
|
000-06217
|
4.1
|
|
11/2/2009
|
|||||||
|
4.2.6
|
Second Supplemental Indenture to Open-Ended Indenture for the Registrant’s 1.95% Senior Notes due 2016, 3.30% Senior Notes due 2021, and 4.80% Senior Notes due 2041, dated as of September 19, 2011
|
8-K
|
000-06217
|
4.01
|
|
9/19/2011
|
|||||||
|
4.2.7
|
Third Supplemental Indenture to Open-Ended Indenture for the Registrant’s 1.35% Senior Notes due 2017, 2.70% Senior Notes due 2022, 4.00% Senior Notes due 2032 and 4.25% Senior Notes due 2042, dated as of December 11, 2012
|
8-K
|
000-06217
|
4.01
|
|
12/11/2012
|
|||||||
|
4.2.8
|
Fourth Supplemental Indenture to Open-Ended Indenture for the Registrant’s 4.25% Senior Notes due 2042, dated as of December 14, 2012
|
8-K
|
000-06217
|
4.01
|
|
12/14/2012
|
|||||||
|
10.1**
|
Intel Corporation 1984 Stock Option Plan, as amended and restated effective July 16, 1997
|
10-Q
|
333-45395
|
10.1
|
|
8/11/1998
|
|||||||
|
10.1.2
|
Intel Corporation 1997 Stock Option Plan, as amended and restated effective July 16, 1997
|
10-K
|
000-06217
|
10.7
|
|
3/11/2003
|
|||||||
|
10.2**
|
Intel Corporation 2004 Equity Incentive Plan, effective May 19, 2004
|
10-Q
|
000-06217
|
10.3
|
|
8/2/2004
|
|||||||
|
10.2.1**
|
Form of Notice of Grant of Non-Qualified Stock Option under the Intel Corporation 2004 Equity Incentive Plan
|
10-Q
|
000-06217
|
10.7
|
|
8/2/2004
|
|||||||
|
10.2.2**
|
Standard Terms and Conditions Relating to Non-Qualified Stock Options granted to U.S. employees on and after May 19, 2004 under the Intel Corporation 2004 Equity Incentive Plan
|
10-Q
|
000-06217
|
10.5
|
|
8/2/2004
|
|||||||
|
10.2.3**
|
Standard International Non-Qualified Stock Option Agreement under the Intel Corporation 2004 Equity Incentive Plan
|
10-Q
|
000-06217
|
10.6
|
|
8/2/2004
|
|||||||
|
10.2.4**
|
Intel Corporation Non-Employee Director Non-Qualified Stock Option Agreement under the Intel Corporation 2004 Equity Incentive Plan
|
10-Q
|
000-06217
|
10.4
|
|
8/2/2004
|
|||||||
|
10.2.5**
|
Form of ELTSOP Non-Qualified Stock Option Agreement under the Intel Corporation 2004 Equity Incentive Plan
|
8-K
|
000-06217
|
10.1
|
|
10/12/2004
|
|||||||
|
10.2.6**
|
Intel Corporation 2004 Equity Incentive Plan, as amended and restated, effective May 18, 2005
|
8-K
|
000-06217
|
10.1
|
|
5/20/2005
|
|||||||
|
10.2.7**
|
Form of Notice of Grant of Restricted Stock Units
|
8-K
|
000-06217
|
10.5
|
|
2/9/2006
|
|||||||
116
|
Exhibit
Number
|
Incorporated by Reference
|
Filed or
Furnished
Herewith
|
|||||||||||
|
Exhibit Description
|
Form
|
File Number
|
Exhibit
|
Filing
Date
|
|||||||||
|
10.2.8**
|
Intel Corporation Nonqualified Stock Option Agreement under the 2004 Equity Incentive Plan
|
10-K
|
000-06217
|
10.16
|
|
2/27/2006
|
|||||||
|
10.2.9**
|
Intel Corporation 2004 Equity Incentive Plan Standard Terms and Conditions relating to Non-Qualified Stock Options granted on and after February 1, 2006 under the Intel Corporation 2004 Equity Incentive Plan (other than grants made under the SOP Plus or ELTSOP programs)
|
10-Q
|
000-06217
|
10.6
|
|
5/8/2006
|
|||||||
|
10.2.10**
|
Intel Corporation 2004 Equity Incentive Plan Terms and Conditions relating to Nonqualified Stock Options granted on and after February 1, 2006 under the Intel Corporation 2004 Equity Incentive Plan for grants formerly known as ELTSOP Grants
|
10-Q
|
000-06217
|
10.13
|
|
5/8/2006
|
|||||||
|
10.2.11**
|
Intel Corporation International Nonqualified Stock Option Agreement under the 2004 Equity Incentive Plan (for grants after February 1, 2006 under the ELTSOP Program)
|
10-Q
|
000-06217
|
10.15
|
|
5/8/2006
|
|||||||
|
10.3**
|
Amendment to all Grant Agreements of Restricted Stock Units and Stock Options granted under the Intel Corporation 2006 Equity Incentive Plan, Intel Corporation 2004 Equity Incentive Plan and 1997 Stock Option Plan and are outstanding as of January 15, 2008
|
10-Q
|
000-06217
|
10.5
|
|
5/2/2008
|
|||||||
|
10.4**
|
Intel Corporation 2006 Equity Incentive Plan, as amended and restated, effective May 17, 2006
|
8-K
|
000-06217
|
10.1
|
|
5/22/2006
|
|||||||
|
10.4.1**
|
Intel Corporation Restricted Stock Unit Agreement under the 2006 Equity Incentive Plan (for RSUs granted after April 1, 2006 and before May 18, 2006 under the standard RSU program)
|
8-K
|
000-06217
|
10.2
|
|
7/6/2006
|
|||||||
|
10.4.2**
|
Intel Corporation 2006 Equity Incentive Plan Terms and Conditions relating to Restricted Stock Units granted on and after May 17, 2006 and before January 19, 2008 under the Intel Corporation 2006 Equity Incentive Plan (for RSUs granted under the ELTSOP RSU Program)
|
8-K
|
000-06217
|
10.7
|
|
7/6/2006
|
|||||||
|
10.4.3**
|
Intel Corporation Restricted Stock Unit Agreement under the 2006 Equity Incentive Plan (for RSUs granted after May 17, 2006 and before January 19, 2008 under the ELTSOP program)
|
8-K
|
000-06217
|
10.8
|
|
7/6/2006
|
|||||||
|
10.4.4**
|
Form of Notice of Grant—Restricted Stock Units
|
8-K
|
000-06217
|
10.13
|
|
7/6/2006
|
|||||||
|
10.4.5**
|
Intel Corporation 2006 Equity Incentive Plan Standard Terms and Conditions relating to Non-Qualified Stock Options granted on and after May 17, 2006 and before January 19, 2008 under the Intel Corporation 2006 Equity Incentive Plan (standard option program)
|
8-K
|
000-06217
|
10.14
|
|
7/6/2006
|
|||||||
|
10.4.6**
|
Intel Corporation Nonqualified Stock Option Agreement under the 2006 Equity Incentive Plan (for options granted after May 17, 2006 and before January 19, 2008 under the standard program)
|
8-K
|
000-06217
|
10.15
|
|
7/6/2006
|
|||||||
|
10.4.7**
|
Intel Corporation 2006 Equity Incentive Plan Terms and Conditions relating to Nonqualified Stock Options granted on and after May 17, 2006 and before January 19, 2008 under the Intel Corporation 2006 Equity Incentive Plan (for options granted under the ELTSOP option program)
|
8-K
|
000-06217
|
10.19
|
|
7/6/2006
|
|||||||
|
10.4.8**
|
Form of Notice of Grant—Nonqualified Stock Options
|
8-K
|
000-06217
|
10.24
|
|
7/6/2006
|
|||||||
|
10.4.9**
|
Intel Corporation 2006 Equity Incentive Plan Terms and Conditions Relating to Non-Qualified Stock Options granted to Paul Otellini on January 18, 2007 under the Intel Corporation 2006 Equity Incentive Plan
|
10-K
|
000-06217
|
10.42
|
|
2/26/2007
|
|||||||
117
|
Exhibit
Number
|
Incorporated by Reference
|
Filed or
Furnished
Herewith
|
|||||||||||
|
Exhibit Description
|
Form
|
File Number
|
Exhibit
|
Filing
Date
|
|||||||||
|
10.4.10**
|
Intel Corporation 2006 Equity Incentive Plan, as amended and restated, effective May 16, 2007
|
8-K
|
000-06217
|
10.1
|
|
5/16/2007
|
|||||||
|
10.4.11**
|
Intel Corporation 2006 Equity Incentive Plan Terms and Conditions Relating to Restricted Stock Units Granted to Paul S. Otellini on April 17, 2008 under the Intel Corporation 2006 Equity Incentive Plan (under the ELTSOP RSU Program)
|
8-K
|
000-06217
|
99.1
|
|
4/17/2008
|
|||||||
|
10.4.12**
|
Intel Corporation 2006 Equity Incentive Plan Standard Terms and Conditions relating to Restricted Stock Units granted on and after March 27, 2009 and before January 22, 2010 under the Intel Corporation 2006 Equity Incentive Plan (standard OSU program)
|
10-Q
|
000-06217
|
10.1
|
|
4/30/2009
|
|||||||
|
10.4.13**
|
Intel Corporation Restricted Stock Unit Agreement under the 2006 Equity Incentive Plan (for RSUs granted after March 27, 2009 and before January 22, 2010 under the standard OSU program)
|
10-Q
|
000-06217
|
10.2
|
|
4/30/2009
|
|||||||
|
10.4.14**
|
Form of Terms and Conditions Relating to Nonqualified Options Granted to Paul Otellini under the Intel Corporation 2006 Equity Incentive Plan
|
10-Q
|
000-06217
|
10.3
|
|
4/30/2009
|
|||||||
|
10.4.15**
|
Intel Corporation 2006 Equity Incentive Plan, as amended and restated, effective May 20, 2009
|
8-K
|
000-06217
|
10.1
|
|
5/22/2009
|
|||||||
|
10.4.16**
|
Intel Corporation Non-Employee Director Restricted Stock Unit Agreement under the 2006 Equity Incentive Plan (for RSUs granted after January 17, 2008)
|
10-Q
|
000-06217
|
10.1
|
|
8/3/2009
|
|||||||
|
10.4.17**
|
Intel Corporation Non-Employee Director Restricted Stock Unit Agreement under the 2006 Equity Incentive Plan (for RSUs granted after March 27, 2009 and before January 22, 2010 under the OSU program)
|
10-Q
|
000-06217
|
10.2
|
|
8/3/2009
|
|||||||
|
10.4.18**
|
Form of Notice of Grant - Restricted Stock Units
|
10-Q
|
000-06217
|
10.3
|
|
8/3/2009
|
|||||||
|
10.4.19**
|
Intel Corporation 2006 Equity Incentive Plan Standard Terms and Conditions relating to Non-Qualified Stock Options granted to A. Douglas Melamed on January 22, 2010 under the Intel Corporation 2006 Equity Incentive Plan (standard option program)
|
10-K
|
000-06217
|
10.5
|
|
2/22/2010
|
|||||||
|
10.4.20**
|
Standard Terms and Conditions relating to Restricted Stock Units granted on and after January 22, 2010 and before January 20, 2011 under the Intel Corporation Equity Incentive Plan (standard OSU program)
|
10-K
|
000-06217
|
10.48
|
|
2/22/2010
|
|||||||
|
10.4.21**
|
Intel Corporation Restricted Stock Unit Agreement under the Intel Corporation 2006 Equity Incentive Plan (for RSUs granted after January 22, 2010 and before January 20, 2011 under the standard OSU program)
|
10-K
|
000-06217
|
10.49
|
|
2/22/2010
|
|||||||
|
10.4.22**
|
Intel Corporation Non-Employee Director Restricted Stock Unit Agreement under the 2006 Equity Incentive Plan (for RSUs granted after July 1, 2010 and before January 20, 2011 under the OSU program)
|
10-Q
|
000-06217
|
10.1
|
|
7/30/2010
|
|||||||
|
10.4.23**
|
Intel Corporation Restricted Stock Unit Agreement under the 2006 Equity Incentive Plan (for RSUs granted after January 20, 2011 under the standard Management Committee Member-Restricted Stock Unit program)
|
8-K
|
000-06217
|
99.1
|
|
1/26/2011
|
|||||||
|
10.4.24**
|
Intel Corporation Restricted Stock Unit Agreement under the 2006 Equity Incentive Plan (for RSUs granted on and after January 20, 2011 and before January 24, 2012 under the standard OSU program)
|
8-K
|
000-06217
|
99.2
|
|
1/26/2011
|
|||||||
118
|
Exhibit
Number
|
Incorporated by Reference
|
Filed or
Furnished
Herewith
|
|||||||||||
|
Exhibit Description
|
Form
|
File Number
|
Exhibit
|
Filing
Date
|
|||||||||
|
10.4.25**
|
Intel Corporation 2006 Equity Incentive Plan Standard Terms and Conditions Relating to Restricted Stock Units Granted on and after January 20, 2011 and before January 24, 2012 under the Intel Corporation 2006 Equity Incentive Plan (standard OSU program)
|
8-K
|
000-06217
|
99.3
|
|
1/26/2011
|
|||||||
|
10.4.26**
|
Intel Corporation 2006 Equity Incentive Plan Standard Terms and Conditions Relating to Restricted Stock Units Granted on and after January 20, 2011 under the Intel Corporation 2006 Equity Incentive Plan (standard Management Committee Member -Restricted Stock Unit program)
|
8-K
|
000-06217
|
99.4
|
|
1/26/2011
|
|||||||
|
10.4.27**
|
Intel Corporation 2006 Equity Incentive Plan, as amended and restated, effective May 19, 2011
|
S-8
|
333-175123
|
99.1
|
|
6/24/2011
|
|||||||
|
10.4.28**
|
Intel Corporation Restricted Stock Unit Agreement under the 2006 Equity Incentive Plan (for RSUs granted on or after January 24, 2012 with Year 2 to Year 5 Vesting)
|
10-K
|
000-06217
|
10.56
|
|
2/23/2012
|
|||||||
|
10.4.29**
|
Intel Corporation 2006 Equity Incentive Plan Standard Terms and Conditions Relating to Restricted Stock Units Granted on and after January 24, 2012 under the Intel Corporation 2006 Equity Incentive Plan (with Year 2 to 5 Vesting)
|
10-K
|
000-06217
|
10.57
|
|
2/23/2012
|
|||||||
|
10.4.30**
|
Terms and Conditions of Success Equity Award (CEO performance based RSUs)
|
10-Q
|
000-06217
|
10.1
|
|
5/4/2012
|
|||||||
|
10.5**
|
Intel Corporation 2006 Equity Incentive Plan Terms and Conditions Relating to Non-Qualified Stock Options Granted on April 17, 2008 under the Intel Corporation 2006 Equity Incentive Plan
|
10-Q
|
000-06217
|
10.3
|
|
5/2/2008
|
|||||||
|
10.6**
|
Amendment to All Grant Agreements of Restricted Stock Units and Stock Options granted under the Intel Corporation 2006 Equity Incentive Plan (elimination of leave of absence provisions and the addition of the ability to change the grant agreement as laws change)
|
10-Q
|
000-06217
|
10.6
|
|
5/2/2008
|
|||||||
|
10.7**
|
Amendment to the Restricted Stock Unit Agreement under the 2006 Equity Incentive Plan (for RSUs granted on or after January 24, 2012 with Year 2 to Year 5 Vesting) and the Standard Terms and Conditions Relating to Restricted Stock Units Granted on and after January 24, 2012 under the Intel Corporation 2006 Equity Incentive Plan (with Year 2 to 5 Vesting)
|
10-Q
|
000-06217
|
10.1
|
|
4/29/2013
|
|||||||
|
10.8**
|
Intel Corporation 2006 Equity Incentive Plan, as amended and restated, effective May 16, 2013
|
10-Q
|
000-06217
|
10.1
|
|
7/29/2013
|
|||||||
|
10.9**
|
Intel Corporation 2007 Executive Officer Incentive Plan, effective as of January 1, 2007
|
8-K
|
000-06217
|
10.2
|
|
5/16/2007
|
|||||||
|
10.9.1**
|
Amendment to the Intel Corporation 2007 Executive Officer Incentive Plan, effective as of January 1, 2012
|
10-K
|
000-06217
|
10.31
|
|
2/23/2012
|
|||||||
|
10.9.2**
|
Intel Corporation 2014 Annual Performance Bonus Plan (amended and restated, effective January 1, 2014)
|
X
|
|||||||||||
|
10.10**
|
Intel Corporation Deferral Plan for Outside Directors, effective July 1, 1998
|
10-K
|
333-45395
|
10.6
|
|
3/26/1999
|
|||||||
|
10.11**
|
Form of Indemnification Agreement with Directors and Executive Officers
|
10-K
|
000-06217
|
10.15
|
|
2/22/2005
|
|||||||
|
10.12**
|
Listed Officer Compensation
|
10-Q
|
000-06217
|
10.1
|
|
5/3/2007
|
|||||||
|
10.13**
|
Intel Corporation Sheltered Employee Retirement Plan Plus, as amended and restated, effective January 1, 2009
|
S-8
|
333-172024
|
99.1
|
|
2/2/2011
|
|||||||
|
10.14**
|
Intel Corporation 2006 Stock Purchase Plan, approved May 17, 2006 and effective July 31, 2006
|
S-8
|
333-135178
|
99.1
|
|
6/21/2006
|
|||||||
119
|
Exhibit
Number
|
Incorporated by Reference
|
Filed or
Furnished
Herewith
|
|||||||||||
|
Exhibit Description
|
Form
|
File Number
|
Exhibit
|
Filing
Date
|
|||||||||
|
10.14.1**
|
Amendment to the Intel Corporation 2006 Stock Purchase Plan, effective February 20, 2009
|
10-K
|
000-06217
|
10.45
|
|
2/23/2009
|
|||||||
|
10.14.2**
|
Intel Corporation 2006 Stock Purchase Plan, as amended and restated, approved May 19, 2011, effective July 31, 2006
|
S-8
|
333-175123
|
99.2
|
|
6/24/2011
|
|||||||
|
10.14.3**
|
Intel Corporation 2006 Stock Purchase Plan, as amended and restated, approved July 19, 2011, effective July 31, 2006
|
10-Q
|
000-06217
|
10.3
|
|
8/8/2011
|
|||||||
|
10.15**
|
Summary of Intel Corporation Non-Employee Director Compensation
|
8-K
|
000-06217
|
10.1
|
|
7/14/2006
|
|||||||
|
10.16**
|
Intel Corporation 2006 Deferral Plan for Outside Directors, effective November 15, 2006
|
10-K
|
000-06217
|
10.41
|
|
2/26/2007
|
|||||||
|
10.17
|
Settlement Agreement Between Advanced Micro Devices, Inc. and Intel Corporation, dated November 11, 2009
|
8-K
|
000-06217
|
10.1
|
|
11/12/2009
|
|||||||
|
10.18
|
Agreement and Plan of Merger Among Intel Corporation, Jefferson Acquisition Corporation and McAfee, Inc. dated August 18, 2010
|
8-K
|
000-06217
|
2.1
|
|
8/19/2010
|
|||||||
|
10.19
|
Patent Cross License Agreement between NVIDIA Corporation and Intel Corporation, dated January 10, 2011. Portions of this exhibit have been omitted pursuant to a request for confidential treatment.
|
8-K
|
000-06217
|
10.1
|
|
1/10/2011
|
|||||||
|
10.20**
|
Offer Letter from Intel Corporation to A. Douglas Melamed dated November 10, 2009
|
10-Q
|
000-06217
|
10.1
|
|
5/9/2011
|
|||||||
|
10.21**
|
Offer letter from Intel Corporation to Paul S. Otellini effective May 17, 2013
|
10-Q
|
000-06217
|
10.2
|
|
7/29/2013
|
|||||||
|
12.1
|
Statement Setting Forth the Computation of Ratios of Earnings to Fixed Charges
|
X
|
|||||||||||
|
21.1
|
Intel Corporation Subsidiaries
|
X
|
|||||||||||
|
23.1
|
Consent of Ernst & Young LLP, Independent Registered Public Accounting Firm
|
X
|
|||||||||||
|
31.1
|
Certification of Chief Executive Officer pursuant to Rule 13a-14(a) of the Securities Exchange Act of 1934, as amended (the Exchange Act)
|
X
|
|||||||||||
|
31.2
|
Certification of Chief Financial Officer and Principal Accounting Officer pursuant to Rule 13a-14(a) of the Exchange Act
|
X
|
|||||||||||
|
32.1
|
Certification of the Chief Executive Officer and the Chief Financial Officer and Principal Accounting Officer pursuant to Rule 13a-14(b) of the Exchange Act and 18 U.S.C. Section 1350, as adopted pursuant to Section 906 of the Sarbanes-Oxley Act of 2002
|
X
|
|||||||||||
|
101.INS
|
XBRL Instance Document
|
X
|
|||||||||||
|
101.SCH
|
XBRL Taxonomy Extension Schema Document
|
X
|
|||||||||||
|
101.CAL
|
XBRL Taxonomy Extension Calculation Linkbase Document
|
X
|
|||||||||||
|
101.DEF
|
XBRL Taxonomy Extension Definition Linkbase Document
|
X
|
|||||||||||
|
101.LAB
|
XBRL Taxonomy Extension Label Linkbase Document
|
X
|
|||||||||||
|
101.PRE
|
XBRL Taxonomy Extension Presentation Linkbase Document
|
X
|
|||||||||||
|
**
|
Management contracts or compensation plans or arrangements in which directors or executive officers are eligible to participate.
|
120
SIGNATURES
Pursuant to the requirements of Section 13 or 15(d) of the Securities Exchange Act of 1934, the Registrant has duly caused this report to be signed on its behalf by the undersigned, thereunto duly authorized.
|
INTEL CORPORATION
Registrant
|
|||
|
By:
|
/
S
/ S
TACY
J. S
MITH
|
||
|
Stacy J. Smith
|
|||
|
Executive Vice President, Chief Financial Officer, and Principal Accounting Officer
|
|||
|
February 14, 2014
|
|||
Pursuant to the requirements of the Securities Exchange Act of 1934, this report has been signed below by the following persons on behalf of the Registrant and in the capacities and on the dates indicated.
|
/
S
/ C
HARLENE
B
ARSHEFSKY
|
/
S
/ J
AMES
D. P
LUMMER
|
|||
|
Charlene Barshefsky
|
James D. Plummer
|
|||
|
Director
|
Director
|
|||
|
February 14, 2014
|
February 14, 2014
|
|||
|
/
S
/ A
NDY
D. B
RYANT
|
/
S
/ D
AVID
S. P
OTTRUCK
|
|||
|
Andy D. Bryant
|
David S. Pottruck
|
|||
|
Chairman of the Board and Director
|
Director
|
|||
|
February 14, 2014
|
February 14, 2014
|
|||
|
/
S
/ S
USAN
L. D
ECKER
|
/
S
/ S
TACY
J. S
MITH
|
|||
|
Susan L. Decker
|
Stacy J. Smith
|
|||
|
Director
|
Executive Vice President, Chief Financial Officer, and Principal Accounting Officer
|
|||
|
February 14, 2014
|
||||
|
February 14, 2014
|
||||
|
/
S
/ J
OHN
J. D
ONAHOE
|
/
S
/ F
RANK
D. Y
EARY
|
|||
|
John J. Donahoe
|
Frank D. Yeary
|
|||
|
Director
|
Director
|
|||
|
February 14, 2014
|
February 14, 2014
|
|||
|
/
S
/ R
EED
E. H
UNDT
|
/
S
/ D
AVID
B. Y
OFFIE
|
|||
|
Reed E. Hundt
|
David B. Yoffie
|
|||
|
Director
|
Director
|
|||
|
February 14, 2014
|
February 14, 2014
|
|||
|
/
S
/ B
RIAN
M. K
RZANICH
|
|
|||
|
Brian M. Krzanich
|
||||
|
Chief Executive Officer, Director
|
||||
|
Principal Executive Officer
|
||||
|
February 14, 2014
|
||||
121
TABLE OF CONTENTS
Part IItem 1. BusinessNote 27: Operating Segments and Geographic InformationNote 5: Cash and InvestmentsNote 26: ContingenciesItem 1A. Risk FactorsItem 1B. Unresolved Staff CommentsItem 2. PropertiesItem 3. Legal ProceedingsItem 4. Mine Safety DisclosuresPart IIItem 5. Market For Registrant S Common Equity, Related Stockholder Matters and Issuer Purchases Of Equity SecuritiesNote 20: Common Stock RepurchasesItem 6. Selected Financial DataNote 13: Restructuring and Asset Impairment ChargesNote 8: AcquisitionsItem 7. Management S Discussion and Analysis Of Financial Condition and Results Of OperationsNote 3: Accounting ChangesNote 11: Identified Intangible AssetsNote 16: BorrowingsNote 2: Accounting PoliciesItem 7A. Quantitative and Qualitative Disclosures About Market RiskNote 4: Fair ValueItem 8. Financial Statements and Supplementary DataNote 1: Basis Of PresentationNote 17: Retirement Benefit PlansNote 6: Derivative Financial InstrumentsNote 10: GoodwillNote 19: Employee Equity Incentive PlansNote 24: Income TaxesNote 25: Other Comprehensive Income (loss)Note 7: Concentrations Of Credit RiskNote 9: DivestituresNote 12: Other Long-term AssetsNote 14: Deferred IncomeNote 15: Chipset Design IssueNote 18: CommitmentsNote 21: Gains (losses) on Equity Investments, NetNote 22: Interest and Other, NetNote 23: Earnings Per ShareItem 9. Changes in and Disagreements with Accountants on Accounting and Financial DisclosureItem 9A. Controls and ProceduresItem 9B. Other InformationPart IIIItem 10. Directors, Executive Officers and Corporate GovernanceItem 11. Executive CompensationItem 12. Security Ownership Of Certain Beneficial Owners and Management and Related Stockholder MattersItem 13. Certain Relationships and Related Transactions, and Director IndependenceItem 14. Principal Accounting Fees and ServicesPart IVItem 15. Exhibits, Financial Statement Schedules