INTEL CORP
10-Ks and 10-Qs
|
|
|
|
|
|
|
|
|
|
|
|
|
|
|
|
|
|
|
|
|
|
|
|
|
|
|
|
|
|
|
|
|
|
|
|
|
|
|
|
|
|
|
|
|
|
|
|
|
|
|
|
|
UNITED STATES SECURITIES AND EXCHANGE COMMISSION
Washington, D.C. 20549
FORM 10-Q
(Mark One)
|
|
þ
|
QUARTERLY REPORT PURSUANT TO SECTION 13 OR 15(d) OF THE SECURITIES EXCHANGE ACT OF 1934
|
|
For the quarterly period ended September 30, 2017
|
||
Or
|
|
¨
|
TRANSITION REPORT PURSUANT TO SECTION 13 OR 15(d) OF THE SECURITIES EXCHANGE ACT OF 1934
|
|
For the transition period from
to
|
||
Commission File Number
000-06217
INTEL CORPORATION
(Exact name of registrant as specified in its charter)
|
Delaware
|
94-1672743
|
|
|
(State or other jurisdiction of incorporation or organization)
|
(I.R.S. Employer Identification No.)
|
|
|
2200 Mission College Boulevard, Santa Clara, California
|
95054-1549
|
|
|
(Address of principal executive offices)
|
(Zip Code)
|
|
(408) 765-8080
(Registrant’s telephone number, including area code)
N/A
(Former name, former address and former fiscal year, if changed since last report)
Indicate by check mark whether the registrant (1) has filed all reports required to be filed by Section 13 or 15(d) of the Securities Exchange Act of 1934 during the preceding 12 months (or for such shorter period that the registrant was required to file such reports), and (2) has been subject to such filing requirements for the past 90 days. Yes
þ
No
¨
Indicate by check mark whether the registrant has submitted electronically and posted on its corporate Web site, if any, every Interactive Data File required to be submitted and posted pursuant to Rule 405 of Regulation S-T (§232.405 of this chapter) during the preceding 12 months (or for such shorter period that the registrant was required to submit and post such files). Yes
þ
No
¨
Indicate by check mark whether the registrant is a large accelerated filer, an accelerated filer, a non-accelerated filer, a smaller reporting company, or an emerging growth company. See the definitions of “large accelerated filer,” “accelerated filer,” “smaller reporting company,” and "emerging growth company" in Rule 12b-2 of the Exchange Act.
|
Large accelerated filer
þ
|
Accelerated filer
¨
|
Non-accelerated filer
¨
|
Smaller reporting company
¨
|
Emerging growth company
¨
|
|
(Do not check if a smaller reporting company)
|
||||
If an emerging growth company, indicate by check mark if the registrant has elected not to use the extended transition period for complying with any new or revised financial accounting standards provided pursuant to Section 13(a) of the Exchange Act.
¨
Indicate by check mark whether the registrant is a shell company (as defined in Rule 12b-2 of the Exchange Act). Yes
¨
No
þ
Shares outstanding of the Registrant’s common stock
:
|
Class
|
Outstanding as of September 30, 2017
|
|
|
Common stock, $0.001 par value
|
4,680 million
|
|
INTEL CORPORATION
FORM 10-Q
FOR THE FISCAL QUARTER ENDED
SEPTEMBER 30, 2017
INDEX
|
|
Page
|
|
|
Item 1.
|
||
|
Item 2.
|
||
|
Item 3.
|
||
|
Item 4.
|
||
|
Item 1.
|
||
|
Item 1A.
|
||
|
Item 2.
|
||
|
Item 6.
|
||
Forward-Looking Statements
This Quarterly Report on Form 10-Q contains forward-looking statements that involve a number of risks and uncertainties. Words such as "anticipates," "expects," "intends," "goals," "plans," "believes," "seeks," "estimates," "continues," "may," "will," “would,” "should," “could,” and variations of such words and similar expressions are intended to identify such forward-looking statements. In addition, any statements that refer to projections of our future financial performance, our anticipated growth and trends in our businesses, uncertain events or assumptions, and other characterizations of future events or circumstances are forward-looking statements. Such statements are based on management's expectations as of the date of this filing and involve many risks and uncertainties that could cause our actual results to differ materially from those expressed or implied in our forward-looking statements. Such risks and uncertainties include those described throughout this report and our Annual Report on Form 10-K for the year ended December 31, 2016, particularly the "Risk Factors" sections of such reports. Given these risks and uncertainties, readers are cautioned not to place undue reliance on such forward-looking statements. Readers are urged to carefully review and consider the various disclosures made in this Form 10-Q and in other documents we file from time to time with the Securities and Exchange Commission that disclose risks and uncertainties that may affect our business. The forward-looking statements in this Form 10-Q do not reflect the potential impact of any divestitures, mergers, acquisitions, or other business combinations that had not been completed as of
October 26, 2017
. In addition, the forward-looking statements in this Form 10-Q are made as of the date of this filing, and Intel does not undertake, and expressly disclaims any duty, to update such statements, whether as a result of new information, new developments or otherwise, except to the extent that disclosure may be required by law.
1
|
ITEM 1.
|
FINANCIAL STATEMENTS
|
INTEL CORPORATION
|
|
Three Months Ended
|
Nine Months Ended
|
||||||||||||||
|
(In Millions, Except Per Share Amounts)
|
Sep 30,
2017 |
Oct 1,
2016 |
Sep 30,
2017 |
Oct 1,
2016 |
||||||||||||
|
Net revenue
|
$
|
16,149
|
|
$
|
15,778
|
|
$
|
45,708
|
|
$
|
43,013
|
|
||||
|
Cost of sales
|
6,092
|
|
5,795
|
|
17,406
|
|
16,927
|
|
||||||||
|
Gross margin
|
10,057
|
|
9,983
|
|
28,302
|
|
26,086
|
|
||||||||
|
Research and development
|
3,223
|
|
3,069
|
|
9,824
|
|
9,460
|
|
||||||||
|
Marketing, general and administrative
|
1,666
|
|
2,006
|
|
5,624
|
|
6,239
|
|
||||||||
|
Restructuring and other charges
|
4
|
|
372
|
|
189
|
|
1,786
|
|
||||||||
|
Amortization of acquisition-related intangibles
|
49
|
|
74
|
|
124
|
|
253
|
|
||||||||
|
Operating expenses
|
4,942
|
|
5,521
|
|
15,761
|
|
17,738
|
|
||||||||
|
Operating income
|
5,115
|
|
4,462
|
|
12,541
|
|
8,348
|
|
||||||||
|
Gains (losses) on equity investments, net
|
846
|
|
(12
|
)
|
1,440
|
|
488
|
|
||||||||
|
Interest and other, net
|
(31
|
)
|
(132
|
)
|
336
|
|
(340
|
)
|
||||||||
|
Income before taxes
|
5,930
|
|
4,318
|
|
14,317
|
|
8,496
|
|
||||||||
|
Provision for taxes
|
1,414
|
|
940
|
|
4,029
|
|
1,742
|
|
||||||||
|
Net income
|
$
|
4,516
|
|
$
|
3,378
|
|
$
|
10,288
|
|
$
|
6,754
|
|
||||
|
Basic earnings per share of common stock
|
$
|
0.96
|
|
$
|
0.71
|
|
$
|
2.19
|
|
$
|
1.43
|
|
||||
|
Diluted earnings per share of common stock
|
$
|
0.94
|
|
$
|
0.69
|
|
$
|
2.12
|
|
$
|
1.39
|
|
||||
|
Cash dividends declared per share of common stock
|
$
|
0.5450
|
|
$
|
0.5200
|
|
$
|
1.0775
|
|
$
|
1.0400
|
|
||||
|
Weighted average shares of common stock outstanding:
|
||||||||||||||||
|
Basic
|
4,688
|
|
4,734
|
|
4,707
|
|
4,728
|
|
||||||||
|
Diluted
|
4,821
|
|
4,877
|
|
4,849
|
|
4,872
|
|
||||||||
See accompanying notes.
2
INTEL CORPORATION
CONSOLIDATED CONDENSED STATEMENTS OF COMPREHENSIVE INCOME (Unaudited)
|
Three Months Ended
|
Nine Months Ended
|
|||||||||||||||
|
(In Millions)
|
Sep 30,
2017 |
Oct 1,
2016 |
Sep 30,
2017 |
Oct 1,
2016 |
||||||||||||
|
Net income
|
$
|
4,516
|
|
$
|
3,378
|
|
$
|
10,288
|
|
$
|
6,754
|
|
||||
|
Changes in other comprehensive income, net of tax:
|
||||||||||||||||
|
Net unrealized holding gains (losses) on available-for-sale investments
|
399
|
|
412
|
|
408
|
|
357
|
|
||||||||
|
Deferred tax asset valuation allowance
|
—
|
|
(2
|
)
|
—
|
|
(5
|
)
|
||||||||
|
Net unrealized holding gains (losses) on derivatives
|
19
|
|
61
|
|
350
|
|
274
|
|
||||||||
|
Net prior service (costs) credits
|
2
|
|
1
|
|
(8
|
)
|
4
|
|
||||||||
|
Actuarial valuation
|
11
|
|
10
|
|
241
|
|
(289
|
)
|
||||||||
|
Net foreign currency translation adjustment
|
5
|
|
(2
|
)
|
513
|
|
(1
|
)
|
||||||||
|
Other comprehensive income (loss)
|
436
|
|
480
|
|
1,504
|
|
340
|
|
||||||||
|
Total comprehensive income
|
$
|
4,952
|
|
$
|
3,858
|
|
$
|
11,792
|
|
$
|
7,094
|
|
||||
See accompanying notes.
3
INTEL CORPORATION
|
(In Millions)
|
Sep 30,
2017 |
Dec 31,
2016 |
||||||
|
Assets
|
||||||||
|
Current assets:
|
||||||||
|
Cash and cash equivalents
|
$
|
9,075
|
|
$
|
5,560
|
|
||
|
Short-term investments
|
1,446
|
|
3,225
|
|
||||
|
Trading assets
|
6,983
|
|
8,314
|
|
||||
|
Accounts receivable, net
|
5,954
|
|
4,690
|
|
||||
|
Inventories
|
6,929
|
|
5,553
|
|
||||
|
Assets held for sale
|
—
|
|
5,210
|
|
||||
|
Other current assets
|
2,767
|
|
2,956
|
|
||||
|
Total current assets
|
33,154
|
|
35,508
|
|
||||
|
Property, plant and equipment, net of accumulated depreciation of $58,048 ($53,934 as of December 31, 2016)
|
39,472
|
|
36,171
|
|
||||
|
Marketable equity securities
|
6,059
|
|
6,180
|
|
||||
|
Other long-term investments
|
3,844
|
|
4,716
|
|
||||
|
Goodwill
|
24,389
|
|
14,099
|
|
||||
|
Identified intangible assets, net
|
13,058
|
|
9,494
|
|
||||
|
Other long-term assets
|
7,112
|
|
7,159
|
|
||||
|
Total assets
|
$
|
127,088
|
|
$
|
113,327
|
|
||
|
Liabilities, temporary equity, and stockholders’ equity
|
||||||||
|
Current liabilities:
|
||||||||
|
Short-term debt
|
$
|
4,142
|
|
$
|
4,634
|
|
||
|
Accounts payable
|
3,554
|
|
2,475
|
|
||||
|
Accrued compensation and benefits
|
2,805
|
|
3,465
|
|
||||
|
Accrued advertising
|
892
|
|
810
|
|
||||
|
Deferred income
|
1,706
|
|
1,718
|
|
||||
|
Liabilities held for sale
|
—
|
|
1,920
|
|
||||
|
Other accrued liabilities
|
7,590
|
|
5,280
|
|
||||
|
Total current liabilities
|
|
20,689
|
|
20,302
|
|
|||
|
Long-term debt
|
27,498
|
|
20,649
|
|
||||
|
Long-term deferred tax liabilities
|
2,943
|
|
1,730
|
|
||||
|
Other long-term liabilities
|
4,152
|
|
3,538
|
|
||||
|
Contingencies (Note 18)
|
|
|
||||||
|
Temporary equity
|
870
|
|
882
|
|
||||
|
Stockholders’ equity:
|
||||||||
|
Preferred stock
|
—
|
|
—
|
|
||||
|
Common stock and capital in excess of par value, 4,680 issued and outstanding (4,730 issued and outstanding as of December 31, 2016)
|
26,547
|
|
25,373
|
|
||||
|
Accumulated other comprehensive income (loss)
|
1,610
|
|
106
|
|
||||
|
Retained earnings
|
42,779
|
|
40,747
|
|
||||
|
Total stockholders’ equity
|
70,936
|
|
66,226
|
|
||||
|
Total liabilities, temporary equity, and stockholders’ equity
|
$
|
127,088
|
|
$
|
113,327
|
|
||
See accompanying notes.
4
INTEL CORPORATION
|
|
Nine Months Ended
|
|||||||
|
(In Millions)
|
Sep 30,
2017 |
Oct 1,
2016 |
||||||
|
Cash and cash equivalents, beginning of period
|
$
|
5,560
|
|
$
|
15,308
|
|
||
|
Cash flows provided by (used for) operating activities:
|
||||||||
|
Net income
|
10,288
|
|
6,754
|
|
||||
|
Adjustments to reconcile net income to net cash provided by operating activities:
|
||||||||
|
Depreciation
|
4,990
|
|
4,684
|
|
||||
|
Share-based compensation
|
1,051
|
|
1,136
|
|
||||
|
Restructuring and other charges
|
189
|
|
1,786
|
|
||||
|
Amortization of intangibles
|
999
|
|
1,176
|
|
||||
|
(Gains) losses on equity investments, net
|
(1,372
|
)
|
(414
|
)
|
||||
|
(Gains) losses on divestitures
|
(387
|
)
|
—
|
|
||||
|
Deferred taxes
|
570
|
|
(188
|
)
|
||||
|
Changes in assets and liabilities:
1
|
||||||||
|
Accounts receivable
|
(1,128
|
)
|
(100
|
)
|
||||
|
Inventories
|
(1,245
|
)
|
(118
|
)
|
||||
|
Accounts payable
|
171
|
|
188
|
|
||||
|
Accrued compensation and benefits
|
(551
|
)
|
(1,874
|
)
|
||||
|
Income taxes payable and receivable
|
979
|
|
961
|
|
||||
|
Other assets and liabilities
|
315
|
|
(333
|
)
|
||||
|
Total adjustments
|
4,581
|
|
6,904
|
|
||||
|
Net cash provided by operating activities
|
14,869
|
|
13,658
|
|
||||
|
Cash flows provided by (used for) investing activities:
|
||||||||
|
Additions to property, plant and equipment
|
(7,709
|
)
|
(6,095
|
)
|
||||
|
Acquisitions, net of cash acquired
|
(14,499
|
)
|
(15,151
|
)
|
||||
|
Purchases of available-for-sale investments
|
(1,977
|
)
|
(7,962
|
)
|
||||
|
Sales of available-for-sale investments
|
4,610
|
|
3,793
|
|
||||
|
Maturities of available-for-sale investments
|
3,488
|
|
4,928
|
|
||||
|
Purchases of trading assets
|
(9,792
|
)
|
(9,953
|
)
|
||||
|
Maturities and sales of trading assets
|
11,806
|
|
7,867
|
|
||||
|
Investments in loans receivable and reverse repurchase agreements
|
—
|
|
(223
|
)
|
||||
|
Collection of loans receivable and reverse repurchase agreements
|
250
|
|
911
|
|
||||
|
Investments in non-marketable equity investments
|
(726
|
)
|
(893
|
)
|
||||
|
Proceeds from divestitures
|
3,124
|
|
—
|
|
||||
|
Other investing
|
893
|
|
405
|
|
||||
|
Net cash used for investing activities
|
(10,532
|
)
|
(22,373
|
)
|
||||
|
Cash flows provided by (used for) financing activities:
|
||||||||
|
Increase (decrease) in short-term debt, net
|
(5
|
)
|
426
|
|
||||
|
Issuance of long-term debt, net of issuance costs
|
7,716
|
|
2,734
|
|
||||
|
Repayment of debt
|
(1,502
|
)
|
—
|
|
||||
|
Proceeds from sales of common stock through employee equity incentive plans
|
637
|
|
1,024
|
|
||||
|
Repurchase of common stock
|
(3,611
|
)
|
(2,054
|
)
|
||||
|
Restricted stock unit withholdings
|
(424
|
)
|
(434
|
)
|
||||
|
Payment of dividends to stockholders
|
(3,794
|
)
|
(3,692
|
)
|
||||
|
Other financing
|
161
|
|
155
|
|
||||
|
Net cash provided by (used for) financing activities
|
(822
|
)
|
(1,841
|
)
|
||||
|
Net increase (decrease) in cash and cash equivalents
|
3,515
|
|
(10,556
|
)
|
||||
|
Cash and cash equivalents, end of period
|
$
|
9,075
|
|
$
|
4,752
|
|
||
|
Supplemental disclosures of noncash investing activities and cash flow information:
|
||||||||
|
Acquisition of property, plant, and equipment included in accounts payable and accrued liabilities
|
$
|
1,736
|
|
$
|
1,505
|
|
||
|
Non-marketable equity investment in McAfee from divestiture
|
$
|
1,078
|
|
$
|
—
|
|
||
|
Cash paid during the period for:
|
||||||||
|
Interest, net of capitalized interest and interest rate swap payments/receipts
|
$
|
386
|
|
$
|
472
|
|
||
|
Income taxes, net of refunds
|
$
|
2,328
|
|
$
|
843
|
|
||
|
1
|
The impact of assets and liabilities reclassified as held for sale was not considered in the changes in assets and liabilities within cash flows from operating activities. See "
Note 10: Acquisitions and Divestitures
" for additional information.
|
See accompanying notes.
5
INTEL CORPORATION
NOTES TO CONSOLIDATED CONDENSED FINANCIAL STATEMENTS — Unaudited
We prepared our interim consolidated condensed financial statements that accompany these notes in conformity with U.S. generally accepted accounting principles, consistent in all material respects with those applied in our Annual Report on Form 10-K for the fiscal year ended
December 31, 2016
(2016 Form 10-K).
We have a 52- or 53-week fiscal year that ends on the last Saturday in December. Our fiscal year 2017 is a 52-week year ending on December 30, 2017, while our fiscal year 2016 was a 53-week fiscal year that ended on December 31, 2016. The first quarter of fiscal year 2016 was a 14-week quarter compared to the standard 13-week quarters.
We have made estimates and judgments affecting the amounts reported in our consolidated condensed financial statements and the accompanying notes. The actual results that we experience may differ materially from our estimates. The interim financial information is unaudited, but reflects all normal adjustments that are, in our opinion, necessary to provide a fair statement of results for the interim periods presented. This report should be read in conjunction with the consolidated financial statements in our 2016 Form 10-K.
Advertising
Through cooperative advertising programs, such as our Intel Inside
®
program, we reimburse customers for marketing activities for certain of our products. We accrue cooperative advertising obligations and record the costs at the same time that the related revenue is recognized. We record cooperative advertising costs as marketing, general and administrative (MG&A) expenses to the extent that an advertising benefit separate from the revenue transaction can be identified and the fair value of that advertising benefit received is determinable. We record any excess in cash paid to customers over the fair value of the advertising benefit we receive as a reduction in revenue.
We are transitioning customers from the current offerings under the Intel Inside
®
program to cooperative advertising offerings more tailored to customers and their marketing audiences. In the second half of 2017, we are recording cooperative advertising costs as a reduction of revenue as we no longer meet the criteria for recording these expenses within MG&A.
We assess the adoption impacts of recently issued accounting standards by the Financial Accounting Standards Board on our financial statements. The tables below describe impacts from newly issued standards as well as material updates to our previous assessments, if any, from our 2016 Form 10-K.
Accounting Standards Adopted
|
Standard/Description
|
Effective Date and Adoption Considerations
|
Effect on Financial Statements or Other Significant Matters
|
|
Intangibles - Goodwill and Other - Simplifying the Test for Goodwill Impairment
. This accounting standard update eliminates Step 2 from the existing guidance to simplify how goodwill impairment tests are performed.
With the elimination of this step, a goodwill impairment test is performed by comparing the fair value of a reporting unit to its carrying value. An impairment charge is recognized for the amount by which the reporting unit's carrying value exceeds its fair value.
|
We elected to early adopt this accounting standard update in the second quarter of 2017 on a prospective basis.
|
We expect the adoption of this update to simplify our annual goodwill impairment testing process, by eliminating the need to estimate the implied fair value of a reporting unit’s goodwill, if its respective carrying value exceeds fair value.
|
6
INTEL CORPORATION
NOTES TO CONSOLIDATED CONDENSED FINANCIAL STATEMENTS — Unaudited (Continued)
Accounting Standards Not Yet Adopted
|
Standard/Description
|
Effective Date and Adoption Considerations
|
Effect on Financial Statements or Other Significant Matters
|
|
Financial Instruments - Recognition and Measurement.
Requires changes to the accounting for financial instruments that primarily affect equity securities, financial liabilities measured using the fair value option, and the presentation and disclosure requirements for such instruments.
|
Effective in the first quarter of 2018.
Changes to our marketable equity securities are required to be adopted using a modified-retrospective approach through a cumulative-effect adjustment to retained earnings as of the beginning of the fiscal year of adoption. A cumulative-effect adjustment equal to the balance of unrealized gains or losses in accumulated other comprehensive income (loss) for these securities as of December 31, 2017 will be recorded to retained earnings in the period of adoption. Due to fluctuations in our portfolio, the precise impact from adopting the standard will not be known until December 31, 2017.
Since management has elected to apply the measurement alternative to non-marketable equity securities, changes to these securities are adopted prospectively.
|
Marketable equity securities previously classified as available-for-sale equity investments will be measured and recorded at fair value with changes in fair value recorded through the income statement.
All non-marketable equity securities formerly classified as cost method investments will be measured and recorded using the measurement alternative upon adoption. Equity securities measured and recorded using the measurement alternative are recorded at cost minus impairment, if any, plus or minus changes resulting from observable price changes. Adjustments resulting from impairments and observable price changes will be recorded in the income statement.
Beginning in the first quarter of 2018, in accordance with the standard, fair value measurement and hierarchy disclosures will no longer be provided for equity securities measured using the measurement alternative. In addition, the existing impairment model will be replaced with a new one-step qualitative impairment model. No initial adoption adjustment will be recorded for these instruments since the standard is required to be applied prospectively for securities measured using the measurement alternative.
We are finalizing our impact assessment and changes to our accounting policies and financial statement disclosures.
|
|
Compensation - Retirement Benefits - Improving the Presentation of Net Periodic Pension Cost and Net Periodic Postretirement Benefit Cost.
This amended standard was issued to provide additional guidance on the presentation of net benefit cost in the income statement and on the components eligible for capitalization in assets. The service cost component of the net periodic benefit cost will continue to be reported within operating income on the consolidated income statement. All other non-service components are required to be presented separately outside operating income and only service costs will be eligible for inventory capitalization.
|
Effective in the first quarter of 2018.
Changes to the presentation of benefit costs are required to be adopted retrospectively while changes to the capitalization of service costs into inventories are required to be adopted prospectively. The standard permits, as a practical expedient, to use the amounts disclosed in the Retirement Benefit Plans footnote for the prior comparative periods as the estimation basis for applying the retrospective presentation requirement.
|
We expect the adoption of the amended standard to result in the reclassification of approximately $260 million from non-service components above the subtotal of operating income to interest and other, net, for the year ended December 31, 2016. We are continuing to assess the impacts of adoption to our 2017 financial statements.
|
7
INTEL CORPORATION
NOTES TO CONSOLIDATED CONDENSED FINANCIAL STATEMENTS — Unaudited (Continued)
We manage our business through the following operating segments:
|
Client Computing Group (CCG)
|
|
Includes platforms designed for notebooks, 2 in 1 systems, desktops (including all-in-ones and high-end enthusiast PCs), tablets, phones, wireless and wired connectivity products, and mobile communication components.
|
|
Data Center Group (DCG)
|
|
Includes workload-optimized platforms for compute, storage, and network functions and related products designed for enterprise, cloud, and communication infrastructure market segments.
|
|
Internet of Things Group (IOTG)
|
|
Includes platforms designed for Internet of Things market segments, including retail, transportation, industrial, video, buildings and smart cities, along with a broad range of other market segments.
|
|
Non-Volatile Memory Solutions Group (NSG)
|
|
Includes Intel
®
Optane™ SSD products and NAND flash memory products primarily used in solid-state drives.
|
|
Programmable Solutions Group (PSG)
|
|
Includes programmable semiconductors primarily field-programmable gate array (FPGAs) and related products for a broad range of market segments, including communications, data center, industrial, military, and automotive.
|
|
All other
|
|
Includes results from our other non-reportable segments and corporate-related charges.
|
We offer platforms that incorporate various components and technologies, including a microprocessor and chipset, a stand-alone System-on-Chip, or a multichip package. A platform may be enhanced by additional hardware, software, and services offered by Intel. Platforms are used in various form factors across our CCG, DCG, and IOTG operating segments. We derive a substantial majority of our revenue from platforms, which is our principal product.
In the
third
quarter of
2017
, we completed our tender offer for the outstanding ordinary shares of Mobileye B.V. (Mobileye), formerly known as Mobileye N.V. In the second quarter of
2017
, we completed the planned divestiture of Intel Security Group (ISecG). The results are reported within the "all other" category. See "
Note 10: Acquisitions and Divestitures
" for additional information.
The “all other” category includes revenue, expenses, and charges such as:
|
•
|
results of operations from non-reportable segments;
|
|
•
|
amounts included within restructuring and other charges;
|
|
•
|
a portion of profit-dependent compensation and other expenses not allocated to the operating segments;
|
|
•
|
historical results of operations of divested businesses;
|
|
•
|
results of operations of start-up businesses that support our initiatives, including our foundry business; and
|
|
•
|
acquisition-related costs, including amortization and any impairment of acquisition-related intangibles and goodwill.
|
The Chief Operating Decision Maker (CODM), which is our Chief Executive Officer (CEO), does not evaluate operating segments using discrete asset information. Operating segments do not record inter-segment revenue. We do not allocate gains and losses from equity investments, interest and other income, or taxes to operating segments. Although the CODM uses operating income to evaluate the segments, operating costs included in one segment may benefit other segments. Except for these differences, the accounting policies for segment reporting are the same as for Intel as a whole.
8
INTEL CORPORATION
NOTES TO CONSOLIDATED CONDENSED FINANCIAL STATEMENTS — Unaudited (Continued)
Net revenue and operating income (loss) for each period were as follows:
|
Three Months Ended
|
Nine Months Ended
|
|||||||||||||||
|
(In Millions)
|
Sep 30,
2017 |
Oct 1,
2016 |
Sep 30,
2017 |
Oct 1,
2016 |
||||||||||||
|
Net revenue:
|
||||||||||||||||
|
Client Computing Group
|
||||||||||||||||
|
Platform
|
$
|
8,132
|
|
$
|
8,258
|
|
$
|
23,163
|
|
$
|
22,395
|
|
||||
|
Other
|
728
|
|
634
|
|
1,886
|
|
1,384
|
|
||||||||
|
8,860
|
|
8,892
|
|
25,049
|
|
23,779
|
|
|||||||||
|
Data Center Group
|
||||||||||||||||
|
Platform
|
4,439
|
|
4,164
|
|
12,344
|
|
11,589
|
|
||||||||
|
Other
|
439
|
|
378
|
|
1,138
|
|
979
|
|
||||||||
|
4,878
|
|
4,542
|
|
13,482
|
|
12,568
|
|
|||||||||
|
Internet of Things Group
|
||||||||||||||||
|
Platform
|
680
|
|
605
|
|
1,926
|
|
1,673
|
|
||||||||
|
Other
|
169
|
|
84
|
|
364
|
|
239
|
|
||||||||
|
849
|
|
689
|
|
2,290
|
|
1,912
|
|
|||||||||
|
Non-Volatile Memory Solutions Group
|
891
|
|
649
|
|
2,631
|
|
1,760
|
|
||||||||
|
Programmable Solutions Group
|
469
|
|
425
|
|
1,334
|
|
1,249
|
|
||||||||
|
All other
|
202
|
|
581
|
|
922
|
|
1,745
|
|
||||||||
|
Total net revenue
|
$
|
16,149
|
|
$
|
15,778
|
|
$
|
45,708
|
|
$
|
43,013
|
|
||||
|
Operating income (loss):
|
||||||||||||||||
|
Client Computing Group
|
$
|
3,600
|
|
$
|
3,327
|
|
$
|
9,656
|
|
$
|
7,123
|
|
||||
|
Data Center Group
|
2,255
|
|
2,110
|
|
5,403
|
|
5,639
|
|
||||||||
|
Internet of Things Group
|
146
|
|
191
|
|
390
|
|
403
|
|
||||||||
|
Non-Volatile Memory Solutions Group
|
(52
|
)
|
(134
|
)
|
(291
|
)
|
(453
|
)
|
||||||||
|
Programmable Solutions Group
|
113
|
|
78
|
|
302
|
|
(184
|
)
|
||||||||
|
All other
|
(947
|
)
|
(1,110
|
)
|
(2,919
|
)
|
(4,180
|
)
|
||||||||
|
Total operating income
|
$
|
5,115
|
|
$
|
4,462
|
|
$
|
12,541
|
|
$
|
8,348
|
|
||||
9
INTEL CORPORATION
NOTES TO CONSOLIDATED CONDENSED FINANCIAL STATEMENTS — Unaudited (Continued)
We computed basic earnings per share of common stock based on the weighted average number of shares of common stock outstanding during the period. We computed diluted earnings per share of common stock based on the weighted average number of shares of common stock outstanding plus potentially dilutive shares of common stock outstanding during the period.
|
|
Three Months Ended
|
Nine Months Ended
|
||||||||||||||
|
(In Millions, Except Per Share Amounts)
|
Sep 30,
2017 |
Oct 1,
2016 |
Sep 30,
2017 |
Oct 1,
2016 |
||||||||||||
|
Net income available to common stockholders
|
$
|
4,516
|
|
$
|
3,378
|
|
$
|
10,288
|
|
$
|
6,754
|
|
||||
|
Weighted average shares of common stock outstanding—basic
|
4,688
|
|
4,734
|
|
4,707
|
|
4,728
|
|
||||||||
|
Dilutive effect of employee equity incentive plans
|
34
|
|
47
|
|
43
|
|
54
|
|
||||||||
|
Dilutive effect of convertible debt
|
99
|
|
96
|
|
99
|
|
90
|
|
||||||||
|
Weighted average shares of common stock outstanding—diluted
|
4,821
|
|
4,877
|
|
4,849
|
|
4,872
|
|
||||||||
|
Basic earnings per share of common stock
|
$
|
0.96
|
|
$
|
0.71
|
|
$
|
2.19
|
|
$
|
1.43
|
|
||||
|
Diluted earnings per share of common stock
|
$
|
0.94
|
|
$
|
0.69
|
|
$
|
2.12
|
|
$
|
1.39
|
|
||||
Potentially dilutive shares of common stock from employee incentive plans are determined by applying the treasury stock method to the assumed exercise of outstanding stock options, the assumed vesting of outstanding restricted stock units (RSUs), and the assumed issuance of common stock under the stock purchase plan. Potentially dilutive shares of common stock for our 2005 debentures are determined by applying the if-converted method. However, as our 2009 debentures require settlement of the principal amount of the debt in cash upon conversion, with the conversion premium paid in cash or stock at our option, potentially dilutive shares of common stock are determined by applying the treasury stock method.
In all periods presented, potentially dilutive securities which would have been antidilutive are
insignificant
and are excluded from the computation of diluted earnings per share.
In all periods presented, we
included
our 2009 debentures in the calculation of diluted earnings per share of common stock because the average market price was above the conversion price. We could potentially exclude the 2009 debentures in the future if the average market price is below the conversion price.
Inventories
|
(In Millions)
|
Sep 30,
2017 |
Dec 31,
2016 |
||||||
|
Raw materials
|
$
|
1,115
|
|
$
|
695
|
|
||
|
Work in process
|
3,965
|
|
3,190
|
|
||||
|
Finished goods
|
1,849
|
|
1,668
|
|
||||
|
Total inventories
|
$
|
6,929
|
|
$
|
5,553
|
|
||
Deferred Income
|
(In Millions)
|
Sep 30,
2017 |
Dec 31,
2016 |
||||||
|
Deferred income on shipments of components to distributors
|
$
|
1,530
|
|
$
|
1,475
|
|
||
|
Deferred income from software, services and other
|
176
|
|
243
|
|
||||
|
Current deferred income
|
$
|
1,706
|
|
|
$
|
1,718
|
|
|
10
INTEL CORPORATION
NOTES TO CONSOLIDATED CONDENSED FINANCIAL STATEMENTS — Unaudited (Continued)
Gains (Losses) on Equity Investments, Net
The components of gains (losses) on equity investments, net for each period were as follows:
|
|
Three Months Ended
|
Nine Months Ended
|
||||||||||||||
|
(In Millions)
|
Sep 30,
2017 |
Oct 1,
2016 |
Sep 30,
2017 |
Oct 1,
2016 |
||||||||||||
|
Share of equity method investee losses, net
|
$
|
(110
|
)
|
$
|
(10
|
)
|
$
|
(129
|
)
|
$
|
(30
|
)
|
||||
|
Impairments
|
(10
|
)
|
(48
|
)
|
(613
|
)
|
(137
|
)
|
||||||||
|
Gains on sales, net
|
944
|
|
38
|
|
2,020
|
|
553
|
|
||||||||
|
Dividends
|
—
|
|
—
|
|
68
|
|
74
|
|
||||||||
|
Other, net
|
22
|
|
8
|
|
94
|
|
28
|
|
||||||||
|
Total gains (losses) on equity investments, net
|
$
|
846
|
|
$
|
(12
|
)
|
$
|
1,440
|
|
$
|
488
|
|
||||
Interest and Other, Net
The components of interest and other, net for each period were as follows:
|
|
Three Months Ended
|
Nine Months Ended
|
||||||||||||||
|
(In Millions)
|
Sep 30,
2017 |
Oct 1,
2016 |
Sep 30,
2017 |
Oct 1,
2016 |
||||||||||||
|
Interest income
|
$
|
137
|
|
$
|
56
|
|
$
|
349
|
|
$
|
159
|
|
||||
|
Interest expense
|
(191
|
)
|
(180
|
)
|
(493
|
)
|
(575
|
)
|
||||||||
|
Other, net
|
23
|
|
(8
|
)
|
480
|
|
76
|
|
||||||||
|
Total interest and other, net
|
$
|
(31
|
)
|
$
|
(132
|
)
|
$
|
336
|
|
$
|
(340
|
)
|
||||
Interest expense in the preceding table is net of
$77 million
of interest capitalized in the
third
quarter of
2017
and
$212 million
in the
first nine months
of
2017
(
$36 million
in the
third
quarter of
2016
and
$82 million
in the
first nine months
of
2016
).
Note 7: Restructuring and Other Charges
|
Three Months Ended
|
Nine Months Ended
|
|||||||||||||||
|
(In Millions)
|
Sep 30,
2017 |
Oct 1,
2016 |
Sep 30,
2017 |
Oct 1,
2016 |
||||||||||||
|
2016 Restructuring Program
|
$
|
2
|
|
$
|
349
|
|
$
|
(51
|
)
|
$
|
1,763
|
|
||||
|
Other charges
|
2
|
|
23
|
|
240
|
|
23
|
|
||||||||
|
Total restructuring and other charges
|
$
|
4
|
|
$
|
372
|
|
$
|
189
|
|
$
|
1,786
|
|
||||
2016 Restructuring Program
In the second quarter of 2017, we substantially completed the 2016 Restructuring Program. For further information, see "Note 7: Restructuring and Other Charges" in Part II, Item 8 of our 2016 Form 10-K.
Restructuring and other charges by type for the 2016 Restructuring Program for the period were as follows:
|
Three Months Ended
|
Nine Months Ended
|
|||||||||||||||
|
(In Millions)
|
Sep 30,
2017 |
Oct 1,
2016 |
Sep 30,
2017 |
Oct 1,
2016 |
||||||||||||
|
Employee severance and benefit arrangements
|
$
|
(2
|
)
|
$
|
338
|
|
$
|
(72
|
)
|
$
|
1,752
|
|
||||
|
Pension settlement charges
|
—
|
|
10
|
|
—
|
|
10
|
|
||||||||
|
Asset impairment and other charges
|
4
|
|
1
|
|
21
|
|
1
|
|
||||||||
|
Total restructuring and other charges
|
$
|
2
|
|
$
|
349
|
|
$
|
(51
|
)
|
$
|
1,763
|
|
||||
11
INTEL CORPORATION
NOTES TO CONSOLIDATED CONDENSED FINANCIAL STATEMENTS — Unaudited (Continued)
Restructuring and other activity for the 2016 Restructuring Program for the
first nine months
of
2017
was as follows:
|
(In Millions)
|
Employee Severance and Benefits
|
Asset Impairments and Other
|
Total
|
|||||||||
|
Accrued restructuring balance as of December 31, 2016
|
$
|
585
|
|
$
|
10
|
|
$
|
595
|
|
|||
|
Additional accruals
|
—
|
|
21
|
|
21
|
|
||||||
|
Adjustments
|
(72
|
)
|
—
|
|
(72
|
)
|
||||||
|
Cash payments
|
(282
|
)
|
(25
|
)
|
(307
|
)
|
||||||
|
Non-cash settlements
|
—
|
|
(2
|
)
|
(2
|
)
|
||||||
|
Accrued restructuring balance as of September 30, 2017
|
$
|
231
|
|
$
|
4
|
|
$
|
235
|
|
|||
A substantial majority of the accrued restructuring balance as of
September 30, 2017
is expected to be paid within the next 12 months and was recorded within accrued compensation and benefits.
Restructuring actions related to this program that were approved in 2016 impacted approximately
15,000
employees.
Other charges
|
Three Months Ended
|
Nine Months Ended
|
|||||||||||||||
|
(In Millions)
|
Sep 30,
2017 |
Oct 1,
2016 |
Sep 30,
2017 |
Oct 1,
2016 |
||||||||||||
|
ISecG separation costs
|
$
|
1
|
|
$
|
23
|
|
$
|
144
|
|
$
|
23
|
|
||||
|
Other
|
1
|
|
—
|
|
96
|
|
—
|
|
||||||||
|
Total other charges
|
$
|
2
|
|
$
|
23
|
|
$
|
240
|
|
$
|
23
|
|
||||
Our effective income tax rate was
28.1%
in the
first nine months
of
2017
compared to
20.5%
in the
first nine months
of
2016
.
A majority
of the
increase
in the effective rate was attributable to the
$822 million
tax expense due to our divestiture of ISecG.
Available-for-Sale Investments
|
September 30, 2017
|
December 31, 2016
|
|||||||||||||||||||||||||||||||
|
(In Millions)
|
Adjusted Cost
|
Gross Unrealized Gains
|
Gross Unrealized Losses
|
Fair Value
|
Adjusted Cost
|
Gross Unrealized Gains
|
Gross Unrealized Losses
|
Fair Value
|
||||||||||||||||||||||||
|
Corporate debt
|
$
|
2,603
|
|
$
|
12
|
|
$
|
(7
|
)
|
$
|
2,608
|
|
$
|
3,847
|
|
$
|
4
|
|
$
|
(14
|
)
|
$
|
3,837
|
|
||||||||
|
Financial institution instruments
|
7,709
|
|
6
|
|
(4
|
)
|
7,711
|
|
6,098
|
|
5
|
|
(11
|
)
|
6,092
|
|
||||||||||||||||
|
Government debt
|
986
|
|
3
|
|
(3
|
)
|
986
|
|
1,581
|
|
—
|
|
(8
|
)
|
1,573
|
|
||||||||||||||||
|
Marketable equity securities
|
2,101
|
|
3,958
|
|
—
|
|
6,059
|
|
2,818
|
|
3,363
|
|
(1
|
)
|
6,180
|
|
||||||||||||||||
|
Total available-for-sale investments
|
$
|
13,399
|
|
$
|
3,979
|
|
$
|
(14
|
)
|
$
|
17,364
|
|
$
|
14,344
|
|
$
|
3,372
|
|
$
|
(34
|
)
|
$
|
17,682
|
|
||||||||
Government debt includes instruments such as non-U.S. government bonds and U.S. agency securities. Financial institution instruments include instruments issued or managed by financial institutions in various forms such as commercial paper, fixed and floating rate bonds, money market fund deposits, and time deposits.
Substantially all
time deposits were issued by institutions outside the U.S. as of
September 30, 2017
(
most
time deposits were issued by institutions outside the U.S. as of
December 31, 2016
).
12
INTEL CORPORATION
NOTES TO CONSOLIDATED CONDENSED FINANCIAL STATEMENTS — Unaudited (Continued)
During the
third
quarter of
2017
, we sold available-for sale investments for proceeds of
$2.9 billion
(
$195 million
in the
third
quarter of
2016
). During the
first nine months
of
2017
, we sold available-for-sale investments for proceeds of
$4.7 billion
(
$4.0 billion
in the
first nine months
of
2016
). The gross realized gains on sales of available-for-sale investments were
$927 million
in the
third
quarter of
2017
and
$2.0 billion
in the
first nine months
of
2017
(
$41 million
in the
third
quarter of
2016
and
$538 million
in the
first nine months
of
2016
).
On April 28, 2017, Cloudera, Inc. (Cloudera) completed its initial public offering and we have designated our previous equity and cost method investments in Cloudera as available-for-sale. During the second quarter of 2017, we determined we had an other-than-temporary decline in the fair value of our investment and recognized an impairment charge of
$278 million
. We recognized the impairment in the second quarter due to the duration and severity of the decline in the investment's fair value, which we determined was below cost based upon observable market prices after the initial public offering.
The fair value of available-for-sale debt investments, by contractual maturity, as of
September 30, 2017
, were as follows:
|
(In Millions)
|
Fair Value
|
|||
|
Due in 1 year or less
|
$
|
3,314
|
|
|
|
Due in 1–2 years
|
1,573
|
|
||
|
Due in 2–5 years
|
2,200
|
|
||
|
Due after 5 years
|
71
|
|
||
|
Instruments not due at a single maturity date
|
4,147
|
|
||
|
Total
|
$
|
11,305
|
|
|
Equity Method Investments
McAfee
In the second quarter of
2017
, we closed our divestiture of the ISecG business and retained a
49%
interest in McAfee as partial consideration. Our investment is accounted for under the equity method of accounting and is classified within other long-term assets. In the third quarter of 2017, we received a
$735 million
dividend from McAfee and recorded our share of equity method investee losses. The carrying value of our investment was
$257 million
as of
September 30, 2017
. For further information related to the divestiture of the ISecG business, see "
Note 10: Acquisitions and Divestitures
".
IM Flash Technologies, LLC
Since the inception of IM Flash Technologies, LLC (IMFT) in 2006, Micron Technology, Inc. (Micron) and Intel have jointly developed NAND flash memory and, most recently, 3D XPoint™ technology products. Intel also purchases jointly developed products directly from Micron under certain supply agreements.
As of
September 30, 2017
, we own a
49%
interest in IMFT. The carrying value of our investment was
$855 million
as of
September 30, 2017
(
$849 million
as of
December 31, 2016
) and is classified within other long-term assets.
IMFT is a variable interest entity and all costs of IMFT are passed on to Micron and Intel through sale of products or services in proportional share of ownership. Our portion of IMFT costs, primarily related to product purchases and production-related services, was approximately
$115 million
in the
third
quarter of
2017
and approximately
$350 million
in the
first nine months
of
2017
(approximately
$115 million
in the
third
quarter of
2016
and approximately
$315 million
in the
first nine months
of
2016
). The amount due to IMFT for product purchases and services provided was approximately
$73 million
as of
September 30, 2017
(approximately
$95 million
as of
December 31, 2016
).
IMFT depends on Micron and Intel for any additional cash needs. Our known maximum exposure to loss approximated the carrying value of our investment balance in IMFT. Except for the amount due to IMFT for product purchases and production-related services, we did not have any additional liabilities recognized on our consolidated condensed balance sheets in connection with our interests in this joint venture as of
September 30, 2017
. Our potential future losses could be higher than the carrying amount of our investment, as Intel and Micron are liable for other future operating costs or obligations of IMFT. Future cash calls could also increase our investment balance and the related exposure to loss. In addition, because we are currently committed to purchasing
49%
of IMFT’s production output and production-related services, we may be required to purchase products at a cost in excess of realizable value.
13
INTEL CORPORATION
NOTES TO CONSOLIDATED CONDENSED FINANCIAL STATEMENTS — Unaudited (Continued)
Non-marketable Cost Method Investments
Beijing UniSpreadtrum Technology Ltd.
During 2014, we entered into a series of agreements with Tsinghua Unigroup Ltd. (Tsinghua Unigroup), an operating subsidiary of Tsinghua Holdings Co. Ltd., to, among other things, jointly develop Intel
®
architecture- and communications-based solutions for phones. We agreed to invest up to
9.0 billion
Chinese yuan (approximately
$1.5 billion
as of the date of the agreement) for a minority stake of approximately
20%
of Beijing UniSpreadtrum Technology Ltd., a holding company under Tsinghua Unigroup. During 2015, we invested
$966 million
to complete the first phase of the equity investment and accounted for our interest using the cost method of accounting. During the second quarter of 2017, we reduced our expectation of the company's future operating performance due to competitive pressures, which resulted in an other-than-temporary impairment charge of
$147 million
.
Trading Assets
Net
gains
related to trading assets still held at the reporting date were
$81 million
in the
third
quarter of
2017
and
$433 million
in the
first nine months
of
2017
(there were
$72 million
net gains related to trading assets still held at the reporting date in the
third
quarter of
2016
and
$245 million
of net
gains
in the
first nine months
of
2016
). Net
losses
on the related derivatives were
$75 million
in the
third
quarter of
2017
and
$402 million
in the
first nine months
of
2017
(net
losses
of
$54 million
in the
third
quarter of
2016
and
$224 million
in the
first nine months
of
2016
).
Note 10: Acquisitions and Divestitures
Acquisition of Mobileye
On August 21, 2017, we completed our tender offer for all of the outstanding ordinary shares of Mobileye, a global leader in the development of computer vision and machine learning, data analysis, localization and mapping for advanced driver assistance systems and autonomous driving. This acquisition combines Mobileye's leading computer vision expertise with Intel’s high-performance computing and connectivity expertise to create automated driving solutions from car to cloud. The combination is expected to accelerate innovation for the automotive industry and position Intel as a leading technology provider in the fast-growing market for highly and fully autonomous vehicles. The transaction also extends Intel’s strategy to invest in data-intensive market opportunities that build on our strengths in computing and connectivity from the cloud, through the network, to the device.
As of the completion of the tender offer, we acquired substantially all of the outstanding ordinary shares of Mobileye. We acquired
84.4%
of the outstanding shares on August 8, 2017 and
97.3%
as of August 21, 2017, and we intend to acquire all remaining outstanding shares. We have reflected the acquisition of the additional outstanding shares and reduction to the noncontrolling interest by
$1.8 billion
in the tables below.
Total consideration to acquire Mobileye was
$14.5 billion
(net of
$366 million
of cash and cash equivalents acquired)
.
The preliminary fair values of the assets acquired and liabilities assumed by major class in the acquisition of Mobileye were recognized as follows:
|
(In Millions)
|
||||
|
Short-term investments and marketable securities
|
$
|
370
|
|
|
|
Tangible assets
|
227
|
|
||
|
Goodwill
|
10,278
|
|
||
|
Identified intangible assets
|
4,482
|
|
||
|
Current liabilities
|
(69
|
)
|
||
|
Deferred tax liabilities and other
|
(418
|
)
|
||
|
Noncontrolling interest
|
(375
|
)
|
||
|
Total
|
$
|
14,495
|
|
|
We assumed outstanding unvested Mobileye stock options and RSUs granted under two Mobileye equity plans. We will not grant additional equity awards under these two Mobileye equity plans. In connection with the acquisition, we recognized share-based compensation expense of
$71 million
for cash-settled awards.
14
INTEL CORPORATION
NOTES TO CONSOLIDATED CONDENSED FINANCIAL STATEMENTS — Unaudited (Continued)
The preliminary allocation of the purchase price was based upon estimates and assumptions that are subject to change within the one year measurement period. The primary areas of the purchase price allocation that are not yet finalized are certain tax matters, identification of contingencies, and goodwill.
The fair value of the noncontrolling interest was determined based on the quoted share price of Mobileye as of August 8, 2017, and the remaining outstanding shares that constitute the noncontrolling interest. We recorded the noncontrolling interest as a component of equity.
Goodwill of
$10.3 billion
arising from the acquisition is attributed to the expected synergies and other benefits that will be generated from the combination of Intel and Mobileye. Substantially all of the goodwill recognized is not expected to be deductible for tax purposes. The goodwill recognized from the acquisition is included within "all other."
The identified intangible assets assumed in the acquisition of Mobileye were recognized as follows:
|
Fair Value
(In Millions) |
Weighted Average
Estimated Useful Life (In Years) |
|||||
|
Developed technology
|
$
|
2,346
|
|
9
|
||
|
Customer relationships
|
713
|
|
12
|
|||
|
Brands
|
64
|
|
10
|
|||
|
Identified intangible assets subject to amortization
|
3,123
|
|
||||
|
In-process research and development
|
1,359
|
|
||||
|
Identified intangible assets not subject to amortization
|
1,359
|
|
||||
|
Total identified intangible assets
|
$
|
4,482
|
|
|||
Acquired developed technology represents the fair value of Mobileye products that have reached technological feasibility and are a part of Mobileye’s product offerings, as opposed to in-process research and development which represents the fair value of products that have not reached technological feasibility. Customer relationships represent the fair values of the underlying relationships and agreements with Mobileye’s customers.
Divestiture of Intel Security Group
On April 3, 2017, we closed the transaction with TPG VII Manta Holdings, L.P., now known as Manta Holdings, L.P. (TPG), transferring certain assets and liabilities relating to ISecG to a newly formed, jointly-owned, separate cybersecurity company called McAfee.
Total consideration received was
$4.2 billion
, consisting of
$924 million
in cash proceeds,
$1.1 billion
in the form of equity representing a
49%
ownership interest in McAfee, and
$2.2 billion
in the form of promissory notes issued by McAfee and TPG. During the third quarter of 2017, McAfee and TPG repaid the
$2.2 billion
of promissory notes, which are included within proceeds from divestiture.
The carrying amounts of the major classes of ISecG assets and liabilities as of the transaction close date included the following:
|
(In Millions)
|
Apr 3,
2017 |
|||
|
Accounts receivable
|
$
|
317
|
|
|
|
Goodwill
|
3,601
|
|
||
|
Identified intangible assets
|
965
|
|
||
|
Other assets
|
276
|
|
||
|
Total assets
|
$
|
5,159
|
|
|
|
Deferred income
|
$
|
1,553
|
|
|
|
Other liabilities
|
276
|
|
||
|
Total liabilities
|
$
|
1,829
|
|
|
15
INTEL CORPORATION
NOTES TO CONSOLIDATED CONDENSED FINANCIAL STATEMENTS — Unaudited (Continued)
As of the transaction close date, we recognized a pre-tax gain of
$387 million
within "Interest and other, net," which is net of
$507 million
of currency translation adjustment losses reclassified from accumulated other comprehensive income (loss) associated with currency charges on the carrying values of ISecG goodwill and identified intangible assets. In addition, we recognized a tax expense of
$822 million
.
As a result of our acquisition of Mobileye during the third quarter of 2017, we recorded
$4.5 billion
of identified intangible assets. For further information about these acquired identified intangible assets, see "
Note 10: Acquisitions and Divestitures
."
|
|
September 30, 2017
|
|||||||||||
|
(In Millions)
|
Gross Assets
|
Accumulated
Amortization |
Net
|
|||||||||
|
Acquisition-related developed technology
|
$
|
8,937
|
|
$
|
(1,686
|
)
|
$
|
7,251
|
|
|||
|
Acquisition-related customer relationships
|
2,052
|
|
(265
|
)
|
1,787
|
|
||||||
|
Acquisition-related brands
|
143
|
|
(24
|
)
|
119
|
|
||||||
|
Licensed technology and patents
|
3,237
|
|
(1,504
|
)
|
1,733
|
|
||||||
|
Identified intangible assets subject to amortization
|
14,369
|
|
(3,479
|
)
|
10,890
|
|
||||||
|
In-process research and development
|
2,168
|
|
—
|
|
2,168
|
|
||||||
|
Identified intangible assets not subject to amortization
|
2,168
|
|
—
|
|
2,168
|
|
||||||
|
Total identified intangible assets
|
$
|
16,537
|
|
$
|
(3,479
|
)
|
$
|
13,058
|
|
|||
|
|
December 31, 2016
|
|||||||||||
|
(In Millions)
|
Gross Assets
|
Accumulated
Amortization |
Net
|
|||||||||
|
Acquisition-related developed technology
|
$
|
7,405
|
|
$
|
(1,836
|
)
|
$
|
5,569
|
|
|||
|
Acquisition-related customer relationships
|
1,449
|
|
(260
|
)
|
1,189
|
|
||||||
|
Acquisition-related brands
|
87
|
|
(21
|
)
|
66
|
|
||||||
|
Licensed technology and patents
|
3,285
|
|
(1,423
|
)
|
1,862
|
|
||||||
|
Identified intangible assets subject to amortization
|
12,226
|
|
(3,540
|
)
|
8,686
|
|
||||||
|
In-process research and development
|
808
|
|
—
|
|
808
|
|
||||||
|
Identified intangible assets not subject to amortization
|
808
|
|
—
|
|
808
|
|
||||||
|
Total identified intangible assets
|
$
|
13,034
|
|
$
|
(3,540
|
)
|
$
|
9,494
|
|
|||
Amortization expenses recorded in the consolidated condensed statements of income for each period were as follows:
|
Three Months Ended
|
Nine Months Ended
|
|||||||||||||||||
|
(In Millions)
|
Location
|
Sep 30,
2017 |
Oct 1,
2016 |
Sep 30,
2017 |
Oct 1,
2016 |
|||||||||||||
|
Acquisition-related developed technology
|
Cost of sales
|
$
|
243
|
|
$
|
235
|
|
$
|
650
|
|
$
|
705
|
|
|||||
|
Acquisition-related customer relationships
|
Amortization of acquisition-related intangibles
|
45
|
|
69
|
|
113
|
|
234
|
|
|||||||||
|
Acquisition-related brands
|
Amortization of acquisition-related intangibles
|
4
|
|
5
|
|
11
|
|
19
|
|
|||||||||
|
Licensed technology and patents
|
Cost of sales
|
73
|
|
76
|
|
225
|
|
218
|
|
|||||||||
|
Total amortization expense
|
$
|
365
|
|
$
|
385
|
|
$
|
999
|
|
$
|
1,176
|
|
||||||
16
INTEL CORPORATION
NOTES TO CONSOLIDATED CONDENSED FINANCIAL STATEMENTS — Unaudited (Continued)
We expect future amortization expense for the next five years to be as follows:
|
(In Millions)
|
Remainder of 2017
|
2018
|
2019
|
2020
|
2021
|
|||||||||||||||
|
Acquisition-related developed technology
|
$
|
262
|
|
$
|
1,045
|
|
$
|
1,043
|
|
$
|
1,011
|
|
$
|
976
|
|
|||||
|
Acquisition-related customer relationships
|
48
|
|
181
|
|
180
|
|
179
|
|
179
|
|
||||||||||
|
Acquisition-related brands
|
5
|
|
20
|
|
20
|
|
20
|
|
20
|
|
||||||||||
|
Licensed technology and patents
|
61
|
|
239
|
|
227
|
|
202
|
|
187
|
|
||||||||||
|
Total future amortization expenses
|
$
|
376
|
|
$
|
1,485
|
|
$
|
1,470
|
|
$
|
1,412
|
|
$
|
1,362
|
|
|||||
|
(In Millions)
|
Sep 30,
2017 |
Dec 31,
2016 |
||||||
|
Equity method investments
|
$
|
1,406
|
|
$
|
1,328
|
|
||
|
Non-marketable cost method investments
|
2,719
|
|
3,098
|
|
||||
|
Non-current deferred tax assets
|
789
|
|
907
|
|
||||
|
Pre-payments for property, plant and equipment
|
468
|
|
347
|
|
||||
|
Loans receivable
|
543
|
|
236
|
|
||||
|
Reverse repurchase agreements
|
—
|
|
250
|
|
||||
|
Other
|
1,187
|
|
993
|
|
||||
|
Total other long-term assets
|
$
|
7,112
|
|
$
|
7,159
|
|
||
Note 13: Borrowings
|
(In Millions)
|
Sep 30,
2017 |
Dec 31,
2016 |
||||||
|
Drafts payable
|
$
|
21
|
|
$
|
25
|
|
||
|
Current portion of long-term debt
|
4,129
|
|
4,618
|
|
||||
|
Less: debt issuance costs associated with the current portion of long-term debt
|
(8
|
)
|
(9
|
)
|
||||
|
Total short-term debt
|
$
|
4,142
|
|
$
|
4,634
|
|
||
Our current portion of long-term debt includes our
2009
junior subordinated convertible debentures due
2039
.
We have an ongoing authorization from our Board of Directors to borrow up to
$10.0 billion
under our commercial paper program. This amount includes an increase of
$5.0 billion
in the authorization limit approved by our Board of Directors in April 2017.
During the second quarter of 2017, we repaid
$500 million
of our
1.75%
senior notes that matured in
May 2017
.
17
INTEL CORPORATION
NOTES TO CONSOLIDATED CONDENSED FINANCIAL STATEMENTS — Unaudited (Continued)
Long-Term Debt
Our indebtedness is carried at amortized cost net of applicable hedge adjustments.
|
(In Millions)
|
Sep 30,
2017 |
Dec 31,
2016 |
||||||
|
Floating-rate senior notes:
|
||||||||
|
$700, three-month LIBOR plus 0.08%, due May 2020
|
$
|
700
|
|
$
|
—
|
|
||
|
$800, three-month LIBOR plus 0.35%, due May 2022
|
800
|
|
—
|
|
||||
|
Fixed-rate senior notes:
|
||||||||
|
$500, 1.75%, due May 2017
|
—
|
|
501
|
|
||||
|
$3,000, 1.35%, due December 2017
|
3,000
|
|
2,999
|
|
||||
|
$600, 2.50%, due November 2018
|
602
|
|
604
|
|
||||
|
A$250, 3.25%, due December 2019
1
|
196
|
|
180
|
|
||||
|
$1,000, 1.85%, due May 2020
|
1,000
|
|
—
|
|
||||
|
$1,750, 2.45%, due July 2020
|
1,749
|
|
1,749
|
|
||||
|
$500, 1.70%, due May 2021
|
499
|
|
499
|
|
||||
|
$2,000, 3.30%, due October 2021
|
1,995
|
|
1,988
|
|
||||
|
$750, 2.35%, due May 2022
|
747
|
|
—
|
|
||||
|
$1,000, 3.10%, due July 2022
|
994
|
|
987
|
|
||||
|
A$550, 4.00%, due December 2022
1
|
431
|
|
394
|
|
||||
|
$1,500, 2.70%, due December 2022
|
1,491
|
|
1,480
|
|
||||
|
$400, 4.10%, due November 2023
|
421
|
|
424
|
|
||||
|
$1,250, 2.88%, due May 2024
|
1,242
|
|
—
|
|
||||
|
$600, 2.70%, due June 2024
|
596
|
|
—
|
|
||||
|
$2,250, 3.70%, due July 2025
|
2,177
|
|
2,148
|
|
||||
|
$1,000, 2.60%, due May 2026
|
993
|
|
983
|
|
||||
|
$1,000, 3.15%, due May 2027
|
991
|
|
—
|
|
||||
|
$750, 4.00%, due December 2032
|
745
|
|
745
|
|
||||
|
$1,500, 4.80%, due October 2041
|
1,491
|
|
1,491
|
|
||||
|
$925, 4.25%, due December 2042
|
924
|
|
924
|
|
||||
|
$2,000, 4.90%, due July 2045
|
1,999
|
|
1,999
|
|
||||
|
$1,007, 4.90%, due August 2045
|
—
|
|
995
|
|
||||
|
$915, 4.70%, due December 2045
|
910
|
|
894
|
|
||||
|
$1,250, 4.10%, due May 2046
|
1,243
|
|
1,243
|
|
||||
|
$1,000, 4.10%, due May 2047
|
994
|
|
—
|
|
||||
|
$640, 4.10%, due August 2047
|
638
|
|
—
|
|
||||
|
Junior subordinated convertible debentures:
|
||||||||
|
$1,600, 2.95%, due December 2035
|
1,004
|
|
992
|
|
||||
|
$2,000, 3.25%, due August 2039
|
1,130
|
|
1,118
|
|
||||
|
Long-term debt
|
31,702
|
|
25,337
|
|
||||
|
Less: current portion of long-term debt
|
(4,129
|
)
|
(4,618
|
)
|
||||
|
Less: debt issuance costs
|
(75
|
)
|
(70
|
)
|
||||
|
Total long-term debt
|
$
|
27,498
|
|
$
|
20,649
|
|
||
|
1
|
To manage foreign currency risk associated with the Australian-dollar-denominated notes issued in 2015, we entered into currency interest rate swaps with an aggregate notional amount of
$577 million
, which effectively converted these notes to U.S.-dollar-denominated notes. For further discussion on our currency interest rate swaps, see "
Note 16: Derivative Financial Instruments
."
|
18
INTEL CORPORATION
NOTES TO CONSOLIDATED CONDENSED FINANCIAL STATEMENTS — Unaudited (Continued)
During the second quarter of 2017, we issued a total of
$7.1 billion
aggregate principal amount of senior notes. We intend to use the net proceeds from the offering of the notes for general corporate purposes, which may include refinancing of outstanding debt or repurchases of shares of our common stock.
During the third quarter of 2017, we redeemed the
$1.0 billion
4.90%
senior notes due
August 2045
. Additionally, we issued a total of
$640 million
aggregate principal amount of senior notes. We used the net proceeds from the offering of the notes to finance a portion of the redemption price of our
4.90%
senior notes due
August 2045
.
Our senior floating rate notes pay interest quarterly and our senior fixed rate notes pay interest semiannually. We may redeem the fixed rate notes prior to their maturity at our option at specified redemption prices and subject to certain restrictions. The obligations under the notes rank equally in right of payment with all of our other existing and future senior unsecured indebtedness and effectively rank junior to all liabilities of our subsidiaries.
For further information on our debt instruments, see "Note 14: Borrowings" in Part II, Item 8 of our
2016
Form 10-K.
19
INTEL CORPORATION
NOTES TO CONSOLIDATED CONDENSED FINANCIAL STATEMENTS — Unaudited (Continued)
For information about our fair value policies, and methods and assumptions used in estimating the fair value of our financial assets and liabilities, see “Note 2: Accounting Policies" and "Note 15: Fair Value" in Part II, Item 8 of our 2016 Form 10-K.
Assets and Liabilities Measured and Recorded at Fair Value on a Recurring Basis
|
September 30, 2017
|
December 31, 2016
|
|||||||||||||||||||||||||||||||
|
Fair Value Measured and Recorded at Reporting Date Using
|
|
Fair Value Measured and Recorded at Reporting Date Using
|
|
|||||||||||||||||||||||||||||
|
(In Millions)
|
Level 1
|
Level 2
|
Level 3
|
Total
|
Level 1
|
Level 2
|
Level 3
|
Total
|
||||||||||||||||||||||||
|
Assets
|
||||||||||||||||||||||||||||||||
|
Cash equivalents:
|
||||||||||||||||||||||||||||||||
|
Corporate debt
|
$
|
—
|
|
$
|
150
|
|
$
|
—
|
|
$
|
150
|
|
$
|
—
|
|
$
|
498
|
|
$
|
—
|
|
$
|
498
|
|
||||||||
|
Financial institution instruments
1
|
4,146
|
|
1,619
|
|
—
|
|
5,765
|
|
1,920
|
|
811
|
|
—
|
|
2,731
|
|
||||||||||||||||
|
Government debt
2
|
—
|
|
100
|
|
—
|
|
100
|
|
—
|
|
332
|
|
—
|
|
332
|
|
||||||||||||||||
|
Reverse repurchase agreements
|
—
|
|
1,599
|
|
—
|
|
1,599
|
|
—
|
|
768
|
|
—
|
|
768
|
|
||||||||||||||||
|
Short-term investments:
|
||||||||||||||||||||||||||||||||
|
Corporate debt
|
—
|
|
750
|
|
6
|
|
756
|
|
—
|
|
1,332
|
|
6
|
|
1,338
|
|
||||||||||||||||
|
Financial institution instruments
1
|
—
|
|
557
|
|
—
|
|
557
|
|
—
|
|
1,603
|
|
—
|
|
1,603
|
|
||||||||||||||||
|
Government debt
2
|
—
|
|
133
|
|
—
|
|
133
|
|
—
|
|
284
|
|
—
|
|
284
|
|
||||||||||||||||
|
Trading assets:
|
||||||||||||||||||||||||||||||||
|
Asset-backed securities
|
—
|
|
12
|
|
—
|
|
12
|
|
—
|
|
87
|
|
—
|
|
87
|
|
||||||||||||||||
|
Corporate debt
|
—
|
|
2,269
|
|
—
|
|
2,269
|
|
—
|
|
2,847
|
|
—
|
|
2,847
|
|
||||||||||||||||
|
Financial institution instruments
1
|
57
|
|
990
|
|
—
|
|
1,047
|
|
36
|
|
1,608
|
|
—
|
|
1,644
|
|
||||||||||||||||
|
Government debt
2
|
31
|
|
3,624
|
|
—
|
|
3,655
|
|
32
|
|
3,704
|
|
—
|
|
3,736
|
|
||||||||||||||||
|
Other current assets:
|
||||||||||||||||||||||||||||||||
|
Derivative assets
|
2
|
|
289
|
|
—
|
|
291
|
|
—
|
|
382
|
|
—
|
|
382
|
|
||||||||||||||||
|
Loans receivable
|
—
|
|
88
|
|
—
|
|
88
|
|
—
|
|
326
|
|
—
|
|
326
|
|
||||||||||||||||
|
Marketable equity securities
|
5,584
|
|
475
|
|
—
|
|
6,059
|
|
6,180
|
|
—
|
|
—
|
|
6,180
|
|
||||||||||||||||
|
Other long-term investments:
|
||||||||||||||||||||||||||||||||
|
Corporate debt
|
—
|
|
1,697
|
|
5
|
|
1,702
|
|
—
|
|
1,995
|
|
6
|
|
2,001
|
|
||||||||||||||||
|
Financial institution instruments
1
|
—
|
|
1,389
|
|
—
|
|
1,389
|
|
—
|
|
1,758
|
|
—
|
|
1,758
|
|
||||||||||||||||
|
Government debt
2
|
—
|
|
753
|
|
—
|
|
753
|
|
—
|
|
957
|
|
—
|
|
957
|
|
||||||||||||||||
|
Other long-term assets:
|
||||||||||||||||||||||||||||||||
|
Derivative assets
|
—
|
|
74
|
|
9
|
|
83
|
|
—
|
|
31
|
|
9
|
|
40
|
|
||||||||||||||||
|
Loans receivable
|
—
|
|
543
|
|
—
|
|
543
|
|
—
|
|
236
|
|
—
|
|
236
|
|
||||||||||||||||
|
Total assets measured and recorded at fair value
|
9,820
|
|
17,111
|
|
20
|
|
26,951
|
|
8,168
|
|
19,559
|
|
21
|
|
27,748
|
|
||||||||||||||||
|
Liabilities
|
||||||||||||||||||||||||||||||||
|
Other accrued liabilities:
|
||||||||||||||||||||||||||||||||
|
Derivative liabilities
|
—
|
|
449
|
|
—
|
|
449
|
|
—
|
|
371
|
|
—
|
|
371
|
|
||||||||||||||||
|
Other long-term liabilities:
|
||||||||||||||||||||||||||||||||
|
Derivative liabilities
|
—
|
|
166
|
|
7
|
|
173
|
|
—
|
|
179
|
|
33
|
|
212
|
|
||||||||||||||||
|
Total liabilities measured and recorded at fair value
|
$
|
—
|
|
$
|
615
|
|
$
|
7
|
|
$
|
622
|
|
$
|
—
|
|
$
|
550
|
|
$
|
33
|
|
$
|
583
|
|
||||||||
|
1
|
Level 1 investments consist of money market funds. Level 2 investments consist primarily of commercial paper, certificates of deposit, time deposits, and notes and bonds issued by financial institutions.
|
|
2
|
Level 1 investments consist primarily of US Treasury securities. Level 2 investments consist primarily of US Agency notes and non-U.S. government debt.
|
20
INTEL CORPORATION
NOTES TO CONSOLIDATED CONDENSED FINANCIAL STATEMENTS — Unaudited (Continued)
In the second quarter of 2017, we began assigning fair value hierarchy levels based on the underlying instrument type for our fixed income portfolio. We have reclassified prior period amounts to conform to the current period presentation.
Fair Value Option for Loans Receivable
As of
September 30, 2017
and
December 31, 2016
, the fair value of our loans receivable for which we elected the fair value option
did not significantly
differ from the contractual principal balance based on the contractual currency.
Assets Measured and Recorded at Fair Value on a Non-Recurring Basis
Our non-marketable equity investments, marketable equity method investments, and non-financial assets, such as intangible assets and property, plant and equipment, are recorded at fair value only if an impairment is recognized.
We classified non-marketable equity investments as Level 3. Impairments recognized on non-marketable equity investments held as of
September 30, 2017
were
insignificant
during the
third
quarter of
2017
and
$335 million
during the
first nine months
of
2017
(
$48 million
during the
third
quarter of
2016
and
$132 million
during the
first nine months
of
2016
on non-marketable equity investments held as of
October 1, 2016
).
Financial Instruments Not Recorded at Fair Value on a Recurring Basis
The carrying amounts and fair values of financial instruments not recorded at fair value on a recurring basis at the end of each period were as follows:
|
September 30, 2017
|
||||||||||||||||||||
|
(In Millions)
|
Carrying
Amount
|
Fair Value Measured Using
|
Fair Value
|
|||||||||||||||||
|
Level 1
|
Level 2
|
Level 3
|
||||||||||||||||||
|
Grants receivable
|
$
|
646
|
|
$
|
—
|
|
$
|
646
|
|
$
|
—
|
|
$
|
646
|
|
|||||
|
Loans receivable
|
$
|
15
|
|
$
|
—
|
|
$
|
15
|
|
$
|
—
|
|
$
|
15
|
|
|||||
|
Non-marketable cost method investments
|
$
|
2,719
|
|
$
|
—
|
|
$
|
—
|
|
$
|
3,336
|
|
$
|
3,336
|
|
|||||
|
Reverse repurchase agreements
|
$
|
250
|
|
$
|
—
|
|
$
|
250
|
|
$
|
—
|
|
$
|
250
|
|
|||||
|
Short-term debt
|
$
|
4,121
|
|
$
|
—
|
|
$
|
4,703
|
|
$
|
—
|
|
$
|
4,703
|
|
|||||
|
Long-term debt
|
$
|
27,498
|
|
$
|
—
|
|
$
|
29,485
|
|
$
|
—
|
|
$
|
29,485
|
|
|||||
|
December 31, 2016
|
||||||||||||||||||||
|
(In Millions)
|
Carrying
Amount
|
Fair Value Measured Using
|
Fair Value
|
|||||||||||||||||
|
Level 1
|
Level 2
|
Level 3
|
||||||||||||||||||
|
Grants receivable
|
$
|
361
|
|
$
|
—
|
|
$
|
362
|
|
$
|
—
|
|
$
|
362
|
|
|||||
|
Loans receivable
|
$
|
265
|
|
$
|
—
|
|
$
|
265
|
|
$
|
—
|
|
$
|
265
|
|
|||||
|
Non-marketable cost method investments
|
$
|
3,098
|
|
$
|
—
|
|
$
|
—
|
|
$
|
3,890
|
|
$
|
3,890
|
|
|||||
|
Reverse repurchase agreements
|
$
|
250
|
|
$
|
—
|
|
$
|
250
|
|
$
|
—
|
|
$
|
250
|
|
|||||
|
Short-term debt
|
$
|
4,609
|
|
$
|
—
|
|
$
|
5,120
|
|
$
|
—
|
|
$
|
5,120
|
|
|||||
|
Long-term debt
|
$
|
20,649
|
|
$
|
—
|
|
$
|
21,957
|
|
$
|
—
|
|
$
|
21,957
|
|
|||||
The carrying amount and fair value of short-term debt exclude drafts payable.
In the
third
quarter of
2017
, we began assigning fair value hierarchy levels for our short-term and long-term debt based on the underlying instrument type. We have reclassified prior period amounts to conform to the current period presentation.
21
INTEL CORPORATION
NOTES TO CONSOLIDATED CONDENSED FINANCIAL STATEMENTS — Unaudited (Continued)
Note 15: Other Comprehensive Income (Loss)
The changes in accumulated other comprehensive income (loss) by component and related tax effects in the
first nine months
of
2017
were as follows:
|
(In Millions)
|
Unrealized Holding Gains (Losses) on Available-for-Sale Investments
|
Unrealized Holding Gains (Losses) on Derivatives
|
Prior Service Credits (Costs)
|
Actuarial Gains (Losses)
|
Foreign Currency Translation Adjustment
|
Total
|
||||||||||||||||||
|
December 31, 2016
|
$
|
2,164
|
|
$
|
(259
|
)
|
$
|
(40
|
)
|
$
|
(1,240
|
)
|
$
|
(519
|
)
|
$
|
106
|
|
||||||
|
Other comprehensive income (loss) before reclassifications
1
|
2,589
|
|
528
|
|
—
|
|
213
|
|
6
|
|
3,336
|
|
||||||||||||
|
Amounts reclassified out of accumulated other comprehensive income
|
(1,962
|
)
|
(28
|
)
|
(9
|
)
|
55
|
|
507
|
|
(1,437
|
)
|
||||||||||||
|
Tax effects
|
(219
|
)
|
(150
|
)
|
1
|
|
(27
|
)
|
—
|
|
(395
|
)
|
||||||||||||
|
Other comprehensive income (loss)
|
408
|
|
350
|
|
(8
|
)
|
241
|
|
513
|
|
1,504
|
|
||||||||||||
|
September 30, 2017
|
$
|
2,572
|
|
$
|
91
|
|
$
|
(48
|
)
|
$
|
(999
|
)
|
$
|
(6
|
)
|
$
|
1,610
|
|
||||||
|
1
|
In the second quarter of 2017, we froze future benefit accruals for our Ireland pension plan.
|
22
INTEL CORPORATION
NOTES TO CONSOLIDATED CONDENSED FINANCIAL STATEMENTS — Unaudited (Continued)
The amounts reclassified out of accumulated other comprehensive income (loss) into the consolidated condensed statements of income for each period were as follows:
|
Income Before Taxes Impact
(In Millions) |
||||||||||||||||||
|
Three Months Ended
|
Nine Months Ended
|
|||||||||||||||||
|
Comprehensive Income Components
|
Sep 30,
2017 |
Oct 1,
2016 |
Sep 30,
2017 |
Oct 1,
2016 |
Location
|
|||||||||||||
|
Unrealized holding gains (losses)
1
on available-for-sale investments:
|
||||||||||||||||||
|
$
|
916
|
|
$
|
42
|
|
$
|
1,962
|
|
$
|
530
|
|
Gains (losses) on equity investments, net
|
||||||
|
916
|
|
42
|
|
1,962
|
|
530
|
|
|||||||||||
|
Unrealized holding gains (losses) on derivatives:
|
||||||||||||||||||
|
Foreign currency contracts
|
(13
|
)
|
(11
|
)
|
(60
|
)
|
(70
|
)
|
Cost of sales
|
|||||||||
|
24
|
|
(2
|
)
|
10
|
|
(5
|
)
|
Research and development
|
||||||||||
|
4
|
|
1
|
|
(2
|
)
|
—
|
|
Marketing, general and administrative
|
||||||||||
|
12
|
|
—
|
|
28
|
|
11
|
|
Gains (losses) on equity investments, net
|
||||||||||
|
17
|
|
19
|
|
52
|
|
36
|
|
Interest and other, net
|
||||||||||
|
44
|
|
7
|
|
28
|
|
(28
|
)
|
|||||||||||
|
Amortization of pension and postretirement benefit components:
|
||||||||||||||||||
|
Prior service credits (costs)
|
(3
|
)
|
(2
|
)
|
9
|
|
(6
|
)
|
||||||||||
|
Actuarial gains (losses)
|
(15
|
)
|
(20
|
)
|
(55
|
)
|
(46
|
)
|
||||||||||
|
(18
|
)
|
(22
|
)
|
(46
|
)
|
(52
|
)
|
|||||||||||
|
Currency translation adjustment
|
—
|
|
—
|
|
(507
|
)
|
—
|
|
Interest and other, net
|
|||||||||
|
Total amounts reclassified out of accumulated other comprehensive income (loss)
|
$
|
942
|
|
$
|
27
|
|
$
|
1,437
|
|
$
|
450
|
|
||||||
|
1
|
We determine the cost of the investment sold based on an average cost basis at the individual security level.
|
The amortization of pension and postretirement benefit components are included in the computation of net periodic benefit cost. For further information, see "Note 18: Retirement Benefit Plans" in Part II, Item 8 of our 2016 Form 10-K.
We estimate that we will reclassify approximately
$94 million
(before taxes) of net derivative
gains
included in accumulated other comprehensive income (loss) into earnings within the next 12 months.
During the second quarter of 2017, we reclassified approximately
$507 million
(before taxes) of currency translation adjustment losses included in accumulated other comprehensive income (loss) into earnings as a result of our divestiture of ISecG. For more information see "
Note 10: Acquisitions and Divestitures
."
23
INTEL CORPORATION
NOTES TO CONSOLIDATED CONDENSED FINANCIAL STATEMENTS — Unaudited (Continued)
For further information on our derivative policies, see “Note 2: Accounting Policies" in Part II, Item 8 of our 2016 Form 10-K.
Volume of Derivative Activity
Total gross notional amounts for outstanding derivatives (recorded at fair value) at the end of each period were as follows:
|
(In Millions)
|
Sep 30,
2017 |
Dec 31,
2016 |
Oct 1,
2016 |
|||||||||
|
Foreign currency contracts
|
$
|
18,573
|
|
$
|
17,960
|
|
$
|
17,833
|
|
|||
|
Interest rate contracts
|
18,171
|
|
14,228
|
|
10,046
|
|
||||||
|
Other
|
1,461
|
|
1,340
|
|
1,355
|
|
||||||
|
Total
|
$
|
38,205
|
|
$
|
33,528
|
|
$
|
29,234
|
|
|||
Fair Value of Derivative Instruments in the Consolidated Condensed Balance Sheets
|
|
September 30, 2017
|
December 31, 2016
|
||||||||||||||
|
(In Millions)
|
Assets
1
|
Liabilities
2
|
Assets
1
|
Liabilities
2
|
||||||||||||
|
Derivatives designated as hedging instruments:
|
||||||||||||||||
|
Foreign currency contracts
3
|
$
|
296
|
|
$
|
33
|
|
$
|
21
|
|
$
|
252
|
|
||||
|
Interest rate contracts
|
8
|
|
125
|
|
3
|
|
187
|
|
||||||||
|
Total derivatives designated as hedging instruments
|
304
|
|
158
|
|
24
|
|
439
|
|
||||||||
|
Derivatives not designated as hedging instruments:
|
||||||||||||||||
|
Foreign currency contracts
3
|
48
|
|
437
|
|
374
|
|
114
|
|
||||||||
|
Interest rate contracts
|
11
|
|
27
|
|
15
|
|
30
|
|
||||||||
|
Other
|
11
|
|
—
|
|
9
|
|
—
|
|
||||||||
|
Total derivatives not designated as hedging instruments
|
70
|
|
464
|
|
398
|
|
144
|
|
||||||||
|
Total derivatives
|
$
|
374
|
|
$
|
622
|
|
$
|
422
|
|
$
|
583
|
|
||||
|
1
|
Derivative assets are recorded as other assets, current and non-current.
|
|
2
|
Derivative liabilities are recorded as other liabilities, current and non-current.
|
|
3
|
The majority of these instruments mature within
12 months.
|
24
INTEL CORPORATION
NOTES TO CONSOLIDATED CONDENSED FINANCIAL STATEMENTS — Unaudited (Continued)
Amounts Offset in the Consolidated Condensed Balance Sheets
The gross amounts of our derivative instruments and reverse repurchase agreements subject to master netting arrangements with various counterparties, and cash and non-cash collateral posted under such agreements at the end of each period were as follows:
|
September 30, 2017
|
||||||||||||||||||||||||
|
Gross Amounts Not Offset in the Balance Sheet
|
||||||||||||||||||||||||
|
(In Millions)
|
Gross Amounts Recognized
|
Gross Amounts Offset in the Balance Sheet
|
Net Amounts Presented in the Balance Sheet
|
Financial Instruments
|
Cash and Non-Cash Collateral Received or Pledged
|
Net Amount
|
||||||||||||||||||
|
Assets:
|
||||||||||||||||||||||||
|
Derivative assets subject to master netting arrangements
|
$
|
360
|
|
$
|
—
|
|
$
|
360
|
|
$
|
(201
|
)
|
$
|
(159
|
)
|
$
|
—
|
|
||||||
|
Reverse repurchase agreements
|
1,849
|
|
—
|
|
1,849
|
|
—
|
|
(1,849
|
)
|
—
|
|
||||||||||||
|
Total assets
|
2,209
|
|
—
|
|
2,209
|
|
(201
|
)
|
(2,008
|
)
|
—
|
|
||||||||||||
|
Liabilities:
|
||||||||||||||||||||||||
|
Derivative liabilities subject to master netting arrangements
|
603
|
|
—
|
|
603
|
|
(201
|
)
|
(377
|
)
|
25
|
|
||||||||||||
|
Total liabilities
|
$
|
603
|
|
$
|
—
|
|
$
|
603
|
|
$
|
(201
|
)
|
$
|
(377
|
)
|
$
|
25
|
|
||||||
|
December 31, 2016
|
||||||||||||||||||||||||
|
Gross Amounts Not Offset in the Balance Sheet
|
||||||||||||||||||||||||
|
(In Millions)
|
Gross Amounts Recognized
|
Gross Amounts Offset in the Balance Sheet
|
Net Amounts Presented in the Balance Sheet
|
Financial Instruments
|
Cash and Non-Cash Collateral Received or Pledged
|
Net Amount
|
||||||||||||||||||
|
Assets:
|
||||||||||||||||||||||||
|
Derivative assets subject to master netting arrangements
|
$
|
433
|
|
$
|
—
|
|
$
|
433
|
|
$
|
(368
|
)
|
$
|
(42
|
)
|
$
|
23
|
|
||||||
|
Reverse repurchase agreements
|
1,018
|
|
—
|
|
1,018
|
|
—
|
|
(1,018
|
)
|
—
|
|
||||||||||||
|
Total assets
|
1,451
|
|
—
|
|
1,451
|
|
(368
|
)
|
(1,060
|
)
|
23
|
|
||||||||||||
|
Liabilities:
|
||||||||||||||||||||||||
|
Derivative liabilities subject to master netting arrangements
|
588
|
|
—
|
|
588
|
|
(368
|
)
|
(201
|
)
|
19
|
|
||||||||||||
|
Total liabilities
|
$
|
588
|
|
$
|
—
|
|
$
|
588
|
|
$
|
(368
|
)
|
$
|
(201
|
)
|
$
|
19
|
|
||||||
We obtain and secure available collateral from counterparties against obligations, including securities lending transactions and reverse repurchase agreements, when we deem it appropriate.
25
INTEL CORPORATION
NOTES TO CONSOLIDATED CONDENSED FINANCIAL STATEMENTS — Unaudited (Continued)
Derivatives in Cash Flow Hedging Relationships
The before-tax net gains or losses, attributed to the effective portion of cash flow hedges, recognized in other comprehensive income (loss), were
$83 million
net
gains
in the
third
quarter of
2017
and
$528 million
net
gains
in the
first nine months
of
2017
(
$92 million
net
gains
in the
third
quarter of
2016
and
$374 million
net
gains
in the
first nine months
of
2016
).
Substantially all
of our cash flow hedges are foreign currency contracts for the
first nine months
of
2017
and
2016
.
During the
first nine months
of 2017 and 2016, hedge ineffectiveness and amounts excluded from effectiveness testing were
insignificant
.
For information on the unrealized holding gains (losses) on derivatives reclassified out of accumulated other comprehensive income into the consolidated condensed statements of income, see "
Note 15: Other Comprehensive Income (Loss)
."
Derivatives in Fair Value Hedging Relationships
The effects of derivative instruments designated as fair value hedges, recognized in interest and other, net for each period were as follows:
|
Three Months Ended
|
Nine Months Ended
|
|||||||||||||||
|
(In Millions)
|
Sep 30,
2017 |
Oct 1,
2016 |
Sep 30,
2017 |
Oct 1,
2016 |
||||||||||||
|
Interest rate contracts
|
$
|
(15
|
)
|
$
|
(34
|
)
|
$
|
67
|
|
$
|
188
|
|
||||
|
Hedged items
|
15
|
|
34
|
|
(67
|
)
|
(188
|
)
|
||||||||
|
Total
|
$
|
—
|
|
$
|
—
|
|
$
|
—
|
|
$
|
—
|
|
||||
There was
no
ineffectiveness during all periods presented in the preceding table.
Derivatives Not Designated as Hedging Instruments
The effects of derivative instruments not designated as hedging instruments on the consolidated condensed statements of income for each period were as follows:
|
|
|
Three Months Ended
|
Nine Months Ended
|
|||||||||||||||
|
(In Millions)
|
Location of Gains (Losses)
Recognized in Income on Derivatives
|
Sep 30,
2017 |
Oct 1,
2016 |
Sep 30,
2017 |
Oct 1,
2016 |
|||||||||||||
|
Foreign currency contracts
|
Interest and other, net
|
$
|
(91
|
)
|
$
|
(35
|
)
|
$
|
(521
|
)
|
$
|
(209
|
)
|
|||||
|
Interest rate contracts
|
Interest and other, net
|
(3
|
)
|
7
|
|
(4
|
)
|
(8
|
)
|
|||||||||
|
Other
|
Various
|
40
|
|
72
|
|
135
|
|
90
|
|
|||||||||
|
Total
|
$
|
(54
|
)
|
$
|
44
|
|
$
|
(390
|
)
|
$
|
(127
|
)
|
||||||
Our equity incentive plans are broad-based, long-term programs intended to attract and retain talented employees and align stockholder and employee interests.
In May 2017, stockholders approved an extension of the expiration date of the 2006 Equity Incentive Plan to June 2020 and approved an additional
33 million
shares reserved for issuance under the plan. As of September 30, 2017,
218 million
shares of common stock remained available for future grants.
Share-Based Compensation
Share-based compensation expense recognized was
$397 million
, which includes
$71 million
of cash-settled awards in connection with the Mobileye acquisition, in the
third
quarter of
2017
and
$1.1 billion
in the
first nine months
of
2017
(
$324 million
in the
third
quarter of
2016
and
$1.1 billion
in the
first nine months
of
2016
).
26
INTEL CORPORATION
NOTES TO CONSOLIDATED CONDENSED FINANCIAL STATEMENTS — Unaudited (Continued)
Restricted Stock Unit Awards
Restricted stock unit activity in the
first nine months
of
2017
was as follows:
|
Number of
RSUs
(In Millions)
|
Weighted Average
Grant-Date
Fair Value
|
||||||
|
December 31, 2016
|
106.8
|
|
$
|
28.99
|
|
||
|
Granted
|
41.1
|
|
$
|
34.46
|
|
||
|
Assumed in acquisition
|
1.1
|
|
$
|
34.90
|
|
||
|
Vested
|
(38.3
|
)
|
$
|
27.33
|
|
||
|
Forfeited
|
(11.1
|
)
|
$
|
29.97
|
|
||
|
September 30, 2017
|
99.6
|
|
$
|
31.84
|
|
||
The aggregate fair value of awards that vested in the
first nine months
of
2017
was
$1.5 billion
, which represents the market value of our common stock on the date that the RSUs vested. The grant-date fair value of awards that vested in
first nine months
of
2017
was
$1.0 billion
. The number of RSUs vested includes shares of common stock that we withheld on behalf of employees to satisfy the minimum statutory tax withholding requirements. RSUs that are expected to vest are net of estimated future forfeitures.
Stock Purchase Plan
The 2006 Stock Purchase Plan allows eligible employees to purchase shares of our common stock at
85%
of the value of our common stock on specific dates. Rights to purchase shares of common stock are granted during the first and third quarters of each year. The 2006 Stock Purchase Plan has
150 million
shares of common stock remaining through August 2021 for issuance.
Employees purchased
15 million
shares of common stock in the
first nine months
of
2017
for
$432 million
(
16.5 million
shares of common stock in the
first nine months
of
2016
for
$415 million
) under the 2006 Stock Purchase Plan.
Note 18: Contingencies
Legal Proceedings
We are a party to various legal proceedings, including those noted in this section. Although management at present believes that the ultimate outcome of these proceedings, individually and in the aggregate, will not materially harm our financial position, results of operations, cash flows, or overall trends, legal proceedings and related government investigations are subject to inherent uncertainties, and unfavorable rulings or other events could occur. Unfavorable resolutions could include substantial monetary damages. In addition, in matters for which injunctive relief or other conduct remedies are sought, unfavorable resolutions could include an injunction or other order prohibiting us from selling one or more products at all or in particular ways, precluding particular business practices, or requiring other remedies. An unfavorable outcome may result in a material adverse impact on our business, results of operations, financial position, and overall trends. We might also conclude that settling one or more such matters is in the best interests of our stockholders, employees and customers, and any such settlement could include substantial payments. Except as specifically described below, we have not concluded that settlement of any of the legal proceedings noted in this section is appropriate at this time.
27
INTEL CORPORATION
NOTES TO CONSOLIDATED CONDENSED FINANCIAL STATEMENTS — Unaudited (Continued)
European Commission Competition Matter
In 2001, the European Commission (EC) commenced an investigation regarding claims by Advanced Micro Devices, Inc. (AMD) that we used unfair business practices to persuade customers to buy our microprocessors. We received numerous requests for information and documents from the EC and we responded to each of those requests. The EC issued a Statement of Objections in July 2007 and held a hearing on that Statement in March 2008. The EC issued a Supplemental Statement of Objections in July 2008. In May 2009, the EC issued a decision finding that we had violated Article 82 of the EC Treaty and Article 54 of the European Economic Area Agreement. In general, the EC found that we violated Article 82 (later renumbered as Article 102 by a new treaty) by offering alleged "conditional rebates and payments" that required our customers to purchase all or most of their x86 microprocessors from us. The EC also found that we violated Article 82 by making alleged "payments to prevent sales of specific rival products." The EC imposed a fine in the amount of
€1.1 billion
(
$1.4 billion
as of May 2009), which we subsequently paid during the third quarter of 2009, and ordered us to "immediately bring to an end the infringement referred to in" the EC decision.
The EC decision contained no specific direction on whether or how we should modify our business practices. Instead, the decision stated that we should "cease and desist" from further conduct that, in the EC's opinion, would violate applicable law. We took steps, which are subject to the EC's ongoing review, to comply with that decision pending appeal. We had discussions with the EC to better understand the decision and to explain changes to our business practices.
We appealed the EC decision to the Court of First Instance (which has been renamed the General Court) in July 2009. The hearing of our appeal took place in July 2012. In June 2014, the General Court rejected our appeal in its entirety. In August 2014, we filed an appeal with the European Court of Justice. In November 2014, Intervener Association for Competitive Technologies filed comments in support of Intel’s grounds of appeal. The EC and interveners filed briefs in November 2014, we filed a reply in February 2015, and the EC filed a rejoinder in April 2015. The Court of Justice held oral argument in June 2016. In October 2016, Advocate General Wahl, an advisor to the Court of Justice, issued a non-binding advisory opinion which favored Intel on a number of grounds.
The Court of Justice issued its decision in September 2017, setting aside the judgment of the General Court and sending the case back to the General Court to examine whether the rebates at issue are capable of restricting competition. The General Court has appointed a panel of five judges to consider our appeal of the EC’s 2009 decision in light of the Court of Justice’s clarifications of the law. The parties are expected to file initial “Observations” about the Court of Justice’s decision and the appeal in November 2017. Pending the final decision in this matter, the fine paid by Intel has been placed by the EC in commercial bank accounts where it accrues interest.
Shareholder Derivative Litigation regarding In re High Tech Employee Antitrust Litigation
In March 2014, the Police Retirement System of St. Louis (PRSSL) filed a shareholder derivative action in the Superior Court of California in Santa Clara County against Intel, certain current and former members of our Board of Directors, and former officers. The complaint alleges that the defendants breached their duties to the company by participating in, or allowing, purported antitrust violations, which were alleged in a now-settled antitrust class action lawsuit captioned
In re High Tech Employee Antitrust Litigation
claiming that
Intel, Adobe Systems Incorporated, Apple Inc., Google Inc., Intuit Inc., Lucasfilm Ltd., and Pixar conspired to suppress their employees’ compensation. In March 2014, a second plaintiff, Barbara Templeton, filed a substantially similar derivative suit in the same court. In May 2014, a third shareholder, Robert Achermann, filed a substantially similar derivative action in the same court. The court consolidated the three actions into one, which is captioned
In re Intel Corporation Shareholder Derivative Litigation
. Plaintiffs filed a consolidated complaint in July 2014. In August 2015, the court granted our motion to dismiss the consolidated complaint. The plaintiffs thereafter filed a motion for reconsideration and a motion for new trial, both of which the court denied in October 2015. In November 2015, plaintiffs PRSSL and Templeton appealed the court's decision. The appeal is fully briefed, and we are waiting on a hearing date from the appellate court.
In June 2015, the International Brotherhood of Electrical Workers (IBEW) filed a shareholder derivative action in the Chancery Court in Delaware against Intel, certain current and former members of our Board of Directors, and former officers. The lawsuit makes allegations substantially similar to those in the California shareholder derivative litigation described above, but additionally alleges breach of the duty of disclosure with respect to
In re High Tech Employee Antitrust Litigation
and that Intel's 2013 and 2014 proxy statements misrepresented the effectiveness of the Board’s oversight of compliance issues at Intel and the Board’s compliance with Intel’s Code of Conduct and Board of Director Guidelines on Significant Corporate Governance Issues. In October 2015, the court stayed the IBEW lawsuit for six months pending further developments in the California case. In March 2016, Intel and IBEW entered into a stipulated dismissal pursuant to which IBEW dismissed its complaint but may re-file upon the withdrawal or final resolution of the appeal in the PRSSL California shareholder derivative litigation.
28
INTEL CORPORATION
NOTES TO CONSOLIDATED CONDENSED FINANCIAL STATEMENTS — Unaudited (Continued)
In April 2016, John Esposito filed a shareholder derivative action in the Superior Court of California in Santa Clara County against Intel, current members of our Board of Directors, and certain former officers and employees. Esposito made a demand on our Board in 2013 to investigate whether our officers or directors should be sued for their participation in the events described in
In re High Tech Employee Antitrust Litigation
. In November 2015, our Board decided not to take further action on Esposito’s demand based on the recommendation of the Audit Committee of the Board after its investigation of relevant facts and circumstances. Esposito seeks to set aside such decision, and alleges that the Board was not disinterested in making that decision and that the investigation was inadequate. In November 2016, the court granted Intel’s motion to dismiss the case, without leave to amend. In March 2017, plaintiff filed a motion for fees. The court denied plaintiff’s fee motion in May 2017, and entered final judgment in this matter in June 2017. In August 2017, Esposito appealed the final judgment.
McAfee, Inc. Shareholder Litigation
On August 19, 2010, we announced that we had agreed to acquire all of the common stock of McAfee, Inc. (McAfee) for
$48.00
per share. Four McAfee shareholders filed putative class-action lawsuits in Santa Clara County, California Superior Court challenging the proposed transaction. The cases were ordered consolidated in September 2010. Plaintiffs filed an amended complaint that named former McAfee board members, McAfee, and Intel as defendants, and alleged that the McAfee board members breached their fiduciary duties and that McAfee and Intel aided and abetted those breaches of duty. The complaint requested rescission of the merger agreement, such other equitable relief as the court may deem proper, and an award of damages in an unspecified amount. In June 2012, the plaintiffs’ damages expert asserted that the value of a McAfee share for the purposes of assessing damages should be
$62.08
.
In January 2012, the court certified the action as a class action, appointed the Central Pension Laborers’ Fund to act as the class representative and scheduled trial to begin in January 2013. In March 2012, defendants filed a petition with the California Court of Appeal for a writ of mandate to reverse the class certification order; the petition was denied in June 2012. In March 2012, at defendants’ request, the court held that plaintiffs were not entitled to a jury trial and ordered a bench trial. In April 2012, plaintiffs filed a petition with the California Court of Appeal for a writ of mandate to reverse that order, which the court of appeal denied in July 2012. In August 2012, defendants filed a motion for summary judgment. The trial court granted that motion in November 2012, and entered final judgment in the case in February 2013. In April 2013, plaintiffs appealed the final judgment. The California Court of Appeal heard oral argument in October 2017, and the parties await the court’s decision. Because the resolution of the appeal may materially impact the scope and nature of the proceeding, we are unable to make a reasonable estimate of the potential loss or range of losses, if any, arising from this matter. We dispute the class-action claims and intend to continue to defend the lawsuit vigorously.
Intel Corporation v. Future Link Systems, LLC
In March 2014, we filed a complaint against Future Link Systems, LLC (Future Link) in the United States District Court for the District of Delaware, requesting a declaratory judgment that Intel and our customers do not infringe any valid, enforceable claim of
nine
patents owned by Future Link. In July 2015, Future Link filed counterclaims against Intel alleging infringement of
fifteen
patents. In June 2017, the court denied both parties’
Daubert
motions to exclude opinions of the other parties’ damages experts. In July 2017, the court ruled on numerous motions for summary judgment of certain claims filed by both Intel and Future Link. As of July 2017, Future Link alleged infringement of
fourteen
patents, claimed past damages in the amount of approximately
$9.9 billion
in its experts’ reports, and sought additional damages accrued through trial and ongoing royalties after trial in an unspecified amount. The court scheduled a jury trial for September 2017 on Future Link’s infringement claims regarding
three
patents with a past damages claim of approximately
$2.9 billion
and ordered that other proceedings be stayed. In August 2017, the parties reached a confidential settlement agreement resolving all claims. The settlement did not have a material financial impact to Intel.
29
|
ITEM 2.
|
MANAGEMENT’S DISCUSSION AND ANALYSIS OF FINANCIAL CONDITION AND RESULTS OF OPERATIONS
|
Our Management’s Discussion and Analysis of Financial Condition and Results of Operations (MD&A) is provided in addition to the accompanying consolidated condensed financial statements and notes to assist readers in understanding our results of operations, financial condition, and cash flows. MD&A is organized as follows:
|
•
|
Overview
. Discussion of our business and overall analysis of financial and other highlights affecting the company in order to provide context for the remainder of MD&A.
|
|
•
|
Results of Operations
. Analysis of our financial results comparing the
three and nine
months ended
September 30, 2017
to the
three and nine
months ended
October 1, 2016
.
|
|
•
|
Liquidity and Capital Resources
. Analysis of changes in our balance sheets and cash flows, and discussion of our financial condition and potential sources of liquidity.
|
|
•
|
Contractual Obligations.
Material changes, outside our ordinary course of business, to our significant contractual obligations as of
December 31, 2016
.
|
This interim MD&A should be read in conjunction with the MD&A in our Annual Report on Form 10-K for the fiscal year ended
December 31, 2016
(2016 Form 10-K).
30
INTEL CORPORATION
MANAGEMENT'S DISCUSSION AND ANALYSIS OF FINANCIAL CONDITION AND RESULTS OF OPERATIONS (Continued)
Overview
(Dollars in Billions, Except Per Share Amounts)
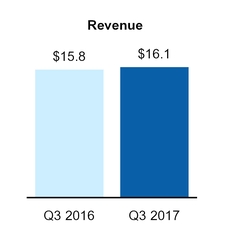
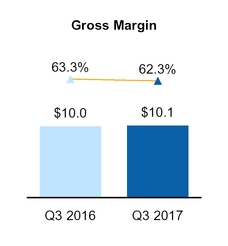
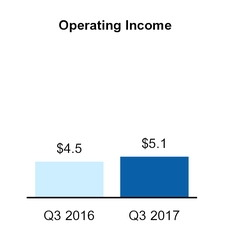
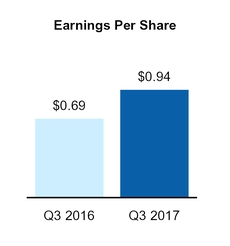
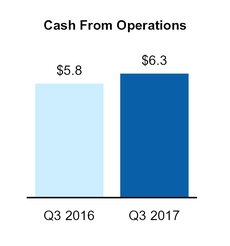
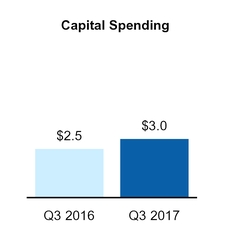
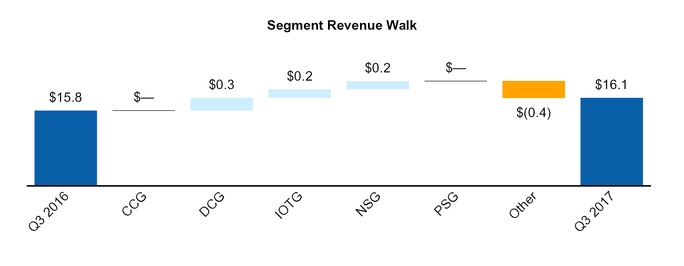
31
INTEL CORPORATION
MANAGEMENT'S DISCUSSION AND ANALYSIS OF FINANCIAL CONDITION AND RESULTS OF OPERATIONS (Continued)
In
Q3 2017
we achieved revenue of
$16.1 billion
, an increase of
$371 million
or
2%
from
Q3 2016
. Excluding the divested Intel Security Group (ISecG), revenue grew 6% from a year ago. Compared to
Q3 2016
, our topline growth was primarily driven by strong performance across our data-centric businesses*, which collectively grew 15% year-on-year after adjusting for ISecG. Data Center Group (DCG), Internet of Things Group (IOTG), and Non-Volatile Memory Solutions Group (NSG) all achieved record quarterly revenue. Earnings per share were
$0.94
,
up
25 cents
on a year-on-year basis.
|
•
|
CCG, our PC-centric business, had revenue of
$8.9 billion
with platform volumes
down
7%
and platform average selling prices
up
7%
compared to
Q3 2016
. We saw a typical inventory build ahead of the holiday season and we believe the worldwide PC supply chain is operating at healthy levels. The PC-centric business continued to improve profitability as operating income grew
8%
from a year ago.
|
|
•
|
The data-centric businesses represent approximately 45% of our total revenue. DCG had revenue of
$4.9 billion
,
up
7%
with platform volumes
up
4%
and platform average selling prices
up
2%
compared to
Q3 2016
. IOTG, NSG, and Programmable Solutions Group (PSG) are collectively becoming a larger component of our overall business, growing 25% in aggregate in Q3 2017 from a year ago.
|
|
•
|
Gross margin of
62.3%
was
down 1 point
compared to
Q3 2016
.
|
|
•
|
Research and development (R&D) plus marketing, general, and administrative (MG&A) spending for the quarter was
$4.9 billion
,
down 4%
from a year ago. R&D and MG&A were
30%
of revenue in
Q3 2017
, down approximately
2
points from
Q3 2016
, and
34%
of revenue in the
first nine months
of
2017
, down approximately 3 points from the first nine months of 2016.
|
|
•
|
Operating income for
Q3 2017
was
$5.1 billion
,
up
15%
on a year-on-year basis. The tax rate for the quarter was
23.8%
,
up 2 points
compared to
Q3 2016
. Net income for
Q3 2017
was
$4.5 billion
,
up
34%
from
Q3 2016
.
|
|
•
|
Q3 2017 operating income and EPS are all-time records. The EPS increase of
25 cents
was driven by higher platform revenue, growth in adjacent businesses**, lower restructuring and other charges, and higher gains on sales of a portion of our interest in ASML Holding N.V. (ASML).
|
|
•
|
Our business continues to generate healthy cash flow with
$6.3 billion
of cash from operations in
Q3 2017
. During
Q3 2017
, we purchased
$3.0 billion
in capital assets, paid
$1.3 billion
in dividends, and used
$1.1 billion
to repurchase
31 million
shares of stock.
|
Four months ahead of our expectations, we completed our tender offer for the outstanding ordinary shares of Mobileye B.V. (Mobileye), a global leader in the development of computer vision and machine learning, data analysis, localization and mapping for advanced driver assistance systems and autonomous driving. As a result of the completion, in Q3 2017 we had acquisition-related impacts associated with this transaction, including inventory valuation adjustment of
$27 million
and other acquisition-related charges of
$113 million
.
During the quarter, we launched our 8th Generation Intel
®
Core™ Processors, code named Coffee Lake, which delivered significant performance improvement to our client platforms. In addition, we are making great progress in artificial intelligence. For example, we launched the Intel
®
Movidius™ Myriad™ X vision processing unit (VPU), the world's first VPU with a dedicated Neural Compute Engine to deliver artificial intelligence capabilities to the edge in a low-power and high-performance package.
* Data-centric businesses consist of DCG, IOTG, NSG, PSG, and all other.
** Adjacent businesses consist of our non-platform results.
32
INTEL CORPORATION
MANAGEMENT'S DISCUSSION AND ANALYSIS OF FINANCIAL CONDITION AND RESULTS OF OPERATIONS (Continued)
Results of Operations
|
Three Months Ended
|
Nine Months Ended
|
|||||||||||||||||||||||||||
|
|
Q3 2017
|
Q3 2016
|
YTD 2017
|
YTD 2016
|
||||||||||||||||||||||||
|
(Dollars in Millions, Except Per Share Amounts)
|
Dollars
|
% of Net
Revenue |
Dollars
|
% of Net
Revenue |
Dollars
|
% of Net
Revenue |
Dollars
|
% of Net
Revenue |
||||||||||||||||||||
|
Net revenue
|
$
|
16,149
|
|
100.0
|
%
|
$
|
15,778
|
|
100.0
|
%
|
$
|
45,708
|
|
100.0
|
%
|
$
|
43,013
|
|
100.0
|
%
|
||||||||
|
Cost of sales
|
6,092
|
|
37.7
|
%
|
5,795
|
|
36.7
|
%
|
17,406
|
|
38.1
|
%
|
16,927
|
|
39.4
|
%
|
||||||||||||
|
Gross margin
|
10,057
|
|
62.3
|
%
|
9,983
|
|
63.3
|
%
|
28,302
|
|
61.9
|
%
|
26,086
|
|
60.6
|
%
|
||||||||||||
|
Research and development
|
3,223
|
|
20.0
|
%
|
3,069
|
|
19.4
|
%
|
9,824
|
|
21.5
|
%
|
9,460
|
|
22.0
|
%
|
||||||||||||
|
Marketing, general and administrative
|
1,666
|
|
10.3
|
%
|
2,006
|
|
12.7
|
%
|
5,624
|
|
12.3
|
%
|
6,239
|
|
14.5
|
%
|
||||||||||||
|
Restructuring and other charges
|
4
|
|
—
|
%
|
372
|
|
2.4
|
%
|
189
|
|
0.4
|
%
|
1,786
|
|
4.1
|
%
|
||||||||||||
|
Amortization of acquisition-related intangibles
|
49
|
|
0.3
|
%
|
74
|
|
0.5
|
%
|
124
|
|
0.3
|
%
|
253
|
|
0.6
|
%
|
||||||||||||
|
Operating income
|
5,115
|
|
31.7
|
%
|
4,462
|
|
28.3
|
%
|
12,541
|
|
27.4
|
%
|
8,348
|
|
19.4
|
%
|
||||||||||||
|
Gains (losses) on equity investments, net
|
846
|
|
5.2
|
%
|
(12
|
)
|
(0.1
|
)%
|
1,440
|
|
3.2
|
%
|
488
|
|
1.1
|
%
|
||||||||||||
|
Interest and other, net
|
(31
|
)
|
(0.2
|
)%
|
(132
|
)
|
(0.8
|
)%
|
336
|
|
0.7
|
%
|
(340
|
)
|
(0.7
|
)%
|
||||||||||||
|
Income before taxes
|
5,930
|
|
36.7
|
%
|
4,318
|
|
27.4
|
%
|
14,317
|
|
31.3
|
%
|
8,496
|
|
19.8
|
%
|
||||||||||||
|
Provision for taxes
|
1,414
|
|
8.7
|
%
|
940
|
|
6.0
|
%
|
4,029
|
|
8.8
|
%
|
1,742
|
|
4.1
|
%
|
||||||||||||
|
Net income
|
$
|
4,516
|
|
28.0
|
%
|
$
|
3,378
|
|
21.4
|
%
|
$
|
10,288
|
|
22.5
|
%
|
$
|
6,754
|
|
15.7
|
%
|
||||||||
|
Diluted earnings per common share
|
$
|
0.94
|
|
$
|
0.69
|
|
$
|
2.12
|
|
$
|
1.39
|
|
||||||||||||||||
Net Revenue
Our net revenue in
Q3 2017
increased
by
$371 million
, or
2%
, compared to
Q3 2016
. The increase in revenue was driven by higher NSG revenue as well as DCG and IOTG platform unit sales, which was partially offset by desktop platform unit sales. Additionally, revenue was positively impacted by desktop and notebook platform average selling price increases due to mix of products which was partially offset by changes to the Intel Inside
®
program in Q3 2017. We are implementing this change in an effort to make the program more efficient, effective and to provide more flexibility to our customers. This change to the Intel Inside
®
program impacts the way we classify our cooperative advertising costs and resulted in a reduction in revenue of approximately $200 million with a corresponding reduction in marketing expenses.
Our net revenue for the
first nine months
of
2017
increased
by
$2.7 billion
, or
6%
, compared to the
first nine months
of
2016
, which reflected an extra workweek. The higher revenue was driven by higher platform average selling prices,
up
7%
, primarily from notebook and DCG platforms. Additionally, revenue increased due to higher notebook, DCG and IOTG platform unit sales. Revenue also increased from higher NSG and CCG modem revenue. The increase in revenue was offset by the
Q2 2017
divestiture of ISecG and lower desktop platform unit sales.
33
INTEL CORPORATION
MANAGEMENT'S DISCUSSION AND ANALYSIS OF FINANCIAL CONDITION AND RESULTS OF OPERATIONS (Continued)
Gross Margin
Our overall gross margin percentage was
62.3%
in
Q3 2017
,
down
from
63.3%
in
Q3 2016
, and was
61.9%
in the
first nine months
of
2017
,
up
from
60.6%
in the
first nine months
of
2016
. Our overall gross margin dollars in
Q3 2017
increased
by
$74 million
, or
0.7%
, compared to
Q3 2016
, and in the
in the
first nine months
of
2017
increased
by
$2.2 billion
, or
8.5%
, compared to the
first nine months
of
2016
.
We derived most of our overall gross margin dollars from the sale of platforms in the CCG and DCG operating segments.
|
(In Millions)
|
Gross Margin Reconciliation
|
|||
|
$
|
10,057
|
|
Q3 2017 Gross Margin
|
|
|
290
|
|
Lower platform unit cost, primarily on 14nm cost improvement
|
||
|
280
|
|
Higher gross margin from platform revenue
|
||
|
(170
|
)
|
Impact of the ISecG divestiture, offset by higher gross margin from adjacent businesses
|
||
|
(260
|
)
|
Higher period charges associated with the ramp of our 10nm process technology
|
||
|
(66
|
)
|
Other
|
||
|
$
|
9,983
|
|
Q3 2016 Gross Margin
|
|
|
(In Millions)
|
Gross Margin Reconciliation
|
|||
|
$
|
28,302
|
|
YTD 2017 Gross Margin
|
|
|
1,795
|
|
Higher gross margin from platform revenue
|
||
|
930
|
|
Lower platform unit cost, primarily on 14nm cost improvement
|
||
|
480
|
|
Lower Altera and other acquisition-related charges
|
||
|
(300
|
)
|
Impact of the ISecG divestiture, offset by higher gross margin from adjacent businesses
|
||
|
(580
|
)
|
Higher factory start-up costs, primarily driven by the ramp of our 10nm process technology
|
||
|
(109
|
)
|
Other
|
||
|
$
|
26,086
|
|
YTD 2016 Gross Margin
|
|
Client Computing Group
|
(Dollars in Millions)
|
Q3 2017
|
Q3 2016
|
% Change
|
YTD 2017
|
YTD 2016
|
% Change
|
||||||||||||||||
|
Platform revenue
|
$
|
8,132
|
|
$
|
8,258
|
|
(2
|
)%
|
$
|
23,163
|
|
$
|
22,395
|
|
3
|
%
|
||||||
|
Other revenue
|
728
|
|
634
|
|
15
|
%
|
1,886
|
|
1,384
|
|
36
|
%
|
||||||||||
|
Net revenue
|
$
|
8,860
|
|
$
|
8,892
|
|
—
|
%
|
$
|
25,049
|
|
$
|
23,779
|
|
5
|
%
|
||||||
|
Operating income
|
$
|
3,600
|
|
$
|
3,327
|
|
8
|
%
|
$
|
9,656
|
|
$
|
7,123
|
|
36
|
%
|
||||||
|
CCG platform unit sales
|
(7
|
)%
|
(3
|
)%
|
||||||||||||||||||
|
CCG platform average selling prices
|
7
|
%
|
7
|
%
|
||||||||||||||||||
CCG revenue in
Q3 2017
was flat compared to
Q3 2016
. The following impacted CCG revenue:
|
(In Millions)
|
Revenue Reconciliation
|
|||
|
$
|
8,860
|
|
Q3 2017 CCG Revenue
|
|
|
(192
|
)
|
Lower desktop platform unit sales, down 6%
|
||
|
94
|
|
Higher CCG other revenue, including modem products
|
||
|
66
|
|
Other platform impacts
|
||
|
$
|
8,892
|
|
Q3 2016 CCG Revenue
|
|
34
INTEL CORPORATION
MANAGEMENT'S DISCUSSION AND ANALYSIS OF FINANCIAL CONDITION AND RESULTS OF OPERATIONS (Continued)
|
(In Millions)
|
Revenue Reconciliation
|
|||
|
$
|
25,049
|
|
YTD 2017 CCG Revenue
|
|
|
657
|
|
Higher notebook platform unit sales, up 5%
|
||
|
571
|
|
Higher notebook platform average selling prices, up 4%, from mix of processors
|
||
|
502
|
|
Higher CCG other revenue, including modem products
|
||
|
(482
|
)
|
Lower desktop platform unit sales, down 4%
|
||
|
22
|
|
Other platform impacts
|
||
|
$
|
23,779
|
|
YTD 2016 CCG Revenue
|
|
The following impacted CCG operating income:
|
(In Millions)
|
Operating Income Reconciliation
|
|||
|
$
|
3,600
|
|
Q3 2017 CCG Operating Income
|
|
|
275
|
|
Lower CCG platform unit cost, primarily on 14nm cost improvement
|
||
|
145
|
|
Lower factory start-up costs, primarily driven by the ramp of our 10nm process technology
|
||
|
(215
|
)
|
Higher period charges associated with the ramp of our 10nm process technology
|
||
|
68
|
|
Other
|
||
|
$
|
3,327
|
|
Q3 2016 CCG Operating Income
|
|
|
(In Millions)
|
Operating Income Reconciliation
|
|||
|
$
|
9,656
|
|
YTD 2017 CCG Operating Income
|
|
|
1,025
|
|
Lower CCG platform unit cost, primarily on 14nm cost improvement
|
||
|
865
|
|
Higher gross margin from CCG platform revenue
|
||
|
565
|
|
Lower CCG spending and share of technology development and MG&A costs
|
||
|
78
|
|
Other
|
||
|
$
|
7,123
|
|
YTD 2016 CCG Operating Income
|
|
Data Center Group
|
(Dollars in Millions)
|
Q3 2017
|
Q3 2016
|
% Change
|
YTD 2017
|
YTD 2016
|
% Change
|
||||||||||||||||
|
Platform revenue
|
$
|
4,439
|
|
$
|
4,164
|
|
7
|
%
|
$
|
12,344
|
|
$
|
11,589
|
|
7
|
%
|
||||||
|
Other revenue
|
439
|
|
378
|
|
16
|
%
|
1,138
|
|
979
|
|
16
|
%
|
||||||||||
|
Net revenue
|
$
|
4,878
|
|
$
|
4,542
|
|
7
|
%
|
$
|
13,482
|
|
$
|
12,568
|
|
7
|
%
|
||||||
|
Operating income
|
$
|
2,255
|
|
$
|
2,110
|
|
7
|
%
|
$
|
5,403
|
|
$
|
5,639
|
|
(4
|
)%
|
||||||
|
DCG platform unit sales
|
4
|
%
|
3
|
%
|
||||||||||||||||||
|
DCG platform average selling prices
|
2
|
%
|
3
|
%
|
||||||||||||||||||
DCG revenue in
Q3 2017
was
up
7%
compared to
Q3 2016
based on growth in the cloud market segment, up 24%, and the communication market segment, up 9%, offset by the enterprise market segment, down 6%.
The following impacted DCG revenue:
|
(In Millions)
|
Revenue Reconciliation
|
|||
|
$
|
4,878
|
|
Q3 2017 DCG Revenue
|
|
|
173
|
|
Higher DCG platform unit sales, up 4%
|
||
|
102
|
|
Higher DCG platform average selling prices, up 2%, from mix of processors
|
||
|
61
|
|
Other
|
||
|
$
|
4,542
|
|
Q3 2016 DCG Revenue
|
|
35
INTEL CORPORATION
MANAGEMENT'S DISCUSSION AND ANALYSIS OF FINANCIAL CONDITION AND RESULTS OF OPERATIONS (Continued)
|
(In Millions)
|
Revenue Reconciliation
|
|||
|
$
|
13,482
|
|
YTD 2017 DCG Revenue
|
|
|
384
|
|
Higher DCG platform unit sales, up 3%
|
||
|
371
|
|
Higher DCG platform average selling prices, up 3%, from mix of processors
|
||
|
159
|
|
Other
|
||
|
$
|
12,568
|
|
YTD 2016 DCG Revenue
|
|
The following impacted DCG operating income:
|
(In Millions)
|
Operating Income Reconciliation
|
|||
|
$
|
2,255
|
|
Q3 2017 DCG Operating Income
|
|
|
255
|
|
Higher gross margin from DCG platform revenue
|
||
|
(145
|
)
|
Higher factory start-up costs, primarily driven by the ramp of our 10nm process technology
|
||
|
35
|
|
Other
|
||
|
$
|
2,110
|
|
Q3 2016 DCG Operating Income
|
|
|
(In Millions)
|
Operating Income Reconciliation
|
|||
|
$
|
5,403
|
|
YTD 2017 DCG Operating Income
|
|
|
(555
|
)
|
Higher factory start-up costs, primarily driven by the ramp of our 10nm process technology
|
||
|
(365
|
)
|
Higher DCG operating expense, primarily on increased share of technology development and MG&A costs
|
||
|
710
|
|
Higher gross margin from DCG platform revenue
|
||
|
(26
|
)
|
Other
|
||
|
$
|
5,639
|
|
YTD 2016 DCG Operating Income
|
|
Internet of Things Group
|
(Dollars in Millions)
|
Q3 2017
|
Q3 2016
|
% Change
|
YTD 2017
|
YTD 2016
|
% Change
|
||||||||||||||||
|
Platform revenue
|
$
|
680
|
|
$
|
605
|
|
12
|
%
|
$
|
1,926
|
|
$
|
1,673
|
|
15
|
%
|
||||||
|
Other revenue
|
169
|
|
84
|
|
101
|
%
|
364
|
|
239
|
|
52
|
%
|
||||||||||
|
Net revenue
|
$
|
849
|
|
$
|
689
|
|
23
|
%
|
$
|
2,290
|
|
$
|
1,912
|
|
20
|
%
|
||||||
|
Operating income
|
$
|
146
|
|
$
|
191
|
|
(24
|
)%
|
$
|
390
|
|
$
|
403
|
|
(3
|
)%
|
||||||
The net revenue for the IOTG operating segment
increased
by
$160 million
in
Q3 2017
compared to
Q3 2016
, driven by
$152 million
from
higher IOTG platform unit sales
and $74 million of milestone-based revenue from adjacent business,
offset by
$77 million
from
lower IOTG platform average selling prices
. IOTG revenue grew across the retail, industrial, and video market segments.
The net revenue for the IOTG operating segment
increased
by
$378 million
in the
first nine months
of
2017
compared to the
first nine months
of
2016
, driven by
$201 million
from
higher IOTG platform unit sales
, $74 million of milestone-based revenue from adjacent business,
and
$52 million
from
higher IOTG platform average selling prices
.
The operating income for the IOTG operating segment
decreased
by
$45 million
in
Q3 2017
compared to
Q3 2016
, and
decreased
by
$13 million
in the
first nine months
of
2017
compared to the
first nine months
of
2016
. The operating income decreases were driven by
higher spending and increased share of technology development and MG&A costs, partially offset by higher gross margin from IOTG revenue
.
36
INTEL CORPORATION
MANAGEMENT'S DISCUSSION AND ANALYSIS OF FINANCIAL CONDITION AND RESULTS OF OPERATIONS (Continued)
Non-Volatile Memory Solutions Group
|
(Dollars in Millions)
|
Q3 2017
|
Q3 2016
|
% Change
|
YTD 2017
|
YTD 2016
|
% Change
|
||||||||||||||||
|
Net revenue
|
$
|
891
|
|
$
|
649
|
|
37
|
%
|
$
|
2,631
|
|
$
|
1,760
|
|
49
|
%
|
||||||
|
Operating income (loss)
|
$
|
(52
|
)
|
$
|
(134
|
)
|
61
|
%
|
$
|
(291
|
)
|
$
|
(453
|
)
|
36
|
%
|
||||||
The net revenue for the NSG operating segment
increased
by
$242 million
in
Q3 2017
compared to
Q3 2016
, driven by
$347 million higher volume due to strength in data center, offset by $105 million lower average selling prices due to mix of products sold
.
The net revenue for the NSG operating segment
increased
by
$871 million
in the
first nine months
of
2017
compared to the
first nine months
of
2016
, driven by
$1.3 billion higher SSD volume from market demand and strength in data center, offset by $401 million lower average selling prices due to mix of products sold
.
The operating loss for the NSG operating segment
decreased
by
$82 million
in
Q3 2017
compared to
Q3 2016
. Operating loss decrease was primarily driven by
$156 million lower unit cost due to mix of products and cost improvements as we continue to ramp our Dalian, China facility.
The operating loss for the NSG operating segment
decreased
$162 million
in the
first nine months
of
2017
compared to the
first nine months
of
2016
, driven by
$401 million lower unit cost due to mix of products and cost improvements, and by higher volume, offset by lower average selling prices
.
Programmable Solutions Group
|
(Dollars in Millions)
|
Q3 2017
|
Q3 2016
|
% Change
|
YTD 2017
|
YTD 2016
|
% Change
|
||||||||||||||||
|
Net revenue
|
$
|
469
|
|
$
|
425
|
|
10
|
%
|
$
|
1,334
|
|
$
|
1,249
|
|
7
|
%
|
||||||
|
Operating income (loss)
|
$
|
113
|
|
$
|
78
|
|
45
|
%
|
$
|
302
|
|
$
|
(184
|
)
|
n/m
|
|
||||||
PSG had operating income in the
first nine months
of
2017
compared to an operating loss in the
first nine months
of
2016
, primarily driven by acquisition-related charges, including a deferred revenue write-down and inventory valuation adjustment, in the
first nine months
of
2016
. Due to the revaluation of deferred revenue to fair value, we excluded revenue of
$99 million
and associated costs that would have created
$64 million
of operating income in the
first nine months
of
2016
. Additionally, we incurred approximately
$387 million
in the
first nine months
of
2016
of additional cost of sales charges that would have been excluded from the operating results in the
first nine months
of
2016
if the acquired inventory had not been remeasured to fair value upon acquisition and then sold to end customers, resulting in zero margin on that inventory for the period.
37
INTEL CORPORATION
MANAGEMENT'S DISCUSSION AND ANALYSIS OF FINANCIAL CONDITION AND RESULTS OF OPERATIONS (Continued)
Operating Expenses
|
(Dollars in Millions)
|
Q3 2017
|
Q3 2016
|
YTD 2017
|
YTD 2016
|
||||||||||||
|
Research and development (R&D)
|
$
|
3,223
|
|
$
|
3,069
|
|
$
|
9,824
|
|
$
|
9,460
|
|
||||
|
Marketing, general and administrative (MG&A)
|
$
|
1,666
|
|
$
|
2,006
|
|
$
|
5,624
|
|
$
|
6,239
|
|
||||
|
R&D and MG&A as percentage of net revenue
|
30.3
|
%
|
32.2
|
%
|
33.8
|
%
|
36.5
|
%
|
||||||||
|
Restructuring and other charges
|
$
|
4
|
|
$
|
372
|
|
$
|
189
|
|
$
|
1,786
|
|
||||
|
Amortization of acquisition-related intangibles
|
$
|
49
|
|
$
|
74
|
|
$
|
124
|
|
$
|
253
|
|
||||
Research and Development
R&D
increased
by
$154 million
, or
5%
, in
Q3 2017
compared to
Q3 2016
and by
$364 million
, or
4%
, in the
first nine months
of
2017
compared to the
first nine months
of
2016
. These increases were driven by higher process development costs for our 7nm process technology, higher investments in data-centric businesses, and higher profit-dependent compensation due to an increase in net income. Increases were partially offset by the ISecG divestiture, cost savings from gained efficiencies, and the impact of an extra work week in Q1 2016.
Marketing, General and Administrative
MG&A
decreased
by
$340 million
, or
17%
, in
Q3 2017
compared to
Q3 2016
. This decrease was driven by the ISecG divestiture and changes to the Intel Inside
®
program, partially offset by acquisition-related charges associated with Mobileye and higher profit-dependent compensation due to an increase in net income.
MG&A
decreased
$615 million
, or
10%
, in the
first nine months
of
2017
compared to the
first nine months
of
2016
. This decrease was driven by the ISecG divestiture, changes to the Intel Inside
®
program, and the impact of an extra work week in Q1 2016, partially offset by higher profit-dependent compensation due to an increase in net income.
Restructuring and Other Charges
|
(In Millions)
|
Q3 2017
|
Q3 2016
|
YTD 2017
|
YTD 2016
|
||||||||||||
|
2016 Restructuring Program
|
$
|
2
|
|
$
|
349
|
|
$
|
(51
|
)
|
$
|
1,763
|
|
||||
|
Other charges
|
2
|
|
23
|
|
240
|
|
23
|
|
||||||||
|
Total restructuring and other charges
|
$
|
4
|
|
$
|
372
|
|
$
|
189
|
|
$
|
1,786
|
|
||||
2016 Restructuring Program
. In Q2 2016, our management approved and commenced the 2016 Restructuring Program. The program was substantially completed during
Q2 2017
.
Other Charges.
Other charges consist primarily of expenses associated with the divestiture of ISecG that was completed in
Q2 2017
.
For further information, see "
Note 7: Restructuring and Other Charges
" in Part I, Item 1 of this Form 10-Q.
38
INTEL CORPORATION
MANAGEMENT'S DISCUSSION AND ANALYSIS OF FINANCIAL CONDITION AND RESULTS OF OPERATIONS (Continued)
Gains (Losses) on Equity Investments and Interest and Other, Net
|
(In Millions)
|
Q3 2017
|
Q3 2016
|
YTD 2017
|
YTD 2016
|
||||||||||||
|
Gains (losses) on equity investments, net
|
$
|
846
|
|
$
|
(12
|
)
|
$
|
1,440
|
|
$
|
488
|
|
||||
|
Interest and other, net
|
$
|
(31
|
)
|
$
|
(132
|
)
|
$
|
336
|
|
$
|
(340
|
)
|
||||
Gains (losses) on equity investments, net
We recognized higher net realized gains on sales of a portion of our interest in ASML of
$926 million
in
Q3 2017
and
$2.0 billion
in the
first nine months
of
2017
compared to
$407 million
for the
first nine months
of
2016
. The higher net realized gains were partially offset by
$613 million
of impairment charges and our share of equity method investee losses for the
first nine months
of
2017
.
Interest and other, net
We recognized a lower interest and other, net loss in
Q3 2017
compared to
Q3 2016
due primarily to higher interest income
Q3 2017
. We recognized an interest and other, net gain for the
first nine months
of
2017
compared to a net loss for the
first nine months
of
2016
due primarily to a
$387 million
gain on the divestiture of ISecG in Q2 2017 and higher interest income in the
first nine months
of
2017
.
Provision for Taxes
|
(Dollars in Millions)
|
Q3 2017
|
Q3 2016
|
YTD 2017
|
YTD 2016
|
||||||||||||
|
Income before taxes
|
$
|
5,930
|
|
$
|
4,318
|
|
$
|
14,317
|
|
$
|
8,496
|
|
||||
|
Provision for taxes
|
$
|
1,414
|
|
$
|
940
|
|
$
|
4,029
|
|
$
|
1,742
|
|
||||
|
Effective tax rate
|
23.8
|
%
|
21.8
|
%
|
28.1
|
%
|
20.5
|
%
|
||||||||
A substantial majority
of the increase in our effective tax rate in
Q3 2017
compared to
Q3 2016
was driven by a higher proportion of our income in higher tax rate jurisdictions.
A majority
of the
increase
in our effective tax rate in the
first nine months
of
2017
compared to the
first nine months
of
2016
was driven by an
$822 million
tax expense due to the ISecG divestiture that occurred in
Q2 2017
.
39
INTEL CORPORATION
MANAGEMENT'S DISCUSSION AND ANALYSIS OF FINANCIAL CONDITION AND RESULTS OF OPERATIONS (Continued)
Liquidity and Capital Resources
We consider the following when assessing our liquidity and capital resources:
|
(Dollars in Millions)
|
Sep 30,
2017 |
Dec 31,
2016 |
||||||
|
Cash and cash equivalents, short-term investments, and trading assets
|
$
|
17,504
|
|
$
|
17,099
|
|
||
|
Other long-term investments
|
$
|
3,844
|
|
$
|
4,716
|
|
||
|
Loans receivable and other
|
$
|
894
|
|
$
|
996
|
|
||
|
Reverse repurchase agreements with original maturities greater than three months
|
$
|
250
|
|
$
|
250
|
|
||
|
Total debt
|
$
|
31,640
|
|
$
|
25,283
|
|
||
|
Temporary equity
|
$
|
870
|
|
$
|
882
|
|
||
|
Debt as percentage of permanent stockholders’ equity
|
44.6
|
%
|
38.2
|
%
|
||||
Cash generated by operations is our primary source of liquidity. We maintain a diverse investment portfolio that we continually analyze based on issuer, industry, and country. When assessing our sources of liquidity we include investments as shown in the preceding table.
Substantially all
of our investments in debt instruments and financing receivables are in investment-grade securities.
Other potential sources of liquidity include our commercial paper program and our automatic shelf registration statement on file with the SEC, pursuant to which we may offer an unspecified amount of debt, equity, and other securities. Under our commercial paper program, we have an ongoing authorization from our Board of Directors to borrow up to
$10.0 billion
. This amount includes an increase of
$5.0 billion
in the authorization limit approved by our Board of Directors in April 2017. No commercial paper remained outstanding as of
September 30, 2017
. In Q3 2017, we redeemed our
$1.0 billion
,
4.90%
senior notes due
August 2045
as well as issued a total of
$640 million
aggregate principal amount of senior notes to finance a portion of the senior notes redeemed.
As of
September 30, 2017
,
$10.0 billion
of our
$17.5 billion
of cash and cash equivalents, short-term investments, and trading assets was held by our non-U.S. subsidiaries. Of the
$10.0 billion
held by our non-U.S. subsidiaries, approximately
$4.9 billion
was available for use in the U.S. without incurring additional U.S. income taxes in excess of the amounts already accrued in our financial statements as of
September 30, 2017
. The remaining amount of non-U.S. cash and cash equivalents, short-term investments, and trading assets has been indefinitely reinvested and, therefore, no U.S. current or deferred taxes have been accrued. This amount is earmarked for near-term investment in our operations outside the U.S. and future acquisitions of non-U.S. entities. We believe our U.S. sources of cash and liquidity are sufficient to meet our business needs in the U.S., and do not expect that we will need to repatriate the funds we have designated as indefinitely reinvested outside the U.S. Under current tax laws, should our plans change and we were to choose to repatriate some or all of the funds we have designated as indefinitely reinvested outside the U.S., such amounts would be subject to U.S. income taxes and applicable non-U.S. income and withholding taxes.
During Q3 2017, we acquired
97.3%
of Mobileye's outstanding ordinary shares for
$14.5 billion
net cash. We funded the acquisition, and expect to fund the remaining portion, with cash held by our non-U.S. subsidiaries.
During Q2 2017, we completed the divestiture of our ISecG business for total consideration of
$4.2 billion
. The consideration included cash proceeds of
$924 million
and
$2.2 billion
in the form of promissory notes. During Q3 2017, McAfee and TPG repaid the
$2.2 billion
of promissory notes and McAfee paid us a
$735 million
dividend.
We believe we have sufficient financial resources to meet our business requirements in the next 12 months, including capital expenditures for worldwide manufacturing and assembly and test; working capital requirements; and potential dividends, common stock repurchases, acquisitions, and strategic investments.
40
INTEL CORPORATION
MANAGEMENT'S DISCUSSION AND ANALYSIS OF FINANCIAL CONDITION AND RESULTS OF OPERATIONS (Continued)
In summary, our cash flows for each period were as follows:
|
Nine Months Ended
|
||||||||
|
(In Millions)
|
Sep 30,
2017 |
Oct 1,
2016 |
||||||
|
Net cash provided by operating activities
|
$
|
14,869
|
|
$
|
13,658
|
|
||
|
Net cash used for investing activities
|
(10,532
|
)
|
(22,373
|
)
|
||||
|
Net cash provided by (used for) financing activities
|
(822
|
)
|
(1,841
|
)
|
||||
|
Net increase (decrease) in cash and cash equivalents
|
$
|
3,515
|
|
$
|
(10,556
|
)
|
||
Operating Activities
Cash provided by operating activities is net income adjusted for certain non-cash items and changes in assets and liabilities.
For the
first nine months
of
2017
compared to the
first nine months
of
2016
, the
$1.2 billion
increase
in cash provided by operations was primarily due to higher net income. This increase was partially offset by adjustments to net income for non-cash items, primarily driven by reduced restructuring charges, as well as changes in working capital, which benefited from $1.0 billion receipts of customer deposits.
Investing Activities
Investing cash flows consist primarily of capital expenditures; investment purchases, sales, maturities, and disposals; and proceeds from divestitures and cash used for acquisitions.
Cash used for investing activities was lower for the
first nine months
of
2017
compared to the
first nine months
of
2016
primarily due to net sales of available-for-sale investments and trading assets, as well as proceeds from our divestiture of ISecG. This activity was partially offset by higher capital expenditures.
Financing Activities
Financing cash flows consist primarily of repurchases of common stock, payment of dividends to stockholders, issuance and repayment of short-term and long-term debt, and proceeds from the sale of shares of common stock through employee equity incentive plans.
Cash
used for
financing activities was lower in the
first nine months
of
2017
compared to the
first nine months
of
2016
primarily due to higher issuances of long-term debt. This increase was partially offset by higher repurchases of common stock and repayment of debt.
Contractual Obligations
During Q2 2017, we issued
$7.1 billion
in aggregate principal amount of senior unsecured notes. Our remaining total cash payments (including anticipated interest payments on fixed rate debt that are not recorded on the consolidated condensed balance sheets, and excluding interest payments relating to our floating rate debt) over the life of these long-term debt obligations are expected to be approximately
$9.2 billion
. During Q3 2017, we issued a total of
$640 million
aggregate principal amount of senior notes. For further information, see "
Note 13: Borrowings
" in the notes to consolidated condensed financial statements on this Form 10-Q.
Acquisition of Mobileye
During
Q3 2017
, we acquired substantially all of Mobileye's issued and outstanding ordinary shares by means of a tender offer for
$63.54
per share in cash. For further information, see "
Note 10: Acquisitions and Divestitures
" in the notes to consolidated condensed financial statements on this Form 10-Q.
41
|
ITEM 3.
|
QUANTITATIVE AND QUALITATIVE DISCLOSURES ABOUT MARKET RISK
|
We are affected by changes in currency exchange and interest rates, as well as equity and commodity prices. For discussion about market risk and sensitivity analysis related to changes in currency exchange rates, interest rates, equity prices, and commodity prices refer to Part II, Item 7A, Quantitative and Qualitative Disclosures About Market Risk, in our 2016 Form 10-K.
|
ITEM 4.
|
CONTROLS AND PROCEDURES
|
Evaluation of Disclosure Controls and Procedures
Based on management’s evaluation (with the participation of our Chief Executive Officer (CEO) and Chief Financial Officer (CFO)), as of the end of the period covered by this report, our CEO and CFO have concluded that our disclosure controls and procedures (as defined in Rules 13a-15(e) and 15d-15(e) under the Securities Exchange Act of 1934, as amended (the Exchange Act)), are effective to provide reasonable assurance that information required to be disclosed by us in reports that we file or submit under the Exchange Act is recorded, processed, summarized, and reported within the time periods specified in SEC rules and forms, and is accumulated and communicated to management, including our principal executive officer and principal financial officer, as appropriate, to allow timely decisions regarding required disclosure.
Changes in Internal Control Over Financial Reporting
There were no changes to our internal control over financial reporting (as defined in Rules 13a-15(f) and 15d-15(f) under the Exchange Act) that occurred during the quarter ended
September 30, 2017
that have materially affected, or are reasonably likely to materially affect, our internal control over financial reporting.
Inherent Limitations on Effectiveness of Controls
Our management, including the CEO and CFO, does not expect that our disclosure controls and procedures or our internal control over financial reporting will prevent or detect all errors and all fraud. A control system, no matter how well-designed and operated, can provide only reasonable, not absolute, assurance that the control system’s objectives will be met. The design of a control system must reflect the fact that there are resource constraints, and the benefits of controls must be considered relative to their costs. Further, because of the inherent limitations in all control systems, no evaluation of controls can provide absolute assurance that misstatements due to error or fraud will not occur or that all control issues and instances of fraud, if any, have been detected. The design of any system of controls is based in part on certain assumptions about the likelihood of future events, and there can be no assurance that any design will succeed in achieving its stated goals under all potential future conditions. Projections of any evaluation of the effectiveness of controls to future periods are subject to risks. Over time, controls may become inadequate because of changes in conditions or deterioration in the degree of compliance with policies or procedures.
42
|
ITEM 1.
|
LEGAL PROCEEDINGS
|
For a discussion of legal proceedings, see “
Note 18: Contingencies
” in the notes to consolidated condensed financial statements in this Form 10-Q.
|
ITEM 1A.
|
RISK FACTORS
|
The risks described in Part I, Item 1A, "Risk Factors," in our 2016 Form 10-K, could materially and adversely affect our business, financial condition and results of operations, and the trading price of our common stock could decline. These risk factors do not identify all risks that we face - our operations could also be affected by factors that are not presently known to us or that we currently consider to be immaterial to our operations. Due to risks and uncertainties, known and unknown, our past financial results may not be a reliable indicator of future performance and historical trends should not be used to anticipate results or trends in future periods. The Risk Factors section of our
2016
Annual Report on Form 10-K remains current in all material respects.
|
ITEM 2.
|
UNREGISTERED SALES OF EQUITY SECURITIES AND USE OF PROCEEDS
|
Issuer Purchases of Equity Securities
We have an ongoing authorization (originally adopted in 2005 and subsequently amended) to repurchase shares of our common stock in open market or negotiated transactions. As of
September 30, 2017
, we were authorized to repurchase up to
$75.0 billion
,
of which
$13.2 billion
remained available. This amount includes an increase of
$10.0 billion
in the authorization limit approved by our Board of Directors in April 2017.
Common stock repurchase activity under our repurchase program during the
third
quarter of
2017
was as follows:
|
Period
|
Total Number
of Shares Purchased (In Millions) |
Average Price
Paid Per Share |
Dollar Value of
Shares That May Yet Be Purchased (In Millions) |
||||||||
|
July 2, 2017 - July 29, 2017
|
11.6
|
|
$
|
34.27
|
|
$
|
13,800
|
|
|||
|
July 30, 2017 - August 26, 2017
|
8.1
|
|
$
|
35.59
|
|
$
|
13,512
|
|
|||
|
August 27, 2017 - September 30, 2017
|
8.9
|
|
$
|
36.03
|
|
$
|
13,191
|
|
|||
|
Total
|
28.6
|
|
$
|
35.19
|
|
||||||
We issue RSUs as part of our equity incentive plans. In our consolidated condensed financial statements, we treat shares of common stock withheld for tax purposes on behalf of our employees in connection with the vesting of
RSUs
as common stock repurchases because they reduce the number of shares that would have been issued upon vesting. These withheld shares of common stock are not considered common stock repurchases under our authorized common stock repurchase plan
and accordingly are not included in the common stock repurchase totals in the preceding table.
43
|
ITEM 6.
|
EXHIBITS
|
|
|
|
Incorporated by Reference
|
|
|||||||||
|
Exhibit
Number
|
Exhibit Description
|
Form
|
File Number
|
Exhibit
|
Filing
Date
|
Filed or
Furnished
Herewith
|
||||||
|
3.1
|
8-K
|
000-06217
|
3.1
|
5/22/2006
|
||||||||
|
3.2
|
8-K
|
000-06217
|
3.2
|
1/26/2016
|
||||||||
|
4.1
|
8-K
|
000-06217
|
4.1
|
8/14/2017
|
||||||||
|
12.1
|
X
|
|||||||||||
|
31.1
|
X
|
|||||||||||
|
31.2
|
X
|
|||||||||||
|
32.1
|
X
|
|||||||||||
|
101.INS
|
XBRL Instance Document
|
X
|
||||||||||
|
101.SCH
|
XBRL Taxonomy Extension Schema Document
|
X
|
||||||||||
|
101.CAL
|
XBRL Taxonomy Extension Calculation Linkbase Document
|
X
|
||||||||||
|
101.DEF
|
XBRL Taxonomy Extension Definition Linkbase Document
|
X
|
||||||||||
|
101.LAB
|
XBRL Taxonomy Extension Label Linkbase Document
|
X
|
||||||||||
|
101.PRE
|
XBRL Taxonomy Extension Presentation Linkbase Document
|
X
|
||||||||||
Intel, the Intel logo, Intel Core, Intel Inside, Movidius, Myriad, Intel Optane and 3D XPoint are trademarks of Intel Corporation or its subsidiaries in the U.S. and/or other countries.
Other names and brands may be claimed as the property of others.
44
SIGNATURES
Pursuant to the requirements of the Securities Exchange Act of 1934, the registrant has duly caused this report to be signed on its behalf by the undersigned thereunto duly authorized.
|
|
INTEL CORPORATION
(Registrant) |
||||
|
Date:
|
October 26, 2017
|
|
By:
|
|
/s/ R
OBERT
H. S
WAN
|
|
|
|
Robert H. Swan
|
|||
|
|
|
Executive Vice President, Chief Financial Officer, and Principal Accounting Officer
|
|||
45
TABLE OF CONTENTS
Part I Financial InformationItem 1. Financial StatementsNote 10: Acquisitions and DivestituresNote 1: Basis Of PresentationNote 2: Accounting PoliciesNote 3: Recent Accounting StandardsNote 4: Operating Segments InformationNote 5: Earnings Per ShareNote 6: Other Financial Statement DetailsNote 7: Restructuring and Other ChargesNote 8: Income TaxesNote 9: InvestmentsNote 11: Identified Intangible AssetsNote 12: Other Long-term AssetsNote 13: BorrowingsNote 16: Derivative Financial InstrumentsNote 14: Fair ValueNote 15: Other Comprehensive Income (loss)Note 17: Employee Equity Incentive PlansNote 18: ContingenciesItem 2. Management S Discussion and Analysis Of Financial Condition and Results Of OperationsItem 3. Quantitative and Qualitative Disclosures About Market RiskItem 4. Controls and ProceduresPart II Other InformationItem 1. Legal ProceedingsItem 1A. Risk FactorsItem 2. Unregistered Sales Of Equity Securities and Use Of ProceedsItem 6. Exhibits