INTEL CORP
10-Ks and 10-Qs
|
|
|
|
|
|
|
|
|
|
|
|
|
|
|
|
|
|
|
|
|
|
|
|
|
|
|
|
|
|
|
|
|
|
|
|
|
|
|
|
|
|
|
|
|
|
|
|
|
|
|
|
|
UNITED STATES SECURITIES AND EXCHANGE COMMISSION
Washington, D.C. 20549
FORM 10-Q
(Mark One)
|
|
þ
|
QUARTERLY REPORT PURSUANT TO SECTION 13 OR 15(d) OF THE SECURITIES EXCHANGE ACT OF 1934
|
|
For the quarterly period ended June 30, 2018.
|
||
Or
|
|
¨
|
TRANSITION REPORT PURSUANT TO SECTION 13 OR 15(d) OF THE SECURITIES EXCHANGE ACT OF 1934
|
|
For the transition period from
to
|
||
Commission File Number
000-06217

INTEL CORPORATION
(Exact name of registrant as specified in its charter)
|
Delaware
|
94-1672743
|
|
|
(State or other jurisdiction of incorporation or organization)
|
(I.R.S. Employer Identification No.)
|
|
|
2200 Mission College Boulevard, Santa Clara, California
|
95054-1549
|
|
|
(Address of principal executive offices)
|
(Zip Code)
|
|
(408) 765-8080
(Registrant’s telephone number, including area code)
N/A
(Former name, former address and former fiscal year, if changed since last report)
Indicate by check mark whether the registrant (1) has filed all reports required to be filed by Section 13 or 15(d) of the Securities Exchange Act of 1934 during the preceding 12 months (or for such shorter period that the registrant was required to file such reports), and (2) has been subject to such filing requirements for the past 90 days. Yes
þ
No
¨
Indicate by check mark whether the registrant has submitted electronically and posted on its corporate Web site, if any, every Interactive Data File required to be submitted and posted pursuant to Rule 405 of Regulation S-T (§232.405 of this chapter) during the preceding 12 months (or for such shorter period that the registrant was required to submit and post such files). Yes
þ
No
¨
Indicate by check mark whether the registrant is a large accelerated filer, an accelerated filer, a non-accelerated filer, a smaller reporting company, or an emerging growth company. See the definitions of “large accelerated filer,” “accelerated filer,” “smaller reporting company,” and "emerging growth company" in Rule 12b-2 of the Exchange Act.
|
Large accelerated filer
þ
|
Accelerated filer
¨
|
Non-accelerated filer
¨
|
Smaller reporting company
¨
|
Emerging growth company
¨
|
|
(Do not check if a smaller reporting company)
|
||||
If an emerging growth company, indicate by check mark if the registrant has elected not to use the extended transition period for complying with any new or revised financial accounting standards provided pursuant to Section 13(a) of the Exchange Act.
¨
Indicate by check mark whether the registrant is a shell company (as defined in Rule 12b-2 of the Exchange Act). Yes
¨
No
þ
Shares outstanding of the Registrant’s common stock:
|
Class
|
Outstanding as of June 30, 2018
|
|
|
Common stock, $0.001 par value
|
4,611 million
|
|
TABLE OF CONTENTS
THE ORGANIZATION OF OUR QUARTERLY REPORT ON FORM 10-Q
The order and presentation of content in our Quarterly Report on Form 10-Q (Form 10-Q) differs from the traditional U.S. Securities and Exchange Commission (SEC) Form 10-Q format. We believe this format improves readability and better presents how we organize and manage our business. See "Form 10-Q Cross-Reference Index" within Other Key Information for a cross-reference index to the traditional SEC Form 10-Q format.
We have included key metrics that we use to measure our business, some of which are non-GAAP measures. See these "Non-GAAP Financial Measures" within Other Key Information.
|
Page
|
|||
|
FORWARD-LOOKING STATEMENTS
|
|||
|
A QUARTER IN REVIEW
|
|||
|
CONSOLIDATED CONDENSED FINANCIAL STATEMENTS AND SUPPLEMENTAL DETAILS
|
|||
|
Consolidated Condensed Statements of Income
|
|||
|
Consolidated Condensed Statements of Comprehensive Income
|
|||
|
Consolidated Condensed Balance Sheets
|
|||
|
Consolidated Condensed Statements of Cash Flows
|
|||
|
Notes to Consolidated Condensed Financial Statements
|
|||
|
MANAGEMENT'S DISCUSSION AND ANALYSIS (MD&A) - RESULTS OF OPERATIONS
|
|||
|
Overview
|
|||
|
Revenue, Gross Margin, and Operating Expenses
|
|||
|
Business Unit Trends and Results
|
|||
|
Other Consolidated Results of Operations
|
|||
|
Liquidity and Capital Resources
|
|||
|
Quantitative and Qualitative Disclosures about Market Risk
|
|||
|
OTHER KEY INFORMATION
|
|||
|
Risk Factors
|
|||
|
Controls and Procedures
|
|||
|
Non-GAAP Financial Measures
|
|||
|
Issuer Purchases of Equity Securities
|
|||
|
Exhibits
|
|||
|
Form 10-Q Cross-Reference Index
|
|||
FORWARD-LOOKING STATEMENTS
This Quarterly Report on Form 10-Q contains forward-looking statements that involve a number of risks and uncertainties. Words such as "anticipates," "expects," "intends," "goals," "plans," "believes," "seeks," "estimates," "continues," "may," "will," "would," "should," "could," and variations of such words and similar expressions are intended to identify such forward-looking statements. In addition, any statements that refer to projections of our future financial performance, our anticipated growth and trends in our businesses, projected growth of markets relevant to our businesses, uncertain events or assumptions, and other characterizations of future events or circumstances are forward-looking statements. Such statements are based on management's expectations as of the date of this filing and involve many risks and uncertainties that could cause our actual results to differ materially from those expressed or implied in our forward-looking statements. Such risks and uncertainties include those described throughout this report and our Annual Report on Form 10-K for the year ended
December 30, 2017
, particularly the "Risk Factors" sections of such reports. Given these risks and uncertainties, readers are cautioned not to place undue reliance on such forward-looking statements. Readers are urged to carefully review and consider the various disclosures made in this Form 10-Q and in other documents we file from time to time with the Securities and Exchange Commission that disclose risks and uncertainties that may affect our business. The forward-looking statements in this Form 10-Q do not reflect the potential impact of any divestitures, mergers, acquisitions, or other business combinations that had not been completed as of the date of this filing. In addition, the forward-looking statements in this Form 10-Q are made as of the date of this filing, and Intel does not undertake, and expressly disclaims any duty, to update such statements, whether as a result of new information, new developments or otherwise, except to the extent that disclosure may be required by law.
INTEL UNIQUE TERMS
We use specific terms throughout this document to describe our business and results. Below are key terms and how we define them:
|
PLATFORM PRODUCTS
|
A microprocessor (processor or central processing unit (CPU)) and chipset, a stand-alone System-on-Chip (SoC), or a multichip package. Platform products, or platforms, are primarily used in solutions sold through Client Computing Group (CCG), Data Center Group (DCG), and Internet of Things Group (IOTG) segments.
|
|
|
ADJACENT PRODUCTS
|
All of our non-platform products, for CCG, DCG, and IOTG like modem, ethernet and silicon photonics, as well as Non-Volatile Memory Solutions Group (NSG), Programmable Solutions Group (PSG), and Mobileye products. Combined with our platform products, adjacent products form comprehensive platform solutions to meet customer needs.
|
|
|
PC-CENTRIC BUSINESS
|
Is made up of our CCG business, both platform and adjacent products.
|
|
|
DATA-CENTRIC BUSINESSES
|
Includes our DCG, IOTG, NSG, PSG, and all other businesses.
|
|
Intel, the Intel logo, Intel Inside, Intel Optane, Intel Core, Xeon, 3D XPoint and XMM are trademarks of Intel Corporation or its subsidiaries in the U.S. and/or other countries.
*Other names and brands may be claimed as the property of others.
|
1
|
||
|
A QUARTER IN REVIEW
|
After five decades in the tech industry,
we are poised to deliver another record year, our third in a row
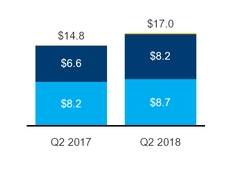
. We had record second quarter revenue and are continuing to transform the company from a PC-centric to a data-centric company. Our data-centric businesses collectively grew 26% from a year ago and are now approaching 50% of our revenue. Individually, Data Center Group (DCG), Internet of Things Group (IOTG), Non-volatile Memory Solutions Group (NSG), and Programmable Solutions Group (PSG) all achieved double digit revenue growth. Client Computing Group (CCG) continued to execute well, producing 6% revenue growth and funding data-centric investments. Strong operating margin leverage and our lower tax rate resulted in GAAP and non-GAAP EPS growth, even as we continued investing in growth areas.
From a capital allocation perspective, in the first half of the year we generated
$13.7 billion
of cash flow from operations and returned
$8.6 billion
to shareholders.
|
REVENUE
|
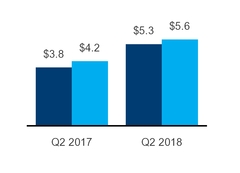
OPERATING INCOME
|
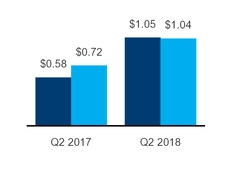
DILUTED EPS
|
||||||||
|
$17.0B
|
$5.3B
|
$5.6B
|
$1.05
|
$1.04
|
||||||
|
GAAP
|
GAAP
|
non-GAAP
1
|
GAAP
|
non-GAAP
1
|
||||||
|
up $2.2B or 15% from Q2 2017
|
up $1.4B or 37% from Q2 2017
|
up $1.4B or 34% from Q2 2017
|
up $0.47 or 82% from Q2 2017
|
up $0.32 or 44% from Q2 2017
|
||||||
|
Strong performance across all businesses and record revenue from IOTG and NSG
|
Higher demand of performance-leading products and growth of adjacent businesses; offset by corresponding unit costs
|
Top-line revenue growth, strong operating margin leverage, lower tax rate from Tax Reform
2
|
||||||||
|
■
Data-centric $B
|
■
PC-centric $B
|
■
GAAP $B
|
■
Non-GAAP $B
|
■
GAAP
|
■
Non-GAAP
|
|||||
BUSINESS SUMMARY
|
•
|
Fifty years ago, Robert Noyce and Gordon Moore founded Intel. In honor of our golden anniversary, we are embracing Robert Noyce’s inspiring challenge, "Don't be encumbered by history, go off and do something wonderful.” We will celebrate our heritage and the wonderful things we are doing to create a bright future for Intel and the world.
|
|
•
|
Micron Technology, Inc. (Micron) and Intel announced that we had agreed to complete joint development for the second generation of 3D XPoint™ technology and that technology development beyond the second generation of 3D XPoint technology will be pursued independently in order to optimize the technology for our respective products and business needs. Intel-Micron Flash Technologies (IMFT) facility in Lehi, Utah, will continue to manufacture memory based on 3D XPoint technology.
|
|
•
|
We had several notable product updates during the quarter. We announced that Mobileye’s EyeQ* computer vision technology and Responsibility Sensitive Safety driving policy will be used in Baidu, Inc.'s, Apollo* commercial Autonomous Vehicle program. We are now shipping the Intel
®
XMM
™
7560 modem, our first CDMA and first multi-SIM capable cellular modem, manufactured based on our 14nm process technology. Expanding our memory product line, we
announced production of the industry’s first four-bits-per-cell (QLC) NAND PCIe SSDs
. CCG launched several new 8th Gen Intel
®
Core
™
processors including the 8th Gen Intel Core i7-8086K limited-edition processor for gaming.
|
|
•
|
We released our annual Corporate Responsibility Report, highlighting our progress over the past year in environmental sustainability, supply chain responsibility, diversity and inclusion, and social impact. We made significant progress on our diversity initiatives and accelerated our 2020 diversity goal by two years to achieve full representation
3
in our U.S. workforce by the end of 2018.
|
1
See "Non-GAAP Financial Measures" within Other Key Information.
2
Tax Reform refers to the U.S. Tax Cuts and Jobs Act enacted in December 2017.
3
Full representation of women and underrepresented minorities is the point at which Intel’s workforce in the U.S. matches the supply of skilled talent available (market availability) for current roles at Intel.
|
A QUARTER IN REVIEW
|
2
|
|
|
INTEL CORPORATION
|
|
|
Three Months Ended
|
Six Months Ended
|
||||||||||||||
|
(In Millions, Except Per Share Amounts; Unaudited)
|
Jun 30,
2018 |
Jul 1,
2017 |
Jun 30,
2018 |
Jul 1,
2017 |
||||||||||||
|
Net revenue
|
$
|
16,962
|
|
$
|
14,763
|
|
$
|
33,028
|
|
$
|
29,559
|
|
||||
|
Cost of sales
|
6,543
|
|
5,667
|
|
12,878
|
|
11,303
|
|
||||||||
|
Gross margin
|
10,419
|
|
9,096
|
|
20,150
|
|
18,256
|
|
||||||||
|
Research and development
|
3,371
|
|
3,262
|
|
6,682
|
|
6,573
|
|
||||||||
|
Marketing, general and administrative
|
1,725
|
|
1,850
|
|
3,625
|
|
3,949
|
|
||||||||
|
Restructuring and other charges
|
—
|
|
105
|
|
—
|
|
185
|
|
||||||||
|
Amortization of acquisition-related intangibles
|
50
|
|
37
|
|
100
|
|
75
|
|
||||||||
|
Operating expenses
|
5,146
|
|
5,254
|
|
10,407
|
|
10,782
|
|
||||||||
|
Operating income
|
5,273
|
|
3,842
|
|
9,743
|
|
7,474
|
|
||||||||
|
Gains (losses) on equity investments, net
|
(203
|
)
|
342
|
|
440
|
|
594
|
|
||||||||
|
Interest and other, net
|
459
|
|
388
|
|
357
|
|
319
|
|
||||||||
|
Income before taxes
|
5,529
|
|
4,572
|
|
10,540
|
|
8,387
|
|
||||||||
|
Provision for taxes
|
523
|
|
1,764
|
|
1,080
|
|
2,615
|
|
||||||||
|
Net income
|
$
|
5,006
|
|
$
|
2,808
|
|
$
|
9,460
|
|
$
|
5,772
|
|
||||
|
Earnings per share – Basic
|
$
|
1.08
|
|
$
|
0.60
|
|
$
|
2.03
|
|
$
|
1.22
|
|
||||
|
Earnings per share – Diluted
|
$
|
1.05
|
|
$
|
0.58
|
|
$
|
1.98
|
|
$
|
1.19
|
|
||||
|
Cash dividends declared per share of common stock
|
$
|
—
|
|
$
|
—
|
|
$
|
0.60
|
|
$
|
0.5325
|
|
||||
|
Weighted average shares of common stock outstanding:
|
||||||||||||||||
|
Basic
|
4,649
|
|
4,710
|
|
4,661
|
|
4,717
|
|
||||||||
|
Diluted
|
4,747
|
|
4,845
|
|
4,768
|
|
4,864
|
|
||||||||
See accompanying notes.
|
FINANCIAL STATEMENTS
|
Consolidated Condensed Statements of Income
|
3
|
|
INTEL CORPORATION
CONSOLIDATED CONDENSED STATEMENTS OF COMPREHENSIVE INCOME
|
|
Three Months Ended
|
Six Months Ended
|
|||||||||||||||
|
(In Millions; Unaudited)
|
Jun 30,
2018 |
Jul 1,
2017 |
Jun 30,
2018 |
Jul 1,
2017 |
||||||||||||
|
Net income
|
$
|
5,006
|
|
$
|
2,808
|
|
$
|
9,460
|
|
$
|
5,772
|
|
||||
|
Changes in other comprehensive income, net of tax:
|
||||||||||||||||
|
Net unrealized holding gains (losses) on available-for-sale equity investments
|
—
|
|
(534
|
)
|
—
|
|
9
|
|
||||||||
|
Net unrealized holding gains (losses) on derivatives
|
(293
|
)
|
136
|
|
(174
|
)
|
331
|
|
||||||||
|
Actuarial valuation and other pension benefits (expenses), net
|
(122
|
)
|
202
|
|
26
|
|
220
|
|
||||||||
|
Translation adjustments and other
|
9
|
|
507
|
|
(13
|
)
|
508
|
|
||||||||
|
Other comprehensive income (loss)
|
(406
|
)
|
311
|
|
(161
|
)
|
1,068
|
|
||||||||
|
Total comprehensive income
|
$
|
4,600
|
|
$
|
3,119
|
|
$
|
9,299
|
|
$
|
6,840
|
|
||||
See accompanying notes.
|
FINANCIAL STATEMENTS
|
Consolidated Condensed Statements of Comprehensive Income
|
4
|
|
INTEL CORPORATION
|
|
(In Millions)
|
Jun 30,
2018 |
Dec 30,
2017 |
||||||
|
(unaudited)
|
||||||||
|
Assets
|
||||||||
|
Current assets:
|
||||||||
|
Cash and cash equivalents
|
$
|
2,614
|
|
$
|
3,433
|
|
||
|
Short-term investments
|
2,263
|
|
1,814
|
|
||||
|
Trading assets
|
7,348
|
|
8,755
|
|
||||
|
Accounts receivable
|
4,636
|
|
5,607
|
|
||||
|
Inventories
|
7,344
|
|
6,983
|
|
||||
|
Other current assets
|
3,398
|
|
2,908
|
|
||||
|
Total current assets
|
27,603
|
|
29,500
|
|
||||
|
Property, plant and equipment, net of accumulated depreciation of $62,071 ($59,286 as of December 30, 2017)
|
45,914
|
|
41,109
|
|
||||
|
Equity investments
|
9,245
|
|
8,579
|
|
||||
|
Other long-term investments
|
3,071
|
|
3,712
|
|
||||
|
Goodwill
|
24,351
|
|
24,389
|
|
||||
|
Identified intangible assets, net
|
12,098
|
|
12,745
|
|
||||
|
Other long-term assets
|
3,690
|
|
3,215
|
|
||||
|
Total assets
|
$
|
125,972
|
|
$
|
123,249
|
|
||
|
Liabilities, temporary equity, and stockholders’ equity
|
||||||||
|
Current liabilities:
|
||||||||
|
Short-term debt
|
$
|
3,510
|
|
$
|
1,776
|
|
||
|
Accounts payable
|
4,143
|
|
2,928
|
|
||||
|
Accrued compensation and benefits
|
2,601
|
|
3,526
|
|
||||
|
Deferred income
|
—
|
|
1,656
|
|
||||
|
Other accrued liabilities
|
7,317
|
|
7,535
|
|
||||
|
Total current liabilities
|
|
17,571
|
|
17,421
|
|
|||
|
Debt
|
24,632
|
|
25,037
|
|
||||
|
Contract liabilities
|
2,393
|
|
—
|
|
||||
|
Income taxes payable, non-current
|
5,618
|
|
4,069
|
|
||||
|
Deferred income taxes
|
1,666
|
|
3,046
|
|
||||
|
Other long-term liabilities
|
3,391
|
|
3,791
|
|
||||
|
Contingencies (Note 15)
|
|
|
||||||
|
Temporary equity
|
654
|
|
866
|
|
||||
|
Stockholders’ equity:
|
||||||||
|
Preferred stock
|
—
|
|
—
|
|
||||
|
Common stock and capital in excess of par value, 4,611 issued and outstanding (4,687 issued and outstanding as of December 30, 2017)
|
25,470
|
|
26,074
|
|
||||
|
Accumulated other comprehensive income (loss)
|
(1,089
|
)
|
862
|
|
||||
|
Retained earnings
|
45,666
|
|
42,083
|
|
||||
|
Total stockholders’ equity
|
70,047
|
|
69,019
|
|
||||
|
Total liabilities, temporary equity, and stockholders’ equity
|
$
|
125,972
|
|
$
|
123,249
|
|
||
See accompanying notes.
|
FINANCIAL STATEMENTS
|
Consolidated Condensed Balance Sheets
|
5
|
|
INTEL CORPORATION
|
|
|
Six Months Ended
|
|||||||
|
(In Millions; Unaudited)
|
Jun 30,
2018 |
Jul 1,
2017 |
||||||
|
Cash and cash equivalents, beginning of period
|
$
|
3,433
|
|
$
|
5,560
|
|
||
|
Cash flows provided by (used for) operating activities:
|
||||||||
|
Net income
|
9,460
|
|
5,772
|
|
||||
|
Adjustments to reconcile net income to net cash provided by operating activities:
|
||||||||
|
Depreciation
|
3,536
|
|
3,300
|
|
||||
|
Share-based compensation
|
820
|
|
725
|
|
||||
|
Restructuring and other charges
|
—
|
|
185
|
|
||||
|
Amortization of intangibles
|
782
|
|
634
|
|
||||
|
(Gains) losses on equity investments, net
|
(401
|
)
|
(526
|
)
|
||||
|
(Gains) losses on divestitures
|
(497
|
)
|
(387
|
)
|
||||
|
Deferred taxes
|
93
|
|
807
|
|
||||
|
Changes in assets and liabilities:
|
||||||||
|
Accounts receivable
|
369
|
|
(618
|
)
|
||||
|
Inventories
|
(303
|
)
|
(760
|
)
|
||||
|
Accounts payable
|
274
|
|
425
|
|
||||
|
Accrued compensation and benefits
|
(884
|
)
|
(1,102
|
)
|
||||
|
Customer deposits and prepaid supply agreements
|
1,580
|
|
—
|
|
||||
|
Income taxes payable and receivable
|
(1,226
|
)
|
563
|
|
||||
|
Other assets and liabilities
|
94
|
|
(413
|
)
|
||||
|
Total adjustments
|
4,237
|
|
2,833
|
|
||||
|
Net cash provided by operating activities
|
13,697
|
|
8,605
|
|
||||
|
Cash flows provided by (used for) investing activities:
|
||||||||
|
Additions to property, plant and equipment
|
(7,440
|
)
|
(4,730
|
)
|
||||
|
Purchases of available-for-sale debt investments
|
(1,578
|
)
|
(1,876
|
)
|
||||
|
Maturities of available-for-sale debt investments
|
1,720
|
|
2,197
|
|
||||
|
Purchases of trading assets
|
(6,501
|
)
|
(7,961
|
)
|
||||
|
Maturities and sales of trading assets
|
7,691
|
|
5,977
|
|
||||
|
Purchases of equity investments
|
(594
|
)
|
(643
|
)
|
||||
|
Sales of equity investments
|
215
|
|
1,751
|
|
||||
|
Proceeds from divestitures
|
548
|
|
924
|
|
||||
|
Other investing
|
(45
|
)
|
145
|
|
||||
|
Net cash used for investing activities
|
(5,984
|
)
|
(4,216
|
)
|
||||
|
Cash flows provided by (used for) financing activities:
|
||||||||
|
Increase (decrease) in short-term debt, net
|
1,991
|
|
(12
|
)
|
||||
|
Issuance of long-term debt, net of issuance costs
|
—
|
|
7,078
|
|
||||
|
Repayment of debt and debt conversion
|
(1,169
|
)
|
(500
|
)
|
||||
|
Proceeds from sales of common stock through employee equity incentive plans
|
320
|
|
406
|
|
||||
|
Repurchase of common stock
|
(5,807
|
)
|
(2,518
|
)
|
||||
|
Restricted stock unit withholdings
|
(465
|
)
|
(404
|
)
|
||||
|
Payment of dividends to stockholders
|
(2,800
|
)
|
(2,516
|
)
|
||||
|
Other financing
|
(602
|
)
|
204
|
|
||||
|
Net cash provided by (used for) financing activities
|
(8,532
|
)
|
1,738
|
|
||||
|
Net increase (decrease) in cash and cash equivalents
|
(819
|
)
|
6,127
|
|
||||
|
Cash and cash equivalents, end of period
|
$
|
2,614
|
|
$
|
11,687
|
|
||
|
Supplemental disclosures of noncash investing activities and cash flow information:
|
||||||||
|
Acquisition of property, plant, and equipment included in accounts payable and accrued liabilities
|
$
|
2,789
|
|
$
|
1,686
|
|
||
|
Loan receivable from McAfee and TPG
|
$
|
—
|
|
$
|
2,200
|
|
||
|
Non-marketable equity investment in McAfee from divestiture
|
$
|
—
|
|
$
|
1,078
|
|
||
|
Cash paid during the period for:
|
||||||||
|
Interest, net of capitalized interest and interest rate swap payments/receipts
|
$
|
209
|
|
$
|
280
|
|
||
|
Income taxes, net of refunds
|
$
|
2,196
|
|
$
|
1,139
|
|
||
See accompanying notes.
|
FINANCIAL STATEMENTS
|
Consolidated Condensed Statements of Cash Flows
|
6
|
|
INTEL CORPORATION
NOTES TO CONSOLIDATED CONDENSED FINANCIAL STATEMENTS
|
We prepared our interim consolidated condensed financial statements that accompany these notes in conformity with U.S. generally accepted accounting principles, consistent in all material respects with those applied in our Annual Report on Form 10-K for the fiscal year ended
December 30, 2017
(
2017
Form 10-K), except for changes associated with recent accounting standards for retirement benefits, revenue recognition, and financial instruments as detailed in "
Note 2: Recent Accounting Standards and Accounting Policies
."
We have made estimates and judgments affecting the amounts reported in our consolidated condensed financial statements and the accompanying notes. The actual results that we experience may differ materially from our estimates. The interim financial information is unaudited, but reflects all normal adjustments that are, in our opinion, necessary to provide a fair statement of results for the interim periods presented. This report should be read in conjunction with the consolidated financial statements in our
2017
Form 10-K.
We assess the adoption impacts of recently issued accounting standards by the Financial Accounting Standards Board on our financial statements. The sections below describe impacts from newly adopted standards as well as material updates to our previous assessments, if any, from our 2017 Form 10-K.
ACCOUNTING STANDARDS ADOPTED
Retirement Benefits - Improving the Presentation of Net Periodic Pension Cost and Net Periodic Postretirement Benefit Cost
Standard/Description:
This amended standard was issued to provide additional guidance on the presentation of net periodic benefit cost in the income statement and on the components eligible for capitalization in assets. In accordance with the revised standard, we have separated the different components of net periodic benefit cost, presenting service cost components within operating income and other non-service components separately outside of operating income on the income statement. In addition, only service costs are now eligible for inventory capitalization.
Effective Date and Adoption Considerations:
Effective in the first quarter of 2018. Changes to the presentation of benefit costs were required to be adopted retrospectively, while changes to the capitalization of service costs into inventories were required to be adopted prospectively. The standard permits, as a practical expedient, use of the amounts disclosed in the Retirement Benefit Plans footnote for the prior comparative periods as the estimation basis for applying the retrospective presentation requirement.
Effect on Financial Statements or Other Significant Matters:
Adoption of the amended standard resulted in the reclassification of approximately
$114 million
of non-service net periodic benefit costs from line items within operating income to interest and other, net, for the year ended
December 30, 2017
(
$259 million
for the year ended
December 31, 2016
).
Revenue Recognition - Contracts with Customers
Standard/Description:
This standard was issued to achieve a consistent application of revenue recognition within the U.S., resulting in a single revenue model to be applied by all companies. Under the new model, recognition of revenue occurs when a customer obtains control of promised goods or services in an amount that reflects the consideration to which the entity expects to be entitled in exchange for those goods or services. In addition, the new standard requires that companies disclose the nature, amount, timing, and uncertainty of revenue and cash flows arising from contracts with customers.
Effective Date and Adoption Considerations:
Effective in the first quarter of 2018.
This standard was adopted using a modified retrospective approach through a
cumulative adjustment to retained earnings for the fiscal year beginning December 31, 2017
.
Effect on Financial Statements or Other Significant Matters:
Our adoption assessments identified a change in revenue recognition timing on our component sales made to distributors. Under the new standard we now recognize revenue when we deliver to the distributor rather than deferring recognition until the distributor sells the components.
On the date of initial application, we removed the deferred income and related receivables on component sales made to distributors through a cumulative adjustment to retained earnings. The revenue deferral that was historically recognized in the following period is expected to be primarily offset by the acceleration of revenue recognition in the current period as control of the product transfers to our customer.
|
FINANCIAL STATEMENTS
|
Notes to Financial Statements
|
7
|
Our assessment also identified a change in expense recognition timing related to payments we make to our customers for distinct services they perform as part of cooperative advertising programs, which were previously recorded as operating expenses. We now recognize the expense for cooperative advertising in the period the marketing activities occur. Previously we recognized the expense in the period the customer was entitled to participate in the program, which coincided with the period of sale. On the date of initial adoption, we capitalized the expense of cooperative advertising not performed through a cumulative adjustment to retained earnings.
We have completed our adoption and implemented policies, processes, and controls to support the standard's measurement and disclosure requirements. Refer to the tables below, which summarize the impacts of the changes discussed above to Intel's financial statements recorded as an adjustment to opening balances for the fiscal year beginning December 31, 2017, and also provide comparative reporting of the impacts of adopting the standard.
Accounting Policy Updates:
We recognize net product revenue when we satisfy performance obligations as evidenced by the transfer of control of our products or services to customers. Substantially all of our revenue is derived from product sales. In accordance with contract terms, revenue for product sales is recognized at the time of product shipment from our facilities or delivery to the customer location, as determined by the agreed upon shipping terms. We include shipping charges billed to customers in net revenue, and include the related shipping costs in cost of sales.
We measure revenue based on the amount of consideration we expect to be entitled to in exchange for products or services. Any variable consideration is recognized as a reduction of net revenue at the time of revenue recognition. We determine variable consideration, which consists primarily of sales price concessions, by estimating the most likely amount of consideration we expect to receive from the customer based on historical analysis of customer purchase volumes. The impacts of distributor sales price reductions resulting from price protection agreements are also estimated based on historical analysis of such activity and are reflected as a reduction in net revenue.
We make payments to our customers through cooperative advertising programs, such as our Intel Inside
®
program, for marketing activities for certain of our products. We accrue cooperative advertising obligations and record the costs as a reduction in revenue at the same time that the related revenue is recognized.
Financial Instruments - Recognition and Measurement
Standard/Description:
Requires changes to the accounting for financial instruments that primarily affect equity securities, financial liabilities measured using the fair value option, and the presentation and disclosure requirements for such instruments.
Effective Date and Adoption Considerations:
Effective in the first quarter of 2018. Changes to our marketable equity securities were required to be adopted using a modified retrospective approach through a cumulative effect adjustment to retained earnings for the fiscal year beginning December 31, 2017. Since management has elected to apply the measurement alternative to non-marketable equity securities, changes to these securities were adopted prospectively.
Effect on Financial Statements or Other Significant Matters:
Marketable equity securities previously classified as available-for-sale equity investments are now measured and recorded at fair value with changes in fair value recorded through the income statement.
All non-marketable equity securities formerly classified as cost method investments are measured and recorded using the measurement alternative. Equity securities measured and recorded using the measurement alternative are recorded at cost minus impairment, if any, plus or minus changes resulting from qualifying observable price changes. Adjustments resulting from impairments and qualifying observable price changes are recorded in the income statement.
Beginning in the first quarter of 2018, in accordance with the standard, recurring fair value disclosures are no longer provided for equity securities measured using the measurement alternative. In addition, the existing impairment model has been replaced with a new one-step qualitative impairment model. No initial adoption adjustment was recorded for these instruments since the standard was required to be applied prospectively for securities measured using the measurement alternative.
We have completed our adoption and implemented policies, processes, and controls to support the standard's measurement and disclosure requirements. Refer to the table below, which summarizes impacts, net of tax, of the changes discussed above to Intel's financial statements. This reflects an adjustment to opening balances for the fiscal year beginning December 31, 2017.
Accounting Policy Updates:
We regularly invest in equity securities of public and private companies to promote business and strategic objectives. Equity investments are measured and recorded as follows:
|
•
|
Marketable equity securities
are equity securities with readily determinable fair value (RDFV) that are measured and recorded at fair value. Prior to fiscal 2018, these securities were measured and recorded at fair value and classified as available-for-sale securities.
|
|
•
|
Non-marketable equity securities
are equity securities without RDFV that are measured and recorded using a measurement alternative which measures the securities at cost minus impairment, if any, plus or minus changes resulting from qualifying observable price changes. These securities were previously accounted for using the cost method of accounting, measured at cost less other-than-temporary impairment.
|
|
•
|
Equity method investments
are equity securities in investees we do not control but over which we have the ability to exercise significant influence. Equity method investments are measured at cost minus impairment, if any, plus or minus our share of equity method investee income or loss. Our proportionate share of the income or loss from equity method investments is recognized on a one-quarter lag.
|
|
FINANCIAL STATEMENTS
|
Notes to Financial Statements
|
8
|
Realized and unrealized gains or losses resulting from changes in value and sale of our equity investments are recorded in gains (losses) on equity investments, net. We previously recorded unrealized gains and losses through other comprehensive income (loss) and realized gains and losses on the sale, exchange or impairment of these equity investments through gains (losses) on equity investments, net.
The carrying value of our portfolio of non-marketable equity securities totaled
$2.9 billion
as of
June 30, 2018
(
$2.6 billion
as of
December 30, 2017
). The carrying value of our non-marketable equity securities is adjusted for qualifying observable price changes resulting from the issuance of similar or identical securities by the same issuer. Determining whether an observed transaction is similar to a security within our portfolio requires judgment based on the rights and preferences of the securities. Recording upward and downward adjustments to the carrying value of our equity securities as a result of observable price changes requires quantitative assessments of the fair value of our securities using various valuation methodologies and involves the use of estimates.
Non-marketable equity securities and equity method investments are also subject to periodic impairment reviews. Our quarterly impairment analysis considers both qualitative and quantitative factors that may have a significant impact on the investee's fair value. Qualitative factors considered include industry and market conditions, the financial performance and near-term prospects of the investee, and other relevant events and factors affecting the investee. When indicators of impairment exist, we prepare quantitative assessments of the fair value of our equity investments using both the market and income approaches which require judgment and the use of estimates, including discount rates, investee revenues and costs, and comparable market data of private and public companies, among others. Prior to fiscal 2018, non-marketable equity securities were tested for impairment using the other-than-temporary impairment model which considered the severity and duration of a decline in fair value below cost and our ability and intent to hold the investment for a sufficient period of time to allow for recovery. Impairments of non-marketable equity securities were
$43 million
in the first six months of 2018 and
$325 million
in the first six months of 2017.
Opening Balance Adjustments
The following table summarizes the effects of adopting
Revenue Recognition - Contracts with Customers
,
Financial Instruments - Recognition and Measurement
, and other accounting standards on our financial statements for the fiscal year beginning December 31, 2017 as an adjustment to the opening balance:
|
Adjustments from
|
||||||||||||||||||||
|
(In Millions) |
Balance as of
Dec 30, 2017 |
Revenue Standard
|
Financial Instruments Standard
|
Other
1
|
Opening Balance as of
Dec 31, 2017 |
|||||||||||||||
|
Assets:
|
||||||||||||||||||||
|
Accounts receivable
|
$
|
5,607
|
|
$
|
(530
|
)
|
$
|
—
|
|
$
|
—
|
|
$
|
5,077
|
|
|||||
|
Inventories
|
$
|
6,983
|
|
$
|
47
|
|
$
|
—
|
|
$
|
—
|
|
$
|
7,030
|
|
|||||
|
Other current assets
|
$
|
2,908
|
|
$
|
64
|
|
$
|
—
|
|
$
|
(8
|
)
|
$
|
2,964
|
|
|||||
|
Equity investments
|
$
|
—
|
|
$
|
—
|
|
$
|
8,579
|
|
$
|
—
|
|
$
|
8,579
|
|
|||||
|
Marketable equity securities
|
$
|
4,192
|
|
$
|
—
|
|
$
|
(4,192
|
)
|
$
|
—
|
|
$
|
—
|
|
|||||
|
Other long-term assets
|
$
|
7,602
|
|
$
|
—
|
|
$
|
(4,387
|
)
|
$
|
(43
|
)
|
$
|
3,172
|
|
|||||
|
Liabilities:
|
||||||||||||||||||||
|
Deferred income
|
$
|
1,656
|
|
$
|
(1,356
|
)
|
$
|
—
|
|
$
|
—
|
|
$
|
300
|
|
|||||
|
Other accrued liabilities
|
$
|
7,535
|
|
$
|
81
|
|
$
|
—
|
|
$
|
—
|
|
$
|
7,616
|
|
|||||
|
Deferred income taxes
|
$
|
3,046
|
|
$
|
191
|
|
$
|
—
|
|
$
|
(20
|
)
|
$
|
3,217
|
|
|||||
|
Stockholders' equity:
|
||||||||||||||||||||
|
Accumulated other comprehensive income (loss)
|
$
|
862
|
|
$
|
—
|
|
$
|
(1,745
|
)
|
$
|
(45
|
)
|
$
|
(928
|
)
|
|||||
|
Retained earnings
|
$
|
42,083
|
|
$
|
665
|
|
$
|
1,745
|
|
$
|
14
|
|
$
|
44,507
|
|
|||||
|
1
|
Includes adjustments from adoption of "Income Taxes - Intra-Entity Transfers of Assets Other Than Inventory" and "Income Statement
—
Reporting Comprehensive Income - Reclassification of Certain Tax Effects from Accumulated Other Comprehensive Income."
|
|
FINANCIAL STATEMENTS
|
Notes to Financial Statements
|
9
|
The following table summarizes the impacts of adopting the new revenue standard on our consolidated condensed statements of income and balance sheets:
|
Three Months Ended June 30, 2018
|
Six Months Ended June 30, 2018
|
|||||||||||||||||||||||
|
(In Millions)
|
As reported
|
Adjustments
|
Without new revenue standard
|
As reported
|
Adjustments
|
Without new revenue standard
|
||||||||||||||||||
|
Income Statement
|
||||||||||||||||||||||||
|
Net revenue
|
$
|
16,962
|
|
$
|
78
|
|
$
|
17,040
|
|
$
|
33,028
|
|
$
|
(384
|
)
|
$
|
32,644
|
|
||||||
|
Cost of sales
|
6,543
|
|
(26
|
)
|
6,517
|
|
12,878
|
|
(182
|
)
|
12,696
|
|
||||||||||||
|
Gross margin
|
10,419
|
|
104
|
|
10,523
|
|
20,150
|
|
(202
|
)
|
19,948
|
|
||||||||||||
|
Marketing, general and administrative
|
1,725
|
|
(18
|
)
|
1,707
|
|
3,625
|
|
(70
|
)
|
3,555
|
|
||||||||||||
|
Operating income
|
5,273
|
|
122
|
|
5,395
|
|
9,743
|
|
(132
|
)
|
9,611
|
|
||||||||||||
|
Income before taxes
|
5,529
|
|
122
|
|
5,651
|
|
10,540
|
|
(132
|
)
|
10,408
|
|
||||||||||||
|
Provision for taxes
|
523
|
|
23
|
|
546
|
|
1,080
|
|
(24
|
)
|
1,056
|
|
||||||||||||
|
Net income
|
$
|
5,006
|
|
$
|
99
|
|
$
|
5,105
|
|
$
|
9,460
|
|
$
|
(108
|
)
|
$
|
9,352
|
|
||||||
|
As of June 30, 2018
|
||||||||||||||||||||||||
|
(In Millions)
|
As reported
|
Adjustments
|
Without new revenue standard
|
|||||||||||||||||||||
|
Balance Sheet
|
||||||||||||||||||||||||
|
Assets:
|
||||||||||||||||||||||||
|
Accounts receivable
|
$
|
4,636
|
|
$
|
482
|
|
$
|
5,118
|
|
|||||||||||||||
|
Inventories
|
$
|
7,344
|
|
$
|
34
|
|
$
|
7,378
|
|
|||||||||||||||
|
Other current assets
|
$
|
3,398
|
|
$
|
4
|
|
$
|
3,402
|
|
|||||||||||||||
|
Liabilities:
|
||||||||||||||||||||||||
|
Deferred income
|
$
|
—
|
|
$
|
1,677
|
|
$
|
1,677
|
|
|||||||||||||||
|
Other accrued liabilities
|
$
|
7,317
|
|
$
|
(181
|
)
|
$
|
7,136
|
|
|||||||||||||||
|
Deferred income taxes
|
$
|
1,666
|
|
$
|
(203
|
)
|
$
|
1,463
|
|
|||||||||||||||
|
Equity:
|
||||||||||||||||||||||||
|
Retained earnings
|
$
|
45,666
|
|
$
|
(773
|
)
|
$
|
44,893
|
|
|||||||||||||||
We manage our business through the following operating segments:
|
•
|
Client Computing Group (CCG)
|
|
•
|
Data Center Group (DCG)
|
|
•
|
Internet of Things Group (IOTG)
|
|
•
|
Non-Volatile Memory Solutions Group (NSG)
|
|
•
|
Programmable Solutions Group (PSG)
|
|
•
|
All Other
|
We offer platform products that incorporate various components and technologies, including a microprocessor and chipset, a stand-alone System-on-Chip (SoC), or a multichip package. A platform product may be enhanced by additional hardware, software, and services offered by Intel. Platform products are used in various form factors across our CCG, DCG, and IOTG operating segments. We derive a substantial majority of our revenue from platform products, which are our principal products and considered as one class of product.
CCG and DCG are our reportable operating segments. IOTG, NSG, and PSG do not meet the quantitative thresholds to qualify as reportable operating segments; however, we have elected to disclose the results of these non-reportable operating segments.
|
FINANCIAL STATEMENTS
|
Notes to Financial Statements
|
10
|
The “all other” category includes revenue, expenses, and charges such as:
|
•
|
results of operations from non-reportable segments not otherwise presented, including Mobileye results;
|
|
•
|
historical results of operations from divested businesses, including Intel Security Group (ISecG) results;
|
|
•
|
results of operations of start-up businesses that support our initiatives, including our foundry business;
|
|
•
|
amounts included within restructuring and other charges;
|
|
•
|
a portion of employee benefits, compensation, and other expenses not allocated to the operating segments; and
|
|
•
|
acquisition-related costs, including amortization and any impairment of acquisition-related intangibles and goodwill.
|
The Chief Operating Decision Maker (CODM), which is our
interim
Chief Executive Officer, does not evaluate operating segments using discrete asset information. Operating segments do not record inter-segment revenue. We do not allocate gains and losses from equity investments, interest and other income, or taxes to operating segments. Although the CODM uses operating income to evaluate the segments, operating costs included in one segment may benefit other segments. Except for these differences, the accounting policies for segment reporting are the same as for Intel as a whole.
Net revenue and operating income (loss) for each period were as follows:
|
Three Months Ended
|
Six Months Ended
|
|||||||||||||||
|
(In Millions)
|
Jun 30,
2018 |
Jul 1,
2017 |
Jun 30,
2018 |
Jul 1,
2017 |
||||||||||||
|
Net revenue:
|
||||||||||||||||
|
Client Computing Group
|
||||||||||||||||
|
Platform
|
$
|
8,065
|
|
$
|
7,634
|
|
$
|
15,680
|
|
$
|
15,031
|
|
||||
|
Adjacent
|
663
|
|
579
|
|
1,268
|
|
1,158
|
|
||||||||
|
8,728
|
|
8,213
|
|
16,948
|
|
16,189
|
|
|||||||||
|
Data Center Group
|
||||||||||||||||
|
Platform
|
5,100
|
|
4,026
|
|
9,924
|
|
7,905
|
|
||||||||
|
Adjacent
|
449
|
|
346
|
|
859
|
|
699
|
|
||||||||
|
5,549
|
|
4,372
|
|
10,783
|
|
8,604
|
|
|||||||||
|
Internet of Things Group
|
||||||||||||||||
|
Platform
|
745
|
|
614
|
|
1,464
|
|
1,246
|
|
||||||||
|
Adjacent
|
135
|
|
106
|
|
256
|
|
195
|
|
||||||||
|
880
|
|
720
|
|
1,720
|
|
1,441
|
|
|||||||||
|
Non-Volatile Memory Solutions Group
|
1,079
|
|
874
|
|
2,119
|
|
1,740
|
|
||||||||
|
Programmable Solutions Group
|
517
|
|
440
|
|
1,015
|
|
865
|
|
||||||||
|
All other
|
209
|
|
144
|
|
443
|
|
720
|
|
||||||||
|
Total net revenue
|
$
|
16,962
|
|
$
|
14,763
|
|
$
|
33,028
|
|
$
|
29,559
|
|
||||
|
Operating income (loss):
|
||||||||||||||||
|
Client Computing Group
|
$
|
3,234
|
|
$
|
3,025
|
|
$
|
6,025
|
|
$
|
6,056
|
|
||||
|
Data Center Group
|
2,737
|
|
1,661
|
|
5,339
|
|
3,148
|
|
||||||||
|
Internet of Things Group
|
243
|
|
139
|
|
470
|
|
244
|
|
||||||||
|
Non-Volatile Memory Solutions Group
|
(65
|
)
|
(110
|
)
|
(146
|
)
|
(239
|
)
|
||||||||
|
Programmable Solutions Group
|
101
|
|
97
|
|
198
|
|
189
|
|
||||||||
|
All other
|
(977
|
)
|
(970
|
)
|
(2,143
|
)
|
(1,924
|
)
|
||||||||
|
Total operating income
|
$
|
5,273
|
|
$
|
3,842
|
|
$
|
9,743
|
|
$
|
7,474
|
|
||||
|
FINANCIAL STATEMENTS
|
Notes to Financial Statements
|
11
|
Disaggregated net revenue for each period was as follows:
|
Three Months Ended
|
Six Months Ended
|
|||||||||||||||
|
(In Millions)
|
Jun 30,
2018 |
Jul 1,
2017 |
Jun 30,
2018 |
Jul 1,
2017 |
||||||||||||
|
Platform revenue
|
||||||||||||||||
|
Desktop platform
|
$
|
2,954
|
|
$
|
2,776
|
|
$
|
5,861
|
|
$
|
5,631
|
|
||||
|
Notebook platform
|
5,086
|
|
4,816
|
|
9,775
|
|
9,314
|
|
||||||||
|
DCG platform
|
5,100
|
|
4,026
|
|
9,924
|
|
7,905
|
|
||||||||
|
Other platform
1
|
770
|
|
656
|
|
1,508
|
|
1,332
|
|
||||||||
|
13,910
|
|
12,274
|
|
27,068
|
|
24,182
|
|
|||||||||
|
—
|
|
|||||||||||||||
|
Adjacent revenue
2
|
3,052
|
|
2,489
|
|
5,960
|
|
4,843
|
|
||||||||
|
ISecG divested business
|
—
|
|
—
|
|
—
|
|
534
|
|
||||||||
|
Total revenue
|
$
|
16,962
|
|
$
|
14,763
|
|
$
|
33,028
|
|
$
|
29,559
|
|
||||
|
1
|
Includes our tablet, service provider, and IOTG platform revenue.
|
|
2
|
Includes all of our non-platform products for CCG, DCG, and IOTG like modem, ethernet, and silicon photonics, as well as NSG, PSG, and Mobileye products.
|
We computed basic earnings per share of common stock based on the weighted average number of shares of common stock outstanding during the period. We computed diluted earnings per share of common stock based on the weighted average number of shares of common stock outstanding plus potentially dilutive shares of common stock outstanding during the period.
|
|
Three Months Ended
|
Six Months Ended
|
||||||||||||||
|
(In Millions, Except Per Share Amounts)
|
Jun 30,
2018 |
Jul 1,
2017 |
Jun 30,
2018 |
Jul 1,
2017 |
||||||||||||
|
Net income available to common stockholders
|
$
|
5,006
|
|
$
|
2,808
|
|
$
|
9,460
|
|
$
|
5,772
|
|
||||
|
Weighted average shares of common stock outstanding – basic
|
4,649
|
|
4,710
|
|
4,661
|
|
4,717
|
|
||||||||
|
Dilutive effect of employee equity incentive plans
|
52
|
|
36
|
|
59
|
|
48
|
|
||||||||
|
Dilutive effect of convertible debt
|
46
|
|
99
|
|
48
|
|
99
|
|
||||||||
|
Weighted average shares of common stock outstanding – diluted
|
4,747
|
|
4,845
|
|
4,768
|
|
4,864
|
|
||||||||
|
Earnings per share – Basic
|
$
|
1.08
|
|
$
|
0.60
|
|
$
|
2.03
|
|
$
|
1.22
|
|
||||
|
Earnings per share – Diluted
|
$
|
1.05
|
|
$
|
0.58
|
|
$
|
1.98
|
|
$
|
1.19
|
|
||||
Potentially dilutive shares of common stock from employee equity incentive plans are determined by applying the treasury stock method to the assumed exercise of outstanding stock options, the assumed vesting of outstanding restricted stock units (RSUs), and the assumed issuance of common stock under the stock purchase plan. In December 2017, we paid cash to satisfy the conversion of our 2035 debentures, which we excluded from our dilutive earnings per share computation starting in the fourth quarter of 2017 and are no longer dilutive. Our 2039 debentures require settlement of the principal amount of the debt in cash upon conversion. Since the conversion premium is paid in cash or stock at our option, we determined the potentially dilutive shares of common stock by applying the treasury stock method. As of
June 30, 2018
, we paid cash to satisfy the conversion of a portion of our 2039 debentures.
The potentially dilutive shares associated with the converted portion are excluded from our diluted earnings per share computation in the first six months of 2018 as they are no longer dilutive.
In all periods presented, potentially dilutive outstanding securities which would have been antidilutive are
insignificant
and are excluded from the computation of diluted earnings per share. In all periods presented, we
included
our outstanding 2039 debentures in the calculation of diluted earnings per share of common stock because the average market price was above the conversion price. We could potentially exclude the 2039 debentures in the future if the average market price is below the conversion price.
|
(In Millions)
|
Jun 30,
2018 |
Opening Balance as of Dec 31, 2017
|
||||||
|
Contract liabilities from prepaid supply agreements
|
$
|
2,704
|
|
$
|
105
|
|
||
|
Contract liabilities from software, services and other
|
115
|
|
195
|
|
||||
|
Total contract liabilities
|
$
|
2,819
|
|
$
|
300
|
|
||
Contract liabilities are primarily related to partial prepayments received from customers on long term supply agreements towards future NSG product delivery. As new prepaid supply agreements are entered into and performance obligations are negotiated, this component of the contract liability balance will increase, and as customers purchase product and utilize their prepaid balances, the balance will decrease. The short-term portion of prepayments from supply agreements is reported on the consolidated condensed balance sheets within other accrued liabilities.
The following table shows the changes in contract liability balances relating to prepaid supply agreements during the
first six months
of
2018
:
|
(In Millions)
|
||||
|
Prepaid supply agreements balance as of Dec 31, 2017
|
$
|
105
|
|
|
|
Additions and adjustments
|
2,723
|
|
||
|
Revenue recognized
|
(124
|
)
|
||
|
Prepaid supply agreements balance as of Jun 30, 2018
|
$
|
2,704
|
|
|
Additions in the
first six months
of
2018
include a
$1.0 billion
reclassification from customer deposits previously included in other long-term liabilities
. The long-term supply agreements represent
$5.0 billion
in future anticipated revenues with
4%
expected to be recognized during the current year and the remainder ratably over the next five years.
INVENTORIES
|
(In Millions)
|
Jun 30,
2018 |
Dec 30,
2017 |
||||||
|
Raw materials
|
$
|
1,236
|
|
$
|
1,098
|
|
||
|
Work in process
|
4,081
|
|
3,893
|
|
||||
|
Finished goods
|
2,027
|
|
1,992
|
|
||||
|
Total inventories
|
$
|
7,344
|
|
$
|
6,983
|
|
||
INTEREST AND OTHER, NET
The components of interest and other, net for each period were as follows:
|
|
Three Months Ended
|
Six Months Ended
|
||||||||||||||
|
(In Millions)
|
Jun 30,
2018 |
Jul 1,
2017 |
Jun 30,
2018 |
Jul 1,
2017 |
||||||||||||
|
Interest income
|
$
|
108
|
|
$
|
136
|
|
$
|
199
|
|
$
|
212
|
|
||||
|
Interest expense
|
(116
|
)
|
(156
|
)
|
(228
|
)
|
(302
|
)
|
||||||||
|
Other, net
|
467
|
|
408
|
|
386
|
|
409
|
|
||||||||
|
Total interest and other, net
|
$
|
459
|
|
$
|
388
|
|
$
|
357
|
|
$
|
319
|
|
||||
Interest expense in the preceding table is net of
$126 million
of interest capitalized in the
second
quarter of
2018
and
$239 million
in the
first six months
of
2018
(
$69 million
in the
second
quarter of
2017
and
$136 million
in the
first six months
of
2017
).
In the second quarter of 2018, we completed the divestiture of Wind River Systems, Inc. and recognized a pre-tax gain of
$494 million
. For the six months ended
June 30, 2018
, we have settled conversion requests for our 2039 convertible debentures totaling
$476 million
in principal, resulting in a cumulative loss of
$130 million
.
|
FINANCIAL STATEMENTS
|
Notes to Financial Statements
|
12
|
During the second quarter of 2018, we adjusted our provisional tax estimates related to the U.S. Tax Cuts and Jobs Act (Tax Reform) that we recorded in the fourth quarter of 2017 to reflect the impact of additional analysis related to the transition tax liability. Our accounting remains incomplete as of the
second
quarter of 2018 and will be refined throughout
2018
based on our ongoing analysis of data and tax positions along with new guidance from regulators and interpretation of the law. Our estimated annual effective tax rate for the
first six months
of
2018
includes provisional tax estimates for certain Tax Reform provisions related to foreign-derived intangible income and low-taxed intangible income. We expect that these provisions will be clarified by additional analysis and regulatory guidance, and the clarification could impact our estimated annual effective tax rate.
Our effective income tax rate was
10.2%
in the
first six months
of
2018
compared to
31.2%
in the
first six months
of
2017
. Tax Reform reduced the U.S. statutory federal tax rate from
35.0%
to
21.0%
, which favorably impacted our effective tax rate in the
first six months
of
2018
by approximately
eight
percentage points. Further, the Tax Reform provisions related to foreign-derived intangible income favorably impacted our effective tax rate by approximately
three
percentage points, and the provision related to low-taxed intangible income and the repeal of the domestic manufacturing deduction each unfavorably impacted our effective tax rate by approximately
one
percentage point. The decrease in the
first six months
of
2018
was also driven by one-time items, primarily associated with the
$822 million
tax expense in the second quarter of
2017
due to our divestiture of ISecG, which increased our effective tax rate in the
first six months
of
2017
by approximately
nine
percentage points, and the adjustment to our provisional estimates for Tax Reform in the first six months of 2018, which reduced our effective tax rate by approximately
two
percentage points.
Trading Assets
Net
losses
related to trading assets still held at the reporting date were
$326 million
in the
second
quarter of
2018
and
$214 million
in the
first six months
of
2018
(
$321 million
of net
gains
in the
second
quarter of
2017
and
$483 million
in the
first six months
of
2017
). Net
gains
on the related derivatives were
$316 million
in the
second
quarter of
2018
and
$221 million
in the
first six months
of
2018
(
$311 million
of net
losses
in the
second
quarter of
2017
and
$446 million
in the
first six months
of
2017
).
Available-for-Sale Debt Investments
|
June 30, 2018
|
December 30, 2017
|
|||||||||||||||||||||||||||||||
|
(In Millions)
|
Adjusted Cost
|
Gross Unrealized Gains
|
Gross Unrealized Losses
|
Fair Value
|
Adjusted Cost
|
Gross Unrealized Gains
|
Gross Unrealized Losses
|
Fair Value
|
||||||||||||||||||||||||
|
Corporate debt
|
$
|
2,054
|
|
$
|
2
|
|
$
|
(27
|
)
|
$
|
2,029
|
|
$
|
2,294
|
|
$
|
4
|
|
$
|
(13
|
)
|
$
|
2,285
|
|
||||||||
|
Financial institution instruments
|
3,433
|
|
4
|
|
(16
|
)
|
3,421
|
|
3,387
|
|
3
|
|
(9
|
)
|
3,381
|
|
||||||||||||||||
|
Government debt
|
791
|
|
—
|
|
(13
|
)
|
778
|
|
961
|
|
—
|
|
(6
|
)
|
955
|
|
||||||||||||||||
|
Total available-for-sale debt investments
|
$
|
6,278
|
|
$
|
6
|
|
$
|
(56
|
)
|
$
|
6,228
|
|
$
|
6,642
|
|
$
|
7
|
|
$
|
(28
|
)
|
$
|
6,621
|
|
||||||||
Government debt includes instruments such as non-U.S. government bonds and U.S. agency securities. Financial institution instruments include instruments issued or managed by financial institutions in various forms such as commercial paper, fixed and floating rate bonds, money market fund deposits, and time deposits.
Substantially all
time deposits were issued by institutions outside the U.S. as of
June 30, 2018
and
December 30, 2017
.
The fair value of available-for-sale debt investments, by contractual maturity, as of
June 30, 2018
, was as follows:
|
(In Millions)
|
Fair Value
|
|||
|
Due in 1 year or less
|
$
|
3,011
|
|
|
|
Due in 1–2 years
|
1,115
|
|
||
|
Due in 2–5 years
|
1,887
|
|
||
|
Due after 5 years
|
69
|
|
||
|
Instruments not due at a single maturity date
|
146
|
|
||
|
Total
|
$
|
6,228
|
|
|
|
FINANCIAL STATEMENTS
|
Notes to Financial Statements
|
13
|
EQUITY INVESTMENTS
|
(In Millions)
|
Jun 30,
2018 |
Dec 30,
2017 |
||||||
|
Marketable equity securities
|
$
|
4,432
|
|
$
|
4,192
|
|
||
|
Non-marketable equity securities
|
2,851
|
|
2,613
|
|
||||
|
Equity method investments
|
1,962
|
|
1,774
|
|
||||
|
Total
|
$
|
9,245
|
|
|
$
|
8,579
|
|
|
The components of gains (losses) on equity investments, net for each period were as follows:
|
|
Three Months Ended
|
Six Months Ended
|
||||||||||||||
|
(In Millions)
|
Jun 30,
2018 |
Jul 1,
2017 |
Jun 30,
2018 |
Jul 1,
2017 |
||||||||||||
|
Initial mark to market adjustments on marketable equity securities
1 2
|
$
|
46
|
|
$
|
—
|
|
$
|
46
|
|
$
|
—
|
|
||||
|
Ongoing mark to market adjustments on marketable equity
securities
1 2
|
(235
|
)
|
—
|
|
371
|
|
—
|
|
||||||||
|
Gains (losses) on sales
2
|
1
|
|
802
|
|
11
|
|
1,076
|
|
||||||||
|
Observable price adjustments on non-marketable equity securities
2
|
24
|
|
—
|
|
148
|
|
—
|
|
||||||||
|
Impairments
|
(26
|
)
|
(555
|
)
|
(43
|
)
|
(603
|
)
|
||||||||
|
Share of equity method investee gains (losses)
|
(70
|
)
|
(8
|
)
|
(152
|
)
|
(19
|
)
|
||||||||
|
Dividends
|
35
|
|
66
|
|
37
|
|
68
|
|
||||||||
|
Other
|
22
|
|
37
|
|
22
|
|
72
|
|
||||||||
|
Total gains (losses) on equity investments, net
|
$
|
(203
|
)
|
$
|
342
|
|
$
|
440
|
|
$
|
594
|
|
||||
|
1
|
Initial mark to market adjustments refers to the fair value adjustment recorded upon a security becoming marketable, generally as a result of an initial public offering (IPO), whereas ongoing mark to market adjustments refers to all post-IPO mark to market adjustments.
|
2
Both initial and ongoing mark to market adjustments and observable price adjustments relate to the new financial instruments standard adopted in the first quarter of 2018, and are not applicable in prior periods. Gains (losses) on sales includes realized gains (losses) on sales of non-marketable equity securities and equity method investments, and in 2017 also includes realized gains (losses) on sales of available-for-sale equity securities which are now reflected in ongoing mark to market adjustments on marketable equity securities.
|
Three Months Ended
|
Six Months Ended
|
|||||||
|
(In Millions)
|
Jun 30,
2018 |
Jun 30,
2018 |
||||||
|
Net gains (losses) recognized during the period on equity securities
|
$
|
(133
|
)
|
$
|
592
|
|
||
|
Less: Net (gains) losses recognized during the period on equity securities sold during the period
|
(11
|
)
|
(49
|
)
|
||||
|
Unrealized gains (losses) recognized during the reporting period on equity securities still held at the reporting date
|
$
|
(144
|
)
|
$
|
543
|
|
||
Cloudera, Inc.
On April 28, 2017, Cloudera, Inc. (Cloudera) completed its initial public offering and we designated our previous equity and cost method investments in Cloudera as available-for-sale. During the second quarter of 2017, we determined we had an other-than-temporary decline in the fair value of our investment and recognized an impairment charge of
$278 million
.
Beijing UniSpreadtrum Technology Ltd.
During 2014, we entered into a series of agreements with Tsinghua Unigroup Ltd. (Tsinghua Unigroup), an operating subsidiary of Tsinghua Holdings Co. Ltd., to, among other things, jointly develop Intel
®
architecture- and communications-based solutions for phones. We agreed to invest up to
9.0 billion
Chinese yuan (approximately
$1.5 billion
as of the date of the agreement) for a minority stake of approximately
20%
of Beijing UniSpreadtrum Technology Ltd., a holding company under Tsinghua Unigroup. During 2015, we invested
$966 million
to complete the first phase of the equity investment and accounted for our interest using the cost method of accounting. During 2017, we reduced our expectation of the company's future operating performance due to competitive pressures, which resulted in an impairment charge of
$308 million
.
|
FINANCIAL STATEMENTS
|
Notes to Financial Statements
|
14
|
IM Flash Technologies, LLC
IMFT was formed in 2006 by Micron and Intel to jointly develop NAND flash memory and 3D XPoint™ technology products. On July 16, 2018, Intel and Micron announced that they agreed to complete joint development for the second generation of 3D XPoint technology, which is expected to occur in the first half of 2019. Technology development beyond the second generation of 3D XPoint technology will be pursued independently by the two companies in order to optimize the technology for their respective product and business needs. Intel continues to purchase jointly developed products from Micron under certain supply agreements.
As of
June 30, 2018
, we own a
49%
interest in IMFT. The carrying value of our investment was
$1.9 billion
as of
June 30, 2018
(
$1.5 billion
as of
December 30, 2017
), which is classified as an equity method investment.
The IMFT operating agreement continues through 2024 unless terminated earlier, and provides for certain buy-sell rights of the joint venture. Intel has the right to cause Micron to buy our interest in IMFT and, if exercised, Micron could elect to receive financing from us for one to two years. Commencing in January 2019, Micron has the right to call our interest in IMFT with the closing date to be effective within one year.
IMFT is a variable interest entity and all costs of IMFT are passed on to Micron and Intel through sale of products or services in proportional share of ownership. Our portion of IMFT costs was approximately
$144 million
in the
second
quarter of
2018
and approximately
$227 million
in the
first six months
of
2018
(approximately
$105 million
in the
second
quarter of
2017
and approximately
$235 million
in the
first six months
of
2017
). In the event that IMFT has excess cash, IMFT will make payments to Micron and Intel in the form of dividends.
IMFT depends on Micron and Intel for any additional cash needs. During the
first six months
of
2018
, we extended
$319 million
in member debt financing (MDF) to IMFT to fund the ramp of 3D XPoint technology. The MDF balance may be converted to a capital contribution at our request, or may be repaid upon availability of funds. Our known maximum exposure to loss approximated the carrying value of our investment balance in IMFT. Our potential future losses could be higher than the carrying amount of our investment, as Intel and Micron are liable for other future operating costs or obligations of IMFT and future cash calls. In addition, because we are currently committed to purchasing
49%
of IMFT’s production output and production-related services, we may be required to purchase products at a cost in excess of realizable value.
We have determined that we do not have the characteristics of a consolidating investor in the variable interest entity and therefore, we account for our interest in IMFT using the equity method of accounting.
|
FINANCIAL STATEMENTS
|
Notes to Financial Statements
|
15
|
|
|
June 30, 2018
|
|||||||||||
|
(In Millions)
|
Gross Assets
|
Accumulated
Amortization |
Net
|
|||||||||
|
Acquisition-related developed technology
|
$
|
9,513
|
|
$
|
(2,472
|
)
|
$
|
7,041
|
|
|||
|
Acquisition-related customer relationships
|
2,036
|
|
(388
|
)
|
1,648
|
|
||||||
|
Acquisition-related brands
|
143
|
|
(39
|
)
|
104
|
|
||||||
|
Licensed technology and patents
|
3,084
|
|
(1,487
|
)
|
1,597
|
|
||||||
|
Identified intangible assets subject to amortization
|
14,776
|
|
(4,386
|
)
|
10,390
|
|
||||||
|
In-process research and development
|
1,567
|
|
—
|
|
1,567
|
|
||||||
|
Other intangible assets
|
141
|
|
—
|
|
141
|
|
||||||
|
Identified intangible assets not subject to amortization
|
1,708
|
|
—
|
|
1,708
|
|
||||||
|
Total identified intangible assets
|
$
|
16,484
|
|
$
|
(4,386
|
)
|
$
|
12,098
|
|
|||
|
|
December 30, 2017
|
|||||||||||
|
(In Millions)
|
Gross Assets
|
Accumulated
Amortization |
Net
|
|||||||||
|
Acquisition-related developed technology
|
$
|
8,912
|
|
$
|
(1,922
|
)
|
$
|
6,990
|
|
|||
|
Acquisition-related customer relationships
|
2,052
|
|
(313
|
)
|
1,739
|
|
||||||
|
Acquisition-related brands
|
143
|
|
(29
|
)
|
114
|
|
||||||
|
Licensed technology and patents
|
3,104
|
|
(1,370
|
)
|
1,734
|
|
||||||
|
Identified intangible assets subject to amortization
|
14,211
|
|
(3,634
|
)
|
10,577
|
|
||||||
|
In-process research and development
|
2,168
|
|
—
|
|
2,168
|
|
||||||
|
Identified intangible assets not subject to amortization
|
2,168
|
|
—
|
|
2,168
|
|
||||||
|
Total identified intangible assets
|
$
|
16,379
|
|
$
|
(3,634
|
)
|
$
|
12,745
|
|
|||
Amortization expenses recorded in the consolidated condensed statements of income for each period were as follows:
|
Three Months Ended
|
Six Months Ended
|
|||||||||||||||||
|
(In Millions)
|
Location
|
Jun 30,
2018 |
Jul 1,
2017 |
Jun 30,
2018 |
Jul 1,
2017 |
|||||||||||||
|
Acquisition-related developed technology
|
Cost of sales
|
$
|
275
|
|
$
|
198
|
|
$
|
550
|
|
$
|
407
|
|
|||||
|
Acquisition-related customer relationships
|
Amortization of acquisition-related intangibles
|
45
|
|
33
|
|
90
|
|
68
|
|
|||||||||
|
Acquisition-related brands
|
Amortization of acquisition-related intangibles
|
5
|
|
4
|
|
10
|
|
7
|
|
|||||||||
|
Licensed technology and patents
|
Cost of sales
|
67
|
|
78
|
|
132
|
|
152
|
|
|||||||||
|
Total amortization expenses
|
$
|
392
|
|
$
|
313
|
|
$
|
782
|
|
$
|
634
|
|
||||||
We expect future amortization expenses for the next five years to be as follows:
|
(In Millions)
|
Remainder of 2018
|
2019
|
2020
|
2021
|
2022
|
|||||||||||||||
|
Acquisition-related developed technology
|
$
|
549
|
|
$
|
1,097
|
|
$
|
1,066
|
|
$
|
1,030
|
|
$
|
991
|
|
|||||
|
Acquisition-related customer relationships
|
90
|
|
180
|
|
179
|
|
179
|
|
171
|
|
||||||||||
|
Acquisition-related brands
|
10
|
|
20
|
|
20
|
|
20
|
|
6
|
|
||||||||||
|
Licensed technology and patents
|
127
|
|
238
|
|
208
|
|
196
|
|
191
|
|
||||||||||
|
Total future amortization expenses
|
$
|
776
|
|
$
|
1,535
|
|
$
|
1,473
|
|
$
|
1,425
|
|
$
|
1,359
|
|
|||||
|
FINANCIAL STATEMENTS
|
Notes to Financial Statements
|
16
|
|
(In Millions)
|
Jun 30,
2018 |
Dec 30,
2017 |
||||||
|
Non-current deferred tax assets
|
$
|
1,026
|
|
$
|
840
|
|
||
|
Pre-payments for property, plant and equipment
|
1,117
|
|
714
|
|
||||
|
Loans receivable
|
541
|
|
860
|
|
||||
|
Other
|
1,006
|
|
801
|
|
||||
|
Total other long-term assets
|
$
|
3,690
|
|
$
|
3,215
|
|
||
|
FINANCIAL STATEMENTS
|
Notes to Financial Statements
|
17
|
For information about our fair value policies, and methods and assumptions used in estimating the fair value of our financial assets and liabilities, see "Note 2: Accounting Policies" and "Note 15: Fair Value" in our
2017
Form 10-K.
ASSETS AND LIABILITIES MEASURED AND RECORDED AT FAIR VALUE ON A RECURRING BASIS
|
June 30, 2018
|
December 30, 2017
|
|||||||||||||||||||||||||||||||
|
Fair Value Measured and
Recorded at Reporting Date Using
|
|
Fair Value Measured and
Recorded at Reporting Date Using
|
|
|||||||||||||||||||||||||||||
|
(In Millions)
|
Level 1
|
Level 2
|
Level 3
|
Total
|
Level 1
|
Level 2
|
Level 3
|
Total
|
||||||||||||||||||||||||
|
Assets
|
||||||||||||||||||||||||||||||||
|
Cash equivalents:
|
||||||||||||||||||||||||||||||||
|
Corporate debt
|
$
|
—
|
|
$
|
231
|
|
$
|
—
|
|
$
|
231
|
|
$
|
—
|
|
$
|
30
|
|
$
|
—
|
|
$
|
30
|
|
||||||||
|
Financial institution instruments
1
|
146
|
|
517
|
|
—
|
|
663
|
|
335
|
|
640
|
|
—
|
|
975
|
|
||||||||||||||||
|
Government debt
2
|
—
|
|
—
|
|
—
|
|
—
|
|
—
|
|
90
|
|
—
|
|
90
|
|
||||||||||||||||
|
Reverse repurchase agreements
|
—
|
|
1,249
|
|
—
|
|
1,249
|
|
—
|
|
1,399
|
|
—
|
|
1,399
|
|
||||||||||||||||
|
Short-term investments:
|
||||||||||||||||||||||||||||||||
|
Corporate debt
|
—
|
|
500
|
|
—
|
|
500
|
|
—
|
|
672
|
|
3
|
|
675
|
|
||||||||||||||||
|
Financial institution instruments
1
|
—
|
|
1,602
|
|
—
|
|
1,602
|
|
—
|
|
1,009
|
|
—
|
|
1,009
|
|
||||||||||||||||
|
Government debt
2
|
—
|
|
161
|
|
—
|
|
161
|
|
—
|
|
130
|
|
—
|
|
130
|
|
||||||||||||||||
|
Trading assets:
|
||||||||||||||||||||||||||||||||
|
Asset-backed securities
|
—
|
|
—
|
|
—
|
|
—
|
|
—
|
|
2
|
|
—
|
|
2
|
|
||||||||||||||||
|
Corporate debt
|
—
|
|
2,755
|
|
—
|
|
2,755
|
|
—
|
|
2,842
|
|
—
|
|
2,842
|
|
||||||||||||||||
|
Financial institution instruments
1
|
88
|
|
1,642
|
|
—
|
|
1,730
|
|
59
|
|
1,064
|
|
—
|
|
1,123
|
|
||||||||||||||||
|
Government debt
2
|
29
|
|
2,834
|
|
—
|
|
2,863
|
|
30
|
|
4,758
|
|
—
|
|
4,788
|
|
||||||||||||||||
|
Other current assets:
|
||||||||||||||||||||||||||||||||
|
Derivative assets
|
—
|
|
214
|
|
—
|
|
214
|
|
—
|
|
279
|
|
—
|
|
279
|
|
||||||||||||||||
|
Loans receivable
3
|
—
|
|
301
|
|
—
|
|
301
|
|
—
|
|
30
|
|
—
|
|
30
|
|
||||||||||||||||
|
Marketable equity securities
|
4,412
|
|
20
|
|
—
|
|
4,432
|
|
4,148
|
|
44
|
|
—
|
|
4,192
|
|
||||||||||||||||
|
Other long-term investments:
|
||||||||||||||||||||||||||||||||
|
Corporate debt
|
—
|
|
1,298
|
|
—
|
|
1,298
|
|
—
|
|
1,576
|
|
4
|
|
1,580
|
|
||||||||||||||||
|
Financial institution instruments
1
|
—
|
|
1,156
|
|
—
|
|
1,156
|
|
—
|
|
1,397
|
|
—
|
|
1,397
|
|
||||||||||||||||
|
Government debt
2
|
—
|
|
617
|
|
—
|
|
617
|
|
—
|
|
735
|
|
—
|
|
735
|
|
||||||||||||||||
|
Other long-term assets:
|
||||||||||||||||||||||||||||||||
|
Derivative assets
|
—
|
|
63
|
|
—
|
|
63
|
|
—
|
|
77
|
|
7
|
|
84
|
|
||||||||||||||||
|
Loans receivable
3
|
—
|
|
291
|
|
—
|
|
291
|
|
—
|
|
610
|
|
—
|
|
610
|
|
||||||||||||||||
|
Total assets measured and recorded at fair value
|
4,675
|
|
15,451
|
|
—
|
|
20,126
|
|
4,572
|
|
17,384
|
|
14
|
|
21,970
|
|
||||||||||||||||
|
Liabilities
|
||||||||||||||||||||||||||||||||
|
Other accrued liabilities:
|
||||||||||||||||||||||||||||||||
|
Derivative liabilities
|
—
|
|
435
|
|
—
|
|
435
|
|
—
|
|
454
|
|
—
|
|
454
|
|
||||||||||||||||
|
Other long-term liabilities:
|
||||||||||||||||||||||||||||||||
|
Derivative liabilities
|
—
|
|
590
|
|
79
|
|
669
|
|
—
|
|
297
|
|
6
|
|
303
|
|
||||||||||||||||
|
Total liabilities measured and recorded at fair value
|
$
|
—
|
|
$
|
1,025
|
|
$
|
79
|
|
$
|
1,104
|
|
$
|
—
|
|
$
|
751
|
|
$
|
6
|
|
$
|
757
|
|
||||||||
|
1
|
Level 1 investments consist of money market funds. Level 2 investments consist primarily of commercial paper, certificates of deposit, time deposits, and notes and bonds issued by financial institutions.
|
|
2
|
Level 1 investments consist primarily of U.S. Treasury securities. Level 2 investments consist primarily of U.S. Agency notes and non-U.S. government debt.
|
|
3
|
The fair value of our loans receivable for which we elected the fair value option
did not significantly
differ from the contractual principal balance based on the contractual currency.
|
|
FINANCIAL STATEMENTS
|
Notes to Financial Statements
|
18
|
ASSETS MEASURED AND RECORDED AT FAIR VALUE ON A NON-RECURRING BASIS
Our non-marketable equity securities, equity method investments, non-financial assets, such as intangible assets and property, plant and equipment, are recorded at fair value only if an impairment or observable price adjustment is recognized in the current period. If an observable price adjustment or impairment is recognized on our non-marketable equity securities during the period, we classify these assets as Level 3 within the fair value hierarchy based on the nature of the fair value inputs.
FINANCIAL INSTRUMENTS NOT RECORDED AT FAIR VALUE ON A RECURRING BASIS
Financial instruments not recorded at fair value on a recurring basis include non-marketable equity securities (that have not been re-measured or impaired in the current period), grants receivable, loans receivable, reverse repurchase agreements and our short-term and long-term debt.
Prior to the adoption of the new financial instrument standard, our non-marketable cost method investments were disclosed at fair value on a recurring basis and the carrying amount and fair value as of
December 30, 2017
was
$2.6 billion
and
$3.6 billion
, respectively. These assets were classified as Level 3 within the fair value hierarchy based on the nature of the fair value inputs.
As of
June 30, 2018
, the aggregate carrying value of grants receivable, loans receivable, and reverse repurchase agreements was
$996 million
(the aggregate carrying amount as of
December 30, 2017
was
$935 million
). The estimated fair value of these financial instruments approximates their carrying value and is categorized as Level 2 within the fair value hierarchy based on the nature of the fair value inputs.
As of
June 30, 2018
, the fair value of short and long-term debt (excluding drafts payable) was
$29.5 billion
(the fair value as of
December 30, 2017
was
$29.4 billion
). These liabilities are classified as Level 2 within the fair value hierarchy based on the nature of the fair value inputs.
The changes in accumulated other comprehensive income (loss) by component and related tax effects in the
first six months
of
2018
were as follows:
|
(In Millions)
|
Unrealized Holding Gains (Losses) on Available-for-Sale Equity Investments
|
Unrealized Holding Gains (Losses) on Derivatives
|
Actuarial Valuation and Other Pension Expenses
|
Translation adjustments and other
|
Total
|
|||||||||||||||
|
Balance as of December 30, 2017
|
$
|
1,745
|
|
$
|
106
|
|
$
|
(963
|
)
|
$
|
(26
|
)
|
$
|
862
|
|
|||||
|
Impact of change in accounting standards
|
(1,745
|
)
|
24
|
|
(65
|
)
|
(4
|
)
|
(1,790
|
)
|
||||||||||
|
Opening Balance as of December 31, 2017
|
$
|
—
|
|
$
|
130
|
|
$
|
(1,028
|
)
|
$
|
(30
|
)
|
$
|
(928
|
)
|
|||||
|
Other comprehensive income (loss) before reclassifications
|
—
|
|
(134
|
)
|
4
|
|
(26
|
)
|
(156
|
)
|
||||||||||
|
Amounts reclassified out of accumulated other comprehensive income (loss)
|
—
|
|
(87
|
)
|
32
|
|
6
|
|
(49
|
)
|
||||||||||
|
Tax effects
|
—
|
|
47
|
|
(10
|
)
|
7
|
|
44
|
|
||||||||||
|
Other comprehensive income (loss)
|
—
|
|
(174
|
)
|
26
|
|
(13
|
)
|
(161
|
)
|
||||||||||
|
Balance as of June 30, 2018
|
$
|
—
|
|
$
|
(44
|
)
|
$
|
(1,002
|
)
|
$
|
(43
|
)
|
$
|
(1,089
|
)
|
|||||
|
FINANCIAL STATEMENTS
|
Notes to Financial Statements
|
19
|
The amounts reclassified out of accumulated other comprehensive income (loss) into the consolidated condensed statements of income for each period were as follows:
|
Income Before Taxes Impact
(In Millions) |
||||||||||||||||||
|
Three Months Ended
|
Six Months Ended
|
|||||||||||||||||
|
Comprehensive Income Components
|
Location
|
Jun 30,
2018 |
Jul 1,
2017 |
Jun 30,
2018 |
Jul 1,
2017 |
|||||||||||||
|
Unrealized holding gains (losses) on available-for-sale equity investments:
|
||||||||||||||||||
|
Gains (losses) on equity investments, net
|
$
|
—
|
|
$
|
783
|
|
$
|
—
|
|
$
|
1,046
|
|
||||||
|
—
|
|
783
|
|
—
|
|
1,046
|
|
|||||||||||
|
Unrealized holding gains (losses) on derivatives:
|
||||||||||||||||||
|
Foreign currency contracts
|
Cost of sales
|
11
|
|
(27
|
)
|
19
|
|
(47
|
)
|
|||||||||
|
Research and development
|
30
|
|
2
|
|
71
|
|
(14
|
)
|
||||||||||
|
Marketing, general and administrative
|
18
|
|
(1
|
)
|
32
|
|
(6
|
)
|
||||||||||
|
Gains (losses) on equity investments, net
|
—
|
|
12
|
|
—
|
|
16
|
|
||||||||||
|
Interest and other, net
|
(25
|
)
|
(3
|
)
|
(35
|
)
|
35
|
|
||||||||||
|
34
|
|
(17
|
)
|
87
|
|
(16
|
)
|
|||||||||||
|
Amortization of pension and postretirement benefit components:
|
||||||||||||||||||
|
Actuarial valuation and other pension expenses
|
13
|
|
(4
|
)
|
(32
|
)
|
(28
|
)
|
||||||||||
|
13
|
|
(4
|
)
|
(32
|
)
|
(28
|
)
|
|||||||||||
|
Translation adjustments and other
|
Interest and other, net
|
(7
|
)
|
(507
|
)
|
(6
|
)
|
(507
|
)
|
|||||||||
|
Total amounts reclassified out of accumulated other comprehensive income (loss)
|
$
|
40
|
|
$
|
255
|
|
$
|
49
|
|
$
|
495
|
|
||||||
The amortization of pension and postretirement benefit components is included in the computation of net periodic benefit cost. For more information, see "Note 18: Retirement Benefit Plans" in our
2017
Form 10-K.
We estimate that we will reclassify approximately
$145 million
(before taxes) of net derivative
losses
included in accumulated other comprehensive income (loss) into earnings within the next 12 months.
|
FINANCIAL STATEMENTS
|
Notes to Financial Statements
|
20
|
For further information on our derivative policies, see "Note 2: Accounting Policies" in our
2017
Form 10-K.
VOLUME OF DERIVATIVE ACTIVITY
Total gross notional amounts for outstanding derivatives (recorded at fair value) at the end of each period were as follows:
|
(In Millions)
|
Jun 30,
2018 |
Dec 30,
2017 |
Jul 1,
2017 |
|||||||||
|
Foreign currency contracts
|
$
|
18,396
|
|
$
|
19,958
|
|
$
|
20,861
|
|
|||
|
Interest rate contracts
|
23,349
|
|
16,823
|
|
16,781
|
|
||||||
|
Other
|
1,477
|
|
1,636
|
|
1,396
|
|
||||||
|
Total
|
$
|
43,222
|
|
$
|
38,417
|
|
$
|
39,038
|
|
|||
FAIR VALUE OF DERIVATIVE INSTRUMENTS IN THE CONSOLIDATED CONDENSED BALANCE SHEETS
|
|
June 30, 2018
|
December 30, 2017
|
||||||||||||||
|
(In Millions)
|
Assets
1
|
Liabilities
2
|
Assets
1
|
Liabilities
2
|
||||||||||||
|
Derivatives designated as hedging instruments:
|
||||||||||||||||
|
Foreign currency contracts
3
|
$
|
60
|
|
$
|
185
|
|
$
|
283
|
|
$
|
32
|
|
||||
|
Interest rate contracts
|
24
|
|
647
|
|
1
|
|
254
|
|
||||||||
|
Total derivatives designated as hedging instruments
|
84
|
|
832
|
|
284
|
|
286
|
|
||||||||
|
Derivatives not designated as hedging instruments:
|
||||||||||||||||
|
Foreign currency contracts
3
|
159
|
|
247
|
|
52
|
|
447
|
|
||||||||
|
Interest rate contracts
|
33
|
|
25
|
|
18
|
|
24
|
|
||||||||
|
Other
|
1
|
|
—
|
|
9
|
|
—
|
|
||||||||
|
Total derivatives not designated as hedging instruments
|
193
|
|
272
|
|
79
|
|
471
|
|
||||||||
|
Total derivatives
|
$
|
277
|
|
$
|
1,104
|
|
$
|
363
|
|
$
|
757
|
|
||||
|
1
|
Derivative assets are recorded as other assets, current and non-current.
|
|
2
|
Derivative liabilities are recorded as other liabilities, current and non-current.
|
|
3
|
The majority of these instruments mature within
12 months.
|
|
FINANCIAL STATEMENTS
|
Notes to Financial Statements
|
21
|
AMOUNTS OFFSET IN THE CONSOLIDATED CONDENSED BALANCE SHEETS
The gross amounts of our derivative instruments and reverse repurchase agreements subject to master netting arrangements with various counterparties, and cash and non-cash collateral posted under such agreements at the end of each period were as follows:
|
June 30, 2018
|
||||||||||||||||||||||||
|
Gross Amounts Not Offset in the Balance Sheet
|
||||||||||||||||||||||||
|
(In Millions)
|
Gross Amounts Recognized
|
Gross Amounts Offset in the Balance Sheet
|
Net Amounts Presented in the Balance Sheet
|
Financial Instruments
|
Cash and Non-Cash Collateral Received or Pledged
|
Net Amount
|
||||||||||||||||||
|
Assets:
|
||||||||||||||||||||||||
|
Derivative assets subject to master netting arrangements
|
$
|
277
|
|
$
|
—
|
|
$
|
277
|
|
$
|
(172
|
)
|
$
|
(105
|
)
|
$
|
—
|
|
||||||
|
Reverse repurchase agreements
|
1,499
|
|
—
|
|
1,499
|
|
—
|
|
(1,499
|
)
|
—
|
|
||||||||||||
|
Total assets
|
1,776
|
|
—
|
|
1,776
|
|
(172
|
)
|
(1,604
|
)
|
—
|
|
||||||||||||
|
Liabilities:
|
||||||||||||||||||||||||
|
Derivative liabilities subject to master netting arrangements
|
1,095
|
|
—
|
|
1,095
|
|
(172
|
)
|
(885
|
)
|
38
|
|
||||||||||||
|
Total liabilities
|
$
|
1,095
|
|
$
|
—
|
|
$
|
1,095
|
|
$
|
(172
|
)
|
$
|
(885
|
)
|
$
|
38
|
|
||||||
|
December 30, 2017
|
||||||||||||||||||||||||
|
Gross Amounts Not Offset in the Balance Sheet
|
||||||||||||||||||||||||
|
(In Millions)
|
Gross Amounts Recognized
|
Gross Amounts Offset in the Balance Sheet
|
Net Amounts Presented in the Balance Sheet
|
Financial Instruments
|
Cash and Non-Cash Collateral Received or Pledged
|
Net Amount
|
||||||||||||||||||
|
Assets:
|
||||||||||||||||||||||||
|
Derivative assets subject to master netting arrangements
|
$
|
350
|
|
$
|
—
|
|
$
|
350
|
|
$
|
(206
|
)
|
$
|
(130
|
)
|
$
|
14
|
|
||||||
|
Reverse repurchase agreements
|
1,649
|
|
—
|
|
1,649
|
|
—
|
|
(1,649
|
)
|
—
|
|
||||||||||||
|
Total assets
|
1,999
|
|
—
|
|
1,999
|
|
(206
|
)
|
(1,779
|
)
|
14
|
|
||||||||||||
|
Liabilities:
|
||||||||||||||||||||||||
|
Derivative liabilities subject to master netting arrangements
|
745
|
|
—
|
|
745
|
|
(206
|
)
|
(504
|
)
|
35
|
|
||||||||||||
|
Total liabilities
|
$
|
745
|
|
$
|
—
|
|
$
|
745
|
|
$
|
(206
|
)
|
$
|
(504
|
)
|
$
|
35
|
|
||||||
We obtain and secure available collateral from counterparties against obligations, including securities lending transactions and reverse repurchase agreements, when we deem it appropriate
.
DERIVATIVES IN CASH FLOW HEDGING RELATIONSHIPS
The before-tax net gains or losses attributed to the effective portion of cash flow hedges, recognized in other comprehensive income (loss), were
$339 million
net
losses
in the
second
quarter of
2018
and
were
$134 million
net
losses
in the
first six months
of
2018
(
$180 million
net
gains
in the
second
quarter of
2017
and
$445 million
net
gains
in the
first six months
of
2017
).
Substantially all
of our cash flow hedges were foreign currency contracts for all periods presented.
During the
first six months
of 2018 and 2017, the amounts excluded from effectiveness testing were
insignificant
.
For information on the unrealized holding gains (losses) on derivatives reclassified out of accumulated other comprehensive income into the consolidated condensed statements of income, see "
Note 12: Other Comprehensive Income (Loss)
."
|
FINANCIAL STATEMENTS
|
Notes to Financial Statements
|
22
|
DERIVATIVES IN FAIR VALUE HEDGING RELATIONSHIPS
The effects of derivative instruments designated as fair value hedges, recognized in interest and other, net for each period were as follows:
|
Three Months Ended
|
Six Months Ended
|
|||||||||||||||
|
(In Millions)
|
Jun 30,
2018 |
Jul 1,
2017 |
Jun 30,
2018 |
Jul 1,
2017 |
||||||||||||
|
Interest rate contracts
|
$
|
(113
|
)
|
$
|
96
|
|
$
|
(371
|
)
|
$
|
82
|
|
||||
|
Hedged items
|
113
|
|
(96
|
)
|
371
|
|
(82
|
)
|
||||||||
|
Total
|
$
|
—
|
|
$
|
—
|
|
$
|
—
|
|
$
|
—
|
|
||||
The amounts recorded on the consolidated condensed balance sheets related to cumulative basis adjustments for fair value hedges for each period were as follows:
|
Line Item in the Consolidated Condensed Balance Sheet in Which the Hedged Item Is Included
|
Carrying Amount of the Hedged Item Asset/(Liabilities)
|
Cumulative Amount of Fair Value Hedging Adjustment Included in the Carrying Amount Assets/(Liabilities)
|
||||||||||||||
|
Years Ended
(In Millions) |
Jun 30,
2018 |
Dec 30,
2017 |
Jun 30,
2018 |
Dec 30,
2017 |
||||||||||||
|
Long-Term Debt
|
$
|
19,389
|
|
$
|
(12,653
|
)
|
$
|
623
|
|
$
|
252
|
|
||||
As of
June 30, 2018
and
December 30, 2017
, the total notional amount of pay variable/receive fixed-interest rate swaps was
$20.0 billion
and
$12.9 billion
, respectively.
DERIVATIVES NOT DESIGNATED AS HEDGING INSTRUMENTS
The effects of derivative instruments not designated as hedging instruments on the consolidated condensed statements of income for each period were as follows:
|
|
|
Three Months Ended
|
Six Months Ended
|
|||||||||||||||
|
(In Millions)
|
Location of Gains (Losses)
Recognized in Income on Derivatives
|
Jun 30,
2018 |
Jul 1,
2017 |
Jun 30,
2018 |
Jul 1,
2017 |
|||||||||||||
|
Foreign currency contracts
|
Interest and other, net
|
$
|
438
|
|
$
|
(271
|
)
|
$
|
268
|
|
$
|
(430
|
)
|
|||||
|
Interest rate contracts
|
Interest and other, net
|
6
|
|
1
|
|
20
|
|
(1
|
)
|
|||||||||
|
Other
|
Various
|
27
|
|
38
|
|
(4
|
)
|
95
|
|
|||||||||
|
Total
|
$
|
471
|
|
$
|
(232
|
)
|
$
|
284
|
|
$
|
(336
|
)
|
||||||
Our equity incentive plans are broad-based, long-term programs intended to attract and retain talented employees and align stockholder and employee interests. Our plans include our 2006 Equity Incentive Plan and our 2006 Stock Purchase Plan. The 2006 Equity Incentive Plan had
186 million
shares of common stock available through June 2020 for future grants.
SHARE-BASED COMPENSATION
Share-based compensation expense recognized was
$387 million
in the
second
quarter of
2018
and
$820 million
in the
first six months
of
2018
(
$328 million
in the
second
quarter of
2017
and
$725 million
in the
first six months
of
2017
).
|
FINANCIAL STATEMENTS
|
Notes to Financial Statements
|
23
|
RESTRICTED STOCK UNIT AWARDS
Restricted stock unit activity in the
first six months
of
2018
was as follows:
|
Number of
RSUs
(In Millions)
|
Weighted Average
Grant-Date
Fair Value
|
||||||
|
December 30, 2017
|
100.4
|
|
$
|
32.36
|
|
||
|
Granted
|
32.5
|
|
$
|
49.47
|
|
||
|
Vested
|
(34.7
|
)
|
$
|
30.82
|
|
||
|
Forfeited
|
(4.1
|
)
|
$
|
34.02
|
|
||
|
June 30, 2018
|
94.1
|
|
$
|
38.76
|
|
||
The aggregate fair value of awards that vested in the
first six months
of
2018
was
$1.8 billion
, which represents the market value of our common stock on the date that the RSUs vested. The grant-date fair value of awards that vested in the
first six months
of
2018
was
$1.1 billion
. The number of RSUs vested includes shares of common stock that we withheld on behalf of employees to satisfy the minimum statutory tax withholding requirements.
STOCK PURCHASE PLAN
The 2006 Stock Purchase Plan allows eligible employees to purchase shares of our common stock at
85%
of the value of our common stock on specific dates. Rights to purchase shares of common stock are granted during the first and third quarters of each year. The 2006 Stock Purchase Plan had
142 million
shares of common stock remaining through August 2021 for issuance.
Employees purchased
8.2 million
shares of common stock in the
first six months
of
2018
for
$249 million
(
8 million
shares of common stock in the
first six months
of
2017
for
$235 million
) under the 2006 Stock Purchase Plan.
LEGAL PROCEEDINGS
We are a party to various legal proceedings, including those noted in this section. Although management at present believes that the ultimate outcome of these proceedings, individually and in the aggregate, will not materially harm our financial position, results of operations, cash flows, or overall trends, legal proceedings and related government investigations are subject to inherent uncertainties, and unfavorable rulings or other events could occur. Unfavorable resolutions could include substantial monetary damages. In addition, in matters for which injunctive relief or other conduct remedies are sought, unfavorable resolutions could include an injunction or other order prohibiting us from selling one or more products at all or in particular ways, precluding particular business practices, or requiring other remedies. An unfavorable outcome may result in a material adverse impact on our business, results of operations, financial position, and overall trends. We might also conclude that settling one or more such matters is in the best interests of our stockholders, employees, and customers, and any such settlement could include substantial payments. Except as specifically described below, we have not concluded that settlement of any of the legal proceedings noted in this section is appropriate at this time.
European Commission Competition Matter
In 2001, the European Commission (EC) commenced an investigation regarding claims by Advanced Micro Devices, Inc. (AMD) that we used unfair business practices to persuade customers to buy our microprocessors. We received numerous requests for information and documents from the EC and we responded to each of those requests. The EC issued a Statement of Objections in July 2007 and held a hearing on that Statement in March 2008. The EC issued a Supplemental Statement of Objections in July 2008. In May 2009, the EC issued a decision finding that we had violated Article 82 of the EC Treaty and Article 54 of the European Economic Area Agreement. In general, the EC found that we violated Article 82 (later renumbered as Article 102 by a new treaty) by offering alleged "conditional rebates and payments" that required our customers to purchase all or most of their x86 microprocessors from us. The EC also found that we violated Article 82 by making alleged "payments to prevent sales of specific rival products." The EC imposed a fine in the amount of
€1.1 billion
(
$1.4 billion
as of May 2009), which we subsequently paid during the third quarter of 2009, and ordered us to "immediately bring to an end the infringement referred to in" the EC decision.
The EC decision contained no specific direction on whether or how we should modify our business practices. Instead, the decision stated that we should "cease and desist" from further conduct that, in the EC's opinion, would violate applicable law. We took steps, which are subject to the EC's ongoing review, to comply with that decision pending appeal. We had discussions with the EC to better understand the decision and to explain changes to our business practices.
|
FINANCIAL STATEMENTS
|
Notes to Financial Statements
|
24
|
We appealed the EC decision to the Court of First Instance (which has been renamed the General Court) in July 2009. The hearing of our appeal took place in July 2012. In June 2014, the General Court rejected our appeal in its entirety. In August 2014, we filed an appeal with the European Court of Justice. In November 2014, Intervener Association for Competitive Technologies filed comments in support of Intel’s grounds of appeal. The EC and interveners filed briefs in November 2014, we filed a reply in February 2015, and the EC filed a rejoinder in April 2015. The Court of Justice held oral argument in June 2016. In October 2016, Advocate General Wahl, an advisor to the Court of Justice, issued a non-binding advisory opinion that favored Intel on a number of grounds. The Court of Justice issued its decision in September 2017, setting aside the judgment of the General Court and sending the case back to the General Court to examine whether the rebates at issue were capable of restricting competition. The General Court has appointed a panel of five judges to consider our appeal of the EC’s 2009 decision in light of the Court of Justice’s clarifications of the law. In November 2017, the parties filed initial “Observations” about the Court of Justice’s decision and the appeal, and were invited by the General Court to offer supplemental comments to each other’s “Observations,” which the parties submitted in March 2018. Pending the final decision in this matter, the fine paid by Intel has been placed by the EC in commercial bank accounts where it accrues interest.
Shareholder Derivative Litigation regarding In re High Tech Employee Antitrust Litigation
In March 2014, the Police Retirement System of St. Louis (PRSSL) filed a shareholder derivative action in the Superior Court of California in Santa Clara County against Intel, certain current and former members of our Board of Directors, and former officers. The complaint alleges that the defendants breached their duties to the company by participating in, or allowing, purported antitrust violations that were alleged in a now-settled antitrust class action lawsuit captioned
In re High Tech Employee Antitrust Litigation
claiming that Intel, Adobe Systems Incorporated, Apple Inc., Google Inc., Intuit Inc., Lucasfilm Ltd., and Pixar conspired to suppress their employees’ compensation. In March 2014, a second plaintiff, Barbara Templeton, filed a substantially similar derivative suit in the same court. In May 2014, a third shareholder, Robert Achermann, filed a substantially similar derivative action in the same court. The court consolidated the three actions into one, which is captioned
In re Intel Corporation Shareholder Derivative Litigation
. Plaintiffs filed a consolidated complaint in July 2014. In August 2015, the court granted our motion to dismiss the consolidated complaint. The plaintiffs thereafter filed a motion for reconsideration and a motion for new trial, both of which the court denied in October 2015. In November 2015, plaintiffs PRSSL and Templeton appealed the court's decision. The appeal is fully briefed, and we are waiting on a hearing date from the appellate court.
In June 2015, the International Brotherhood of Electrical Workers (IBEW) filed a shareholder derivative action in the Chancery Court in Delaware against Intel, certain current and former members of our Board of Directors, and former officers. The lawsuit makes allegations substantially similar to those in the California shareholder derivative litigation described above, but additionally alleges breach of the duty of disclosure with respect to
In re High Tech Employee Antitrust Litigation
and that Intel's 2013 and 2014 proxy statements misrepresented the effectiveness of the Board’s oversight of compliance issues at Intel and the Board’s compliance with Intel’s Code of Conduct and Board of Director Guidelines on Significant Corporate Governance Issues. In October 2015, the court stayed the IBEW lawsuit for six months pending further developments in the California case. In March 2016, Intel and IBEW entered into a stipulated dismissal pursuant to which IBEW dismissed its complaint but may re-file upon the withdrawal or final resolution of the appeal in the PRSSL California shareholder derivative litigation.
In April 2016, John Esposito filed a shareholder derivative action in the Superior Court of California in Santa Clara County against Intel, current members of our Board of Directors, and certain former officers and employees. Esposito made a demand on our Board in 2013 to investigate whether our officers or directors should be sued for their participation in the events described in
In re High Tech Employee Antitrust Litigation
. In November 2015, our Board decided not to take further action on Esposito’s demand based on the recommendation of the Audit Committee of the Board after its investigation of relevant facts and circumstances. Esposito seeks to set aside such decision, and alleges that the Board was not disinterested in making that decision and that the investigation was inadequate. In November 2016, the court granted Intel’s motion to dismiss the case, without leave to amend. In March 2017, plaintiff filed a motion for fees. The court denied plaintiff’s fee motion in May 2017, and entered final judgment in this matter in June 2017. In August 2017, Esposito appealed the final judgment but withdrew the appeal in June 2018, ending the case.
McAfee, Inc. Shareholder Litigation
On August 19, 2010, we announced that we had agreed to acquire all of the common stock of McAfee, Inc. (McAfee) for
$48.00
per share. Four McAfee shareholders filed putative class-action lawsuits in Santa Clara County, California Superior Court challenging the proposed transaction. The cases were ordered consolidated in September 2010. Plaintiffs filed an amended complaint that named former McAfee board members, McAfee, and Intel as defendants, and alleged that the McAfee board members breached their fiduciary duties and that McAfee and Intel aided and abetted those breaches of duty. The complaint requested rescission of the merger agreement, such other equitable relief as the court may deem proper, and an award of damages in an unspecified amount. In June 2012, the plaintiffs’ damages expert asserted that the value of a McAfee share for the purposes of assessing damages should be
$62.08
.
|
FINANCIAL STATEMENTS
|
Notes to Financial Statements
|
25
|
In January 2012, the court certified the action as a class action, appointed the Central Pension Laborers’ Fund to act as the class representative, and scheduled trial to begin in January 2013. In March 2012, defendants filed a petition with the California Court of Appeal for a writ of mandate to reverse the class certification order; the petition was denied in June 2012. In March 2012, at defendants’ request, the court held that plaintiffs were not entitled to a jury trial and ordered a bench trial. In April 2012, plaintiffs filed a petition with the California Court of Appeal for a writ of mandate to reverse that order, which the court of appeal denied in July 2012. In August 2012, defendants filed a motion for summary judgment. The trial court granted that motion in November 2012, and entered final judgment in the case in February 2013. In April 2013, plaintiffs appealed the final judgment. The California Court of Appeal heard oral argument in October 2017, and in November 2017, affirmed the judgment as to McAfee's nine outside directors, reversed the judgment as to former McAfee director and chief executive officer David DeWalt, Intel, and McAfee, and affirmed the trial court's ruling that the plaintiffs are not entitled to a jury trial. At a June 2018 case management conference following remand, the Superior Court set an October hearing date for any additional summary judgment motions that may be filed, and set trial to begin in December 2018. Plaintiffs subsequently filed a motion for leave to amend the complaint which is set for hearing in September 2018. Because the resolution of pretrial motions may materially impact the scope and nature of the proceeding, and because of uncertainties regarding theories that may be asserted at trial following the appellate court's remand of only certain claims in the proceeding and the extent of Intel's responsibility, if any, with respect to such claims, we are unable to make a reasonable estimate of the potential loss or range of losses, if any, arising from this matter. We dispute the class-action claims and intend to continue to defend the lawsuit vigorously.
Litigation related to Security Vulnerabilities
In June 2017, a Google research team notified us and other companies that it had identified security vulnerabilities (now commonly referred to as “Spectre” and “Meltdown”) that affect many types of microprocessors, including our products. As is standard when findings like these are presented, we worked together with other companies in the industry to verify the research and develop and validate software and firmware updates for impacted technologies. On January 3, 2018, information on the security vulnerabilities was publicly reported, before software and firmware updates to address the vulnerabilities were made widely available. Numerous lawsuits have been filed against Intel and, in certain cases, our executives and directors, in U.S. federal and state courts and in certain courts in other countries relating to the Spectre and Meltdown security vulnerabilities.
As of July 25, 2018,
46
consumer class action lawsuits and
three
securities class action lawsuits have been filed. The consumer class action plaintiffs, who purport to represent various classes of end users of our products, generally claim to have been harmed by Intel's actions and/or omissions in connection with the security vulnerabilities and assert a variety of common law and statutory claims seeking monetary damages and equitable relief. Of the consumer class action lawsuits,
42
have been filed in the United States,
two
in Canada, and
two
in Israel. In April 2018, the United States Judicial Panel on Multidistrict Litigation ordered the U.S. consumer class action lawsuits consolidated for pretrial proceedings in the United States District Court for the District of Oregon. The lead securities class action plaintiffs, who purport to represent classes of acquirers of Intel stock between October 27, 2017 and January 9, 2018, generally allege that Intel and certain officers violated securities laws by making statements about Intel's products that were revealed to be false or misleading by the disclosure of the security vulnerabilities. The securities class actions are pending in the United States District Court for the Northern District of California. Additional lawsuits and claims may be asserted on behalf of customers and shareholders seeking monetary damages or other related relief. We dispute the claims described above and intend to defend the lawsuits vigorously. Given the procedural posture and the nature of these cases, including that the proceedings are in the early stages, that alleged damages have not been specified, that uncertainty exists as to the likelihood of a class or classes being certified or the ultimate size of any class or classes if certified, and that there are significant factual and legal issues to be resolved, we are unable to make a reasonable estimate of the potential loss or range of losses, if any, that might arise from these matters.
In addition to these lawsuits, Intel stockholders have filed
seven
shareholder derivative lawsuits since January 2018 against certain current and former members of our Board of Directors and certain current and former officers, alleging that the defendants breached their duties to Intel in connection with the disclosure of the security vulnerabilities and the failure to take action in relation to alleged insider trading. The complaints seek to recover damages from the defendants on behalf of Intel. Three of the derivative actions were filed in the United States District Court for the Northern District of California and have been consolidated. Defendants moved to dismiss those actions on the ground that plaintiffs’ failure to make a pre-lawsuit demand on the Board was not excused. The hearing on that motion is scheduled for August 2018. Four of the derivative actions were filed in the Superior Court of the State of California in San Mateo County and have been consolidated. Defendants moved to stay the state court derivative actions pending resolution of the federal derivative actions and also moved to dismiss the state court actions on the ground that plaintiffs’ failure to make a pre-lawsuit demand on the Board was not excused. The hearing on the motion to stay is scheduled for early August 2018, and the hearing on the motion to dismiss is scheduled for late August 2018.
|
FINANCIAL STATEMENTS
|
Notes to Financial Statements
|
26
|
|
MANAGEMENT'S DISCUSSION AND ANALYSIS (MD&A) -
RESULTS OF OPERATIONS
|
After five decades in the tech industry,
we are poised to deliver another record year, our third in a row
. We had record second quarter revenue and are continuing to transform the company from a PC-centric to a data-centric company. Our data-centric businesses collectively grew 26% from a year ago and are now approaching 50% of our revenue. Individually, Data Center Group (DCG), Internet of Things Group (IOTG), Non-volatile Memory Solutions Group (NSG), and Programmable Solutions Group (PSG) all achieved double digit revenue growth. Client Computing Group (CCG) continued to execute well, producing 6% revenue growth and funding data-centric investments. Strong operating margin leverage and our lower tax rate resulted in GAAP and non-GAAP EPS growth, even as we continued investing in growth areas.
For a more comprehensive overview of the results of our operations, see "A Quarter in Review."
|
Three Months Ended
|
Six Months Ended
|
|||||||||||||||||||||||||||
|
|
Q2 2018
|
Q2 2017
|
YTD 2018
|
YTD 2017
|
||||||||||||||||||||||||
|
(Dollars in Millions, Except Per Share Amounts)
|
Dollars
|
% of Net
Revenue |
Dollars
|
% of Net
Revenue |
Dollars
|
% of Net
Revenue |
Dollars
|
% of Net
Revenue |
||||||||||||||||||||
|
Net revenue
|
$
|
16,962
|
|
100.0
|
%
|
$
|
14,763
|
|
100.0
|
%
|
$
|
33,028
|
|
100.0
|
%
|
$
|
29,559
|
|
100.0
|
%
|
||||||||
|
Cost of sales
|
6,543
|
|
38.6
|
%
|
5,667
|
|
38.4
|
%
|
12,878
|
|
39.0
|
%
|
11,303
|
|
38.2
|
%
|
||||||||||||
|
Gross margin
|
10,419
|
|
61.4
|
%
|
9,096
|
|
61.6
|
%
|
20,150
|
|
61.0
|
%
|
18,256
|
|
61.8
|
%
|
||||||||||||
|
Research and development
|
3,371
|
|
19.9
|
%
|
3,262
|
|
22.1
|
%
|
6,682
|
|
20.2
|
%
|
6,573
|
|
22.2
|
%
|
||||||||||||
|
Marketing, general and administrative
|
1,725
|
|
10.2
|
%
|
1,850
|
|
12.5
|
%
|
3,625
|
|
11.0
|
%
|
3,949
|
|
13.4
|
%
|
||||||||||||
|
Restructuring and other charges
|
—
|
|
—
|
%
|
105
|
|
0.7
|
%
|
—
|
|
—
|
%
|
185
|
|
0.6
|
%
|
||||||||||||
|
Amortization of acquisition-related intangibles
|
50
|
|
0.3
|
%
|
37
|
|
0.3
|
%
|
100
|
|
0.3
|
%
|
75
|
|
0.3
|
%
|
||||||||||||
|
Operating income
|
5,273
|
|
31.1
|
%
|
3,842
|
|
26.0
|
%
|
9,743
|
|
29.5
|
%
|
7,474
|
|
25.3
|
%
|
||||||||||||
|
Gains (losses) on equity investments, net
|
(203
|
)
|
(1.2
|
)%
|
342
|
|
2.3
|
%
|
440
|
|
1.3
|
%
|
594
|
|
2.0
|
%
|
||||||||||||
|
Interest and other, net
|
459
|
|
2.7
|
%
|
388
|
|
2.6
|
%
|
357
|
|
1.1
|
%
|
319
|
|
1.1
|
%
|
||||||||||||
|
Income before taxes
|
5,529
|
|
32.6
|
%
|
4,572
|
|
31.0
|
%
|
10,540
|
|
31.9
|
%
|
8,387
|
|
28.4
|
%
|
||||||||||||
|
Provision for taxes
|
523
|
|
3.1
|
%
|
1,764
|
|
11.9
|
%
|
1,080
|
|
3.3
|
%
|
2,615
|
|
8.8
|
%
|
||||||||||||
|
Net income
|
$
|
5,006
|
|
29.5
|
%
|
$
|
2,808
|
|
19.0
|
%
|
$
|
9,460
|
|
28.6
|
%
|
$
|
5,772
|
|
19.5
|
%
|
||||||||
|
Earnings per share – Diluted
|
$
|
1.05
|
|
$
|
0.58
|
|
$
|
1.98
|
|
$
|
1.19
|
|
||||||||||||||||
|
MD&A - RESULTS OF OPERATIONS
|
Consolidated Results & Analysis
|
27
|
REVENUE
(Dollars in charts are shown in billions)
|
SEGMENT REVENUE WALKS
|
|||
|
Q2 2018 vs. Q2 2017
|
YTD 2018 vs. YTD 2017
|
||
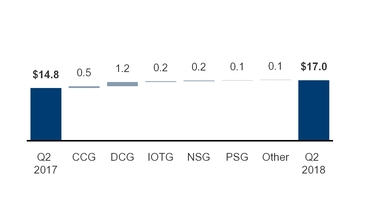
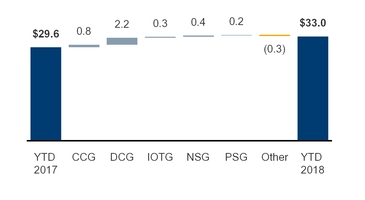
|
Q2 2018 vs. Q2 2017
|
Our
Q2 2018
revenue was
$17.0 billion
,
up
$2.2 billion
, or
15%
, from
Q2 2017
. The increase in revenue was primarily driven by strong performance across our data-centric businesses, which collectively grew
26%
year over year. Mobileye, which we acquired in Q3 2017, recognized
$173 million
in revenue, contributing to the growth of our data-centric businesses. Our PC-centric business also grew
6%
.
|
YTD 2018 vs. YTD 2017
|
Our
YTD 2018
revenue was
$33.0 billion
,
up
$3.5 billion
, or
12%
from
YTD 2017
. We are executing to our strategy of growing data-centric businesses, which collectively grew revenue by
20%
in the first half of 2018 compared to first half of 2017. Our recently acquired Mobileye business recognized
$
324
million
in revenue, contributing to the growth of our data-centric businesses. Data-centric businesses in
YTD 2017
included
$534
million in revenue from Intel Security Group (ISecG), which we divested in Q2 2017. Our PC-centric business also grew
5%
.
GROSS MARGIN
(Dollars in chart are shown in billions; percentages indicate gross margin as a percentage of total revenue)
|
GROSS MARGIN
|
|
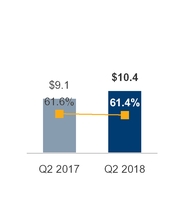
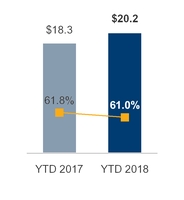
We derived
most
of our overall gross margin dollars from the sale of platform products in the CCG and DCG operating segments. Our overall gross margin dollars in
Q2 2018
increased
by
$1.3 billion
compared to
Q2 2017
. Our gross margin percentage was slightly down as the increase in higher platform revenue was offset by higher unit costs as well as
a higher proportion of our revenue from lower margin adjacent businesses.
|
MD&A - RESULTS OF OPERATIONS
|
Consolidated Results & Analysis
|
28
|
|
(In Millions)
|
Gross Margin Walk
|
|||
|
$
|
10,419
|
|
Q2 2018 Gross Margin
|
|
|
1,550
|
|
Higher gross margin from platform revenue
|
||
|
150
|
|
Higher gross margin from adjacent businesses
|
||
|
120
|
|
Lower factory start-up costs, primarily associated with our 10nm process technology
|
||
|
(350
|
)
|
Higher platform unit costs, primarily from mix of products
|
||
|
(125
|
)
|
Period charges primarily associated with engineering samples and higher initial production costs from our 10nm products
|
||
|
(22
|
)
|
Other
|
||
|
$
|
9,096
|
|
Q2 2017 Gross Margin
|
|
|
$
|
20,150
|
|
YTD 2018 Gross Margin
|
|
|
2,695
|
|
Higher gross margin from platform revenue
|
||
|
360
|
|
Lower factory start-up costs, primarily associated with our 10nm process technology
|
||
|
(435
|
)
|
Higher platform unit cost, primarily from mix of products
|
||
|
(395
|
)
|
Period charges primarily associated with engineering samples and higher initial production costs from our 10nm products
|
||
|
(295
|
)
|
Impact of ISecG divestiture offset by higher gross margin from adjacent businesses
|
||
|
(36
|
)
|
Other
|
||
|
$
|
18,256
|
|
YTD 2017 Gross Margin
|
|
|
MD&A - RESULTS OF OPERATIONS
|
Consolidated Results & Analysis
|
29
|
OPERATING EXPENSES
(Dollars in charts are shown in billions; percentages indicate expenses as a percentage of total revenue)
|
RESEARCH AND DEVELOPMENT
|
MARKETING, GENERAL AND ADMINISTRATIVE
|
||
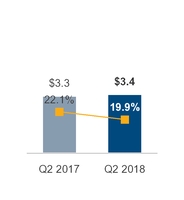
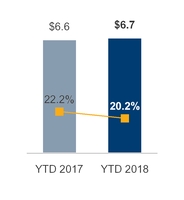
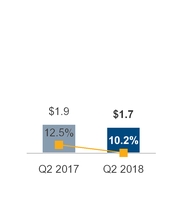
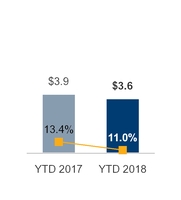
Total research and development (R&D) and marketing, general and administrative (MG&A) expenses for
Q2 2018
were
$5.1 billion
,
flat
from
Q2 2017
(
down
2.0%
on a YTD basis). These expenses represent
30.0%
of revenue for
Q2 2018
and
34.6%
of revenue for
Q2 2017
(
31.2%
of revenue in the
first six months
of
2018
and
35.6%
of revenue in the
first six months
of
2017
).
Research and Development
|
Q2 2018 vs. Q2 2017
|
R&D
increased
by
$109 million
, or
3.3%
, in
Q2 2018
compared to
Q2 2017
, driven by the following:
+
Higher investments in data-centric businesses
+
Higher profit-dependent compensation due to an increase in net income
|
YTD 2018 vs. YTD 2017
|
R&D
increased
by
$109 million
, or
1.7%
, in the
first six months
of
2018
compared to the
first six months
of
2017
, driven by the following:
+
Higher investments in data-centric businesses
+
Higher investments in 10nm process technology
+
Higher profit-dependent compensation due to an increase in net income
-
Lower expenses due to the ISecG divestiture
Marketing, General and Administrative
|
Q2 2018 vs. Q2 2017
|
MG&A
decreased
by
$125 million
, or
6.8%
, in
Q2 2018
compared to
Q2 2017
, driven by the following:
-
Lower expenses due to the ISecG divestiture
-
Change to the Intel Inside program
+
Higher profit-dependent compensation due to an increase in net income
|
YTD 2018 vs. YTD 2017
|
MG&A
decreased
by
$324 million
, or
8.2%
, in the
first six months
of
2018
compared to the
first six months
of
2017
, driven by the following:
-
Lower expenses due to the ISecG divestiture
-
Change to the Intel Inside program
+
Higher profit-dependent compensation due to an increase in net income
|
MD&A - RESULTS OF OPERATIONS
|
Consolidated Results & Analysis
|
30
|
CLIENT COMPUTING GROUP (CCG)
(Dollars in charts are shown in billions)
Overview
CCG is responsible for all aspects of the client computing continuum, which includes platforms designed for end-user form factors, focusing on high growth segments of 2-in-1, thin-and-light, commercial and gaming, and growing adjacencies as well as connectivity technologies.
|
CCG REVENUE
|
CCG OPERATING INCOME
|
||
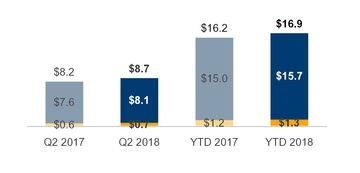
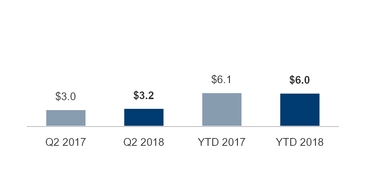
|
■
Platform
|
■
Adjacent
|
|
CCG Revenue Summary
Our revenue in Q2 2018 and in YTD 2018
increased
from strong demand in commercial and gaming market segments, and higher demand for our high-performance processors in desktop which more than offset the volume decline. Overall market conditions continue to improve and we now expect modest growth in the PC total addressable market (TAM) this year for the first time since 2011
1
.
|
(In Millions)
|
CCG Revenue Walk
|
|||
|
$
|
8,728
|
|
Q2 2018 CCG Revenue
|
|
|
328
|
|
Desktop platform ASP
|
||
|
156
|
|
Notebook platform volume
|
||
|
113
|
|
Notebook platform ASP
|
||
|
(150
|
)
|
Desktop platform volume
|
||
|
68
|
|
Other
|
||
|
$
|
8,213
|
|
Q2 2017 CCG Revenue
|
|
|
$
|
16,948
|
|
YTD 2018 CCG Revenue
|
|
|
509
|
|
Desktop platform ASP
|
||
|
323
|
|
Notebook platform volume
|
||
|
(279
|
)
|
Desktop platform volume
|
||
|
206
|
|
Other
|
||
|
$
|
16,189
|
|
YTD 2017 CCG Revenue
|
|
1
Source: Intel calculated TAM derived from industry analyst reports
|
MD&A - RESULTS OF OPERATIONS
|
Segment Results & Analysis
|
31
|
|
Key Revenue Metrics
|
|||||||
|
Q2 2018 vs. Q2 2017
|
YTD 2018 vs. YTD 2017
|
||||||
|
Desktop Platform
|
|||||||
|
Volume
|
down
|
(9)%
|
down
|
(8)%
|
|||
|
ASP
|
up
|
13%
|
up
|
10%
|
|||
|
Notebook Platform
|
|||||||
|
Volume
|
up
|
3%
|
up
|
3%
|
|||
|
ASP
|
up
|
2%
|
up
|
1%
|
|||
|
Adjacent Products
|
|||||||
|
Revenue
|
up
|
15%
|
up
|
9%
|
|||
|
(In Millions)
|
CCG Operating Income Walk
|
|||
|
$
|
3,234
|
|
Q2 2018 CCG Operating Income
|
|
|
455
|
|
Higher gross margin from CCG platform revenue
|
||
|
110
|
|
Lower CCG operating expense
|
||
|
(175
|
)
|
Period charges primarily associated with engineering samples and higher initial product costs from our 10nm products
|
||
|
(230
|
)
|
Higher CCG platform unit costs due to increased mix to performance products
|
||
|
49
|
|
Other
|
||
|
$
|
3,025
|
|
Q2 2017 CCG Operating Income
|
|
|
$
|
6,025
|
|
YTD 2018 CCG Operating Income
|
|
|
(595
|
)
|
Period charges primarily associated with engineering samples and higher initial product costs from our 10nm products
|
||
|
(285
|
)
|
Higher CCG platform unit costs due to increased mix to performance products
|
||
|
700
|
|
Higher gross margin from CCG platform revenue
|
||
|
149
|
|
Other
|
||
|
$
|
6,056
|
|
YTD 2017 CCG Operating Income
|
|
DATA CENTER GROUP (DCG)
(Dollars in charts are shown in billions)
Overview
DCG develops workload-optimized platforms for compute, storage, network, and related functions, which are designed for and sold into the enterprise and government, cloud, and communications service providers market segments.
|
DCG REVENUE
|
DCG OPERATING INCOME
|
||
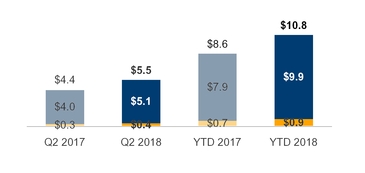
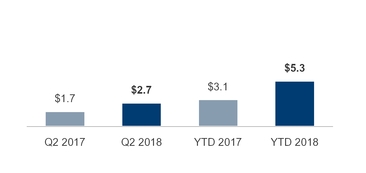
|
■
Platform
|
■
Adjacent
|
|
DCG Revenue Summary
|
MD&A - RESULTS OF OPERATIONS
|
Segment Results & Analysis
|
32
|
Our revenue grew in Q2 2018 and in YTD 2018 from strength across all market segments and adoption of 14nm Intel
®
Xeon
®
Scalable processors, which drove ASP up. We had heightened demand for data intensive workloads and macroeconomic momentum in cloud, improved market conditions in enterprise and government, and increased market segment share with communication service providers.
|
(In Millions)
|
DCG Revenue Walk
|
|||
|
$
|
5,549
|
|
Q2 2018 DCG Revenue
|
|
|
566
|
|
DCG platform volume
|
||
|
508
|
|
DCG platform ASP
|
||
|
103
|
|
Adjacent revenue
|
||
|
$
|
4,372
|
|
Q2 2017 DCG Revenue
|
|
|
$
|
10,783
|
|
YTD 2018 DCG Revenue
|
|
|
1,181
|
|
DCG platform volume
|
||
|
838
|
|
DCG platform ASP
|
||
|
160
|
|
Other
|
||
|
$
|
8,604
|
|
YTD 2017 DCG Revenue
|
|
|
Markets Segment Revenue Growth
1
|
Q2 2018 vs. Q2 2017
|
Key Revenue Metrics
|
Q2 2018 vs. Q2 2017
|
YTD 2018 vs. YTD 2017
|
||||||||
|
Cloud service provider
|
up
|
41%
|
DCG Platform
|
|||||||||
|
Enterprise and government
|
up
|
10%
|
Volume
|
up
|
14%
|
up
|
15%
|
|||||
|
Communication service provider
|
up
|
30%
|
ASP
|
up
|
11%
|
up
|
9%
|
|||||
|
1
DCG platform products are sold across all three market segments.
|
Adjacent Products
|
|||||||||||
|
Revenue
|
up
|
30%
|
up
|
23%
|
||||||||
|
(In Millions)
|
DCG Operating Income Walk
|
|||
|
$
|
2,737
|
|
Q2 2018 DCG Operating Income
|
|
|
1,005
|
|
Higher gross margin from DCG platform revenue
|
||
|
100
|
|
Lower factory start-up costs, primarily associated with our 10nm process technology
|
||
|
(120
|
)
|
Higher DCG platform unit costs
|
||
|
91
|
|
Other
|
||
|
$
|
1,661
|
|
Q2 2017 DCG Operating Income
|
|
|
$
|
5,339
|
|
YTD 2018 DCG Operating Income
|
|
|
1,875
|
|
Higher gross margin from DCG platform revenue
|
||
|
220
|
|
Lower factory start-up costs, primarily associated with our 10nm process technology
|
||
|
96
|
|
Other
|
||
|
$
|
3,148
|
|
YTD 2017 DCG Operating Income
|
|
|
MD&A - RESULTS OF OPERATIONS
|
Segment Results & Analysis
|
33
|
INTERNET OF THINGS GROUP (IOTG)
(Dollars in charts are shown in billions)
Overview
IOTG develops and sells high-performance Internet of Things compute solutions for retail, automotive, industrial, and video surveillance market segments, along with a broad range of other embedded applications. These market-driven solutions utilize silicon and software assets from our data center and client businesses to expand our compute footprint into Internet of Things market segments.
|
IOTG REVENUE
|
IOTG OPERATING INCOME
|
||
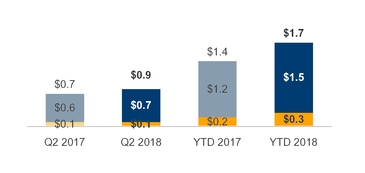
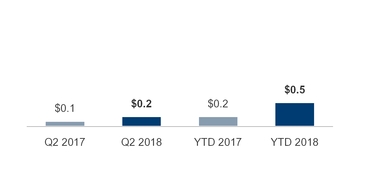
|
■
Platform
|
■
Adjacent
|
|
Revenue and Operating Income Summary
|
Q2 2018 vs. Q2 2017
|
Net revenue was
$880 million
,
up
$160 million
, driven primarily by
$199 million
higher
IOTG platform unit sales, partially offset by
$68 million
lower
IOTG platform ASPs. Revenue grew due to strength across the retail, industrial, and other market segments. Operating income was
$243 million
,
up
$104 million
driven by higher revenue.
|
YTD 2018 vs. YTD 2017
|
Net revenue was
$1.7 billion
,
up
$279 million
, driven primarily by
$453 million
higher
IOTG platform unit sales, partially offset by
$235 million
lower
IOTG platform ASPs. Revenue grew due to strength across the retail, industrial, and other market segments. Operating income was
$470 million
,
up
$226 million
driven by higher revenue, lower costs from lower factory startup and the mix of our processors, and lower spending as autonomous driving investment shifted to other businesses.
NON-VOLATILE MEMORY SOLUTIONS GROUP (NSG)
(Dollars in charts are shown in billions)
Overview
NSG offers lntel
®
Optane
™
and lntel
®
3D NAND technologies, which drive innovation in solid-state drives (SSDs) and other memory products. The primary customers are enterprise and cloud-based data centers, users of business and consumer desktops and laptops, and a variety of embedded and Internet of Things application providers.
|
NSG REVENUE
|
NSG OPERATING INCOME
|
||
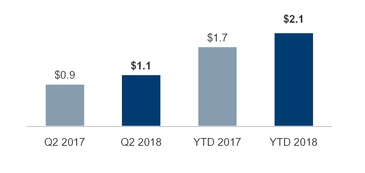
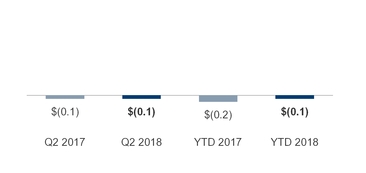
|
MD&A - RESULTS OF OPERATIONS
|
Segment Results & Analysis
|
34
|
Revenue and Operating Income Summary
|
Q2 2018 vs. Q2 2017
|
Net revenue was
$1.1 billion
,
up
$205 million
, driven by
$620 million
higher unit sales due to strong demand in data center and the growth of component and Intel Optane technology products, offset by
$414 million
lower ASP due to market condition and mix of products. Operating loss was
$65 million
,
down
$45 million
, as our triple-level cell (TLC) NAND and 64-Layer product lines continued to ramp, driving higher unit sales and lower unit cost, which more than offset the decline in ASP.
|
YTD 2018 vs. YTD 2017
|
Net revenue was
$2.1 billion
,
up
$379 million
, driven by
$1.2 billion
higher unit sales due to continued demand in data center and the growth of component and Intel Optane technology products, offset by
$859 million
lower ASP due to market condition and mix of products. Operating loss was
$146 million
,
down
$93 million
, as our TLC NAND and 64-Layer product lines continued to ramp, driving higher unit sales and lower unit cost, which more than offset the decline in ASP.
PROGRAMMABLE SOLUTIONS GROUP (PSG)
(Dollars in charts are shown in billions)
Overview
PSG offers programmable semiconductors, primarily field-programmable gate arrays (FPGAs) and related products for a broad range of market segments, including communications, data center, industrial, military, and automotive.
|
PSG REVENUE
|
PSG OPERATING INCOME
|
||
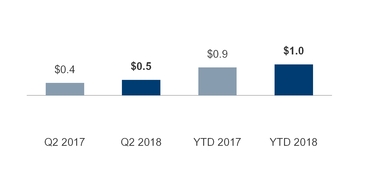
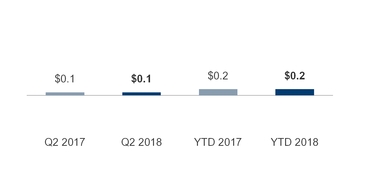
Revenue and Operating Income Summary
|
Q2 2018 vs. Q2 2017
|
PSG revenue was
$517 million
,
up
$77 million
year over year, driven by strength in the data center market segment and growth of our advanced products, based on 28nm, 20nm, and 14nm process technologies, which collectively grew roughly 70% in the quarter. Operating income was
$101 million
,
up
$4 million
year over year.
|
YTD 2018 vs. YTD 2017
|
PSG revenue was
$1.0 billion
,
up
$150 million
, driven by strength in the data center and embedded market segments as well as last-time buys of our legacy products and growth of our advanced products, based on 28nm, 20nm, and 14nm process technologies. Operating income was
$198 million
,
up
$9 million
.
|
MD&A - RESULTS OF OPERATIONS
|
Segment Results & Analysis
|
35
|
GAINS (LOSSES) ON EQUITY INVESTMENTS AND INTEREST AND OTHER, NET
|
(In Millions)
|
Q2 2018
|
Q2 2017
|
YTD 2018
|
YTD 2017
|
||||||||||||
|
Gains (losses) on equity investments, net
|
$
|
(203
|
)
|
$
|
342
|
|
$
|
440
|
|
$
|
594
|
|
||||
|
Interest and other, net
|
$
|
459
|
|
$
|
388
|
|
$
|
357
|
|
$
|
319
|
|
||||
Gains (losses) on equity investments, net
We recognized ongoing mark to market net losses on our marketable equity securities of
$235 million
in
Q2 2018
, primarily related to our interests in Cloudera, Inc. and ongoing mark to market net gains of
$371 million
in the
first six months
of
2018
, primarily related to our interests in ASML Holding N.V. (ASML). We recognized
$802 million
of net realized gains on sales in
Q2 2017
and
$1.1 billion
in the
first six months
of
2017
, primarily related to sales of a portion of our interest in ASML. The net realized gains were partially offset by
$555 million
of impairment charges in
Q2 2017
.
Interest and other, net
We recognized a net gain in
Q2 2018
and for the
first six months
of
2018
primarily due to a
$494 million
gain on the divestiture of Wind River Systems, Inc. (Wind River) in Q2 2018. We recognized a net gain in
Q2 2017
and for the
first six months
of
2017
primarily due to a $387 million gain on the divestiture of ISecG in Q2 2017.
For the
six months ended
June 30, 2018
, we paid
$1.2 billion
to satisfy conversion obligations for
$476 million
of our
$2.0 billion
3.25%
junior subordinated 2039 convertible debentures. We recognized a loss of
$130 million
in interest and other, net and
$770 million
as a reduction in stockholders' equity related to the conversion feature.
PROVISION FOR TAXES
|
(Dollars in Millions)
|
Q2 2018
|
Q2 2017
|
YTD 2018
|
YTD 2017
|
||||||||||||
|
Income before taxes
|
$
|
5,529
|
|
$
|
4,572
|
|
$
|
10,540
|
|
$
|
8,387
|
|
||||
|
Provision for taxes
|
$
|
523
|
|
$
|
1,764
|
|
$
|
1,080
|
|
$
|
2,615
|
|
||||
|
Effective tax rate
|
9.5
|
%
|
38.6
|
%
|
10.2
|
%
|
31.2
|
%
|
||||||||
Our effective tax rate was
9.5%
in
Q2 2018
compared to
38.6%
in
Q2 2017
. The U.S. Tax Cuts and Jobs Act (Tax Reform) reduced the U.S. statutory federal tax rate from
35.0%
to
21.0%
and the decrease in effective tax rate was also driven by
one-time items, primarily associated with the
$822 million
tax expense in
Q2 2017
due to our divestiture of ISecG, which increased our Q2 2017 effective tax rate by
16
percentage points, and the adjustment to our provisional estimates for Tax Reform in Q2 2018, which reduced our effective income tax rate by
three
percentage points.
Our effective income tax rate was
10.2%
in the
first six months
of
2018
compared to
31.2%
in the
first six months
of
2017
. The reduction in the U.S statutory federal tax rate favorably impacted our effective tax rate by approximately
eight
percentage points. Further, the Tax Reform provisions related to foreign-derived intangible income favorably impacted our effective tax rate by approximately
three
percentage points, and the provision related to low-taxed intangible income and the repeal of the domestic manufacturing deduction each unfavorably impacted our effective tax rate by approximately
one
percentage point. The decrease was also driven by one-time items, primarily associated with the
$822 million
tax expense in Q2
2017
due to our divestiture of ISecG, which increased our effective tax rate in the
first six months
of
2017
by approximately
nine
percentage points, and the adjustment to our provisional estimates for Tax Reform in the
first six months
of
2018
, which reduced our effective tax rate by approximately
two
percentage points.
|
MD&A - RESULTS OF OPERATIONS
|
Consolidated Results & Analysis
|
36
|
LIQUIDITY AND CAPITAL RESOURCES
We consider the following when assessing our liquidity and capital resources:
|
(Dollars in Millions)
|
Jun 30,
2018 |
Dec 30,
2017 |
||||||
|
Cash and cash equivalents, short-term investments, and trading assets
|
$
|
12,225
|
|
$
|
14,002
|
|
||
|
Other long-term investments
|
$
|
3,071
|
|
$
|
3,712
|
|
||
|
Loans receivable and other
|
$
|
1,189
|
|
$
|
1,097
|
|
||
|
Reverse repurchase agreements with original maturities greater than three months
|
$
|
250
|
|
$
|
250
|
|
||
|
Total debt
|
$
|
28,142
|
|
$
|
26,813
|
|
||
|
Temporary equity
|
$
|
654
|
|
$
|
866
|
|
||
|
Debt as percentage of permanent stockholders’ equity
|
40.2
|
%
|
38.8
|
%
|
||||
Cash generated by operations is our primary source of liquidity. We maintain a diverse investment portfolio that we continually analyze based on issuer, industry, and country. When assessing our sources of liquidity we include investments as shown in the preceding table.
Substantially all
of our investments in debt instruments and financing receivables are in investment-grade securities.
Other potential sources of liquidity include our commercial paper program and our automatic shelf registration statement on file with the SEC, pursuant to which we may offer an unspecified amount of debt, equity, and other securities. Under our commercial paper program, we have an ongoing authorization from our Board of Directors to borrow up to
$10.0 billion
. As of
June 30, 2018
,
$2.0 billion
of commercial paper remained outstanding.
We believe we have sufficient financial resources to meet our business requirements in the next 12 months, including capital expenditures for worldwide manufacturing and assembly and test; working capital requirements; and potential dividends, common stock repurchases, acquisitions, and strategic investments.
|
CASH FROM OPERATIONS $B
|
CAPITAL EXPENDITURES $B
|
CASH TO STOCKHOLDERS $B
|
|||
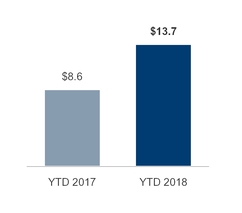
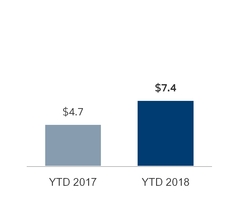
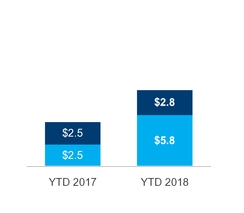
|
■
Dividends
■
Buybacks
|
||||
|
Six Months Ended
|
||||||||
|
(In Millions)
|
Jun 30,
2018 |
Jul 1,
2017 |
||||||
|
Net cash provided by operating activities
|
$
|
13,697
|
|
$
|
8,605
|
|
||
|
Net cash used for investing activities
|
(5,984
|
)
|
(4,216
|
)
|
||||
|
Net cash provided by (used for) financing activities
|
(8,532
|
)
|
1,738
|
|
||||
|
Net increase (decrease) in cash and cash equivalents
|
$
|
(819
|
)
|
$
|
6,127
|
|
||
Operating Activities
Cash provided by operating activities is net income adjusted for certain non-cash items and changes in assets and liabilities.
For the
first six months
of
2018
compared to the
first six months
of
2017
, the
$5.1 billion
increase
in cash provided by operations was primarily due to higher net income and changes in working capital, which benefited from receipts of customer deposits and prepaid supply agreements, offset by increased tax payments.
|
MD&A - RESULTS OF OPERATIONS
|
Consolidated Results & Analysis
|
37
|
Investing Activities
Investing cash flows consist primarily of capital expenditures; investment purchases, sales, maturities, and disposals; and proceeds from divestitures and cash used for acquisitions.
Cash used for investing activities was higher for the
first six months
of
2018
compared to the
first six months
of
2017
primarily due to increased capital expenditures and reduced sales of equity investments. The increase was partially offset by net trading asset activity.
Financing Activities
Financing cash flows consist primarily of repurchases of common stock, payment of dividends to stockholders, issuance and repayment of short-term and long-term debt, and proceeds from the sale of shares of common stock through employee equity incentive plans.
Cash was
used for
financing activities in the
first six months
of
2018
compared to cash provided by financing activities for the
first six months
of
2017
primarily due to no new long-term debt issuance, increased repurchases of common stock, and conversion of a portion of our 2039 debentures; these were partially offset by increases in short-term debt.
QUANTITATIVE AND QUALITATIVE DISCLOSURES ABOUT MARKET RISK
We are affected by changes in currency exchange and interest rates, as well as equity and commodity prices. For discussion about market risk and sensitivity analysis related to changes in currency exchange rates, interest rates, equity prices, and commodity prices refer to "Quantitative and Qualitative Disclosures About Market Risk" within "MD&A - Results of Operations," in our
2017
Form 10-K.
|
MD&A - RESULTS OF OPERATIONS
|
Consolidated Results & Analysis
|
38
|
|
OTHER KEY INFORMATION
|
RISK FACTORS
The risks described in "Risk Factors" within "Other Key Information" in our
2017
Form 10-K could materially and adversely affect our business, financial condition and results of operations, and the trading price of our common stock could decline. These risk factors do not identify all risks that we face—our operations could also be affected by factors that are not presently known to us or that we currently consider to be immaterial to our operations. Due to risks and uncertainties, known and unknown, our past financial results may not be a reliable indicator of future performance and historical trends should not be used to anticipate results or trends in future periods. Below, we have updated the risk factor included in our
2017
Form 10-K titled “We are subject to cybersecurity and privacy risks—Third parties regularly attempt to gain unauthorized access to our network, products, services, and infrastructure.” The Risk Factors section in our
2017
Form 10-K otherwise remains current in all material respects.
Third parties regularly attempt to gain unauthorized access to our network, products, services, and infrastructure.
We regularly face attempts by others to gain unauthorized access through the Internet or to introduce malicious software to our IT systems. Additionally, individuals or organizations, including malicious hackers or intruders into our physical facilities, may attempt to gain unauthorized access and corrupt the processes of hardware and software products that we manufacture and services we provide. Due to the widespread use of our products, we are a frequent target of computer hackers and organizations that intend to sabotage, take control of, or otherwise corrupt our manufacturing or other processes, products, and services. We are also a target of malicious attackers who attempt to gain access to our network or data centers or those of our customers or end users; steal proprietary information related to our business, products, employees, and customers; or interrupt our systems and services or those of our customers or others. Such attempts are increasing in number and in technical sophistication.
From time to time, we encounter intrusions or unauthorized access to our network, products, services, or infrastructure. To date, none have resulted in any material adverse impact to our business or operations. Such incidents, whether or not successful, could result in our incurring significant costs related to, for example, rebuilding internal systems, writing down inventory value, implementing additional threat protection measures, providing modifications to our products and services, defending against litigation, responding to regulatory inquiries or actions, paying damages, providing customers with incentives to maintain the business relationship, or taking other remedial steps with respect to third parties. In addition, these threats are constantly evolving, thereby increasing the difficulty of successfully defending against them or implementing adequate preventative measures. While we seek to detect and investigate all unauthorized attempts and attacks against our network, products, and services, and to prevent their recurrence where practicable through changes to our internal processes and tools and/or changes or updates to our products and services, we remain potentially vulnerable to additional known or unknown threats. In some instances, we, our customers, and the users of our products and services may be unaware of an incident or its magnitude and effects.
We or third parties regularly identify security vulnerabilities with respect to our processors and other products as well as the operating systems and workloads running on them. For example, a type of security vulnerability known as a side-channel exploit has been identified. Side-channel exploits include the variants referred to as “Spectre” and “Meltdown.” Additional variants have been identified and may continue to be identified. As we have become a more data-centric company, our processors and other products are being used in more and different critical application areas that create new or increased cybersecurity and privacy risks. In addition, publicity about security vulnerabilities and attempted or successful exploits, whether accurate or inaccurate, may result in increased attempts by third parties to identify additional vulnerabilities. Although vulnerabilities have often been discovered and mitigated in advance of being exploited, it is possible that vulnerabilities may not be mitigated before they become known. We, our customers, and the users of our products may not promptly learn of or be able to fully assess the magnitude or effects of a vulnerability, including the extent, if any, to which a vulnerability has been exploited. Subsequent events or new information could develop which changes our assessment of the impact of a security vulnerability, including additional information learned as we develop and deploy mitigations or updates, become aware of additional variants, evaluate the competitiveness of existing and new products, address future warranty or other claims or customer satisfaction considerations, as well as developments in the course of any litigation or regulatory inquiries or actions over these matters.
Mitigation techniques designed to address security vulnerabilities, including software and firmware updates or other preventative measures, may not be available on a timely basis, or at all, may not operate as intended, or may not effectively resolve vulnerabilities for all applications. In addition, we may be required to rely on third parties, including hardware, software, and services vendors, as well as our customers and end users, to develop and deploy mitigation techniques, and the availability, effectiveness, and performance impact of mitigation techniques may depend solely or in part on the actions of these third parties in determining whether and how to develop and deploy mitigations. Security vulnerabilities and/or mitigation techniques may result in adverse performance effects, reboots, system instability or unavailability, data loss or corruption, unpredictable system behavior, decisions by customers and end users to limit or change the applications in which they use our products or product features, or the misappropriation of data by third parties.
|
OTHER KEY INFORMATION
|
39
|
|
Security vulnerabilities and any limitations of, or adverse effects resulting from, mitigation techniques can adversely affect our results of operations, financial condition, customer relationships, prospects, and reputation in a number of ways, any of which may be material. For example, whether or not they involve attempted or successful exploits, they may result in our incurring significant costs related to developing and deploying updates and mitigations, writing down inventory value, defending against product claims and litigation, responding to regulatory inquiries or actions, paying damages, addressing customer satisfaction considerations, or taking other remedial steps with respect to third parties. Adverse publicity about security vulnerabilities or mitigations could damage our reputation with customers or users and reduce demand for our products and services. These effects may be greater to the extent that competing products are not susceptible to the same vulnerabilities or if vulnerabilities can be more effectively mitigated in competing products. Moreover, third parties may release information regarding potential vulnerabilities of our products before mitigations are available, which, in turn, could lead to attempted or successful exploits, adversely affect our ability to introduce mitigations, or otherwise harm our business and reputation. For example, information on the “Spectre” and “Meltdown” side-channel variants was prematurely reported publicly before mitigation techniques to address all vulnerabilities were made widely available, and certain of the mitigation techniques did not operate as intended.
CONTROLS AND PROCEDURES
Evaluation of Disclosure Controls and Procedures
Based on management’s evaluation (with the participation of our
principal executive officer and principal financial officer
), as of the end of the period covered by this report, our
principal executive officer and principal financial officer
has concluded that our disclosure controls and procedures (as defined in Rules 13a-15(e) and 15d-15(e) under the Securities Exchange Act of 1934, as amended (the Exchange Act)), are effective to provide reasonable assurance that information required to be disclosed by us in reports that we file or submit under the Exchange Act is recorded, processed, summarized, and reported within the time periods specified in SEC rules and forms, and is accumulated and communicated to management, including our principal executive officer and principal financial officer, as appropriate, to allow timely decisions regarding required disclosure.
Changes in Internal Control Over Financial Reporting
There were no changes to our internal control over financial reporting (as defined in Rules 13a-15(f) and 15d-15(f) under the Exchange Act) that occurred during the quarter ended
June 30, 2018
that have materially affected, or are reasonably likely to materially affect, our internal control over financial reporting.
Inherent Limitations on Effectiveness of Controls
Our management, including the
principal executive officer and principal financial officer
, does not expect that our disclosure controls and procedures or our internal control over financial reporting will prevent or detect all errors and all fraud. A control system, no matter how well-designed and operated, can provide only reasonable, not absolute, assurance that the control system’s objectives will be met. The design of a control system must reflect the fact that there are resource constraints, and the benefits of controls must be considered relative to their costs. Further, because of the inherent limitations in all control systems, no evaluation of controls can provide absolute assurance that misstatements due to error or fraud will not occur or that all control issues and instances of fraud, if any, have been detected. The design of any system of controls is based in part on certain assumptions about the likelihood of future events, and there can be no assurance that any design will succeed in achieving its stated goals under all potential future conditions. Projections of any evaluation of the effectiveness of controls to future periods are subject to risks. Over time, controls may become inadequate because of changes in conditions or deterioration in the degree of compliance with policies or procedures.
NON-GAAP FINANCIAL MEASURES
We believe non-GAAP financial measures provide investors with useful supplemental information about the financial performance of our business, enable comparison of financial results between periods where certain items may vary independent of business performance, and allow for greater transparency with respect to key metrics used by management in operating our business and measuring our performance.
Our non-GAAP operating income and diluted earnings per share reflect adjustments for the following items, as well as the related income tax effects. Income tax effects have been calculated using an appropriate tax rate for each adjustment. These non-GAAP financial measures should not be considered a substitute for, or superior to, financial measures calculated in accordance with GAAP, and the financial results calculated in accordance with GAAP and reconciliations from these results should be carefully evaluated.
Acquisition-related adjustments:
The non-GAAP financial measures disclosed by the company exclude certain expenses related to acquisitions. Amortization of acquisition-related intangible assets consists of amortization of intangible assets such as developed technology, brands, and customer relationships acquired in connection with business combinations. We record charges related to the amortization of these intangibles within both cost of sales and operating expenses in our GAAP financial statements. Amortization charges for our acquisition-related intangible assets are inconsistent in size and are significantly impacted by the timing and valuation of our acquisitions. Consequently, our non-GAAP adjustments exclude these charges to facilitate an evaluation of our current operating performance and comparisons to our past operating performance.
|
OTHER KEY INFORMATION
|
40
|
|
Restructuring and other charges:
Restructuring charges are costs associated with a formal restructuring plan and are primarily related to employee severance and benefit arrangements. Other charges include asset impairments, pension charges, and costs associated with the ISecG divestiture. We exclude restructuring and other charges, including any adjustments to charges recorded in prior periods, for purposes of calculating certain non-GAAP measures. We believe that these costs do not reflect our current operating performance. Consequently, our non-GAAP adjustments exclude these charges to facilitate an evaluation of our current operating performance and comparisons to our past operating performance.
Ongoing mark to market on marketable equity securities:
We exclude gains and losses resulting from ongoing mark to market adjustments of our marketable equity securities when calculating certain non-GAAP measures as we do not believe this volatility correlates to our core operational performance. Consequently, our non-GAAP earnings per share figures exclude these impacts to facilitate an evaluation of our current performance and comparisons to our past operating performance.
Gains or losses from divestitures:
We divested ISecG in Q2 2017 and Wind River in Q2 2018. We exclude gains or losses, and related tax impacts, resulting from divestitures when calculating certain non-GAAP measures. We believe making these adjustments facilitates a better evaluation of our current operating performance and comparisons to our past operating performance.
Tax Reform adjustment:
During Q2 2018, we made an adjustment to our Tax Reform provisional tax estimates that we recorded in Q4 2017. We exclude this provisional tax adjustment when calculating certain non-GAAP measures. We believe making this adjustment facilitates a better evaluation of our current operating performance and comparisons to our past operating performance.
Following are the reconciliations of our most comparable GAAP measures to our non-GAAP measures presented:
|
Three Months Ended
|
||||||||
|
(In Millions)
|
Jun 30,
2018 |
Jul 1,
2017 |
||||||
|
Operating income
|
$
|
5,273
|
|
$
|
3,842
|
|
||
|
Amortization of acquisition-related intangibles
|
325
|
|
235
|
|
||||
|
Restructuring and other charges
|
—
|
|
105
|
|
||||
|
Non-GAAP operating income
|
$
|
5,598
|
|
$
|
4,182
|
|
||
|
Three Months Ended
|
||||||||
|
Jun 30,
2018 |
Jul 1,
2017 |
|||||||
|
Earnings per share - Diluted
|
$
|
1.05
|
|
$
|
0.58
|
|
||
|
Amortization of acquisition-related intangibles
|
0.07
|
|
0.05
|
|
||||
|
Restructuring and other charges
|
—
|
|
0.02
|
|
||||
|
Ongoing mark to market on marketable equity securities
|
0.05
|
|
—
|
|
||||
|
(Gains) losses from divestitures
|
(0.10
|
)
|
(0.08
|
)
|
||||
|
Tax Reform
|
(0.04
|
)
|
—
|
|
||||
|
Income tax effect
|
0.01
|
|
0.15
|
|
||||
|
Non-GAAP Earnings per share - Diluted
|
$
|
1.04
|
|
$
|
0.72
|
|
||
|
OTHER KEY INFORMATION
|
41
|
|
ISSUER PURCHASES OF EQUITY SECURITIES
We have an ongoing authorization, originally approved by our Board of Directors in 2005 and subsequently amended, to repurchase shares of our common stock in open market or negotiated transactions. As of
June 30, 2018
, we were authorized to repurchase up to
$75.0 billion
, of which
$7.2 billion
remained available.
Common stock repurchase activity under our publicly announced stock repurchase plan during the
second
quarter of
2018
was as follows:
|
Period
|
Total Number
of Shares Purchased (In Millions) |
Average Price
Paid Per Share |
Dollar Value of
Shares That May Yet Be Purchased Under the Plans (In Millions) |
||||||||
|
April 1, 2018 - April 28, 2018
|
12.9
|
|
$
|
50.97
|
|
$
|
10,577
|
|
|||
|
April 29, 2018 - May 26, 2018
|
13.6
|
|
$
|
54.16
|
|
$
|
9,840
|
|
|||
|
May 27, 2018 - June 30, 2018
|
49.3
|
|
$
|
53.02
|
|
$
|
7,224
|
|
|||
|
Total
|
75.9
|
|
$
|
52.87
|
|
||||||
We issue RSUs as part of our equity incentive plans. In our consolidated condensed financial statements, we treat shares of common stock withheld for tax purposes on behalf of our employees in connection with the vesting of
RSUs
as common stock repurchases because they reduce the number of shares that would have been issued upon vesting. These withheld shares of common stock are not considered common stock repurchases under our authorized common stock repurchase plan
and accordingly are not included in the common stock repurchase totals in the preceding table.
|
OTHER KEY INFORMATION
|
42
|
|
EXHIBITS
|
|
|
Incorporated by Reference
|
|
|||||||||
|
Exhibit
Number
|
Exhibit Description
|
Form
|
File Number
|
Exhibit
|
Filing
Date
|
Filed or
Furnished
Herewith
|
||||||
|
3.1
|
8-K
|
000-06217
|
3.1
|
5/22/2006
|
||||||||
|
3.2
|
8-K
|
000-06217
|
3.2
|
3/19/2018
|
||||||||
|
12.1
|
X
|
|||||||||||
|
31.1
|
X
|
|||||||||||
|
32.1
|
X
|
|||||||||||
|
101.INS
|
XBRL Instance Document
|
X
|
||||||||||
|
101.SCH
|
XBRL Taxonomy Extension Schema Document
|
X
|
||||||||||
|
101.CAL
|
XBRL Taxonomy Extension Calculation Linkbase Document
|
X
|
||||||||||
|
101.DEF
|
XBRL Taxonomy Extension Definition Linkbase Document
|
X
|
||||||||||
|
101.LAB
|
XBRL Taxonomy Extension Label Linkbase Document
|
X
|
||||||||||
|
101.PRE
|
XBRL Taxonomy Extension Presentation Linkbase Document
|
X
|
||||||||||
|
OTHER KEY INFORMATION
|
43
|
|
FORM 10-Q CROSS-REFERENCE INDEX
|
Item Number
|
Item
|
|
|
Part I - Financial Information
|
||
|
Item 1.
|
Financial Statements
|
|
|
Item 2.
|
Management's Discussion and Analysis of Financial Condition and Results of Operations:
|
|
|
Results of operations
|
||
|
Liquidity and capital resources
|
||
|
Off-balance sheet arrangements
|
(a)
|
|
|
Contractual obligations
|
(b)
|
|
|
Item 3.
|
Quantitative and Qualitative Disclosures About Market Risk
|
Page
38
|
|
Item 4.
|
Controls and Procedures
|
Page
40
|
|
|
||
|
Part II - Other Information
|
||
|
Item 1.
|
Legal Proceedings
|
|
|
Item 1A.
|
Risk Factors
|
Page
39
|
|
Item 2.
|
Unregistered Sales of Equity Securities and Use of Proceeds
|
Page
42
|
|
Item 3.
|
Defaults Upon Senior Securities
|
Not applicable
|
|
Item 4.
|
Mine Safety Disclosures
|
Not applicable
|
|
Item 5.
|
Other Information
|
Not applicable
|
|
Item 6.
|
Exhibits
|
Page
43
|
|
Signatures
|
Page
45
|
|
|
(a)
|
As of
June 30, 2018
, we did not have any significant off-balance sheet arrangements, as defined in Item 303(a)(4)(ii) of SEC Regulation S-K.
|
|
(b)
|
There were no material changes to our significant contractual obligations from those disclosed in our Annual Report on Form 10-K for the year ended December 30, 2017.
|
|
OTHER KEY INFORMATION
|
44
|
|
SIGNATURES
Pursuant to the requirements of the Securities Exchange Act of 1934, the registrant has duly caused this report to be signed on its behalf by the undersigned thereunto duly authorized.
|
|
INTEL CORPORATION
(Registrant) |
||||
|
Date:
|
July 26, 2018
|
|
By:
|
|
/s/ ROBERT H. SWAN
|
|
|
|
Robert H. Swan
|
|||
|
|
|
Interim Chief Executive Officer and Principal Executive Officer;
Executive Vice President, Chief Financial Officer and Principal Financial Officer
|
|||
|
Date:
|
July 26, 2018
|
By:
|
/s/ KEVIN T. MCBRIDE
|
||
|
Kevin T. McBride
|
|||||
|
Vice President of Finance, Corporate Controller and Principal Accounting Officer
|
|||||
|
45
|
||
TABLE OF CONTENTS
Note 1: Basis Of PresentationNote 2: Recent Accounting Standards and Accounting PoliciesNote 3: Operating SegmentsNote 4: Earnings Per ShareNote 5: Contract LiabilitiesNote 6: Other Financial Statement DetailsNote 7: Income TaxesNote 8: InvestmentsNote 9: Identified Intangible AssetsNote 10: Other Long-term AssetsNote 11: Fair ValueNote 12: Other Comprehensive Income (loss)Note 13: Derivative Financial InstrumentsNote 14: Employee Equity Incentive PlansNote 15: Contingencies