INTUIT INC
10-Ks and 10-Qs
|
|
|
|
|
|
|
|
|
|
|
|
|
|
|
|
|
|
|
|
|
|
|
|
|
|
|
|
|
|
|
|
|
|
|
|
|
|
|
|
|
|
|
|
|
|
|
|
|
|
|
|
|
|
|
|
UNITED STATES SECURITIES AND EXCHANGE COMMISSION
Washington, D.C. 20549
______________________________________
FORM 10-K
|
þ
|
|
Annual Report pursuant to Section 13 or 15(d) of the Securities Exchange Act of 1934
|
For the fiscal year ended
July 31, 2017
OR
|
o
|
|
Transition report pursuant to Section 13 or 15(d) of the Securities Exchange Act of 1934
|
For the transition period from
to
Commission File Number 0-21180
INTUIT INC.
(Exact name of registrant as specified in its charter)
|
Delaware
(State of incorporation)
|
|
77-0034661
(IRS Employer Identification No.)
|
2700 Coast Avenue, Mountain View, CA 94043
(Address of principal executive offices, including zip code)
(650) 944-6000
(Registrant’s telephone number, including area code)
Securities registered pursuant to Section 12(b) of the Act:
|
|
Title of Each Class
|
|
Name of Exchange on Which Registered
|
|
|
Common Stock, $0.01 par value
|
|
NASDAQ Global Select Market
|
Securities registered pursuant to Section 12(g) of the Act: None.
Indicate by check mark if the registrant is a well-known seasoned issuer, as defined in Rule 405 of the Securities Act. Yes
þ
No
o
Indicate by check mark if the registrant is not required to file reports pursuant to Section 13 or 15(d) of the Act. Yes
o
No
þ
Indicate by check mark whether the registrant (1) has filed all reports required to be filed by Section 13 or 15(d) of the Securities Exchange Act of 1934 during the preceding 12 months (or for such shorter period that the registrant was required to file such reports); and (2) has been subject to such filing requirements for the past 90 days. Yes
þ
No
o
Indicate by check mark whether the registrant has submitted electronically and posted on its corporate website, if any, every Interactive Data File required to be submitted and posted pursuant to Rule 405 of Regulation S-T during the preceding 12 months (or for such shorter period that the registrant was required to submit and post such files). Yes
þ
No
o
Indicate by check mark if disclosure of delinquent filers pursuant to Item 405 of Regulation S-K is not contained herein, and will not be contained, to the best of registrant’s knowledge, in definitive proxy or information statements incorporated by reference in Part III of this Form 10-K or any amendment to this Form 10-K.
þ
Indicate by check mark whether the registrant is a large accelerated filer, an accelerated filer, a non-accelerated filer, a smaller reporting company, or an emerging growth company. See definition of “large accelerated filer,” “accelerated filer”, “smaller reporting company”, and “emerging growth company” in Rule 12b-2 of the Exchange Act. (Check one)
|
Large accelerated
filer
|
þ
|
Accelerated filer
|
o
|
Non-accelerated filer
|
o
|
Smaller reporting
company
|
o
|
Emerging growth
company
|
o
|
|
|
|
(Do not check if a smaller reporting company)
|
|
||||||
If an emerging growth company, indicate by check mark if the registrant has elected not to use the extended transition period for complying with any new or revised financial accounting standards provided pursuant to Section 13(a) of the Exchange Act.
o
Indicate by check mark whether the registrant is a shell company (as defined in Rule 12b-2 of the Exchange Act). Yes
o
No
þ
The aggregate market value of Intuit Inc. outstanding common stock held by non-affiliates of Intuit as of January 31,
2017
, the last business day of our most recently completed second fiscal quarter, based on the closing price of
$118.58
reported by the NASDAQ Global Select Market on that date, was
$28.8
billion.
There were
254,973,504
shares of Intuit voting common stock outstanding as of
August 25, 2017
.
DOCUMENTS INCORPORATED BY REFERENCE
Portions of the registrant’s definitive proxy statement for its Annual Meeting of Stockholders to be held on
January 18, 2018
are incorporated by reference in Part III of this Annual Report on Form 10-K.
INTUIT INC.
FISCAL
2017
FORM 10-K
INDEX
|
Page
|
|||
|
|
|
||
|
|
|
|
|
|
|
|
|
|
|
|
|
||
|
|
|
|
|
|
|
|
|
|
|
|
|
||
|
|
|
|
|
|
|
|
|
|
|
|
|
||
|
|
|
|
|
|
|
|
|
|
|
|
|||
|
EX-10.17
|
|||
|
EX-10.47
|
|||
|
EX-10.57
|
|||
|
EX-21.01
|
|||
|
EX-23.01
|
|||
|
EX-31.01
|
|||
|
EX-31.02
|
|||
|
EX-32.01
|
|||
|
EX-32.02
|
|||
|
EX-101.INS XBRL Instance Document - the instance document does not appear in the Interactive Data File because its XBRL tags are embedded within the Inline XBRL document
|
|||
|
EX-101.SCH XBRL Taxonomy Extension Schema
|
|||
|
EX-101.CAL XBRL Taxonomy Extension Calculation Linkbase
|
|||
|
EX-101.LAB XBRL Taxonomy Extensions Label Linkbase
|
|||
|
EX-101.PRE XBRL Taxonomy Extension Presentation Linkbase
|
|||
|
EX-101.DEF XBRL Taxonomy Extension Definition Linkbase
|
|||
Intuit, the Intuit logo, QuickBooks, TurboTax, Lacerte, ProSeries, and Mint, among others, are registered trademarks and/or registered service marks of Intuit Inc., or one of its subsidiaries, in the United States and other countries. Other parties’ marks are the property of their respective owners.
2
Forward-Looking Statements
This Annual Report on Form 10-K contains forward-looking statements that involve risks and uncertainties. Please also see the section entitled “
Risk Factors”
in Item 1A of this Report for important information to consider when evaluating these statements. All statements in this report, other than statements that are purely historical, are forward-looking statements. Words such as “expect,” “anticipate,” “intend,” “plan,” “believe,” “forecast,” “estimate,” “seek,” and similar expressions also identify forward-looking statements. In this report, forward-looking statements include, without limitation, the following:
|
•
|
our expectations and beliefs regarding future conduct and growth of the business;
|
|
•
|
our beliefs and expectations regarding seasonality, competition and other trends that affect our business;
|
|
•
|
our expectation that we will solve problems faster and more efficiently for our growing base of customers by moving to more open platforms with application programming interfaces that enable the contributions of end users and third-party developers;
|
|
•
|
our expectation that we will continue to invest significant resources in our product development, marketing and sales capabilities;
|
|
•
|
our expectation that we will continue to invest significant management attention and resources in our information technology infrastructure and in our privacy and security capabilities;
|
|
•
|
our expectation that we will work with the broader industry and government to protect our customers from fraud;
|
|
•
|
our expectation that we will be able to protect our customers’ data and prevent third parties from using stolen customer information to perpetrate fraud in our tax and other offerings;
|
|
•
|
our expectation that we will generate significant cash from operations;
|
|
•
|
our expectation that connected services revenue as a percentage of our total revenue will continue to grow;
|
|
•
|
our expectations regarding the development of future products, services, business models and technology platforms and our research and development efforts;
|
|
•
|
our assumptions underlying our critical accounting policies and estimates, including our estimates regarding promotional and return reserves; the collectability of accounts receivable; stock volatility and other assumptions used to estimate the fair value of share-based compensation; the fair value of goodwill; and expected future amortization of acquired intangible assets;
|
|
•
|
our intention not to sell our investments and our belief that it is more likely than not that we will not be required to sell them before recovery at par;
|
|
•
|
our belief that the investments we hold are not other-than-temporarily impaired;
|
|
•
|
our belief that we take prudent measures to mitigate investment related risks;
|
|
•
|
our belief that our exposure to currency exchange fluctuation risk will not be significant in the future;
|
|
•
|
our assessments and estimates that determine our effective tax rate;
|
|
•
|
our belief that our income tax valuation allowance is sufficient;
|
|
•
|
our belief that it is not reasonably possible that there will be a significant increase or decrease in our unrecognized tax benefits over the next 12 months;
|
|
•
|
our intent to permanently reinvest a significant portion of our earnings from foreign operations, and our belief that we will not need funds generated from foreign operations to fund our domestic operations;
|
|
•
|
our belief that our cash and cash equivalents, investments and cash generated from operations will be sufficient to meet our seasonal working capital needs, capital expenditure requirements, contractual obligations, debt service requirements and other liquidity requirements associated with our operations for at least the next 12 months;
|
|
•
|
our expectation that we will return excess cash generated by operations to our stockholders through repurchases of our common stock and the payment of cash dividends;
|
|
•
|
our plan to continue to provide ongoing enhancements and certain connected services for all future versions of our QuickBooks Desktop software products;
|
|
•
|
our belief that the credit facility will be available to us should we choose to borrow under it; and
|
|
•
|
our assessments and beliefs regarding the future outcome of pending legal proceedings and inquiries by regulatory authorities, the liability, if any, that Intuit may incur as a result of those proceedings and inquiries, and the impact of any potential losses associated with such proceedings or inquiries on our financial statements.
|
We caution investors that forward-looking statements are only predictions based on our current expectations about future events and are not guarantees of future performance. We encourage you to read carefully all information provided in this
3
report and in our other filings with the Securities and Exchange Commission before deciding to invest in our stock or to maintain or change your investment. These forward-looking statements are based on information as of the filing date of this Annual Report, and we undertake no obligation to revise or update any forward-looking statement for any reason.
|
|
|
CORPORATE BACKGROUND
|
General
Intuit helps consumers, small businesses, and the self-employed prosper by delivering financial management and compliance products and services. We also provide specialized tax products to accounting professionals, who are key partners that help us reach small business customers.
Our flagship brands, QuickBooks and TurboTax, help more than 42 million customers run their small businesses, pay employees and bills, separate business and personal expenses, track their money, and file income taxes. ProSeries and Lacerte are our leading tax preparation offerings for professional accountants. We had revenue of
$5.2 billion
in our fiscal year ended
July 31, 2017
, with approximately
8,200
employees in major offices in the United States, Canada, India, the United Kingdom, Israel, Australia, and other locations.
Intuit Inc. was incorporated in California in March 1984. We reincorporated in Delaware and completed our initial public offering in March 1993. Our principal executive offices are located at 2700 Coast Avenue, Mountain View, California, 94043, and our main telephone number is 650-944-6000. Our corporate website,
www.intuit.com
, provides materials for investors and information relating to Intuit’s corporate governance. The content on any website referred to in this filing is not incorporated by reference into this filing unless expressly noted otherwise. When we refer to “we,” “our” or “Intuit” in this Annual Report on Form 10-K, we mean the current Delaware corporation (Intuit Inc.) and its California predecessor, as well as all of our consolidated subsidiaries.
Available Information
We file reports required of public companies with the Securities and Exchange Commission (SEC). These include annual reports on Form 10-K, quarterly reports on Form 10-Q, current reports on Form 8-K, proxy statements and other reports, and amendments to these reports. The public may read and copy the materials we file with or furnish to the SEC at the SEC’s Public Reference Room at 100 F Street, N.E., Washington, D.C. 20549. The public may obtain information on the operation of the Public Reference Room by calling the SEC at 1-800-SEC-0330. The SEC also maintains a website at
www.sec.gov
that contains reports, proxy and information statements, and other information regarding issuers that file electronically with the SEC. We make available free of charge on the Investor Relations section of our corporate website all of the reports we file with or furnish to the SEC as soon as reasonably practicable after the reports are filed or furnished. Copies of this Annual Report on Form 10-K may also be obtained without charge by contacting Investor Relations, Intuit Inc., P.O. Box 7850, Mountain View, California 94039-7850 or by calling 650-944-6000.
|
BUSINESS OVERVIEW
|
Intuit’s Mission
We are a global finance and compliance platform company committed to powering prosperity around the world. Our customers include consumers, small businesses, and the self-employed. Working with a broad array of vital partners – accountants, developers, financial institutions, schools, governments and other platform companies, such as Apple and Google – we strive to deliver three benefits that matter most to our customers:
|
•
|
Making more money
: Helping consumers save money, and enabling small businesses and the self-employed to grow and prosper.
|
|
•
|
Eliminating work
: Turning drudgery into time for what matters most.
|
|
•
|
Having complete confidence
: Providing peace of mind when making financial or compliance decisions.
|
We build durable competitive advantage by delivering personalized experiences via our trusted open platform that builds connections between customers, partners and products, as described in our Growth Strategy below.
4
Our Business Portfolio
We organize our businesses into
three
reportable segments – Small Business, Consumer Tax, and ProConnect.
|
Small Business
:
This segment targets small businesses, the self-employed, and the accounting professionals who serve and advise them around the globe. Our offerings include QuickBooks financial and business management online services and desktop software, payroll solutions, and payment processing solutions.
Consumer Tax
:
This segment targets consumers and includes TurboTax income tax preparation products and services sold in the U.S. and Canada.
ProConnect
:
This segment targets professional accountants in the U.S. and Canada, who are essential to both small business success and tax preparation and filing. Our ProConnect professional tax offerings include Lacerte, ProSeries, ProFile, and ProConnect Tax Online.
|
Our Growth Strategy
As emerging technology and market trends change the way people live and work, we change too. For more than three decades, we have continuously re-invented ourselves from a desktop business to the web and mobile. Our assessment of external trends – the emergence and influence of the digital generation, the evolution of social networks as a means to accomplish important financial tasks and growth in the self-employed workforce – reveals significant opportunities to drive future growth. The result is a global market that is shifting from traditional services that are manual in nature to more automated, interconnected services that work on platforms and increasingly rely on artificial intelligence and machine learning.
Our strategy is built on the strength of our One Intuit Ecosystem, a connected, one-stop destination for customers to make their financial lives easier. Our evolving strategy focuses on three elements:
|
•
|
Personalized experiences
:
With deep expertise and customer-provided data, we can create increasingly valuable personalized experiences that delight and serve our customers. For example, our TurboTax solutions use machine learning to create a customized interview, asking questions uniquely tailored to each individual situation. By delivering an amazing end-to-end experience, we offer customers the value they expect from our offerings as quickly and easily as possible.
|
|
•
|
Trusted open platform
:
With a secure, open platform, we allow real-time access to – and use of – high-quality data to internal and external developers, speeding our ability to embrace new technology, such as artificial intelligence and machine learning. One example of this is our QuickBooks open platform, where small businesses and accountants can install apps created by third-party developers to enhance the functionality and personalization of the QuickBooks experience.
|
|
•
|
Indispensable connections
:
Within our One Intuit Ecosystem we strive to build connections between customers, partners, and products on our platform. For example, TurboTax customers can obtain a credit score using technology first found in our Mint personal finance offering.
|
We are well positioned to succeed in this new environment, with connected services (total service and other revenue) generating $
3.8
billion, or
73
percent, of our total revenue in fiscal
2017
.
Summary
As the external environment evolves, we adapt our strategy to meet these changes. Our commitment remains consistent and has been our success formula for more than 30 years: a focus on developing innovative financial and compliance products and services that are easy to use and are available where and when customers need them. As a result, our customers actively recommend our products and solutions to others, which is one important way that we measure the success of our strategy.
|
PRODUCTS AND SERVICES
|
During fiscal
2017
we offered our products and services in the
three
segments described in
“Business Overview”
above. The following table shows the classes of similar products or services that accounted for 5% or more of total net revenue within the last three fiscal years.
|
Fiscal 2017
|
Fiscal 2016
|
Fiscal 2015
|
||||||
|
Small Business
|
50
|
%
|
49
|
%
|
50
|
%
|
||
|
Consumer Tax
|
42
|
%
|
42
|
%
|
43
|
%
|
||
|
ProConnect
|
8
|
%
|
9
|
%
|
7
|
%
|
||
5
International total net revenue was less than 5% of consolidated total net revenue for fiscal
2017
, fiscal
2016
, and fiscal
2015
. See Item 1A, “
Risk Factors – Our international operations are subject to increased risks which may harm our business, operating results, and financial condition,”
for a discussion of risks relating to our international operations.
For financial information about our segments, see
“Management’s Discussion and Analysis of Financial Condition and Results of Operations”
in Item 7 and Note 13 to the financial statements in Item 8 of this Annual Report.
Small Business
Our Small Business segment targets small businesses, the self-employed, and the accounting professionals who serve and advise them around the world. Our offerings include QuickBooks financial and business management online services and desktop software, payroll and payment processing solutions, and financial supplies.
QuickBooks Online Services and Desktop Software
.
Our easy-to-use QuickBooks financial management solutions help small businesses, the self-employed, and accounting professionals solve financial and compliance problems, make more money and reduce unnecessary work, while giving them complete confidence in their actions and decisions. Users can track income and expenses, create and send invoices and estimates, manage and pay bills, and review a variety of financial reports. Our QuickBooks offering is accessible online and via a desktop version.
QuickBooks is built on an open platform, allowing third-party developers to create online and mobile applications that integrate with our offering. A growing number of companies offer applications built for our QuickBooks platform, including PayPal, Shopify, Square, and Bill.com.
In addition to our core QuickBooks offering, we also offer specific solutions for the following customer segments:
|
•
|
Self-Employed
. QuickBooks Self-Employed is designed specifically for self-employed customers whose needs are different than small businesses that use QuickBooks. Features include categorizing business and personal transactions, identifying and classifying tax deductible expenses, tracking mileage, calculating estimated quarterly taxes and sending invoices. QuickBooks Self-Employed can be combined with TurboTax to export and pay year-end taxes. QuickBooks Self-Employed is available both online and via a mobile application.
|
|
•
|
Accountants
. QuickBooks Online Accountant is available to accounting professionals who use QuickBooks offerings and recommend them to their small business clients. This offering provides the tools and file-sharing capabilities that accounting professionals need to efficiently complete bookkeeping and financial reporting tasks and to manage their practices. We also offer membership in the QuickBooks ProAdvisor program, providing QuickBooks Online Accountant and QuickBooks Online Payroll services, technical support, training, product certification, access to marketing tools, and discounts on Intuit products and services purchased on behalf of clients.
|
|
•
|
Enterprise
. Our QuickBooks Enterprise offering is designed for larger small businesses that have outgrown our QuickBooks product, and is available as a hosted or server-based solution. This offering provides industry-specific reports and features for a range of industries, including Contractor, Manufacturing and Wholesale, Nonprofit, and Retail.
|
Payroll Solutions
.
We offer two levels of payroll solutions that are sold on a subscription basis and seamlessly integrate with our QuickBooks Online and QuickBooks Desktop offerings. Our basic payroll offering includes online payroll processing, direct deposit of employee paychecks, payroll reports, electronic payment of federal and state payroll taxes, and electronic filing of federal and state payroll tax forms. In addition, our full-service payroll offering provides comprehensive payroll services to QuickBooks customers who prefer not to perform payroll tasks themselves.
Payment Processing Solutions
.
Our full range of merchant services for small businesses includes credit card, debit card, electronic benefits, and gift card processing services; check verification, check guarantee, and electronic check conversion, including automated clearing house capabilities. We also provide web-based transaction processing services for online merchants. In addition to transaction processing services, our broad support for our clients includes customer service, merchant and consumer collections, chargeback and retrieval support, and fraud and loss prevention screening. We also offer e-invoicing, which allows small businesses to email invoices directly from QuickBooks with a Pay Now link and enables customers to instantly pay online or from their mobile device.
Financial Supplies
.
We offer a range of financial supplies designed for individuals and small businesses that use our QuickBooks offerings. These include standard paper checks and Secure Plus checks with CheckLock fraud protection features; envelopes, invoices and deposit slips; and business identity products, such as business cards and stationery. We also offer tax forms, tax return presentation folders and other supplies for professional tax preparers.
6
Consumer Tax
Our TurboTax products and services are designed to enable individuals to prepare and file their own federal and state personal income tax returns quickly and accurately. They are designed to be easy to use, yet sophisticated enough for complex tax returns. Most of these offerings are available on mobile devices such as smartphones and tablets.
Tax Return Preparation Offerings
.
For the
2016
tax season we offered a range of software products and services that included TurboTax Basic, for simple returns; TurboTax Deluxe, for taxpayers who itemize deductions; TurboTax Premier, for taxpayers who own investments or rental property; and TurboTax Home and Business and TurboTax Self-Employed, for small business owners. We also offered TurboTax Free Edition for the simplest returns. We offered live tax advice from U.S.-based tax professionals to TurboTax customers during the
2016
tax season.
With SmartLook, customers can connect with a live expert and get guidance right on their screen.
TurboTax AnswerXchange is an online forum where participants can learn from and share information with other users while preparing their income tax returns. For the
2016
tax season our online tax preparation and filing services were offered through the websites of thousands of financial institutions, electronic retailers, and other online merchants. Financial institutions can offer our online tax preparation and filing services to their customers through a link to TurboTax Online. Our TurboTax U.S. and Canada offerings consist of desktop, online, and mobile offerings.
Electronic Filing and Other Services
.
Our desktop, online, and mobile tax preparation customers can electronically file their federal and state income tax returns through our electronic filing center. For the
2016
tax season TurboTax customers had the option to receive their income tax refunds on a prepaid debit card that we provided through a partner. We also offered audit defense, audit support, identity restoration services, and credit scores.
Intuit Tax Freedom Project
.
Under the Intuit Tax Freedom Project, we provide online federal and state income tax return preparation and electronic filing services at no charge to eligible taxpayers. For the
2016
tax season we provided approximately 1.2 million free federal returns under this initiative. We are a member of the Free File Alliance, a consortium of private sector companies that has entered into an agreement with the federal government to provide free online federal tax preparation and filing services to eligible taxpayers. See also
“Competition – Consumer Tax Segment”
later in this Item 1 for more information on the Free File Alliance.
ProConnect
Our ProConnect segment targets professional accountants in the U.S. and Canada, who are essential to both small business success and tax preparation and filing. Our ProConnect professional tax offerings enable accountants to accurately and efficiently complete and electronically file a full range of consumer, small business, and commercial federal and state tax returns with both desktop and online offerings. Lacerte is designed for full-service accounting firms who handle more complex returns. We offer two versions of our ProSeries software: ProSeries Professional Edition, designed for year-round tax practices handling moderately complex tax returns, and ProSeries Basic Edition, designed for the needs of smaller and seasonal tax practices. ProConnect Tax Online is our cloud-based solution which is designed for year-round practices who prepare moderately complex consumer and small business returns and integrates with our QuickBooks Online offerings. ProFile is our Canadian tax offering which serves year-round full-service accounting firms for both consumer and business tax returns. We offer a variety of tax-related services that complement the tax return preparation process including year-round document storage and access, collaboration services, e-signature, and bank products.
|
PRODUCT DEVELOPMENT
|
Since the markets for software and related services are characterized by rapid technological change, shifting customer needs and frequent new product introductions and enhancements, a continuous high level of investment is required to innovate and quickly develop new products and services as well as enhance existing offerings. Our product development efforts are becoming more important than ever as we pursue our growth strategy.
We develop many of our products and services internally, and we have a number of United States and foreign patents and pending applications that relate to various aspects of our products and technology. We also supplement our internal development efforts by acquiring or licensing products and technology from third parties, and establishing other relationships that enable us to enhance or expand our offerings more rapidly. We expect to expand our third-party technology relationships as we continue to pursue our growth strategy.
While our traditional desktop software products – QuickBooks, TurboTax, Lacerte, and ProSeries – tend to have predictable annual development and product release cycles, as we move to more online offerings and mobile applications, the development cycles are becoming more rapid. In addition, developing consumer and professional tax software and services presents unique challenges because of the demanding development cycle required to accurately incorporate federal and state tax law and tax form changes within a rigid timetable. The development timing for our small business payroll and merchant payment processing services offerings varies with business needs and regulatory requirements and the length of the development cycle depends on the scope and complexity of each project.
We continue to make substantial investments in research and development, and we expect to focus our future research and development efforts on enhancing existing products and services and on developing new products and services, including new
7
mobile and global offerings. We also expect to continue to focus significant research and development efforts on ongoing projects to update the technology platforms for several of our offerings. Our research and development expenses were
$998
million or
19%
of total net revenue in fiscal
2017
;
$881
million or
19%
of total net revenue in fiscal
2016
; and
$798
million or
19%
of total net revenue in fiscal
2015
.
|
SEASONALITY
|
Our Consumer Tax offerings have significant seasonal patterns. As a result, during each of the last three fiscal years the total revenue for our third quarter ended April 30 has represented nearly half of our total revenue for those years. We expect the seasonality of our Consumer Tax business to continue to have a significant impact on our quarterly financial results in the future.
|
MARKETING, SALES AND DISTRIBUTION CHANNELS
|
Markets
Our primary target customers are consumers, small businesses, and the self-employed. We also provide specialized tax products to accounting professionals, who are key partners to help us reach small business customers. The markets in which we compete have always been characterized by rapid technological change, shifting customer needs, and frequent new product introductions and enhancements by competitors. Over the past several years, the widespread availability of the Internet, mobile devices, and the explosion of social media have accelerated the pace of change and revolutionized the way that customers learn about, evaluate, and purchase products and services.
Real-time, personalized online and mobile shopping experiences have become the standard. In addition, many customers now begin shopping in one channel and ultimately purchase in another. This has created a need for integrated, multi-channel, shop-and-buy experiences. Market and industry changes quickly make existing products and services obsolete. Our success depends on our ability to respond rapidly to these changes with new business models, updated competitive strategies, new or enhanced products and services, alternative distribution methods, and other changes in the way we do business.
Marketing Programs
We use a variety of traditional and innovative marketing programs to generate orders, stimulate demand, and generally maintain and increase customer awareness of our product portfolio. These programs include: digital marketing and targeted advertising, such as search engine optimization and purchasing keywords from major search engine companies; placing and promoting our mobile applications in proprietary online stores; direct-response mail and e-mail campaigns; telephone solicitations; newspaper, magazine, billboard, radio, and television advertising; social media campaigns; and coordinated promotional offers with major retailers. We also use workflow-integrated, in-product discovery in some of our offerings to market other related products and services, including third-party products and services. In addition, we create marketing campaigns that are designed to attract new users through trial promotional offerings.
Sales and Distribution Channels
Multi-Channel Shop-and-Buy Experiences
.
Our customers increasingly use the Internet and mobile devices to research products and services. Some customers buy and use our products and services entirely online or through their mobile devices. Others purchase desktop products and services using the Internet. Still others make their final decision at a retail location. Although retail sales of our products and services are gradually declining as online distribution channels grow in importance, we continue to coordinate our websites, promotions, and retail displays to support an integrated, multi-channel, shop-and-buy model.
Direct Sales Channel
. We sell many of our products and services directly through our websites and call centers. Telesales continues to be an effective channel for serving customers that want live help to select the products and services that are right for their needs. We also have a direct sales force that calls on U.S. and international accountant firms and seeks to increase their awareness, usage, and recommendation of our Small Business solutions.
Retail Channel
. We sell our QuickBooks and TurboTax desktop software as well as payroll services and merchant credit card payment processing services at retail locations across the United States. We sell these products and services directly and through distributors to office supply superstores, warehouse clubs, consumer electronics retailers, general mass merchandisers, online retailers, and catalogs. In Canada and the United Kingdom, we also rely on distributors and other third parties who sell products into the retail channel. The retail channel provides broad customer reach through retailer-sponsored advertising and exposure to retail foot traffic. This channel also gives us the opportunity to communicate our products, services, and messages through multiple touch points and allows us to serve our customers at relatively modest cost.
Mobile Application Stores
.
We distribute many of our offerings for mobile devices through proprietary online stores that provide applications for specific devices. These include the Apple App Store, which provides apps for the Apple iPhone and iPad, and Google’s Play Store, which provides apps for Android-compatible smartphones and tablets.
8
Other Channels
.
We sell our consumer and small business products and services through selected alliance partners and accountants that help us reach new customers at the point of need and drive growth and market share by extending our online reach. Solution providers combine our products and services with value-added marketing, sales, and technical expertise to deliver a complete solution at the local level. As we expand our mobile and global offerings, we expect that strategic partnerships will become increasingly important to our business.
|
COMPETITION
|
Overview
We face intense competition in all of our businesses, both domestically and internationally. Competitive interest and expertise in many of the markets we serve have grown markedly over the past few years and we expect this trend to continue. Some of our existing competitors have significantly greater financial, technical, and marketing resources than we do. In addition, the competitive landscape can shift rapidly as new companies enter markets in which we compete. This is particularly true for online and mobile products and services, where the barriers to entry are lower than they are for desktop software products and services. To attract customers, many online and mobile competitors are offering free or low-priced products which we must take into account in our pricing strategies.
Our most obvious competition comes from other companies that offer technology solutions similar to ours. However, for many of our products and services, other important competitive alternatives for customers are third-party service providers such as professional accountants and seasonal assisted tax preparation businesses. Manual tools and processes, or general-purpose software, are also important competitive alternatives.
Competition Specific to Segments
Small Business Segment
.
QuickBooks is the leading small business financial management software in the U.S. Our small business desktop products and services face competitive challenges from companies such as The Sage Group plc, which offers software and associated services that directly target small business customers. Our small business online products and services face competition from online accounting offerings from companies such as Xero and FreshBooks, free or low-cost online accounting offerings, and free online banking and bill payment services offered by financial institutions and others. In our payroll business we compete directly with Automatic Data Processing, Inc. (ADP), Paychex, Gusto, and many other companies with payroll offerings, including online payroll offerings. In our merchant services business we compete directly with large financial institutions such as Wells Fargo, JP Morgan Chase, and Bank of America and with many payment processors, including First Data Corporation, Elavon, Global Payments, FIS, PayPal, and Square.
Consumer Tax Segment
. In our Consumer Tax segment, our future growth depends on our ability to attract new customers to the self-preparation tax category from tax stores and other tax preparers. In the U.S. private sector we face intense competition from H&R Block, which provides tax preparation services in its stores and a competing software offering. We also face competition from several other large tax preparation service providers, from a myriad of small tax preparers, and from numerous online self-preparation offerings, including Blucora’s TaxAct and Credit Karma. Some of these competitors are offering electronic tax preparation and filing services at no cost to individual taxpayers. In Canada, our TurboTax Canada offerings face competition from H&R Block, SimpleTax, StudioTax, and UFile. These competing offerings subject us to significant price pressure in both the U.S. and Canada.
We also face competitive challenges from publicly funded government entities that offer electronic tax preparation and filing services at no cost to individual taxpayers. We are a member of the Free File Alliance, a consortium of private sector companies that has entered into an agreement with the federal government. Under this agreement, the member companies provide online federal tax preparation and filing services at no cost to the public or eligible federal taxpayers, and the federal government has agreed not to provide a competing service. Approximately 22 states have also adopted Free File Alliance public-private agreements while approximately 20 other states offer some form of direct government tax preparation and filing services free to qualified taxpayers. We continue to actively work with others in the private and public sectors to advance the goals of the Free File Alliance policy initiative and to support successful public-private partnerships. However, future administrative, regulatory, or legislative activity in this area could harm our Consumer Tax business.
ProConnect Segment
.
In the U.S., Lacerte professional tax offerings face competition from competitively-priced tax and accounting solutions that include integration with non-tax functionality. These include CCH’s ProSystems fx Office Suite and Thomson Reuters’ CS Professional Suite and GoSystems Tax. Our ProSeries professional tax offerings face competition from CCH’s ATX and TaxWise offerings, Drake, and other smaller providers. In Canada, our ProFile professional tax offerings face competition from CCH’s Cantax and Taxprep offerings and from Thomson Reuters’ DTMax and UFile Pro offerings. We also face growing competition from online tax and accounting offerings in the U.S. and Canada, which may be marketed more effectively or have lower pricing than our offerings for accounting professionals.
Competitive Factors
We believe the most important competitive factors for our core offerings – QuickBooks, TurboTax, Lacerte, and ProSeries – are ease of use, product features, size of the installed customer base, brand name recognition, value proposition, cost, reliability,
9
security, and product and support quality. Access to distribution channels is also important for our QuickBooks and TurboTax desktop software products. In addition, support from accounting professionals and the ability for customers to upgrade within product families as their businesses grow are significant competitive factors for our QuickBooks products. Productivity is an important competitive factor for the full-service accounting firms to which we market our Lacerte software products. We believe we compete effectively on these factors as our QuickBooks and TurboTax products are the leading products in the U.S. for their respective categories.
For our service offerings such as small business payroll and merchant payment processing, we believe the most important competitive factors are functionality, ease of use, high availability, security, the integration of these products with related software, brand name recognition, effective distribution, quality of support, and cost.
|
CUSTOMER SERVICE AND TECHNICAL SUPPORT
|
We provide customer service and technical support by telephone, e-mail, online and video chat, text messaging, online communities, and our customer service and technical support websites. We have full-time and outsourced customer service and technical support staffs. We supplement these staffs with seasonal employees and additional outsourcing during periods of peak call volumes, such as during the tax return filing season or following a major product launch. We outsource to several firms domestically and internationally. Most of our internationally outsourced small business customer service and technical support personnel are currently located in India and the Philippines.
We offer free self-help information through our technical support websites for our QuickBooks, TurboTax and ProConnect offerings. Customers can also use our websites to find answers to commonly asked questions and check on the status of orders. Under certain paid support plans, customers can also use our websites to receive product updates electronically. Support alternatives and fees vary by product. We sponsor online user communities such as Intuit Community for small businesses and accounting professionals, and TurboTax AnswerXchange, where consumers can share knowledge and product advice with each other. We also offer live tax advice from U.S.-based tax professionals to U.S. TurboTax users.
|
MANUFACTURING AND DISTRIBUTION
|
Online Products and Services
Intuit’s data centers house most of the systems, networks and databases required to operate and deliver our online products and services. These include QuickBooks Online, online payroll services, merchant payment processing services, TurboTax Online, ProConnect Tax Online, and consumer and professional electronic tax filing services. Through our data centers, we connect customers to our products and services and store customer and business information. As our businesses continue to move toward delivering personalized experiences, trusted open platforms and indispensable connections, we expect that our infrastructure will become even more critical to our business in the future.
Our primary data centers are a facility we own in Washington state and a co-located data center in Nevada. We also have a number of other data centers that are primarily located in the western United States and Canada. We continue to execute on a multi-year plan to transition to fewer data centers in more geographically diverse locations. In addition, we have an enterprise agreement with Amazon Web Services and over time will be hosting an increasing number of our applications and services in their secure online environment.
Desktop Software and Supplies
Although an increasing proportion of our desktop software customers choose to electronically download software, many customers continue to choose to purchase these products in the form of physical media. The key processes in manufacturing desktop software are manufacturing compact discs (CDs) and digital video discs (DVDs), printing boxes and related materials, and assembling and shipping the final products.
For retail manufacturing, we have an agreement with Arvato Digital Services, Inc., a division of Bertelsmann AG, under which Arvato provides a majority of the manufacturing volume for our launches of QuickBooks and TurboTax, as well as for day-to-day replenishment after product launches. Arvato has operations in multiple locations that can provide redundancy if necessary.
For retail distribution, we have an agreement with Arvato under which Arvato handles all logistics services. Our retail product launches are operationally complex. Our model for product delivery for retail launches and replenishment is a hybrid of direct to store deliveries and shipments to central warehouse locations. This allows improved inventory management by our retailers. We also ship products for many of our smaller retail customers through distributors.
Arvato also provides most of the manufacturing volume and distribution services for our direct desktop software orders. We have an exclusive agreement with Harland Clarke, a division of M&F Worldwide Corporation, to fulfill orders for all of our printed checks and most other products for our financial supplies business.
10
We have multiple sources for all of our raw materials and availability has historically not been a significant problem for us. We continue to see consolidation among CD/DVD suppliers and reduced demand overall for this media type. As a result, we believe CD/DVD media may become more difficult and more costly to obtain in the near future.
We typically ship products within a few days of receiving an order and backlog is minimal.
|
PRIVACY AND SECURITY OF CUSTOMER AND EMPLOYEE INFORMATION AND TRANSACTIONS
|
We are subject to various federal, state and international laws and regulations and to financial institution and healthcare provider requirements relating to the privacy and security of customer and employee personal information. We are also subject to laws and regulations that apply to the Internet, behavioral tracking and advertising, mobile applications and messaging, telemarketing, e-mail activities, data transfer, data hosting and retention, financial and health information, financial transactions, and credit reporting. Additional laws in all of these areas are likely to be passed in the future, which could result in significant limitations on or changes to the ways in which we can collect, use, host, store or transmit the personal information and data of our customers or employees, communicate with our customers, and deliver products and services to customers or employees, or may significantly increase our compliance costs. As our business expands to new industry segments and new uses of data that are regulated for privacy and security, or to countries outside the United States that have strict data protections laws, our compliance requirements and costs will increase.
We are the stewards of our customers’ data. Through a Master Privacy Policy Framework designed to be consistent with globally recognized privacy principles, we comply with United States federal and other country guidelines and practices to help ensure that customers and employees are aware of, and can control, how we use information about them. Our primary websites and online products, such as Intuit.com, QuickBooks and TurboTax, have been certified by TRUSTe, an independent organization that operates a website and online product privacy certification program representing industry standard practices to address users’ and regulators’ concerns about online privacy. We also use privacy statements to provide notice to customers of our privacy practices, as well as provide them the opportunity to furnish instructions with respect to use of their personal information. We participate in industry groups whose purpose is to develop or shape industry best practices, and to influence public policy for privacy and security.
To address security concerns, we use security safeguards to help protect the systems and the information customers and employees give to us from loss, misuse and unauthorized alteration. Whenever customers transmit sensitive information, such as credit card information or tax return data, through one of our websites or products, we use industry standards to encrypt the data as it is transmitted to us. We work to protect our systems from unauthorized internal or external access using numerous commercially available computer security products as well as internally developed security procedures and practices.
|
GOVERNMENT REGULATION
|
Our Consumer Tax and ProConnect segments are subject to federal and state government requirements, including regulations related to the electronic filing of tax returns, the provision of tax preparer assistance, and the use and disclosure of customer information. In addition, we offer certain other products and services to small businesses and consumers, such as payroll, payments, and financing, which are also subject to regulatory requirements. As we expand our products and services, both domestically and internationally, we may become subject to additional government regulation. Further, regulators may adopt new laws or regulations or their interpretation of existing laws or regulations may differ from ours or expand to cover additional products and services. These increased regulatory requirements could impose significant limitations on our business and increase our cost of compliance.
We are subject to federal and state laws and government regulations concerning employee safety and health and environmental matters. The Occupational Safety and Health Administration, the Environmental Protection Agency, and other federal and state agencies have the authority to put regulations in place that may have an impact on our operations.
11
|
INTELLECTUAL PROPERTY
|
Our success depends on the proprietary technology embodied in our offerings. We protect this proprietary technology by relying on a variety of intellectual property mechanisms, including copyright, patent, trade secret and trademark laws, restrictions on disclosure and other methods. For example, we regularly file applications for patents, copyrights and trademarks and service marks in order to protect intellectual property that we believe is important to our business. We hold a growing patent portfolio that we believe is important to Intuit’s overall competitive advantage, although we are not materially dependent on any one patent or particular group of patents in our portfolio at this time. We also have a number of registered trademarks that include Intuit, QuickBooks, TurboTax, Lacerte, ProSeries, and Mint. We have registered these and other trademarks and service marks in the United States and, depending on the relevance of each brand to other markets, in many foreign countries. Most registrations can be renewed perpetually at 10-year intervals. We also license intellectual property from third parties for use in our products.
Although our portfolio of patents is growing, the patents that have been issued to us could be determined to be invalid and may not be enforceable against competitive products in every jurisdiction. In addition, third parties have asserted and may, in the future, assert infringement claims against us and our customers. These claims and any litigation may result in invalidation of our proprietary rights or a finding of infringement along with an assessment of damages. Litigation, even if without merit, could result in substantial costs and diversion of resources and management attention. In addition, third-party licenses may not continue to be available to us on commercially acceptable terms, or at all.
|
EMPLOYEES
|
As of
July 31, 2017
, we had approximately
8,200
full-time employees in major offices in the United States, Canada, India, the United Kingdom, Israel, Australia and other locations. We also employ a significant number of seasonal and contract employees during the second and third quarters of our fiscal years to support our consumer tax customers. For example, at the peak of the
2016
tax season we employed approximately
1,400
seasonal employees. We believe our future success and growth will depend on our ability to attract and retain qualified employees in all areas of our business. We do not currently have any collective bargaining agreements with our employees, and we believe employee relations are generally good. Although we have employment-related agreements with a number of key employees, these agreements do not guarantee continued service. We believe we offer competitive compensation and a good working environment. We were named one of
Fortune
magazine’s “100 Best Companies to Work For” in each of the last sixteen years. However, we face intense competition for qualified employees, and we expect to face continuing challenges in recruiting and retention.
12
|
|
Our businesses routinely encounter and address risks, many of which could cause our future results to be materially different than we presently anticipate. Below, we describe certain important risks, categorized solely for ease of reference as strategic, operational, legal and compliance, and financial risks. The manner in which we respond to future developments as well as our competitors’ reactions to those developments may affect our future operating results.
STRATEGIC RISKS
Strategic risks relate to our current and future operating model, business plans and growth strategy, including the risks associated with the following: competitive pressures on our product offerings and business models; our ability to adapt to technological changes and global trends; our reliance on third-party intellectual property and our ability to protect our own intellectual property rights; the value of our brand; and mergers, acquisitions and divestiture activity that may have unanticipated costs and expenses.
We face intense competitive pressures that may harm our operating results.
We face intense competition in all of our businesses, and we expect competition to remain intense in the future. Our competitors and potential competitors range from large and established entities to emerging start-ups. Our competitors may introduce superior products and services, reduce prices, have greater technical, marketing and other resources, have greater name recognition, have larger installed bases of customers, have well-established relationships with our current and potential customers, advertise aggressively or beat us to market with new products and services. In addition, we may face competition from existing companies, with large established consumer user-bases and broad-based platforms, who may change or expand the focus of their business strategies and marketing to target our customers, including small businesses and tax customers.
We also face competition from companies with a variety of business models and monetization strategies, including increased competition from providers of free offerings, particularly in our tax, accounting, and payments businesses. In order to compete, we have also introduced free offerings in several categories, but we may not be able to attract customers as effectively as competitors with different business models. In addition, we may not be able to monetize our free offerings if other providers of free offerings provide features that we do not offer and customers who have formerly paid for Intuit’s products and services may elect to use our competitors’ free offerings instead. These competitive factors may diminish our revenue and profitability, and harm our ability to acquire and retain customers.
Our consumer tax business also faces significant competition from the public sector, where we face the risk of federal and state taxing authorities proposing revenue strategies that involve developing and providing government tax software or other government return preparation systems at public expense. These or similar programs may be introduced or expanded in the future, which may change the voluntary compliance tax system in ways that could cause us to lose customers and revenue. The IRS Free File Program is currently the sole means by which the IRS offers tax software to taxpayers, and as part of the program the IRS has agreed it will not offer a competing service. Under this program, the IRS has worked with private industry to provide more than 50 million free returns since 2003, utilizing donated private sector tax software and e-filing services for low and middle income taxpayers at no cost to users or the government. However, its continuation depends on a number of factors, including increasing public awareness of and access to the free program, as well as continued government support. The current agreement is scheduled to expire in October 2020. If the Free File Program were to be terminated and the IRS were to enter the software development and return preparation space, the federal government would become a direct competitor of the U.S. tax services industry and of Intuit, which could potentially have material and adverse revenue implications.
Future revenue growth depends upon our ability to adapt to technological change as well as global trends in the way customers access consumer software offerings and successfully introduce new and enhanced products, services and business models.
Online offerings, desktop software and mobile technology industries are characterized by rapidly changing technology, evolving industry standards and frequent new product introductions. As we continue to grow our online, mobile, and other offerings, we must continue to innovate and develop new products and features to meet changing customer needs and attract and retain talented software developers. We need to continue to develop our skills, tools and capabilities to capitalize on existing and emerging technologies, which require us to devote significant resources.
Our consumer and professional tax businesses depend significantly on revenue from customers who return each year to use our updated tax preparation and filing software and services. As our existing products mature, encouraging customers to purchase product upgrades becomes more challenging unless new product releases provide features and functionality that have meaningful incremental value. We also provide additional customer benefits by utilizing customer data available to us through our existing offerings. If we are not able to develop and clearly demonstrate the value of new or upgraded products or services to our customers, or effectively utilize our customers’ data, our revenues may be harmed. In addition, as we continue to introduce and expand our new business models, including offerings that are free to end users, we may be unsuccessful in monetizing or increasing customer adoption of these offerings or our risk profile may change, resulting in loss of revenue.
13
The number of people who access products and services through devices other than personal computers, including mobile phones, smartphones, and handheld computers such as tablets, continues to increase. We have devoted significant resources to develop products and services for users of these alternative devices, but the versions of our products and services developed for these devices may not be compelling to users. Even if we are able to attract new users through these mobile offerings, the amount of revenue that we derive per user from mobile offerings may be less than the revenue that we have historically derived from users of personal computers. As new devices and new platforms are continually being released, it is difficult to predict the problems we may encounter in developing versions of our products and services for use on these alternative devices and we may need to devote significant resources to the creation, support, and maintenance of such offerings. If we are slow to develop products and technologies that are compatible with these alternative devices, or if our competitors are able to achieve those results more quickly than us, we will fail to capture a significant share of an increasingly important portion of the market for online services, which could adversely affect our business.
In some cases, we may expend a significant amount of resources and management attention on offerings that do not ultimately succeed in their markets. We have encountered difficulty in launching new products and services in the past. If we misjudge customer needs in the future, our new products and services may not succeed and our revenues and earnings may be harmed. We have also invested, and in the future, expect to invest in new business models, geographies, strategies and initiatives. Such endeavors may involve significant risks and uncertainties, including distraction of management from current operations, expenses associated with the initiatives and inadequate return on investments. Because these new initiatives are inherently risky, they may not be successful and may harm our financial condition and operating results.
We rely on third-party intellectual property in our products and services.
Many of our products and services include intellectual property of third parties, which we license under agreements that may need to be renewed or renegotiated from time to time. We may not be able to obtain licenses to these third-party technologies or content on reasonable terms, or at all. If we are unable to obtain the rights necessary to use this intellectual property in our products and services, we may not be able to sell the affected offerings, and customers who are currently using the affected product may be disrupted, which may in turn harm our future financial results, damage our brand, and result in customer loss. Also, we and our customers have been and may continue to be subject to infringement claims as a result of the third-party intellectual property incorporated in our offerings. Although we try to mitigate this risk and we may not be ultimately liable for any potential infringement, pending claims require us to use significant resources, require management attention and could result in loss of customers.
Some of our offerings include third-party software that is licensed under so-called “open source” licenses, some of which may include a requirement that, under certain circumstances, we make available, or grant licenses to, any modifications or derivative works we create based upon the open source software. Although we have established internal review and approval processes to mitigate these risks, we may not be sure that all open source software is submitted for approval prior to use in our products. Many of the risks associated with usage of open source may not be eliminated, and may, if not properly addressed, harm our business.
Our intellectual property rights are valuable, and any inability to protect them could reduce the value of our products, services, and brand.
Our patents, trademarks, trade secrets, copyrights and other intellectual property rights are important assets for us. We aggressively protect our intellectual property rights by relying on federal, state and common law rights in the U.S. and internationally, as well as a variety of administrative procedures. We also rely on contractual restrictions to protect our proprietary rights in products and services. The efforts that we take to protect our proprietary rights may not always be sufficient or effective. Protecting our intellectual property rights is costly and time consuming and may not be successful in every location. Any significant impairment of our intellectual property rights could harm our business, our brand and our ability to compete.
Policing unauthorized use and copying of our products is difficult, expensive, and time consuming. Current U.S. laws that prohibit copying give us only limited practical protection from software piracy and the laws of many other countries provide very little protection. We frequently encounter unauthorized copies of our software being sold through online marketplaces. Although we continue to evaluate and put in place technology solutions to attempt to lessen the impact of piracy and engage in efforts to educate consumers and public policy leaders on these issues and cooperate with industry groups in their efforts to combat piracy, we expect piracy to be a persistent problem that results in lost revenues and increased expenses.
Our business depends on our strong reputation and the value of our brands.
Developing and maintaining awareness of our brands is critical to achieving widespread acceptance of our existing and future products and services and is an important element in attracting new customers. Adverse publicity (whether or not justified) relating to events or activities attributed to us, our employees or agents may tarnish our reputation and reduce the value of our brands. Damage to our reputation and loss of brand equity may reduce demand for our products and services and thus have an adverse effect on our future financial results, as well as require additional resources to rebuild our reputation and restore the value of the brands.
14
Our acquisition and divestiture activities may disrupt our ongoing business, may involve increased expenses and may present risks not contemplated at the time of the transactions.
We have acquired and may continue to acquire companies, products and technologies that complement our strategic direction, both in and outside the United States. Acquisitions involve significant risks and uncertainties, including:
|
•
|
inability to successfully integrate the acquired technology, data assets and operations into our business and maintain uniform standards, controls, policies, and procedures;
|
|
•
|
inability to realize synergies expected to result from an acquisition;
|
|
•
|
disruption of our ongoing business and distraction of management;
|
|
•
|
challenges retaining the key employees, customers, resellers and other business partners of the acquired operation;
|
|
•
|
the internal control environment of an acquired entity may not be consistent with our standards or with regulatory requirements, and may require significant time and resources to align or rectify;
|
|
•
|
unidentified issues not discovered in our due diligence process, including product or service quality issues, intellectual property issues and legal contingencies;
|
|
•
|
failure to successfully further develop an acquired business or technology and any resulting impairment of amounts currently capitalized as intangible assets;
|
|
•
|
in the case of foreign acquisitions and investments, the impact of particular economic, tax, currency, political, legal and regulatory risks associated with specific countries.
|
We have divested and may in the future divest certain assets or businesses that no longer fit with our strategic direction or growth targets. Divestitures involve significant risks and uncertainties, including:
|
•
|
inability to find potential buyers on favorable terms;
|
|
•
|
failure to effectively transfer liabilities, contracts, facilities and employees to buyers;
|
|
•
|
requirements that we retain or indemnify buyers against certain liabilities and obligations;
|
|
•
|
the possibility that we will become subject to third-party claims arising out of such divestiture;
|
|
•
|
challenges in identifying and separating the intellectual properties and data to be divested from the intellectual properties and data that we wish to retain;
|
|
•
|
inability to reduce fixed costs previously associated with the divested assets or business;
|
|
•
|
challenges in collecting the proceeds from any divestiture;
|
|
•
|
disruption of our ongoing business and distraction of management;
|
|
•
|
loss of key employees who leave the Company as a result of a divestiture;
|
|
•
|
if customers or partners of the divested business do not receive the same level of service from the new owners, our other businesses may be adversely affected, to the extent that these customers or partners also purchase other products offered by us or otherwise conduct business with our retained business.
|
Because acquisitions and divestitures are inherently risky, our transactions may not be successful and may, in some cases, harm our operating results or financial condition. Although we typically fund our acquisitions through cash available from operations, if we were to use debt to fund acquisitions or for other purposes, our interest expense and leverage would increase significantly, and if we were to issue equity securities as consideration in an acquisition, current shareholders’ percentage ownership and earnings per share would be diluted.
OPERATIONAL RISKS
Operational risks arise from internal and external events relating to systems, processes and people. Risks that affect the operation of our businesses include the following: security breaches; privacy and cybersecurity concerns relating to online offerings; fraudulent activities by third parties; relationships with third parties; competition for and retention of key talent; issues with our product launches; problems with our information technology infrastructure; and risks associated with operating internationally.
A security breach resulting in third-party access to our sensitive customer and employee information and data could materially disrupt our businesses, result in the disclosure of confidential information, significantly damage our reputation, subject us to costly litigation and cause material losses.
We host, collect, use and retain large amounts of sensitive and personal customer and employee information and data, including credit card information, tax return information, bank account numbers and passwords, personal and business financial data and transactions, social security numbers, healthcare information and payroll information. We and our vendors use commercially available security technologies to protect this information and data, and we also use security and business
15
controls to limit access to and use of such sensitive and personal customer information and data. Although we expend significant resources to create security protections that shield our customer data against potential theft and security breaches, such measures cannot provide absolute security. We have experienced instances in the past where criminals, using stolen identity information obtained outside of our systems, have gained unauthorized and illegal access to our customers’ data. As the accessibility of stolen identity information increases, we may experience additional instances of unauthorized and illegal access to our systems using our customers’ stolen identity information in the future. In addition, third parties may fraudulently induce employees, customers, or users to disclose sensitive information in order to gain access to our data or customers’ data. The security measures that we implement may not be able to prevent access to our systems from unauthorized users who have fraudulently obtained our customers’ personal information. In addition, because the techniques used to obtain unauthorized access change frequently, becoming more sophisticated and are often not able to be detected until after a successful attack, we may be unable to anticipate these techniques or implement adequate preventive measures. Further, as we move to an ecosystem where customers have one identity across multiple products, a security breach may give access to increased amount of customer data. A major breach of our security measures or those of third parties that provide hosting services or have access to our sensitive and personal customer information may have serious negative consequences for our businesses, including possible litigation, fines, penalties and damages, material harm to our reputation and brands, further regulation and oversight by federal or state agencies, and loss of our ability to provide financial transaction services or accept and process customer credit card orders or tax returns.
Our technologies, systems, and networks and our customers’ devices have been subject to, and are likely to continue to be the target of, cyber-attacks, computer viruses, worms, phishing attacks, malicious software programs and other information security breaches that could result in the unauthorized release, gathering, monitoring, misuse, loss or destruction of our customers’ or employees’ sensitive and personal information and data, or otherwise disrupt our or our customers’ or other third parties’ business operations. These types of attacks can be made by individuals, groups of hackers, and sophisticated organizations including state-sponsored organizations or nation-states themselves. Customers that fail to update their systems, continue to run software that we no longer support or that fail to install security patches on a timely basis make it more difficult for us to detect and prevent these kinds of attacks. Although this is an industry-wide problem that affects software across platforms, it is increasingly affecting our offerings because cyber-criminals tend to focus their efforts on well-known offerings that are popular among customers and hold sensitive information and we expect them to continue to do so. If these cyber-criminals are able to circumvent our security measures, exploit vulnerabilities in our customers’ devices or customers’ behavior, or if we are unable to detect an intrusion into our systems and contain such intrusion in a reasonable amount of time, our customers’ sensitive and personal information and data may be compromised, which could lead to litigation with our customers, fines, penalties and other damages.
In addition, our employees, contractors, temporary and seasonal employees may have access to sensitive and personal information of our customers and employees. While we conduct background checks of our employees and these other individuals and limit access to systems and data, it is possible that one or more of these individuals may circumvent these controls, resulting in accidental or intentional disclosure or misuse of our customers’ or employees’ data. In addition, we rely on third-party vendors to host certain of our sensitive and personal information and data. While we conduct due diligence on these third-party partners with respect to their security and business controls, we may not have the ability to effectively monitor or oversee the implementation of these controls measures, and, in any event, individuals or third parties may be able to circumvent these security and business controls and/or exploit vulnerabilities that may exist in these controls, resulting in the disclosure or misuse of sensitive and personal customer or employee information and data.
Privacy and cybersecurity concerns relating to online offerings, including our offerings specifically, as well as the external environment generally, could damage our reputation and deter current and potential customers from adopting our products and services.
From time to time, we detect, or receive notices from customers or public or private agencies that they have detected, actual or perceived vulnerabilities in our servers, our software or third-party software components that are distributed with our products or fraudulent activity by unauthorized persons utilizing our products with stolen customer identity information. The existence of such vulnerabilities or fraudulent activity, even if they do not result in a security breach, may undermine customer confidence as well as the confidence of government agencies that regulate our offerings. As we further transition our businesses to online and connected services, continue to collect more personal and sensitive information, and operate in more countries, the risk that perceived vulnerabilities of our systems could seriously harm our business by tarnishing our reputation and brand and/or limiting the adoption of our products and services is likely to increase.
In addition, the continued occurrence of cyber-attacks and data breaches on governments, businesses and consumers in general, indicates that we operate in an external environment where cyber-attacks and data breaches are becoming increasingly common. If the global cybersecurity environment worsens, and there are increased instances of security breaches of third-party offerings where consumers’ data and sensitive information is compromised, consumers may be less willing to use online offerings, particularly offerings like ours where customers often share sensitive financial data. This could damage our reputation and deter current and potential customers from adopting our products and services or lead customers to cease using online and connected software products to transact financial business altogether.
16
If we are unable to effectively combat the increasing amount and sophistication of fraudulent activities by third parties using our offerings, we may suffer losses, which may be substantial, and lose the confidence of our customers and government agencies and our revenues and earnings may be harmed.
The online tax preparation, payroll administration and online payments industries have been experiencing an increasing amount of fraudulent activities by third parties, and those fraudulent activities are becoming increasingly sophisticated. Although we do not believe that any of this activity is uniquely targeted at our products or business, this type of fraudulent activity may adversely impact our tax, payroll, and payments businesses. In addition to any losses that may result from such fraud, which may be substantial, a loss of confidence by our customers or by governmental agencies in our ability to prevent fraudulent activity that is perpetrated through our offerings may seriously harm our business and damage our brand. If we cannot adequately combat such fraudulent activity that is perpetrated through our tax offerings, governmental authorities may refuse to allow us to continue to offer such services, which could include federal or state tax authorities refusing to allow us to process our customers’ tax returns electronically, resulting in a significant adverse impact on our earnings and revenue. As fraudulent activities become more pervasive and increasingly sophisticated, and fraud detection and prevention measures must become correspondingly more complex to combat them across the various industries in which we operate, we may implement risk control mechanisms that could make it more difficult for legitimate customers to obtain and use our products, which could result in lost revenue and negatively impact our earnings.
If we fail to process transactions effectively or fail to adequately protect against disputed or potential fraudulent activities, our business may be harmed.
Our operations process a significant volume and dollar value of transactions on a daily basis, especially in our payroll and payments businesses. Despite our efforts to ensure that effective processing systems and controls are in place to handle transactions appropriately, it is possible that we may make errors or that funds may be misappropriated due to fraud. The systems supporting our business are comprised of multiple technology platforms that are difficult to scale. If we are unable to effectively manage our systems and processes, or if there is an error in our products, we may be unable to process customer data in an accurate, reliable and timely manner, which may harm our reputation, the willingness of customers to use our products, and our financial results. In our payments processing service business, if merchants for whom we process payment transactions are unable to pay refunds due to their customers in connection with disputed or fraudulent merchant transactions, we may be required to pay those amounts and our payments may exceed the amount of the customer reserves we have established to make such payments.
Business interruption or failure of our information technology and communication systems may impair the availability of our products and services, which may damage our reputation and harm our future financial results.
Our reputation and ability to attract, retain and serve our customers is dependent upon the reliable performance of our products and our underlying technical infrastructure. As we continue to transition our business to more connected services, we become more dependent on the continuing operation and availability of our information technology and communication systems and those of our external service providers, including, for example, third-party Internet-based or “cloud” computing services. We do not have redundancy for all of our systems, many of our critical applications reside in only one of our data centers, and our disaster recovery planning may not account for all eventualities. In the event of significant system disruption we may experience loss of data or processing capabilities, which may cause us to lose customers and may materially harm our reputation and our operating results. In addition, we are in the process of updating our customer facing applications and the supporting information technology infrastructure to meet our customers’ expectations for continuous service availability. Any difficulties in upgrading these applications or infrastructure or failure of our systems or those of our third-party service providers may result in interruptions in our service, which may reduce our revenues and profits, cause us to lose customers and damage our reputation. Any prolonged interruptions at any time may result in lost customers, additional refunds of customer charges, negative publicity and increased operating costs, any of which may significantly harm our business, financial condition and results of operations.
Our tax businesses must effectively handle extremely heavy customer demand during critical peak periods from January until April of each year. We face significant risks in maintaining adequate service levels during these peak periods where we derive a substantial portion of our overall revenue from the tax businesses. Any interruptions in our online tax preparation or electronic filing service at any time during the tax season, particularly during a peak period, could result in significantly decreased revenue, lost customers, additional refunds of customer charges, negative publicity and increased operating costs, any of which could significantly harm our business, financial condition and results of operations.
We are in the process of migrating our applications and infrastructure to new data centers and to third-party hosted environments. If we do not execute the transition to these new environments in an effective manner, we may experience unplanned service disruptions or unforeseen increases in costs which may harm our operating results and our business.
17
We rely on internal systems and external systems maintained by manufacturers, distributors and other service providers to take and fulfill customer orders, handle customer service requests and host certain online activities. Any interruption or failure of our internal or external systems may prevent us or our service providers from accepting and fulfilling customer orders or cause company and customer data to be unintentionally disclosed. Our continuing efforts to upgrade and expand our network security and other information systems as well as our high-availability capabilities may be costly, and problems with the design or implementation of system enhancements may harm our business and our results of operations.
Our business operations, data centers, information technology and communications systems are vulnerable to damage or interruption from natural disasters, human error, malicious attacks, fire, power loss, telecommunications failures, computer viruses, computer denial of service attacks, terrorist attacks and other events beyond our control. In addition, our corporate headquarters and other critical business operations are located near major seismic faults. In the event of a major natural or man-made disaster, our insurance coverage may not completely compensate us for our losses and our future financial results may be materially harmed.
If we are unable to develop, manage and maintain critical third-party business relationships, our business may be adversely affected.
Our growth is increasingly dependent on the strength of our business relationships and our ability to continue to develop, manage and maintain new and existing relationships. We rely on various third-party partners, including software and service providers, suppliers, vendors, manufacturers, distributors, accountants, contractors, financial institutions, core processors, licensing partners and development partners, among others, in many areas of our business in order to deliver our offerings and operate our business. We also rely on third parties to support the operation of our business by maintaining our physical facilities, equipment, power systems and infrastructure. In certain instances, these third-party relationships are sole source or limited source relationships and can be difficult to replace or substitute depending on the level of integration of the third party’s products or services into, or with, our offerings and/or the general availability of such third party’s products and services. In addition, there may be few or no alternative third-party providers or vendors in the market. Further, there can be no assurance that we will be able to adequately retain third-party contractors engaged to help us operate our business. The failure of third parties to provide acceptable and high quality products, services and technologies or to update their products, services and technologies may result in a disruption to our business operations and our customers, which may reduce our revenues and profits, cause us to lose customers and damage our reputation. Alternative arrangements and services may not be available to us on commercially reasonable terms or we may experience business interruptions upon a transition to an alternative partner.
Although we have strict standards for our suppliers and business partners to comply with the law and company policies regarding workplace and employment practices, data use and security, environmental compliance, intellectual property licensing and other applicable regulatory and compliance requirements, we cannot control their day-to-day practices. If any of them violate laws or implements practices regarded as unethical, we could experience supply chain disruptions, canceled orders, terminations of or damage to key relationships, and damage to our reputation.
In particular, we have relationships with banks, credit unions and other financial institutions that support certain critical services we offer to our customers. If macroeconomic conditions or other factors cause any of these institutions to fail, consolidate, stop providing certain services or institute cost-cutting efforts, our business and financial results may suffer and we may be unable to offer those services to our customers.
We have also started to increasingly utilize the distribution platforms of third parties like Apple’s App Store and Google’s Play Store for the distribution of certain of our product offerings. Although we benefit from the strong brand recognition and large user base of these distribution platforms to attract new customers, the platform owners have wide discretion to change the pricing structure, terms of service and other policies with respect to us and other developers. Any adverse changes by these third parties could adversely affect our financial results.
Because competition for our key employees is intense, we may not be able to attract, retain and develop the highly skilled employees we need to support our planned growth.
Much of our future success depends on the continued service and availability of skilled personnel, including members of our executive team, and those in technical, marketing and staff positions. Experienced personnel in the software, mobile technologies, data science, data security, and software as a service industries are in high demand and competition for their talents is intense, especially in California and India, where the majority of our employees are located. Also, as we strive to continue to adapt to technological change and introduce new and enhanced products and business models, we must be able to secure, maintain and develop the right quality and quantity of engaged and committed talent. The incentives we have available to attract, retain, and motivate employees provided by our equity awards may become less effective, and if we were to issue significant equity to attract additional employees, the ownership of our existing stockholders would be diluted. Although we strive to be an employer of choice, we may not be able to continue to successfully attract, retain and develop key personnel, which may cause our business to suffer.
18
The nature of our products and services necessitates timely product launches, and if we experience significant product accuracy or quality problems or delays, it may harm our revenue, earnings and reputation.
All of our tax products and many of our non-tax products have rigid development timetables that increase the risk of errors in our products and the risk of launch delays. Our tax preparation software product development cycle is particularly challenging due to the need to incorporate unpredictable and potentially late tax law and tax form changes each year and because our customers expect high levels of accuracy and a timely launch of these products to prepare and file their taxes by the tax filing deadline. Due to the complexity of our products and the condensed development cycles under which we operate, our products may contain errors that could unexpectedly interfere with the operation of the software or result in incorrect calculations. The complexity of the tax laws on which our products are based may also make it difficult for us to consistently deliver offerings that contain the features, functionality and level of accuracy that our customers expect. When we encounter problems we may be required to modify our code, work with state tax administrators to communicate with affected customers, assist customers with amendments, distribute patches to customers who have already purchased the product and recall or repackage existing product inventory in our distribution channels. If we encounter development challenges or discover errors in our products either late in our development cycle or after release it may cause us to delay our product launch date or suspend product availability until such issues can be fixed. Any major defects, launch delays or product suspensions may lead to loss of customers and revenue, negative publicity, customer and employee dissatisfaction, reduced retailer shelf space and promotions, and increased operating expenses, such as inventory replacement costs, legal fees or other payments, including those resulting from our accuracy guarantee in our tax preparation products. For example, an error in our tax products could cause a compliance error for taxpayers, including the over or underpayment of their federal or state tax liability. While our accuracy guarantee commits us to reimburse penalties and interest paid by customers due solely to calculation errors in our tax preparation products, such errors may result in additional burdens on third parties that we may need to address or that may cause us to suspend the availability of our products until such errors are addressed. This could also affect our reputation, the willingness of customers to use our products, and our financial results.
We regularly invest resources to update and improve our internal information technology systems and software platforms. Should our investments not succeed, or if delays or other issues with new or existing internal technology systems and software platforms disrupt our operations, our business could be harmed.
We rely on our network and data center infrastructure and internal technology systems for many of our development, marketing, operational, support, sales, accounting and financial reporting activities. We are continually investing resources to update and improve these systems and environments in order to meet existing, as well as the growing and changing requirements of our business and customers. If we experience prolonged delays or unforeseen difficulties in updating and upgrading our systems and architecture, we may experience outages and may not be able to deliver certain offerings and develop new offerings and enhancements that we need to remain competitive. Such improvements and upgrades are often complex, costly and time consuming. In addition such improvements can be challenging to integrate with our existing technology systems, or may uncover problems with our existing technology systems. Unsuccessful implementation of hardware or software updates and improvements could result in outages, disruption in our business operations, loss of revenue or damage to our reputation.
Our international operations are subject to increased risks which may harm our business, operating results, and financial condition.
In addition to uncertainty about our ability to generate revenues from our foreign operations and expand into international markets, there are risks inherent in doing business internationally, including:
|
•
|
different or more restrictive privacy, data protection, data localization, and other laws that could require us to make changes to our products, services and operations, such as mandating that certain types of data collected in a particular country be stored and/or processed within that country;
|
|
•
|
difficulties in developing, staffing, and simultaneously managing a large number of varying foreign operations as a result of distance, language, and cultural differences;
|
|
•
|
stringent local labor laws and regulations;
|
|
•
|
credit risk and higher levels of payment fraud;
|
|
•
|
profit repatriation restrictions, and foreign currency exchange restrictions;
|
|
•
|
geopolitical events, including natural disasters, acts of war and terrorism;
|
|
•
|
import or export regulations;
|
|
•
|
compliance with U.S. laws such as the Foreign Corrupt Practices Act, and local laws prohibiting corrupt payments to government officials;
|
|
•
|
antitrust and competition regulations;
|
|
•
|
potentially adverse tax developments;
|
19
|
•
|
economic uncertainties relating to European sovereign and other debt;
|
|
•
|
trade barriers and changes in trade regulations;
|
|
•
|
political or social unrest, economic instability, repression, or human rights issues; and
|
|
•
|
risks related to other government regulation or required compliance with local laws.
|
Violations of the rapidly evolving and complex foreign and U.S. laws and regulations that apply to our international operations may result in fines, criminal actions or sanctions against us, our officers or our employees, prohibitions on the conduct of our business and damage to our reputation. Although we have implemented policies and procedures designed to promote compliance with these laws, there can be no assurance that our employees, contractors or agents will not violate our policies. These risks inherent in our international operations and expansion increase our costs of doing business internationally and may result in harm to our business, operating results, and financial condition.
LEGAL AND COMPLIANCE RISKS
Legal and compliance risks arise from change in the government and regulatory environment, potential litigation, regulatory inquiries and intellectual property infringement claims. Government and regulatory risk include the following: increased government regulations; ongoing litigation and regulatory inquiries; and intellectual property infringement.
Increased government regulation of our businesses, or changes to existing regulations, may harm our operating results.
The Company is subject to federal, state and local laws and regulations that affect the Company’s activities, including, without limitation, areas of labor, advertising, tax, financial services, data privacy and security requirements, digital content, consumer protection, real estate, billing, e-commerce, promotions, quality of services, intellectual property ownership and infringement, import and export requirements, anti-corruption, foreign exchange controls and cash repatriation restrictions, anti-competition, environmental, health and safety.
There have been significant new regulations and heightened focus by the government on many of these areas, as well as in areas such as insurance and healthcare (including, for example, the Affordable Care Act). A
s we expand our products and services and revise our business models, both domestically and internationally, we may become subject to additional government regulation or increased regulatory scrutiny. Further, regulators (both in the U.S. and in other jurisdictions in which we operate) may adopt new laws or regulations, change existing regulations, or their interpretation of existing laws or regulations may differ from ours .
As our business continues to expand to countries outside the United States that have more strict data protection laws, our compliance requirements and costs may increase. Recent legal developments in the European Union have created compliance uncertainty and increased complexity regarding certain transfers of information from Europe to the U.S. The European Commission has approved a data protection regulation, known as the GDPR, which has been finalized and is due to come into force in May 2018. The GDPR will require certain operational changes to be made by companies that receive or process personal data of residents of the EU and will include significant penalties for non-compliance. In addition, other governmental authorities around the world are considering similar types of legislative and regulatory proposals concerning data protection. Due to the uncertain international environment, we could face additional compliance obligations that could cause us to incur costs or require us to change our business practices in a manner adverse to our business. Further, these regulatory requirements could also
impose significant limitations, require changes to our business, require notification to customers or employees of a security breach, restrict our use or storage of personal information, or cause changes in customer purchasing behavior which may make our business more costly, less efficient or impossible to conduct, and may require us to modify our current or future products or services, which may make customers less likely to purchase our products or harm our future financial results. We have incurred – and may continue to incur – significant expenses to comply with mandatory privacy and security standards and protocols imposed by law, regulation, industry standards or contractual obligations.
The tax preparation industry continues to receive heightened attention from federal and state governments. New legislation, regulation, public policy considerations, changes in the cybersecurity environment, litigation by the government or private entities, changes to or new interpretations of existing laws may result in greater oversight of the tax preparation industry, restrict the types of products and services that we can offer or the prices we can charge, or otherwise cause us to change the way we operate our tax businesses or offer our tax products and services. We may not be able to respond quickly to such regulatory, legislative and other developments, and these changes may in turn increase our cost of doing business and limit our revenue opportunities. In addition, if our practices are not consistent with new interpretations of existing laws, we may become subject to lawsuits, penalties, and other liabilities that did not previously apply. We are also required to comply with a variety of state revenue agency standards in order to successfully operate our tax preparation and electronic filing services. Changes in state-imposed requirements by one or more of the states, including the required use of specific technologies or technology standards, may significantly increase the costs of providing those services to our customers and may prevent us from delivering a quality product to our customers in a timely manner.
We are also subject to certain laws and regulations in the U.S. and other jurisdictions relating to electronic funds transfer, money transmission and other regulated activities. In the event laws governing regulated activities change or expand, we may be subject to additional compliance costs. As we increase our business activities into regulated areas, such as lending, we may be subject to increased regulations and compliance requirements.
20
We are frequently a party to litigation and regulatory inquiries which could result in an unfavorable outcome and have an adverse effect on our business, financial condition, results of operation and cash flows.
We are subject to various legal proceedings (including class action lawsuits), claims and regulatory inquiries that have arisen out of the ordinary conduct of our business and are not yet resolved and additional claims and inquiries may arise in the future. The number and significance of these claims and inquiries have increased as our businesses have evolved. Any proceedings, claims or inquiries initiated by or against us, whether successful or not, may be time consuming; result in costly litigation, damage awards, consent decrees, injunctive relief or increased costs of business; require us to change our business practices or products; require significant amounts of management time; result in diversion of significant operations resources; or otherwise harm our business and future financial results. For further information about specific litigation, see Item 3, “Legal Proceedings”.
Third parties claiming that we infringe their proprietary rights may cause us to incur significant legal expenses and prevent us from selling our products.
We may become increasingly subject to infringement claims, including patent, copyright, trade secret, and trademark infringement claims. Litigation may be necessary to determine the validity and scope of the intellectual property rights of others. We have received a number of allegations of intellectual property infringement claims in the past and expect to receive more claims in the future based on allegations that our offerings infringe upon the intellectual property held by third parties. Some of these claims are the subject of pending litigation against us and against some of our customers. These claims may involve patent holding companies or other adverse intellectual property owners who have no relevant product revenues of their own, and against whom our own intellectual property may provide little or no deterrence. The ultimate outcome of any allegation is uncertain and, regardless of outcome, any such claim, with or without merit, may be time consuming to defend, result in costly litigation, divert management’s time and attention from our business, require us to stop selling, delay shipping or redesign our products, or require us to pay monetary damages for royalty or licensing fees, or to satisfy indemnification obligations that we have with some of our customers. Our failure to obtain necessary license or other rights, or litigation arising out of intellectual property claims may harm our business.
We are subject to risks associated with information disseminated through our services.
The laws relating to the liability of online services companies for information such as online content disseminated through their services are subject to frequent challenges. In spite of settled law in the U.S., claims are made against online services companies by parties who disagree with the content. Where our online content is accessed on the internet outside of the U.S., challenges may be brought under foreign laws which do not provide the same protections for online services companies as in the U.S. These challenges in either U.S. or foreign jurisdictions may rise to legal claims alleging defamation, libel, invasion of privacy, negligence, copyright or trademark infringement, or other theories based on the nature and content of the materials disseminated through the services. Certain of our services include content generated by users of our online services. Although this content is not generated by us, claims of defamation or other injury may be made against us for that content. Any costs incurred as a result of this potential liability may harm our business.
FINANCIAL RISKS
Financial risks relate to our ability to meet financial obligations and mitigate exposure to financial impacts to our businesses or our offerings. Financial risks arise from the following: seasonality; excessive product returns; unanticipated changes in income tax rates; adverse global macro-economic conditions; fluctuations in our net income; indebtedness; and the fluctuation of our stock price.
Our tax business is highly seasonal and our quarterly results could fluctuate significantly.
Our tax offerings have significant seasonal patterns. Revenue from income tax preparation products and services is heavily concentrated during November through April. This seasonality has caused significant fluctuations in our quarterly financial results. Our financial results may also fluctuate from quarter to quarter and year to year due to a variety of factors, including factors that may affect the timing of revenue recognition. These include changes to our offerings that result in the inclusion or exclusion of ongoing services; changes in product pricing strategies or product sales mix; the timing of the availability of federal and state tax forms from taxing agencies and the ability of those agencies to receive electronic tax return submissions; changes in customer behavior; and the timing of our discontinuation of support for older product offerings. Other factors that may affect our quarterly or annual financial results include the timing of acquisitions, divestitures, and goodwill and acquired intangible asset impairment charges. Any fluctuations in our operating results may adversely affect our stock price.
If actual product returns exceed returns reserves our future financial results may be harmed.
We ship more desktop software products to our distributors and retailers than we expect them to sell, in order to reduce the risk that distributors or retailers may run out of products. This is particularly true for our tax products, which have a short selling season and for which returns occur primarily in our fiscal third and fourth quarters. Like many software companies that sell their products through distributors and retailers, we have historically accepted significant product returns. We establish reserves against revenue for product returns in our financial statements based on estimated returns and we closely monitor
21
product sales and inventory in the retail channel in an effort to maintain adequate reserves. In the past, returns have not differed significantly from these reserves. However, if we experience actual returns that significantly exceed reserves, it may result in lower net revenue.
Unanticipated changes in our income tax rates may affect our future financial results.
Our future effective income tax rates may be favorably or unfavorably affected by unanticipated changes in the valuation of our deferred tax assets and liabilities, by changes in our stock price, or by changes in tax laws or their interpretation. In addition, we are subject to the continuous examination of our income tax returns by the Internal Revenue Service and other tax authorities. We regularly assess the likelihood of adverse outcomes resulting from these examinations to determine the adequacy of our provision for income taxes. These continuous examinations may result in unforeseen tax-related liabilities, which may harm our future financial results.
Adverse global economic conditions could harm our business and financial condition.
Adverse macroeconomic developments could negatively affect our business and financial condition. Adverse global economic events have caused, and could, in the future, cause disruptions and volatility in global financial markets and increased rates of default and bankruptcy, and could impact consumer and small business spending. While we have historically performed well in economic downturns, there is no guarantee that we would continue to perform well in future adverse macroeconomic conditions. In particular, because the majority of our revenue is derived from sales within the U.S., economic conditions in the U.S. have an even greater impact on us than companies with a more diverse international presence. Challenging economic times could cause potential new customers not to purchase or to delay purchasing of our products and services, and could cause our existing customers to discontinue purchasing or delay upgrades of our existing products and services, thereby negatively impacting our revenues and future financial results. Decreased consumer spending levels could also reduce credit and debit card transaction processing volumes causing reductions in our payments revenue. Poor economic conditions and high unemployment have caused, and could in the future cause, a significant decrease in the number of tax returns filed, which may have a significant effect on the number of tax returns we prepare and file. In addition, weakness in the end-user consumer and small business markets could negatively affect the cash flow of our distributors and resellers who could, in turn, delay paying their obligations to us, which could increase our credit risk exposure and cause delays in our recognition of revenue or future sales to these customers. Any of these events could harm our business and our future financial results.
Amortization of acquired intangible assets and impairment charges may cause significant fluctuation in our net income.
Our acquisitions have resulted in significant expenses, including amortization and impairment of acquired technology and other acquired intangible assets, and impairment of goodwill. Total costs and expenses in these categories were
$14 million
in fiscal
2017
;
$34 million
in fiscal
2016
; and $339 million in fiscal
2015
, of which $149 million was classified as discontinued operations. Although under current accounting rules goodwill is not amortized, we may incur impairment charges related to the goodwill already recorded and to goodwill arising out of future acquisitions. We test the impairment of goodwill annually in our fourth fiscal quarter or more frequently if indicators of impairment arise. The timing of the formal annual test may result in charges to our statement of operations in our fourth fiscal quarter that may not have been reasonably foreseen in prior periods. The total costs and expenses for fiscal 2015 included goodwill and intangible asset impairment charges of $297 million, of which $149 million was classified as discontinued operations. At
July 31, 2017
, we had
$1.3 billion
in goodwill and
$22
million in net acquired intangible assets on our balance sheet, both of which may be subject to impairment charges in the future. New acquisitions, and any impairment of the value of acquired intangible assets, may have a significant negative impact on our future financial results.
We have
$488 million
in debt outstanding and may incur other debt in the future, which may adversely affect our financial condition and future financial results.
On February 1, 2016, we entered into a master credit agreement with certain institutional lenders for a new five-year credit facility in an aggregate principal amount of $1.5 billion. The master credit agreement includes a $500 million unsecured term loan and a $1 billion unsecured revolving credit facility that will expire on February 1, 2021. As of
July 31, 2017
, we had no outstanding borrowings under the revolving credit facility and had an outstanding debt of
$488 million
on the term loan. We may use the proceeds of any advances against the credit facility for general corporate purposes, including future acquisitions and share repurchases.
This debt may adversely affect our financial condition and future financial results by, among other things:
|
•
|
increasing our vulnerability to downturns in our business, to competitive pressures and to adverse economic and industry conditions;
|
|
•
|
requiring the dedication of a portion of our expected cash from operations to service our indebtedness, thereby reducing the amount of expected cash flow available for other purposes, including capital expenditures and acquisitions; and
|
|
•
|
limiting our flexibility in planning for, or reacting to, changes in our businesses and our industries.
|
22
Our current unsecured revolving credit facility imposes restrictions on us, including restrictions on our ability to create liens on our assets and the ability of our subsidiaries to incur indebtedness, and require us to maintain compliance with specified financial ratios. Our ability to comply with these ratios may be affected by events beyond our control. In addition, our short- and long-term debt includes covenants that may adversely affect our ability to incur certain liens or engage in certain types of sale and leaseback transactions. If we breach any of the covenants under our short- and long-term debt or our unsecured revolving credit facility and do not obtain a waiver from the lenders, then, subject to applicable cure periods, any outstanding indebtedness may be declared immediately due and payable.
In addition, changes by any rating agency to our credit rating may negatively impact the value and liquidity of both our debt and equity securities. If our credit ratings are downgraded or other negative action is taken, the interest rate payable by us under our unsecured revolving credit facility may increase. In addition, any downgrades in our credit ratings may affect our ability to obtain additional financing in the future and may affect the terms of any such financing.
Our stock price may be volatile and your investment could lose value.
Our stock price is subject to changes in recommendations or earnings estimates by financial analysts, changes in investors’ or analysts’ valuation measures for our stock, our credit ratings and market trends unrelated to our performance. Furthermore, speculation in the press or investment community about our strategic position, financial condition, results of operations, business or security of our products, can cause changes in our stock price. These factors, as well as general economic and political conditions and the timing of announcements in the public market regarding new products, product enhancements or technological advances by our competitors or us, and any announcements by us of acquisitions, major transactions, or management changes may adversely affect our stock price. Further, any changes in the amounts or frequency of share repurchases or dividends may also adversely affect our stock price. A significant drop in our stock price could expose us to the risk of securities class actions lawsuits, which may result in substantial costs and divert management’s attention and resources, which may adversely affect our business.
|
|
None.
|
|
Our principal locations, their purposes, and the expiration dates for the leases on facilities at those locations as of
July 31, 2017
are shown in the table below. We have renewal options on many of our leases.
|
Location
|
Purpose
|
Approximate
Square
Feet
|
Principal
Lease
Expiration
Dates
|
|||
|
Mountain View, California
|
Corporate headquarters and principal offices for Small Business segment
|
487,000
|
2024 - 2026
|
|||
|
Mountain View, California
|
Corporate headquarters and principal offices for Small Business segment
|
224,000
|
Owned
|
|||
|
San Diego, California
|
Principal offices for Consumer Tax segment
|
466,000
|
Owned
|
|||
|
Bangalore, India
|
Principal offices for Intuit India
|
359,000
|
2020 - 2022
|
|||
|
Quincy, Washington
|
Primary data center
|
240,000
|
Owned
|
|||
|
Menlo Park, California
|
Subleased office space
|
210,000
|
2025
|
|||
|
San Francisco, California
|
General office space
|
202,000
|
2025
|
|||
|
Woodland Hills, California
|
Principal offices for Small Business payment solutions business
|
168,000
|
2018
|
|||
|
Plano, Texas
|
Principal offices for ProConnect segment and data center
|
166,000
|
2026
|
|||
We also lease or own facilities in a number of smaller domestic locations and internationally in Canada, the United Kingdom, Singapore, Australia, and several other locations. We believe our facilities are suitable and adequate for our current and near-term needs, and that we will be able to locate additional facilities as needed. See Note 8 to the financial statements in Item 8 of this Annual Report for more information about our lease commitments.
23
|
|
In fiscal 2015 Intuit was contacted by regulatory authorities, including Congress, the Federal Trade Commission, the SEC, the Department of Justice and certain state Attorneys General, which are conducting inquiries in connection with the increase during the 2015 tax season in attempts by criminals using stolen identity information to file fraudulent tax returns and claim refunds at the state and federal levels. Intuit is cooperating with all such government inquiries, including formal requests for information. In addition, we are the subject of certain actions, including a consolidated putative class action lawsuit by individuals who claim to have suffered damages in connection with the foregoing events. We believe that the allegations contained within these lawsuits are without merit, and we intend to vigorously defend against them.
Intuit is subject to certain routine legal proceedings, including class action lawsuits like those described above, as well as demands, claims, government inquiries and threatened litigation, that arise in the normal course of our business, including assertions that we may be infringing patents or other intellectual property rights of others. We currently believe that, in addition to any amounts accrued, the amount of potential losses, if any, for any pending claims of any type (either alone or combined) will not have a material impact on our consolidated financial statements. The ultimate outcome of any litigation is uncertain and, regardless of outcome, litigation can have an adverse impact on Intuit because of defense costs, negative publicity, diversion of management resources and other factors. Our failure to obtain necessary license or other rights, or litigation arising out of intellectual property claims could adversely affect our business.
|
|
None.
|
|
Market Information for Common Stock
Intuit’s common stock is quoted on the NASDAQ Global Select Market under the symbol “INTU.” The following table shows the range of high and low sale prices reported on the NASDAQ Global Select Market for the periods indicated. The closing price of Intuit’s common stock on
August 25, 2017
was
$137.35
.
|
High
|
Low
|
||||||
|
Fiscal year ended July 31, 2016
|
|
|
|||||
|
First quarter
|
|
$107.75
|
|
|
$79.63
|
|
|
|
Second quarter
|
108.00
|
|
88.66
|
|
|||
|
Third quarter
|
105.32
|
|
88.17
|
|
|||
|
Fourth quarter
|
116.97
|
|
99.25
|
|
|||
|
Fiscal year ended July 31, 2017
|
|
|
|
|
|||
|
First quarter
|
|
$114.06
|
|
|
$106.34
|
|
|
|
Second quarter
|
120.55
|
|
103.22
|
|
|||
|
Third quarter
|
128.45
|
|
111.90
|
|
|||
|
Fourth quarter
|
143.81
|
|
124.22
|
|
|||
Stockholders
As of
August 25, 2017
we had approximately 470 record holders and approximately 157,000 beneficial holders of our common stock.
24
Dividends
We declared and paid quarterly cash dividends that totaled
$1.36
per share of outstanding common stock or
$353 million
during fiscal
2017
;
$1.20
per share of outstanding common stock or
$318 million
during fiscal
2016
; and
$1.00
per share of outstanding common stock or
$283 million
during fiscal
2015
. In August
2017
our Board of Directors declared a quarterly cash dividend of
$0.39
per share of outstanding common stock payable on
October 18, 2017
to stockholders of record at the close of business on
October 10, 2017
. We currently expect to continue to pay comparable cash dividends on a quarterly basis in the future; however, future declarations of dividends and the establishment of future record dates and payment dates are subject to the final determination of our Board of Directors.
Recent Sales of Unregistered Securities
None.
Purchases of Equity Securities by the Issuer and Affiliated Purchasers
Stock repurchase activity during the three months ended
July 31, 2017
was as follows:
|
Period
|
Total Number
of Shares
Purchased
|
Average
Price Paid
per Share
|
Total Number
of Shares
Purchased
as Part of
Publicly
Announced
Plans
|
Approximate
Dollar Value
of Shares
That May Yet
Be Purchased
Under
the Plans
|
||||||||
|
May 1, 2017 through May 31, 2017
|
88,429
|
|
$125.68
|
88,429
|
|
|
$1,871,634,145
|
|
||||
|
June 1, 2017 through June 30, 2017
|
1,260,000
|
|
$139.33
|
1,260,000
|
|
|
$1,696,077,791
|
|
||||
|
July 1, 2017 through July 31, 2017
|
1,310,480
|
|
$133.54
|
1,310,480
|
|
|
$1,521,078,092
|
|
||||
|
Total
|
2,658,909
|
|
$136.02
|
2,658,909
|
|
|
||||||
Note:
All of the shares purchased as part of publicly announced plans during the three months ended
July 31, 2017
were purchased under a plan we announced on August 19, 2016 under which we are authorized to repurchase up to $2 billion of our common stock. At
July 31, 2017
, authorization from our Board of Directors to expend up to
$1.5
billion remained available under that plan.
25
Company Stock Price Performance
The graph below compares the cumulative total stockholder return on Intuit common stock for the last five full fiscal years with the cumulative total returns on the S&P 500 Index and the Morgan Stanley Technology Index for the same period. The graph assumes that $100 was invested in Intuit common stock and in each of the other indices on July 31,
2012
and that all dividends were reinvested. The comparisons in the graph below are based on historical data – with Intuit common stock prices based on the closing price on the dates indicated – and are not intended to forecast the possible future performance of Intuit’s common stock.
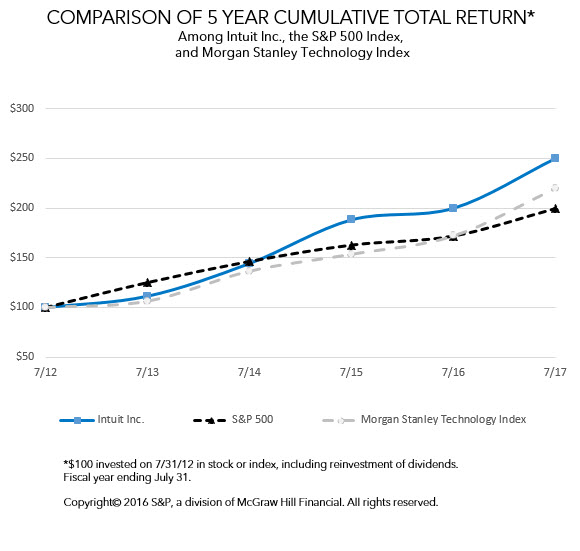
|
July 31, 2012
|
July 31, 2013
|
July 31, 2014
|
July 31, 2015
|
July 31, 2016
|
July 31, 2017
|
||||||||||||||||||
|
Intuit Inc.
|
$
|
100.00
|
|
$
|
111.38
|
|
$
|
144.30
|
|
$
|
188.21
|
|
$
|
199.88
|
|
$
|
249.95
|
|
|||||
|
S&P 500
|
$
|
100.00
|
|
$
|
125.00
|
|
$
|
146.17
|
|
$
|
162.55
|
|
$
|
171.68
|
|
$
|
199.22
|
|
|||||
|
Morgan Stanley Technology Index
|
$
|
100.00
|
|
$
|
106.35
|
|
$
|
136.57
|
|
$
|
153.60
|
|
$
|
172.05
|
|
$
|
219.84
|
|
|||||
|
|
The following tables show Intuit’s selected financial information for the past five fiscal years. The comparability of the information is affected by a variety of factors, including acquisitions and divestitures of businesses, issuance and repayment of debt, share-based compensation expense, amortization of acquired technology and other acquired intangible assets, repurchases of common stock under our stock repurchase programs, and the payment of cash dividends.
In fiscal 2013 through fiscal 2015 we acquired several companies and we have included the results of operations for each of them in our consolidated results of operations from their respective dates of acquisition.
In fiscal 2013 we completed the sale of our Intuit Websites business. In fiscal 2014 we completed the sales of our Intuit Financial Services and Intuit Health businesses. In fiscal 2016 we completed the sales of our Demandforce, QuickBase, and
26
Quicken businesses. We accounted for all of these businesses as discontinued operations and have therefore reclassified our statements of operations for all periods presented below to reflect them as such. We have also reclassified our balance sheets for all periods presented below to reflect Intuit Financial Services, Demandforce, QuickBase, and Quicken as discontinued operations. The net assets of Intuit Websites and Intuit Health were not significant, so we have not reclassified our balance sheets for any period presented below to reflect them as discontinued operations.
To better understand the information in these tables, investors should read
“Management’s Discussion and Analysis of Financial Condition and Results of Operations”
in Item 7 of this Annual Report, and the financial statements and related notes in Item 8 of this Annual Report, especially Note 6,
“Discontinued Operations.”
|
Consolidated Statement of Operations Data
|
Fiscal
|
||||||||||||||||||
|
(In millions, except per share amounts)
|
2017
(1)
|
2016
|
2015
|
2014
|
2013
|
||||||||||||||
|
Total net revenue
|
$
|
5,177
|
|
$
|
4,694
|
|
$
|
4,192
|
|
$
|
4,243
|
|
$
|
3,946
|
|
||||
|
Total costs and expenses
|
3,782
|
|
3,452
|
|
3,454
|
|
2,943
|
|
2,738
|
|
|||||||||
|
Operating income from continuing operations
|
1,395
|
|
1,242
|
|
738
|
|
1,300
|
|
1,208
|
|
|||||||||
|
Total share-based compensation expense included in total costs and expenses
|
326
|
|
278
|
|
242
|
|
186
|
|
166
|
|
|||||||||
|
Net income from continuing operations
|
971
|
|
806
|
|
413
|
|
853
|
|
807
|
|
|||||||||
|
Net income (loss) from discontinued operations
|
—
|
|
173
|
|
(48
|
)
|
54
|
|
51
|
|
|||||||||
|
Net income
|
971
|
|
979
|
|
365
|
|
907
|
|
858
|
|
|||||||||
|
Net income per common share:
|
|
|
|
|
|
||||||||||||||
|
Basic net income per share from continuing operations
|
$
|
3.78
|
|
$
|
3.08
|
|
$
|
1.47
|
|
$
|
2.99
|
|
$
|
2.72
|
|
||||
|
Basic net income (loss) per share from discontinued operations
|
—
|
|
0.65
|
|
(0.17
|
)
|
0.19
|
|
0.17
|
|
|||||||||
|
Basic net income per share
|
$
|
3.78
|
|
$
|
3.73
|
|
$
|
1.30
|
|
$
|
3.18
|
|
$
|
2.89
|
|
||||
|
Diluted net income per share from continuing operations
|
$
|
3.72
|
|
$
|
3.04
|
|
$
|
1.45
|
|
$
|
2.94
|
|
$
|
2.66
|
|
||||
|
Diluted net income (loss) per share from discontinued operations
|
—
|
|
0.65
|
|
(0.17
|
)
|
0.18
|
|
0.17
|
|
|||||||||
|
Diluted net income per share
|
$
|
3.72
|
|
$
|
3.69
|
|
$
|
1.28
|
|
$
|
3.12
|
|
$
|
2.83
|
|
||||
|
Dividends declared per common share
|
$
|
1.36
|
|
$
|
1.20
|
|
$
|
1.00
|
|
$
|
0.76
|
|
$
|
0.68
|
|
||||
|
(1)
|
In the first quarter of fiscal 2017, we elected to early adopt ASU 2016-09, “
Compensation—Stock Compensation (Topic 718): Improvements to Employee Share-Based Payment Accounting.
” As required by ASU 2016-09, excess tax benefits recognized on stock-based compensation expense are reflected in our condensed consolidated statements of operations as a component of the provision for income taxes on a prospective basis. See Note 1 to the financial statements in Item 8 of this Annual Report for more information.
|
|
Consolidated Balance Sheet Data
|
At July 31,
|
||||||||||||||||||
|
(In millions)
|
2017
|
2016
|
2015
|
2014
|
2013
|
||||||||||||||
|
Cash, cash equivalents and investments
|
$
|
777
|
|
$
|
1,080
|
|
$
|
1,697
|
|
$
|
1,914
|
|
$
|
1,661
|
|
||||
|
Long-term investments
|
31
|
|
28
|
|
27
|
|
31
|
|
83
|
|
|||||||||
|
Working capital (deficit)
|
(529
|
)
|
(637
|
)
|
816
|
|
1,200
|
|
1,116
|
|
|||||||||
|
Total assets
|
4,068
|
|
4,250
|
|
4,968
|
|
5,201
|
|
5,486
|
|
|||||||||
|
Short-term debt
|
50
|
|
512
|
|
—
|
|
—
|
|
—
|
|
|||||||||
|
Long-term debt
|
438
|
|
488
|
|
500
|
|
499
|
|
499
|
|
|||||||||
|
Other long-term obligations
|
130
|
|
146
|
|
172
|
|
166
|
|
135
|
|
|||||||||
|
Total stockholders’ equity
|
1,354
|
|
1,161
|
|
2,332
|
|
3,078
|
|
3,531
|
|
|||||||||
27
|
|
Management’s Discussion and Analysis of Financial Condition and Results of Operations (MD&A) is intended to provide readers of our consolidated financial statements with the perspectives of management. This should allow the readers of this report to obtain a comprehensive understanding of our businesses, strategies, current trends, and future prospects. Our MD&A includes the following sections:
|
•
Executive Overview:
High level discussion of our operating results and some of the trends that affect our business.
•
Critical Accounting Policies and Estimates:
Policies and estimates that we believe are important to understanding the assumptions and judgments underlying our financial statements.
•
Results of Operations:
A more detailed discussion of our revenue and expenses.
•
Liquidity and Capital Resources:
Discussion of key aspects of our statements of cash flows, changes in our balance sheets, and our financial commitments.
|
You should note that this MD&A discussion contains forward-looking statements that involve risks and uncertainties. Please see the section entitled
“Forward-Looking Statements”
immediately preceding Part 1 for important information to consider when evaluating such statements.
You should read this MD&A in conjunction with the financial statements and related notes in Item 8 of this Annual Report. In fiscal 2016 we completed the sales of our Demandforce, QuickBase, and Quicken businesses. We accounted for all of these businesses as discontinued operations and have therefore reclassified our statements of operations for all periods presented to reflect them as such. Because the cash flows of these discontinued operations were not material for any period presented, we have not segregated them on our statements of cash flows. See
“Results of Operations – Non-Operating Income and Expense – Discontinued Operations”
later in this Item 7 for more information. Unless otherwise noted, the following discussion pertains to our continuing operations.
|
EXECUTIVE OVERVIEW
|
This overview provides a high level discussion of our operating results and some of the trends that affect our business. We believe that an understanding of these trends is important in order to understand our financial results for fiscal
2017
as well as our future prospects. This summary is not intended to be exhaustive, nor is it a substitute for the detailed discussion and analysis provided elsewhere in this Annual Report on Form 10-K.
|
Industry Trends and Seasonality
|
Industry Trends
The industry in which we operate is dynamic and highly competitive, and we expect it to remain so in the future. The markets for software and related services, especially highly-available connected services, are characterized by rapid technological change, shifting customer needs, and frequent new product introductions and enhancements. Competitive interest and expertise in many of the markets we serve have grown markedly over the past few years and we expect this trend to continue. There are also large, cloud-based service companies who innovate quickly and serve small businesses and consumers. While today our competition with such companies may be limited, as we and those companies grow, our competition with them may increase. In recent years the widespread availability of the Internet, the emergence of mobile devices, and the explosion of social media have accelerated the pace of change and revolutionized the way that people throughout the world manage important financial tasks. The result is a global market that is shifting from traditional services that are paper-based, human-produced, and brick-and-mortar bound, to one where people understand, demand, and embrace the benefits of connected services. This trend toward connected services is the primary driver of the strategies in all of our businesses.
Seasonality
Our Consumer Tax offerings have significant seasonal patterns. As a result, during each of the last three fiscal years the total revenue for our third quarter ended April 30 has represented nearly half of our total revenue for those years. We expect the seasonality of our Consumer Tax business to continue to have a significant impact on our quarterly financial results in the future.
28
|
Key Challenges and Risks
|
Our growth strategy depends upon our ability to initiate and embrace disruptive technology trends, to enter new markets, and to drive broad adoption of the products and services we develop and market. Our future growth also increasingly depends on the strength of our third-party business relationships and our ability to continue to develop, maintain, and strengthen new and existing relationships. To remain competitive and continue to grow, we are investing significant resources in our product development, marketing, and sales capabilities, and we expect to continue to do so in the future.
As we continue transitioning to offer more connected services, the ongoing operation and availability of our information technology and communication systems and those of our external service providers is becoming increasingly important. Because we help customers manage their financial lives, we face risks associated with the hosting, collection, use, and retention of personal customer information and data. We are investing significant management attention and resources in our information technology infrastructure and in our privacy and security capabilities, and we expect to continue to do so in the future.
Beginning in early calendar year 2015, state taxing authorities, the IRS, and the tax preparation industry experienced an increase in attempts by criminals using stolen identity information to file fraudulent tax returns and claim refunds at the federal level and expanding into the state level. We implemented additional security measures in our products and began working with state governments to share information regarding suspicious filings while continuing to share such information with the federal government. We continue to invest in security and to work with the broader industry and government to protect our customers against this type of fraud.
For a complete discussion of the most significant risks and uncertainties affecting our business, please see
“Forward-Looking Statements”
immediately preceding Part 1 and
“Risk Factors”
in Item 1A of Part I of this Report.
|
Overview of Financial Results
|
The most important financial indicators that we use to assess our business are revenue growth for the company as a whole, for each reportable segment, and for product lines within each reportable segment; operating income growth and operating income margins for the company as a whole and for each reportable segment; earnings per share; and cash flow from operations. We also track certain non-financial drivers of revenue growth and, when material, identify them in the applicable discussions of segment results below. These non-financial drivers include, for example, customer growth and retention for all of our businesses and transaction volume for our payment processing business. Total credit and debit card transaction volume correlates strongly with the macroeconomic environment and is one of the key drivers of revenue growth in our payment processing business. Customers for our connected services offerings have generally grown faster than those for our traditional desktop software offerings, reflecting our strategic focus on connected services over the past few years. Connected services (total service and other revenue) generated
$3.8
billion or
73%
of our total revenue in fiscal
2017
. We expect connected services revenue as a percentage of our total revenue to continue to grow in the future.
|
•
|
Total net revenue for fiscal
2017
was
$5.2 billion
, an increase of
10%
compared with fiscal
2016
.
|
|
•
|
Revenue in our Small Business segment increased
13%
compared with fiscal
2016
due to
30%
growth in Small Business Online Ecosystem revenue and the impact of the changes to our QuickBooks Desktop software products that we implemented in fiscal 2015.
|
|
•
|
Revenue in our Consumer Tax segment increased
9%
compared with fiscal
2016
due to 2% growth in TurboTax federal units and a shift in mix to the higher end of our product lineup.
|
|
•
|
Revenue in our ProConnect segment increased
2%
to
$437
million in fiscal
2017
compared with fiscal
2016
.
|
|
•
|
Operating income from continuing operations increased
12%
in fiscal
2017
compared with fiscal
2016
due to the increase in revenue described above. Higher revenue was partially offset by higher costs and expenses, including higher spending for staffing, advertising and other marketing programs, and share-based compensation.
|
|
•
|
Net income from continuing operations increased
20%
in fiscal
2017
compared with fiscal
2016
due to the increase in operating income and a lower effective tax rate in fiscal
2017
.
|
|
•
|
Diluted net income per share from continuing operations for fiscal
2017
increased
22%
to
$3.72
as a result of the increase in net income and the decline in weighted average diluted common shares compared with fiscal
2016
.
|
|
•
|
We ended fiscal
2017
with cash, cash equivalents and investments totaling
$777 million
. In fiscal
2017
we generated cash from operations, net sales of investments, borrowings under our revolving credit facility, and the issuance of common stock under employee stock plans. During the same period we used cash for the repayment of debt and amounts outstanding under our revolving credit facility, repurchases of shares of our common stock under our stock repurchase programs, payments of cash dividends, and capital expenditures. At
July 31, 2017
, we had authorization from our Board of Directors to expend up to an additional
$1.5 billion
for stock repurchases.
|
29
|
CRITICAL ACCOUNTING POLICIES AND ESTIMATES
|
In preparing our consolidated financial statements in accordance with U.S. generally accepted accounting principles (GAAP), we are required to make estimates, assumptions, and judgments that can have a significant impact on our net revenue, operating income or loss and net income or loss, as well as on the value of certain assets and liabilities on our balance sheet. We believe that the estimates, assumptions, and judgments involved in the following accounting policies have the greatest potential impact on our consolidated financial statements, so we consider these to be our critical accounting policies:
|
•
|
Revenue Recognition
|
|
•
|
Business Combinations
|
|
•
|
Goodwill, Acquired Intangible Assets, and Other Long-Lived Assets – Impairment Assessments
|
|
•
|
Accounting for Share-Based Compensation Plans
|
|
•
|
Legal Contingencies
|
|
•
|
Accounting for Income Taxes
– Estimates of Deferred Taxes, Valuation Allowances, and Uncertain Tax Positions
|
Our senior management has reviewed the development and selection of these critical accounting policies and their disclosure in this Annual Report on Form 10-K with the Audit and Risk Committee of our Board of Directors.
Revenue Recognition
We derive revenue from the sale of software subscriptions, hosted services, packaged software products, financial supplies, technical support plans, transaction fees, merchant services hardware, and multiple element arrangements that may include a combination of these items. We follow the appropriate revenue recognition rules for each type of revenue. For additional information, see
“Revenue Recognition”
in Note 1 to the financial statements in Item 8 of this Annual Report. We generally recognize revenue when persuasive evidence of an arrangement exists, we have delivered the product or performed the service, the fee is fixed or determinable and collectibility is probable. However, determining whether and when some of these criteria have been satisfied often involves exercising judgment and using estimates that can have a significant impact on the timing and amount of revenue we report. For example, for multiple element arrangements containing only software and software-related elements, we must exercise judgment and use estimates in order to (1) allocate the total price among the various elements we must deliver; (2) determine whether undelivered services are essential to the functionality of the delivered products and services; (3) determine whether vendor-specific evidence of fair value exists for each undelivered element; and (4) determine whether and when each element has been delivered. For multiple element arrangements containing non-software elements, we must exercise judgment and use estimates in order to (1) determine whether and when each element has been delivered; (2) determine the fair value of each element using the selling price hierarchy of vendor-specific evidence of fair value (VSOE) if available, third-party evidence (TPE) if VSOE is not available, and estimated selling price (ESP) if neither VSOE nor TPE is available; and (3) allocate the total price among the various elements based on the relative selling price method. If we were to change any of these judgments or estimates, it could cause a material increase or decrease in the amount of revenue that we report in a particular period. Amounts for fees collected or invoiced and due relating to arrangements where revenue cannot be recognized are reflected on our balance sheet as deferred revenue and recognized when the applicable revenue recognition criteria are satisfied.
Business Combinations
As described in
“Description of Business and Summary of Significant Accounting Policies – Business Combinations,”
in Note 1 to the financial statements in Item 8 of this Annual Report, under the acquisition method of accounting we generally recognize the identifiable assets acquired, the liabilities assumed, and any noncontrolling interests in an acquiree at their fair values as of the date of acquisition. We measure goodwill as the excess of consideration transferred, which we also measure at fair value, over the net of the acquisition date fair values of the identifiable assets acquired and liabilities assumed. The acquisition method of accounting requires us to exercise judgment and make significant estimates and assumptions regarding the fair values of the elements of a business combination as of the date of acquisition, including the fair values of identifiable intangible assets, deferred tax asset valuation allowances, liabilities related to uncertain tax positions, and contingencies. This method also requires us to refine these estimates over a one-year measurement period to reflect new information obtained about facts and circumstances that existed as of the acquisition date that, if known, would have affected the measurement of the amounts recognized as of that date. If we are required to retroactively adjust provisional amounts that we have recorded for the fair values of assets and liabilities in connection with acquisitions, these adjustments could materially decrease our operating income and net income and result in lower asset values on our balance sheet.
Significant estimates and assumptions that we must make in estimating the fair value of acquired technology, customer lists, and other identifiable intangible assets include future cash flows that we expect to generate from the acquired assets. If the subsequent actual results and updated projections of the underlying business activity change compared with the assumptions and projections used to develop these values, we could record impairment charges. In addition, we have estimated the economic lives of certain acquired assets and these lives are used to calculate depreciation and amortization expense. If our estimates of the economic lives change, depreciation or amortization expenses could be accelerated or slowed.
30
Goodwill, Acquired Intangible Assets and Other Long-Lived Assets – Impairment Assessments
We estimate the fair value of acquired intangible assets and other long-lived assets that have finite useful lives whenever an event or change in circumstances indicates that the carrying value of the asset may not be recoverable. We test for potential impairment of goodwill and other intangible assets that have indefinite useful lives annually in our fourth fiscal quarter or whenever indicators of impairment arise. The timing of the annual test may result in charges to our statement of operations in our fourth fiscal quarter that could not have been reasonably foreseen in prior periods.
As described in
“Description of Business and Summary of Significant Accounting Policies – Goodwill, Acquired Intangible Assets and Other Long-Lived Assets,”
in Note 1 to the financial statements in Item 8 of this Annual Report, in order to estimate the fair value of goodwill we use a weighted combination of a discounted cash flow model (known as the income approach) and comparisons to publicly traded companies engaged in similar businesses (known as the market approach). The income approach requires us to use a number of assumptions, including market factors specific to the business, the amount and timing of estimated future cash flows to be generated by the business over an extended period of time, long-term growth rates for the business, and a rate of return that considers the relative risk of achieving the cash flows and the time value of money. We evaluate cash flows at the reporting unit level. Although the assumptions we use in our discounted cash flow model are consistent with the assumptions we use to generate our internal strategic plans and forecasts, significant judgment is required to estimate the amount and timing of future cash flows from each reporting unit and the relative risk of achieving those cash flows. When using the market approach, we make judgments about the comparability of publicly traded companies engaged in similar businesses. We base our judgments on factors such as size, growth rates, profitability, risk, and return on investment. We also make judgments when adjusting market multiples of revenue, operating income, and earnings for these companies to reflect their relative similarity to our own businesses. We had a total of
$1.3 billion
in goodwill on our balance sheet at
July 31, 2017
. See Note 5 to the financial statements in Item 8 of this Annual Report for a summary of goodwill by reportable segment.
We estimate the recoverability of acquired intangible assets and other long-lived assets that have finite useful lives by comparing the carrying amount of the asset to the future undiscounted cash flows that we expect the asset to generate. In order to estimate the fair value of those assets, we estimate the present value of future cash flows from those assets. The key assumptions that we use in our discounted cash flow model are the amount and timing of estimated future cash flows to be generated by the asset over an extended period of time and a rate of return that considers the relative risk of achieving the cash flows and the time value of money. Significant judgment is required to estimate the amount and timing of future cash flows and the relative risk of achieving those cash flows. We also make judgments about the remaining useful lives of acquired intangible assets and other long-lived assets that have finite lives. We had a total of
$22 million
in net acquired intangible assets on our balance sheet at
July 31, 2017
.
Assumptions and estimates about future values and remaining useful lives are complex and often subjective. They can be affected by a variety of factors, including external factors such as industry and economic trends, and internal factors such as changes in our business strategy and our internal forecasts. For example, if our future operating results do not meet current forecasts or if we experience a sustained decline in our market capitalization that is determined to be indicative of a reduction in fair value of one or more of our reporting units, we may be required to record future impairment charges for goodwill and acquired intangible assets. Impairment charges could materially decrease our future net income and result in lower asset values on our balance sheet.
During the fourth quarters of fiscal
2017
, fiscal
2016
, and fiscal
2015
we performed our annual goodwill impairment tests. Using the methodology described in
“Description of Business and Summary of Significant Accounting Policies – Goodwill, Acquired Intangible Assets and Other Long-Lived Assets,”
in Note 1 to the financial statements in Part 8 of this Annual Report, we determined that the estimated fair values of all of our reporting units exceeded their carrying values and that they were not impaired. In addition, during this analysis we concluded that the estimated fair values of all of our reporting units substantially exceeded their carrying values.
During the third quarter of fiscal 2015 there was a significant decline in the revenue and operating income forecast for our Consumer Ecosystem reporting unit. As a result of this development, we performed an interim impairment test of goodwill and acquired intangible assets for that reporting unit. We concluded that the carrying value of goodwill associated with our Consumer Ecosystem reporting unit was impaired and we recorded an impairment charge of
$263
million that reduced the carrying value of goodwill to $211 million as of April 30, 2015. See “
Fair Value Measurements – Assets and Liabilities Measured at Fair Value on a Non-Recurring Basis,”
in Note 2 to the financial statements in Item 8 of this Annual Report for more information.
During the fourth quarter of fiscal 2015 management approved a plan to sell our Quicken business, which was part of our Consumer Ecosystem reporting unit, and we accounted for it as discontinued operations. As a result, we reclassified a portion of the goodwill impairment charge that we recorded in the third quarter of fiscal 2015 to discontinued operations based on the relative fair values of Quicken and the remaining components of our Consumer Ecosystem reporting unit. In the third quarter of fiscal 2016 we completed the sale of our Quicken business for cash consideration that was not significant.
31
Accounting for Share-Based Compensation Plans
At
July 31, 2017
, there was
$802
million of total unrecognized compensation cost related to non-vested share-based compensation arrangements granted under all equity compensation plans which we will amortize to expense in the future. We expect to recognize that cost over a weighted average vesting period of
2.4
years.
In the first quarter of fiscal 2017, we elected to early adopt ASU 2016-09,
“Compensation
—
Stock Compensation (Topic 718): Improvements to Employee Share-Based Payment Accounting.”
As part of this new standard, we have elected to account for forfeitures as they occur, rather than estimate expected forfeitures over the course of a vesting period. See Note 1 to the financial statements in Item 8 of this Annual Report for more information.
We use a lattice binomial model and the assumptions described in Note 10 to the financial statements in Item 8 of this Annual Report to estimate the fair value of stock options granted. We estimate the expected term of options granted based on implied exercise patterns using a binomial model. We estimate the volatility of our common stock at the date of grant based on the implied volatility of publicly traded one-year and two-year options on our common stock. Our decision to use implied volatility is based upon the availability of actively traded options on our common stock and our assessment that implied volatility is more representative of future stock price trends than historical volatility. We base the risk-free interest rate that we use in our option valuation model on the implied yield in effect at the time of option grant on constant maturity U.S. Treasury issues with equivalent remaining terms. We use an annualized expected dividend yield in our option valuation model. We adjust share-based compensation expense for actual forfeitures as they occur. Prior to our adoption of ASU 2016-09 in the first quarter of fiscal 2017, we estimated forfeitures at the time of grant and revised those estimates in subsequent periods if actual forfeitures differed from those estimates. We amortize the fair value of options on a straight-line basis over the requisite service periods of the awards, which are generally the vesting periods. We may elect to use different assumptions under our option valuation model in the future, which could materially affect our net income or loss and net income or loss per share.
Restricted stock units (RSUs) granted typically vest based on continued service. We value these time-based RSUs at the date of grant using the intrinsic value method. We amortize the fair value of time-based RSUs on a straight-line basis over the service period. Certain RSUs granted to senior management vest based on the achievement of pre-established performance or market goals. We estimate the fair value of performance-based RSUs at the date of grant using the intrinsic value method and the probability that the specified performance criteria will be met. Each quarter we update our assessment of the probability that the specified performance criteria will be achieved and adjust our estimate of the fair value of the performance-based RSUs if necessary. We amortize the fair values of performance-based RSUs over the requisite service period for each separately vesting tranche of the award. We estimate the fair value of market-based RSUs at the date of grant using a Monte Carlo valuation methodology and amortize those fair values over the requisite service period for each separately vesting tranche of the award. The Monte Carlo methodology that we use to estimate the fair value of market-based RSUs at the date of grant incorporates into the valuation the possibility that the market condition may not be satisfied. Provided that the requisite service is rendered, the total fair value of the market-based RSUs at the date of grant must be recognized as compensation expense even if the market condition is not achieved. However, the number of shares that ultimately vest can vary significantly with the performance of the specified market criteria. All of the RSUs we grant have dividend rights that are subject to the same vesting requirements as the underlying equity awards, so we do not adjust the intrinsic (market) value of our RSUs for dividends. See Note 10 to the financial statements in Item 8 of this Annual Report for more information.
Legal Contingencies
We are subject to certain legal proceedings, as well as demands, claims and threatened litigation that arise in the normal course of our business. We review the status of each significant matter quarterly and assess our potential financial exposure. If the potential loss from any claim or legal proceeding is considered probable and the amount can be reasonably estimated, we record a liability and an expense for the estimated loss. If we determine that a loss is possible and the range of the loss can be reasonably determined, then we disclose the range of the possible loss. Significant judgment is required in the determination of whether a potential loss is probable, reasonably possible, or remote as well as in the determination of whether a potential exposure is reasonably estimable. Our accruals are based on the best information available at the time. As additional information becomes available, we reassess the potential liability related to our pending claims and litigation and may revise our estimates. Potential legal liabilities and the revision of estimates of potential legal liabilities could have a material impact on our financial position and results of operations.
Accounting for Income Taxes – Estimates of Deferred Taxes, Valuation Allowances, and Uncertain Tax Positions
We estimate our income taxes based on the various jurisdictions where we conduct business. Significant judgment is required in determining our worldwide income tax provision. The calculation of our tax liabilities involves dealing with uncertainties in the application of complex tax rules and the potential for future adjustment of our uncertain tax positions by the United States Internal Revenue Service or other taxing jurisdictions. We estimate our current tax liability and assess temporary differences that result from differing treatments of certain items for tax and accounting purposes. These differences result in deferred tax assets and liabilities, which we show on our balance sheet. We must then assess the likelihood that our deferred tax assets will be realized. To the extent we believe that realization is not likely, we establish a valuation allowance. When we establish a valuation allowance or increase this allowance in an accounting period, we record a corresponding tax expense in our statement of operations.
32
At
July 31, 2017
, we had net deferred tax assets of
$125 million
which included a valuation allowance of $64 million for loss and tax credit carryforwards related to state tax credits, foreign losses, and state operating and capital losses. We recorded the valuation allowance to reflect uncertainties about whether we will be able to utilize some of our deferred tax assets before they expire. While we believe our current valuation allowance is sufficient, we could in the future be required to increase the valuation allowance to take into account additional deferred tax assets that we may be unable to realize. We assess the need for an adjustment to the valuation allowance on a quarterly basis. The assessment is based on our estimates of future sources of taxable income for the jurisdictions in which we operate and the periods over which our deferred tax assets will be realizable. See Note 9 to the financial statements in Item 8 of this Annual Report for more information.
We recognize and measure benefits for uncertain tax positions using a two-step approach. The first step is to evaluate the tax position taken or expected to be taken in a tax return by determining if the weight of available evidence indicates that it is more likely than not that the tax position will be sustained upon audit, including resolution of any related appeals or litigation processes. For tax positions that are more likely than not of being sustained upon audit, the second step is to measure the tax benefit as the largest amount that is more than 50% likely of being realized upon settlement. Significant judgment is required to evaluate uncertain tax positions. We evaluate our uncertain tax positions on a quarterly basis. Our evaluations are based upon a number of factors, including changes in facts or circumstances, changes in tax law, correspondence with tax authorities during the course of audits and effective settlement of audit issues. Changes in the recognition or measurement of uncertain tax positions could result in material increases or decreases in our income tax expense in the period in which we make the change, which could have a material impact on our effective tax rate and operating results.
33
|
RESULTS OF OPERATIONS
|
|
Financial Overview
|
|||||||||||||||||
|
(Dollars in millions, except per share amounts)
|
Fiscal
2017
|
Fiscal
2016
|
Fiscal
2015 |
2017-2016
% Change
|
2016-2015
% Change
|
||||||||||||
|
Total net revenue
|
|
$5,177
|
|
|
$4,694
|
|
|
$4,192
|
|
10
|
%
|
12
|
%
|
||||
|
Operating income from continuing operations
|
1,395
|
|
1,242
|
|
738
|
|
12
|
%
|
68
|
%
|
|||||||
|
Net income from continuing operations
|
971
|
|
806
|
|
413
|
|
20
|
%
|
95
|
%
|
|||||||
|
Diluted net income per share from continuing operations
|
|
$3.72
|
|
|
$3.04
|
|
|
$1.45
|
|
22
|
%
|
110
|
%
|
||||
Fiscal
2017
Compared with Fiscal
2016
Total net revenue increased
$483
million or
10%
in fiscal
2017
compared with fiscal
2016
. Revenue in our Small Business segment increased
13%
due to
30%
growth in Small Business Online Ecosystem revenue and the impact of the changes to our QuickBooks Desktop software products. Starting with the release of QuickBooks 2015 in the first quarter of fiscal 2015, and for all subsequent versions, we began delivering ongoing enhancements and certain connected services for our QuickBooks Desktop software products. We plan to continue to provide ongoing enhancements and certain connected services for all future versions of these offerings. As a result of these changes, we recognize revenue for these QuickBooks Desktop software products as services are provided over approximately three years. Revenue in our Consumer Tax segment increased
9%
due to 2% growth in TurboTax federal units and a shift in mix to the higher end of our product lineup. Revenue in our ProConnect segment increased
2%
to
$437
million in fiscal
2017
. See
“Segment Results”
later in this Item 7 for more information.
Operating income from continuing operations increased
12%
in fiscal
2017
compared with fiscal
2016
due to the increase in revenue described above. Higher revenue was partially offset by higher costs and expenses. Total operating expenses increased about $152 million for staffing, about $85 million for advertising and other marketing programs, and about
$48
million for share-based compensation. See
“Operating Expenses”
later in this Item 7 for more information.
Net income from continuing operations increased
20%
in fiscal
2017
compared with fiscal
2016
due to the increase in operating income and a lower effective tax rate in the fiscal 2017 period. See
“Non-Operating Income and Expenses – Income Taxes”
later in this Item 7 for more information. Diluted net income per share from continuing operations for fiscal
2017
increased
22%
to
$3.72
as a result of the increase in net income and the decline in weighted average diluted common shares compared with fiscal 2016.
Fiscal
2016
Compared with Fiscal
2015
Total net revenue increased $502 million or 12% in fiscal 2016 compared with fiscal 2015. Total net revenue results were affected by the fiscal 2015 changes we made to our desktop software offerings described in
“Executive Overview – Overview of Financial Results”
earlier in this Item 7. Revenue in our Small Business segment increased 9% due to 25% growth in Small Business Online Ecosystem revenue and the impact of the changes to our QuickBooks Desktop software products. The fiscal 2015 changes to our desktop software offerings also affected our ProConnect segment, whose revenue increased 51% to $428 million in fiscal 2016. Revenue in our Consumer Tax segment increased 10% due to 12% growth in U.S. federal TurboTax units. See
“Segment Results”
later in this Item 7 for more information.
Operating income from continuing operations increased 68% in fiscal 2016 compared with fiscal 2015 due in part to the increase in revenue described above. Higher revenue was partially offset by higher costs and operating expenses. Total operating expenses increased about $28 million for staffing, about $26 million for depreciation, about $10 million for advertising and other marketing programs, and about $34 million for share-based compensation. In fiscal 2015, we recorded goodwill and intangible asset impairment charges of $148 million for our Consumer Ecosystem reporting unit in operating expense. See
“Operating Expenses”
later in this Item 7 for more information.
Net income from continuing operations increased 95% in fiscal 2016 compared with fiscal 2015 due to the increase in operating income and a lower effective tax rate in the fiscal 2016 period. See
“Non-Operating Income and Expenses – Income Taxes”
later in this Item 7 for more information. Diluted net income per share from continuing operations for fiscal 2016 increased 110% to $3.04 as a result of the increase in net income and the decline in weighted average diluted common shares compared with fiscal 2015.
34
|
Segment Results
|
The information below is organized in accordance with our three reportable segments. All of our segments operate primarily in the United States and sell primarily to customers in the United States. International total net revenue was less than 5% of consolidated total net revenue for all periods presented.
Segment operating income is segment net revenue less segment cost of revenue and operating expenses. Segment expenses do not include certain costs, such as corporate selling and marketing, product development, and general and administrative expenses and share-based compensation expenses, which are not allocated to specific segments. These unallocated costs totaled
$1.32 billion
in fiscal
2017
,
$1.18 billion
in fiscal
2016
, and
$1.02 billion
in fiscal
2015
. Unallocated costs increased in fiscal
2017
compared with fiscal
2016
and in fiscal
2016
compared with fiscal
2015
due to increases in corporate product development and selling and marketing expenses in support of the growth of our businesses and to higher share-based compensation expenses. Segment expenses also do not include amortization of acquired technology, amortization of other acquired intangible assets, and goodwill and intangible asset impairment charges. See Note 13 to the financial statements in Item 8 of this Annual Report for reconciliations of total segment operating income to consolidated operating income from continuing operations for each fiscal year presented.
We calculate revenue growth rates and segment operating margin figures using dollars in thousands. Those results may vary slightly from figures calculated using the dollars in millions presented.
35
|
Small Business
|

|
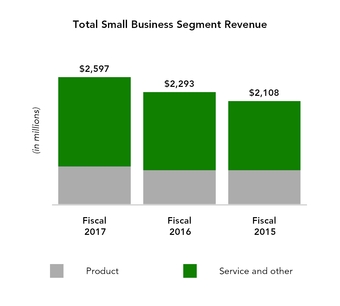
Small Business segment product revenue is derived primarily from QuickBooks Desktop software products, including Desktop Pro, Desktop for Mac, Desktop Premier, and Enterprise; QuickBooks Basic Payroll and QuickBooks Enhanced Payroll; QuickBooks Point of Sale solutions; ProAdvisor Program memberships for the accounting professionals who serve small businesses; and financial supplies.
Small Business segment service and other revenue is derived primarily from our QuickBooks Online and QuickBooks Self-Employed financial and business management offerings; QuickBooks Desktop Pro Plus, QuickBooks Desktop Premier Plus, and QuickBooks Enterprise with Hosting, our subscription offerings; QuickBooks Enterprise term licenses and QuickBooks technical support plans; small business payroll services, including QuickBooks Online Payroll, Intuit Online Payroll, QuickBooks Assisted Payroll, and Intuit Full Service Payroll; and payment processing services for small businesses.
|
(Dollars in millions)
|
Fiscal
2017
|
Fiscal
2016
|
Fiscal
2015 |
2017-2016
% Change
|
2016-2015
% Change
|
||||||||||||
|
Product revenue
|
$
|
789
|
|
$
|
709
|
|
$
|
709
|
|
|
|
||||||
|
Service and other revenue
|
1,808
|
|
1,584
|
|
1,399
|
|
|
|
|||||||||
|
Total segment revenue
|
$
|
2,597
|
|
$
|
2,293
|
|
$
|
2,108
|
|
13
|
%
|
9
|
%
|
||||
|
% of total revenue
|
50
|
%
|
49
|
%
|
50
|
%
|
|||||||||||
|
Segment operating income
|
$
|
1,075
|
|
$
|
894
|
|
$
|
709
|
|
20
|
%
|
26
|
%
|
||||
|
% of related revenue
|
41
|
%
|
39
|
%
|
34
|
%
|
|
|
|||||||||
Fiscal
2017
Compared with Fiscal
2016
Small Business Online Ecosystem
Small Business Online Ecosystem revenue of
$853 million
increased
30%
in fiscal 2017 compared with fiscal
2016
. The increase was driven by customer acquisition. At
July 31, 2017
QuickBooks Online subscribers were up
58%
compared with the same point in time a year ago. Online payroll customers were up
14%
, and active online payments customers were up
17%
. Online payments charge volume increased
19%
in fiscal 2017 compared with fiscal 2016.
Small Business Desktop Ecosystem
Small Business Desktop Ecosystem revenue of
$1.7 billion
increased
8%
in fiscal 2017 compared with fiscal
2016
. In fiscal 2017, QuickBooks Desktop, Enterprise, and Desktop Subscriptions revenue increased 32% due to the impact of changes to our QuickBooks Desktop software products described in “Financial Overview” above, and to QuickBooks Enterprise customer growth and price increases. QuickBooks Desktop units declined
8%
. Desktop payments revenue decreased
10%
, as we continued to focus resources on core offerings for QuickBooks merchants and deemphasized certain non-QuickBooks payments offerings.
Small Business segment total operating income as a percentage of related revenue increased in fiscal 2017 compared with fiscal 2016. This increase was due to the higher revenue described above partially offset by higher expenses for staffing, advertising and other marketing programs, and outside services.
Fiscal
2016
Compared with Fiscal
2015
Small Business Online Ecosystem
Small Business Online Ecosystem revenue of $657 million increased 25% in fiscal
2016
compared with fiscal 2015. The increase was driven by customer acquisition. At July 31, 2016 QuickBooks Online subscribers were up 41% compared with the same
36
point in time a year ago. Online payroll customers were up 17%, and active online payments customers were up 6%. Online payments charge volume increased 15% in fiscal 2017 compared with fiscal 2016.
Small Business Desktop Ecosystem
Small Business Desktop Ecosystem revenue of $1.6 billion increased 4% in fiscal
2016
compared with fiscal 2015. In fiscal
2016
, QuickBooks Desktop revenue increased due to 8% unit growth and the impact of the fiscal 2015 changes we made to our QuickBooks Desktop offerings. QuickBooks Enterprise revenue grew of 27%. Desktop payments revenue decreased 10%, as we continued to focus resources on core offerings for QuickBooks merchants and deemphasized certain non-QuickBooks payments offerings.
Small Business segment operating income as a percentage of related revenue increased in fiscal 2016 compared with fiscal 2015. The increase was due to the higher revenue described above and relatively stable spending during fiscal 2016.
37
|
Consumer Tax
|

|
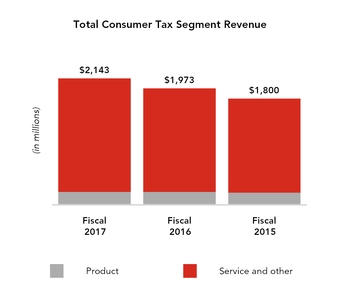
Consumer Tax segment product revenue is derived primarily from TurboTax desktop tax return preparation software.
Consumer Tax segment service and other revenue is derived primarily from TurboTax Online tax return preparation services and electronic tax filing services.
|
(Dollars in millions)
|
Fiscal
2017
|
Fiscal
2016
|
Fiscal
2015 |
2017-2016
% Change
|
2016-2015
% Change
|
||||||||||||
|
Product revenue
|
$
|
225
|
|
$
|
226
|
|
$
|
212
|
|
|
|
||||||
|
Service and other revenue
|
1,918
|
|
1,747
|
|
1,588
|
|
|
|
|||||||||
|
Total segment revenue
|
$
|
2,143
|
|
$
|
1,973
|
|
$
|
1,800
|
|
9
|
%
|
10
|
%
|
||||
|
% of total revenue
|
42
|
%
|
42
|
%
|
43
|
%
|
|||||||||||
|
Segment operating income
|
$
|
1,392
|
|
$
|
1,289
|
|
$
|
1,134
|
|
8
|
%
|
14
|
%
|
||||
|
% of related revenue
|
65
|
%
|
65
|
%
|
63
|
%
|
|
|
|||||||||
Fiscal
2017
Compared with Fiscal
2016
Revenue for our Consumer Tax segment increased
$170
million or
9%
in fiscal
2017
compared with fiscal
2016
due to 2% growth in TurboTax federal units and a shift in mix to the higher end of our product lineup.
Consumer Tax segment operating income as a percentage of related revenue was flat in fiscal
2017
compared with fiscal
2016
. Higher revenue was partially offset by higher expenses for advertising and other marketing programs and staffing.
Fiscal
2016
Compared with Fiscal
2015
Revenue for our Consumer Tax segment increased $173 million or 10% in fiscal 2016 compared with fiscal 2015 due to 12% growth in TurboTax U.S. federal units excluding Free File Alliance federal units. TurboTax Online U.S. federal units increased 15% in fiscal 2016. Online U.S. federal units represented approximately 84% of total TurboTax U.S. federal units for the 2015 tax season, up from approximately 82% for the 2014 tax season.
Consumer Tax segment operating income as a percentage of related revenue increased in fiscal 2016 compared with fiscal 2015 due to the higher revenue described above partially offset by higher expenses for staffing and advertising and other marketing programs in fiscal 2016.
38
|
ProConnect
|

|
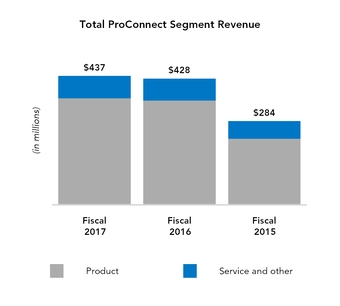
ProConnect segment product revenue is derived primarily from Lacerte, ProSeries, and ProFile desktop tax preparation software products.
ProConnect segment service and other revenue is derived primarily from ProConnect Tax Online tax return preparation, bank products, and related services that complement the tax return preparation process.
|
(Dollars in millions)
|
Fiscal
2017
|
Fiscal
2016
|
Fiscal
2015 |
2017-2016
% Change
|
2016-2015
% Change
|
||||||||||||
|
Product revenue
|
$
|
362
|
|
$
|
354
|
|
$
|
225
|
|
|
|
||||||
|
Service and other revenue
|
75
|
|
74
|
|
59
|
|
|
|
|||||||||
|
Total segment revenue
|
$
|
437
|
|
$
|
428
|
|
$
|
284
|
|
2
|
%
|
51
|
%
|
||||
|
% of total revenue
|
8
|
%
|
9
|
%
|
7
|
%
|
|||||||||||
|
Segment operating income
|
$
|
263
|
|
$
|
268
|
|
$
|
109
|
|
(2
|
%)
|
148
|
%
|
||||
|
% of related revenue
|
60
|
%
|
63
|
%
|
38
|
%
|
|
|
|||||||||
This segment targets professional accountants in the U.S. and Canada, who are essential to both small business success and tax preparation and filing.
Fiscal
2017
Compared with Fiscal
2016
ProConnect segment total net revenue increased
$9
million or
2%
in fiscal
2017
compared with fiscal
2016
. During fiscal 2017 we made a strategic decision to focus less on price increases and more on customer retention by delivering awesome products and a valuable end to end experience. This resulted in slower ProConnect revenue growth in fiscal 2017 than we have experienced historically.
ProConnect segment operating income as a percentage of related revenue decreased in fiscal
2017
compared with fiscal
2016
. Higher revenue was more than offset by higher staffing expenses.
Fiscal
2016
Compared with Fiscal
2015
ProConnect segment total net revenue increased $144 million or 51% in fiscal 2016 compared with fiscal 2015 due to the impact of the fiscal 2015 changes we made to our desktop software offerings. ProConnect customers grew about 1% in fiscal 2016 compared with fiscal 2015.
ProConnect segment operating income as a percentage of related revenue increased in fiscal 2016 compared with fiscal 2015 due to the revenue increase described above and relatively stable spending during fiscal 2016.
39
|
Cost of Revenue
|
||||||||||||||||||||
|
(Dollars in millions)
|
Fiscal
2017
|
% of
Related
Revenue
|
Fiscal
2016 |
% of
Related
Revenue
|
Fiscal
2015 |
% of
Related
Revenue
|
||||||||||||||
|
Cost of product revenue
|
$
|
120
|
|
9
|
%
|
$
|
131
|
|
10
|
%
|
$
|
139
|
|
12
|
%
|
|||||
|
Cost of service and other revenue
|
677
|
|
18
|
%
|
599
|
|
18
|
%
|
556
|
|
18
|
%
|
||||||||
|
Amortization of acquired technology
|
12
|
|
n/a
|
|
22
|
|
n/a
|
|
30
|
|
n/a
|
|
||||||||
|
Total cost of revenue
|
$
|
809
|
|
16
|
%
|
$
|
752
|
|
16
|
%
|
$
|
725
|
|
17
|
%
|
|||||
Our cost of revenue has three components: (1) cost of product revenue, which includes the direct costs of manufacturing and shipping or electronically downloading our desktop software products; (2) cost of service and other revenue, which reflects direct costs associated with providing services, including data center and support costs related to delivering online services; and (3) amortization of acquired technology, which represents the cost of amortizing developed technologies that we have obtained through acquisitions over their useful lives.
Cost of product revenue as a percentage of product revenue decreased slightly in fiscal
2017
compared with fiscal
2016
due to the fiscal 2015 changes we made to our QuickBooks and ProConnect desktop software products and a decrease in the number of desktop units shipped. Cost of product revenue decreased in fiscal 2016 compared with fiscal 2015 due to the fiscal 2015 changes we made to our QuickBooks and ProConnect desktop software products. We expense costs of product revenue as they are incurred for delivered software and we do not defer any of these costs when product revenue is deferred.
|
Operating Expenses
|
||||||||||||||||||||
|
(Dollars in millions)
|
Fiscal
2017
|
% of
Total
Net
Revenue
|
Fiscal
2016 |
% of
Total
Net
Revenue
|
Fiscal
2015 |
% of
Total
Net
Revenue
|
||||||||||||||
|
Selling and marketing
|
$
|
1,420
|
|
27
|
%
|
$
|
1,289
|
|
28
|
%
|
$
|
1,288
|
|
31
|
%
|
|||||
|
Research and development
|
998
|
|
19
|
%
|
881
|
|
19
|
%
|
798
|
|
19
|
%
|
||||||||
|
General and administrative
|
553
|
|
11
|
%
|
518
|
|
11
|
%
|
483
|
|
11
|
%
|
||||||||
|
Amortization of other acquired intangible assets
|
2
|
|
—
|
%
|
12
|
|
—
|
%
|
12
|
|
—
|
%
|
||||||||
|
Goodwill and intangible asset impairment charges
|
—
|
|
—
|
%
|
—
|
|
—
|
%
|
148
|
|
4
|
%
|
||||||||
|
Total operating expenses
|
$
|
2,973
|
|
57
|
%
|
$
|
2,700
|
|
58
|
%
|
$
|
2,729
|
|
65
|
%
|
|||||
Fiscal
2017
Compared with Fiscal
2016
Total operating expenses as a percentage of total net revenue decreased slightly in fiscal
2017
compared to fiscal
2016
. Total net revenue increased
$483
million or
10%
and total operating expenses increased
$273 million
. The increase in operating expenses was primarily driven by $152 million for higher staffing expenses due to higher headcount, $85 million for advertising and other marketing programs, and
$48
million for share-based compensation expenses. Share-based compensation expenses have been increasing over time because the total fair value of our share-based awards has generally been increasing.
Fiscal
2016
Compared with Fiscal
2015
Total operating expenses as a percentage of total net revenue decreased to 58% in fiscal 2016 from 65% in fiscal 2015. Total net revenue increased $502 million or 12% and total operating expenses increased $119 million, excluding the goodwill and intangible asset impairment charges in fiscal 2015. Total net revenue growth was affected by the fiscal 2015 changes we made to our desktop software offerings described in
“Executive Overview – Overview of Financial Results”
earlier in this Item 7. Operating expenses increased about $28 million for higher staffing expenses, about $26 million for depreciation, about $10 million for advertising and other marketing programs, and about $34 million for share-based compensation expenses. Fiscal 2015 general and administrative expenses were partially offset by a $32 million pre-tax net gain on the sale of certain assets related to our Payments business. Share-based compensation expenses were higher in fiscal 2016 due to our assumption of certain equity awards in connection with recent business combinations. Share-based compensation expenses have also been increasing over time because the market price of our common stock has generally been increasing.
40
|
Non-Operating Income and Expenses
|
Interest Expense
Interest expense of
$31
million in fiscal
2017
consisted primarily of interest on our senior notes, unsecured term loan, and unsecured revolving credit facility. Interest expense of
$35
million in fiscal
2016
consisted primarily of interest on our senior notes, unsecured term loan, and unsecured revolving credit facilities. Interest expense of
$27
million in fiscal
2015
consisted primarily of interest on our senior notes. See Note 7 and Note 8 to the financial statements in Item 8 of this Annual Report for more information.
Interest and Other Income (Expense), Net
|
(In millions)
|
Fiscal 2017
|
Fiscal 2016
|
Fiscal 2015
|
||||||||
|
Interest income
(1)
|
$
|
8
|
|
$
|
3
|
|
$
|
8
|
|
||
|
Net gain (loss) on executive deferred compensation plan assets
(2)
|
7
|
|
—
|
|
3
|
|
|||||
|
Other
|
(12
|
)
|
(7
|
)
|
(10
|
)
|
|||||
|
Total interest and other income (expense), net
|
$
|
3
|
|
$
|
(4
|
)
|
$
|
1
|
|
||
(1) Interest income in fiscal 2017 was higher compared with fiscal 2016 due to higher average interest rates and higher average invested balances. Interest income in fiscal 2016 was lower compared with fiscal 2015 due to lower average interest rates and lower average invested balances.
(
2) In accordance with authoritative guidance, we record gains and losses associated with executive deferred compensation plan assets in interest and other income and gains and losses associated with the related liabilities in operating expenses. The total amounts recorded in operating expenses for each period are approximately equal to the total amounts recorded in interest and other income in those periods.
Income Taxes
Effective Tax Rate
Our effective tax rates for fiscal
2017
, fiscal
2016
, and fiscal
2015
were approximately
29%
,
33%
, and
42%
. Excluding the tax effect related to share-based compensation tax benefits resulting from the adoption of ASU 2016-09, our effective tax rate for fiscal 2017 was approximately 34%. Excluding the tax effect related to the goodwill impairment charge, our effective tax rate for fiscal 2015 was approximately 36%. The differences between these effective tax rates and the federal statutory rate of 35% were not significant. See Note 9 to the financial statements in Item 8 of this Annual Report for more information about our effective tax rates.
Net Deferred Tax Assets
At
July 31, 2017
, we had net deferred tax assets of
$125
million which included a valuation allowance of $64 million for loss and tax credit carryforwards related to state tax credits, foreign losses, and state operating and capital losses. We recorded the valuation allowance to reflect uncertainties about whether we will be able to utilize some of our deferred tax assets before they expire. While we believe our current valuation allowance is sufficient, we could in the future be required to increase the valuation allowance to take into account additional deferred tax assets that we may be unable to realize. We assess the need for an adjustment to the valuation allowance on a quarterly basis. The assessment is based on our estimates of future sources of taxable income for the jurisdictions in which we operate and the periods over which our deferred tax assets will be realizable. See “
Critical Accounting Policies and Estimates
” earlier in this Item 7 and Note 9 to the financial statements in Item 8 of this Annual Report for more information.
Discontinued Operations
In the third quarter of fiscal 2016 we sold our Demandforce, QuickBase, and Quicken businesses for $463 million in cash. We recorded a pre-tax gain of $354 million and a net gain of $173 million on the disposal of these three businesses in fiscal 2016. We have reclassified our statements of operations for all periods presented to reflect these businesses as discontinued operations. See Note 6 to the financial statements in Item 8 of this Annual Report for a more complete description of these discontinued operations and the impact that they have had on our statements of operations for the fiscal periods presented.
41
|
LIQUIDITY AND CAPITAL RESOURCES
|
|
Overview
|
At
July 31, 2017
, our cash, cash equivalents and investments totaled
$777 million
, a decrease of
$303
million from
July 31, 2016
due to the factors described in
“Statements of Cash Flows”
below. Our primary sources of liquidity have been cash from operations, which entails the collection of accounts receivable for products and services, and borrowings under our credit facilities. Our primary uses of cash have been for research and development programs, selling and marketing activities, capital projects, acquisitions of businesses, debt service costs and debt repayment, repurchases of our common stock under our stock repurchase programs, and the payment of cash dividends. As discussed in
“Executive Overview – Industry Trends and Seasonality”
earlier in this Item 7, our business is subject to significant seasonality. The balance of our cash, cash equivalents and investments generally fluctuates with that seasonal pattern. We believe the seasonality of our business is likely to continue in the future.
The following table summarizes selected measures of our liquidity and capital resources at the dates indicated:
|
(Dollars in millions)
|
July 31,
2017 |
July 31,
2016 |
$
Change
|
%
Change
|
||||||||||
|
Cash, cash equivalents and investments
|
$
|
777
|
|
$
|
1,080
|
|
$
|
(303
|
)
|
(28
|
)%
|
|||
|
Long-term investments
|
31
|
|
28
|
|
3
|
|
11
|
%
|
||||||
|
Short-term debt
|
50
|
|
512
|
|
(462
|
)
|
(90
|
)%
|
||||||
|
Long-term debt
|
438
|
|
488
|
|
(50
|
)
|
(10
|
)%
|
||||||
|
Working capital (deficit)
|
(529
|
)
|
(637
|
)
|
108
|
|
(17
|
)%
|
||||||
|
Ratio of current assets to current liabilities
|
0.7 : 1
|
|
0.7 : 1
|
|
|
|
||||||||
We have historically generated significant cash from operations and we expect to continue to do so during fiscal
2018
. Our cash, cash equivalents, and investments totaled
$777 million
at
July 31, 2017
, none of those funds were restricted, and approximately
68%
of those funds were located in the U.S. Our unsecured revolving credit facility is available to us for general corporate purposes, including future acquisitions and share repurchases. At
July 31, 2017
, no amounts were outstanding under the revolving credit facility. See Note 7 to the financial statements in Item 8 of this Annual Report for more information. In August 2017, we borrowed $285 million under the revolving credit facility for general corporate purposes and share repurchases, as our cash balance in the first fiscal quarter is seasonally low.
We evaluate, on an ongoing basis, the merits of acquiring technology or businesses, or establishing strategic relationships with and investing in other companies. Our strong liquidity profile enables us to respond nimbly to these kinds of opportunities.
Based on past performance and current expectations, we believe that our cash and cash equivalents, investments, and cash generated from operations will be sufficient to meet anticipated seasonal working capital needs, capital expenditure requirements, contractual obligations, commitments, debt service requirements, and other liquidity requirements associated with our operations for at least the next 12 months. We expect to return excess cash generated by operations to our stockholders through repurchases of our common stock and payment of cash dividends, after taking into account our operating and strategic cash needs.
|
Statements of Cash Flows
|
The following table summarizes selected items from our statements of cash flows for fiscal
2017
, fiscal
2016
, and fiscal
2015
. See the financial statements in Item 8 of this Annual Report for complete statements of cash flows for those periods.
|
Fiscal
|
Fiscal
|
Fiscal
|
|||||||||
|
(Dollars in millions)
|
2017
|
2016
|
2015
|
||||||||
|
Net cash provided by (used in):
|
|
|
|
||||||||
|
Operating activities
|
$
|
1,599
|
|
$
|
1,460
|
|
$
|
1,589
|
|
||
|
Investing activities
|
(85
|
)
|
371
|
|
(182
|
)
|
|||||
|
Financing activities
|
(1,632
|
)
|
(1,999
|
)
|
(1,422
|
)
|
|||||
|
Effect of exchange rates on cash and cash equivalents
|
9
|
|
(2
|
)
|
(26
|
)
|
|||||
|
Net decrease in cash and cash equivalents
|
$
|
(109
|
)
|
$
|
(170
|
)
|
$
|
(41
|
)
|
||
During fiscal
2017
we generated
$1.6
billion in cash from operations. We also received
$190 million
in cash from net sales of investments,
$150 million
from borrowings under our revolving credit facility, and
$73 million
from the issuance of common
42
stock under employee stock plans. During the same period we used
$662 million
in cash for the repayment of debt and amounts outstanding under our revolving credit facility,
$839 million
for the repurchase of shares of our common stock under our stock repurchase programs,
$353 million
for the payment of cash dividends, and
$230 million
for capital expenditures.
During fiscal 2016 we generated $1.5 billion in cash from operations. We also received $500 million in proceeds from our term loan, $463 million from the sales of our Demandforce, QuickBase, and Quicken businesses, $418 million from net sales of investments, and $89 million in cash from the issuance of common stock under employee stock plans. During the same period we used $2.3 billion in cash for the repurchase of shares of our common stock under our stock repurchase programs, $318 million for the payment of cash dividends, and $522 million for capital expenditures, including the purchase of certain previously leased facilities.
During fiscal 2015 we generated $1.6 billion in cash from operations. We also received $107 million in cash from the issuance of common stock under employee stock plans and $156 million from net sales of investments. During the same period we used $1.2 billion in cash for the repurchase of shares of our common stock under our stock repurchase programs, $283 million for the payment of cash dividends, and $261 million for capital expenditures.
|
Stock Repurchase Programs and Dividends on Common Stock
|
As described in Note 10 to the financial statements in Item 8 of this Annual Report, during fiscal
2017
, fiscal
2016
, and fiscal
2015
we continued to repurchase shares of our common stock under a series of repurchase programs that our Board of Directors has authorized. At
July 31, 2017
, we had authorization from our Board of Directors to expend up to an additional
$1.5 billion
for stock repurchases.
During fiscal
2017
, fiscal
2016
, and fiscal
2015
we also continued to pay quarterly cash dividends on shares of our outstanding common stock. In August
2017
our Board of Directors declared a quarterly cash dividend of
$0.39
per share of outstanding common stock payable on
October 18, 2017
to stockholders of records at the close of business on
October 10, 2017
. We currently expect to continue paying comparable cash dividends on a quarterly basis; however, future declarations of dividends and the establishment of future record dates and payment dates are subject to the final determination of our Board of Directors.
|
Credit Facilities
|
On February 1, 2016 we entered into a master credit agreement with certain institutional lenders for a five-year credit facility in an aggregate principal amount of $1.5 billion. The master credit agreement includes a $500 million unsecured term loan and a $1 billion unsecured revolving credit facility that will expire on February 1, 2021. Under the master credit agreement we may, subject to certain customary conditions, on one or more occasions increase commitments under the revolving credit facility in an amount not to exceed $250 million in the aggregate and may extend the maturity date up to two times. Advances under the revolving credit facility accrue interest at rates that are equal to, at our election, either Bank of America's alternate base rate plus a margin that ranges from 0.0% to 0.5% or the London Interbank Offered Rate (LIBOR) plus a margin that ranges from 0.9% to 1.5%. Actual margins under either election will be based on our senior debt credit ratings. At
July 31, 2017
, no amounts were outstanding under the revolving credit facility. We monitor counterparty risk associated with the institutional lenders that are providing the credit facility. We currently believe that the credit facility will be available to us should we choose to borrow under it.
Under the master credit agreement, we borrowed $500 million in the form of an unsecured term loan on February 1, 2016. We may, subject to certain customary conditions, on one or more occasions increase commitments under the term loan in an amount not to exceed $500 million in the aggregate. The term loan accrues interest at rates that are equal to, at our election, either Bank of America's alternate base rate plus a margin that ranges from 0.125% to 0.875% or LIBOR plus a margin that ranges from 1.125% to 1.875%. Actual margins under either election will be based on our senior debt credit ratings. The term loan is subject to quarterly principal payments of 2.5% of the loan amount which began in July 2017, with the balance payable on February 1, 2021. At
July 31, 2017
,
$488 million
was outstanding under the term loan.
The master credit agreement includes customary affirmative and negative covenants, including financial covenants that require us to maintain a ratio of total debt to annual earnings before interest, taxes, depreciation and amortization (EBITDA) of not greater than 3.25 to 1.00 as of any date and a ratio of annual EBITDA to annual interest expense of not less than 3.00 to 1.00 as of the last day of each fiscal quarter. We remained in compliance with these covenants at all times during the quarter ended
July 31, 2017
.
43
|
Cash Held by Foreign Subsidiaries
|
Our cash, cash equivalents and investments totaled
$777 million
at
July 31, 2017
. Of this amount, approximately
32%
was held by our foreign subsidiaries and subject to repatriation tax considerations. These foreign funds were located primarily in Canada and India. We intend to permanently reinvest a significant portion of our earnings from foreign operations, and we currently do not anticipate that we will need funds generated from foreign operations to fund our domestic operations. In the event that funds from foreign operations are needed to fund operations in the United States, if U.S. taxes have not been previously provided on the related earnings we would provide for and pay additional U.S. taxes at the time we change our intention with regard to the reinvestment of those earnings.
|
OFF-BALANCE SHEET ARRANGEMENTS
|
At
July 31, 2017
, we did not have any significant off-balance sheet arrangements, as defined in Item 303(a)(4)(ii) of Regulation S-K.
|
CONTRACTUAL OBLIGATIONS
|
The following table summarizes our known contractual obligations to make future payments at
July 31, 2017
:
|
Payments Due by Period
|
|||||||||||||||||||
|
|
Less than
|
1-3
|
3-5
|
More than
|
|
||||||||||||||
|
(In millions)
|
1 year
|
years
|
years
|
5 years
|
Total
|
||||||||||||||
|
Amounts due under executive deferred compensation plan
|
$
|
83
|
|
$
|
—
|
|
$
|
—
|
|
$
|
—
|
|
$
|
83
|
|
||||
|
Unsecured term loan
|
50
|
|
100
|
|
338
|
|
—
|
|
488
|
|
|||||||||
|
Interest and fees due on debt
|
10
|
|
19
|
|
4
|
|
—
|
|
33
|
|
|||||||||
|
License fee payable (1)
|
10
|
|
10
|
|
—
|
|
—
|
|
20
|
|
|||||||||
|
Operating leases (2)
|
61
|
|
100
|
|
93
|
|
130
|
|
384
|
|
|||||||||
|
Purchase obligations (3)
|
63
|
|
66
|
|
19
|
|
—
|
|
148
|
|
|||||||||
|
Total contractual obligations (4)
|
$
|
277
|
|
$
|
295
|
|
$
|
454
|
|
$
|
130
|
|
$
|
1,156
|
|
||||
_____________________
|
(1)
|
In May 2009 we entered into an agreement to license certain technology for $20 million in cash and $100 million payable over ten fiscal years. See Note 8 to the financial statements in Item 8 of this Annual Report for more information.
|
|
(2)
|
Includes operating leases for facilities and equipment. Amounts do not include
$87 million
of future sublease income. We had no significant capital leases at
July 31, 2017
. See Note 8 to the financial statements in Item 8 of this Annual Report for more information.
|
|
(3)
|
Represents agreements to purchase products and services that are enforceable, legally binding and specify terms, including: fixed or minimum quantities to be purchased; fixed, minimum or variable price provisions; and the approximate timing of the payments.
|
|
(4)
|
Other long-term obligations on our balance sheet at
July 31, 2017
included long-term income tax liabilities of
$53 million
which related primarily to unrecognized tax benefits. We have not included this amount in the table above because we cannot make a reasonably reliable estimate regarding the timing of settlements with taxing authorities, if any.
|
|
RECENT ACCOUNTING PRONOUNCEMENTS
|
For a description of recent accounting pronouncements and the potential impact of these pronouncements on our consolidated financial statements, see Note 1 to the financial statements in Item 8 of this Annual Report.
44
|
|
Investment Portfolio and Interest Rate Risk
We actively monitor market conditions and developments specific to the securities in which we invest. We believe that we take a conservative approach to investing our funds in that we invest only in highly-rated securities and diversify our portfolio of investments. While we believe we take prudent measures to mitigate investment-related risks, such risks cannot be fully eliminated because of market circumstances that are outside our control.
Our investments consist of instruments that meet quality standards that are consistent with our investment policy. This policy specifies that, except for direct obligations of the United States government, securities issued by agencies of the United States government, and money market funds, we diversify our investments by limiting our holdings with any individual issuer. We do not hold derivative financial instruments or European sovereign debt in our portfolio of investments. See Note 2 and Note 3 to the financial statements in Item 8 of this Annual Report for a summary of the amortized cost and fair value of our investments by type of issue.
Our cash equivalents and investments are subject to market risk due to changes in interest rates. Interest rate movements affect the interest income we earn on cash equivalents and investments and the value of those investments. At
July 31, 2017
, our cash equivalents and investments totaled
$644 million
and had a weighted average pre-tax yield of
1.47%
. Total interest income for fiscal
2017
was
$8 million
. If the Federal Reserve Target Rate had increased by 25 basis points from the level of
July 31, 2017
, the value of our investments at that date would have decreased by approximately
$1
million. If the Federal Reserve Target Rate had increased by 100 basis points from the level of
July 31, 2017
, the value of our investments at that date would have decreased by approximately
$4
million.
We are also exposed to the impact of changes in interest rates as they affect our $1 billion unsecured revolving credit facility and $500 million unsecured term loan. Advances under the revolving credit facility accrue interest at rates that are equal to Bank of America’s alternate base rate plus a margin that ranges from
0.0%
to
0.5%
or the London InterBank Offered Rate (LIBOR) plus a margin that ranges from
0.9%
to
1.5%
. The term loan accrues interest at rates that are equal to, at our election, either Bank of America's alternate base rate plus a margin that ranges from 0.125% to 0.875% or LIBOR plus a margin that ranges from 1.125% to 1.875%. Actual margins under all of these elections are based on our senior debt credit ratings. Consequently, our interest expense fluctuates with changes in the general level of these interest rates. At
July 31, 2017
no amounts were outstanding under the revolving credit facility and
$488 million
was outstanding under the term loan. See Note 7 and Note 8 to the financial statements in Item 8 of this Annual Report for more information.
Impact of Foreign Currency Rate Changes
The functional currencies of our international operating subsidiaries are generally the local currencies. We translate the assets and liabilities of our foreign subsidiaries at the exchange rates in effect on the balance sheet date. We translate their revenue, costs and expenses at the average rates of exchange in effect during the period. We include translation gains and losses in the stockholders’ equity section of our balance sheets. We include net gains and losses resulting from foreign exchange transactions in interest and other income in our statements of operations.
Since we translate foreign currencies (primarily Canadian dollars, Indian rupees, and British pounds) into U.S. dollars for financial reporting purposes, currency fluctuations can have an impact on our financial results. The historical impact of currency fluctuations on our financial results has generally been immaterial. We believe that our exposure to currency exchange fluctuation risk is not significant primarily because our global subsidiaries invoice customers and satisfy their financial obligations almost exclusively in their local currencies. Although the impact of currency fluctuations on our financial results has generally been immaterial in the past and we believe that for the reasons cited above currency fluctuations will not be significant in the future, the impact of currency fluctuations could be material in the future. As of
July 31, 2017
, we did not engage in foreign currency hedging activities.
45
|
|
|
1.
|
INDEX TO CONSOLIDATED FINANCIAL STATEMENTS
|
The following financial statements are filed as part of this Report:
|
|
Page
|
|
|
|
|
|
|
|
|
|
|
|
|
|
|
|
|
2.
|
INDEX TO FINANCIAL STATEMENT SCHEDULES
|
The following financial statement schedule is filed as part of this Report and should be read in conjunction with the Consolidated Financial Statements:
|
Schedule
|
Page
|
||
|
|
All other schedules not listed above have been omitted because they are inapplicable or are not required.
|
|
46
REPORT OF INDEPENDENT REGISTERED PUBLIC ACCOUNTING FIRM
The Board of Directors and Stockholders of Intuit Inc.
We have audited the accompanying consolidated balance sheets of Intuit Inc. as of July 31, 2017 and 2016, and the related consolidated statements of operations, comprehensive income, stockholders' equity and cash flows for each of the three years in the period ended July 31, 2017. Our audits also included the financial statement schedule listed in the Index at Item 15(a). These financial statements and schedule are the responsibility of the Company's management. Our responsibility is to express an opinion on these financial statements and schedule based on our audits.
We conducted our audits in accordance with the standards of the Public Company Accounting Oversight Board (United States). Those standards require that we plan and perform the audit to obtain reasonable assurance about whether the financial statements are free of material misstatement. An audit includes examining, on a test basis, evidence supporting the amounts and disclosures in the financial statements. An audit also includes assessing the accounting principles used and significant estimates made by management, as well as evaluating the overall financial statement presentation. We believe that our audits provide a reasonable basis for our opinion.
In our opinion, the financial statements referred to above present fairly, in all material respects, the consolidated financial position of Intuit Inc. at July 31, 2017 and 2016, and the consolidated results of its operations and its cash flows for each of the three years in the period ended July 31, 2017, in conformity with U.S. generally accepted accounting principles. Also, in our opinion, the related financial statement schedule, when considered in relation to the basic financial statements taken as a whole, presents fairly in all material respects the information set forth therein.
We also have audited, in accordance with the standards of the Public Company Accounting Oversight Board (United States), Intuit Inc.’s internal control over financial reporting as of July 31, 2017, based on criteria established in Internal Control-Integrated Framework issued by the Committee of Sponsoring Organizations of the Treadway Commission (2013 framework), and our report dated September 1, 2017 expressed an unqualified opinion thereon.
/s/ Ernst & Young LLP
San Jose, California
September 1, 2017
47
REPORT OF INDEPENDENT REGISTERED PUBLIC ACCOUNTING FIRM
The Board of Directors and Stockholders of Intuit Inc.
We have audited Intuit Inc.’s internal control over financial reporting as of July 31, 2017, based on criteria established in Internal Control-Integrated Framework issued by the Committee of Sponsoring Organizations of the Treadway Commission (2013 framework), (the COSO criteria). Intuit Inc.’s management is responsible for maintaining effective internal control over financial reporting, and for its assessment of the effectiveness of internal control over financial reporting included in the accompanying Management’s Report on Internal Control over Financial Reporting. Our responsibility is to express an opinion on the company’s internal control over financial reporting based on our audit.
We conducted our audit in accordance with the standards of the Public Company Accounting Oversight Board (United States). Those standards require that we plan and perform the audit to obtain reasonable assurance about whether effective internal control over financial reporting was maintained in all material respects. Our audit included obtaining an understanding of internal control over financial reporting, assessing the risk that a material weakness exists, testing and evaluating the design and operating effectiveness of internal control based on the assessed risk, and performing such other procedures as we considered necessary in the circumstances. We believe that our audit provides a reasonable basis for our opinion.
A company’s internal control over financial reporting is a process designed to provide reasonable assurance regarding the reliability of financial reporting and the preparation of financial statements for external purposes in accordance with generally accepted accounting principles. A company’s internal control over financial reporting includes those policies and procedures that (1) pertain to the maintenance of records that, in reasonable detail, accurately and fairly reflect the transactions and dispositions of the assets of the company; (2) provide reasonable assurance that transactions are recorded as necessary to permit preparation of financial statements in accordance with generally accepted accounting principles, and that receipts and expenditures of the company are being made only in accordance with authorizations of management and directors of the company; and (3) provide reasonable assurance regarding prevention or timely detection of unauthorized acquisition, use, or disposition of the company’s assets that could have a material effect on the financial statements.
Because of its inherent limitations, internal control over financial reporting may not prevent or detect misstatements. Also, projections of any evaluation of effectiveness to future periods are subject to the risk that controls may become inadequate because of changes in conditions, or that the degree of compliance with the policies or procedures may deteriorate.
In our opinion, Intuit Inc. maintained, in all material respects, effective internal control over financial reporting as of July 31, 2017, based on the COSO criteria.
We also have audited, in accordance with the standards of the Public Company Accounting Oversight Board (United States), the consolidated balance sheets of Intuit Inc. as of July 31, 2017 and 2016, and the related consolidated statements of operations, comprehensive income, stockholders' equity and cash flows for each of the three years in the period ended July 31, 2017 of Intuit Inc. and our report dated September 1, 2017 expressed an unqualified opinion thereon.
/s/ Ernst & Young LLP
San Jose, California
September 1, 2017
48
|
INTUIT INC.
CONSOLIDATED STATEMENTS OF OPERATIONS
|
|||||||||||
|
|
Twelve Months Ended July 31,
|
||||||||||
|
(In millions, except per share amounts)
|
2017
|
2016
|
2015
|
||||||||
|
Net revenue:
|
|
|
|||||||||
|
Product
|
$
|
|
|
$
|
|
|
$
|
|
|
||
|
Service and other
|
|
|
|
|
|
|
|||||
|
Total net revenue
|
|
|
|
|
|
|
|||||
|
Costs and expenses:
|
|
|
|
||||||||
|
Cost of revenue:
|
|
|
|
||||||||
|
Cost of product revenue
|
|
|
|
|
|
|
|||||
|
Cost of service and other revenue
|
|
|
|
|
|
|
|||||
|
Amortization of acquired technology
|
|
|
|
|
|
|
|||||
|
Selling and marketing
|
|
|
|
|
|
|
|||||
|
Research and development
|
|
|
|
|
|
|
|||||
|
General and administrative
|
|
|
|
|
|
|
|||||
|
Amortization of other acquired intangible assets
|
|
|
|
|
|
|
|||||
|
Goodwill and intangible asset impairment charges
|
|
|
|
|
|
|
|||||
|
Total costs and expenses
|
|
|
|
|
|
|
|||||
|
Operating income from continuing operations
|
|
|
|
|
|
|
|||||
|
Interest expense
|
(
|
)
|
(
|
)
|
(
|
)
|
|||||
|
Interest and other income (expense), net
|
|
|
(
|
)
|
|
|
|||||
|
Income from continuing operations before income taxes
|
|
|
|
|
|
|
|||||
|
Income tax provision
|
|
|
|
|
|
|
|||||
|
Net income from continuing operations
|
|
|
|
|
|
|
|||||
|
Net income (loss) from discontinued operations
|
|
|
|
|
(
|
)
|
|||||
|
Net income
|
$
|
|
|
$
|
|
|
$
|
|
|
||
|
Basic net income per share from continuing operations
|
$
|
|
|
$
|
|
|
$
|
|
|
||
|
Basic net income (loss) per share from discontinued operations
|
|
|
|
|
(
|
)
|
|||||
|
Basic net income per share
|
$
|
|
|
$
|
|
|
$
|
|
|
||
|
Shares used in basic per share calculations
|
|
|
|
|
|
|
|||||
|
Diluted net income per share from continuing operations
|
$
|
|
|
$
|
|
|
$
|
|
|
||
|
Diluted net income (loss) per share from discontinued operations
|
|
|
|
|
(
|
)
|
|||||
|
Diluted net income per share
|
$
|
|
|
$
|
|
|
$
|
|
|
||
|
Shares used in diluted per share calculations
|
|
|
|
|
|
|
|||||
|
Cash dividends declared per common share
|
$
|
|
|
$
|
|
|
$
|
|
|
||
See accompanying notes.
49
|
INTUIT INC.
CONSOLIDATED STATEMENTS OF COMPREHENSIVE INCOME
|
|||||||||||
|
|
Twelve Months Ended July 31,
|
||||||||||
|
(In millions)
|
2017
|
2016
|
2015
|
||||||||
|
Net income
|
$
|
|
|
$
|
|
|
$
|
|
|
||
|
Other comprehensive income (loss), net of income taxes:
|
|||||||||||
|
Unrealized gain (loss) on available-for-sale debt securities
|
(
|
)
|
|
|
(
|
)
|
|||||
|
Foreign currency translation gain (loss)
|
|
|
(
|
)
|
(
|
)
|
|||||
|
Total other comprehensive income (loss), net
|
|
|
(
|
)
|
(
|
)
|
|||||
|
Comprehensive income
|
$
|
|
|
$
|
|
|
$
|
|
|
||
See accompanying notes.
50
|
INTUIT INC.
CONSOLIDATED BALANCE SHEETS
|
|||||||
|
|
July 31,
|
||||||
|
(Dollars in millions, except par value; shares in thousands)
|
2017
|
2016
|
|||||
|
ASSETS
|
|
|
|||||
|
Current assets:
|
|
|
|||||
|
Cash and cash equivalents
|
$
|
|
|
$
|
|
|
|
|
Investments
|
|
|
|
|
|||
|
Accounts receivable, net of allowance for doubtful accounts of $46 and $51
|
|
|
|
|
|||
|
Income taxes receivable
|
|
|
|
|
|||
|
Prepaid expenses and other current assets
|
|
|
|
|
|||
|
Current assets before funds held for customers
|
|
|
|
|
|||
|
Funds held for customers
|
|
|
|
|
|||
|
Total current assets
|
|
|
|
|
|||
|
Long-term investments
|
|
|
|
|
|||
|
Property and equipment, net
|
|
|
|
|
|||
|
Goodwill
|
|
|
|
|
|||
|
Acquired intangible assets, net
|
|
|
|
|
|||
|
Long-term deferred income taxes
|
|
|
|
|
|||
|
Other assets
|
|
|
|
|
|||
|
Total assets
|
$
|
|
|
$
|
|
|
|
|
LIABILITIES AND STOCKHOLDERS’ EQUITY
|
|
|
|||||
|
Current liabilities:
|
|
|
|||||
|
Short-term debt
|
$
|
|
|
$
|
|
|
|
|
Accounts payable
|
|
|
|
|
|||
|
Accrued compensation and related liabilities
|
|
|
|
|
|||
|
Deferred revenue
|
|
|
|
|
|||
|
Other current liabilities
|
|
|
|
|
|||
|
Current liabilities before customer fund deposits
|
|
|
|
|
|||
|
Customer fund deposits
|
|
|
|
|
|||
|
Total current liabilities
|
|
|
|
|
|||
|
Long-term debt
|
|
|
|
|
|||
|
Long-term deferred revenue
|
|
|
|
|
|||
|
Other long-term obligations
|
|
|
|
|
|||
|
Total liabilities
|
|
|
|
|
|||
|
Commitments and contingencies
|
|
|
|||||
|
Stockholders’ equity:
|
|
|
|||||
|
Preferred stock, $0.01 par value
Authorized - 1,345 shares total; 145 shares designated Series A;
250 shares designated Series B Junior Participating
Issued and outstanding - None
|
|
|
|
|
|||
|
Common stock, $0.01 par value
Authorized - 750,000 shares
Outstanding - 255,668 shares at July 31, 2017 and 257,853 shares at July 31, 2016
|
|
|
|
|
|||
|
Additional paid-in capital
|
|
|
|
|
|||
|
Treasury stock, at cost
|
(
|
)
|
(
|
)
|
|||
|
Accumulated other comprehensive loss
|
(
|
)
|
(
|
)
|
|||
|
Retained earnings
|
|
|
|
|
|||
|
Total stockholders’ equity
|
|
|
|
|
|||
|
Total liabilities and stockholders’ equity
|
$
|
|
|
$
|
|
|
|
See accompanying notes.
51
|
INTUIT INC.
CONSOLIDATED STATEMENTS OF STOCKHOLDERS’ EQUITY
|
||||||||||||||||||||
|
|
Common Stock
|
Additional
Paid-In Capital
|
Treasury Stock
|
Accumulated
Other
Comprehensive Loss
|
Retained Earnings
|
Total
Stockholders’ Equity
|
||||||||||||||
|
(Dollars in millions, shares in thousands)
|
Shares
|
Amount
|
||||||||||||||||||
|
Balance at July 31, 2014
|
|
|
$
|
|
|
$
|
|
|
$
|
(
|
)
|
$
|
(
|
)
|
$
|
|
|
$
|
|
|
|
Comprehensive income
|
—
|
|
—
|
|
—
|
|
—
|
|
(
|
)
|
|
|
|
|
||||||
|
Issuance of stock under employee stock plans, net of shares withheld for employee taxes
|
|
|
—
|
|
|
|
—
|
|
—
|
|
—
|
|
|
|
||||||
|
Stock repurchases under stock repurchase programs
|
(
|
)
|
—
|
|
—
|
|
(
|
)
|
—
|
|
—
|
|
(
|
)
|
||||||
|
Dividends and dividend rights declared ($1.00 per share)
|
—
|
|
—
|
|
—
|
|
—
|
|
—
|
|
(
|
)
|
(
|
)
|
||||||
|
Tax benefit from share-based compensation plans
|
—
|
|
—
|
|
|
|
—
|
|
—
|
|
—
|
|
|
|
||||||
|
Share-based compensation expense
|
—
|
|
—
|
|
|
|
—
|
|
—
|
|
—
|
|
|
|
||||||
|
Balance at July 31, 2015
|
|
|
|
|
|
|
(
|
)
|
(
|
)
|
|
|
|
|
||||||
|
Comprehensive income
|
—
|
|
—
|
|
—
|
|
—
|
|
(
|
)
|
|
|
|
|
||||||
|
Issuance of stock under employee stock plans, net of shares withheld for employee taxes
|
|
|
—
|
|
|
|
—
|
|
—
|
|
—
|
|
|
|
||||||
|
Stock repurchases under stock repurchase programs
|
(
|
)
|
—
|
|
—
|
|
(
|
)
|
—
|
|
—
|
|
(
|
)
|
||||||
|
Dividends and dividend rights declared ($1.20 per share)
|
—
|
|
—
|
|
—
|
|
—
|
|
—
|
|
(
|
)
|
(
|
)
|
||||||
|
Tax benefit from share-based compensation plans
|
—
|
|
—
|
|
|
|
—
|
|
—
|
|
—
|
|
|
|
||||||
|
Share-based compensation expense
|
—
|
|
—
|
|
|
|
—
|
|
—
|
|
—
|
|
|
|
||||||
|
Balance at July 31, 2016
|
|
|
|
|
|
|
(
|
)
|
(
|
)
|
|
|
|
|
||||||
|
Comprehensive income
|
—
|
|
—
|
|
—
|
|
—
|
|
|
|
|
|
|
|
||||||
|
Issuance of stock under employee stock plans, net of shares withheld for employee taxes
|
|
|
—
|
|
|
|
—
|
|
—
|
|
—
|
|
|
|
||||||
|
Stock repurchases under stock repurchase programs
|
(
|
)
|
—
|
|
—
|
|
(
|
)
|
—
|
|
—
|
|
(
|
)
|
||||||
|
Dividends and dividend rights declared ($1.36 per share)
|
—
|
|
—
|
|
—
|
|
—
|
|
—
|
|
(
|
)
|
(
|
)
|
||||||
|
Cumulative effect of change in accounting principle
|
—
|
|
—
|
|
|
|
—
|
|
—
|
|
(
|
)
|
|
|
||||||
|
Share-based compensation expense
|
—
|
|
—
|
|
|
|
—
|
|
—
|
|
—
|
|
|
|
||||||
|
Balance at July 31, 2017
|
|
|
$
|
|
|
$
|
|
|
$
|
(
|
)
|
$
|
(
|
)
|
$
|
|
|
$
|
|
|
See accompanying notes.
52
|
INTUIT INC.
CONSOLIDATED STATEMENTS OF CASH FLOWS
|
|||||||||||
|
|
Twelve Months Ended July 31,
|
||||||||||
|
(In millions)
|
2017
|
|
2016
|
|
2015
|
||||||
|
Cash flows from operating activities:
|
|
|
|
||||||||
|
Net income
|
$
|
|
|
$
|
|
|
$
|
|
|
||
|
Adjustments to reconcile net income to net cash provided by operating activities:
|
|
|
|||||||||
|
Depreciation
|
|
|
|
|
|
|
|||||
|
Amortization of acquired intangible assets
|
|
|
|
|
|
|
|||||
|
Goodwill and intangible asset impairment charges
|
|
|
|
|
|
|
|||||
|
Share-based compensation expense
|
|
|
|
|
|
|
|||||
|
Pre-tax gain on sale of discontinued operations (1)
|
|
|
(
|
)
|
|
|
|||||
|
Deferred income taxes
|
|
|
|
|
(
|
)
|
|||||
|
Tax benefit from share-based compensation plans
|
|
|
|
|
|
|
|||||
|
Other
|
|
|
|
|
|
|
|||||
|
Total adjustments
|
|
|
|
|
|
|
|||||
|
Changes in operating assets and liabilities:
|
|
|
|
||||||||
|
Accounts receivable
|
|
|
(
|
)
|
|
|
|||||
|
Income taxes receivable
|
(
|
)
|
|
|
(
|
)
|
|||||
|
Prepaid expenses and other assets
|
(
|
)
|
(
|
)
|
|
|
|||||
|
Accounts payable
|
|
|
(
|
)
|
|
|
|||||
|
Accrued compensation and related liabilities
|
|
|
(
|
)
|
|
|
|||||
|
Deferred revenue
|
|
|
|
|
|
|
|||||
|
Other liabilities
|
|
|
(
|
)
|
(
|
)
|
|||||
|
Total changes in operating assets and liabilities
|
|
|
|
|
|
|
|||||
|
Net cash provided by operating activities
|
|
|
|
|
|
|
|||||
|
Cash flows from investing activities:
|
|
|
|
||||||||
|
Purchases of corporate and customer fund investments
|
(
|
)
|
(
|
)
|
(
|
)
|
|||||
|
Sales of corporate and customer fund investments
|
|
|
|
|
|
|
|||||
|
Maturities of corporate and customer fund investments
|
|
|
|
|
|
|
|||||
|
Net change in cash and cash equivalents held to satisfy customer fund obligations
|
(
|
)
|
|
|
(
|
)
|
|||||
|
Net change in customer fund deposits
|
|
|
(
|
)
|
|
|
|||||
|
Purchases of property and equipment
|
(
|
)
|
(
|
)
|
(
|
)
|
|||||
|
Capitalization of internal use software
|
(
|
)
|
(
|
)
|
(
|
)
|
|||||
|
Acquisitions of businesses, net of cash acquired
|
|
|
|
|
(
|
)
|
|||||
|
Proceeds from divestiture of businesses
|
|
|
|
|
|
|
|||||
|
Other
|
(
|
)
|
(
|
)
|
|
|
|||||
|
Net cash provided by (used in) investing activities
|
(
|
)
|
|
|
(
|
)
|
|||||
|
Cash flows from financing activities:
|
|
|
|
||||||||
|
Proceeds from borrowings under revolving credit facilities
|
|
|
|
|
|
|
|||||
|
Repayments on borrowings under revolving credit facilities
|
(
|
)
|
(
|
)
|
|
|
|||||
|
Proceeds from long-term debt
|
|
|
|
|
|
|
|||||
|
Repayment of debt
|
(
|
)
|
|
|
|
|
|||||
|
Proceeds from issuance of stock under employee stock plans
|
|
|
|
|
|
|
|||||
|
Payments for employee taxes withheld upon vesting of restricted stock units
|
(
|
)
|
(
|
)
|
(
|
)
|
|||||
|
Cash paid for purchases of treasury stock
|
(
|
)
|
(
|
)
|
(
|
)
|
|||||
53
|
INTUIT INC.
CONSOLIDATED STATEMENTS OF CASH FLOWS
|
|||||||||||
|
Dividends and dividend rights paid
|
(
|
)
|
(
|
)
|
(
|
)
|
|||||
|
Other
|
(
|
)
|
(
|
)
|
(
|
)
|
|||||
|
Net cash used in financing activities
|
(
|
)
|
(
|
)
|
(
|
)
|
|||||
|
Effect of exchange rates on cash and cash equivalents
|
|
|
(
|
)
|
(
|
)
|
|||||
|
Net decrease in cash and cash equivalents
|
(
|
)
|
(
|
)
|
(
|
)
|
|||||
|
Cash and cash equivalents at beginning of period
|
|
|
|
|
|
|
|||||
|
Cash and cash equivalents at end of period
|
$
|
|
|
$
|
|
|
$
|
|
|
||
|
Supplemental disclosure of cash flow information:
|
|
|
|
||||||||
|
Interest paid
|
$
|
|
|
$
|
|
|
$
|
|
|
||
|
Income taxes paid
|
$
|
|
|
$
|
|
|
$
|
|
|
||
_________________________
|
(1)
|
|
During the first quarter of fiscal 2017, we elected to early adopt ASU 2016-09, “
Compensation—Stock Compensation (Topic 718): Improvements to Employee Share-Based Payment Accounting.
” See Note 1, “
Description of Business and Summary of Significant Accounting Policies - Accounting Standards Recently Adopted,
” for more information.
See accompanying notes.
54
|
INTUIT INC.
NOTES TO CONDENSED CONSOLIDATED FINANCIAL STATEMENTS
|
|
1. Description of Business and Summary of Significant Accounting Policies
|
|
Description of Business
|
Intuit helps consumers, small businesses, and the self-employed prosper by delivering financial management and compliance products and services. We also provide specialized tax products to accounting professionals, who are key partners that help us reach small business customers.
Our flagship brands, QuickBooks and TurboTax, help customers run their small businesses, pay employees and bills, separate business and personal expenses, track their money, and file income taxes. ProSeries and Lacerte are our leading tax preparation offerings for professional accountants. Incorporated in 1984 and headquartered in Mountain View, California, we sell our products and services primarily in the United States.
|
Basis of Presentation
|
These consolidated financial statements include the financial statements of Intuit and its wholly owned subsidiaries. We have eliminated all significant intercompany balances and transactions in consolidation. We have reclassified certain amounts previously reported in our financial statements to conform to the current presentation, including amounts related to discontinued operations and reportable segments. See Note 6,
“Discontinued Operations,”
and Note 13,
“Segment Information,”
for more information.
|
Seasonality
|
|
Use of Estimates
|
|
Revenue Recognition
|
We derive revenue from the sale of software subscriptions, hosted services, packaged software products, financial supplies, technical support plans, transaction fees, merchant services hardware, and multiple element arrangements that may include a combination of these items. We recognize revenue when all four revenue recognition criteria have been met: persuasive evidence of an arrangement exists, we have delivered the product or performed the service, the fee is fixed or determinable, and collectibility is probable. Determining whether and when these criteria have been satisfied involves exercising judgment and using estimates and assumptions that can have a significant impact on the timing and amount of revenue that we recognize.
In some situations, we receive advance payments from our customers. We defer revenue associated with these advance payments and the relative fair value of undelivered elements under multiple element arrangements until we ship the products or perform the services.
55
We account for cash consideration (such as sales incentives) that we give to our customers or resellers as a reduction of revenue rather than as an operating expense unless we receive a benefit that we can identify and for which we can reasonably estimate the fair value.
Product Revenue
Prior to fiscal 2015, we recognized revenue from the sale of our packaged software products when legal title transferred. This generally occurred when our customers electronically downloaded products from the Internet, when we shipped the products or, in the case of certain agreements, when products were delivered to retailers. In the first quarter of fiscal 2015 we began delivering ongoing enhancements and certain connected services for QuickBooks and ProConnect desktop solutions that we sold from that time forward. As a result, we recognize revenue for these QuickBooks desktop solutions over the period that the enhancements and connected services are provided, which is approximately
three
years. We recognize revenue for these ProConnect desktop solutions as services are provided over the calendar year, once tax forms are available from taxing agencies and the agencies are able to receive electronic tax return submissions.
We recognize revenue from the sale of our financial supplies such as printed check stock and merchant services hardware such as retail point-of-sale equipment and credit card readers for mobile phones when legal title transfers. This is generally when we ship the products. We record product revenue net of our sales tax obligations.
We sell some of our QuickBooks and TurboTax desktop software products on consignment to certain retailers. We begin recognizing revenue for these consignment transactions only when the end-user sale has occurred. For software products that are sold on a subscription basis and include periodic updates, we recognize revenue ratably over the period that we provide services to the customer.
We reduce product revenue from distributors and retailers for estimated returns that are based on historical returns experience and other factors, such as the volume and price mix of products in the retail channel, return rates for prior releases of the product, trends in retailer inventory, and economic trends that might impact customer demand for our products (including the competitive environment and the timing of new releases of our product). We also reduce product revenue for the estimated redemption of promotional discounts and rebates on certain current product sales. Our estimated reserves for distributor and retailer sales incentive rebates are based on distributors’ and retailers’ actual performance against the terms and conditions of rebate programs.
Service and Other Revenue
Our service revenue consists primarily of hosted services such as QuickBooks Online, QuickBooks desktop software term licenses, TurboTax Online, payroll services, electronic merchant payment processing services, and electronic tax filing and advice services. Our service revenue also includes QuickBooks technical support plans in our Small Business segment.
We recognize revenue from hosted services as the services are performed, provided we have no other remaining obligations to these customers. We generally require customers to remit payroll tax funds to us in advance of the payroll date via electronic funds transfer. We include in total net revenue the interest that we earn on these funds between the time that we collect them from customers and the time that we remit them to outside parties. Service revenue for electronic payment processing services that we provide to merchants is recorded net of interchange fees charged by credit card associations.
We offer several QuickBooks technical support plans and recognize support revenue over the life of the plans.
Other revenue consists primarily of revenue from revenue-sharing and royalty arrangements with third-party partners. We typically recognize this revenue as earned based upon reporting provided to us by our partners.
Multiple Element Arrangements
We enter into multiple element revenue arrangements in which a customer may purchase a combination of software, upgrades, hosted services, technical support, and hardware.
Multiple Element Arrangements That Contain Software and Software-Related Elements
For multiple element arrangements that contain only software and software-related elements, such as QuickBooks desktop software and paid technical support plans, we allocate and defer revenue for the undelivered elements based on their vendor-specific objective evidence of fair value (VSOE). VSOE is the price charged when that element is sold separately. In situations where VSOE exists for all elements (delivered and undelivered), we allocate the total revenue to be earned under the arrangement among the various elements, based on their relative fair value. For arrangements where VSOE exists only for the undelivered elements, we defer the full fair value of the undelivered elements and recognize the difference between the total arrangement fee and the amount deferred for the undelivered items as revenue. If VSOE does not exist for an undelivered service element, we recognize the revenue from the entire arrangement as the services are delivered. If VSOE does not exist for undelivered elements that are specified products or features, we defer revenue until the earlier of the delivery of all elements or the point at which we determine VSOE for these undelivered elements.
We recognize revenue related to the delivered products or services only if: (1) the above revenue recognition criteria are met; (2) any undelivered products or services are not essential to the functionality of the delivered products and services; (3) payment for the delivered products or services is not contingent upon delivery of the remaining products or services; and (4)
56
we have an enforceable claim to receive the amount due in the event that we do not deliver the undelivered products or services.
Multiple Element Arrangements That Contain Non-Software Elements
For multiple element arrangements that contain non-software elements such as hosted services or credit card readers for mobile phones, we: (1) determine whether and when each element has been delivered; (2) determine the fair value of each element using the selling price hierarchy of VSOE if available, third-party evidence (TPE) if VSOE is not available, and estimated selling price (ESP) if neither VSOE nor TPE is available; and (3) allocate the total price among the various elements using the relative selling price method. Once we have allocated the total price among the various elements, we recognize revenue when the revenue recognition criteria described above are met for each element.
|
Shipping and Handling
|
|
Customer Service and Technical Support
|
|
Software Development Costs
|
|
Internal Use Software
|
57
|
Advertising
|
|
Leases
|
We review all leases for capital or operating classification at their inception. We use our incremental borrowing rate in the assessment of lease classification and define the initial lease term to include the construction build-out period but to exclude lease extension periods. We conduct our operations primarily under operating leases. For leases that contain rent escalations, we record the total rent payable during the lease term, as defined above, on a straight-line basis over the term of the lease. We record the difference between the rent paid and the straight-line rent in a deferred rent account in other current liabilities or other long-term obligations, as appropriate, on our balance sheets.
|
Capitalization of Interest Expense
|
|
Foreign Currency
|
|
Income Taxes
|
We estimate our income taxes based on the various jurisdictions where we conduct business. Significant judgment is required in determining our worldwide income tax provision. We estimate our current tax liability and assess temporary differences that result from differing treatments of certain items for tax and accounting purposes. These differences result in deferred tax assets and liabilities, which we show on our balance sheet. We must then assess the likelihood that our deferred tax assets will be realized. To the extent we believe that realization is not likely, we establish a valuation allowance. When we establish a valuation allowance or increase this allowance in an accounting period, we record a corresponding income tax expense in our statement of operations.
We review the need for a valuation allowance to reflect uncertainties about whether we will be able to utilize some of our deferred tax assets before they expire. The valuation allowance analysis is based on our estimates of taxable income for the jurisdictions in which we operate and the periods over which our deferred tax assets will be realizable. While we have considered future taxable income in assessing the need for a valuation allowance for the periods presented, we could be required to record a valuation allowance to take into account additional deferred tax assets that we may be unable to realize. An increase in the valuation allowance would have an adverse impact, which could be material, on our income tax provision and net income in the period in which we record the increase.
We recognize and measure benefits for uncertain tax positions using a two-step approach. The first step is to evaluate the tax position taken or expected to be taken in a tax return by determining if the weight of available evidence indicates that it is more likely than not that the tax position will be sustained upon audit, including resolution of any related appeals or litigation processes. For tax positions that are more likely than not of being sustained upon audit, the second step is to measure the tax benefit as the largest amount that is more than
50%
likely of being realized upon settlement. Significant judgment is required to evaluate uncertain tax positions. We evaluate our uncertain tax positions on a quarterly basis. Our evaluations are based upon a number of factors, including changes in facts or circumstances, changes in tax law, correspondence with tax authorities during the course of audits and effective settlement of audit issues. Changes in the recognition or measurement of uncertain
58
tax positions could result in material increases or decreases in our income tax expense in the period in which we make the change, which could have a material impact on our effective tax rate and operating results.
|
Computation of Net Income (Loss) Per Share
|
We compute basic net income or loss per share using the weighted average number of common shares outstanding during the period. We compute diluted net income per share using the weighted average number of common shares and dilutive potential common shares outstanding during the period. Dilutive potential common shares consist of the shares issuable upon the exercise of stock options and upon the vesting of restricted stock units (RSUs) under the treasury stock method.
We include stock options with combined exercise prices and unrecognized compensation expense that are less than the average market price for our common stock, and RSUs with unrecognized compensation expense that is less than the average market price for our common stock, in the calculation of diluted net income per share. We exclude stock options with combined exercise prices and unrecognized compensation expense that are greater than the average market price for our common stock, and RSUs with unrecognized compensation expense that is greater than the average market price for our common stock, from the calculation of diluted net income per share because their effect is anti-dilutive. Under the treasury stock method, the amount that must be paid to exercise stock options and the amount of compensation expense for future service that we have not yet recognized for stock options and RSUs are assumed to be used to repurchase shares. Prior to our adoption of ASU 2016-09 in the first quarter of fiscal 2017, we included tax benefits in assessing whether equity awards were dilutive and in our calculations of weighted average dilutive shares under the treasury stock method.
All of the RSUs we grant have dividend rights. Dividend rights are accumulated and paid when the underlying RSUs vest. Since the dividend rights are subject to the same vesting requirements as the underlying equity awards they are considered a contingent transfer of value. Consequently, the RSUs are not considered participating securities and we do not present them separately in earnings per share.
59
|
|
Twelve Months Ended July 31,
|
||||||||||
|
(In millions, except per share amounts)
|
2017
|
2016
|
2015
|
||||||||
|
Numerator:
|
|
|
|||||||||
|
Net income from continuing operations
|
$
|
|
|
$
|
|
|
$
|
|
|
||
|
Net income (loss) from discontinued operations
|
|
|
|
|
(
|
)
|
|||||
|
Net income
|
$
|
|
|
$
|
|
|
$
|
|
|
||
|
Denominator:
|
|
|
|
||||||||
|
Shares used in basic per share amounts:
|
|
|
|
||||||||
|
Weighted average common shares outstanding
|
|
|
|
|
|
|
|||||
|
Shares used in diluted per share amounts:
|
|
|
|
||||||||
|
Weighted average common shares outstanding
|
|
|
|
|
|
|
|||||
|
Dilutive common equivalent shares from stock options and restricted stock awards
|
|
|
|
|
|
|
|||||
|
Dilutive weighted average common shares outstanding
|
|
|
|
|
|
|
|||||
|
Basic and diluted net income per share:
|
|
|
|
||||||||
|
Basic net income per share from continuing operations
|
$
|
|
|
$
|
|
|
$
|
|
|
||
|
Basic net income (loss) per share from discontinued operations
|
|
|
|
|
(
|
)
|
|||||
|
Basic net income per share
|
$
|
|
|
$
|
|
|
$
|
|
|
||
|
Diluted net income per share from continuing operations
|
$
|
|
|
$
|
|
|
$
|
|
|
||
|
Diluted net income (loss) per share from discontinued operations
|
|
|
|
|
(
|
)
|
|||||
|
Diluted net income per share
|
$
|
|
|
$
|
|
|
$
|
|
|
||
|
Weighted average stock options and restricted stock units excluded from
calculation due to anti-dilutive effect
|
|
|
|
|
|
|
|||||
|
Cash Equivalents and Investments
|
We consider highly liquid investments with maturities of three months or less at the date of purchase to be cash equivalents. Cash equivalents consist primarily of AAA-rated money market funds and time deposits in all periods presented. Investments consist of available-for-sale investment-grade debt securities that we carry at fair value. Except for direct obligations of the United States government, securities issued by agencies of the United States government, and money market funds, we diversify our investments by limiting our holdings with any individual issuer.
|
Accounts Receivable and Allowances for Doubtful Accounts
|
60
|
Funds Held for Customers and Customer Fund Deposits
|
|
Property and Equipment
|
|
Business Combinations
|
The acquisition method of accounting for business combinations requires us to use significant estimates and assumptions, including fair value estimates, as of the business combination date and to refine those estimates as necessary during the measurement period (defined as the period, not to exceed
one
year, in which we may adjust the provisional amounts recognized for a business combination).
Under the acquisition method of accounting we recognize separately from goodwill the identifiable assets acquired, the liabilities assumed, and any noncontrolling interests in an acquiree, generally at the acquisition date fair value. We measure goodwill as of the acquisition date as the excess of consideration transferred, which we also measure at fair value, over the net of the acquisition date amounts of the identifiable assets acquired and liabilities assumed. Costs that we incur to complete the business combination such as investment banking, legal and other professional fees are not considered part of consideration and we charge them to general and administrative expense as they are incurred. Under the acquisition method we also account for acquired company restructuring activities that we initiate separately from the business combination.
Should the initial accounting for a business combination be incomplete by the end of a reporting period that falls within the measurement period, we report provisional amounts in our financial statements. During the measurement period, we adjust the provisional amounts recognized at the acquisition date to reflect new information obtained about facts and circumstances that existed as of the acquisition date that, if known, would have affected the measurement of the amounts recognized as of that date and we record those adjustments to our financial statements. We apply those measurement period adjustments that we determine to be significant retrospectively to comparative information in our financial statements, including adjustments to depreciation and amortization expense.
|
Goodwill, Acquired Intangible Assets and Other Long-Lived Assets
|
Goodwill
We record goodwill when the fair value of consideration transferred in a business combination exceeds the fair value of the identifiable assets acquired and liabilities assumed. Goodwill and other intangible assets that have indefinite useful lives are not amortized, but we test them for impairment annually during our fourth fiscal quarter and whenever an event or change in circumstances indicates that the carrying value of the asset may not be recoverable.
For goodwill, we perform a two-step impairment test. In the first step, we compare the fair value of each reporting unit to its carrying value. In accordance with authoritative guidance, we define fair value as the price that would be received from the sale of an asset or paid to transfer a liability in the principal or most advantageous market for the asset or liability in an orderly transaction between market participants on the measurement date. We consider and use all valuation methods that are appropriate in estimating the fair value of our reporting units and generally use a weighted combination of income and market approaches. Under the income approach, we estimate the fair value of each reporting unit based on the present value of future cash flows. We use a number of assumptions in our discounted cash flow model, including market factors specific to the business, the amount and timing of estimated future cash flows to be generated by the business over an extended period of time, long-term growth rates for the business, and a rate of return that considers the relative risk of achieving the cash flows
61
and the time value of money. Under the market approach, we estimate the fair value of each reporting unit based on market multiples of revenue, operating income, and earnings for comparable publicly traded companies engaged in similar businesses. If the estimated fair value of the reporting unit exceeds the carrying value of the net assets assigned to that unit, goodwill is not impaired and no further analysis is required.
If the carrying value of the net assets assigned to a reporting unit exceeds the estimated fair value of the unit, we perform the second step of the impairment test. In this step we allocate the fair value of the reporting unit calculated in step one to all of the assets and liabilities of that unit, as if we had just acquired the reporting unit in a business combination. The excess of the fair value of the reporting unit over the total amount allocated to the assets and liabilities represents the implied fair value of goodwill. If the carrying value of a reporting unit’s goodwill exceeds its implied fair value, we would record an impairment loss equal to the difference. See Note 2,
“Fair Value Measurements – Assets and Liabilities Measured at Fair Value on a Non-Recurring Basis,”
for a discussion of the goodwill impairment charge that we recorded for the twelve months ended July 31, 2015.
Acquired Intangible Assets and Other Long-Lived Assets
|
Share-Based Compensation Plans
|
We estimate the fair value of stock options granted using a lattice binomial model and a multiple option award approach. We amortize the fair value of stock options on a straight-line basis over the requisite service periods of the awards, which are generally the vesting periods.
See Note 10,
“Stockholders’ Equity,”
for a description of our share-based compensation plans and more information on the assumptions we use to calculate the fair value of share-based compensation.
|
Concentration of Credit Risk and Significant Customers and Suppliers
|
We operate in markets that are highly competitive and rapidly changing. Significant technological changes, shifting customer needs, the emergence of competitive products or services with new capabilities and other factors could negatively impact our operating results.
We are also subject to risks related to changes in the value of our significant balance of investments. Our portfolio of investments consists of investment-grade securities. Except for direct obligations of the United States government, securities issued by agencies of the United States government and money market funds, we diversify our investments by limiting our holdings with any individual issuer.
We sell a significant portion of our products through third-party retailers and distributors. As a result, we face risks related to the collectibility of our accounts receivable. To appropriately manage this risk, we perform ongoing evaluations of customer credit and limit the amount of credit extended as we deem appropriate, but generally do not require collateral. We maintain reserves for estimated credit losses and these losses have historically been within our expectations. However, since we cannot
62
predict future changes in the financial stability of our customers, we cannot guarantee that our reserves will continue to be adequate.
No
customer accounted for
10%
or more of total net revenue for the twelve months ended July 31,
2017
,
2016
or
2015
, nor did any customer account for
10%
or more of total accounts receivable at July 31,
2017
or July 31,
2016
.
|
Accounting Standards Recently Adopted
|
Stock Compensation -
In March 2016 the FASB issued ASU 2016-09, “
Compensation—Stock Compensation (Topic 718): Improvements to Employee Share-Based Payment Accounting.
” As required by ASU 2016-09, excess tax benefits recognized on stock-based compensation expense are reflected in our condensed consolidated statements of operations as a component of the provision for income taxes on a prospective basis. Excess tax benefits are classified as an operating activity in our condensed consolidated statements of cash flows and we have applied this provision on a retrospective basis. We elected to early adopt this standard in the first quarter of our fiscal year that began August 1, 2016. For the twelve months ended July 31, 2017, we recognized excess tax benefits of
$
72
million
in our provision for income taxes. For the twelve months ended July 31, 2016 and July 31, 2015, net cash provided by operating activities increased by
$
59
million
and
$
85
million
with a corresponding offset to net cash used in financing activities. In addition, we have elected to account for forfeitures as they occur, rather than estimate expected forfeitures over the course of a vesting period. As a result of the adoption of ASU 2016-09, we recognized the net cumulative effect of this change as a
$
6
million
increase to additional paid-in capital, a
$
2
million
increase to deferred tax assets and a
$
4
million
reduction to retained earnings as of August 1, 2016.
|
Accounting Standards Not Yet Adopted
|
Goodwill Impairment
-
In January 2017 the Financial Accounting Standards Board (FASB) issued Accounting Standards Update (ASU) 2017-04, “
Intangibles—Goodwill and Other (Topic 350): Simplifying the Test for Goodwill Impairment.”
This new standard eliminates Step 2 from the goodwill impairment test. Instead, an entity should compare the fair value of a reporting unit with its carrying amount and recognize an impairment charge for the amount by which the carrying amount exceeds the reporting unit's fair value, not to exceed the total amount of goodwill allocated to the reporting unit. The standard is effective for fiscal years beginning after December 15, 2019, including interim periods within those fiscal years, which means that it will be effective for us in the first quarter of our fiscal year beginning August 1, 2020. Early adoption is permitted. We are currently evaluating the impact of our pending adoption of ASU 2017-04 on our consolidated financial statements.
Business Combinations
-
In January 2017 the FASB issued ASU 2017-01, “
Business Combinations (Topic 805): Clarifying the Definition of a Business
.
”
This new standard clarifies the definition of a business in order to allow for the evaluation of whether transactions should be accounted for as acquisitions or disposals of assets or businesses. The standard is effective for fiscal years beginning after December 15, 2017, including interim periods within those fiscal years, which means that it will be effective for us in the first quarter of our fiscal year beginning August 1, 2018. Early adoption is permitted. We are currently evaluating the impact of our pending adoption of ASU 2017-01 on our consolidated financial statements.
Statement of Cash Flows
-
In August 2016 the FASB issued ASU 2016-15, “
Statement of Cash Flows (Topic 230): Classification of Certain Cash Receipts and Cash Payments.”
This new standard will make eight targeted changes to how cash receipts and cash payments are presented and classified in the statement of cash flows. The standard is effective for fiscal years beginning after December 15, 2017, which means that it will be effective for us in the first quarter of our fiscal year beginning August 1, 2018. The standard will require adoption on a retrospective basis unless it is impracticable to apply, in which case we would be required to apply the amendments prospectively as of the earliest date practicable. We are currently evaluating the impact of our pending adoption of ASU 2016-15 on our consolidated financial statements.
Financial Instruments
-
In June 2016 the FASB issued ASU 2016-13, “
Financial Instruments—Credit Losses (Topic 326).
” This new standard requires the measurement of all expected credit losses for financial assets held at the reporting date based on historical experience, current conditions, and reasonable and supportable forecasts. The standard is effective for fiscal years beginning after December 15, 2019, including interim periods within those fiscal years, which means that it will be effective for us in the first quarter of our fiscal year beginning August 1, 2020. Earlier adoption is permitted in the first quarter of our fiscal year beginning August 1, 2019. We are currently evaluating the impact of our pending adoption of ASU 2016-13 on our consolidated financial statements.
Leases
-
In February 2016 the FASB issued ASU 2016-02, “
Leases (Topic 842).
” This new standard amends a number of aspects of lease accounting, including requiring lessees to recognize operating leases with a term greater than one year on their balance sheet as a right-of-use asset and corresponding lease liability, measured at the present value of the lease payments. The standard is effective for fiscal years beginning after December 15, 2018, including interim periods within those fiscal years, which means that it will be effective for us in the first quarter of our fiscal year beginning August 1, 2019. Early
63
adoption is permitted. This standard is required to be adopted using a modified retrospective approach. We are currently evaluating the impact of our pending adoption of ASU 2016-02 on our consolidated financial statements.
Revenue Recognition
-
In May 2014 the FASB issued ASU 2014-09, “
Revenue from Contracts with Customers (Topic 606)
,” and in August 2015 the FASB issued ASU 2015-14, “
Revenue from Contracts with Customers (Topic 606): Deferral of the Effective Date
,” which defers the effective date of ASU 2014-09 by one year. This new standard supersedes nearly all existing revenue recognition guidance under U.S. GAAP. The core principle of the new standard is to recognize revenues when promised goods or services are transferred to customers in an amount that reflects the consideration that is expected to be received for those goods or services. ASU 2014-09 defines a five step process to achieve this core principle and, in doing so, it is possible that more judgment and estimates may be required within the revenue recognition process than is required under present U.S. GAAP. These may include identifying performance obligations in the contract, estimating the amount of variable consideration to include in the transaction price, and allocating the transaction price to each separate performance obligation. The new standard also requires additional disclosure about the nature, amount, timing and uncertainty of revenue and cash flows arising from customer contracts, including significant judgments and changes in judgments. The new standard is effective for reporting periods beginning after December 15, 2017, which means that it will be effective for us in the first quarter of our fiscal year beginning August 1, 2018.
We plan to adopt Topic 606 utilizing the full retrospective transition method when it becomes effective for us in the first fiscal quarter beginning August 1, 2018.
We have completed our preliminary assessment of the new standard and are continuing to assess all potential impacts of the standard, primarily related to our Consumer Tax and ProConnect professional tax offerings. We currently believe the most significant changes to the timing and amount of revenue recognition relate to our QuickBooks desktop solutions. Under the current standard, we recognize substantially all of the transaction price for QuickBooks desktop solutions ratably over the period that enhancements and connected services are provided, which is approximately three years. Under the new standard, we will recognize software license revenue for QuickBooks desktop solutions at the time the license is delivered. Due to the upfront recognition of Quickbooks desktop solutions, upon adoption, we will remove deferred revenue from our liabilities through a cumulative adjustment to retained earnings.
We do not expect our annual revenue growth rates to be significantly different under Topic 606, but we do expect the timing of quarterly revenue recognition to be different as a result of these changes.
Accounting for commissions under the new standard will result in the deferral of incremental commission costs for obtaining contracts, which we do not expect to be material.
|
2. Fair Value Measurements
|
|
Fair Value Hierarchy
|
The authoritative guidance defines fair value as the price that would be received from the sale of an asset or paid to transfer a liability in an orderly transaction between market participants on the measurement date. When determining fair value, we consider the principal or most advantageous market for an asset or liability and assumptions that market participants would use when pricing the asset or liability. In addition, we consider and use all valuation methods that are appropriate in estimating the fair value of an asset or liability.
The authoritative guidance establishes a fair value hierarchy that is based on the extent and level of judgment used to estimate the fair value of assets and liabilities. In general, the authoritative guidance requires us to maximize the use of observable inputs and minimize the use of unobservable inputs when measuring fair value. An asset or liability’s categorization within the fair value hierarchy is based upon the lowest level of input that is significant to the measurement of its fair value. The three levels of input defined by the authoritative guidance are as follows:
|
•
|
Level 1
uses unadjusted quoted prices that are available in active markets for identical assets or liabilities.
|
|
•
|
Level 2
uses inputs other than quoted prices included in Level 1 that are either directly or indirectly observable through correlation with market data. These include quoted prices in active markets for similar assets or liabilities: quoted prices for identical or similar assets or liabilities in markets that are not active; and inputs to valuation models or other pricing methodologies that do not require significant judgment because the inputs used in the model, such as interest rates and volatility, can be corroborated by readily observable market data for substantially the full term of the assets or liabilities.
|
|
•
|
Level 3
uses one or more unobservable inputs that are supported by little or no market activity and that are significant to the determination of fair value. Level 3 assets and liabilities include those whose fair values are
|
64
determined using pricing models, discounted cash flow methodologies or similar valuation techniques and significant management judgment or estimation.
|
Assets and Liabilities Measured at Fair Value on a Recurring Basis
|
|
|
At July 31, 2017
|
At July 31, 2016
|
|||||||||||||||||||||||||||||
|
(In millions)
|
Level 1
|
Level 2
|
Level 3
|
Total
Fair Value
|
Level 1
|
Level 2
|
Level 3
|
Total
Fair Value
|
|||||||||||||||||||||||
|
Assets:
|
|
|
|
|
|
|
|
|
|||||||||||||||||||||||
|
Cash equivalents, primarily money market funds and time deposits
|
$
|
|
|
$
|
|
|
$
|
|
|
$
|
|
|
$
|
|
|
$
|
|
|
$
|
|
|
$
|
|
|
|||||||
|
Available-for-sale debt securities:
|
|
|
|
|
|
|
|||||||||||||||||||||||||
|
Municipal bonds
|
|
|
|
|
|
|
|
|
|
|
|
|
|
|
|
|
|||||||||||||||
|
Municipal auction rate securities
|
|
|
|
|
|
|
|
|
|
|
|
|
|
|
|
|
|||||||||||||||
|
Corporate notes
|
|
|
|
|
|
|
|
|
|
|
|
|
|
|
|
|
|||||||||||||||
|
U.S. agency securities
|
|
|
|
|
|
|
|
|
|
|
|
|
|
|
|
|
|||||||||||||||
|
Total available-for-sale securities
|
|
|
|
|
|
|
|
|
|
|
|
|
|
|
|
|
|||||||||||||||
|
Total assets measured at fair value on a recurring basis
|
$
|
|
|
$
|
|
|
$
|
|
|
$
|
|
|
$
|
|
|
$
|
|
|
$
|
|
|
$
|
|
|
|||||||
|
Liabilities:
|
|
|
|
|
|
|
|
|
|||||||||||||||||||||||
|
Senior notes
(1)
|
$
|
|
|
$
|
|
|
$
|
|
|
$
|
|
|
$
|
|
|
$
|
|
|
$
|
|
|
$
|
|
|
|||||||
______________________
|
(1)
|
|
|
|
At July 31, 2017
|
At July 31, 2016
|
|||||||||||||||||||||||||||||
|
(In millions)
|
Level 1
|
Level 2
|
Level 3
|
Total
Fair Value
|
Level 1
|
Level 2
|
Level 3
|
Total
Fair Value
|
|||||||||||||||||||||||
|
Cash equivalents:
|
|
|
|
|
|
|
|
|
|||||||||||||||||||||||
|
In cash and cash equivalents
|
$
|
|
|
$
|
|
|
$
|
|
|
$
|
|
|
$
|
|
|
$
|
|
|
$
|
|
|
$
|
|
|
|||||||
|
In funds held for customers
|
|
|
|
|
|
|
|
|
|
|
|
|
|
|
|
|
|||||||||||||||
|
Total cash and cash equivalents
|
$
|
|
|
$
|
|
|
$
|
|
|
$
|
|
|
$
|
|
|
$
|
|
|
$
|
|
|
$
|
|
|
|||||||
|
Available-for-sale securities:
|
|
|
|
|
|
|
|
|
|||||||||||||||||||||||
|
In investments
|
$
|
|
|
$
|
|
|
$
|
|
|
$
|
|
|
$
|
|
|
$
|
|
|
$
|
|
|
$
|
|
|
|||||||
|
In funds held for customers
|
|
|
|
|
|
|
|
|
|
|
|
|
|
|
|
|
|||||||||||||||
|
In long-term investments
|
|
|
|
|
|
|
|
|
|
|
|
|
|
|
|
|
|||||||||||||||
|
Total available-for-sale securities
|
$
|
|
|
$
|
|
|
$
|
|
|
$
|
|
|
$
|
|
|
$
|
|
|
$
|
|
|
$
|
|
|
|||||||
We value our Level 1 assets, consisting primarily of money market funds and time deposits, using quoted prices in active markets for identical instruments. Financial assets whose fair values we measure on a recurring basis using Level 2 inputs consist of municipal bonds, corporate notes and U.S. agency securities. We measure the fair values of these assets with the help of a pricing service that either provides quoted market prices in active markets for identical or similar securities or uses observable inputs for their pricing without applying significant adjustments. Our fair value processes include controls that are designed to ensure that we record appropriate fair values for our Level 2 investments. These controls include comparison to pricing provided by a secondary pricing service or investment manager, validation of pricing sources and models, review of key model inputs, analysis of period-over-period price fluctuations, and independent recalculation of prices where appropriate.
Financial liabilities whose fair values we measured using Level 2 inputs consisted of senior unsecured notes. We repaid those notes during the third quarter of fiscal 2017. See Note 7, “
Current Liabilities – Short-Term Debt,”
for more information. We measured the fair value of our senior notes based on their trading prices and the interest rates we could obtain for other borrowings with similar terms.
65
Financial assets whose fair values we measure using significant unobservable (Level 3) inputs consist of municipal auction rate securities that are no longer liquid. We estimate the fair values of the auction rate securities using a discounted cash flow model. Using our discounted cash flow model, we determined that the fair values of the municipal auction rate securities we held at July 31,
2017
,
2016
, and
2015
were approximately equal to their par values and as a result we recorded no decrease in their fair values during the twelve months then ended. We continue to classify them as long-term investments based on the maturities of the underlying securities at that date. We do not intend to sell our municipal auction rate securities. In addition, it is more likely than not that we will not be required to sell them before recovery at par, which may be at maturity.
There were
no
transfers between Level 1, Level 2, and Level 3 of the fair value hierarchy during the twelve months ended July 31,
2017
,
2016
or
2015
.
|
Assets and Liabilities Measured at Fair Value on a Non-Recurring Basis
|
Assets measured at fair value on a non-recurring basis include reporting units measured at fair value in a goodwill impairment test. Estimates of fair value for reporting units fall under Level 3 of the fair value hierarchy.
During the fourth quarters of fiscal
2017
, fiscal
2016
, and fiscal
2015
we performed our annual goodwill impairment tests. Using the methodology described in Note 1, we determined that the estimated fair values of all of our reporting units exceeded their carrying values and that they were not impaired.
During the third quarter of fiscal 2015 there was a significant decline in the revenue and operating income forecast for our Consumer Ecosystem reporting unit. As a result of this development, we performed an interim impairment test of goodwill and acquired intangible assets for that reporting unit. We concluded that the carrying value of goodwill associated with our Consumer Ecosystem reporting unit was impaired and we recorded an impairment charge of
$
263
million that reduced the carrying value of goodwill to
$
211
million as of April 30, 2015. The amount of the impairment charge was determined by comparing the carrying value of goodwill assigned to the reporting unit with the implied fair value of the goodwill. We used a weighted combination of a discounted cash flow model (income approach) and comparisons to publicly traded companies engaged in similar businesses (market approach) to estimate the fair value of our Consumer Ecosystem reporting unit. Key assumptions that we used in the income approach included the amount and timing of estimated future cash flows to be generated by the business over an extended period of time, long-term growth rates for the business, and a rate of return that considered the relative risk of achieving the cash flows and the time value of money. For the market approach, we estimated the fair value of the reporting unit based on market multiples of revenue, operating income, and earnings for comparable publicly traded companies engaged in similar businesses. We believe that the assumptions used to determine the impairment amount for the goodwill of this reporting unit are reasonable.
|
3. Cash and Cash Equivalents, Investments, and Funds Held for Customers
|
|
|
July 31, 2017
|
July 31, 2016
|
|||||||||||||
|
(In millions)
|
Amortized Cost
|
Fair Value
|
Amortized Cost
|
Fair Value
|
|||||||||||
|
Classification on balance sheets:
|
|
|
|
|
|||||||||||
|
Cash and cash equivalents
|
$
|
|
|
$
|
|
|
$
|
|
|
$
|
|
|
|||
|
Investments
|
|
|
|
|
|
|
|
|
|||||||
|
Funds held for customers
|
|
|
|
|
|
|
|
|
|||||||
|
Long-term investments
|
|
|
|
|
|
|
|
|
|||||||
|
Total cash and cash equivalents, investments, and funds
held for customers
|
$
|
|
|
$
|
|
|
$
|
|
|
$
|
|
|
|||
66
|
|
July 31, 2017
|
July 31, 2016
|
|||||||||||||
|
(In millions)
|
Amortized Cost
|
Fair Value
|
Amortized Cost
|
Fair Value
|
|||||||||||
|
Type of issue:
|
|
|
|
|
|||||||||||
|
Total cash and cash equivalents
|
$
|
|
|
$
|
|
|
$
|
|
|
$
|
|
|
|||
|
Available-for-sale debt securities:
|
|
|
|
|
|||||||||||
|
Municipal bonds
|
|
|
|
|
|
|
|
|
|||||||
|
Municipal auction rate securities
|
|
|
|
|
|
|
|
|
|||||||
|
Corporate notes
|
|
|
|
|
|
|
|
|
|||||||
|
U.S. agency securities
|
|
|
|
|
|
|
|
|
|||||||
|
Total available-for-sale debt securities
|
|
|
|
|
|
|
|
|
|||||||
|
Other long-term investments
|
|
|
|
|
|
|
|
|
|||||||
|
Total cash and cash equivalents, investments, and funds
held for customers
|
$
|
|
|
$
|
|
|
$
|
|
|
$
|
|
|
|||
We include realized gains and losses on our available-for-sale debt securities in interest and other income or expense, net in our statements of operations. Gross realized gains and losses on our available-for-sale debt securities for the twelve months ended July 31,
2017
,
2016
and
2015
were
not
significant.
We accumulate unrealized gains and losses on our available-for-sale debt securities, net of tax, in accumulated other comprehensive income or loss in the stockholders’ equity section of our balance sheets. Gross unrealized gains and losses on our available-for-sale debt securities at
July 31, 2017
and
July 31, 2016
were
not
significant.
We periodically review our investment portfolios to determine if any investment is other-than-temporarily impaired due to changes in credit risk or other potential valuation concerns. We believe that the investments that we held at
July 31, 2017
were not other-than-temporarily impaired. Unrealized losses on available-for-sale debt securities at
July 31, 2017
were not significant and are due to changes in interest rates, including market credit spreads, and not due to increased credit risks associated with specific securities. We do not intend to sell these investments. In addition, it is more likely than not that we will not be required to sell them before recovery at par, which may be at maturity.
|
|
July 31, 2017
|
July 31, 2016
|
|||||||||||||
|
(In millions)
|
Amortized Cost
|
Fair Value
|
Amortized Cost
|
Fair Value
|
|||||||||||
|
Due within one year
|
$
|
|
|
$
|
|
|
$
|
|
|
$
|
|
|
|||
|
Due within two years
|
|
|
|
|
|
|
|
|
|||||||
|
Due within three years
|
|
|
|
|
|
|
|
|
|||||||
|
Due after three years
|
|
|
|
|
|
|
|
|
|||||||
|
Total available-for-sale debt securities
|
$
|
|
|
$
|
|
|
$
|
|
|
$
|
|
|
|||
67
|
4. Property and Equipment
|
|
|
Life in
|
July 31,
|
|||||||
|
(Dollars in millions)
|
Years
|
2017
|
2016
|
||||||
|
Equipment
|
3-5
|
$
|
|
|
$
|
|
|
||
|
Computer software
|
3-6
|
|
|
|
|
||||
|
Furniture and fixtures
|
5
|
|
|
|
|
||||
|
Leasehold improvements
|
2-16
|
|
|
|
|
||||
|
Land
|
NA
|
|
|
|
|
||||
|
Buildings
|
5-30
|
|
|
|
|
||||
|
Capital in progress
|
NA
|
|
|
|
|
||||
|
|
|
|
|
|
|
||||
|
Less accumulated depreciation and amortization
|
|
(
|
)
|
(
|
)
|
||||
|
Total property and equipment, net
|
|
$
|
|
|
$
|
|
|
||
__________________________
NA = Not Applicable
Capital in progress at
July 31, 2016
consisted primarily of costs related to internal use software projects and land and buildings that we were in the process of constructing on our headquarters campus in Mountain View, California. The balance of land and buildings in the capital in progress account was
$
172
million
at
July 31, 2016
. The land and buildings were placed in service during fiscal 2017.
|
5. Goodwill and Acquired Intangible Assets
|
|
Goodwill
|
|
(In millions)
|
Balance
July 31,
2015
|
Goodwill
Acquired/
Adjusted
|
Balance
July 31,
2016
|
Goodwill
Acquired/
Adjusted
|
Balance
July 31,
2017
|
||||||||||||||
|
Small Business
|
$
|
|
|
$
|
|
|
$
|
|
|
$
|
|
|
$
|
|
|
||||
|
Consumer Tax
|
|
|
|
|
|
|
|
|
|
|
|||||||||
|
ProConnect
|
|
|
|
|
|
|
|
|
|
|
|||||||||
|
Totals
|
$
|
|
|
$
|
|
|
$
|
|
|
$
|
|
|
$
|
|
|
||||
Goodwill is net of accumulated impairment losses of
$
114
million
, which were recorded prior to July 31, 2015 in our Small Business segment. Adjustments in the table above primarily consist of foreign currency translation.
68
|
Acquired Intangible Assets
|
|
(Dollars in millions)
|
Customer
Lists
|
Purchased
Technology
|
Trade
Names
and Logos
|
Covenants
Not to
Compete
or Sue
|
Total
|
||||||||||||||
|
At July 31, 2017:
|
|
|
|
|
|
||||||||||||||
|
Cost
|
$
|
|
|
$
|
|
|
$
|
|
|
$
|
|
|
$
|
|
|
||||
|
Accumulated amortization
|
(
|
)
|
(
|
)
|
(
|
)
|
(
|
)
|
(
|
)
|
|||||||||
|
Acquired intangible assets, net
|
$
|
|
|
$
|
|
|
$
|
|
|
$
|
|
|
$
|
|
|
||||
|
Weighted average life in years
|
NA
|
|
|
|
NA
|
|
|
|
|
|
|||||||||
|
At July 31, 2016:
|
|
|
|
|
|
||||||||||||||
|
Cost
|
$
|
|
|
$
|
|
|
$
|
|
|
$
|
|
|
$
|
|
|
||||
|
Accumulated amortization
|
(
|
)
|
(
|
)
|
(
|
)
|
(
|
)
|
(
|
)
|
|||||||||
|
Acquired intangible assets, net
|
$
|
|
|
$
|
|
|
$
|
|
|
$
|
|
|
$
|
|
|
||||
|
Weighted average life in years
|
|
|
|
|
NA
|
|
|
|
|
|
|||||||||
|
(In millions)
|
Expected
Future
Amortization
Expense
|
||
|
|
|
||
|
Twelve months ending July 31,
|
|
||
|
2018
|
$
|
|
|
|
2019
|
|
|
|
|
2020
|
|
|
|
|
2021
|
|
|
|
|
2022
|
|
|
|
|
Thereafter
|
|
|
|
|
Total expected future amortization expense
|
$
|
|
|
|
6. Discontinued Operations
|
On February 1, 2016 we completed the sale of our Demandforce business. On April 1, 2016 we completed the sales of our QuickBase and Quicken businesses. We received
$
463
million
in cash and recorded a pre-tax gain of
$
354
million
and a net gain of
$
173
million
on the disposal of these
three
businesses in fiscal 2016.
We classified our Demandforce, QuickBase, and Quicken businesses as discontinued operations and have therefore segregated their operating results from continuing operations in our statements of operations for all periods presented. Because the cash flows of these businesses were not material for any period presented, we have not segregated them on our statements of cash flows. Demandforce and QuickBase were part of our Small Business segment and Quicken was part of our former Consumer segment.
69
|
7. Current Liabilities
|
|
Short-Term Debt
|
Short-term debt at July 31, 2016 included
$
500
million
of
5.75
%
senior unsecured notes due on March 15, 2017, less the unamortized discount. During the third quarter of fiscal 2017 we repaid those notes when they became due using cash from operations. We paid
$
29
million
in cash for interest on the notes during each of the
twelve
months ended
July 31, 2017
,
July 31, 2016
, and
July 31, 2015
.
On February 1, 2016 we entered into a master credit agreement with certain institutional lenders for a
five
-year credit facility in an aggregate principal amount of
$
1.5
billion
. The master credit agreement includes a
$
500
million
unsecured term loan and a
$
1
billion
unsecured revolving credit facility. At
July 31, 2017
,
$
488
million
was outstanding under the term loan, of which
$
50
million
was classified as short-term debt. See Note 8, “
Long-Term Obligations and Commitments – Long-Term Debt,”
for more information regarding the term loan.
|
Unsecured Revolving Credit Facilities
|
The master credit agreement we entered into on February 1, 2016 includes a
$
1
billion
unsecured revolving credit facility that will expire on February 1, 2021. Under the master credit agreement we may, subject to certain customary conditions, on one or more occasions increase commitments under the revolving credit facility in an amount not to exceed
$
250
million
in the aggregate and may extend the maturity date up to
two
times. Advances under the revolving credit facility accrue interest at rates that are equal to, at our election, either Bank of America's alternate base rate plus a margin that ranges from
0.0
%
to
0.5
%
or the London Interbank Offered Rate (LIBOR) plus a margin that ranges from
0.9
%
to
1.5
%
. Actual margins under either election will be based on our senior debt credit ratings. The master credit agreement includes customary affirmative and negative covenants, including financial covenants that require us to maintain a ratio of total debt to annual earnings before interest, taxes, depreciation and amortization (EBITDA) of not greater than
3.25
to 1.00 as of any date and a ratio of annual EBITDA to annual interest expense of not less than
3.00
to 1.00 as of the last day of each fiscal quarter. We remained in compliance with these covenants at all times during the fiscal year ended
July 31, 2017
. During the
twelve
months ended
July 31, 2017
we borrowed and repaid
$
150
million
under this revolving credit facility and at
July 31, 2017
no
amounts were outstanding. We paid
$
1
million
in cash for interest on the revolving credit facility during the twelve months ended
July 31, 2017
and
$
2
million
in cash for interest on revolving credit facilities during the twelve months e
nded
July 31, 2016
.
|
Other Current Liabilities
|
|
|
July 31,
|
||||||
|
(In millions)
|
2017
|
2016
|
|||||
|
Executive deferred compensation plan liabilities
|
$
|
|
|
$
|
|
|
|
|
Reserve for promotional discounts and rebates
|
|
|
|
|
|||
|
Reserve for product returns
|
|
|
|
|
|||
|
Current portion of license fee payable
|
|
|
|
|
|||
|
Current portion of deferred rent
|
|
|
|
|
|||
|
Current portion of dividend payable
|
|
|
|
|
|||
|
Interest payable
|
|
|
|
|
|||
|
Other
|
|
|
|
|
|||
|
Total other current liabilities
|
$
|
|
|
$
|
|
|
|
|
8. Long-Term Obligations and Commitments
|
|
Long-Term Debt
|
On February 1, 2016 we entered into a master credit agreement with certain institutional lenders for a
five
-year credit facility in an aggregate principal amount of
$
1.5
billion
, which includes a
$
500
million
unsecured term loan. Under the master credit agreement we may, subject to certain customary conditions, on one or more occasions increase commitments under the term loan in an amount not to exceed
$
500
million
in the aggregate. The term loan accrues interest at rates that are equal to, at our
70
election, either Bank of America's alternate base rate plus a margin that ranges from
0.125
%
to
0.875
%
or LIBOR plus a margin that ranges from
1.125
%
to
1.875
%
. Actual margins under either election will be based on our senior debt credit ratings. The master credit agreement includes customary affirmative and negative covenants. See Note 7, “
Current Liabilities – Unsecured Revolving Credit Facilities,”
for more information. The term loan is subject to quarterly principal payments of
2.5
%
of the loan amount which began in July 2017, with the balance payable on February 1, 2021. At
July 31, 2017
,
$
488
million
was outstanding under the term loan, of which
$
50
million
was classified as short-term debt. Interest on the term loan is payable monthly. We paid
$
11
million
and
$
4
million
in cash for interest on the term loan during the twelve months ended
July 31, 2017
and
July 31, 2016
.
|
Other Long-Term Obligations
|
|
|
July 31,
|
||||||
|
(In millions)
|
2017
|
2016
|
|||||
|
Total deferred rent
|
$
|
|
|
$
|
|
|
|
|
Long-term income tax liabilities
|
|
|
|
|
|||
|
Total license fee payable
|
|
|
|
|
|||
|
Long-term deferred income tax liabilities
|
|
|
|
|
|||
|
Other
|
|
|
|
|
|||
|
Total long-term obligations
|
|
|
|
|
|||
|
Less current portion (included in other current liabilities)
|
(
|
)
|
(
|
)
|
|||
|
Long-term obligations due after one year
|
$
|
|
|
$
|
|
|
|
In May 2009 we entered into an agreement to license certain technology for
$
20
million in cash and
$
100
million payable over
ten
fiscal years. The total present value of the arrangement at inception was approximately
$
89
million. The total license fee payable in the table above includes imputed interest through the dates indicated.
|
Operating Lease Commitments and Unconditional Purchase Obligations
|
We lease office facilities and equipment under non-cancellable operating lease arrangements. Our facilities leases generally provide for periodic rent increases and many contain escalation clauses and renewal options. The leases for our corporate headquarters campus in Mountain View, California expire in 2024 and 2026, with options to extend the lease terms for an additional
ten
years at rates to be determined in accordance with the agreements.
In the ordinary course of business we enter into certain unconditional purchase obligations with our suppliers. These are agreements to purchase products and services that are enforceable, legally binding, and specify terms that include fixed or minimum quantities to be purchased; fixed, minimum or variable price provisions; and the approximate timing of the payments.
|
(In millions)
|
Purchase
Obligations
|
Operating
Lease
Commitments
|
Sublease Income
|
Net Operating Lease Commitments
|
|||||||||||
|
Fiscal year ending July 31,
|
|
||||||||||||||
|
2018
|
$
|
|
|
$
|
|
|
$
|
|
|
$
|
|
|
|||
|
2019
|
|
|
|
|
|
|
|
|
|||||||
|
2020
|
|
|
|
|
|
|
|
|
|||||||
|
2021
|
|
|
|
|
|
|
|
|
|||||||
|
2022
|
|
|
|
|
|
|
|
|
|||||||
|
Thereafter
|
|
|
|
|
|
|
|
|
|||||||
|
Total commitments
|
$
|
|
|
$
|
|
|
$
|
|
|
$
|
|
|
|||
71
|
9. Income Taxes
|
|
|
Twelve Months Ended July 31,
|
||||||||||
|
(In millions)
|
2017
|
2016
|
2015
|
||||||||
|
Current:
|
|
|
|
||||||||
|
Federal
|
$
|
|
|
$
|
|
|
$
|
|
|
||
|
State
|
|
|
|
|
|
|
|||||
|
Foreign
|
|
|
|
|
|
|
|||||
|
Total current
|
|
|
|
|
|
|
|||||
|
Deferred:
|
|
|
|
||||||||
|
Federal
|
|
|
(
|
)
|
|
|
|||||
|
State
|
|
|
(
|
)
|
|
|
|||||
|
Foreign
|
|
|
(
|
)
|
|
|
|||||
|
Total deferred
|
|
|
(
|
)
|
|
|
|||||
|
Total provision for income taxes from continuing operations
|
$
|
|
|
$
|
|
|
$
|
|
|
||
In the first quarter of fiscal 2017, we elected to early adopt ASU 2016-09,
“Compensation-Stock Compensation (Topic 718): Improvements to Employee Share-Based Payment Accounting.”
This new standard requires excess tax benefits recognized on stock-based compensation expense to be reflected in the statements of operations as a component of the provision for income taxes on a prospective basis. For the twelve months ended July 31, 2017, we recognized excess tax benefits of
$
72
million in our current provision for income taxes. See Note 1, “
Description of Business and Summary of Significant Accounting Policies,
” for more information.
For periods prior to ASU 2016-09 adoption, excess tax benefits associated with share-based compensation deductions are credited to stockholders’ equity rather than current tax expense. The reductions of income taxes payable resulting from share-based compensation deductions that were credited to stockholders’ equity were approximately
$
59
million for the twelve months ended
July 31, 2016
, and
$
85
million for the twelve months ended
July 31, 2015
.
|
|
Twelve Months Ended July 31,
|
||||||||||
|
(In millions)
|
2017
|
2016
|
2015
|
||||||||
|
United States
|
$
|
|
|
$
|
|
|
$
|
|
|
||
|
Foreign
|
|
|
(
|
)
|
(
|
)
|
|||||
|
Total
|
$
|
|
|
$
|
|
|
$
|
|
|
||
72
|
|
Twelve Months Ended July 31,
|
||||||||||
|
(In millions)
|
2017
|
2016
|
2015
|
||||||||
|
Income from continuing operations before income taxes
|
$
|
|
|
$
|
|
|
$
|
|
|
||
|
Statutory federal income tax
|
$
|
|
|
$
|
|
|
$
|
|
|
||
|
State income tax, net of federal benefit
|
|
|
|
|
|
|
|||||
|
Federal research and experimentation credits
|
(
|
)
|
(
|
)
|
(
|
)
|
|||||
|
Domestic production activities deduction
|
(
|
)
|
(
|
)
|
(
|
)
|
|||||
|
Stock-based compensation
|
|
|
|
|
|
|
|||||
|
Federal excess tax benefits related to stock-based compensation
|
(
|
)
|
|
|
|
|
|||||
|
Effects of non-U.S. operations
|
|
|
|
|
|
|
|||||
|
Non-deductible goodwill
|
|
|
|
|
|
|
|||||
|
Other, net
|
|
|
(
|
)
|
|
|
|||||
|
Total provision for income taxes from continuing operations
|
$
|
|
|
$
|
|
|
$
|
|
|
||
In December 2015 the Consolidated Appropriations Act, 2016 was signed into law. The Act includes a permanent reinstatement of the federal research and experimentation credit that was retroactive to January 1, 2015. We recorded a discrete tax benefit of approximately
$
12
million
for the retroactive effect during the twelve months ended July 31 2016.
In December 2014 the Tax Increase Prevention Act of 2014 was signed into law. The Act includes a reinstatement of the federal research and experimentation credit through December 31, 2014 that was retroactive to January 1, 2014. We recorded a discrete tax benefit of approximately
$
11
million for the retroactive effect during the twelve months ended July 31, 2015.
|
|
July 31,
|
||||||
|
(In millions)
|
2017
|
2016
|
|||||
|
Deferred tax assets:
|
|
|
|||||
|
Accruals and reserves not currently deductible
|
$
|
|
|
$
|
|
|
|
|
Deferred revenue
|
|
|
|
|
|||
|
Deferred rent
|
|
|
|
|
|||
|
Accrued and deferred compensation
|
|
|
|
|
|||
|
Loss and tax credit carryforwards
|
|
|
|
|
|||
|
Stock-based compensation
|
|
|
|
|
|||
|
Other, net
|
|
|
|
|
|||
|
Total gross deferred tax assets
|
|
|
|
|
|||
|
Valuation allowance
|
(
|
)
|
(
|
)
|
|||
|
Total deferred tax assets
|
|
|
|
|
|||
|
Deferred tax liabilities:
|
|
|
|||||
|
Intangible assets
|
|
|
|
|
|||
|
Property and equipment
|
|
|
|
|
|||
|
Total deferred tax liabilities
|
|
|
|
|
|||
|
Net deferred tax assets
|
$
|
|
|
$
|
|
|
|
73
|
|
July 31,
|
||||||
|
(In millions)
|
2017
|
2016
|
|||||
|
Long-term deferred income taxes
|
$
|
|
|
$
|
|
|
|
|
Long-term deferred income taxes included in other long-term obligations
|
(
|
)
|
(
|
)
|
|||
|
Net deferred tax assets
|
$
|
|
|
$
|
|
|
|
We have provided a valuation allowance related to state tax credit carryforwards, foreign loss carryforwards, and state operating and capital loss carryforwards that we believe are unlikely to be realized. Changes in the valuation allowance during the twelve months ended July 31, 2017 were primarily related to an increase in the valuation allowance for state tax credit and foreign loss carryforwards. Changes in the valuation allowance during the twelve months ended July 31, 2016 were primarily related to an increase in the valuation allowance for foreign operating loss carryforwards, state tax credit and state capital loss carryforwards.
At July 31, 2016, the income tax expense associated with the net gain from discontinued operations consisted of
$
179
million
related to the sale of Demandforce, QuickBase, and Quicken, and
$
2
million
related to the increase of valuation allowance on state capital loss carryforwards. See Note 6, “
Discontinued Operations,
” for more information.
At
July 31, 2017
, we had total federal net operating loss carryforwards of approximately
$
16
million that will start to expire in fiscal
2028
. Utilization of the net operating losses is subject to annual limitation. The annual limitation may result in the expiration of net operating losses before utilization.
At
July 31, 2017
, we had total state net operating loss carryforwards of approximately
$
103
million for which we have recorded a deferred tax asset of
$
6
million and a valuation allowance of
$
5
million
. The state net operating losses will start to expire in fiscal
2018
. Utilization of the net operating losses is subject to annual limitation. The annual limitation may result in the expiration of net operating losses before utilization.
At
July 31, 2017
, we had Singapore operating loss carryforwards of approximately
$
92
million
and Brazil operating loss carryforwards of approximately
$
14
million
which have an indefinite carryforward period. We recorded a full valuation allowance on the related deferred tax asset.
At
July 31, 2017
, we had California research and experimentation credit carryforwards of approximately
$
66
million
. We recorded a full valuation on the related deferred tax asset.
|
Unrecognized Tax Benefits
|
|
|
Twelve Months Ended July 31,
|
||||||||||
|
(In millions)
|
2017
|
2016
|
2015
|
||||||||
|
Gross unrecognized tax benefits, beginning balance
|
$
|
|
|
$
|
|
|
$
|
|
|
||
|
Increases related to tax positions from prior fiscal years, including acquisitions
|
|
|
|
|
|
|
|||||
|
Decreases related to tax positions from prior fiscal years
|
(
|
)
|
(
|
)
|
(
|
)
|
|||||
|
Increases related to tax positions taken during current fiscal year
|
|
|
|
|
|
|
|||||
|
Settlements with tax authorities
|
(
|
)
|
(
|
)
|
(
|
)
|
|||||
|
Gross unrecognized tax benefits, ending balance
|
$
|
|
|
$
|
|
|
$
|
|
|
||
The total amount of our unrecognized tax benefits at
July 31, 2017
was
$
61
million. Net of related deferred tax assets, unrecognized tax benefits were
$
38
million at that date. If we were to recognize these net benefits, our income tax expense would reflect a favorable net impact of
$
38
million. We do not believe that it is reasonably possible that there will be a significant increase or decrease in unrecognized tax benefits over the next 12 months.
We file U.S. federal, U.S. state, and foreign tax returns. Our major tax jurisdictions are U.S. federal and the State of California. For U.S. federal tax returns we are no longer subject to tax examinations for years prior to fiscal 2013. For California tax returns we are currently under tax examinations for fiscal 2009 to fiscal 2015.
74
|
10. Stockholders’ Equity
|
|
Stock Repurchase Programs
|
Intuit’s Board of Directors has authorized a series of common stock repurchase programs. Shares of common stock repurchased under these programs become treasury shares. Under these programs, we repurchased
6.9
million
shares of our common stock for
$
839
million
during the twelve months ended
July 31, 2017
;
24.8
million
shares for
$
2.3
billion
during the twelve months ended
July 31, 2016
; and
13.8
million
shares for
$
1.2
billion
during the twelve months ended
July 31, 2015
. At
July 31, 2017
, we had authorization from our Board of Directors to expend up to an additional
$
1.5
billion
for stock repurchases. Future stock repurchases under the current program are at the discretion of management, and authorization of future stock repurchase programs is subject to the final determination of our Board of Directors.
Our treasury shares are repurchased at the market price on the trade date; accordingly, all amounts paid to reacquire these shares have been recorded as treasury stock on our balance sheets. Repurchased shares of our common stock are held as treasury shares until they are reissued or retired. When we reissue treasury stock, if the proceeds from the sale are more than the average price we paid to acquire the shares we record an increase in additional paid-in capital. Conversely, if the proceeds from the sale are less than the average price we paid to acquire the shares, we record a decrease in additional paid-in capital to the extent of increases previously recorded for similar transactions and a decrease in retained earnings for any remaining amount.
In the past we have satisfied option exercises and restricted stock unit vesting under our employee equity incentive plans by reissuing treasury shares, and we may do so again in the future. During the second quarter of fiscal 2014 we began issuing new shares of common stock to satisfy option exercises and RSU vesting under our 2005 Equity Incentive Plan. We have not yet determined the ultimate disposition of the shares that we have repurchased in the past, and consequently we continue to hold them as treasury shares.
|
Dividends on Common Stock
|
During fiscal
2017
we declared and paid cash dividends that totaled
$
1.36
per share of outstanding common stock or approximately
$
353
million
. In August
2017
our Board of Directors declared a quarterly cash dividend of
$
0.39
per share of outstanding common stock payable on
October 18, 2017
to stockholders of record at the close of business on
October 10, 2017
. Future declarations of dividends and the establishment of future record dates and payment dates are subject to the final determination of our Board of Directors.
|
Description of 2005 Equity Incentive Plan
|
Our stockholders initially approved our 2005 Equity Incentive Plan (2005 Plan) on December 9, 2004. On January 19, 2017 our stockholders approved an Amended and Restated 2005 Equity Incentive Plan (Restated 2005 Plan) that expires on January 19, 2027 and approved an additional
23.1
million
shares for issuance under that plan. Under the Restated 2005 Plan, we are permitted to grant incentive and non-qualified stock options, restricted stock awards, restricted stock units (RSUs), stock appreciation rights and stock bonus awards to our employees, non-employee directors, and consultants. The Compensation and Organizational Development Committee of our Board of Directors or its delegates determine who will receive grants, when those grants will be exercisable, their exercise price and other terms. We are permitted to issue up to
138.1
million
shares under the Restated 2005 Plan. The plan provides a fungible share reserve. Each stock option granted on or after November 1, 2010 reduces the share reserve by
one
share and each restricted stock award or restricted stock unit granted reduces the share reserve by
2.3
shares. Stock options forfeited and returned to the pool of shares available for grant increase the pool by
one
share for each share forfeited. Restricted stock awards and RSUs forfeited and returned to the pool of shares available for grant increase the pool by
2.3
shares for each share forfeited. Shares withheld for income taxes upon vesting of RSUs that were granted on or after July 21, 2016 are also returned to the pool of shares available for grant. At
July 31, 2017
, there were approximately
25.2
million
shares available for grant under this plan. Stock options granted under the 2005 Plan and the Restated 2005 Plan typically vest over three years based on continued service and have a seven year term. RSUs granted under those plans typically vest over three years based on continued service. Certain RSUs granted to senior management vest based on the achievement of pre-established performance or market goals.
75
|
Description of Employee Stock Purchase Plan
|
On November 26, 1996 our stockholders initially adopted our Employee Stock Purchase Plan (ESPP) under Section 423 of the Internal Revenue Code. The ESPP permits our eligible employees to make payroll deductions to purchase our stock on regularly scheduled purchase dates at a discount. Our stockholders have approved amendments to the ESPP to permit the issuance of up to
23.8
million
shares under the ESPP, which expires upon the earliest to occur of (a) termination of the ESPP by the Board, or (b) issuance of all the shares of Intuit’s common stock reserved for issuance under the ESPP. Offering periods under the ESPP are
six months
in duration and composed of
two
consecutive three-month accrual periods. Shares are purchased at
85
%
of the lower of the closing price for Intuit common stock on the first day of the offering period or the last day of the accrual period.
Under the ESPP, employees purchased
752,605
shares of Intuit common stock during the twelve months ended
July 31, 2017
;
882,206
shares during the twelve months ended
July 31, 2016
; and
892,632
shares during the twelve months ended
July 31, 2015
. At
July 31, 2017
, there were
3,003,962
shares available for issuance under this plan.
|
Share-Based Compensation Expense
|
|
|
Twelve Months Ended July 31,
|
||||||||||
|
(In millions except per share amounts)
|
2017
|
2016
|
2015
|
||||||||
|
Cost of service and other revenue
|
$
|
|
|
$
|
|
|
$
|
|
|
||
|
Selling and marketing
|
|
|
|
|
|
|
|||||
|
Research and development
|
|
|
|
|
|
|
|||||
|
General and administrative
|
|
|
|
|
|
|
|||||
|
Total share-based compensation expense from continuing operations
|
|
|
|
|
|
|
|||||
|
Income tax benefit
|
(
|
)
|
(
|
)
|
(
|
)
|
|||||
|
Decrease in net income from continuing operations
|
$
|
|
|
$
|
|
|
$
|
|
|
||
|
Decrease in net income per share from continuing operations:
|
|
|
|
||||||||
|
Basic
|
$
|
|
|
$
|
|
|
$
|
|
|
||
|
Diluted
|
$
|
|
|
$
|
|
|
$
|
|
|
||
In the first quarter of fiscal 2017, we elected to early adopt ASU 2016-09,
“Compensation-Stock Compensation (Topic 718): Improvements to Employee Share-Based Payment Accounting.”
This new standard requires excess tax benefits recognized on stock-based compensation expense to be reflected in the statements of operations as a component of the provision for income taxes on a prospective basis. See Note 1, “
Description of Business and Summary of Significant Accounting Policies,
” for more information.
We capitalized
$
7
million
in share-based compensation related to internal use software projects during the twelve months ended
July 31, 2017
and
$
6
million
during the twelve months ended
July 31, 2016
. The table above also excludes share-based compensation expense for our discontinued operations, which totaled
$
3
million
during the twelve months ended
July 31, 2016
and
$
15
million
during the twelve months ended
July 31, 2015
. Because we have not reclassified our statements of cash flows to segregate discontinued operations, these amounts are included in share-based compensation expense on our statements of cash flows for that period.
|
Determining Fair Value
|
Valuation and Amortization Method
.
We estimate the fair value of stock options granted using a lattice binomial model and a multiple option award approach. Our stock options have various restrictions, including vesting provisions and restrictions on transfer, and are often exercised prior to their contractual maturity. We believe that lattice binomial models are more capable of incorporating the features of our stock options than closed-form models such as the Black Scholes model. The use of a lattice binomial model requires the use of extensive actual employee exercise behavior and a number of complex assumptions including the expected volatility of our stock price over the term of the options, risk-free interest rates and expected dividends. We amortize the fair value of options on a straight-line basis over the requisite service periods of the awards, which are generally the vesting periods.
Restricted stock units (RSUs) granted typically vest based on continued service. We value these time-based RSUs at the date of grant using the intrinsic value method. We amortize the fair value of time-based RSUs on a straight-line basis over the service period. Certain RSUs granted to senior management vest based on the achievement of pre-established performance or
76
market goals. We estimate the fair value of performance-based RSUs at the date of grant using the intrinsic value method and the probability that the specified performance criteria will be met. Each quarter we update our assessment of the probability that the specified performance criteria will be achieved and adjust our estimate of the fair value of the performance-based RSUs if necessary. We amortize the fair values of performance-based RSUs over the requisite service period for each separately vesting tranche of the award. We estimate the fair value of market-based RSUs at the date of grant using a Monte Carlo valuation methodology and amortize those fair values over the requisite service period for each separately vesting tranche of the award. The Monte Carlo methodology that we use to estimate the fair value of market-based RSUs at the date of grant incorporates into the valuation the possibility that the market condition may not be satisfied. Provided that the requisite service is rendered, the total fair value of the market-based RSUs at the date of grant must be recognized as compensation expense even if the market condition is not achieved. However, the number of shares that ultimately vest can vary significantly with the performance of the specified market criteria.
All of the RSUs we grant have dividend rights that are subject to the same vesting requirements as the underlying equity awards, so we do not adjust the market price of our stock on the date of grant for dividends.
Expected Term
. The expected term of options granted represents the period of time that they are expected to be outstanding and is a derived output of the lattice binomial model. The expected term of stock options is impacted by all of the underlying assumptions and calibration of our model. The lattice binomial model assumes that option exercise behavior is a function of the option’s remaining vested life and the extent to which the market price of our common stock exceeds the option exercise price. The lattice binomial model estimates the probability of exercise as a function of these two variables based on the history of exercises and cancellations on all past option grants made by us.
Expected Volatility
. We estimate the volatility of our common stock at the date of grant based on the implied volatility of one-year and two-year publicly traded options on our common stock. Our decision to use implied volatility was based upon the availability of actively traded options on our common stock and our assessment that implied volatility is more representative of future stock price trends than historical volatility.
Risk-Free Interest Rate
.
We base the risk-free interest rate that we use in our option valuation model on the implied yield in effect at the time of option grant on constant maturity U.S. Treasury issues with equivalent remaining terms.
Dividends
.
We use an annualized expected dividend yield in our option valuation model. We paid quarterly cash dividends during fiscal
2017
, fiscal
2016
, and fiscal
2015
and currently expect to continue to pay cash dividends in the future.
Forfeitures
.
We adjust share-based compensation expense for actual forfeitures as they occur. Prior to our adoption of ASU 2016-09 in the first quarter of fiscal 2017, we estimated forfeitures at the time of grant and revised those estimates in subsequent periods if actual forfeitures differed from those estimates. We used historical data to estimate pre-vesting option forfeitures and recorded share-based compensation expense only for those awards that were expected to vest.
|
|
Twelve Months Ended July 31,
|
|||||||
|
2017
|
2016
|
2015
|
||||||
|
Assumptions for stock options:
|
|
|
|
|||||
|
Expected volatility (range)
|
22% - 23%
|
|
22% - 26%
|
|
22% - 24%
|
|
||
|
Weighted average expected volatility
|
|
%
|
|
%
|
|
%
|
||
|
Risk-free interest rate (range)
|
1.65% - 1.70%
|
|
0.98% - 1.49%
|
|
1.13% - 1.47%
|
|
||
|
Expected dividend yield
|
0.97% - 1.17%
|
|
1.06% - 1.36%
|
|
0.93% - 1.05%
|
|
||
|
Assumptions for ESPP:
|
|
|
|
|||||
|
Expected volatility (range)
|
18% - 21%
|
|
23% - 26%
|
|
20% - 23%
|
|
||
|
Weighted average expected volatility
|
|
%
|
|
%
|
|
%
|
||
|
Risk-free interest rate (range)
|
0.30% - 0.89%
|
|
0.06% - 0.47%
|
|
0.01% - 0.15%
|
|
||
|
Expected dividend yield
|
1.09% - 1.10%
|
|
1.13% - 1.34%
|
|
0.96% - 1.19%
|
|
||
77
|
Share-Based Awards Available for Grant
|
|
(Shares in thousands)
|
Shares
Available
for Grant
|
|
|
Balance at July 31, 2014
|
|
|
|
Options granted
|
(
|
)
|
|
Restricted stock units granted
(1)
|
(
|
)
|
|
Share-based awards canceled/forfeited/expired
(1)(2)
|
|
|
|
Balance at July 31, 2015
|
|
|
|
Options granted
|
(
|
)
|
|
Restricted stock units granted
(1)
|
(
|
)
|
|
Share-based awards canceled/forfeited/expired
(1)(2)
|
|
|
|
Balance at July 31, 2016
|
|
|
|
Additional shares authorized
|
|
|
|
Options granted
|
(
|
)
|
|
Restricted stock units granted
(1)
|
(
|
)
|
|
Share-based awards canceled/forfeited/expired
(1)(2)
|
|
|
|
Balance at July 31, 2017
|
|
|
________________________________
|
(1)
|
|
|
(2)
|
|
78
|
Stock Option Activity and Related Share-Based Compensation Expense
|
|
|
Options Outstanding
|
|||||
|
(Shares in thousands)
|
Number of
Shares
|
Weighted Average
Exercise Price
Per Share
|
||||
|
Balance at July 31, 2014
|
|
|
|
$
|
|
|
|
Granted
|
|
|
|
|
||
|
Exercised
|
(
|
)
|
|
|
||
|
Canceled or expired
|
(
|
)
|
|
|
||
|
Balance at July 31, 2015
|
|
|
|
|
||
|
Granted
|
|
|
|
|
||
|
Exercised
|
(
|
)
|
|
|
||
|
Canceled or expired
|
(
|
)
|
|
|
||
|
Balance at July 31, 2016
|
|
|
|
|
||
|
Granted
|
|
|
|
|
||
|
Exercised
|
(
|
)
|
|
|
||
|
Canceled or expired
|
(
|
)
|
|
|
||
|
Balance at July 31, 2017
|
|
|
|
$
|
|
|
|
Number
of Shares
(in thousands)
|
Weighted
Average
Remaining
Contractual
Life
(in Years)
|
Weighted
Average
Exercise
Price per
Share
|
Aggregate
Intrinsic
Value
(in millions)
|
|||||||||
|
Options outstanding
|
|
|
|
|
$
|
|
|
$
|
|
|||
|
Options exercisable
|
|
|
|
|
$
|
|
|
$
|
|
|||
The aggregate intrinsic values at
July 31, 2017
are calculated as the difference between the exercise price of the underlying options and the market price of our common stock for shares that were in-the-money at that date. In-the-money options at
July 31, 2017
were options that had exercise prices that were lower than the
$
137.21
market price of our common stock at that date.
|
Twelve Months Ended July 31,
|
|||||||||||
|
(In millions except per share amounts)
|
2017
|
2016
|
2015
|
||||||||
|
Weighted average fair value of options granted (per share)
|
$
|
|
|
$
|
|
|
$
|
|
|
||
|
Total grant date fair value of options vested
|
$
|
|
|
$
|
|
|
$
|
|
|
||
|
Aggregate intrinsic value of options exercised
|
$
|
|
|
$
|
|
|
$
|
|
|
||
|
Share-based compensation expense for stock options and ESPP
|
$
|
|
|
$
|
|
|
$
|
|
|
||
|
Total tax benefit for stock option and ESPP share-based compensation
|
$
|
|
|
$
|
|
|
$
|
|
|
||
|
Cash received from option exercises
|
$
|
|
|
$
|
|
|
$
|
|
|
||
|
Cash tax benefits realized related to tax deductions for non-qualified option exercises and disqualifying dispositions under all share-based payment arrangements
|
$
|
|
|
$
|
|
|
$
|
|
|
||
In the first quarter of fiscal 2017, we elected to early adopt ASU 2016-09,
“Compensation-Stock Compensation (Topic 718): Improvements to Employee Share-Based Payment Accounting.”
This new standard requires excess tax benefits recognized on
79
stock-based compensation expense to be reflected in the statements of operations as a component of the provision for income taxes on a prospective basis. See Note 1, “
Description of Business and Summary of Significant Accounting Policies,
” for more information.
At
July 31, 2017
, there was approximately
$
85
million
of unrecognized compensation cost related to non-vested stock options with a weighted average vesting period of
2.4
years. We will adjust unrecognized compensation cost for actual forfeitures as they occur.
|
Restricted Stock Unit Activity and Related Share-Based Compensation Expense
|
|
(Shares in thousands)
|
Number
of Shares
|
Weighted
Average
Grant Date
Fair Value
|
||||
|
Nonvested at July 31, 2014
|
|
|
|
$
|
|
|
|
Granted
|
|
|
|
|
||
|
Assumed or granted in connection with acquisitions
|
|
|
|
|
||
|
Vested
|
(
|
)
|
|
|
||
|
Forfeited
|
(
|
)
|
|
|
||
|
Nonvested at July 31, 2015
|
|
|
|
|
||
|
Granted
|
|
|
|
|
||
|
Vested
|
(
|
)
|
|
|
||
|
Forfeited
|
(
|
)
|
|
|
||
|
Nonvested at July 31, 2016
|
|
|
|
|
||
|
Granted
|
|
|
|
|
||
|
Vested
|
(
|
)
|
|
|
||
|
Forfeited
|
(
|
)
|
|
|
||
|
Nonvested at July 31, 2017
|
|
|
|
$
|
|
|
|
Twelve Months Ended July 31,
|
|||||||||||
|
(In millions)
|
2017
|
2016
|
2015
|
||||||||
|
Total fair market value of shares vested
|
$
|
|
|
$
|
|
|
$
|
|
|
||
|
Share-based compensation for RSUs
|
$
|
|
|
$
|
|
|
$
|
|
|
||
|
Total tax benefit related to RSU share-based compensation expense
|
$
|
|
|
$
|
|
|
$
|
|
|
||
|
Cash tax benefits realized for tax deductions for RSUs
|
$
|
|
|
$
|
|
|
$
|
|
|
||
At
July 31, 2017
, there was
$
717
million
of unrecognized compensation cost related to non-vested RSUs with a weighted average vesting period of
2.4
years. We will adjust unrecognized compensation cost for actual forfeitures as they occur.
|
Accumulated Other Comprehensive Loss
|
Comprehensive income consists of two elements, net income and other comprehensive income (loss). Other comprehensive income (loss) items are recorded in the stockholders’ equity section of our balance sheets and excluded from net income. Our other comprehensive income (loss) consists of unrealized gains and losses on marketable debt securities classified as available-for-sale and foreign currency translation adjustments for subsidiaries with functional currencies other than the U.S. dollar.
80
|
July 31,
|
|||||||
|
(In millions)
|
2017
|
2016
|
|||||
|
Unrealized gains on available-for-sale debt securities
|
$
|
|
|
$
|
|
|
|
|
Foreign currency translation adjustments
|
(
|
)
|
(
|
)
|
|||
|
Total accumulated other comprehensive loss
|
$
|
(
|
)
|
$
|
(
|
)
|
|
|
11. Benefit Plans
|
|
Non-Qualified Deferred Compensation Plan
|
Intuit’s Non-Qualified Deferred Compensation Plan provides that executives who meet minimum compensation requirements are eligible to defer up to
75
%
of their salaries and up to
75
%
of their bonuses. We have agreed to credit the participants’ contributions with earnings that reflect the performance of certain independent investment funds. We do not guarantee above-market interest on account balances. We may also make discretionary employer contributions to participant accounts in certain circumstances. The timing, amounts, and vesting schedules of employer contributions are at the sole discretion of the Compensation and Organizational Development Committee of our Board of Directors or its delegate. The benefits under this plan are unsecured and are general assets of Intuit. Participants are generally eligible to receive payment of their vested benefit at the end of their elected deferral period or after termination of their employment with Intuit for any reason or at a later date to comply with the restrictions of Section 409A of the Internal Revenue Code. Participants may elect to receive their payments in a lump sum or installments. Discretionary company contributions and the related earnings vest completely upon the participant’s disability, death, or a change in control of Intuit. We made no employer contributions to the plan for any period presented.
We had liabilities related to this plan of
$
83
million at
July 31, 2017
and
$
69
million at
July 31, 2016
. We have matched the plan liabilities with similar-performing assets, which are primarily investments in life insurance contracts. These assets are recorded in other long-term assets while liabilities related to obligations are recorded in other current liabilities on our balance sheets.
|
401(k) Plan
|
|
12. Litigation
|
In fiscal 2015 Intuit was contacted by regulatory authorities, including Congress, the Federal Trade Commission, the SEC, the Department of Justice and certain state Attorneys General, which are conducting inquiries in connection with the increase during the 2015 tax season in attempts by criminals using stolen identity information to file fraudulent tax returns and claim refunds at the state and federal levels. Intuit is cooperating with all such government inquiries, including formal requests for information. In addition, we are the subject of certain actions, including a consolidated putative class action lawsuits by individuals who claim to have suffered damages in connection with the foregoing events. We believe that the allegations contained within these lawsuits are without merit, and we intend to vigorously defend against them.
81
|
13. Segment Information
|
We have defined
three
reportable segments, described below, based on factors such as how we manage our operations and how our chief operating decision maker views results. We define the chief operating decision maker as our Chief Executive Officer and our Chief Financial Officer. Our chief operating decision maker organizes and manages our business primarily on the basis of product and service offerings.
|
Small Business
:
This segment targets small businesses, the self-employed, and the accounting professionals who serve and advise them around the globe. Our offerings include QuickBooks financial and business management online services and desktop software, payroll solutions, and payment processing solutions.
Consumer Tax
:
This segment targets consumers and includes TurboTax income tax preparation products and services sold in the U.S. and Canada.
ProConnect
:
This segment targets professional accountants in the U.S. and Canada, who are essential to both small business success and tax preparation and filing. Our ProConnect professional tax offerings include Lacerte, ProSeries, ProFile, and ProConnect Tax Online.
|
All of our segments operate primarily in the United States and sell primarily to customers in the United States. International total net revenue was less than
5
%
of consolidated total net revenue for the twelve months ended July 31,
2017
,
2016
and
2015
.
We include expenses such as corporate selling and marketing, product development, and general and administrative expenses and share-based compensation expenses, which are not allocated to specific segments, in unallocated corporate items. Unallocated corporate items also include amortization of acquired technology, amortization of other acquired intangible assets, and goodwill and intangible asset impairment charges.
The accounting policies of our reportable segments are the same as those described in the summary of significant accounting policies in Note 1. Except for goodwill and purchased intangible assets, we do not generally track assets by reportable segment and, consequently, we do not disclose total assets by reportable segment. See Note 5,
“Goodwill and Acquired Intangible Assets,”
for goodwill by reportable segment.
|
|
Twelve Months Ended July 31,
|
||||||||||
|
(In millions)
|
2017
|
2016
|
2015
|
||||||||
|
Net revenue:
|
|
|
|||||||||
|
Small Business
|
$
|
|
|
$
|
|
|
$
|
|
|
||
|
Consumer Tax
|
|
|
|
|
|
|
|||||
|
ProConnect
|
|
|
|
|
|
|
|||||
|
Total net revenue
|
$
|
|
|
$
|
|
|
$
|
|
|
||
|
Operating income from continuing operations:
|
|
|
|
||||||||
|
Small Business
|
$
|
|
|
$
|
|
|
$
|
|
|
||
|
Consumer Tax
|
|
|
|
|
|
|
|||||
|
ProConnect
|
|
|
|
|
|
|
|||||
|
Total segment operating income
|
|
|
|
|
|
|
|||||
|
Unallocated corporate items:
|
|
|
|
||||||||
|
Share-based compensation expense
|
(
|
)
|
(
|
)
|
(
|
)
|
|||||
|
Other common expenses
|
(
|
)
|
(
|
)
|
(
|
)
|
|||||
|
Amortization of acquired technology
|
(
|
)
|
(
|
)
|
(
|
)
|
|||||
|
Amortization of other acquired intangible assets
|
(
|
)
|
(
|
)
|
(
|
)
|
|||||
|
Goodwill and intangible asset impairment charges
|
|
|
|
|
(
|
)
|
|||||
|
Total unallocated corporate items
|
(
|
)
|
(
|
)
|
(
|
)
|
|||||
|
Total operating income from continuing operations
|
$
|
|
|
$
|
|
|
$
|
|
|
||
82
|
14. Selected Quarterly Financial Data
(Unaudited)
|
|
|
Fiscal 2017 Quarter Ended
|
||||||||||||||
|
(In millions, except per share amounts)
|
October 31
|
January 31
|
April 30
|
July 31
|
|||||||||||
|
Total net revenue
|
$
|
|
|
$
|
|
|
$
|
|
|
$
|
|
|
|||
|
Cost of revenue
|
|
|
|
|
|
|
|
|
|||||||
|
All other costs and expenses
|
|
|
|
|
|
|
|
|
|||||||
|
Operating income (loss)
|
(
|
)
|
|
|
|
|
(
|
)
|
|||||||
|
Net income (loss)
|
(
|
)
|
|
|
|
|
|
|
|||||||
|
Basic net income (loss) per share
|
$
|
(
|
)
|
$
|
|
|
$
|
|
|
$
|
|
|
|||
|
Diluted net income (loss) per share
|
$
|
(
|
)
|
$
|
|
|
$
|
|
|
$
|
|
|
|||
|
|
Fiscal 2016 Quarter Ended
|
||||||||||||||
|
(In millions, except per share amounts)
|
October 31
|
January 31
|
April 30
|
July 31
|
|||||||||||
|
Total net revenue
|
$
|
|
|
$
|
|
|
$
|
|
|
$
|
|
|
|||
|
Cost of revenue
|
|
|
|
|
|
|
|
|
|||||||
|
All other costs and expenses
|
|
|
|
|
|
|
|
|
|||||||
|
Operating income (loss) from continuing operations
|
(
|
)
|
|
|
|
|
(
|
)
|
|||||||
|
Net income (loss) from continuing operations
|
(
|
)
|
|
|
|
|
(
|
)
|
|||||||
|
Net income (loss) from discontinued operations
|
|
|
(
|
)
|
|
|
|
|
|||||||
|
Net income (loss)
|
(
|
)
|
|
|
|
|
(
|
)
|
|||||||
|
Basic net income (loss) per share from continuing operations
|
$
|
(
|
)
|
$
|
|
|
$
|
|
|
$
|
(
|
)
|
|||
|
Basic net income (loss) per share from discontinued operations
|
|
|
(
|
)
|
|
|
|
|
|||||||
|
Basic net income (loss) per share
|
$
|
(
|
)
|
$
|
|
|
$
|
|
|
$
|
(
|
)
|
|||
|
Diluted net income (loss) per share from continuing operations
|
$
|
(
|
)
|
$
|
|
|
$
|
|
|
$
|
(
|
)
|
|||
|
Diluted net income (loss) per share from discontinued operations
|
|
|
(
|
)
|
|
|
|
|
|||||||
|
Diluted net income (loss) per share
|
$
|
(
|
)
|
$
|
|
|
$
|
|
|
$
|
(
|
)
|
|||
83
|
INTUIT INC.
SCHEDULE II - VALUATION AND QUALIFYING ACCOUNTS
|
|||||||||||||||
|
(In millions)
|
Beginning
Balance
|
Additions
Charged to
Expense/
Revenue
|
Deductions
|
Ending
Balance
|
|||||||||||
|
Year ended July 31, 2017
|
|
|
|
|
|||||||||||
|
Allowance for doubtful accounts
|
$
|
|
|
$
|
|
|
$
|
(
|
)
|
$
|
|
|
|||
|
Reserve for product returns
|
|
|
|
|
(
|
)
|
|
|
|||||||
|
Reserve for promotional discounts and rebates
|
|
|
|
|
(
|
)
|
|
|
|||||||
|
Year ended July 31, 2016
|
|
|
|
|
|||||||||||
|
Allowance for doubtful accounts
|
$
|
|
|
$
|
|
|
$
|
(
|
)
|
$
|
|
|
|||
|
Reserve for product returns
|
|
|
|
|
(
|
)
|
|
|
|||||||
|
Reserve for promotional discounts and rebates
|
|
|
|
|
(
|
)
|
|
|
|||||||
|
Year ended July 31, 2015
|
|
|
|
|
|||||||||||
|
Allowance for doubtful accounts
|
$
|
|
|
$
|
|
|
$
|
(
|
)
|
$
|
|
|
|||
|
Reserve for product returns
|
|
|
|
|
(
|
)
|
|
|
|||||||
|
Reserve for promotional discounts and rebates
|
|
|
|
|
(
|
)
|
|
|
|||||||
|
Notes:
|
|
84
|
|
None.
|
|
Evaluation of Disclosure Controls and Procedures
Based upon an evaluation of the effectiveness of disclosure controls and procedures, Intuit’s Chief Executive Officer (CEO) and Chief Financial Officer (CFO) have concluded that as of the end of the period covered by this Annual Report on Form 10-K our disclosure controls and procedures as defined under Exchange Act Rules 13a-15(e) and 15d-15(e) were effective to provide reasonable assurance that information required to be disclosed in our Exchange Act reports is recorded, processed, summarized, and reported within the time periods specified by the Securities and Exchange Commission and is accumulated and communicated to management, including the CEO and CFO, as appropriate to allow timely decisions regarding required disclosure.
Management’s Report on Internal Control over Financial Reporting
Our management is responsible for establishing and maintaining adequate internal control over financial reporting, as such term is defined in Exchange Act Rules 13a-15(f) and 15d-15(f). Under the supervision and with the participation of our management, including our Chief Executive Officer and Chief Financial Officer, we conducted an evaluation of the effectiveness of our internal control over financial reporting as of
July 31, 2017
based on the guidelines established in
Internal Control – Integrated Framework
issued by the Committee of Sponsoring Organizations of the Treadway Commission (COSO). Based on the results of this evaluation, our management has concluded that our internal control over financial reporting was effective as of
July 31, 2017
to provide reasonable assurance regarding the reliability of financial reporting and the preparation of financial statements for external reporting purposes in accordance with generally accepted accounting principles. We reviewed the results of management’s assessment with the Audit and Risk Committee of Intuit’s Board of Directors.
Ernst & Young LLP, an independent registered public accounting firm, has audited the effectiveness of our internal control over financial reporting as of
July 31, 2017
. Their report is included in Item 8 of this Annual Report on Form 10-K.
Changes in Internal Control over Financial Reporting
During our most recent fiscal quarter, there has not occurred any change in our internal control over financial reporting that has materially affected, or is reasonably likely to materially affect, our internal control over financial reporting.
Inherent Limitations on Effectiveness of Controls
Our management, including our Chief Executive Officer and Chief Financial Officer, believes that our disclosure controls and procedures and internal control over financial reporting are designed to provide reasonable assurance of achieving their objectives and that they are effective at the reasonable assurance level. However, no matter how well conceived and executed, a control system can provide only reasonable and not absolute assurance that the objectives of the control system are met. The design of any control system must reflect the fact that there are resource constraints and the benefits of controls must be considered relative to their costs. There are also limitations that are inherent in any control system. These limitations include the realities that breakdowns can occur because of errors in judgment or mistakes, and that controls can be circumvented by individual persons, by collusion of two or more people, or by management override of the controls. Because of these inherent limitations in a cost effective control system, misstatements due to error or fraud may occur and not be detected.
|
|
None.
85
|
|
Except for the information about our executive officers shown below, the information required by this Item 10 is incorporated by reference from the information contained in our Proxy Statement to be filed with the U.S. Securities and Exchange Commission in connection with the solicitation of proxies for our
2018
Annual Meeting of Stockholders (the “
2018
Proxy Statement”) under the sections entitled “Our Board of Directors and Nominees – Directors Standing for Election,” “Corporate Governance,” and “Security Ownership of Certain Beneficial Owners and Management – Section 16(a) Beneficial Ownership Reporting Compliance.”
We maintain a Code of Conduct and Ethics that applies to all employees, including all officers. We also maintain a Board of Directors Code of Ethics that applies to all members of our Board of Directors. Our Code of Conduct and Ethics and Board of Directors Code of Ethics incorporate guidelines designed to deter wrongdoing and to promote honest and ethical conduct and compliance with applicable laws and regulations. Our Code of Conduct and Ethics and Board of Directors Code of Ethics are published on our Investor Relations website at
http://s21.q4cdn.com/374309911/files/doc_downloads/corporate_governance/INT_Intuit_Code-2016-Final.pdf
and
http://s21.q4cdn.com/374309911/files/doc_downloads/bod/BOD_Code_of_Ethics.pdf,
respectively. We disclose amendments to certain provisions of our Code of Conduct and Ethics and Board of Directors Code of Ethics, or waivers of such provisions granted to executive officers and directors, on this website.
EXECUTIVE OFFICERS
The following table shows Intuit’s executive officers and their areas of responsibility as of July 31,
2017
. Their biographies follow the table.
|
Name
|
Age
|
Position
|
|||
|
Brad D. Smith
|
53
|
|
Chairman of the Board of Directors, President and Chief Executive Officer
|
||
|
Scott D. Cook
|
65
|
|
Chairman of the Executive Committee
|
||
|
Laura A. Fennell
|
56
|
|
Executive Vice President, General Counsel and Corporate Secretary
|
||
|
Sasan K. Goodarzi
|
49
|
|
Executive Vice President and General Manager, Small Business Group
|
||
|
H. Tayloe Stansbury
|
56
|
|
Executive Vice President and Chief Technology Officer
|
||
|
Daniel A. Wernikoff
|
45
|
|
Executive Vice President and General Manager, Consumer Tax Group
|
||
|
R. Neil Williams
|
64
|
|
Executive Vice President and Chief Financial Officer
|
||
|
Mark J. Flournoy
|
51
|
|
Vice President, Corporate Controller and Chief Accounting Officer
|
||
Mr. Smith has been President and Chief Executive Officer and a member of the Board of Directors since January 2008. He became Chairman of the Board in January 2016. He was Senior Vice President and General Manager, Small Business Division from May 2006 to December 2007 and Senior Vice President and General Manager, QuickBooks from May 2005 to May 2006. He also served as Senior Vice President and General Manager, Consumer Tax Group from March 2004 until May 2005 and as Vice President and General Manager of Intuit’s Accountant Central and Developer Network from February 2003 to March 2004. Prior to joining Intuit in February 2003, Mr. Smith was Senior Vice President of Marketing and Business Development at ADP, a provider of business outsourcing solutions, where he held several executive positions from 1996 to 2003. Mr. Smith also serves on the boards of directors of Nordstrom, Inc. and SurveyMonkey Inc. Mr. Smith holds a Bachelor’s degree in Business Administration from Marshall University and a Master’s degree in Management from Aquinas College.
Mr. Cook, a founder of Intuit, has been an Intuit director since March 1984 and is currently Chairman of the Executive Committee. He served as Intuit’s Chairman of the Board from February 1993 through July 1998. From April 1984 to April 1994, he served as Intuit’s President and Chief Executive Officer. Mr. Cook also serves on the board of directors of The Procter & Gamble Company. Mr. Cook holds a Bachelor of Arts degree in Economics and Mathematics from the University of Southern California and a Master’s degree in Business Administration from Harvard Business School.
Ms. Fennell has been Executive Vice President, General Counsel and Corporate Secretary since August 2015 and previously served as Senior Vice President, General Counsel and Corporate Secretary from February 2007. She leads Intuit’s legal, corporate affairs, privacy, and information security teams. Ms. Fennell joined Intuit as Vice President, General Counsel and Corporate Secretary in April 2004. Prior to joining Intuit, Ms. Fennell spent nearly eleven years at Sun Microsystems, Inc., most recently as Vice President of Corporate Legal Resources, as well as Acting General Counsel. Prior to joining Sun, she was an associate attorney at Wilson Sonsini, Goodrich & Rosati PC. Ms. Fennell sits on the board of directors of the Children’s Discovery Museum of San Jose. Ms. Fennell holds a Bachelor of Science degree in Business Administration from California State University, Chico and a Juris Doctor from Santa Clara University.
86
Mr. Goodarzi has been Executive Vice President and General Manager of Intuit’s Small Business Group since May 2016. He previously was Executive Vice President and General Manager of Intuit’s Consumer Tax Group from August 2015 through April 2016 and from August 2013 to July 2015 served as Senior Vice President and General Manager of the Consumer Tax Group. He rejoined Intuit in August 2011 as Senior Vice President and Chief Information Officer, serving in that capacity until July 2013, prior to which he had served as Chief Executive Officer of Nexant Inc., a privately held provider of intelligent grid software and clean energy solutions, since November 2010. During his previous tenure at Intuit from 2004 to 2010, Mr. Goodarzi led several business units including Intuit Financial Services and the professional tax division. Prior to joining Intuit, Mr. Goodarzi worked for Invensys, a global provider of industrial automation, transportation and controls technology, serving as global president of the products group. He also held a number of senior leadership roles in the automation control division at Honeywell and served as the chief executive officer and co-founder of a technology startup, Lazer Cables Inc. Mr. Goodarzi holds a Bachelor’s degree in Electrical Engineering from the University of Central Florida and a Master’s degree in Business Administration from the Kellogg School of Management at Northwestern University.
Mr. Stansbury has been Executive Vice President and Chief Technology Officer since August 2015 and joined Intuit in May 2009 as Senior Vice President and Chief Technology Officer. Mr. Stansbury previously served as chief information officer of VMware. Earlier he was executive vice president of Ariba and held executive engineering and general management roles at Calico Commerce and Xerox, led developer tools engineering groups at Borland International and Sun Microsystems, and researched intelligent systems at Xerox PARC. Mr. Stansbury serves on the boards of Coupa Software Inc. and Shutterfly, Inc. Mr. Stansbury holds a Bachelor’s degree in Applied Mathematics from Harvard University.
Mr. Wernikoff has been Executive Vice President and General Manager of Intuit’s Consumer Tax Group since May 2016. He previously was Executive Vice President and General Manager of Intuit’s Small Business Group from August 2015 through April 2016 and from April 2014 to July 2015 served as Senior Vice President and General Manager of the Small Business Group. He previously was the Senior Vice President and General Manager of Intuit’s Small Business Financial Solutions Group from August 2013. From August 2010 to July 2013, he served as General Manager of Intuit’s Financial Management Solutions business unit and was promoted from Vice President to Senior Vice President in August 2011. Mr. Wernikoff joined Intuit in March 2003 and was promoted to Vice President in August 2007. He held various executive roles in Payments, QuickBooks and Financial Management Solutions from August 2007 to August 2010. Mr. Wernikoff’s previous experience includes leadership positions at Charles Schwab, Bank One Corp., and First Chicago Capital Markets. Mr. Wernikoff holds a Bachelor’s degree in Finance from Miami University of Ohio and a Master’s degree in Business Administration from the University of Pittsburgh.
Mr. Williams has been Executive Vice President and Chief Financial Officer since August 2015 and joined Intuit in January 2008 as Senior Vice President and Chief Financial Officer. He is responsible for all financial aspects of the company, including corporate strategy and business development, investor relations, financial operations and real estate. Beginning in 2001, he served as Executive Vice President of Visa U.S.A., Inc., the leading payments company in the U.S., and then from November 2004 to September 2007 served as Chief Financial Officer, leading all financial functions for the company and its subsidiaries. During the same period, Mr. Williams held the dual role of Chief Financial Officer for Inovant LLC, Visa’s global IT organization responsible for global transactions processing and technology development. Mr. Williams also serves on the boards of directors of Amyris, Inc. and RingCentral, Inc. Mr. Williams holds a Bachelor’s degree in Business Administration from the University of Southern Mississippi and he is a certified public accountant.
Mr. Flournoy was appointed as Vice President and Chief Accounting Officer in February 2014. He joined Intuit in 2003 as director of general accounting and internal controls and was named Corporate Controller in 2012. From 1996 to 2003, Mr. Flournoy served as a corporate controller for various private and public companies in California. He began his career in public accounting at Ernst & Young, where he served from 1992 to 1996. Mr. Flournoy holds a Bachelor’s degree in Business Administration – Finance from the University of Southern California and a secondary Bachelor’s degree in Accounting from San Diego State University.
|
|
The information required by this Item 11 is incorporated by reference from the information contained in our
2018
Proxy Statement under the sections entitled “Corporate Governance – Compensation Committee Interlocks and Insider Participation,” “Director Compensation,” “Equity Compensation Plan Information,” and “Executive Compensation.”
|
|
The information required by this Item 12 is incorporated by reference from the information contained in our
2018
Proxy Statement under the sections entitled “Security Ownership of Certain Beneficial Owners and Management” and “Executive Compensation.”
87
|
|
The information required by this Item 13 is incorporated by reference from the information contained in our
2018
Proxy Statement under the sections entitled “Corporate Governance – Director Independence” and “Transactions with Related Persons.”
|
|
The information required by this Item 14 is incorporated by reference from the information contained in our
2018
Proxy Statement under the section entitled “Proposal No. 2 – Ratification of Selection of Independent Registered Public Accounting Firm.”
|
|
|
(a)
|
The following documents are filed as part of this report:
|
|
1.
|
Financial Statements
– See Index to Consolidated Financial Statements in Part II, Item 8.
|
|
2.
|
Financial Statement Schedules
– See Index to Consolidated Financial Statements in Part II, Item 8.
|
|
3.
|
Exhibits
– See Exhibit Index immediately following the signature page of this Annual Report on Form 10-K.
|
88
|
SIGNATURES
|
Pursuant to the requirements of Section 13 or 15(d) of the Securities Exchange Act of 1934, the Registrant has duly caused this Form 10-K to be signed on its behalf by the undersigned, thereunto duly authorized.
|
|
|
INTUIT INC.
|
|
||
|
Dated:
|
September 1, 2017
|
By:
|
/s/ R. NEIL WILLIAMS
|
|
|
|
|
|
R. Neil Williams
|
|
||
|
|
|
Executive Vice President and Chief Financial Officer
(Principal Financial Officer)
|
|
||
89
|
POWER OF ATTORNEY
|
By signing this Annual Report on Form 10-K below, I hereby appoint each of Brad D. Smith and R. Neil Williams as my attorney-in-fact to sign all amendments to this Form 10-K on my behalf, and to file this Form 10-K (including all exhibits and other documents related to the Form 10-K) with the Securities and Exchange Commission. I authorize each of my attorneys-in-fact to (1) appoint a substitute attorney-in-fact for himself and (2) perform any actions that he believes are necessary or appropriate to carry out the intention and purpose of this Power of Attorney. I ratify and confirm all lawful actions taken directly or indirectly by my attorneys-in-fact and by any properly appointed substitute attorneys-in-fact.
Pursuant to the requirements of the Securities Exchange Act of 1934, this report has been signed by the following persons on behalf of the Registrant and in the capacities and on the dates indicated.
|
Name
|
Title
|
Date
|
||
|
Principal Executive Officer:
|
|
|
||
|
/s/ BRAD D. SMITH
|
Chairman of the Board of Directors, President and Chief Executive Officer
|
September 1, 2017
|
||
|
Brad D. Smith
|
||||
|
|
|
|
||
|
Principal Financial Officer:
|
|
|
||
|
/s/ R. NEIL WILLIAMS
|
Executive Vice President and Chief Financial Officer
|
September 1, 2017
|
||
|
R. Neil Williams
|
||||
|
|
|
|
||
|
Principal Accounting Officer:
|
|
|
||
|
/s/ MARK J. FLOURNOY
|
Vice President, Corporate Controller and Chief Accounting Officer
|
September 1, 2017
|
||
|
Mark J. Flournoy
|
||||
|
|
|
|
||
|
Additional Directors:
|
|
|
||
|
/s/ EVE BURTON
|
Director
|
September 1, 2017
|
||
|
Eve Burton
|
||||
|
/s/ SCOTT D. COOK
|
Director
|
September 1, 2017
|
||
|
Scott D. Cook
|
||||
|
/s/ RICHARD DALZELL
|
Director
|
September 1, 2017
|
||
|
Richard Dalzell
|
||||
|
|
|
|
||
|
/s/ DIANE B. GREENE
|
Director
|
September 1, 2017
|
||
|
Diane B. Greene
|
||||
|
/s/ DEBORAH LIU
|
Director
|
September 1, 2017
|
||
|
Deborah Liu
|
||||
|
|
|
|
||
|
/s/ SUZANNE NORA JOHNSON
|
Director
|
September 1, 2017
|
||
|
Suzanne Nora Johnson
|
||||
|
/s/ DENNIS D. POWELL
|
Director
|
September 1, 2017
|
||
|
Dennis D. Powell
|
||||
|
/s/ RAUL VAZQUEZ
|
Director
|
September 1, 2017
|
||
|
Raul Vazquez
|
||||
|
/s/ JEFF WEINER
|
Director
|
September 1, 2017
|
||
|
Jeff Weiner
|
||||
90
|
EXHIBIT INDEX
|
|
Exhibit Number
|
Exhibit Description
|
Filed Herewith
|
Incorporated by Reference Form/File No.
|
Date
|
|||
|
|
|
|
|
|
|||
|
3.01
|
|
10-Q
|
6/14/2000
|
||||
|
|
|
|
|
|
|||
|
3.02
|
|
8-K
|
5/9/2016
|
||||
|
|
|
|
|
|
|||
|
4.01
|
|
10-K
|
9/15/2009
|
||||
|
|
|
|
|
|
|||
|
4.02
|
|
8-K
|
3/7/2007
|
||||
|
|
|
|
|
|
|||
|
4.03
|
|
8-K
|
3/12/2007
|
||||
|
|
|
|
|
|
|||
|
10.01+
|
|
8-K
|
4/28/2008
|
||||
|
|
|
|
|
|
|||
|
10.02+
|
|
S-8
333-156205
|
12/17/2008
|
||||
|
|
|
|
|
|
|||
|
10.03+
|
|
S-8
333-163728
|
12/15/2009
|
||||
|
|
|
|
|
|
|||
|
10.04+
|
S-8
333-171768
|
1/19/2011
|
|||||
|
|
|
|
|
|
|||
|
10.05+
|
8-K
|
7/27/2012
|
|||||
|
10.06+
|
S-8 333-193551
|
1/24/2014
|
|||||
|
10.07+
|
S-8 333-215639
|
1/20/2017
|
|||||
|
10.08+
|
10-Q
|
12/10/2004
|
|||||
|
10.09+
|
|
10-Q
|
12/10/2004
|
||||
|
|
|
|
|
|
|||
|
10.10+
|
|
10-Q
|
12/1/2011
|
||||
|
10.11+
|
10-Q
|
2/25/2016
|
|||||
|
|
|||||||
|
10.12+
|
10-Q
|
3/1/2013
|
|||||
|
10.13+
|
10-Q
|
3/1/2013
|
|||||
|
10.14+
|
10-Q
|
3/1/2013
|
|||||
|
10.15+
|
10-Q
|
3/1/2013
|
|||||
|
10.16+
|
10-Q
|
3/1/2013
|
|||||
91
|
Exhibit Number
|
Exhibit Description
|
Filed Herewith
|
Incorporated by Reference Form/File No.
|
Date
|
|||
|
10.17+
|
X
|
||||||
|
10.18+
|
10-K
|
9/1/2016
|
|||||
|
10.19+
|
10-K
|
9/13/2013
|
|||||
|
10.20+
|
10-Q
|
11/21/2014
|
|||||
|
10.21+
|
10-K
|
9/1/2015
|
|||||
|
10.22+
|
10-K
|
9/1/2015
|
|||||
|
10.23+
|
10-K
|
9/13/2012
|
|||||
|
10.24+
|
10-K
|
9/13/2012
|
|||||
|
10.25+
|
10-K
|
9/13/2012
|
|||||
|
10.26+
|
10-K
|
9/13/2012
|
|||||
|
10.27+
|
10-K
|
9/13/2012
|
|||||
|
|
|||||||
|
10.28+
|
10-K
|
9/13/2012
|
|||||
|
|
|||||||
|
10.29+
|
10-K
|
9/13/2012
|
|||||
|
10.30+
|
10-K
|
9/12/2014
|
|||||
|
10.31+
|
10-K
|
9/16/2010
|
|||||
|
|
|
|
|
||||
|
10.32+
|
10-K
|
9/16/2010
|
|||||
|
10.33+
|
10-K
|
9/16/2010
|
|||||
|
10.34+
|
10-Q
|
5/24/2016
|
|||||
|
|
|||||||
|
10.35+
|
10-Q
|
2/29/2012
|
|||||
|
|
|||||||
|
10.36+
|
10-K
|
9/13/2012
|
|||||
|
10.37+
|
10-K
|
9/13/2012
|
|||||
|
|
|||||||
92
|
Exhibit Number
|
Exhibit Description
|
Filed Herewith
|
Incorporated by Reference Form/File No.
|
Date
|
|||
|
10.38+
|
|
10-Q
|
12/4/2008
|
||||
|
|
|
|
|
||||
|
10.39+
|
S-8
|
8/5/2009
|
|||||
|
10.40+
|
|
S-8
|
8/5/2009
|
||||
|
|
|
|
|
|
|||
|
10.41+
|
|
10-K
|
9/12/2008
|
||||
|
|
|||||||
|
10.42+
|
|
10-K
|
9/12/2008
|
||||
|
10.43+
|
|
10-K
|
9/15/2009
|
||||
|
|
|
|
|
|
|||
|
10.44+
|
|
10-Q
|
12/10/2004
|
||||
|
|
|
|
|
|
|||
|
10.45+
|
10-K
|
9/1/2015
|
|||||
|
|
|
|
|
||||
|
10.46+
|
10-K
|
9/1/2016
|
|||||
|
|
|
|
|
|
|||
|
10.47+
|
X
|
||||||
|
|
|||||||
|
10.48+
|
|
10-Q
|
5/31/2002
|
||||
|
|
|||||||
|
10.49+
|
10-K
|
9/13/2013
|
|||||
|
|
|||||||
|
10.50+
|
|
10-Q
|
2/23/2017
|
||||
|
|
|
|
|
|
|||
|
10.51+
|
|
10-Q
|
12/4/2008
|
||||
|
|
|||||||
|
10.52+
|
10-K
|
9/13/2013
|
|||||
|
|
|
|
|
||||
|
10.53+
|
10--K
|
9/12/2014
|
|||||
|
10.54+
|
10-K
|
9/1/2015
|
|||||
|
|
|
|
|
|
|||
|
10.55+
|
10-K
|
9/13/2013
|
|||||
|
|
|||||||
|
10.56+
|
10-K
|
9/1/2016
|
|||||
|
10.57+
|
X
|
||||||
|
10.58+
|
|
10-Q
|
12/4/2008
|
||||
|
10.59+
|
|
8-K
|
10/5/2007
|
||||
|
10.60+
|
|
8-K
|
11/8/2007
|
||||
93
|
Exhibit Number
|
Exhibit Description
|
Filed Herewith
|
Incorporated by Reference Form/File No.
|
Date
|
|||
|
10.61+
|
10-K
|
9/12/2014
|
|||||
|
|
|||||||
|
10.62
|
10-Q
|
2/25/2016
|
|||||
|
|
|||||||
|
10.63
|
10-Q
|
2/29/2012
|
|||||
|
|
|
|
|
||||
|
10.64
|
10-Q
|
12/5/2005
|
|||||
|
10.65
|
10-Q
|
12/4/2009
|
|||||
|
10.66
|
10-K
|
9/12/2014
|
|||||
|
|
|||||||
|
10.67
|
10-K
|
9/1/2015
|
|||||
|
10.68#
|
|
10-K
|
9/19/2003
|
||||
|
|
|
||||||
|
10.69
|
|
10-K
|
9/14/2007
|
||||
|
|
|
||||||
|
10.70#
|
|
10-Q
|
5/30/2008
|
||||
|
|
|||||||
|
10.71#
|
10-Q
|
12/6/2010
|
|||||
|
|
|||||||
|
10.72
|
10-Q
|
11/22/2013
|
|||||
|
|
|
|
|
||||
|
10.73
|
10-K
|
9/12/2014
|
|||||
|
|
|
|
|
||||
|
10.74#
|
8-K
|
11/16/2015
|
|||||
|
|
|
|
|
||||
|
10.75
|
|
10-K
|
9/19/2003
|
||||
|
10.76
|
|
10-K
|
9/19/2003
|
||||
|
10.77
|
10-Q
|
3/1/2011
|
|||||
94
|
Exhibit Number
|
Exhibit Description
|
Filed Herewith
|
Incorporated by Reference Form/File No.
|
Date
|
|||
|
10.78
|
10-Q
|
3/1/2011
|
|||||
|
21.01
|
X
|
|
|||||
|
23.01
|
X
|
|
|||||
|
24.01
|
X
|
|
|||||
|
|
|
|
|
||||
|
31.01
|
X
|
|
|||||
|
|
|
|
|
||||
|
31.02
|
X
|
|
|||||
|
|
|
|
|
||||
|
32.01*
|
X
|
|
|||||
|
|
|
|
|
||||
|
32.02*
|
X
|
|
|||||
|
|
|
|
|
||||
|
101.INS
|
XBRL Instance Document - the instance document does not appear in the Interactive Data File because its XBRL tags are embedded within the Inline XBRL document
|
X
|
|
||||
|
|
|
|
|
||||
|
101.SCH
|
XBRL Taxonomy Extension Schema
|
X
|
|
||||
|
|
|
|
|
||||
|
101.CAL
|
XBRL Taxonomy Extension Calculation Linkbase
|
X
|
|
||||
|
|
|
|
|
||||
|
101.LAB
|
XBRL Taxonomy Extension Label Linkbase
|
X
|
|
||||
|
|
|
|
|
||||
|
101.PRE
|
XBRL Taxonomy Extension Presentation Linkbase
|
X
|
|
||||
|
|
|
|
|
||||
|
101.DEF
|
XBRL Taxonomy Extension Definition Linkbase
|
X
|
|
||||
______________________
|
+
|
Indicates a management contract or compensatory plan or arrangement.
|
|
|
#
|
We have requested confidential treatment for certain portions of this document pursuant to an application for confidential treatment sent to the Securities and Exchange Commission (SEC). We omitted such portions from this filing and filed them separately with the SEC.
|
|
|
*
|
This certification is not deemed “filed” for purposes of Section 18 of the Securities Exchange Act of 1934, or otherwise subject to the liability of that section. Such certification will not be deemed to be incorporated by reference into any filing under the Securities Act of 1933 or the Securities Exchange Act of 1934, except to the extent that Intuit specifically incorporates it by reference.
|
|
95
TABLE OF CONTENTS
Part IItem 1 - BusinessItem 1A - Risk FactorsItem 1B - Unresolved Staff CommentsItem 2 - PropertiesItem 3 - Legal ProceedingsItem 4 - Mine Safety DisclosuresPart IIItem 5 - Market For Registrant S Common Equity, Related Stockholder Matters and Issuer Purchases Of Equity SecuritiesItem 6 - Selected Financial DataItem 7 - Management S Discussion and Analysis Of Financial Condition and Results Of OperationsItem 7A - Quantitative and Qualitative Disclosures About Market RiskItem 8 - Financial Statements and Supplementary DataItem 9 - Changes in and Disagreements with Accountants on Accounting and Financial DisclosureItem 9A - Controls and ProceduresItem 9B - Other InformationPart IIIItem 10 - Directors, Executive Officers and Corporate GovernanceItem 11 - Executive CompensationItem 12 - Security Ownership Of Certain Beneficial Owners and Management and Related Stockholder MattersItem 13 - Certain Relationships and Related Transactions, and Director IndependenceItem 14 - Principal Accountant Fees and ServicePart IVItem 15 - Exhibits and Financial Statement Schedules