INTUIT INC
10-Ks and 10-Qs
|
|
|
|
|
|
|
|
|
|
|
|
|
|
|
|
|
|
|
|
|
|
|
|
|
|
|
|
|
|
|
|
|
|
|
|
|
|
|
|
|
|
|
|
|
|
|
|
|
|
|
|
|
|
|
|
UNITED STATES SECURITIES AND EXCHANGE COMMISSION
Washington, D.C. 20549
________________________________________
FORM
10-Q
|
þ
|
|
Quarterly report pursuant to Section 13 or 15(d) of the Securities Exchange Act of 1934
|
|
For the quarterly period ended October 31, 2017
|
||
OR
|
o
|
|
Transition report pursuant to Section 13 or 15(d) of the Securities Exchange Act of 1934
|
|
For the transition period from ____________ to ____________ .
|
||
Commission File Number 0-21180
(Exact name of registrant as specified in its charter)
|
Delaware
(State of incorporation)
|
|
77-0034661
(IRS employer identification no.)
|
|
2700 Coast Avenue, Mountain View, CA 94043
(Address of principal executive offices)
|
||
|
(650) 944-6000
(Registrant’s telephone number, including area code)
|
||
Indicate by check mark whether the registrant: (1) has filed all reports required to be filed by Section 13 or 15(d) of the Securities Exchange Act of 1934 during the preceding 12 months (or for such shorter period that the registrant was required to file such reports); and (2) has been subject to such filing requirements for the past 90 days. Yes
þ
No
o
Indicate by check mark whether the registrant has submitted electronically and posted on its corporate Web site, if any, every Interactive Data File required to be submitted and posted pursuant to Rule 405 of Regulation S-T during the preceding 12 months (or for such shorter period that the registrant was required to submit and post such files). Yes
þ
No
o
Indicate by check mark whether the registrant is a large accelerated filer, an accelerated filer, a non-accelerated filer, a smaller reporting company, or an emerging growth company. See the definitions of “large accelerated filer,” “accelerated filer,” “smaller reporting company,” and “emerging growth company” in Rule 12b-2 of the Exchange Act. (Check one):
|
Large accelerated
filer
|
þ
|
Accelerated filer
|
o
|
Non-accelerated filer
|
o
|
Smaller reporting
company
|
o
|
Emerging growth
company
|
o
|
|
|
|
(Do not check if a smaller reporting company)
|
|
||||||
I
f an emerging growth company, indicate by check mark if the registrant has elected not to use the extended transition period for complying with any new or revised financial accounting standards provided pursuant to Section 13(a) of the Exchange Act.
o
Indicate by check mark whether the registrant is a shell company (as defined in Rule 12b-2 of the Exchange Act). Yes
o
No
þ
Indicate the number of shares outstanding of each of the issuer’s classes of common stock, as of the latest practicable date.
255,649,800
shares of Common Stock, $0.01 par value, were outstanding at
November 14, 2017
.
|
INTUIT INC.
FORM 10-Q
INDEX
|
|
Page
|
|
|
|
|
|
|
|
|
|
|
|
|
|
|
|
|
|
|
|
|
|
|
|
|
|
|
|
|
|
|
|
|
|
|
|
|
|
|
|
|
|
|
|
|
|
|
|
|
|
|
|
|
|
|
|
|
EX-10.01
|
|
|
EX-10.02
|
|
|
EX-10.03
|
|
|
EX-10.04
|
|
|
EX-31.01
|
|
|
EX-31.02
|
|
|
EX-32.01
|
|
|
EX-32.02
|
|
|
EX-101.INS XBRL Instance Document - the instance document does not appear in the Interactive Data File because its XBRL tags are embedded within the Inline XBRL document
|
|
|
EX-101.SCH XBRL Taxonomy Extension Schema
|
|
|
EX-101.CAL XBRL Taxonomy Extension Calculation Linkbase
|
|
|
EX-101.LAB XBRL Taxonomy Extension Label Linkbase
|
|
|
EX-101.PRE XBRL Taxonomy Extension Presentation Linkbase
|
|
|
EX-101.DEF XBRL Taxonomy Extension Definition Linkbase
|
|
Intuit, the Intuit logo, QuickBooks, TurboTax, Intuit ProConnect, Lacerte, ProSeries, and Mint, among others, are registered trademarks and/or registered service marks of Intuit Inc., or one of its subsidiaries, in the United States and other countries. Other parties’ marks are the property of their respective owners.
|
Intuit Q1 Fiscal 2018 Form 10-Q
|
2
|
||
Forward-Looking Statements
This Quarterly Report on Form 10-Q contains forward-looking statements. All statements in this report, other than statements that are purely historical, are forward-looking statements. Words such as “expect,” “anticipate,” “intend,” “plan,” “believe,” “forecast,” “estimate,” “seek,” and similar expressions also identify forward-looking statements. In this report, forward-looking statements include, without limitation, the following:
|
•
|
our expectations and beliefs regarding future conduct and growth of the business;
|
|
•
|
our beliefs and expectations regarding seasonality, competition and other trends that affect our business;
|
|
•
|
our expectation that we will solve problems faster and more efficiently for our growing base of customers by moving to more open platforms with application programming interfaces that enable the contributions of end users and third-party developers;
|
|
•
|
our expectation that we will continue to invest significant resources in our product development, marketing and sales capabilities;
|
|
•
|
our expectation that we will continue to invest significant management attention and resources in our information technology infrastructure and in our privacy and security capabilities;
|
|
•
|
our expectation that we will work with the broader industry and government to protect our customers from fraud;
|
|
•
|
our expectation that we will be able to protect our customers’ data and prevent third parties from using stolen customer information to perpetrate fraud in our tax and other offerings;
|
|
•
|
our expectation that we will generate significant cash from operations;
|
|
•
|
our expectation that connected services revenue as a percentage of our total revenue will continue to grow;
|
|
•
|
our expectations regarding the development of future products, services, business models and technology platforms and our research and development efforts;
|
|
•
|
our assumptions underlying our critical accounting policies and estimates, including our estimates regarding promotional and return reserves; the collectability of accounts receivable; stock volatility and other assumptions used to estimate the fair value of share-based compensation; the fair value of goodwill; and expected future amortization of acquired intangible assets;
|
|
•
|
our plans with respect to the adoption of Topic 606, including the adoption timing and methodology, as well our expectations and beliefs with respect to its impact on our revenue growth rates and on the timing of our quarterly revenue recognition;
|
|
•
|
our intention not to sell our investments and our belief that it is more likely than not that we will not be required to sell them before recovery at par;
|
|
•
|
our belief that the investments we hold are not other-than-temporarily impaired;
|
|
•
|
our belief that we take prudent measures to mitigate investment related risks;
|
|
•
|
our belief that our exposure to currency exchange fluctuation risk will not be significant in the future;
|
|
•
|
our assessments and estimates that determine our effective tax rate;
|
|
•
|
our belief that it is not reasonably possible that there will be a significant increase or decrease in our unrecognized tax benefits over the next 12 months;
|
|
•
|
our intent to permanently reinvest a significant portion of our earnings from foreign operations, and our belief that we will not need funds generated from foreign operations to fund our domestic operations;
|
|
•
|
our belief that our cash and cash equivalents, investments and cash generated from operations will be sufficient to meet our seasonal working capital needs, capital expenditure requirements, contractual obligations, debt service requirements and other liquidity requirements associated with our operations for at least the next 12 months;
|
|
•
|
our expectation that we will return excess cash generated by operations to our stockholders through repurchases of our common stock and the payment of cash dividends;
|
|
•
|
our belief that the credit facility will be available to us should we choose to borrow under it; and
|
|
•
|
our assessments and beliefs regarding the future outcome of pending legal proceedings and inquiries by regulatory authorities, the liability, if any, that Intuit may incur as a result of those proceedings and inquiries, and the impact of any potential losses associated with such proceedings or inquiries on our financial statements.
|
We caution investors that forward-looking statements are only predictions based on our current expectations about future events and are not guarantees of future performance. We encourage you to read carefully all information provided in this Quarterly Report and in our other filings with the Securities and Exchange Commission before deciding to invest in our stock or to maintain or change your investment. These forward-looking statements are based on information as of the filing date of this Quarterly Report, and we undertake no obligation to revise or update any forward-looking statement for any reason.
|
Intuit Q1 Fiscal 2018 Form 10-Q
|
3
|
||
|
|
|
|
|
INTUIT INC.
|
|||||||
|
|
Three Months Ended
|
||||||
|
(In millions, except per share amounts)
|
October 31,
2017 |
October 31,
2016 |
|||||
|
Net revenue:
|
|
|
|||||
|
Product
|
$
|
|
|
$
|
|
|
|
|
Service and other
|
|
|
|
|
|||
|
Total net revenue
|
|
|
|
|
|||
|
Costs and expenses:
|
|
|
|||||
|
Cost of revenue:
|
|
|
|||||
|
Cost of product revenue
|
|
|
|
|
|||
|
Cost of service and other revenue
|
|
|
|
|
|||
|
Amortization of acquired technology
|
|
|
|
|
|||
|
Selling and marketing
|
|
|
|
|
|||
|
Research and development
|
|
|
|
|
|||
|
General and administrative
|
|
|
|
|
|||
|
Amortization of other acquired intangible assets
|
|
|
|
|
|||
|
Total costs and expenses
|
|
|
|
|
|||
|
Operating loss
|
(
|
)
|
(
|
)
|
|||
|
Interest expense
|
(
|
)
|
(
|
)
|
|||
|
Interest and other income (expense), net
|
|
|
(
|
)
|
|||
|
Loss before income taxes
|
(
|
)
|
(
|
)
|
|||
|
Income tax benefit
|
(
|
)
|
(
|
)
|
|||
|
Net loss
|
$
|
(
|
)
|
$
|
(
|
)
|
|
|
Basic net loss per share
|
$
|
(
|
)
|
$
|
(
|
)
|
|
|
Shares used in basic per share calculations
|
|
|
|
|
|||
|
Diluted net loss per share
|
$
|
(
|
)
|
$
|
(
|
)
|
|
|
Shares used in diluted per share calculations
|
|
|
|
|
|||
|
Cash dividends declared per common share
|
$
|
|
|
$
|
|
|
|
See accompanying notes.
|
Intuit Q1 Fiscal 2018 Form 10-Q
|
4
|
||
|
INTUIT INC.
CONDENSED CONSOLIDATED STATEMENTS OF COMPREHENSIVE LOSS
(unaudited)
|
|||||||
|
|
Three Months Ended
|
||||||
|
(In millions)
|
October 31,
2017 |
October 31,
2016 |
|||||
|
Net loss
|
$
|
(
|
)
|
$
|
(
|
)
|
|
|
Other comprehensive income (loss), net of income taxes:
|
|||||||
|
Unrealized losses on available-for-sale debt securities
|
|
|
(
|
)
|
|||
|
Foreign currency translation losses
|
(
|
)
|
(
|
)
|
|||
|
Total other comprehensive loss, net
|
(
|
)
|
(
|
)
|
|||
|
Comprehensive loss
|
$
|
(
|
)
|
$
|
(
|
)
|
|
See accompanying notes.
|
Intuit Q1 Fiscal 2018 Form 10-Q
|
5
|
||
|
INTUIT INC.
|
|||||||
|
(In millions)
|
October 31,
2017 |
July 31,
2017 |
|||||
|
ASSETS
|
|
|
|||||
|
Current assets:
|
|
|
|||||
|
Cash and cash equivalents
|
$
|
|
|
$
|
|
|
|
|
Investments
|
|
|
|
|
|||
|
Accounts receivable, net
|
|
|
|
|
|||
|
Income taxes receivable
|
|
|
|
|
|||
|
Prepaid expenses and other current assets
|
|
|
|
|
|||
|
Current assets before funds held for customers
|
|
|
|
|
|||
|
Funds held for customers
|
|
|
|
|
|||
|
Total current assets
|
|
|
|
|
|||
|
Long-term investments
|
|
|
|
|
|||
|
Property and equipment, net
|
|
|
|
|
|||
|
Goodwill
|
|
|
|
|
|||
|
Acquired intangible assets, net
|
|
|
|
|
|||
|
Long-term deferred income taxes
|
|
|
|
|
|||
|
Other assets
|
|
|
|
|
|||
|
Total assets
|
$
|
|
|
$
|
|
|
|
|
LIABILITIES AND STOCKHOLDERS’ EQUITY
|
|
|
|||||
|
Current liabilities:
|
|
|
|||||
|
Short-term debt
|
$
|
|
|
$
|
|
|
|
|
Accounts payable
|
|
|
|
|
|||
|
Accrued compensation and related liabilities
|
|
|
|
|
|||
|
Deferred revenue
|
|
|
|
|
|||
|
Other current liabilities
|
|
|
|
|
|||
|
Current liabilities before customer fund deposits
|
|
|
|
|
|||
|
Customer fund deposits
|
|
|
|
|
|||
|
Total current liabilities
|
|
|
|
|
|||
|
Long-term debt
|
|
|
|
|
|||
|
Long-term deferred revenue
|
|
|
|
|
|||
|
Other long-term obligations
|
|
|
|
|
|||
|
Total liabilities
|
|
|
|
|
|||
|
Commitments and contingencies
|
|
|
|||||
|
Stockholders’ equity:
|
|
|
|||||
|
Preferred stock
|
|
|
|
|
|||
|
Common stock and additional paid-in capital
|
|
|
|
|
|||
|
Treasury stock, at cost
|
(
|
)
|
(
|
)
|
|||
|
Accumulated other comprehensive loss
|
(
|
)
|
(
|
)
|
|||
|
Retained earnings
|
|
|
|
|
|||
|
Total stockholders’ equity
|
|
|
|
|
|||
|
Total liabilities and stockholders’ equity
|
$
|
|
|
$
|
|
|
|
See accompanying notes.
|
Intuit Q1 Fiscal 2018 Form 10-Q
|
6
|
||
|
INTUIT INC.
CONDENSED CONSOLIDATED STATEMENTS OF STOCKHOLDERS’ EQUITY
(unaudited)
|
||||||||||||||||||||||
|
(In millions, except shares in thousands)
|
Shares of
Common
Stock
|
Common
Stock and
Additional
Paid-In
Capital
|
Treasury
Stock
|
Accumulated
Other
Comprehensive
Loss
|
Retained
Earnings
|
Total
Stockholders'
Equity
|
||||||||||||||||
|
Balance at July 31, 2017
|
|
|
$
|
|
|
$
|
(
|
)
|
$
|
(
|
)
|
$
|
|
|
$
|
|
|
|||||
|
Comprehensive loss
|
—
|
|
—
|
|
—
|
|
(
|
)
|
(
|
)
|
(
|
)
|
||||||||||
|
Issuance of stock under employee stock plans, net of shares withheld for employee taxes
|
|
|
|
|
|
|
—
|
|
—
|
|
|
|
||||||||||
|
Stock repurchases under stock repurchase programs
|
(
|
)
|
—
|
|
(
|
)
|
—
|
|
—
|
|
(
|
)
|
||||||||||
|
Dividends and dividend rights declared ($0.39 per share)
|
—
|
|
—
|
|
—
|
|
—
|
|
(
|
)
|
(
|
)
|
||||||||||
|
Share-based compensation expense
|
—
|
|
|
|
—
|
|
—
|
|
—
|
|
|
|
||||||||||
|
Balance at October 31, 2017
|
|
|
$
|
|
|
$
|
(
|
)
|
$
|
(
|
)
|
$
|
|
|
$
|
|
|
|||||
|
(In millions, except shares in thousands)
|
Shares of
Common
Stock
|
Common
Stock and
Additional
Paid-In
Capital
|
Treasury
Stock
|
Accumulated
Other
Comprehensive
Loss
|
Retained
Earnings
|
Total
Stockholders'
Equity
|
||||||||||||||||
|
Balance at July 31, 2016
|
|
|
$
|
|
|
$
|
(
|
)
|
$
|
(
|
)
|
$
|
|
|
$
|
|
|
|||||
|
Comprehensive loss
|
—
|
|
—
|
|
—
|
|
(
|
)
|
(
|
)
|
(
|
)
|
||||||||||
|
Issuance of stock under employee stock plans, net of shares withheld for employee taxes
|
|
|
(
|
)
|
—
|
|
—
|
|
—
|
|
(
|
)
|
||||||||||
|
Stock repurchases under stock repurchase programs
|
(
|
)
|
—
|
|
(
|
)
|
—
|
|
—
|
|
(
|
)
|
||||||||||
|
Dividends and dividend rights declared ($0.34 per share)
|
—
|
|
—
|
|
—
|
|
—
|
|
(
|
)
|
(
|
)
|
||||||||||
|
Cumulative effect of change in
accounting principle |
—
|
|
|
|
—
|
|
—
|
|
(
|
)
|
|
|
||||||||||
|
Share-based compensation expense
|
—
|
|
|
|
—
|
|
—
|
|
—
|
|
|
|
||||||||||
|
Balance at October 31, 2016
|
|
|
$
|
|
|
$
|
(
|
)
|
$
|
(
|
)
|
$
|
|
|
$
|
|
|
|||||
See accompanying notes.
|
Intuit Q1 Fiscal 2018 Form 10-Q
|
7
|
||
|
INTUIT INC.
|
|||||||
|
Three Months Ended
|
|||||||
|
(In millions)
|
October 31,
2017 |
October 31,
2016 |
|||||
|
Cash flows from operating activities:
|
|
|
|||||
|
Net loss
|
$
|
(
|
)
|
$
|
(
|
)
|
|
|
Adjustments to reconcile net loss to net cash used in operating activities:
|
|||||||
|
Depreciation
|
|
|
|
|
|||
|
Amortization of acquired intangible assets
|
|
|
|
|
|||
|
Share-based compensation expense
|
|
|
|
|
|||
|
Deferred income taxes
|
(
|
)
|
(
|
)
|
|||
|
Other
|
|
|
|
|
|||
|
Total adjustments
|
|
|
|
|
|||
|
Changes in operating assets and liabilities:
|
|
|
|||||
|
Accounts receivable
|
(
|
)
|
(
|
)
|
|||
|
Income taxes receivable
|
|
|
(
|
)
|
|||
|
Prepaid expenses and other assets
|
(
|
)
|
(
|
)
|
|||
|
Accounts payable
|
|
|
(
|
)
|
|||
|
Accrued compensation and related liabilities
|
(
|
)
|
(
|
)
|
|||
|
Deferred revenue
|
(
|
)
|
(
|
)
|
|||
|
Other liabilities
|
|
|
|
|
|||
|
Total changes in operating assets and liabilities
|
(
|
)
|
(
|
)
|
|||
|
Net cash used in operating activities
|
(
|
)
|
(
|
)
|
|||
|
Cash flows from investing activities:
|
|
|
|||||
|
Purchases of corporate and customer fund investments
|
(
|
)
|
(
|
)
|
|||
|
Sales of corporate and customer fund investments
|
|
|
|
|
|||
|
Maturities of corporate and customer fund investments
|
|
|
|
|
|||
|
Net change in cash and cash equivalents held to satisfy customer fund obligations
|
|
|
(
|
)
|
|||
|
Net change in customer fund deposits
|
(
|
)
|
|
|
|||
|
Purchases of property and equipment
|
(
|
)
|
(
|
)
|
|||
|
Other
|
(
|
)
|
(
|
)
|
|||
|
Net cash provided by (used in) investing activities
|
(
|
)
|
|
|
|||
|
Cash flows from financing activities:
|
|
|
|||||
|
Proceeds from borrowings under revolving credit facility
|
|
|
|
|
|||
|
Repayment of debt
|
(
|
)
|
|
|
|||
|
Proceeds from issuance of stock under employee stock plans
|
|
|
|
|
|||
|
Payments for employee taxes withheld upon vesting of restricted stock units
|
(
|
)
|
(
|
)
|
|||
|
Cash paid for purchases of treasury stock
|
(
|
)
|
(
|
)
|
|||
|
Dividends and dividend rights paid
|
(
|
)
|
(
|
)
|
|||
|
Net cash provided by (used in) financing activities
|
|
|
(
|
)
|
|||
|
Effect of exchange rates on cash and cash equivalents
|
(
|
)
|
(
|
)
|
|||
|
Net decrease in cash and cash equivalents
|
|
|
(
|
)
|
|||
|
Cash and cash equivalents at beginning of period
|
|
|
|
|
|||
|
Cash and cash equivalents at end of period
|
$
|
|
|
$
|
|
|
|
See accompanying notes.
|
Intuit Q1 Fiscal 2018 Form 10-Q
|
8
|
||
|
INTUIT INC.
NOTES TO CONDENSED CONSOLIDATED FINANCIAL STATEMENTS
(unaudited)
|
|
1. Description of Business and Summary of Significant Accounting Policies
|
|
Description of Business
|
Intuit helps consumers, small businesses, and the self-employed prosper by delivering financial management and compliance products and services. We also provide specialized tax products to accounting professionals, who are key partners that help us reach small business customers.
Our flagship brands, QuickBooks and TurboTax, help customers run their small businesses, pay employees and bills, separate business and personal expenses, track their money, and file income taxes. ProSeries and Lacerte are our leading tax preparation offerings for professional accountants. Incorporated in 1984 and headquartered in Mountain View, California, we sell our products and services primarily in the United States.
|
Basis of Presentation
|
These condensed consolidated financial statements include the financial statements of Intuit and its wholly owned subsidiaries. We have eliminated all significant intercompany balances and transactions in consolidation. We have included all adjustments, consisting only of normal recurring items, which we considered necessary for a fair presentation of our financial results for the interim periods presented. We have reclassified certain amounts previously reported in our financial statements to conform to the current presentation, including amounts related to reportable segments. See Note 9, “
Segment Information
,” for more information.
|
Seasonality
|
|
Significant Accounting Policies
|
We describe our significant accounting policies in Note 1 to the financial statements in Item 8 of our Annual Report on Form 10-K for the fiscal year ended
July 31, 2017
. There have been no changes to our significant accounting policies during the first
three
months of fiscal
2018
.
|
Use of Estimates
|
|
Computation of Net Income (Loss) Per Share
|
We compute basic net income or loss per share using the weighted average number of common shares outstanding during the period. We compute diluted net income per share using the weighted average number of common shares and dilutive potential common shares outstanding during the period. Dilutive potential common shares consist of the shares issuable upon the exercise of stock options and upon the vesting of restricted stock units (RSUs) under the treasury stock method.
|
Intuit Q1 Fiscal 2018 Form 10-Q
|
9
|
||
We include stock options with combined exercise prices and unrecognized compensation expense that are less than the average market price for our common stock, and RSUs with unrecognized compensation expense that is less than the average market price for our common stock, in the calculation of diluted net income per share. We exclude stock options with combined exercise prices and unrecognized compensation expense that are greater than the average market price for our common stock, and RSUs with unrecognized compensation expense that is greater than the average market price for our common stock, from the calculation of diluted net income per share because their effect is anti-dilutive. Under the treasury stock method, the amount that must be paid to exercise stock options and the amount of compensation expense for future service that we have not yet recognized for stock options and RSUs are assumed to be used to repurchase shares.
All of the RSUs we grant have dividend rights. Dividend rights are accumulated and paid when the underlying RSUs vest. Since the dividend rights are subject to the same vesting requirements as the underlying equity awards they are considered a contingent transfer of value. Consequently, the RSUs are not considered participating securities and we do not present them separately in earnings per share.
|
|
Three Months Ended
|
||||||
|
(In millions, except per share amounts)
|
October 31,
2017 |
October 31,
2016 |
|||||
|
Numerator:
|
|
|
|||||
|
Net loss
|
$
|
(
|
)
|
$
|
(
|
)
|
|
|
Denominator:
|
|
|
|||||
|
Shares used in basic per share amounts:
|
|
|
|||||
|
Weighted average common shares outstanding
|
|
|
|
|
|||
|
|
|
||||||
|
Shares used in diluted per share amounts:
|
|||||||
|
Weighted average common shares outstanding
|
|
|
|
|
|||
|
Dilutive common equivalent shares from stock options
|
|||||||
|
and restricted stock awards
|
|
|
|
|
|||
|
Dilutive weighted average common shares outstanding
|
|
|
|
|
|||
|
Basic and diluted net loss per share:
|
|
|
|||||
|
Basic net loss per share
|
$
|
(
|
)
|
$
|
(
|
)
|
|
|
Diluted net loss per share
|
$
|
(
|
)
|
$
|
(
|
)
|
|
|
Shares excluded from computation of diluted net loss per share:
|
|||||||
|
Weighted average stock options and restricted stock units that would have been included in the computation of dilutive common equivalent shares outstanding if net income had been reported in the period
|
|
|
|
|
|||
|
Weighted average stock options and restricted stock units that would have been excluded from the computation of dilutive common equivalent shares outstanding if net income had been reported in the period due to their anti-dilutive effect
|
|
|
|
|
|||
|
Concentration of Credit Risk and Significant Customers
|
|
Accounting Standards Not Yet Adopted
|
Goodwill Impairment
-
In January 2017 the Financial Accounting Standards Board (FASB) issued Accounting Standards Update (ASU) 2017-04, “
Intangibles—Goodwill and Other (Topic 350): Simplifying the Test for Goodwill Impairment.”
This new standard eliminates Step 2 from the goodwill impairment test. Instead, an entity should compare the fair value of a reporting unit with its carrying amount and recognize an impairment charge for the amount by which the carrying amount exceeds the reporting unit's fair value, not to exceed the total amount of goodwill allocated to the reporting unit. The standard is effective for fiscal years beginning after December 15, 2019, including interim periods within those fiscal years, which means that it will
|
Intuit Q1 Fiscal 2018 Form 10-Q
|
10
|
||
be effective for us in the first quarter of our fiscal year beginning August 1, 2020. Early adoption is permitted. We are currently evaluating the impact of our pending adoption of ASU 2017-04 on our consolidated financial statements.
Business Combinations
-
In January 2017 the FASB issued ASU 2017-01, “
Business Combinations (Topic 805): Clarifying the Definition of a Business
.
”
This new standard clarifies the definition of a business in order to allow for the evaluation of whether transactions should be accounted for as acquisitions or disposals of assets or businesses. The standard is effective for fiscal years beginning after December 15, 2017, including interim periods within those fiscal years, which means that it will be effective for us in the first quarter of our fiscal year beginning August 1, 2018. Early adoption is permitted. We are currently evaluating the impact of our pending adoption of ASU 2017-01 on our consolidated financial statements.
Statement of Cash Flows
-
In August 2016 the FASB issued ASU 2016-15, “
Statement of Cash Flows (Topic 230): Classification of Certain Cash Receipts and Cash Payments.”
This new standard will make eight targeted changes to how cash receipts and cash payments are presented and classified in the statement of cash flows. The standard is effective for fiscal years beginning after December 15, 2017, which means that it will be effective for us in the first quarter of our fiscal year beginning August 1, 2018. The standard will require adoption on a retrospective basis unless it is impracticable to apply, in which case we would be required to apply the amendments prospectively as of the earliest date practicable. We are currently evaluating the impact of our pending adoption of ASU 2016-15 on our consolidated financial statements.
Financial Instruments
-
In June 2016 the FASB issued ASU 2016-13, “
Financial Instruments—Credit Losses (Topic 326).
” This new standard requires the measurement of all expected credit losses for financial assets held at the reporting date based on historical experience, current conditions, and reasonable and supportable forecasts. The standard is effective for fiscal years beginning after December 15, 2019, including interim periods within those fiscal years, which means that it will be effective for us in the first quarter of our fiscal year beginning August 1, 2020. Earlier adoption is permitted in the first quarter of our fiscal year beginning August 1, 2019. We are currently evaluating the impact of our pending adoption of ASU 2016-13 on our consolidated financial statements.
Leases
-
In February 2016 the FASB issued ASU 2016-02, “
Leases (Topic 842).
” This new standard amends a number of aspects of lease accounting, including requiring lessees to recognize operating leases with a term greater than one year on their balance sheet as a right-of-use asset and corresponding lease liability, measured at the present value of the lease payments. The standard is effective for fiscal years beginning after December 15, 2018, including interim periods within those fiscal years, which means that it will be effective for us in the first quarter of our fiscal year beginning August 1, 2019. Early adoption is permitted. This standard is required to be adopted using a modified retrospective approach. We are currently evaluating the impact of our pending adoption of ASU 2016-02 on our consolidated financial statements.
Revenue Recognition
-
In May 2014 the FASB issued ASU 2014-09, “Revenue from Contracts with Customers (Topic 606),”and in August 2015 the FASB issued ASU 2015-14, “Revenue from Contracts with Customers (Topic 606): Deferral of the Effective Date,” which defers the effective date of ASU 2014-09 by one year. This new standard supersedes nearly all existing revenue recognition guidance under U.S. GAAP. The core principle of the new standard is to recognize revenues when promised goods or services are transferred to customers in an amount that reflects the consideration that is expected to be received for those goods or services. ASU 2014-09 defines a five step process to achieve this core principle and, in doing so, it is possible that more judgment and estimates may be required within the revenue recognition process than is required under present U.S. GAAP. These may include identifying performance obligations in the contract, estimating the amount of variable consideration to include in the transaction price, and allocating the transaction price to each separate performance obligation. The new standard also requires additional disclosure about the nature, amount, timing and uncertainty of revenue and cash flows arising from customer contracts, including significant judgments and changes in judgments. The new standard is effective for reporting periods beginning after December 15, 2017, which means that it will be effective for us in the first quarter of our fiscal year beginning August 1, 2018.
We plan to adopt Topic 606 utilizing the full retrospective transition method when it becomes effective for us in the first fiscal quarter beginning August 1, 2018.
We have completed our preliminary assessment of the new standard and are continuing to assess all potential impacts of the standard. We currently believe the most significant changes will be the timing of revenue recognition related to our QuickBooks desktop solutions and our consumer and professional tax desktop solutions.
Under the current standard, we recognize substantially all of the revenue for QuickBooks desktop solutions ratably over the period that enhancements and connected services are provided, which is approximately three years. Under the new standard, we will recognize software license revenue for QuickBooks desktop solutions at the time the license is delivered. Due to the upfront recognition of Quickbooks desktop solutions, upon adoption, we will remove deferred revenue from our liabilities through a cumulative adjustment to retained earnings. We expect the timing of QuickBooks desktop revenue in our Small Business & Self-Employed reporting segment to shift to earlier quarters within each fiscal year as a result of these changes.
With respect to our consumer and professional tax desktop solutions, under the current standard, we recognize all revenue related to the desktop solutions as services are provided. Under the new standard, we will recognize revenue for the desktop tax preparation software license and related tax form updates as they are delivered. We will recognize revenue for our electronic filing and connected services as those services are provided. As sales and delivery of desktop tax preparation software solutions are concentrated from November through April, we expect the timing of the related desktop revenue for our Consumer and Strategic Partner reporting segments to shift to earlier quarters within each fiscal year as a result of these changes.
|
Intuit Q1 Fiscal 2018 Form 10-Q
|
11
|
||
Under Topic 606 we do not expect our annual total and reporting segment revenue growth rates to be significantly different as compared to growth rates under the current standard.
Accounting for commissions under the new standard will result in the deferral of incremental commission costs for obtaining contracts, which we do not expect to be material.
|
2. Fair Value Measurements
|
|
Fair Value Hierarchy
|
The authoritative guidance establishes a fair value hierarchy that is based on the extent and level of judgment used to estimate the fair value of assets and liabilities. In general, the authoritative guidance requires us to maximize the use of observable inputs and minimize the use of unobservable inputs when measuring fair value. An asset or liability’s categorization within the fair value hierarchy is based upon the lowest level of input that is significant to the measurement of its fair value. The three levels of input defined by the authoritative guidance are as follows:
|
•
|
Level 1
uses unadjusted quoted prices that are available in active markets for identical assets or liabilities.
|
|
•
|
Level 2
uses inputs other than quoted prices included in Level 1 that are either directly or indirectly observable through correlation with market data. These include quoted prices in active markets for similar assets or liabilities; quoted prices for identical or similar assets or liabilities in markets that are not active; and inputs to valuation models or other pricing methodologies that do not require significant judgment because the inputs used in the model, such as interest rates and volatility, can be corroborated by readily observable market data for substantially the full term of the assets or liabilities.
|
|
•
|
|
|
Assets and Liabilities Measured at Fair Value on a Recurring Basis
|
|
|
October 31, 2017
|
July 31, 2017
|
|||||||||||||||||||||||||||||
|
(In millions)
|
Level 1
|
Level 2
|
Level 3
|
Total
Fair Value
|
Level 1
|
Level 2
|
Level 3
|
Total
Fair Value
|
|||||||||||||||||||||||
|
Assets:
|
|
|
|
|
|
|
|
|
|||||||||||||||||||||||
|
Cash equivalents, primarily time deposits
|
$
|
|
|
$
|
|
|
$
|
|
|
$
|
|
|
$
|
|
|
$
|
|
|
$
|
|
|
$
|
|
|
|||||||
|
Available-for-sale debt securities:
|
|
|
|
|
|
|
|
|
|||||||||||||||||||||||
|
Municipal bonds
|
|
|
|
|
|
|
|
|
|
|
|
|
|
|
|
|
|||||||||||||||
|
Corporate notes
|
|
|
|
|
|
|
|
|
|
|
|
|
|
|
|
|
|||||||||||||||
|
U.S. agency securities
|
|
|
|
|
|
|
|
|
|
|
|
|
|
|
|
|
|||||||||||||||
|
Municipal auction rate securities
|
|
|
|
|
|
|
|
|
|
|
|
|
|
|
|
|
|||||||||||||||
|
Total available-for-sale securities
|
|
|
|
|
|
|
|
|
|
|
|
|
|
|
|
|
|||||||||||||||
|
Total assets measured at fair value on a recurring basis
|
$
|
|
|
$
|
|
|
$
|
|
|
$
|
|
|
$
|
|
|
$
|
|
|
$
|
|
|
$
|
|
|
|||||||
|
Intuit Q1 Fiscal 2018 Form 10-Q
|
12
|
||
|
|
October 31, 2017
|
July 31, 2017
|
|||||||||||||||||||||||||||||
|
(In millions)
|
Level 1
|
Level 2
|
Level 3
|
Total
Fair Value
|
Level 1
|
Level 2
|
Level 3
|
Total
Fair Value
|
|||||||||||||||||||||||
|
Cash equivalents:
|
|
|
|
|
|
|
|
|
|||||||||||||||||||||||
|
In cash and cash equivalents
|
$
|
|
|
$
|
|
|
$
|
|
|
$
|
|
|
$
|
|
|
$
|
|
|
$
|
|
|
$
|
|
|
|||||||
|
Available-for-sale securities:
|
|
|
|
|
|
|
|
|
|||||||||||||||||||||||
|
In investments
|
$
|
|
|
$
|
|
|
$
|
|
|
$
|
|
|
$
|
|
|
$
|
|
|
$
|
|
|
$
|
|
|
|||||||
|
In funds held for customers
|
|
|
|
|
|
|
|
|
|
|
|
|
|
|
|
|
|||||||||||||||
|
In long-term investments
|
|
|
|
|
|
|
|
|
|
|
|
|
|
|
|
|
|||||||||||||||
|
Total available-for-sale securities
|
$
|
|
|
$
|
|
|
$
|
|
|
$
|
|
|
$
|
|
|
$
|
|
|
$
|
|
|
$
|
|
|
|||||||
We value our Level 1 assets, consisting primarily of time deposits, using quoted prices in active markets for identical instruments. Financial assets whose fair values we measure on a recurring basis using Level 2 inputs consist of municipal bonds, corporate notes, and U.S. agency securities. We measure the fair values of these assets with the help of a pricing service that either provides quoted market prices in active markets for identical or similar securities or uses observable inputs for their pricing without applying significant adjustments. Our fair value processes include controls that are designed to ensure that we record appropriate fair values for our Level 2 investments. These controls include comparison to pricing provided by a secondary pricing service or investment manager, validation of pricing sources and models, review of key model inputs, analysis of period-over-period price fluctuations, and independent recalculation of prices where appropriate.
Financial assets whose fair values we measure using significant unobservable (Level 3) inputs consist of municipal auction rate securities that are no longer liquid. We estimate the fair values of the auction rate securities using a discounted cash flow model. We continue to classify them as long-term investments based on the maturities of the underlying securities at that date. We do not intend to sell our municipal auction rate securities. In addition, it is more likely than not that we will not be required to sell them before recovery at par, which may be at maturity.
|
3. Cash and Cash Equivalents, Investments, and Funds Held for Customers
|
We consider highly liquid investments with maturities of three months or less at the date of purchase to be cash equivalents. Cash equivalents consist primarily of time deposits in all periods presented. Investments at
October 31, 2017
consisted of available-for-sale investment-grade debt securities that we carried at fair value. Funds held for customers consist of cash and cash equivalents and investment grade available-for-sale debt securities in all periods presented. Except for direct obligations of the United States government, securities issued by agencies of the United States government, and money market funds, we diversify our investments in debt securities by limiting our holdings with any individual issuer.
|
|
October 31, 2017
|
July 31, 2017
|
|||||||||||||
|
(In millions)
|
Amortized
Cost
|
Fair Value
|
Amortized
Cost
|
Fair Value
|
|||||||||||
|
Classification on balance sheets:
|
|
|
|
|
|||||||||||
|
Cash and cash equivalents
|
$
|
|
|
$
|
|
|
$
|
|
|
$
|
|
|
|||
|
Investments
|
|
|
|
|
|
|
|
|
|||||||
|
Funds held for customers
|
|
|
|
|
|
|
|
|
|||||||
|
Long-term investments
|
|
|
|
|
|
|
|
|
|||||||
|
Total cash and cash equivalents, investments, and funds
held for customers
|
$
|
|
|
$
|
|
|
$
|
|
|
$
|
|
|
|||
|
Intuit Q1 Fiscal 2018 Form 10-Q
|
13
|
||
|
|
October 31, 2017
|
July 31, 2017
|
|||||||||||||
|
(In millions)
|
Amortized
Cost
|
Fair Value
|
Amortized
Cost
|
Fair Value
|
|||||||||||
|
Type of issue:
|
|
|
|
|
|||||||||||
|
Total cash and cash equivalents
|
$
|
|
|
$
|
|
|
$
|
|
|
$
|
|
|
|||
|
Available-for-sale debt securities:
|
|||||||||||||||
|
Municipal bonds
|
|
|
|
|
|
|
|
|
|||||||
|
Corporate notes
|
|
|
|
|
|
|
|
|
|||||||
|
U.S. agency securities
|
|
|
|
|
|
|
|
|
|||||||
|
Municipal auction rate securities
|
|
|
|
|
|
|
|
|
|||||||
|
Total available-for-sale debt securities
|
|
|
|
|
|
|
|
|
|||||||
|
Other long-term investments
|
|
|
|
|
|
|
|
|
|||||||
|
Total cash and cash equivalents, investments, and funds
held for customers
|
$
|
|
|
$
|
|
|
$
|
|
|
$
|
|
|
|||
We use the specific identification method to compute gains and losses on investments. We include realized gains and losses on our available-for-sale debt securities in interest and other income or expense on our statements of operations. Gross realized gains and losses on our available-for-sale debt securities for the
three
months ended
October 31, 2017
and
October 31, 2016
were not significant.
We accumulate unrealized gains and losses on our available-for-sale debt securities, net of tax, in accumulated other comprehensive income or loss in the stockholders’ equity section of our balance sheets. Gross unrealized gains and losses on our available-for-sale debt securities at
October 31, 2017
and
July 31, 2017
were not significant.
We periodically review our investment portfolios to determine if any investment is other-than-temporarily impaired due to changes in credit risk or other potential valuation concerns. We believe that the investments we held at
October 31, 2017
were not other-than-temporarily impaired. Unrealized losses on available-for-sale debt securities at
October 31, 2017
were not significant and were due to changes in interest rates, including market credit spreads, and not due to increased credit risks associated with specific securities. We do not intend to sell these investments. In addition, it is more likely than not that we will not be required to sell them before recovery at par, which may be at maturity.
|
|
October 31, 2017
|
July 31, 2017
|
|||||||||||||
|
(In millions)
|
Amortized
Cost
|
Fair Value
|
Amortized
Cost
|
Fair Value
|
|||||||||||
|
Due within one year
|
$
|
|
|
$
|
|
|
$
|
|
|
$
|
|
|
|||
|
Due within two years
|
|
|
|
|
|
|
|
|
|||||||
|
Due within three years
|
|
|
|
|
|
|
|
|
|||||||
|
Due after three years
|
|
|
|
|
|
|
|
|
|||||||
|
Total available-for-sale debt securities
|
$
|
|
|
$
|
|
|
$
|
|
|
$
|
|
|
|||
|
4. Current Liabilities
|
|
Short-Term Debt
|
On February 1, 2016 we entered into a master credit agreement with certain institutional lenders for a
five
-year credit facility in an aggregate principal amount of
$
1.5
billion
. The master credit agreement includes a
$
500
million
unsecured term loan and a
$
1
billion
unsecured revolving credit facility. At
October 31, 2017
,
$
475
million
was outstanding under the term loan, of which
$
50
million
was classified as short-term debt. See Note 5, “
Long-Term Obligations and Commitments – Long-Term Debt,”
for more information regarding the term loan.
|
Intuit Q1 Fiscal 2018 Form 10-Q
|
14
|
||
|
Unsecured Revolving Credit Facility
|
The master credit agreement we entered into on February 1, 2016 includes a
$
1
billion
unsecured revolving credit facility that will expire on February 1, 2021. Under the master credit agreement we may, subject to certain customary conditions, on one or more occasions increase commitments under the revolving credit facility in an amount not to exceed
$
250
million
in the aggregate and may extend the maturity date up to two times. Advances under the revolving credit facility accrue interest at rates that are equal to, at our election, either Bank of America's alternate base rate plus a margin that ranges from
0.0
%
to
0.5
%
or the London Interbank Offered Rate (LIBOR) plus a margin that ranges from
0.9
%
to
1.5
%
. Actual margins under either election will be based on our senior debt credit ratings. The master credit agreement includes customary affirmative and negative covenants, including financial covenants that require us to maintain a ratio of total debt to annual earnings before interest, taxes, depreciation and amortization (EBITDA) of not greater than
3.25
to 1.00 as of any date and a ratio of annual EBITDA to annual interest expense of not less than
3.00
to 1.00 as of the last day of each fiscal quarter. We remained in compliance with these covenants at all times during the quarter ended
October 31, 2017
. During the
three
months ended
October 31, 2017
we borrowed
$
400
million
under this revolving credit facility and at
October 31, 2017
$
400
million
was outstanding. We paid
$
1
million
in cash for interest on the revolving credit facility during the
three
months ended
October 31, 2017
. Cash paid for interest on the revolving credit facility during the
three
months ended
October 31, 2016
was not significant.
|
Other Current Liabilities
|
|
(In millions)
|
October 31,
2017 |
July 31,
2017 |
|||||
|
Executive deferred compensation plan liabilities
|
$
|
|
|
$
|
|
|
|
|
Reserve for promotional discounts and rebates
|
|
|
|
|
|||
|
Reserve for product returns
|
|
|
|
|
|||
|
Current portion of license fee payable
|
|
|
|
|
|||
|
Current portion of deferred rent
|
|
|
|
|
|||
|
Current portion of dividend payable
|
|
|
|
|
|||
|
Other
|
|
|
|
|
|||
|
Total other current liabilities
|
$
|
|
|
$
|
|
|
|
|
5. Long-Term Obligations and Commitments
|
|
Long-Term Debt
|
On February 1, 2016 we entered into a master credit agreement with certain institutional lenders for a five-year credit facility in an aggregate principal amount of
$
1.5
billion
, which includes a
$
500
million
unsecured term loan. Under the master credit agreement we may, subject to certain customary conditions, on one or more occasions increase commitments under the term loan in an amount not to exceed
$
500
million
in the aggregate. The term loan accrues interest at rates that are equal to, at our election, either Bank of America's alternate base rate plus a margin that ranges from
0.125
%
to
0.875
%
or LIBOR plus a margin that ranges from
1.125
%
to
1.875
%
. Actual margins under either election will be based on our senior debt credit ratings. The master credit agreement includes customary affirmative and negative covenants. See Note 4, “
Current Liabilities – Unsecured Revolving Credit Facility,”
for more information. The term loan is subject to quarterly principal payments, which began in July 2017, of
2.5
%
of the original loan amount, with the balance payable on February 1, 2021. At
October 31, 2017
,
$
475
million
was outstanding under the term loan, of which
$
50
million
was classified as short-term debt. Interest on the term loan is payable monthly. We paid
$
3
million
and
$
2
million
in cash for interest on the term loan during the
three
months ended
October 31, 2017
and
October 31, 2016
respectively.
|
Intuit Q1 Fiscal 2018 Form 10-Q
|
15
|
||
|
Other Long-Term Obligations
|
|
(In millions)
|
October 31,
2017 |
July 31,
2017 |
|||||
|
Total deferred rent
|
$
|
|
|
$
|
|
|
|
|
Long-term income tax liabilities
|
|
|
|
|
|||
|
Total license fee payable
|
|
|
|
|
|||
|
Total dividend payable
|
|
|
|
|
|||
|
Long-term deferred income tax liabilities
|
|
|
|
|
|||
|
Other
|
|
|
|
|
|||
|
Total long-term obligations
|
|
|
|
|
|||
|
Less current portion (included in other current liabilities)
|
(
|
)
|
(
|
)
|
|||
|
Long-term obligations due after one year
|
$
|
|
|
$
|
|
|
|
|
Operating Lease Commitments and Unconditional Purchase Obligations
|
|
6. Income Taxes
|
|
Effective Tax Rate
|
We compute our provision for or benefit from income taxes by applying the estimated annual effective tax rate to income or loss from recurring operations and adding the effects of any discrete income tax items specific to the period.
In the first quarter of fiscal 2017 we adopted ASU 2016-09,
“Compensation-Stock Compensation (Topic 718): Improvements to Employee Share-Based Payment Accounting.”
As a result, we recognized excess tax benefits on share-based compensation of
$
25
million and
$
19
million in our provision for income taxes for the three months ended October 31, 2017 and 2016 respectively.
Our effective tax rate for the three months ended
October 31, 2017
was approximately
72
%
. Excluding discrete tax items primarily related to share-based compensation tax benefits resulting from the adoption of ASU 2016-09, our effective tax rate for the period was
33
%
and did not differ significantly from the federal statutory rate of
35
%
. The tax benefit we received from the domestic production activities deduction and the federal research and experimentation credit were partially offset by the tax expense related to state income taxes and nondeductible share-based compensation.
Our effective tax rate for the three months ended
October 31, 2016
was approximately
58
%
. Excluding discrete tax items primarily related to share-based compensation tax benefits resulting from the adoption of ASU 2016-09, our effective tax rate for the period was
34
%
and did not differ significantly from the federal statutory rate of
35
%
. The tax benefit we received from the domestic production activities deduction and the federal research and experimentation credit were partially offset by the tax expense related to state income taxes and nondeductible share-based compensation.
|
Unrecognized Tax Benefits and Other Considerations
|
|
Intuit Q1 Fiscal 2018 Form 10-Q
|
16
|
||
|
7. Stockholders’ Equity
|
|
Stock Repurchase Programs and Treasury Shares
|
Intuit’s Board of Directors has authorized a series of common stock repurchase programs. Shares of common stock repurchased under these programs become treasury shares. We repurchased
1.2
million shares for
$
170
million
under these programs during the
three
months ended
October 31, 2017
. Included in this amount were
$
2
million
of repurchases which occurred in late October 2017 and were settled in early November 2017. At
October 31, 2017
, we had authorization from our Board of Directors to expend up to an additional
$
1.4
billion
for stock repurchases. Future stock repurchases under the current programs are at the discretion of management, and authorization of future stock repurchase programs is subject to the final determination of our Board of Directors.
Our treasury shares are repurchased at the market price on the trade date; accordingly, all amounts paid to reacquire these shares have been recorded as treasury stock on our balance sheets. Repurchased shares of our common stock are held as treasury shares until they are reissued or retired. When we reissue treasury stock, if the proceeds from the sale are more than the average price we paid to acquire the shares we record an increase in additional paid-in capital. Conversely, if the proceeds from the sale are less than the average price we paid to acquire the shares, we record a decrease in additional paid-in capital to the extent of increases previously recorded for similar transactions and a decrease in retained earnings for any remaining amount.
In the past we have satisfied option exercises and restricted stock unit vesting under our employee equity incentive plans by reissuing treasury shares, and we may do so again in the future. During the second quarter of fiscal 2014 we began issuing new shares of common stock to satisfy option exercises and RSU vesting under our 2005 Equity Incentive Plan. We have not yet determined the ultimate disposition of the shares that we have repurchased in the past, and consequently we continue to hold them as treasury shares.
|
Dividends on Common Stock
|
During the
three
months ended
October 31, 2017
we declared and paid quarterly cash dividends that totaled
$
0.39
per share of outstanding common stock or
$
105
million. In
November 2017
our Board of Directors declared a quarterly cash dividend of
$
0.39
per share of outstanding common stock payable on
January 18, 2018
to stockholders of record at the close of business on
January 10, 2018
. Future declarations of dividends and the establishment of future record dates and payment dates are subject to the final determination of our Board of Directors.
|
Share-Based Compensation Expense
|
|
|
Three Months Ended
|
||||||
|
(In millions)
|
October 31,
2017 |
October 31,
2016 |
|||||
|
Cost of revenue
|
$
|
|
|
$
|
|
|
|
|
Selling and marketing
|
|
|
|
|
|||
|
Research and development
|
|
|
|
|
|||
|
General and administrative
|
|
|
|
|
|||
|
Total share-based compensation expense
|
$
|
|
|
$
|
|
|
|
We capitalized
$
1
million in share-based compensation related to internal use software projects during the
three
months ended
October 31, 2017
and
$
2
million
during the
three
months ended
October 31, 2016
.
|
Intuit Q1 Fiscal 2018 Form 10-Q
|
17
|
||
|
Share-Based Awards Available for Grant
|
|
(Shares in thousands)
|
Shares
Available
for Grant
|
|
|
Balance at July 31, 2017
|
|
|
|
Options granted
|
|
|
|
Restricted stock units granted (1)
|
(
|
)
|
|
Share-based awards canceled/forfeited/expired (1)(2)
|
|
|
|
Balance at October 31, 2017
|
|
|
____________________________________________________
|
(1)
|
|
|
(2)
|
|
|
Stock Option Activity and Related Share-Based Compensation Expense
|
|
|
Options Outstanding
|
|||||
|
(Shares in thousands)
|
Number
of Shares
|
Weighted
Average
Exercise
Price
Per Share
|
||||
|
Balance at July 31, 2017
|
|
|
$
|
|
|
|
|
Granted
|
|
|
|
|
||
|
Exercised
|
(
|
)
|
|
|
||
|
Canceled or expired
|
(
|
)
|
|
|
||
|
Balance at October 31, 2017
|
|
|
$
|
|
|
|
|
Exercisable at October 31, 2017
|
|
|
$
|
|
|
|
At
October 31, 2017
, there was approximately
$
73
million of unrecognized compensation cost related to non-vested stock options with a weighted average vesting period of
2.2
years. We will adjust unrecognized compensation cost for actual forfeitures as they occur.
|
Restricted Stock Unit Activity and Related Share-Based Compensation Expense
|
|
Restricted Stock Units
|
||||||
|
(Shares in thousands)
|
Number
of Shares
|
Weighted
Average
Grant Date
Fair Value
|
||||
|
Nonvested at July 31, 2017
|
|
|
$
|
|
|
|
|
Granted
|
|
|
|
|
||
|
Vested
|
(
|
)
|
|
|
||
|
Forfeited
|
(
|
)
|
|
|
||
|
Nonvested at October 31, 2017
|
|
|
$
|
|
|
|
|
Intuit Q1 Fiscal 2018 Form 10-Q
|
18
|
||
|
8. Litigation
|
In fiscal 2015 Intuit was contacted by certain state and federal regulatory authorities in connection with inquiries regarding an increase during the 2015 tax season in attempts by criminals using stolen identity information to file fraudulent tax returns and claim refunds. Intuit provided information in response to those inquiries. A consolidated putative class action lawsuit was filed by individuals who claim to have suffered damages in connection with the 2015 events. We believe that the allegations in that lawsuit are without merit, and we intend to vigorously defend against them.
|
9. Segment Information
|
In August 2017, we aligned our segment reporting for fiscal 2018 with our core customers and business partners. The Consumer Ecosystem offering moved from the Small Business segment into the Consumer Tax segment. The company also renamed the Small Business, Consumer Tax, and ProConnect segments as the Small Business & Self-Employed, Consumer, and Strategic Partner segments. The Strategic Partner segment will continue to manage our professional tax offerings while now focusing on partners instrumental to the success of Intuit’s ecosystem.
We have defined our
three
reportable segments, described below, based on factors such as how we manage our operations and how our chief operating decision maker views results. We define the chief operating decision maker as our Chief Executive Officer and our Chief Financial Officer. Our chief operating decision maker organizes and manages our business primarily on the basis of product and service offerings.
|
Small Business & Self-Employed
:
This segment targets small businesses, the self-employed, and the accounting professionals who serve and advise them around the globe. Our offerings include QuickBooks financial and business management online services and desktop software, payroll solutions, and payment processing solutions.
Consumer
:
This segment targets consumers and includes TurboTax income tax preparation products and services sold in the U.S. and Canada.
Strategic Partner
:
This segment targets professional accountants in the U.S. and Canada, who are essential to both small business success and tax preparation and filing. Our professional tax offerings include Lacerte, ProSeries, ProFile, and ProConnect Tax Online.
|
All of our segments operate primarily in the United States and sell primarily to customers in the United States. International total net revenue was less than
5
%
of consolidated total net revenue for all periods presented.
We include expenses such as corporate selling and marketing, product development, general and administrative expenses and share-based compensation expenses, which are not allocated to specific segments, in unallocated corporate items. Unallocated corporate items also include amortization of acquired technology, amortization of other acquired intangible assets, and goodwill and intangible asset impairment charges.
The accounting policies of our reportable segments are the same as those described in the summary of significant accounting policies in Note 1 to the financial statements in Item 8 of our Annual Report on Form 10-K for the fiscal year ended
July 31, 2017
and in Note 1,
"Description of Business and Summary of Significant Accounting Policies – Significant Accounting Policies"
in this Quarterly Report on Form 10-Q. Except for goodwill and purchased intangible assets, we do not generally track assets by reportable segment and, consequently, we do not disclose total assets by reportable segment.
|
Intuit Q1 Fiscal 2018 Form 10-Q
|
19
|
||
|
|
Three Months Ended
|
||||||
|
(In millions)
|
October 31,
2017 |
October 31,
2016 |
|||||
|
Net revenue:
|
|
|
|||||
|
Small Business & Self-Employed
|
$
|
|
|
$
|
|
|
|
|
Consumer
|
|
|
|
|
|||
|
Strategic Partner
|
|
|
|
|
|||
|
Total net revenue
|
$
|
|
|
$
|
|
|
|
|
Operating income (loss):
|
|
|
|||||
|
Small Business & Self-Employed
|
$
|
|
|
$
|
|
|
|
|
Consumer
|
(
|
)
|
(
|
)
|
|||
|
Strategic Partner
|
|
|
|
|
|||
|
Total segment operating income
|
|
|
|
|
|||
|
Unallocated corporate items:
|
|
|
|||||
|
Share-based compensation expense
|
(
|
)
|
(
|
)
|
|||
|
Other common expenses
|
(
|
)
|
(
|
)
|
|||
|
Amortization of acquired technology
|
(
|
)
|
(
|
)
|
|||
|
Amortization of other acquired intangible assets
|
(
|
)
|
(
|
)
|
|||
|
Total unallocated corporate items
|
(
|
)
|
(
|
)
|
|||
|
Total operating loss
|
$
|
(
|
)
|
$
|
(
|
)
|
|
|
Intuit Q1 Fiscal 2018 Form 10-Q
|
20
|
||
|
|
Management’s Discussion and Analysis of Financial Condition and Results of Operations (MD&A) is intended to provide readers of our consolidated financial statements with the perspectives of management. This should allow the readers of this report to obtain a comprehensive understanding of our businesses, strategies, current trends, and future prospects. Our MD&A includes the following sections:
|
•
Executive Overview:
High level discussion of our operating results and some of the trends that affect our business.
•
Critical Accounting Policies and Estimates:
Significant changes since our most recent Annual Report on Form 10-K that we believe are important to understanding the assumptions and judgments underlying our financial statements.
•
Results of Operations:
A more detailed discussion of our revenue and expenses.
•
Liquidity and Capital Resources:
Discussion of key aspects of our statements of cash flows, changes in our balance sheets, and our financial commitments.
|
You should note that this MD&A contains forward-looking statements that involve risks and uncertainties. Please
see the section entitled “Forward-Looking Statements” immediately preceding Part 1 for important information to consider
when evaluating such statements.
You should read this MD&A in conjunction with the financial statements and related notes in Part I, Item 1 of this Quarterly Report and our Annual Report on Form 10-K for the fiscal year ended
July 31, 2017
.
|
EXECUTIVE OVERVIEW
|
This overview provides a high-level discussion of our operating results and some of the trends that affect our business. We believe that an understanding of these trends is important in order to understand our financial results as well as our future prospects. This summary is not intended to be exhaustive, nor is it a substitute for the detailed discussion and analysis provided elsewhere in this Quarterly Report on Form 10-Q.
|
About Intuit
|
Intuit helps consumers, small businesses, and the self-employed prosper by delivering financial management and compliance products and services. We also provide specialized tax products to accounting professionals, who are key partners that help us reach small business customers. We organize our businesses into three reportable segments – Small Business & Self-Employed, Consumer, and Strategic Partner.
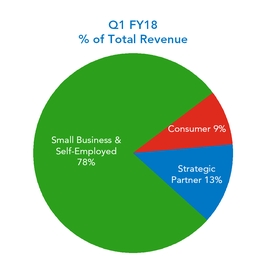
|
Small Business & Self-Employed
:
This segment targets small businesses, the self-employed, and the accounting professionals who serve and advise them around the globe. Our offerings include QuickBooks financial and business management online services and desktop software, payroll solutions, and payment processing solutions.
Consumer
:
This segment targets consumers and includes TurboTax income tax preparation products and services sold in the U.S. and Canada.
Strategic Partner
:
This segment targets professional accountants in the U.S. and Canada, who are essential to both small business success and tax preparation and filing. Our professional tax offerings include Lacerte, ProSeries, ProFile, and ProConnect Tax Online.
|
|
Intuit Q1 Fiscal 2018 Form 10-Q
|
21
|
||
|
Our Growth Strategy
|
|
As emerging technology and market trends change the way people live and work, we change too. For more than three decades, we have continuously re-invented ourselves from a desktop business to the web and mobile. Our assessment of external trends – the emergence and influence of the digital generation, the evolution of social networks as a means to accomplish important financial tasks and growth in the self-employed workforce – reveals significant opportunities to drive future growth. The result is a global market that is shifting from traditional services that are manual in nature to more automated, interconnected services that work on platforms and increasingly rely on artificial intelligence and machine learning.
Our strategy is built on the strength of our One Intuit Ecosystem, a connected, one-stop destination for customers to make their financial lives easier. Our evolving strategy focuses on three elements:
|
|
•
Personalized experiences
:
With deep expertise and customer-provided data, we can create increasingly valuable personalized experiences that delight and serve our customers. For example, our TurboTax solutions use machine learning to create a customized interview, asking questions uniquely tailored to each individual situation. By delivering an amazing end-to-end experience, we offer customers the value they expect from our offerings as quickly and easily as possible.
•
Trusted open platform
:
With a secure, open platform, we allow real-time access to – and use of – high-quality data to internal and external developers, speeding our ability to embrace new technology, such as artificial intelligence and machine learning. One example of this is our QuickBooks open platform, where small businesses and accountants can install apps created by third-party developers to enhance the functionality and personalization of the QuickBooks experience.
•
Indispensable connections
:
Within our One Intuit Ecosystem we strive to build connections between customers, partners, and products on our platform. We also focus on building relationships with strategic partners critical to providing key customer benefits. These include accountants, developers, financial institutions, schools, governments, and other platform companies.
|
|
Industry Trends and Seasonality
|
Industry Trends
The industry in which we operate is dynamic and highly competitive, and we expect it to remain so in the future. The markets for software and related services, especially highly-available connected services, are characterized by rapid technological change, shifting customer needs, and frequent new product introductions and enhancements. Competitive interest and expertise in many of the markets we serve have grown markedly over the past few years and we expect this trend to continue. There are also large, cloud-based service companies who innovate quickly and serve small businesses and consumers. While today our competition with such companies may be limited, as we and those companies grow, our competition with them may increase. In recent years the widespread availability of the Internet, the emergence of mobile devices, and the explosion of social media have accelerated the pace of change and revolutionized the way that people throughout the world manage important financial tasks. The result is a global market that is shifting from traditional services that are paper-based, human-produced, and brick-and-mortar bound, to one where people understand, demand, and embrace the benefits of connected services. This trend toward connected services is the primary driver of the strategies in all of our businesses.
Seasonality
Our Consumer offerings have significant seasonal patterns. As a result, during each of the last three fiscal years the total revenue for our third quarter ended April 30 has represented nearly half of our total revenue for those years. We expect the seasonality of our Consumer business to continue to have a significant impact on our quarterly financial results in the future.
|
Key Challenges and Risks
|
Our growth strategy depends upon our ability to initiate and embrace disruptive technology trends, to enter new markets, and to drive broad adoption of the products and services we develop and market. Our future growth also increasingly depends on the strength of our third-party business relationships and our ability to continue to develop, maintain and strengthen new and existing relationships. To remain competitive and continue to grow, we are investing significant resources in our product development, marketing, and sales capabilities, and we expect to continue to do so in the future.
As we continue transitioning to offer more connected services, the ongoing operation and availability of our information technology and communication systems and those of our external service providers is becoming increasingly important. Because we help customers manage their financial lives, we face risks associated with the hosting, collection, use, and retention of personal customer information and data. We are investing significant management attention and resources in our
|
Intuit Q1 Fiscal 2018 Form 10-Q
|
22
|
||
information technology infrastructure and in our privacy and security capabilities, and we expect to continue to do so in the future.
Beginning in early calendar year 2015, state taxing authorities, the IRS, and the tax preparation industry experienced an increase in attempts by criminals using stolen identity information to file fraudulent tax returns and claim refunds at the federal level and expanding into the state level. We implemented additional security measures in our products and began working with state governments to share information regarding suspicious filings while continuing to share such information with the federal government. We continue to invest in security and to work with the broader industry and government to protect our customers against this type of fraud.
For a complete discussion of the most significant risks and uncertainties affecting our business, please see
“Forward-Looking
Statements”
immediately preceding Part 1 and
“Risk Factors”
in Item 1A of Part II of this Quarterly Report.
|
Overview of Financial Results
|
The most important financial indicators that we use to assess our business are revenue growth for the company as a whole, for each reportable segment, and for product lines within each reportable segment; operating income growth and operating income margins for the company as a whole and for each reportable segment; earnings per share; and cash flow from operations. We also track certain non-financial drivers of revenue growth and, when material, identify them in the applicable discussions of segment results below. These non-financial drivers include, for example, customer growth and retention for all of our businesses and transaction volume for our payment processing business. Total credit and debit card transaction volume correlates strongly with the macroeconomic environment and is one of the key drivers of revenue growth in our payment processing business. Customers for our connected services offerings have generally grown faster than those for our traditional desktop software offerings, reflecting our strategic focus on connected services over the past few years. Connected services (total service and other revenue) generated $3.8 billion or 73% of our total revenue in fiscal
2017
. We expect connected services revenue as a percentage of our total revenue to continue to grow in the future.
Key highlights for the first quarter of fiscal 2018 include the following:
|
Revenue of
|
Small Business & Self-Employed revenue of
|
Operating loss of
|
||
|
$886 M
|
$694 M
|
$57 M
|
||
|
up 14% from same period of fiscal 2017
|
up 17% from same period of fiscal 2017
|
down 7% from same period of fiscal 2017
|
||
|
Net loss of
|
Basic and diluted net loss per share of
|
Cash, cash equivalents and investments of
|
||
|
$17 M
|
$0.07
|
$777 M
|
||
|
down 43% from same period of fiscal 2017
|
down 42% from same period of fiscal 2017
|
|||
|
Intuit Q1 Fiscal 2018 Form 10-Q
|
23
|
||
|
CRITICAL ACCOUNTING POLICIES AND ESTIMATES
|
In preparing our financial statements, we make estimates, assumptions and judgments that can have a significant impact on our net revenue, operating income or loss, and net income or loss, as well as on the value of certain assets and liabilities on our balance sheet. We believe that the estimates, assumptions and judgments involved in the accounting policies described in Management’s Discussion and Analysis of Financial Condition and Results of Operations in Item 7 of our Annual Report on Form 10-K for the fiscal year ended
July 31, 2017
have the greatest potential impact on our financial statements, so we consider them to be our critical accounting policies and estimates. We believe that there were no significant changes in those critical accounting policies and estimates during the first
three months
of fiscal
2018
. Senior management has reviewed the development and selection of our critical accounting policies and estimates and their disclosure in this Quarterly Report on Form 10-Q with the Audit and Risk Committee of our Board of Directors.
|
RESULTS OF OPERATIONS
|
|
Financial Overview
|
||||||||||||||
|
(Dollars in millions, except per share amounts)
|
Q1
FY18 |
Q1
FY17 |
$
Change
|
%
Change
|
||||||||||
|
Total net revenue
|
$
|
886
|
|
$
|
778
|
|
$
|
108
|
|
14
|
%
|
|||
|
Operating loss
|
(57
|
)
|
(61
|
)
|
4
|
|
(7
|
)%
|
||||||
|
Net loss
|
(17
|
)
|
(30
|
)
|
13
|
|
(43
|
)%
|
||||||
|
Basic and diluted net loss per share
|
$
|
(0.07
|
)
|
$
|
(0.12
|
)
|
$
|
0.05
|
|
(42
|
)%
|
|||
Total net revenue for the first quarter of fiscal
2018
increased
$108 million
or
14%
compared with the same period of fiscal
2017
. The increase was primarily attributable to an increase in our Small Business & Self-Employed segment revenue due to growth in the Online Ecosystem. Revenue in our Consumer segment was seasonally light. See “S
egment Results”
later in this Item 2 for more information about the results for all of our reportable segments.
Operating loss decreased
7%
for the first quarter of fiscal
2018
compared with the same period of fiscal
2017
due to the increase in revenue partially offset by higher costs and expenses, including higher spending for staffing, outside services, advertising and other marketing programs, and share-based compensation. See “
Operating Expenses”
later in this Item 2 for more information.
Net loss decreased
43%
for the first quarter of fiscal
2018
compared with the same period of fiscal
2017
due to the decrease in operating loss and a higher effective tax rate in the fiscal 2018 period. The higher effective tax rate was due to increased tax benefits on share-based compensation. See “
Non-Operating Income and Expenses - Income Taxes”
later in this Item 2 for more information. Basic and diluted net loss per share decreased
42%
to
$0.07
, consistent with the decrease in net loss.
|
Segment Results
|
The information below is organized in accordance with our three reportable segments. See
“Executive Overview – About Intuit”
earlier in this Item 2 and Note 9 to the financial statements in Part I, Item 1 of this Quarterly Report for more information. All of our segments operate primarily in the United States and sell primarily to customers in the United States. International total net revenue was less than
5%
of consolidated total net revenue for all periods presented.
Segment operating income or loss is segment net revenue less segment cost of revenue and operating expenses. See
“Executive Overview – Industry Trends and Seasonality”
earlier in this Item 2 for a description of the seasonality of our business. Segment expenses do not include certain costs, such as corporate selling and marketing, product development, general and administrative expenses, and share-based compensation expenses, which are not allocated to specific segments. These unallocated costs totaled
$372 million
in the first
three
months of fiscal
2018
and
$328 million
in the first
three
months of fiscal
2017
. Unallocated costs increased in the fiscal
2018
period due to increased corporate product development and selling and marketing expenses in support of the growth of our businesses and higher share-based compensation expenses. Segment expenses also do not include amortization of acquired technology, amortization of other acquired intangible assets, and goodwill and intangible asset impairment charges. See Note 9 to the financial statements in Part I, Item 1 of this Quarterly Report for reconciliations of total segment operating income or loss to consolidated operating income or loss for each fiscal period presented.
We calculate revenue growth rates and segment operating margin figures using dollars in thousands. Those results may vary slightly from figures calculated using the dollars in millions presented below.
|
Intuit Q1 Fiscal 2018 Form 10-Q
|
24
|
||
|
Small Business & Self-Employed
|

|

Product revenue is derived primarily from QuickBooks Desktop software products, including Desktop Pro, Desktop for Mac, Desktop Premier, and Enterprise; QuickBooks Basic Payroll and QuickBooks Enhanced Payroll; QuickBooks Point of Sale solutions; ProAdvisor Program memberships for the accounting professionals who serve small businesses; and financial supplies.
Service and other revenue is derived primarily from our QuickBooks Online and QuickBooks Self-Employed financial and business management offerings; QuickBooks Desktop Pro Plus, QuickBooks Desktop Premier Plus, and QuickBooks Enterprise with Hosting, our subscription offerings; QuickBooks Enterprise term licenses and QuickBooks technical support plans; small business payroll services, including QuickBooks Online Payroll, Intuit Online Payroll, QuickBooks Assisted Payroll, and Intuit Full Service Payroll; and payment processing services for small businesses.
|
(Dollars in millions)
|
Q1
FY18 |
Q1
FY17 |
%
Change
|
|||||||
|
Product revenue
|
$
|
208
|
|
$
|
188
|
|
11
|
%
|
||
|
Service and other revenue
|
486
|
|
405
|
|
20
|
%
|
||||
|
Total segment revenue
|
$
|
694
|
|
$
|
593
|
|
17
|
%
|
||
|
% of total revenue
|
78
|
%
|
76
|
%
|
|
|||||
|
Segment operating income
|
$
|
301
|
|
$
|
239
|
|
26
|
%
|
||
|
% of related revenue
|
43
|
%
|
40
|
%
|
|
|||||
Total Small Business & Self-Employed segment revenue increased
$101 million
or
17%
in the
first
quarter of fiscal
2018
compared with the same period of fiscal
2017
due to growth in Online Ecosystem revenue.
Online Ecosystem
Online Ecosystem revenue of $258 million increased 35% in the
first
quarter of fiscal
2018
compared with the same period of fiscal
2017
due to customer acquisition. At October 31, 2017 QuickBooks Online subscribers were
2.55 million
, up 56% compared with the same point in time a year ago. Online Services revenue increased 15% in the
first
quarter of fiscal
2018
compared with the same period of fiscal
2017
due to customer growth in online payroll and payments.
Desktop Ecosystem
Desktop Ecosystem revenue of $436 million increased 8% in the
first
quarter of fiscal
2018
compared with the same period of fiscal
2017
due to growth in QuickBooks Enterprise. QuickBooks Desktop units declined 35%.
Small Business & Self-Employed segment operating income as a percentage of related revenue increased in the
first
quarter of fiscal
2018
compared with the same period of fiscal
2017
. This increase was due to the higher revenue described above partially offset by higher expenses for staffing and advertising and other marketing programs.
|
Intuit Q1 Fiscal 2018 Form 10-Q
|
25
|
||
|
Consumer
|

|
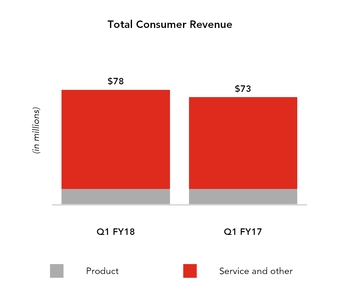
Product revenue is derived primarily from TurboTax desktop tax return preparation software.
Service and other revenue is derived primarily from TurboTax Online tax return preparation services and electronic tax filing services.
|
(Dollars in millions)
|
Q1
FY18 |
Q1
FY17 |
%
Change
|
|||||||
|
Product revenue
|
$
|
11
|
|
$
|
11
|
|
(2
|
)%
|
||
|
Service and other revenue
|
67
|
|
62
|
|
9
|
%
|
||||
|
Total segment revenue
|
$
|
78
|
|
$
|
73
|
|
7
|
%
|
||
|
% of total revenue
|
9
|
%
|
10
|
%
|
|
|||||
|
Segment operating loss
|
$
|
(55
|
)
|
$
|
(38
|
)
|
44
|
%
|
||
|
% of related revenue
|
(70
|
)%
|
(52
|
)%
|
|
|||||
Total Consumer segment revenue increased
7%
to
$78 million
in the first quarter of fiscal 2018 compared with the same quarter of fiscal 2017. Due to the seasonal nature of our Consumer offerings, we typically generate nominal revenue from Consumer products and services in our first fiscal quarter compared with our second and third fiscal quarters. The majority of revenue for the first quarter of each fiscal year is for the filing of extended returns for the previous tax year. Because of the seasonality of our Consumer revenue, we do not believe that first fiscal quarter revenue in our Consumer segment is indicative of revenue trends for the current fiscal year. We will not have substantially complete results for the 2017 tax season until the third quarter of fiscal 2018.
In our first fiscal quarter, Consumer segment typically generates operating losses because Consumer revenue is nominal while segment operating expenses for functions such as research and development continue at relatively consistent levels. We do not believe that Consumer segment operating results for the first quarter of fiscal 2018 compared with the same quarter of fiscal 2017 are indicative of trends for the full fiscal year.
|
Intuit Q1 Fiscal 2018 Form 10-Q
|
26
|
||
|
Strategic Partner
|

|
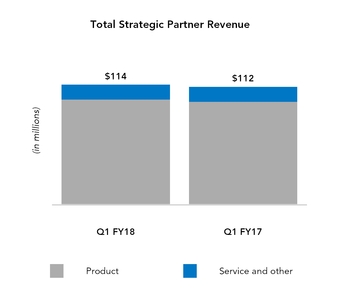
Product revenue is derived primarily from Lacerte, ProSeries, and ProFile desktop tax preparation software products.
Service and other revenue is derived primarily from ProConnect Tax Online tax return preparation, bank products, and related services that complement the tax return preparation process.
|
(Dollars in millions)
|
Q1
FY18 |
Q1
FY17 |
%
Change
|
|||||||
|
Product revenue
|
$
|
100
|
|
$
|
98
|
|
2
|
%
|
||
|
Service and other revenue
|
14
|
|
14
|
|
1
|
%
|
||||
|
Total segment revenue
|
$
|
114
|
|
$
|
112
|
|
2
|
%
|
||
|
% of total revenue
|
13
|
%
|
14
|
%
|
|
|||||
|
Segment operating income
|
$
|
72
|
|
$
|
70
|
|
3
|
%
|
||
|
% of related revenue
|
63
|
%
|
62
|
%
|
|
|||||
The Strategic Partner segment targets professional accountants in the U.S. and Canada, who are essential to both small business success and tax preparation and filing.
Total Strategic Partner segment revenue increased slightly in the first quarter of fiscal 2018 compared with the same period of fiscal 2017. Strategic Partner segment operating income as a percentage of related revenue increased slightly in the first
three
months of fiscal
2018
compared with the same period of fiscal 2017 due to the increase in revenue and relatively stable spending.
|
Intuit Q1 Fiscal 2018 Form 10-Q
|
27
|
||
|
Cost of Revenue
|
|||||||||||||
|
(Dollars in millions)
|
Q1
FY18 |
% of
Related
Revenue
|
Q1
FY17 |
% of
Related
Revenue
|
|||||||||
|
Cost of product revenue
|
$
|
24
|
|
8
|
%
|
$
|
29
|
|
10
|
%
|
|||
|
Cost of service and other revenue
|
170
|
|
30
|
%
|
151
|
|
31
|
%
|
|||||
|
Amortization of acquired technology
|
2
|
|
n/a
|
|
3
|
|
n/a
|
|
|||||
|
Total cost of revenue
|
$
|
196
|
|
22
|
%
|
$
|
183
|
|
24
|
%
|
|||
Cost of product revenue as a percentage of related revenue decreased in the first quarter of fiscal 2018 compared with the same period of fiscal 2017 due to the decrease in cost of product revenue and an increase in the related revenue. Cost of product revenue decreased primarily due to the decline in QuickBooks Desktop units, as well as lower costs to provide support for the desktop products. We expense costs of product revenue as they are incurred for delivered software and we do not defer any of these costs when product revenue is deferred.
|
Operating Expenses
|
|||||||||||||
|
(Dollars in millions)
|
Q1
FY18 |
% of
Total
Net
Revenue
|
Q1
FY17 |
% of
Total
Net
Revenue
|
|||||||||
|
Selling and marketing
|
$
|
308
|
|
35
|
%
|
$
|
283
|
|
36
|
%
|
|||
|
Research and development
|
293
|
|
33
|
%
|
246
|
|
32
|
%
|
|||||
|
General and administrative
|
145
|
|
16
|
%
|
126
|
|
16
|
%
|
|||||
|
Amortization of other acquired intangible assets
|
1
|
|
—
|
%
|
1
|
|
—
|
%
|
|||||
|
Total operating expenses
|
$
|
747
|
|
84
|
%
|
$
|
656
|
|
84
|
%
|
|||
Total operating expenses as a percentage of total net revenue was flat in the first quarter of fiscal
2018
compared to the same quarter of fiscal
2017
. Total net revenue for the
first
quarter of fiscal
2018
increased
$108 million
or
14%
while total operating expenses for the quarter increased
$91 million
or
14%
. Operating expenses increased about $43 million for higher staffing expenses due to higher headcount, $19 million for outside services, $7 million for advertising and other marketing programs, and
$7 million
for share-based compensation expenses. Share-based compensation expenses have been increasing over time because the total fair value of our share-based awards has generally been increasing.
|
Non-Operating Income and Expenses
|
Interest Expense
Interest expense of
$5
million for the first
three months
of fiscal
2018
consisted primarily of interest on our unsecured term loan and unsecured revolving credit facility. Interest expense of
$9
million for the first
three months
of fiscal
2017
consisted primarily of interest on our senior notes and unsecured term loan. In the third quarter of fiscal 2017 we repaid the senior notes when they became due. See Note 4 and Note 5 to the financial statements in Part I, Item 1 of this Quarterly Report for more information.
Interest and Other Income (Expense), Net
|
(In millions)
|
Q1
FY18 |
Q1
FY17 |
|||||
|
Interest income
(1)
|
$
|
2
|
|
$
|
1
|
|
|
|
Net gain (loss) on executive deferred compensation plan assets
(2)
|
2
|
|
(1
|
)
|
|||
|
Other
|
(1
|
)
|
(2
|
)
|
|||
|
Total interest and other income (expense), net
|
$
|
3
|
|
$
|
(2
|
)
|
|
(1) Interest income in the
first
quarter of fiscal
2018
increased compared with the same period of fiscal
2017
due to higher average interest rates partially offset by lower average invested balances.
(2) In accordance with authoritative guidance, we record gains and losses associated with executive deferred compensation plan assets in interest and other income and gains and losses associated with the related liabilities in operating expenses. The total amounts recorded in operating expenses for each period are approximately equal to the total amounts recorded in interest and other income in those periods.
|
Intuit Q1 Fiscal 2018 Form 10-Q
|
28
|
||
Income Taxes
We compute our provision for or benefit from income taxes by applying the estimated annual effective tax rate to income or loss from recurring operations and adding the effects of any discrete income tax items specific to the period.
In the first quarter of fiscal 2017 we adopted ASU 2016-09. As a result, we recognized excess tax benefits on share-based compensation of $25 million and $19 million in our provision for income taxes for the three months ended October 31, 2017 and 2016 respectively.
Our effective tax rate for the first quarter of fiscal 2018 was approximately
72%
. Excluding discrete tax items primarily related to share-based compensation tax benefits resulting from the adoption of ASU 2016-09, our effective tax rate for the period was
33%
and did not differ significantly from the federal statutory rate of
35%
. See Note 6 to the financial statements in Part I, Item 1 of this Quarterly Report for more information.
Our effective tax rate for the first quarter of fiscal 2017 was approximately
58%
. Excluding discrete tax items primarily related to share-based compensation tax benefits resulting from the adoption of ASU 2016-09, our effective tax rate for the period was 34% and did not differ significantly from the federal statutory rate of 35%. See Note 6 to the financial statements in Part I, Item 1 of this Quarterly Report for more information.
|
LIQUIDITY AND CAPITAL RESOURCES
|
|
Overview
|
At
October 31, 2017
, our cash, cash equivalents and investments totaled
$777 million
, which was flat compared to
July 31, 2017
due to the factors discussed under
“Statements of Cash Flows”
below. Our primary sources of liquidity have been cash from operations, which entails the collection of accounts receivable for products and services, and borrowings under our credit facility. Our primary uses of cash have been for research and development programs, selling and marketing activities, capital projects, acquisitions of businesses, debt service costs and debt repayment, repurchases of our common stock under our stock repurchase programs, and the payment of cash dividends. As discussed in
“Executive Overview – Industry Trends and Seasonality”
earlier in this Item 2, our business is subject to significant seasonality. The balance of our cash, cash equivalents, and investments generally fluctuates with that seasonal pattern. We believe the seasonality of our business is likely to continue in the future.
The following table summarizes selected measures of our liquidity and capital resources at the dates indicated:
|
(Dollars in millions)
|
October 31,
2017 |
July 31,
2017 |
$
Change
|
%
Change
|
||||||||||
|
Cash, cash equivalents, and investments
|
$
|
777
|
|
$
|
777
|
|
$
|
—
|
|
—
|
%
|
|||
|
Long-term investments
|
31
|
|
31
|
|
—
|
|
—
|
%
|
||||||
|
Short-term debt
|
450
|
|
50
|
|
400
|
|
800
|
%
|
||||||
|
Long-term debt
|
425
|
|
438
|
|
(13
|
)
|
(3
|
)%
|
||||||
|
Working capital (deficit)
|
(702
|
)
|
(529
|
)
|
(173
|
)
|
33
|
%
|
||||||
|
Ratio of current assets to current liabilities
|
0.7 : 1
|
|
0.7 : 1
|
|
|
|
||||||||
We have historically generated significant cash from operations and we expect to continue to do so during the balance of fiscal
2018
. Our cash, cash equivalents, and investments totaled
$777 million
at
October 31, 2017
, none of those funds were restricted, and approximately
71%
of those funds were located in the U.S. Our unsecured revolving credit facility is available to us for general corporate purposes, including future acquisitions and stock repurchases. In the first quarter of fiscal 2018, we borrowed $400 million under the revolving credit facility for general corporate purposes and share repurchases, as our cash balance in the first fiscal quarter is seasonally low. At
October 31, 2017
,
$400 million
was outstanding under the revolving credit facility.
We evaluate, on an ongoing basis, the merits of acquiring technology or businesses, or establishing strategic relationships with and investing in other companies. Our strong liquidity profile enables us to respond nimbly to these types of opportunities.
Based on past performance and current expectations, we believe that our cash and cash equivalents, investments, and cash generated from operations will be sufficient to meet anticipated seasonal working capital needs, capital expenditure requirements, contractual obligations, commitments, debt service requirements, and other liquidity requirements associated with our operations for at least the next 12 months. We expect to return excess cash generated by operations to our stockholders through repurchases of our common stock and payment of cash dividends, after taking into account our operating and strategic cash needs.
|
Intuit Q1 Fiscal 2018 Form 10-Q
|
29
|
||
|
Statements of Cash Flows
|
The following table summarizes selected items from our statements of cash flows for the first
three months
of fiscal
2018
and fiscal
2017
. See the financial statements in Part I, Item 1 of this Quarterly Report for complete statements of cash flows for those periods.
|
|
Three Months Ended
|
||||||||||
|
(Dollars in millions)
|
October 31,
2017 |
October 31,
2016 |
$
Change
|
||||||||
|
Net cash provided by (used in):
|
|
|
|
||||||||
|
Operating activities
|
$
|
(78
|
)
|
$
|
(205
|
)
|
$
|
127
|
|
||
|
Investing activities
|
(75
|
)
|
98
|
|
(173
|
)
|
|||||
|
Financing activities
|
158
|
|
(166
|
)
|
324
|
|
|||||
|
Effect of exchange rates on cash and cash equivalents
|
(5
|
)
|
(5
|
)
|
—
|
|
|||||
|
Net increase (decrease) in cash and cash equivalents
|
$
|
—
|
|
$
|
(278
|
)
|
$
|
278
|
|
||
|
Our primary sources and uses of cash were as follows:
|
||
|
Three Months Ended
|
||
|
October 31, 2017
|
October 31, 2016
|
|
|
Sources of cash:
•
Borrowings under revolving credit facility
•
Issuance of common stock under employee stock plans
Uses of cash:
•
Operations
•
Payment of accrued bonuses for fiscal 2017
•
Repurchases of shares of our common stock
•
Payments of cash dividends
•
Capital expenditures
•
Repayment of debt
|
Sources of cash:
•
Net sales of investments
•
Borrowings under revolving credit facility
•
Issuance of common stock under employee stock plans
Uses of cash:
•
Operations
•
Payment of accrued bonuses for fiscal 2016
•
Repurchases of shares of our common stock
•
Payment of cash dividends
•
Capital expenditures
|
|
|
Stock Repurchase Programs, Treasury Shares, and Dividends on Common Stock
|
As described in Note 7 to the financial statements in Part I, Item 1 of this Quarterly Report, during the first
three months
of fiscal
2018
we continued to repurchase shares of our common stock under repurchase programs that our Board of Directors has authorized. At
October 31, 2017
, we had authorization from our Board of Directors to expend up to an additional
$1.4 billion
for stock repurchases. We currently expect to continue repurchasing our common stock on a quarterly basis; however, future stock repurchases under the current program are at the discretion of management, and authorization of future stock repurchase programs is subject to the final determination of our Board of Directors.
During the first
three months
of fiscal
2018
we also continued to pay quarterly cash dividends on shares of our outstanding common stock. In
November 2017
our Board of Directors declared a quarterly cash dividend of
$0.39
per share of outstanding common stock payable on
January 18, 2018
to stockholders of record at the close of business on
January 10, 2018
. We currently expect to continue paying comparable cash dividends on a quarterly basis; however, future declarations of dividends and the establishment of future record dates and payment dates are subject to the final determination of our Board of Directors.
|
Credit Facility
|
On February 1, 2016 we entered into a master credit agreement with certain institutional lenders for a five-year credit facility in an aggregate principal amount of $1.5 billion. The master credit agreement includes a $500 million unsecured term loan and a $1 billion unsecured revolving credit facility that will expire on February 1, 2021. Under the master credit agreement we may, subject to certain customary conditions, on one or more occasions increase commitments under the revolving credit facility in an amount not to exceed $250 million in the aggregate and may extend the maturity date up to two times. Advances under the revolving credit facility accrue interest at rates that are equal to, at our election, either Bank of America's alternate base rate plus a margin that ranges from 0.0% to 0.5% or the London Interbank Offered Rate (LIBOR) plus a margin that ranges from 0.9% to 1.5%. Actual margins under either election will be based on our senior debt credit ratings. At
October 31, 2017
,
$400 million
was outstanding under the revolving credit facility. We monitor counterparty risk associated with the institutional
|
Intuit Q1 Fiscal 2018 Form 10-Q
|
30
|
||
lenders that are providing the credit facility. We currently believe that the credit facility will be available to us should we choose to borrow under it.
Under the master credit agreement, we borrowed $500 million in the form of an unsecured term loan on February 1, 2016. We may, subject to certain customary conditions, on one or more occasions increase commitments under the term loan in an amount not to exceed $500 million in the aggregate. The term loan accrues interest at rates that are equal to, at our election, either Bank of America's alternate base rate plus a margin that ranges from 0.125% to 0.875% or LIBOR plus a margin that ranges from 1.125% to 1.875%. Actual margins under either election will be based on our senior debt credit ratings. The term loan is subject to quarterly principal payments, which began in July 2017, of
2.5%
of the original loan amount, with the balance payable on February 1, 2021. At
October 31, 2017
,
$475 million
was outstanding under the term loan.
The master credit agreement includes customary affirmative and negative covenants, including financial covenants that require us to maintain a ratio of total debt to annual earnings before interest, taxes, depreciation and amortization (EBITDA) of not greater than 3.25 to 1.00 as of any date and a ratio of annual EBITDA to annual interest expense of not less than 3.00 to 1.00 as of the last day of each fiscal quarter. We remained in compliance with these covenants at all times during the quarter ended
October 31, 2017
.
|
Cash Held by Foreign Subsidiaries
|
Our cash, cash equivalents, and investments totaled
$777 million
at
October 31, 2017
. Of this amount, approximately
29%
was held by our foreign subsidiaries and subject to repatriation tax considerations. These foreign funds were located primarily in Canada and India. We intend to permanently reinvest a significant portion of our earnings from foreign operations, and we currently do not anticipate that we will need funds generated from foreign operations to fund our domestic operations. In the event that funds from foreign operations are needed to fund operations in the United States, if U.S. taxes have not been previously provided on the related earnings we would provide for and pay additional U.S. taxes at the time we change our intention with regard to the reinvestment of those earnings.
Off-Balance Sheet Arrangements
At
October 31, 2017
, we did not have any significant off-balance sheet arrangements, as defined in Item 303(a)(4)(ii) of Regulation S-K.
Contractual Obligations
We presented our contractual obligations at
July 31, 2017
in our Annual Report on Form 10-K for the fiscal year then ended. On September 13, 2017 we signed an agreement that includes a minimum purchase commitment of $450 million through August 31, 2022. There were no other significant changes to our contractual obligations during the first
three
months of fiscal
2018
.
Recent Accounting Pronouncements
For a description of recent accounting pronouncements, if any, and the potential impact of these pronouncements on our consolidated financial statements, see Note 1 to the financial statements in Part I, Item 1 of this Quarterly Report.
|
Intuit Q1 Fiscal 2018 Form 10-Q
|
31
|
||
|
|
Investment Portfolio and Interest Rate Risk
We actively monitor market conditions and developments specific to the securities in which we invest. We believe that we take a conservative approach to investing our funds in that we invest only in highly-rated securities and diversify our portfolio of investments. While we believe we take prudent measures to mitigate investment-related risks, such risks cannot be fully eliminated because of market circumstances that are outside our control.
Our investments consist of instruments that meet quality standards that are consistent with our investment policy. This policy specifies that, except for direct obligations of the United States government, securities issued by agencies of the United States government, and money market funds, we diversify our investments by limiting our holdings with any individual issuer. We do not hold derivative financial instruments or European sovereign debt in our portfolio of investments. See Note 2 and Note 3 to the financial statements in Part I, Item 1 of this Quarterly Report for a summary of the amortized cost and fair value of our investments by type of issue.
Our cash equivalents and investments are subject to market risk due to changes in interest rates. Interest rate movements affect the interest income we earn on cash equivalents and investments and the fair value of those investments. If the Federal Reserve Target Rate had increased by 25 basis points from the level of
October 31, 2017
, the value of our investments at that date would have decreased by approximately
$1
million. If the Federal Reserve Target Rate had increased by 100 basis points from the level of
October 31, 2017
, the value of our investments at that date would have decreased by approximately
$4
million.
We are also exposed to the impact of changes in interest rates as they affect our $1 billion unsecured revolving credit facility and $500 million unsecured term loan. Advances under the revolving credit facility accrue interest at rates that are equal to Bank of America's alternate base rate plus a margin that ranges from 0.0% to 0.5% or the London InterBank Offered Rate (LIBOR) plus a margin that ranges from 0.9% to 1.5%. The term loan accrues interest at rates that are equal to, at our election, either Bank of America's alternate base rate plus a margin that ranges from 0.125% to 0.875% or LIBOR plus a margin that ranges from 1.125% to 1.875%. Actual margins under all of these elections are based on our senior debt credit ratings. Consequently, our interest expense fluctuates with changes in the general level of these interest rates. At
October 31, 2017
,
$400 million
was outstanding under the revolving credit facility and
$475 million
was outstanding under the term loan. See Note 4 and Note 5 to the financial statements in Part I, Item 1 of this Quarterly Report for more information.
Impact of Foreign Currency Rate Changes
The functional currencies of our international operating subsidiaries are generally the local currencies. We translate the assets and liabilities of our foreign subsidiaries at the exchange rates in effect on the balance sheet date. We translate their revenue, costs and expenses at the average rates of exchange in effect during the period. We include translation gains and losses in the stockholders’ equity section of our balance sheets. We include net gains and losses resulting from foreign exchange transactions in interest and other income in our statements of operations.
Since we translate foreign currencies (primarily Canadian dollars, Indian rupees, and British pounds) into U.S. dollars for financial reporting purposes, currency fluctuations can have an impact on our financial results. The historical impact of currency fluctuations on our financial results has generally been immaterial. We believe that our exposure to currency exchange fluctuation risk is not significant primarily because our global subsidiaries invoice customers and satisfy their financial obligations almost exclusively in their local currencies. Although the impact of currency fluctuations on our financial results has generally been immaterial in the past and we believe that for the reasons cited above currency fluctuations will not be significant in the future, the impact of currency fluctuations could be material in the future. As of
October 31, 2017
, we did not engage in foreign currency hedging activities.
|
Intuit Q1 Fiscal 2018 Form 10-Q
|
32
|
||
|
|
Evaluation of Disclosure Controls and Procedures
Based upon an evaluation of the effectiveness of disclosure controls and procedures, Intuit’s Chief Executive Officer (CEO) and Chief Financial Officer (CFO) have concluded that as of the end of the period covered by this Quarterly Report on Form 10-Q, our disclosure controls and procedures as defined under Exchange Act Rules 13a-15(e) and 15d-15(e) were effective to provide reasonable assurance that information required to be disclosed in our Exchange Act reports is recorded, processed, summarized and reported within the time periods specified by the Securities and Exchange Commission and is accumulated and communicated to management, including the CEO and CFO, as appropriate to allow timely decisions regarding required disclosure.
Changes in Internal Control over Financial Reporting
During our most recent fiscal quarter, there has not occurred any change in our internal control over financial reporting that has materially affected, or is reasonably likely to materially affect, our internal control over financial reporting.
Inherent Limitations on Effectiveness of Controls
Our management, including our Chief Executive Officer and Chief Financial Officer, believes that our disclosure controls and procedures and internal control over financial reporting are designed to provide reasonable assurance of achieving their objectives and that they are effective at the reasonable assurance level. However, no matter how well conceived and executed, a control system can provide only reasonable and not absolute assurance that the objectives of the control system are met. The design of any control system must reflect the fact that there are resource constraints and the benefits of controls must be considered relative to their costs. There are also limitations that are inherent in any control system. These limitations include the realities that breakdowns can occur because of errors in judgment or mistakes, and that controls can be circumvented by individual persons, by collusion of two or more people, or by management override of the controls. Because of these inherent limitations in a cost effective control system, misstatements due to error or fraud may occur and not be detected.
|
Intuit Q1 Fiscal 2018 Form 10-Q
|
33
|
||
|
|
|
|
See Note 8 to the financial statements in Part I, Item 1 of this Quarterly Report on Form 10-Q for a description of legal proceedings.
|
|
Our businesses routinely encounter and address risks, many of which could cause our future results to be materially different than we presently anticipate. Below, we describe certain important risks, categorized solely for ease of reference as strategic, operational, legal and compliance, and financial risks. The manner in which we respond to future developments as well as our competitors’ reactions to those developments may affect our future operating results.
STRATEGIC RISKS
Strategic risks relate to our current and future operating model, business plans and growth strategy, including the risks associated with the following: competitive pressures on our product offerings and business models; our ability to adapt to technological changes and global trends; our reliance on third-party intellectual property and our ability to protect our own intellectual property rights; the value of our brand; and mergers, acquisitions and divestiture activity that may have unanticipated costs and expenses.
We face intense competitive pressures that may harm our operating results.
We face intense competition in all of our businesses, and we expect competition to remain intense in the future. Our competitors and potential competitors range from large and established entities to emerging start-ups. Our competitors may introduce superior products and services, reduce prices, have greater technical, marketing and other resources, have greater name recognition, have larger installed bases of customers, have well-established relationships with our current and potential customers, advertise aggressively or beat us to market with new products and services. In addition, we may face competition from existing companies, with large established consumer user-bases and broad-based platforms, who may change or expand the focus of their business strategies and marketing to target our customers, including small businesses and tax customers.
We also face competition from companies with a variety of business models and monetization strategies, including increased competition from providers of free offerings, particularly in our tax, accounting, and payments businesses. In order to compete, we have also introduced free offerings in several categories, but we may not be able to attract customers as effectively as competitors with different business models. In addition, we may not be able to monetize our free offerings if other providers of free offerings provide features that we do not offer and customers who have formerly paid for Intuit’s products and services may elect to use our competitors’ free offerings instead. These competitive factors may diminish our revenue and profitability, and harm our ability to acquire and retain customers.
Our consumer tax business also faces significant competition from the public sector, where we face the risk of federal and state taxing authorities proposing revenue strategies that involve developing and providing government tax software or other government return preparation systems at public expense. These or similar programs may be introduced or expanded in the future, which may change the voluntary compliance tax system in ways that could cause us to lose customers and revenue. The IRS Free File Program is currently the sole means by which the IRS offers tax software to taxpayers, and as part of the program the IRS has agreed it will not offer a competing service. Under this program, the IRS has worked with private industry to provide more than 50 million free returns since 2003, utilizing donated private sector tax software and e-filing services for low and middle income taxpayers at no cost to users or the government. However, its continuation depends on a number of factors, including increasing public awareness of and access to the free program, as well as continued government support. The current agreement is scheduled to expire in October 2020. If the Free File Program were to be terminated and the IRS were to enter the software development and return preparation space, the federal government would become a direct competitor of the U.S. tax services industry and of Intuit, which could potentially have material and adverse revenue implications.
Future revenue growth depends upon our ability to adapt to technological change as well as global trends in the way customers access consumer software offerings and successfully introduce new and enhanced products, services and business models.
Online offerings, desktop software and mobile technology industries are characterized by rapidly changing technology, evolving industry standards and frequent new product introductions. As we continue to grow our online, mobile, and other
|
Intuit Q1 Fiscal 2018 Form 10-Q
|
34
|
||
offerings, we must continue to innovate and develop new products and features to meet changing customer needs and attract and retain talented software developers. We need to continue to develop our skills, tools and capabilities to capitalize on existing and emerging technologies, which require us to devote significant resources.
Our consumer and professional tax businesses depend significantly on revenue from customers who return each year to use our updated tax preparation and filing software and services. As our existing products mature, encouraging customers to purchase product upgrades becomes more challenging unless new product releases provide features and functionality that have meaningful incremental value. We also provide additional customer benefits by utilizing customer data available to us through our existing offerings. If we are not able to develop and clearly demonstrate the value of new or upgraded products or services to our customers, or effectively utilize our customers’ data, our revenues may be harmed. In addition, as we continue to introduce and expand our new business models, including offerings that are free to end users, we may be unsuccessful in monetizing or increasing customer adoption of these offerings or our risk profile may change, resulting in loss of revenue.
The number of people who access products and services through devices other than personal computers, including mobile phones, smartphones, and handheld computers such as tablets, continues to increase. We have devoted significant resources to develop products and services for users of these alternative devices, but the versions of our products and services developed for these devices may not be compelling to users. Even if we are able to attract new users through these mobile offerings, the amount of revenue that we derive per user from mobile offerings may be less than the revenue that we have historically derived from users of personal computers. As new devices and new platforms are continually being released, it is difficult to predict the problems we may encounter in developing versions of our products and services for use on these alternative devices and we may need to devote significant resources to the creation, support, and maintenance of such offerings. If we are slow to develop products and technologies that are compatible with these alternative devices, or if our competitors are able to achieve those results more quickly than us, we will fail to capture a significant share of an increasingly important portion of the market for online services, which could adversely affect our business.
In some cases, we may expend a significant amount of resources and management attention on offerings that do not ultimately succeed in their markets. We have encountered difficulty in launching new products and services in the past. If we misjudge customer needs in the future, our new products and services may not succeed and our revenues and earnings may be harmed. We have also invested, and in the future, expect to invest in new business models, geographies, strategies and initiatives. Such endeavors may involve significant risks and uncertainties, including distraction of management from current operations, expenses associated with the initiatives and inadequate return on investments. Because these new initiatives are inherently risky, they may not be successful and may harm our financial condition and operating results.
We rely on third-party intellectual property in our products and services.
Many of our products and services include intellectual property of third parties, which we license under agreements that may need to be renewed or renegotiated from time to time. We may not be able to obtain licenses to these third-party technologies or content on reasonable terms, or at all. If we are unable to obtain the rights necessary to use this intellectual property in our products and services, we may not be able to sell the affected offerings, and customers who are currently using the affected product may be disrupted, which may in turn harm our future financial results, damage our brand, and result in customer loss. Also, we and our customers have been and may continue to be subject to infringement claims as a result of the third-party intellectual property incorporated in our offerings. Although we try to mitigate this risk and we may not be ultimately liable for any potential infringement, pending claims require us to use significant resources, require management attention and could result in loss of customers.
Some of our offerings include third-party software that is licensed under so-called “open source” licenses, some of which may include a requirement that, under certain circumstances, we make available, or grant licenses to, any modifications or derivative works we create based upon the open source software. Although we have established internal review and approval processes to mitigate these risks, we may not be sure that all open source software is submitted for approval prior to use in our products. Many of the risks associated with usage of open source may not be eliminated, and may, if not properly addressed, harm our business.
Our intellectual property rights are valuable, and any inability to protect them could reduce the value of our products, services, and brand.
Our patents, trademarks, trade secrets, copyrights and other intellectual property rights are important assets for us. We aggressively protect our intellectual property rights by relying on federal, state and common law rights in the U.S. and internationally, as well as a variety of administrative procedures. We also rely on contractual restrictions to protect our proprietary rights in products and services. The efforts that we take to protect our proprietary rights may not always be sufficient or effective. Protecting our intellectual property rights is costly and time consuming and may not be successful in every location. Any significant impairment of our intellectual property rights could harm our business, our brand and our ability to compete.
Policing unauthorized use and copying of our products is difficult, expensive, and time consuming. Current U.S. laws that prohibit copying give us only limited practical protection from software piracy and the laws of many other countries provide very little protection. We frequently encounter unauthorized copies of our software being sold through online marketplaces. Although we continue to evaluate and put in place technology solutions to attempt to lessen the impact of piracy and engage
|
Intuit Q1 Fiscal 2018 Form 10-Q
|
35
|
||
in efforts to educate consumers and public policy leaders on these issues and cooperate with industry groups in their efforts to combat piracy, we expect piracy to be a persistent problem that results in lost revenues and increased expenses.
Our business depends on our strong reputation and the value of our brands.
Developing and maintaining awareness of our brands is critical to achieving widespread acceptance of our existing and future products and services and is an important element in attracting new customers. Adverse publicity (whether or not justified) relating to events or activities attributed to us, our employees or agents may tarnish our reputation and reduce the value of our brands. Damage to our reputation and loss of brand equity may reduce demand for our products and services and thus have an adverse effect on our future financial results, as well as require additional resources to rebuild our reputation and restore the value of the brands.
Our acquisition and divestiture activities may disrupt our ongoing business, may involve increased expenses and may present risks not contemplated at the time of the transactions.
We have acquired and may continue to acquire companies, products and technologies that complement our strategic direction, both in and outside the United States. Acquisitions involve significant risks and uncertainties, including:
|
•
|
inability to successfully integrate the acquired technology, data assets and operations into our business and maintain uniform standards, controls, policies, and procedures;
|
|
•
|
inability to realize synergies expected to result from an acquisition;
|
|
•
|
disruption of our ongoing business and distraction of management;
|
|
•
|
challenges retaining the key employees, customers, resellers and other business partners of the acquired operation;
|
|
•
|
the internal control environment of an acquired entity may not be consistent with our standards or with regulatory requirements, and may require significant time and resources to align or rectify;
|
|
•
|
unidentified issues not discovered in our due diligence process, including product or service quality issues, intellectual property issues and legal contingencies;
|
|
•
|
failure to successfully further develop an acquired business or technology and any resulting impairment of amounts currently capitalized as intangible assets;
|
|
•
|
in the case of foreign acquisitions and investments, the impact of particular economic, tax, currency, political, legal and regulatory risks associated with specific countries.
|
We have divested and may in the future divest certain assets or businesses that no longer fit with our strategic direction or growth targets. Divestitures involve significant risks and uncertainties, including:
|
•
|
inability to find potential buyers on favorable terms;
|
|
•
|
failure to effectively transfer liabilities, contracts, facilities and employees to buyers;
|
|
•
|
requirements that we retain or indemnify buyers against certain liabilities and obligations;
|
|
•
|
the possibility that we will become subject to third-party claims arising out of such divestiture;
|
|
•
|
challenges in identifying and separating the intellectual properties and data to be divested from the intellectual properties and data that we wish to retain;
|
|
•
|
inability to reduce fixed costs previously associated with the divested assets or business;
|
|
•
|
challenges in collecting the proceeds from any divestiture;
|
|
•
|
disruption of our ongoing business and distraction of management;
|
|
•
|
loss of key employees who leave the Company as a result of a divestiture;
|
|
•
|
if customers or partners of the divested business do not receive the same level of service from the new owners, our other businesses may be adversely affected, to the extent that these customers or partners also purchase other products offered by us or otherwise conduct business with our retained business.
|
Because acquisitions and divestitures are inherently risky, our transactions may not be successful and may, in some cases, harm our operating results or financial condition. Although we typically fund our acquisitions through cash available from operations, if we were to use debt to fund acquisitions or for other purposes, our interest expense and leverage would increase significantly, and if we were to issue equity securities as consideration in an acquisition, current shareholders’ percentage ownership and earnings per share would be diluted.
OPERATIONAL RISKS
Operational risks arise from internal and external events relating to systems, processes and people. Risks that affect the operation of our businesses include the following: security breaches; privacy and cybersecurity concerns relating to online
|
Intuit Q1 Fiscal 2018 Form 10-Q
|
36
|
||
offerings; fraudulent activities by third parties; relationships with third parties; competition for and retention of key talent; issues with our product launches; problems with our information technology infrastructure; and risks associated with operating internationally.
A security breach of us or our vendors resulting in third-party access to our sensitive customer and employee information and data, or other sensitive, nonpublic business information, could materially disrupt our businesses, result in the disclosure of confidential information, significantly damage our reputation, subject us to costly litigation and cause material losses.
We host, collect, use and retain large amounts of sensitive and personal customer and employee information and data, including credit card information, tax return information, bank account numbers and passwords, personal and business financial data and transactions, social security numbers, healthcare information and payroll information, as well as confidential, nonpublic business information. We use commercially available security technologies to protect this information and data, and we also use security and business controls to limit access to and use of such sensitive information and data. Although we expend significant resources to create security protections that shield our, and our customers', data against potential theft and security breaches, such measures cannot provide absolute security. We have experienced instances in the past where criminals, using stolen identity information obtained outside of our systems, have gained unauthorized and illegal access to our customers’ data. As the accessibility of stolen identity information increases, we may experience additional instances of unauthorized and illegal access to our systems using our customers’ stolen identity information in the future. Further, as we move to an ecosystem where customers have one identity across multiple products, a security breach may give access to increased amounts of customer data. In addition, third parties may fraudulently induce employees, customers, or users to disclose sensitive information in order to gain access to our systems, which host our, and our customers’, sensitive data. The security measures that we implement may not be able to prevent access to our systems from unauthorized users who have fraudulently obtained our customers’ personal information. In addition, because the techniques used to obtain unauthorized access change frequently, becoming more sophisticated and are often not able to be detected until after a successful attack, we may be unable to anticipate these techniques or implement adequate preventive measures.
Our technologies, systems, and networks and our customers’ devices have been subject to, and are likely to continue to be the target of, cyber-attacks, computer viruses, worms, phishing attacks, malicious software programs and other information security breaches that could result in the unauthorized release, gathering, monitoring, misuse, loss or destruction of our customers’ or employees’ sensitive and personal information and data or Intuit's sensitive business data. These attacks could also disrupt our or our customers’ or other third parties’ business operations. These types of attacks can be made by individuals, groups of hackers, and sophisticated organizations including state-sponsored organizations or nation-states themselves. Customers that fail to update their systems, continue to run software that we no longer support or that fail to install security patches on a timely basis make it more difficult for us to detect and prevent these kinds of attacks. Although this is an industry-wide problem that affects software across platforms, it is increasingly affecting our offerings because cyber-criminals tend to focus their efforts on well-known offerings that are popular among customers and hold sensitive information and we expect them to continue to do so. If these cyber-criminals are able to circumvent our security measures, exploit vulnerabilities in our customers’ devices or customers’ behavior, or if we are unable to detect an intrusion into our systems and contain such intrusion in a reasonable amount of time, our customers’ sensitive and personal information and data may be compromised.
We also rely on certain third-party partners and vendors that have access to customer data to help deliver customer benefits, or host certain of our and our customers' sensitive and personal information and data. In addition, we share sensitive, nonpublic business information (including, for example, materials relating to financial, business and legal strategies) with other vendors in the ordinary course of business. While we conduct background checks of our employees and these other individuals and limit access to systems and data, it is possible that one or more of these individuals may circumvent these controls, resulting in accidental or intentional disclosure or misuse of our customers’ or employees’ data. In addition, we rely on third-party vendors to host certain of our sensitive and personal information and data. While we conduct due diligence on these third-party partners with respect to their security and business controls, we may not have the ability to effectively monitor or oversee the implementation of these controls measures, and, in any event, individuals or third parties may be able to circumvent these security and business controls and/or exploit vulnerabilities that may exist in these controls, resulting in the disclosure or misuse of sensitive business and personal customer or employee information and data.
A major breach of our security measures or those of our third party vendors may have serious negative consequences for our businesses, including disclosure of sensitive customer or employee data, or confidential or competitively sensitive information regarding our business, including intellectual property and other proprietary data; possible litigation, fines, penalties and damages; material harm to our reputation and brands; further regulation and oversight by federal or state agencies; and loss of our ability to provide financial transaction services or accept and process customer credit card orders or tax returns.
Privacy and cybersecurity concerns relating to online offerings, including our offerings specifically, as well as the external environment generally, and security breaches of third-party offerings, could make our products more vulnerable to fraudulent activity, damage our reputation and deter current and potential customers from adopting our products and services.
From time to time, we detect, or receive notices from customers or public or private agencies that they have detected, actual or perceived vulnerabilities in our servers, our software or third-party software components that are distributed with our
|
Intuit Q1 Fiscal 2018 Form 10-Q
|
37
|
||
products or fraudulent activity by unauthorized persons utilizing our products with stolen customer identity information. The existence of such vulnerabilities or fraudulent activity, even if they do not result in a security breach, may undermine customer confidence as well as the confidence of government agencies that regulate our offerings. As we further transition our businesses to online and connected services, continue to collect more personal and sensitive information, and operate in more countries, the risk that perceived vulnerabilities of our systems could seriously harm our business by tarnishing our reputation and brand and/or limiting the adoption of our products and services is likely to increase.
In addition, the continued occurrence of cyber-attacks and data breaches on governments, businesses and consumers in general, indicates that we operate in an external environment where cyber-attacks and data breaches are becoming increasingly common. If the global cybersecurity environment worsens, and there are increased instances of security breaches of third-party offerings where consumers’ data and sensitive information is compromised, consumers may be less willing to use online offerings, particularly offerings like ours where customers often share sensitive financial data. In addition, the increased availability of data obtained as a result of breaches of third-party offerings could make our own products more vulnerable to fraudulent activity. This could damage our reputation and deter current and potential customers from adopting our products and services or lead customers to cease using online and connected software products to transact financial business altogether.
If we are unable to effectively combat the increasing amount and sophistication of fraudulent activities by third parties using our offerings, we may suffer losses, which may be substantial, and lose the confidence of our customers and government agencies and our revenues and earnings may be harmed.
The online tax preparation, payroll administration and online payments industries have been experiencing an increasing amount of fraudulent activities by third parties, and those fraudulent activities are becoming increasingly sophisticated. Although we do not believe that any of this activity is uniquely targeted at our products or business, this type of fraudulent activity may adversely impact our tax, payroll, and payments businesses. In addition to any losses that may result from such fraud, which may be substantial, a loss of confidence by our customers or by governmental agencies in our ability to prevent fraudulent activity that is perpetrated through our offerings may seriously harm our business and damage our brand. If we cannot adequately combat such fraudulent activity that is perpetrated through our tax offerings, governmental authorities may refuse to allow us to continue to offer such services, which could include federal or state tax authorities refusing to allow us to process our customers’ tax returns electronically, resulting in a significant adverse impact on our earnings and revenue. As fraudulent activities become more pervasive and increasingly sophisticated, and fraud detection and prevention measures must become correspondingly more complex to combat them across the various industries in which we operate, we may implement risk control mechanisms that could make it more difficult for legitimate customers to obtain and use our products, which could result in lost revenue and negatively impact our earnings.
If we fail to process transactions effectively or fail to adequately protect against disputed or potential fraudulent activities, our business may be harmed.
Our operations process a significant volume and dollar value of transactions on a daily basis, especially in our payroll and payments businesses. Despite our efforts to ensure that effective processing systems and controls are in place to handle transactions appropriately, it is possible that we may make errors or that funds may be misappropriated due to fraud. The systems supporting our business are comprised of multiple technology platforms that are difficult to scale. If we are unable to effectively manage our systems and processes, or if there is an error in our products, we may be unable to process customer data in an accurate, reliable and timely manner, which may harm our reputation, the willingness of customers to use our products, and our financial results. In our payments processing service business, if merchants for whom we process payment transactions are unable to pay refunds due to their customers in connection with disputed or fraudulent merchant transactions, we may be required to pay those amounts and our payments may exceed the amount of the customer reserves we have established to make such payments.
Business interruption or failure of our information technology and communication systems may impair the availability of our products and services, which may damage our reputation and harm our future financial results.
Our reputation and ability to attract, retain and serve our customers is dependent upon the reliable performance of our products and our underlying technical infrastructure. As we continue to transition our business to more connected services, we become more dependent on the continuing operation and availability of our information technology and communication systems and those of our external service providers, including, for example, third-party Internet-based or “cloud” computing services. We do not have redundancy for all of our systems, many of our critical applications reside in only one of our data centers, and our disaster recovery planning may not account for all eventualities. In the event of significant system disruption we may experience loss of data or processing capabilities, which may cause us to lose customers and may materially harm our reputation and our operating results. In addition, we are in the process of updating our customer facing applications and the supporting information technology infrastructure to meet our customers’ expectations for continuous service availability. Any difficulties in upgrading these applications or infrastructure or failure of our systems or those of our third-party service providers may result in interruptions in our service, which may reduce our revenues and profits, cause us to lose customers and damage our reputation. Any prolonged interruptions at any time may result in lost customers, additional refunds of customer
|
Intuit Q1 Fiscal 2018 Form 10-Q
|
38
|
||
charges, negative publicity and increased operating costs, any of which may significantly harm our business, financial condition and results of operations.
Our tax businesses must effectively handle extremely heavy customer demand during critical peak periods from January until April of each year. We face significant risks in maintaining adequate service levels during these peak periods where we derive a substantial portion of our overall revenue from the tax businesses. Any interruptions in our online tax preparation or electronic filing service at any time during the tax season, particularly during a peak period, could result in significantly decreased revenue, lost customers, additional refunds of customer charges, negative publicity and increased operating costs, any of which could significantly harm our business, financial condition and results of operations.
We are in the process of migrating our applications and infrastructure to new data centers and to third-party hosted environments. If we do not execute the transition to these new environments in an effective manner, we may experience unplanned service disruptions or unforeseen increases in costs which may harm our operating results and our business.
We rely on internal systems and external systems maintained by manufacturers, distributors and other service providers to take and fulfill customer orders, handle customer service requests and host certain online activities. Any interruption or failure of our internal or external systems may prevent us or our service providers from accepting and fulfilling customer orders or cause company and customer data to be unintentionally disclosed. Our continuing efforts to upgrade and expand our network security and other information systems as well as our high-availability capabilities may be costly, and problems with the design or implementation of system enhancements may harm our business and our results of operations.
Our business operations, data centers, information technology and communications systems are vulnerable to damage or interruption from natural disasters, human error, malicious attacks, fire, power loss, telecommunications failures, computer viruses, computer denial of service attacks, terrorist attacks and other events beyond our control. In addition, our corporate headquarters and other critical business operations are located near major seismic faults. In the event of a major natural or man-made disaster, our insurance coverage may not completely compensate us for our losses and our future financial results may be materially harmed.
If we are unable to develop, manage and maintain critical third-party business relationships, our business may be adversely affected.
Our growth is increasingly dependent on the strength of our business relationships and our ability to continue to develop, manage and maintain new and existing relationships. We rely on various third-party partners, including software and service providers, suppliers, vendors, manufacturers, distributors, accountants, contractors, financial institutions, core processors, licensing partners and development partners, among others, in many areas of our business in order to deliver our offerings and operate our business. We also rely on third parties to support the operation of our business by maintaining our physical facilities, equipment, power systems and infrastructure. In certain instances, these third-party relationships are sole source or limited source relationships and can be difficult to replace or substitute depending on the level of integration of the third party’s products or services into, or with, our offerings and/or the general availability of such third party’s products and services. In addition, there may be few or no alternative third-party providers or vendors in the market. Further, there can be no assurance that we will be able to adequately retain third-party contractors engaged to help us operate our business. The failure of third parties to provide acceptable and high quality products, services and technologies or to update their products, services and technologies may result in a disruption to our business operations and our customers, which may reduce our revenues and profits, cause us to lose customers and damage our reputation. Alternative arrangements and services may not be available to us on commercially reasonable terms or we may experience business interruptions upon a transition to an alternative partner.
Although we have strict standards for our suppliers and business partners to comply with the law and company policies regarding workplace and employment practices, data use and security, environmental compliance, intellectual property licensing and other applicable regulatory and compliance requirements, we cannot control their day-to-day practices. If any of them violate laws or implements practices regarded as unethical, we could experience supply chain disruptions, canceled orders, terminations of or damage to key relationships, and damage to our reputation.
In particular, we have relationships with banks, credit unions and other financial institutions that support certain critical services we offer to our customers. If macroeconomic conditions or other factors cause any of these institutions to fail, consolidate, stop providing certain services or institute cost-cutting efforts, our business and financial results may suffer and we may be unable to offer those services to our customers.
We have also started to increasingly utilize the distribution platforms of third parties like Apple’s App Store and Google’s Play Store for the distribution of certain of our product offerings. Although we benefit from the strong brand recognition and large user base of these distribution platforms to attract new customers, the platform owners have wide discretion to change the pricing structure, terms of service and other policies with respect to us and other developers. Any adverse changes by these third parties could adversely affect our financial results.
|
Intuit Q1 Fiscal 2018 Form 10-Q
|
39
|
||
Because competition for our key employees is intense, we may not be able to attract, retain and develop the highly skilled employees we need to support our planned growth.
Much of our future success depends on the continued service and availability of skilled personnel, including members of our executive team, and those in technical, marketing and staff positions. Experienced personnel in the software, mobile technologies, data science, data security, and software as a service industries are in high demand and competition for their talents is intense, especially in California and India, where the majority of our employees are located. Also, as we strive to continue to adapt to technological change and introduce new and enhanced products and business models, we must be able to secure, maintain and develop the right quality and quantity of engaged and committed talent. The incentives we have available to attract, retain, and motivate employees provided by our equity awards may become less effective, and if we were to issue significant equity to attract additional employees, the ownership of our existing stockholders would be diluted. Although we strive to be an employer of choice, we may not be able to continue to successfully attract, retain and develop key personnel, which may cause our business to suffer.
The nature of our products and services necessitates timely product launches, and if we experience significant product accuracy or quality problems or delays, it may harm our revenue, earnings and reputation.
All of our tax products and many of our non-tax products have rigid development timetables that increase the risk of errors in our products and the risk of launch delays. Our tax preparation software product development cycle is particularly challenging due to the need to incorporate unpredictable and potentially late tax law and tax form changes each year and because our customers expect high levels of accuracy and a timely launch of these products to prepare and file their taxes by the tax filing deadline. Due to the complexity of our products and the condensed development cycles under which we operate, our products may contain errors that could unexpectedly interfere with the operation of the software or result in incorrect calculations. The complexity of the tax laws on which our products are based may also make it difficult for us to consistently deliver offerings that contain the features, functionality and level of accuracy that our customers expect. When we encounter problems we may be required to modify our code, work with state tax administrators to communicate with affected customers, assist customers with amendments, distribute patches to customers who have already purchased the product and recall or repackage existing product inventory in our distribution channels. If we encounter development challenges or discover errors in our products either late in our development cycle or after release it may cause us to delay our product launch date or suspend product availability until such issues can be fixed. Any major defects, launch delays or product suspensions may lead to loss of customers and revenue, negative publicity, customer and employee dissatisfaction, reduced retailer shelf space and promotions, and increased operating expenses, such as inventory replacement costs, legal fees or other payments, including those resulting from our accuracy guarantee in our tax preparation products. For example, an error in our tax products could cause a compliance error for taxpayers, including the over or underpayment of their federal or state tax liability. While our accuracy guarantee commits us to reimburse penalties and interest paid by customers due solely to calculation errors in our tax preparation products, such errors may result in additional burdens on third parties that we may need to address or that may cause us to suspend the availability of our products until such errors are addressed. This could also affect our reputation, the willingness of customers to use our products, and our financial results.
We regularly invest resources to update and improve our internal information technology systems and software platforms. Should our investments not succeed, or if delays or other issues with new or existing internal technology systems and software platforms disrupt our operations, our business could be harmed.
We rely on our network and data center infrastructure and internal technology systems for many of our development, marketing, operational, support, sales, accounting and financial reporting activities. We are continually investing resources to update and improve these systems and environments in order to meet existing, as well as the growing and changing requirements of our business and customers. If we experience prolonged delays or unforeseen difficulties in updating and upgrading our systems and architecture, we may experience outages and may not be able to deliver certain offerings and develop new offerings and enhancements that we need to remain competitive. Such improvements and upgrades are often complex, costly and time consuming. In addition such improvements can be challenging to integrate with our existing technology systems, or may uncover problems with our existing technology systems. Unsuccessful implementation of hardware or software updates and improvements could result in outages, disruption in our business operations, loss of revenue or damage to our reputation.
Our international operations are subject to increased risks which may harm our business, operating results, and financial condition.
In addition to uncertainty about our ability to generate revenues from our foreign operations and expand into international markets, there are risks inherent in doing business internationally, including:
|
•
|
different or more restrictive privacy, data protection, data localization, and other laws that could require us to make changes to our products, services and operations, such as mandating that certain types of data collected in a particular country be stored and/or processed within that country;
|
|
•
|
difficulties in developing, staffing, and simultaneously managing a large number of varying foreign operations as a result of distance, language, and cultural differences;
|
|
Intuit Q1 Fiscal 2018 Form 10-Q
|
40
|
||
|
•
|
stringent local labor laws and regulations;
|
|
•
|
credit risk and higher levels of payment fraud;
|
|
•
|
profit repatriation restrictions, and foreign currency exchange restrictions;
|
|
•
|
geopolitical events, including natural disasters, acts of war and terrorism;
|
|
•
|
import or export regulations;
|
|
•
|
compliance with U.S. laws such as the Foreign Corrupt Practices Act, and local laws prohibiting corrupt payments to government officials;
|
|
•
|
antitrust and competition regulations;
|
|
•
|
potentially adverse tax developments;
|
|
•
|
economic uncertainties relating to European sovereign and other debt;
|
|
•
|
trade barriers and changes in trade regulations;
|
|
•
|
political or social unrest, economic instability, repression, or human rights issues; and
|
|
•
|
risks related to other government regulation or required compliance with local laws.
|
Violations of the rapidly evolving and complex foreign and U.S. laws and regulations that apply to our international operations may result in fines, criminal actions or sanctions against us, our officers or our employees, prohibitions on the conduct of our business and damage to our reputation. Although we have implemented policies and procedures designed to promote compliance with these laws, there can be no assurance that our employees, contractors or agents will not violate our policies. These risks inherent in our international operations and expansion increase our costs of doing business internationally and may result in harm to our business, operating results, and financial condition.
LEGAL AND COMPLIANCE RISKS
Legal and compliance risks arise from change in the government and regulatory environment, potential litigation, regulatory inquiries and intellectual property infringement claims. Government and regulatory risk include the following: increased government regulations; ongoing litigation and regulatory inquiries; and intellectual property infringement.
Increased government regulation of our businesses, or changes to existing regulations, may harm our operating results.
The Company is subject to federal, state and local laws and regulations that affect the Company’s activities, including, without limitation, areas of labor, advertising, tax, financial services, data privacy and security requirements, digital content, consumer protection, real estate, billing, e-commerce, promotions, quality of services, intellectual property ownership and infringement, import and export requirements, anti-corruption, foreign exchange controls and cash repatriation restrictions, anti-competition, environmental, health and safety.
There have been significant new regulations and heightened focus by the government on many of these areas, as well as in areas such as insurance and healthcare (including, for example, the Affordable Care Act). A
s we expand our products and services and revise our business models, both domestically and internationally, we may become subject to additional government regulation or increased regulatory scrutiny. Further, regulators (both in the U.S. and in other jurisdictions in which we operate) may adopt new laws or regulations, change existing regulations, or their interpretation of existing laws or regulations may differ from ours .
As our business continues to expand to countries outside the United States that have more strict data protection laws, our compliance requirements and costs may increase. Recent legal developments in the European Union have created compliance uncertainty and increased complexity regarding certain transfers of information from Europe to the U.S. The European Commission has approved a data protection regulation, known as the GDPR, which has been finalized and is due to come into force in May 2018. The GDPR will require certain operational changes to be made by companies that receive or process personal data of residents of the EU and will include significant penalties for non-compliance. In addition, other governmental authorities around the world are considering similar types of legislative and regulatory proposals concerning data protection. Due to the uncertain international environment, we could face additional compliance obligations that could cause us to incur costs or require us to change our business practices in a manner adverse to our business. Further, these regulatory requirements could also
impose significant limitations, require changes to our business, require notification to customers or employees of a security breach, restrict our use or storage of personal information, or cause changes in customer purchasing behavior which may make our business more costly, less efficient or impossible to conduct, and may require us to modify our current or future products or services, which may make customers less likely to purchase our products or harm our future financial results. We have incurred – and may continue to incur – significant expenses to comply with mandatory privacy and security standards and protocols imposed by law, regulation, industry standards or contractual obligations.
The tax preparation industry continues to receive heightened attention from federal and state governments. New legislation, regulation, public policy considerations, changes in the cybersecurity environment, litigation by the government or private entities, changes to or new interpretations of existing laws may result in greater oversight of the tax preparation industry, restrict the types of products and services that we can offer or the prices we can charge, or otherwise cause us to change the
|
Intuit Q1 Fiscal 2018 Form 10-Q
|
41
|
||
way we operate our tax businesses or offer our tax products and services. We may not be able to respond quickly to such regulatory, legislative and other developments, and these changes may in turn increase our cost of doing business and limit our revenue opportunities. In addition, if our practices are not consistent with new interpretations of existing laws, we may become subject to lawsuits, penalties, and other liabilities that did not previously apply. We are also required to comply with a variety of state revenue agency standards in order to successfully operate our tax preparation and electronic filing services. Changes in state-imposed requirements by one or more of the states, including the required use of specific technologies or technology standards, may significantly increase the costs of providing those services to our customers and may prevent us from delivering a quality product to our customers in a timely manner.
We are also subject to certain laws and regulations in the U.S. and other jurisdictions relating to electronic funds transfer, money transmission and other regulated activities. In the event laws governing regulated activities change or expand, we may be subject to additional compliance costs. As we increase our business activities into regulated areas, such as lending, we may be subject to increased regulations and compliance requirements.
We are frequently a party to litigation and regulatory inquiries which could result in an unfavorable outcome and have an adverse effect on our business, financial condition, results of operation and cash flows.
We are subject to various legal proceedings (including class action lawsuits), claims and regulatory inquiries that have arisen out of the ordinary conduct of our business and are not yet resolved and additional claims and inquiries may arise in the future. The number and significance of these claims and inquiries have increased as our businesses have evolved. Any proceedings, claims or inquiries initiated by or against us, whether successful or not, may be time consuming; result in costly litigation, damage awards, consent decrees, injunctive relief or increased costs of business; require us to change our business practices or products; require significant amounts of management time; result in diversion of significant operations resources; or otherwise harm our business and future financial results. For further information about specific litigation, see Item 1, “Legal Proceedings”.
Third parties claiming that we infringe their proprietary rights may cause us to incur significant legal expenses and prevent us from selling our products.
We may become increasingly subject to infringement claims, including patent, copyright, trade secret, and trademark infringement claims. Litigation may be necessary to determine the validity and scope of the intellectual property rights of others. We have received a number of allegations of intellectual property infringement claims in the past and expect to receive more claims in the future based on allegations that our offerings infringe upon the intellectual property held by third parties. Some of these claims are the subject of pending litigation against us and against some of our customers. These claims may involve patent holding companies or other adverse intellectual property owners who have no relevant product revenues of their own, and against whom our own intellectual property may provide little or no deterrence. The ultimate outcome of any allegation is uncertain and, regardless of outcome, any such claim, with or without merit, may be time consuming to defend, result in costly litigation, divert management’s time and attention from our business, require us to stop selling, delay shipping or redesign our products, or require us to pay monetary damages for royalty or licensing fees, or to satisfy indemnification obligations that we have with some of our customers. Our failure to obtain necessary license or other rights, or litigation arising out of intellectual property claims may harm our business.
We are subject to risks associated with information disseminated through our services.
The laws relating to the liability of online services companies for information such as online content disseminated through their services are subject to frequent challenges. In spite of settled law in the U.S., claims are made against online services companies by parties who disagree with the content. Where our online content is accessed on the internet outside of the U.S., challenges may be brought under foreign laws which do not provide the same protections for online services companies as in the U.S. These challenges in either U.S. or foreign jurisdictions may rise to legal claims alleging defamation, libel, invasion of privacy, negligence, copyright or trademark infringement, or other theories based on the nature and content of the materials disseminated through the services. Certain of our services include content generated by users of our online services. Although this content is not generated by us, claims of defamation or other injury may be made against us for that content. Any costs incurred as a result of this potential liability may harm our business.
FINANCIAL RISKS
Financial risks relate to our ability to meet financial obligations and mitigate exposure to financial impacts to our businesses or our offerings. Financial risks arise from the following: seasonality; excessive product returns; unanticipated changes in income tax rates; adverse global macro-economic conditions; fluctuations in our net income; indebtedness; and the fluctuation of our stock price.
Our tax business is highly seasonal and our quarterly results could fluctuate significantly.
Our tax offerings have significant seasonal patterns. Revenue from income tax preparation products and services is heavily concentrated during November through April. This seasonality has caused significant fluctuations in our quarterly financial results. Our financial results may also fluctuate from quarter to quarter and year to year due to a variety of factors, including factors that may affect the timing of revenue recognition. These include changes to our offerings that result in the inclusion or
|
Intuit Q1 Fiscal 2018 Form 10-Q
|
42
|
||
exclusion of ongoing services; changes in product pricing strategies or product sales mix; the timing of the availability of federal and state tax forms from taxing agencies and the ability of those agencies to receive electronic tax return submissions; changes in customer behavior; and the timing of our discontinuation of support for older product offerings. Other factors that may affect our quarterly or annual financial results include the timing of acquisitions, divestitures, and goodwill and acquired intangible asset impairment charges. Any fluctuations in our operating results may adversely affect our stock price.
If actual product returns exceed returns reserves our future financial results may be harmed.
We ship more desktop software products to our distributors and retailers than we expect them to sell, in order to reduce the risk that distributors or retailers may run out of products. This is particularly true for our tax products, which have a short selling season and for which returns occur primarily in our fiscal third and fourth quarters. Like many software companies that sell their products through distributors and retailers, we have historically accepted significant product returns. We establish reserves against revenue for product returns in our financial statements based on estimated returns and we closely monitor product sales and inventory in the retail channel in an effort to maintain adequate reserves. In the past, returns have not differed significantly from these reserves. However, if we experience actual returns that significantly exceed reserves, it may result in lower net revenue.
Unanticipated changes in our income tax rates may affect our future financial results.
Our future effective income tax rates may be favorably or unfavorably affected by unanticipated changes in the valuation of our deferred tax assets and liabilities, by changes in our stock price, or by changes in tax laws or their interpretation. In addition, we are subject to the continuous examination of our income tax returns by the Internal Revenue Service and other tax authorities. We regularly assess the likelihood of adverse outcomes resulting from these examinations to determine the adequacy of our provision for income taxes. These continuous examinations may result in unforeseen tax-related liabilities, which may harm our future financial results.
Adverse global economic conditions could harm our business and financial condition.
Adverse macroeconomic developments could negatively affect our business and financial condition. Adverse global economic events have caused, and could, in the future, cause disruptions and volatility in global financial markets and increased rates of default and bankruptcy, and could impact consumer and small business spending. While we have historically performed well in economic downturns, there is no guarantee that we would continue to perform well in future adverse macroeconomic conditions. In particular, because the majority of our revenue is derived from sales within the U.S., economic conditions in the U.S. have an even greater impact on us than companies with a more diverse international presence. Challenging economic times could cause potential new customers not to purchase or to delay purchasing of our products and services, and could cause our existing customers to discontinue purchasing or delay upgrades of our existing products and services, thereby negatively impacting our revenues and future financial results. Decreased consumer spending levels could also reduce credit and debit card transaction processing volumes causing reductions in our payments revenue. Poor economic conditions and high unemployment have caused, and could in the future cause, a significant decrease in the number of tax returns filed, which may have a significant effect on the number of tax returns we prepare and file. In addition, weakness in the end-user consumer and small business markets could negatively affect the cash flow of our distributors and resellers who could, in turn, delay paying their obligations to us, which could increase our credit risk exposure and cause delays in our recognition of revenue or future sales to these customers. Any of these events could harm our business and our future financial results.
Amortization of acquired intangible assets and impairment charges may cause significant fluctuation in our net income.
Our acquisitions have resulted in significant expenses, including amortization and impairment of acquired technology and other acquired intangible assets, and impairment of goodwill. Total costs and expenses in these categories were $14 million in fiscal 2017; $34 million in fiscal 2016; and $339 million in fiscal 2015, of which $149 million was classified as discontinued operations. Although under current accounting rules goodwill is not amortized, we may incur impairment charges related to the goodwill already recorded and to goodwill arising out of future acquisitions. We test the impairment of goodwill annually in our fourth fiscal quarter or more frequently if indicators of impairment arise. The timing of the formal annual test may result in charges to our statement of operations in our fourth fiscal quarter that may not have been reasonably foreseen in prior periods. The total costs and expenses for fiscal 2015 included goodwill and intangible asset impairment charges of $297 million, of which $149 million was classified as discontinued operations. At
October 31, 2017
, we had
$1.3 billion
in goodwill and
$18 million
in net acquired intangible assets on our balance sheet, both of which may be subject to impairment charges in the future. New acquisitions, and any impairment of the value of acquired intangible assets, may have a significant negative impact on our future financial results.
We have $475 million in debt outstanding under the term loan and have drawn
$400 million
on our unsecured revolving credit facility and may incur other debt in the future, which may adversely affect our financial condition and future financial results.
On February 1, 2016, we entered into a master credit agreement with certain institutional lenders for a new five-year credit facility in an aggregate principal amount of $1.5 billion. The master credit agreement includes a $500 million unsecured term
|
Intuit Q1 Fiscal 2018 Form 10-Q
|
43
|
||
loan and a $1 billion unsecured revolving credit facility that will expire on February 1, 2021. As of
October 31, 2017
,
$475 million
was outstanding on the term loan and
$400 million
was outstanding under the revolving credit facility. We may use the proceeds of any advances against the credit facility for general corporate purposes, including future acquisitions and share repurchases.
This debt may adversely affect our financial condition and future financial results by, among other things:
|
•
|
increasing our vulnerability to downturns in our business, to competitive pressures and to adverse economic and industry conditions;
|
|
•
|
requiring the dedication of a portion of our expected cash from operations to service our indebtedness, thereby reducing the amount of expected cash flow available for other purposes, including capital expenditures and acquisitions; and
|
|
•
|
limiting our flexibility in planning for, or reacting to, changes in our businesses and our industries.
|
Our current unsecured revolving credit facility imposes restrictions on us, including restrictions on our ability to create liens on our assets and the ability of our subsidiaries to incur indebtedness, and require us to maintain compliance with specified financial ratios. Our ability to comply with these ratios may be affected by events beyond our control. In addition, our short- and long-term debt includes covenants that may adversely affect our ability to incur certain liens or engage in certain types of sale and leaseback transactions. If we breach any of the covenants under our short- and long-term debt or our unsecured revolving credit facility and do not obtain a waiver from the lenders, then, subject to applicable cure periods, any outstanding indebtedness may be declared immediately due and payable.
In addition, changes by any rating agency to our credit rating may negatively impact the value and liquidity of both our debt and equity securities. If our credit ratings are downgraded or other negative action is taken, the interest rate payable by us under our unsecured revolving credit facility may increase. In addition, any downgrades in our credit ratings may affect our ability to obtain additional financing in the future and may affect the terms of any such financing.
Our stock price may be volatile and your investment could lose value.
Our stock price is subject to changes in recommendations or earnings estimates by financial analysts, changes in investors’ or analysts’ valuation measures for our stock, our credit ratings and market trends unrelated to our performance. Furthermore, speculation in the press or investment community about our strategic position, financial condition, results of operations, business or security of our products, can cause changes in our stock price. These factors, as well as general economic and political conditions and the timing of announcements in the public market regarding new products, product enhancements or technological advances by our competitors or us, and any announcements by us of acquisitions, major transactions, or management changes may adversely affect our stock price. Further, any changes in the amounts or frequency of share repurchases or dividends may also adversely affect our stock price. A significant drop in our stock price could expose us to the risk of securities class actions lawsuits, which may result in substantial costs and divert management’s attention and resources, which may adversely affect our business.
|
Intuit Q1 Fiscal 2018 Form 10-Q
|
44
|
||
|
|
Purchases of Equity Securities By The Issuer And Affiliated Purchasers
Stock repurchase activity during the three months ended
October 31, 2017
was as follows:
|
Period
|
Total Number
of Shares
Purchased
|
Average
Price Paid
per Share
|
Total Number
of Shares Purchased as Part of Publicly Announced
Plans
|
Approximate
Dollar Value of Shares That May Yet Be Purchased Under
the Plans
|
||||||||||
|
August 1, 2017 through August 31, 2017
|
990,000
|
|
$
|
136.68
|
|
990,000
|
|
$
|
1,385,762,369
|
|
||||
|
September 1, 2017 through September 30, 2017
|
129,000
|
|
$
|
142.84
|
|
129,000
|
|
$
|
1,367,336,059
|
|
||||
|
October 1, 2017 through October 31, 2017
|
105,600
|
|
$
|
145.30
|
|
105,600
|
|
$
|
1,351,992,646
|
|
||||
|
Total
|
1,224,600
|
|
$
|
138.07
|
|
1,224,600
|
|
|
||||||
Note
: All of the shares purchased as part of publicly announced plans during the three months ended
October 31, 2017
were purchased under a plan we announced on August 19, 2016 under which we are authorized to repurchase up to $2 billion of our common stock. At
October 31, 2017
, authorization from our Board of Directors to expend up to
$1.4 billion
remained available under that plan.
|
|
See the Exhibit Index immediately following the signature page of this Quarterly Report on Form 10-Q.
|
Intuit Q1 Fiscal 2018 Form 10-Q
|
45
|
||
|
SIGNATURES
|
Pursuant to the requirements of the Securities Exchange Act of 1934, the Registrant has duly caused this report to be signed on its behalf by the undersigned, thereunto duly authorized.
|
|
INTUIT INC.
(Registrant)
|
|
|||
|
Date:
|
November 20, 2017
|
By:
|
/s/ R. NEIL WILLIAMS
|
|
|
|
|
|
R. Neil Williams
|
|
||
|
|
|
Executive Vice President and Chief Financial Officer (Authorized Officer and Principal Financial Officer)
|
|
||
|
Intuit Q1 Fiscal 2018 Form 10-Q
|
46
|
||
|
EXHIBIT INDEX
|
|
Exhibit
Number
|
|
Exhibit Description
|
|
Filed
Herewith
|
|
Incorporated by
Reference
|
|
10.01+
|
X
|
|||||
|
10.02+
|
X
|
|||||
|
10.03+
|
X
|
|||||
|
10.04+
|
X
|
|||||
|
31.01
|
|
|
X
|
|
|
|
|
|
|
|
|
|
|
|
|
31.02
|
|
|
X
|
|
|
|
|
|
|
|
|
|
|
|
|
32.01*
|
|
|
X
|
|
|
|
|
|
|
|
|
|
|
|
|
32.02*
|
|
|
X
|
|
|
|
|
|
|
|
|
|
|
|
|
101.INS
|
|
XBRL Instance Document - the instance document does not appear in the Interactive Data File because its XBRL tags are embedded within the Inline XBRL document
|
|
X
|
|
|
|
|
|
|
|
|
|
|
|
101.SCH
|
|
XBRL Taxonomy Extension Schema
|
|
X
|
|
|
|
|
|
|
|
|
|
|
|
101.CAL
|
|
XBRL Taxonomy Extension Calculation Linkbase
|
|
X
|
|
|
|
|
|
|
|
|
|
|
|
101.LAB
|
|
XBRL Taxonomy Extension Label Linkbase
|
|
X
|
|
|
|
|
|
|
|
|
|
|
|
101.PRE
|
|
XBRL Taxonomy Extension Presentation Linkbase
|
|
X
|
|
|
|
|
|
|
|
|
|
|
|
101.DEF
|
|
XBRL Taxonomy Extension Definition Linkbase
|
|
X
|
|
|
________________________________
|
+
|
Indicates a management contract or compensatory plan or arrangement.
|
|
*
|
This exhibit is intended to be furnished and shall not be deemed “filed” for purposes of the Securities Exchange Act of 1934, as amended.
|
|
Intuit Q1 Fiscal 2018 Form 10-Q
|
47
|
||
TABLE OF CONTENTS
Part I - Financial InformationItem 1 - Financial StatementsItem 2 - Management S Discussion and Analysis Of Financial Condition and Results Of OperationsItem 3 - Quantitative and Qualitative Disclosures About Market RiskItem 4 - Controls and ProceduresPart II - Other InformationItem 1 - Legal ProceedingsItem 1A - Risk FactorsItem 2 - Unregistered Sales Of Equity Securities and Use Of ProceedsItem 6 - Exhibits