INTERNATIONAL PAPER CO /NEW/
10-Ks and 10-Qs
|
|
|
|
|
|
|
|
|
|
|
|
|
|
|
|
|
|
|
|
|
|
|
|
|
|
|
|
|
|
|
|
|
|
|
|
|
|
|
|
|
|
|
|
|
|
|
|
|
|
|
|
|
|
|
|
|
|
|
UNITED STATES
SECURITIES AND EXCHANGE COMMISSION
WASHINGTON, D.C. 20549
_____________________________________________________
FORM 10-K
(Mark One)
|
ý
|
|
ANNUAL REPORT PURSUANT TO SECTION 13 OR 15(d) OF THE SECURITIES EXCHANGE ACT OF 1934 for the fiscal year ended December 31, 2018
|
or
|
¨
|
|
TRANSITION REPORT PURSUANT TO SECTION 13 OR 15(d) OF THE SECURITIES EXCHANGE ACT OF 1934 For the transition period from to
|
Commission File No. 1-3157
INTERNATIONAL PAPER COMPANY
(Exact name of registrant as specified in its charter)
|
New York
|
|
13-0872805
|
|
(State or other jurisdiction of incorporation or organization)
|
|
(I.R.S. Employer Identification No.)
|
6400 Poplar Avenue
Memphis, Tennessee
(Address of principal executive offices)
38197
(Zip Code)
Registrant’s telephone number, including area code: (901) 419-9000
_____________________________________________________
Securities registered pursuant to Section 12(b) of the Act:
|
Title of each class
|
|
Name of each exchange on which registered
|
|
Common Stock, $1 per share par value
|
|
New York Stock Exchange
|
_____________________________________________________
Securities Registered Pursuant to Section 12(g) of the Act: None
Indicate by check mark if the registrant is a well-known seasoned issuer, as defined in Rule 405 of the Securities Act.
Yes
ý
No
¨
Indicate by check mark if the registrant is not required to file reports pursuant to Section 13 or Section 15(d) of the Act.
Yes
¨
No
ý
Indicate by check mark whether the registrant (1) has filed all reports required to be filed by Section 13 or 15(d) of the Securities Exchange Act of 1934 during the preceding 12 months (or for such shorter period that the registrant was required to file such reports), and (2) has been subject to such filing requirements for the past 90 days. Yes
ý
No
¨
Indicate by check mark whether the registrant has submitted electronically every Interactive Data File required to be submitted pursuant to Rule 405 of Regulation S-T (section 232.405 of this chapter) during the preceding 12 months (or for such shorter period that the registrant was required to submit such files). Yes
ý
No
¨
Indicate by check mark if disclosure of delinquent filers pursuant to Item 405 of Regulation S-K (section 229.405 of this chapter) is not contained herein, and will not be contained, to the best of registrant’s knowledge, in definitive proxy or information statements incorporated by reference in Part III of this Form 10-K or any amendment to this Form 10-K.
ý
Indicate by check mark whether the registrant is a large accelerated filer, an accelerated filer, a non-accelerated filer, a smaller reporting company or an emerging growth company. See definitions of “large accelerated filer,” “accelerated filer,” “smaller reporting company,” and "emerging growth company" in Rule 12b-2 of the Exchange Act. (Check one):
|
Large accelerated filer
ý
|
|
Accelerated filer
¨
|
|
Non-accelerated filer
¨
|
|
Smaller reporting company
¨
|
Emerging growth company
¨
|
|
|
|
|
|
||||||
If emerging growth company, indicate by check mark if the registrant has elected not to use the extended transition period for complying with any new or revised financial accounting standards provided pursuant to Section 13 (a) of the Exchange Act.
o
Indicate by check mark whether the registrant is a shell company (as defined in Rule 12b-2 of the Act). Yes
¨
No
ý
The aggregate market value of the Company’s outstanding common stock held by non-affiliates of the registrant, computed by reference to the closing price as reported on the New York Stock Exchange, as of the last business day of the registrant’s most recently completed second fiscal quarter (June 30, 2018) was approximately
$21,249,006,136
.
The number of shares outstanding of the Company’s common stock as of
February 15, 2019
was
400,236,119
.
Documents incorporated by reference:
Portions of the registrant’s proxy statement filed within 120 days of the close of the registrant’s fiscal year in connection with registrant’s
2019
annual meeting of shareholders are incorporated by reference into Part III of this Form 10-K.
1
INTERNATIONAL PAPER COMPANY
INDEX TO ANNUAL REPORT ON FORM 10-K
FOR THE YEAR ENDED
DECEMBER 31, 2018
|
PART I.
|
|
|
|
ITEM 1.
|
||
|
ITEM 1A.
|
||
|
ITEM 1B.
|
||
|
ITEM 2.
|
||
|
ITEM 3.
|
||
|
ITEM 4.
|
||
|
PART II.
|
|
|
|
ITEM 5.
|
||
|
ITEM 6.
|
||
|
ITEM 7.
|
||
INTERNATIONAL PAPER COMPANY
INDEX TO ANNUAL REPORT ON FORM 10-K
FOR THE YEAR ENDED
DECEMBER 31, 2018
|
ITEM 7A.
|
||
|
ITEM 8.
|
||
|
ITEM 9.
|
||
|
ITEM 9A.
|
||
|
ITEM 9B.
|
||
|
PART III.
|
|
|
|
ITEM 10.
|
||
|
ITEM 11.
|
||
|
ITEM 12.
|
||
|
ITEM 13.
|
||
|
ITEM 14.
|
||
|
PART IV.
|
|
|
|
ITEM 15.
|
||
|
APPENDIX I
|
||
|
APPENDIX II
|
||
International Paper Company (the Company or International Paper, which may also be referred to as we or us) is a global producer of renewable fiber-based packaging, pulp and paper products with manufacturing operations in North America, Latin America, Europe, North Africa, India and Russia. We are a New York corporation, incorporated in 1941 as the successor to the New York corporation of the same name organized in 1898. You can learn more about us by visiting our website at www.internationalpaper.com.
In the United States, at
December 31, 2018
, the Company operated
27
pulp, paper and packaging mills,
166
converting and packaging plants,
16
recycling plants and
three
bag facilities. Production facilities at
December 31, 2018
in Canada, Europe, India, North Africa, and Latin America included
16
pulp, paper and packaging mills,
43
converting and packaging plants, and
two
recycling plants. We operate a printing and packaging products distribution business principally through
nine
branches in Asia. At
December 31, 2018
, we owned or managed approximately
329,000
acres of forestland in Brazil and had, through licenses and forest management agreements, harvesting rights on government-owned forestlands in Russia. Substantially all of our businesses have experienced, and are likely to continue to experience, cycles relating to industry capacity and general economic conditions.
For management and financial reporting purposes, our businesses are separated into three segments: Industrial Packaging; Global Cellulose Fibers; and Printing Papers.
A description of these business segments can be found on pages
23
and
24
of
Item 7. Management’s Discussion and Analysis of Financial Condition and Results of Operations
. The Company’s
50%
equity interest in Ilim S.A. (Ilim) is also a separate reportable industry segment.
From 2014 through 2018, International Paper’s capital expenditures approximated
$7.2 billion
, excluding mergers and acquisitions. These expenditures reflect our continuing efforts to use our capital strategically to improve product quality and environmental performance, as well as lower costs and maintain reliability of operations. Capital spending in
2018
was approximately
$1.6 billion
and is expected to be approximately
$1.4 billion
in
2019
. You can find more information about capital expenditures on page
28
of
Item 7. Management’s Discussion and Analysis of Financial Condition and Results of Operations
.
Discussions of acquisitions can be found on page
29
of
Item 7. Management’s Discussion and Analysis of Financial Condition and Results of Operations
.
You can find discussions of restructuring charges and other special items on pages
22
and
23
of
Item 7. Management’s Discussion and Analysis of Financial Condition and Results of Operations
.
Throughout this Annual Report on Form 10-K, we “incorporate by reference” certain information in parts of other documents filed with the Securities and Exchange Commission (SEC). The SEC permits us to disclose important information by referring to it in that manner. Please refer to such information. Our annual reports on Form 10-K, quarterly reports on Form 10-Q and current reports on Form 8-K, along with all other reports and any amendments thereto filed with or furnished to the SEC, are publicly available free of charge on the Investor Relations section of our website at www.internationalpaper.com as soon as reasonably practicable after we electronically file such material with, or furnish it to, the SEC. The information contained on or connected to our website is not incorporated by reference into this Form 10-K and should not be considered part of this or any other report that we filed with or furnished to the SEC.
The pulp, paper and packaging sectors are large and fragmented, and the areas into which the Company sells its principal products are very competitive. Our products compete with similar products produced by other forest products companies. We also compete, in some instances, with companies in other industries and against substitutes for wood-fiber products.
Many factors influence the Company’s competitive position, including price, cost, product quality and services. You can find more information about the impact of these factors on operating profits on pages
17
through
28
of
Item 7. Management’s Discussion and Analysis of Financial Condition and Results of Operations
. You can find information about the Company’s manufacturing capacities on page
A-4
of
Appendix II
.
The Company sells products directly to end users and converters, as well as through agents, resellers and paper distributors.
The Company’s principal products are described on pages
23
and
24
of
Item 7. Management’s Discussion and Analysis of Financial Condition and Results of Operations
.
1
Sales volumes of major products for
2018
,
2017
and
2016
were as follows:
Sales Volumes by Product (a)
|
In thousands of short tons (except as noted)
|
2018
|
2017
|
2016
|
|||
|
Industrial Packaging
|
||||||
|
Corrugated Packaging (b)
|
10,624
|
|
10,413
|
|
10,392
|
|
|
Containerboard
|
3,229
|
|
3,294
|
|
3,091
|
|
|
Recycling
|
2,282
|
|
2,257
|
|
2,450
|
|
|
Saturated Kraft
|
196
|
|
181
|
|
182
|
|
|
Gypsum/Release Kraft
|
227
|
|
229
|
|
200
|
|
|
Bleached Kraft
|
31
|
|
27
|
|
24
|
|
|
EMEA Packaging (b) (c)
|
1,476
|
|
1,518
|
|
1,477
|
|
|
Asian Box (b) (d)
|
—
|
|
—
|
|
208
|
|
|
Brazilian Packaging (c)
|
351
|
|
357
|
|
371
|
|
|
European Coated Paperboard
|
390
|
|
398
|
|
393
|
|
|
Industrial Packaging
|
18,806
|
|
18,674
|
|
18,788
|
|
|
Global Cellulose Fibers
(
in thousands of metric tons)
(e)
|
3,573
|
|
3,708
|
|
1,870
|
|
|
Printing Papers
|
||||||
|
U.S. Uncoated Papers
|
1,886
|
|
1,915
|
|
1,872
|
|
|
European and Russian Uncoated Papers
|
1,440
|
|
1,483
|
|
1,536
|
|
|
Brazilian Uncoated Papers
|
1,125
|
|
1,167
|
|
1,114
|
|
|
Indian Uncoated Papers
|
263
|
|
253
|
|
241
|
|
|
Printing Papers
|
4,714
|
|
4,818
|
|
4,763
|
|
|
(a)
|
Includes third-party and inter-segment sales and excludes sales of equity investees.
|
|
(b)
|
Volumes for corrugated box sales reflect consumed tons sold (CTS). Board sales by these businesses reflect invoiced tons.
|
|
(c)
|
Excludes newsprint sales volumes at the Madrid, Spain mill through Q3 2017.
|
|
(d)
|
Includes sales volumes through the date of sale on June 30, 2016.
|
|
(e)
|
Includes North American, European and Brazilian volumes and internal sales to mills. Includes sales volumes from the pulp business acquired beginning December 1, 2016.
|
The Company operates its primary research and development center in Loveland, Ohio, as well as several other product development facilities, including the Global Cellulose Fibers technology center in Federal Way, Washington.
We direct research and development activities to short-term, long-term and technical assistance needs of customers and operating divisions, and to process, equipment and product innovations. Activities include product development within the operating divisions; studies on innovation and improvement of pulping, bleaching, chemical recovery, paper making, converting and coating processes; packaging design and materials development; mechanical packaging systems, environmentally sensitive printing inks and reduction of environmental discharges; re-use of raw materials in manufacturing processes; recycling of consumer and packaging paper products; energy conservation; applications of computer controls to
manufacturing operations; innovations and improvement of products; and development of various new products. Our development efforts specifically address product safety, as well as the minimization of solid waste. The cost to the Company of its research and development operations was
$30 million
in
2018
,
$28 million
in
2017
, and
$20 million
in
2016
.
We own numerous patents, copyrights, trademarks, trade secrets and other intellectual property rights relating to our products and to the processes for their production. We also license intellectual property rights to and from others where advantageous or necessary. Many of the manufacturing processes are among our trade secrets. Some of our products are covered by U.S. and non-U.S. patents and are sold under well known trademarks. We derive a competitive advantage by protecting our trade secrets, patents, trademarks and other intellectual property rights, and by using them as required to support our businesses.
2
International Paper is subject to extensive federal and state environmental regulation, as well as similar regulations internationally. Our continuing objectives include: (1) controlling emissions and discharges from our facilities into the air, water and groundwater to avoid adverse impacts on the environment, and (2) maintaining compliance with applicable laws and regulations. The Company spent $47 million in 2018 for capital projects to control environmental releases into the air and water, and to assure environmentally sound management and disposal of waste. We expect to spend $70 million in 2019 for environmental capital projects. Capital expenditures for 2020 environmental projects are anticipated to be approximately $70 million. Capital expenditures for 2021 environmental projects are estimated to be $95 million.
The Company has completed capital projects to meet the U.S. Environmental Protection Agency's (EPA) Boiler MACT (maximum achievable control technology) regulations that require owners of specified boilers to meet revised air emissions standards for certain substances. Since 2016, lawsuits challenging all or portions of the Boiler MACT regulations have resulted in the U.S. Court of Appeals for the D.C. Circuit remanding certain portions of the Boiler MACT regulations to the EPA for reconsideration of certain standards in the regulations. We have not identified any additional Boiler MACT capital project expenditures that might result from the outcome of the remands to the EPA.
Amendments lowering National Ambient Air Quality Standards (NAAQS) for sulfur dioxide (SO2), nitrogen dioxide (NO2), fine particulate (PM2.5), and ozone have been finalized by the EPA in recent years but to date have not had a material impact on the Company.
In an effort to mitigate the potential climate change impacts from human activities, various international, national and sub-national (regional, state and local) governmental actions have been or may be undertaken. Presently, these efforts have not materially impacted International Paper, but such efforts may have a material impact on the Company in the future.
International Efforts
A successor program to the 1997 Kyoto Protocol, the Paris Agreement, went into effect in November 2016 and continued international efforts and voluntary commitments toward reducing the emissions of greenhouse gases (GHGs). Consistent with this objective, participating countries aim to balance GHG
emissions generation and removal in the second half of this century or, in effect, achieve net-zero global GHG emissions.
As part of the Paris Agreement, many countries, including the U.S. and EU member states, established non-binding emissions reduction targets. The U.S. non-binding commitment is for GHG emissions to be 7% below 2005 GHG emissions levels by 2020 and 26% to 28% below by 2025. Other countries in which we do business made similar non-binding commitments. On August 4, 2017, the U.S. filed official notice to withdraw from the Paris Agreement. Notwithstanding the notice of withdrawal by the U.S., the Company’s voluntary GHG reductions, which are set out in our annual Global Citizenship report, remain roughly in line with the percentages of the U.S. prior target reductions. It is not clear at this time what, if any, further reductions by the Company might be required by the countries in which we operate. Due to this uncertainty, it is not possible at this time to estimate the potential impacts of these agreements on the Company.
To assist member countries in meeting obligations under the Kyoto Protocol, the EU established and continues to operate an Emissions Trading System (EU ETS). Currently, we have two sites directly subject to regulation under Phase III of the EU ETS, one in Poland and one in France. Other sites that we operate in the EU experience indirect impacts of the EU ETS through purchased power pricing. Neither the direct nor indirect impacts of the EU ETS have been material to the Company, but they could be material to the Company in the future depending on how the Paris Agreement's non-binding commitments or allocation of and market prices for GHG credits under existing rules evolve over the coming years.
U.S. Efforts, including State, Regional and Local Measures
In the U.S., the 1997 Kyoto Protocol was not ratified and Congress has not passed GHG legislation. The EPA manages regulations to: (i) control GHGs from mobile sources by adopting transportation fuel efficiency standards; (ii) control GHG emissions from new Electric Generating Units (EGUs); (iii) require reporting of GHGs from sources of GHGs greater than 25,000 tons per year; (iv) in 2015, require states to develop plans to reduce GHGs from utility EGUs and (v) in 2016 EPA took the first steps in the process of developing emissions standards for existing sources in the oil and gas sector.
A few U.S. states have enacted or are considering legal measures to require the reduction of emissions of GHGs by companies and public utilities, primarily through the development of GHG emission inventories or regional GHG cap-and-trade programs. California has already enacted such a program and similar actions are being
3
considered by Washington. The Company does not have any sites currently subject to California's GHG regulatory plan. There may be indirect impacts from changing input costs (such as electricity) at some of our California converting operations but these have yet to manifest themselves in material impacts. Although we are monitoring proposed programs in other states, it is unclear what impacts, if any, state-level GHG rules will have on the Company’s operations.
Summary
Regulation of GHGs continues to evolve in various countries in which we do business. While it is likely that there will be increased governmental action regarding GHGs and climate change in the future, it is unclear when such actions will occur and at this time it is not reasonably possible to estimate Company costs of compliance with rules that have not yet been adopted or implemented and may not be adopted or implemented in the future. In addition to possible direct impacts, future legislation and regulation could have indirect impacts on International Paper, such as higher prices for transportation, energy and other inputs, as well as more protracted air permitting processes, causing delays and higher costs to implement capital projects. International Paper has controls and procedures in place to stay informed about developments concerning possible climate change legislation and regulation in the U.S. and in other countries where we operate. We regularly assess whether such legislation or regulation may have a material effect on the Company, its operations or financial condition, and whether we have any related disclosure obligations.
International Paper plays a significant role in responding to the climate change challenge. Our entire business depends upon the sustainability of forests. We transform renewable resources into recyclable products that people depend on every day. This cycle begins with sourcing renewable fiber from responsibly managed forests, and at the end of use our products are recycled into new products at a higher rate than any other base material. We will continue to lead the world in responsible forest stewardship to ensure healthy and productive forest ecosystems for generations to come. Our efforts to advance sustainable forest management and restore forest landscapes are an important lever for mitigating climate change through carbon storage in forests. Furthermore, we use biomass and manufacturing residuals (rather than fossil fuels) to generate a substantial majority of the manufacturing energy at our mills.
Additional information regarding climate change and International Paper is available in our 2017 Global Citizenship report found on our website at www.internationalpaper.com, though this information is not incorporated by reference into this Form 10-K and
should not be considered part of this or any other report that we file with or furnish to the SEC.
As of
December 31, 2018
, we have approximately
53,000
employees, nearly
33,000
of whom are located in the United States. Of our U.S. employees, approximately
23,000
are hourly, with unions representing approximately
14,000
employees. Approximately
11,000
of this number are represented by the United Steelworkers union (USW).
International Paper, the USW, and several other unions have entered into two master agreements covering various mills and converting facilities. These master agreements cover several specific items, including wages, select benefit programs, successorship, employment security, and health and safety. Individual facilities continue to have local agreements for other subjects not covered by the master agreements. If local facility agreements are not successfully negotiated at the time of expiration, under the terms of the master agreements the local contracts will automatically renew with the same terms in effect. The master agreements cover the majority of our union represented mills and converting facilities. In addition, International Paper is party to a master agreement with District Council 2, International Brotherhood of Teamsters, covering additional converting facilities.
Mark S. Sutton,
57, chairman (since January 1, 2015) & chief executive officer (since November 1, 2014). Mr. Sutton previously served as president & chief operating officer from June 1, 2014 to October 31, 2014, senior vice president - industrial packaging from November 2011 to May 31, 2014, senior vice president - printing and communications papers of the Americas from 2010 until 2011, senior vice president - supply chain from 2008 to 2009, vice president - supply chain from 2007 until 2008, and vice president - strategic planning from 2005 until 2007. Mr. Sutton joined International Paper in 1984. Mr. Sutton serves on the board of directors of The Kroger Company. He is a member of The Business Council and the Business Roundtable and serves on the American Forest & Paper Association board of directors and the international advisory board of the Moscow School of Management - Skolkovo. He was appointed chairman of the U.S. Russian Business Council and was also appointed to the U.S. Section of the U.S.-Brazil CEO Forum. He also serves on the board of directors of Memphis Tomorrow and board of governors for New Memphis Institute. Mr. Sutton has been a director since June 1, 2014.
4
W. Michael Amick, Jr.,
55, senior vice president - paper the Americas & India since January 1, 2017. Mr. Amick previously served as senior vice president - North American papers & consumer packaging from July 2016 until December 2016, senior vice president - North American papers, pulp & consumer packaging from November 2014 until June 2016, vice president - president, IP India, from August 2012 to October 2014, and vice president and general manager for the coated paperboard business from 2010 to 2012. Mr. Amick joined International Paper in 1990.
Tommy S. Joseph,
59, senior vice president - manufacturing, technology, EH&S and global sourcing since January 2010. Mr. Joseph previously served as senior vice president - manufacturing, technology, EH&S from February 2009 until December 2009, and vice president - technology from 2005 until February 2009. Mr. Joseph is a director of Ilim in which International Paper holds a 50% interest, and of its subsidiary, Ilim Group. Mr. Joseph joined International Paper in 1983.
Timothy S. Nicholls,
57, senior vice president & chief financial officer since June 2018. Mr. Nicholls previously served as senior vice president - industrial packaging the Americas from January 2017 through June 2018, senior vice president - industrial packaging from November 2014 through December 2016, senior vice president - printing and communications papers of the Americas from November 2011 through October 2014, senior vice president and chief financial officer from 2007 until 2011, vice president and executive project leader of IP Europe during 2007, and vice president and chief financial officer - IP Europe from 2005 until 2007. Mr. Nicholls joined International Paper in 1991.
Thomas J. Plath,
55, senior vice president - human resources and global citizenship since March 1, 2017. Mr. Plath previously served as vice president - human resources, global businesses from November 2014 through February 2017, and vice president - HR manufacturing, technology, EH&S and global supply chain from April 2013 to November 2014. Mr. Plath joined International Paper in 1991.
Jean-Michel Ribieras,
56, senior vice president - industrial packaging the Americas since June 2018. Mr. Ribieras previously served as senior vice president - global cellulose fibers from July 2016 through June 2018, senior vice president - president, IP Europe, Middle East, Africa & Russia from 2013 until June 2016, and president - IP Latin America from 2009 until 2013. Mr. Ribieras joined International Paper in 1993.
Sharon R. Ryan,
59, senior vice president, general counsel & corporate secretary since November 2011. Ms. Ryan previously served as vice president, acting general counsel & corporate secretary from May 2011
until November 2011, vice president from March 2011 until May 2011, associate general counsel, chief ethics and compliance officer from 2009 until 2011, and associate general counsel from 2006 until 2009. Ms. Ryan joined International Paper in 1988.
John V. Sims,
56, senior vice president - president, IP Europe, Middle East, Africa & Russia since July 2016. Mr. Sims previously served as vice president and general manager, European papers from March 2016 until June 2016, vice president & general manager, North American papers from 2013 until February 2016, and vice president, finance and strategy, industrial packaging, from 2009 until 2013. Mr. Sims is a director of Ilim in which International Paper holds a 50% interest, and of its subsidiary, Ilim Group. Mr. Sims joined International Paper in 1994.
Catherine I. Slater,
55, senior vice president - global cellulose fibers & IP Asia since June 2018. Ms. Slater previously served as senior vice president - consumer packaging from December 2016 through December 2017. Ms. Slater joined International Paper from Weyerhaeuser Company in December 2016, effective with the completion of the acquisition of Weyerhaeuser’s cellulose fibers business, which she previously led. Ms. Slater’s 24-year career with Weyerhaeuser included leadership roles in manufacturing, printing papers, consumer products, wood products and the cellulose fibers business.
Gregory T. Wanta,
53, senior vice president - North American container since November 2016. Mr. Wanta has served in a variety of roles of increasing responsibility in manufacturing and commercial leadership roles in specialty papers, coated paperboard, printing papers, foodservice and industrial packaging, including vice president, central region, Container the Americas, from January 2012 through October 2016. Mr. Wanta joined International Paper in 1991.
Raw materials essential to our businesses include wood fiber, purchased in the form of pulpwood, wood chips and old corrugated containers (OCC), and certain chemicals, including caustic soda and starch. For further information concerning fiber supply purchase agreements, see page
30
.
Certain statements in this Annual Report on Form 10-K (including the exhibits hereto) that are not historical in nature may be considered “forward-looking” statements within the meaning of the Private Securities Litigation Reform Act of 1995. These statements are often identified by the words, “will,” “may,” “should,”
5
“continue,” “anticipate,” “believe,” “expect,” “plan,” “appear,” “project,” “estimate,” “intend,” and words of a similar nature. These statements are not guarantees of future performance and reflect management’s current views with respect to future events, which are subject to risks and uncertainties that could cause actual results to differ materially from those expressed or implied in these statements. Factors which could cause actual results to differ include but are not limited to: (i) the level of our indebtedness and changes in interest rates; (ii) industry conditions, including but not limited to changes in the cost or availability of raw materials, energy and transportation costs, competition we face, cyclicality and changes in consumer preferences, demand and pricing for our products; (iii) global economic conditions and political changes, including but not limited to the impairment of financial institutions, changes in currency exchange rates, credit ratings issued by recognized credit rating organizations, the amount of our future pension funding obligation, changes in tax laws and pension and health care costs; (iv) unanticipated expenditures related to the cost of compliance with existing and new environmental and other governmental regulations and to actual or potential litigation; (v) whether we experience a material disruption at one of our manufacturing facilities; (vi) risks inherent in conducting business through a joint venture; and (vii) our ability to achieve the benefits we expect from all acquisitions, divestitures and restructurings. These and other factors that could cause or contribute to actual results differing materially from such forward-looking statements are discussed in greater detail below in “Item 1A. Risk Factors.” We undertake no obligation to publicly update any forward-looking statements, whether as a result of new information, future events or otherwise.
The Company faces risks in the normal course of business and through global, regional, and local events that could have an adverse impact on its reputation, operations, and financial performance. The Board of Directors exercises oversight of the Company’s enterprise risk management program, which includes strategic, operational and financial matters, as well as compliance and legal risks. The Audit and Finance Committee coordinates the risk oversight role exercised by the Board’s standing committees and management, and it receives updates on the risk management processes twice per year.
In addition to the risks and uncertainties discussed elsewhere in this Annual Report on Form 10-K (particularly in
Item 7. Management’s Discussion and Analysis of Financial Condition and Results of Operations
), or in the Company’s other filings with the Securities and Exchange Commission, the following are some important factors that could cause the Company’s
actual results to differ materially from those projected in any forward-looking statement.
RISKS RELATING TO INDUSTRY CONDITIONS
CHANGES IN THE COST OR AVAILABILITY OF RAW MATERIALS, ENERGY AND TRANSPORTATION COULD AFFECT OUR PROFITABILITY.
We rely heavily on the use of certain raw materials (principally virgin wood fiber, recycled fiber, caustic soda and starch), energy sources (principally biomass, natural gas, electricity and fuel oil) and third-party companies that transport our goods. The market price of virgin wood fiber varies based upon availability and source. The global supply and demand for recycled fiber may be affected by trade policies between countries, individual governments' legislation and regulations, as well as changes in the global economy. In addition, the increase in demand of products manufactured, in whole or in part, from recycled fiber, on a global basis, may cause occasional significant fluctuations in recycled fiber prices. Energy prices, in particular prices for oil and natural gas, have fluctuated dramatically in the past and may continue to fluctuate in the future. The availability of labor and the market price for diesel fuel may affect our costs for third-party transportation. Our profitability has been, and will continue to be, affected by changes in the costs and availability of such raw materials, energy sources and transportation sources.
THE INDUSTRIES IN WHICH WE OPERATE EXPERIENCE BOTH ECONOMIC CYCLICALITY AND CHANGES IN CONSUMER PREFERENCES. FLUCTUATIONS IN THE PRICES OF, AND THE DEMAND FOR, OUR PRODUCTS COULD MATERIALLY AFFECT OUR FINANCIAL CONDITION, RESULTS OF OPERATIONS AND CASH FLOWS.
Substantially all of our businesses have experienced, and are likely to continue to experience, cycles relating to industry capacity and general economic conditions. The length and magnitude of these cycles have varied over time and by product. In addition, changes in consumer preferences may increase or decrease the demand for our products. These consumer preferences affect the prices of our products. Consequently, our financial results are sensitive to changes in the pricing and demand for our products.
COMPETITION IN THE UNITED STATES AND INTERNATIONALLY COULD NEGATIVELY IMPACT OUR FINANCIAL RESULTS.
We operate in a competitive environment, both in the United States and internationally, in all of our operating segments. Product innovations, manufacturing and operating efficiencies, and marketing, distribution and pricing strategies pursued or achieved by competitors could negatively impact our financial results.
6
RISKS RELATING TO MARKET AND ECONOMIC FACTORS
ADVERSE DEVELOPMENTS IN GENERAL BUSINESS AND ECONOMIC CONDITIONS COULD HAVE AN ADVERSE EFFECT ON THE DEMAND FOR OUR PRODUCTS AND OUR FINANCIAL CONDITION AND RESULTS OF OPERATIONS.
General economic conditions may adversely affect industrial non-durable goods production, consumer spending, commercial printing and advertising activity, white-collar employment levels and consumer confidence, all of which impact demand for our products. In addition, volatility in the capital and credit markets, which impacts interest rates, currency exchange rates and the availability of credit, could have a material adverse effect on our business, financial condition and our results of operations.
CHANGES IN INTERNATIONAL CONDITIONS COULD ADVERSELY AFFECT OUR BUSINESS AND RESULTS OF OPERATIONS.
Our operating results and business prospects could be substantially affected by risks related to the countries outside the United States in which we have manufacturing facilities or sell our products. Specifically, Russia, Brazil, Poland, India, and Turkey, where we have substantial manufacturing facilities, are countries that are exposed to economic and political instability in their respective regions of the world. Fluctuations in the value of local currency versus the U.S. dollar, downturns in economic activity, adverse tax consequences or rulings, nationalization or any change in social, political or labor conditions in any of these countries or regions could negatively affect our financial results. Trade protection measures in favor of local producers of competing products, including governmental subsidies, tax benefits and other measures giving local producers a competitive advantage over International Paper, may also adversely impact our operating results and business prospects in these countries. Likewise, disruption in existing trade agreements or increased trade friction between countries (e.g., the U.S. and China) could have a negative effect on our business and results of operations by restricting the free flow of goods and services across borders. In addition, our international operations are subject to regulation under U.S. law and other laws related to operations in foreign jurisdictions. For example, the Foreign Corrupt Practices Act prohibits U.S. companies and their representatives from offering, promising, authorizing or making payments to foreign officials for the purpose of obtaining or retaining business abroad. Failure to comply with domestic or foreign laws could result in various adverse consequences, including the imposition of civil or criminal sanctions and the prosecution of executives overseeing our international operations.
THE LEVEL OF OUR INDEBTEDNESS COULD ADVERSELY AFFECT OUR FINANCIAL CONDITION AND IMPAIR OUR ABILITY TO OPERATE OUR BUSINESS.
As of
December 31, 2018
, International Paper had approximately
$10.7 billion
of outstanding indebtedness. The level of our indebtedness could have important consequences to our financial condition, operating results and business, including the following:
|
•
|
it may limit our ability to obtain additional debt or equity financing for working capital, capital expenditures, product development, dividends, share repurchases, debt service requirements, acquisitions and general corporate or other purposes;
|
|
•
|
a portion of our cash flows from operations will be dedicated to payments on indebtedness and will not be available for other purposes, including operations, capital expenditures and future business opportunities;
|
|
•
|
the debt service requirements of our indebtedness could make it more difficult for us to satisfy other obligations;
|
|
•
|
our indebtedness that is subject to variable rates and, in the instance such variable rates use the London Interbank Offered Rate (LIBOR) as a benchmark, exposes us to a possible increase in debt service obligations in the event that the method for determining LIBOR changes, LIBOR is replaced by an alternative reference rate or LIBOR is phased out altogether;
|
|
•
|
it may limit our ability to adjust to changing market conditions and place us at a competitive disadvantage compared to our competitors that have less debt; and
|
|
•
|
it may increase our vulnerability to a downturn in general economic conditions or in our business, and may make us unable to carry out capital spending that is important to our growth.
|
In addition, we are subject to agreements that require meeting and maintaining certain financial ratios and covenants. A significant or prolonged downturn in general business and economic conditions may affect our ability to comply with these covenants or meet those financial ratios and tests and could require us to take action to reduce our debt or to act in a manner contrary to our current business objectives.
CHANGES IN CREDIT RATINGS ISSUED BY NATIONALLY RECOGNIZED STATISTICAL RATING ORGANIZATIONS COULD
ADVERSELY AFFECT OUR COST OF FINANCING AND HAVE AN ADVERSE
7
EFFECT ON THE MARKET PRICE OF OUR SECURITIES.
Maintaining an investment-grade credit rating is an important element of our financial strategy, and a downgrade of the Company’s ratings below investment grade will likely eliminate our ability to access the commercial paper market, may limit our access to the capital markets, have an adverse effect on the market price of our securities, increase our cost of borrowing and require us to post collateral for derivatives in a net liability position. The Company’s desire to maintain its investment grade rating may cause the Company to take certain actions designed to improve its cash flow, including sale of assets, suspension or reduction of our dividend and reductions in capital expenditures and working capital.
Under the terms of the agreements governing approximately $1.4 billion of our debt as of
December 31, 2018
, the applicable interest rate on such debt may increase upon each downgrade in our credit rating below investment grade. As a result, a downgrade in our credit rating below investment grade may lead to an increase in our interest expense. There can be no assurance that such credit ratings will remain in effect for any given period of time or that such ratings will not be lowered, suspended or withdrawn entirely by the rating agencies, if, in each rating agency’s judgment, circumstances so warrant. Any such downgrade, suspension or withdrawal of our credit ratings could adversely affect our cost of borrowing, limit our access to the capital markets or result in more restrictive covenants in agreements governing the terms of any future indebtedness that we may incur.
DOWNGRADES IN THE CREDIT RATINGS OF BANKS ISSUING CERTAIN LETTERS OF CREDIT WILL INCREASE OUR COST OF MAINTAINING CERTAIN INDEBTEDNESS AND MAY RESULT IN THE ACCELERATION OF DEFERRED TAXES.
We are subject to the risk that a bank with currently issued irrevocable letters of credit supporting installment notes delivered to Temple-Inland in connection with Temple-Inland's 2007 sales of forestlands may be downgraded below a required rating. Since 2007, certain banks have fallen below the required ratings threshold and were successfully replaced, or waivers were obtained regarding their replacement. As a result of continuing uncertainty in the banking environment, a number of the letter-of-credit banks currently in place remain subject to risk of downgrade and the number of qualified replacement banks remains limited. The downgrade of one or more of these banks may subject the Company to additional costs of securing a replacement letter-of-credit bank or could result in an acceleration of payments of up to $538 million in deferred income taxes if replacement banks cannot be obtained. The deferred taxes are currently recorded in the Company's consolidated financial statements. See
Note 14, Variable Interest Entities
, on pages
65
and
66
, and
Note
12, Income Taxes
, on pages
58
through
62
, in
Item 8. Financial Statements and Supplementary Data
for further information.
OUR PENSION AND HEALTH CARE COSTS ARE SUBJECT TO NUMEROUS FACTORS WHICH COULD CAUSE THESE COSTS TO CHANGE.
We have defined benefit pension plans covering substantially all U.S. salaried employees hired prior to July 1, 2004 (or later for certain acquired populations, as described in
Note 18. Retirement Plans
, on pages
70
through
77
, in
Item 8. Financial Statements and Supplementary Data
) and substantially all hourly and union employees regardless of hire date. The Company has frozen participation under these plans for U.S. salaried employees, including credited services and compensation on or after January 1, 2019; however, the pension freeze does not affect benefits accrued through December 31, 2018. We provide retiree health care benefits to certain former U.S. hourly employees, as well as financial assistance towards the cost of individual retiree medical coverage for certain former U.S. salaried employees. Our pension costs are dependent upon numerous factors resulting from actual plan experience and assumptions of future experience. Pension plan assets are primarily made up of equity and fixed income investments. Fluctuations in actual equity market returns, changes in general interest rates and changes in the number of retirees may result in increased pension costs in future periods. Likewise, changes in assumptions regarding current discount rates and expected rates of return on plan assets could increase pension costs.
OUR PENSION PLANS ARE CURRENTLY UNDERFUNDED ON A PROJECTED BENEFIT OBLIGATION BASIS, AND OVER TIME WE MAY BE REQUIRED TO MAKE CASH PAYMENTS TO THE PLANS, REDUCING THE CASH AVAILABLE FOR OUR BUSINESS.
We record a liability associated with our pension plans equal to the excess of the benefit obligation over the fair value of plan assets. The benefit liability recorded under the provisions of Accounting Standards Codification (ASC) 715, “Compensation – Retirement Benefits,” at
December 31, 2018
was
$1.8 billion
. The amount and timing of future contributions will depend upon a number of factors, including the actual earnings and changes in values of plan assets and changes in interest rates.
RISKS RELATING TO OUR OPERATIONS
MATERIAL DISRUPTIONS AT ONE OF OUR MANUFACTURING FACILITIES COULD NEGATIVELY IMPACT OUR FINANCIAL RESULTS.
We operate our facilities in compliance with applicable rules and regulations and take measures to minimize the risks of disruption at our facilities. A material disruption at our corporate headquarters or one of our manufacturing facilities could prevent us from meeting
8
customer demand, reduce our sales and/or negatively impact our financial condition. Any of our manufacturing facilities, or any of our machines within an otherwise operational facility, could cease operations unexpectedly due to a number of events, including:
|
•
|
fires, floods, earthquakes, hurricanes or other catastrophes;
|
|
•
|
the effect of a drought or reduced rainfall on its water supply;
|
|
•
|
the effect of other severe weather conditions on equipment and facilities;
|
|
•
|
terrorism or threats of terrorism;
|
|
•
|
domestic and international laws and regulations applicable to our Company and our business partners, including joint venture partners, around the world;
|
|
•
|
unscheduled maintenance outages;
|
|
•
|
prolonged power failures;
|
|
•
|
an equipment failure;
|
|
•
|
a chemical spill or release;
|
|
•
|
explosion of a boiler or other equipment;
|
|
•
|
damage or disruptions caused by third parties operating on or adjacent to one of our manufacturing facilities;
|
|
•
|
disruptions in the transportation infrastructure, including roads, bridges, railroad tracks and tunnels;
|
|
•
|
widespread outbreak of an illness or any other communicable disease, or any other public health crisis;
|
|
•
|
labor difficulties; and
|
|
•
|
other operational problems.
|
Any such downtime or facility damage could prevent us from meeting customer demand for our products and/or require us to make unplanned expenditures. If one of these machines or facilities were to incur significant downtime, our ability to meet our production targets and satisfy customer requirements could be impaired, resulting in lower sales and having a negative effect on our business and financial results.
CERTAIN OPERATIONS ARE CONDUCTED BY JOINT VENTURES THAT WE CANNOT OPERATE SOLELY FOR OUR BENEFIT.
Certain operations in Russia are carried on by a joint venture, Ilim. In joint ventures, we share ownership and management of a company with one or more parties who may or may not
have the same goals, strategies, priorities or resources as we do. In general, joint ventures are intended to be operated for the benefit of all co-owners, rather than for our exclusive benefit. Operating a business as a joint venture often requires additional organizational formalities as well as time-consuming procedures for sharing information and making decisions. In joint ventures, we are required to pay more attention to our relationship with our co-owners as well as with the joint venture, and if a co-owner changes, our relationship may be adversely affected. In addition, the benefits from a successful joint venture are shared among the co-owners, so we receive only our portion of those benefits.
WE MAY NOT ACHIEVE THE EXPECTED BENEFITS FROM ACQUISITIONS, JOINT VENTURES, DIVESTITURES, CAPITAL INVESTMENTS AND OTHER CORPORATE TRANSACTIONS.
Our strategy for long-term growth, productivity and profitability depends, in part, on our ability to accomplish prudent acquisitions, joint ventures, divestitures, capital investments and other corporate transactions and to realize the benefits we expect from such transactions, and we are subject to the risk that we may not achieve the expected benefits. Among the benefits we expect from potential as well as completed acquisitions and joint ventures are synergies, cost savings, growth opportunities or access to new markets (or a combination thereof), and in the case of divestitures, the realization of proceeds from the sale of businesses and assets to purchasers who place higher strategic value on such businesses and assets than does International Paper. In January 2018, for example, we completed a transaction transferring our North American Consumer Packaging business to Graphic Packaging in exchange for, among other things, an equity interest in the combined business of 20.5%. The success of the transaction and the value of our equity interest will depend on variables we do not control, such as the financial performance of the combined business and on the ability of the combined business to realize anticipated growth opportunities, cost savings and other synergies.
WE ARE SUBJECT TO INFORMATION TECHNOLOGY RISKS RELATED TO BREACHES OF SECURITY PERTAINING TO SENSITIVE COMPANY, CUSTOMER, EMPLOYEE AND VENDOR INFORMATION AS WELL AS BREACHES IN THE TECHNOLOGY USED TO MANAGE OPERATIONS AND OTHER BUSINESS PROCESSES.
Our business operations rely upon secure information technology systems for data capture, processing, storage and reporting. Despite careful security and controls design, implementation, updating and independent third party verification, our information technology systems, and those of our third party providers, could become subject to employee error or malfeasance, cyber attacks, or natural disasters. Network, system, application and data
9
breaches could result in operational disruptions or information misappropriation including, but not limited to, interruption to systems availability, denial of access to and misuse of applications required by our customers to conduct business with International Paper. Access to internal applications required to plan our operations, source materials, manufacture and ship finished goods and account for orders could be denied or misused. Theft of intellectual property or trade secrets, and inappropriate disclosure of confidential company, employee, customer or vendor information, could stem from such incidents. Any of these operational disruptions and/or misappropriation of information could result in lost sales, business delays, negative publicity, government enforcement and could have a material effect on our business.
RISKS RELATING TO LEGAL PROCEEDINGS AND COMPLIANCE COSTS
WE ARE SUBJECT TO A WIDE VARIETY OF LAWS, REGULATIONS AND OTHER GOVERNMENT REQUIREMENTS THAT MAY CHANGE IN SIGNIFICANT WAYS, AND THE COST OF COMPLIANCE WITH SUCH REQUIREMENTS COULD IMPACT OUR BUSINESS AND RESULTS OF OPERATIONS.
Our operations are subject to regulation under a wide variety of U.S. federal and state and non-U.S. laws, regulations and other government requirements -- including, among others, those relating to the environment, health and safety, labor and employment, data privacy, tax, trade and health care. There can be no assurance that laws, regulations and government requirements will not be changed, applied or interpreted in ways that will require us to modify our operations and objectives or affect our returns on investments by restricting existing activities and products, subjecting them to escalating costs.
For example, we have incurred, and expect that we will continue to incur, significant capital, operating and other expenditures complying with applicable environmental laws and regulations. There can be no assurance that future remediation requirements and compliance with existing and new laws and requirements, including with global climate change laws and regulations, will not require significant expenditures, or that existing reserves for specific matters will be adequate to cover future costs. We could also incur substantial fines or sanctions, enforcement actions (including orders limiting our operations or requiring corrective measures), natural resource damages claims, cleanup and closure costs, and third-party claims for property damage and personal injury as a result of violations of, or liabilities under, environmental laws, regulations, codes and common law. The amount and timing of environmental expenditures is difficult to predict, and, in some cases, liability may be imposed without regard to
contribution or to whether we knew of, or caused, the release of hazardous substances.
As another example, we are subject to a number of labor and employment laws and regulations that could significantly increase our operating costs and reduce our operational flexibility. Additionally, we are subject to complex and evolving U.S. and international privacy laws and regulations, including those pertaining to the handling of personal data, such as the General Data Protection Regulation (GDPR). Government authorities around the world are considering, or are in the process of implementing, new data protection regulations. Many of these laws and regulations are subject to uncertain application, interpretation or enforcement standards that could result in claims, changes to our business practices, penalties, increased operating costs or other impacts on our businesses.
As a final example, the application of tax law is subject to interpretation and is subject to audit by taxing authorities. Additionally, administrative guidance can be incomplete or vary from legislative intent, and therefore the application of the tax law is uncertain. While we believe the positions reported by the Company comply with relevant tax laws and regulations, taxing authorities could interpret our application of certain laws and regulations differently. We are currently subject to tax audits in the U.S., Brazil, Poland, Russia and other taxing jurisdictions around the world. In some cases, we have appealed and may continue to appeal, assessments by taxing authorities in the court system. As such, tax controversy matters may result in previously unrecorded tax expenses, higher future tax expenses or the assessment of interest and penalties.
RESULTS OF LEGAL PROCEEDINGS COULD HAVE A MATERIAL EFFECT ON OUR CONSOLIDATED FINANCIAL STATEMENTS.
The costs and other effects of pending litigation against us cannot be determined with certainty. Although we do not believe that the outcome of any pending or threatened lawsuits or claims will have a material effect on our business or consolidated financial statements, there can be no assurance that the outcome of any lawsuit or claim will be as expected.
None.
As of
December 31, 2018
, the Company owned or managed approximately
329,000
acres of forestlands in Brazil, and had, through licenses and forest management agreements, harvesting rights on
10
government-owned forestlands in Russia. All owned lands in Brazil are independently third-party certified for sustainable forestry under the Brazilian National Forest Certification Program (CERFLOR) and the Forest Stewardship Council (FSC).
A listing of our production facilities by segment, the vast majority of which we own, can be found in
Appendix I
hereto, which is incorporated herein by reference.
The Company’s facilities are in good operating condition and are suited for the purposes for which they are presently being used. We continue to study the economics of modernization or adopting other alternatives for higher cost facilities.
Given the size, scope and complexity of our business interests, we continually examine and evaluate a wide variety of business opportunities and planning alternatives, including possible acquisitions and sales or other dispositions of properties. You can find a discussion about the level of planned capital investments for
2019
on page
30
, and dispositions and restructuring activities as of
December 31, 2018
, on pages
21
through
23
of
Item 7. Management’s Discussion and Analysis of Financial Condition and Results of Operations
, and on page
52
and pages
54
and
55
of
Item 8. Financial Statements and Supplementary Data
.
Information concerning the Company’s legal proceedings is set forth in
Note 13 Commitments and Contingent Liabilities
on pages
62
through
65
of
Item 8. Financial Statements and Supplementary Data
.
Additionally, in the third quarter of 2018, the Company received a natural resource damages penalty assessment of RUB 18.8 million (approximately $275,000) arising from the Company’s voluntary disclosure of mercury contamination identified in sediment in a river tributary that traverses the site of the Company’s mill in Svetogorsk, Russia. The mercury contamination is associated with a former manufacturing facility located on the Svetogorsk mill site. The Company is cooperating with the Russian government to resolve the matter.
Not applicable.
ITEM 5. MARKET FOR REGISTRANT’S COMMON EQUITY, RELATED STOCKHOLDER MATTERS AND ISSUER PURCHASES OF EQUITY SECURITIES
As of the filing of this Annual Report on Form 10-K, the Company’s common shares are traded on the New York Stock Exchange (NYSE: IP). As of
February 15, 2019
, there were approximately 11,316 record holders of common stock of the Company.
The table below presents information regarding the Company’s purchases of its equity securities for the time periods presented.
PURCHASES OF EQUITY SECURITIES BY THE ISSUER AND AFFILIATED PURCHASERS.
|
Period
|
Total Number of Shares Purchased (a)
|
Average Price Paid per Share
|
Total Number of Shares (or Units) Purchased as Part of Publicly Announced Programs
|
Maximum Number (or Approximate Dollar Value) of Shares that May Yet Be Purchased Under the Plans or Programs (in billions)
|
||||||
|
October 1, 2018 - October 31, 2018
|
2,225,310
|
|
$
|
44.94
|
|
2,225,188
|
|
$
|
2.33
|
|
|
November 1, 2018 - November 30, 2018
|
1,475,242
|
|
45.79
|
|
1,474,900
|
|
2.27
|
|
||
|
December 1, 2018 - December 31, 2018
|
725,363
|
|
45.51
|
|
712,442
|
|
2.23
|
|
||
|
Total
|
4,425,915
|
|
||||||||
|
(a)
|
13,385 shares were acquired from employees from share withholdings to pay income taxes under the Company’s restricted stock programs. During these periods, 4,412,530 shares were purchased under our share repurchase program, which was approved by our Board of Directors and announced on July 8, 2014 and October 9, 2018. Through this program, which does not have an expiration date, we were authorized to purchase, in open market transactions (including block trades), privately negotiated transactions or otherwise, up to $3.5 billion aggregate amount of shares of our common stock. As of February 15, 2019, approximately $2.19 billion aggregate amount of shares of our common stock remained authorized for purchase under this program.
|
11
PERFORMANCE GRAPH
The performance graph shall not be deemed to be “soliciting material” or to be “filed” with the Commission or subject to Regulation 14A or 14C, or to the liabilities of Section 18 of the Exchange Act of 1934, as amended.
The following graph compares a $100 investment in Company stock on December 31, 2013 with a $100 investment in our Return on Invested Capital (ROIC) Peer Group and the S&P 500 also made at market close on December 31, 2013. The graph portrays total return, 2013–2018, assuming reinvestment of dividends.
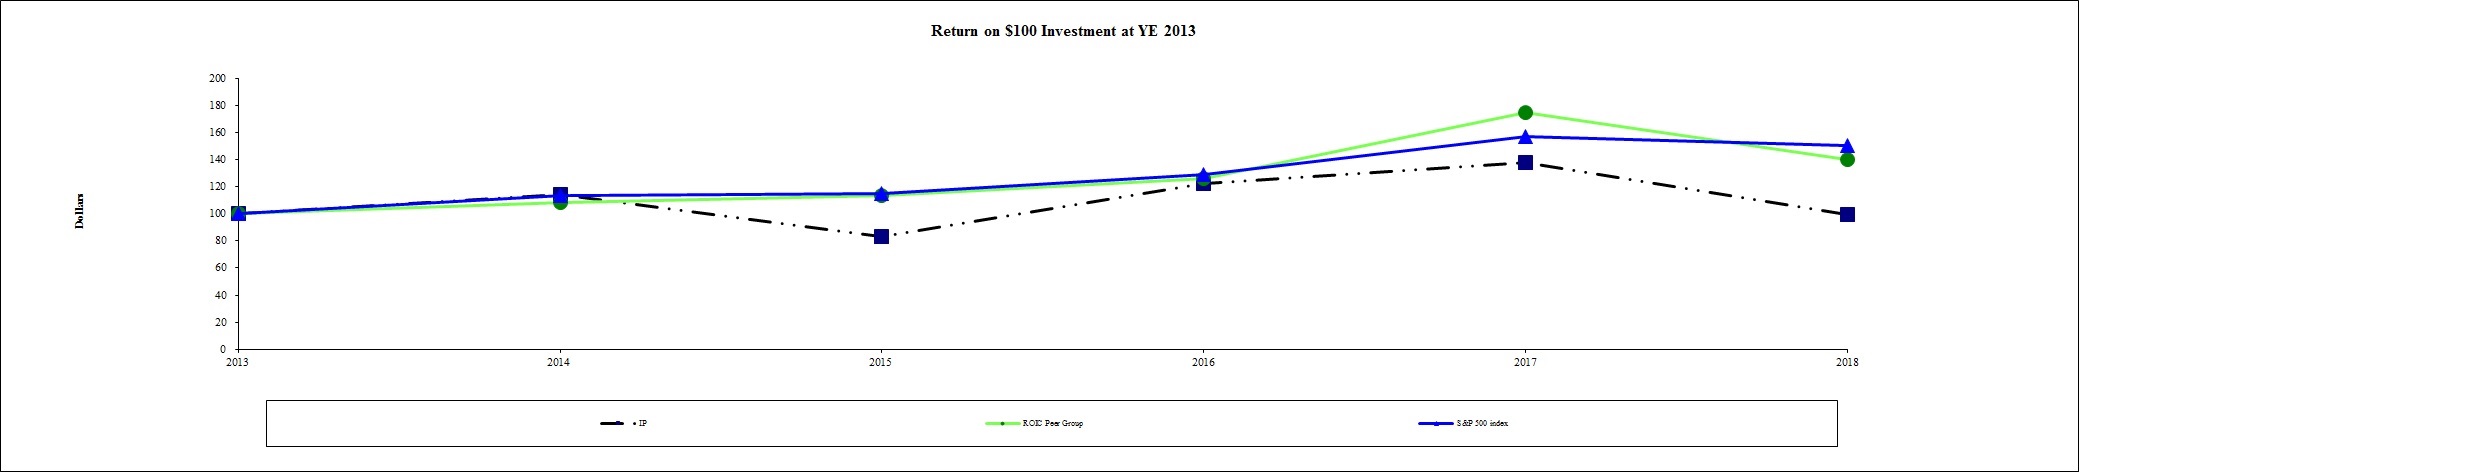
Note 1. The companies included in the ROIC Peer Group are Domtar Inc., Fibria Celulose S.A., Graphic Packaging Holding Company, Klabin S.A., Metsa Board Corporation, Mondi Group, Packaging Corporation of America, Smurfit Kappa Group, Stora Enso Group, and UPM-Kymmene Corp. MeadWestvaco Corp. and Rock-Tenn Company are included in the ROIC Peer Group results through 2014 and subsequently, after the merger of those companies, WestRock was added to the Peer group beginning in 2015.
|
Note 2.
|
Returns are calculated in $USD.
|
12
FIVE-YEAR FINANCIAL SUMMARY (a)
|
Dollar amounts in millions, except per share amounts and stock prices
|
2018
|
|
2017
|
|
2016
|
|
2015
|
|
2014
|
|
||||||||||
|
RESULTS OF OPERATIONS
|
||||||||||||||||||||
|
Net sales
|
$
|
23,306
|
|
|
$
|
21,743
|
|
|
$
|
19,495
|
|
|
$
|
20,675
|
|
|
$
|
21,889
|
|
|
|
Costs and expenses, excluding interest
|
20,989
|
|
|
20,323
|
|
|
18,180
|
|
|
18,988
|
|
|
20,548
|
|
|
|||||
|
Earnings (loss) from continuing operations before income taxes and equity earnings
|
1,781
|
|
(b)
|
848
|
|
(e)
|
795
|
|
(h)
|
1,132
|
|
(k)
|
734
|
|
(n)
|
|||||
|
Equity earnings (loss), net of taxes
|
336
|
|
|
177
|
|
|
198
|
|
117
|
|
|
(200
|
)
|
|
||||||
|
Discontinued operations, net of taxes
|
345
|
|
(c)
|
34
|
|
(f)
|
102
|
|
(i)
|
85
|
|
(l)
|
77
|
|
(o)
|
|||||
|
Net earnings (loss)
|
2,017
|
|
(b-d)
|
2,144
|
|
(e-g)
|
902
|
|
(h-j)
|
917
|
|
(k-m)
|
536
|
|
(n-p)
|
|||||
|
Noncontrolling interests, net of taxes
|
5
|
|
|
—
|
|
|
(2
|
)
|
|
(21
|
)
|
|
(19
|
)
|
|
|||||
|
Net earnings (loss) attributable to International Paper Company
|
2,012
|
|
(b-d)
|
2,144
|
|
(e-g)
|
904
|
|
(h-j)
|
938
|
|
(k-m)
|
555
|
|
(n-p)
|
|||||
|
FINANCIAL POSITION
|
||||||||||||||||||||
|
Current assets less current liabilities
|
$
|
2,302
|
|
|
$
|
3,175
|
|
|
$
|
2,601
|
|
|
$
|
2,244
|
|
|
$
|
2,719
|
|
|
|
Plants, properties and equipment, net
|
13,067
|
|
|
13,265
|
|
|
13,003
|
|
|
11,000
|
|
|
11,794
|
|
|
|||||
|
Forestlands
|
402
|
|
|
448
|
|
|
456
|
|
|
366
|
|
|
507
|
|
|
|||||
|
Total assets
|
33,576
|
|
|
33,903
|
|
|
33,093
|
|
|
30,271
|
|
|
28,369
|
|
|
|||||
|
Notes payable and current maturities of long-term debt
|
639
|
|
|
311
|
|
|
239
|
|
|
426
|
|
|
742
|
|
|
|||||
|
Long-term debt
|
10,015
|
|
|
10,846
|
|
|
11,075
|
|
|
8,844
|
|
|
8,584
|
|
|
|||||
|
Total shareholders’ equity
|
7,362
|
|
|
6,522
|
|
|
4,341
|
|
|
3,884
|
|
|
5,115
|
|
|
|||||
|
BASIC EARNINGS PER SHARE ATTRIBUTABLE TO INTERNATIONAL PAPER COMPANY COMMON SHAREHOLDERS
|
||||||||||||||||||||
|
Earnings (loss) from continuing operations
|
$
|
4.07
|
|
|
$
|
5.11
|
|
|
$
|
1.95
|
|
|
$
|
2.05
|
|
$
|
1.12
|
|
|
|
|
Discontinued operations
|
0.84
|
|
|
0.08
|
|
|
0.25
|
|
|
0.20
|
|
0.18
|
|
|||||||
|
Net earnings (loss)
|
4.91
|
|
|
5.19
|
|
|
2.20
|
|
|
2.25
|
|
1.30
|
|
|
||||||
|
DILUTED EARNINGS PER SHARE ATTRIBUTABLE TO INTERNATIONAL PAPER COMPANY COMMON SHAREHOLDERS
|
||||||||||||||||||||
|
Earnings (loss) from continuing operations
|
$
|
4.02
|
|
|
$
|
5.05
|
|
|
$
|
1.93
|
|
|
$
|
2.03
|
|
$
|
1.10
|
|
|
|
|
Discontinued operations
|
0.83
|
|
|
0.08
|
|
|
0.25
|
|
|
0.20
|
|
0.19
|
|
|||||||
|
Net earnings (loss)
|
4.85
|
|
|
5.13
|
|
|
2.18
|
|
|
2.23
|
|
1.29
|
|
|
||||||
|
Cash dividends
|
1.925
|
|
|
1.863
|
|
|
1.783
|
|
|
1.640
|
|
|
1.450
|
|
|
|||||
|
COMMON STOCK PRICES
|
||||||||||||||||||||
|
High
|
$
|
66.94
|
|
|
$
|
58.96
|
|
|
$
|
54.68
|
|
|
$
|
57.90
|
|
|
$
|
55.73
|
|
|
|
Low
|
37.55
|
|
|
49.60
|
|
|
32.50
|
|
|
36.76
|
|
|
44.24
|
|
|
|||||
|
Year-end
|
40.36
|
|
|
57.94
|
|
|
53.06
|
|
|
37.70
|
|
|
53.58
|
|
|
|||||
|
FINANCIAL RATIOS
|
||||||||||||||||||||
|
Current ratio
|
1.5
|
|
|
1.6
|
|
|
1.6
|
|
|
1.6
|
|
|
1.5
|
|
|
|||||
|
Total debt to capital ratio
|
0.59
|
|
|
0.63
|
|
|
0.72
|
|
|
0.70
|
|
|
0.65
|
|
|
|||||
|
Return on shareholders’ equity
|
28.4
|
%
|
|
43.9
|
%
|
|
22.1
|
%
|
|
20.0
|
%
|
|
7.7
|
%
|
|
|||||
|
CAPITAL EXPENDITURES
|
$
|
1,572
|
|
|
$
|
1,391
|
|
|
$
|
1,348
|
|
|
|
$1,487
|
|
|
|
$1,366
|
|
|
|
NUMBER OF EMPLOYEES
|
53,000
|
|
|
56,000
|
|
|
55,000
|
|
|
56,000
|
|
|
58,000
|
|
|
|||||
13
FINANCIAL GLOSSARY
Current ratio—
current assets divided by current liabilities.
Total debt to capital ratio—
long-term debt plus notes payable and current maturities of long-term debt divided by long-term debt, notes payable and current maturities of long-term debt and total shareholders’ equity.
Return on shareholders’ equity—
net earnings attributable to International Paper Company divided by average shareholders’ equity (computed monthly).
FOOTNOTES TO FIVE-YEAR FINANCIAL SUMMARY
|
(a)
|
All prior periods presented have been restated to reflect the North American Consumer Packaging business and the xpedx business as discontinued operations (excluding cash flow related items) and prior period amounts have been adjusted to conform with current year presentation, if applicable.
|
2018:
(b) Includes the following charges (gains):
|
2018
|
||||||||
|
In millions
|
Before Tax
|
After Tax
|
||||||
|
Smurfit-Kappa acquisition proposal costs
|
12
|
|
9
|
|
||||
|
Legal settlement
|
9
|
|
7
|
|
||||
|
Litigation settlement recovery
|
(5
|
)
|
(4
|
)
|
||||
|
Environmental remediation reserve adjustment
|
9
|
|
7
|
|
||||
|
EMEA Packaging optimization
|
47
|
|
34
|
|
||||
|
Abandoned property removal
|
32
|
|
24
|
|
||||
|
Riverdale mill conversion costs
|
9
|
|
7
|
|
||||
|
Brazil Packaging impairment
|
122
|
|
81
|
|
||||
|
Debt extinguishment costs
|
10
|
|
7
|
|
||||
|
Gain on sale of investment in Liaison Technologies
|
(31
|
)
|
(23
|
)
|
||||
|
Total special items
|
$
|
214
|
|
$
|
149
|
|
||
|
Non-operating pension expense
|
494
|
|
371
|
|
||||
|
Total
|
$
|
708
|
|
$
|
520
|
|
||
(c) Includes the following charges (gains):
|
2018
|
||||||||
|
In millions
|
Before Tax
|
After Tax
|
||||||
|
North American Consumer Packaging transaction costs
|
25
|
|
19
|
|
||||
|
North American Consumer Packaging gain on transfer
|
(488
|
)
|
(364
|
)
|
||||
|
Total
|
$
|
(463
|
)
|
$
|
(345
|
)
|
||
(d) Includes the following tax expenses (benefits):
|
In millions
|
2018
|
|||
|
State income tax legislative changes
|
$
|
9
|
|
|
|
Tax benefit of Tax Cuts and Jobs Act
|
(36
|
)
|
||
|
International investment restructuring
|
19
|
|
||
|
Foreign tax audits
|
25
|
|
||
|
Total
|
$
|
17
|
|
|
2017:
(e) Includes the following charges (gains):
|
2017
|
||||||||
|
In millions
|
Before Tax
|
After Tax
|
||||||
|
Gain on sale of investment in ArborGen
|
$
|
(14
|
)
|
$
|
(9
|
)
|
||
|
Costs associated with the pulp business acquired in 2016
|
33
|
|
20
|
|
||||
|
Amortization of Weyerhaeuser inventory fair value step-up
|
14
|
|
8
|
|
||||
|
Holmen bargain purchase gain
|
(6
|
)
|
(6
|
)
|
||||
|
Abandoned property removal
|
20
|
|
13
|
|
||||
|
Kleen Products settlement
|
354
|
|
219
|
|
||||
|
Asia Foodservice sale
|
9
|
|
4
|
|
||||
|
Brazil Packaging wood supply accelerated amortization
|
10
|
|
7
|
|
||||
|
Debt extinguishment costs
|
83
|
|
51
|
|
||||
|
Interest income on income tax refund claims
|
(5
|
)
|
(3
|
)
|
||||
|
Other items
|
(2
|
)
|
(2
|
)
|
||||
|
Total special items
|
$
|
496
|
|
$
|
302
|
|
||
|
Non-operating pension expense
|
484
|
|
298
|
|
||||
|
Total
|
$
|
980
|
|
$
|
600
|
|
||
(f) Includes the operating earnings of the North American Consumer Packaging business for the full year. Also includes the following charges (gains):
|
2017
|
||||||||
|
In millions
|
Before Tax
|
After Tax
|
||||||
|
North American Consumer Packaging transaction costs
|
$
|
17
|
|
$
|
10
|
|
||
|
Non-operating pension expense
|
45
|
|
28
|
|
||||
|
Total
|
$
|
62
|
|
$
|
38
|
|
||
(g) Includes the following tax expenses (benefits):
|
In millions
|
2017
|
|||
|
International legal entity restructuring
|
$
|
34
|
|
|
|
Income tax refund claims
|
(113
|
)
|
||
|
Cash pension contribution
|
38
|
|
||
|
International tax law change
|
9
|
|
||
|
Tax benefit of Tax Cuts and Jobs Act
|
(1,222
|
)
|
||
|
Total
|
$
|
(1,254
|
)
|
|
14
2016:
(h) Includes the following charges (gains):
|
2016
|
||||||||
|
In millions
|
Before Tax
|
After Tax
|
||||||
|
Riegelwood mill conversion costs
|
$
|
9
|
|
$
|
6
|
|
||
|
India Packaging evaluation write-off
|
17
|
|
11
|
|
||||
|
Write-off of certain regulatory pre-engineering costs
|
8
|
|
5
|
|
||||
|
Early debt extinguishment costs
|
29
|
|
18
|
|
||||
|
Costs associated with the newly acquired pulp business
|
31
|
|
21
|
|
||||
|
Asia Box impairment / restructuring
|
70
|
|
58
|
|
||||
|
Gain on sale of investment in Arizona Chemical
|
(8
|
)
|
(5
|
)
|
||||
|
Turkey mill closure
|
7
|
|
6
|
|
||||
|
Amortization of Weyerhaeuser inventory fair value step-up
|
19
|
|
11
|
|
||||
|
Total special items
|
$
|
182
|
|
$
|
131
|
|
||
|
Non-operating pension expense
|
610
|
|
375
|
|
||||
|
Total
|
$
|
792
|
|
$
|
506
|
|
||
(i) Includes the operating earnings of the North American Consumer Packaging business for the full year. Also includes the following charges (gains):
|
2016
|
||||||||
|
In millions
|
Before Tax
|
After Tax
|
||||||
|
xpedx legal settlement
|
$
|
8
|
|
$
|
5
|
|
||
|
Total
|
$
|
8
|
|
$
|
5
|
|
||
(j) Includes the following tax expenses (benefits):
|
In millions
|
2016
|
|||
|
Cash pension contribution
|
$
|
23
|
|
|
|
U.S. Federal audit
|
(14
|
)
|
||
|
Brazil goodwill
|
(57
|
)
|
||
|
International legal entity restructuring
|
(6
|
)
|
||
|
Luxembourg tax rate change
|
31
|
|
||
|
Total
|
$
|
(23
|
)
|
|
2015:
(k) Includes the following charges (gains):
|
2015
|
||||||||
|
In millions
|
Before Tax
|
After Tax
|
||||||
|
Riegelwood mill conversion costs, net of proceeds from sale of the Carolina Coated Bristols brand
|
$
|
8
|
|
$
|
4
|
|
||
|
Timber monetization restructuring
|
16
|
|
10
|
|
||||
|
Early debt extinguishment costs
|
207
|
|
133
|
|
||||
|
IP-Sun JV impairment
|
174
|
|
180
|
|
||||
|
Legal reserve adjustment
|
15
|
|
9
|
|
||||
|
Refund and state tax credits
|
(4
|
)
|
(2
|
)
|
||||
|
Impairment of Orsa goodwill and trade name intangible
|
137
|
|
137
|
|
||||
|
Other items
|
6
|
|
5
|
|
||||
|
Total special items
|
$
|
559
|
|
$
|
476
|
|
||
|
Non-operating pension expense
|
258
|
|
157
|
|
||||
|
Total
|
$
|
817
|
|
$
|
633
|
|
||
(l) Includes the operating earnings of the North American Consumer Packaging business for the full year .
(m) Includes the following tax expenses (benefits):
|
In millions
|
2015
|
|||
|
IP-Sun JV impairment
|
$
|
(67
|
)
|
|
|
Cash pension contribution
|
23
|
|
||
|
Other items
|
7
|
|
||
|
Total
|
$
|
(37
|
)
|
|
2014:
(n) Includes the following charges (gains):
|
2014
|
||||||||
|
In millions
|
Before Tax
|
After Tax
|
||||||
|
Temple-Inland integration
|
$
|
16
|
|
$
|
10
|
|
||
|
Courtland mill shutdown
|
554
|
|
338
|
|
||||
|
Early debt extinguishment costs
|
276
|
|
169
|
|
||||
|
India legal contingency resolution
|
(20
|
)
|
(20
|
)
|
||||
|
Multi-employer pension plan withdrawal liability
|
35
|
|
21
|
|
||||
|
Foreign tax amnesty program
|
32
|
|
17
|
|
||||
|
Asia Industrial Packaging goodwill impairment
|
100
|
|
100
|
|
||||
|
Loss on sale by investee and impairment of investment
|
47
|
|
36
|
|
||||
|
Other items
|
12
|
|
9
|
|
||||
|
Total special items
|
$
|
1,052
|
|
$
|
680
|
|
||
|
Non-operating pension expense
|
212
|
|
129
|
|
||||
|
Total
|
$
|
1,264
|
|
$
|
809
|
|
||
15
(o) Includes the operating earnings of the North American Consumer Packaging business and the xpedx business prior to the spin-off, and the following charges (gains):
|
2014
|
||||||||
|
In millions
|
Before Tax
|
After Tax
|
||||||
|
xpedx spinoff
|
$
|
24
|
|
$
|
16
|
|
||
|
Building Products divestiture
|
16
|
|
9
|
|
||||
|
xpedx restructuring
|
1
|
|
(1
|
)
|
||||
|
Total
|
$
|
41
|
|
$
|
24
|
|
||
(p) Includes the following tax expenses (benefits):
|
In millions
|
2014
|
|||
|
State legislative tax change
|
$
|
10
|
|
|
|
Internal restructuring
|
(90
|
)
|
||
|
Other items
|
(1
|
)
|
||
|
Total
|
$
|
(81
|
)
|
|
16
Full-year 2018 net earnings were $2.0 billion ($4.85 per diluted share) compared with net earnings of $2.1 billion ($5.13 per diluted share) for full-year 2017. Full-year 2017 net earnings included a provisional net tax benefit of $1.2 billion ($2.93 per diluted share) related to the U.S. enactment of the Tax Cuts and Jobs Act of 2017 reported as a special item.
International Paper delivered strong earnings, returns and cash generation in 2018, driven by solid commercial and operational performance across our three businesses. Business segment operating profit improved by approximately $800 million to $2.9 billion in 2018, driven primarily by price and mix improvements, with revenue growth of 7.2%. We continued to grow value for our shareholders with a return which was significantly above our cost of capital and marks our ninth consecutive year with value-creating returns. The Company made strategic investments to strengthen our businesses. Among these, we completed the final phase of our multi-year North American containerboard mill system optimization projects, which gives us the added flexibility we need around capacity, products and geographies. We also invested in our North American corrugated packaging system to enhance our capabilities and strengthen our position with the fastest growing segments. In our EMEA Packaging business, we completed the conversion of the Madrid, Spain mill and started production of high-performance, lightweight recycled containerboard to capture the integrated margin with our EMEA box system. International Paper continued to deliver strong cash generation in 2018, which we used to strengthen our balance sheet and return cash to shareholders. We decreased balance sheet debt by about $500 million, and we returned $1.5 billion to shareholders through dividends of about $800 million and share repurchases of about $700 million. The Company increased its dividend for the seventh consecutive year and reduced shares outstanding by 3%.
The Company’s 2018 results include significant price and mix improvements driven by price realization across our three business segments. Improved mix contributed to the Company’s strong performance, particularly in our Global Cellulose Fibers business where we continued to grow fluff pulp volume. Weather events in North America and startup costs associated with the Madrid, Spain mill negatively impacted operations, and planned maintenance outages were higher. Input costs increased in 2018, driven by higher wood fiber, chemicals, distribution and energy costs, and were partially offset by lower recovered fiber costs. Equity earnings increased
by $159 million to $336 million in 2018, driven by excellent commercial and operational performance in our Ilim joint venture and first-year equity earnings from Graphic Packaging International Partners, LLC (GPIP). In total, our equity investments provided $153 million in cash dividends to International Paper in 2018.
Looking ahead to the first quarter 2019, domestic industry conditions remain healthy. We anticipate lower seasonal demand in North America Industrial Packaging and Brazil Papers, as well as lower export volume in Industrial Packaging, as customer destocking continues. In Global Cellulose Fibers we anticipate lower volume due to slower growth in developing markets and customer destocking, as well as a temporary setback in fluff pulp volume resulting from poor execution of a mix improvement plan. Consequently, we expect downward pressure on export price and mix in Industrial Packaging and Global Cellulose Fibers during the first quarter. Operating costs are expected to increase in our three business segments due to lower volume, higher seasonal energy consumption and timing of spending. In addition, planned maintenance outage expense is expected to increase significantly as we move from a low-outage fourth quarter to a heavy-outage first quarter, with first-half 2019 representing nearly 80% of total planned maintenance outage expense in 2019. Input costs are expected to be stable in Industrial Packaging and Global Cellulose Fibers and increase modestly in Printing Papers, mainly due to higher wood costs in North America. Lastly, we expect equity earnings for our Ilim joint venture to remain stable in the first quarter.
Looking to full-year 2019, we remain focused on maximizing value creation for our shareholders. We anticipate meaningful growth in cash generation driven by commercial and operational excellence, lower capital expenditures and higher dividends from our equity investments. We continue to see healthy box demand in North America Industrial Packaging and expect solid demand growth for fluff pulp used in absorbent hygiene products. In Global Cellulose Fibers we expect our fluff pulp volume to recover as we execute on our mix improvement initiatives. In Printing Papers, the business is performing very well and we have good momentum as we move into 2019, with expected price realization from recent price increases. In Europe, the benefits of the Madrid, Spain mill will accelerate through the year. We expect lower planned maintenance outage expense and capital investments of $1.4 billion, which is about $200 million lower than 2018. Our Ilim joint venture is well positioned to thrive through near-term destocking in softwood market pulp in China and we expect to receive about $200 million in cash dividends from the joint venture in 2019. All in, we expect strong cash generation, which we will use to maximize value for our shareholders by strengthening our balance sheet and returning cash to shareholders. We are committed to a strong and
17
competitive dividend and have a $2.2 billion share repurchase authority remaining.
Adjusted Operating Earnings and Adjusted Operating Earnings Per Share are non-GAAP measures and are defined as net earnings from continuing operations (a GAAP measure) excluding special items and non-operating pension expense. Net earnings (loss) and Diluted earnings (loss) per share attributable to common shareholders are the most directly comparable GAAP measures. The Company calculates Adjusted Operating Earnings by excluding the after-tax effect of non-operating pension expense, items considered by management to be unusual and discontinued operations from the earnings reported under GAAP. Adjusted Operating Earnings Per Share is calculated by dividing Adjusted Operating Earnings by diluted average shares of common stock outstanding. Management uses this measure to focus on on-going operations, and believes that it is useful to investors because it enables them to perform meaningful comparisons of past and present operating results. The Company believes that using this information, along with the most direct comparable GAAP measure, provides for a more complete analysis of the results of operations.
The following are reconciliations of Earnings (loss) attributable to common shareholders to Adjusted operating earnings (loss) attributable to common shareholders.
|
2018
|
2017
|
2016
|
|||||||
|
Earnings (Loss) Attributable to Shareholders
|
$
|
2,012
|
|
$
|
2,144
|
|
$
|
904
|
|
|
Less - Discontinued operations (gain) loss
|
(345
|
)
|
(34
|
)
|
(102
|
)
|
|||
|
Earnings (Loss) from Continuing Operations
|
1,667
|
|
2,110
|
|
802
|
|
|||
|
Add back - Non-operating pension expense (income)
|
494
|
|
484
|
|
610
|
|
|||
|
Add back - Net special items expense (income)
|
214
|
|
496
|
|
182
|
|
|||
|
Income tax effect - Non-operating pension and special items expense
|
(171
|
)
|
(1,634
|
)
|
(309
|
)
|
|||
|
Adjusted Operating Earnings (Loss) Attributable to Shareholders
|
$
|
2,204
|
|
$
|
1,456
|
|
$
|
1,285
|
|
|
2018
|
2017
|
2016
|
|||||||
|
Diluted Earnings (Loss) Per Share Attributable to Shareholders
|
$
|
4.85
|
|
$
|
5.13
|
|
$
|
2.18
|
|
|
Less - Discontinued operations (gain) loss per share
|
(0.83
|
)
|
(0.08
|
)
|
(0.25
|
)
|
|||
|
Diluted Earnings (Loss) Per Share from Continuing Operations
|
4.02
|
|
5.05
|
|
1.93
|
|
|||
|
Add back - Non-operating pension expense (income) per share
|
1.19
|
|
1.16
|
|
1.47
|
|
|||
|
Add back - Net special items expense (income) per share
|
0.52
|
|
1.19
|
|
0.44
|
|
|||
|
Income tax effect per share - Non-operating pension and special items expense
|
(0.41
|
)
|
(3.91
|
)
|
(0.75
|
)
|
|||
|
Adjusted Operating Earnings (Loss) Per Share Attributable to Shareholders
|
$
|
5.32
|
|
$
|
3.49
|
|
$
|
3.09
|
|
|
Three Months Ended December 31, 2018
|
Three Months Ended September 30, 2018
|
Three Months Ended December 31, 2017
|
||||||||||
|
Earnings (Loss) Attributable to Shareholders
|
$
|
316
|
|
$
|
562
|
|
$
|
1,460
|
|
|||
|
Less - Discontinued operations (gain) loss
|
—
|
|
—
|
|
8
|
|
||||||
|
Earnings (Loss) from Continuing Operations
|
316
|
|
562
|
|
1,468
|
|
||||||
|
Add back - Non-operating pension expense (income)
|
429
|
|
25
|
|
386
|
|
||||||
|
Add back - Net special items expense (income)
|
(15
|
)
|
142
|
|
106
|
|
||||||
|
Income tax effect - Non-operating pension and special items expense
|
(60
|
)
|
(88
|
)
|
(1,430
|
)
|
||||||
|
Adjusted Operating Earnings (Loss) Attributable to Shareholders
|
$
|
670
|
|
$
|
641
|
|
$
|
530
|
|
|||
|
Three Months Ended December 31, 2018
|
Three Months Ended September 30, 2018
|
Three Months Ended December 31, 2017
|
||||||||||
|
Diluted Earnings (Loss) Per Share Attributable to Shareholders
|
$
|
0.78
|
|
$
|
1.37
|
|
$
|
3.50
|
|
|||
|
Less - Discontinued operations (gain) loss per share
|
—
|
|
—
|
|
0.02
|
|
||||||
|
Diluted Earnings (Loss) Per Share from Continuing Operations
|
0.78
|
|
1.37
|
|
3.52
|
|
||||||
|
Add back - Non-operating pension expense (income) per share
|
1.05
|
|
0.06
|
|
0.92
|
|
||||||
|
Add back - Net special items expense (income) per share
|
(0.04
|
)
|
0.34
|
|
0.25
|
|
||||||
|
Income tax effect per share - Non-operating pension and special items expense
|
(0.14
|
)
|
(0.21
|
)
|
(3.42
|
)
|
||||||
|
Adjusted Operating Earnings (Loss) Per Share Attributable to Shareholders
|
$
|
1.65
|
|
$
|
1.56
|
|
$
|
1.27
|
|
|||
18
Free Cash Flow is a non-GAAP measure and the most directly comparable GAAP measure is cash provided by operations. Management believes that free cash flow is useful to investors as a liquidity measure because it measures the amount of cash generated that is available, after reinvesting in the business, to maintain a strong balance sheet, pay dividends, repurchase stock, service debt and make investments for future growth. It should not be inferred that the entire free cash flow amount is available for discretionary expenditures. By adjusting for certain items that are not indicative of the Company's ongoing performance, free cash flow also enables investors to perform meaningful comparisons between past and present periods.
The Company generated Free Cash Flow of approximately
$1.7 billion
,
$2.0 billion
and
$1.9 billion
in
2018
,
2017
and
2016
, respectively. The following are reconciliations of free cash flow to cash provided by operations:
|
In millions
|
2018
|
2017
|
2016
|
||||||
|
Cash provided by operations
|
$
|
3,226
|
|
$
|
1,757
|
|
$
|
2,478
|
|
|
Adjustments:
|
|||||||||
|
Cash invested in capital projects
|
(1,572
|
)
|
(1,391
|
)
|
(1,348
|
)
|
|||
|
Cash contribution to pension plan
|
—
|
|
1,250
|
|
750
|
|
|||
|
Cash payment for Kleen Settlement
|
—
|
|
354
|
|
—
|
|
|||
|
Free Cash Flow
|
$
|
1,654
|
|
$
|
1,970
|
|
$
|
1,880
|
|
|
In millions
|
Three Months Ended December 31, 2018
|
Three Months Ended September 30, 2018
|
Three Months Ended December 31, 2017
|
||||||
|
Cash provided by operations
|
$
|
821
|
|
$
|
941
|
|
$
|
1,188
|
|
|
Adjustments:
|
|||||||||
|
Cash invested in capital projects
|
(286
|
)
|
(357
|
)
|
(456
|
)
|
|||
|
Free Cash Flow
|
$
|
535
|
|
$
|
584
|
|
$
|
732
|
|
Results of Operations
Business Segment Operating Profits are used by International Paper’s management to measure the earnings performance of its businesses. Management uses this measure to focus on on-going operations and believes that it is useful to investors because it enables them to perform meaningful comparisons of past and present operating results. International Paper believes that using this information, along with net earnings, provides a more complete analysis of the results of operations by year. Business Segment Operating Profits are defined as earnings (loss) from continuing operations before income taxes and equity earnings, but including
the impact of equity earnings and noncontrolling interests, excluding interest expense, net, corporate items, net, corporate special items, net, and non-operating pension expense. Business Segment Operating Profits are defined by the Securities and Exchange Commission as a non-GAAP financial measure, and are not GAAP alternatives to net income or any other operating measure prescribed by accounting principles generally accepted in the United States.
International Paper operates in three segments: Industrial Packaging, Global Cellulose Fibers and Printing Papers.
The following table presents a reconciliation of net earnings (loss) from continuing operations attributable to International Paper Company to its total Business Segment Operating Profit:
|
In millions
|
2018
|
2017
|
2016
|
||||||
|
Net Earnings (Loss) From Continuing Operations Attributable to International Paper Company
|
$
|
1,667
|
|
$
|
2,110
|
|
$
|
802
|
|
|
Add back (deduct)
|
|||||||||
|
Income tax provision (benefit)
|
445
|
|
(1,085
|
)
|
193
|
|
|||
|
Equity (earnings) loss, net of taxes
|
(336
|
)
|
(177
|
)
|
(198
|
)
|
|||
|
Noncontrolling interests, net of taxes
|
5
|
|
—
|
|
(2
|
)
|
|||
|
Earnings (Loss) From Continuing Operations Before Income Taxes and Equity Earnings
|
1,781
|
|
848
|
|
795
|
|
|||
|
Interest expense, net
|
536
|
|
572
|
|
520
|
|
|||
|
Noncontrolling interests/equity earnings included in operations
|
(10
|
)
|
(2
|
)
|
1
|
|
|||
|
Corporate items, net
|
67
|
|
91
|
|
121
|
|
|||
|
Corporate special items, net (income) expense
|
9
|
|
76
|
|
55
|
|
|||
|
Non-operating pension expense
|
494
|
|
484
|
|
610
|
|
|||
|
$
|
2,877
|
|
$
|
2,069
|
|
$
|
2,102
|
|
|
|
Business Segment Operating Profit
|
|||||||||
|
Industrial Packaging
|
$
|
2,093
|
|
$
|
1,547
|
|
$
|
1,741
|
|
|
Global Cellulose Fibers
|
251
|
|
65
|
|
(179
|
)
|
|||
|
Printing Papers
|
533
|
|
457
|
|
540
|
|
|||
|
Business Segment Operating Profit
|
$
|
2,877
|
|
$
|
2,069
|
|
$
|
2,102
|
|
Business Segment Operating Profits in
2018
included a net loss from special items of $205 million compared with $425 million in
2017
and $127 million in
2016
.
Operationally, compared with 2017, the benefits from higher average sales price realizations and mix ($1.3 billion) and higher sales volumes ($13 million) were partially offset by higher input costs ($180 million), higher maintenance outage costs ($122 million) and higher operating costs ($472 million).
Corporate items, net, includes operating profits (losses) of previously divested businesses of $0 million in both 2018 and 2017 and $(2) million in 2016.
19
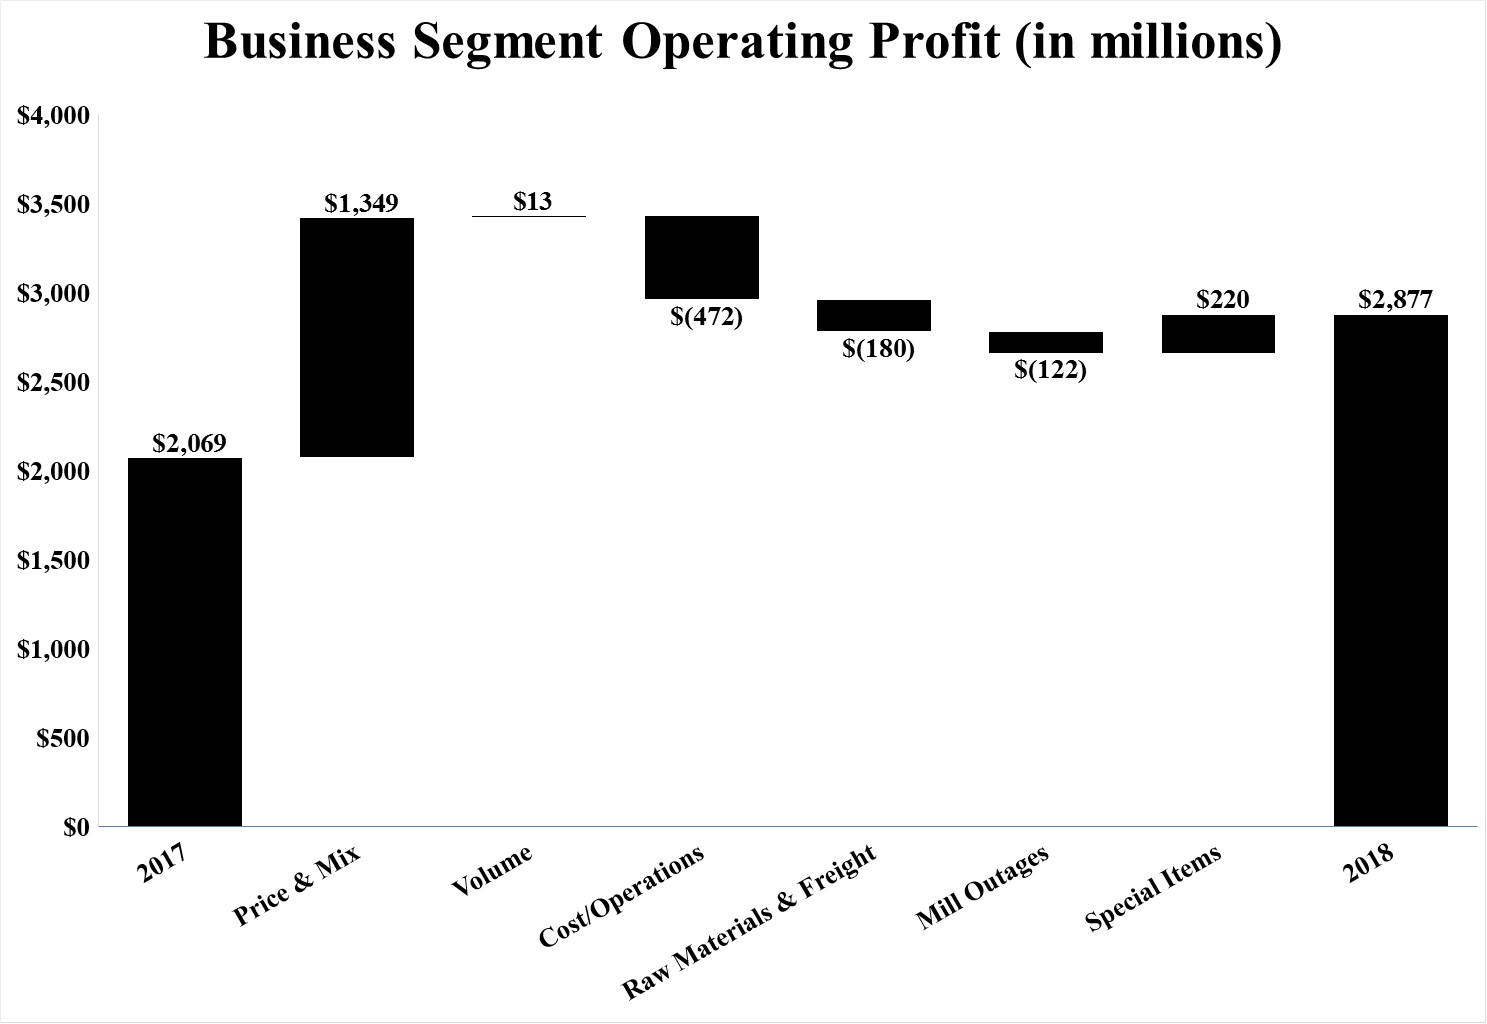
The principal changes in operating profit by business segment were as follows:
|
•
|
Industrial Packaging’s profits of $2.1 billion were $546 million higher than in 2017 as the benefits of higher average sales price realizations, net of mix, higher sales volumes and lower input costs were partially offset by higher operating costs and higher maintenance outage costs. In addition, operating profits in 2018 included a charge of $122 million related to the impairment of fixed assets and an intangible asset in our Brazil Packaging business, charges of $47 million related to the optimization of our EMEA Packaging business, charges of $20 million for the removal of abandoned property at our mills and income of $5 million related to a litigation settlement recovery. In 2017, operating profits included a charge of $354 million related to the settlement of the Kleen Products anti-trust class action lawsuit, charges of $14 million for the removal of abandoned property at our mills, a charge of $10 million for the accelerated amortization of an intangible asset in Brazil and a gain of $6 million for a net bargain purchase gain associated with the 2016 acquisition of Holmen Paper's newsprint mill in Madrid, Spain.
|
|
•
|
Global Cellulose Fibers' operating profit of $251 million was $186 million favorable versus 2017 as the benefits of higher average sales price realizations and improved mix were partially offset by lower sales volumes, higher input costs, higher maintenance outage costs and higher operating costs. Operating profits in 2018 included a charge of $11 million for the removal of abandoned property at our mills. In 2017, operating earnings included $33 million of costs associated with the acquisition and integration of the pulp business acquired in late 2016 from Weyerhaeuser, a charge of $14 million for the amortization of the remaining inventory fair value adjustment associated with that acquisition and a charge of $4 million for the removal of abandoned property at our mills.
|
|
•
|
Printing Papers’ profits of $533 million represented a $76 million increase in operating profits from 2017. The benefits from higher average sales price realizations, net of mix, were partially offset by lower sales volumes, higher input costs, higher maintenance outage costs and higher operating costs. Operating profits in 2018 included charges of $9 million associated with the announced conversion of a paper machine at our Riverdale mill to containerboard production and a charge of $1 million for the removal of abandoned property at our mills. Op
erating profits in 2017 included charges of $2 million for the removal of abandoned property at our mills.
|
Liquidity and Capital Resources
For the year ended
December 31, 2018
, International Paper generated
$3.2 billion
of cash flow from operations compared with
$1.8 billion
in
2017
and
$2.5 billion
in
2016
. Cash flow from operations included
$1.25 billion
and
$750 million
of cash pension contributions in 2017 and 2016, respectively. Capital spending for
2018
totaled
$1.6 billion
, or
118%
of depreciation and amortization expense. Our liquidity position remains strong, supported by approximately
$2.1 billion
of credit facilities that we believe are adequate to meet future liquidity requirements. Maintaining an investment-grade credit rating for our long-term debt continues to be an important element in our overall financial strategy.
We expect another strong year of cash generation in
2019
, which we will use to maximize shareholder value by strengthening our balance sheet, returning meaningful cash to shareholders through dividends and share repurchases and investing organically to grow future cash generation.
Capital spending for
2019
is planned at
$1.4 billion
, or about
104%
of depreciation and amortization, including approximately
$400 million
of strategic investments.
While the operating results for International Paper’s various business segments are driven by a number of business-specific factors, changes in International Paper’s operating results are closely tied to changes in general economic conditions in North America, Europe, Russia, Latin America, India, North Africa and the Middle East. Factors that impact the demand for our products include industrial non-durable goods production, consumer spending, commercial printing and advertising activity, white-collar employment levels, and movements in currency exchange rates.
Product prices are affected by general economic trends, inventory levels, currency exchange rate movements and worldwide capacity utilization. In addition to these
20
revenue-related factors, net earnings are impacted by various cost drivers, the more significant of which include changes in raw material costs, principally wood, recycled fiber and chemical costs; energy costs; freight costs; mill outage costs; salary and benefits costs, including pensions; and manufacturing conversion costs.
The following is a discussion of International Paper’s results of operations for the year ended
December 31, 2018
, and the major factors affecting these results compared to
2017
and
2016
.
For the year ended
December 31, 2018
, International Paper reported net sales of
$23.3 billion
, compared with
$21.7 billion
in
2017
and
$19.5 billion
in
2016
.
International net sales (including U.S. exports) totaled
$8.8 billion
or
38%
of total sales in
2018
. This compares with international net sales of
$8.4 billion
in
2017
and
$6.9 billion
in
2016
.
Full year
2018
net earnings attributable to International Paper Company totaled
$2.0 billion
(
$4.85
per diluted share), compared with net earnings of
$2.1 billion
(
$5.13
per diluted share) in
2017
and
$904 million
(
$2.18
per diluted share) in
2016
. Amounts in all periods include the results of discontinued operations.
Earnings from continuing operations attributable to International Paper Company after taxes in
2018
, 2017 and 2016 were as follows:
|
In millions
|
2018
|
2017
|
2016
|
|||||||||
|
Earnings from continuing operations attributable to International Paper Company
|
$
|
1,667
|
|
(a)
|
$
|
2,110
|
|
(b)
|
$
|
802
|
|
(c)
|
|
(a)
|
Includes $166 million of net special items charges and $371 million of non-operating pension expense which included a pre-tax charge of $424 million ($318 million after taxes) for a settlement accounting charge associated with an annuity purchase and transfer of pension obligations for approximately 23,000 retirees.
|
|
(b)
|
Includes $952 million of net special items income which included a provisional net tax benefit of $1.2 billion related to the enactment of the Tax Cut and Jobs Act and $298 million of non-operating pension expense which included a pre-tax charge of $376 million ($232 million after taxes) for a settlement accounting charge associated with an annuity purchase and transfer of pension obligations for approximately 45,000 retirees.
|
|
(c)
|
Includes $108 million of net special items charges and $375 million of non-operating pension expense which included a pre-tax charge of $439 million ($270 million after taxes) for a settlement accounting charge associated with payments under a term-vested lump sum buyout.
|
Compared with
2017
, the benefits from higher sales volumes, higher average sales price realizations, net of mix, lower corporate and other costs, lower net interest expense and lower tax expense, were partially offset by higher operating costs, higher input costs and higher maintenance outage costs. In addition,
2018
results
included higher equity earnings, net of taxes, relating to the Company’s investments in Ilim and GPIP.
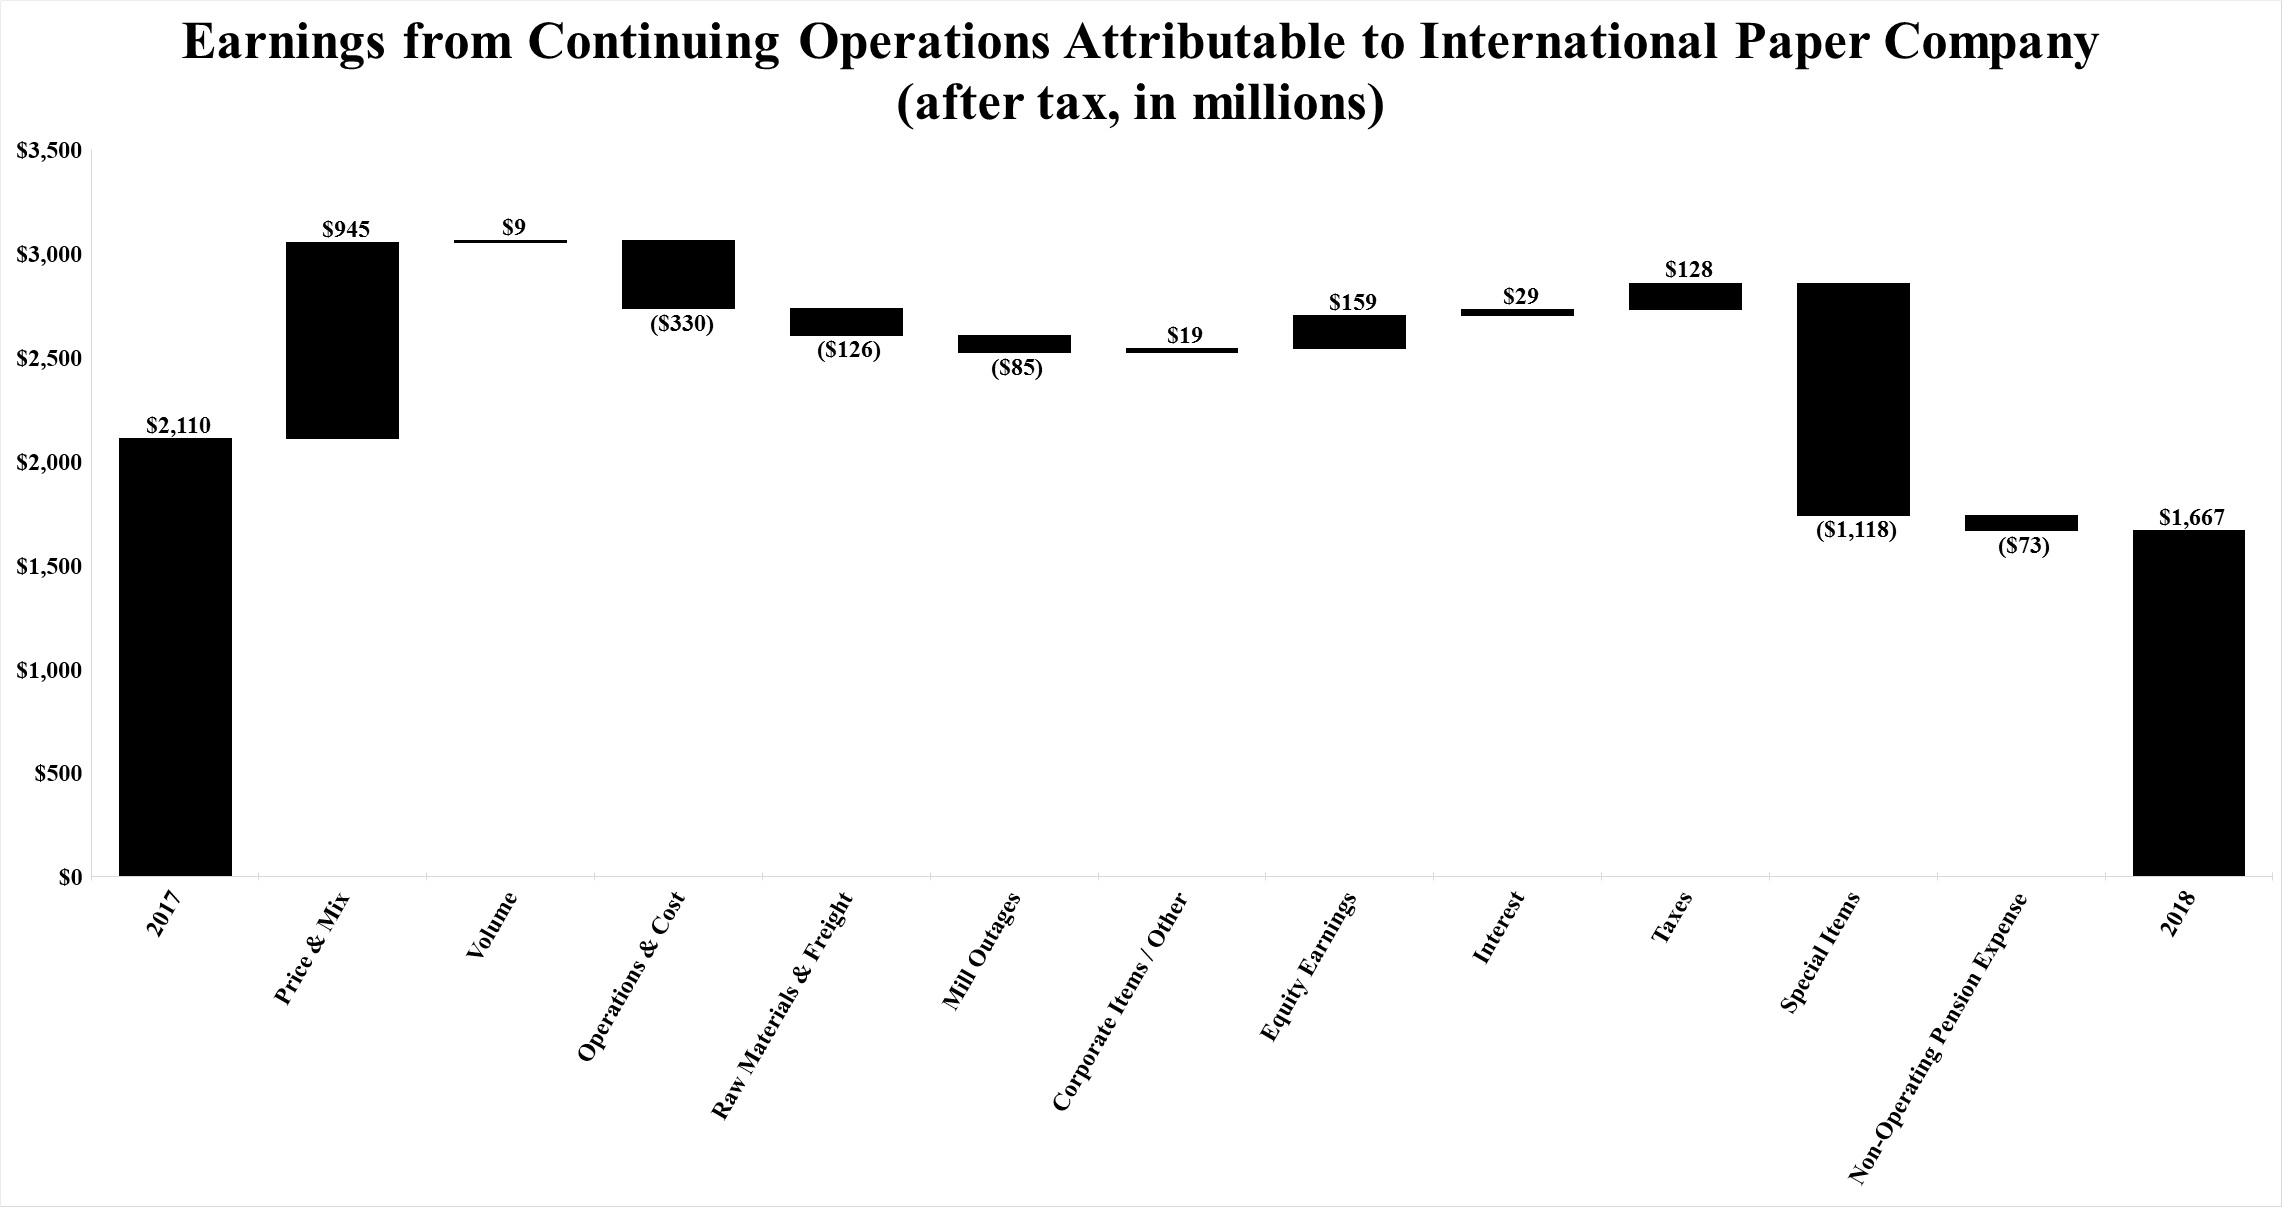
See
Business Segment Results
on pages
24
through
28
for a discussion of the impact of these factors by segment.
Discontinued Operations
2018
:
In 2018, discontinued operations included an after-tax gain of $364 million on the transfer of the North American Consumer Packaging business and after-tax charges of $19 million for costs associated with the transfer.
2017
:
On January 1, 2018, the Company completed the transfer of its North American Consumer Packaging business, which included its North American Coated Paperboard and Foodservice businesses, to a subsidiary of Graphic Packaging Holding Company. International Paper received a 20.5% ownership interest in GPIP, a subsidiary of Graphic Packaging Holding Company, that holds the assets of the combined business. As a result of this transfer, all prior year amounts have been adjusted to reflect the North American Consumer Packaging business as a discontinued operation. See
Note 8 Divestitures and Impairments
on pages
54
and
55
of
Item 8. Financial Statements and Supplementary Data
for further discussion.
Included in discontinued operations were the operating earnings of the North American Consumer Packaging business, an after-tax charge of $10 million for costs associated with the transfer and an after-tax charge of $28 million for non-operating pension expenses related to curtailment charges and termination benefits in connection with this same transaction.
2016
:
In 2016, discontinued operations included the operating earnings of the North American Consumer Packaging business and an after-tax charge of $5 million expense associated with a legal settlement related to the xpedx business.
21
Income Taxes
A net income tax provision of
$445 million
was recorded for
2018
, including a tax benefit of $36 million to revise our 2017 estimated tax related to the enactment of the Tax Cuts and Jobs Act, tax expense of $25 million related to foreign tax audits, tax expense of $19 million related to an international investment restructuring and tax expense of $9 million related to state income tax legislative changes. Excluding these items, a $65 million net tax benefit for other special items and a $123 million tax benefit related to non-operating pension expense, the tax provision was $616 million, or 25% of pre-tax earnings before equity earnings.
A net income tax benefit of
$1.1 billion
was recorded for
2017
, including a provisional net tax benefit of $1.2 billion related to the enactment of the Tax Cuts and Jobs Act, tax benefits of $113 million related to income tax refund claims, tax expense of $9 million related to an international tax law change, tax expense of $34 million related to international investment restructuring and tax expense of $38 million associated with a cash pension contribution. Excluding these items, a $194 million net tax benefit for other special items and a $186 million tax benefit related to non-operating pension expense, the tax provision was $549 million, or 30% of pre-tax earnings before equity earnings.
A net income tax provision of
$193 million
was recorded for
2016
, including tax benefits of $63 million related to legal entity restructurings, tax expense of $31 million associated with a tax rate change in Luxembourg, tax expense of $23 million associated with a $750 million cash pension contribution, and a tax benefit of $14 million related to the closure of a federal tax audit. Excluding these items, a $51 million net tax benefit for other special items and a $235 million tax benefit related to non-operating pension expense, the tax provision was $502 million, or 32% of pre-tax earnings before equity earnings.
Equity Earnings, Net of Taxes
Equity earnings, net of taxes, consisted principally of the Company’s share of earnings from its
50%
investment in Ilim of $290 million, $183 million and $199 million in 2018, 2017 and 2016, respectively, and from its 20.5% ownership interest in GPIP of $46 million in 2018 (see pages
27
and
28
).
Interest Expense and Noncontrolling Interest
Net corporate interest expense totaled
$536 million
in
2018
,
$572 million
in
2017
and
$520 million
in
2016
. Net interest expense in 2017 includes $5 million of interest
income associated with income tax refund claims. The decrease in 2018 compared with 2017 was due to lower average outstanding debt. The increase in 2017 compared with 2016 was due to higher average outstanding debt.
Net earnings attributable to noncontrolling interests were
$5 million
in
2018
, compared with
$0 million
in
2017
and a loss of
$2 million
in
2016
. The increase in 2018 was primarily due to improved earnings in our India Papers business.
Special Items
Restructuring and Other Charges, Net
International Paper continually evaluates its operations for improvement opportunities targeted to (a) focus our portfolio on our core businesses, (b) realign capacity to operate fewer facilities with the same revenue capability and close high cost facilities, and (c) reduce costs.
During
2018
,
2017
and
2016
, pre-tax restructuring and other charges, net totaling
$29 million
,
$67 million
and
$54 million
were recorded. Details of these charges were as follows:
|
Restructuring and Other, Net
|
||||||||||||
|
In millions
|
2018
|
2017
|
2016
|
|||||||||
|
Business Segments
|
||||||||||||
|
EMEA Packaging optimization
|
$
|
47
|
|
(a)
|
$
|
—
|
|
$
|
—
|
|
||
|
Riverdale mill paper machine conversion severance reserve
|
3
|
|
(b)
|
—
|
|
—
|
|
|||||
|
Turkey mill closure
|
—
|
|
—
|
|
7
|
|
(a)
|
|||||
|
50
|
|
—
|
|
7
|
|
|||||||
|
Corporate
|
||||||||||||
|
Early debt extinguishment costs (see Note 15)
|
$
|
10
|
|
$
|
83
|
|
$
|
29
|
|
|||
|
Gain on sale of investment in Liaison Technologies
|
(31
|
)
|
—
|
|
—
|
|
||||||
|
Gain on sale of investment in ArborGen
|
—
|
|
(14
|
)
|
—
|
|
||||||
|
India Packaging business evaluation write-off
|
—
|
|
—
|
|
17
|
|
||||||
|
Gain on sale of investment in Arizona Chemical
|
—
|
|
—
|
|
(8
|
)
|
||||||
|
Riegelwood mill conversion costs net of proceeds from the sale of Carolina Coated Bristols brand
|
—
|
|
—
|
|
9
|
|
||||||
|
Other Items
|
—
|
|
(2
|
)
|
—
|
|
||||||
|
(21
|
)
|
67
|
|
47
|
|
|||||||
|
Total
|
$
|
29
|
|
$
|
67
|
|
$
|
54
|
|
|||
(a) Recorded in the Industrial Packaging business segment.
(b) Recorded in the Printing Papers business segment.
22
Other Corporate Special Items
In addition, other pre-tax corporate special items totaling
$30 million
,
$0 million
and
$8 million
were recorded in
2018
,
2017
and
2016
, respectively. Details of these charges were as follows:
|
Other Corporate Items
|
|||||||||
|
In millions
|
2018
|
2017
|
2016
|
||||||
|
Smurfit-Kappa acquisition proposal costs
|
$
|
12
|
|
$
|
—
|
|
$
|
—
|
|
|
Environmental remediation reserve adjustment
|
9
|
|
—
|
|
—
|
|
|||
|
Legal settlement
|
9
|
|
—
|
|
—
|
|
|||
|
Write-off of certain regulatory pre-engineering costs
|
—
|
|
—
|
|
8
|
|
|||
|
Total
|
$
|
30
|
|
$
|
—
|
|
$
|
8
|
|
Impairments of Goodwill
No goodwill impairment charges were recorded in 2018, 2017 or 2016.
Net Losses on Sales and Impairments of Businesses
Net losses on sales and impairments of businesses included in special items totaled a pre-tax loss of
$122 million
in
2018
related to the impairment of an intangible asset and fixed assets in the Brazil Packaging business, a pre-tax loss of
$9 million
in
2017
related to the write down of the long-lived assets of the Company's Asia foodservice business to fair value and a pre-tax loss of
$70 million
related to severance and the impairment of the IP Asia Packaging business in
2016
. See
Note 8 Divestitures and Impairments
on pages
54
and
55
of
Item 8. Financial Statements and Supplementary Data
for further discussion.
DESCRIPTION OF BUSINESS SEGMENTS
International Paper’s business segments discussed below are consistent with the internal structure used to manage these businesses. All segments are differentiated on a common product, common customer basis consistent with the business segmentation generally used in the forest products industry.
Industrial Packaging
International Paper is the largest manufacturer of containerboard in the United States. Our U.S. production capacity is over 13 million tons annually. Our products include linerboard, medium, whitetop, recycled linerboard, recycled medium and saturating kraft. About 80% of our production is converted into corrugated boxes and other packaging by our 179 North American container plants. Additionally, we recycle approximately
one million tons of OCC and mixed and white paper through our 18 recycling plants. Our container plants are
supported by regional design centers, which offer total packaging solutions and supply chain initiatives. In EMEA, our operations include one recycled fiber containerboard mill in Morocco, a recycled containerboard mill in Spain and 26 container plants in France, Italy, Spain, Morocco and Turkey. In Brazil, our operations include three containerboard mills and four box plants.
International Paper also produces high quality coated paperboard for a variety of packaging end uses with 428,000 tons of annual capacity at our mills in Poland and Russia.
Global Cellulose Fibers
Our cellulose fibers product portfolio includes fluff, market and specialty pulps. International Paper is the largest producer of fluff pulp which is used to make absorbent hygiene products like baby diapers, feminine care, adult incontinence and other non-woven products. Our market pulp is used for tissue and paper products. We continue to invest in exploring new innovative uses for our products, such as our specialty pulps, which are used for non-absorbent end uses including textiles, filtration, construction material, paints and coatings, reinforced plastics and more. Our products are made in the United States, Canada, France, Poland, and Russia and are sold around the world. International Paper facilities have annual dried pulp capacity of about 4 million metric tons.
Printing Papers
International Paper is one of the world’s largest producers of printing and writing papers. The primary product in this segment is uncoated papers. This business produces papers for use in copiers, desktop and laser printers and digital imaging. End-use applications include advertising and promotional materials such as brochures, pamphlets, greeting cards, books, annual reports and direct mail. Uncoated papers also produces a variety of grades that are converted by our customers into envelopes, tablets, business forms and file folders. Uncoated papers are sold under private label and International Paper brand names that include
Hammermill, Springhill, Williamsburg, Postmark, Accent, Great White, Chamex, Ballet
,
Rey, Pol, and Svetocopy
. The mills producing uncoated papers are located in the United States, France, Poland, Russia, Brazil and India. The mills have uncoated paper production capacity of over 4 million tons annually. Brazilian operations function through International Paper do Brasil, Ltda, which owns or manages approximately 329,000 acres of forestlands in Brazil.
23
Ilim
In October 2007, International Paper and Ilim completed a 50:50 joint venture to operate a pulp and paper business located in Russia. Ilim’s facilities include three paper mills located in Bratsk, Ust-Ilimsk, and Koryazhma, Russia, with combined total pulp and paper capacity of over 3.4 million metric tons. Ilim has
exclusive harvesting rights on timberland and forest areas exceeding 18.9 million acres (7.66 million hectares).
GPIP
On January 1, 2018, the Company completed the transfer of its North American Consumer Packaging business, which includes its North American Coated Paperboard and Foodservice businesses, to Graphic Packaging International Partners, LLC (GPIP), a subsidiary of Graphic Packaging Holding Company, in exchange for a
20.5%
ownership interest in GPIP. GPIP subsequently transferred the North American Consumer Packaging business to Graphic Packaging International, LLC (GPI), a wholly-owned subsidiary of GPIP that holds the assets of the combined business.
Products and brand designations appearing in italics are trademarks of International Paper or a related company.
BUSINESS SEGMENT RESULTS
The following tables present net sales and operating profit (loss) which is the Company's measure of segment profitability. The tables include a detail of special items in each year, where applicable, in order to show operating profit before special items.
Industrial Packaging
Demand for Industrial Packaging products is closely correlated with non-durable industrial goods production, as well as with demand for processed foods, poultry, meat and agricultural products. In addition to prices and volumes, major factors affecting the profitability of Industrial Packaging are raw material and energy costs, freight costs, mill outage costs, manufacturing efficiency and product mix.
|
Industrial Packaging
|
|
|
|
||||||
|
In millions
|
2018
|
2017
|
2016
|
||||||
|
Net Sales
|
$
|
15,900
|
|
$
|
15,077
|
|
$
|
14,226
|
|
|
Operating Profit (Loss)
|
$
|
2,093
|
|
$
|
1,547
|
|
$
|
1,741
|
|
|
Brazil Packaging impairment
|
122
|
|
—
|
|
—
|
|
|||
|
EMEA Packaging optimization
|
47
|
|
—
|
|
—
|
|
|||
|
Litigation settlement recovery
|
(5
|
)
|
—
|
|
—
|
|
|||
|
Abandoned property removal
|
20
|
|
14
|
|
—
|
|
|||
|
Kleen Products anti-trust settlement
|
—
|
|
354
|
|
—
|
|
|||
|
Holmen mill bargain purchase gain
|
—
|
|
(6
|
)
|
—
|
|
|||
|
Brazil Packaging wood supply accelerated amortization
|
—
|
|
10
|
|
—
|
|
|||
|
Turkey mill closure
|
—
|
|
—
|
|
7
|
|
|||
|
Asia Packaging restructuring and impairment
|
—
|
|
—
|
|
70
|
|
|||
|
Operating Profit Before Special Items
|
$
|
2,277
|
|
$
|
1,919
|
|
$
|
1,818
|
|
Industrial Packaging
net sales for
2018
increased
5%
to
$15.9 billion
compared with
$15.1 billion
in
2017
, and
12%
compared with
$14.2 billion
in
2016
. Operating profits before special items in
2018
were
19%
higher
than in
2017
and
25%
higher
than in
2016
. Comparing 2018 with 2017, benefits from higher average sales price realizations, net of mix ($712 million), higher sales volumes ($33 million) and lower input costs ($2 million) were partially offset by higher operating costs ($333 million) and higher maintenance outage costs ($56 million).
|
North American Industrial Packaging
|
|||||||||
|
In millions
|
2018
|
2017
|
2016
|
||||||
|
Net Sales (a)
|
$
|
14,187
|
|
$
|
13,329
|
|
$
|
12,450
|
|
|
Operating Profit (Loss)
|
$
|
2,292
|
|
$
|
1,504
|
|
$
|
1,757
|
|
|
Litigation settlement recovery
|
(5
|
)
|
—
|
|
—
|
|
|||
|
Abandoned property removal
|
20
|
|
14
|
|
—
|
|
|||
|
Kleen Products anti-trust settlement
|
—
|
|
354
|
|
—
|
|
|||
|
Operating Profit Before Special Items
|
$
|
2,307
|
|
$
|
1,872
|
|
$
|
1,757
|
|
(a) Includes intra-segment sales of $233 million for 2018, $172 million for 2017 and $143 million for 2016.
24
North American Industrial Packaging's
sales volumes increased in 2018 compared with 2017 reflecting higher box shipments, partially offset by lower shipments of containerboard to both the domestic and export markets. In 2018, the business took about 518,000 tons of maintenance downtime compared with about 416,000 tons of total downtime in 2017, of which about 35,000 were non-maintenance downtime and 381,000 were maintenance downtime. Average sales prices were significantly higher for boxes and for containerboard in export markets. Substantially lower input costs for recycled fiber were partially offset by higher costs for wood, energy, chemicals and freight. Planned maintenance downtime costs were $50 million higher in 2018, than in 2017. Operating costs increased due to inflation, distribution costs and weather-related production constraints in early 2018.
Looking ahead to the first quarter of 2019, compared with the fourth quarter of 2018, sales volumes for boxes are expected to be seasonally lower despite two more shipping days. Shipments of containerboard to export markets are also expected to decline, reflecting slowing market demand in China and EMEA. Based on pricing to date in the current quarter, average sales prices for boxes are expected to be flat, while average sales prices for export containerboard are expected to be lower. Input costs, primarily for wood and energy, are expected to be higher. Planned maintenance downtime spending should be about $102 million higher. Manufacturing operating costs will be negatively impacted by lower volume and inflation, while distribution costs are also expected to increase.
|
EMEA Industrial Packaging
|
|
|
|
||||||
|
In millions
|
2018
|
2017
|
2016
|
||||||
|
Net Sales
|
$
|
1,355
|
|
$
|
1,334
|
|
$
|
1,227
|
|
|
Operating Profit (Loss)
|
$
|
(120
|
)
|
$
|
6
|
|
$
|
15
|
|
|
EMEA Packaging optimization
|
47
|
|
—
|
|
—
|
|
|||
|
Holmen mill net bargain purchase gain
|
—
|
|
(6
|
)
|
—
|
|
|||
|
Turkey mill closure
|
—
|
|
—
|
|
7
|
|
|||
|
Operating Profit Before Special Items
|
$
|
(73
|
)
|
$
|
—
|
|
$
|
22
|
|
EMEA Industrial Packaging's
sales volumes in 2018 were lower than in 2017, reflecting weaker market demand for fruit and vegetable boxes in the Euro-zone and slowing economic conditions in Turkey. Average sales margins decreased slightly, as higher containerboard costs were only partially offset by higher sales prices for boxes. Input costs for energy were flat. Operating costs rose due to inflation and higher costs associated with the new plant in Tangier, Morocco. Earnings were also negatively impacted by the conversion and ramp-up of the Madrid mill.
Entering the first quarter of 2019, compared with the fourth quarter of 2018, sales volumes are expected to be seasonally higher. Average sales margins are expected
to reflect the full realization of box price increases and further board cost reductions. Operating costs will benefit from the continued integration of our Madrid mill. Earnings are expected to be favorably impacted by the increased production volumes of recycled containerboard at the Madrid mill.
|
Brazilian Industrial Packaging
|
|
|
|
||||||
|
In millions
|
2018
|
2017
|
2016
|
||||||
|
Net Sales
|
$
|
232
|
|
$
|
251
|
|
$
|
232
|
|
|
Operating Profit (Loss)
|
$
|
(151
|
)
|
$
|
(35
|
)
|
$
|
(43
|
)
|
|
Brazil Packaging impairment
|
122
|
|
—
|
|
—
|
|
|||
|
Brazil Packaging wood supply accelerated amortization
|
—
|
|
10
|
|
—
|
|
|||
|
Operating Profit Before Special Items
|
$
|
(29
|
)
|
$
|
(25
|
)
|
$
|
(43
|
)
|
Brazilian Industrial Packaging's
sales volumes in 2018 increased,
compared with 2017 for boxes, but this was offset by decreased containerboard shipments. Average sales margins improved reflecting higher sales prices, partially offset by an unfavorable mix. Input costs increased, primarily for recycled fiber, utilities and chemicals. Operating costs were negatively impacted by inflation, but benefited from lower overhead costs. Planned maintenance downtime costs were $1 million lower in 2018, compared with 2017. In addition, a nationwide truckers' strike during the second quarter negatively impacted operating profit by approximately $3 million.
Looking ahead to the first quarter of 2019, compared with the fourth quarter of 2018, sales volumes are expected to be higher, primarily for containerboard. Based on pricing to date in the current quarter, average sales margins are expected to improve. Input costs are expected to be lower for recycled fiber and freight, and operating costs will also be lower. In late 2018, the Company announced that it was exploring strategic options for its Brazil Packaging business.
|
European Coated Paperboard
|
|
|
|
||||||
|
In millions
|
2018
|
2017
|
2016
|
||||||
|
Net Sales
|
$
|
359
|
|
$
|
335
|
|
$
|
327
|
|
|
Operating Profit (Loss)
|
$
|
72
|
|
$
|
72
|
|
$
|
93
|
|
European Coated Paperboard's
sales volumes in 2018 compared with 2017, decreased in Europe, but were partially offset by an increase in Russia. Average sales margins were higher in both Russia and Europe, reflecting higher average sales prices and a more favorable mix. Input costs were higher mainly for wood and energy in both regions. Planned maintenance downtime costs were $6 million higher in 2018 than in 2017, primarily at the Kwidzyn mill.
Looking forward to the first quarter of 2019, compared with the fourth quarter of 2018, sales volumes are expected to be stable in both Europe and Russia.
25
Average sales margins are expected to be higher in Europe due to a more favorable mix. In Russia, average sales margins should be stable. Input costs are expected to be lower for purchased pulp, wood and energy. Maintenance outage costs should be flat due to no outages in the fourth quarter and no planned outages in the first quarter.
|
Asian Industrial Packaging
|
|
|
|
||||||
|
In millions
|
2018
|
2017
|
2016
|
||||||
|
Net Sales
|
$
|
—
|
|
$
|
—
|
|
$
|
133
|
|
|
Operating Profit (Loss)
|
$
|
—
|
|
$
|
—
|
|
$
|
(81
|
)
|
|
Asia Packaging restructuring and impairment
|
—
|
|
—
|
|
70
|
|
|||
|
Operating Profit Before Special Items
|
$
|
—
|
|
$
|
—
|
|
$
|
(11
|
)
|
On June 30, 2016, the Company completed the sale of its corrugated packaging business in China and Southeast Asia to Xiamen Bridge Hexing Equity Investment Partnership Enterprise. See
Note 8 Divestitures and Impairments
on pages
54
and
55
of
Item 8. Financial Statements and Supplementary Data
for further discussion of the sale of this business.
Global Cellulose Fibers
Demand for Cellulose Fibers products is closely correlated with changes in demand for absorbent hygiene products and is further affected by changes in currency rates that can benefit or hurt producers in different geographic regions. Principal cost drivers include manufacturing efficiency, raw material and energy costs, mill outage costs, and freight costs.
|
Global Cellulose Fibers
|
|
|
|
||||||
|
In millions
|
2018
|
2017
|
2016
|
||||||
|
Net Sales
|
$
|
2,819
|
|
$
|
2,551
|
|
$
|
1,092
|
|
|
Operating Profit (Loss)
|
$
|
251
|
|
$
|
65
|
|
$
|
(179
|
)
|
|
Acquisition and integration costs
|
—
|
|
33
|
|
31
|
|
|||
|
Abandoned property removal
|
11
|
|
4
|
|
—
|
|
|||
|
Inventory fair value step-up amortization
|
—
|
|
14
|
|
19
|
|
|||
|
Operating Profit Before Special Items
|
$
|
262
|
|
$
|
116
|
|
$
|
(129
|
)
|
Global Cellulose Fibers
results include the net sales and operating profit associated with the pulp business acquired from Weyerhaeuser, from the date of acquisition on December 1, 2016. See
Note 7 Acquisitions and Joint Ventures
on pages
52
through
54
of
Item 8. Financial Statements and Supplementary Data
for additional information about the acquisition.
Net sales for
2018
increased
to
$2.8 billion
, compared with
$2.6 billion
in
2017
and
$1.1 billion
in
2016
. Operating profits before special items in
2018
were significantly higher than in both
2017
and
2016
. Comparing 2018 with 2017, benefits from higher average sales price realizations and mix ($328 million) were
partially offset by lower sales volumes ($3 million), higher input costs ($41 million), higher planned maintenance downtime costs ($41 million) and higher operating costs ($97 million).
Sales volumes in 2018 were about flat with 2017. Sales prices increased across all product lines. Average sales margins also benefited from a favorable product mix reflecting an increase in sales of absorbent pulp. Input costs were higher, primarily for wood and chemicals. Planned maintenance downtime costs were $31 million higher in 2018. Operating costs increased due to higher distribution and inventory valuation costs. Hurricane Florence negatively impacted earnings by $38 million, net of insurance proceeds. In Europe and Russia, average sales prices increased significantly. Input costs were higher for wood, energy and chemicals. Planned maintenance downtime costs were $10 million higher in 2018 than in 2017, primarily at the Saillat mill.
Entering the first quarter of 2019, sales volumes will be lower due to production constraints resulting from planned maintenance outages, softer market demand in developing markets and customer destocking, as well as a temporary setback in fluff pulp volume resulting from poor execution of a mix improvement plan. Based on pricing to date in the current quarter, average sales prices are expected to decrease particularly fo softwood pulp in China. Input costs are expected to decrease for chemicals. Planned maintenance downtime costs should be $20 million higher than in the fourth quarter of 2018. Manufacturing operating costs are expected to rise due to lower volume, seasonality and inflation. In Eu
rope and Russia, sales volumes are expected to be lower, while sales margins should be stable.
Printing Papers
Demand for Printing Papers products is closely correlated with changes in commercial printing and advertising activity, direct mail volumes and, for uncoated cut-size products, with changes in white-collar employment levels that affect the usage of copy and laser printer paper. Principal cost drivers include manufacturing efficiency, raw material and energy costs, mill outage costs and freight costs.
|
Printing Papers
|
|
|
|
||||||
|
In millions
|
2018
|
2017
|
2016
|
||||||
|
Net Sales
|
$
|
4,375
|
|
$
|
4,157
|
|
$
|
4,058
|
|
|
Operating Profit (Loss)
|
$
|
533
|
|
$
|
457
|
|
$
|
540
|
|
|
Riverdale mill conversion
|
9
|
|
—
|
|
—
|
|
|||
|
Abandoned property removal
|
1
|
|
2
|
|
—
|
|
|||
|
Operating Profit Before Special Items
|
$
|
543
|
|
$
|
459
|
|
$
|
540
|
|
Printing Papers
net sales for
2018
of
$4.4 billion
increased
5%
, compared with
$4.2 billion
in
2017
, and
8%
,
compared with
$4.1 billion
in
2016
. Operating profits before special items in
2018
were
18%
higher
than in
26
2017
and
1%
higher
than in
2016
. Comparing 2018 with 2017, benefits from higher average sales price realizations, net of mix ($309 million), were partially offset by lower sales volumes ($17 million), higher input costs ($141 million), higher planned maintenance downtime costs ($25 million) and higher operating costs ($42 million).
|
North American Printing Papers
|
|
|
|
||||||
|
In millions
|
2018
|
2017
|
2016
|
||||||
|
Net Sales
|
$
|
1,956
|
|
$
|
1,833
|
|
$
|
1,890
|
|
|
Operating Profit (Loss)
|
$
|
160
|
|
$
|
132
|
|
$
|
236
|
|
|
Riverdale mill conversion
|
9
|
|
—
|
|
—
|
|
|||
|
Abandoned property removal
|
1
|
|
2
|
|
—
|
|
|||
|
Operating Profit Before Special Items
|
$
|
170
|
|
$
|
134
|
|
$
|
236
|
|
North American Printing Papers'
sales volumes for 2018 were lower than in 2017, primarily due to lower sales to export markets. Average sales margins improved due to sales price increases for both cutsize paper and rolls, net of an unfavorable mix. Input costs were higher for wood and chemicals. Planned maintenance downtime costs were $1 million higher in 2018. Operating costs were higher primarily due to inflation and distribution costs, and included $5 million, net of insurance recoveries, related to Hurricane Florence.
Entering the first quarter of 2019, sales volumes are expected to be lower due to capacity constraints resulting from planned maintenance outages. Average sales margins should be steady, reflecting the full-quarter impact of late-2018 sales price increases. Operating costs are expected to be higher due to seasonality and inflation. Input costs should be higher, primarily for wood and chemicals. Planned maintenance downtime costs will increase by about $3 million in the 2019 first quarter.
|
Brazilian Papers
|
|
|
|
||||||
|
In millions
|
2018
|
2017
|
2016
|
||||||
|
Net Sales (a)
|
$
|
978
|
|
$
|
972
|
|
$
|
897
|
|
|
Operating Profit (Loss)
|
$
|
227
|
|
$
|
194
|
|
$
|
173
|
|
(a) Includes intra-segment sales of $13 million for 2018, $24 million for 2017 and $5 million for 2016.
Brazilian Papers'
sales volumes for uncoated freesheet paper in 2018, were lower compared with 2017 in both the domestic and export markets. Average domestic and export sales prices were higher due to the realization of multiple price increases implemented in 2018. Raw material costs increased for pulp, chemicals and energy. Operating costs were negatively impacted by inflation and a nationwide truckers' strike in the second quarter. Planned maintenance downtime costs were $4 million higher in 2018.
Looking ahead to 2019, compared with the fourth quarter of 2018, sales volumes for uncoated freesheet paper in
the first quarter are expected to be seasonally weaker in
the domestic market. Average sales margins are expected to decrease as price pressures in the Latin American export markets and an unfavorable mix more than offset the partial realization of announced domestic sales price increases. Input costs are expected to be stable. Maintenance outage costs should be flat due to no outages in the fourth quarter and no planned outages in the first quarter.
|
European Papers
|
|
|
|
||||||
|
In millions
|
2018
|
2017
|
2016
|
||||||
|
Net Sales
|
$
|
1,252
|
|
$
|
1,187
|
|
$
|
1,109
|
|
|
Operating Profit (Loss)
|
$
|
129
|
|
$
|
136
|
|
$
|
142
|
|
European Papers'
sales volumes for uncoated freesheet paper in 2018 were higher in Russia, but lower in Europe compared with 2017. Average sales prices increased for uncoated freesheet paper in both regions following price increases implemented in late 2017, and throughout 2018. Input costs were higher for wood, energy, purchased pulp and chemicals. Planned maintenance downtime costs were $20 million higher in 2018, than in 2017, primarily at the Saillat mill.
Entering 2019, sales volumes for uncoated freesheet paper in the first quarter are expected to increase in Europe, but decrease in Russia. Average sales prices are expected to be higher in Europe due to the continued realization of a fourth-quarter 2018 price increase, and higher in Russia. Input costs should be lower in Europe, mainly for wood and energy, but higher in Russia, primarily for wood and chemicals. Maintenance outage costs should be flat due to no outages in the fourth quarter and no planned outages in the first quarter.
|
Indian Papers
|
|
|
|
||||||
|
In millions
|
2018
|
2017
|
2016
|
||||||
|
Net Sales
|
$
|
202
|
|
$
|
189
|
|
$
|
167
|
|
|
Operating Profit (Loss)
|
$
|
17
|
|
$
|
(5
|
)
|
$
|
(11
|
)
|
Indian Papers'
sales volumes in 2018 were higher than in 2017 due to improved paper machine productivity. Average sales prices also increased. Input costs were higher for chemicals and recycled fiber, but were partially offset by lower wood costs. Operating costs were lower in 2018, reflecting improved mill performance efficiencies, while planned maintenance downtime costs were flat compared with 2017.
Looking ahead to the first quarter of 2019, sales volumes are expected to be slightly higher than in the 2018 fourth quarter. Based on pricing to date in the current quarter, average sales prices are expected to be stable.
Equity Earnings, Net of Taxes – Ilim
International Paper accounts for its investment in Ilim , a separate reportable industry segment, using the equity method of accounting.
27
The Company recorded equity earnings, net of taxes, related to Ilim of $290 million in 2018, compared with earnings of $183 million in 2017, and $199 million in 2016. Operating results recorded in 2018 included an after-tax non-cash foreign exchange loss of $82 million, compared with an after-tax foreign exchange gain of $15 million in 2017 and an after-tax foreign exchange gain of $25 million in 2016, primarily on the remeasurement of Ilim's U.S. dollar denominated net debt.
Ilim delivered outstanding performance in 2018, driven largely by higher price realization and strong demand. Sales volumes for the joint venture increased year over year for shipments to China of softwood pulp and linerboard, but were offset by decreased sales of hardwood pulp to China. Sales volumes in the Russian market increased for softwood pulp and hardwood pulp, but decreased for linerboard. Average sales price realizations were significantly higher in 2018 for sales of softwood pulp, hardwood pulp and linerboard to China and other export markets. Average sales price realizations in Russian markets increased year over year for all products. Input costs were higher in 2018, primarily for wood, fuel and chemicals. Distribution costs were negatively impacted by tariffs and inflation. The Company received cash dividends from the joint venture of $128 million in 2018, $133 million in 2017 and $58 million in 2016.
Entering the first quarter of 2019, sales volumes are expected to be lower than in the fourth quarter of 2018, due to the seasonal slowdown in China and fewer trading days. Based on pricing to date in the current quarter, average sales prices are expected to decrease for hardwood pulp, softwood pulp and linerboard to China. Input costs are projected to be relatively flat, while distribution costs are expected to increase.
Equity Earnings - GPIP
International Paper recorded equity earnings of $46 million on its 20.5% ownership position in GPIP in 2018. The Company received cash dividends from the investment of $25 million in 2018.
Overview
A major factor in International Paper’s liquidity and capital resource planning is its generation of operating cash flow, which is highly sensitive to changes in the pricing and demand for our major products. While changes in key cash operating costs, such as energy, raw material, mill outage and transportation costs, do have an effect on operating cash generation, we believe that our focus on pricing and cost controls has improved our cash flow generation over an operating cycle.
Cash uses during
2018
were primarily focused on working capital requirements, capital spending, debt reductions and returning cash to shareholders through dividends and share repurchases under the Company's share repurchase program.
Cash Provided by Operating Activities
Cash provided by operations, including discontinued operations, totaled
$3.2 billion
in
2018
, compared with
$1.8 billion
for
2017
, and
$2.5 billion
for
2016
. Cash used by working capital components (accounts receivable, contract assets and inventory less accounts payable and accrued liabilities, interest payable and other) totaled
$439 million
in
2018
, compared with cash used by working capital components of
$402 million
in
2017
, and cash provided by working capital components of
$71 million
in
2016
.
Investment Activities
Including discontinued operations, investment activities in
2018
increased from
2017
, as 2018 included higher capital spending. In 2016, investment activity included the purchase of Weyerhaeuser's pulp business for
$2.2 billion
in cash, the purchase of the Holmen business for $57 million in cash, net of cash acquired, and proceeds from the sale of the Asia Packaging business of $108 million, net of cash divested. The Company maintains an average capital spending target around depreciation and amortization levels, or modestly above, due to strategic plans over the course of an economic cycle. Capital spending was
$1.6 billion
in
2018
, or
118%
of depreciation and amortization, compared with
$1.4 billion
in
2017
, or
98%
of depreciation and amortization, and
$1.3 billion
, or
110%
of depreciation and amortization in
2016
. Across our segments, capital spending as a percentage of depreciation and amortization ranged from
69.8%
to
132.1%
in
2018
.
The following table shows capital spending for operations by business segment for the years ended
December 31, 2018
,
2017
and
2016
, excluding amounts related to discontinued operations of $111 million in 2017 and $107 million in 2016.
|
In millions
|
2018
|
2017
|
2016
|
||||||
|
Industrial Packaging
|
$
|
1,061
|
|
$
|
836
|
|
$
|
832
|
|
|
Global Cellulose Fibers
|
183
|
|
188
|
|
174
|
|
|||
|
Printing Papers
|
303
|
|
235
|
|
215
|
|
|||
|
Subtotal
|
1,547
|
|
1,259
|
|
1,221
|
|
|||
|
Corporate and other
|
25
|
|
21
|
|
20
|
|
|||
|
Capital Spending
|
$
|
1,572
|
|
$
|
1,280
|
|
$
|
1,241
|
|
Capital expenditures in
2019
are currently expected to be about
$1.4 billion
, or
104%
of depreciation and amortization, including approximately
$400 million
of strategic investments.
28
Acquisitions and Joint Ventures
See
Note 7 Acquisitions and Joint Ventures
on pages
52
through
54
of
Item 8. Financial Statements and Supplementary Data
for a discussion of the Company's acquisitions.
Financing Activities
Amounts related to early debt extinguishment during the years ended
December 31, 2018
,
2017
and
2016
were as follows:
|
In millions
|
2018
|
2017
|
2016
|
||||||
|
Debt reductions (a)
|
$
|
780
|
|
$
|
993
|
|
$
|
266
|
|
|
Pre-tax early debt extinguishment costs (b)
|
10
|
|
83
|
|
29
|
|
|||
|
(a)
|
Reductions related to notes with interest rates ranging from
1.57%
to
9.38%
with original maturities from
2018
to
2032
for the years ended December 31,
2018
,
2017
and
2016
.
|
|
(b)
|
Amounts are included in Restructuring and other charges in the accompanying consolidated statements of operations.
|
2018:
Financing activities during 2018 included debt issuances of
$490 million
and retirements of
$1.0 billion
for a net decrease of
$518 million
.
International Paper utilizes interest rate swaps to change the mix of fixed and variable rate debt and manage interest expense. At December 31, 2018, International Paper had interest rate swaps with a notional amount of
$700 million
and maturities ranging from
2024
to 2026 (see
Note 16 Derivatives and Hedging Activities
on pages
67
through
70
of
Item 8. Financial Statements and Supplementary Data
). During 2018, the inclusion of the offsetting interest income from short-term investments reduced the effective interest rate from
4.8%
to
4.6%
.
In June 2018, the borrowing capacity of the commercial paper program was increased from
$750 million
to
$1.0 billion
. Under the terms of the program, individual maturities on borrowings may vary, but may not exceed one year from the date of issuance. Interest bearing notes may be issued either as fixed notes or floating rate notes. As of
December 31, 2018
, 2017 and 2016, the Company had
$465 million
,
$180 million
and
$165 million
, respectively, outstanding under this program.
Other financing activities during 2018 included the net repurchase of approximately 12.3 million shares of treasury stock, including restricted stock tax withholding. Repurchases of common stock and payments of restricted stock withholding taxes totaled $732 million, including $700 million related to shares repurchased under the Company's share repurchase program. On October 9, 2018, the Company announced an authorization to repurchase $2 billion of the Company's common stock to supplement remaining amounts under prior share repurchase authorizations, bringing total
share repurchase authorizations since 2013 to $5.0 billion. The Company will continue to repurchase such shares in open market repurchase transactions. Under the $5.0 billion share repurchase program, the Company has repurchased 58.0 million shares at an average price of $47.68, for a total of approximately $2.8 billion, as of December 31, 2018.
In October 2018, International Paper announced that the quarterly dividend would be increased from $0.4750 per share to $0.50 per share, effective for the 2018 fourth quarter.
2017:
Financing activities during 2017 included debt issuances of
$1.9 billion
and retirements of
$1.4 billion
for a net increase of
$483 million
.
At December 31, 2017, International Paper had no interest rate swap contracts outstanding. During 2017, the inclusion of the offsetting interest income from short-term investments reduced the effective interest rate from
5.0%
to
4.7%
.
In 2017, International Paper issued
$1.0 billion
of
4.35%
senior unsecured notes with a maturity date in
2048
. The proceeds from this offering, together with a combination of available cash and other borrowings, were used to make a
$1.25 billion
voluntary cash contribution to the Company's pension plan. In December 2017, International Paper received
$660 million
in cash proceeds from a new loan entered into by International Paper as part of the transfer of the North American Consumer Packaging business to a subsidiary of Graphic Packing Holding Company discussed in
Note 8 Divestitures and Impairments
on pages
54
and
55
of
Item 8. Financial Statements and Supplementary Data
). The Company used the cash proceeds, together with available cash, to pay down existing debt of approximately
$900 million
of notes with interest rates ranging from
1.92%
to
9.38%
and original maturities from
2018
to
2021
. Pre-tax early debt retirement costs of
$83 million
related to the debt repayments, including
$82 million
of cash premiums, are included in Restructuring and other charges in the accompanying consolidated statement of operations for the year ended December 31, 2017. The
$660 million
term loan was subsequently assumed by a subsidiary of GPIP from International Paper on January 1, 2018, and was classified as Liabilities held for sale at
December 31, 2017
, in the accompanying consolidated balance sheet.
Other financing activities during 2017 included the net issuance of approximately 1.7 million shares of treasury stock, including restricted stock tax withholding. Payments of restricted stock withholding taxes and repurchases totaled $47 million.
In October 2017, International Paper announced that the quarterly dividend would be increased from $0.4625 per
29
share to $0.4750 per share, effective for the 2017 fourth quarter.
2016:
Financing activities during 2016 included debt issuances of
$3.8 billion
and retirements of
$1.9 billion
for a net increase of
$1.9 billion
.
At December 31, 2016, International Paper had no interest rate swap contracts outstanding. During 2016, the amortization of deferred gains on previously terminated swaps had no impact on the weighted average cost of long-term recourse debt. The inclusion of the offsetting interest income from short-term investments reduced the effective rate from
5.3%
to
4.8%
.
In 2016, International Paper issued
$1.1 billion
of
3.00%
senior unsecured notes with a maturity date in
2027
, and
$1.2 billion
of
4.40%
senior unsecured notes with a maturity date in
2047
, the proceeds from which were primarily used to fund the acquisition of Weyerhaeuser's pulp business. In addition, the Company repaid approximately
$266 million
of notes with an interest rate of
7.95%
and an original maturity of
2018
. Pre-tax early debt retirement costs of
$29 million
related to the debt repayments, including the
$31 million
of cash premiums, are included in restructuring and other charges in the accompanying consolidated statement of operations for the twelve months ended December 31, 2016.
In December 2016, International Paper entered into a new
$1.5 billion
contractually committed credit facility that expires in December 2021, and has a facility fee of
0.15%
payable annually.
Other financing activities during 2016 included the net repurchase of approximately 0.9 million shares of treasury stock, including restricted stock tax withholding. Repurchases of common stock and payments of restricted stock withholding taxes totaled $132 million, including $100 million related to shares repurchased under the Company's share repurchase program.
In October 2016, International Paper announced that the quarterly dividend would be increased from $0.44 per share to $0.46 per share, effective for the 2016 fourth quarter.
Variable Interest Entities
Information concerning variable interest entities is set forth in
Note 14 Variable Interest Entities
on pages
65
and
66
of
Item 8. Financial Statements and Supplementary Data
.
Liquidity and Capital Resources Outlook for
2019
Capital Expenditures and Long-Term Debt
International Paper expects to be able to meet projected capital expenditures, service existing debt and meet working capital and dividend requirements during
2019
with current cash balances and cash from operations. Additionally, the Company has existing credit facilities totaling
$2.1 billion
at December 31, 2018.
The Company will continue to rely upon debt and capital markets for the majority of any necessary long-term funding not provided by operating cash flows. Funding decisions will be guided by our capital structure planning objectives. The primary goals of the Company’s capital structure planning are to maximize financial flexibility and preserve liquidity while reducing interest expense. The majority of International Paper’s debt is accessed through global public capital markets where we have a wide base of investors. The Company was in compliance with all its debt covenants at
December 31, 2018
, and was well below the thresholds stipulated under the covenants as defined in our credit agreements.
Maintaining an investment grade credit rating is an important element of International Paper’s financing strategy. At
December 31, 2018
, the Company held long-term credit ratings of BBB (stable outlook) and Baa2 (stable outlook) by S&P and Moody’s, respectively.
Contractual obligations for future payments under existing debt and lease commitments and purchase obligations at
December 31, 2018
, were as follows:
|
In millions
|
2019
|
2020
|
2021
|
2022
|
2023
|
Thereafter
|
||||||||||||
|
Debt maturities
|
$
|
639
|
|
$
|
83
|
|
$
|
441
|
|
$
|
487
|
|
$
|
348
|
|
$
|
8,656
|
|
|
Lease obligations
|
160
|
|
125
|
|
77
|
|
49
|
|
28
|
|
118
|
|
||||||
|
Purchase obligations (a)
|
3,211
|
|
654
|
|
578
|
|
487
|
|
413
|
|
1,857
|
|
||||||
|
Total (b)
|
$
|
4,010
|
|
$
|
862
|
|
$
|
1,096
|
|
$
|
1,023
|
|
$
|
789
|
|
$
|
10,631
|
|
|
(a)
|
Includes
$1.4 billion
relating to fiber supply agreements entered into at the time of the 2006 Transformation Plan forestland sales and in conjunction with the 2008 acquisition of Weyerhaeuser Company’s Containerboard, Packaging and Recycling business. Also includes
$1.1 billion
relating to fiber supply agreements assumed in conjunction with the 2016 acquisition of Weyerhaeuser's pulp business.
|
|
(b)
|
Not included in the above table due to the uncertainty of the amount and timing of the payment are unrecognized tax benefits of approximately $193 million. Also not included in the above table is $206 million of Deemed Repatriation Transition Tax associated with the 2017 Tax Cuts and Jobs Act which will be settled from 2019 - 2026.
|
We consider the undistributed earnings of our foreign subsidiaries as of
December 31, 2018
, to be permanently reinvested and, accordingly, no U.S. income taxes have been provided thereon (see
Note 12 Income Taxes
on pages
58
through
62
of I
tem 8. Financial Statements and Supplementary Data
). We do not anticipate the need to
30
repatriate funds to the United States to satisfy domestic liquidity needs arising in the ordinary course of business, including liquidity needs associated with our domestic debt service requirements.
Pension Obligations and Funding
At
December 31, 2018
, the projected benefit obligation for the Company’s U.S. defined benefit plans determined under U.S. GAAP was approximately
$1.7 billion
higher than the fair value of plan assets, excluding non-U.S. plans. Approximately $1.5 billion of this amount relates to plans that are subject to minimum funding requirements. Under current IRS funding rules, the calculation of minimum funding requirements differs from the calculation of the present value of plan benefits (the projected benefit obligation) for accounting purposes. In December 2008, the Worker, Retiree and Employer Recovery Act of 2008 (WERA) was passed by the U.S. Congress which provided for pension funding relief and technical corrections. Funding contributions depend on the funding method selected by the Company, and the timing of its implementation, as well as on actual demographic data and the targeted funding level. The Company continually reassesses the amount and timing of any discretionary contributions and elected to make contributions totaling
$1.25 billion
for the year ended December 31, 2017 and $750 million for the year ended December 31, 2016. No voluntary contributions were made in 2018. At this time, we do not expect to have any required contributions to our plans in
2019
, although the Company may elect to make future voluntary contributions. The timing and amount of future contributions, which could be material, will depend on a number of factors, including the actual earnings and changes in values of plan assets and changes in interest rates.
During the fourth quarter of 2018, the Company entered into an agreement with The Prudential Insurance Company of America to purchase a group annuity contract and transfer approximately
$1.6 billion
of International Paper's U.S. qualified pension plan projected benefit obligations, subject to customary closing conditions. The transaction closed on October 2, 2018 and was funded with pension plan assets. Under the transaction, at the end of 2018, Prudential assumed responsibility for pension benefits and annuity administration for approximately
23,000
retirees or their beneficiaries receiving less than
$1,000
in monthly benefit payments from the plan. Settlement accounting rules required a remeasurement of the qualified plan as of October 2, 2018 and the Company recognized a non-cash pension settlement charge of
$424 million
before tax in the fourth quarter of 2018.
During the fourth quarter of 2017, the Company entered into an agreement with The Prudential Insurance Company of America to purchase a group annuity
contract and transfer approximately
$1.3 billion
of International Paper's U.S. qualified pension plan projected benefit obligations. The transaction closed on October 3, 2017 and was funded with pension plan assets. Under the transaction, at the end of 2017, Prudential assumed responsibility for pension benefits and annuity administration for approximately
45,000
retirees or their beneficiaries receiving less than
$450
in monthly benefit payments from the plan. Settlement accounting rules required a remeasurement of the qualified plan as of October 3, 2017 and the Company recognized a non-cash pension settlement charge of
$376 million
before tax in the fourth quarter of 2017. In addition, large payments from the non-qualified pension plan also required a remeasurement as of October 2, 2017 and a non-cash settlement charge of
$7 million
was also recognized in the fourth quarter of 2017.
During the first quarter of 2016, International Paper announced a voluntary, limited-time opportunity for former employees who are participants in the Retirement Plan of International Paper Company (the Pension Plan) to request early payment of their entire Pension Plan benefit in the form of a single lump sum payment. The amount of total payments under this program was approximately $1.2 billion, and were made from Plan trust assets on June 30, 2016. Based on the level of payments made, settlement accounting rules applied and resulted in a plan remeasurement as of the June 30, 2016 payment date. As a result of settlement accounting, the Company recognized a pro-rata portion of the unamortized net actuarial loss, after remeasurement, resulting in a $439 million non-cash charge to the Company's earnings in the second quarter of 2016. Additional payments of $8 million and $9 million were made during the third and fourth quarters, respectively, due to mandatory cash payouts and a small lump sum payout, and the Pension Plan was subsequently remeasured at September 30, 2016 and December 31, 2016. As a result of settlement accounting, the Company recognized non-cash settlement charges of $3 million in both the third and fourth quarters of 2016.
Ilim Shareholder’s Agreement
In October 2007, in connection with the formation of the Ilim joint venture, International Paper entered into a shareholder’s agreement that includes provisions relating to the reconciliation of disputes among the partners. This agreement provides that at any time, either the Company or its partners may commence procedures specified under the deadlock agreement. If these or any other deadlock procedures under the shareholder's agreement are commenced, although it is not obligated to do so, the Company may in certain situations choose to purchase its partners'
50%
interest in Ilim. Any such transaction would be subject to review and approval by Russian and other relevant anti-trust authorities. Based on the provisions of the agreement, the Company
31
estimates that the current purchase price for its partners' 50% interests would be approximately $2.4 billion, which could be satisfied by payment of cash or International Paper common stock, or some combination of the two, at the Company's option. The purchase by the Company of its partners’ 50% interest in Ilim would result in the consolidation of Ilim's financial position and results of operations in all subsequent periods. The parties have informed each other that they have no current intention to commence procedures specified under the deadlock provisions of the shareholder’s agreement.
The preparation of financial statements in conformity with accounting principles generally accepted in the United States requires International Paper to establish accounting policies and to make estimates that affect both the amounts and timing of the recording of assets, liabilities, revenues and expenses. Some of these estimates require judgments about matters that are inherently uncertain.
Accounting policies whose application may have a significant effect on the reported results of operations and financial position of International Paper, and that can require judgments by management that affect their application, include the accounting for contingencies, impairment or disposal of long-lived assets and goodwill, pensions and income taxes. The Company has discussed the selection of critical accounting policies and the effect of significant estimates with the Audit and Finance Committee of the Company’s Board of Directors.
Contingent Liabilities
Accruals for contingent liabilities, including legal, and environmental matters, are recorded when it is probable that a liability has been incurred or an asset impaired and the amount of the loss can be reasonably estimated. Liabilities accrued for legal matters require judgments regarding projected outcomes and range of loss based on historical experience and recommendations of legal counsel. Liabilities for environmental matters require evaluations of relevant environmental regulations and estimates of future remediation alternatives and costs. The Company utilizes its in-house legal and environmental experts to develop estimates of its legal and environmental obligations, supplemented as needed by third-party specialists to analyze its most complex contingent liabilities.
We calculate our workers' compensation reserves based on estimated actuarially calculated development factors. The workers' compensation reserves are reviewed at least quarterly to determine the adequacy of the accruals and related financial statement disclosure. While we believe that our assumptions are appropriate, the ultimate settlement of workers' compensation reserves
may differ significantly from amounts we have accrued in our consolidated financial statements.
Impairment of Long-Lived Assets and Goodwill
An impairment of a long-lived asset exists when the asset’s carrying amount exceeds its fair value, and is recorded when the carrying amount is not recoverable through cash flows from future operations or disposals. A goodwill impairment exists when the carrying amount of goodwill exceeds its fair value. Assessments of possible impairments of long-lived assets and goodwill are made when events or changes in circumstances indicate that the carrying value of the asset may not be recoverable through future operations. Additionally, evaluation for possible impairment of goodwill and intangible asset balances is required annually. The amount and timing of any impairment charges based on these assessments may require the estimation of future cash flows or the fair market value of the related assets based on management’s best estimates of certain key factors, including future selling prices and volumes, operating, raw material, energy and freight costs, and various other projected operating economic factors and other intended uses of the assets. As these key factors change in future periods, the Company will update its impairment analysis to reflect its latest estimates and projections.
ASU 2011-08, "Intangibles - Goodwill and Other," allows entities testing goodwill for impairment the option of performing a qualitative (Step 0) assessment before calculating the fair value of a reporting unit for the goodwill impairment test. If a Step 0 assessment is performed, an entity is no longer required to calculate the fair value of a reporting unit unless the entity determines that, based on that Step 0 assessment, it is more likely than not that its fair value is less than its carrying value.
During 2018, a determination was made that the current carrying value of the long-lived assets of the Brazil Packaging business exceeded their estimated fair value due to a change in the outlook for the business. Management engaged a third party to assist with determining the fair value of the business and the fixed assets. The fair value of the business was calculated using a probability-weighted approach based on discounted future cash flows, market multiples, and transaction multiples and the fair value of the fixed assets was determined using a market approach. As a result, a pre-tax charge of
$122 million
(
$81 million
, net of tax) was recorded related to the impairment of an intangible asset and fixed assets.
The Company performed its annual testing of its reporting units for possible goodwill impairments by applying the qualitative Step 0 analysis to its reporting units as of October 1, 2018. For the current year evaluation, the Company assessed various assumptions, events and circumstances that would have affected the estimated
32
fair value of the reporting units. The results of this assessment indicated that it is not more likely than not that the fair values of the Company's reporting units were less than the carrying values of the reporting units.
In addition, the Company considered whether there were any events or circumstances outside of the annual evaluation that would reduce the fair value of its reporting units below their carrying amounts and necessitate a goodwill impairment evaluation. In consideration of all relevant factors, there were no indicators that would require goodwill impairment subsequent to October 1, 2018.
No goodwill impairment charges were recorded in 2018, 2017 or 2016.
Pension Benefit Obligations
The charges recorded for pension benefit obligations are determined annually in conjunction with International Paper’s consulting actuary, and are dependent upon various assumptions including the expected long-term rate of return on plan assets, discount rates, projected future compensation increases and mortality rates.
The calculations of pension obligations and expenses require decisions about a number of key assumptions that can significantly affect liability and expense amounts, including the expected long-term rate of return on plan assets and the discount rate used to calculate plan liabilities.
Benefit obligations and fair values of plan assets as of
December 31, 2018
, for International Paper’s pension plan were as follows:
|
In millions
|
Benefit
Obligation |
Fair Value of
Plan Assets |
||||
|
U.S. qualified pension
|
$
|
10,124
|
|
$
|
8,735
|
|
|
U.S. nonqualified pension
|
343
|
|
—
|
|
||
|
Non-U.S. pension
|
215
|
|
161
|
|
||
The table below shows assumptions used by International Paper to calculate U.S. pension obligations for the years shown:
|
2018
|
2017
|
2016
|
||||
|
Discount rate
|
4.30
|
%
|
3.60
|
%
|
4.10
|
%
|
|
Rate of compensation increase
|
2.25
|
%
|
3.75
|
%
|
3.75
|
%
|
International Paper determines these actuarial assumptions, after consultation with our actuaries, on December 31 of each year or more frequently if required, to calculate liability information as of that date and pension expense for the following year. The expected long-term rate of return on plan assets is based on projected rates of return for current and planned asset classes in the plan’s investment portfolio. The discount rate assumption was determined based on a hypothetical
settlement portfolio selected from a universe of high quality corporate bonds.
The expected long-term rate of return on U.S. pension plan assets used to determine net periodic cost for the year ended
December 31, 2018
was
7.50%
.
Increasing (decreasing) the expected long-term rate of return on U.S. plan assets by an additional
0.25
% would decrease (increase)
2019
pension expense by approximately
$22 million
, while a (decrease) increase of
0.25
% in the discount rate would (increase) decrease pension expense by approximately
$27 million
.
Actual rates of return earned on U.S. pension plan assets for each of the last 10 years were:
|
Year
|
Return
|
Year
|
Return
|
||
|
2018
|
(3.0
|
)%
|
2013
|
14.1
|
%
|
|
2017
|
19.3
|
%
|
2012
|
14.1
|
%
|
|
2016
|
7.1
|
%
|
2011
|
2.5
|
%
|
|
2015
|
1.3
|
%
|
2010
|
15.1
|
%
|
|
2014
|
6.4
|
%
|
2009
|
23.8
|
%
|
The 2012, 2013 and 2014 returns above represent weighted averages of International Paper and Temple-Inland asset returns. International Paper and Temple-Inland assets were combined in October 2014. The annualized time-weighted rate of return earned on U.S. pension plan assets was
6.0%
and
9.8%
for the past five and ten years, respectively. The following graph shows the growth of a $1,000 investment in International Paper’s U.S. Pension Plan Master Trust. The graph portrays the time-weighted rate of return from 2008 – 2018.
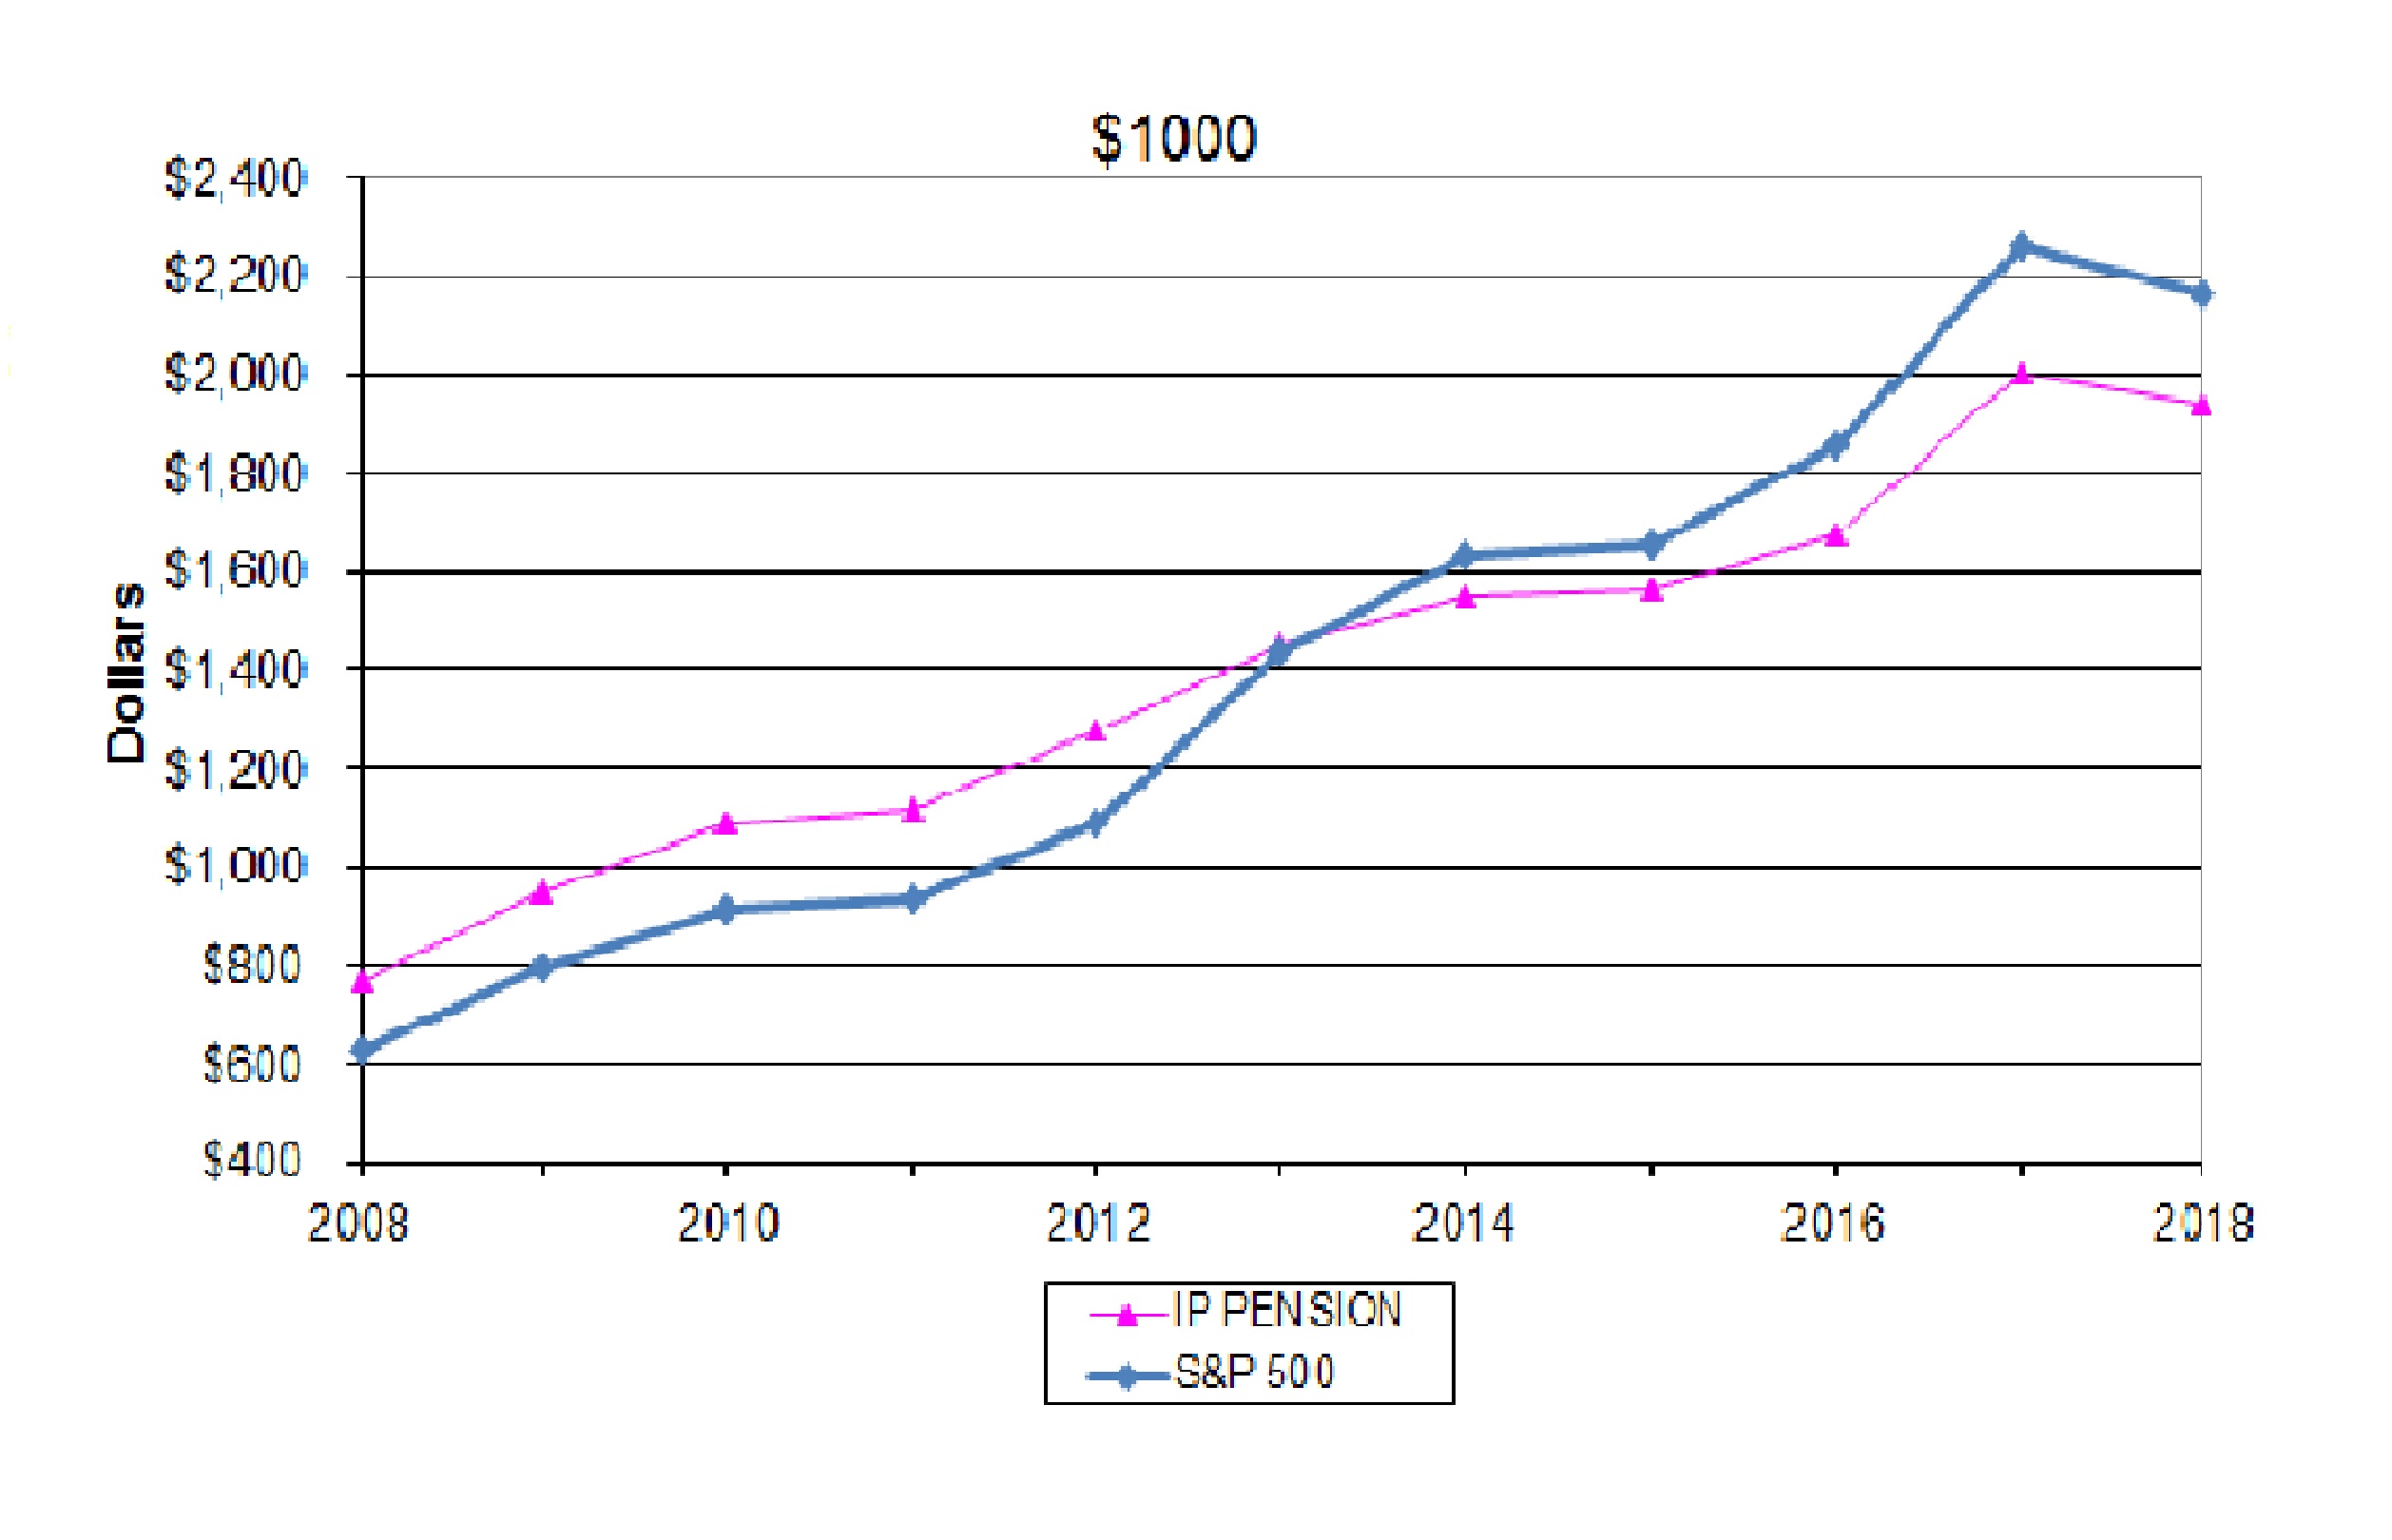
ASC 715, “Compensation – Retirement Benefits,” provides for delayed recognition of actuarial gains and losses, including amounts arising from changes in the estimated projected plan benefit obligation due to changes in the assumed discount rate, differences between the actual and expected return on plan assets, and other assumption changes. These net gains and losses are recognized in pension expense prospectively over a period that approximates the average remaining service period of active employees expected to receive
33
benefits under the plans to the extent that they are not offset by gains and losses in subsequent years.
Net periodic pension plan expenses, calculated for all of International Paper’s plans, were as follows:
|
In millions
|
2018
|
|
2017
|
|
2016
|
|
2015
|
|
2014
|
|
|||||
|
Pension expense
|
|
|
|||||||||||||
|
U.S. plans
|
$
|
632
|
|
$
|
717
|
|
$
|
809
|
|
$
|
461
|
|
$
|
387
|
|
|
Non-U.S. plans
|
4
|
|
5
|
|
4
|
|
6
|
|
—
|
|
|||||
|
Net expense
|
$
|
636
|
|
$
|
722
|
|
$
|
813
|
|
$
|
467
|
|
$
|
387
|
|
The decrease in 2018 pension expense primarily reflects lower interest cost on a lower 2018 projected benefit obligation along with the current year absence of a curtailment loss and special termination benefits associated with the North American Consumer Packaging transaction, partially offset by a higher settlement loss in the current year associated with the October 2018 annuity purchase transaction.
Assuming that discount rates, expected long-term returns on plan assets and rates of future compensation increases remain the same as of December 31,
2018
, projected future net periodic pension plan expenses would be as follows:
|
In millions
|
2020
|
2019
|
||||
|
Pension expense
|
||||||
|
U.S. plans
|
$
|
88
|
|
$
|
103
|
|
|
Non-U.S. plans
|
4
|
|
4
|
|
||
|
Net expense
|
$
|
92
|
|
$
|
107
|
|
The Company estimates that it will record net pension expense of approximately
$103 million
for its U.S. defined benefit plans in
2019
, compared to expense of
$632 million
in
2018
. The 2018 expense includes
$424 million
of settlement accounting charges. Excluding these settlement charges, the estimated decrease in net pension expense in 2019 is primarily due to lower amortization of actuarial losses and lower service cost partially offset by lower asset returns due to the annuity purchase and a decrease in the expected long-term return on asset assumption from 7.50% in 2018 to 7.25% in 2019.
The market value of plan assets for International Paper’s U.S. qualified pension plan at
December 31, 2018
totaled approximately
$8.7 billion
, consisting of approximately
32%
equity securities,
51%
debt securities,
11%
real estate funds and
6%
other assets.
The Company’s funding policy for its qualified pension plans is to contribute amounts sufficient to meet legal funding requirements, plus any additional amounts that the Company may determine to be appropriate considering the funded status of the plan, tax deductibility, the cash flows generated by the Company, and other factors. The Company continually reassesses the amount and timing of any discretionary contributions and
could elect to make voluntary contributions in the future. There are no required contributions to the U.S. qualified plan in 2019. The nonqualified defined benefit plans are funded to the extent of benefit payments, which totaled
$29 million
for the year ended
December 31, 2018
.
Income Taxes
International Paper records its global tax provision based on the respective tax rules and regulations for the jurisdictions in which it operates. Where the Company believes that a tax position is supportable for income tax purposes, the item is included in its income tax returns. Where treatment of a position is uncertain, liabilities are recorded based upon the Company’s evaluation of the “more likely than not” outcome considering technical merits of the position based on specific tax regulations and facts of each matter. Changes to recorded liabilities are only made when an identifiable event occurs that changes the likely outcome, such as settlement with the relevant tax authority, the expiration of statutes of limitation for the subject tax year, change in tax laws, or recent court cases that are relevant to the matter.
Valuation allowances are recorded to reduce deferred tax assets when it is more likely than not that a tax benefit will not be realized. Significant judgment is required in evaluating the need for and magnitude of appropriate valuation allowances against deferred tax assets. The realization of these assets is dependent on generating future taxable income, as well as successful implementation of various tax planning strategies.
While International Paper believes that these judgments and estimates are appropriate and reasonable under the circumstances, actual resolution of these matters may differ from recorded estimated amounts.
See
Note 2 Recent Accounting Developments
on pages
47
and
48
of
Item 8. Financial Statements and Supplementary Data
for a discussion of new accounting pronouncements.
Information concerning the Company’s environmental and legal proceedings is set forth in
Note 13 Commitments and Contingent Liabilities
on pages
62
through
65
of
Item 8. Financial Statements and Supplementary Data
.
While inflationary increases in certain input costs, such as energy, wood fiber and chemical costs, have an impact on the Company’s operating results, changes in general inflation have had minimal impact on our operating results
34
in each of the last three years. Sales prices and volumes are more strongly influenced by economic supply and demand factors in specific markets and by exchange rate fluctuations than by inflationary factors.
International Paper has operations in a number of countries. Its operations in those countries also export to, and compete with, imports from other regions. As such, currency movements can have a number of direct and indirect impacts on the Company’s financial statements. Direct impacts include the translation of international operations’ local currency financial statements into U.S. dollars and the remeasurement impact associated with non-functional currency financial assets and liabilities. Indirect impacts include the change in competitiveness of imports into, and exports out of, the United States (and the impact on local currency pricing of products that are traded internationally). In general, a weaker U.S. dollar and stronger local currency is beneficial to International Paper. The currencies that have the most impact are the Euro, the Brazilian real, the Polish zloty and the Russian ruble.
We use financial instruments, including fixed and variable rate debt, to finance operations, for capital spending programs and for general corporate purposes. Additionally, financial instruments, including various derivative contracts, are used to hedge exposures to interest rate, commodity and foreign currency risks. We do not use financial instruments for trading purposes. Information related to International Paper’s debt obligations is included in
Note 15 Debt and Lines of Credit
on pages
66
and
67
of
Item 8. Financial Statements and Supplementary Data
. A discussion of derivatives and hedging activities is included in
Note 16 Derivatives and Hedging Activities
on pages
67
through
70
of
Item 8. Financial Statements and Supplementary Data
.
The fair value of our debt and financial instruments varies due to changes in market interest and foreign currency rates and commodity prices since the inception of the related instruments. We assess this market risk utilizing a sensitivity analysis. The sensitivity analysis measures the potential loss in earnings, fair values and cash flows based on a hypothetical 10% change (increase and decrease) in interest and currency rates and commodity prices.
Interest Rate Risk
Our exposure to market risk for changes in interest rates relates primarily to short- and long-term debt obligations and investments in marketable securities. We invest in
investment-grade securities of financial institutions and money market mutual funds with a minimum rating of AAA and limit exposure to any one issuer or fund. Our investments in marketable securities at
December 31, 2018
and
2017
are stated at cost, which approximates market due to their short-term nature. Our interest rate risk exposure related to these investments was not material.
We issue fixed and floating rate debt in a proportion that management deems appropriate based on current and projected market conditions. Derivative instruments, such as, interest rate swaps, may be used to execute this strategy. At
December 31, 2018
and
2017
, the fair value of the net liability of financial instruments with exposure to interest rate risk was approximately
$9.2 billion
and
$11.1 billion
, respectively. The potential decline in fair value resulting from a 10% adverse shift in quoted interest rates would have been approximately
$538 million
and
$679 million
at
December 31, 2018
and
2017
, respectively.
Commodity Price Risk
The objective of our commodity exposure management is to minimize volatility in earnings due to large fluctuations in the price of commodities. Commodity swap or forward purchase contracts may be used to manage risks associated with market fluctuations in energy prices.
Foreign Currency Risk
International Paper transacts business in many currencies and is also subject to currency exchange rate risk through investments and businesses owned and operated in foreign countries. Our objective in managing the associated foreign currency risks is to minimize the effect of adverse exchange rate fluctuations on our after-tax cash flows. We address these risks on a limited basis by entering into cross-currency and interest rate swaps, or foreign exchange contracts. At
December 31, 2018
and
2017
, the net fair value of financial instruments with exposure to foreign currency risk was approximately a
$8 million
liability and a
$10 million
asset, respectively.
The potential loss in fair value for such financial instruments from a 10% adverse change in quoted foreign currency exchange rates would have been approximately
$29 million
at both
December 31, 2018
and
2017
.
See the preceding discussion and
Note 16 Derivatives and Hedging Activities
on pages
67
through
70
of
Item 8. Financial Statements and Supplementary Data
.
35
REPORT OF MANAGEMENT ON:
Financial Statements
The management of International Paper Company is responsible for the preparation of the consolidated financial statements in this annual report and for establishing and maintaining adequate internal controls over financial reporting. The consolidated financial statements have been prepared using accounting principles generally accepted in the United States of America considered appropriate in the circumstances to present fairly the Company’s consolidated financial position, results of operations and cash flows on a consistent basis. Management has also prepared the other information in this annual report and is responsible for its accuracy and consistency with the consolidated financial statements.
As can be expected in a complex and dynamic business environment, some financial statement amounts are based on estimates and judgments. Even though estimates and judgments are used, measures have been taken to provide reasonable assurance of the integrity and reliability of the financial information contained in this annual report. We have formed a Disclosure Committee to oversee this process.
The accompanying consolidated financial statements have been audited by the independent registered public accounting firm Deloitte & Touche LLP. During its audits, Deloitte & Touche LLP was given unrestricted access to all financial records and related data, including minutes of all meetings of stockholders and the board of directors and all committees of the board. Management believes that all representations made to the independent auditors during their audits were valid and appropriate.
Internal Control Over Financial Reporting
The management of International Paper Company is also responsible for establishing and maintaining adequate internal control over financial reporting. Internal control over financial reporting is the process designed by, or under the supervision of, our principal executive officer and principal financial officer, and effected by our Board of Directors, management and other personnel to provide reasonable assurance regarding the reliability of financial reporting and the preparation of financial statements for external purposes. All internal control systems have inherent limitations, including the possibility of circumvention and overriding of controls, and therefore can provide only reasonable assurance of achieving the designed control objectives. The Company’s internal control system is supported by written policies and procedures, contains
self-monitoring mechanisms, and is audited by the internal audit function. Appropriate actions are taken by management to correct deficiencies as they are identified.
The Company has assessed the effectiveness of its internal control over financial reporting as of
December 31, 2018
. In making this assessment, it used the criteria described in “Internal Control – Integrated Framework (2013)” issued by the Committee of Sponsoring Organizations of the Treadway Commission (COSO). Based on this assessment, management believes that, as of
December 31, 2018
, the Company’s internal control over financial reporting was effective.
The Company’s independent registered public accounting firm, Deloitte & Touche LLP, has issued its report on the effectiveness of the Company’s internal control over financial reporting. The report appears on pages
38
and
39
.
Internal Control Environment And Board Of Directors Oversight
Our internal control environment includes an enterprise-wide attitude of integrity and control consciousness that establishes a positive “tone at the top.” This is exemplified by our ethics program that includes long-standing principles and policies on ethical business conduct that require employees to maintain the highest ethical and legal standards in the conduct of International Paper business, which have been distributed to all employees; a toll-free telephone helpline whereby any employee may anonymously report suspected violations of law or International Paper’s policy; and an office of ethics and business practice. The internal control system further includes careful selection and training of supervisory and management personnel, appropriate delegation of authority and division of responsibility, dissemination of accounting and business policies throughout International Paper, and an extensive program of internal audits with management follow-up.
The Board of Directors, assisted by the Audit and Finance Committee (Committee), monitors the integrity of the Company’s financial statements and financial reporting procedures, the performance of the Company’s internal audit function and independent auditors, and other matters set forth in its charter. The Committee, which consists of independent directors, meets regularly with representatives of management, and with the independent auditors and the Internal Auditor, with and without management representatives in attendance, to review their activities. The Committee’s Charter takes into account the New York Stock Exchange rules relating to Audit Committees and the SEC rules and regulations promulgated as a result of the Sarbanes-Oxley Act of 2002. The Committee has
36
reviewed and discussed the consolidated financial statements for the year ended
December 31, 2018
, including critical accounting policies and significant management judgments, with management and the independent auditors. The Committee’s report recommending the inclusion of such financial statements in this Annual Report on Form 10-K will be set forth in our Proxy Statement.

MARK S. SUTTON
CHAIRMAN AND CHIEF EXECUTIVE OFFICER

TIMOTHY S. NICHOLLS
SENIOR VICE PRESIDENT AND CHIEF FINANCIAL OFFICER
37
REPORT OF INDEPENDENT REGISTERED PUBLIC ACCOUNTING FIRM
To the Shareholders and Board of Directors of International Paper Company:
Opinion on the Financial Statements
We have audited the accompanying consolidated balance sheets of International Paper Company and subsidiaries (the "Company") as of December 31, 2018 and 2017, the related consolidated statements of operations, comprehensive income, changes in equity, and cash flows for each of the three years in the period ended December 31, 2018, and the related notes (collectively referred to as the "financial statements"). In our opinion, the financial statements present fairly, in all material respects, the financial position of the Company as of December 31, 2018 and 2017, and the results of its operations and its cash flows for each of the three years in the period ended December 31, 2018, in conformity with accounting principles generally accepted in the United States of America.
We have also audited, in accordance with the standards of the Public Company Accounting Oversight Board (United States) (PCAOB), the Company's internal control over financial reporting as of December 31, 2018, based on criteria established in
Internal Control - Integrated Framework (2013)
issued by the Committee of Sponsoring Organizations of the Treadway Commission and our report dated February 20, 2019, expressed an unqualified opinion on the Company's internal control over financial reporting.
Basis for Opinion
These financial statements are the responsibility of the Company's management. Our responsibility is to express an opinion on the Company's financial statements based on our audits. We are a public accounting firm registered with the PCAOB and are required to be independent with respect to the Company in accordance with the U.S. federal securities laws and the applicable rules and regulations of the Securities and Exchange Commission and the PCAOB.
We conducted our audits in accordance with the standards of the PCAOB. Those standards require that we plan and perform the audit to obtain reasonable assurance about whether the financial statements are free of material misstatement, whether due to error or fraud. Our audits included performing procedures to assess the risks of material misstatement of the financial statements, whether due to error or fraud, and performing procedures that respond to those risks. Such procedures included examining, on a test basis, evidence regarding the amounts and disclosures in the financial statements. Our audits also included
evaluating the accounting principles used and significant estimates made by management, as well as evaluating the overall presentation of the financial statements. We believe that our audits provide a reasonable basis for our opinion.
/s/ Deloitte & Touche LLP
Memphis, Tennessee
February 20, 2019
We have served as the Company's auditor since 2002.
To the Shareholders and Board of Directors of International Paper Company:
Opinion on Internal Control over Financial Reporting
We have audited the internal control over financial reporting of International Paper Company and subsidiaries (the “Company”) as of December 31, 2018, based on criteria established in
Internal Control - Integrated Framework (2013)
issued by the Committee of Sponsoring Organizations of the Treadway Commission (COSO). In our opinion, the Company maintained, in all material respects, effective internal control over financial reporting as of December 31, 2018, based on criteria established in
Internal Control - Integrated Framework (2013)
issued by COSO.
We have also audited, in accordance with the standards of the Public Company Accounting Oversight Board (United States) (PCAOB), the consolidated financial statements as of and for the year ended December 31, 2018, of the Company, and our report dated February 20, 2019 expressed an unqualified opinion on those financial statements.
Basis for Opinion
The Company’s management is responsible for maintaining effective internal control over financial reporting and for its assessment of the effectiveness of internal control over financial reporting, included in the accompanying Report of Management on Internal Control over Financial Reporting. Our responsibility is to express an opinion on the Company’s internal control over financial reporting based on our audit. We are a public accounting firm registered with the PCAOB and are required to be independent with respect to the Company in accordance with the U.S. federal securities
38
laws and the applicable rules and regulations of the Securities and Exchange Commission and the PCAOB.
We conducted our audit in accordance with the standards of the PCAOB. Those standards require that we plan and perform the audit to obtain reasonable assurance about whether effective internal control over financial reporting was maintained in all material respects. Our audit included obtaining an understanding of internal control over financial reporting, assessing the risk that a material weakness exists, testing and evaluating the design and operating effectiveness of internal control based on the assessed risk, and performing such other procedures as we considered necessary in the circumstances. We believe that our audit provides a reasonable basis for our opinion.
Definition and Limitations of Internal Control over Financial Reporting
A company’s internal control over financial reporting is a process designed to provide reasonable assurance regarding the reliability of financial reporting and the preparation of financial statements for external purposes in accordance with generally accepted accounting principles. A company’s internal control over financial reporting includes those policies and procedures that (1) pertain to the maintenance of records that, in reasonable detail, accurately and fairly reflect the transactions and dispositions of the assets of the company; (2) provide reasonable assurance that transactions are recorded as necessary to permit preparation of financial statements in accordance with generally accepted accounting principles, and that receipts and expenditures of the company are being made only in accordance with authorizations of management and directors of the company; and (3) provide reasonable assurance regarding prevention or timely detection of unauthorized acquisition, use, or disposition of the company’s assets that could have a material effect on the financial statements.
Because of its inherent limitations, internal control over financial reporting may not prevent or detect misstatements. Also, projections of any evaluation of effectiveness to future periods are subject to the risk that controls may become inadequate because of changes in conditions, or that the degree of compliance with the policies or procedures may deteriorate.
/s/ Deloitte & Touche LLP
Memphis, Tennessee
February 20, 2019
39
|
In millions, except per share amounts, for the years ended December 31
|
2018
|
2017
|
2016
|
||||||
|
NET SALES
|
$
|
23,306
|
|
$
|
21,743
|
|
$
|
19,495
|
|
|
COSTS AND EXPENSES
|
|||||||||
|
Cost of products sold
|
15,555
|
|
14,802
|
|
13,419
|
|
|||
|
Selling and administrative expenses
|
1,723
|
|
1,621
|
|
1,458
|
|
|||
|
Depreciation, amortization and cost of timber harvested
|
1,328
|
|
1,343
|
|
1,124
|
|
|||
|
Distribution expenses
|
1,567
|
|
1,434
|
|
1,237
|
|
|||
|
Taxes other than payroll and income taxes
|
171
|
|
169
|
|
154
|
|
|||
|
Restructuring and other charges, net
|
29
|
|
67
|
|
54
|
|
|||
|
Net (gains) losses on sales and impairments of businesses
|
122
|
|
9
|
|
70
|
|
|||
|
Litigation settlement
|
—
|
|
354
|
|
—
|
|
|||
|
Net bargain purchase gain on acquisition of business
|
—
|
|
(6
|
)
|
—
|
|
|||
|
Interest expense, net
|
536
|
|
572
|
|
520
|
|
|||
|
Non-operating pension expense
|
494
|
|
530
|
|
664
|
|
|||
|
EARNINGS (LOSS) FROM CONTINUING OPERATIONS BEFORE INCOME TAXES AND EQUITY EARNINGS (LOSSES)
|
1,781
|
|
848
|
|
795
|
|
|||
|
Income tax provision (benefit)
|
445
|
|
(1,085
|
)
|
193
|
|
|||
|
Equity earnings (loss), net of taxes
|
336
|
|
177
|
|
198
|
|
|||
|
EARNINGS (LOSS) FROM CONTINUING OPERATIONS
|
1,672
|
|
2,110
|
|
800
|
|
|||
|
Discontinued operations, net of taxes
|
345
|
|
34
|
|
102
|
|
|||
|
NET EARNINGS (LOSS)
|
2,017
|
|
2,144
|
|
902
|
|
|||
|
Less: Net earnings (loss) attributable to noncontrolling interests
|
5
|
|
—
|
|
(2
|
)
|
|||
|
NET EARNINGS (LOSS) ATTRIBUTABLE TO INTERNATIONAL PAPER
COMPANY |
$
|
2,012
|
|
$
|
2,144
|
|
$
|
904
|
|
|
BASIC EARNINGS (LOSS) PER SHARE ATTRIBUTABLE TO INTERNATIONAL PAPER COMPANY COMMON SHAREHOLDERS
|
|||||||||
|
Earnings (loss) from continuing operations
|
$
|
4.07
|
|
$
|
5.11
|
|
$
|
1.95
|
|
|
Discontinued operations, net of taxes
|
0.84
|
|
0.08
|
|
0.25
|
|
|||
|
Net earnings (loss)
|
$
|
4.91
|
|
$
|
5.19
|
|
$
|
2.20
|
|
|
DILUTED EARNINGS (LOSS) PER SHARE ATTRIBUTABLE TO INTERNATIONAL PAPER COMPANY COMMON SHAREHOLDERS
|
|||||||||
|
Earnings (loss) from continuing operations
|
$
|
4.02
|
|
$
|
5.05
|
|
$
|
1.93
|
|
|
Discontinued operations, net of taxes
|
0.83
|
|
0.08
|
|
0.25
|
|
|||
|
Net earnings (loss)
|
$
|
4.85
|
|
$
|
5.13
|
|
$
|
2.18
|
|
|
AMOUNTS ATTRIBUTABLE TO INTERNATIONAL PAPER COMPANY COMMON SHAREHOLDERS
|
|||||||||
|
Earnings (loss) from continuing operations
|
$
|
1,667
|
|
$
|
2,110
|
|
$
|
802
|
|
|
Discontinued operations, net of taxes
|
345
|
|
34
|
|
102
|
|
|||
|
Net earnings (loss)
|
$
|
2,012
|
|
$
|
2,144
|
|
$
|
904
|
|
The accompanying notes are an integral part of these financial statements.
40
|
In millions for the years ended December 31
|
2018
|
2017
|
2016
|
||||||
|
NET EARNINGS (LOSS)
|
$
|
2,017
|
|
$
|
2,144
|
|
$
|
902
|
|
|
OTHER COMPREHENSIVE INCOME (LOSS), NET OF TAX
|
|||||||||
|
Amortization of pension and postretirement prior service costs and net loss:
|
|||||||||
|
U.S. plans (less tax of $196, $280 and $343)
|
588
|
|
486
|
|
545
|
|
|||
|
Non-U.S. plans (less tax of $0, $0 and $0)
|
1
|
|
—
|
|
—
|
|
|||
|
Pension and postretirement liability adjustments:
|
|||||||||
|
U.S. plans (less tax of $6, $69 and $283)
|
18
|
|
56
|
|
(451
|
)
|
|||
|
Non-U.S. plans (less tax of $1, $1 and $4)
|
4
|
|
3
|
|
3
|
|
|||
|
Change in cumulative foreign currency translation adjustment (less tax of $1, $0 and $0)
|
(473
|
)
|
177
|
|
260
|
|
|||
|
Net gains/losses on cash flow hedging derivatives:
|
|||||||||
|
Net gains (losses) arising during the period (less tax of $5, $4 and $3)
|
(10
|
)
|
15
|
|
(6
|
)
|
|||
|
Reclassification adjustment for (gains) losses included in net earnings (less tax of $1, $2 and $3)
|
2
|
|
(7
|
)
|
(7
|
)
|
|||
|
TOTAL OTHER COMPREHENSIVE INCOME (LOSS), NET OF TAX
|
130
|
|
730
|
|
344
|
|
|||
|
Comprehensive Income (Loss)
|
2,147
|
|
2,874
|
|
1,246
|
|
|||
|
Net (Earnings) Loss Attributable to Noncontrolling Interests
|
(5
|
)
|
—
|
|
2
|
|
|||
|
Other Comprehensive (Income) Loss Attributable to Noncontrolling Interests
|
3
|
|
(1
|
)
|
2
|
|
|||
|
COMPREHENSIVE INCOME (LOSS) ATTRIBUTABLE TO INTERNATIONAL PAPER COMPANY
|
$
|
2,145
|
|
$
|
2,873
|
|
$
|
1,250
|
|
The accompanying notes are an integral part of these financial statements.
41
|
In millions, except per share amounts, at December 31
|
2018
|
2017
|
||||
|
ASSETS
|
||||||
|
Current Assets
|
||||||
|
Cash and temporary investments
|
$
|
589
|
|
$
|
1,018
|
|
|
Accounts and notes receivable (less allowances of $81 in 2018 and $73 in 2017)
|
3,521
|
|
3,287
|
|
||
|
Contract assets
|
395
|
|
—
|
|
||
|
Inventories
|
2,241
|
|
2,313
|
|
||
|
Assets held for sale
|
—
|
|
1,377
|
|
||
|
Other current assets
|
250
|
|
282
|
|
||
|
Total Current Assets
|
6,996
|
|
8,277
|
|
||
|
Plants, Properties and Equipment, net
|
13,067
|
|
13,265
|
|
||
|
Forestlands
|
402
|
|
448
|
|
||
|
Investments
|
1,648
|
|
390
|
|
||
|
Financial Assets of Special Purpose Entities (Note 14)
|
7,070
|
|
7,051
|
|
||
|
Goodwill
|
3,374
|
|
3,411
|
|
||
|
Deferred Charges and Other Assets
|
1,019
|
|
1,061
|
|
||
|
TOTAL ASSETS
|
$
|
33,576
|
|
$
|
33,903
|
|
|
LIABILITIES AND EQUITY
|
||||||
|
Current Liabilities
|
||||||
|
Notes payable and current maturities of long-term debt
|
$
|
639
|
|
$
|
311
|
|
|
Accounts payable
|
2,413
|
|
2,458
|
|
||
|
Accrued payroll and benefits
|
535
|
|
485
|
|
||
|
Liabilities held for sale
|
—
|
|
805
|
|
||
|
Other accrued liabilities
|
1,107
|
|
1,043
|
|
||
|
Total Current Liabilities
|
4,694
|
|
5,102
|
|
||
|
Long-Term Debt
|
10,015
|
|
10,846
|
|
||
|
Nonrecourse Financial Liabilities of Special Purpose Entities (Note 14)
|
6,298
|
|
6,291
|
|
||
|
Deferred Income Taxes
|
2,600
|
|
2,291
|
|
||
|
Pension Benefit Obligation
|
1,762
|
|
1,939
|
|
||
|
Postretirement and Postemployment Benefit Obligation
|
264
|
|
326
|
|
||
|
Other Liabilities
|
560
|
|
567
|
|
||
|
Commitments and Contingent Liabilities (Note 13)
|
|
|
||||
|
Equity
|
||||||
|
Common stock $1 par value, 2018 - 448.9 shares & 2017 - 448.9 shares
|
449
|
|
449
|
|
||
|
Paid-in capital
|
6,280
|
|
6,206
|
|
||
|
Retained earnings
|
7,465
|
|
6,180
|
|
||
|
Accumulated other comprehensive loss
|
(4,500
|
)
|
(4,633
|
)
|
||
|
9,694
|
|
8,202
|
|
|||
|
Less: Common stock held in treasury, at cost, 2018 – 48.310 shares and 2017 – 35.975 shares
|
2,332
|
|
1,680
|
|
||
|
Total International Paper Shareholders’ Equity
|
7,362
|
|
6,522
|
|
||
|
Noncontrolling interests
|
21
|
|
19
|
|
||
|
Total Equity
|
7,383
|
|
6,541
|
|
||
|
TOTAL LIABILITIES AND EQUITY
|
$
|
33,576
|
|
$
|
33,903
|
|
The accompanying notes are an integral part of these financial statements.
42
|
In millions for the years ended December 31
|
2018
|
2017
|
2016
|
||||||
|
OPERATING ACTIVITIES
|
|||||||||
|
Net earnings (loss)
|
$
|
2,017
|
|
$
|
2,144
|
|
$
|
902
|
|
|
Depreciation, amortization, and cost of timber harvested
|
1,328
|
|
1,423
|
|
1,227
|
|
|||
|
Deferred income tax provision (benefit), net
|
133
|
|
(1,113
|
)
|
136
|
|
|||
|
Restructuring and other charges, net
|
29
|
|
67
|
|
54
|
|
|||
|
Pension plan contributions
|
—
|
|
(1,250
|
)
|
(750
|
)
|
|||
|
Periodic pension expense, net
|
632
|
|
717
|
|
809
|
|
|||
|
Net gain on transfer of North American Consumer Packaging business
|
(488
|
)
|
—
|
|
—
|
|
|||
|
Net bargain purchase gain on acquisition of business
|
—
|
|
(6
|
)
|
—
|
|
|||
|
Net (gains) losses on sales and impairments of businesses
|
122
|
|
9
|
|
70
|
|
|||
|
Equity method dividends received
|
153
|
|
133
|
|
58
|
|
|||
|
Equity (earnings) losses, net
|
(336
|
)
|
(177
|
)
|
(198
|
)
|
|||
|
Other, net
|
75
|
|
212
|
|
99
|
|
|||
|
Changes in current assets and liabilities
|
|||||||||
|
Accounts and notes receivable
|
(342
|
)
|
(370
|
)
|
(94
|
)
|
|||
|
Contract assets
|
(32
|
)
|
—
|
|
—
|
|
|||
|
Inventories
|
(236
|
)
|
(87
|
)
|
11
|
|
|||
|
Accounts payable and accrued liabilities
|
151
|
|
114
|
|
98
|
|
|||
|
Interest payable
|
(8
|
)
|
1
|
|
41
|
|
|||
|
Other
|
28
|
|
(60
|
)
|
15
|
|
|||
|
CASH PROVIDED BY (USED FOR) OPERATING ACTIVITIES
|
3,226
|
|
1,757
|
|
2,478
|
|
|||
|
INVESTMENT ACTIVITIES
|
|||||||||
|
Invested in capital projects
|
(1,572
|
)
|
(1,391
|
)
|
(1,348
|
)
|
|||
|
Acquisitions, net of cash acquired
|
(8
|
)
|
(45
|
)
|
(2,228
|
)
|
|||
|
Net settlement on transfer of North American Consumer Packaging business
|
(40
|
)
|
—
|
|
—
|
|
|||
|
Proceeds from divestitures, net of cash divested
|
—
|
|
4
|
|
108
|
|
|||
|
Proceeds from sale of fixed assets
|
23
|
|
26
|
|
19
|
|
|||
|
Other
|
28
|
|
15
|
|
(49
|
)
|
|||
|
CASH PROVIDED BY (USED FOR) INVESTMENT ACTIVITIES
|
(1,569
|
)
|
(1,391
|
)
|
(3,498
|
)
|
|||
|
FINANCING ACTIVITIES
|
|||||||||
|
Repurchases of common stock and payments of restricted stock tax withholding
|
(732
|
)
|
(47
|
)
|
(132
|
)
|
|||
|
Issuance of debt
|
490
|
|
1,907
|
|
3,830
|
|
|||
|
Reduction of debt
|
(1,008
|
)
|
(1,424
|
)
|
(1,938
|
)
|
|||
|
Change in book overdrafts
|
(1
|
)
|
26
|
|
—
|
|
|||
|
Dividends paid
|
(789
|
)
|
(769
|
)
|
(733
|
)
|
|||
|
Net debt tender premiums paid
|
(6
|
)
|
(84
|
)
|
(31
|
)
|
|||
|
Other
|
—
|
|
(8
|
)
|
(14
|
)
|
|||
|
CASH PROVIDED BY (USED FOR) FINANCING ACTIVITIES
|
(2,046
|
)
|
(399
|
)
|
982
|
|
|||
|
Effect of Exchange Rate Changes on Cash
|
(40
|
)
|
18
|
|
21
|
|
|||
|
Change in Cash and Temporary Investments
|
(429
|
)
|
(15
|
)
|
(17
|
)
|
|||
|
Cash and Temporary Investments
|
|||||||||
|
Beginning of the period
|
1,018
|
|
1,033
|
|
1,050
|
|
|||
|
End of the period
|
$
|
589
|
|
$
|
1,018
|
|
$
|
1,033
|
|
The accompanying notes are an integral part of these financial statements.
43
CONSOLIDATED STATEMENT OF CHANGES IN EQUITY
|
|
||||||||||||||||||||||||
|
In millions
|
Common Stock Issued
|
Paid-in Capital
|
Retained Earnings
|
Accumulated Other Comprehensive Income (Loss)
|
Treasury Stock
|
Total International Paper Shareholders’ Equity
|
Noncontrolling Interests
|
Total Equity
|
||||||||||||||||
|
BALANCE, JANUARY 1, 2016
|
$
|
449
|
|
$
|
6,243
|
|
$
|
4,649
|
|
$
|
(5,708
|
)
|
$
|
1,749
|
|
$
|
3,884
|
|
$
|
25
|
|
$
|
3,909
|
|
|
Issuance of stock for various plans, net
|
—
|
|
(6
|
)
|
—
|
|
—
|
|
(128
|
)
|
122
|
|
—
|
|
122
|
|
||||||||
|
Repurchase of stock
|
—
|
|
—
|
|
—
|
|
—
|
|
132
|
|
(132
|
)
|
—
|
|
(132
|
)
|
||||||||
|
Dividends
|
—
|
|
—
|
|
(743
|
)
|
—
|
|
—
|
|
(743
|
)
|
—
|
|
(743
|
)
|
||||||||
|
Transactions of equity method investees
|
—
|
|
(48
|
)
|
—
|
|
—
|
|
—
|
|
(48
|
)
|
—
|
|
(48
|
)
|
||||||||
|
Divestiture of noncontrolling interests
|
—
|
|
—
|
|
—
|
|
—
|
|
—
|
|
—
|
|
(3
|
)
|
(3
|
)
|
||||||||
|
Other
|
—
|
|
—
|
|
8
|
|
—
|
|
—
|
|
8
|
|
—
|
|
8
|
|
||||||||
|
Comprehensive income (loss)
|
—
|
|
—
|
|
904
|
|
346
|
|
—
|
|
1,250
|
|
(4
|
)
|
1,246
|
|
||||||||
|
BALANCE, DECEMBER 31, 2016
|
449
|
|
6,189
|
|
4,818
|
|
(5,362
|
)
|
1,753
|
|
4,341
|
|
18
|
|
4,359
|
|
||||||||
|
Issuance of stock for various plans, net
|
—
|
|
42
|
|
—
|
|
—
|
|
(120
|
)
|
162
|
|
—
|
|
162
|
|
||||||||
|
Repurchase of stock
|
—
|
|
—
|
|
—
|
|
—
|
|
47
|
|
(47
|
)
|
—
|
|
(47
|
)
|
||||||||
|
Dividends
|
—
|
|
—
|
|
(782
|
)
|
—
|
|
—
|
|
(782
|
)
|
—
|
|
(782
|
)
|
||||||||
|
Transactions of equity method investees
|
—
|
|
(25
|
)
|
—
|
|
—
|
|
—
|
|
(25
|
)
|
—
|
|
(25
|
)
|
||||||||
|
Comprehensive income (loss)
|
—
|
|
—
|
|
2,144
|
|
729
|
|
—
|
|
2,873
|
|
1
|
|
2,874
|
|
||||||||
|
BALANCE, DECEMBER 31, 2017
|
449
|
|
6,206
|
|
6,180
|
|
(4,633
|
)
|
1,680
|
|
6,522
|
|
19
|
|
6,541
|
|
||||||||
|
Adoption of ASC 606 revenue from contracts with customers
|
—
|
|
—
|
|
73
|
|
—
|
|
—
|
|
73
|
|
—
|
|
73
|
|
||||||||
|
Issuance of stock for various plans, net
|
—
|
|
62
|
|
—
|
|
—
|
|
(80
|
)
|
142
|
|
—
|
|
142
|
|
||||||||
|
Repurchase of stock
|
—
|
|
—
|
|
—
|
|
—
|
|
732
|
|
(732
|
)
|
—
|
|
(732
|
)
|
||||||||
|
Dividends
|
—
|
|
—
|
|
(800
|
)
|
—
|
|
—
|
|
(800
|
)
|
—
|
|
(800
|
)
|
||||||||
|
Transactions of equity method investees
|
—
|
|
12
|
|
—
|
|
—
|
|
—
|
|
12
|
|
—
|
|
12
|
|
||||||||
|
Comprehensive income (loss)
|
—
|
|
—
|
|
2,012
|
|
133
|
|
—
|
|
2,145
|
|
2
|
|
2,147
|
|
||||||||
|
BALANCE, DECEMBER 31, 2018
|
$
|
449
|
|
$
|
6,280
|
|
$
|
7,465
|
|
$
|
(4,500
|
)
|
$
|
2,332
|
|
$
|
7,362
|
|
$
|
21
|
|
$
|
7,383
|
|
The accompanying notes are an integral part of these financial statements.
44
NATURE OF BUSINESS
International Paper (the Company) is a global paper and packaging company with primary markets and manufacturing operations in North America, Europe, Latin America, North Africa, India and Russia. Substantially all of our businesses have experienced, and are likely to continue to experience, cycles relating to available industry capacity and general economic conditions.
FINANCIAL STATEMENTS
These consolidated financial statements have been prepared in conformity with accounting principles generally accepted in the United States that require the use of management’s estimates. Actual results could differ from management’s estimates.
On January 1, 2018, the Company completed the previously announced transfer of its North American Consumer Packaging business, which includes its North American Coated Paperboard and Foodservice businesses, to a subsidiary of Graphic Packaging Holding Company. The Company received a
20.5%
ownership interest in a subsidiary of Graphic Packaging Holding Company that holds the assets of the combined business. See
Note 8
for further discussion.
CONSOLIDATION
The consolidated financial statements include the accounts of International Paper and its wholly-owned, controlled majority-owned and financially controlled subsidiaries. All significant intercompany balances and transactions are eliminated.
EQUITY METHOD INVESTMENTS
The equity method of accounting is applied for investments in affiliated companies when the Company has significant influence over the investee’s operations, or when the investee is structured with separate capital accounts and our investment is considered more than minor, which is the case for our
20.5%
investment in Graphic Packaging International Partners, LLC (GPIP). Our material equity method investments are described in
Note 10
.
DISCONTINUED OPERATIONS
A discontinued operation may include a component or a group of components of the Company's operations. A disposal of a component or a group of components is
reported in discontinued operations if the disposal represents a strategic shift that has or will have a major effect on the Company's operations and financial results when the following occurs: (1) a component (or group of components) meets the criteria to be classified as held for sale; (2) the component or group of components is disposed of by sale; or (3) the component or group of components is disposed of other than by sale (for example, by abandonment or in a distribution to owners in a spinoff).
For any component classified as held for sale or disposed of by sale or other than by sale, qualifying for presentation as a discontinued operation, the Company reports the results of operations of the discontinued operations (including any gain or loss recognized on the disposal or loss recognized on classification as held for sale of a discontinued operation), less applicable income taxes (benefit), as a separate component in the consolidated statement of operations for current and all prior periods presented.
REVENUE RECOGNITION
Generally, the Company recognizes revenue on a point-in-time basis when the customer takes title to the goods and assumes the risks and rewards for the goods. For customized goods where the Company has a legally enforceable right to payment for the goods, the Company recognizes revenue over time, which generally is, as the goods are produced.
The Company’s revenue is primarily derived from fixed consideration; however, we do have contract terms that give rise to variable consideration, primarily cash discounts and volume rebates. International Paper offers early payment discounts to customers across the Company’s businesses. The Company estimates the expected cash discounts and other customer refunds based on the historical experience across the Company’s portfolio of customers to record reductions in revenue which is consistent with the most likely amount method outlined in ASC 606. Management has concluded that this method is the best estimate of the consideration the Company will be entitled to from its customers.
The Company has elected to present all sales taxes on a net basis, account for shipping and handling activities as fulfillment activities, recognize the incremental costs of obtaining a contract as expense when incurred if the amortization period of the asset the Company would recognize is one year or less, and not record interest income or interest expense when the difference in timing of control or transfer and customer payment is one year or less.
TEMPORARY INVESTMENTS
Temporary investments with an original maturity of three months or less are treated as cash equivalents and are stated at cost, which approximates market value.
45
INVENTORIES
Inventories are valued at the lower of cost or market value and include all costs directly associated with manufacturing products: materials, labor and manufacturing overhead. In the United States, costs of raw materials and finished pulp and paper products, are generally determined using the last-in, first-out method. Other inventories are valued using the first-in, first-out or average cost methods.
PLANTS, PROPERTIES AND EQUIPMENT
Plants, properties and equipment are stated at cost, less accumulated depreciation. Expenditures for betterments are capitalized, whereas normal repairs and maintenance are expensed as incurred. The units-of-production method of depreciation is used for pulp and paper mills, and the straight-line method is used for other plants and equipment.
GOODWILL
Annual evaluation for possible goodwill impairment is performed as of the beginning of the fourth quarter of each year, with additional interim evaluation performed when management believes that it is more likely than not, that events or circumstances have occurred that would result in the impairment of a reporting unit’s goodwill.
The Company has the option to evaluate goodwill for impairment by first performing a qualitative (Step 0) assessment of events and circumstances to determine whether it is more likely than not that the fair value of a reporting unit is less than its carrying amount. If, after assessing the totality of events or circumstances, the Company determines that it is not more likely than not that the fair value of a reporting unit is less than its carrying amounts, then the two-step goodwill impairment evaluation is not required to be performed. If the Company determines that it is more likely than not that the fair value of a reporting unit is less than its carrying amount, or if the Company does not elect the option to perform an initial qualitative assessment, the Company is required to perform the traditional two-step goodwill impairment evaluation. In performing this evaluation, the Company estimates the fair value of its reporting units using the expected discounted future cash flows for each reporting unit. Key assumptions in the impairment analysis considered by management include the discount rate, long-term growth rate, tax rate, inflation rate and foreign exchange rates. These estimated fair values are then analyzed for reasonableness by comparing them to historic market transactions for businesses in the industry, and by comparing the sum of the reporting unit fair values and other corporate assets and liabilities divided by diluted common shares outstanding to the Company’s traded stock price on the evaluation date. For reporting units whose recorded value of net assets plus goodwill is
in excess of their estimated fair values, the fair values of the individual assets and liabilities of the respective reporting units are then determined to calculate the amount of any goodwill impairment charge required, if any. See
Note 11
for further discussion.
IMPAIRMENT OF LONG-LIVED ASSETS
Long-lived assets are reviewed for impairment upon the occurrence of events or changes in circumstances that indicate that the carrying value of the assets may not be recoverable. A recoverability test is performed based on undiscounted cash flows, requiring judgments as to whether assets are held and used or held for sale, the weighting of operational alternatives being considered by management and estimates of the amount and timing of expected future cash flows from the use of the long-lived assets generated by their use. Impaired assets are recorded at their estimated fair value. See
Note 8
for further discussion.
INCOME TAXES
International Paper uses the asset and liability method of accounting for income taxes whereby deferred income taxes are recorded for the future tax consequences attributable to differences between the financial statement and tax bases of assets and liabilities. Deferred tax assets and liabilities are measured using enacted tax rates expected to apply to taxable income in the years in which those temporary differences are expected to be recovered or settled. Deferred tax assets and liabilities are remeasured to reflect new tax rates in the periods rate changes are enacted.
International Paper records its worldwide tax provision based on the respective tax rules and regulations for the jurisdictions in which it operates. Where the Company believes that a tax position is supportable for income tax purposes, the item is included in its income tax returns. Where treatment of a position is uncertain, liabilities are recorded based upon the Company’s evaluation of the “more likely than not” outcome considering the technical merits of the position based on specific tax regulations and the facts of each matter. Changes to recorded liabilities are made only when an identifiable event occurs that changes the likely outcome, such as settlement with the relevant tax authority, the expiration of statutes of limitation for the subject tax year, a change in tax laws, or a recent court case that addresses the matter.
While the judgments and estimates made by the Company are based on management’s evaluation of the technical merits of a matter, assisted as necessary by consultation with outside consultants, historical experience and other assumptions that management believes are appropriate and reasonable under current circumstances, actual resolution of these matters may differ from recorded estimated amounts, resulting in
46
adjustments that could materially affect future financial statements.
ENVIRONMENTAL REMEDIATION COSTS
Costs associated with environmental remediation obligations are accrued when such costs are probable and reasonably estimable. Such accruals are adjusted as further information develops or circumstances change. Costs of future expenditures for environmental remediation obligations are discounted to their present value when the amount and timing of expected cash payments are reliably estimable.
TRANSLATION OF FINANCIAL STATEMENTS
Balance sheets of international operations are translated into U.S. dollars at year-end exchange rates, while statements of operations are translated at average rates. Adjustments resulting from financial statement translations are included as cumulative translation adjustments in Accumulated other comprehensive loss.
Other than as described below, no new accounting pronouncement issued or effective during the fiscal year has had or is expected to have a material impact on the consolidated financial statements.
FAIR VALUE MEASUREMENT
In August 2018, the FASB issued ASU 2018-13, "Fair Value Measurement (Topic 820): Disclosure Framework - Changes to the Disclosure Requirements for Fair Value Measurement." The new guidance modifies disclosure requirements related to fair value measurement. This guidance is effective for annual reporting periods beginning after December 15, 2019, and interim periods within those years. Implementation on a prospective or retrospective basis varies by specific disclosure requirement. Early adoption is permitted. The Company early adopted the provisions of this guidance in 2018 with no material impact on the financial statements.
COMPREHENSIVE INCOME
In February 2018, the FASB issued ASU 2018-02, "Income Statement - Reporting Comprehensive Income (Topic 220): Reclassification of Certain Tax Effects from Accumulated Other Comprehensive Income." This guidance gives entities the option to reclassify stranded tax effects caused by the newly-enacted U.S. Tax Cuts and Jobs Act from accumulated other comprehensive income to retained earnings. This guidance is effective for annual reporting periods beginning after December 15, 2018, and interim periods within those years. The Company is finalizing its evaluation of the provisions of this guidance.
RETIREMENT BENEFITS
In August 2018, the FASB issued ASU 2018-14, "Compensation - Retirement Benefits - Defined Benefit Plans - General (Topic 715-20): Disclosure Framework — Changes to the Disclosure Requirements for Defined Benefit Plans." This guidance adds, removes, and clarifies disclosure requirements related to defined benefit pension and other postretirement plans. This guidance is effective for annual reporting periods beginning after December 15, 2020. Early adoption is permitted. This guidance should be applied on a retrospective basis to all periods presented. The Company early adopted the provisions of this guidance in 2018 with no material impact on the financial statements.
The Company adopted the provision of ASU 2017-07, "Compensation - Retirement Benefits (Topic 715): Improving the Presentation of Net Periodic Pension Cost and Net Periodic Postretirement Benefit Cost," on January 1, 2018. Under this new guidance, employers present the service costs component of the net periodic benefit cost in the same income statement line items as other employee compensation costs arising from services rendered during the period. In addition, only the service cost component is eligible for capitalization in assets. Employers present the other components separately from the line items that includes the service cost and outside of any subtotal of operating income. In addition, disclosure of the lines used to present the other components of net periodic benefit cost are required if the components are not presented separately in the income statement. The retrospective adoption had no impact on Net earnings (loss).
INTANGIBLES
In August 2018, the FASB issued ASU 2018-15, "Intangibles - Goodwill and Other - Internal-Use Software (Subtopic 350-40): Customer's Accounting for Implementation Costs Incurred in a Cloud Computing Arrangement That Is a Service Contract." The guidance aligns the requirements for capitalizing implementation costs incurred in a hosting arrangement that is a service contract with the requirements for capitalizing implementation costs incurred to develop or obtain internal-use software (and hosting arrangements that include an internal-use software license). The accounting for the service element of a hosting arrangement that is a service contract is not affected by the amendments in this guidance. This guidance is effective for annual reporting periods beginning after December 15, 2019, and interim periods within those fiscal years. Early adoption is permitted. The Company is currently evaluating the provisions of this guidance.
47
In January 2017, the FASB issued ASU 2017-04, "Intangibles - Goodwill and Other (Topic 350): Simplifying the Test for Goodwill Impairment." This guidance eliminates the requirement to calculate the implied fair value of goodwill under Step 2 of today's goodwill impairment test to measure a goodwill impairment charge. Instead, entities will record an impairment charge based on the excess of a reporting unit's carrying amount over its fair value. This guidance should be applied prospectively and is effective for annual reporting periods beginning after December 15, 2019, for any impairment test performed in 2020. Early adoption is permitted for annual and interim goodwill impairment testing dates after January 1, 2017. The Company is currently evaluating the provisions of this guidance; however, we do not anticipate adoption having a material impact on the financial statements.
LEASES
In February 2016, the FASB issued ASU 2016-02, (Leases Topic 842): "Leases." This ASU will require most leases to be recognized on the balance sheet which will increase reported assets and liabilities. Lessor accounting will remain substantially similar to current U.S. GAAP. This ASU is effective for annual reporting periods beginning after December 15, 2018, and interim periods within those years, and mandates a modified retrospective transition method for all entities. The Company will adopt this guidance using the newly approved transition method. We will recognize a liability and corresponding asset associated with in-scope operating and finance leases and are in the final stages of determining those amounts and the processes required to account for leasing activity on an ongoing basis. On adoption, we expect to recognize additional assets and liabilities of approximately
$500 million
based on the present value of the remaining minimum rental payments.
REVENUE RECOGNITION
On January 1, 2018, the Company adopted the new revenue recognition standard ASC 606, "Revenue from Contracts With Customers," (new revenue standard) and all related amendments, using the modified retrospective method. We recognized the cumulative effect of initially applying the new revenue standard as an adjustment to the operating balance of Retained earnings. The comparative information has not been restated and continues to be reported under the accounting standards in effect for those periods.
The Company recorded a net increase to opening Retained earnings of
$73 million
as of January 1, 2018, due to the cumulative impact of adopting the new revenue standard, with the impact primarily related to our customized products. The impacts of the adoption of the new revenue standard on the Company's consolidated financial statements were as follows:
|
Consolidated Statement of Operations
|
|||||||||||
|
2018
|
|||||||||||
|
In millions, except per share amounts
|
Balances As Reported Under ASC 606
|
Balances Without Adoption of ASC 606
|
Impact of Adoption Increase/(Decrease)
|
||||||||
|
Net sales
|
$
|
23,306
|
|
$
|
23,274
|
|
$
|
32
|
|
||
|
Cost of products sold
|
15,555
|
|
15,535
|
|
20
|
|
|||||
|
Distribution expenses
|
1,567
|
|
1,563
|
|
4
|
|
|||||
|
Income tax provision (benefit), net
|
445
|
|
443
|
|
2
|
|
|||||
|
Earnings (loss) from continuing operations
|
1,672
|
|
1,666
|
|
6
|
|
|||||
|
Net earnings (loss)
|
2,017
|
|
2,011
|
|
6
|
|
|||||
|
Earnings per share attributable to International Paper Company Shareholders
|
|||||||||||
|
Basic
|
$
|
4.91
|
|
$
|
4.90
|
|
$
|
0.01
|
|
||
|
Diluted
|
4.85
|
|
4.84
|
|
0.01
|
|
|||||
|
Consolidated Balance Sheet
|
|||||||||||
|
2018
|
|||||||||||
|
In millions, except per share amounts
|
Balances As Reported Under ASC 606
|
Balances Without Adoption of ASC 606
|
Impact of Adoption Increase/(Decrease)
|
||||||||
|
Contract assets
|
$
|
395
|
|
$
|
—
|
|
$
|
395
|
|
||
|
Inventories
|
2,241
|
|
2,511
|
|
(270
|
)
|
|||||
|
Other current assets
|
250
|
|
278
|
|
(28
|
)
|
|||||
|
Other accrued liabilities
|
1,107
|
|
1,088
|
|
19
|
|
|||||
|
Deferred income taxes
|
2,600
|
|
2,601
|
|
(1
|
)
|
|||||
|
Retained earnings
|
7,465
|
|
7,386
|
|
79
|
|
|||||
|
Consolidated Statement of Cash Flows
|
|||||||||||
|
2018
|
|||||||||||
|
In millions, except per share amounts
|
Balances As Reported Under ASC 606
|
Balances Without Adoption of ASC 606
|
Impact of Adoption Increase/(Decrease)
|
||||||||
|
Net earnings (loss)
|
$
|
2,017
|
|
$
|
2,011
|
|
$
|
6
|
|
||
|
Deferred income tax provision (benefit), net
|
133
|
|
159
|
|
(26
|
)
|
|||||
|
Contract assets
|
(32
|
)
|
—
|
|
(32
|
)
|
|||||
|
Inventories
|
(236
|
)
|
(256
|
)
|
20
|
|
|||||
|
Accounts payable and accrued liabilities
|
151
|
|
147
|
|
4
|
|
|||||
|
Other
|
28
|
|
—
|
|
28
|
|
|||||
48
Disaggregated Revenue
A geographic disaggregation of revenues across our company segmentation in the following tables provide information to assist in evaluating the nature, timing and uncertainty of revenue and cash flows and how they may be impacted by economic factors.
|
2018
|
||||||||||||||||||||
|
Reportable Segments
|
Industrial Packaging
|
Global Cellulose Fibers
|
Printing Papers
|
Corporate & Intersegment
|
Total
|
|||||||||||||||
|
Primary Geographical Markets
(a)
|
||||||||||||||||||||
|
United States
|
$
|
13,167
|
|
$
|
2,336
|
|
$
|
1,903
|
|
$
|
203
|
|
$
|
17,609
|
|
|||||
|
EMEA
|
1,704
|
|
304
|
|
1,330
|
|
(17
|
)
|
3,321
|
|
||||||||||
|
Pacific Rim and Asia
|
142
|
|
179
|
|
245
|
|
39
|
|
605
|
|
||||||||||
|
Americas, other than U.S.
|
887
|
|
—
|
|
897
|
|
(13
|
)
|
1,771
|
|
||||||||||
|
Total
|
$
|
15,900
|
|
$
|
2,819
|
|
$
|
4,375
|
|
$
|
212
|
|
$
|
23,306
|
|
|||||
|
Operating Segments
|
||||||||||||||||||||
|
North American Industrial Packaging
|
$
|
14,187
|
|
$
|
—
|
|
$
|
—
|
|
$
|
—
|
|
$
|
14,187
|
|
|||||
|
EMEA Industrial Packaging
|
1,355
|
|
—
|
|
—
|
|
—
|
|
1,355
|
|
||||||||||
|
Brazilian Industrial Packaging
|
232
|
|
—
|
|
—
|
|
—
|
|
232
|
|
||||||||||
|
European Coated Paperboard
|
359
|
|
—
|
|
—
|
|
—
|
|
359
|
|
||||||||||
|
Global Cellulose Fibers
|
—
|
|
2,819
|
|
—
|
|
—
|
|
2,819
|
|
||||||||||
|
North American Printing Papers
|
—
|
|
—
|
|
1,956
|
|
—
|
|
1,956
|
|
||||||||||
|
Brazilian Papers
|
—
|
|
—
|
|
978
|
|
—
|
|
978
|
|
||||||||||
|
European Papers
|
—
|
|
—
|
|
1,252
|
|
—
|
|
1,252
|
|
||||||||||
|
Indian Papers
|
—
|
|
—
|
|
202
|
|
—
|
|
202
|
|
||||||||||
|
Intra-segment Eliminations
|
(233
|
)
|
—
|
|
(13
|
)
|
—
|
|
(246
|
)
|
||||||||||
|
Corporate & Inter-segment Sales
|
—
|
|
—
|
|
—
|
|
212
|
|
212
|
|
||||||||||
|
Total
|
$
|
15,900
|
|
$
|
2,819
|
|
$
|
4,375
|
|
$
|
212
|
|
$
|
23,306
|
|
|||||
(a) Net sales are attributed to countries based on the location of the seller.
The nature of the Company's contracts can vary based on the business, customer type and region; however, in all instances it is International Paper's customary business practice to receive a valid order from the customer, in which each parties' rights and related payment terms are clearly identifiable.
Revenue Contract Balances
The opening and closing balances of the Company's contract assets and current contract liabilities are as follows:
|
In millions
|
Contract Assets (Short-Term)
|
Contract Liabilities (Short-Term)
|
||||||
|
Beginning Balance - January 1, 2018
|
$
|
366
|
|
$
|
53
|
|
||
|
Ending Balance - December 31, 2018
|
395
|
|
56
|
|
||||
|
Increase / (Decrease)
|
$
|
29
|
|
$
|
3
|
|
||
49
A contract asset is created when the Company recognizes revenue on its customized products prior to having an unconditional right to payment from the customer, which generally does not occur until title and risk of loss passes to the customer.
A contract liability is created when customers prepay for goods prior to the Company transferring those goods to the customer. The contract liability is reduced once control of the goods is transferred to the customer. The majority of our customer prepayments are received during the fourth quarter each year for goods that will be transferred to customers over the following twelve months.
The difference between the opening and closing balances of the Company's contract assets and contract liabilities primarily results from the difference between the price and quantity at comparable points in time for goods which we have an unconditional right to payment or receive pre-payment from the customer, respectively.
Performance Obligations and Significant Judgments
International Paper's principal business is to manufacture and sell fiber-based packaging, pulp and paper goods. As a general rule, none of our businesses provide equipment installation or other ancillary services outside producing and shipping packaging, pulp and paper goods to customers.
Contracts or purchase orders with customers could include a single type of product or it could include multiple types/grades of products. Regardless, the contracted price with the customer is agreed to at the individual product level outlined in the customer contracts or purchase orders. The Company does not
bundle prices; however, we do negotiate with customers
on pricing and rebates for the same products based on a variety of factors (e.g. level of contractual volume, geographical location, etc.). Management has concluded that the prices negotiated with each individual customer are representative of the stand-alone selling price of the product.
Basic earnings per share is computed by dividing earnings by the weighted average number of common shares outstanding. Diluted earnings per share is computed assuming that all potentially dilutive securities were converted into common shares.
There are no adjustments required to be made to net income for purposes of computing basic and diluted EPS.
A reconciliation of the amounts included in the computation of basic earnings (loss) per share from continuing operations, and diluted earnings (loss) per share from continuing operations is as follows:
|
In millions, except per share amounts
|
2018
|
2017
|
2016
|
||||||||
|
Earnings (loss) from continuing operations attributable to International Paper common shareholders
|
$
|
1,667
|
|
$
|
2,110
|
|
$
|
802
|
|
||
|
Weighted average common shares outstanding
|
409.1
|
|
412.7
|
|
411.1
|
|
|||||
|
Effect of dilutive securities:
|
|||||||||||
|
Restricted performance share plan
|
5.1
|
|
5.0
|
|
4.5
|
|
|||||
|
Weighted average common shares outstanding – assuming dilution
|
414.2
|
|
417.7
|
|
415.6
|
|
|||||
|
Basic earnings (loss) per share from continuing operations
|
$
|
4.07
|
|
$
|
5.11
|
|
$
|
1.95
|
|
||
|
Diluted earnings (loss) per share from continuing operations
|
$
|
4.02
|
|
$
|
5.05
|
|
$
|
1.93
|
|
||
50
The following table presents changes in AOCI, net of tax, reported in the consolidated financial statements for the years ended December 31:
|
In millions
|
2018
|
2017
|
2016
|
||||||
|
Defined Benefit Pension and Postretirement Adjustments
|
|||||||||
|
Balance at beginning of period
|
$
|
(2,527
|
)
|
$
|
(3,072
|
)
|
$
|
(3,169
|
)
|
|
Other comprehensive income (loss) before reclassifications
|
22
|
|
59
|
|
(448
|
)
|
|||
|
Amounts reclassified from accumulated other comprehensive income
|
589
|
|
486
|
|
545
|
|
|||
|
Balance at end of period
|
(1,916
|
)
|
(2,527
|
)
|
(3,072
|
)
|
|||
|
Change in Cumulative Foreign Currency Translation Adjustments
|
|||||||||
|
Balance at beginning of period
|
(2,111
|
)
|
(2,287
|
)
|
(2,549
|
)
|
|||
|
Other comprehensive income (loss) before reclassifications
|
(475
|
)
|
178
|
|
263
|
|
|||
|
Amounts reclassified from accumulated other comprehensive income
|
2
|
|
(1
|
)
|
(3
|
)
|
|||
|
Other Comprehensive Income (Loss) Attributable to Noncontrolling Interest
|
3
|
|
(1
|
)
|
2
|
|
|||
|
Balance at end of period
|
(2,581
|
)
|
(2,111
|
)
|
(2,287
|
)
|
|||
|
Net Gains and Losses on Cash Flow Hedging Derivatives
|
|||||||||
|
Balance at beginning of period
|
5
|
|
(3
|
)
|
10
|
|
|||
|
Other comprehensive income (loss) before reclassifications
|
(10
|
)
|
15
|
|
(6
|
)
|
|||
|
Amounts reclassified from accumulated other comprehensive income
|
2
|
|
(7
|
)
|
(7
|
)
|
|||
|
Balance at end of period
|
(3
|
)
|
5
|
|
(3
|
)
|
|||
|
Total Accumulated Other Comprehensive Income (Loss) at End of Period
|
$
|
(4,500
|
)
|
$
|
(4,633
|
)
|
$
|
(5,362
|
)
|
Reclassifications out of AOCI for the three years ended December 31 were as follows:
|
Amount Reclassified from Accumulated Other Comprehensive Income
|
Location of Amount Reclassified from AOCI
|
||||||||||
|
2018
|
2017
|
2016
|
|||||||||
|
In millions
|
|||||||||||
|
Defined benefit pension and postretirement items:
|
|||||||||||
|
Prior-service costs
|
$
|
(11
|
)
|
$
|
(33
|
)
|
$
|
(37
|
)
|
(a)
|
Non-operating pension expense
|
|
Actuarial gains/(losses)
|
(774
|
)
|
(733
|
)
|
(851
|
)
|
(a)
|
Non-operating pension expense
|
|||
|
Total pre-tax amount
|
(785
|
)
|
(766
|
)
|
(888
|
)
|
|||||
|
Tax (expense)/benefit
|
196
|
|
280
|
|
343
|
|
|||||
|
Net of tax
|
(589
|
)
|
(486
|
)
|
(545
|
)
|
|||||
|
Change in cumulative foreign currency translation adjustments:
|
|||||||||||
|
Business acquisitions/divestiture
|
(2
|
)
|
1
|
|
3
|
|
(b)
|
Discontinued operations, net of taxes
|
|||
|
Tax (expense)/benefit
|
—
|
|
—
|
|
—
|
|
|||||
|
Net of tax
|
(2
|
)
|
1
|
|
3
|
|
|||||
|
Net gains and losses on cash flow hedging derivatives:
|
|||||||||||
|
Foreign exchange contracts
|
(3
|
)
|
9
|
|
10
|
|
(c)
|
Cost of products sold
|
|||
|
Total pre-tax amount
|
(3
|
)
|
9
|
|
10
|
|
|||||
|
Tax (expense)/benefit
|
1
|
|
(2
|
)
|
(3
|
)
|
|||||
|
Net of tax
|
(2
|
)
|
7
|
|
7
|
|
|||||
|
Total reclassifications for the period, net of tax
|
$
|
(593
|
)
|
$
|
(478
|
)
|
$
|
(535
|
)
|
||
(a) These accumulated other comprehensive income components are included in the computation of net periodic pension cost (see
Note 18
for additional details).
(b) Amounts for 2016 and 2017 were reclassed to Net (gains) losses on sales and impairment of businesses.
(c) This accumulated other comprehensive income component is included in our derivatives and hedging activities (see
Note 16
for additional details).
51
2018:
During 2018, restructuring and other charges, net, totaling
$29 million
before taxes were recorded. These charges included:
|
In millions
|
2018
|
|||
|
EMEA packaging restructuring (a)
|
$
|
47
|
|
|
|
Gain on sale of investment in Liaison Technologies Inc.
|
(31
|
)
|
||
|
Early debt extinguishment costs (see Note 15)
|
10
|
|
||
|
Riverdale mill conversion severance (b)
|
3
|
|
||
|
Total
|
$
|
29
|
|
|
(a) Includes
$33 million
of severance,
$6 million
in accelerated depreciation,
$2 million
in accelerated amortization and
$6 million
in other charges in conjunction with the optimization of our EMEA Packaging business. The majority of the severance charges recorded were paid throughout the year.
(b) Includes severance related to
51
employees.
2017:
During 2017, restructuring and other charges, net, totaling
$67 million
before taxes were recorded. These charges included:
|
In millions
|
2017
|
|||
|
Early debt extinguishment costs (see Note 15)
|
$
|
83
|
|
|
|
Gain on sale of investment in ArborGen
|
(14
|
)
|
||
|
Other
|
(2
|
)
|
||
|
Total
|
$
|
67
|
|
|
2016:
During 2016, total restructuring and other charges, net, of
$54 million
before taxes were recorded. These charges included:
|
In millions
|
2016
|
|||
|
Early debt extinguishment costs (see Note 15)
|
$
|
29
|
|
|
|
India packaging evaluation write-off
|
17
|
|
||
|
Gain on sale of investment in Arizona Chemical
|
(8
|
)
|
||
|
Riegelwood mill conversion costs (a)
|
9
|
|
||
|
Turkey mill closure (b)
|
7
|
|
||
|
Total
|
$
|
54
|
|
|
|
(a)
|
Includes
$3 million
of accelerated depreciation,
$3 million
of inventory write-off charges and
$3 million
of other charges.
|
|
(b)
|
Includes
$4 million
of accelerated depreciation and
$3 million
of severance charges which is related to
85
employees.
|
TANGIER, MOROCCO FACILITY
2017:
On June 30, 2017, the Company completed the acquisition of Europac's Tangier, Morocco facility, a corrugated packaging facility, for
€40 million
(approximately
$46 million
using the June 30, 2017
exchange rate). After working capital and other post-close adjustments, final consideration exchanged was
€33 million
(approximately
$38 million
using the June 30, 2017 exchange rate).
The following table summarizes the final fair value assigned to assets and liabilities acquired as of June 30, 2017:
|
In millions
|
June 30, 2017
|
||
|
Cash and temporary investments
|
$
|
1
|
|
|
Accounts and notes receivable
|
7
|
|
|
|
Inventory
|
3
|
|
|
|
Plants, properties and equipment
|
31
|
|
|
|
Goodwill
|
4
|
|
|
|
Other intangible assets
|
5
|
|
|
|
Deferred charges and other assets
|
4
|
|
|
|
Total assets acquired
|
55
|
|
|
|
Accounts payable and accrued liabilities
|
4
|
|
|
|
Long-term debt
|
11
|
|
|
|
Other long-term liabilities
|
2
|
|
|
|
Total liabilities assumed
|
17
|
|
|
|
Net assets acquired
|
$
|
38
|
|
Since the date of acquisition, Net sales of
$6 million
and Earnings (loss) from continuing operations before income taxes and equity earnings of
$(1) million
from the acquired business have been included in the Company's consolidated statement of operations for the year ended December 31, 2017. Pro forma information related to the acquisition of the Europac business has not been included as it is impractical to obtain the information due to the lack of availability of U.S. GAAP financial data and does not have a material effect on the Company's consolidated results of operations.
The Company has accounted for the above acquisition under ASC 805, "Business Combinations" and the results of operations have been included in International Paper's financial statements beginning with the date of acquisition.
WEYERHAEUSER PULP BUSINESS
2016:
On December 1, 2016, the Company finalized the purchase of Weyerhaeuser's pulp business for approximately
$2.2 billion
in cash, subject to post-closing adjustments. Under the terms of the agreement, International Paper acquired
four
fluff pulp mills,
one
northern bleached softwood kraft mill and
two
converting facilities of modified fiber, located in the United States, Canada and Poland.
52
The following table summarizes the final fair values assigned to assets and liabilities acquired as of December 1, 2016:
|
In millions
|
December 1, 2016
|
|
|
|
Cash and temporary investments
|
$
|
12
|
|
|
Accounts and notes receivable
|
195
|
|
|
|
Inventory
|
238
|
|
|
|
Other current assets
|
11
|
|
|
|
Plants, properties and equipment
|
1,711
|
|
|
|
Goodwill
|
52
|
|
|
|
Other intangible assets
|
212
|
|
|
|
Deferred charges and other assets
|
6
|
|
|
|
Total assets acquired
|
2,437
|
|
|
|
Accounts payable and accrued liabilities
|
114
|
|
|
|
Long-term debt
|
104
|
|
|
|
Other long-term liabilities
|
28
|
|
|
|
Total liabilities assumed
|
246
|
|
|
|
Net assets acquired
|
$
|
2,191
|
|
In connection with the allocation of fair value, inventories were written up by
$33 million
to their estimated fair value. During 2017 and 2016,
$14 million
before taxes (
$8 million
after taxes) and
$19 million
before taxes (
$12 million
after taxes), respectively, were expensed to Cost of products sold as the related inventory was sold.
Since the date of acquisition, Net sales of
$111 million
and Earnings (loss) from continuing operations before income taxes and equity earnings of
$(21) million
from the acquired business are included in the Company's consolidated statement of operations for the year ended December 31, 2016. Additionally, Selling and administrative expenses for 2016 include
$28 million
in charges before taxes (
$18 million
after taxes) for integration costs associated with the acquisition.
The identifiable intangible assets acquired in connection with the acquisition of the Weyerhaeuser pulp business included the following:
|
In millions
|
Estimated
Fair Value |
Average
Remaining Useful Life |
|||
|
Asset Class:
|
(at acquisition
date) |
||||
|
Customer relationships and lists
|
$
|
95
|
|
24 years
|
|
|
Trade names, patents, trademarks and developed technology
|
113
|
|
8 years
|
||
|
Other
|
4
|
|
10 years
|
||
|
Total
|
$
|
212
|
|
|
|
On an unaudited pro forma basis, assuming the acquisition of the newly acquired pulp business had
closed January 1, 2016, the consolidated results would have reflected Net sales of
$20.8 billion
and Earnings (loss) from continuing operations before income taxes and equity earnings of
$942 million
for the year ended December 31, 2016.
The 2016 pro forma information includes adjustments for additional amortization expense on identifiable intangible assets of
$18 million
and eliminating the write-off of the estimated fair value of inventory of
$(19) million
and non-recurring integration costs associated with the acquisition of
$30 million
, including
$12 million
of deal costs.
The unaudited pro forma consolidated financial information was prepared for comparative purposes only and includes certain adjustments, as noted above. They do not reflect the effect of costs or synergies that would have been expected to result from the integration of the acquisition. The pro forma information does not purport to represent International Paper's actual results of operations as if the transaction described above would have occurred as of January 1, 2016, nor is it necessarily an indicator of future results.
HOLMEN PAPER NEWSPRINT MILL
2016:
On June 30, 2016, the Company completed the acquisition of Holmen Paper's newsprint mill in Madrid, Spain. Under the terms of the acquisition agreement, International Paper purchased the Madrid newsprint mill, as well as, associated recycling operations and a
50%
ownership interest in a cogeneration facility. The Company completed the conversion of the mill to produce recycled containerboard with an expected capacity of
440,000
tons, supporting the Company's corrugated packaging business in EMEA.
The Company's aggregate purchase price for the mill, recycling operations and
50%
ownership of the cogeneration facility was
€53 million
(approximately
$59 million
using June 30, 2016 exchange rate). The assignment of fair value to assets acquired and liabilities assumed was completed in the first quarter of 2017 and is presented in the table below.
|
In millions
|
June 30, 2016
|
||
|
Current assets
|
$
|
14
|
|
|
Equity method investments
|
14
|
|
|
|
Plants, properties and equipment
|
60
|
|
|
|
Other long-term assets
|
5
|
|
|
|
Total assets acquired
|
93
|
|
|
|
Short-term liabilities
|
9
|
|
|
|
Long-term liabilities
|
16
|
|
|
|
Total liabilities assumed
|
25
|
|
|
|
Net assets acquired
|
$
|
68
|
|
53
The final fair values assigned indicated that the sum of the cash consideration paid was less than the fair value of the underlying net assets, after adjustments, by
$6 million
, resulting in a bargain purchase gain being recorded on this transaction. The amount of revenue and earnings recognized since the acquisition date are
$90 million
and a net loss of
$2 million
, respectively, for the year ended December 31, 2016. Pro forma information related to the acquisition of the Holmen businesses has not been included as it is impractical to obtain the information due to the lack of availability of financial data and does not have a material effect on the Company's consolidated results of operations.
The Company has accounted for the above acquisitions under ASC 805, "Business Combinations" and the results of operations have been included in International Paper's financial statements beginning with the dates of acquisition.
DISCONTINUED OPERATIONS
2017:
On January 1, 2018, the Company completed the transfer of its North American Consumer Packaging business, which included its North American Coated Paperboard and Foodservice businesses, to Graphic Packaging International Partners, LLC (GPIP), a subsidiary of Graphic Packaging Holding Company, in exchange for a
20.5%
ownership interest in GPIP. GPIP subsequently transferred the North American Consumer Packaging business to Graphic Packaging International, LLC (GPI), a wholly-owned subsidiary of GPIP. Prior to the transaction, International Paper also received
$660 million
in cash proceeds from a new loan entered into by International Paper on December 8, 2017, which the Company used to pay down existing debt. The loan was subsequently assumed by GPI from International Paper on the transaction closing date and was classified as Liabilities held for sale in the accompanying consolidated balance sheet. International Paper is accounting for its ownership interest in the combined business under the equity method. The Company determined the fair value of its investment in the combined business to be
$1.1 billion
and recorded a pre-tax gain of
$488 million
(
$364 million
, net of tax) in 2018. The fair value was calculated using a market approach using inputs classified as Level 2 and Level 3 within the fair value hierarchy, which is further defined in
Note 16
.
All current and historical operating results for North American Consumer Packaging are included in Discontinued operations, net of tax, in the accompanying consolidated statement of operations. The following summarizes the major classes of line items comprising Earnings (Loss) Before Income Taxes and Equity Earnings reconciled to Discontinued
Operations, net of tax, related to the transfer of the North American Consumer Packaging business for all prior periods presented in the consolidated statement of operations:
|
In millions
|
2018
|
|
2017
|
|
2016
|
|
|||
|
Net Sales
|
$
|
—
|
|
$
|
1,559
|
|
$
|
1,584
|
|
|
Costs and Expenses
|
|||||||||
|
Cost of products sold
|
—
|
|
1,179
|
|
1,095
|
|
|||
|
Selling and administrative expenses
|
25
|
|
110
|
|
91
|
|
|||
|
Depreciation, amortization and cost of timber harvested
|
—
|
|
80
|
|
103
|
|
|||
|
Distribution expenses
|
—
|
|
126
|
|
124
|
|
|||
|
Taxes other than payroll and income taxes
|
—
|
|
11
|
|
10
|
|
|||
|
(Gain) loss on transfer of business
|
(488
|
)
|
—
|
|
—
|
|
|||
|
Interest expense, net
|
—
|
|
1
|
|
—
|
|
|||
|
Earnings (Loss) Before Income Taxes and Equity Earnings
|
463
|
|
52
|
|
161
|
|
|||
|
Income tax provision (benefit)
|
118
|
|
18
|
|
54
|
|
|||
|
Discontinued Operations, Net of Taxes
|
$
|
345
|
|
$
|
34
|
|
$
|
107
|
|
At December 31, 2017, all assets and liabilities of North American Consumer Packaging are classified as current assets held for sale and current liabilities held for sale in the accompanying consolidated balance sheet. The following summarizes the major classes of assets and liabilities of North American Consumer Packaging reconciled to total Assets held for sale and total Liabilities held for sale in the accompanying consolidated balance sheet:
|
In millions
|
2017
|
|
|
|
Accounts and notes receivable
|
$
|
143
|
|
|
Inventories
|
185
|
|
|
|
Other current assets
|
3
|
|
|
|
Plants, properties and equipment
|
1,021
|
|
|
|
Deferred charges and other assets
|
25
|
|
|
|
Total Assets Held for Sale
|
$
|
1,377
|
|
|
Accounts payable
|
$
|
104
|
|
|
Accrued payroll and benefits
|
25
|
|
|
|
Other accrued liabilities
|
17
|
|
|
|
Long-term debt
|
651
|
|
|
|
Other liabilities
|
8
|
|
|
|
Total Liabilities Held for Sale
|
$
|
805
|
|
Total cash provided by (used for) operations related to the North American Consumer Packaging business of
$(25) million
,
$207 million
and
$268 million
for 2018, 2017 and 2016, respectively, is included in Cash Provided By (Used For) Operations in the consolidated statement of cash flows. Total cash used for investing activities related to the North American Consumer Packaging business of
$40 million
,
$111 million
and
$114 million
for 2018, 2017 and 2016, respectively, is
54
included in Cash Provided By (Used For) Investing Activities in the consolidated statement of cash flows.
OTHER DIVESTITURES AND IMPAIRMENTS
2018:
During 2018, a determination was made that the current carrying value of the long-lived assets of the Brazil Packaging business exceeded their estimated fair value due to a change in the outlook for the business. Management engaged a third party to assist with determining the fair value of the business and the fixed assets. The fair value of the business was calculated using a probability-weighted approach based on discounted future cash flows, market multiples, and transaction multiples and the fair value of the fixed assets was determined using a market approach. As a result, a pre-tax charge of
$122 million
(
$81 million
, net of tax) was recorded related to the impairment of an intangible asset and fixed assets. This charge is included in Net (gains) losses on sales and impairments of businesses in the accompanying consolidated statement of operations and is included in the results for the Industrial Packaging segment. In the fourth quarter of 2018, the Company announced that it was exploring strategic options for its Brazil Packaging business.
2017:
On September 7, 2017, the Company completed the sale of its foodservice business in China to Huhtamaki Hong Kong Limited. Proceeds received totaled approximately RMB
129 million
(
$18 million
using the September 30, 2017 exchange rate). Under the terms of the transaction, and after post-closing adjustments, International Paper received approximately RMB
49 million
in exchange for its ownership interest in
two
China foodservice entities and RMB
80 million
for the sale of notes receivable from the acquired entities.
Subsequent to the announced agreement in June 2017, a determination was made that the current book value of the asset group exceeded its estimated fair value of
$7 million
, which was the agreed upon selling price. As a result, a pre-tax charge of
$9 million
was recorded during the second quarter of 2017, to write down the long-lived assets of this business to their estimated fair value. Amounts related to this business included in the Company's statement of operations were immaterial for all periods presented.
2016:
On June 30, 2016, the Company completed the sale of its corrugated packaging business in China and Southeast Asia to Xiamen Bridge Hexing Equity Investment Partnership Enterprise. Under the terms of the transaction and after post-closing adjustments, International Paper received a total of approximately RMB
957 million
(approximately
$144 million
at the June 30, 2016 exchange rate), which included the buyer's assumption of a liability for outstanding loans of approximately
$55 million
which are payable up to three
years from the closing of the sale. There was no remaining balance on the outstanding loans payable to International Paper as of December 31, 2018.
Based on the final sales price, a determination was made that the current book value of the asset group was not recoverable. As a result, a pre-tax charge of
$46 million
was recorded during 2016 in the Company's Industrial Packaging segment to write down the long-lived assets of this business to their estimated fair value. In addition, the Company recorded a pre-tax charge of
$24 million
for severance that was contingent upon the sale of this business. The 2016 net loss totaling
$70 million
related to the impairment and severance of IP Asia Packaging is included in Net (gains) losses on sales and impairments of businesses in the accompanying consolidated statement of operations.
The amount of pre-tax losses related to the IP Asia Packaging business included in the Company's consolidated statement of operations was
$83 million
for year ended December 31, 2016.
TEMPORARY INVESTMENTS
Temporary investments with an original maturity of three months or less are treated as cash equivalents and are stated at cost. Temporary investments totaled
$402 million
and
$661 million
at December 31,
2018
and
2017
, respectively.
ACCOUNTS AND NOTES RECEIVABLE
Accounts and notes receivable, net, by classification were:
|
In millions at December 31
|
2018
|
2017
|
||||
|
Accounts and notes receivable:
|
||||||
|
Trade
|
$
|
3,249
|
|
$
|
3,017
|
|
|
Other
|
272
|
|
270
|
|
||
|
Total
|
$
|
3,521
|
|
$
|
3,287
|
|
INVENTORIES
|
In millions at December 31
|
2018
|
2017
|
||||
|
Raw materials
|
$
|
260
|
|
$
|
274
|
|
|
Finished pulp, paper and packaging products
|
1,241
|
|
1,337
|
|
||
|
Operating supplies
|
641
|
|
615
|
|
||
|
Other
|
99
|
|
87
|
|
||
|
Inventories
|
$
|
2,241
|
|
$
|
2,313
|
|
The last-in, first-out inventory method is used to value most of International Paper’s U.S. inventories. Approximately
70%
of total raw materials and finished products inventories were valued using this method. The last-in, first-out inventory reserve was
$329 million
55
and
$293 million
at December 31,
2018
and
2017
, respectively.
PLANTS, PROPERTIES AND EQUIPMENT
|
In millions at December 31
|
2018
|
2017
|
||||
|
Pulp, paper and packaging facilities
|
$
|
32,329
|
|
$
|
32,523
|
|
|
Other properties and equipment
|
1,232
|
|
1,291
|
|
||
|
Gross cost
|
33,561
|
|
33,814
|
|
||
|
Less: Accumulated depreciation
|
20,494
|
|
20,549
|
|
||
|
Plants, properties and equipment, net
|
$
|
13,067
|
|
$
|
13,265
|
|
Non-cash additions to plants, property and equipment included within accounts payable were $
135 million
,
$275 million
and
$172 million
at
December 31, 2018
,
2017
and
2016
, respectively.
Annual straight-line depreciable lives generally are, for buildings -
20
to
40
years, and for machinery and equipment -
3
to
20
years. Depreciation expense was
$1.2 billion
,
$1.2 billion
and
$1.0 billion
for the years ended December 31,
2018
,
2017
and
2016
, respectively. Cost of products sold excludes depreciation and amortization expense.
INTEREST
Interest payments of
$772 million
,
$782 million
and
$682 million
were made during the years ended December 31,
2018
,
2017
and
2016
, respectively.
Amounts related to interest were as follows:
|
In millions
|
2018
|
2017
|
2016
|
||||||
|
Interest expense
|
$
|
734
|
|
$
|
758
|
|
$
|
695
|
|
|
Interest income
|
198
|
|
186
|
|
175
|
|
|||
|
Capitalized interest costs
|
30
|
|
25
|
|
28
|
|
|||
ASSET RETIREMENT OBLIGATIONS
At both December 31, 2018 and December 31, 2017, we had recorded liabilities of
$86 million
related to asset retirement obligations.
The Company accounts for the following investments in affiliated companies under the equity method of accounting.
GRAPHIC PACKAGING INTERNATIONAL PARTNERS, LLC
On January 1, 2018, the Company completed the transfer of its North American Consumer Packaging business, which includes its North American Coated Paperboard and Foodservice businesses, to Graphic Packaging International Partners, LLC (GPIP), a subsidiary of Graphic Packaging Holding Company, in exchange for a
20.5%
ownership interest in GPIP. GPIP subsequently transferred the North American
Consumer Packaging business to Graphic Packaging International, LLC (GPI), a wholly-owned subsidiary of GPIP that holds the assets of the combined business. The Company recorded equity earnings of
$46 million
for the year ended
December 31, 2018
. The Company received cash dividends from GPIP of
$25 million
during 2018. At
December 31, 2018
, the Company's investment in GPIP was
$1.1 billion
, which was
$562 million
more than the Company's proportionate share of the entity's underlying net assets. The difference primarily relates to the basis difference between the fair value of our investment and the underlying net assets and is generally amortized in equity earnings over a period consistent with the underlying long-lived assets. Management engaged a third party to assist with determining the fair value of the intangible assets and the fixed assets. The fair value of the intangible assets were calculated using income and market approaches and the fair value of the fixed assets was calculated using a cost approach. The fair values were determined using inputs classified as Level 2 and Level 3 within the fair value hierarchy, which is further defined in
Note 16
. The Company is party to various agreements with GPI under which it sells fiber and other products to GPI. Sales under these agreements were
$240 million
for the year ended
December 31, 2018
.
Summarized financial information for GPIP is presented in the following tables:
Balance Sheet
|
In millions
|
2018
|
||
|
Current assets
|
$
|
1,757
|
|
|
Noncurrent assets
|
5,292
|
|
|
|
Current liabilities
|
1,148
|
|
|
|
Noncurrent liabilities
|
3,156
|
|
|
Income Statement
|
In millions
|
2018
|
||
|
Net sales
|
$
|
6,023
|
|
|
Gross profit
|
946
|
|
|
|
Income from continuing operations
|
336
|
|
|
|
Net income
|
337
|
|
|
ILIM S.A. (Ilim)
The Company also holds a
50%
equity interest in Ilim, which has subsidiaries whose primary operations are in Russia. The Company recorded equity earnings (losses), net of taxes, of
$290 million
,
$183 million
, and
$199 million
in
2018
,
2017
, and
2016
, respectively, for Ilim. Equity earnings (losses) includes an after-tax foreign exchange (loss) gain of
$(82) million
,
$15 million
, and
$25 million
in
2018
,
2017
and
2016
, respectively, primarily on the remeasurement of U.S. dollar-denominated net debt. The Company received cash dividends from the joint venture of
$128 million
and
$133 million
in 2018 and 2017, respectively. At
56
December 31,
2018
and
2017
, the Company's investment in Ilim, which is recorded in Investments in the consolidated balance sheet, was
$478 million
and
$338 million
, respectively, which was
$145 million
and
$154 million
, respectively, more than the Company's proportionate share of the joint venture's underlying net assets. The differences primarily relate to currency translation adjustments and the basis difference between the fair value of our investment at acquisition and the underlying net assets. The Company is party to a joint marketing agreement with JSC Ilim Group, a subsidiary of Ilim, under which the Company purchases, markets and sells paper produced by JSC Ilim Group. Purchases under this agreement were
$214 million
,
$205 million
and
$170 million
for the years ended December 31,
2018
,
2017
and
2016
, respectively.
Summarized financial information for Ilim is presented in the following tables:
Balance Sheet
|
In millions
|
2018
|
2017
|
|||||
|
Current assets
|
$
|
981
|
|
$
|
689
|
|
|
|
Noncurrent assets
|
1,710
|
|
1,696
|
|
|||
|
Current liabilities
|
545
|
|
1,039
|
|
|||
|
Noncurrent liabilities
|
1,470
|
|
972
|
|
|||
|
Noncontrolling interests
|
11
|
|
6
|
|
|||
Income Statement
|
In millions
|
2018
|
2017
|
2016
|
||||||||
|
Net sales
|
$
|
2,713
|
|
$
|
2,150
|
|
$
|
1,927
|
|
||
|
Gross profit
|
1,549
|
|
1,047
|
|
957
|
|
|||||
|
Income from continuing operations
|
592
|
|
379
|
|
419
|
|
|||||
|
Net income
|
571
|
|
362
|
|
391
|
|
|||||
The audited U.S. GAAP financial statements for Ilim are included in Exhibit 99.1 to this Form 10-K.
GOODWILL
The following table presents changes in the goodwill balances as allocated to each business segment for the years ended
December 31, 2018
and
2017
:
|
In millions
|
Industrial
Packaging
|
Global Cellulose Fibers
|
Printing
Papers
|
|
Total
|
||||||||||
|
Balance as of December 31, 2016
|
|||||||||||||||
|
Goodwill
|
$
|
3,375
|
|
$
|
19
|
|
|
$
|
2,143
|
|
|
$
|
5,537
|
|
|
|
Accumulated impairment losses
|
(296
|
)
|
—
|
|
|
(1,877
|
)
|
(2,173
|
)
|
||||||
|
3,079
|
|
19
|
|
266
|
|
3,364
|
|
||||||||
|
Currency translation and other (a)
|
3
|
|
—
|
|
8
|
|
|
11
|
|
||||||
|
Additions/reductions
|
4
|
|
(b)
|
33
|
|
(c)
|
(1
|
)
|
|
36
|
|
||||
|
Balance as of December 31, 2017
|
|||||||||||||||
|
Goodwill
|
3,382
|
|
|
52
|
|
2,150
|
|
|
5,584
|
|
|||||
|
Accumulated impairment losses
|
(296
|
)
|
|
—
|
|
(1,877
|
)
|
(2,173
|
)
|
||||||
|
|
3,086
|
|
|
52
|
|
273
|
|
|
3,411
|
|
|||||
|
Currency translation and other (a)
|
(1
|
)
|
—
|
|
(34
|
)
|
|
(35
|
)
|
||||||
|
Additions/reductions
|
(2
|
)
|
(d)
|
—
|
|
—
|
|
(2
|
)
|
||||||
|
Balance as of December 31, 2018
|
|||||||||||||||
|
Goodwill
|
3,379
|
|
52
|
|
|
2,116
|
|
|
5,547
|
|
|||||
|
Accumulated impairment losses
|
(296
|
)
|
—
|
|
|
(1,877
|
)
|
(2,173
|
)
|
||||||
|
Total
|
$
|
3,083
|
|
$
|
52
|
|
|
$
|
239
|
|
|
$
|
3,374
|
|
|
|
(a)
|
Represents the effects of foreign currency translations and reclassifications.
|
|
(b)
|
Reflects the acquisition of the Moroccan box plant.
|
|
(c)
|
Reflects the acquisition and purchase price adjustments of the Weyerhaeuser pulp business.
|
|
(d)
|
Reflects a reduction from tax benefits generated by the deduction of goodwill amortization for tax purposes in the U.S.
|
57
The Company performed its annual evaluation of its reporting units for possible goodwill impairments by applying the qualitative Step 0 analysis to its reporting units as of October 1, 2018. For the current year evaluation, the Company assessed various assumptions, events and circumstances that would have affected the estimated fair value of the reporting units. The results of this assessment indicated that it is not more likely than not that the fair values of the Company's reporting units were less than the carrying values of the reporting units.
In addition, the Company considered whether there were any events or circumstances subsequent to the annual evaluation that would reduce the fair value of its reporting units below their carrying amounts and necessitate another goodwill impairment evaluation. In consideration of all relevant factors, there were no indicators that would require goodwill impairment subsequent to October 1, 2018.
OTHER INTANGIBLES
Identifiable intangible assets comprised the following:
|
|
||||||||||||||||||
|
|
2018
|
2017
|
||||||||||||||||
|
In millions at December 31
|
Gross
Carrying
Amount
|
Accumulated
Amortization
|
Net Intangible Assets
|
Gross
Carrying
Amount
|
Accumulated
Amortization
|
Net Intangible Assets
|
||||||||||||
|
Customer relationships and lists
|
$
|
542
|
|
$
|
247
|
|
$
|
295
|
|
$
|
610
|
|
$
|
247
|
|
$
|
363
|
|
|
Non-compete agreements
|
67
|
|
67
|
|
—
|
|
72
|
|
72
|
|
—
|
|
||||||
|
Tradenames, patents and trademarks, and developed technology
|
174
|
|
90
|
|
84
|
|
172
|
|
72
|
|
100
|
|
||||||
|
Land and water rights
|
8
|
|
2
|
|
6
|
|
8
|
|
2
|
|
6
|
|
||||||
|
Software
|
26
|
|
25
|
|
1
|
|
24
|
|
23
|
|
1
|
|
||||||
|
Other
|
30
|
|
23
|
|
7
|
|
38
|
|
26
|
|
12
|
|
||||||
|
Total
|
$
|
847
|
|
$
|
454
|
|
$
|
393
|
|
$
|
924
|
|
$
|
442
|
|
$
|
482
|
|
The Company recognized the following amounts as amortization expense related to intangible assets:
|
In millions
|
2018
|
2017
|
2016
|
||||||
|
Amortization expense related to intangible assets
|
$
|
59
|
|
$
|
77
|
|
$
|
54
|
|
Based on current intangibles subject to amortization, estimated amortization expense for each of the succeeding years is as follows:
2019
–
$48 million
,
2020
–
$46 million
,
2021
–
$46 million
,
2022
–
$44 million
,
2023
–
$40 million
, and cumulatively thereafter –
$163 million
.
The components of International Paper’s earnings from continuing operations before income taxes and equity earnings by taxing jurisdiction were as follows:
|
In millions
|
2018
|
2017
|
2016
|
||||||
|
Earnings (loss)
|
|||||||||
|
U.S.
|
$
|
1,450
|
|
$
|
297
|
|
$
|
411
|
|
|
Non-U.S.
|
331
|
|
551
|
|
384
|
|
|||
|
Earnings (loss) from continuing operations before income taxes and equity earnings
|
$
|
1,781
|
|
$
|
848
|
|
$
|
795
|
|
On December 22, 2017, the U.S. government enacted comprehensive tax legislation commonly referred to as the Tax Cuts and Jobs Act (the Tax Act). The Tax Act makes broad and complex changes to the U.S. tax code, including, but not limited to, (1) reducing the U.S. federal corporate tax rate from
35%
to
21%
; (2) requiring companies to pay a one-time deemed repatriation transition tax (the Transition Tax) on certain earnings of
foreign subsidiaries; (3) generally eliminating U.S. federal income taxes on dividends from foreign subsidiaries; (4) requiring a current inclusion in U.S. federal taxable income of certain earnings of controlled foreign corporations; (5) eliminating the corporate alternative minimum tax (AMT) and changing how AMT
credits can be realized; (6) capital expensing; (7) eliminating the deduction on U.S. manufacturing activities; and (8) creating new limitations on
deductible interest expense and executive compensation.
The Securities Exchange Commission staff issued Staff Accounting Bulletin (SAB) 118 which provided guidance on accounting for the tax effects of the Tax Act. SAB 118 provided a measurement period that should not extend beyond one year from the Tax Act enactment date for companies to complete the accounting under ASC 740. In accordance with SAB 118, a company had to reflect the income tax effects of those aspects of the Tax Act for which the accounting under ASC 740 is complete. To the extent that a company’s accounting for certain income tax effects of the Tax Act was incomplete but it
58
was able to determine a reasonable estimate, it was required to record a provisional estimate in the financial statements. The Company has completed its analysis of the one-time impacts of the Tax Act within the one year measurement period.
In connection with our initial analysis of the impact of the Tax Act, we recorded a provisional net tax benefit of
$1.22 billion
in the period ending December 31, 2017. The net tax benefit primarily consisted of a net tax benefit for the re-measurement of U.S. deferred taxes of
$1.454 billion
and an expense for the Transition Tax of
$231 million
. During the SAB 118 measurement period in the year ended December 31, 2018, we recorded an additional net tax benefit of
$36 million
associated with the one-time effects of the Tax Act.
Reduction of U.S. federal corporate tax rate:
The Tax Act reduced the corporate tax rate to
21%
, effective January 1, 2018. For certain of our deferred tax assets and liabilities, we recorded a provisional net decrease of
$1.451 billion
with a corresponding adjustment to deferred income tax benefit in the same amount for the year ended December 31, 2017. After the completion of the federal income tax return during the third quarter and state tax returns in the fourth quarter, we recognized an adjustment of
$11 million
from the remeasurement of certain temporary differences. The tax benefit of the measurement-period adjustment on the 2018 effective tax rate was approximately
0.6%
. A total decrease of the deferred tax liabilities by
$1.462 billion
has been recorded to date with a corresponding adjustment of
$1.462 billion
to income tax benefit.
Deemed Repatriation Transition Tax:
This is a
tax on previously untaxed accumulated and current earnings and profits (E&P) of foreign subsidiaries. To determine the amount of the transition tax, we must determine, in addition to other factors, the amount of post-1986 E&P of the relevant subsidiaries, as well as the amount of non-U.S. income taxes paid on such earnings. We were able to make a reasonable estimate of the Transition Tax and recorded a provisional Transition Tax obligation of
$231 million
in the period ended December 31, 2017. On the basis of revised E&P computations that were calculated during the SAB 118 measurement period, as well as the impacts of guidance received from the IRS pertaining to the Transition Tax computation, we recognized an adjustment of
$25 million
related to the Transition Tax obligation. The tax benefit of the measurement-period adjustment on the 2018 effective tax rate was approximately
1.4%
. A total Transition Tax obligation of
$206 million
has been recorded.
Valuation Allowances:
The Company has assessed whether its U.S. state and local income tax valuation allowance analysis is affected by various aspects of the
Tax Act (e.g. deemed repatriation of foreign income, acceleration of cost recovery). For certain of our state deferred tax assets, we recorded a net
$3 million
provisional decrease in the recorded valuation allowance with a corresponding adjustment to deferred income tax benefit in the same amount for the year ended December 31, 2017. The Company has determined at the conclusion of the SAB 118 measurement period that the Tax Act had no additional direct impact on the state and local income tax valuation allowance. Therefore the accounting for this item is complete and no change was recorded in the year ended December 31, 2018.
Global Intangible Low-Taxed Income (GILTI):
The Tax Act subjects a U.S. shareholder to current tax on GILTI earned by certain foreign subsidiaries. The FASB Staff Q&A, Topic 740 No. 5, "Accounting for Global Intangible Low-Taxed Income," states that an entity can make an accounting policy election to either recognize deferred taxes for temporary differences expected to reverse as GILTI in future years, or provide for the tax expense related to GILTI in the year the tax is incurred. We have elected to recognize the tax on GILTI as a period expense in the period the tax is incurred.
Undistributed Earnings of Subsidiaries:
The Company provides for foreign withholding taxes and any applicable U.S. state income taxes on earnings intended to be repatriated from non-U.S. subsidiaries, which we believe will be limited in the future to each year's current earnings. No provision for these taxes on approximately
$1.7 billion
of undistributed earnings of non-U.S. subsidiaries as of December 31, 2018 has been made, as these earnings are considered indefinitely invested. Determination of the amount of taxes that might be paid on these undistributed earnings if eventually remitted in a taxable manner is not practicable.
If management decided to monetize the Company’s foreign investments, we would recognize the tax cost related to the excess of the book value over the tax basis of those investments. This would include foreign withholding taxes and any applicable U.S. Federal and state income taxes. Determination of the tax cost that that would be incurred upon monetization of the Company’s foreign investments is not practicable; however, we do not believe it would be material.
59
The provision (benefit) for income taxes from continuing operations (excluding noncontrolling interests) by taxing jurisdiction was as follows:
|
In millions
|
2018
|
2017
|
2016
|
||||||
|
Current tax provision (benefit)
|
|||||||||
|
U.S. federal
|
$
|
227
|
|
$
|
(73
|
)
|
$
|
(7
|
)
|
|
U.S. state and local
|
37
|
|
(23
|
)
|
(12
|
)
|
|||
|
Non-U.S.
|
165
|
|
112
|
|
76
|
|
|||
|
|
$
|
429
|
|
$
|
16
|
|
$
|
57
|
|
|
Deferred tax provision (benefit)
|
|||||||||
|
U.S. federal
|
$
|
12
|
|
$
|
(1,150
|
)
|
$
|
134
|
|
|
U.S. state and local
|
50
|
|
9
|
|
27
|
|
|||
|
Non-U.S.
|
(46
|
)
|
40
|
|
(25
|
)
|
|||
|
|
$
|
16
|
|
$
|
(1,101
|
)
|
$
|
136
|
|
|
Income tax provision (benefit)
|
$
|
445
|
|
$
|
(1,085
|
)
|
$
|
193
|
|
The Company’s deferred income tax provision (benefit) includes a
$13 million
benefit, a
$1.459 billion
benefit and a
$18 million
provision for
2018
,
2017
and
2016
, respectively, for the effect of various changes in non-U.S. and U.S. federal and state tax rates.
International Paper made income tax payments, net of refunds, of
$388 million
,
$7 million
and
$90 million
in
2018
,
2017
and
2016
, respectively.
A reconciliation of income tax expense using the statutory U.S. income tax rate compared with the actual income tax provision follows:
|
In millions
|
2018
|
2017
|
2016
|
||||||
|
Earnings (loss) from continuing
operations before income taxes and equity earnings |
$
|
1,781
|
|
$
|
848
|
|
$
|
795
|
|
|
Statutory U.S. income tax rate
|
21
|
%
|
35
|
%
|
35
|
%
|
|||
|
Tax expense (benefit) using statutory U.S. income tax rate
|
374
|
|
297
|
|
278
|
|
|||
|
State and local income taxes
|
72
|
|
(7
|
)
|
8
|
|
|||
|
Impact of rate differential on non-U.S. permanent differences and earnings
|
35
|
|
(36
|
)
|
(26
|
)
|
|||
|
Tax expense (benefit) on manufacturing activities
|
(1
|
)
|
23
|
|
(10
|
)
|
|||
|
Non-deductible business expenses
|
27
|
|
7
|
|
9
|
|
|||
|
Sale of non-strategic assets
|
—
|
|
—
|
|
12
|
|
|||
|
Tax audits
|
28
|
|
—
|
|
(14
|
)
|
|||
|
Subsidiary liquidation
|
—
|
|
—
|
|
(63
|
)
|
|||
|
Deemed repatriation, net of foreign tax credits
|
(25
|
)
|
231
|
|
—
|
|
|||
|
U.S. federal tax rate change
|
(13
|
)
|
(1,451
|
)
|
—
|
|
|||
|
Foreign derived intangible income deduction
|
(25
|
)
|
—
|
|
—
|
|
|||
|
US tax on non-U.S. earnings (GILTI and Subpart F)
|
19
|
|
44
|
|
21
|
|
|||
|
Foreign tax credits
|
(15
|
)
|
(96
|
)
|
(11
|
)
|
|||
|
General business and other tax credits
|
(26
|
)
|
(86
|
)
|
(15
|
)
|
|||
|
Other, net
|
(5
|
)
|
(11
|
)
|
4
|
|
|||
|
Income tax provision (benefit)
|
$
|
445
|
|
$
|
(1,085
|
)
|
$
|
193
|
|
|
Effective income tax rate
|
25
|
%
|
(128
|
)%
|
24
|
%
|
|||
The tax effects of significant temporary differences, representing deferred income tax assets and liabilities at
December 31, 2018
and
2017
, were as follows:
|
In millions
|
2018
|
2017
|
||||
|
Deferred income tax assets:
|
||||||
|
Postretirement benefit accruals
|
$
|
89
|
|
$
|
102
|
|
|
Pension obligations
|
465
|
|
516
|
|
||
|
Alternative minimum and other tax credits
|
291
|
|
416
|
|
||
|
Net operating and capital loss carryforwards
|
594
|
|
665
|
|
||
|
Compensation reserves
|
191
|
|
174
|
|
||
|
Other
|
164
|
|
139
|
|
||
|
Gross deferred income tax assets
|
1,794
|
|
2,012
|
|
||
|
Less: valuation allowance (a)
|
(441
|
)
|
(429
|
)
|
||
|
Net deferred income tax asset
|
$
|
1,353
|
|
$
|
1,583
|
|
|
Deferred income tax liabilities:
|
||||||
|
Intangibles
|
$
|
(152
|
)
|
$
|
(139
|
)
|
|
Investments
|
(255
|
)
|
—
|
|
||
|
Plants, properties and equipment
|
(1,826
|
)
|
(2,000
|
)
|
||
|
Forestlands, related installment sales, and investment in subsidiary
|
(1,453
|
)
|
(1,454
|
)
|
||
|
Gross deferred income tax liabilities
|
$
|
(3,686
|
)
|
$
|
(3,593
|
)
|
|
Net deferred income tax liability
|
$
|
(2,333
|
)
|
$
|
(2,010
|
)
|
60
(a) The net change in the total valuation allowance for the years ended December 31, 2018 and 2017 was an increase of
$12 million
and an increase of
$26 million
, respectively.
Deferred income tax assets and liabilities are recorded in the accompanying consolidated balance sheet under the captions Deferred charges and other assets and Deferred income taxes. There was a decrease in deferred income tax assets principally relating to the utilization of U.S. Federal alternative minimum tax credits as permitted under Tax Reform. Deferred tax liabilities increased primarily due to the tax deferral of the book gain recognized on the transfer of the North American Consumer Packaging business to a subsidiary of Graphic Packaging Holding Company. Of the
$1.5 billion
of deferred tax liabilities for forestlands, related installment sales, and investment in subsidiary,
$884 million
is attributable to an investment in subsidiary and relates to a 2006 International Paper installment sale of forestlands and
$538 million
is attributable to a 2007 Temple-Inland installment sale of forestlands (see
Note 14
).
A reconciliation of the beginning and ending amount of unrecognized tax benefits for the years ended
December 31, 2018
,
2017
and
2016
is as follows:
|
In millions
|
2018
|
2017
|
2016
|
||||||
|
Balance at January 1
|
$
|
(188
|
)
|
$
|
(98
|
)
|
$
|
(150
|
)
|
|
(Additions) reductions based on tax positions related to current year
|
(7
|
)
|
(54
|
)
|
(4
|
)
|
|||
|
(Additions) for tax positions of prior years
|
(37
|
)
|
(40
|
)
|
(3
|
)
|
|||
|
Reductions for tax positions of prior years
|
5
|
|
4
|
|
33
|
|
|||
|
Settlements
|
2
|
|
6
|
|
19
|
|
|||
|
Expiration of statutes of
limitations |
2
|
|
1
|
|
5
|
|
|||
|
Currency translation adjustment
|
3
|
|
(7
|
)
|
2
|
|
|||
|
Balance at December 31
|
$
|
(220
|
)
|
$
|
(188
|
)
|
$
|
(98
|
)
|
If the Company were to prevail on the unrecognized tax benefits recorded, substantially all of the balances at
December 31, 2018
,
2017
and
2016
would benefit the effective tax rate.
The Company accrues interest on unrecognized tax benefits as a component of interest expense. Penalties, if incurred, are recognized as a component of income
tax expense. The Company had approximately
$21 million
and
$17 million
accrued for the payment of
estimated interest and penalties associated with unrecognized tax benefits at
December 31, 2018
and
2017
, respectively.
The major jurisdictions where the Company files income tax returns are the United States, Brazil, France, Poland and Russia. Generally, tax years 2006 through 2017 remain open and subject to examination by the relevant tax authorities. The Company frequently faces challenges regarding the amount of taxes due. These challenges include positions taken by the Company related to the timing, nature, and amount of deductions and the allocation of income among various tax jurisdictions. Pending audit settlements and the expiration of statute of limitations could reduce the uncertain tax positions by
$30 million
during the next twelve months.
The Brazilian Federal Revenue Service has challenged the deductibility of goodwill amortization generated in a 2007 acquisition by International Paper do Brasil Ltda., a wholly-owned subsidiary of the Company. The Company received assessments for the tax years 2007-2015 totaling approximately
$150 million
in tax, and
$380 million
in interest and penalties as of December 31, 2018 (adjusted for variation in currency exchange rates). After a previous favorable ruling challenging the basis for these assessments, we received an unfavorable decision in October 2018 from the Brazilian Administrative Council of Tax Appeals. The Company intends to further appeal the matter in the Brazilian federal courts in 2019; however, this tax litigation matter may take many years to resolve. The Company believes that it has appropriately evaluated the transaction underlying these assessments, and has concluded based on Brazilian tax law, that its tax position would be sustained. The Company intends to vigorously defend its position against the current assessments and any similar assessments that may be issued for tax years subsequent to 2015.
International Paper uses the flow-through method to account for investment tax credits earned on eligible open-loop biomass facilities and combined heat and power system expenditures. Under this method, the investment tax credits are recognized as a reduction to income tax expense in the year they are earned rather than a reduction in the asset basis. The Company recorded a tax benefit of
$6 million
during 2018 and recorded a tax benefit of
$68 million
during 2017 related to Investment Tax Credits earned in tax years 2013-2017.
61
The following details the scheduled expiration dates of the Company’s net operating loss and income tax credit carryforwards:
|
In millions
|
2019
Through 2028 |
2029
Through 2038 |
Indefinite
|
Total
|
||||||||
|
U.S. federal and non-U.S. NOLs
|
$
|
53
|
|
$
|
—
|
|
$
|
417
|
|
$
|
470
|
|
|
State taxing jurisdiction NOLs (a)
|
80
|
|
42
|
|
—
|
|
122
|
|
||||
|
U.S. federal, non-
U.S. and state tax credit carryforwards (a) |
162
|
|
11
|
|
118
|
|
291
|
|
||||
|
U.S. federal and state capital loss carryforwards (a)
|
2
|
|
—
|
|
—
|
|
2
|
|
||||
|
Total
|
$
|
297
|
|
$
|
53
|
|
$
|
535
|
|
$
|
885
|
|
|
Less: valuation allowance (a)
|
(192
|
)
|
(8
|
)
|
(198
|
)
|
(398
|
)
|
||||
|
Total, net
|
$
|
105
|
|
$
|
45
|
|
$
|
337
|
|
$
|
487
|
|
(a) State amounts are presented net of federal benefit.
OPERATING LEASES
Certain property, machinery and equipment are leased under cancelable and non-cancelable agreements.
At
December 31, 2018
, total future minimum commitments under existing non-cancelable operating leases were as follows:
|
In millions
|
2019
|
2020
|
2021
|
2022
|
2023
|
Thereafter
|
||||||||||||
|
Lease obligations
|
$
|
160
|
|
$
|
125
|
|
$
|
77
|
|
$
|
49
|
|
$
|
28
|
|
$
|
118
|
|
Rent expense was
$196 million
,
$157 million
and
$150 million
for
2018
,
2017
and
2016
, respectively.
GUARANTEES
In connection with sales of businesses, property, equipment, forestlands and other assets, International Paper commonly makes representations and warranties relating to such businesses or assets, and may agree to indemnify buyers with respect to tax and environmental liabilities, breaches of representations and warranties, and other matters. Where liabilities for such matters are determined to be probable and subject to reasonable estimation, accrued liabilities are recorded at the time of sale as a cost of the transaction.
ENVIRONMENTAL AND LEGAL PROCEEDINGS
Environmental
International Paper has been named as a potentially responsible party (PRP) in environmental remediation actions under various federal and state laws, including
the Comprehensive Environmental Response, Compensation and Liability Act (CERCLA). Many of these proceedings involve the cleanup of hazardous substances at large commercial landfills that received waste from many different sources. While joint and several liability is authorized under CERCLA and equivalent state laws, as a practical matter, liability for CERCLA cleanups is typically allocated among the many PRPs. There are other remediation costs typically associated with the cleanup of hazardous substances at the Company’s current, closed or formerly-owned facilities, and recorded as liabilities in the balance sheet.
Remediation costs are recorded in the consolidated financial statements when they become probable and reasonably estimable. International Paper has estimated the probable liability associated with these matters to be approximately
$128 million
(
$138 million
undiscounted) in the aggregate as of December 31,
2018
. Other than as described below, completion of required remedial actions is not expected to have a material effect on our consolidated financial statements.
Cass Lake:
One of the matters included above arises out of a closed wood-treating facility located in Cass Lake, Minnesota. In June 2011, the United States Environmental Protection Agency (EPA) selected and published a proposed soil remedy at the site with an estimated cost of
$46 million
. The overall remediation reserve for the site is currently
$49 million
to address the selection of an alternative for the soil remediation component of the overall site remedy, which includes the ongoing groundwater remedy. In October 2011, the EPA released a public statement indicating that the final soil remedy decision would be delayed. In March 2016, the EPA issued a proposed plan concerning clean-up standards at a portion of the site, the estimated cost of which is included within the reserve referenced above. In October 2012, the Natural Resource Trustees for this site provided notice to International Paper and other PRPs of their intent to perform a Natural Resource Damage Assessment. It is premature to predict the outcome of the assessment or to estimate a loss or range of loss, if any, which may be incurred.
Kalamazoo River:
The Company is a PRP with respect to the Allied Paper, Inc./Portage Creek/Kalamazoo River Superfund Site in Michigan. The EPA asserts that the site is contaminated by polychlorinated biphenyls (PCBs) primarily as a result of discharges from various paper mills located along the Kalamazoo River, including a paper mill (the Allied Paper Mill) formerly owned by St. Regis Paper Company (St. Regis). The Company is a successor in interest to St. Regis.
|
•
|
In March 2016, the Company and other PRPs received a special notice letter from the EPA (i) inviting participation in implementing a remedy for a portion of the site known as Operable Unit 5, Area 1,
|
62
and (ii) demanding reimbursement of EPA past costs totaling
$37 million
, including
$19 million
in past costs previously demanded by the EPA. The Company responded to the special notice letter. In December 2016, the EPA issued a unilateral administrative order to the Company and other PRPs to perform the remedy. The Company responded to the unilateral administrative order, agreeing to comply with the order subject to its sufficient cause defenses.
|
•
|
In April 2016, the EPA issued a separate unilateral administrative order to the Company and certain other PRPs for a time-critical removal action (TCRA) of PCB-contaminated sediments from a different portion of the site. The Company responded to the unilateral administrative order and agreed along with two other parties to comply with the order subject to its sufficient cause defenses.
|
|
•
|
In October 2016, the Company and another PRP received a special notice letter from the EPA inviting participation in the remedial design component of the landfill remedy for the Allied Paper Mill. The record of decision establishing the final landfill remedy for the Allied Paper Mill was issued by the EPA in September 2016. The Company responded to the Allied Paper Mill special notice letter in late December 2016. In February 2017, the EPA informed the Company that it would make other arrangements for the performance of the remedial design.
|
The Company’s CERCLA liability has not been finally determined with respect to these or any other portions of the site, and except as noted above, the Company has declined to perform any work or reimburse the EPA at this time. As noted below, the Company is involved in allocation/apportionment litigation with regard to the site. Accordingly, it is premature to predict the outcome or estimate our maximum reasonably possible loss with respect to this site. However, we do not believe that any material loss is probable.
The Company was named as a defendant by Georgia-Pacific Consumer Products LP, Fort James Corporation and Georgia Pacific LLC in a contribution and cost recovery action for alleged pollution at the site. The suit seeks contribution under CERCLA for costs purportedly expended by plaintiffs (
$79 million
as of the filing of the complaint) and for future remediation costs. The suit alleges that a mill, during the time it was allegedly owned and operated by St. Regis, discharged PCB contaminated solids and paper residuals resulting from paper de-inking and recycling. NCR Corporation and Weyerhaeuser Company are also named as defendants in the suit. In mid-2011, the suit was transferred from the District Court for the Eastern District of Wisconsin to the District Court for the Western District of Michigan.
The trial of the initial liability phase took place in February 2013. Weyerhaeuser conceded prior to trial that it was a liable party with respect to the site. In September 2013, an opinion and order was issued in the suit. The order concluded that the Company (as the successor to St. Regis) was not an “operator,” but was an “owner,” of the mill at issue during a portion of the relevant period and is therefore liable under CERCLA. The order also determined that NCR is a liable party as an "arranger for disposal" of PCBs in waste paper that was de-inked and recycled by mills along the Kalamazoo River. The order did not address the Company's responsibility, if any, for past or future costs. The parties’ responsibility, including that of the Company, was the subject of a second trial, which was concluded in late 2015. In June 2018, the Court issued its Final Judgment and Order, which fixed the past cost amount at approximately
$50 million
(plus interest to be determined) and allocated to the Company a
15%
share of responsibility for those past costs. The Court did not address responsibility for future costs in its decision. In July 2018, the Company and each of the other parties filed notices appealing the Final Judgment and prior orders incorporated into that Judgment. As to future remediation costs, we remain unable to estimate our maximum reasonably possible loss with respect to this site. However, we do not believe that any material loss is probable.
Harris County:
International Paper and McGinnis Industrial Maintenance Corporation (MIMC), a subsidiary of Waste Management, Inc. (WMI), are PRPs at the San Jacinto River Waste Pits Superfund Site in Harris County, Texas. The PRPs have been actively participating in the activities at the site and share the costs of these activities. In September 2016, the EPA issued a proposed remedial action plan (PRAP) for the site, which identified the preferred remedy as the removal of the contaminated material currently protected by an armored cap. In addition, the EPA selected a preferred remedy for the separate southern impoundment that requires offsite disposal. In January 2017, the PRPs submitted comments on the PRAP.
On October 11, 2017, the EPA issued a Record of Decision (ROD) selecting the final remedy for the site: removal and relocation of the waste material from both the northern and southern impoundments. The EPA did not specify the methods or practices needed to perform this work. While the EPA’s selected remedy was accompanied by a cost estimate of approximately
$115 million
, we do not believe that estimate provides a reasonable basis for accrual under GAAP because the estimate was based on a technological method for performing the work that we believe is not feasible. Subsequent to the issuance of the ROD, there have been numerous meetings between the EPA and the PRPs, and the Company continues to work with the EPA and MIMC/WMI to develop the remedial design.
63
To this end, in April 2018, the PRPs entered into an Administrative Order on Consent (AOC) with the EPA, agreeing to work together to develop the remedial design over the subsequent 29 months. The AOC does not include any agreement to perform waste removal or other construction activity at the site. Rather, it involves adaptive management techniques and a pre-design investigation, the objectives of which include filling data gaps (including but not limited to post-Hurricane Harvey technical data generated prior to the ROD and not incorporated into the selected remedy), refining areas and volumes of materials to be addressed, determining if an excavation remedy is able to be implemented in a manner protective of human health and the environment, and investigating potential impacts of remediation activities to infrastructure in the vicinity.
The Company has identified a number of concerns and uncertainties regarding the remedy described in the ROD and regarding the EPA’s estimates for the costs and time required to implement the selected remedy. The Company has determined, however, that even if the ROD cannot be implemented, a sheet pile "engineered barrier" can be constructed, which would enhance the existing remedy and could also be used should the ROD be determined to be feasible and implementable. We have increased our recorded liability accordingly to reflect the estimated cost of constructing this barrier. Because of ongoing questions regarding cost effectiveness, technical feasibility, timing and other technical data, however, it is uncertain how the ROD will be implemented. Consequently, while additional losses are probable as a result of the selected remedy, we are currently unable to determine any further adjustment to our immaterial recorded liability. It remains reasonably possible that additional losses could be material as the remedial design process with the EPA continues over the coming quarters.
International Paper and MIMC/WMI are also defending an additional lawsuit related to the site brought by approximately
600
individuals who allege property damage and personal injury. Because this case is still in the discovery phase, it is premature to predict the outcome or to estimate a loss or range of loss, if any, which may be incurred.
Antitrust
Containerboard:
In June 2016, a lawsuit captioned
Ashley Furniture Indus., Inc. v. Packaging Corporation of America (W.D. Wis.)
, was filed in federal court in Wisconsin against
ten
defendants, including the Company, Temple-Inland and Weyerhaeuser Company. The
Ashley Furniture
lawsuit alleged a civil violation of Section 1 of the Sherman Act (in particular, that defendants conspired to limit the supply and thereby increase prices of containerboard products), and also asserted Wisconsin state antitrust claims. In January
2019, the parties filed a stipulation to dismiss the
Ashley Furniture
lawsuit with prejudice, and the case is now closed. The Company made no payment in consideration for the dismissal.
In January 2011, International Paper was named as a defendant in a lawsuit filed in state court in Cocke County, Tennessee alleging that International Paper violated Tennessee law by conspiring to limit the supply and fix the prices of containerboard from mid-2005 to the present. Plaintiffs in the state court action seek certification of a class of Tennessee indirect purchasers of containerboard products, damages and costs, including attorneys' fees. No class certification materials have been filed to date in the Tennessee action. The Company disputes the allegations made in the Tennessee lawsuit and is vigorously defending it. At this time, however, because the action is in a preliminary stage, we are unable to predict an outcome or estimate a range of reasonably possible loss.
Contract
Signature:
In August 2014, a lawsuit captioned
Signature Industrial Services LLC et al. v. International Paper Company
was filed in state court in Texas. The
Signature
lawsuit arises out of approximately
$1 million
in disputed invoices related to the installation of new equipment at the Company's Orange, Texas mill. In addition to the invoices in dispute,
Signature
and its president allege consequential damages arising from the Company's nonpayment of those invoices. The lawsuit was tried before a jury in Beaumont, Texas, in May 2017. On June 1, 2017, the jury returned a verdict awarding approximately
$125 million
in damages to the plaintiffs. The Court issued a judgment on December 14, 2017, awarding the plaintiffs a total of approximately
$137 million
in actual and consequential damages, fees, costs and pre-judgment interest, and awarding post-judgment interest. The Company has appealed this judgment. The Company has presented in its briefing numerous and strong bases for appeal, and we believe we will prevail on appeal. Because the appellate proceedings are ongoing, we are unable to estimate a range of reasonably possible loss, but we expect the amount of any loss to be immaterial.
General
The Company is involved in various other inquiries, administrative proceedings and litigation relating to environmental and safety matters, personal injury, labor and employment, contracts, sales of property, intellectual property, tax and other matters, some of which allege substantial monetary damages. While any proceeding or litigation has the element of uncertainty, the Company believes that the outcome of any of these other lawsuits or claims that are pending or threatened or all of them combined (other than those that cannot be assessed due to their preliminary nature) will not have
64
a material effect on its consolidated financial statements. See
Note 12
for details regarding a tax matter.
In connection with the 2006 sale of approximately
5.6 million
acres of forestlands, International Paper received installment notes (the Timber Notes) totaling approximately
$4.8 billion
.
The Timber Notes were used as collateral for borrowings from third party lenders, which effectively monetized the Timber Notes through the creation of newly formed special purposes entities (the Entities). The monetization structure preserved the tax deferral that resulted from the 2006 forestlands sales. As of December 31, 2018, this deferred tax liability was
$884 million
.
During 2015, International Paper initiated a series of actions in order to extend the 2006 monetization structure and maintain the long-term nature of the deferred tax liability. The Entities, with assets and liabilities primarily consisting of the Timber Notes and third-party bank loans (the Extension Loans), were restructured which resulted in the formation of wholly-owned, bankruptcy-remote special purpose entities (the 2015 Financing Entities).
The Timber Notes are shown in Financial assets of special purpose entities on the accompanying consolidated balance sheet and mature in
August 2021
unless extended for an additional
five
years. These notes, which do not require principal payments prior to their maturity, are supported by approximately
$4.8 billion
of irrevocable letters of credit.
The Extension Loans are shown in Nonrecourse financial liabilities of special purpose entities on the accompanying consolidated balance sheet and mature in the fourth quarter of 2020. These bank loans, totaling approximately
$4.2 billion
, are nonrecourse to the Company, and are secured by approximately
$4.8 billion
of Timber Notes, the irrevocable letters of credit supporting the Timber Notes and approximately
$150 million
of International Paper debt obligations. The
$150 million
of International Paper debt obligations are eliminated in the consolidation of the 2015 Financing Entities and are not reflected in the Company’s consolidated balance sheet. Provisions of loan agreements related to approximately
$1.1 billion
of the Extension Loans require the bank issuing letters of credit supporting the Timber Notes pledged as collateral to maintain a credit rating at or above a specified threshold. In the event the credit rating of the letter of credit bank is downgraded below the specified threshold, the letters of credit must be replaced within
60 days
with letters of credit from a qualifying financial institution.
As of December 31, 2018 and 2017, the fair value of the Timber Notes was
$4.7 billion
and
$4.8 billion
, respectively, and the fair value of the Extension Loans was
$4.2 billion
and
$4.3 billion
for the years ended 2018 and 2017. The Timber Notes and Extension Loans are classified as Level 2 within the fair value hierarchy, which is further defined in
Note 16
.
Activity between the Company and the 2015 Financing Entities was as follows:
|
In millions
|
2018
|
2017
|
2016
|
||||||
|
Revenue (a)
|
$
|
95
|
|
$
|
95
|
|
$
|
95
|
|
|
Expense (a)
|
128
|
|
128
|
|
128
|
|
|||
|
Cash receipts (b)
|
95
|
|
95
|
|
77
|
|
|||
|
Cash payments (c)
|
128
|
|
128
|
|
98
|
|
|||
|
(a)
|
The revenue and expense are included in Interest expense, net in the accompanying consolidated statement of operations.
|
|
(b)
|
The cash receipts are interest received on the Financial assets of special purpose entities.
|
|
(c)
|
The cash payments represent interest paid on Nonrecourse financial liabilities of special purpose entities.
|
In connection with the acquisition of Temple-Inland in February 2012, two special purpose entities became wholly-owned subsidiaries of International Paper.
The use of the two wholly-owned special purpose entities discussed below preserved the tax deferral that resulted from the 2007 Temple-Inland timberlands sales. As of December 31, 2018, this deferred tax liability was
$538 million
, which will be settled with the maturity of the notes in
2027
.
In October 2007, Temple-Inland sold
1.55 million
acres of timberland for
$2.4 billion
. The total consideration consisted almost entirely of notes due in
2027
issued by the buyer of the timberland, which Temple-Inland contributed to two wholly-owned, bankruptcy-remote special purpose entities. The notes are shown in Financial assets of special purpose entities in the accompanying consolidated balance sheet and are supported by
$2.4 billion
of irrevocable letters of credit issued by three banks, which are required to maintain minimum credit ratings on their long-term debt. As of December 31, 2018 and 2017, the fair value of the notes was
$2.2 billion
and
$2.3 billion
, respectively. These notes are classified as Level 2 within the fair value hierarchy, which is further defined in
Note 16
.
In December 2007, Temple-Inland's two wholly-owned special purpose entities borrowed
$2.1 billion
which is shown in Nonrecourse financial liabilities of special purpose entities. The loans are repayable in
2027
and are secured by the
$2.4 billion
of notes and the irrevocable letters of credit securing the notes, and are nonrecourse to us. The loan agreements provide that if a credit rating of any of the banks issuing the letters of credit is downgraded below the specified threshold, the
65
letters of credit issued by that bank must be replaced within
30 days
with letters of credit from another qualifying financial institution. As of December 31, 2018 and 2017, the fair value of this debt was
$2.0 billion
and
$2.1 billion
for the years ended 2018 and 2017, respectively. This debt is classified as Level 2 within the fair value hierarchy, which is further defined in
Note 16
.
Activity between the Company and the 2007 financing entities was as follows:
|
In millions
|
2018
|
2017
|
2016
|
||||||
|
Revenue (a)
|
$
|
72
|
|
$
|
49
|
|
$
|
37
|
|
|
Expense (b)
|
67
|
|
48
|
|
37
|
|
|||
|
Cash receipts (c)
|
48
|
|
28
|
|
15
|
|
|||
|
Cash payments (d)
|
57
|
|
39
|
|
27
|
|
|||
|
(a)
|
The revenue is included in Interest expense, net, in the accompanying consolidated statement of operations and includes approximately
$19 million
for the years ended December 31, 2018, 2017 and 2016, respectively, of accretion income for the amortization of the purchase accounting adjustment on the Financial assets of special purpose entities.
|
(b) The expense is included in Interest expense, net, in the accompanying consolidated statement of operations and includes approximately
$7 million
for the years ended December 31, 2018, 2017 and 2016, respectively, of accretion expense for the amortization of the purchase accounting adjustment on the Nonrecourse financial liabilities of special purpose entities.
(c) The cash receipts are interest received on the Financial assets of special purpose entities.
(d) The cash payments are interest paid on Nonrecourse financial liabilities of special purpose entities.
Amounts related to early debt extinguishment during the years ended December 31,
2018
,
2017
and
2016
were as follows:
|
In millions
|
2018
|
2017
|
2016
|
||||||
|
Debt reductions (a)
|
$
|
780
|
|
$
|
993
|
|
$
|
266
|
|
|
Pre-tax early debt extinguishment costs (b)
|
10
|
|
83
|
|
29
|
|
|||
|
(a)
|
Reductions related to notes with interest rates ranging from
1.57%
to
9.38%
with original maturities from
2018
to
2032
for the years ended December 31,
2018
,
2017
and
2016
.
|
|
(b)
|
Amounts are included in Restructuring and other charges in the accompanying consolidated statements of operations.
|
In June 2018, the borrowing capacity of the commercial paper program was increased from
$750 million
to
$1.0 billion
. Under the terms of the program, individual maturities on borrowings may vary, but not exceed one year from the date of issue. Interest bearing notes may be issued either as fixed notes or floating rate notes. As of
December 31, 2018
, the Company had
$465 million
outstanding under this program.
A summary of long-term debt follows:
|
In millions at December 31
|
2018
|
2017
|
||||
|
8.7% note – due 2038
|
$
|
264
|
|
$
|
264
|
|
|
7.5% note – due 2021
|
406
|
|
409
|
|
||
|
7.3% note – due 2039
|
721
|
|
721
|
|
||
|
6 7/8% notes – due 2023 – 2029
|
131
|
|
131
|
|
||
|
6.65% note – due 2037
|
4
|
|
4
|
|
||
|
6.4% to 7.75% debentures due 2025 – 2027
|
144
|
|
143
|
|
||
|
6.0% note – due 2041
|
585
|
|
585
|
|
||
|
5.00% to 5.15% notes – due 2035 – 2046
|
1,288
|
|
1,281
|
|
||
|
4.8% note – due 2044
|
799
|
|
796
|
|
||
|
4.75% note – due 2022
|
355
|
|
817
|
|
||
|
3.00% to 4.40% notes – due 2024 – 2048
|
4,481
|
|
4,775
|
|
||
|
Floating rate notes – due 2018 – 2023 (a)
|
908
|
|
650
|
|
||
|
Environmental and industrial development bonds – due 2018 – 2035 (b)
|
566
|
|
585
|
|
||
|
Other (c)
|
2
|
|
(4
|
)
|
||
|
Total (d)
|
10,654
|
|
11,157
|
|
||
|
Less: current maturities
|
639
|
|
311
|
|
||
|
Long-term debt
|
$
|
10,015
|
|
$
|
10,846
|
|
|
(a)
|
The weighted average interest rate on these notes was
3.5%
in
2018
and
2.6%
in
2017
.
|
|
(b)
|
The weighted average interest rate on these bonds was
5.5%
in
2018
and
6.0%
in
2017
.
|
|
(c)
|
Includes
$60 million
and
$70 million
of debt issuance costs as of December 31, 2018 and 2017, respectively.
|
|
(d)
|
The fair market value was approximately
$10.6 billion
at December 31, 2018 and
$12.3 billion
at
December 31, 2017
.
|
Total maturities of long-term debt over the next five years are
2019
–
$639 million
;
2020
–
$83 million
;
2021
–
$441 million
;
2022
–
$487 million
; and
2023
–
$348 million
.
At
December 31, 2018
, International Paper’s credit facilities (the Agreements) totaled
$2.1 billion
. The Agreements generally provide for interest rates at a floating rate index plus a pre-determined margin dependent upon International Paper’s credit rating. The Agreements include a
$1.5 billion
contractually committed bank facility that expires in
December 2021
, and has a facility fee of
0.15%
payable annually. The liquidity facilities also include up to
$600 million
of uncommitted financings based on eligible receivables balances under a receivables securitization program that expires in
December 2019
. At
December 31, 2018
, there were no borrowings under either the bank facility or receivables securitization program.
The Company’s financial covenants require the maintenance of a minimum net worth, as defined in our debt agreements, of
$9 billion
and a total debt-to-capital ratio of less than
60%
. Net worth is defined as the sum of common stock, paid-in capital and retained earnings,
66
less treasury stock plus any cumulative goodwill impairment charges. The calculation also excludes accumulated other comprehensive income/loss and Nonrecourse Financial Liabilities of Special Purpose Entities. The total debt-to-capital ratio is defined as total debt divided by the sum of total debt plus net worth. As of
December 31, 2018
, we were in compliance with our debt covenants.
International Paper periodically uses derivatives and other financial instruments to hedge exposures to interest rate, commodity and currency risks. International Paper does not hold or issue financial instruments for trading purposes. For hedges that meet the hedge accounting criteria, International Paper, at inception, formally designates and documents the instrument as a fair value hedge, a cash flow hedge or a net investment hedge of a specific underlying exposure.
INTEREST RATE RISK MANAGEMENT
Our policy is to manage interest cost using a mixture of fixed-rate and variable-rate debt. To manage this risk in a cost-efficient manner, we enter into interest rate swaps whereby we agree to exchange with the counterparty, at specified intervals, the difference between fixed and variable interest amounts calculated by reference to a notional amount.
Interest rate swaps that meet specific accounting criteria are accounted for as fair value or cash flow hedges. For fair value hedges, the changes in the fair value of both the hedging instruments and the underlying debt obligations are immediately recognized in interest expense. For cash flow hedges, the effective portion of the changes in the fair value of the hedging instrument is reported in Accumulated other comprehensive income (AOCI) and reclassified into interest expense over the life of the underlying debt. The ineffective portion for both cash flow and fair value hedges, which is not material for any year presented, is immediately recognized in earnings.
FOREIGN CURRENCY RISK MANAGEMENT
We manufacture and sell our products and finance operations in a number of countries throughout the world and, as a result, are exposed to movements in foreign currency exchange rates. The purpose of our foreign currency hedging program is to manage the volatility associated with the changes in exchange rates.
To manage this exchange rate risk, we have historically utilized a combination of forward contracts, options and currency swaps. Contracts that qualify are designated as cash flow hedges of certain forecasted transactions denominated in foreign currencies. The effective portion of the changes in fair value of these instruments is reported in AOCI and reclassified into earnings in the same financial statement line item and in the same period or periods during which the related hedged transactions affect earnings. The ineffective portion, which is not material for any year presented, is immediately recognized in earnings.
The change in value of certain non-qualifying instruments used to manage foreign exchange exposure of intercompany financing transactions and certain balance sheet items subject to revaluation is immediately recognized in earnings, substantially offsetting the foreign currency mark-to-market impact of the related exposure.
COMMODITY RISK MANAGEMENT
Certain raw materials used in our production processes are subject to price volatility caused by weather, supply conditions, political and economic variables and other unpredictable factors. To manage the volatility in earnings due to price fluctuations, we may utilize swap contracts or forward purchase contracts.
Derivative instruments are reported in the consolidated balance sheets at their fair values, unless the derivative instruments qualify for the normal purchase normal sale (NPNS) exception under GAAP and such exception has been elected. If the NPNS exception is elected, the fair values of such contracts are not recognized on the balance sheet.
Contracts that qualify are designated as cash flow hedges of forecasted commodity purchases. The effective portion of the changes in fair value for these instruments is reported in AOCI and reclassified into
earnings in the same financial statement line item and in the same period or periods during which the hedged transactions affect earnings. The ineffective and non-qualifying portions, which are not material for any year presented, are immediately recognized in earnings. The change in the fair value of certain non-qualifying instruments used to reduce commodity price volatility is immediately recognized in earnings.
67
The notional amounts of qualifying and non-qualifying instruments used in hedging transactions were as follows:
|
In millions
|
December 31, 2018
|
December 31, 2017
|
||
|
Derivatives in Cash Flow Hedging Relationships:
|
||||
|
Foreign exchange contracts (a)
|
407
|
|
329
|
|
|
Derivatives in Fair Value Hedging Relationships:
|
||||
|
Interest rate contracts
|
700
|
|
—
|
|
|
Derivatives Not Designated as Hedging Instruments:
|
||||
|
Electricity contract
|
8
|
|
13
|
|
|
Foreign exchange contracts
|
19
|
|
10
|
|
|
(a)
|
These contracts had maturities of
two years
or less as of
December 31, 2018
.
|
The following table shows gains or losses recognized in AOCI, net of tax, related to derivative instruments:
|
|
Gain (Loss)
Recognized in AOCI on Derivatives
(Effective Portion)
|
||||||||
|
In millions
|
2018
|
2017
|
2016
|
||||||
|
Foreign exchange contracts
|
$
|
(10
|
)
|
$
|
15
|
|
$
|
4
|
|
|
Interest rate contracts
|
—
|
|
—
|
|
(10
|
)
|
|||
|
Total
|
$
|
(10
|
)
|
$
|
15
|
|
$
|
(6
|
)
|
During the next
12 months
, the amount of the
December 31, 2018
AOCI balance, after tax, that is expected to be reclassified to earnings is a loss of
$4 million
.
The amounts of gains and losses recognized in the consolidated statement of operations on qualifying and non-qualifying financial instruments used in hedging transactions were as follows:
|
|
Gain (Loss)
Reclassified from AOCI into Income (Effective Portion) |
Location of Gain
(Loss) Reclassified from AOCI into Income (Effective Portion) |
|||||||||||
|
In millions
|
2018
|
|
2017
|
|
2016
|
|
|
|
|||||
|
Derivatives in Cash Flow Hedging Relationships:
|
|||||||||||||
|
Foreign exchange contracts
|
$
|
(1
|
)
|
$
|
8
|
|
$
|
7
|
|
|
Cost of products sold
|
||
|
Interest rate contracts
|
(1
|
)
|
(1
|
)
|
—
|
|
Interest expense, net
|
||||||
|
Total
|
$
|
(2
|
)
|
$
|
7
|
|
$
|
7
|
|
|
|||
|
|
Gain (Loss)
Recognized
in Income
|
|
Location of Gain (Loss)
in Consolidated Statement of
Operations
|
|||||||||||||
|
In millions
|
2018
|
|
2017
|
|
2016
|
|
|
|||||||||
|
Derivatives in Fair Value Hedging Relationships:
|
||||||||||||||||
|
Interest rate contracts
|
$
|
16
|
|
$
|
—
|
|
|
$
|
—
|
|
Interest expense, net
|
|||||
|
Debt
|
(16
|
)
|
|
—
|
|
—
|
|
|
Interest expense, net
|
|||||||
|
Total
|
$
|
—
|
|
|
$
|
—
|
|
|
$
|
—
|
|
|
|
|||
|
Derivatives Not Designated as Hedging Instruments:
|
||||||||||||||||
|
Electricity Contracts
|
$
|
2
|
|
$
|
(10
|
)
|
$
|
—
|
|
Cost of products sold
|
||||||
|
Foreign exchange contracts
|
1
|
|
—
|
|
|
—
|
|
Cost of products sold
|
||||||||
|
Interest rate contracts
|
—
|
|
|
1
|
|
(a)
|
5
|
|
(b)
|
Interest expense, net
|
||||||
|
Total
|
$
|
3
|
|
$
|
(9
|
)
|
|
$
|
5
|
|
|
|||||
|
(a)
|
Excluding gain of
$1 million
related to debt reduction recorded to Restructuring and other charges.
|
|
(b)
|
Excluding gain of
$2 million
related to debt reduction recorded to Restructuring and other charges.
|
Fair Value Measurements
International Paper’s financial assets and liabilities that are recorded at fair value consist of derivative contracts, including interest rate swaps, foreign currency forward contracts, options and other financial instruments that
are used to hedge exposures to interest rate, commodity and currency risks. For these financial instruments, fair value is determined at each balance sheet date using an income approach.
68
The guidance for fair value measurements and disclosures sets out a fair value hierarchy that groups fair value measurement inputs into the following three classifications:
Level 1: Quoted market prices in active markets for identical assets or liabilities.
Level 2: Observable market-based inputs other than quoted prices included within Level 1 that are observable for the asset or liability, either directly or indirectly.
Level 3: Unobservable inputs for the asset or liability reflecting the reporting entity’s own assumptions or external inputs from inactive markets.
Transfers between levels are recognized at the end of the reporting period. All of International Paper’s derivative fair value measurements use Level 2 inputs.
Below is a description of the valuation calculation and the inputs used for each class of contract:
Interest Rate Contracts
Interest rate contracts are valued using swap curves obtained from an independent market data provider. The market value of each contract is the sum of the fair value of all future interest payments between the contract counterparties, discounted to present value. The fair value of the future interest payments is determined by comparing the contract rate to the derived forward
interest rate and present valued using the appropriate derived interest rate curve.
Foreign Exchange Contracts
Foreign currency forward and option contracts are valued using standard valuation models. Significant inputs used in these standard valuation models are foreign currency forward and interest rate curves and a volatility measurement. The fair value of each contract is present valued using the applicable interest rate. All significant inputs are readily available in public markets, or can be derived from observable market transactions.
Electricity Contract
The Company is party to an electricity contract used to manage market fluctuations in energy pricing. The Company's electricity contract is valued using the Mid-C index forward curve obtained from the Intercontinental Exchange. The market value of the contract is the sum of the fair value of all future purchase payments between the contract counterparties, discounted to present value. The fair value of the future purchase payments is determined by comparing the contract price to the forward price and present valued using International Paper's cost of capital.
Since the volume and level of activity of the markets that each of the above contracts are traded in has been normal, the fair value calculations have not been adjusted for inactive markets or disorderly transactions.
The following table provides a summary of the impact of our derivative instruments in the consolidated balance sheet:
Fair Value Measurements
Level 2 – Significant Other Observable Inputs
|
|
Assets
|
|
Liabilities
|
|
||||||||||||
|
In millions
|
December 31, 2018
|
|
December 31, 2017
|
|
December 31, 2018
|
|
December 31, 2017
|
|
||||||||
|
Derivatives designated as hedging instruments
|
||||||||||||||||
|
Foreign exchange contracts – cash flow
|
$
|
3
|
|
|
$
|
11
|
|
|
$
|
10
|
|
|
$
|
1
|
|
|
|
Interest rate contracts – fair value
|
16
|
|
—
|
|
—
|
|
—
|
|
||||||||
|
Total derivatives designated as hedging instruments
|
19
|
|
(a)
|
11
|
|
(b)
|
10
|
|
(c)
|
1
|
|
(c)
|
||||
|
Derivatives not designated as hedging instruments
|
||||||||||||||||
|
Electricity contract
|
—
|
|
|
—
|
|
|
4
|
|
|
8
|
|
|
||||
|
Foreign exchange contracts
|
—
|
|
—
|
|
1
|
|
—
|
|
||||||||
|
Total derivatives not designated as hedging instruments
|
—
|
|
|
—
|
|
|
5
|
|
(c)
|
8
|
|
(d)
|
||||
|
Total derivatives
|
$
|
19
|
|
|
$
|
11
|
|
|
$
|
15
|
|
|
$
|
9
|
|
|
|
(a)
|
Includes
$2 million
recorded in Other current assets and
$17 million
recorded in Deferred charges and other assets in the accompanying consolidated balance sheet.
|
|
(b)
|
Included in Other current assets in the accompanying consolidated balance sheet.
|
|
(c)
|
Included in Other accrued liabilities in the accompanying consolidated balance sheet.
|
|
(d)
|
Includes
$5 million
recorded in Other accrued liabilities and
$3 million
recorded in Other liabilities in the accompanying consolidated balance sheet.
|
69
The above contracts are subject to enforceable master netting arrangements that provide rights of offset with each counterparty when amounts are payable on the same date in the same currency or in the case of certain specified defaults. Management has made an accounting policy election to not offset the fair value of recognized derivative assets and derivative liabilities in the consolidated balance sheet. The amounts owed to the counterparties and owed to the Company are considered immaterial with respect to each counterparty and in the aggregate with all counterparties.
Credit-Risk-Related Contingent Features
International Paper evaluates credit risk by monitoring its exposure with each counterparty to ensure that exposure stays within acceptable policy limits. Credit risk is also mitigated by contractual provisions with the majority of our banks. Certain of the contracts include a credit support annex that requires the posting of collateral by the counterparty or International Paper based on each party’s rating and level of exposure. Based on the Company’s current credit rating, the collateral threshold is generally
$15 million
.
If the lower of the Company’s credit rating by Moody’s or S&P were to drop below investment grade, the Company would be required to post collateral for all of its derivatives in a net liability position, although no derivatives would terminate. As of
December 31, 2018
and
2017
, there were no derivative instruments containing credit-risk-related contingent features in a net liability position. The Company was
not
required to post any collateral as of
December 31, 2018
or
2017
.
The authorized capital stock at both
December 31, 2018
and
2017
, consisted of
990,850,000
shares of common stock,
$1
par value;
400,000
shares of cumulative
$4
preferred stock, without par value (stated value
$100
per share); and
8,750,000
shares of serial preferred stock,
$1
par value. The serial preferred stock is issuable in one or more series by the Board of Directors without further shareholder action.
The following is a rollforward of shares of common stock for the three years ended
December 31, 2018
,
2017
and
2016
:
|
|
Common Stock
|
|||
|
In thousands
|
Issued
|
Treasury
|
||
|
Balance at January 1, 2016
|
448,916
|
|
36,776
|
|
|
Issuance of stock for various plans, net
|
—
|
|
(2,745
|
)
|
|
Repurchase of stock
|
—
|
|
3,640
|
|
|
Balance at December 31, 2016
|
448,916
|
|
37,671
|
|
|
Issuance of stock for various plans, net
|
—
|
|
(2,577
|
)
|
|
Repurchase of stock
|
—
|
|
881
|
|
|
Balance at December 31, 2017
|
448,916
|
|
35,975
|
|
|
Issuance of stock for various plans, net
|
—
|
|
(1,721
|
)
|
|
Repurchase of stock
|
—
|
|
14,056
|
|
|
Balance at December 31, 2018
|
448,916
|
|
48,310
|
|
International Paper sponsors and maintains the Retirement Plan of International Paper Company (the Pension Plan), a tax-qualified defined benefit pension plan that provides retirement benefits to substantially all U.S. salaried employees and hourly employees (receiving salaried benefits) hired prior to July 1, 2004, and substantially all other U.S. hourly and union employees who work at a participating business unit regardless of hire date. These employees generally are
eligible to participate in the Pension Plan upon attaining
21
years of age and completing one year of eligibility service. U.S. salaried employees and hourly employees (receiving salaried benefits) hired after June 30, 2004 are not eligible to participate in the Pension Plan, but receive a company contribution to their individual savings plan accounts (see Other U.S. Plans); however, salaried employees hired by Temple Inland prior to March 1, 2007 or Weyerhaeuser Company's Cellulose Fibers division prior to December 1, 2011 also participate in the Pension Plan. The Pension Plan provides defined pension benefits based on years of credited service and either final average earnings (salaried employees and hourly employees receiving salaried benefits), hourly job rates or specified benefit rates (hourly and union employees).
70
The Company also has three unfunded nonqualified defined benefit pension plans: a Pension Restoration Plan available to employees hired prior to July 1, 2004 that provides retirement benefits based on eligible compensation in excess of limits set by the Internal Revenue Service, and two supplemental retirement plans for senior managers (SERP), which is an alternative retirement plan for salaried employees who are senior vice presidents and above or who are designated by the chief executive officer as participants. These nonqualified plans are only funded to the extent of benefits paid, which totaled
$29 million
,
$40 million
and
$21 million
in
2018
,
2017
and
2016
, respectively, and which are expected to be
$27 million
in
2019
.
Notwithstanding the foregoing, the Company has frozen participation, including credited service and compensation, for salaried employees under the Pension Plan, the Pension Restoration Plan and the two SERP plans for all service on or after January 1, 2019. This change does not affect benefits accrued through December 31, 2018. For service after this date, employees affected by the freeze will receive Retirement Savings Account contributions as described later in this
Note 18
.
Many non-U.S. employees are covered by various retirement benefit arrangements, some of which are considered to be defined benefit pension plans for accounting purposes.
OBLIGATIONS AND FUNDED STATUS
The following table shows the changes in the benefit obligation and plan assets for
2018
and
2017
, and the plans’ funded status.
|
|
2018
|
2017
|
||||||||||
|
In millions
|
U.S.
Plans |
Non-
U.S. Plans |
U.S.
Plans |
Non-
U.S. Plans |
||||||||
|
Change in projected benefit obligation:
|
||||||||||||
|
Benefit obligation, January 1
|
$
|
13,264
|
|
$
|
247
|
|
$
|
13,683
|
|
$
|
219
|
|
|
Service cost
|
153
|
|
5
|
|
160
|
|
4
|
|
||||
|
Interest cost
|
467
|
|
8
|
|
536
|
|
9
|
|
||||
|
Settlements
|
(1,653
|
)
|
(2
|
)
|
(1,295
|
)
|
(4
|
)
|
||||
|
Actuarial loss (gain)
|
(1,089
|
)
|
(17
|
)
|
913
|
|
2
|
|
||||
|
Acquisitions
|
—
|
|
—
|
|
—
|
|
5
|
|
||||
|
Divestitures
|
—
|
|
—
|
|
33
|
|
—
|
|
||||
|
Plan amendments
|
2
|
|
—
|
|
3
|
|
—
|
|
||||
|
Benefits paid
|
(677
|
)
|
(9
|
)
|
(769
|
)
|
(8
|
)
|
||||
|
Effect of foreign currency exchange rate movements
|
—
|
|
(17
|
)
|
—
|
|
20
|
|
||||
|
Benefit obligation, December 31
|
$
|
10,467
|
|
$
|
215
|
|
$
|
13,264
|
|
$
|
247
|
|
|
Change in plan assets:
|
||||||||||||
|
Fair value of plan assets, January 1
|
$
|
11,368
|
|
$
|
176
|
|
$
|
10,312
|
|
$
|
153
|
|
|
Actual return on plan assets
|
(332
|
)
|
(2
|
)
|
1,830
|
|
10
|
|
||||
|
Company contributions
|
29
|
|
10
|
|
1,290
|
|
10
|
|
||||
|
Benefits paid
|
(677
|
)
|
(9
|
)
|
(769
|
)
|
(8
|
)
|
||||
|
Settlements
|
(1,653
|
)
|
(2
|
)
|
(1,295
|
)
|
(4
|
)
|
||||
|
Other
|
—
|
|
—
|
|
—
|
|
3
|
|
||||
|
Effect of foreign currency exchange rate movements
|
—
|
|
(12
|
)
|
—
|
|
12
|
|
||||
|
Fair value of plan assets, December 31
|
$
|
8,735
|
|
$
|
161
|
|
$
|
11,368
|
|
$
|
176
|
|
|
Funded status, December 31
|
$
|
(1,732
|
)
|
$
|
(54
|
)
|
$
|
(1,896
|
)
|
$
|
(71
|
)
|
|
Amounts recognized in the consolidated balance sheet:
|
||||||||||||
|
Non-current asset
|
$
|
—
|
|
$
|
5
|
|
$
|
—
|
|
$
|
5
|
|
|
Current liability
|
(27
|
)
|
(2
|
)
|
(30
|
)
|
(3
|
)
|
||||
|
Non-current liability
|
(1,705
|
)
|
(57
|
)
|
(1,866
|
)
|
(73
|
)
|
||||
|
|
$
|
(1,732
|
)
|
$
|
(54
|
)
|
$
|
(1,896
|
)
|
$
|
(71
|
)
|
|
Amounts recognized in accumulated other comprehensive income under ASC 715 (pre-tax):
|
||||||||||||
|
Prior service cost (credit)
|
$
|
74
|
|
$
|
(1
|
)
|
$
|
88
|
|
$
|
(1
|
)
|
|
Net actuarial loss
|
3,140
|
|
57
|
|
3,893
|
|
67
|
|
||||
|
|
$
|
3,214
|
|
$
|
56
|
|
$
|
3,981
|
|
$
|
66
|
|
71
The largest contributor to the actuarial gain affecting the benefit obligation was the increase in the discount rate from
3.60%
at December 31, 2017 to
4.30%
at December 31, 2018 which improved the funded position. Mortality rates, retirement rates for hourly employees, termination rates, disability incidence and the salary increase assumption were updated to reflect an experience study completed in 2018 which also improved the funded position.
The components of the
$(767) million
and
$(10) million
related to U.S. plans and non-U.S. plans, respectively, in the amounts recognized in OCI during
2018
consisted of:
|
In millions
|
U.S.
Plans |
Non-
U.S. Plans |
||||
|
Current year actuarial (gain) loss
|
$
|
8
|
|
$
|
(4
|
)
|
|
Amortization of actuarial loss
|
(337
|
)
|
(2
|
)
|
||
|
Current year prior service cost
|
2
|
|
—
|
|
||
|
Amortization of prior service cost
|
(16
|
)
|
—
|
|
||
|
Settlements
|
(424
|
)
|
—
|
|
||
|
Effect of foreign currency exchange rate movements
|
—
|
|
(4
|
)
|
||
|
|
$
|
(767
|
)
|
$
|
(10
|
)
|
The portion of the change in the funded status that was recognized in either net periodic benefit cost or OCI for the U.S. plans was
$(134) million
,
$(184) million
and
$626 million
in
2018
,
2017
and
2016
, respectively. The portion of the change in funded status for the non-U.S. plans was
$(6) million
,
$10 million
, and
$23 million
in
2018
,
2017
and
2016
, respectively.
The accumulated benefit obligation at
December 31, 2018
and
2017
was
$10.4 billion
and
$13.2 billion
, respectively, for our U.S. defined benefit plans and
$200 million
and
$230 million
, respectively, at
December 31, 2018
and
2017
for our non-U.S. defined benefit plans.
The following table summarizes information for pension plans with an accumulated benefit obligation in excess of plan assets at
December 31, 2018
and
2017
:
|
|
2018
|
2017
|
||||||||||
|
In millions
|
U.S.
Plans |
Non-U.S.
Plans |
U.S.
Plans |
Non-U.S.
Plans |
||||||||
|
Projected benefit obligation
|
$
|
10,467
|
|
$
|
187
|
|
$
|
13,264
|
|
$
|
215
|
|
|
Accumulated benefit obligation
|
10,440
|
|
175
|
|
13,161
|
|
200
|
|
||||
|
Fair value of plan assets
|
8,735
|
|
128
|
|
11,368
|
|
139
|
|
||||
ASC 715, “Compensation – Retirement Benefits” provides for delayed recognition of actuarial gains and losses, including amounts arising from changes in the estimated projected plan benefit obligation due to changes in the assumed discount rate, differences
between the actual and expected return on plan assets and other assumption changes. These net gains and losses are recognized prospectively over a period that approximates the average remaining service period of active employees expected to receive benefits under the plans to the extent that they are not offset by gains in subsequent years.
NET PERIODIC PENSION EXPENSE
Service cost is the actuarial present value of benefits attributed by the plans’ benefit formula to services rendered by employees during the year. Interest cost represents the increase in the projected benefit obligation, which is a discounted amount, due to the passage of time. The expected return on plan assets reflects the computed amount of current-year earnings from the investment of plan assets using an estimated long-term rate of return.
Net periodic pension expense for qualified and nonqualified U.S. and non-U.S. defined benefit plans comprised the following:
|
|
2018
|
2017
|
2016
|
|||||||||||||||
|
In millions
|
U.S.
Plans |
Non-
U.S. Plans |
U.S.
Plans |
Non-
U.S. Plans |
U.S.
Plans |
Non-
U.S. Plans |
||||||||||||
|
Service cost
|
$
|
153
|
|
$
|
5
|
|
$
|
160
|
|
$
|
4
|
|
$
|
158
|
|
$
|
4
|
|
|
Interest cost
|
467
|
|
8
|
|
536
|
|
9
|
|
580
|
|
9
|
|
||||||
|
Expected return on plan assets
|
(765
|
)
|
(11
|
)
|
(774
|
)
|
(11
|
)
|
(815
|
)
|
(10
|
)
|
||||||
|
Actuarial loss / (gain)
|
337
|
|
2
|
|
339
|
|
2
|
|
400
|
|
1
|
|
||||||
|
Amortization of prior service cost
|
16
|
|
—
|
|
28
|
|
—
|
|
41
|
|
—
|
|
||||||
|
Curtailment loss / (gain) (a)
|
—
|
|
—
|
|
23
|
|
—
|
|
—
|
|
—
|
|
||||||
|
Settlement loss
|
424
|
|
—
|
|
383
|
|
1
|
|
445
|
|
—
|
|
||||||
|
Special termination benefits (a)
|
—
|
|
—
|
|
22
|
|
—
|
|
—
|
|
—
|
|
||||||
|
Net periodic pension expense
|
$
|
632
|
|
$
|
4
|
|
$
|
717
|
|
$
|
5
|
|
$
|
809
|
|
$
|
4
|
|
(a) Recorded in Discontinued operations in the consolidated statement of operations.
The components of net periodic pension expense other than the Service cost component are included in Non-operating pension expense in the Consolidated Statement of Operations.
The decrease in 2018 pension expense primarily reflects lower interest cost on a lower 2018 projected benefit obligation along with the current year absence of a curtailment loss and special termination benefits associated with North American Consumer Packaging transaction, partially offset by a higher settlement loss in the current year associated with the October 2018 annuity purchase transaction.
72
On September 25, 2018, the Company entered into an agreement with The Prudential Insurance Company of America to purchase a group annuity contract and transfer approximately
$1.6 billion
of International Paper's U.S. qualified pension plan projected benefit obligations, subject to customary closing conditions. The transaction closed on October 2, 2018 and was funded with pension plan assets. Under the transaction, at the end of 2018, Prudential assumed responsibility for pension benefits and annuity administration for approximately
23,000
retirees or their beneficiaries receiving less than
$1,000
in monthly benefit payments from the plan. Settlement accounting rules required a remeasurement of the qualified plan as of October 2, 2018 and the Company recognized a non-cash pension settlement charge of
$424 million
before tax in the fourth quarter of 2018.
On September 26, 2017, the Company entered into an agreement with The Prudential Insurance Company of America to purchase a group annuity contract and transfer approximately
$1.3 billion
of International Paper's U.S. qualified pension plan projected benefit obligations, subject to customary closing conditions. The transaction closed on October 3, 2017 and was funded with pension plan assets. Under the transaction, at the end of 2017, Prudential assumed responsibility for pension benefits and annuity administration for approximately
45,000
retirees or their beneficiaries receiving less than
$450
in monthly benefit payments from the plan. Settlement accounting rules required a remeasurement of the qualified plan as of October 3, 2017 and the Company recognized a non-cash pension settlement charge of
$376 million
before tax in the fourth quarter of 2017. In addition, large payments from the non-qualified pension plan also required a remeasurement as of October 2, 2017 and a non-cash settlement charge of
$7 million
was also recognized in the fourth quarter of 2017.
In the first quarter of 2016 International Paper announced a voluntary, limited-time opportunity for former employees who are participants in the Retirement Plan of International Paper Company (the Pension Plan) to request early payment of their entire Pension Plan benefit in the form of a single lump sum payment. The amount of total payments under this program was approximately
$1.2 billion
, and were made from Plan trust assets on June 30, 2016. Based on the level of payments made, settlement accounting rules applied and resulted in a plan remeasurement as of the June 30, 2016 payment date. As a result of settlement accounting, the Company recognized a pro-rata portion of the unamortized net actuarial loss, after remeasurement, resulting in a
$439 million
non-cash charge to the Company's earnings in the second quarter of 2016. Additional payments of
$8 million
and
$9 million
were made during the third and fourth quarters, respectively, due to mandatory cash payouts and a small lump sum payout, and the Pension Plan was subsequently remeasured at September 30, 2016 and December 31, 2016. As a result of settlement accounting, the Company recognized non-cash settlement charges of
$3 million
in both the third and fourth quarters of 2016.
ASSUMPTIONS
International Paper evaluates its actuarial assumptions annually as of December 31 (the measurement date) and considers changes in these long-term factors based upon market conditions and the requirements for employers’ accounting for pensions. These assumptions are used to calculate benefit obligations as of December 31 of the current year and pension expense to be recorded in the following year (i.e., the discount rate used to determine the benefit obligation as of
December 31, 2018
is also the discount rate used to determine net pension expense for the
2019
year).
Major actuarial assumptions used in determining the benefit obligations and net periodic pension cost for our defined benefit plans are presented in the following table:
|
|
2018
|
2017
|
2016
|
|||||||||
|
|
U.S.
Plans |
Non-
U.S. Plans |
U.S.
Plans |
Non-
U.S. Plans |
U.S.
Plans |
Non-
U.S. Plans |
||||||
|
Actuarial assumptions used to determine benefit obligations as of December 31:
|
||||||||||||
|
Discount rate
|
4.30
|
%
|
3.97
|
%
|
3.60
|
%
|
3.59
|
%
|
4.10
|
%
|
3.88
|
%
|
|
Rate of compensation increase
|
2.25
|
%
|
4.05
|
%
|
3.75
|
%
|
4.06
|
%
|
3.75
|
%
|
4.20
|
%
|
|
Actuarial assumptions used to determine net periodic pension cost for years ended December 31:
|
||||||||||||
|
Discount rate (a)
|
3.80
|
%
|
3.59
|
%
|
4.03
|
%
|
3.88
|
%
|
4.05
|
%
|
4.72
|
%
|
|
Expected long-term rate of return on plan assets
|
7.50
|
%
|
6.52
|
%
|
7.50
|
%
|
6.73
|
%
|
7.75
|
%
|
6.55
|
%
|
|
Rate of compensation increase
|
3.38
|
%
|
4.06
|
%
|
3.75
|
%
|
4.20
|
%
|
3.75
|
%
|
4.03
|
%
|
(a) Represents the weighted average rate for the U.S. qualified plans in 2018, 2017 and 2016 due to the remeasurements.
73
The expected long-term rate of return on plan assets is based on projected rates of return for current and planned asset classes in the plan’s investment portfolio. Projected rates of return are developed through an asset/liability study in which projected returns for each of the plan’s asset classes are determined after analyzing historical experience and future expectations of returns and volatility of the various asset classes.
Based on the target asset allocation for each asset class, the overall expected rate of return for the portfolio is developed considering the effects of active portfolio management and expenses paid from plan assets. The discount rate assumption was determined from a universe of high quality corporate bonds. A settlement portfolio is selected and matched to the present value of the plan’s projected benefit payments. To calculate pension expense for
2019
, the Company will use an expected long-term rate of return on plan assets of
7.25%
for the Retirement Plan of International Paper, a discount rate of
4.30%
and an assumed rate of compensation increase of
2.25%
. The Company estimates that it will record net pension expense of approximately
$103 million
for its U.S. defined benefit plans in
2019
, compared to expense of
$632 million
in
2018
. The 2018 expense includes
$424 million
of settlement accounting charges. Excluding these settlement charges, the estimated decrease in net pension expense in 2019 is primarily due to lower amortization of actuarial losses and lower service cost partially offset by lower asset returns due to the annuity purchase and a decrease in the expected long-term return on asset assumption from
7.50%
in 2018 to
7.25%
in 2019.
For non-U.S. pension plans, assumptions reflect economic assumptions applicable to each country.
The following illustrates the effect on pension expense for
2019
of a
25
basis point decrease in the above assumptions:
|
In millions
|
2019
|
||
|
Expense/(Income):
|
|||
|
Discount rate
|
$
|
27
|
|
|
Expected long-term rate of return on plan assets
|
22
|
|
|
PLAN ASSETS
International Paper’s Board of Directors has appointed a Fiduciary Review Committee that is responsible for fiduciary oversight of the U.S. Pension Plan, approving investment policy and reviewing the management and control of plan assets. Pension Plan assets are invested to maximize returns within prudent levels of risk.
The Pension Plan maintains a strategic asset allocation policy that designates target allocations by asset class. Investments are diversified across classes and within each class to minimize the risk of large losses. Derivatives, including swaps, forward and futures contracts, may be used as asset class substitutes or for hedging or other risk management purposes. Periodic reviews are made of investment policy objectives and investment manager performance. For non-U.S. plans, assets consist principally of common stock and fixed income securities.
International Paper’s U.S. pension allocations by type of fund at December 31, 2018 and 2017 and target allocations were as follows:
|
Asset Class
|
2018
|
2017
|
Target
Allocations |
||
|
Equity accounts
|
32
|
%
|
49
|
%
|
32% - 43%
|
|
Fixed income accounts
|
51
|
%
|
36
|
%
|
44% - 56%
|
|
Real estate accounts
|
11
|
%
|
10
|
%
|
5% - 11%
|
|
Other
|
6
|
%
|
5
|
%
|
3% - 8%
|
|
Total
|
100
|
%
|
100
|
%
|
|
The fair values of International Paper’s pension plan assets at
December 31, 2018
and
2017
by asset class are shown below. Hedge funds disclosed in the following table are allocated equally between equity and fixed income accounts for target allocation purposes.
|
Fair Value Measurement at December 31, 2018
|
||||||||||||
|
Asset Class
|
Total
|
Quoted
Prices in Active Markets For Identical Assets (Level 1) |
Significant
Observable Inputs (Level 2) |
Significant
Unobservable Inputs (Level 3) |
||||||||
|
In millions
|
|
|
|
|
||||||||
|
Equities – domestic
|
$
|
685
|
|
$
|
685
|
|
$
|
—
|
|
$
|
—
|
|
|
Equities – international
|
1,150
|
|
1,141
|
|
9
|
|
—
|
|
||||
|
Corporate bonds
|
1,434
|
|
—
|
|
1,434
|
|
—
|
|
||||
|
Government securities
|
2,262
|
|
—
|
|
2,262
|
|
—
|
|
||||
|
Mortgage backed securities
|
—
|
|
—
|
|
—
|
|
—
|
|
||||
|
Other fixed income
|
(723
|
)
|
—
|
|
(736
|
)
|
13
|
|
||||
|
Derivatives
|
98
|
|
—
|
|
—
|
|
98
|
|
||||
|
Cash and cash equivalents
|
294
|
|
294
|
|
—
|
|
—
|
|
||||
|
Other investments:
|
||||||||||||
|
Equities - domestic
|
515
|
|
||||||||||
|
Equities - international
|
433
|
|
||||||||||
|
Corporate bonds
|
59
|
|
||||||||||
|
Other fixed income
|
180
|
|
||||||||||
|
Hedge funds
|
886
|
|
||||||||||
|
Private equity
|
518
|
|
||||||||||
|
Real estate funds
|
944
|
|
||||||||||
|
Total Investments
|
$
|
8,735
|
|
$
|
2,120
|
|
$
|
2,969
|
|
$
|
111
|
|
74
|
Fair Value Measurement at December 31, 2017
|
||||||||||||
|
Asset Class
|
Total
|
Quoted
Prices in Active Markets For Identical Assets (Level 1) |
Significant
Observable Inputs (Level 2) |
Significant
Unobservable Inputs (Level 3) |
||||||||
|
In millions
|
|
|
|
|
||||||||
|
Equities – domestic
|
$
|
1,291
|
|
$
|
1,291
|
|
$
|
—
|
|
$
|
—
|
|
|
Equities – international
|
2,132
|
|
2,119
|
|
13
|
|
—
|
|
||||
|
Corporate bonds
|
1,177
|
|
—
|
|
1,177
|
|
—
|
|
||||
|
Government securities
|
2,778
|
|
—
|
|
2,778
|
|
—
|
|
||||
|
Mortgage backed securities
|
1
|
|
—
|
|
—
|
|
1
|
|
||||
|
Other fixed income
|
(802
|
)
|
—
|
|
(814
|
)
|
12
|
|
||||
|
Derivatives
|
8
|
|
—
|
|
(8
|
)
|
16
|
|
||||
|
Cash and cash equivalents
|
397
|
|
397
|
|
—
|
|
—
|
|
||||
|
Other investments:
|
||||||||||||
|
Equities - domestic
|
708
|
|
||||||||||
|
Equities - international
|
866
|
|
||||||||||
|
Corporate bonds
|
66
|
|
||||||||||
|
Other fixed income
|
232
|
|
||||||||||
|
Hedge funds
|
927
|
|
||||||||||
|
Private equity
|
481
|
|
||||||||||
|
Real estate funds
|
1,106
|
|
||||||||||
|
Total Investments
|
$
|
11,368
|
|
$
|
3,807
|
|
$
|
3,146
|
|
$
|
29
|
|
In accordance with accounting standards, the following investments are measured at NAV and are not classified in the fair value hierarchy. Some of the investments have redemption limitations, restrictions, and notice requirements which are further explained below.
|
Other Investments at December 31, 2018
|
||||||||
|
Investment
|
Fair Value
|
Unfunded Commitments
|
Redemption Frequency
|
Remediation Notice Period
|
||||
|
In millions
|
||||||||
|
Equities – domestic
|
$
|
515
|
|
$
|
—
|
|
Daily to monthly
|
1-5 days
|
|
Equities – international
|
433
|
|
—
|
|
Daily to monthly
|
1-5 days
|
||
|
Corporate bonds
|
59
|
|
—
|
|
Daily to monthly
|
1-5 days
|
||
|
Other fixed income
|
180
|
|
—
|
|
Daily to monthly
|
1-5 days
|
||
|
Hedge funds
|
886
|
|
—
|
|
Daily to annually
|
1 - 100 days
|
||
|
Private equity
|
518
|
|
310
|
|
(a)
|
None
|
||
|
Real estate funds
|
944
|
|
109
|
|
Quarterly
|
45 - 60 days
|
||
|
Total
|
$
|
3,535
|
|
$
|
419
|
|
||
(a) A private equity fund investment ("partnership interest") is contractually locked up for the life of the private equity fund by the partnership agreement. Limited partners do not have the option to redeem partnership interests.
|
Other Investments at December 31, 2017
|
||||||||
|
Investment
|
Fair Value
|
Unfunded Commitments
|
Redemption Frequency
|
Remediation Notice Period
|
||||
|
In millions
|
|
|
|
|
||||
|
Equities - domestic
|
$
|
708
|
|
$
|
—
|
|
Daily to monthly
|
1-5 days
|
|
Equities - international
|
866
|
|
—
|
|
Daily to monthly
|
1-5 days
|
||
|
Corporate bonds
|
66
|
|
—
|
|
Daily to monthly
|
1-5 days
|
||
|
Other fixed income
|
232
|
|
—
|
|
Daily to monthly
|
1-5 days
|
||
|
Hedge funds
|
927
|
|
—
|
|
Daily to annually
|
1 - 100 days
|
||
|
Private equity
|
481
|
|
262
|
|
(a)
|
None
|
||
|
Real estate funds
|
1,106
|
|
121
|
|
Quarterly
|
45 - 60 days
|
||
|
Total
|
$
|
4,386
|
|
$
|
383
|
|
|
|
(a) A private equity fund investment ("partnership interest") is contractually locked up for the life of the private equity fund by the partnership agreement. Limited partners do not have the option to redeem partnership interests.
Equity securities consist primarily of publicly traded U.S. companies and international companies. Publicly traded equities are valued at the closing prices reported in the active market in which the individual securities are traded.
Fixed income consists of government securities, mortgage-backed securities, corporate bonds, common collective funds and other fixed income investments. Government securities are valued by third-party pricing sources. Mortgage-backed security holdings consist primarily of agency-rated holdings. The fair value estimates for mortgage securities are calculated by third-party pricing sources chosen by the custodian’s price matrix. Corporate bonds are valued using either the yields currently available on comparable securities of issuers with similar credit ratings or using a discounted cash flows approach that utilizes observable inputs, such as current yields of similar instruments, but includes adjustments for certain risks that may not be observable, such as credit and liquidity risks. Common collective funds are valued at the net asset value per share multiplied by the number of shares held as of the measurement date. Other fixed income investments of
$(723) million
and
$(802) million
at December 31, 2018 and 2017, respectively, primarily include reverse repurchase agreement obligations in which we have sold a security and have an agreement to repurchase the same or substantially the same security at a later date for a price specified in the agreement.
Derivative investments such as futures, forward contracts, options and swaps are used to help manage risks. Derivatives are generally employed as an asset class substitutes (such as when employed in a portable alpha strategy), for managing asset/liability mismatches, or bona fide hedging or other appropriate risk management purposes.
Derivative instruments are generally valued by the investment managers or in certain instances by third-party pricing sources.
75
Hedge funds are investment structures for managing private, loosely-regulated investment pools that can pursue a diverse array of investment strategies with a wide range of different securities and derivative instruments. These investments are made through funds-of-funds (commingled, multi-manager fund structures) and through direct investments in individual hedge funds. Hedge funds are primarily valued by each fund’s third-party administrator based upon the valuation of the underlying securities and instruments and primarily by applying a market or income valuation methodology as appropriate depending on the specific type of security or instrument held. Funds-of-funds are valued based upon the net asset values of the underlying investments in hedge funds.
Private equity consists of interests in partnerships that invest in U.S. and non-U.S. debt and equity securities. Partnership interests are valued using the most recent general partner statement of fair value, updated for any subsequent partnership interest cash flows.
Real estate funds include commercial properties, land and timberland, and generally includes, but is not limited to, retail, office, industrial, multifamily and hotel properties. Real estate fund values are primarily reported by the fund manager and are based on valuation of the underlying investments which include inputs such as cost, discounted cash flows, independent appraisals and market based comparable data.
The following is a reconciliation of the assets that are classified using significant unobservable inputs (Level 3) at
December 31, 2018
.
Fair Value Measurements Using Significant Unobservable Inputs (Level 3)
|
In millions
|
Mortgage backed securities
|
Other
fixed income |
Derivatives
|
Total
|
||||||||
|
Beginning balance at December 31, 2016
|
$
|
1
|
|
$
|
11
|
|
$
|
(71
|
)
|
$
|
(59
|
)
|
|
Actual return on plan assets:
|
||||||||||||
|
Relating to assets still held at the reporting date
|
—
|
|
1
|
|
94
|
|
95
|
|
||||
|
Relating to assets sold during the period
|
—
|
|
—
|
|
(23
|
)
|
(23
|
)
|
||||
|
Purchases, sales and settlements
|
—
|
|
—
|
|
16
|
|
16
|
|
||||
|
Transfers in and/or out of Level 3
|
—
|
|
—
|
|
—
|
|
—
|
|
||||
|
Ending balance at December 31, 2017
|
$
|
1
|
|
$
|
12
|
|
$
|
16
|
|
$
|
29
|
|
|
Actual return on plan assets:
|
||||||||||||
|
Relating to assets still held at the reporting date
|
—
|
|
1
|
|
75
|
|
76
|
|
||||
|
Relating to assets sold during the period
|
—
|
|
—
|
|
(19
|
)
|
(19
|
)
|
||||
|
Purchases, sales and settlements
|
(1
|
)
|
—
|
|
26
|
|
25
|
|
||||
|
Transfers in and/or out of Level 3
|
—
|
|
—
|
|
—
|
|
—
|
|
||||
|
Ending balance at December 31, 2018
|
$
|
—
|
|
$
|
13
|
|
$
|
98
|
|
$
|
111
|
|
FUNDING AND CASH FLOWS
The Company’s funding policy for the Pension Plan is to contribute amounts sufficient to meet legal funding requirements, plus any additional amounts that the Company may determine to be appropriate considering the funded status of the plans, tax deductibility, cash flow generated by the Company, and other factors. The Company continually reassesses the amount and timing of any discretionary contributions. Contributions to the qualified plan totaling
$1.25 billion
and
$750 million
were made by the Company in
2017
and
2016
, respectively. No voluntary contributions were made in 2018. Generally, International Paper’s non-U.S. pension plans are funded using the projected benefit as a target, except in certain countries where funding of benefit plans is not required.
At
December 31, 2018
, projected future pension benefit payments, excluding any termination benefits, were as follows:
|
In millions
|
|
||
|
2019
|
$
|
562
|
|
|
2020
|
571
|
|
|
|
2021
|
585
|
|
|
|
2022
|
597
|
|
|
|
2023
|
611
|
|
|
|
2024-2028
|
3,191
|
|
|
OTHER U.S. PLANS
International Paper sponsors the International Paper Company Salaried Savings Plan and the International Paper Company Hourly Savings Plan, both of which are tax-qualified defined contribution 401(k) savings plans.
76
Substantially all U.S. salaried and certain hourly employees are eligible to participate and may make elective deferrals to such plans to save for retirement. International Paper makes matching contributions to participant accounts on a specified percentage of employee deferrals as determined by the provisions of each plan. For eligible employees hired after June 30, 2004, the Company makes Retirement Savings Account contributions equal to a percentage of an eligible employee’s pay. Beginning in 2019, as a result of the freeze for salaried employees under the Pension Plan, all salaried employees will be eligible for the contribution to the Retirement Savings Account.
The Company also sponsors the International Paper Company Deferred Compensation Savings Plan, which is an unfunded nonqualified defined contribution plan. This plan permits eligible employees to continue to make deferrals and receive company matching contributions (and Retirement Savings Account contributions) when their contributions to the International Paper Salaried Savings Plan are stopped due to limitations under U.S. tax law. Participant deferrals and company contributions are not invested in a separate trust, but are paid directly from International Paper’s general assets at the time benefits become due and payable.
Company contributions to the plans totaled approximately
$125 million
,
$117 million
and
$106 million
for the plan years ending in
2018
,
2017
and
2016
, respectively.
U.S. POSTRETIREMENT BENEFITS
International Paper provides certain retiree health care and life insurance benefits covering certain U.S. salaried and hourly employees. These employees are generally eligible for benefits upon retirement and completion of a specified number of years of creditable service. International Paper does not fund these benefits prior to payment and has the right to modify or terminate certain of these plans in the future.
In addition to the U.S. plan, certain Brazilian and Moroccan employees are eligible for retiree health care and life insurance benefits.
The components of postretirement benefit expense in
2018
,
2017
and
2016
were as follows:
|
In millions
|
2018
|
2017
|
2016
|
|||||||||||||||
|
U.S.
Plans |
Non-
U.S. Plans |
U.S.
Plans |
Non-
U.S. Plans |
U.S.
Plans |
Non-
U.S. Plans |
|||||||||||||
|
Service cost
|
$
|
1
|
|
$
|
—
|
|
$
|
1
|
|
$
|
—
|
|
$
|
1
|
|
$
|
—
|
|
|
Interest cost
|
8
|
|
2
|
|
11
|
|
2
|
|
11
|
|
3
|
|
||||||
|
Actuarial loss
|
9
|
|
2
|
|
8
|
|
3
|
|
5
|
|
2
|
|
||||||
|
Amortization of prior service credits
|
(2
|
)
|
(3
|
)
|
(3
|
)
|
(4
|
)
|
(4
|
)
|
(4
|
)
|
||||||
|
Net postretirement expense
|
$
|
16
|
|
$
|
1
|
|
$
|
17
|
|
$
|
1
|
|
$
|
13
|
|
$
|
1
|
|
International Paper evaluates its actuarial assumptions annually as of December 31 (the measurement date) and considers changes in these long-term factors based upon market conditions and the requirements of employers’ accounting for postretirement benefits other than pensions. The discount rate assumption was determined based on a hypothetical settlement portfolio selected from a universe of high quality corporate bonds.
The discount rates used to determine net U.S. and non-U.S. postretirement benefit cost for the years ended
December 31, 2018
,
2017
and
2016
were as follows:
|
2018
|
2017
|
2016
|
||||||||||
|
U.S.
Plans |
Non-
U.S. Plans |
U.S.
Plans |
Non-
U.S. Plans |
U.S.
Plans |
Non-
U.S. Plans |
|||||||
|
Discount rate
|
3.50
|
%
|
9.38
|
%
|
4.00
|
%
|
10.53
|
%
|
4.20
|
%
|
12.23
|
%
|
The weighted average assumptions used to determine the benefit obligation at
December 31, 2018
and
2017
were as follows:
|
2018
|
2017
|
|||||||
|
U.S.
Plans |
Non-
U.S. Plans |
U.S.
Plans |
Non-
U.S. Plans |
|||||
|
Discount rate
|
4.20
|
%
|
9.10
|
%
|
3.50
|
%
|
9.38
|
%
|
|
Health care cost trend rate assumed for next year
|
7.00
|
%
|
10.04
|
%
|
6.50
|
%
|
10.27
|
%
|
|
Rate that the cost trend rate gradually declines to
|
5.00
|
%
|
4.93
|
%
|
5.00
|
%
|
5.15
|
%
|
|
Year that the rate reaches the rate it is assumed to remain
|
2026
|
|
2030
|
|
2022
|
|
2028
|
|
77
The plans are only funded in an amount equal to benefits paid. The following table presents the changes in benefit obligation and plan assets for
2018
and
2017
:
|
In millions
|
2018
|
2017
|
||||||||||
|
U.S.
Plans |
Non-
U.S. Plans |
U.S.
Plans |
Non-
U.S. Plans |
|||||||||
|
Change in projected benefit obligation:
|
||||||||||||
|
Benefit obligation, January 1
|
$
|
270
|
|
$
|
25
|
|
$
|
280
|
|
$
|
23
|
|
|
Service cost
|
1
|
|
—
|
|
1
|
|
—
|
|
||||
|
Interest cost
|
8
|
|
2
|
|
11
|
|
2
|
|
||||
|
Participants’ contributions
|
5
|
|
—
|
|
5
|
|
—
|
|
||||
|
Actuarial (gain) loss
|
(34
|
)
|
2
|
|
14
|
|
2
|
|
||||
|
Plan amendments
|
—
|
|
—
|
|
—
|
|
—
|
|
||||
|
Benefits paid
|
(38
|
)
|
(1
|
)
|
(42
|
)
|
(2
|
)
|
||||
|
Less: Federal subsidy
|
1
|
|
—
|
|
1
|
|
—
|
|
||||
|
Currency Impact
|
—
|
|
(4
|
)
|
—
|
|
—
|
|
||||
|
Benefit obligation, December 31
|
$
|
213
|
|
$
|
24
|
|
$
|
270
|
|
$
|
25
|
|
|
Change in plan assets:
|
||||||||||||
|
Fair value of plan assets, January 1
|
$
|
—
|
|
$
|
—
|
|
$
|
—
|
|
$
|
—
|
|
|
Company contributions
|
33
|
|
1
|
|
37
|
|
2
|
|
||||
|
Participants’ contributions
|
5
|
|
—
|
|
5
|
|
—
|
|
||||
|
Benefits paid
|
(38
|
)
|
(1
|
)
|
(42
|
)
|
(2
|
)
|
||||
|
Fair value of plan assets, December 31
|
$
|
—
|
|
$
|
—
|
|
$
|
—
|
|
$
|
—
|
|
|
Funded status, December 31
|
$
|
(213
|
)
|
$
|
(24
|
)
|
$
|
(270
|
)
|
$
|
(25
|
)
|
|
Amounts recognized in the consolidated balance sheet under ASC 715:
|
||||||||||||
|
Current liability
|
$
|
(23
|
)
|
$
|
(1
|
)
|
$
|
(28
|
)
|
$
|
(1
|
)
|
|
Non-current liability
|
(190
|
)
|
(23
|
)
|
(242
|
)
|
(24
|
)
|
||||
|
|
$
|
(213
|
)
|
$
|
(24
|
)
|
$
|
(270
|
)
|
$
|
(25
|
)
|
|
Amounts recognized in accumulated other comprehensive income under ASC 715 (pre-tax):
|
||||||||||||
|
Net actuarial loss (gain)
|
$
|
31
|
|
$
|
15
|
|
$
|
74
|
|
$
|
19
|
|
|
Prior service credit
|
(4
|
)
|
(22
|
)
|
(6
|
)
|
(30
|
)
|
||||
|
|
$
|
27
|
|
$
|
(7
|
)
|
$
|
68
|
|
$
|
(11
|
)
|
The non-current portion of the liability is included with the postemployment liability in the accompanying consolidated balance sheet under Postretirement and postemployment benefit obligation.
The components of the
($41) million
and
$4 million
change in the amounts recognized in OCI during
2018
for U.S. and non-U.S. plans, respectively, consisted of:
|
In millions
|
U.S.
Plans |
Non-
U.S. Plans |
||||
|
Current year actuarial (gain) loss
|
$
|
(34
|
)
|
$
|
2
|
|
|
Amortization of actuarial (loss) gain
|
(9
|
)
|
(2
|
)
|
||
|
Current year prior service cost
|
—
|
|
—
|
|
||
|
Amortization of prior service credit
|
2
|
|
3
|
|
||
|
Currency impact
|
—
|
|
1
|
|
||
|
|
$
|
(41
|
)
|
$
|
4
|
|
The portion of the change in the funded status that was recognized in either net periodic benefit cost or OCI for the U.S. plans was
$(25) million
,
$25 million
and
$42 million
in
2018
,
2017
and
2016
, respectively. The portion of the change in funded status for the non-U.S. plans was
$5 million
,
$3 million
, and
$(25) million
in
2018
,
2017
and
2016
, respectively.
At
December 31, 2018
, estimated total future postretirement benefit payments, net of participant contributions and estimated future Medicare Part D subsidy receipts, were as follows:
|
In millions
|
Benefit
Payments |
Subsidy Receipts
|
Benefit
Payments |
||||||
|
U.S.
Plans |
U.S.
Plans |
Non-
U.S. Plans |
|||||||
|
2019
|
$
|
24
|
|
$
|
1
|
|
$
|
1
|
|
|
2020
|
23
|
|
1
|
|
1
|
|
|||
|
2021
|
21
|
|
1
|
|
1
|
|
|||
|
2022
|
20
|
|
1
|
|
1
|
|
|||
|
2023
|
19
|
|
1
|
|
1
|
|
|||
|
2024 – 2028
|
77
|
|
5
|
|
7
|
|
|||
International Paper currently has an Incentive Compensation Plan (ICP) which, upon the approval by the Company’s shareholders in May 2009, replaced the Company’s Long-Term Incentive Compensation Plan (LTICP). The ICP authorizes grants of restricted stock, restricted or deferred stock units, performance awards payable in cash or stock upon the attainment of specified performance goals, dividend equivalents, stock options,
78
stock appreciation rights, other stock-based awards, and cash-based awards at the discretion of the Management Development and Compensation Committee of the Board of Directors (the Committee) that administers the ICP. Additionally, restricted stock, which may be deferred into RSU’s, may be awarded under a Restricted Stock and Deferred Compensation Plan for Non-Employee Directors.
PERFORMANCE SHARE PLAN
Under the Performance Share Plan (PSP), contingent awards of International Paper common stock are granted by the Committee. The PSP awards are earned over a three-year period. PSP awards are earned based on the achievement of defined performance rankings of Return on Invested Capital (ROIC) and Total Shareholder Return (TSR) compared to ROIC and TSR peer groups of companies. The 2016-2018 and 2017-2019 Awards are weighted
75%
for ROIC and
25%
for TSR for all participants except for officers for whom the awards are weighted
50%
for ROIC and
50%
for TSR. The 2018-2020 Award is weighted
50%
ROIC and
50%
TSR for all participants. The ROIC component of the PSP awards is valued at the closing stock price on the day prior to the grant date. As the ROIC component contains a performance condition, compensation expense, net of estimated forfeitures, is recorded over the requisite service period based on the most probable number of awards expected to vest. The TSR component of the PSP awards is valued using a Monte Carlo simulation as the TSR component contains a market condition. The Monte Carlo simulation estimates the fair value of the TSR component based on the expected term of the award, a risk-free rate, expected dividends, and the expected volatility for the Company and its competitors. The expected term is estimated based on the vesting period of the awards, the risk-free rate is based on the yield on U.S. Treasury securities matching the vesting period, and the volatility is based on the Company’s historical volatility over the expected term. PSP grants are made in performance-based restricted stock units.
The following table sets forth the assumptions used to determine compensation cost for the market condition component of the PSP plan:
|
|
Twelve Months Ended December 31, 2018
|
|
Expected volatility
|
22.75%-22.99%
|
|
Risk-free interest rate
|
1.31%-1.98%
|
The following summarizes PSP activity for the three years ending
December 31, 2018
:
|
Share/Units
|
Weighted
Average
Grant Date
Fair Value
|
||||
|
Outstanding at December 31, 2015
|
5,857,733
|
|
|
$38.69
|
|
|
Granted
|
2,617,982
|
|
37.26
|
|
|
|
Shares issued
|
(2,316,085
|
)
|
43.82
|
|
|
|
Forfeited
|
(209,500
|
)
|
43.61
|
|
|
|
Outstanding at December 31, 2016
|
5,950,130
|
|
35.89
|
|
|
|
Granted
|
2,163,912
|
|
51.78
|
|
|
|
Shares issued
|
(1,876,134
|
)
|
51.00
|
|
|
|
Forfeited
|
(438,024
|
)
|
45.96
|
|
|
|
Outstanding at December 31, 2017
|
5,799,884
|
|
36.17
|
|
|
|
Granted
|
1,751,235
|
|
62.97
|
|
|
|
Shares issued
|
(1,588,642
|
)
|
53.67
|
|
|
|
Forfeited
|
(196,000
|
)
|
56.57
|
|
|
|
Outstanding at December 31, 2018
|
5,766,477
|
|
|
$38.79
|
|
RESTRICTED STOCK AWARD PROGRAMS
The service-based Restricted Stock Award program (RSA), designed for recruitment, retention and special recognition purposes, provides for awards of restricted stock to key employees.
The following summarizes the activity of the RSA program for the three years ending
December 31, 2018
:
|
Shares
|
Weighted
Average
Grant Date
Fair Value
|
||||
|
Outstanding at December 31, 2015
|
120,368
|
|
|
$48.24
|
|
|
Granted
|
117,881
|
|
42.81
|
|
|
|
Shares issued
|
(59,418
|
)
|
47.14
|
|
|
|
Forfeited
|
(9,500
|
)
|
39.36
|
|
|
|
Outstanding at December 31, 2016
|
169,331
|
|
45.34
|
|
|
|
Granted
|
63,319
|
|
57.24
|
|
|
|
Shares issued
|
(59,650
|
)
|
47.90
|
|
|
|
Forfeited
|
(6,700
|
)
|
53.53
|
|
|
|
Outstanding at December 31, 2017
|
166,300
|
|
48.63
|
|
|
|
Granted
|
66,100
|
|
51.43
|
|
|
|
Shares issued
|
(100,289
|
)
|
48.44
|
|
|
|
Forfeited
|
—
|
|
—
|
|
|
|
Outstanding at December 31, 2018
|
132,111
|
|
|
$50.17
|
|
At
December 31, 2018
,
2017
and
2016
a total of
11.9 million
,
13.2 million
and
14.3 million
shares, respectively, were available for grant under the ICP.
79
Stock-based compensation expense and related income tax benefits were as follows:
|
In millions
|
2018
|
2017
|
2016
|
||||||
|
Total stock-based compensation expense (included in selling and administrative expense)
|
$
|
135
|
|
$
|
147
|
|
$
|
124
|
|
|
Income tax benefits related to stock-based compensation
|
16
|
|
45
|
|
34
|
|
|||
At
December 31, 2018
,
$104 million
of compensation cost, net of estimated forfeitures, related to unvested restricted performance shares, executive continuity awards and restricted stock attributable to future performance had not yet been recognized. This amount will be recognized in expense over a weighted-average period of
1.7
years.
International Paper’s business segments, Industrial Packaging, Global Cellulose Fibers and Printing Papers, are consistent with the internal structure used to manage these businesses. See the
Description of Business Segments
in
Part II. Item 7. Management's Discussion and Analysis of Financial Condition and Results of Operations
for a description of the types of products and services from which each reportable segment derives its revenues. All segments are differentiated on a common product, common customer basis consistent with the business segmentation generally used in the Forest Products industry.
Business segment operating profits are used by International Paper’s management to measure the earnings performance of its businesses. Management believes that this measure allows a better understanding of trends in costs, operating efficiencies, prices and volumes. Business segment operating profits are defined as earnings (loss) from continuing operations before income taxes and equity earnings, but including the impact of equity earnings and noncontrolling interests, excluding interest expense, net, corporate items, net, corporate special items, net, and non-operating pension expense.
External sales by major product is determined by aggregating sales from each segment based on similar products or services. External sales are defined as those that are made to parties outside International Paper’s consolidated group, whereas sales by segment in the Net Sales table are determined using a management approach and include intersegment sales.
INFORMATION BY BUSINESS SEGMENT
Net Sales
|
In millions
|
2018
|
2017
|
2016
|
||||||||
|
Industrial Packaging
|
$
|
15,900
|
|
$
|
15,077
|
|
$
|
14,226
|
|
||
|
Global Cellulose Fibers
|
2,819
|
|
2,551
|
|
1,092
|
|
|||||
|
Printing Papers
|
4,375
|
|
4,157
|
|
4,058
|
|
|||||
|
Corporate and Intersegment Sales (a)
|
212
|
|
(42
|
)
|
119
|
|
|||||
|
Net Sales
|
$
|
23,306
|
|
$
|
21,743
|
|
$
|
19,495
|
|
||
Operating Profit
|
In millions
|
2018
|
2017
|
2016
|
||||||||
|
Industrial Packaging
|
$
|
2,093
|
|
$
|
1,547
|
|
$
|
1,741
|
|
||
|
Global Cellulose Fibers
|
251
|
|
65
|
|
(179
|
)
|
|||||
|
Printing Papers
|
533
|
|
457
|
|
540
|
|
|||||
|
Business Segment Operating Profit
|
2,877
|
|
2,069
|
|
2,102
|
|
|||||
|
Earnings (loss) from continuing operations before income taxes and equity earnings
|
1,781
|
|
848
|
|
795
|
|
|||||
|
Interest expense, net
|
536
|
|
572
|
|
520
|
|
|||||
|
Noncontrolling interests / equity earnings adjustment (b)
|
(10
|
)
|
(2
|
)
|
1
|
|
|||||
|
Corporate items, net (a)
|
67
|
|
91
|
|
121
|
|
|||||
|
Corporate special items, net (a)
|
9
|
|
76
|
|
55
|
|
|||||
|
Non-operating pension expense
|
494
|
|
484
|
|
610
|
|
|||||
|
|
$
|
2,877
|
|
$
|
2,069
|
|
$
|
2,102
|
|
||
Restructuring and Other Charges
|
In millions
|
2018
|
2017
|
2016
|
||||||||
|
Industrial Packaging
|
$
|
47
|
|
$
|
—
|
|
$
|
7
|
|
||
|
Global Cellulose Fibers
|
—
|
|
—
|
|
—
|
|
|||||
|
Printing Papers
|
3
|
|
—
|
|
—
|
|
|||||
|
Corporate (c)
|
(21
|
)
|
67
|
|
47
|
|
|||||
|
Restructuring and Other Charges
|
$
|
29
|
|
$
|
67
|
|
$
|
54
|
|
||
80
Assets
|
In millions
|
2018
|
2017
|
|||||
|
Industrial Packaging
|
$
|
15,859
|
|
$
|
15,354
|
|
|
|
Global Cellulose Fibers
|
3,880
|
|
3,913
|
|
|||
|
Printing Papers
|
3,905
|
|
4,054
|
|
|||
|
Corporate and other (d)
|
9,932
|
|
10,582
|
|
|||
|
Assets
|
$
|
33,576
|
|
$
|
33,903
|
|
|
Capital Spending
|
In millions
|
2018
|
2017
|
2016
|
||||||||
|
Industrial Packaging
|
$
|
1,061
|
|
$
|
836
|
|
$
|
832
|
|
||
|
Global Cellulose Fibers
|
183
|
|
188
|
|
174
|
|
|||||
|
Printing Papers
|
303
|
|
235
|
|
215
|
|
|||||
|
Subtotal
|
1,547
|
|
1,259
|
|
1,221
|
|
|||||
|
Corporate and other (e)
|
25
|
|
21
|
|
20
|
|
|||||
|
Capital Spending
|
$
|
1,572
|
|
$
|
1,280
|
|
$
|
1,241
|
|
||
Depreciation, Amortization and Cost of Timber Harvested (f)(g)
|
In millions
|
2018
|
2017
|
2016
|
||||||||
|
Industrial Packaging
|
$
|
803
|
|
$
|
815
|
|
$
|
760
|
|
||
|
Global Cellulose Fibers
|
262
|
|
264
|
|
110
|
|
|||||
|
Printing Papers
|
258
|
|
254
|
|
242
|
|
|||||
|
Corporate (h)
|
5
|
|
10
|
|
12
|
|
|||||
|
Depreciation and Amortization
|
$
|
1,328
|
|
$
|
1,343
|
|
$
|
1,124
|
|
||
External Sales By Major Product
|
In millions
|
2018
|
2017
|
2016
|
||||||||
|
Industrial Packaging
|
$
|
15,828
|
|
$
|
14,946
|
|
$
|
14,142
|
|
||
|
Global Cellulose Fibers
|
2,810
|
|
2,524
|
|
1,090
|
|
|||||
|
Printing Papers
|
4,359
|
|
4,142
|
|
4,062
|
|
|||||
|
Other (i)
|
309
|
|
131
|
|
201
|
|
|||||
|
Net Sales
|
$
|
23,306
|
|
$
|
21,743
|
|
$
|
19,495
|
|
||
INFORMATION BY GEOGRAPHIC AREA
Net Sales (j)
|
In millions
|
2018
|
2017
|
2016
|
||||||||
|
United States (k)
|
$
|
17,609
|
|
$
|
16,247
|
|
$
|
14,363
|
|
||
|
EMEA
|
3,321
|
|
3,129
|
|
2,852
|
|
|||||
|
Pacific Rim and Asia
|
605
|
|
625
|
|
699
|
|
|||||
|
Americas, other than U.S.
|
1,771
|
|
1,742
|
|
1,581
|
|
|||||
|
Net Sales
|
$
|
23,306
|
|
$
|
21,743
|
|
$
|
19,495
|
|
||
Long-Lived Assets (l)
|
In millions
|
2018
|
2017
|
|||||
|
United States
|
$
|
10,586
|
|
$
|
10,545
|
|
|
|
EMEA
|
1,315
|
|
1,302
|
|
|||
|
Pacific Rim and Asia
|
201
|
|
236
|
|
|||
|
Americas, other than U.S.
|
1,367
|
|
1,630
|
|
|||
|
Long-Lived Assets
|
$
|
13,469
|
|
$
|
13,713
|
|
|
|
(a)
|
Includes sales of
$0 million
in 2018,
$15 million
in 2017 and
$42 million
in 2016, operating profits (losses) of
$0 million
in 2018,
$0 million
in 2017 and
$(2) million
in 2016, and corporate special items expense of
$0 million
in 2018,
$9 million
in 2017 and
$9 million
in 2016, from previously divested businesses.
|
|
(b)
|
Operating profits for industry segments include each segment’s percentage share of the profits of subsidiaries included in that segment that are less than wholly-owned. The pre-tax noncontrolling interests and equity earnings for these subsidiaries is added here to present consolidated earnings from continuing operations before income taxes and equity earnings.
|
|
(c)
|
Includes corporate expenses and expenses of
$0 million
in 2018,
$9 million
in 2017 and
$9 million
in 2016, from previously divested businesses.
|
|
(d)
|
Includes corporate assets, assets of businesses held for sale and assets of previously divested businesses.
|
|
(e)
|
Includes corporate assets and assets of previously divested businesses of
$0 million
in 2018,
$0 million
in 2017 and
$1 million
in 2016.
|
|
(f)
|
Excludes accelerated depreciation related to the closure and/or repurposing of mills in 2016.
|
|
(g)
|
Prior years recast to reflect current methodology for allocation of Corporate depreciation and amortization to the business segments. There is no change to segment operating profit.
|
|
(h)
|
Includes
$0 million
in 2018,
$1 million
in 2017 and
$2 million
in 2016, from previously divested businesses.
|
|
(i)
|
Includes
$0 million
in 2018,
$15 million
in 2017, and
$42 million
in 2016, from previously divested businesses.
|
|
(j)
|
Net sales are attributed to countries based on the location of the seller.
|
|
(k)
|
Export sales to unaffiliated customers were
$3.1 billion
in
2018
,
$2.9 billion
in
2017
and
$1.8 billion
in
2016
.
|
|
(l)
|
Long-Lived Assets includes Forestlands and Plants, Properties and Equipment, net.
|
81
|
In millions, except per share amounts and stock prices
|
1st
Quarter |
|
2nd
Quarter |
|
3rd
Quarter |
|
4th Quarter
|
|
Year
|
|||||||||||
|
2018
|
||||||||||||||||||||
|
Net sales
|
$
|
5,621
|
|
|
$
|
5,833
|
|
|
$
|
5,901
|
|
|
$
|
5,951
|
|
|
$
|
23,306
|
|
|
|
Earnings (loss) from continuing operations before income taxes and equity earnings
|
356
|
|
(a)
|
490
|
|
(a)
|
553
|
|
(a)
|
382
|
|
(a)
|
1,781
|
|
(a)
|
|||||
|
Gain (loss) from discontinued operations
|
368
|
|
(b)
|
(23
|
)
|
(b)
|
—
|
|
(b)
|
—
|
|
(b)
|
345
|
|
(b)
|
|||||
|
Net earnings (loss) attributable to International Paper Company
|
729
|
|
(a-c)
|
405
|
|
(a-c)
|
562
|
|
(a-c)
|
316
|
|
(a-c)
|
2,012
|
|
(a-c)
|
|||||
|
Basic earnings (loss) per share attributable to International Paper Company common shareholders:
|
||||||||||||||||||||
|
Earnings (loss) from continuing operations
|
$
|
0.87
|
|
|
$
|
1.03
|
|
|
$
|
1.38
|
|
|
$
|
0.79
|
|
|
$
|
4.07
|
|
|
|
Gain (loss) from discontinued operations
|
0.89
|
|
|
(0.05
|
)
|
|
—
|
|
|
—
|
|
|
0.84
|
|
|
|||||
|
Net earnings (loss)
|
1.76
|
|
|
0.98
|
|
|
1.38
|
|
|
0.79
|
|
|
4.91
|
|
|
|||||
|
Diluted earnings (loss) per share attributable to International Paper Company common shareholders:
|
||||||||||||||||||||
|
Earnings (loss) from continuing operations
|
0.86
|
|
|
1.02
|
|
|
1.37
|
|
|
0.78
|
|
|
4.02
|
|
|
|||||
|
Gain (loss) from discontinued operations
|
0.88
|
|
|
(0.05
|
)
|
|
—
|
|
|
—
|
|
|
0.83
|
|
|
|||||
|
Net earnings (loss)
|
1.74
|
|
|
0.97
|
|
|
1.37
|
|
|
0.78
|
|
|
4.85
|
|
|
|||||
|
Dividends per share of common stock
|
0.4750
|
|
|
0.4750
|
|
|
0.4750
|
|
|
0.5000
|
|
|
1.9250
|
|
||||||
|
2017
|
||||||||||||||||||||
|
Net sales
|
$
|
5,132
|
|
|
$
|
5,383
|
|
|
$
|
5,517
|
|
|
$
|
5,711
|
|
|
$
|
21,743
|
|
|
|
Earnings (loss) from continuing operations before income taxes and equity earnings
|
217
|
|
(d)
|
(23
|
)
|
(d)
|
457
|
|
(d)
|
197
|
|
(d)
|
848
|
|
(d)
|
|||||
|
Gain (loss) from discontinued operations
|
17
|
|
(e)
|
(4
|
)
|
(e)
|
29
|
|
(e)
|
(8
|
)
|
(e)
|
34
|
|
(e)
|
|||||
|
Net earnings (loss) attributable to International Paper Company
|
209
|
|
(d-f)
|
80
|
|
(d-f)
|
395
|
|
(d-f)
|
1,460
|
|
(d-f)
|
2,144
|
|
(d-f)
|
|||||
|
Basic earnings (loss) per share attributable to International Paper Company common shareholders:
|
|
|
|
|
|
|
|
|
|
|
||||||||||
|
Earnings (loss) from continuing operations
|
$
|
0.47
|
|
|
$
|
0.20
|
|
|
$
|
0.89
|
|
|
$
|
3.56
|
|
|
$
|
5.11
|
|
|
|
Gain (loss) from discontinued operations
|
0.04
|
|
|
(0.01
|
)
|
|
0.07
|
|
|
(0.02
|
)
|
|
0.08
|
|
|
|||||
|
Net earnings (loss)
|
0.51
|
|
|
0.19
|
|
|
0.96
|
|
|
3.54
|
|
|
5.19
|
|
|
|||||
|
Diluted earnings (loss) per share attributable to International Paper Company common shareholders:
|
|
|
|
|
|
|
|
|
|
|
||||||||||
|
Earnings (loss) from continuing operations
|
0.46
|
|
|
0.20
|
|
|
0.88
|
|
|
3.52
|
|
|
5.05
|
|
|
|||||
|
Gain (loss) from discontinued operations
|
0.04
|
|
|
(0.01
|
)
|
|
0.07
|
|
|
(0.02
|
)
|
|
0.08
|
|
|
|||||
|
Net earnings (loss)
|
0.50
|
|
|
0.19
|
|
|
0.95
|
|
|
3.50
|
|
|
5.13
|
|
|
|||||
|
Dividends per share of common stock
|
0.4625
|
|
|
0.4625
|
|
|
0.4625
|
|
|
0.4750
|
|
|
1.8625
|
|
||||||
Note: International Paper's common shares (symbol: IP) are listed on the New York Stock Exchange.
Note: Since basic and diluted earnings per share are computed independently for each period and category, full year per share amounts may not equal the sum of the four quarters.
82
Footnotes to Interim Financial Results
|
(a)
|
Includes the following pre-tax charges (gains):
|
|
2018
|
||||||||||||||||
|
In millions
|
Q1
|
|
Q2
|
Q3
|
Q4
|
|||||||||||
|
Smurfit-Kappa acquisition proposal costs
|
$
|
—
|
|
$
|
12
|
|
$
|
—
|
|
$
|
—
|
|
||||
|
Legal settlement
|
9
|
|
—
|
|
—
|
|
—
|
|
||||||||
|
Litigation settlement recovery
|
—
|
|
—
|
|
—
|
|
(5
|
)
|
||||||||
|
Environmental remediation reserve adjustment
|
—
|
|
—
|
|
9
|
|
—
|
|
||||||||
|
EMEA Packaging optimization
|
22
|
|
26
|
|
—
|
|
(1
|
)
|
||||||||
|
Abandoned property removal
|
9
|
|
9
|
|
6
|
|
8
|
|
||||||||
|
Riverdale mill conversion costs
|
—
|
|
—
|
|
5
|
|
4
|
|
||||||||
|
Brazil Packaging impairment
|
—
|
|
—
|
|
122
|
|
—
|
|
||||||||
|
Debt extinguishment costs
|
—
|
|
—
|
|
—
|
|
10
|
|
||||||||
|
Gain on sale of investment in Liaison Technologies
|
—
|
|
—
|
|
—
|
|
(31
|
)
|
||||||||
|
Non-operating pension expense
|
4
|
|
36
|
|
25
|
|
429
|
|
||||||||
|
Total
|
$
|
44
|
|
$
|
83
|
|
$
|
167
|
|
$
|
414
|
|
||||
(b) Includes the following pre-tax charges (gains):
|
2018
|
||||||||||||||||
|
In millions
|
Q1
|
|
Q2
|
Q3
|
Q4
|
|||||||||||
|
North American Consumer Packaging transaction costs
|
$
|
23
|
|
$
|
2
|
|
$
|
—
|
|
$
|
—
|
|
||||
|
North American Consumer Packaging gain on transfer
|
(516
|
)
|
28
|
|
—
|
|
—
|
|
||||||||
|
Total
|
$
|
(493
|
)
|
$
|
30
|
|
$
|
—
|
|
$
|
—
|
|
||||
(c) Includes the following tax expenses (benefits):
|
2018
|
||||||||||||||||
|
In millions
|
Q1
|
Q2
|
Q3
|
Q4
|
||||||||||||
|
State income tax legislative changes
|
$
|
—
|
|
$
|
9
|
|
$
|
—
|
|
$
|
—
|
|
||||
|
Tax benefit of Tax Cuts and Jobs Act
|
—
|
|
—
|
|
(36
|
)
|
—
|
|
||||||||
|
International investment restructuring
|
—
|
|
—
|
|
—
|
|
19
|
|
||||||||
|
Foreign tax audits
|
—
|
|
—
|
|
—
|
|
25
|
|
||||||||
|
Tax impact of other special items
|
(9
|
)
|
(13
|
)
|
(46
|
)
|
3
|
|
||||||||
|
Tax impact of non-operating pension expense
|
(1
|
)
|
(9
|
)
|
(6
|
)
|
(107
|
)
|
||||||||
|
Total
|
$
|
(10
|
)
|
$
|
(13
|
)
|
$
|
(88
|
)
|
$
|
(60
|
)
|
||||
(d) Includes the following pre-tax charges (gains):
|
2017
|
||||||||||||||||
|
In millions
|
Q1
|
|
Q2
|
Q3
|
Q4
|
|||||||||||
|
Gain on sale of investment in ArborGen
|
$
|
—
|
|
$
|
(14
|
)
|
$
|
—
|
|
$
|
—
|
|
||||
|
Costs associated with the pulp business acquired in 2016
|
4
|
|
5
|
|
6
|
|
18
|
|
||||||||
|
Amortization of Weyerhaeuser inventory fair value step-up
|
14
|
|
—
|
|
—
|
|
—
|
|
||||||||
|
Holmen bargain purchase gain
|
(6
|
)
|
—
|
|
—
|
|
—
|
|
||||||||
|
Abandoned property removal
|
2
|
|
5
|
|
7
|
|
6
|
|
||||||||
|
Kleen Products settlement
|
—
|
|
354
|
|
—
|
|
—
|
|
||||||||
|
Asia Foodservice sale
|
—
|
|
9
|
|
—
|
|
—
|
|
||||||||
|
Brazil Packaging wood supply accelerated amortization
|
—
|
|
—
|
|
10
|
|
—
|
|
||||||||
|
Debt extinguishment costs
|
—
|
|
—
|
|
—
|
|
83
|
|
||||||||
|
Interest income on income tax refund claims
|
—
|
|
(4
|
)
|
—
|
|
(1
|
)
|
||||||||
|
Other items
|
—
|
|
(2
|
)
|
—
|
|
—
|
|
||||||||
|
Non-operating pension expense
|
31
|
|
34
|
|
33
|
|
386
|
|
||||||||
|
Total
|
$
|
45
|
|
$
|
387
|
|
$
|
56
|
|
$
|
492
|
|
||||
(e) Includes the operating earnings of the North American Consumer Packaging business for the full year. Also includes the following pre-tax charges (gains):
|
2017
|
||||||||||||||||
|
In millions
|
Q1
|
|
Q2
|
Q3
|
Q4
|
|||||||||||
|
North American Consumer Packaging transaction costs
|
$
|
—
|
|
$
|
—
|
|
$
|
—
|
|
$
|
17
|
|
||||
|
Non-operating pension expense
|
—
|
|
—
|
|
—
|
|
45
|
|
||||||||
|
Total
|
$
|
—
|
|
$
|
—
|
|
$
|
—
|
|
$
|
62
|
|
||||
(f) Includes the following tax expenses (benefits):
|
2017
|
||||||||||||||||
|
In millions
|
Q1
|
Q2
|
Q3
|
Q4
|
||||||||||||
|
International legal entity restructuring
|
$
|
15
|
|
$
|
—
|
|
$
|
19
|
|
$
|
—
|
|
||||
|
Income tax refund claims
|
—
|
|
(85
|
)
|
—
|
|
(28
|
)
|
||||||||
|
Cash pension contribution
|
—
|
|
38
|
|
—
|
|
—
|
|
||||||||
|
International tax law change
|
—
|
|
—
|
|
—
|
|
9
|
|
||||||||
|
Tax benefit of Tax Cuts and Jobs Act
|
—
|
|
—
|
|
—
|
|
(1,222
|
)
|
||||||||
|
Tax impact of other special items
|
(8
|
)
|
(137
|
)
|
(8
|
)
|
(41
|
)
|
||||||||
|
Tax impact of non-operating pension expense
|
(12
|
)
|
(13
|
)
|
(13
|
)
|
(148
|
)
|
||||||||
|
Total
|
$
|
(5
|
)
|
$
|
(197
|
)
|
$
|
(2
|
)
|
$
|
(1,430
|
)
|
||||
83
None.
As of December 31, 2018, an evaluation was carried out under the supervision and with the participation of the Company’s management, including our principal executive officer and principal financial officer, of the effectiveness of our disclosure controls and procedures and internal control over financial reporting. Based upon this evaluation, our principal executive officer and principal financial officer have concluded that the Company’s disclosure controls and procedures and internal control over financial reporting were effective as of December 31, 2018.
CHANGES IN INTERNAL CONTROL OVER FINANCIAL REPORTING
There have been no changes in our internal control over financial reporting during the quarter ended
December 31, 2018
, that have materially affected, or are reasonably likely to materially affect, our internal control over financial reporting.
None.
Information concerning our directors is hereby incorporated by reference to our definitive proxy statement that will be filed with the Securities and Exchange Commission (SEC) within 120 days of the close of our fiscal year. The Audit and Finance Committee of the Board of Directors has at least one member who is a financial expert, as that term is defined in Item 401(d)(5) of Regulation S-K. Further information concerning the composition of the Audit and Finance Committee and our audit committee financial experts is hereby incorporated by reference to our definitive proxy statement that will be filed with the SEC within 120 days of the close of our fiscal year. Information with respect to our executive officers is set forth on pages
4
and
5
in
Part I
of this Form 10-K under the caption, “
Executive Officers of the Registrant
.”
Executive officers of International Paper are elected to hold office until the next annual meeting of the Board of Directors following the annual meeting of shareholders and, until the election of successors, subject to removal by the Board.
The Company’s Code of Business Ethics (Code) is applicable to all employees of the Company, including the chief executive officer and senior financial officers, as well as the Board of Directors. We disclose any amendments to our Code and any waivers from a provision of our Code granted to our directors, chief executive officer and senior financial officers on our website within four business days following such amendment or waiver. To date, no waivers of the Code have been granted.
We make available free of charge on our website at www.internationalpaper.com, and in print to any shareholder who requests them, our Corporate Governance Principles, our Code of Business Ethics and the Charters of our Audit and Finance Committee, Management Development and Compensation Committee, Governance Committee and Public Policy and Environment Committee. Requests for copies may be directed to the corporate secretary at our corporate headquarters.
Information with respect to compliance with Section 16(a) of the Exchange Act and our corporate governance is hereby incorporated by reference to our definitive proxy statement that will be filed with the SEC within 120 days of the close of our fiscal year.
Information with respect to the compensation of executives and directors of the Company is hereby incorporated by reference to our definitive proxy statement that will be filed with the SEC within 120 days of the close of our fiscal year.
A description of the security ownership of certain beneficial owners and management and equity compensation plan information is hereby incorporated by reference to our definitive proxy statement that will be filed with the SEC within 120 days of the close of our fiscal year.
A description of certain relationships and related transactions is hereby incorporated by reference to our definitive proxy statement that will be filed with the SEC within 120 days of the close of our fiscal year.
84
Information with respect to fees paid to, and services rendered by, our independent registered public accounting firm, and our policies and procedures for pre-approving those services, is hereby incorporated by reference to our definitive proxy statement that will be filed with the SEC within 120 days of the close of our fiscal year.
|
(1)
|
Financial Statements – See
Item 8. Financial Statements and Supplementary Data
.
|
|
(2)
|
Financial Statement Schedules – The following additional financial data should be read in conjunction with the consolidated financial statements in
Item 8. Financial Statements and Supplementary Data
. Schedules not included with this additional financial data have been omitted because they are not applicable, or the required information is shown in the consolidated financial statements or the notes thereto.
|
2018
,
2017
and
2016
|
(2.1)
|
|
|
(3.1)
|
|
|
(3.2)
|
|
|
(4.1)
|
|
|
(4.2)
|
|
|
(4.3)
|
|
|
(4.4)
|
|
|
(4.5)
|
|
|
(4.6)
|
|
|
(4.7)
|
|
|
(4.8)
|
|
85
|
(4.9)
|
|
|
(4.10)
|
|
|
(4.11)
|
In accordance with Item 601 (b) (4) (iii) (A) of Regulation S-K, certain instruments respecting long-term debt of the Company have been omitted but will be furnished to the Commission upon request.
|
|
(10.1)
|
|
|
(10.2)
|
|
|
(10.3)
|
|
|
(10.4)
|
|
|
(10.5)
|
|
|
(10.6)
|
|
|
(10.7)
|
|
|
(10.8)
|
|
|
(10.9)
|
|
|
(10.10)
|
|
|
(10.11)
|
|
|
(10.12)
|
|
|
(10.13)
|
|
|
(10.14)
|
|
|
(10.15)
|
|
86
|
(10.16)
|
|
|
(10.17)
|
|
|
(10.18)
|
|
|
(10.19)
|
|
|
(10.20)
|
|
|
(10.21)
|
|
|
(10.22)
|
|
|
(10.23)
|
|
|
(10.24)
|
|
|
(10.25)
|
|
|
(10.26)
|
|
|
(10.27)
|
|
|
(10.28)
|
|
|
(10.29)
|
|
|
(21)
|
|
|
(23.1)
|
|
|
(23.2)
|
|
|
(24)
|
|
|
(31.1)
|
|
|
(31.2)
|
|
|
(32)
|
|
|
(99.1)
|
|
87
|
(101.INS)
|
XBRL Instance Document *
|
|
(101.SCH)
|
XBRL Taxonomy Extension Schema *
|
|
(101.CAL)
|
XBRL Taxonomy Extension Calculation Linkbase *
|
|
(101.DEF)
|
XBRL Taxonomy Extension Definition Linkbase *
|
|
(101.LAB)
|
XBRL Taxonomy Extension Label Linkbase *
|
|
(101.PRE)
|
XBRL Extension Presentation Linkbase *
|
+ Management contract or compensatory plan or arrangement.
* Filed herewith
† Confidential treatment has been granted for certain information pursuant to Rule 24b-2 under the Securities Act of 1934, as amended.
88
Pursuant to the requirements of Section 13 or 15(d) of the Securities Exchange Act of 1934, the Registrant has duly caused this report to be signed on its behalf by the undersigned, thereunto duly authorized.
INTERNATIONAL PAPER COMPANY
|
By:
|
/
S
/ S
HARON
R. R
YAN
|
February 20, 2019
|
|
|
Sharon R. Ryan
|
|||
|
Senior Vice President, General Counsel
and Corporate Secretary
|
|||
POWER OF ATTORNEY
KNOW ALL MEN BY THESE PRESENTS, that each person whose signature appears below constitutes and appoints Sharon R. Ryan and Matthew Barron as his or her true and lawful attorney-in-fact and agent, acting alone, with full power of substitution and resubstitution for him or her and in his or her name, place and stead, in any and all capacities, to sign any or all amendments to this annual report on Form 10-K, and to file the same, with all exhibits thereto and other documents in connection therewith, with the Securities and Exchange Commission, granting unto said attorney-in-fact full power and authority to do and perform each and every act and thing requisite or necessary to be done, hereby ratifying and confirming all that said attorney-in-fact and agent, or his or her substitute or substitutes, may lawfully do or cause to be done by virtue hereof.
Pursuant to the requirements of the Securities Exchange Act of 1934, this report has been signed below by the following persons on behalf of the registrant and in the capacities and on the dates indicated:
|
Signature
|
|
Title
|
|
Date
|
|
/
S
/ M
ARK
S. S
UTTON
|
|
Chairman of the Board & Chief Executive Officer and Director
|
|
February 20, 2019
|
|
Mark S. Sutton
|
||||
|
/
S
/ D
AVID
J. B
RONCZEK
|
|
Director
|
|
February 20, 2019
|
|
David J. Bronczek
|
||||
|
/
S
/ W
ILLIAM
J. B
URNS
|
|
Director
|
|
February 20, 2019
|
|
Willliam J. Burns
|
||||
|
/
S
/ C
HRISTOPHER
M. C
ONNOR
|
|
Director
|
|
February 20, 2019
|
|
Christopher M. Connor
|
||||
|
/
S
/ A
HMET
C. D
ORDUNCU
|
|
Director
|
|
February 20, 2019
|
|
Ahmet C. Dorduncu
|
||||
|
/
S
/ I
LENE
S. G
ORDON
|
|
Director
|
|
February 20, 2019
|
|
Ilene S. Gordon
|
||||
89
|
/
S
/ J
ACQUELINE
C. H
INMAN
|
|
Director
|
|
February 20, 2019
|
|
Jacqueline C. Hinman
|
||||
|
/s/ C
LINTON
A. L
EWIS, JR.
|
|
Director
|
|
February 20, 2019
|
|
Clinton A. Lewis, Jr.
|
||||
|
/S/ K
ATHRYN
D. S
ULLIVAN
|
|
Director
|
|
February 20, 2019
|
|
Kathryn D. Sullivan
|
||||
|
/
S
/ J. S
TEVEN
W
HISLER
|
|
Director
|
|
February 20, 2019
|
|
J. Steven Whisler
|
||||
|
/
S
/ R
AY
G. Y
OUNG
|
|
Director
|
|
February 20, 2019
|
|
Ray G. Young
|
||||
|
/
S
/ T
IMOTHY
S. N
ICHOLLS
|
|
Senior Vice President and Chief Financial Officer
|
|
February 20, 2019
|
|
Timothy S. Nicholls
|
||||
|
/
S
/ V
INCENT
P. B
ONNOT
|
|
Vice President – Finance and Controller
|
|
February 20, 2019
|
|
Vincent P. Bonnot
|
||||
90
2018
LISTING OF FACILITIES
(all facilities are owned except noted otherwise)
|
PRINTING PAPERS
|
Savannah, Georgia
|
Tracy, California
|
||
|
Cayuga, Indiana
|
Golden, Colorado
|
|||
|
Uncoated Papers
|
Cedar Rapids, Iowa
|
Wheat Ridge, Colorado
|
||
|
U.S.:
|
Henderson, Kentucky
|
Putnam, Connecticut
|
||
|
Selma, Alabama (Riverdale Mill)
|
Maysville, Kentucky
|
Orlando, Florida
|
||
|
Ticonderoga, New York
|
Bogalusa, Louisiana
|
Plant City, Florida
|
||
|
Eastover, South Carolina
|
Campti, Louisiana
|
Tampa, Florida leased
|
||
|
Georgetown, South Carolina
|
Mansfield, Louisiana
|
Columbus, Georgia
|
||
|
Sumter, South Carolina
|
Vicksburg, Mississippi
|
Forest Park, Georgia
|
||
|
Valliant, Oklahoma
|
Griffin, Georgia
|
|||
|
International:
|
Springfield, Oregon
|
Kennesaw, Georgia leased
|
||
|
Luiz Antônio, São Paulo, Brazil
|
Orange, Texas
|
Lithonia, Georgia
|
||
|
Mogi Guacu, São Paulo, Brazil
|
Savannah, Georgia
|
|||
|
Três Lagoas, Mato Grosso do Sul, Brazil
|
International:
|
Stone Mountain, Georgia leased
|
||
|
Saillat, France
|
Franco da Rocha, São Paulo, Brazil
|
Tucker, Georgia
|
||
|
Kadiam, India
|
Nova Campina, São Paulo, Brazil
|
Aurora, Illinois (3 locations)
|
||
|
Rajahmundry, India
|
Paulinia, São Paulo, Brazil
|
Bedford Park, Illinois (2 locations) 1 leased
|
||
|
Kwidzyn, Poland
|
Veracruz, Mexico
|
Belleville, Illinois
|
||
|
Svetogorsk, Russia
|
Kenitra, Morocco
|
Carol Stream, Illinois
|
||
|
Madrid, Spain
|
Des Plaines, Illinois
|
|||
|
GLOBAL CELLULOSE FIBERS
|
Lincoln, Illinois
|
|||
|
Corrugated Container
|
Montgomery, Illinois
|
|||
|
Pulp
|
U.S.:
|
Northlake, Illinois
|
||
|
U.S.:
|
Bay Minette, Alabama
|
Rockford, Illinois
|
||
|
Cantonment, Florida
|
Decatur, Alabama
|
Butler, Indiana
|
||
|
Flint River, Georgia
|
Dothan, Alabama leased
|
Crawfordsville, Indiana
|
||
|
Port Wentworth, Georgia
|
Huntsville, Alabama
|
Fort Wayne, Indiana
|
||
|
Columbus, Mississippi
|
Conway, Arkansas
|
Hammond, Indiana
|
||
|
New Bern, North Carolina
|
Fort Smith, Arkansas (2 locations)
|
Indianapolis, Indiana (2 locations)
|
||
|
Riegelwood, North Carolina
|
Russellville, Arkansas (2 locations)
|
Saint Anthony, Indiana
|
||
|
Eastover, South Carolina
|
Tolleson, Arizona
|
Tipton, Indiana
|
||
|
Georgetown, South Carolina
|
Yuma, Arizona
|
Cedar Rapids, Iowa
|
||
|
Franklin, Virginia
|
Anaheim, California
|
Waterloo, Iowa
|
||
|
Buena Park, California leased
|
Garden City, Kansas
|
|||
|
International:
|
Camarillo, California
|
Kansas City, Kansas
|
||
|
Grande Prairie, Alberta, Canada
|
Carson, California
|
Bowling Green, Kentucky
|
||
|
Saillat, France
|
Cerritos, California leased
|
Lexington, Kentucky
|
||
|
Gdansk, Poland
|
Compton, California
|
Louisville, Kentucky
|
||
|
Kwidzyn, Poland
|
Elk Grove, California
|
Walton, Kentucky
|
||
|
Svetogorsk, Russia
|
Exeter, California
|
Bogalusa, Louisiana
|
||
|
Gilroy, California (2 locations)
|
Lafayette, Louisiana
|
|||
|
INDUSTRIAL PACKAGING
|
Los Angeles, California
|
Shreveport, Louisiana
|
||
|
Modesto, California
|
Springhill, Louisiana
|
|||
|
Containerboard
|
Ontario, California
|
Auburn, Maine
|
||
|
U.S.:
|
Salinas, California
|
Three Rivers, Michigan
|
||
|
Pine Hill, Alabama
|
Sanger, California
|
Arden Hills, Minnesota
|
||
|
Prattville, Alabama
|
San Leandro, California leased
3
|
Austin, Minnesota
|
||
|
Cantonment, Florida
|
Santa Fe Springs, California (2 locations)
|
Fridley, Minnesota
|
||
|
Rome, Georgia
|
Stockton, California
|
Minneapolis, Minnesota leased
|
||
A-1
|
Shakopee, Minnesota
|
Laurens, South Carolina
|
Silao, Mexico
|
||
|
White Bear Lake, Minnesota
|
Lexington, South Carolina
|
Toluca, Mexico
|
||
|
Houston, Mississippi
|
Ashland City, Tennessee leased
|
Villa Nicolas Romero, Mexico
|
||
|
Jackson, Mississippi
|
Cleveland, Tennessee
|
Zapopan, Mexico
|
||
|
Magnolia, Mississippi leased
|
Elizabethton, Tennessee leased
|
Agadir, Morocco
|
||
|
Olive Branch, Mississippi
|
Morristown, Tennessee
|
Casablanca, Morocco
|
||
|
Fenton, Missouri
|
Murfreesboro, Tennessee
|
Tangier, Morocco
|
||
|
Kansas City, Missouri
|
Amarillo, Texas
|
Almeria, Spain
2
|
||
|
Maryland Heights, Missouri
|
Carrollton, Texas (2 locations)
|
Barcelona, Spain
|
||
|
North Kansas City, Missouri leased
|
Edinburg, Texas
|
Bilbao, Spain
|
||
|
St. Joseph, Missouri
|
El Paso, Texas
|
Gandia, Spain
|
||
|
St. Louis, Missouri
|
Ft. Worth, Texas leased
|
Las Palmas, Spain
|
||
|
Omaha, Nebraska
|
Grand Prairie, Texas
|
Madrid, Spain
|
||
|
Barrington, New Jersey
|
Hidalgo, Texas
|
Tenerife, Spain
|
||
|
Bellmawr, New Jersey
|
McAllen, Texas
|
Adana, Turkey
|
||
|
Milltown, New Jersey
|
San Antonio, Texas (2 locations)
|
Bursa. Turkey
|
||
|
Spotswood, New Jersey
|
Sealy, Texas
|
Corlu, Turkey
|
||
|
Thorofare, New Jersey
|
Waxahachie, Texas
|
Corum, Turkey
|
||
|
Binghamton, New York
|
Lynchburg, Virginia
|
Gebze, Turkey
|
||
|
Buffalo, New York
|
Petersburg, Virginia
|
Izmir, Turkey
|
||
|
Rochester, New York
|
Richmond, Virginia
|
|||
|
Scotia, New York
|
Moses Lake, Washington
|
Recycling
|
||
|
Utica, New York
|
Olympia, Washington
|
U.S.:
|
||
|
Charlotte, North Carolina (2 locations) 1 leased
|
Yakima, Washington
|
Phoenix, Arizona
|
||
|
Lumberton, North Carolina
|
Fond du Lac, Wisconsin
|
Fremont, California
|
||
|
Manson, North Carolina
|
Manitowoc, Wisconsin
|
Norwalk, California
|
||
|
Newton, North Carolina
|
West Sacramento, California
|
|||
|
Statesville, North Carolina
|
International:
|
Itasca, Illinois
|
||
|
Byesville, Ohio
|
Manaus, Amazonas, Brazil
|
Des Moines, Iowa
|
||
|
Delaware, Ohio
|
Paulinia, São Paulo, Brazil
|
Wichita, Kansas
|
||
|
Eaton, Ohio
|
Rio Verde, Goias, Brazil
|
Roseville, Minnesota
|
||
|
Madison, Ohio
|
Suzano, São Paulo, Brazil
|
Omaha, Nebraska
|
||
|
Marion, Ohio
|
Rancagua, Chile
|
Charlotte, North Carolina
|
||
|
Marysville, Ohio leased
|
Arles, France
|
Beaverton, Oregon
|
||
|
Middletown, Ohio
|
Chalon-sur-Saone, France
|
Springfield, Oregon leased
|
||
|
Mt. Vernon, Ohio
|
Creil, France
|
Carrollton, Texas
|
||
|
Newark, Ohio
|
LePuy, France (Espaly Box Plant)
|
Salt Lake City, Utah
|
||
|
Streetsboro, Ohio
|
Mortagne, France
|
Richmond, Virginia
|
||
|
Wooster, Ohio
|
Guadeloupe, French West Indies
|
Kent, Washington
|
||
|
Oklahoma City, Oklahoma
|
Bellusco, Italy
|
|||
|
Beaverton, Oregon (3 locations)
|
Catania, Italy
|
International:
|
||
|
Hillsboro, Oregon
|
Pomezia, Italy
|
Monterrey, Mexico leased
|
||
|
Portland, Oregon
|
San Felice, Italy
|
Xalapa, Veracruz, Mexico leased
|
||
|
Salem, Oregon leased
|
Apodaco (Monterrey), Mexico leased
|
|||
|
Biglerville, Pennsylvania (2 locations)
|
Ixtaczoquitlan, Mexico
|
Bags
|
||
|
Eighty-four, Pennsylvania
|
Juarez, Mexico leased
|
U.S.:
|
||
|
Hazleton, Pennsylvania
|
Los Mochis, Mexico
|
Buena Park, California
|
||
|
Kennett Square, Pennsylvania
|
Puebla, Mexico leased
|
Beaverton, Oregon
|
||
|
Lancaster, Pennsylvania
|
Reynosa, Mexico
|
Grand Prairie, Texas
|
||
|
Mount Carmel, Pennsylvania
|
San Jose Iturbide, Mexico
|
|||
|
Georgetown, South Carolina
|
Santa Catarina, Mexico
|
|||
A-2
|
Coated Paperboard
|
||||
|
International:
|
||||
|
Kwidzyn, Poland
|
||||
|
Svetogorsk, Russia
|
||||
|
DISTRIBUTION
|
||||
|
IP Asia
|
||||
|
International:
|
||||
|
Guangzhou, China
|
||||
|
Hong Kong, China
|
||||
|
Shanghai, China
|
||||
|
Japan
|
||||
|
Korea
|
||||
|
Singapore
|
||||
|
Taiwan
1
|
||||
|
Thailand
1
|
||||
|
Vietnam
1
|
||||
|
FOREST RESOURCES
|
||||
|
International:
|
||||
|
Approximately 329,400 acres
|
||||
|
in Brazil
|
||||
|
1) Closed July 2018
|
||||
|
2) Closed September 2018
|
||||
|
3) Closed December 2018
|
||||
A-3
2018
CAPACITY INFORMATION
|
(in thousands of short tons except as noted)
|
U.S.
|
EMEA
|
Americas,
other than U.S. |
India
|
Total
|
|||||||||
|
Industrial Packaging
|
||||||||||||||
|
Containerboard
(a)
|
13,596
|
|
91
|
|
366
|
|
—
|
|
14,053
|
|
||||
|
Coated Paperboard
|
—
|
|
428
|
|
—
|
|
—
|
|
428
|
|
||||
|
Total Industrial Packaging
|
13,596
|
|
519
|
|
366
|
|
—
|
|
14,481
|
|
||||
|
Global Cellulose Fibers
|
||||||||||||||
|
Dried Pulp
(in thousands of metric tons)
|
2,914
|
|
277
|
|
535
|
|
—
|
|
3,726
|
|
||||
|
Printing Papers
|
||||||||||||||
|
Uncoated Freesheet & Bristols
(b)
|
1,990
|
|
1,162
|
|
1,135
|
|
266
|
|
4,553
|
|
||||
|
Newsprint
|
—
|
|
75
|
|
—
|
|
—
|
|
75
|
|
||||
|
Total Printing Papers
|
1,990
|
|
1,237
|
|
1,135
|
|
266
|
|
4,628
|
|
||||
(a) In addition to Containerboard, this also includes saturated kraft, kraft bag, and gypsum.
(b) In addition to Uncoated Freesheet and Bristols, includes bleached multiwall bag and plate.
|
Forest Resources
|
||
|
We own, manage or have an interest in approximately 1.4 million acres of forestlands worldwide. These forestlands and associated acres are located in the following regions:
|
(M Acres)
|
|
|
Brazil
|
329
|
|
|
We have harvesting rights in:
|
||
|
Russia
|
1,047
|
|
|
|
|
|
|
Total
|
1,376
|
|
A-4
TABLE OF CONTENTS
Item 5. Market For Registrant S Common Equity, Related Stockholder Matters and Issuer Purchases Of Equity SecuritiesNote 2. Returns Are Calculated in $usd