INTERNATIONAL PAPER CO /NEW/
10-Ks and 10-Qs
|
|
|
|
|
|
|
|
|
|
|
|
|
|
|
|
|
|
|
|
|
|
|
|
|
|
|
|
|
|
|
|
|
|
|
|
|
|
|
|
|
|
|
|
|
|
|
|
|
|
|
|
|
|
|
|
|
|
|
UNITED STATES
SECURITIES AND EXCHANGE COMMISSION
WASHINGTON, D.C. 20549
FORM 10-Q
ý
QUARTERLY REPORT PURSUANT TO SECTION 13 OR 15(d) OF THE SECURITIES EXCHANGE ACT OF 1934
For the Quarterly Period Ended
March 31, 2016
¨
TRANSITION REPORT PURSUANT TO SECTION 13 OR 15(d) OF THE SECURITIES EXCHANGE ACT OF 1934
For the Transition Period From to
_________________________________________
Commission File Number 1-3157
INTERNATIONAL PAPER COMPANY
(Exact name of registrant as specified in its charter)
|
New York
|
13-0872805
|
|
(State or other jurisdiction of
|
(I.R.S. Employer
|
|
incorporation of organization)
|
Identification No.)
|
|
6400 Poplar Avenue, Memphis, TN
|
38197
|
|
(Address of principal executive offices)
|
(Zip Code)
|
Registrant’s telephone number, including area code: (901) 419-7000
Indicate by check mark whether the registrant (1) has filed all reports required to be filed by Section 13 or 15(d) of the Securities Exchange Act of 1934 during the preceding 12 months (or for such shorter period that the registrant was required to file such reports), and (2) has been subject to such filing requirements for the past 90 days. Yes
ý
No
¨
Indicate by check mark whether the registrant has submitted electronically and posted on its corporate Web site, if any, every Interactive Data File required to be submitted and posted pursuant to Rule 405 of Regulation S-T (paragraph 232.405 of this chapter) during the preceding 12 months (or for such shorter period that the registrant was required to submit and post such files). Yes
ý
No
¨
Indicate by check mark whether the registrant is a large accelerated filer, an accelerated filer, a non-accelerated filer or a smaller reporting company. See the definitions of “large accelerated filer,” “accelerated filer” and “smaller reporting company” in Rule 12b-2 of the Exchange Act.
|
Large accelerated filer
|
ý
|
Accelerated filer
|
¨
|
|
Non-accelerated filer
|
¨
|
Smaller reporting company
|
¨
|
Indicate by check mark whether the registrant is a shell company (as defined in Rule 12b-2 of the Exchange Act). Yes
¨
No
ý
The number of shares outstanding of the registrant’s common stock, par value $1.00 per share, as of
April 29, 2016
was
411,174,341
.
INDEX
|
|
|
PAGE NO.
|
|
Consolidated Statement of Operations - Three Months Ended March 31, 2016 and 2015
|
||
|
Consolidated Statement of Comprehensive Income - Three Months Ended March 31, 2016 and 2015
|
||
|
Consolidated Balance Sheet - March 31, 2016 and December 31, 2015
|
||
|
Consolidated Statement of Cash Flows - Three Months Ended March 31, 2016 and 2015
|
||
|
ITEM 1.
|
FINANCIAL STATEMENTS
|
INTERNATIONAL PAPER COMPANY
(Unaudited)
(In millions, except per share amounts)
|
|
Three Months Ended
March 31, |
||||||
|
|
2016
|
2015
|
|||||
|
Net Sales
|
$
|
5,110
|
|
$
|
5,517
|
|
|
|
Costs and Expenses
|
|||||||
|
Cost of products sold
|
3,611
|
|
3,844
|
|
|||
|
Selling and administrative expenses
|
376
|
|
406
|
|
|||
|
Depreciation, amortization and cost of timber harvested
|
284
|
|
323
|
|
|||
|
Distribution expenses
|
320
|
|
357
|
|
|||
|
Taxes other than payroll and income taxes
|
41
|
|
44
|
|
|||
|
Restructuring and other charges
|
1
|
|
—
|
|
|||
|
Net (gains) losses on sales and impairments of businesses
|
37
|
|
—
|
|
|||
|
Interest expense, net
|
123
|
|
137
|
|
|||
|
Earnings (Loss) From Continuing Operations Before Income Taxes and Equity Earnings
|
317
|
|
406
|
|
|||
|
Income tax provision (benefit)
|
41
|
|
130
|
|
|||
|
Equity earnings (loss), net of taxes
|
63
|
|
35
|
|
|||
|
Earnings (Loss) From Continuing Operations
|
339
|
|
311
|
|
|||
|
Discontinued operations, net of taxes
|
(5
|
)
|
—
|
|
|||
|
Net Earnings (Loss)
|
334
|
|
311
|
|
|||
|
Less: Net earnings (loss) attributable to noncontrolling interests
|
—
|
|
(2
|
)
|
|||
|
Net Earnings (Loss) Attributable to International Paper Company
|
$
|
334
|
|
$
|
313
|
|
|
|
Basic Earnings (Loss) Per Share Attributable to International Paper Company Common Shareholders
|
|||||||
|
Earnings (loss) from continuing operations
|
$
|
0.82
|
|
$
|
0.74
|
|
|
|
Discontinued operations, net of taxes
|
(0.01
|
)
|
—
|
|
|||
|
Net earnings (loss)
|
$
|
0.81
|
|
$
|
0.74
|
|
|
|
Diluted Earnings (Loss) Per Share Attributable to International Paper Company Common Shareholders
|
|||||||
|
Earnings (loss) from continuing operations
|
$
|
0.82
|
|
$
|
0.74
|
|
|
|
Discontinued operations, net of taxes
|
(0.01
|
)
|
—
|
|
|||
|
Net earnings (loss)
|
$
|
0.81
|
|
$
|
0.74
|
|
|
|
Average Shares of Common Stock Outstanding – assuming dilution
|
414.0
|
|
423.7
|
|
|||
|
Cash Dividends Per Common Share
|
$
|
0.4400
|
|
$
|
0.4000
|
|
|
|
Amounts Attributable to International Paper Company Common Shareholders
|
|||||||
|
Earnings (loss) from continuing operations
|
$
|
339
|
|
$
|
313
|
|
|
|
Discontinued operations, net of taxes
|
(5
|
)
|
—
|
|
|||
|
Net earnings (loss)
|
$
|
334
|
|
$
|
313
|
|
|
The accompanying notes are an integral part of these consolidated financial statements.
1
INTERNATIONAL PAPER COMPANY
Consolidated Statement of Comprehensive Income
(Unaudited)
(In millions)
|
|
Three Months Ended
March 31, |
||||||
|
|
2016
|
2015
|
|||||
|
Net Earnings (Loss)
|
$
|
334
|
|
$
|
311
|
|
|
|
Other Comprehensive Income (Loss), Net of Tax:
|
|||||||
|
Amortization of pension and post-retirement prior service costs and net loss:
|
|||||||
|
U.S. plans
|
64
|
|
78
|
|
|||
|
Pension and postretirement liability adjustments:
|
|||||||
|
Non-U.S. plans
|
17
|
|
—
|
|
|||
|
Change in cumulative foreign currency translation adjustment
|
236
|
|
(484
|
)
|
|||
|
Net gains/losses on cash flow hedging derivatives:
|
|||||||
|
Net gains (losses) arising during the period
|
4
|
|
6
|
|
|||
|
Reclassification adjustment for (gains) losses included in net earnings (loss)
|
(1
|
)
|
3
|
|
|||
|
Total Other Comprehensive Income (Loss), Net of Tax
|
320
|
|
(397
|
)
|
|||
|
Comprehensive Income (Loss)
|
654
|
|
(86
|
)
|
|||
|
Net (earnings) loss attributable to noncontrolling interests
|
—
|
|
2
|
|
|||
|
Other comprehensive (income) loss attributable to noncontrolling interests
|
(1
|
)
|
1
|
|
|||
|
Comprehensive Income (Loss) Attributable to International Paper Company
|
$
|
653
|
|
$
|
(83
|
)
|
|
The accompanying notes are an integral part of these consolidated financial statements.
2
INTERNATIONAL PAPER COMPANY
(In millions)
|
March 31,
2016 |
December 31,
2015 |
||||||
|
|
(unaudited)
|
|
|||||
|
Assets
|
|||||||
|
Current Assets
|
|||||||
|
Cash and temporary investments
|
$
|
1,155
|
|
$
|
1,050
|
|
|
|
Accounts and notes receivable, net
|
2,641
|
|
2,675
|
|
|||
|
Inventories
|
2,217
|
|
2,228
|
|
|||
|
Deferred income tax assets
|
295
|
|
312
|
|
|||
|
Assets held for sale
|
216
|
|
—
|
|
|||
|
Other current assets
|
268
|
|
212
|
|
|||
|
Total Current Assets
|
6,792
|
|
6,477
|
|
|||
|
Plants, Properties and Equipment, net
|
12,037
|
|
11,980
|
|
|||
|
Forestlands
|
399
|
|
366
|
|
|||
|
Investments
|
287
|
|
228
|
|
|||
|
Financial Assets of Special Purpose Entities (Note 13)
|
7,019
|
|
7,014
|
|
|||
|
Goodwill
|
3,354
|
|
3,335
|
|
|||
|
Deferred Charges and Other Assets
|
1,155
|
|
1,131
|
|
|||
|
Total Assets
|
$
|
31,043
|
|
$
|
30,531
|
|
|
|
Liabilities and Equity
|
|||||||
|
Current Liabilities
|
|||||||
|
Notes payable and current maturities of long-term debt
|
$
|
551
|
|
$
|
426
|
|
|
|
Liabilities held for sale
|
98
|
|
—
|
|
|||
|
Accounts payable
|
2,065
|
|
2,078
|
|
|||
|
Accrued payroll and benefits
|
362
|
|
434
|
|
|||
|
Other accrued liabilities
|
1,022
|
|
986
|
|
|||
|
Total Current Liabilities
|
4,098
|
|
3,924
|
|
|||
|
Long-Term Debt
|
8,824
|
|
8,844
|
|
|||
|
Nonrecourse Financial Liabilities of Special Purpose Entities (Note 13)
|
6,279
|
|
6,277
|
|
|||
|
Deferred Income Taxes
|
3,277
|
|
3,231
|
|
|||
|
Pension Benefit Obligation
|
3,533
|
|
3,548
|
|
|||
|
Postretirement and Postemployment Benefit Obligation
|
338
|
|
364
|
|
|||
|
Other Liabilities
|
434
|
|
434
|
|
|||
|
Equity
|
|||||||
|
Common stock, $1 par value, 2016 – 448.9 shares and 2015 – 448.9 shares
|
449
|
|
449
|
|
|||
|
Paid-in capital
|
6,130
|
|
6,243
|
|
|||
|
Retained earnings
|
4,800
|
|
4,649
|
|
|||
|
Accumulated other comprehensive loss
|
(5,389
|
)
|
(5,708
|
)
|
|||
|
5,990
|
|
5,633
|
|
||||
|
Less: Common stock held in treasury, at cost, 2016 – 37.737 shares and 2015 – 36.776 shares
|
1,756
|
|
1,749
|
|
|||
|
Total Shareholders’ Equity
|
4,234
|
|
3,884
|
|
|||
|
Noncontrolling interests
|
26
|
|
25
|
|
|||
|
Total Equity
|
4,260
|
|
3,909
|
|
|||
|
Total Liabilities and Equity
|
$
|
31,043
|
|
$
|
30,531
|
|
|
The accompanying notes are an integral part of these consolidated financial statements.
3
INTERNATIONAL PAPER COMPANY
(Unaudited)
(In millions)
|
|
Three Months Ended
March 31, |
||||||
|
|
2016
|
2015
|
|||||
|
Operating Activities
|
|||||||
|
Net earnings (loss)
|
$
|
334
|
|
$
|
311
|
|
|
|
Depreciation, amortization and cost of timber harvested
|
284
|
|
323
|
|
|||
|
Deferred income tax provision (benefit), net
|
(37
|
)
|
(3
|
)
|
|||
|
Restructuring and other charges
|
1
|
|
—
|
|
|||
|
Net (gains) losses on sales and impairments of businesses
|
37
|
|
—
|
|
|||
|
Equity (earnings) loss, net
|
(63
|
)
|
(35
|
)
|
|||
|
Periodic pension expense, net
|
91
|
|
122
|
|
|||
|
Other, net
|
27
|
|
76
|
|
|||
|
Changes in current assets and liabilities
|
|||||||
|
Accounts and notes receivable
|
(7
|
)
|
(76
|
)
|
|||
|
Inventories
|
(9
|
)
|
(81
|
)
|
|||
|
Accounts payable and accrued liabilities
|
(26
|
)
|
(14
|
)
|
|||
|
Interest payable
|
32
|
|
19
|
|
|||
|
Other
|
(44
|
)
|
(4
|
)
|
|||
|
Cash Provided By (Used For) Operations
|
620
|
|
638
|
|
|||
|
Investment Activities
|
|||||||
|
Invested in capital projects
|
(309
|
)
|
(319
|
)
|
|||
|
Proceeds from sale of fixed assets
|
8
|
|
9
|
|
|||
|
Other
|
(63
|
)
|
(67
|
)
|
|||
|
Cash Provided By (Used For) Investment Activities
|
(364
|
)
|
(377
|
)
|
|||
|
Financing Activities
|
|||||||
|
Repurchases of common stock and payments of restricted stock tax withholding
|
(131
|
)
|
(139
|
)
|
|||
|
Issuance of common stock
|
—
|
|
2
|
|
|||
|
Issuance of debt
|
467
|
|
40
|
|
|||
|
Reduction of debt
|
(322
|
)
|
(280
|
)
|
|||
|
Change in book overdrafts
|
3
|
|
—
|
|
|||
|
Dividends paid
|
(181
|
)
|
(169
|
)
|
|||
|
Cash Provided By (Used For) Financing Activities
|
(164
|
)
|
(546
|
)
|
|||
|
Cash Included in Assets Held for Sale
|
(12
|
)
|
—
|
|
|||
|
Effect of Exchange Rate Changes on Cash
|
25
|
|
(20
|
)
|
|||
|
Change in Cash and Temporary Investments
|
105
|
|
(305
|
)
|
|||
|
Cash and Temporary Investments
|
|||||||
|
Beginning of period
|
1,050
|
|
1,881
|
|
|||
|
End of period
|
$
|
1,155
|
|
$
|
1,576
|
|
|
The accompanying notes are an integral part of these consolidated financial statements.
4
INTERNATIONAL PAPER COMPANY
Condensed Notes to Consolidated Financial Statements
(Unaudited)
The accompanying unaudited consolidated financial statements have been prepared in conformity with accounting principles generally accepted in the United States and in accordance with the instructions to Form 10-Q and, in the opinion of management, include all adjustments that are necessary for the fair presentation of International Paper Company’s (International Paper’s, the Company’s or our) financial position, results of operations, and cash flows for the interim periods presented. Except as disclosed herein, such adjustments are of a normal, recurring nature. Results for the first
three
months of the year may not necessarily be indicative of full year results. It is suggested that these consolidated financial statements be read in conjunction with the audited financial statements and the notes thereto included in the Company’s Annual Report on Form 10-K for the year ended
December 31, 2015
which have previously been filed with the Securities and Exchange Commission.
Stock Compensation
In March 2016, the Financial Accounting Standards Board (FASB) issued ASU 2016-09, "Improvements to Employee Share-Based Payment Accounting." Under this new guidance, all excess tax benefits and tax deficiencies will be recognized in the income statement as they occur, replacing current guidance which requires tax benefits that exceed compensation costs (windfalls) to be recognized in equity. The new guidance will also change the cash flow presentation of excess tax benefits, classifying them as operating inflows rather than financing activities as they are currently classified. In addition, the new guidance will allow companies to provide net settlement of stock-based compensation to cover tax withholding as long as the net settlement doesn't exceed the maximum individual statutory tax rate in the employee's tax jurisdiction. This ASU is effective for annual reporting periods beginning after December 15, 2016, and interim periods with those years. Early adoption is permitted. The Company is currently evaluating the provisions of this guidance.
Investments - Equity Method and Joint Ventures
In March 2016, the FASB issued ASU 2016-07, "Simplifying the Transition to the Equity Method of Accounting." The amendments in the ASU eliminate the requirement that when an investment qualifies for use of the equity method as a result of an increase in the level of ownership interest or degree of influence, an investor must adjust the investment, results of operations, and retained earnings retroactively on a step-by-step basis as if the equity method had been in effect during all previous periods that the investment had been held. The amendments require that the equity method investor add the cost of acquiring the additional interest in the investee to the current basis of the investor's previously held interest and adopt the equity method of accounting as of the date the investment becomes qualified for equity method accounting. Therefore, upon qualifying for the equity method of accounting, no retroactive adjustment of the investment is required. This ASU is effective for annual reporting periods beginning after December 15, 2016, and interim periods within those years and should be applied prospectively upon the effective date. Early adoption is permitted. The Company is currently evaluating the provisions of this guidance.
Derivatives and Hedging
Also in March 2016, the FASB issued ASU 2016-05, "Effect of Derivative Contract Novations on Existing Hedge Accounting Relationships." The amendments in this ASU apply to all reporting entities for which there is a change in the counterparty to a derivative instrument that has been designated as a hedging instrument under Topic 815. This ASU clarifies that a change in the counterparty to a derivative instrument that has been designated as the hedging instrument under Topic 815 does not, in and of itself, require dedesignation of that hedging relationship provided that all other hedge accounting criteria continue to be met. This ASU is effective for annual reporting periods beginning after December 15, 2016, and interim periods within those years, and allow for the amendments to be applied on either a prospective basis or a modified retrospective basis. The Company is currently evaluating the provisions of this guidance.
Leases
In February 2016, the FASB issued ASU 2016-02, "Leases." This ASU will require most leases to be recognized on the balance sheet which will increase reported assets and liabilities. Lessor accounting will remain substantially similar to current U.S. GAAP. This ASU is effective for annual reporting periods beginning after December 15, 2018, and interim periods within those years, and mandates a modified retrospective transition method for all entities. The Company is currently evaluating the provisions of this guidance.
5
Classification of Deferred Taxes
In November 2015, the FASB issued ASU 2015-17, "Balance Classification of Deferred Taxes." This ASU requires entities to offset all deferred tax assets and liabilities (and valuation allowances) for each tax-paying jurisdiction within each tax-paying component. The net deferred tax must be presented as a single noncurrent amount. This ASU is effective for annual reporting periods beginning after December 15, 2016, and interim periods within those years. Early adoption is permitted. The application of the requirements of this guidance is not expected to have a material effect on the consolidated financial statements.
Business Combinations
In September 2015, the FASB issued ASU 2015-16, "Business Combinations - Simplifying the Accounting for Measurement Period Adjustments." This ASU provides that an acquirer must recognize adjustments to provisional amounts that are identified during the measurement period in the reporting period in which the adjustment amounts are determined. The ASU also requires acquirers to present separately on the face of the income statement, or disclose in the notes, the portion of the amount recorded in current-period earnings by line item that would have been recorded in previous reporting periods if the adjustment to the provisional amounts had been recognized at the acquisition date. This ASU is effective for annual reporting periods beginning after December 15, 2015, and interim periods within those years. This ASU must be applied prospectively to adjustments to provisional amounts that occur after the effective date. The application of the requirements of this guidance did not have a material effect on the consolidated financial statements.
Inventory
In July 2015, the FASB issued ASU 2015-11, "Simplifying the Measurement of Inventory." This ASU provides that entities should measure inventory at the lower of cost and net realizable value. Net realizable value is the estimated selling prices in the ordinary course of business less reasonably predictable costs of completion, disposal and transportation. Subsequent measurement is unchanged for inventory measure using LIFO or the retail inventory method. This ASU is effective for annual reporting periods beginning after December 15, 2016, and interim periods within those years. Early adoption is permitted. The Company is currently evaluating the provisions of this guidance.
Cloud Computing Arrangements
In April 2015, the FASB issued ASU 2015-05, "Customer's Accounting for Fees Paid in a Cloud Computing Arrangement." This ASU provides clarification on whether a cloud computing arrangement includes a software license. If a software license is included, the customer should account for the license consistent with its accounting of other software licenses. If a software license is not included, the arrangement should be accounted for as a service contract. This ASU is effective for annual reporting periods beginning after December 15, 2015, and interim periods within those years. The application of the requirements of this guidance did not have a material effect on the consolidated financial statements.
In April 2015, the FASB issued ASU 2015-03, "Interest - Imputation of Interest (Subtopic 835-30: Simplifying the Presentation of Debt Issuance Costs)," which simplifies the balance sheet presentation of the costs for issuing debt. This ASU is effective for annual reporting periods beginning after December 15, 2015, and interim periods within those years; however, early adoption is allowed. An entity should apply the new guidance on a retrospective basis, wherein the balance sheet of each individual period presented should be adjusted to reflect the period-specific effects of applying the new guidance. The application of the requirements of this guidance did not have a material effect on the consolidated financial statements.
Consolidation
In February 2015, the FASB issued ASU 2015-02, "Consolidation," which amends the requirements for consolidation and significantly changes the consolidation analysis required. This ASU is effective for annual reporting periods beginning after December 15, 2015, and interim periods within those years. The application of the requirements of this guidance did not have a material effect on the consolidated financial statements.
Share-Based Payment
In June 2014, the FASB issued ASU 2014-12, "Accounting for Share-Based Payments When the Terms of an Award Provide That Performance Target Could Be Achieved After the Requisite Service Period." This guidance provides that entities should treat performance targets that can be met after the requisite service period of a share-based payment award as performance conditions that affect vesting. As such, an entity should not record compensation expense related to an award for which transfer to the employee is contingent on the entity's satisfaction of a performance target until it becomes probable that the performance target will be met. This ASU is effective for annual reporting periods beginning after December 15, 2015, and interim periods within those years. The application of the requirements of this guidance did not have a material effect on the consolidated financial statements.
6
Revenue Recognition
In March 2016, the FASB issued ASU 2016-08, "Revenue from Contracts with Customer." This guidance amends the principal-versus-agent implementation guidance and illustrations in ASU 2014-09. This ASU clarifies that an entity should evaluate whether it is the principal or the agent for each specified good or service promised in a contract with a customer. Therefore, for contracts involving more than one specified good or service, the entity may be the principal for one or more specified goods or services and the agent for others. This ASU has the same effective date as the new revenue standard, ASU 2014-09, and entities are required to adopt this ASU by using the same transition method used to adopt the new revenue standard. The Company is currently evaluating the provisions of this guidance.
In May 2014, the FASB issued ASU 2014-09, "Revenue from Contracts with Customers." The guidance replaces most existing revenue recognition guidance and provides that an entity should recognize revenue to depict the transfer of promised goods or services to customers in an amount that reflects the consideration to which the entity expects to be entitled in exchange for those goods and services. This ASU was effective for annual reporting periods beginning after December 15, 2016, and interim periods within those years and permits the use of either the retrospective or cumulative effect transition method; however, in August 2015, the FASB issued ASU 2015-14 which defers the effective date by one year making the guidance effective for annual reporting periods beginning after December 15, 2017. Early adoption will be permitted as of the original effective date in ASU 2014-09. The Company is currently evaluating the provisions of this guidance.
A summary of the changes in equity for the
three
months ended
March 31, 2016
and
2015
is provided below:
|
|
Three Months Ended
March 31, |
||||||||||||||||||||||
|
|
2016
|
2015
|
|||||||||||||||||||||
|
In millions, except per share amounts
|
Total
International
Paper
Shareholders’
Equity
|
Noncontrolling
Interests
|
Total
Equity
|
Total
International
Paper
Shareholders’
Equity
|
Noncontrolling
Interests
|
Total
Equity
|
|||||||||||||||||
|
Balance, January 1
|
$
|
3,884
|
|
$
|
25
|
|
$
|
3,909
|
|
$
|
5,115
|
|
$
|
148
|
|
$
|
5,263
|
|
|||||
|
Issuance of stock for various plans, net
|
(6
|
)
|
—
|
|
(6
|
)
|
141
|
|
—
|
|
141
|
|
|||||||||||
|
Repurchase of stock
|
(131
|
)
|
—
|
|
(131
|
)
|
(141
|
)
|
—
|
|
(141
|
)
|
|||||||||||
|
Common stock dividends ($0.4400 per share in 2016 and $0.4000 per share in 2015)
|
(183
|
)
|
—
|
|
(183
|
)
|
(174
|
)
|
—
|
|
(174
|
)
|
|||||||||||
|
Transactions of equity method investees
|
17
|
|
—
|
|
17
|
|
—
|
|
—
|
|
—
|
|
|||||||||||
|
Comprehensive income (loss)
|
653
|
|
1
|
|
654
|
|
(83
|
)
|
(3
|
)
|
(86
|
)
|
|||||||||||
|
Ending Balance, March 31
|
$
|
4,234
|
|
$
|
26
|
|
$
|
4,260
|
|
$
|
4,858
|
|
$
|
145
|
|
$
|
5,003
|
|
|||||
The following table presents changes in AOCI for the
three
-month period ended
March 31, 2016
:
|
In millions
|
Defined Benefit Pension and Postretirement Items (a)
|
Change in Cumulative Foreign Currency Translation Adjustments (a)
|
Net Gains and Losses on Cash Flow Hedging Derivatives (a)
|
Total (a)
|
||||||||||||
|
Balance, January 1, 2016
|
$
|
(3,169
|
)
|
$
|
(2,549
|
)
|
$
|
10
|
|
$
|
(5,708
|
)
|
||||
|
Other comprehensive income (loss) before reclassifications
|
17
|
|
236
|
|
4
|
|
257
|
|
||||||||
|
Amounts reclassified from accumulated other comprehensive income
|
64
|
|
—
|
|
(1
|
)
|
63
|
|
||||||||
|
Net Current Period Other Comprehensive Income (Loss)
|
81
|
|
236
|
|
3
|
|
320
|
|
||||||||
|
Other Comprehensive Income (Loss) Attributable to Noncontrolling Interest
|
—
|
|
(1
|
)
|
—
|
|
(1
|
)
|
||||||||
|
Balance, March 31, 2016
|
$
|
(3,088
|
)
|
$
|
(2,314
|
)
|
$
|
13
|
|
$
|
(5,389
|
)
|
||||
|
(a)
|
All amounts are net of tax. Amounts in parentheses indicate debits to AOCI.
|
7
The following table presents changes in AOCI for the
three
-month period ended
March 31, 2015
:
|
In millions
|
Defined Benefit Pension and Postretirement Items (a)
|
Change in Cumulative Foreign Currency Translation Adjustments (a)
|
Net Gains and Losses on Cash Flow Hedging Derivatives (a)
|
Total (a)
|
||||||||||||
|
Balance, January 1, 2015
|
$
|
(3,134
|
)
|
$
|
(1,513
|
)
|
$
|
1
|
|
$
|
(4,646
|
)
|
||||
|
Other comprehensive income (loss) before reclassifications
|
—
|
|
(484
|
)
|
6
|
|
(478
|
)
|
||||||||
|
Amounts reclassified from accumulated other comprehensive income
|
78
|
|
—
|
|
3
|
|
81
|
|
||||||||
|
Net Current Period Other Comprehensive Income (Loss)
|
78
|
|
(484
|
)
|
9
|
|
(397
|
)
|
||||||||
|
Other Comprehensive Income (Loss) Attributable to Noncontrolling Interest
|
—
|
|
1
|
|
—
|
|
1
|
|
||||||||
|
Balance, March 31 2015
|
$
|
(3,056
|
)
|
$
|
(1,996
|
)
|
$
|
10
|
|
$
|
(5,042
|
)
|
||||
|
(a)
|
All amounts are net of tax. Amounts in parentheses indicate debits to AOCI.
|
The following table presents details of the reclassifications out of AOCI for the
three
-month periods ended
March 31
:
|
Details About Accumulated Other Comprehensive Income Components
|
Amount Reclassified from Accumulated Other Comprehensive Income (a)
|
Location of Amount Reclassified from AOCI
|
|||||||||
|
Three Months Ended
March 31, |
|||||||||||
|
2016
|
2015
|
||||||||||
|
In millions:
|
|||||||||||
|
Defined benefit pension and postretirement items:
|
|||||||||||
|
Prior-service costs
|
$
|
(9
|
)
|
$
|
(8
|
)
|
(b)
|
Cost of products sold
|
|||
|
Actuarial gains (losses)
|
(95
|
)
|
(120
|
)
|
(b)
|
Cost of products sold
|
|||||
|
Total pre-tax amount
|
(104
|
)
|
(128
|
)
|
|||||||
|
Tax (expense) benefit
|
40
|
|
50
|
|
|||||||
|
Net of tax
|
(64
|
)
|
(78
|
)
|
|||||||
|
Net gains and losses on cash flow hedging derivatives:
|
|||||||||||
|
Foreign exchange contracts
|
1
|
|
(6
|
)
|
(c)
|
Cost of products sold
|
|||||
|
Total pre-tax amount
|
1
|
|
(6
|
)
|
|||||||
|
Tax (expense)/benefit
|
—
|
|
3
|
|
|||||||
|
Net of tax
|
1
|
|
(3
|
)
|
|||||||
|
Total reclassifications for the period
|
$
|
(63
|
)
|
$
|
(81
|
)
|
|||||
|
(a)
|
Amounts in parentheses indicate debits to earnings/loss.
|
|
(b)
|
These accumulated other comprehensive income components are included in the computation of net periodic pension cost (see Note 16 for additional details).
|
|
(c)
|
This accumulated other comprehensive income component is included in our derivatives and hedging activities (see Note 15 for additional details).
|
8
Basic earnings per common share are computed by dividing earnings by the weighted average number of common shares outstanding. Diluted earnings per common share are computed assuming that all potentially dilutive securities were converted into common shares. A reconciliation of the amounts included in the computation of earnings (loss) per common share, and diluted earnings (loss) per common share is as follows:
|
|
Three Months Ended
March 31, |
||||||
|
In millions, except per share amounts
|
2016
|
2015
|
|||||
|
Earnings (loss) from continuing operations
|
$
|
339
|
|
$
|
313
|
|
|
|
Effect of dilutive securities (a)
|
—
|
|
—
|
|
|||
|
Earnings (loss) from continuing operations – assuming dilution
|
$
|
339
|
|
$
|
313
|
|
|
|
Average common shares outstanding
|
410.8
|
|
421.2
|
|
|||
|
Effect of dilutive securities (a)
|
|||||||
|
Restricted stock performance share plan
|
3.2
|
|
2.5
|
|
|||
|
Average common shares outstanding – assuming dilution
|
414.0
|
|
423.7
|
|
|||
|
Basic earnings (loss) from continuing operations per common share
|
$
|
0.82
|
|
$
|
0.74
|
|
|
|
Diluted earnings (loss) from continuing operations per common share
|
$
|
0.82
|
|
$
|
0.74
|
|
|
|
(a)
|
Securities are not included in the table in periods when antidilutive.
|
2016:
During the three months ended March 31, 2016, restructuring and other charges totaling
$1 million
before taxes were recorded. Details of these charges were as follows:
|
|
Three Months Ended
March 31, 2016 |
||
|
In millions
|
|||
|
Gain on sale of investment in Arizona Chemical
|
$
|
(8
|
)
|
|
Riegelwood mill conversion costs
|
9
|
|
|
|
Total
|
$
|
1
|
|
On March 16, 2016, the Company announced that it had entered into a binding agreement with Holmen Paper to purchase Holmen's newsprint mill in Madrid, Spain, and intends to convert the facility to produce recycled containerboard. Under the terms of the agreement, International Paper will purchase the Madrid newsprint mill, as well as associated recycling operations and a
50%
ownership interest in a cogeneration facility. The transaction is expected to close during the second quarter of 2016, subject to certain regulatory approvals.
International Paper plans to convert the newsprint facility during the second half of 2017 to produce recycled containerboard with an expected capacity of
380,000
metric tonnes. Once completed, the converted mill will support the Company's corrugated packaging business in EMEA. The Company's aggregated purchase price for the mill, recycling operations and
50%
ownership of the cogeneration facility is
€50 million
(approximately
$57 million
using March 31, 2016 exchange rate), subject certain closing and post-closing adjustments.
Other Divestitures and Impairments
2016:
On March 14, 2016, the Company announced that it had entered into a definitive agreement to sell its corrugated packaging business in China and Southeast Asia to Xiamen Bridge Hexing Equity Investment Partnership Enterprise. Under the terms of the transaction, International Paper will receive a total of approximately RMB
1 billion
(approximately
$155 million
at the March 31, 2016 exchange rate), subject to post-closing adjustments and other payments, including the buyer's assumption of the liability for loans of approximately
$57 million
. All payments are to be made within six months of closing the sale. The transaction is expected to be completed during the second quarter of 2016, subject to the satisfaction of closing conditions, including obtaining governmental approvals.
9
A determination was made that the current book value of the asset group exceeded its estimated fair value of
$155 million
which is the agreed upon selling price. As a result, a pre-tax charge of
$37 million
was recorded during the three months ended March 31, 2016 in the Company's Industrial Packaging segment to write down the long-lived assets of this business to their estimated fair value. The amount of pre-tax losses related to the IP Asia Packaging business included in the Company's consolidated statement of operations for the three months ended March 31, 2016 and 2015 was
$41 million
and
$2 million
, respectively. The assets related to the IP Asia Packaging business, totaling
$216 million
, are included in Assets held for sale in current assets in the accompanying consolidated balance sheet at March 31, 2016. The liabilities of the IP Asia Packaging business, totaling
$98 million
, are included in Liabilities held for sale in current liabilities in the accompanying consolidated balance sheet at March 31, 2016. The table below reflects the major asset and liability categories of the IP Asia Packaging business' balance sheet as consolidated in International Paper's balance sheet as of March 31, 2016.
|
In millions
|
March 31, 2016
|
|||
|
Total current assets
|
$
|
127
|
|
|
|
Plants, properties and equipment, net
|
89
|
|
||
|
Deferred Charges and Other Assets
|
37
|
|
||
|
253
|
|
|||
|
Impairment charge
|
(37
|
)
|
||
|
Total assets
|
$
|
216
|
|
|
|
Payables and other short-term liabilities
|
$
|
41
|
|
|
|
Debt
|
43
|
|
||
|
Other long-term liabilities
|
14
|
|
||
|
Total liabilities
|
98
|
|
||
|
Shareholder's equity
|
116
|
|
||
|
Noncontrolling interest
|
2
|
|
||
|
Total equity
|
118
|
|
||
|
Total liabilities and equity
|
$
|
216
|
|
|
Temporary Investments
Temporary investments with an original maturity of three months or less are treated as cash equivalents and are stated at cost. Temporary investments totaled
$879 million
and
$738 million
at March 31, 2016 and December 31, 2015, respectively.
Accounts and Notes Receivable
|
In millions
|
March 31, 2016
|
December 31, 2015
|
|||||
|
Accounts and notes receivable, net:
|
|||||||
|
Trade
|
$
|
2,418
|
|
$
|
2,480
|
|
|
|
Other
|
223
|
|
195
|
|
|||
|
Total
|
$
|
2,641
|
|
$
|
2,675
|
|
|
The allowance for doubtful accounts was
$69 million
and
$70 million
at March 31, 2016 and December 31, 2015, respectively.
Inventories
|
In millions
|
March 31, 2016
|
December 31, 2015
|
|||||
|
Raw materials
|
$
|
317
|
|
$
|
339
|
|
|
|
Finished pulp, paper and packaging
|
1,223
|
|
1,248
|
|
|||
|
Operating supplies
|
569
|
|
563
|
|
|||
|
Other
|
108
|
|
78
|
|
|||
|
Total
|
$
|
2,217
|
|
$
|
2,228
|
|
|
10
Depreciation
Accumulated depreciation was
$21.0 billion
and
$20.7 billion
at March 31, 2016 and December 31, 2015. Depreciation expense was
$267 million
and
$304 million
for the three months ended March 31, 2016 and 2015, respectively.
Asset Retirement Obligations
There was no material activity related to asset retirement obligations during either of the three months ended
March 31, 2016
or
2015
.
Interest
Interest payments made during the three months ended March 31, 2016 and 2015 were
$136 million
and
$129 million
, respectively.
Amounts related to interest were as follows:
|
|
Three Months Ended
March 31, |
||||||
|
In millions
|
2016
|
2015
|
|||||
|
Interest expense (a)
|
$
|
160
|
|
$
|
159
|
|
|
|
Interest income (a)
|
37
|
|
22
|
|
|||
|
Capitalized interest costs
|
7
|
|
7
|
|
|||
|
(a)
|
Interest expense and interest income exclude approximately
$9 million
for the three months ended March 31, 2015, related to investments in and borrowings from variable interest entities for which the Company had a legal right of offset (see Note 13).
|
Goodwill
The following table presents changes in goodwill balances as allocated to each business segment for the
three
-month period ended
March 31, 2016
:
|
In millions
|
Industrial
Packaging
|
|
Printing
Papers
|
|
Consumer
Packaging
|
Total
|
|||||||||
|
Balance as of January 1, 2016
|
|||||||||||||||
|
Goodwill
|
$
|
3,325
|
|
|
$
|
2,124
|
|
|
$
|
1,664
|
|
$
|
7,113
|
|
|
|
Accumulated impairment losses (a)
|
(237
|
)
|
|
(1,877
|
)
|
(1,664
|
)
|
(3,778
|
)
|
||||||
|
3,088
|
|
|
247
|
|
|
—
|
|
3,335
|
|
||||||
|
Reclassifications and other (b)
|
1
|
|
21
|
|
—
|
|
22
|
|
|||||||
|
Additions/reductions
|
—
|
|
(3
|
)
|
(c)
|
—
|
|
(3
|
)
|
||||||
|
Balance as of March 31, 2016
|
|||||||||||||||
|
Goodwill
|
3,326
|
|
|
2,142
|
|
|
1,664
|
|
7,132
|
|
|||||
|
Accumulated impairment losses (a)
|
(237
|
)
|
|
(1,877
|
)
|
|
(1,664
|
)
|
(3,778
|
)
|
|||||
|
Total
|
$
|
3,089
|
|
|
$
|
265
|
|
|
$
|
—
|
|
$
|
3,354
|
|
|
|
(a)
|
Represents accumulated goodwill impairment charges since the adoption of ASC 350, “Intangibles – Goodwill and Other” in 2002.
|
|
(b)
|
Represents the effects of foreign currency translations and reclassifications.
|
|
(c)
|
Reflects a reduction from tax benefits generated by the deduction of goodwill amortization for tax purposes in Brazil.
|
11
Other Intangibles
Identifiable intangible assets comprised the following:
|
|
March 31, 2016
|
December 31, 2015
|
|||||||||||||
|
In millions
|
Gross
Carrying
Amount
|
Accumulated
Amortization
|
Gross
Carrying
Amount
|
Accumulated
Amortization
|
|||||||||||
|
Customer relationships and lists
|
$
|
503
|
|
$
|
179
|
|
$
|
495
|
|
$
|
166
|
|
|||
|
Non-compete agreements
|
70
|
|
59
|
|
69
|
|
56
|
|
|||||||
|
Tradenames, patents and trademarks
|
61
|
|
55
|
|
61
|
|
54
|
|
|||||||
|
Land and water rights
|
12
|
|
3
|
|
33
|
|
6
|
|
|||||||
|
Software
|
23
|
|
21
|
|
22
|
|
20
|
|
|||||||
|
Other
|
39
|
|
24
|
|
46
|
|
29
|
|
|||||||
|
Total
|
$
|
708
|
|
$
|
341
|
|
$
|
726
|
|
$
|
331
|
|
|||
The Company recognized the following amounts as amortization expense related to intangible assets:
|
|
Three Months Ended
March 31, |
||||||
|
In millions
|
2016
|
2015
|
|||||
|
Amortization expense related to intangible assets
|
$
|
12
|
|
$
|
13
|
|
|
International Paper made income tax payments, net of refunds, of
$6 million
and
$26 million
for the three months ended March 31, 2016 and 2015, respectively.
The following table presents a rollforward of unrecognized tax benefits and related accrued estimated interest and penalties for the
three
months ended
March 31, 2016
:
|
In millions
|
Unrecognized
Tax Benefits
|
Accrued Estimated
Interest and Tax
Penalties
|
|||||
|
Balance at December 31, 2015
|
$
|
(150
|
)
|
$
|
(34
|
)
|
|
|
Activity for three months ended March 31, 2016
|
26
|
|
(1
|
)
|
|||
|
Balance at March 31, 2016
|
$
|
(124
|
)
|
$
|
(35
|
)
|
|
The Company currently estimates, that as a result of ongoing discussions, pending tax settlements and expirations of statutes of limitations, the amount of unrecognized tax benefits could be reduced by approximately
$24 million
during the next 12 months.
Included in the Company’s income tax provisions for the
three
months ended
March 31, 2016
, is
$74 million
of income tax benefits related to special items. There were no tax benefits related to special items for the three months ended March 31, 2015. The components of the net provision related to special items were as follows:
|
|
Three Months Ended
March 31, |
||||||
|
In millions
|
2016
|
2015
|
|||||
|
Special items
|
$
|
(3
|
)
|
$
|
—
|
|
|
|
Tax-related adjustments:
|
|||||||
|
Internal restructurings
|
(57
|
)
|
—
|
|
|||
|
2010-2012 IRS audit closure
|
(14
|
)
|
—
|
|
|||
|
Income tax provision (benefit) related to special items
|
$
|
(74
|
)
|
$
|
—
|
|
|
12
Environmental Proceedings
CERCLA and State Actions
International Paper has been named as a potentially responsible party (PRP) in environmental remediation actions under various federal and state laws, including the Comprehensive Environmental Response, Compensation and Liability Act (CERCLA). Many of these proceedings involve the cleanup of hazardous substances at large commercial landfills that received waste from many different sources. While joint and several liability is authorized under CERCLA and equivalent state laws, as a practical matter, liability for CERCLA cleanups is typically allocated among the many PRPs. Remediation costs are recorded in the consolidated financial statements when they become probable and reasonably estimable. International Paper has estimated the probable liability associated with these matters to be approximately
$93 million
in the aggregate at
March 31, 2016
.
Cass Lake:
One of the matters included above arises out of a closed wood-treating facility located in Cass Lake, Minnesota. In June 2011, the United States Environmental Protection Agency (EPA) selected and published a proposed soil remedy at the site with an estimated cost of
$46 million
. The overall remediation reserve for the site is currently
$47 million
to address the selection of an alternative for the soil remediation component of the overall site remedy. In October 2011, the EPA released a public statement indicating that the final soil remedy decision would be delayed. In March 2016, the EPA issued a proposed plan concerning clean-up standards at a portion of the site, the estimated cost of which is included within the
$47 million
reserve referenced above. In October 2012, the Natural Resource Trustees for this site provided notice to International Paper and other potentially responsible parties of their intent to perform a Natural Resource Damage Assessment. It is premature to predict the outcome of the assessment or to estimate a loss or range of loss, if any, which may be incurred.
Other Remediation Costs
In addition to the above matters, other remediation costs typically associated with the cleanup of hazardous substances at the Company’s current, closed or formerly-owned facilities, and recorded as liabilities in the balance sheet, totaled approximately
$43 million
as of
March 31, 2016
. Other than as described above, completion of required remedial actions is not expected to have a material effect on our consolidated financial statements.
Legal Proceedings
Environmental
Kalamazoo River:
The Company is a PRP with respect to the Allied Paper, Inc./Portage Creek/Kalamazoo River Superfund Site in Michigan. The EPA asserts that the site is contaminated by polychlorinated biphenyls (PCBs) primarily as a result of discharges from various paper mills located along the Kalamazoo River, including a paper mill formerly owned by St. Regis Paper Company (St. Regis). The Company is a successor in interest to St. Regis. In March 2016, the Company and other PRPs received a special notice letter from the EPA (i) inviting participation concerning the remedy for a portion of the site, and (ii) demanding reimbursement of EPA past costs totaling
$37 million
, including
$19 million
in past costs previously demanded by the EPA. Separately, in April 2016, the EPA issued a unilateral administrative order to the Company and certain other PRPs to remove PCB contaminated sediments from a different portion of the site. The Company is preparing responses to both the special notice letter and the unilateral administrative order. The Company’s CERCLA liability has not been finally determined with respect to these or any other portions of the site, and we have declined to reimburse the EPA at this time. As noted below, the Company is involved in allocation/apportionment litigation with regard to the site. Accordingly, it is premature to predict the outcome or estimate our maximum reasonably possible loss with respect to this site. However, we do not believe that any material loss is probable.
The Company was named as a defendant by Georgia-Pacific Consumer Products LP, Fort James Corporation and Georgia Pacific LLC in a contribution and cost recovery action for alleged pollution at the site. The suit seeks contribution under CERCLA for costs purportedly expended by plaintiffs (
$79 million
as of the filing of the complaint) and for future remediation costs. The suit alleges that a mill, during the time it was allegedly owned and operated by St. Regis, discharged PCB contaminated solids and paper residuals resulting from paper de-inking and recycling. NCR Corporation and Weyerhaeuser Company are also named as defendants in the suit. In mid-2011, the suit was transferred from the District Court for the Eastern District of Wisconsin to the District Court for the Western District of Michigan. The trial of the initial liability phase took place in February 2013. Weyerhaeuser conceded prior to trial that it was a liable party with respect to the site. In September 2013, an opinion and order was issued in the suit. The order concluded that the Company (as the successor to St. Regis) was not an “operator,” but was an “owner,” of the mill at issue during a portion of the relevant period and is therefore liable under CERCLA. The order also determined that NCR is a liable party as an "arranger for disposal" of PCBs in waste paper that was de-inked and recycled by mills along the Kalamazoo River. The order did not address the Company's responsibility, if any, for
13
past or future costs. The parties’ responsibility, including that of the Company, was the subject of a second trial, which was conducted in late 2015. A decision has not been rendered and it is unclear to what extent the Court will address responsibility for future costs in that decision. We are unable to predict the outcome or estimate our maximum reasonably possible loss. However, we do not believe that any material loss is probable.
Harris County:
International Paper and McGinnis Industrial Maintenance Corporation, a subsidiary of Waste Management, Inc., are PRPs at the San Jacinto River Waste Pits Superfund Site (San Jacinto River Superfund Site) in Harris County, Texas, and have been actively participating in investigation and remediation activities at this Superfund Site. In December 2011, Harris County, Texas filed a suit against the Company seeking civil penalties with regard to the alleged discharge of dioxin into the San Jacinto River from waste impoundments that are part of the San Jacinto River Superfund Site. In November 2014, International Paper secured a zero liability jury verdict. Harris County appealed the verdict in April 2015, and that appeal is pending. The Company is also defending an additional lawsuit related to the San Jacinto River Superfund Site brought by approximately
400
individuals who allege property damage and personal injury. Because this case is still in the discovery phase, it is premature to predict the outcome or to estimate a loss or range of loss, if any, which may be incurred.
Vicksburg:
In the first quarter of 2016, the Company received notice from the Mississippi Department of Environmental Quality (MDEQ) of a proposed penalty in excess of
$100,000
arising from alleged violations of air emission permitting requirements at the Company’s Vicksburg, Mississippi paper mill. The Company is working with the MDEQ to resolve the matter. While it is premature to predict the outcome or to estimate the resulting fine, if any, which may be incurred, the Company believes that any such fine will not be material.
Antitrust
Containerboard:
In September 2010,
eight
containerboard producers, including International Paper and Temple-Inland, were named as defendants in a purported class action complaint that alleged a civil violation of Section 1 of the Sherman Act. The suit is captioned
Kleen Products LLC v. International Paper Co. (N.D. Ill.)
. The complaint alleges that the defendants, beginning in February 2004 through November 2010, conspired to limit the supply and thereby increase prices of containerboard products. The class is all persons who purchased containerboard products directly from any defendant for use or delivery in the United States during the period February 2004 to November 2010. The complaint seeks to recover unspecified treble damages and attorneys' fees on behalf of the purported class.
Four
similar complaints were filed and have been consolidated in the Northern District of Illinois. In March 2015, the District Court certified a class of direct purchasers of containerboard products; in June 2015, the United States Court of Appeals for the Seventh Circuit granted the defendants' petition to appeal and the class certification issue is now pending in that court. In June 2015, International Paper and Temple-Inland were named as defendants in a lawsuit, later dismissed without prejudice in November 2015, captioned
Del Monte Fresh Products N.A., Inc. v. Packaging Corporation of America (S.K. Fl.)
, in which the Plaintiff asserted substantially similar allegations to those raised in the
Kleen Products LLC
action. Moreover, in January 2011, International Paper was named as a defendant in a lawsuit filed in state court in Cocke County, Tennessee alleging that International Paper violated Tennessee law by conspiring to limit the supply and fix the prices of containerboard from mid-2005 to the present. Plaintiffs in the state court action seek certification of a class of Tennessee indirect purchasers of containerboard products, damages and costs, including attorneys' fees. No class certification materials have been filed to date in the Tennessee action. The Company disputes the allegations made and is vigorously defending each action. However, because the
Kleen Products LLC
action is in the discovery stage and the Tennessee action is in a preliminary stage, we are unable to predict an outcome or estimate a range of reasonably possible loss.
Gypsum:
Beginning in late December 2012, certain purchasers of gypsum board filed a number of purported class action complaints alleging civil violations of Section 1 of the Sherman Act against Temple-Inland and a number of other gypsum manufacturers. The complaints were similar and alleged that the gypsum manufacturers conspired or otherwise reached agreements to: (1) raise prices of gypsum board either from 2008 or 2011 through the present; (2) avoid price erosion by ceasing the practice of issuing job quotes; and (3) restrict supply through downtime and limiting order fulfillment. On April 8, 2013, the Judicial Panel on Multidistrict Litigation ordered transfer of all pending cases to the U.S. District Court for the Eastern District of Pennsylvania for coordinated and consolidated pretrial proceedings, and the direct purchaser plaintiffs and indirect purchaser plaintiffs filed their respective amended consolidated complaints in June 2013. The amended consolidated complaints alleged a conspiracy or agreement beginning on or before September 2011. The alleged classes were all persons who purchased gypsum board directly or indirectly from any defendant. The complainants sought to recover unspecified treble actual damages and attorneys' fees on behalf of the purported classes. In February 2015, we executed a definitive agreement to settle these cases for an immaterial amount, and this settlement received final court approval and was paid in the third quarter of 2015. In March 2015, several homebuilders filed an antitrust action in the United States District Court for the Northern District of California alleging that they purchased gypsum board and making similar allegations to those contained in the above settled proceeding. The Company intends to dispute the
14
allegations made and to vigorously defend that lawsuit and any lawsuit brought by any purported class member that elected to opt out of the settlement.
In addition, in September 2013, similar purported class actions were filed in courts in Quebec, Canada and Ontario, Canada, with each suit alleging violations of the Canadian Competition Act and seeking damages and injunctive relief. In May 2015, we reached an agreement in principle to settle these Canadian cases, as well as a similar action filed in British Columbia, Canada, for an immaterial amount. This settlement in principle is subject to negotiation and execution of a definitive settlement agreement, which would then be subject to court approval.
Tax
On October 16, 2015, the Company was notified of a
$92 million
tax assessment issued by the state of Sao Paulo, Brazil for tax years 2011 through 2013. The assessment pertains to invoices issued by the Company related to the sale of paper to the editorial segment, which is exempt from the payment of ICMS value-added tax. This assessment is in the preliminary stage. The Company does not believe that a material loss is probable.
General
The Company is involved in various other inquiries, administrative proceedings and litigation relating to environmental and safety matters, labor and employment, personal injury, contracts, sales of property, intellectual property and other matters, some of which allege substantial monetary damages. While any proceeding or litigation has the element of uncertainty, the Company believes that the outcome of any of these lawsuits or claims that are pending or threatened or all of them combined (other than those that cannot be assessed due to their preliminary nature) will not have a material effect on its consolidated financial statements.
Variable Interest Entities
In connection with the 2006 sale of approximately
5.6 million
acres of forestlands, International Paper received installment notes (the Timber Notes) totaling approximately
$4.8 billion
. The Timber Notes, which do not require principal payments prior to their maturity, are supported by irrevocable letters of credit obtained by the buyers of the forestlands.
During 2006, International Paper contributed the Timber Notes to newly formed special purpose entities (the Borrower Entities) in exchange for Class A and Class B interests in these entities. Subsequently, International Paper contributed its Class A interests in the Borrower Entities, along with International Paper promissory notes, to other newly formed special purpose entities (the Investor Entities, and together with the Borrower Entities, the Entities) in exchange for Class A and Class B interests in these entities, and simultaneously sold its Class A interest in the Investor Entities to a third party investor. As a result, at December 31, 2006, International Paper held Class B interests in the Borrower Entities and Class B interests in the Investor Entities valued at approximately
$5.0 billion
.
Following the 2006 sale of forestlands and creation of the Entities discussed above, the Timber Notes were used as collateral for borrowings from third party lenders, which effectively monetized the Timber Notes. Also during 2006, the Entities acquired approximately
$4.8 billion
of International Paper debt obligations for cash, resulting in a total of approximately
$5.2 billion
of International Paper debt obligations held by the Entities at December 31, 2006. The various agreements entered into in connection with these transactions provided that International Paper had, and intended to effect, a legal right to offset its obligations under these debt instruments with its investments in the Entities and despite the offset treatment, these remained debt obligations of International Paper. The use of the Entities facilitated the monetization of the credit enhanced Timber Notes in a cost effective manner by increasing borrowing capacity and lowering the interest rate, while providing for the offset accounting treatment described above. Additionally, the monetization structure preserved the tax deferral that resulted from the 2006 forestlands sales.
During 2015, International Paper initiated a series of actions, including acquiring the Class A interests from a third party and a restructuring, in order to extend the 2006 monetization structure and maintain the long-term nature of the
$1.4 billion
deferred tax liability. The restructuring resulted in the formation of wholly-owned, bankruptcy-remote special purpose entities (the 2015 Financing Entities) and International Paper began consolidating the 2015 Financing Entities during the third quarter of 2015. As part of the transactions, International Paper extended the maturity date on the Timber Notes and entered into nonrecourse third party bank loans totaling approximately
$4.2 billion
(the Extension Loans).
The Timber Notes are shown in Financial Assets of special purpose entities on the accompanying consolidated balance sheet and mature in August 2021 unless extended for an additional five years. These notes are supported by approximately
$4.8 billion
of irrevocable letters of credit. The Extension Loans are shown in Nonrecourse financial liabilities of special purpose entities on the accompanying consolidated balance sheet and mature in the fourth quarter of 2020.
15
In addition, provisions of loan agreements related to approximately
$1.1 billion
of the Extension Loans require the bank issuing the letters of credit supporting the Timber Notes to maintain a credit rating at or above a specified threshold. In the event the credit rating of the letter of credit bank is downgraded below the specified threshold, the letters of credit must be replaced within 60 days with letters of credit from a qualifying financial institution.
As of March 31, 2016, the fair value of the Timber Notes and Extension Loans is
$4.80 billion
and
$4.37 billion
, respectively. The Timber Notes and Extension Loans are classified as Level 2 within the fair value hierarchy, which is further defined in Note 14 in the Company’s Annual Report on Form 10-K for the year ended December 31, 2015.
Activity between the Company and the 2015 Financing Entities (the Entities prior to the purchase of the Class A interest discussed above) was as follows:
|
|
Three Months Ended
March 31, |
||||||
|
In millions
|
2016
|
2015
|
|||||
|
Revenue (a)
|
$
|
24
|
|
$
|
9
|
|
|
|
Expense (a)
|
32
|
|
18
|
|
|||
|
Cash receipts (b)
|
29
|
|
10
|
|
|||
|
Cash payments (c)
|
34
|
|
36
|
|
|||
|
(a)
|
For the three months ended March 31, 2016, the revenue and expense are included in Interest expense, net in the accompanying consolidated statement of operations. For the three months ended March 31, 2015, the net expense related to the Company’s interest in the Entities is included in the accompanying consolidated statement of operations, as International Paper has and intends to effect its legal right to offset as discussed above.
|
|
(b)
|
For the three months ended March 31, 2016, cash receipts are interest received on the Financial assets of special purpose entities. For the three months ended March 31, 2015, the cash receipts are equity distributions from the Entities to International Paper prior to the formation of the 2015 Financing Entities.
|
|
(c)
|
For the three months ended March 31, 2016, the payments represent interest paid on Nonrecourse financial liabilities of special purpose entities. For the three months ended March 31, 2015, the cash payments are interest payments on the associated debt obligations of the Entities discussed above.
|
In connection with the acquisition of Temple-Inland in February 2012, two special purpose entities became wholly-owned subsidiaries of International Paper.
The use of the two wholly-owned special purpose entities discussed below preserved the tax deferral that resulted from the 2007 Temple-Inland timberlands sales. The Company recognized an
$840 million
deferred tax liability in connection with the 2007 sales, which will be settled with the maturity of the notes in 2027.
In October 2007, Temple-Inland sold
1.55 million
acres of timberland for
$2.38 billion
. The total consideration consisted almost entirely of notes due in 2027 issued by the buyer of the timberland, which Temple-Inland contributed to two wholly-owned, bankruptcy-remote special purpose entities. The notes are shown in Financial assets of special purpose entities in the accompanying consolidated balance sheet and are supported by
$2.38 billion
of irrevocable letters of credit issued by three banks, which are required to maintain minimum credit ratings on their long-term debt. In the third quarter of 2012, International Paper completed its preliminary analysis of the acquisition date fair value of the notes and determined it to be
$2.09 billion
. As of
March 31, 2016
, the fair value of the notes was
$2.10 billion
. These notes are classified as Level 2 within the fair value hierarchy, which is further defined in Note 14 in the Company's Annual Report on Form 10-K for the year ended December 31, 2014.
In December 2007, Temple-Inland’s two wholly-owned special purpose entities borrowed
$2.14 billion
shown in Nonrecourse financial liabilities of special purpose entities. The loans are repayable in 2027 and are secured only by the
$2.38 billion
of notes and the irrevocable letters of credit securing the notes and are nonrecourse to us. The loan agreements provide that if a credit rating of any of the banks issuing the letters of credit is downgraded below the specified threshold, the letters of credit issued by that bank must be replaced within
30 days
with letters of credit from another qualifying financial institution. In the third quarter of 2012, International Paper completed its preliminary analysis of the acquisition date fair value of the borrowings and determined it to be
$2.03 billion
. As of
March 31, 2016
, the fair value of this debt was
$1.98 billion
. This debt is classified as Level 2 within the fair value hierarchy, which is further defined in Note 14 in the Company's Annual Report on Form 10-K for the year ended December 31, 2014.
16
Activity between the Company and the 2007 financing entities was as follows:
|
Three Months Ended
March 31, |
|||||||
|
In millions
|
2016
|
2015
|
|||||
|
Revenue (a)
|
$
|
8
|
|
$
|
6
|
|
|
|
Expense (b)
|
7
|
|
6
|
|
|||
|
Cash receipts (c)
|
2
|
|
2
|
|
|||
|
Cash payments (d)
|
6
|
|
4
|
|
|||
|
(a)
|
The revenue is included in Interest expense, net in the accompanying consolidated statement of operations and includes approximately
$5 million
for each of the
three
months ended
March 31, 2016
and
2015
, respectively, of accretion income for the amortization of the purchase accounting adjustment on the Financial assets of special purpose entities.
|
|
(b)
|
The expense is included in Interest expense, net in the accompanying consolidated statement of operations and includes approximately
$2 million
for each of the
three
months ended
March 31, 2016
and
2015
, respectively, of accretion expense for the amortization of the purchase accounting adjustment on the Nonrecourse financial liabilities of special purpose entities.
|
|
(c)
|
The cash receipts are interest received on the Financial assets of special purpose entities.
|
|
(d)
|
The cash payments are interest paid on Nonrecourse financial liabilities of special purpose entities.
|
Amounts related to early debt extinguishment during the
three
months ended
March 31, 2016
and
2015
were as follows:
|
|
Three Months Ended
March 31, |
||||||
|
In millions
|
2016
|
2015
|
|||||
|
Early debt reductions (a)
|
$
|
—
|
|
$
|
217
|
|
|
|
Pre-tax early debt extinguishment costs
|
—
|
|
1
|
|
|||
|
(a)
|
Reductions related to notes with interest rates ranging from
5.30%
to
6.25%
with original maturities from
2015
to
2025
for the three months ended March 31,
2015
.
|
During the first quarter of 2016, International Paper borrowed
$400 million
under a receivable securitization facility at a rate of
1.22%
. The Company repaid
$185 million
of the borrowings during the first quarter of 2016. Subsequent to March 31, 2016, the Company repaid an additional
$100 million
of the borrowings outstanding under the receivable facility.
Subsequent to March 31, 2016, International Paper entered into a
$250 million
contractually committed bank credit facility that expires on
December 31, 2016
and has a facility fee of
0.15%
payable quarterly. In April 2016, the Company borrowed
$230 million
on the bank credit facility. The proceeds from this borrowing were used to pay off
$261 million
of debt maturing in April 2016.
At
March 31, 2016
, the fair value of International Paper’s
$9.4 billion
of debt was approximately
$10.2 billion
. The fair value of the Company’s long-term debt is estimated based on the quoted market prices for the same or similar issues. International Paper’s long-term debt is classified as Level 2 within the fair value hierarchy, which is further defined in Note 14 in the Company’s Annual Report on Form 10-K for the year ended December 31, 2015.
Maintaining an investment-grade credit rating is an important element of International Paper’s financing strategy. At
March 31, 2016
, the Company held long-term credit ratings of BBB (stable outlook) and Baa2 (stable outlook) by S&P and Moody’s, respectively.
As a multinational company we are exposed to market risks, such as changes in interest rates, currency exchanges rates and commodity prices.
For detailed information regarding the Company’s hedging activities and related accounting, refer to Note 14 in the Company’s Annual Report on Form 10-K for the fiscal year ended
December 31, 2015
.
17
The notional amounts of qualifying and non-qualifying financial instruments used in hedging transactions were as follows:
|
In millions
|
March 31, 2016
|
|
December 31, 2015
|
|
||||
|
Derivatives in Cash Flow Hedging Relationships:
|
||||||||
|
Foreign exchange contracts (a)
|
$
|
310
|
|
$
|
290
|
|
||
|
Derivatives in Fair Value Hedging Relationships:
|
||||||||
|
Interest rate contracts
|
—
|
|
17
|
|
||||
|
Derivatives Not Designated as Hedging Instruments:
|
||||||||
|
Electricity contract
|
7
|
|
16
|
|
||||
|
Foreign exchange contracts
|
45
|
|
35
|
|
||||
|
Interest rate contracts
|
—
|
|
38
|
|
|
|||
|
(a)
|
These contracts had maturities of
two years
or less as of
March 31, 2016
.
|
The following table shows gains or losses recognized in AOCI, net of tax, related to derivative instruments:
|
|
Gain (Loss)
Recognized in
AOCI
on Derivatives
(Effective Portion)
|
||||||
|
|
Three Months Ended
March 31, |
||||||
|
In millions
|
2016
|
2015
|
|||||
|
Foreign exchange contracts
|
$
|
4
|
|
$
|
6
|
|
|
|
Total
|
$
|
4
|
|
$
|
6
|
|
|
During the next 12 months, the amount of the
March 31, 2016
AOCI balance, after tax, that is expected to be reclassified to earnings is a gain of
$5 million
.
The amounts of gains and losses recognized in the consolidated statement of operations on qualifying and non-qualifying financial instruments used in hedging transactions were as follows:
|
|
Gain (Loss)
Reclassified from
AOCI
(Effective Portion)
|
Location of Gain (Loss)
Reclassified from AOCI
(Effective Portion)
|
||||||
|
|
Three Months Ended
March 31, |
|
||||||
|
In millions
|
2016
|
2015
|
|
|||||
|
Derivatives in Cash Flow Hedging Relationships:
|
||||||||
|
Foreign exchange contracts
|
$
|
1
|
|
$
|
(3
|
)
|
Cost of products sold
|
|
|
Total
|
$
|
1
|
|
$
|
(3
|
)
|
||
|
|
Gain (Loss) Recognized
|
Location of Gain (Loss)
In Consolidated
Statement
of Operations
|
||||||
|
|
Three Months Ended
March 31, |
|
||||||
|
In millions
|
2016
|
2015
|
|
|||||
|
Derivatives in Fair Value Hedging Relationships:
|
||||||||
|
Interest rate contracts
|
$
|
—
|
|
$
|
2
|
|
Interest expense, net
|
|
|
Debt
|
—
|
|
(2
|
)
|
Interest expense, net
|
|||
|
Total
|
$
|
—
|
|
$
|
—
|
|
||
|
Derivatives Not Designated as Hedging Instruments:
|
||||||||
|
Electricity contract
|
$
|
(2
|
)
|
$
|
(1
|
)
|
Cost of products sold
|
|
|
Foreign exchange contracts
|
—
|
|
(2
|
)
|
Cost of products sold
|
|||
|
Interest rate contracts
|
2
|
|
|
3
|
|
Interest expense, net
|
||
|
Total
|
$
|
—
|
|
$
|
—
|
|
||
18
The following activity is related to fully effective interest rate swaps designated as fair value hedges:
|
|
|
|
2016
|
|
|
|
|
2015
|
|
||||||||||||||
|
In millions
|
Issued
|
|
|
Terminated
|
|
|
Undesignated
|
|
|
Issued
|
|
|
Terminated
|
|
|
Undesignated
|
|
||||||
|
First Quarter
|
$
|
—
|
|
$
|
55
|
|
|
$
|
—
|
|
$
|
—
|
|
|
$
|
—
|
|
|
$
|
—
|
|
||
|
Total
|
$
|
—
|
|
|
$
|
55
|
|
|
$
|
—
|
|
$
|
—
|
|
$
|
—
|
|
|
$
|
—
|
|
||
Fair Value Measurements
For a discussion of the Company’s fair value measurement policies under the fair value hierarchy, refer to Note 14 in the Company’s Annual Report on Form 10-K for the fiscal year ended
December 31, 2015
.
The Company has not changed its valuation techniques for measuring the fair value of any financial assets or liabilities during the year. Transfers between levels, if any, are recognized at the end of the reporting period.
The following table provides a summary of the impact of our derivative instruments in the consolidated balance sheet:
Fair Value Measurements
Level 2 – Significant Other Observable Inputs
|
|
Assets
|
|
Liabilities
|
|
||||||||||||
|
In millions
|
March 31, 2016
|
|
December 31, 2015
|
|
March 31, 2016
|
|
December 31, 2015
|
|
||||||||
|
Derivatives designated as hedging instruments
|
||||||||||||||||
|
Foreign exchange contracts – cash flow
|
$
|
8
|
|
(a)
|
$
|
5
|
|
(b)
|
$
|
1
|
|
(d)
|
$
|
1
|
|
(d)
|
|
Total derivatives designated as hedging instruments
|
$
|
8
|
|
|
$
|
5
|
|
$
|
1
|
|
|
$
|
1
|
|
|
|
|
Derivatives not designated as hedging instruments
|
||||||||||||||||
|
Electricity contract
|
$
|
—
|
|
|
$
|
—
|
|
|
$
|
7
|
|
(c)
|
$
|
7
|
|
(e)
|
|
Foreign exchange contracts
|
2
|
|
(b)
|
—
|
|
|
—
|
|
|
—
|
|
|
||||
|
Total derivatives not designated as hedging instruments
|
$
|
2
|
|
|
$
|
—
|
|
$
|
7
|
|
|
$
|
7
|
|
|
|
|
Total derivatives
|
$
|
10
|
|
|
$
|
5
|
|
$
|
8
|
|
|
$
|
8
|
|
|
|
|
(a)
|
Includes
$7 million
recorded in Other current assets and
$1 million
recorded in Deferred charges and other assets in the accompanying consolidated balance sheet.
|
|
(b)
|
Included in Other current assets in the accompanying consolidated balance sheet.
|
|
(c)
|
Includes
$5 million
recorded in Other accrued liabilities and
$2 million
recorded in Other liabilities in the accompanying consolidated balance sheet.
|
|
(d)
|
Included in Other accrued liabilities in the accompanying consolidated balance sheet.
|
|
(e)
|
Includes
$4 million
recorded in Other accrued liabilities and
$3 million
recorded in Other liabilities in the accompanying consolidated balance sheet.
|
The above contracts are subject to enforceable master netting arrangements that provide rights of offset with each counterparty when amounts are payable on the same date in the same currency or in the case of certain specified defaults. Management has made an accounting policy election to not offset the fair value of recognized derivative assets and derivative liabilities in the consolidated balance sheet. The amounts owed to the counterparties and owed to the Company are considered immaterial with respect to each counterparty and in the aggregate with all counterparties.
Credit-Risk-Related Contingent Features
Certain of the Company’s financial instruments used in hedging transactions are governed by standard credit support arrangements with counterparties. If the lower of the Company’s credit rating by Moody’s or S&P were to drop below investment grade, the Company would be required to post collateral for all of its derivatives in a net liability position, although no derivatives would terminate. As of
March 31, 2016
, there were no derivative contracts in a net liability position that were subject to credit-risk-related contingent features. The fair value of derivative instruments containing credit risk-related contingent features in a net liability position was
$1 million
as of
December 31, 2015
. The Company was not required to post any collateral as of
March 31, 2016
or
December 31, 2015
. For more information on credit-risk-related contingent features, refer to Note 14 in the Company’s Annual Report on Form 10-K for the fiscal year ended
December 31, 2015
.
19
International Paper sponsors and maintains the Retirement Plan of International Paper Company (the Pension Plan), a tax-qualified defined benefit pension plan that provides retirement benefits to substantially all U.S. salaried employees and hourly employees (receiving salaried benefits) hired prior to July 1, 2004, and substantially all other U.S. hourly and union employees who work at a participating business unit regardless of hire date. These employees generally are eligible to participate in the Pension Plan upon attaining 21 years of age and completing one year of eligibility service. U.S. salaried employees and hourly employees (receiving salaried benefits) hired after June 30, 2004, are not eligible for the Pension Plan, but receive a company contribution to their individual savings plan accounts; however, salaried employees hired by Temple Inland prior to March 1, 2007 also participate in the Pension Plan.
The Pension Plan provides defined pension benefits based on years of credited service and either final average earnings (salaried employees and hourly employees receiving salaried benefits), hourly job rates or specified benefit rates (hourly and union employees). A detailed discussion of these plans is presented in Note 16 to the consolidated financial statements included in the Company’s Annual Report on Form 10-K for the fiscal year ended
December 31, 2015
.
In connection with the Temple-Inland acquisition in February 2012, International Paper assumed responsibility for the Temple-Inland Retirement Plan, a defined benefit plan which covers substantially all employees of Temple-Inland. The Temple-Inland Retirement Plan merged with the Retirement Plan of International Paper Company on December 31, 2014.
The Company will freeze participation, including credited service and compensation, for salaried employees under the Pension Plan, the Pension Restoration Plan and the SERP for all service on or after January 1, 2019. In addition, compensation under the Temple-Inland Retirement Plan and the Temple-Inland Supplemental Executive Retirement Plan (collectively, the Temple Retirement Plans) will also be frozen beginning January 1, 2019. Credited service was previously frozen for the Temple Retirement Plans. This change will not affect benefits accrued through December 31, 2018.
Net periodic pension expense for our qualified and nonqualified U.S. defined benefit plans comprised the following:
|
|
Three Months Ended
March 31, |
||||||
|
In millions
|
2016
|
2015
|
|||||
|
Service cost
|
$
|
37
|
|
$
|
39
|
|
|
|
Interest cost
|
156
|
|
149
|
|
|||
|
Expected return on plan assets
|
(206
|
)
|
(196
|
)
|
|||
|
Actuarial loss
|
94
|
|
119
|
|
|||
|
Amortization of prior service cost
|
10
|
|
11
|
|
|||
|
Net periodic pension expense
|
$
|
91
|
|
$
|
122
|
|
|
The Company’s funding policy for our pension plans is to contribute amounts sufficient to meet legal funding requirements, plus any additional amounts that the Company may determine to be appropriate considering the funded status of the plan, tax deductibility, the cash flows generated by the Company, and other factors. No cash contributions were made to the qualified pension plan in the first three months of 2016 or 2015. The nonqualified defined benefit plans are funded to the extent of benefit payments, which totaled
$5 million
for the
three
months ended
March 31, 2016
.
International Paper has an Incentive Compensation Plan (ICP) which is administered by the Management Development and Compensation Committee of the Board of Directors (the Committee). The ICP authorizes the grants of restricted stock, restricted or deferred stock units, performance awards payable in cash or stock upon the attainment of specified performance goals, dividend equivalents, stock options, stock appreciation rights, other stock-based awards and cash-based awards at the discretion of the Committee. A detailed discussion of the ICP, including the now discontinued stock option program and executive continuity award program that provided for tandem grants of restricted stock and stock options, is presented in Note 18 to the consolidated financial statements included in the Company’s Annual Report on Form 10-K for the fiscal year ended
December 31, 2015
. As of
March 31, 2016
,
14.2 million
shares were available for grant under the ICP.
20
Stock-based compensation expense and related income tax benefits were as follows:
|
|
Three Months Ended
March 31, |
||||||
|
In millions
|
2016
|
2015
|
|||||
|
Total stock-based compensation expense (selling and administrative)
|
$
|
26
|
|
$
|
33
|
|
|
|
Income tax benefits related to stock-based compensation
|
33
|
|
89
|
|
|||
At
March 31, 2016
,
$193 million
, net of estimated forfeitures, of compensation cost related to unvested restricted performance shares, executive continuity awards and restricted stock attributable to future service had not yet been recognized. This amount will be recognized in expense over a weighted-average period of
2.0
years.
Performance Share Plan
During the first
three
months of
2016
, the Company granted
2.6 million
performance units at an average grant date fair value of
$37.26
.
International Paper’s industry segments, Industrial Packaging, Printing Papers, and Consumer Packaging are consistent with the internal structure used to manage these businesses. All segments are differentiated on a common product, common customer basis consistent with the business segmentation generally used in the Forest Products industry.
The Company also has a
50%
equity interest in Ilim in Russia that is a separate reportable industry segment. The Company recorded equity earnings (losses), net of taxes, of
$62 million
and
$39 million
for the
three
months ended
March 31, 2016
and 2015, respectively, for Ilim. At
March 31, 2016
and
December 31, 2015
, the Company's investment in Ilim was
$234 million
and
$172 million
, respectively, which was
$164 million
and
$161 million
, respectively, more than the Company's proportionate share of the joint venture's underlying net assets. The differences primarily relate to purchase price fair value adjustments and currency translation adjustments. The Company is party to a joint marketing agreement with Ilim, under which the Company purchases, markets and sells paper produced by Ilim. Purchases under this agreement were
$39 million
and
$43 million
for the
three
months ended
March 31, 2016
and 2015, respectively.
Sales by industry segment for the
three
months ended
March 31, 2016
and
2015
were as follows:
|
|
Three Months Ended
March 31, |
|||||||
|
In millions
|
2016
|
2015
|
||||||
|
Industrial Packaging
|
$
|
3,452
|
|
$
|
3,553
|
|
||
|
Printing Papers
|
1,184
|
|
1,228
|
|
||||
|
Consumer Packaging
|
495
|
|
778
|
|
||||
|
Corporate and Intersegment Sales
|
(21
|
)
|
(42
|
)
|
||||
|
Net Sales
|
$
|
5,110
|
|
$
|
5,517
|
|
||
Operating profit by industry segment for the
three
months ended
March 31, 2016
and
2015
were as follows:
|
|
Three Months Ended
March 31, |
|
||||||
|
In millions
|
2016
|
|
2015
|
|
||||
|
Industrial Packaging
|
$
|
396
|
|
(a)
|
$
|
468
|
|
|
|
Printing Papers
|
85
|
|
109
|
|
|
|||
|
Consumer Packaging
|
16
|
|
(b)
|
46
|
|
|
||
|
Operating Profit
|
497
|
|
|
623
|
|
|
||
|
Interest expense, net
|
(123
|
)
|
(137
|
)
|
||||
|
Noncontrolling interests/equity earnings adjustment (c)
|
—
|
|
|
1
|
|
|
||
|
Corporate items, net
|
(21
|
)
|
(9
|
)
|
||||
|
Restructuring and other charges
|
8
|
|
—
|
|
||||
|
Non-operating pension expense
|
(44
|
)
|
(72
|
)
|
||||
|
Earnings (loss) from continuing operations before income taxes and equity earnings
|
$
|
317
|
|
|
$
|
406
|
|
|
|
Equity earnings (loss), net of taxes – Ilim
|
$
|
62
|
|
$
|
39
|
|
|
|
21
|
(a)
|
Includes a charge of
$37 million
for the three months ended March 31, 2016 for the impairment of the assets of our corrugated packaging business in Asia and costs associated with the announced definitive agreement to sell the business.
|
|
(b)
|
Includes a charge of
$9 million
for the three months ended March 31, 2016 for costs associated with the Riegelwood mill conversion to 100% pulp production.
|
|
(c)
|
Operating profits for industry segments include each segment's percentage share of the profits of subsidiaries included in that segment that are less than wholly owned. The pre-tax noncontrolling interest and equity earnings for these subsidiaries are adjusted here to present consolidated earnings before income taxes and equity earnings.
|
On May 1, 2016, the Company entered into a definitive agreement to purchase the pulp business of Weyerhaeuser Company for
$2.2 billion
in cash, subject to certain adjustments. Because the transaction is a purchase of assets, International Paper expects to realize a tax benefit with an estimated net present value of approximately
$300 million
. Under the terms of the agreement, International Paper will acquire
five
pulp mills and
two
modified fiber mills located in the United States, Canada and Poland. The acquisition is expected to close in the fourth quarter of 2016, subject to certain closing conditions, primarily the receipt of regulatory approval.
22
|
ITEM 2.
|
MANAGEMENT’S DISCUSSION AND ANALYSIS OF FINANCIAL CONDITION AND RESULTS OF OPERATIONS
|
EXECUTIVE SUMMARY
Operating Earnings (a non-GAAP measure) is defined as net earnings from continuing operations (a GAAP measure) excluding special items and non-operating pension expense. International Paper generated Operating Earnings per share attributable to International Paper common shareholders of
$0.80
in the
first
quarter of
2016
, compared with
2015
fourth
-quarter earnings of
$0.87
and
2015
first
-quarter earnings of
$0.84
. Diluted earnings (loss) per share attributable to International Paper common shareholders were
$0.81
in the
first
quarter of
2016
, compared with
$0.43
in the
fourth
quarter of
2015
and
$0.74
in the
first
quarter of
2015
.
International Paper delivered solid results in the 2016 first quarter driven by continued strong performance in our North American Industrial Packaging business along with improved results in our global printing papers businesses driven by better conditions and lower costs. The 2016 first quarter results reflect reliable operations and favorable input costs across our businesses in what was a heavy maintenance outage quarter including the Riegelwood conversion. Also, during the 2016 first quarter, we reached a definitive agreement to divest our interest in the Asia Industrial Packaging business, with the transaction expected to close later this year.
Price and mix were lower than the 2015 fourth quarter, primarily driven by lower pricing on export containerboard and box sales in our North American Industrial Packaging business. Volumes were sequentially lower, as expected, in our North American Industrial Packaging business primarily due to seasonality. Input costs were favorable compared to the 2015 fourth quarter, particularly in the case of recycled fiber and freight in our North American Industrial Packaging business. Maintenance outages were higher compared to the 2015 fourth quarter due in large part to significant costs associated with the Riegelwood mill conversion, which was completed in April 2016. Our Ilim joint venture delivered solid results in the 2016 first quarter driven by strong manufacturing performance partially offset by lower pulp prices and seasonally lower volumes. Ilim’s 2016 first quarter results also reflect the favorable impact of non-cash foreign currency movements associated with Ilim’s U.S. dollar denominated debt.
Looking ahead to the 2016 second quarter, we expect a seasonal volume increase in our North American Industrial Packaging business. Volume in the Brazilian Printing Papers business should also improve after moving past the seasonal weakness of the 2016 first quarter. Price and mix are expected to be unfavorable in our North American pulp business due to lower pulp prices and the ramp up of Riegelwood softwood pulp production, respectively. Pricing is also expected to be unfavorable in our North American Industrial Packaging Business due to lower export pricing and the impact of the January Containerboard pricing index adjustment flowing through to North American box contracts. Pricing in our Brazil Printing Papers business should improve as previously announced price increases are implemented. The solid operational performance noted in the 2015 first quarter is expected to continue during the 2016 second quarter with improvement in our North American Industrial Packaging business associated with seasonally stronger demand utilization along with other cost reduction and improvement initiatives. Input costs are expected to remain overall stable across most businesses with some inflationary pressure impacting the EMEA Printing Papers business. Planned maintenance outage costs will continue to be heavy in the 2016 second quarter but overall are expected to be lower than the 2016 first quarter which included significant outage costs at the Riegelwood mill. For our Ilim joint venture, the 2016 second quarter will likely be impacted by pulp pricing pressure, seasonally higher wood cost and heavy maintenance outage spending. Additionally, we expect Ilim’s earnings to be impacted by the absence of the positive impact from foreign currency movements driven by Ilim’s U.S. dollar denominated debt as we assume no change in foreign currency rates in our outlook.
Operating Earnings and Operating Earnings Per Share are non-GAAP measures. Diluted earnings (loss) per share attributable to International Paper Company common shareholders is the most direct comparable GAAP measure. The Company calculates Operating Earnings by excluding the after-tax effect of items considered by management to be unusual from the earnings reported under GAAP, non-operating pension expense, and discontinued operations. Management uses this measure to focus on on-going operations, and believes that it is useful to investors because it enables them to perform meaningful comparisons of past and present operating results. The Company believes that using this information, along with the most direct comparable GAAP measure, provides for a more complete analysis of the results of operations.
23
The following are reconciliations of Operating Earnings per share attributable to International Paper Company common shareholders to diluted earnings (loss) per share attributable to International Paper Company common shareholders.
|
|
Three Months Ended
March 31, |
Three Months Ended
December 31, |
|||||||||
|
|
2016
|
2015
|
2015
|
||||||||
|
Operating Earnings (Loss) Per Share Attributable to Shareholders
|
$
|
0.80
|
|
$
|
0.84
|
|
$
|
0.87
|
|
||
|
Non-operating pension per share
|
(0.07
|
)
|
(0.10
|
)
|
(0.09
|
)
|
|||||
|
Special items per share
|
0.09
|
|
—
|
|
(0.35
|
)
|
|||||
|
Diluted Earnings (Loss) Per Share from Continuing Operations
|
0.82
|
|
0.74
|
|
0.43
|
|
|||||
|
Discontinued operations per share
|
(0.01
|
)
|
—
|
|
—
|
|
|||||
|
Diluted Earnings (Loss) Per Share Attributable to Shareholders
|
$
|
0.81
|
|
$
|
0.74
|
|
$
|
0.43
|
|
||
RESULTS OF OPERATIONS
For the
first
quarter of
2016
, International Paper Company reported net sales of
$5.1 billion
, compared with
$5.4 billion
in the
fourth
quarter of
2015
and
$5.5 billion
in the
first
quarter of
2015
.
Net earnings attributable to International Paper totaled
$334 million
, or
$0.81
per share, in the
2016
first
quarter. This compared with
$313 million
, or
$0.74
per share, in the
first
quarter of
2015
and
$178 million
or
$0.43
per share, in the
fourth
quarter of
2015
.

Earnings from continuing operations attributable to International Paper Company were
$339 million
in the
first
quarter of
2016
compared with
$313 million
in the
first
quarter of
2015
and
$178 million
in the
fourth
quarter of
2015
. Compared with the
first
quarter of
2015
, the
2016
first
quarter reflects higher sales volumes (
$7 million
), lower raw material and freight costs (
$32 million
), lower net interest expense (
$9 million
) and lower non-operating pension expense (
$17 million
). These benefits were offset by the net impact of lower average sales price realizations and mix ($
48 million
), higher operating costs (
$11 million
), higher mill maintenance outage costs (
$33 million
) and higher corporate and other costs (
$6 million
). Equity earnings, net of taxes, relating to International Paper’s investment in Ilim Holding S.A. were
$23 million
higher in the
2016
first
quarter than in the
2015
first
quarter. Net special items in the
2016
first
quarter were a gain of $36 million compared with no special items in the
2015
first
quarter.
Compared with the
fourth
quarter of
2015
, earnings benefited from lower operating costs (
$18 million
), lower raw material and freight costs (
$20 million
), lower net interest expense (
$7 million
) and lower non-operating pension expense (
$9 million
). These benefits were offset by lower average sales price realizations and an unfavorable mix (
$30 million
), lower sales volumes
24
(
$31 million
), higher mill maintenance outage costs (
$30 million
), higher corporate and other items (
$9 million
) and higher tax expense (
$4 million
) reflecting a higher estimated tax rate. Equity earnings, net of taxes, for Ilim Holding, S.A. increased by
$28 million
versus the
2015
fourth
quarter. Net special items in the
2016
first
quarter were a gain of $36 million compared with a loss of $147 million in the
2015
fourth
quarter.
To measure the performance of the Company’s business segments from period to period without variations caused by special or unusual items, International Paper’s management focuses on industry segment operating profit. This is defined as earnings from continuing operations before taxes, equity earnings and noncontrolling interests, net of taxes, excluding interest expense, corporate charges and corporate special items which may include restructuring charges and (gains) losses on sales and impairments of businesses.
The following table presents a reconciliation of net earnings attributable to International Paper Company to its operating profit:
|
|
Three Months Ended
|
||||||||||
|
|
March 31
|
December 31,
|
|||||||||
|
In millions
|
2016
|
2015
|
2015
|
||||||||
|
Earnings (Loss) From Continuing Operations Attributable to International Paper Company
|
$
|
339
|
|
$
|
313
|
|
$
|
178
|
|
||
|
Add back (deduct):
|
|||||||||||
|
Income tax provision (benefit)
|
41
|
|
130
|
|
120
|
|
|||||
|
Equity (earnings) loss, net of taxes
|
(63
|
)
|
(35
|
)
|
(33
|
)
|
|||||
|
Noncontrolling interests, net of taxes
|
—
|
|
(2
|
)
|
—
|
|
|||||
|
Earnings (Loss) From Continuing Operations Before Income Taxes and Equity Earnings
|
317
|
|
406
|
|
265
|
|
|||||
|
Interest expense, net
|
123
|
|
137
|
|
133
|
|
|||||
|
Noncontrolling interests / equity earnings included in operations
|
—
|
|
(1
|
)
|
(2
|
)
|
|||||
|
Corporate items
|
21
|
|
9
|
|
9
|
|
|||||
|
Special items (income) expense
|
(8
|
)
|
—
|
|
18
|
|
|||||
|
Non-operating pension expense
|
44
|
|
72
|
|
60
|
|
|||||
|
$
|
497
|
|
$
|
623
|
|
$
|
483
|
|
|||
|
Industry Segment Operating Profit:
|
|||||||||||
|
Industrial Packaging
|
$
|
396
|
|
$
|
468
|
|
$
|
304
|
|
||
|
Printing Papers
|
85
|
|
109
|
|
144
|
|
|||||
|
Consumer Packaging
|
16
|
|
46
|
|
35
|
|
|||||
|
Total Industry Segment Operating Profit
|
$
|
497
|
|
$
|
623
|
|
$
|
483
|
|
||
25
Industry Segment Operating Profit
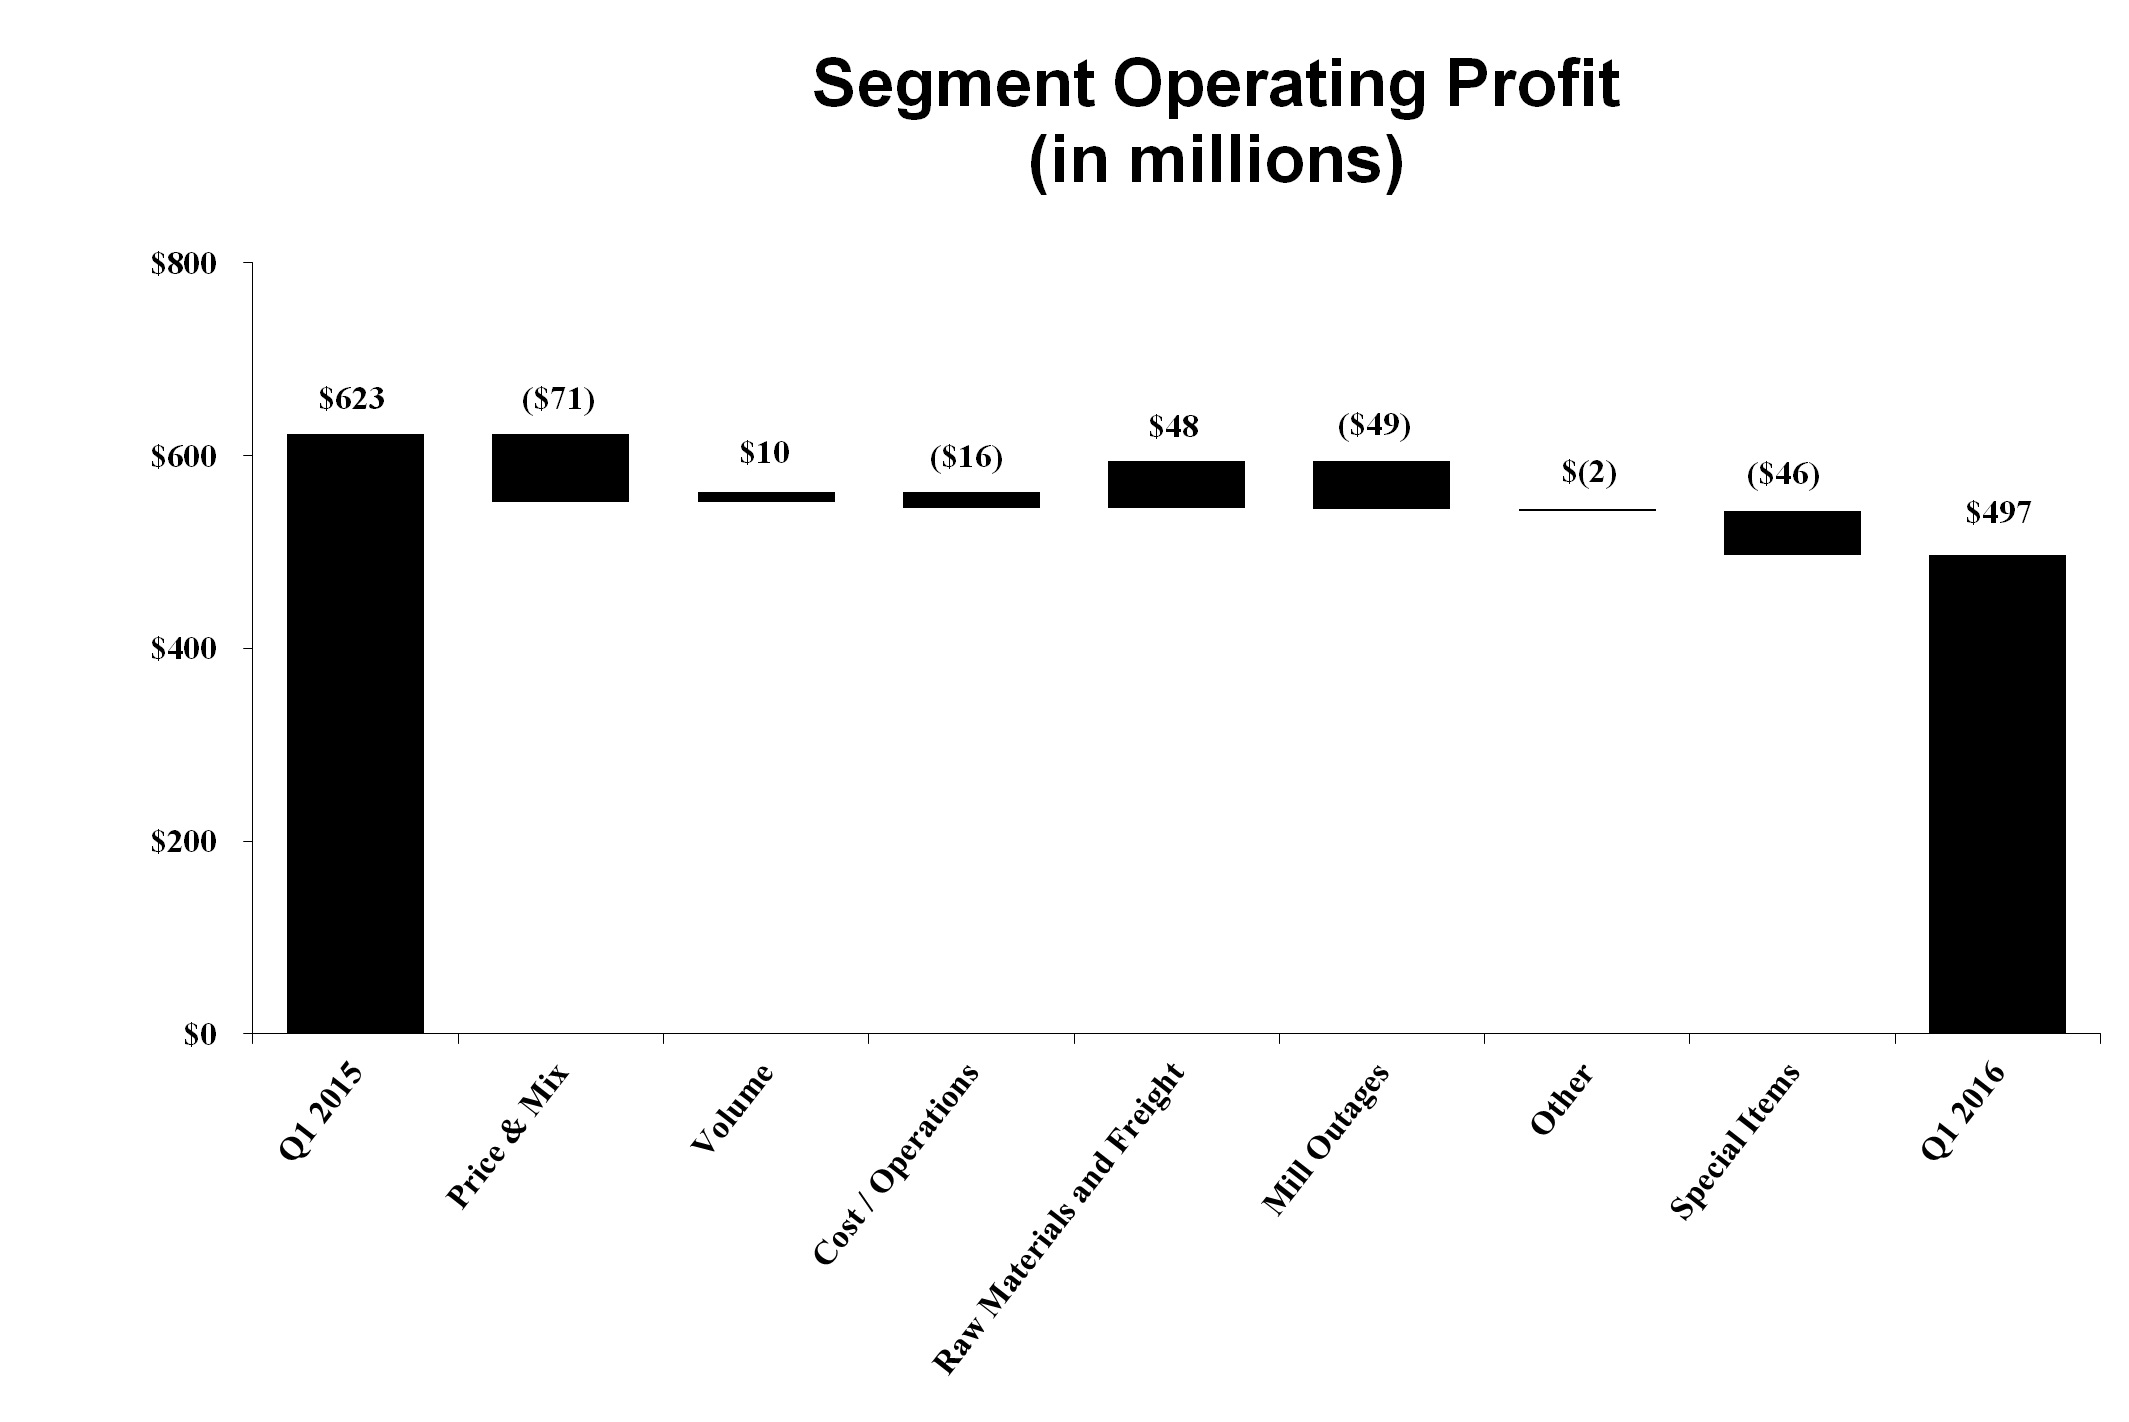
Total industry segment operating profits of
$497 million
in the
2016
first
quarter were lower than the
$623 million
in the
2015
first
quarter, but higher than the
$483 million
in the
2015
fourth
quarter. Compared with the
first
quarter of
2015
, operating profits in the current quarter benefited from higher sales volumes (
$10 million
) and lower raw material and freight costs ($
48 million
). These benefits were offset by the net impact of lower net average sales price realizations and mix ($
71 million
), higher operating costs (
$16 million
), higher mill outage costs (
$49 million
) and higher other costs (
$2 million
). Special items were a loss of $46 million in the
2016
first
quarter compared with no special items in the
2015
first
quarter.
Compared with the
fourth
quarter of
2015
, operating profits benefited from lower operating costs (
$27 million
) and lower raw material and freight costs (
$29 million
). These benefits were offset by lower average sales price realizations and an unfavorable mix (
$44 million
), lower sales volumes (
$45 million
), higher mill outage costs (
$44 million
) and higher other items (
$3 million
). Special items were a loss of $46 million in the
2016
first
quarter compared with a loss of $140 million in the
2015
fourth
quarter.
During the
2016
first
quarter, International Paper took approximately 516,000 tons of downtime of which approximately 212,000 tons were economic-related compared with approximately 202,000 tons of downtime, which included about 13,000 tons that were economic-related, in the
2015
first
quarter. During the
2015
fourth
quarter, International Paper took approximately 402,000 tons of downtime of which approximately 261,000 tons were economic-related. Economic downtime is taken to balance internal supply with our customer demand, while maintenance downtime is taken periodically during the year.
26
Sales Volumes by Product (a)
Sales volumes of major products for the
three
months ended
March 31, 2016
and
2015
were as follows:
|
|
Three Months Ended
March 31, |
||||
|
In thousands of short tons
|
2016
|
2015
|
|||
|
Industrial Packaging
|
|||||
|
North American Corrugated Packaging (c)
|
2,519
|
|
2,500
|
|
|
|
North American Containerboard
|
740
|
|
774
|
|
|
|
North American Recycling
|
607
|
|
590
|
|
|
|
North American Saturated Kraft
|
47
|
|
37
|
|
|
|
North American Gypsum/Release Kraft
|
46
|
|
36
|
|
|
|
North American Bleached Kraft
|
6
|
|
5
|
|
|
|
EMEA Industrial Packaging (c)
|
374
|
|
347
|
|
|
|
Asian Box (c)
|
103
|
|
102
|
|
|
|
Brazilian Packaging (c)
|
77
|
|
81
|
|
|
|
Industrial Packaging
|
4,519
|
|
4,472
|
|
|
|
Printing Papers
|
|||||
|
U.S. Uncoated Papers
|
475
|
|
466
|
|
|
|
EMEA and Russian Uncoated Papers
|
373
|
|
380
|
|
|
|
Brazilian Uncoated Papers
|
254
|
|
235
|
|
|
|
Indian Uncoated Papers
|
63
|
|
64
|
|
|
|
Uncoated Papers
|
1,165
|
|
1,145
|
|
|
|
Market Pulp (b)
|
405
|
|
417
|
|
|
|
Consumer Packaging
|
|||||
|
North American Consumer Packaging
|
308
|
|
338
|
|
|
|
EMEA Coated Paperboard
|
94
|
|
99
|
|
|
|
Asian Coated Paperboard (d)
|
—
|
|
304
|
|
|
|
Consumer Packaging
|
402
|
|
741
|
|
|
|
(a)
|
Sales volumes include third party and inter-segment sales and exclude sales of equity investees.
|
|
(b)
|
Includes North American, European and Brazilian volumes and internal sales to mills.
|
|
(c)
|
Volumes for corrugated box sales reflect consumed tons sold (CTS). Board sales for these businesses reflect invoiced tons.
|
|
(d)
|
Includes sales volumes through the date of sale in October 2015.
|
Income Taxes
An income tax provision of
$41 million
was recorded for the
2016
first
quarter. Excluding a benefit of
$74 million
related to the tax effects of special items and a benefit of
$17 million
related to the tax effects of non-operating pension expense, the effective income tax rate for continuing operations was
33%
for the quarter.
An income tax provision of
$120 million
was recorded for the
2015
fourth
quarter. Excluding a benefit of
$11 million
related to the tax effects of special items and a benefit of
$24 million
related to the tax effects of non-operating pension expense, the effective income tax rate for continuing operations was
32%
for the quarter.
An income tax provision of
$130 million
was recorded for the
2015
first
quarter. Excluding a benefit of
$28 million
related to the tax effects of non-operating pension expense, the effective income tax rate for continuing operations was
33%
for the quarter.
Interest Expense and Corporate Items
Net interest expense for the
2016
first
quarter was
$123 million
compared with
$133 million
in the
2015
fourth
quarter and
$137 million
in the
2015
first
quarter.
Corporate items, net, were
$21 million
in the
2016
first
quarter compared with
$9 million
in the
2015
fourth
quarter, and
$9 million
in the
2015
first
quarter.
27
Restructuring and Other Charges
During the three months ended March 31, 2016, net restructuring and other charges totaling
$1 million
before taxes were recorded. During the three months ended March 31, 2015, no restructuring and other charges were recorded. See discussion in Note 6 to the financial statements for further details.
BUSINESS SEGMENT OPERATING RESULTS
The following presents business segment discussions for the
first
quarter of
2016
.
Industrial Packaging
|
|
2016
|
2015
|
|||||||||
|
In millions
|
1st Quarter
|
1st Quarter
|
4th Quarter
|
||||||||
|
Sales
|
$
|
3,452
|
|
$
|
3,553
|
|
$
|
3,595
|
|
||
|
Operating Profit
|
396
|
|
468
|
|
304
|
|
|||||
Industrial Packaging net sales for the
first
quarter of
2016
were
4%
lower
than in the
fourth
quarter of
2015
and
3%
lower
than in the
first
quarter of
2015
. Operating profits in the
first
quarter of
2016
included a charge of
$37 million
to write down the assets of our Asia corrugated packaging business and costs associated with the announced definitive agreement to sell it. Operating profits in the
fourth
quarter of
2015
included a charge of
$137 million
for goodwill and trade name impairment charges associated with our Brazil Packaging business. Excluding these items, operating profits in the
first
quarter of
2016
were
2%
lower
than in the
fourth
quarter of
2015
and
7%
lower
than the
first
quarter of
2015
.
North American Industrial Packaging
net sales were
$3.0 billion
in the
first
quarter of
2016
compared with
$3.1 billion
in the
fourth
quarter of
2015
and
$3.1 billion
in the
first
quarter of
2015
. Operating profits were
$438 million
in the
first
quarter of
2016
compared with
$451 million
in the
fourth
quarter of
2015
and
$468 million
in the
first
quarter of
2015
.
Sales volumes for boxes in the
first
quarter of
2016
were lower than in the
fourth
quarter of
2015
, reflecting seasonally decreased market demand partially mitigated by two more shipping days. Containerboard shipments to the domestic market were slightly lower, while shipments to the export market increased, recovering from a weak fourth quarter. Total maintenance and economic downtime increased 31,000 tons from 322,000 tons to 353,000 tons which reflects an increase of 50,000 tons for maintenance downtime, partially offset by a decrease of 19,000 tons for economic downtime. Average sales margins for boxes were slightly lower. Average sales price realizations for export containerboard also decreased. Input costs were lower, primarily for recycled fiber and freight. Planned maintenance downtime costs were $10 million higher in the
2016
first
quarter compared with the
2015
fourth
quarter. Operating costs were lower.
Compared with the
first
quarter of
2015
, sales volumes in the
first
quarter of
2016
increased for boxes, reflecting stable market demand and one more shipping day. Sales volumes for shipments of containerboard to both domestic and export markets were lower. Total maintenance and economic downtime was 213,000 tons higher in the first quarter of 2016 which comprises an increase of 1,000 tons for maintenance downtime and an increase of 212,000 tons for economic downtime. Average sales price realizations were lower for shipments of containerboard to export markets. Average sales margins for boxes were also lower due to the impact of price and mix. Input costs decreased for energy, chemicals and freight fuel surcharges. Planned maintenance downtime costs were $10 million higher in the
first
quarter of
2016
compared with the
first
quarter of
2015
.
Entering the
second
quarter of
2016
, sales volumes are expected to be seasonally higher for boxes, reflecting higher daily shipments and one more shipping day. Input costs are expected to be lower for natural gas and wood. Planned maintenance downtime costs should be $6 million higher.
EMEA Industrial Packaging
net sales were
$294 million
in the
first
quarter of
2016
compared with
$293 million
in the
fourth
quarter of
2015
and
$282 million
in the
first
quarter of
2015
. Operating profits were
$7 million
in the
first
quarter of
2016
compared with
$4 million
in the
fourth
quarter of
2015
and
$4 million
in the
first
quarter of
2015
.
Sales volumes for boxes in the
first
quarter of
2016
were slightly lower than in the
fourth
quarter of
2015
, as decreased shipments in Turkey were largely offset by increases in Morocco and Spain. Average sales margins increased, reflecting lower material costs and higher average box sales prices. Input costs for energy were slightly higher, but were more than offset by lower operating costs.
Compared with the
first
quarter of
2015
, sales volumes in the
first
quarter of
2016
were higher, reflecting growing market demand in Morocco and the recovery from prior year labor strikes in Turkey. Average sales margins were negatively impacted by currency translations, while box sales price increases offset higher material costs. Input costs for energy were lower.
28
Looking ahead to the
second
quarter of
2016
, sales volumes are expected to be seasonally higher. Average sales margins are expected to improve reflecting relief from high material costs. Operating costs will be higher due to increased volumes.
On March 16, 2016, the Company announced that it had entered into a binding agreement with Holmen Paper to purchase Holmen's newsprint mill in Madrid, Spain, and intends to convert the facility to produce recycled containerboard. Under the terms of the agreement, International Paper will purchase the Madrid newsprint mill, as well as associated recycling operations and a
50%
ownership interest in a cogeneration facility. The transaction is expected to close during the second quarter of 2016, subject to certain regulatory approvals.
Brazilian Industrial Packaging
net sales were
$42 million
in the
first
quarter of
2016
compared with
$48 million
in the
fourth
quarter of
2015
and
$62 million
in the
first
quarter of
2015
. Operating profits were a loss of
$8 million
in the
first
quarter of
2016
compared with a loss of
$149 million
(a loss of $12 million excluding goodwill and trade name impairment charges) in the
fourth
quarter of
2015
and a loss of
$3 million
in the
first
quarter of
2015
.
Sales volumes in the
first
quarter of
2016
were lower than in the
fourth
quarter of
2015
due to continuing weak economic conditions. Average sales margins were slightly lower as the partial realization of a previously announced box sales price increase was offset by an unfavorable customer and product mix. Input costs were flat.
Compared with the
first
quarter of
2015
, sales volumes in the
first
quarter of
2016
were lower due to continued poor economic conditions. Average sales price realizations increased slightly, while input costs were higher, primarily for starch and chemicals. Operating costs were also higher.
Looking ahead to the
second
quarter of
2016
, sales volumes are expected to be seasonally higher, although the weak economic conditions are expected to continue. Average sales price realizations are also expected to improve due to the continuing realization of box sales price increases. Input costs should be higher, primarily for recycled fiber. Planned maintenance downtime costs should be $2 million higher with an outage scheduled at the Nova Campina mill.
Asian Industrial Packaging
net sales were
$126 million
in the
first
quarter of
2016
compared with
$156 million
in the
fourth
quarter of
2015
and
$146 million
in the
first
quarter of
2015
. Operating profits were a loss of
$41 million
(a loss of $4 million excluding asset write-down and costs associated with the sale of the business) in the
first
quarter of
2016
compared with a loss of
$2 million
in the
fourth
quarter of
2015
and a loss of
$1 million
in the
first
quarter of
2015
.
Sales volumes for boxes in the
first
quarter of
2016
were lower than in the
fourth
quarter of
2015
reflecting continued soft market demand. Lower average sales margins were due to competitive pressure on sales prices and flat linerboard costs. Compared with the
first
quarter of
2015
, corrugated box sales volumes in the
first
quarter of
2016
were higher. Average sales margins decreased due to competitive pressure and weak economic conditions. Distribution sales were lower in the
first
quarter of
2016
compared with both the
fourth
quarter of
2015
and the
first
quarter of
2015
. Operating profits in the
second
quarter of
2016
are expected to continue to be affected by the difficult market conditions. Sales volumes for boxes are expected to be similar to the first quarter, while average sales margins are forecasted to improve.
On March 14, 2016, the Company announced that it has entered into a definitive agreement to sell its corrugated packaging business in China and Southeast Asia to Xiamen Bridge Hexing Equity Investment Partnership Enterprise. The transaction is expected to be completed during the second quarter, subject to satisfaction of closing conditions, including obtaining governmental approvals.
Printing Papers
|
|
2016
|
2015
|
|||||||||
|
In millions
|
1st Quarter
|
1st Quarter
|
4th Quarter
|
||||||||
|
Sales
|
$
|
1,184
|
|
$
|
1,228
|
|
$
|
1,296
|
|
||
|
Operating Profit
|
85
|
|
109
|
|
144
|
|
|||||
Printing Papers net sales for the
first
quarter of
2016
were
9%
lower
than in the
fourth
quarter of
2015
and
4%
lower
than in the
first
quarter of
2015
. Operating profits in the
first
quarter of
2016
were
41%
lower
than in the
fourth
quarter of
2015
and
22%
lower
than in the
first
quarter of
2015
.
North American Printing Papers
net sales were
$481 million
in the
first
quarter of
2016
compared with
$489 million
in the
fourth
quarter of
2015
and
$482 million
in the
first
quarter of
2015
. Operating profits were
$61 million
in the
first
quarter of
2016
compared with
$33 million
in the
fourth
quarter of
2015
and
$34 million
in the
first
quarter of
2015
.
Sales volumes in the
first
quarter of
2016
were even with the
fourth
quarter of
2015
reflecting stable market demand for uncoated freesheet paper in the domestic market. However, average sales price realizations for uncoated freesheet paper were slightly lower. Input costs decreased slightly. Planned maintenance downtime costs in the
first
quarter of
2016
, which included
29
an outage at the Georgetown mill, were $15 million lower than in the
fourth
quarter of
2015
which included outages at the Riverdale and Eastover mills. Manufacturing operating costs were lower.
Compared with the
first
quarter of
2015
, sales volumes in the
first
quarter of
2016
were slightly higher reflecting increased shipments of uncoated freesheet paper to the domestic market, partially offset by lower export shipments. Average sales price realizations for domestic sales of uncoated freesheet paper were lower. Input costs and operating costs were significantly lower. Planned maintenance downtime costs in the first quarter of 2016 were flat compared with the first quarter of 2015.
Entering the
second
quarter of
2016
, sales volumes are expected to improve for uncoated freesheet paper in the North American market. Average sales price realizations are expected to increase slightly due to the implementation of the announced sales price increase for uncoated freesheet rolls. Input costs are expected to be flat. Planned maintenance downtime costs should be $10 million higher with outages scheduled at the Georgetown, Eastover and Ticonderoga mills in the second quarter.
European Printing Papers
net sales were
$289 million
in the
first
quarter of
2016
compared with
$306 million
in the
fourth
quarter of
2015
and
$293 million
in the
first
quarter of
2015
. Operating profits were
$45 million
in the
first
quarter of
2016
compared with
$48 million
in the
fourth
quarter of
2015
and
$35 million
in the
first
quarter of
2015
.
Compared with the
fourth
quarter of
2015
, sales volumes for uncoated freesheet paper in the
first
quarter of
2016
were seasonally lower in Russia, but flat in Europe. Sales volumes for pulp were lower in both Europe and Russia. Average sales price realizations for uncoated freesheet paper increased in both Europe and Russia reflecting the partial implementation of announced price increases. However, average sales price realizations for pulp decreased. Input costs improved in Europe, primarily for energy and wood, but were flat in Russia. Planned maintenance downtime costs were $1 million lower in the first quarter of 2016. Manufacturing operating costs were lower.
Sales volumes for uncoated freesheet paper in the
first
quarter of
2016
were lower compared with the
first
quarter of
2015
in both Europe and Russia. Average sales price realizations increased for uncoated freesheet paper due to price increases implemented during 2015 and the first quarter of 2016. In Europe, input costs were lower for wood and energy, while in Russia costs for wood and energy were higher.
Looking forward to the
second
quarter of
2016
, sales volumes for uncoated freesheet paper are expected to be stable. Average sales price realizations for uncoated freesheet paper are expected to reflect the continued implementation of the price increases begun in Russia in the first quarter. Input costs are expected to be slightly higher for wood. Planned maintenance downtime costs should be $8 million higher in the second quarter of 2016 which includes outages scheduled at the Svetogorsk and Kwidzyn mills.
Brazilian Printing Papers
net sales were
$190 million
in the
first
quarter of
2016
compared with
$252 million
in the
fourth
quarter of
2015
and
$197 million
in the
first
quarter of
2015
. Operating profits were
$35 million
in the
first
quarter of
2016
,
$58 million
in the
fourth
quarter of
2015
and
$37 million
in the
first
quarter of
2015
.
Sales volumes in the
first
quarter of
2016
decreased compared with the
fourth
quarter of
2015
due to seasonally weaker demand. Average sales price realizations were higher in the domestic market due to the partial realization of announced price increases for cutsize and offset paper, but average sales price realizations to other Latin American markets were flat. Average sales margins were negatively impacted by an unfavorable mix. Input costs were stable, while manufacturing operating costs were slightly higher.
Compared with the
first
quarter of
2015
, sales volumes in the
first
quarter of
2016
increased despite weak economic conditions due to market demand related to the upcoming Olympic games. Average sales price realizations were higher reflecting the partial realization of the first-quarter 2016 domestic price increase. Input costs were higher for energy and wood. Planned maintenance downtime costs were $6 million lower than in the first quarter of 2015.
Entering the
second
quarter of
2016
, sales volumes are expected to be seasonally stronger for uncoated freesheet paper in the domestic market. Average sales price realizations are expected to be higher reflecting the continued realization of the first-quarter 2016 price increases for cutsize paper and offset paper in the domestic Brazilian market. Average sales margins should benefit from a more favorable mix. Input costs are expected to be higher, for starch and chemicals. Planned maintenance outage costs should be $6 million higher in the second quarter with outages scheduled at the Mogi Guacu and Luiz Antonio mills.
Indian Printing Papers
net sales were
$43 million
in the
first
quarter of
2016
compared with
$41 million
in the
fourth
quarter of
2015
and
$47 million
in the
first
quarter of
2015
. Operating profits were a loss of
$1 million
in the
first
quarter of
2016
, a loss of
$2 million
in the
fourth
quarter of
2015
and a loss of
$2 million
in the
first
quarter of
2015
.
Compared with the
fourth
quarter of
2015
, sales volumes in the
first
quarter of
2016
were higher reflecting increased market demand from the education segment and market demand growth for cut-size products. Average sales price realizations were flat due to continuing competitive pressures. Input costs were slightly lower for fiber and chemicals, while operating costs increased. Compared with the
first
quarter of
2015
, sales volumes in the
first
quarter of
2016
were flat. Average sales price realizations were also flat, while input costs were lower for wood.
30
Looking ahead to the
second
quarter of
2016
, market demand is expected to be moderately lower with a seasonal decline beginning in June. Average sales margins should remain stable. Input costs for fiber are expected to be slightly lower.
U.S. Market Pulp
net sales were
$181 million
in the
first
quarter of
2016
compared with
$208 million
in the
fourth
quarter of
2015
and
$209 million
in the
first
quarter of
2015
. Operating profits were a loss of
$55 million
in the
first
quarter of
2016
compared with profits of
$7 million
in the
fourth
quarter of
2015
and
$5 million
in the
first
quarter of
2015
.
Sales volumes in the
first
quarter of
2016
decreased compared with the
fourth
quarter of
2015
, primarily for fluff pulp, due to capacity constraints related to annual maintenance outages. Average sales price realizations were lower for both fluff pulp and market pulp. Operating costs were higher principally due to costs related to the Riegelwood conversion. Input costs were flat. Planned maintenance downtime costs in the
first
quarter of
2016
included annual outages at the Georgetown and Riegelwood mills plus outage work related to the Riegelwood conversion and were $45 million higher than in the
fourth
quarter of
2015
, which included an outage at the Pensacola mill.
Compared with the
first
quarter of
2015
, sales volumes were lower in the
first
quarter of
2016
primarily for market pulp shipments. Average sales price realizations were lower for fluff pulp and softwood pulp. Input costs decreased for energy and chemicals. Higher operating costs in the first quarter of 2016 were largely related to the Riegelwood conversion. Planned maintenance downtime and conversion costs were $39 million higher in the first quarter of 2016.
Entering the
second
quarter of
2016
, sales volumes in total are expected to be higher. However, average sales margins will reflect a less favorable product mix resulting from the ramp-up of the Riegelwood mill as it starts up the new machine on lower margin softwood pulp and begins the fluff pulp qualification process. Input costs are expected to be flat, but distribution costs should increase. Planned maintenance downtime costs should be $39 million lower in the second quarter of 2016, but will include some additional costs associated with the Riegelwood conversion. Operating costs associated with the Riegelwood conversion are expected to be lower.
Consumer Packaging
|
|
2016
|
2015
|
||||||||
|
In millions
|
1st Quarter
|
1st Quarter
|
4th Quarter
|
|||||||
|
Sales
|
$
|
495
|
|
778
|
|
$
|
556
|
|
||
|
Operating Profit
|
16
|
|
46
|
|
35
|
|
||||
Consumer Packaging net sales in the
first
quarter of
2016
were
11%
lower
than in the
fourth
quarter of
2015
and
36%
lower
than in the
first
quarter of
2015
. Operating profits in the
first
quarter of
2016
and in the fourth quarter of 2015 included charges of
$9 million
and
$15 million
, respectively, related to the conversion of our Riegelwood mill to 100% pulp production. Operating profits in the
fourth
quarter of
2015
also included a gain of
$12 million
associated with the sale of the IP-Sun JV. Excluding these items, operating profits in the
first
quarter of
2016
were
34%
lower
than in the
fourth
quarter of
2015
and
46%
lower
than in the
first
quarter of
2015
.
North American Consumer Packaging
net sales in the
first
quarter of
2016
were
$418 million
compared with
$475 million
in the
fourth
quarter of
2015
and
$470 million
in the
first
quarter of
2015
. Operating profits were a loss of
$10 million
(a loss of $1 million excluding costs associated with the conversion of the Riegelwood mill to 100% pulp production) in the
first
quarter of
2016
compared with a loss of
$3 million
(a gain of $12 million excluding costs associated with the conversion of the Riegelwood mill) in the
fourth
quarter of
2015
and a gain of
$22 million
in the
first
quarter of
2015
.
Coated Paperboard sales volumes in the
first
quarter of
2016
were lower than in the
fourth
quarter of
2015
primarily reflecting the absence of the coated bristols product line, while sales volumes for the remaining product lines increased. The business took no market related downtime in the 2016 first quarter compared with about 30,000 tons in the 2015 fourth quarter. Average sales price realizations were lower for folding carton board and platestock. Planned maintenance downtime costs were $5 million higher in the 2016 first quarter which included an outage at the Augusta mill compared with the 2015 fourth quarter which had an outage at the Texarkana mill. Input costs were flat.
Compared with the
first
quarter of
2015
, sales volumes in the
first
quarter of
2016
were lower primarily due to the absence of the coated bristols product line. The business took 13,000 tons of market related downtime in the first quarter of 2015. Average sales price realizations were lower due to competitive pressures. Average sales margins were also negatively affected by an unfavorable customer and product mix. Input costs were lower, primarily for energy and chemicals. Planned maintenance downtime costs were $4 million higher.
Foodservice sales volumes in the
first
quarter of
2016
were seasonally lower than in the
fourth
quarter of
2015
. Average sales prices decreased primarily due to the pass-through of lower resin costs. Average sales margins were also impacted by a favorable customer and product mix. Compared with the
first
quarter of
2015
, sales volumes in the
first
quarter of
2016
31
increased due to continued growth with major customers. Average sales margins decreased reflecting lower average sales price realizations. Operating costs were higher.
Looking forward to the
second
quarter of
2016
, coated paperboard sales volumes are expected to be stable. Average sales margins are expected to benefit from a more favorable mix. Planned maintenance downtime costs should be $19 million lower with no outages scheduled in the second quarter of 2016. Input costs are expected to be slightly lower, primarily for wood. Foodservice sales volumes are expected to be seasonally higher, and average sales margins are expected to increase due to a more favorable customer and product mix.
European Consumer Packaging
net sales were
$77 million
in the
first
quarter of
2016
compared with
$81 million
in the
fourth
quarter of
2015
and
$83 million
in the
first
quarter of
2015
. Operating profits in the
first
quarter of
2016
were
$26 million
compared with
$26 million
in the
fourth
quarter of
2015
and
$25 million
in the
first
quarter of
2015
.
Sales volumes in the
first
quarter of
2016
compared with the
fourth
quarter of
2015
were lower in both Europe and Russia. Average sales margins decreased in Europe, reflecting lower sales price realizations and a unfavorable mix, while in Russia average sale prices increased. Input costs were lower for energy and wood in Europe. Operating costs were lower in both Europe and Russia. Compared with the
first
quarter of
2015
, sales volumes decreased in both Europe and Russia. Average sales price realizations increased in Russia, but decreased in Europe. Input costs for energy and wood decreased in Europe, but increased in Russia.
Entering the
second
quarter of
2016
, sales volumes are expected to be higher. Average sales margins are expected to be slightly lower primarily reflecting an unfavorable mix. Planned maintenance downtime costs are expected to be $4 million higher with outages scheduled at the Svetogorsk and Kwidzyn mills. Input costs for wood are expected to be higher.
Asian Consumer Packaging
net sales were
$225 million
in the
first
quarter of
2015
. Operating profits were
$12 million
($0 million excluding a gain associated with the sale of the IP-Sun JV) in the
fourth
quarter of
2015
and a loss of
$1 million
in the
first
quarter of
2015
. The Company sold its 55% equity share in the IP-Sun JV in October 2015.
Equity Earnings, Net of Taxes – Ilim
Since October 2007, International Paper and Ilim Holding S.A. (Ilim) have operated a 50:50 joint venture in Russia. Ilim is a separate reportable industry segment. The Company recorded equity earnings, net of taxes, of
$62 million
in the
first
quarter of
2016
, compared with $34 million in the
fourth
quarter of
2015
and
$39 million
in the
first
quarter of
2015
. In the
first
quarter of
2016
, the after-tax foreign exchange impact primarily on the remeasurement of U.S. dollar-denominated net debt was a gain of $11 million compared with a loss of $19 million in the
fourth
quarter of
2015
. Compared with the
fourth
quarter of
2015
, sales volumes in the
first
quarter of
2016
were lower, primarily for sales of softwood and hardwood pulp in China and other export markets and sales of containerboard in the Russian domestic market. Average sales price realizations decreased, primarily for export sales of hardwood and softwood pulp. Costs for energy and distribution increased, but operating costs were lower.
Compared with the
first
quarter of
2015
, sales volumes in the
first
quarter of
2016
increased for sales of softwood and hardwood pulp to China and hardwood pulp and paper in the Russian domestic market, but were partially offset by decreased sales volumes of softwood pulp in the domestic market and to other export markets. Average sales price realizations were lower, primarily for export sales of softwood pulp. Input costs for wood, chemicals and distribution increased. Operating costs were flat. An after-tax foreign exchange loss of $18 million primarily on the remeasurement of U.S. dollar-denominated net debt was recorded in the first quarter of 2015.
Looking forward to the
second
quarter of
2016
, sales volumes are expected to be stable. Average sales price realizations are expected to decrease compared with the first quarter of 2016 primarily for export sales of hardwood pulp. Input costs are expected to be seasonally higher for wood and for distribution. Planned maintenance downtime costs are expected to be incurred in the second quarter of 2016 with outages scheduled at the Bratsk and Koyazhma mills.
LIQUIDITY AND CAPITAL RESOURCES
Cash provided by operations totaled
$620 million
for the first
three
months of
2016
, compared with
$638 million
for the comparable
2015
three
-month period. Earnings from operations adjusted for non-cash charges were
$674 million
for the first
three
months of
2016
compared to
$794 million
for the first
three
months of
2015
. Cash used for working capital components totaled
$54 million
for the first
three
months of
2016
compared to
$156 million
for the comparable
2015
three
-month period.
The Company generated free cash flow of approximately
$311 million
and
$319 million
in the first
three
months of
2016
and
2015
, respectively. Free cash flow is a non-GAAP measure and the most comparable GAAP measure is cash provided by operations. Management uses free cash flow as a liquidity metric because it measures the amount of cash generated that is available to maintain our assets, make investments or acquisitions, pay dividends, reduce debt, and fund other activities.
32
The following is a reconciliation of free cash flow to cash provided by operations:
|
|
Three Months Ended
March 31, |
||||||
|
In millions
|
2016
|
2015
|
|||||
|
Cash provided by operations
|
$
|
620
|
|
$
|
638
|
|
|
|
Adjustments:
|
|||||||
|
Cash invested in capital projects
|
(309
|
)
|
(319
|
)
|
|||
|
Free Cash Flow
|
$
|
311
|
|
$
|
319
|
|
|
Investments in capital projects totaled
$309 million
in the first
three
months of
2016
compared to
$319 million
in the first
three
months of
2015
. Full-year
2016
capital spending is currently expected to be approximately $1.3 billion, or about 100% of depreciation and amortization expense for our current businesses.
Amounts related to early debt extinguishment during the
three
months ended
March 31, 2016
and
2015
were as follows:
|
|
Three Months Ended
March 31, |
||||||
|
In millions
|
2016
|
2015
|
|||||
|
Early debt reductions (a)
|
$
|
—
|
|
$
|
217
|
|
|
|
Pre-tax early debt extinguishment costs
|
—
|
|
1
|
|
|||
|
(a)
|
Reductions related to notes with interest rates ranging from
5.30%
to
6.25%
with original maturities from
2015
to
2025
for the
three
months ended March 31,
2015
.
|
Financing activities for the first
three
months of
2016
included a
$145 million
net increase in debt versus a
$240 million
net decrease in debt during the comparable
2015
three
-month period.
During the first
three
months of
2016
, International Paper used
2.7 million
shares of treasury stock for various incentive plans. International Paper also acquired
3.6 million
shares of treasury stock, including shares for the payment of restricted stock tax withholding. Repurchases of common stock and payments of restricted stock withholding taxes totaled
$131.0 million
, including
$100.1 million
related to shares repurchased under the Company's share repurchase program. In September 2013, the Company announced a share repurchase program to acquire up to $1.5 billion of the Company's common stock over the next two to three years in open market repurchase transactions. In addition, in July 2014, the Company announced that it would acquire up to $1.5 billion of additional shares of the Company's common stock to supplement the $1.5 billion share repurchase program authorized in September 2013 and intends to continue to repurchase such shares in open market repurchase transactions. The Company has repurchased
44.6 million
shares at an average price of $46.40, for a total of approximately $2.1 billion, as of
March 31, 2016
.
During the first
three
months of
2015
, International Paper issued approximately 60,000 shares of common stock and used approximately
4.2 million
shares of treasury stock for various incentive plans, including stock option exercises that generated approximately
$2 million
of cash. International Paper also acquired
2.6 million
shares of treasury stock, including restricted stock tax withholding. Repurchases of common stock and payments of restricted stock withholding taxes totaled
$141 million
, including
$59 million
related to shares repurchased under the Company's share repurchase program. Cash dividend payments related to common stock totaled
$181 million
and
$169 million
for the first
three
months of
2016
and
2015
, respectively. Dividends were
$0.4400
per share and
$0.4000
per share for the first
three
months in
2016
and
2015
, respectively.
At
March 31, 2016
, contractual obligations for future payments of debt maturities by calendar year were as follows:
$533 million
in 2016;
$53 million
in 2017;
$784 million
in 2018;
$413 million
in 2019;
$176 million
in 2020;
$640 million
in 2021; and
$6.8 billion
thereafter.
Maintaining an investment-grade credit rating is an important element of International Paper’s financing strategy. At
March 31, 2016
, the Company held long-term credit ratings of BBB (stable outlook) and Baa2 (stable outlook) by S&P and Moody’s, respectively.
At
March 31, 2016
, International Paper’s credit agreements totaled
$2.1 billion
, which management believes are adequate to cover expected operating cash flow variability during the current economic cycle. The credit agreements generally provide for interest rates at a floating rate index plus a pre-determined margin dependent upon International Paper’s credit rating. The liquidity facilities include a
$1.5 billion
contractually committed bank credit agreement that expires in August 2019 and has a facility fee of 0.15% payable annually. The liquidity facilities also include up to
$600 million
of uncommitted commercial paper-based financings based on eligible receivable balances (
$385 million
available at
March 31, 2016
) under a receivables securitization program that expires in December 2016. Subsequent to March 31, 2016, International Paper entered into a
$250 million
contractually committed bank credit facility that expires on
December 31, 2016
and has a facility fee of
0.15%
payable
33
quarterly. In April 2016, the Company borrowed $230 million on the bank credit facility. The proceeds from this borrowing were used to pay off $261 million of debt maturing in April 2016.
International Paper expects to be able to meet projected capital expenditures, service existing debt and meet working capital and dividend requirements during
2016
with current cash balances and cash from operations, supplemented as required by its existing credit facilities. The Company will continue to rely on debt and capital markets for the majority of any necessary long-term funding not provided by operating cash flows. Funding decisions will be guided by our capital structure planning objectives. The primary goals of the Company’s capital structure planning are to maximize financial flexibility and preserve liquidity while reducing interest expense. The majority of International Paper’s debt is accessed through global public capital markets where we have a wide base of investors.
Acquisitions and Joint Ventures
See discussion in Note 7 to the financial statements.
Ilim Holding S.A. Shareholders’ Agreement
In October 2007, in connection with the formation of the Ilim Holding S.A. joint venture, International Paper entered into a shareholder’s agreement that includes provisions relating to the reconciliation of disputes among the partners. This agreement was amended May 7, 2014. Pursuant to the amended agreement, beginning on January 1, 2017, either the Company or its partners may commence certain procedures specified under the deadlock provisions. If these or any other deadlock procedures are commenced, although it is not obligated to do so, the Company may in certain situations, choose to purchase its partners' 50% interest in Ilim. Any such transaction would be subject to review and approval by Russian and other relevant anti-trust authorities. The purchase of Ilim's 50% interest by International Paper would result in the consolidation of Ilim's financial position and results of operations in all subsequent periods.
CRITICAL ACCOUNTING POLICIES AND SIGNIFICANT ACCOUNTING ESTIMATES
The preparation of financial statements in conformity with accounting principles generally accepted in the United States requires International Paper to establish accounting policies and to make estimates that affect both the amounts and timing of the recording of assets, liabilities, revenues and expenses. Some of these estimates require judgments about matters that are inherently uncertain.
Accounting policies whose application may have a significant effect on the reported results of operations and financial position of International Paper, and that can require judgments by management that affect their application, include accounting for contingencies, impairment or disposal of long-lived assets, goodwill and other intangible assets, pensions, postretirement benefits other than pensions, stock options and income taxes.
The Company has included in its
2015
Form 10-K a discussion of these critical accounting policies, which are important to the portrayal of the Company’s financial condition and results of operations and require management’s judgments. The Company has not made any changes in these critical accounting policies during the first
three
months of
2016
.
Pension Accounting
Net pension expense totaled approximately
$91 million
for International Paper’s U.S. plans for the
three
months ended
March 31, 2016
, or about
$31 million
less than the pension expense for the first
three
months of
2015
. The decrease in U.S. plan expense was due to an increase in the assumed discount rate to
4.40%
in
2016
from
4.10%
in
2015
, updated demographic assumptions, and lower amortization of unrecognized actuarial losses. Net pension expense for non-U.S. plans was about
$1 million
and
$2 million
for the first
three
months of
2016
and
2015
, respectively.
After consultation with our actuaries, International Paper determines key actuarial assumptions on December 31 of each year that are used to calculate liability information as of that date and pension expense for the following year. Key assumptions affecting pension expense include the discount rate, the expected long-term rate of return on plan assets, the projected rate of future compensation increases, and various demographic assumptions including expected mortality. The discount rate assumption is determined based on approximately 500 Aa-rated bonds appropriate to provide the projected benefit payments of the plan. A bond portfolio is selected and a single rate is determined that equates the market value of the bonds purchased to the discounted value of the plan’s benefit payments. The expected long-term rate of return on plan assets is based on projected rates of return for current and planned asset classes in the plan’s investment portfolio. At
March 31, 2016
, the market value of plan assets for International Paper’s U.S. plans totaled approximately
$10.9 billion
, consisting of approximately
44%
equity securities,
37%
fixed income securities, and
19%
real estate and other assets. Plan assets did not include International Paper common stock.
In the first quarter of 2016, International Paper announced a voluntary, limited-time opportunity for former employees who are participants in the Retirement Plan of International Paper Company (the Pension Plan) to request early payment of their entire Pension Plan benefit in the form of a single lump sum payment. Eligible participants who wished to receive the lump sum
34
payment were required to make an election between February 29 and April 29, 2016, and payment is scheduled to be made on or before June 30, 2016. All payments will be made from the Pension Plan trust assets. The target population has a total liability of
$3 billion
. Based upon the participation rate of eligible participants, the amount of total payments is expected to be approximately
$1.2 billion
. Because of the expected level of payments, settlement accounting rules will apply in the period in which the payments are made. This will result in a plan remeasurement and the recognition in earnings of a pro-rata portion of unamortized net actuarial loss in the second quarter of 2016.
The Company’s funding policy for its qualified pension plans is to contribute amounts sufficient to meet legal funding requirements, plus any additional amounts that the Company may determine to be appropriate considering the funded status of the plans, tax deductibility, the cash flow generated by the Company, and other factors. The U.S. nonqualified plans are only funded to the extent of benefits paid which are expected to be
$22 million
in
2016
.
FORWARD-LOOKING STATEMENTS
Certain statements in this Quarterly Report on Form 10-Q that are not historical in nature may be considered “forward-looking” statements within the meaning of the Private Securities Litigation Reform Act of 1995. These statements are often identified by the words, “will,” “may,” “should,” “continue,” “anticipate,” “believe,” “expect,” “plan,” “appear,” “project,” “estimate,” “intend,” and words of a similar nature. These statements are not guarantees of future performance and reflect management’s current views with respect to future events, which are subject to risks and uncertainties that could cause actual results to differ materially from those expressed or implied in these statements. Factors which could cause actual results to differ include but are not limited to: (i) the level of our indebtedness and changes in interest rates; (ii) industry conditions, including but not limited to changes in the cost or availability of raw materials, energy and transportation costs, competition we face, cyclicality and changes in consumer preferences, demand and pricing for our products; (iii) global economic conditions and political changes, including but not limited to the impairment of financial institutions, changes in currency exchange rates, credit ratings issued by recognized credit rating organizations, the amount of our future pension funding obligation, changes in tax laws and pension and health care costs; (iv) unanticipated expenditures related to the cost of compliance with existing and new environmental and other governmental regulations and to actual or potential litigation; (v) whether we experience a material disruption at one of our manufacturing facilities; (vi) risks inherent in conducting business through a joint venture; (vii) the successful closing of the sale of our corrugated box business in China and Southeast Asia within the estimated timeframe; (viii)the receipt of governmental and other approvals and favorable rulings associated with the purchase of the pulp business of Weyerhaeuser Company and the successful fulfillment or waiver of all closing conditions for the transaction without unexpected delays or conditions; (ix) the failure to realize anticipated synergies and cost savings from the acquisition of the pulp business of Weyerhaeuser Company or delay in realization thereof; (x) our ability to achieve the benefits we expect from all strategic acquisitions, divestitures and restructurings; and (xi) other factors you can find in our press releases and filings with the Securities and Exchange Commission, including the risk factors identified in Item 1A of Part I of the Company’s Annual Report on Form 10-K for the fiscal year ended
December 31, 2015
, as updated in Item 1A of Part II of this Quarterly Report on Form 10-Q ("Risk Factors"). We undertake no obligation to publicly update any forward-looking statements, whether as a result of new information, future events or otherwise. All financial information and statistical measures regarding our 50/50 Ilim joint venture in Russia (“Ilim”), other than historical International Paper Equity Earnings and dividends received by International Paper, have been prepared by the management of Ilim. Ilim management has indicated that the financial information was prepared in accordance with International Financial Reporting Standards and extracted from Ilim’s financial statements, but International Paper has not verified or audited any of this information. Any projected financial information and statistical measures reflect the current views of Ilim management and are subject to risks and uncertainties that could cause actual results to differ materially from those expressed or implied by such projections.
35
|
ITEM 3.
|
QUANTITATIVE AND QUALITATIVE DISCLOSURES ABOUT MARKET RISK
|
Information relating to quantitative and qualitative disclosures about market risk is shown on page 39 of International Paper’s 2015 Form 10-K, which information is incorporated herein by reference. There have been no material changes in the Company’s exposure to market risk since
December 31, 2015
.
|
ITEM 4.
|
CONTROLS AND PROCEDURES
|
Evaluation of Disclosure Controls and Procedures:
Disclosure controls and procedures are controls and other procedures that are designed to ensure that information required to be disclosed in our reports filed or submitted under the Securities Exchange Act of 1934, as amended (Exchange Act), is recorded, processed, summarized and reported (and accumulated and communicated to management, including our Chief Executive Officer and Chief Financial Officer, to allow timely decisions regarding required disclosure) within the time periods specified in the Securities and Exchange Commission’s rules and forms. As of the end of the period covered by this report, we conducted an evaluation, under the supervision and with the participation of our management, including the Chief Executive Officer and Chief Financial Officer, of the effectiveness of our disclosure controls and procedures pursuant to Rules 13a-15 and 15d-15 of the Exchange Act. Based upon that evaluation, our Chief Executive Officer and Chief Financial Officer concluded that the Company’s disclosure controls and procedures were effective as of
March 31, 2016
(the end of the period covered by this report).
Changes in Internal Control over Financial Reporting:
There have been no changes in our internal control over financial reporting during the quarter ended
March 31, 2016
that have materially affected, or are reasonably likely to materially affect, our internal control over financial reporting.
36
|
ITEM 1.
|
LEGAL PROCEEDINGS
|
A discussion of material developments in the Company’s litigation matters occurring in the period covered by this report is found in Note 12 to the financial statements in this Form 10-Q.
|
ITEM 1A.
|
RISK FACTORS
|
Our proposed acquisition of Weyerhaeuser’s pulp business may not be completed within the expected timeframe, or at all, and we may not achieve the expected benefits from this acquisition or from other strategic acquisitions, joint ventures, divestitures and other corporate transactions.
On May 1, 2016, we entered into an agreement to purchase the pulp business of Weyerhaeuser Company for $2.2 billion in cash, subject to certain adjustments. The acquisition is expected to close in the fourth quarter of 2016. Completion of the acquisition is subject to the satisfaction or waiver of certain conditions that are beyond our control and may prevent, delay or otherwise negatively affect its completion. These conditions include U.S. antitrust clearance. The Antitrust Division of the U.S. Department of Justice or other regulatory agencies may refuse to approve the acquisition or seek to make its approval subject to compliance with unanticipated or onerous conditions that could reduce the anticipated benefits of the acquisition. We intend to finance the purchase price of the acquisition from available cash and borrowings under existing or new financing facilities, but no assurances can be given about the timing, availability or cost of such financing.
The success of the acquisition will depend, in part, on our ability to realize the anticipated synergies, cost savings and growth opportunities from integrating the acquired business with our existing businesses. The integration process may be complex, costly and time-consuming, and we may not accomplish the integration of the business smoothly, successfully or within the anticipated costs or timeframe. Potential integration risks include, among other things, our ability to successfully implement our business plan for the combined business, retain key customers, suppliers and employees, and retain and obtain required regulatory approvals, licenses and permits.
More broadly, our strategy for long-term growth, productivity and profitability depends, in part, on our ability to make prudent strategic acquisitions, joint ventures, divestitures and other corporate transactions and to realize the benefits we expect from them.
Otherwise, there have been no material changes from the risk factors disclosed in our Annual Report on Form 10-K for the fiscal year ended December 31, 2015 (Part I, Item 1A).
|
ITEM 2.
|
UNREGISTERED SALES OF EQUITY SECURITIES AND USE OF PROCEEDS
|
PURCHASES OF EQUITY SECURITIES BY THE ISSUER AND AFFILIATED PURCHASERS.
|
Period
|
Total Number of Shares Purchased (a)
|
Average Price Paid per Share
|
Total Number of Shares Purchased as Part of a Publicly Announced Plan or Program
|
Maximum Number (or Approximate Dollar Value) of Shares that May Yet Be Purchased Under the Plans or Programs (in millions)
|
||||
|
January 1, 2016 - January 31, 2016
|
2,725,333
|
|
$36.71
|
2,725,124
|
|
$933
|
||
|
February 1, 2016 - February 29, 2016
|
893,684
|
|
34.97
|
|
—
|
|
933
|
|
|
March 1, 2016 - March 31, 2016
|
2,984
|
|
35.60
|
|
—
|
|
933
|
|
|
Total
|
3,622,001
|
|
||||||
|
(a)
|
896,877 shares were acquired from employees from share withholdings to pay income taxes under the Company's restricted stock programs. The remainder were purchased under a share repurchase program that was approved by our Board of Directors and announced on July 8, 2014. Through this program, which does not have an expiration date, we were authorized to purchase, in open market transactions (including block trades), privately negotiated transactions or otherwise, up to $1.5 billion of shares of our common stock.
|
37
|
ITEM 6.
|
EXHIBITS
|
|
11
|
|
Statement of Computation of Per Share Earnings.
|
|
12
|
|
Computation of Ratio of Earnings to Fixed Charges and Preferred Stock Dividends.
|
|
31.1
|
|
Certification of principal executive officer pursuant to Section 302 of the Sarbanes-Oxley Act of 2002.
|
|
31.2
|
|
Certification of principal financial officer pursuant to Section 302 of the Sarbanes-Oxley Act of 2002.
|
|
32
|
|
Certification pursuant to 18 U.S.C. Section 1350, as adopted pursuant to Section 906 of the Sarbanes-Oxley Act of 2002.
|
|
101.INS
|
|
XBRL Instance Document.
|
|
101.SCH
|
|
XBRL Taxonomy Extension Schema.
|
|
101.CAL
|
|
XBRL Taxonomy Extension Calculation Linkbase.
|
|
101.DEF
|
|
XBRL Taxonomy Extension Definition Linkbase.
|
|
101.LAB
|
|
XBRL Taxonomy Extension Label Linkbase.
|
|
101.PRE
|
|
XBRL Extension Presentation Linkbase.
|
38
SIGNATURES
Pursuant to the requirements of the Securities Exchange Act of 1934, the registrant has duly caused this report to be signed on its behalf by the undersigned thereunto duly authorized.
|
INTERNATIONAL PAPER COMPANY
(Registrant)
|
||
|
May 5, 2016
|
By
|
/s/ Carol L. Roberts
|
|
Carol L. Roberts
|
||
|
Senior Vice President and Chief
Financial Officer
|
||
|
May 5, 2016
|
By
|
/s/ Terri L. Herrington
|
|
Terri L. Herrington
|
||
|
Vice President – Finance and Controller
|
||
39
TABLE OF CONTENTS
Part I. Financial InformationItem 1. Financial StatementsNote 1 - Basis Of PresentationNote 2 - Recent Accounting DevelopmentsNote 3 - EquityNote 4 - Other Comprehensive IncomeNote 5 - Earnings Per Share Attributable To International Paper Company Common ShareholdersNote 6 - Restructuring and Other ChargesNote 7 - AcquisitionsNote 8 - Divestitures / SpinoffNote 9 - Supplemental Financial Statement InformationNote 10 - Goodwill and Other IntangiblesNote 11 - Income TaxesNote 12 - Commitments and ContingenciesNote 13 - Variable Interest Entities and Preferred Securities Of SubsidiariesNote 14 - DebtNote 15 - Derivatives and Hedging ActivitiesNote 16 - Retirement PlansNote 17 - Stock-based CompensationNote 18 - Industry Segment InformationNote 19 - Subsequent EventItem 2. Management S Discussion and Analysis Of Financial Condition and Results Of OperationsItem 3. Quantitative and Qualitative Disclosures About Market RiskItem 4. Controls and ProceduresPart II. Other InformationItem 1. Legal ProceedingsItem 1A. Risk FactorsItem 2. Unregistered Sales Of Equity Securities and Use Of ProceedsItem 6. Exhibits