INTERNATIONAL PAPER CO /NEW/
10-Ks and 10-Qs
|
|
|
|
|
|
|
|
|
|
|
|
|
|
|
|
|
|
|
|
|
|
|
|
|
|
|
|
|
|
|
|
|
|
|
|
|
|
|
|
|
|
|
|
|
|
|
|
|
|
|
|
|
|
|
|
|
|
|
UNITED STATES
SECURITIES AND EXCHANGE COMMISSION
WASHINGTON, D.C. 20549
FORM
10-Q
For the Quarterly Period Ended
June 30, 2021
For the Transition Period From to
_________________________________________
Commission File Number
001-03157
(Exact name of registrant as specified in its charter)
|
|
|
||||
|
(State or other jurisdiction
of incorporation)
|
(I.R.S. Employer
Identification No.)
|
||||
|
|
|
||||
|
(Address of Principal Executive Offices)
|
(Zip Code)
|
||||
Registrant’s telephone number, including area code: (
901
)
419-7000
Securities registered pursuant to Section 12(b) of the Act:
| Title of each class | Trading Symbol(s) | Name of each exchange on which registered | ||||||
|
|
|
|
||||||
Indicate by check mark whether the registrant (1) has filed all reports required to be filed by Section 13 or 15(d) of the Securities Exchange Act of 1934 during the preceding 12 months (or for such shorter period that the registrant was required to file such reports), and (2) has been subject to such filing requirements for the past 90 days.
Yes
☒ No
¨
Indicate by check mark whether the registrant has submitted electronically every Interactive Data File required to be submitted pursuant to Rule 405 of Regulation S-T (paragraph 232.405 of this chapter) during the preceding 12 months (or for such shorter period that the registrant was required to submit such files).
Yes
☒ No
¨
Indicate by check mark whether the registrant is a large accelerated filer, an accelerated filer, a non-accelerated filer, a smaller reporting company or an emerging growth company. See the definitions of “large accelerated filer,” “accelerated filer,” “smaller reporting company,” and "emerging growth company" in Rule 12b-2 of the Exchange Act.
|
|
☒ | Accelerated filer | ☐ | ||||||||
| Non-accelerated filer | ☐ | Smaller reporting company |
|
||||||||
| Emerging growth company |
|
||||||||||
If an emerging growth company, indicate by check mark if the registrant has elected not to use the extended transition period for complying with any new or revised financial accounting standards provided pursuant to Section 13 (a) of the Exchange
Act.
¨
Indicate by check mark whether the registrant is a shell company (as defined in Rule 12b-2 of the Exchange Act). Yes
☐
No ☒
The number of shares outstanding of the registrant’s common stock, par value $1.00 per share, as of July 23, 2021 was
390,834,614
.
INDEX
| PAGE NO. | ||||||||
| Condensed Consolidated Statement of Operations - Three Months and Six Months Ended June 30, 2021 and 2020 | ||||||||
| Condensed Consolidated Statement of Comprehensive Income - Three Months and Six Months Ended June 30, 2021 and 2020 | ||||||||
| Condensed Consolidated Balance Sheet - June 30 2021 and December 31, 2020 | ||||||||
| Condensed Consolidated Statement of Cash Flows - Six Months Ended June 30, 2021 and 2020 | ||||||||
ITEM 1.
FINANCIAL STATEMENTS
INTERNATIONAL PAPER COMPANY
(Unaudited)
(In millions, except per share amounts)
|
Three Months Ended
June 30, |
Six Months Ended
June 30, |
||||||||||||||||||||||
| 2021 | 2020 | 2021 | 2020 | ||||||||||||||||||||
| Net Sales | $ |
|
$ |
|
$ |
|
$ |
|
|||||||||||||||
| Costs and Expenses | |||||||||||||||||||||||
| Cost of products sold |
|
|
|
|
|||||||||||||||||||
| Selling and administrative expenses |
|
|
|
|
|||||||||||||||||||
| Depreciation, amortization and cost of timber harvested |
|
|
|
|
|||||||||||||||||||
| Distribution expenses |
|
|
|
|
|||||||||||||||||||
| Taxes other than payroll and income taxes |
|
|
|
|
|||||||||||||||||||
| Restructuring and other charges, net |
|
|
|
|
|||||||||||||||||||
| Net (gains) losses on sales and impairments of businesses |
(
|
|
(
|
|
|||||||||||||||||||
| Net (gains) losses on sales of equity method investments |
(
|
|
(
|
(
|
|||||||||||||||||||
| Interest expense, net |
|
|
|
|
|||||||||||||||||||
| Non-operating pension expense (income) |
(
|
(
|
(
|
(
|
|||||||||||||||||||
| Earnings (Loss) Before Income Taxes and Equity Earnings |
|
|
|
|
|||||||||||||||||||
| Income tax provision (benefit) |
|
|
|
|
|||||||||||||||||||
| Equity earnings (loss), net of taxes |
|
|
|
|
|||||||||||||||||||
| Net Earnings (Loss) | $ |
|
$ |
|
$ |
|
$ |
|
|||||||||||||||
| Less: Net earnings (loss) attributable to noncontrolling interests |
|
|
|
|
|||||||||||||||||||
| Net Earnings (Loss) Attributable to International Paper Company | $ |
|
$ |
|
$ |
|
$ |
|
|||||||||||||||
| Basic Earnings (Loss) Per Share Attributable to International Paper Company Common Shareholders | |||||||||||||||||||||||
| Net earnings (loss) | $ |
|
$ |
|
$ |
|
$ |
|
|||||||||||||||
| Diluted Earnings (Loss) Per Share Attributable to International Paper Company Common Shareholders | |||||||||||||||||||||||
| Net earnings (loss) | $ |
|
$ |
|
$ |
|
$ |
|
|||||||||||||||
| Average Shares of Common Stock Outstanding – assuming dilution |
|
|
|
|
|||||||||||||||||||
The accompanying notes are an integral part of these condensed financial statements.
1
INTERNATIONAL PAPER COMPANY
(Unaudited)
(In millions)
|
Three Months Ended
June 30, |
Six Months Ended
June 30, |
||||||||||||||||||||||
| 2021 | 2020 | 2021 | 2020 | ||||||||||||||||||||
| Net Earnings (Loss) | $ |
|
$ |
|
$ |
|
$ |
|
|||||||||||||||
| Other Comprehensive Income (Loss), Net of Tax: | |||||||||||||||||||||||
| Amortization of pension and post-retirement prior service costs and net loss: | |||||||||||||||||||||||
| U.S. plans |
|
|
|
|
|||||||||||||||||||
| Pension and postretirement liability adjustments: | |||||||||||||||||||||||
| Non-U.S. plans |
|
|
|
|
|||||||||||||||||||
| Change in cumulative foreign currency translation adjustment |
|
|
|
(
|
|||||||||||||||||||
| Net gains/losses on cash flow hedging derivatives: | |||||||||||||||||||||||
| Net gains (losses) arising during the period |
|
|
|
(
|
|||||||||||||||||||
| Reclassification adjustment for (gains) losses included in net earnings (loss) |
(
|
|
(
|
|
|||||||||||||||||||
| Total Other Comprehensive Income (Loss), Net of Tax |
|
|
|
(
|
|||||||||||||||||||
| Comprehensive Income (Loss) |
|
|
|
(
|
|||||||||||||||||||
| Net (earnings) loss attributable to noncontrolling interests |
(
|
|
(
|
|
|||||||||||||||||||
| Other comprehensive (income) loss attributable to noncontrolling interests |
|
|
|
|
|||||||||||||||||||
| Comprehensive Income (Loss) Attributable to International Paper Company | $ |
|
$ |
|
$ |
|
$ |
(
|
|||||||||||||||
The accompanying notes are an integral part of these condensed financial statements.
2
INTERNATIONAL PAPER COMPANY
(In millions)
|
June 30,
2021 |
December 31,
2020 |
||||||||||
| (unaudited) | |||||||||||
| Assets | |||||||||||
| Current Assets | |||||||||||
| Cash and temporary investments | $ |
|
$ |
|
|||||||
| Accounts and notes receivable, net |
|
|
|||||||||
| Contract assets |
|
|
|||||||||
| Inventories |
|
|
|||||||||
| Current financial assets of variable interest entities (Note 16) |
|
|
|||||||||
| Assets held for sale |
|
|
|||||||||
| Other current assets |
|
|
|||||||||
| Total Current Assets |
|
|
|||||||||
| Plants, Properties and Equipment, net |
|
|
|||||||||
| Forestlands |
|
|
|||||||||
| Investments |
|
|
|||||||||
| Long-Term Financial Assets of Variable Interest Entities (Note 16) |
|
|
|||||||||
| Goodwill |
|
|
|||||||||
| Right of Use Assets |
|
|
|||||||||
| Deferred Charges and Other Assets |
|
|
|||||||||
| Total Assets | $ |
|
$ |
|
|||||||
| Liabilities and Equity | |||||||||||
| Current Liabilities | |||||||||||
| Notes payable and current maturities of long-term debt | $ |
|
$ |
|
|||||||
| Current nonrecourse financial liabilities of variable interest entities (Note 16) |
|
|
|||||||||
| Accounts payable |
|
|
|||||||||
| Accrued payroll and benefits |
|
|
|||||||||
| Liabilities held for sale |
|
|
|||||||||
| Other current liabilities |
|
|
|||||||||
| Total Current Liabilities |
|
|
|||||||||
| Long-Term Debt |
|
|
|||||||||
| Long-Term Nonrecourse Financial Liabilities of Variable Interest Entities (Note 16) |
|
|
|||||||||
| Deferred Income Taxes |
|
|
|||||||||
| Pension Benefit Obligation |
|
|
|||||||||
| Postretirement and Postemployment Benefit Obligation |
|
|
|||||||||
| Long-Term Lease Obligations |
|
|
|||||||||
| Other Liabilities |
|
|
|||||||||
| Equity | |||||||||||
|
Common stock, $
|
|
|
|||||||||
| Paid-in capital |
|
|
|||||||||
| Retained earnings |
|
|
|||||||||
| Accumulated other comprehensive loss |
(
|
(
|
|||||||||
|
|
|
||||||||||
|
Less: Common stock held in treasury, at cost, 2021 –
|
|
|
|||||||||
| Total International Paper Shareholders’ Equity |
|
|
|||||||||
| Noncontrolling interests |
|
|
|||||||||
| Total Equity |
|
|
|||||||||
| Total Liabilities and Equity | $ |
|
$ |
|
|||||||
The accompanying notes are an integral part of these condensed financial statements.
3
INTERNATIONAL PAPER COMPANY
(Unaudited)
(In millions)
|
Six Months Ended
June 30, |
|||||||||||
| 2021 | 2020 | ||||||||||
| Operating Activities | |||||||||||
| Net earnings (loss) | $ |
|
$ |
|
|||||||
| Depreciation, amortization and cost of timber harvested |
|
|
|||||||||
| Deferred income tax provision (benefit), net |
|
|
|||||||||
| Restructuring and other charges, net |
|
|
|||||||||
| Net (gains) losses on sales of equity method investments |
(
|
(
|
|||||||||
| Net (gains) losses on sales and impairments of businesses |
(
|
|
|||||||||
| Equity method dividends received |
|
|
|||||||||
| Equity (earnings) losses, net |
(
|
(
|
|||||||||
| Periodic pension (income) expense, net |
(
|
|
|||||||||
| Other, net |
|
|
|||||||||
| Changes in current assets and liabilities | |||||||||||
| Accounts and notes receivable |
(
|
|
|||||||||
| Contract assets |
(
|
(
|
|||||||||
| Inventories |
|
|
|||||||||
| Accounts payable and accrued liabilities |
|
(
|
|||||||||
| Interest payable |
(
|
|
|||||||||
| Other |
(
|
|
|||||||||
| Cash Provided By (Used For) Operations |
|
|
|||||||||
| Investment Activities | |||||||||||
| Invested in capital projects, net of insurance recoveries |
(
|
(
|
|||||||||
| Acquisitions, net of cash acquired |
(
|
(
|
|||||||||
| Proceeds from sales of equity method investments |
|
|
|||||||||
| Proceeds from sales of businesses, net of cash divested |
|
|
|||||||||
| Proceeds from sale of fixed assets |
|
|
|||||||||
| Other |
(
|
|
|||||||||
| Cash Provided By (Used For) Investment Activities |
|
(
|
|||||||||
| Financing Activities | |||||||||||
| Repurchases of common stock and payments of restricted stock tax withholding |
(
|
(
|
|||||||||
| Issuance of debt |
|
|
|||||||||
| Reduction of debt |
(
|
(
|
|||||||||
| Change in book overdrafts |
|
(
|
|||||||||
| Dividends paid |
(
|
(
|
|||||||||
| Net debt tender premiums paid |
(
|
(
|
|||||||||
| Other |
(
|
|
|||||||||
| Cash Provided By (Used For) Financing Activities |
(
|
(
|
|||||||||
| Cash Included in Assets Held for Sale |
(
|
(
|
|||||||||
| Effect of Exchange Rate Changes on Cash |
|
(
|
|||||||||
| Change in Cash and Temporary Investments |
|
|
|||||||||
| Cash and Temporary Investments | |||||||||||
| Beginning of period |
|
|
|||||||||
| End of period | $ |
|
$ |
|
|||||||
The accompanying notes are an integral part of these condensed financial statements.
4
INTERNATIONAL PAPER COMPANY
(Unaudited)
The accompanying unaudited condensed financial statements have been prepared in conformity with accounting principles generally accepted in the United States and in accordance with the instructions to Form 10-Q and, in the opinion of management, include all adjustments that are necessary for the fair presentation of International Paper Company’s (International Paper’s, the Company’s or our) financial position, results of operations, and cash flows for the interim periods presented. Except as disclosed herein, such adjustments are of a normal, recurring nature. Results for the first six months of the year may not necessarily be indicative of full year results. It is suggested that these condensed financial statements be read in conjunction with the audited financial statements and the notes thereto included in the Company’s Annual Report on Form 10-K for the year ended December 31, 2020, which have previously been filed with the Securities and Exchange Commission.
On March 11, 2020 the World Health Organization (WHO) declared the novel strain of coronavirus (COVID-19) a global pandemic and recommended containment and mitigation measures worldwide. Many of these restrictive measures have been lifted or reduced as the number of COVID-19 cases has declined in the United States and various other countries in comparison to earlier levels at the height of the pandemic, and economic conditions have improved. In addition, most of our manufacturing and converting facilities have remained open and operational during the pandemic and at the current time our manufacturing and converting facilities are generally operational.
The pandemic has had a mixed impact on demand for our products. Demand for printing papers products initially was significantly impacted by the pandemic, but has seen a steady increase over the first half of 2021. Demand for our pulp, containerboard and corrugated box products has not been negatively impacted and in some cases has been positively impacted by COVID-19 to date. However, all of our operations have experienced higher supply chain costs and constrained transportation due in part to the impacts of COVID-19.
There continue to be significant uncertainties associated with the COVID-19 pandemic, including with respect to the various economic reopening plans and the resurgence of new variants of the virus in many areas globally; additional actions that may be taken by governmental authorities and private businesses to attempt to contain the COVID-19 outbreak or to mitigate its impact; the efficacy and, availability of various vaccines and associated levels of vaccination, as well as the possibility that strains of the virus may be resistant to current available vaccines; and the impact of COVID-19 on unemployment, economic activity and consumer confidence. COVID-19 has significantly adversely affected portions of our business, and could have a material adverse effect on our financial condition, results of operations and cash flows if public health and/or global economic conditions deteriorate.
Recently Issued Accounting Pronouncements Not Yet Adopted
Reference Rate Reform
In March 2020, the FASB issued ASU 2020-04, "Reference Rate Reform (Topic 848): Facilitation of the Effects of Reference Rate Reform on Financial Reporting." This guidance provides companies with optional guidance to ease the potential accounting burden associated with transitioning away from reference rates that are expected to be discontinued. This guidance is effective upon issuance and generally can be applied through December 31, 2022. The Company is currently evaluating the provisions of this guidance.
Generally, the Company recognizes revenue on a point-in-time basis when the customer takes title to the goods and assumes the risks and rewards for the goods. For customized goods where the Company has a legally enforceable right to payment for the goods, the Company recognizes revenue over time which, generally, is as the goods are produced.
5
Disaggregated Revenue
A geographic disaggregation of revenues across our company segmentation in the following tables provides information to assist in evaluating the nature, timing and uncertainty of revenue and cash flows and how they may be impacted by economic factors.
| Three Months Ended June 30, 2021 | ||||||||||||||||||||||||||||||||
| In millions | Industrial Packaging | Global Cellulose Fibers | Printing Papers | Corporate and Inter-segment Sales | Total | |||||||||||||||||||||||||||
|
Primary Geographical Markets (a)
|
||||||||||||||||||||||||||||||||
| United States | $ |
|
$ |
|
$ |
|
$ |
|
$ |
|
||||||||||||||||||||||
| EMEA |
|
|
|
(
|
|
|||||||||||||||||||||||||||
| Pacific Rim and Asia |
|
|
|
|
|
|||||||||||||||||||||||||||
| Americas, other than U.S. |
|
|
|
|
|
|||||||||||||||||||||||||||
| Total | $ |
|
$ |
|
$ |
|
$ |
|
$ |
|
||||||||||||||||||||||
| Operating Segments | ||||||||||||||||||||||||||||||||
| North American Industrial Packaging | $ |
|
$ | — | $ | — | $ | — | $ |
|
||||||||||||||||||||||
| EMEA Industrial Packaging |
|
— | — | — |
|
|||||||||||||||||||||||||||
| European Coated Paperboard |
|
— | — | — |
|
|||||||||||||||||||||||||||
| Global Cellulose Fibers | — |
|
— | — |
|
|||||||||||||||||||||||||||
| North American Printing Papers | — | — |
|
— |
|
|||||||||||||||||||||||||||
| Brazilian Papers | — | — |
|
— |
|
|||||||||||||||||||||||||||
| European Papers | — | — |
|
— |
|
|||||||||||||||||||||||||||
| Intra-segment Eliminations |
(
|
— |
(
|
— |
(
|
|||||||||||||||||||||||||||
| Corporate & Inter-segment Sales | — | — | — |
|
|
|||||||||||||||||||||||||||
| Total | $ |
|
$ |
|
$ |
|
$ |
|
$ |
|
||||||||||||||||||||||
(a)
Net sales are attributed to countries based on the location of the seller.
6
| Six Months Ended June 30, 2021 | ||||||||||||||||||||||||||||||||
| In millions | Industrial Packaging | Global Cellulose Fibers | Printing Papers | Corporate and Inter-segment Sales | Total | |||||||||||||||||||||||||||
|
Primary Geographical Markets (a)
|
||||||||||||||||||||||||||||||||
| United States | $ |
|
$ |
|
$ |
|
$ |
|
$ |
|
||||||||||||||||||||||
| EMEA |
|
|
|
(
|
|
|||||||||||||||||||||||||||
| Pacific Rim and Asia |
|
|
|
|
|
|||||||||||||||||||||||||||
| Americas, other than U.S. |
|
|
|
|
|
|||||||||||||||||||||||||||
| Total | $ |
|
$ |
|
$ |
|
$ |
|
$ |
|
||||||||||||||||||||||
| Operating Segments | ||||||||||||||||||||||||||||||||
| North American Industrial Packaging | $ |
|
$ | — | $ | — | $ | — | $ |
|
||||||||||||||||||||||
| EMEA Industrial Packaging |
|
— | — | — |
|
|||||||||||||||||||||||||||
| European Coated Paperboard |
|
— | — | — |
|
|||||||||||||||||||||||||||
| Global Cellulose Fibers | — |
|
— | — |
|
|||||||||||||||||||||||||||
| North American Printing Papers | — | — |
|
— |
|
|||||||||||||||||||||||||||
| Brazilian Papers | — | — |
|
— |
|
|||||||||||||||||||||||||||
| European Papers | — | — |
|
— |
|
|||||||||||||||||||||||||||
| Intra-segment Eliminations |
(
|
— |
(
|
— |
(
|
|||||||||||||||||||||||||||
| Corporate & Inter-segment Sales | — | — | — |
|
|
|||||||||||||||||||||||||||
| Total | $ |
|
$ |
|
$ |
|
$ |
|
$ |
|
||||||||||||||||||||||
(a) Net sales are attributed to countries based on the location of the seller.
| Three Months Ended June 30, 2020 | ||||||||||||||||||||||||||||||||
| In millions | Industrial Packaging | Global Cellulose Fibers | Printing Papers | Corporate & Intersegment | Total | |||||||||||||||||||||||||||
|
Primary Geographical Markets
(a)
|
||||||||||||||||||||||||||||||||
| United States | $ |
|
$ |
|
$ |
|
$ |
|
$ |
|
||||||||||||||||||||||
| EMEA |
|
|
|
(
|
|
|||||||||||||||||||||||||||
| Pacific Rim and Asia |
|
|
|
|
|
|||||||||||||||||||||||||||
| Americas, other than U.S. |
|
|
|
|
|
|||||||||||||||||||||||||||
| Total | $ |
|
$ |
|
$ |
|
$ |
|
$ |
|
||||||||||||||||||||||
| Operating Segments | ||||||||||||||||||||||||||||||||
| North American Industrial Packaging | $ |
|
$ | — | $ | — | $ | — | $ |
|
||||||||||||||||||||||
| EMEA Industrial Packaging |
|
— | — | — |
|
|||||||||||||||||||||||||||
| Brazilian Industrial Packaging |
|
— | — | — |
|
|||||||||||||||||||||||||||
| European Coated Paperboard |
|
— | — | — |
|
|||||||||||||||||||||||||||
| Global Cellulose Fibers | — |
|
— | — |
|
|||||||||||||||||||||||||||
| North American Printing Papers | — | — |
|
— |
|
|||||||||||||||||||||||||||
| Brazilian Papers | — | — |
|
— |
|
|||||||||||||||||||||||||||
| European Papers | — | — |
|
— |
|
|||||||||||||||||||||||||||
| Intra-segment Eliminations |
(
|
— |
|
— |
(
|
|||||||||||||||||||||||||||
| Corporate & Inter-segment Sales | — | — | — |
|
|
|||||||||||||||||||||||||||
| Total | $ |
|
$ |
|
$ |
|
$ |
|
$ |
|
||||||||||||||||||||||
(a) Net sales are attributed to countries based on the location of the seller.
7
| Six Months Ended June 30, 2020 | ||||||||||||||||||||||||||||||||
| In millions | Industrial Packaging | Global Cellulose Fibers | Printing Papers | Corporate & Intersegment | Total | |||||||||||||||||||||||||||
|
Primary Geographical Markets
(a)
|
||||||||||||||||||||||||||||||||
| United States | $ |
|
$ |
|
$ |
|
$ |
|
$ |
|
||||||||||||||||||||||
| EMEA |
|
|
|
(
|
|
|||||||||||||||||||||||||||
| Pacific Rim and Asia |
|
|
|
|
|
|||||||||||||||||||||||||||
| Americas, other than U.S. |
|
|
|
(
|
|
|||||||||||||||||||||||||||
| Total | $ |
|
$ |
|
$ |
|
$ |
|
$ |
|
||||||||||||||||||||||
| Operating Segments | ||||||||||||||||||||||||||||||||
| North American Industrial Packaging | $ |
|
$ | — | $ | — | $ | — | $ |
|
||||||||||||||||||||||
| EMEA Industrial Packaging |
|
— | — | — |
|
|||||||||||||||||||||||||||
| Brazilian Industrial Packaging |
|
— | — | — |
|
|||||||||||||||||||||||||||
| European Coated Paperboard |
|
— | — | — |
|
|||||||||||||||||||||||||||
| Global Cellulose Fibers | — |
|
— | — |
|
|||||||||||||||||||||||||||
| North American Printing Papers | — | — |
|
— |
|
|||||||||||||||||||||||||||
| Brazilian Papers | — | — |
|
— |
|
|||||||||||||||||||||||||||
| European Papers | — | — |
|
— |
|
|||||||||||||||||||||||||||
| Intra-segment Eliminations |
(
|
— |
|
— |
(
|
|||||||||||||||||||||||||||
| Corporate & Inter-segment Sales | — | — | — |
|
|
|||||||||||||||||||||||||||
| Total | $ |
|
$ |
|
$ |
|
$ |
|
$ |
|
||||||||||||||||||||||
(a) Net sales are attributed to countries based on the location of the seller.
Revenue Contract Balances
A contract asset is created when the Company recognizes revenue on its customized products prior to having an unconditional right to payment from the customer, which generally does not occur until title and risk of loss passes to the customer.
A contract liability is created when customers prepay for goods prior to the Company transferring those goods to the customer. The contract liability is reduced once control of the goods is transferred to the customer. The majority of our customer prepayments are received during the fourth quarter each year for goods that will be transferred to customers over the following twelve months. Contract liabilities of $
35
million and $
31
million are included in Other current liabilities in the accompanying condensed consolidated balance sheet as of June 30, 2021 and December 31, 2020, respectively. During the second quarter of 2021, the Company also recorded a contract liability of $
115
million related to the April 2021 acquisition disclosed in Note 8.
The difference between the opening and closing balances of the Company's contract assets and contract liabilities primarily results from the difference between the price and quantity at comparable points in time for goods for which we have an unconditional right to payment or receive prepayment from the customer, respectively.
8
A summary of the changes in equity for the three months and six months ended June 30, 2021 and 2020 is provided below:
| Three Months Ended June 30, 2021 | |||||||||||||||||||||||||||||||||||||||||||||||
| In millions, except per share amounts | Common Stock Issued | Paid-in Capital | Retained Earnings | Accumulated Other Comprehensive Income (Loss) | Common Stock Held In Treasury, At Cost |
Total
International Paper Shareholders’ Equity |
Noncontrolling
Interests |
Total
Equity |
|||||||||||||||||||||||||||||||||||||||
| Balance, April 1 | $ |
|
$ |
|
$ |
|
$ |
(
|
$ |
|
$ |
|
$ |
|
$ |
|
|||||||||||||||||||||||||||||||
| Issuance of stock for various plans, net | — |
|
— | — |
(
|
|
— |
|
|||||||||||||||||||||||||||||||||||||||
| Repurchase of stock | — | — | — | — |
|
(
|
— |
(
|
|||||||||||||||||||||||||||||||||||||||
|
Common stock dividends
($
|
— | — |
(
|
— | — |
(
|
— |
(
|
|||||||||||||||||||||||||||||||||||||||
| Transactions of equity method investees | — |
|
— | — | — |
|
— |
|
|||||||||||||||||||||||||||||||||||||||
| Divestiture of noncontrolling interests | — | — | — | — | — |
|
(
|
(
|
|||||||||||||||||||||||||||||||||||||||
| Comprehensive income (loss) | — | — |
|
|
— |
|
|
|
|||||||||||||||||||||||||||||||||||||||
| Ending Balance, June 30 | $ |
|
$ |
|
$ |
|
$ |
(
|
$ |
|
$ |
|
$ |
|
$ |
|
|||||||||||||||||||||||||||||||
| Six Months Ended June 30, 2021 | |||||||||||||||||||||||||||||||||||||||||||||||
| In millions, except per share amounts | Common Stock Issued | Paid-in Capital | Retained Earnings | Accumulated Other Comprehensive Income (Loss) | Common Stock Held In Treasury, At Cost |
Total
International Paper Shareholders’ Equity |
Noncontrolling
Interests |
Total
Equity |
|||||||||||||||||||||||||||||||||||||||
| Balance, January 1 | $ |
|
$ |
|
$ |
|
$ |
(
|
$ |
|
$ |
|
$ |
|
$ |
|
|||||||||||||||||||||||||||||||
| Issuance of stock for various plans, net | — |
(
|
— | — |
(
|
|
— |
|
|||||||||||||||||||||||||||||||||||||||
| Repurchase of stock | — | — | — | — |
|
(
|
— |
(
|
|||||||||||||||||||||||||||||||||||||||
|
Common stock dividends
($
|
— | — |
(
|
— | — |
(
|
— |
(
|
|||||||||||||||||||||||||||||||||||||||
| Transactions of equity method investees | — |
|
— | — | — |
|
— |
|
|||||||||||||||||||||||||||||||||||||||
| Divestiture of noncontrolling interests | — | — | — | — | — |
|
(
|
(
|
|||||||||||||||||||||||||||||||||||||||
| Comprehensive income (loss) | — | — |
|
|
— |
|
|
|
|||||||||||||||||||||||||||||||||||||||
| Ending Balance, June 30 | $ |
|
$ |
|
$ |
|
$ |
(
|
$ |
|
$ |
|
$ |
|
$ |
|
|||||||||||||||||||||||||||||||
9
| Three Months Ended June 30, 2020 | |||||||||||||||||||||||||||||||||||||||||||||||
| In millions, except per share amounts | Common Stock Issued | Paid-in Capital | Retained Earnings | Accumulated Other Comprehensive Income (Loss) | Common Stock Held In Treasury, At Cost |
Total
International Paper Shareholders’ Equity |
Noncontrolling
Interests |
Total
Equity |
|||||||||||||||||||||||||||||||||||||||
| Balance, April 1 | $ |
|
$ |
|
$ |
|
$ |
(
|
$ |
|
$ |
|
$ |
|
$ |
|
|||||||||||||||||||||||||||||||
| Issuance of stock for various plans, net | — |
|
— | — |
(
|
|
— |
|
|||||||||||||||||||||||||||||||||||||||
|
Common stock dividends ($
|
— | — |
(
|
— | — |
(
|
— |
(
|
|||||||||||||||||||||||||||||||||||||||
| Transactions of equity method investees | — |
|
— | — | — |
|
— |
|
|||||||||||||||||||||||||||||||||||||||
| Comprehensive income (loss) | — | — |
|
|
— |
|
(
|
|
|||||||||||||||||||||||||||||||||||||||
| Ending Balance, June 30 | $ |
|
$ |
|
$ |
|
$ |
(
|
$ |
|
$ |
|
$ |
|
$ |
|
|||||||||||||||||||||||||||||||
| Six Months Ended June 30, 2020 | |||||||||||||||||||||||||||||||||||||||||||||||
| In millions, except per share amounts | Common Stock Issued | Paid-in Capital | Retained Earnings | Accumulated Other Comprehensive Income (Loss) | Common Stock Held In Treasury, At Cost |
Total
International Paper Shareholders’ Equity |
Noncontrolling
Interests |
Total
Equity |
|||||||||||||||||||||||||||||||||||||||
| Balance, January 1 | $ |
|
$ |
|
$ |
|
$ |
(
|
$ |
|
$ |
|
$ |
|
$ |
|
|||||||||||||||||||||||||||||||
| Adoption of ASU 2016-13 measurement of credit losses on financial instruments | — | — |
(
|
— | — |
(
|
— |
(
|
|||||||||||||||||||||||||||||||||||||||
| Issuance of stock for various plans, net | — |
(
|
— | — |
(
|
|
— |
|
|||||||||||||||||||||||||||||||||||||||
| Repurchase of stock | — | — | — | — |
|
(
|
— |
(
|
|||||||||||||||||||||||||||||||||||||||
|
Common stock dividends
($
|
— | — |
(
|
— | — |
(
|
— |
(
|
|||||||||||||||||||||||||||||||||||||||
| Transactions of equity method investees | — |
|
— | — | — |
|
— |
|
|||||||||||||||||||||||||||||||||||||||
| Comprehensive income (loss) | — | — |
|
(
|
— |
(
|
(
|
(
|
|||||||||||||||||||||||||||||||||||||||
| Ending Balance, June 30 | $ |
|
$ |
|
$ |
|
$ |
(
|
$ |
|
$ |
|
$ |
|
$ |
|
|||||||||||||||||||||||||||||||
10
The following table presents changes in accumulated other comprehensive income (AOCI) for the three months and six months ended June 30, 2021 and 2020:
|
Three Months Ended
June 30, |
Six Months Ended
June 30, |
||||||||||||||||||||||
| In millions | 2021 | 2020 | 2021 | 2020 | |||||||||||||||||||
| Defined Benefit Pension and Postretirement Adjustments | |||||||||||||||||||||||
| Balance at beginning of period | $ |
(
|
$ |
(
|
$ |
(
|
$ |
(
|
|||||||||||||||
| Amounts reclassified from accumulated other comprehensive income |
|
|
|
|
|||||||||||||||||||
| Balance at end of period |
(
|
(
|
(
|
(
|
|||||||||||||||||||
| Change in Cumulative Foreign Currency Translation Adjustments | |||||||||||||||||||||||
| Balance at beginning of period |
(
|
(
|
(
|
(
|
|||||||||||||||||||
| Other comprehensive income (loss) before reclassifications |
|
|
|
(
|
|||||||||||||||||||
| Amounts reclassified from accumulated other comprehensive income |
|
|
|
|
|||||||||||||||||||
| Other comprehensive income (loss) attributable to noncontrolling interest |
|
|
|
|
|||||||||||||||||||
| Balance at end of period |
(
|
(
|
(
|
(
|
|||||||||||||||||||
| Net Gains and Losses on Cash Flow Hedging Derivatives | |||||||||||||||||||||||
| Balance at beginning of period |
(
|
(
|
(
|
|
|||||||||||||||||||
| Other comprehensive income (loss) before reclassifications |
|
|
|
(
|
|||||||||||||||||||
| Amounts reclassified from accumulated other comprehensive income |
(
|
|
(
|
|
|||||||||||||||||||
| Balance at end of period |
|
(
|
|
(
|
|||||||||||||||||||
| Total Accumulated Other Comprehensive Income (Loss) at End of Period | $ |
(
|
$ |
(
|
$ |
(
|
$ |
(
|
|||||||||||||||
The following table presents details of the reclassifications out of AOCI for the three months and six months ended June 30, 2021 and 2020:
| In millions: | Amount Reclassified from Accumulated Other Comprehensive Income | Location of Amount Reclassified from AOCI | ||||||||||||||||||||||||||||||
|
Three Months Ended
June 30, |
Six Months Ended
June 30, |
|||||||||||||||||||||||||||||||
| 2021 | 2020 | 2021 | 2020 | |||||||||||||||||||||||||||||
| Defined benefit pension and postretirement items: | ||||||||||||||||||||||||||||||||
| Prior-service costs | $ |
(
|
$ |
(
|
$ |
(
|
$ |
(
|
(a) | Non-operating pension expense | ||||||||||||||||||||||
| Actuarial gains (losses) |
(
|
(
|
(
|
(
|
(a) | Non-operating pension expense | ||||||||||||||||||||||||||
| Total pre-tax amount |
(
|
(
|
(
|
(
|
||||||||||||||||||||||||||||
| Tax (expense) benefit |
|
|
|
|
||||||||||||||||||||||||||||
| Total, net of tax |
(
|
(
|
(
|
(
|
||||||||||||||||||||||||||||
| Change in cumulative foreign currency translation adjustments: | ||||||||||||||||||||||||||||||||
| Business acquisitions/divestitures |
(
|
|
(
|
|
Net (gains) losses on sales and impairments of businesses and Cost of products sold | |||||||||||||||||||||||||||
| Tax (expense) benefit |
|
|
|
|
||||||||||||||||||||||||||||
| Net of tax |
(
|
|
(
|
|
||||||||||||||||||||||||||||
| Net gains and losses on cash flow hedging derivatives: | ||||||||||||||||||||||||||||||||
| Foreign exchange contracts |
|
(
|
|
(
|
(b) | Cost of products sold | ||||||||||||||||||||||||||
| Total pre-tax amount |
|
(
|
|
(
|
||||||||||||||||||||||||||||
| Tax (expense)/benefit |
(
|
|
(
|
|
||||||||||||||||||||||||||||
| Net of tax |
|
(
|
|
(
|
||||||||||||||||||||||||||||
| Total reclassifications for the period | $ |
(
|
$ |
(
|
$ |
(
|
$ |
(
|
||||||||||||||||||||||||
11
(a)
These accumulated other comprehensive income components are included in the computation of net periodic pension cost (see
Note 19
for additional details).
(b)
This accumulated other comprehensive income component is included in our derivatives and hedging activities (see
Note 18
for additional details).
Basic earnings per share is computed by dividing earnings by the weighted average number of common shares outstanding. Diluted earnings per share is computed assuming that all potentially dilutive securities were converted into common shares. There are no adjustments required to be made to net income for purposes of computing basic and diluted earnings per share.
A reconciliation of the amounts included in the computation of basic earnings (loss) per share and diluted earnings (loss) per share is as follows:
|
Three Months Ended
June 30, |
Six Months Ended
June 30, |
||||||||||||||||||||||
| In millions, except per share amounts | 2021 | 2020 | 2021 | 2020 | |||||||||||||||||||
| Earnings (loss) attributable to International Paper Company common shareholders | $ |
|
$ |
|
$ |
|
$ |
|
|||||||||||||||
| Weighted average common shares outstanding |
|
|
|
|
|||||||||||||||||||
| Effect of dilutive securities (a) | |||||||||||||||||||||||
| Restricted performance share plan |
|
|
|
|
|||||||||||||||||||
| Weighted average common shares outstanding – assuming dilution |
|
|
|
|
|||||||||||||||||||
| Basic earnings (loss) per share attributable to International Paper Company Common Shareholders | $ |
|
$ |
|
$ |
|
$ |
|
|||||||||||||||
| Diluted earnings (loss) per share attributable to International Paper Company Common Shareholders | $ |
|
$ |
|
$ |
|
$ |
|
|||||||||||||||
(a)
Securities are not included in the table in periods when antidilutive
2021:
During the three months ended June 30, 2021, the Company recorded a $
170
million pre-tax charge in Corporate related to early debt extinguishment costs and a $
4
million pre-tax charge in Corporate for severance. The majority of the severance is expected to be paid over the next twelve months.
During the three months ended March 31, 2021, the Company recorded an $
18
million pre-tax charge in Corporate related to early debt extinguishment costs and a $
12
million pre-tax charge in the Industrial Packaging segment for severance related to the optimization of our EMEA Packaging business. The majority of the severance is expected to be paid over the next twelve months.
2020:
During the three months ended June 30, 2020, the Company recorded an $
18
million pre-tax charge in Corporate related to early debt extinguishment costs.
During the three months ended March 31, 2020, the Company recorded an $
8
million pre-tax charge in Corporate related to early debt extinguishment costs.
2021:
On April 1, 2021, the Company closed on the previously announced acquisition of two box plants located in Spain. The total purchase consideration, inclusive of working capital adjustments was approximately €
71
million (approximately $
83
million based on the April 1, 2021 exchange rate), subject to post-closing adjustments.
12
The following table summarizes the provisional fair value assigned to assets and liabilities acquired as of April 1, 2021:
| In millions | |||||
| Cash and temporary investments | $ |
|
|||
| Accounts and notes receivable |
|
||||
| Inventories |
|
||||
| Plants, properties and equipment |
|
||||
| Goodwill |
|
||||
| Total assets acquired |
|
||||
| Short-term debt |
|
||||
| Accounts payable and accrued liabilities |
|
||||
| Other current liabilities |
|
||||
| Deferred income taxes |
|
||||
| Total liabilities assumed |
|
||||
| Net assets acquired | $ |
|
|||
Since the date of acquisition, Net sales of $
9
million and Earnings (loss) from continuing operations before income taxes and equity earnings of $
1
million from the acquired business have been included in the Company's consolidated statement of operations for the three months and year to date ended June 30, 2021.
The purchase price and related allocation are preliminary and could be revised as a result of adjustments made to the purchase price, additional information obtained regarding assets acquired and liabilities assumed, and revisions of provisional estimates of fair values, including, but not limited to, the completion of independent appraisals and valuations related to inventory, property, plant and equipment and acquired intangible assets. Adjustments to provisional amounts will be finalized as new information becomes available, but within the adjustment period of up to one year from the acquisition date.
Pro forma information has not been included as it is impracticable to obtain the information due to the lack of availability of historical U.S. GAAP financial data. The results of the operations of these businesses do not have a material effect on the Company's consolidated results of operations.
The Company has accounted for the above acquisition under ASC 805, "Business Combinations" and the results of operations have been included in International Paper's financial statements beginning with the date of acquisition.
In April 2021, the Company received a noncontrolling interest in a U.S-based corrugated packaging producer. In the second quarter, the Company recorded its investment of $
115
million based on the fair value of the noncontrolling interest, and a corresponding contract liability that is amortized over
15 years
. The Company is party to various agreements with the entity which includes a containerboard supply agreement. The Company is accounting for its interest as an equity method investment.
2020:
In May 2020, the Company increased its noncontrolling interest in an entity that produces corrugated sheets. The equity purchase price was $
56
million. The Company is party to various agreements with the entity which includes a containerboard supply agreement. The Company is accounting for its interest as an equity method investment.
Olmuksan International Paper
2021:
On May 31, 2021, the Company completed the sale of its
90.38
% ownership interest in Olmuksan International Paper, a corrugated packaging business in Turkey, to Mondi Group for €
66
million (approximately $
81
million using the May 31, 2021 exchange rate). During the second quarter of 2021, the Company recorded a gain of $
6
million ($
0
after taxes) related to the business working capital adjustment. This charge is included in the Net (gains) losses on sales and impairments of businesses in the accompanying consolidated statement of operations and is included in the results for the Industrial Packaging segment.
In conjunction with the announced agreement in the fourth quarter of 2020, a determination was made that the current book value of the Olmuksan International Paper disposal group exceeded its estimated fair value of $
79
million which was based on the agreed upon transaction price. As a result, a preliminary charge of $
123
million (before and after taxes) was recorded during the fourth quarter of 2020. During the first quarter of 2021, the Company recorded an additional charge of $
2
million (before and after taxes) related to the cumulative foreign currency translation loss. This charge is included in the Net (gains) losses on sales and impairments of businesses in the accompanying consolidated statement of operations and is included in the results for the Industrial Packaging segment.
13
Kwidzyn Mill
2021:
On February 12, 2021, the Company entered into an agreement to sell our Kwidzyn, Poland mill for €
670
million (approximately $
794
million using the June 30, 2021 exchange rate) in cash, subject to final working capital and net debt adjustments. The business includes the pulp and paper mill in Kwidzyn and supporting functions. The transaction is expected to close in the third quarter of 2021, subject to customary closing conditions and regulatory approvals.
At June 30, 2021, all assets and liabilities related to the Kwidzyn mill are classified as current assets held for sale and current liabilities held for sale in the accompanying condensed consolidated balance sheet.
The following summarizes the major classes of assets and liabilities of this business reconciled to Assets held for sale and Liabilities held for sale in the accompanying condensed consolidated balance sheet.
| In millions | June 30, 2021 | ||||
| Cash and temporary investments | $ |
|
|||
| Accounts and notes receivable |
|
||||
| Inventories |
|
||||
| Other current assets |
|
||||
| Plants, properties and equipment |
|
||||
| Goodwill |
|
||||
| Right of use assets |
|
||||
| Deferred charges and other assets |
|
||||
| Total Assets Held for Sale |
|
||||
| Accounts payable and accrued liabilities | $ |
|
|||
| Other current liabilities |
|
||||
| Deferred income taxes |
|
||||
| Long-term lease obligations |
|
||||
| Other liabilities |
|
||||
| Total Liabilities Held for Sale |
|
||||
Printing Papers Spinoff
2021:
On December 3, 2020, the Company announced a plan to pursue a spin-off of the Company's Printing Papers segment into a standalone, publicly-traded company. The transaction will be implemented through the distribution of shares of the standalone company to International Paper shareholders. International Paper will retain up to
19.9
% of the shares of the standalone company at the time of the separation, with the intent to monetize its investment and to provide additional proceeds to the Company. The Company expects the separation to be tax-free for the Company and its shareholders for U.S. federal income tax purposes and plans to complete the spin-off on October 1, 2021, subject to the receipt of required regulatory approvals.
Brazil Industrial Packaging
2020:
On October 14, 2020, the Company closed the previously announced sale of its Brazilian Industrial Packaging business for R$
330
million ($
58.5
million U.S. dollars), with R$
280
million ($
49.6
million U.S. dollars) paid at closing and R$
50
million ($
8.9
million U.S. dollars) to be paid one year from closing. This business includes
three
containerboard mills and
four
box plants and the agreement follows International Paper's previously announced strategic review of the Brazilian Industrial Packaging business.
14
Temporary Investments
Temporary investments with an original maturity of three months or less and money market funds with greater than three month maturities but with the right to redeem without notices are treated as cash equivalents and are stated at cost. Temporary investments totaled $
425
million and $
358
million at June 30, 2021 and December 31, 2020, respectively.
| In millions | June 30, 2021 | December 31, 2020 | |||||||||
| Accounts and notes receivable, net: | |||||||||||
| Trade | $ |
|
$ |
|
|||||||
| Other |
|
|
|||||||||
| Total | $ |
|
$ |
|
|||||||
The allowance for expected credit losses was $
69
million and $
76
million at June 30, 2021 and December 31, 2020, respectively. Based on the Company's accounting estimates and the facts and circumstances available as of the reporting date, we believe our allowance for expected credit losses is adequate.
| In millions | June 30, 2021 | December 31, 2020 | |||||||||
| Raw materials | $ |
|
$ |
|
|||||||
| Finished pulp, paper and packaging |
|
|
|||||||||
| Operating supplies |
|
|
|||||||||
| Other |
|
|
|||||||||
| Total | $ |
|
$ |
|
|||||||
Plants, Properties and Equipment
Accumulated depreciation was $
21.0
billion and $
21.4
billion at June 30, 2021 and December 31, 2020, respectively. Depreciation expense was $
292
million and $
293
million for the three months ended June 30, 2021 and 2020, respectively, and $
586
million and $
602
million for the six months ended June 30, 2021 and 2020, respectively.
Non-cash additions to plants, property and equipment included within accounts payable were $
38
million and $
41
million at June 30, 2021 and December 31, 2020, respectively.
Amounts invested in capital projects in the accompanying condensed consolidated statement of cash flows are presented net of insurance recoveries of $
4
million received during the six months ended June 30, 2021 and $
30
million received during the six months ended June 30, 2020.
Interest
Interest payments made during the six months ended June 30, 2021 and 2020 were $
248
million and $
338
million, respectively.
Amounts related to interest were as follows:
|
Three Months Ended
June 30, |
Six Months Ended
June 30, |
||||||||||||||||||||||
| In millions | 2021 | 2020 | 2021 | 2020 | |||||||||||||||||||
| Interest expense | $ |
|
$ |
|
$ |
|
$ |
|
|||||||||||||||
| Interest income |
|
|
|
|
|||||||||||||||||||
| Capitalized interest costs |
|
|
|
|
|||||||||||||||||||
Asset Retirement Obligations
The Company had recorded liabilities of $
127
million and $
116
million related to asset retirement obligations at June 30, 2021 and December 31, 2020, respectively.
15
International Paper leases various real estate, including certain operating facilities, warehouses, office space and land. The Company also leases material handling equipment, vehicles, and certain other equipment. The Company's leases have remaining lease terms of
one year
to
32
years. Total lease cost was $
71
million and $
67
million for the three months ended June 30, 2021 and 2020, respectively, and $
143
million and $
134
million for the six months ended June 30, 2021 and 2020, respectively.
Supplemental Balance Sheet Information Related to Leases
| In millions | Classification | June 30, 2021 | December 31, 2020 | |||||||||||||||||
| Assets | ||||||||||||||||||||
| Operating lease assets | Right-of-use assets | $ |
|
$ |
|
|||||||||||||||
| Finance lease assets | Plants, properties and equipment, net (a) |
|
|
|||||||||||||||||
| Total leased assets | $ |
|
$ |
|
||||||||||||||||
| Liabilities | ||||||||||||||||||||
| Current | ||||||||||||||||||||
| Operating | Other current liabilities | $ |
|
$ |
|
|||||||||||||||
| Finance | Notes payable and current maturities of long-term debt |
|
|
|||||||||||||||||
| Noncurrent | ||||||||||||||||||||
| Operating | Long-term lease obligations |
|
|
|||||||||||||||||
| Finance | Long-term debt |
|
|
|||||||||||||||||
| Total lease liabilities | $ |
|
$ |
|
||||||||||||||||
(a)
Finance leases are recorded net of accumulated amortization of $
59
million and $
53
million as of June 30, 2021 and December 31, 2020, respectively.
The Company accounts for the following investments under the equity method of accounting.
Graphic Packaging International Partners, LLC
The Company completed the transfer of its North American Consumer Packaging business in exchange for an initial
20.5
% ownership interest (
79,911,591
units) in Graphic Packaging International Partners, LLC (GPIP) in 2018. The Company has since fully monetized its investment in GPIP with transactions beginning in the first quarter 2020 through the second quarter 2021.
GPIP Monetization Transactions
| Date | Transaction Type | Units | Proceeds | Pre-tax Gain | After-Tax Gain | ||||||||||||
| In millions except units | |||||||||||||||||
| 2020 First Quarter | Units exchange |
|
$ |
|
$ |
|
$ |
|
|||||||||
| 2020 Third Quarter | Units exchange |
|
|
|
|
||||||||||||
| 2021 First Quarter | Units exchange and open market sale |
|
|
|
|
||||||||||||
| 2021 First Quarter | TRA (a) |
|
|
||||||||||||||
| 2021 Second Quarter | Units exchange and open market sale |
|
|
|
|
||||||||||||
| 2021 Second Quarter | TRA (a) |
|
|
||||||||||||||
(a)
The TRA entitles the Company to
50
% of the amount of any tax benefits projected to be realized by GPIP upon the Company's exchange of its units. This amount is recorded in other receivables and is expected to be received within the next
12
months.
As of June 30, 2021, the Company no longer had an ownership interest in GPIP. The Company recorded equity earnings of $
3
million and $
11
million for the three months ended June 30, 2021 and 2020, respectively, and $
4
million and $
18
million for the six months ended June 30, 2021 and 2020, respectively. The Company received cash dividends from GPIP of $
5
million and $
10
million during the first six months of 2021 and 2020, respectively.
16
Ilim S.A.
The Company has a
50
% equity interest in Ilim S.A. (Ilim), which has subsidiaries whose primary operations are in Russia. The Company recorded equity earnings (losses), net of taxes, of $
101
million and $
63
million for the three months ended June 30, 2021 and 2020, respectively, and $
150
million and $
28
million for the six months ended June 30, 2021 and 2020, respectively. Foreign exchange gains (losses) included in equity earnings for the three months and six months ended June 30, 2021, were not material and JSC Ilim Group had no U.S. dollar-denominated debt outstanding as of June 30, 2021. Equity earnings (losses) for the three months and six months ended June 30, 2020, included an after-tax foreign exchange gain of $
34
million and an after-tax foreign exchange loss of $
17
million, respectively, primarily on the remeasurement of U.S. dollar-denominated net debt. The Company received cash dividends from the joint venture of $
144
million and $
141
million during the first six months of 2021 and 2020. At June 30, 2021 and December 31, 2020, the Company's investment in Ilim was $
425
million and $
393
million, respectively, which was $
128
million and $
127
million, respectively, more than the Company's proportionate share of the joint venture's underlying net assets. The differences primarily relate to currency translation adjustments and the basis difference between the fair value of our investment at acquisition and the underlying net assets. The Company is party to a joint marketing agreement with JSC Ilim Group, a subsidiary of Ilim, under which the Company purchases, markets and sells paper produced by JSC Ilim Group. Purchases under this agreement were $
42
million and $
39
million for the three months ended June 30, 2021 and 2020, respectively, and $
83
million and $
90
million for the six months ended June 30, 2021 and 2020, respectively.
Summarized financial information for Ilim is presented in the following tables:
Balance Sheet
| In millions | June 30, 2021 | December 31, 2020 | |||||||||
| Current assets | $ |
|
$ |
|
|||||||
| Noncurrent assets |
|
|
|||||||||
| Current liabilities |
|
|
|||||||||
| Noncurrent liabilities |
|
|
|||||||||
| Noncontrolling interests |
|
|
|||||||||
Income Statement
|
Three Months Ended
June 30, |
Six Months Ended
June 30, |
||||||||||||||||||||||
| In millions | 2021 | 2020 | 2021 | 2020 | |||||||||||||||||||
| Net sales | $ |
|
$ |
|
$ |
|
$ |
|
|||||||||||||||
| Gross profit |
|
|
|
|
|||||||||||||||||||
| Income (loss) from continuing operations |
|
|
|
|
|||||||||||||||||||
| Net income (loss) |
|
|
|
|
|||||||||||||||||||
The Company's remaining equity method investments are not material.
17
Goodwill
The following table presents changes in goodwill balances as allocated to each business segment for the six-months ended June 30, 2021:
| In millions |
Industrial
Packaging |
Global Cellulose Fibers |
Printing
Papers |
Total | |||||||||||||||||||
| Balance as of January 1, 2021 | |||||||||||||||||||||||
| Goodwill | $ |
|
$ |
|
$ |
|
$ |
|
|||||||||||||||
| Accumulated impairment losses |
(
|
(
|
(
|
(
|
|||||||||||||||||||
|
|
|
|
|
||||||||||||||||||||
| Currency translation and other (a) |
(
|
|
|
|
|||||||||||||||||||
| Goodwill additions/reductions |
|
(b) |
|
(
|
(b) |
|
|||||||||||||||||
| Accumulated impairment loss additions / reductions |
|
|
|
|
|||||||||||||||||||
| Balance as of June 30, 2021 | |||||||||||||||||||||||
| Goodwill |
|
|
|
|
|||||||||||||||||||
| Accumulated impairment losses |
(
|
(
|
(
|
(
|
|||||||||||||||||||
| Total | $ |
|
$ |
|
$ |
|
$ |
|
|||||||||||||||
(a)
Represents the effects of foreign currency translations
.
(b)
Represents Kwidzyn held for sale and Box Plant acquisitions in EMEA.
Other Intangibles
Identifiable intangible assets comprised the following:
| June 30, 2021 | December 31, 2020 | ||||||||||||||||||||||||||||||||||
| In millions |
Gross
Carrying Amount |
Accumulated
Amortization |
Net Intangible Assets |
Gross
Carrying Amount |
Accumulated
Amortization |
Net Intangible Assets | |||||||||||||||||||||||||||||
| Customer relationships and lists | $ |
|
$ |
|
$ |
|
$ |
|
$ |
|
$ |
|
|||||||||||||||||||||||
| Tradenames, patents and trademarks, and developed technology |
|
|
|
|
|
|
|||||||||||||||||||||||||||||
| Land and water rights |
|
|
|
|
|
|
|||||||||||||||||||||||||||||
| Software |
|
|
|
|
|
|
|||||||||||||||||||||||||||||
| Other |
|
|
|
|
|
|
|||||||||||||||||||||||||||||
| Total | $ |
|
$ |
|
$ |
|
$ |
|
$ |
|
$ |
|
|||||||||||||||||||||||
The Company recognized the following amounts as amortization expense related to intangible assets:
|
Three Months Ended
June 30, |
Six Months Ended
June 30, |
||||||||||||||||||||||
| In millions | 2021 | 2020 | 2021 | 2020 | |||||||||||||||||||
| Amortization expense related to intangible assets | $ |
|
$ |
|
$ |
|
$ |
|
|||||||||||||||
International Paper made income tax payments, net of refunds, of $
185
million and $
58
million for the six months ended June 30, 2021 and 2020, respectively.
The Company currently estimates, that as a result of ongoing discussions, pending tax settlements and expirations of statutes of limitations, the amount of unrecognized tax benefits could be reduced by approximately $
5
million during the next 12 months.
18
Environmental
International Paper has been named as a potentially responsible party (PRP) in environmental remediation actions under various federal and state laws, including the Comprehensive Environmental Response, Compensation and Liability Act (CERCLA). Many of these proceedings involve the cleanup of hazardous substances at large commercial landfills that received waste from many different sources. While joint and several liability is authorized under CERCLA and equivalent state laws, as a practical matter, liability for CERCLA cleanups is typically allocated among the many PRPs. There are other remediation costs typically associated with the cleanup of hazardous substances at the Company’s current, closed or formerly-owned facilities, and recorded as liabilities in the balance sheet.
Remediation costs are recorded in the consolidated financial statements when they become probable and reasonably estimable. International Paper has estimated the probable liability associated with these environmental remediation matters, including those described herein, to be approximately $
185
million ($
194
million undiscounted) in the aggregate as of June 30, 2021. Other than as described below, completion of required remedial actions is not expected to have a material effect on our consolidated financial statements.
Cass Lake:
One of the matters included above arises out of a closed wood-treatment facility located in Cass Lake, Minnesota. In June 2011, the United States Environmental Protection Agency (EPA) selected and published a proposed soil remedy at the site with an estimated cost of $
46
million. In April 2020, the EPA issued a final plan concerning clean-up standards at a portion of the site, the estimated cost of which is included within the reserve referenced above. In October 2012, the Natural Resource Trustees for this site provided notice to International Paper and other PRPs of their intent to perform a Natural Resource Damage Assessment. It is premature to predict the outcome of the assessment or to estimate a loss or range of loss, if any, in excess of the applicable reserve referenced above, which may be incurred.
Kalamazoo River:
The Company is a PRP with respect to the Allied Paper, Inc./Portage Creek/Kalamazoo River Superfund Site in Michigan. The EPA asserts that the site is contaminated by polychlorinated biphenyls (PCBs) primarily as a result of discharges from various paper mills located along the Kalamazoo River, including a paper mill (the Allied Paper Mill) formerly owned by St. Regis Paper Company (St. Regis). The Company is a successor in interest to St. Regis.
•
Operable Unit 5, Area 1: In March 2016, the Company and other PRPs received a special notice letter from the EPA (i) inviting participation in implementing a remedy for a portion of the site known as Operable Unit 5, Area 1, and (ii) demanding reimbursement of EPA past costs totaling $
37
million, including $
19
million
in past costs previously demanded by the EPA. The Company responded to the special notice letter. In December 2016, the EPA issued a unilateral administrative order to the Company and other PRPs to perform the remedy. The Company responded to the unilateral administrative order, agreeing to comply with the order subject to its sufficient cause defenses.
•
Operable Unit 1: In October 2016, the Company and another PRP received a special notice letter from the EPA inviting participation in the remedial design component of the landfill remedy for the Allied Paper Mill, which is also known as Operable Unit 1. The Record of Decision establishing the final landfill remedy for the Allied Paper Mill was issued by the EPA in September 2016. The Company responded to the Allied Paper Mill special notice letter in December 2016. In February 2017, the EPA informed the Company that it would make other arrangements for the performance of the remedial design.
In addition, in December 2019, the United States published notice in the Federal Register of a proposed consent decree with NCR Corporation (one of the parties to the allocation/apportionment litigation described below), the State of Michigan and natural resource trustees under which NCR would make payments of more than $
100
million and perform work in Operable
19
Unit 5, Areas 2, 3, and 4 at an estimated cost of $
135.7
million. In December 2020, the Federal District Court approved the proposed consent decree.
The Company’s CERCLA liability has not been finally determined with respect to these or any other portions of the site, and except as noted above, the Company has declined to perform any work or reimburse the EPA at this time. As noted below, the Company is involved in allocation/apportionment litigation with regard to the site. Accordingly, it is premature to predict the outcome or estimate our maximum reasonably possible loss or range of loss with respect to this site. We have recorded a liability for future remediation costs at the site that are probable and reasonably estimable, and it remains reasonably possible that additional losses in excess of this recorded liability could be material.
The Company was named as a defendant by Georgia-Pacific Consumer Products LP, Fort James Corporation and Georgia Pacific LLC in a contribution and cost recovery action for alleged pollution at the site. NCR Corporation and Weyerhaeuser Company are also named as defendants in the suit. The suit seeks contribution under CERCLA for costs purportedly expended by plaintiffs ($
79
million as of the filing of the complaint) and for future remediation costs. In June 2018, the Court issued its Final Judgment and Order, which fixed the past cost amount at approximately $
50
million (plus interest to be determined) and allocated to the Company a
15
% share of responsibility for those past costs. The Court did not address responsibility for future costs in its decision.
In July 2018, the Company and each of the other parties filed notices appealing the Final Judgment and prior orders incorporated into that Judgment. The Company appeal is pending.
Harris County:
International Paper and McGinnis Industrial Maintenance Corporation (MIMC), a subsidiary of Waste Management, Inc. (WMI), are PRPs at the San Jacinto River Waste Pits Superfund Site in Harris County, Texas. The PRPs have been actively participating in the activities at the site and share the costs of these activities.
In October 2017, the EPA issued a Record of Decision (ROD) selecting the final remedy for the site: removal and relocation of the waste material from both the northern and southern impoundments. The EPA did not specify the methods or practices needed to perform this work. The EPA’s selected remedy was accompanied by a cost estimate of approximately $
115
million ($
105
million for the northern impoundment, and $
10
million for the southern impoundment). Subsequent to the issuance of the ROD, there have been numerous meetings between the EPA and the PRPs, and the Company continues to work with the EPA and MIMC/WMI to develop the remedial design.
To this end, in April 2018, the PRPs entered into an Administrative Order on Consent (AOC) with the EPA, agreeing to work together to develop the remedial design for the northern impoundment. That remedial design work is ongoing. The AOC does not include any agreement to perform waste removal or other construction activity at the site. Rather, it involves adaptive management techniques and a pre-design investigation, the objectives of which include filling data gaps (including but not limited to post-Hurricane Harvey technical data generated prior to the ROD and not incorporated into the selected remedy), refining areas and volumes of materials to be addressed, determining if an excavation remedy is able to be implemented in a manner protective of human health and the environment, and investigating potential impacts of remediation activities to infrastructure in the vicinity.
During the first quarter of 2020, through a series of meetings among the Company, MIMC/WMI, our consultants, the EPA and the Texas Commission on Environmental Quality (TCEQ), progress was made to resolve key technical issues previously preventing the Company from determining the manner in which the selected remedy for the northern impoundment would be feasibly implemented. As a result of these developments, the Company reserved the following amounts in relation to remediation at this site: (a) $
10
million for the southern impoundment; and (b) $
55
million for the northern impoundment, which represents the Company's
50
% share of our estimate of the low end of the range of probable remediation costs.
Although several key technical issues have been resolved, we still face significant challenges remediating the northern impoundment in a cost-efficient manner and without a release to the environment and therefore our discussions with the EPA on the best approach to remediation will continue. Because of ongoing questions regarding cost effectiveness, timing and gathering other technical data, additional losses in excess of our recorded liability are possible. We have submitted the Final Design Package for the southern impoundment to the EPA, and the EPA approved this plan May 7, 2021. We are currently unable to reasonably estimate any further adjustment to our recorded liability or any loss or range of loss in excess of such liability; however, we believe it is unlikely any adjustment would be material.
Asbestos-Related Matters
We have been named as a defendant in various asbestos-related personal injury litigation, in both state and federal court, primarily in relation to the prior operations of certain companies previously acquired by the Company. As of June 30, 2021, the Company's total recorded liability with respect to pending and future asbestos-related claims was $
112
million, net of estimated
20
insurance recoveries. While it is reasonably possible that the Company may incur losses in excess of its recorded liability with respect to asbestos-related matters, we do not believe additional material losses are probable.
Antitrust
Italy:
In March 2017, the Italian Competition Authority (ICA) commenced an investigation into the Italian packaging industry to determine whether producers of corrugated sheets and boxes violated the applicable European competition law. In April 2019, the ICA concluded its investigation and issued initial findings alleging that over
30
producers, including our Italian packaging subsidiary (IP Italy), improperly coordinated the production and sale of corrugated sheets and boxes. On August 6, 2019, the ICA issued its decision and assessed IP Italy a fine of €
29
million (approximately $
32
million at current exchange rates) which was recorded in the third quarter of 2019. We appealed the ICA decision and our appeal was denied on May 25, 2021. However, we continue to believe we have numerous and strong bases to further appeal the decision. However, we continue to believe we have numerous and strong bases to challenge the ICA decision, and we have further appealed the decision to the Italian Council of State.
Taxes Other Than Payroll Taxes
In 2017, the Brazilian Federal Supreme Court decided that the state value-added tax (VAT) should not be included in the basis of federal VAT calculations. In 2018 and 2019, the Brazilian tax authorities published both an internal consultation and a normative ruling with a narrow interpretation of the effects of the case. Based upon the best information available to us at that time, we determined an estimated refund was probable of being realized. As of March 31, 2021, we had recognized a receivable of $
11
million based upon the authorities narrow interpretation. On May 13, 2021, the Brazilian Federal Supreme Court ruled again on the case. The latest ruling provides a much broader definition of the state VAT, which increases the exclusion amount from the Federal VAT calculations. Therefore, we have recognized an additional receivable of $
70
million, which brings the total receivable to $
81
million as of June 30, 2021. The $
70
million of income recognized during the second quarter of 2021 includes income of $
42
million in Cost of Products sold and income of $
28
million in Interest expense, net in the accompanying condensed consolidated statement of operations. The issue is now considered fully resolved, and no further ruling by either the Brazilian Supreme Court nor the Brazilian tax authorities is expected.
General
Variable Interest Entities
As of June 30, 2021, the fair value of the Timber Notes and Extension Loans was $
4.9
billion and $
4.2
billion, respectively, for the 2015 Financing Entities. The Timber Notes and Extension Loans are classified as Level 2 within the fair value hierarchy, which is further defined in Note 17 in the Company's Annual Report on Form 10-K for the year ended December 31, 2020.
The Timber Notes of $
4.8
billion and the Extension Loans of $
4.2
billion both mature in August 2021 and are shown in Current nonrecourse financial assets of variable interest entities and Current nonrecourse financial liabilities of variable interest entities, respectively, on the accompanying balance sheet. We will settle the third-party loans at their maturity in August 2021 with the proceeds from the installment notes which also mature in August 2021 resulting in expected cash proceeds of approximately $
0.6
billion representing our equity in the variable interest entities. Maturity of the installment notes and termination of the monetization structure is expected to result in a $
75
million cash tax payment in the fourth quarter of 2021.
21
Activity between the Company and the 2015 Financing Entities was as follows:
|
Three Months Ended
June 30, |
Six Months Ended
June 30, |
||||||||||||||||||||||
| In millions | 2021 | 2020 | 2021 | 2020 | |||||||||||||||||||
| Revenue (a) | $ |
|
$ |
|
$ |
|
$ |
|
|||||||||||||||
| Expense (a) |
|
|
|
|
|||||||||||||||||||
| Cash receipts (b) |
|
|
|
|
|||||||||||||||||||
| Cash payments (c) |
|
|
|
|
|||||||||||||||||||
(a)
The revenue and expense are included in Interest expense, net in the accompanying statement of operations.
(b)
The cash receipts are interest received on the Financial assets of special purpose entities.
(c)
The cash payments represent interest paid on Nonrecourse financial liabilities of special purpose entities.
As of June 30, 2021, the fair value of the Timber Notes and Extension Loans was $
2.3
billion and $
2.2
billion, respectively, for the 2007 Financing Entities. The Timber Notes and Extension Loans are classified as Level 2 within the fair value hierarchy, which is further defined in Note 17 in the Company’s Annual Report on Form 10-K for the year ended December 31, 2020.
The Timber Notes of $
2.3
billion and the Extension Loans of $
2.1
billion both mature in 2027 and are shown in Long-term nonrecourse financial assets of variable interest entities and Long-term nonrecourse financial liabilities of variable interest entities, respectively, on the accompanying balance sheet.
Activity between the Company and the 2007 Financing Entities was as follows:
|
Three Months Ended
June 30, |
Six Months Ended
June 30, |
||||||||||||||||||||||
| In millions | 2021 | 2020 | 2021 | 2020 | |||||||||||||||||||
| Revenue (a) | $ |
|
$ |
|
$ |
|
$ |
|
|||||||||||||||
| Expense (b) |
|
|
|
|
|||||||||||||||||||
| Cash receipts (c) |
|
|
|
|
|||||||||||||||||||
| Cash payments (d) |
|
|
|
|
|||||||||||||||||||
(a)
The revenue is included in Interest expense, net in the accompanying statement of operations and includes approximately $
4
million and $
9
million for the three months and six months ended June 30, 2021 and 2020, respectively, of accretion income for the amortization of the basis difference adjustment on the Financial assets of special purpose entities.
(b)
The expense is included in Interest expense, net in the accompanying statement of operations and includes approximately $
1
million and $
3
million for the three months and six months ended June 30, 2021 and 2020, respectively, of accretion expense for the amortization of the basis difference adjustment on the Nonrecourse financial liabilities of special purpose entities.
(c)
The cash receipts are interest received on the Financial assets of special purpose entities.
The borrowing capacity of the Company's commercial paper program is $
1.0
billion. Under the terms of the program, individual maturities on borrowings may vary, but not exceed one year from the date of issue. Interest bearing notes may be issued either as fixed or floating rate notes. As of June 30, 2021, the Company had
no
borrowings outstanding under the program.
At June 30, 2021, International Paper’s credit facilities totaled $
2.1
billion. The Agreements generally provide for interest rates at a floating rate index plus a pre-determined margin dependent upon International Paper’s credit rating. The Agreements include a $
1.5
billion contractually committed bank facility. In June 2021, the Company extended the maturity date of the $
1.5
billion credit facility from December 2022 to June 2026. The liquidity facilities also include up to $
550
million of uncommitted financings based on eligible receivables balances under a receivables securitization program. In February of 2021, after considering the Company’s liquidity position in relation to the macroeconomic environment at such time, the Company amended the receivable securitization program from a committed financing arrangement to an uncommitted financing arrangement. The borrowing limit of up to $
550
million based on eligible receivables balances and the expiration date in April
22
2022 remained unchanged from the previous agreement. At June 30, 2021, there were
no
borrowings under either the bank facility or receivables securitization program.
In March 2020, the Company entered into a $
750
million contractually committed 364-day revolving credit agreement with a syndicate of banks and other financial institutions which augmented the Company's access to liquidity due to the macroeconomic conditions related to COVID-19 and supplemented the Company's $
1.5
billion credit agreement. After considering the Company’s liquidity position in relation to the macroeconomic environment at such time, the Company determined not to extend the $
750
million credit agreement after its expiration on March 24, 2021.
The Company’s early debt reductions in the second quarter of 2021 were a debt tender in June 2021 of approximately $
558
million related to debt with interest rates ranging from
4.35
% to
4.40
% and maturity dates ranging from 2047 to 2048 and open market repurchases of approximately $
232
million related to debt with interest rates ranging from
3.00
% to
5.15
% and maturity dates ranging from 2027 to 2046.
The Company’s early debt reductions in the first quarter of 2021 were open market repurchases of approximately $
107
million related to debt with interest rates ranging from
3.00
% to
4.80
% and maturities dates from 2027 to 2048.
The Company’s financial covenants require the maintenance of a minimum net worth, as defined in our debt agreements, of $
9
billion and a total debt-to-capital ratio of less than
60
%. Net worth is defined as the sum of common stock, paid-in capital and retained earnings, less treasury stock plus any cumulative goodwill impairment charges. The calculation also excludes accumulated other comprehensive income/loss and both the current and long-term Nonrecourse Financial Liabilities of Variable Interest Entities. The total debt-to-capital ratio is defined as total debt divided by the sum of total debt plus net worth. As of June 30, 2021, we were in compliance with our debt covenants.
At June 30, 2021, the fair value of International Paper’s $
7.2
billion of debt was approximately $
9.1
billion. The fair value of the Company’s long-term debt is estimated based on the quoted market prices for the same or similar issues. International Paper’s long-term debt is classified as Level 2 within the fair value hierarchy, which is further defined in Note 17 in the Company’s Annual Report on Form 10-K for the year ended December 31, 2020.
As a multinational company, International Paper is exposed to market risks, such as changes in interest rates, currency exchange rates and commodity prices.
The notional amounts of qualifying and non-qualifying financial instruments used in hedging transactions were as follows:
| In millions | June 30, 2021 | December 31, 2020 | |||||||||
| Derivatives in Cash Flow Hedging Relationships: | |||||||||||
| Foreign exchange contracts (USD) | $ |
|
$ |
|
|||||||
| Foreign exchange contracts (EUR) |
|
|
|||||||||
| Derivatives in Net Investment Hedging Relationships: | |||||||||||
| Foreign exchange contracts (EUR) |
|
|
|||||||||
| Foreign exchange contracts (BRL) |
|
|
|||||||||
| Derivatives Not Designated as Hedging Instruments: | |||||||||||
| Electricity contract (MWh) |
|
|
|||||||||
| Foreign exchange contracts (EUR) |
|
|
|||||||||
| Foreign exchange contracts (USD) |
|
|
|||||||||
23
The following table shows gains or losses recognized in AOCI, net of tax, related to derivative instruments:
| Gain (Loss) Recognized in AOCI on Derivatives (Effective Portion) | |||||||||||||||||||||||
|
Three Months Ended
June 30, |
Six Months Ended
June 30, |
||||||||||||||||||||||
| In millions | 2021 | 2020 | 2021 | 2020 | |||||||||||||||||||
| Derivatives in Cash Flow Hedging Relationships: | |||||||||||||||||||||||
| Foreign exchange contracts | $ |
|
$ |
|
$ |
|
$ |
(
|
|||||||||||||||
| Total | $ |
|
$ |
|
$ |
|
$ |
(
|
|||||||||||||||
| Derivatives in Net Investment Hedging Relationships: | |||||||||||||||||||||||
| Foreign exchange contracts | $ |
(
|
$ |
|
$ |
|
$ |
|
|||||||||||||||
| Interest rate contracts |
|
|
|
|
|||||||||||||||||||
| Total | $ |
(
|
$ |
|
$ |
|
$ |
|
|||||||||||||||
During the next 12 months, the amount of the June 30, 2021 AOCI balance, after tax, that is expected to be reclassified to earnings is a gain of $
1
million.
The amounts of gains and losses recognized in the statement of operations on qualifying and non-qualifying financial instruments used in hedging transactions were as follows:
| Gain (Loss) Reclassified from AOCI Into Income (Effective Portion) |
Location of Gain (Loss)
Reclassified from AOCI (Effective Portion) |
|||||||||||||||||||||||||
|
Three Months Ended
June 30, |
Six Months Ended
June 30, |
|||||||||||||||||||||||||
| In millions | 2021 | 2020 | 2021 | 2020 | ||||||||||||||||||||||
| Derivatives in Cash Flow Hedging Relationships: | ||||||||||||||||||||||||||
| Foreign exchange contracts | $ |
|
$ |
(
|
$ |
|
$ |
(
|
Cost of products sold | |||||||||||||||||
| Total | $ |
|
$ |
(
|
$ |
|
$ |
(
|
||||||||||||||||||
| Gain (Loss) Recognized in Income |
Location of Gain (Loss)
In Statement of Operations |
||||||||||||||||||||||||||||
|
Three Months Ended
June 30, |
Six Months Ended
June 30, |
||||||||||||||||||||||||||||
| In millions | 2021 | 2020 | 2021 | 2020 | |||||||||||||||||||||||||
| Derivatives in Fair Value Hedging Relationships: | |||||||||||||||||||||||||||||
| Interest rate contracts | $ |
|
$ |
|
$ |
|
$ |
|
Interest expense, net | ||||||||||||||||||||
| Debt |
|
|
|
(
|
Interest expense, net | ||||||||||||||||||||||||
| Total | $ |
|
$ |
|
$ |
|
$ |
|
|||||||||||||||||||||
| Derivatives in Net Investment Hedging Relationships: | |||||||||||||||||||||||||||||
| Foreign exchange contracts |
|
|
|
|
Net (gain) losses on sales and impairments of businesses | ||||||||||||||||||||||||
| Total | $ |
|
$ |
|
$ |
|
$ |
|
|||||||||||||||||||||
| Derivatives Not Designated as Hedging Instruments: | |||||||||||||||||||||||||||||
| Electricity contract | $ |
|
$ |
|
$ |
|
$ |
(
|
Cost of products sold | ||||||||||||||||||||
| Foreign exchange contracts |
(
|
|
(
|
|
Cost of products sold | ||||||||||||||||||||||||
| Total | $ |
(
|
$ |
|
$ |
|
$ |
(
|
|||||||||||||||||||||
Fair Value Measurements
The Company has not changed its valuation techniques for measuring the fair value of any financial assets or liabilities during the year. Transfers between levels, if any, are recognized at the end of the reporting period.
24
The following table provides a summary of the impact of our derivative instruments in the balance sheet:
Fair Value Measurements
Level 2 – Significant Other Observable Inputs
| Assets | Liabilities | |||||||||||||||||||||||||
| In millions | June 30, 2021 | December 31, 2020 | June 30, 2021 | December 31, 2020 | ||||||||||||||||||||||
| Derivatives designated as hedging instruments | ||||||||||||||||||||||||||
| Foreign exchange contracts – cash flow | $ |
|
$ |
|
$ |
|
$ |
|
||||||||||||||||||
| Foreign exchange contracts - net investment |
|
|
|
|
||||||||||||||||||||||
| Total derivatives designated as hedging instruments |
|
|
|
|
||||||||||||||||||||||
| Derivatives not designated as hedging instruments | ||||||||||||||||||||||||||
| Electricity contract |
|
|
|
|
||||||||||||||||||||||
| Foreign exchange contracts |
|
|
|
|
||||||||||||||||||||||
| Total derivatives not designated as hedging instruments |
|
|
|
|
||||||||||||||||||||||
| Total derivatives | $ |
|
(a) | $ |
|
(a) | $ |
|
(b) | $ |
|
(c) | ||||||||||||||
(a)
Included in Other current assets in the accompanying consolidated balance sheet.
(b)
Includes $
10
million recorded in Other current liabilities and $
1
million recorded in Other liabilities in the accompanying consolidated balance sheet.
(c)
Includes $
7
million recorded in Other current liabilities and $
2
million recorded in Other liabilities in the accompanying consolidated balance sheet.
The above contracts are subject to enforceable master netting arrangements that provide rights of offset with each counterparty when amounts are payable on the same date in the same currency or in the case of certain specified defaults. Management has made an accounting policy election to not offset the fair value of recognized derivative assets and derivative liabilities in the balance sheet. The amounts owed to the counterparties and owed to the Company are considered immaterial with respect to each counterparty and in the aggregate with all counterparties.
International Paper sponsors and maintains the Retirement Plan of International Paper Company (the Pension Plan), a tax-qualified defined benefit pension plan that provides retirement benefits to substantially all U.S. salaried and hourly and union employees who work at a participating business unit.
The Pension Plan provides defined pension benefits based on years of credited service and either final average earnings (salaried employees and hourly employees receiving salaried benefits), hourly job rates or specified benefit rates (hourly and union employees).
Effective January 1, 2019, the Company froze participation, including credited service and compensation, for salaried employees under the Pension Plan, the Pension Restoration Plan and the SERP plan. This change does not affect benefits accrued through December 31, 2018. For service after December 31, 2018, employees affected by the freeze receive a company contribution to their individual Retirement Savings Account.
25
Net periodic pension (income) expense for our qualified and nonqualified U.S. defined benefit plans comprised the following:
|
Three Months Ended
June 30, |
Six Months Ended
June 30, |
||||||||||||||||||||||
| In millions | 2021 | 2020 | 2021 | 2020 | |||||||||||||||||||
| Service cost | $ |
|
$ |
|
$ |
|
$ |
|
|||||||||||||||
| Interest cost |
|
|
|
|
|||||||||||||||||||
| Expected return on plan assets |
(
|
(
|
(
|
(
|
|||||||||||||||||||
| Actuarial loss |
|
|
|
|
|||||||||||||||||||
| Amortization of prior service cost |
|
|
|
|
|||||||||||||||||||
| Net periodic pension (income) expense | $ |
(
|
$ |
|
$ |
(
|
$ |
|
|||||||||||||||
The components of net periodic pension (income) expense other than the Service cost component are included in Non-operating pension (income) expense in the Consolidated Statement of Operations.
The Company’s funding policy for our pension plans is to contribute amounts sufficient to meet legal funding requirements, plus any additional amounts that the Company may determine to be appropriate considering the funded status of the plan, tax deductibility, the cash flows generated by the Company, and other factors. The Company made
no
voluntary cash contributions to the qualified pension plan in the first six months of 2021 or 2020. The nonqualified defined benefit plans are funded to the extent of benefit payments, which totaled $
11
million for the six months ended June 30, 2021.
International Paper has an Incentive Compensation Plan (ICP) which is administered by the Management Development and Compensation Committee of the Board of Directors (the Committee). The ICP authorizes the grants of restricted stock, restricted or deferred stock units, performance awards payable in cash or stock upon the attainment of specified performance goals, dividend equivalents, stock options, stock appreciation rights, other stock-based awards and cash-based awards at the discretion of the Committee. As of June 30, 2021,
7.2
million shares were available for grant under the ICP.
Stock-based compensation expense and related income tax benefits were as follows:
|
Three Months Ended
June 30, |
Six Months Ended
June 30, |
||||||||||||||||||||||
| In millions | 2021 | 2020 | 2021 | 2020 | |||||||||||||||||||
| Total stock-based compensation expense (selling and administrative) | $ |
|
$ |
|
$ |
|
$ |
|
|||||||||||||||
| Income tax benefits related to stock-based compensation |
(
|
|
|
|
|||||||||||||||||||
At June 30, 2021, $
130
million, net of estimated forfeitures, of compensation cost related to unvested restricted performance shares, executive continuity awards and restricted stock attributable to future service had not yet been recognized. This amount will be recognized in expense over a weighted-average period of
2.1
years.
Performance Share Plan
During the first six months of 2021, the Company granted
2.0
million performance units at an average grant date fair value of $
53.15
.
International Paper’s business segments, Industrial Packaging, Global Cellulose Fibers and Printing Papers, are consistent with the internal structure used to manage these businesses. All segments are differentiated on a common product, common customer basis consistent with the business segmentation generally used in the Forest Products industry.
26
Business segment operating profits are used by International Paper's management to measure the earnings performance of its businesses. Management believes that this measure allows a better understanding of trends in costs, operating efficiencies, prices and volumes. Business segment operating profits are defined as earnings (loss) before income taxes and equity earnings, but including the impact of noncontrolling interests, and excluding interest expense, net, corporate expenses, net, corporate net special items, business net special items and non-operating pension expense.
Net sales by business segment for the three months and six months ended June 30, 2021 and 2020 were as follows:
|
Three Months Ended
June 30, |
Six Months Ended
June 30, |
||||||||||||||||||||||
| In millions | 2021 | 2020 | 2021 | 2020 | |||||||||||||||||||
| Industrial Packaging | $ |
|
$ |
|
$ |
|
$ |
|
|||||||||||||||
| Global Cellulose Fibers |
|
|
|
|
|||||||||||||||||||
| Printing Papers |
|
|
|
|
|||||||||||||||||||
| Corporate and Intersegment Sales |
|
|
|
|
|||||||||||||||||||
| Net Sales | $ |
|
$ |
|
$ |
|
$ |
|
|||||||||||||||
Operating profit (loss) by business segment for the three months and six months ended June 30, 2021 and 2020 were as follows:
|
Three Months Ended
June 30, |
Six Months Ended
June 30, |
||||||||||||||||||||||
| In millions | 2021 | 2020 | 2021 | 2020 | |||||||||||||||||||
| Industrial Packaging | $ |
|
$ |
|
$ |
|
$ |
|
|||||||||||||||
| Global Cellulose Fibers |
|
(
|
(
|
(
|
|||||||||||||||||||
| Printing Papers |
|
(
|
|
|
|||||||||||||||||||
| Business Segment Operating Profits | $ |
|
|
$ |
|
$ |
|
||||||||||||||||
| Earnings (loss) before income taxes and equity earnings | $ |
|
$ |
|
$ |
|
$ |
|
|||||||||||||||
| Interest expense, net |
|
|
|
|
|||||||||||||||||||
| Noncontrolling interests adjustment |
(
|
|
(
|
|
|||||||||||||||||||
| Corporate expenses, net |
|
(
|
|
|
|||||||||||||||||||
| Corporate net special items |
|
|
|
|
|||||||||||||||||||
| Business net special items |
(
|
|
(
|
|
|||||||||||||||||||
| Non-operating pension expense (income) |
(
|
(
|
(
|
(
|
|||||||||||||||||||
| Business Segment Operating Profits | $ |
|
$ |
|
$ |
|
$ |
|
|||||||||||||||
27
The following discussion and analysis of our financial condition and results of operations should be read in conjunction with our condensed consolidated financial statements and related notes included in "Financial Statements and Supplementary Data" of this Quarterly Report on Form 10-Q (this "Form 10-Q") and the Company's Annual Report on Form 10-K for the year ended December 31, 2020 (our "Annual Report"). In addition to historical consolidated financial information, the following discussion contains forward-looking statements that reflect our plans, estimates, and beliefs that involve significant risks and uncertainties. Our actual results could differ materially from those discussed in the forward-looking statements. Factors that could cause or contribute to those differences include those discussed below and in our Annual Report, particularly under "Forward-Looking Statements" of this Form 10-Q and "Risk Factors" and "Forward-Looking Statements" of our Annual Report.
EXECUTIVE SUMMARY
Net earnings (loss) attributable to International Paper common shareholders were $432 million ($1.09 per diluted share) in the second quarter of 2021, compared with $349 million ($0.88 per diluted share) in the first quarter of 2021 and $266 million ($0.67 per diluted share) in the second quarter of 2020. International Paper generated Adjusted operating earnings attributable to International Paper common shareholders (a non-GAAP measure defined below) of $421 million ($1.06 per diluted share) in the second quarter of 2021, compared with $299 million ($0.76 per diluted share) in the first quarter of 2021 and $305 million ($0.77 per diluted share) in the second quarter of 2020.
During the second quarter 2021, International Paper delivered solid earnings growth and strong cash generation. The strong demand momentum in the first quarter continued in the second quarter across our three businesses, with very strong demand for corrugated packaging and containerboard and solid demand for fluff pulp. In our Printing Papers business, demand recovery accelerated in the second quarter 2021 in our key geographies. Revenue grew by 15% year-over-year on higher volume and price realization of prior price increases across our three business segments. Our mills and converting system performed well; however, we operated with extremely low containerboard inventory across our packaging network due to the lingering effects of the winter storm in the first quarter. These operating conditions, along with substantial planned maintenance activity and a severely stressed transportation environment, adversely affected volume and operating costs in the second quarter.
Input costs and freight were a significant headwind in the second quarter, primarily driven by higher costs for recovered fiber chemicals and distribution costs.
With respect to capital allocation, in the second quarter we reduced debt by $796 million and returned $258 million to shareholders through dividends and share repurchases.
We also monetized our remaining investment in Graphic Packaging for about $400 million.
Finally, we continue to make excellent progress on the spin-off of our Printing Papers business, which we expect to complete on October 1, 2021.
Comparing our performance in the second quarter 2021 to the first quarter 2021, price and mix increased significantly, driven by strong price realization of prior price increases across all our business segments. Volume in the second quarter 2021 was essentially flat as compared to the first quarter 2021. Second quarter 2021 volume in our North America Packaging business was constrained by low containerboard inventory levels and fluff shipments were hampered by significant port congestion, while volume for printing papers increased across our key regions on continued demand recovery. Our mills and converting plants performed well; although, operating costs were adversely impacted by a highly stressed supply chain environment affecting both inbound materials and outbound shipments, as well as exceptionally low containerboard inventory conditions in our North America packaging system. Planned maintenance outage costs increased sequentially as we completed our highest maintenance quarter of the year. Across the Company, during the first half of the year we completed nearly 65% of our planned maintenance spend for 2021. Input costs were a significant headwind in the second quarter 2021 for most materials, with recovered fiber costs being the largest driver of the unfavorable sequential quarter variance. Additionally, transportation conditions remain challenging across all modes, putting further cost pressure on all inbound materials. Equity earnings improved significantly from the first quarter 2021 on very strong performance from our Ilim joint venture.
Looking ahead to the third quarter 2021, as compared to the second quarter of 2021, in our Industrial Packaging business, we expect higher price and mix on the continued flow-through of our March 2021 price increase in North America. Volume is expected to be stable, with higher volume in North America offset by lower volume in our EMEA packaging business. Operations and costs are expected to improve, with the North America system befitting from a gradual recovery of containerboard inventory levels. Maintenance outage expense is expected to decrease significantly following our highest maintenance outage quarter this year. Input costs are expected to be higher, driven primarily by higher recovered fiber costs. In our Global Cellulose Fibers business, we expect price and mix to improve significantly on price realization of prior period price increases. Volume is expected to be higher with continued solid demand for fluff pulp. Operations and costs are expected to be slightly unfavorable due to continued supply chain stress from port congestion. Maintenance outage expenses are expected to
28
decrease and input costs are expected to increase on higher wood and chemical costs. In our Printing Papers business, we expect price and mix to increase on price flow-through of previously announced increases.
Volume is expected to be moderately higher. Operations and costs are expected to be stable and maintenance outage expenses are expected to decrease. Input costs are expected to increase on higher wood costs. Equity earnings from our Ilim joint venture are expected to be flat, sequentially.
On March 11, 2020 the World Health Organization (WHO) declared the novel strain of coronavirus (COVID-19) a global pandemic and recommended containment and mitigation measures worldwide. Many of these restrictive measures have been lifted or reduced as the number of COVID-19 cases has declined in the United States and various other countries in comparison to earlier levels at the height of the pandemic, and economic conditions have improved. In addition, most of our manufacturing and converting facilities have remained open and operational during the pandemic and at the current time our manufacturing and converting facilities are generally operational.
The pandemic has had a mixed impact on demand for our products. Demand for printing papers products initially was significantly impacted by the pandemic, but has seen a steady increase over the first half of 2021. Demand for our pulp, containerboard and corrugated box products has not been negatively impacted and in some cases has been positively impacted by COVID-19 to date. However, all of our operations have experienced higher supply chain costs and constrained transportation due in part to the impacts of COVID-19.
There continue to be significant uncertainties associated with the COVID-19 pandemic, including with respect to the various economic reopening plans and the resurgence of new variants of the virus in many areas globally; additional actions that may be taken by governmental authorities and private businesses to attempt to contain the COVID-19 outbreak or to mitigate its impact; the efficacy and, availability of various vaccines and associated levels of vaccination, as well as the possibility that strains of the virus may be resistant to current available vaccines; and the impact of COVID-19 on unemployment, economic activity and consumer confidence. COVID-19 has significantly adversely affected portions of our business, and could have a material adverse effect on our financial condition, results of operations and cash flows if public health and/or global economic conditions deteriorate.
Adjusted operating earnings and Adjusted operating earnings per share are non-GAAP measures and are defined as net earnings (loss) attributable to International Paper (a GAAP measure) excluding net special items and non-operating pension expense (income). Net earnings (loss) and Diluted earnings (loss) per share attributable to common shareholders are the most directly comparable GAAP measures. The Company calculates Adjusted operating earnings by excluding the after-tax effect of non-operating pension expense (income) and items considered by management to be unusual (net special items) from the earnings reported under GAAP. Adjusted operating earnings per share is calculated by dividing Adjusted operating earnings by diluted average shares of common stock outstanding. Management uses these measures to focus on on-going operations, and believes that these measures are useful to investors because such measures enable investors to perform meaningful comparisons of past and present consolidated operating results. The Company believes that using this information, along with the most directly comparable GAAP measures, provide for a more complete analysis of the results of operations.
The following are reconciliations of Earnings (loss) attributable to common shareholders to Adjusted operating earnings (loss) attributable to common shareholders on a total and per share basis. Additional detail is provided later in this Form 10-Q regarding the net special items referenced in the charts below.
|
Three Months Ended
June 30, |
Three Months Ended March 31, | ||||||||||||||||
| In millions | 2021 | 2020 | 2021 | ||||||||||||||
| Net Earnings (Loss) Attributable to International Paper Company | $ | 432 | $ | 266 | $ | 349 | |||||||||||
| Add Back - Non-operating pension expense (income) | (52) | (14) | (53) | ||||||||||||||
| Add Back - Net special items expense (income) | 23 | 68 | (17) | ||||||||||||||
| Income tax effect - Non-operating pension and net special items expense | 18 | (15) | 20 | ||||||||||||||
| Adjusted Operating Earnings (Loss) Attributable to International Paper Company | $ | 421 | $ | 305 | $ | 299 | |||||||||||
29
|
Three Months Ended
June 30, |
Three Months Ended March 31, | ||||||||||||||||
| In millions | 2021 | 2020 | 2021 | ||||||||||||||
| Diluted Earnings (Loss) Per Share Attributable to International Paper Company Common Shareholders | $ | 1.09 | $ | 0.67 | $ | 0.88 | |||||||||||
| Add Back - Non-operating pension expense (income) per share | (0.13) | (0.04) | (0.13) | ||||||||||||||
| Add Back - Net special items expense (income) per share | 0.06 | 0.17 | (0.04) | ||||||||||||||
| Income tax effect per share - Non-operating pension and net special items expense | 0.04 | (0.03) | 0.05 | ||||||||||||||
| Adjusted Operating Earnings (Loss) Per Share Attributable to International Paper Company Common Shareholders | $ | 1.06 | $ | 0.77 | $ | 0.76 | |||||||||||
Cash provided by operations totaled $1.3 billion and $1.5 billion for the first six months of 2021 and 2020, respectively. The Company generated free cash flow of approximately $1.1 billion and $1.0 billion in the first six months of 2021 and 2020, respectively. Free cash flow is a non-GAAP measure and the most directly comparable GAAP measure is cash provided by operations. Management utilizes this measure in connection with managing our business and believes that free cash flow is useful to investors as a liquidity measure because it measures the amount of cash generated that is available, after reinvesting in the business, to maintain a strong balance sheet, pay dividends, repurchase stock, service debt and make investments for future growth. It should not be inferred that the entire free cash flow amount is available for discretionary expenditures. By adjusting for certain items that are not indicative of the Company's ongoing performance, we believe that free cash flow also enables investors to perform meaningful comparisons between past and present periods.
The following is a reconciliation of cash provided by operations to free cash flow:
|
Six Months Ended
June 30, |
|||||||||||
| In millions | 2021 | 2020 | |||||||||
| Cash provided by operations | $ | 1,278 | $ | 1,539 | |||||||
| Adjustments: | |||||||||||
| Cash invested in capital projects, net of insurance recoveries | (222) | (538) | |||||||||
| Free Cash Flow | $ | 1,056 | $ | 1,001 | |||||||
The non-GAAP financial measures presented in this Form 10-Q as referenced above have limitations as analytical tools and should not be considered in isolation or as a substitute for an analysis of our results calculated in accordance with GAAP. In addition, because not all companies utilize identical calculations, the Company's presentation of non-GAAP measures in this Form 10-Q may not be comparable to similarly titled measures disclosed by other companies, including companies in the same industry as the Company.
For the second quarter of 2021, International Paper Company reported net sales of $5.6 billion, compared with $5.4 billion in the first quarter of 2021 and $4.9 billion in the second quarter of 2020.
Net earnings (loss) attributable to International Paper totaled $432 million, or $1.09 per diluted share, in the second quarter of 2021. This compared with $349 million, or $0.88 per diluted share, in the first quarter of 2021 and $266 million, or $0.67 per diluted share, in the second quarter of 2020.
30
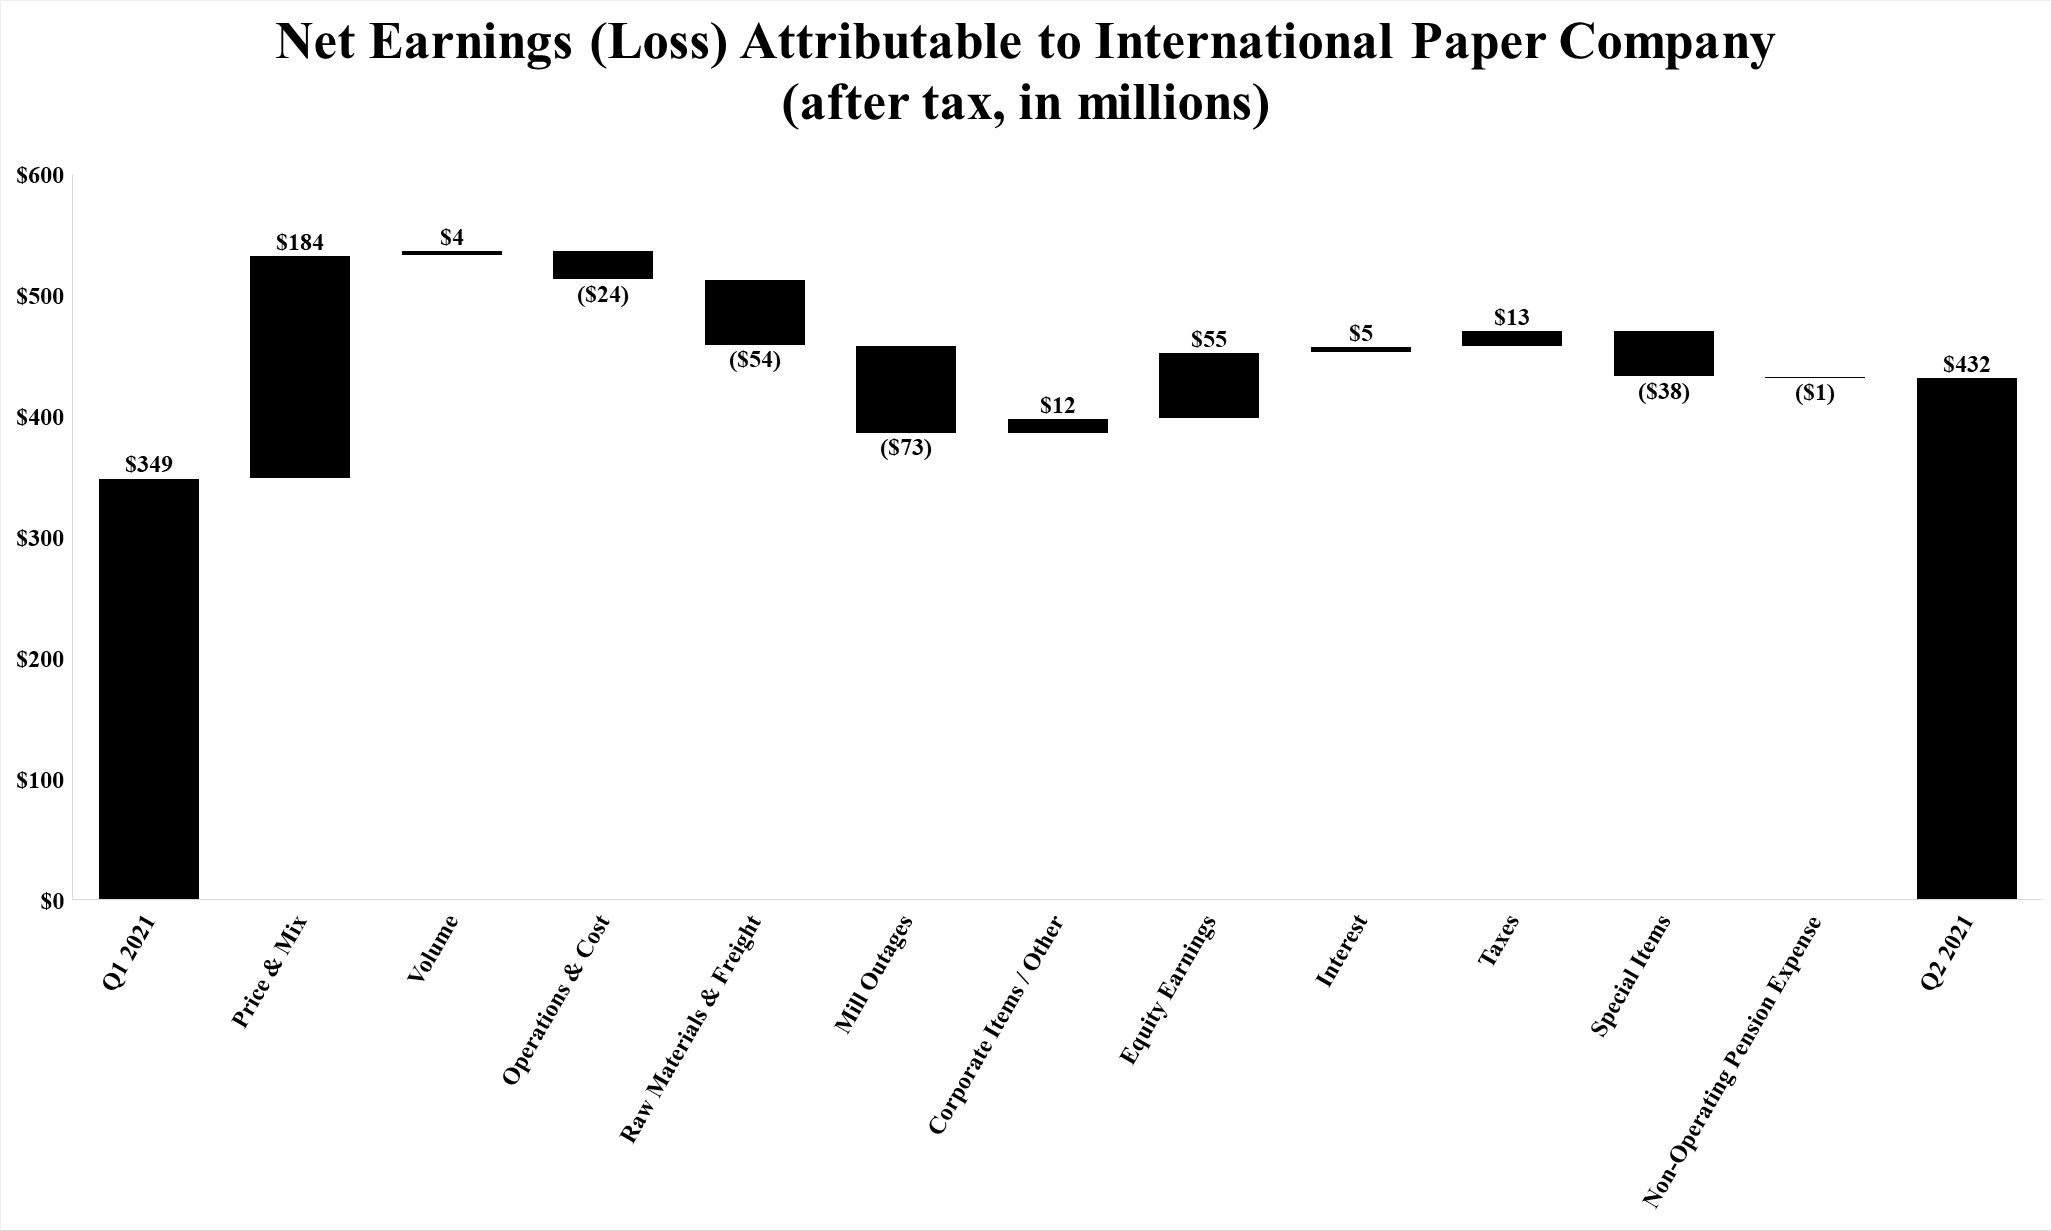
Compared with the first quarter of 2021, earnings benefited from higher average sales prices and a favorable mix ($184 million), higher sales volumes ($4 million), lower corporate and other items ($12 million), lower net interest expense ($5 million) and lower tax expense ($13 million). These benefits were offset by higher operating costs ($24 million), higher raw material and freight costs ($54 million), higher mill maintenance outage costs ($73 million) and higher non-operating pension expense ($1 million). Equity earnings, net of taxes, relating to International Paper’s investments in Ilim S.A., Graphic Packaging International Partners, LLC, and other investments were $55 million higher than in the first quarter of 2021. Net special items in the second quarter of 2021 were a loss of $28 million compared with a gain of $10 million in the first quarter of 2021.
31
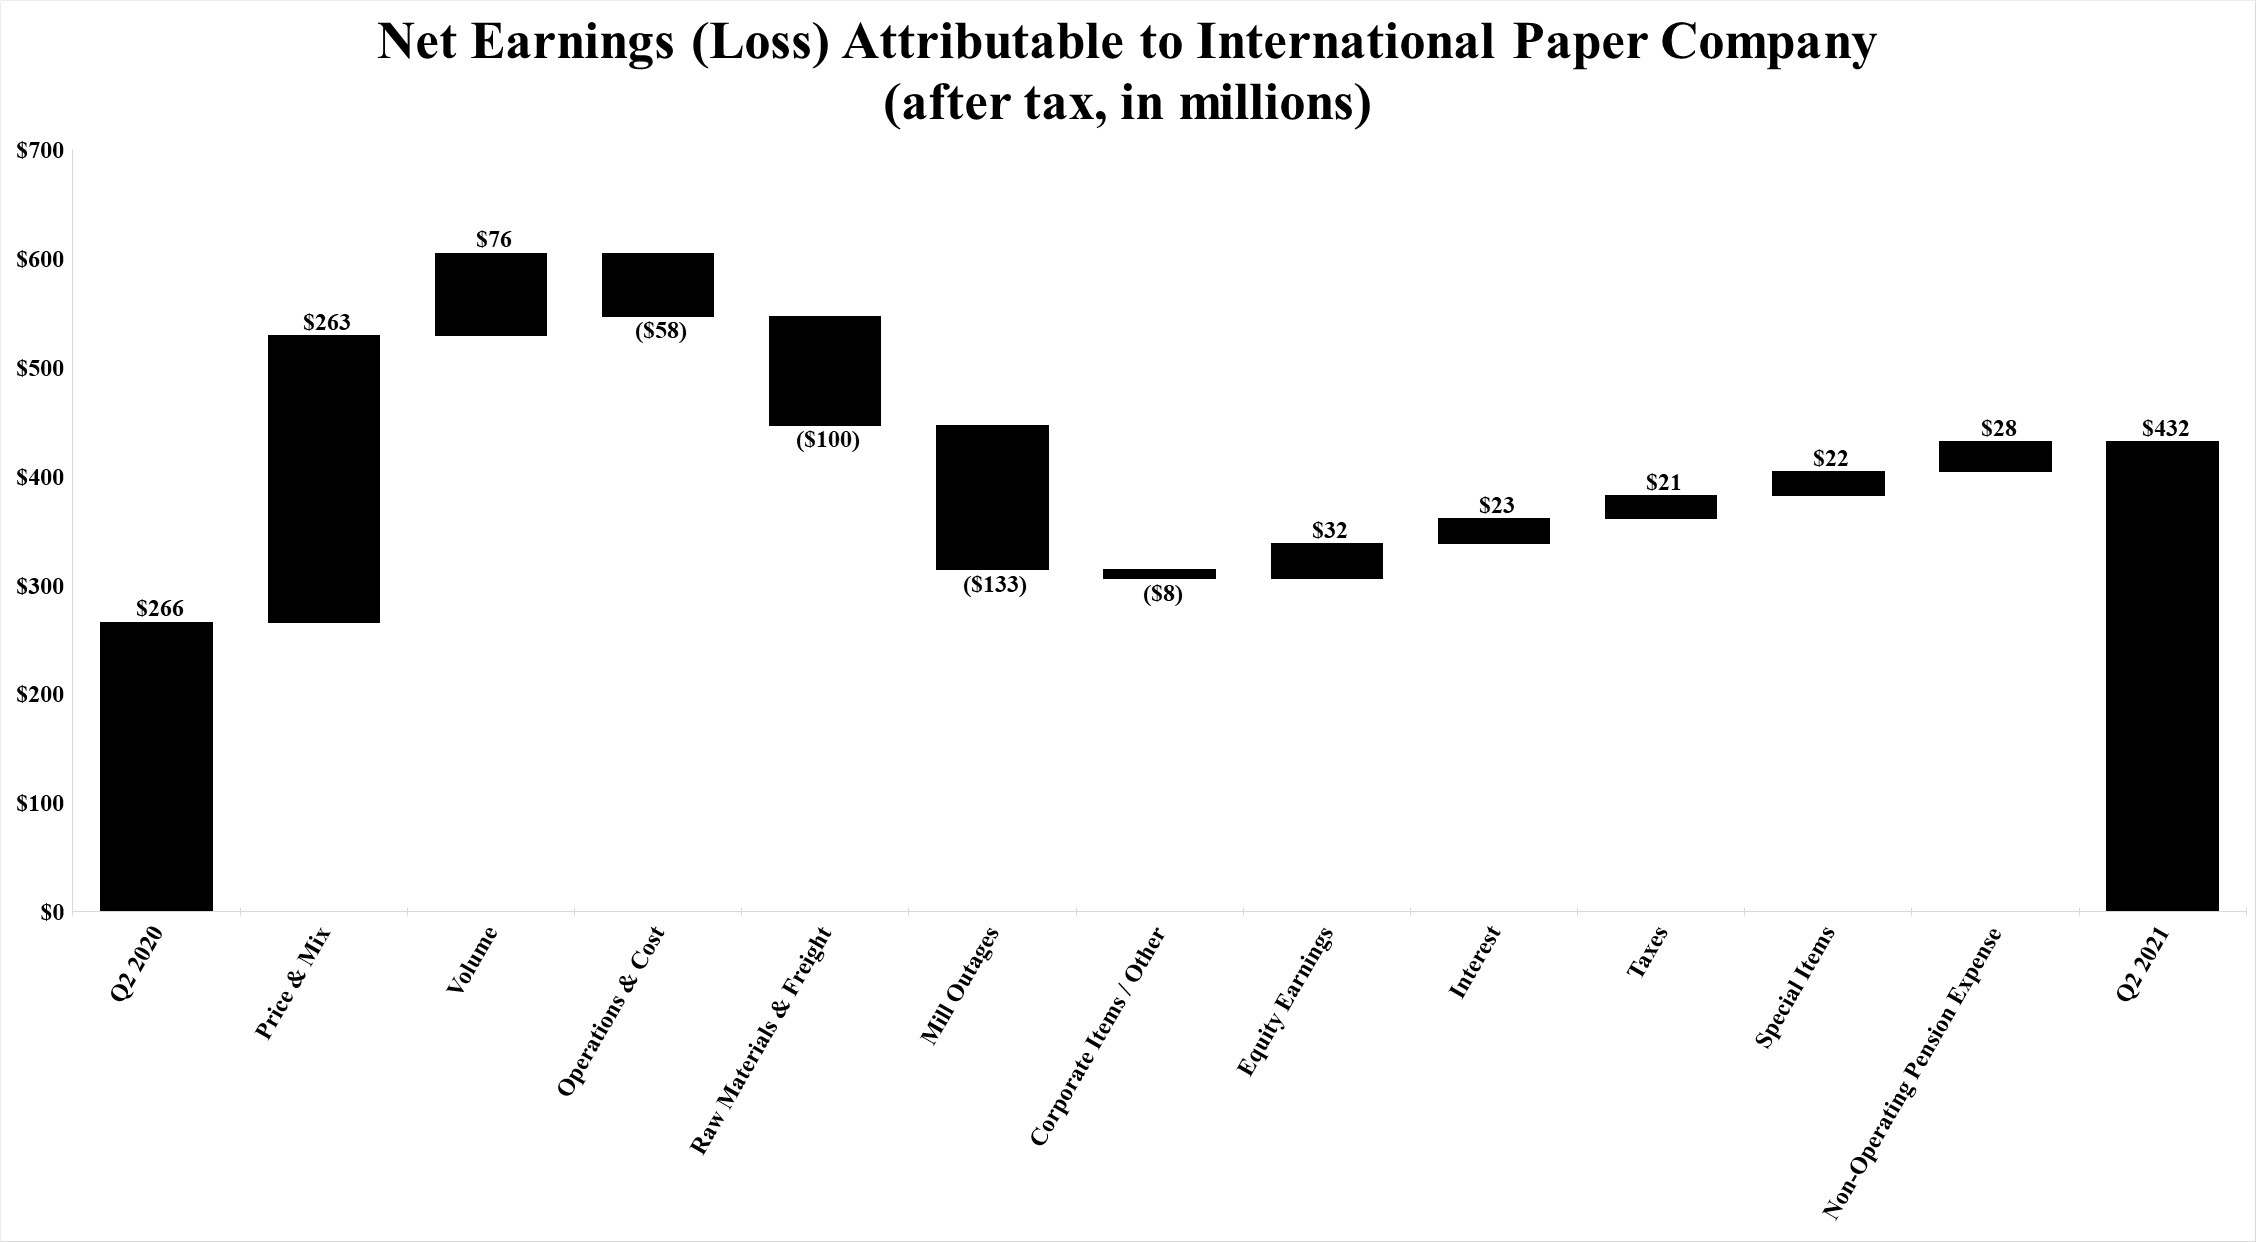
Compared with the second quarter of 2020, the second quarter of 2021 reflects higher average sales prices and a favorable mix ($263 million), higher sales volumes ($76 million), lower net interest expense ($23 million), lower tax expense ($21 million) and lower non-operating pension expense ($28 million). These benefits were offset by higher operating costs ($58 million), higher raw material and freight costs ($100 million), higher mill maintenance outage costs ($133 million) and higher corporate and other costs ($8 million). Equity earnings, net of taxes, relating to International Paper’s investments in Ilim S.A., Graphic Packaging International Partners, LLC, and other investments were $32 million higher in the second quarter of 2021 than in the second quarter of 2020. Net special items in the second quarter of 2021 were a loss of $28 million compared with a loss of $50 million in the second quarter of 2020.
Business segment operating profits are used by International Paper's management to measure the earnings performance of its businesses. Management uses this measure to focus on on-going operations, and believes that it is useful to investors because it enables them to perform meaningful comparisons of past and present operating results. International Paper believes that using this information, along with net earnings, provides a more complete analysis of the results of operations by quarter. Business segment operating profits are defined as earnings (loss) before income taxes and equity earnings, but including the impact of noncontrolling interests, and excluding interest expense, net, corporate expenses, net, corporate net special items, business net special items and non-operating pension expense. Business segment operating profits is a measure reported to our management for purposes of making decisions about allocating resources to our business segments and assessing the performance of our business segments and is presented in our financial statement footnotes in accordance with ASC 280.
International Paper operates in three segments: Industrial Packaging, Global Cellulose Fibers and Printing Papers.
32
The following table presents a reconciliation of Net earnings (loss) attributable to International Paper Company to its Total business segment operating profit:
| Three Months Ended | |||||||||||||||||
| June 30, | March 31, | ||||||||||||||||
| In millions | 2021 | 2020 | 2021 | ||||||||||||||
| Net Earnings (Loss) Attributable to International Paper Company | $ | 432 | $ | 266 | $ | 349 | |||||||||||
| Add back (deduct): | |||||||||||||||||
| Income tax provision (benefit) | 102 | 67 | 99 | ||||||||||||||
| Equity (earnings) loss, net of taxes | (104) | (72) | (49) | ||||||||||||||
| Noncontrolling interests, net of taxes | 2 | — | — | ||||||||||||||
| Earnings (Loss) Before Income Taxes and Equity Earnings | 432 | 261 | 399 | ||||||||||||||
| Interest expense, net | 57 | 116 | 92 | ||||||||||||||
| Noncontrolling interests included in operations | (1) | — | (1) | ||||||||||||||
| Corporate expenses, net | 7 | (3) | 25 | ||||||||||||||
| Corporate net special items | 101 | 54 | (31) | ||||||||||||||
| Business net special items | (50) | 14 | 14 | ||||||||||||||
| Non-operating pension expense (income) | (52) | (14) | (53) | ||||||||||||||
| Adjusted Operating Profit | $ | 494 | $ | 428 | $ | 445 | |||||||||||
| Business Segment Operating Profit (Loss): | |||||||||||||||||
| Industrial Packaging | $ | 408 | $ | 449 | $ | 447 | |||||||||||
| Global Cellulose Fibers | 10 | (10) | (82) | ||||||||||||||
| Printing Papers | 76 | (11) | 80 | ||||||||||||||
| Total Business Segment Operating Profit | $ | 494 | $ | 428 | $ | 445 | |||||||||||
33
Business Segment Operating Profit
Total business segment operating profits were $494 million in the second quarter of 2021, $445 million in the first quarter of 2021 and $428 million in the second quarter of 2020.
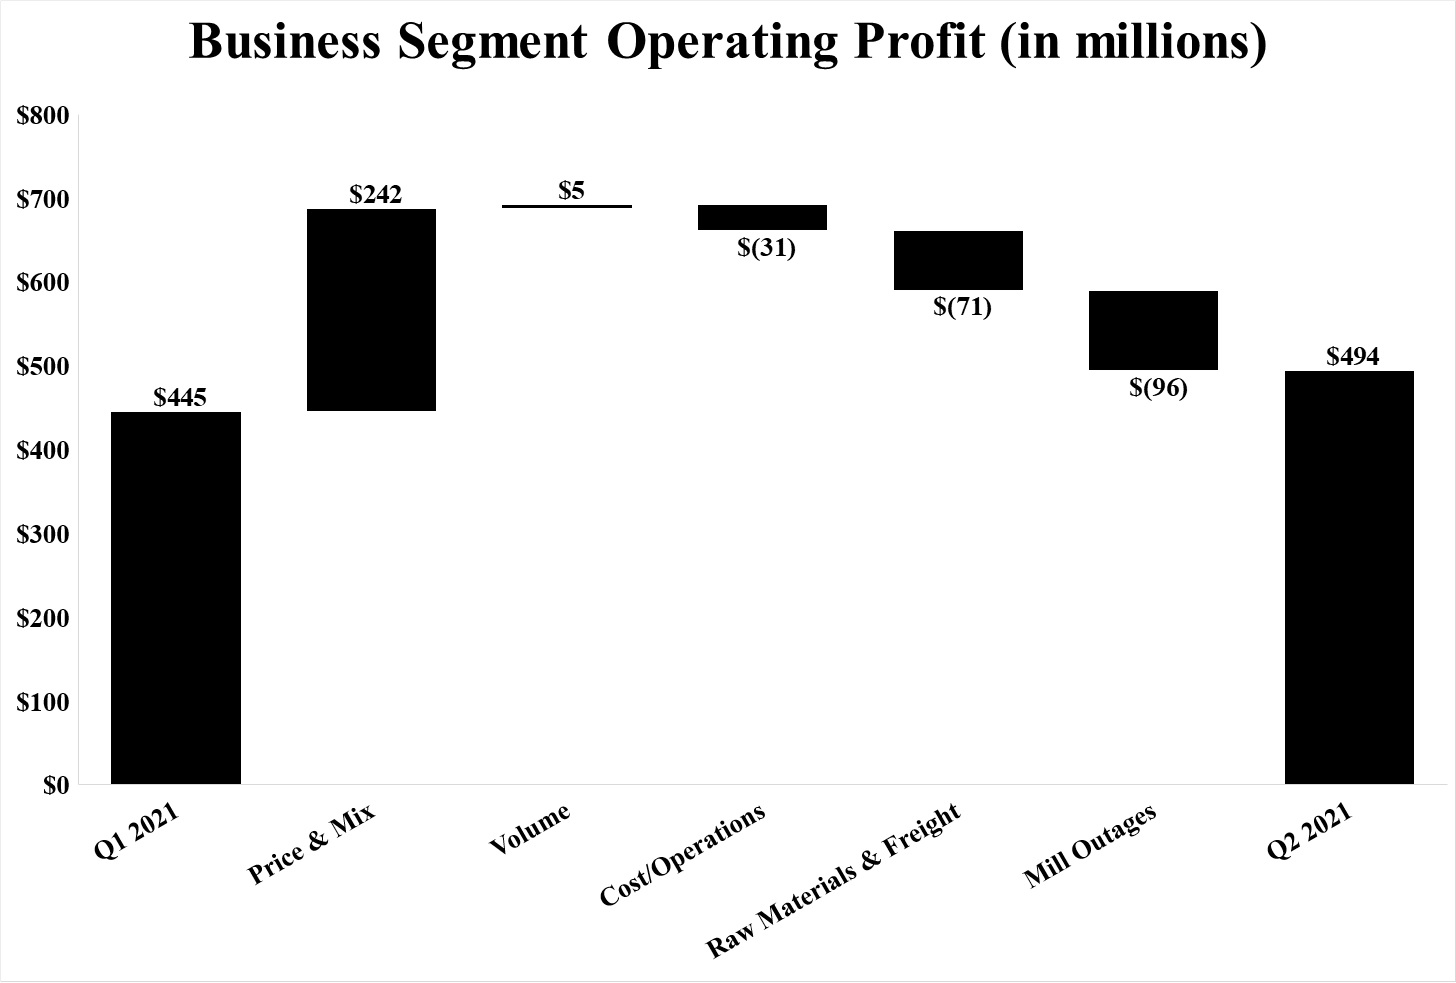
Compared with the first quarter of 2021, operating profits benefited from higher average sales prices and a favorable mix ($242 million) and higher sales volumes ($5 million). These benefits were offset by higher operating costs ($31 million), higher raw material and freight costs ($71 million) and higher mill outage costs ($96 million).
34
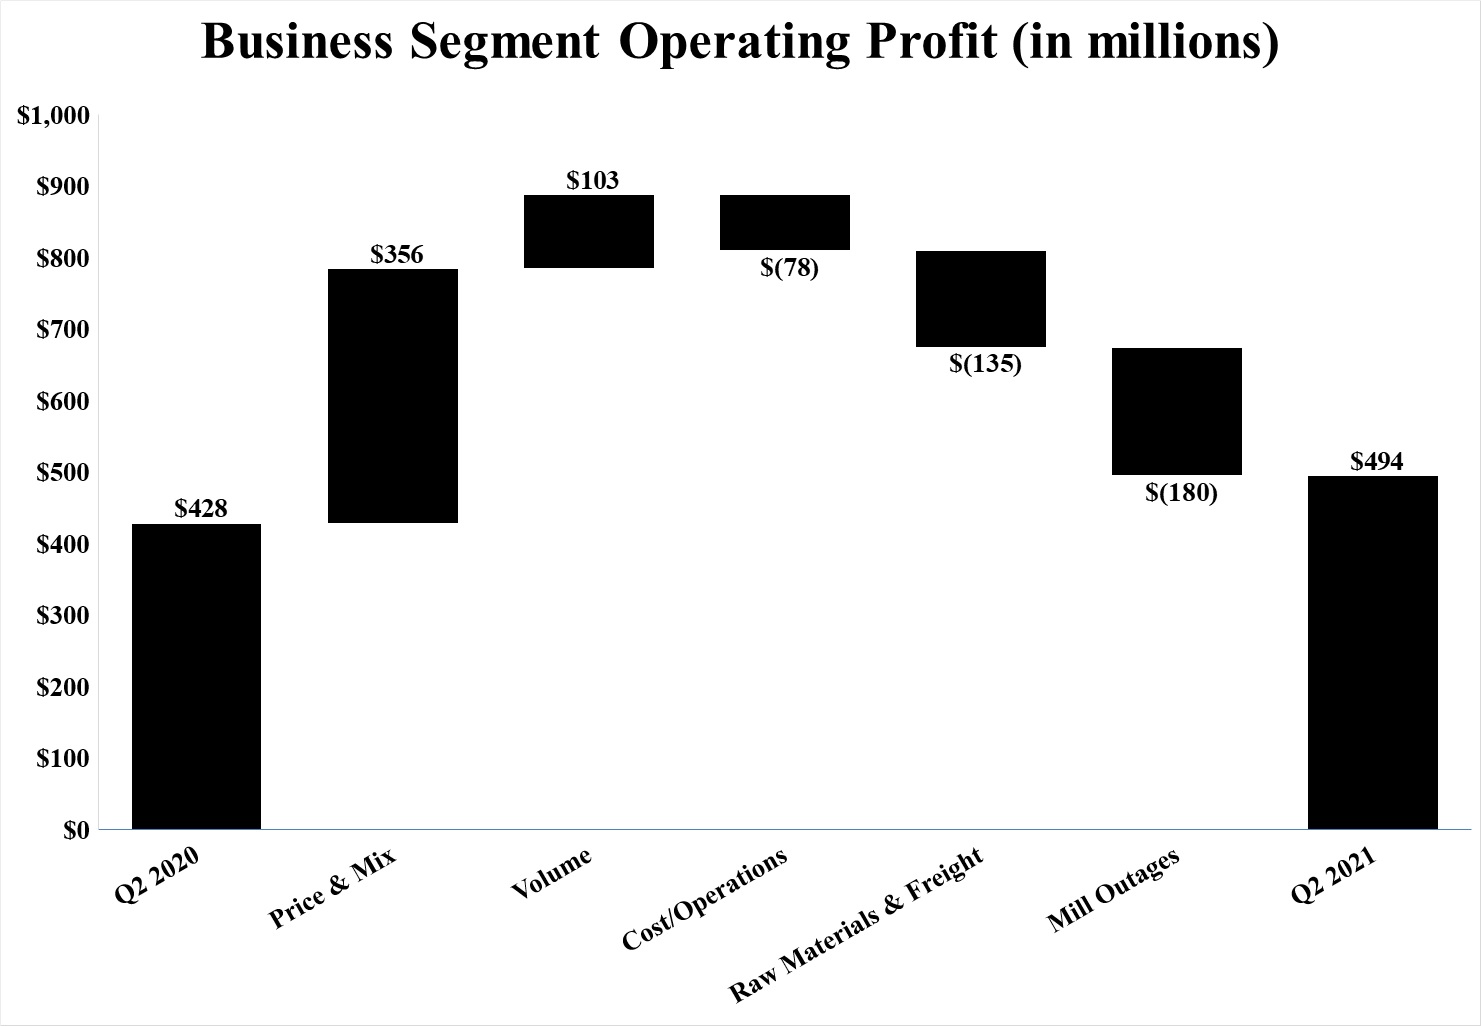
Compared with the second quarter of 2020, operating profits in the current quarter benefited from higher average sales prices and a favorable mix ($356 million) and higher sales volumes ($103 million). These benefits were offset by higher operating costs ($78 million), higher raw material and freight costs ($135 million) and higher mill outage costs ($180 million).
35
Sales Volumes by Product (a)
Sales volumes of major products for the three months and six months ended June 30, 2021 and 2020 were as follows:
|
Three Months Ended
June 30, |
Six Months Ended
June 30, |
||||||||||||||||||||||
| In thousands of short tons (except as noted) | 2021 | 2020 | 2021 | 2020 | |||||||||||||||||||
| Industrial Packaging | |||||||||||||||||||||||
| Corrugated Packaging (b) | 2,733 | 2,571 | 5,417 | 5,195 | |||||||||||||||||||
| Containerboard | 699 | 783 | 1,408 | 1,610 | |||||||||||||||||||
| Recycling | 568 | 520 | 1,126 | 1,089 | |||||||||||||||||||
| Saturated Kraft | 50 | 39 | 95 | 87 | |||||||||||||||||||
| Gypsum/Release Kraft | 68 | 48 | 123 | 104 | |||||||||||||||||||
| Bleached Kraft | 6 | 8 | 13 | 15 | |||||||||||||||||||
| EMEA Packaging (b) | 410 | 375 | 845 | 816 | |||||||||||||||||||
| Brazilian Packaging (b) | — | 83 | — | 173 | |||||||||||||||||||
| European Coated Paperboard | 102 | 95 | 211 | 206 | |||||||||||||||||||
| Industrial Packaging | 4,636 | 4,522 | 9,238 | 9,295 | |||||||||||||||||||
|
Global Cellulose Fibers
(in thousands of metric tons)
(c)
|
851 | 965 | 1,749 | 1,866 | |||||||||||||||||||
| Printing Papers | |||||||||||||||||||||||
| U.S. Uncoated Papers | 379 | 247 | 725 | 662 | |||||||||||||||||||
| European and Russian Uncoated Papers | 327 | 271 | 634 | 631 | |||||||||||||||||||
| Brazilian Uncoated Papers | 272 | 150 | 526 | 390 | |||||||||||||||||||
| Printing Papers | 978 | 668 | 1,885 | 1,683 | |||||||||||||||||||
(a)
Sales volumes include third party and inter-segment sales and exclude sales of equity investees.
(b)
Volumes for corrugated box sales reflect consumed tons sold (CTS). Board sales for these businesses reflect invoiced tons.
(c)
Includes North American, European and Brazilian volumes and internal sales to mills.
Income Taxes
An income tax provision of $102 million was recorded for the second quarter of 2021 and the reported effective income tax rate was 24%. Excluding expense of $5 million related to the tax effects of net special items and expense of $13 million related to the tax effects of non-operating pension expense, the effective income tax rate was 21% for the quarter.
An income tax provision of $99 million was recorded for the first quarter of 2021 and the reported effective income tax rate was 25%. Excluding expense of $7 million related to the tax effects of net special items and expense of $13 million related to the tax effects of non-operating pension expense, the effective income tax rate was 24% for the quarter.
An income tax provision of $67 million was recorded for the second quarter of 2020 and the reported effective income tax rate was 26%. Excluding a benefit of $18 million related to the tax effects of net special items and expense of $3 million related to the tax effects of non-operating pension expense, the effective income tax rate was 26% for the quarter.
Interest Expense
Net interest expense was $57 million which includes interest income of $28 million related to a foreign value-added tax credit accrual in the second quarter of 2021, compared with $92 million in the first quarter of 2021 and $116 million in the second quarter of 2020.
36
Effects of Net Special Items and Non-Operating Pension Expense
Details of net special items and non-operating pension expense (income) for the three months ended are as follows:
| Three Months Ended | ||||||||||||||||||||||||||||||||||||||
| June 30, | March 31, | |||||||||||||||||||||||||||||||||||||
| 2021 | 2020 | 2021 | ||||||||||||||||||||||||||||||||||||
| In millions | Before Tax | After Tax | Before Tax | After Tax | Before Tax | After Tax | ||||||||||||||||||||||||||||||||
| Business Segments | ||||||||||||||||||||||||||||||||||||||
| Foreign value-added tax credit accrual | $ | (42) | $ | (28) | (a) | $ | — | $ | — | $ | — | $ | — | |||||||||||||||||||||||||
| EMEA Packaging impairment - Turkey | (8) | (2) | (b) | — | — | 2 | 2 | (b) | ||||||||||||||||||||||||||||||
| Brazil Packaging impairment | — | — | 9 | 7 | (b) | — | — | |||||||||||||||||||||||||||||||
| Abandoned property removal | — | — | 5 | 4 | (c) | — | — | |||||||||||||||||||||||||||||||
| EMEA Packaging business optimization | — | — | — | — | 12 | 10 | (b) | |||||||||||||||||||||||||||||||
| Business Segments Total | (50) | (30) | 14 | 11 | 14 | 12 | ||||||||||||||||||||||||||||||||
| Corporate | ||||||||||||||||||||||||||||||||||||||
| Debt extinguishment costs | 170 | 128 | 18 | 13 | 18 | 14 | ||||||||||||||||||||||||||||||||
| Printing Papers spin-off / Build a Better IP | 28 | 23 | — | — | 25 | 20 | ||||||||||||||||||||||||||||||||
| Real estate - office impairment | 21 | 16 | — | — | — | — | ||||||||||||||||||||||||||||||||
| Environmental remediation reserve adjustment | 5 | 3 | — | — | — | — | ||||||||||||||||||||||||||||||||
| Asbestos litigation reserve adjustment | — | — | 43 | 33 | — | — | ||||||||||||||||||||||||||||||||
| Gain on sale of equity investment in Graphic Packaging | (130) | (98) | — | — | (74) | (56) | ||||||||||||||||||||||||||||||||
| Inida transaction | — | — | (6) | (6) | — | — | ||||||||||||||||||||||||||||||||
| Other | 7 | 5 | (1) | (1) | — | — | ||||||||||||||||||||||||||||||||
| Corporate Total | 101 | 77 | 54 | 39 | (31) | (22) | ||||||||||||||||||||||||||||||||
| Total net special items | 51 | 47 | 68 | 50 | (17) | (10) | ||||||||||||||||||||||||||||||||
| Non-operating pension expense (income) | (52) | (39) | (14) | (11) | (53) | (40) | ||||||||||||||||||||||||||||||||
| Total net special items and non-operating pension expense (income) | $ | (1) | $ | 8 | $ | 54 | $ | 39 | $ | (70) | $ | (50) | ||||||||||||||||||||||||||
(a) Recorded in the Printing Papers segment.
(b) Recorded in the Industrial Packaging segment.
(c) Includes $3 million ($2 million after taxes) recorded in the Industrial Packaging segment and $2 million (before and after taxes) recorded in the Global Cellulose Fibers segment.
37
Details of net special items and non-operating pension expense for the six months ended are as follows:
|
Six Months Ended
June 30, |
|||||||||||||||||||||||||||||
| 2021 | 2020 | ||||||||||||||||||||||||||||
| In millions | Before Tax | After Tax | Before Tax | After Tax | |||||||||||||||||||||||||
| Business Segments | |||||||||||||||||||||||||||||
| EMEA Packaging business optimization | $ | 12 | $ | 10 | (a) | $ | — | $ | — | ||||||||||||||||||||
| Brazil Packaging impairment | — | — | 353 | 344 | (a) | ||||||||||||||||||||||||
| Abandoned property removal | — | — | 14 | 11 | (b) | ||||||||||||||||||||||||
| Riverdale mill conversion | — | — | 1 | 1 | (c) | ||||||||||||||||||||||||
| Foreign value-added tax credit accrual | (42) | (28) | (c) | (2) | (1) | (a) | |||||||||||||||||||||||
| EMEA Packaging impairment - Turkey | (6) | — | (a) | — | — | ||||||||||||||||||||||||
| Business Segments Total | (36) | (18) | $ | 366 | $ | 355 | |||||||||||||||||||||||
| Corporate | |||||||||||||||||||||||||||||
| Debt extinguishment costs | 188 | 142 | 26 | 19 | |||||||||||||||||||||||||
| Printing Papers spin-off / Build a Better IP | 53 | 43 | — | — | |||||||||||||||||||||||||
| Real estate - office impairment | 21 | 16 | — | — | |||||||||||||||||||||||||
| Environmental remediation reserve adjustment | 5 | 3 | 41 | 31 | |||||||||||||||||||||||||
| Asbestos litigation reserve adjustment | — | — | 43 | 33 | |||||||||||||||||||||||||
| India transaction | — | — | 11 | 11 | |||||||||||||||||||||||||
| Gain on sale of equity investment in Graphic Packaging | (204) | (154) | (33) | (25) | |||||||||||||||||||||||||
| Other | 7 | 5 | (2) | (2) | |||||||||||||||||||||||||
| Corporate Total | 70 | 55 | $ | 86 | $ | 67 | |||||||||||||||||||||||
| Total net special items | 34 | 37 | 452 | 422 | |||||||||||||||||||||||||
| Non-operating pension expense (income) | (105) | (79) | (20) | (16) | |||||||||||||||||||||||||
| Total net special items and non-operating pension expense (income) | $ | (71) | $ | (42) | $ | 432 | $ | 406 | |||||||||||||||||||||
(a) Recorded in the Industrial Packaging segment.
(b) Includes $9 million ($7 million after taxes) for the six months ended June 30, 2020 recorded in the Industrial Packaging segment and $5 million ($4 after taxes) for the six months ended June 30, 2020 recorded in the Global Cellulose Fibers segment.
(c) Recorded in the Printing Papers segment.
The following tables present net sales and business segment operating profit (loss) which is the Company's measure of segment profitability.
Industrial Packaging
| Total Industrial Packaging | 2021 | 2020 | |||||||||||||||||||||||||||||||||
| In millions | 2nd Quarter | 1st Quarter | Six Months | 2nd Quarter | 1st Quarter | Six Months | |||||||||||||||||||||||||||||
| Sales | $ | 4,056 | $ | 3,953 | $ | 8,009 | $ | 3,633 | $ | 3,819 | $ | 7,452 | |||||||||||||||||||||||
| Operating Profit (Loss) | $ | 408 | $ | 447 | $ | 855 | $ | 449 | $ | 470 | $ | 919 | |||||||||||||||||||||||
Industrial Packaging net sales for the second quarter of 2021 were 3% higher compared with the first quarter of 2021 and 12% higher compared with the second quarter of 2020. Operating profit was 9% lower in the second quarter of 2021 compared with the first quarter of 2021 and 9% lower compared with the second quarter of 2020.
| North American Industrial Packaging | 2021 | 2020 | |||||||||||||||||||||||||||||||||
| In millions | 2nd Quarter | 1st Quarter | Six Months | 2nd Quarter | 1st Quarter | Six Months | |||||||||||||||||||||||||||||
| Sales (a) | $ | 3,587 | $ | 3,485 | $ | 7,072 | $ | 3,241 | $ | 3,355 | $ | 6,596 | |||||||||||||||||||||||
| Operating Profit (Loss) | $ | 377 | $ | 395 | $ | 772 | $ | 434 | $ | 437 | $ | 871 | |||||||||||||||||||||||
38
(a)
Includes intra-segment sales of $27 million and $31 million for the three months ended June 30, 2021 and 2020, respectively; $26 million and $32 million for the three months ended March 31, 2021 and 2020, respectively; and $53 million and $63 million for the six months ended June 30, 2021 and 2020, respectively.
North American Industrial Packaging
sales volumes in the second quarter of 2021 were higher compared to the first quarter of 2021, reflecting higher shipments for boxes and domestic containerboard partially offset by lower shipments for export containerboard. E-commerce demand continues to be strong as online purchasing continues to be the preferred channel. Demand in the shipping and distribution and protein segments was also strong. Beverage and produce began to show recovery from food service closures. Total maintenance and economic downtime was about 153,000 tons higher in the second quarter of 2021 compared with the first quarter of 2021, driven by higher maintenance downtime. Average sales margins were significantly higher reflecting higher average sales prices for boxes and export containerboard and a favorable geographic mix. Operating costs were higher, as strong mill operations and the non-repeat of the winter storm impact were more than offset by higher transportation costs and incentive accruals. Planned maintenance downtime costs were $75 million higher in the second quarter of 2021 compared with the first quarter of 2021. Input costs were significantly higher, primarily for recovered fiber, distribution and wood.
Compared with the second quarter of 2020, sales volumes were higher in the second quarter of 2021 for boxes and domestic containerboard and lower for export containerboard. The COVID-19 pandemic has had a mixed impact on box demand, as strong growth in the e-commerce and shipping and distribution segments is partially offset by food service related segments. Food service related demand is beginning to show recovery from pandemic related closures. Total maintenance and economic downtime was about 111,000 tons higher in the second quarter of 2021, driven by higher maintenance downtime. Export containerboard and box prices were significantly higher reflecting previous price increases. Operating costs increased, driven by higher transportation costs and incentive accruals. Planned maintenance downtime costs were $126 million higher in the second quarter of 2021 compared with the second quarter of 2020. Input costs were significantly higher driven by recovered fiber, distribution, chemicals and energy.
Entering the third quarter of 2021, sales volumes for boxes are expected to be higher and export containerboard volumes are expected to be flat. Average sales margins are expected to be higher, reflecting previous price increases and a favorable mix. Operating costs are expected to be lower. Planned maintenance downtime costs are expected to be $117 million lower in the third quarter of 2021 compared with the second quarter of 2021. Input costs are expected to be higher primarily for recovered fiber, energy, chemicals and wood.
| EMEA Industrial Packaging | 2021 | 2020 | |||||||||||||||||||||||||||||||||
| In millions | 2nd Quarter | 1st Quarter | Six Months | 2nd Quarter | 1st Quarter | Six Months | |||||||||||||||||||||||||||||
| Sales | $ | 394 | $ | 396 | $ | 790 | $ | 297 | $ | 350 | $ | 647 | |||||||||||||||||||||||
| Operating Profit (Loss) | $ | 12 | $ | 26 | $ | 38 | $ | 5 | $ | 10 | $ | 15 | |||||||||||||||||||||||
EMEA Industrial Packaging
sales volumes for boxes in the second quarter of 2021 were lower compared with the first quarter of 2021 driven by seasonally lower volumes in Morocco. Average sales margins for boxes were lower reflecting increased containerboard costs, partially offset by a favorable box mix and higher containerboard prices. Operating costs were higher. There were no planned maintenance downtime outages in either the second quarter of 2021 or the first quarter of 2021. Input costs were higher, primarily for recovered fiber and energy. Earnings benefited from the recent box plant acquisitions in Spain. The company completed the sale of its business in Turkey during the second quarter of 2021.
Compared with the second quarter of 2020, sales volumes in the second quarter of 2021 were higher, reflecting recovery of the impacts of the COVID-19 pandemic. Average sales margins for boxes were lower driven by higher containerboard costs. Average sales margins for containerboard were higher reflecting higher sales prices. Operating costs improved reflecting strong operations and cost management. There were no planned maintenance downtime outages in the second quarter of 2020. Input costs were higher, primarily for recovered fiber and energy. Earnings benefited from the recent box plant acquisitions in Spain.
Looking ahead to the third quarter of 2021, sales volumes for boxes are expected to be seasonally lower, primarily in Morocco. Average sales margins are expected to be lower. Operating costs are expected to be lower. Planned maintenance downtime costs are expected to be $2 million higher in the third quarter of 2021 compared with the second quarter of 2021. Input costs are expected to be stable.
| Brazilian Industrial Packaging | 2021 | 2020 | |||||||||||||||||||||||||||||||||
| In millions | 2nd Quarter | 1st Quarter | Six Months | 2nd Quarter | 1st Quarter | Six Months | |||||||||||||||||||||||||||||
| Sales | $ | — | $ | — | $ | — | $ | 42 | $ | 54 | $ | 96 | |||||||||||||||||||||||
| Operating Profit (Loss) | $ | — | $ | — | $ | — | $ | (2) | $ | (1) | $ | (3) | |||||||||||||||||||||||
39
On March 29, 2020 International Paper announced that it had entered into an agreement to sell its Brazilian Industrial Packaging business. The transaction closed October 14, 2020.
| European Coated Paperboard | 2021 | 2020 | |||||||||||||||||||||||||||||||||
| In millions | 2nd Quarter | 1st Quarter | Six Months | 2nd Quarter | 1st Quarter | Six Months | |||||||||||||||||||||||||||||
| Sales | $ | 102 | $ | 98 | $ | 200 | $ | 84 | $ | 92 | $ | 176 | |||||||||||||||||||||||
| Operating Profit (Loss) | $ | 19 | $ | 26 | $ | 45 | $ | 12 | $ | 24 | $ | 36 | |||||||||||||||||||||||
European Coated Paperboard
sales volumes in the second quarter of 2021 compared with the first quarter of 2021 were lower reflecting lower volumes in Russia partially offset by higher volumes in Europe. Average sales margins were higher in both regions driven by higher average sales prices and a favorable mix. Operating costs were lower in Europe and stable in Russia. Planned maintenance downtime costs were $8 million higher in the second quarter of 2021 compared with the first quarter of 2021. Input costs were higher in Europe primarily for purchased pulp, energy and chemicals. In Russia, input costs were stable.
Compared with the second quarter of 2020, sales volumes were higher in Europe partially offset by lower volumes in Russia. Average sales margins were higher in both regions, reflecting higher average sales prices in both regions and a favorable mix in Russia. Operating costs were lower in Europe and higher in Russia. Planned maintenance downtime costs were $4 million higher in the second quarter of 2021 compared with the second quarter of 2020. Input costs were higher in Europe primarily for energy and purchased pulp. In Russia, input costs were stable.
Entering the third quarter of 2021, sales volumes are expected to be higher in Russia and lower in Europe. Average sales margins are expected to be stable in both regions. Operating costs are expected to be lower in Europe but higher in Russia. Planned maintenance downtime costs are expected to be $7 million lower in the third quarter of 2021 compared with the second quarter of 2021. Input costs are expected to be stable in Europe and higher in Russia.
Global Cellulose Fibers
| Total Global Cellulose Fibers | 2021 | 2020 | |||||||||||||||||||||||||||||||||
| In millions | 2nd Quarter | 1st Quarter | Six Months | 2nd Quarter | 1st Quarter | Six Months | |||||||||||||||||||||||||||||
| Sales | $ | 671 | $ | 581 | $ | 1,252 | $ | 605 | $ | 568 | $ | 1,173 | |||||||||||||||||||||||
| Operating Profit (Loss) | $ | 10 | $ | (82) | $ | (72) | $ | (10) | $ | (54) | $ | (64) | |||||||||||||||||||||||
Global Cellulose Fibers
net sales in the second quarter of 2021 were 15% higher compared with the first quarter of 2021 and 11% higher than in the second quarter of 2020. Operating profit in the second quarter of 2021 improved significantly compared to the first quarter of 2021 and improved compared with the second quarter of 2020.
Sales volumes in the second quarter of 2021 compared with the first quarter of 2021 were lower and reflect shipping delays due to significant port congestion in the U.S. Total maintenance and economic downtime was about 15,000 tons lower in the second quarter of 2021 compared with the first quarter of 2021 due to maintenance downtime. Average sales margins improved significantly, reflecting flow through of previous sales price increases. Operating costs were higher driven by higher distribution costs. Planned maintenance downtime costs in the second quarter of 2021 were $9 million lower compared with the first quarter of 2021. Input costs were higher, primarily for energy and chemicals.
Compared with the second quarter of 2020, sales volumes in the second quarter of 2021 were lower reflecting the shipping delays due to port congestion. Total maintenance and economic downtime was about 44,000 tons higher in the second quarter of 2021, due to maintenance downtime. Average sales prices were significantly higher for both fluff and market pulp. Operating costs were higher reflecting higher distribution costs. Planned maintenance downtime costs in the second quarter of 2021 were $35 million higher compared with the second quarter of 2020. Input costs were higher primarily for wood, energy and chemicals.
Entering the third quarter of 2021, sales volumes are expected to increase. Average sales margins are expected to be higher. Planned maintenance downtime costs in the third quarter of 2021 are expected to be $15 million lower compared with the second quarter of 2021. Operating costs are expected to be lower. Input costs are expected to be stable.
Printing Papers
| Total Printing Papers | 2021 | 2020 | |||||||||||||||||||||||||||||||||
| In millions | 2nd Quarter | 1st Quarter | Six Months | 2nd Quarter | 1st Quarter | Six Months | |||||||||||||||||||||||||||||
| Sales | $ | 846 | $ | 781 | $ | 1,627 | $ | 583 | $ | 908 | $ | 1,491 | |||||||||||||||||||||||
| Operating Profit (Loss) | $ | 76 | $ | 80 | $ | 156 | $ | (11) | $ | 96 | $ | 85 | |||||||||||||||||||||||
40
Printing Papers net sales for the second quarter of 2021 were 8% higher than in the first quarter of 2021 and 45% higher than in the second quarter of 2020. Operating profit in the second quarter of 2021 was 5% lower compared with the first quarter of 2021 and significantly higher compared with the second quarter of 2020.
| North American Papers | 2021 | 2020 | |||||||||||||||||||||||||||||||||
| In millions | 2nd Quarter | 1st Quarter | Six Months | 2nd Quarter | 1st Quarter | Six Months | |||||||||||||||||||||||||||||
| Sales | $ | 410 | $ | 366 | $ | 776 | $ | 265 | $ | 446 | $ | 711 | |||||||||||||||||||||||
| Operating Profit (Loss) | $ | 18 | $ | 15 | $ | 33 | $ | (23) | $ | 23 | $ | — | |||||||||||||||||||||||
North American Papers
sales volumes in the second quarter of 2021 were higher compared with the first quarter of 2021 reflecting continued demand recovery from the COVID-19 pandemic. Total maintenance and economic downtime was about 6,000 tons lower in the second quarter of 2021 compared with the first quarter of 2021 primarily due to economic downtime. Average sales margins improved reflecting higher sales prices. Operating costs were flat. Planned maintenance downtime costs were $13 million higher in the second quarter of 2021, compared with the first quarter of 2021. Input costs were higher, primarily for wood and chemicals.
Compared with the second quarter of 2020, sales volumes in the second quarter of 2021 were significantly higher across all grades for uncoated freesheet paper reflecting demand recovery from the COVID-19 pandemic. Total maintenance and economic downtime was about 197,000 tons lower in the second quarter of 2021 compared with the second quarter of 2020 primarily due to economic downtime. Average sales margins were higher, driven by higher average sales prices. Operating costs were higher reflecting higher transportation costs. Planned maintenance downtime costs were $14 million higher in the second quarter of 2021 compared with the second quarter of 2020. Input costs were higher, primarily for wood, energy and chemicals.
Entering the third quarter of 2021, sales volumes are expected to improve. Average sales margins are expected to be higher. Operating costs are expected to be lower. Planned maintenance downtime costs are expected to be $18 million lower in the third quarter of 2021. Input costs are expected to be stable.
| European Papers | 2021 | 2020 | |||||||||||||||||||||||||||||||||
| In millions | 2nd Quarter | 1st Quarter | Six Months | 2nd Quarter | 1st Quarter | Six Months | |||||||||||||||||||||||||||||
| Sales | $ | 255 | $ | 250 | $ | 505 | $ | 209 | $ | 287 | $ | 496 | |||||||||||||||||||||||
| Operating Profit (Loss) | $ | 15 | $ | 22 | $ | 37 | $ | 13 | $ | 41 | $ | 54 | |||||||||||||||||||||||
European Papers
sales volumes for uncoated freesheet paper in the second quarter of 2021, compared with the first quarter of 2021, were higher in Europe and flat in Russia. Economic downtime driven by the COVID-19 pandemic demand decline, negatively impacted earnings in the first quarter of 2021. Average sales margins for uncoated freesheet paper were higher in both regions, reflecting higher average sales prices in Europe and Russia and a favorable mix in Russia. Operating costs were flat in Europe, but higher in Russia. Planned maintenance downtime costs were $10 million higher in the second quarter of 2021 compared to the first quarter of 2021. Input costs were higher in Europe, primarily for energy and chemicals. Input costs were also higher in Russia. Earnings were negatively impacted by unfavorable foreign currency impacts in both regions.
Sales volumes for uncoated freesheet paper in the second quarter of 2021 compared with the second quarter of 2020 were higher in both Europe and Russia, reflecting recovery of the significant decline in demand due to the COVID-19 pandemic. Earnings in both regions were negatively impacted by economic downtime in the second quarter of 2020 driven by the COVID-19 pandemic. Average sales margins for uncoated freesheet paper were lower in Europe reflecting lower average sales prices and an unfavorable mix. In Russia, average sales margins were higher driven by higher average sales prices. Operating costs were higher in Russia and flat in Europe. Planned maintenance downtime costs were $4 million higher in the second quarter of 2021 compared with the second quarter of 2020. Input costs were higher in Europe, primarily for energy. In Russia, input costs were flat.
Looking forward to the third quarter of 2021, sales volumes for uncoated freesheet paper are expected to be higher in Russia and stable in Europe. Average sales margins are expected to be higher in Europe and lower in Russia. Operating costs are expected to be stable in Europe and higher in Russia. Planned maintenance downtime costs are expected to be $11 million lower in the third quarter of 2021 compared with the second quarter of 2021. Input costs are expected to be higher in Russia, primarily for fiber and wood. In Europe, input costs are expected to be stable.
41
| Brazilian Papers | 2021 | 2020 | |||||||||||||||||||||||||||||||||
| In millions | 2nd Quarter | 1st Quarter | Six Months | 2nd Quarter | 1st Quarter | Six Months | |||||||||||||||||||||||||||||
| Sales (a) | $ | 189 | $ | 168 | $ | 357 | $ | 108 | $ | 176 | $ | 284 | |||||||||||||||||||||||
| Operating Profit (Loss) | $ | 43 | $ | 43 | $ | 86 | $ | (1) | $ | 32 | $ | 31 | |||||||||||||||||||||||
(a)
Includes intra-segment sales of $8 million and $(1) million for the three months ended June 30, 2021 and 2020, respectively; $3 million and $1 million for the three months ended March 31, 2021 and 2020, respectively; and $11 million and $0 for the six months ended June 30, 2021 and 2020, respectively.
Brazilian Papers
sales volumes in the second quarter of 2021, compared with the first quarter of 2021, were higher for domestic and lower for export shipments of uncoated freesheet paper. Average sales margins improved driven by higher domestic and export sales prices and a favorable geographic mix. Operating costs were slightly higher. Planned maintenance outage downtime costs were $1 million lower in the second quarter of 2021 compared with the first quarter of 2021. Input costs were higher primarily for purchased pulp, virgin fiber, chemicals and packaging. Earnings benefited from favorable foreign currency impacts in the first quarter of 2021.
Compared with the second quarter of 2020, sales volumes for uncoated freesheet paper in the second quarter of 2021 increased in both domestic and export markets reflecting recovery from the negative demand impact of the COVID-19 pandemic. Average sales margins were higher reflecting higher average domestic and export sales prices and a favorable geographic mix. Operating costs were lower. Planned maintenance outage expenses were $3 million lower in the second quarter of 2021 compared with the second quarter of 2020. Input costs were higher, primarily for purchased pulp, chemicals, packaging, virgin fiber and energy.
Entering the third quarter of 2021, sales volumes for uncoated freesheet paper are expected to be higher for export shipments and lower for domestic shipments. Average sales margins are expected to be higher. Operating costs are expected to be slightly higher. Planned maintenance outage downtime costs are expected to be $6 million higher in the third quarter of 2021 compared with the second quarter of 2021. Input costs are expected to be higher driven by purchased pulp.
Equity Earnings, Net of Taxes – Ilim
International Paper accounts for its 50% equity interest in Ilim S.A. (Ilim) using the equity method of accounting. Ilim is a separate reportable industry segment whose primary operations are in Russia. The Company recorded equity earnings (loss), net of taxes, of $101 million in the second quarter of 2021, compared with $49 million in the first quarter of 2021 and $63 million in the second quarter of 2020. In the first and second quarters of 2021, the after-tax foreign exchange impact primarily on the remeasurement of U.S. dollar-denominated net debt was not material.
Compared with the first quarter of 2021, sales volumes in the second quarter of 2021 were 14% higher overall, primarily for sales of softwood pulp in China, other export markets and Russia, and sales of containerboard in China, partially offset by lower sales of hardwood pulp in China. Hardwood pulp sales in Russia and other export markets increased. Average sales margins increased for softwood pulp, hardwood pulp and containerboard in all regions. Input costs for fuel and wood were higher. Repair, maintenance and distribution costs were also higher.
Compared with the second quarter of 2020, sales volumes in the second quarter of 2021 increased overall by 6%, primarily for sales of softwood pulp in China, other export markets and Russia, and sales of hardwood pulp in Russia, but were partially offset by lower sales of hardwood pulp in China. Sales of containerboard in China were significantly higher, but declined in Russia and other export markets. Average sales margins for softwood pulp, hardwood pulp and containerboard increased in all regions. Input costs, primarily for fuel, energy and chemicals were higher. Distribution costs increased. An after-tax foreign exchange net gain of $34 million primarily on the remeasurement of U.S. dollar denominated net debt was recorded in the second quarter of 2020.
Looking forward to the third quarter of 2021, sales volumes are expected to be lower as maintenance mill outages originally scheduled for the second quarter are rescheduled to occur at the Ust-Ilimsk and Bratsk mills in the third quarter. Based on pricing to date in the current quarter, average sales margins are projected to increase compared with the second quarter of 2021. Input costs for wood are expected to be seasonally lower. Maintenance costs are projected to increase.
Equity Earnings – GPIP
International Paper recorded equity earnings of $3 million in the second quarter of 2021, compared with $1 million in the first quarter of 2021 and $11 million in the second quarter of 2020. As of June 30, 2021, the Company no longer had an ownership interest in GPIP.
42
Cash provided by operations totaled $1.3 billion for the first six months of 2021, compared with $1.5 billion for the comparable 2020 six-month period.
Investments in capital projects, net of insurance recoveries, totaled $222 million in the first six months of 2021, compared to $538 million in the first six months of 2020. Full-year 2021 capital spending is currently expected to be approximately $800 million, or 61% of depreciation and amortization.
Financing activities for the first six months of 2021 included a $910 million net decrease in debt versus a $338 million net decrease in debt during the comparable 2020 six-month period.
Amounts related to early debt extinguishment during the six months ended June 30, 2021 and 2020 were as follows:
|
Three Months Ended
June 30, |
Six Months Ended
June 30, |
||||||||||||||||||||||
| In millions | 2021 | 2020 | 2021 | 2020 | |||||||||||||||||||
| Early debt reductions (a) | $ | 790 | $ | 222 | $ | 897 | $ | 294 | |||||||||||||||
| Pre-tax early debt extinguishment (gain) loss, net | 170 | 18 | 188 | 26 | |||||||||||||||||||
(a)
Reductions related to notes with interest rates ranging from 3.00% to 5.15% with original maturities from 2027 to 2048 and from 3.00% to 7.50% with original maturities from 2021 to 2027 for the three months ended June 30, 2021 and 2020, respectively, and from 3.00% to 5.15% with original maturities from 2027 to 2048 and from 3.00% to 7.50% with original maturities from 2021 to 2048 for the six months ended June 30, 2021 and 2020, respectively.
At June 30, 2021, contractual obligations for future payments of debt maturities (including finance lease liabilities disclosed in
Note 11 - Leases
and excluding the timber monetization structures disclosed in
Note 16 - Variable Interest Entities
) by calendar year were as follows: $20 million in 2021; $198 million in 2022; $362 million in 2023; $152 million in 2024; $210 million in 2025; and $6.2 billion thereafter.
Maintaining an investment-grade credit rating is an important element of International Paper’s financing strategy. At June 30, 2021, the Company held long-term credit ratings of BBB (stable outlook) and Baa2 (stable outlook) by S&P and Moody’s, respectively. In addition, the Company held short-term credit ratings of A2 and P2 by S&P and Moody's, respectively, for borrowings under the Company's commercial paper program.
At June 30, 2021, International Paper’s credit agreements totaled $2.1 billion, which is comprised of the $1.5 billion contractually committed bank credit agreement and up to $550 million under the receivables securitization program. Management believes these credit agreements are adequate to cover expected operating cash flow variability during the current economic cycle. The credit agreements generally provide for interest rates at a floating rate index plus a pre-determined margin dependent upon International Paper’s credit rating. At June 30, 2021, the Company had no borrowings outstanding under the $1.5 billion credit agreement or the $550 million receivables securitization program. The Company’s credit agreements are not subject to any restrictive covenants other than the financial covenants as disclosed in
Note 17 - Debt
, and the borrowings under the receivables securitization program being limited by eligible receivables. The Company was in compliance with all its debt covenants at June 30, 2021 and was well below the thresholds stipulated under the covenants as defined in the credit agreements. Further the financial covenants do not restrict any borrowings under the credit agreements.
In addition to the $2.1 billion capacity under the Company's credit agreements, International Paper has a commercial paper program with a borrowing capacity of $1.0 billion. Under the terms of the program, individual maturities on borrowings may vary, but not exceed one year from the date of issue. Interest bearing notes may be issued either as fixed or floating rate notes. As of June 30, 2021, the Company had no borrowings outstanding under the program.
International Paper expects to be able to meet projected capital expenditures, service existing debt and meet working capital and dividend requirements for the next 12 months with current cash balances and cash from operations, supplemented as required by its existing credit facilities. The Company will continue to rely on debt and capital markets for the majority of any necessary long-term funding not provided by operating cash flows. Funding decisions will be guided by our capital structure planning objectives. The primary goals of the Company’s capital structure planning are to maximize financial flexibility and maintain appropriate levels of liquidity to meet our needs while managing balance sheet debt and interest expense, and we have purchased, and may continue to repurchase, our common stock (under our existing share repurchase program) and debt to the extent consistent with this capital structure planning. The majority of International Paper’s debt is accessed through global public capital markets where we have a wide base of investors. During 2020, management took various actions to further strengthen the Company’s liquidity position in response to the COVID-19 pandemic. This included the Company deferring the payment of our payroll taxes as allowed under CARES Act. The CARES Act allows for the deferral of the payment of the employer portion of Social Security taxes accrued between March 27, 2020, and December 31, 2020. Under the CARES Act
43
50% of the deferred payroll taxes will be paid by December 31, 2021 and the remainder will be paid by December 31, 2022. We believe that our credit agreements, commercial paper program, and the actions taken in response to COVID-19 provide us with sufficient liquidity to operate in the current environment; however, an extended period of economic disruption could impact our access to additional sources of liquidity.
During the first six months of 2021, International Paper used 1.8 million shares of treasury stock for various incentive plans. International Paper also acquired 4.1 million shares of treasury stock, including restricted stock tax withholdings. Repurchases of common stock and payments of restricted stock withholding taxes totaled $213 million, including $186 million related to shares repurchased under the Company's repurchase program.
During the first six months of 2020, International Paper used approximately 2.0 million shares of treasury stock for various incentive plans. International Paper also acquired 1.0 million shares of treasury stock, including restricted stock tax withholding. Repurchases of common stock and payments of restricted stock withholding taxes totaled $41 million, including $14 million related to shares repurchased under the Company's repurchase program.
Cash dividend payments related to common stock totaled $403 million and $403 million for the first six months of 2021 and 2020, respectively. Dividends were $1.0250 per share and $1.0250 per share for the first six months in 2021 and 2020, respectively.
Our pension plan is currently sufficiently funded and we do not anticipate any required contributions for the next 12 months.
Variable Interest Entities
Information concerning variable interest entities is set forth in Note 15 in the Company's Annual Report on Form 10-K for the year ended December 31, 2020. In connection with the 2006 International Paper installment sale of forestlands, we received $4.8 billion of installment notes. These installment notes were used by variable interest entities as collateral for borrowings from third-party lenders. These variable interest entities were restructured in 2015 when the installment notes and third-party loans were extended. The restructured variable interest entities hold installment notes of $4.8 billion that mature in August 2021 and third-party loans of $4.2 billion that were extended to mature in August 2021. The installment notes and third-party loans are shown in Current nonrecourse financial assets of variable interest entities and Current nonrecourse financial liabilities of variable interest entities, respectively, on the accompanying balance sheet. We will settle the third-party loans at their maturity in August 2021 with the proceeds from the installment notes which also mature in August 2021 resulting in expected cash proceeds of approximately $0.6 billion representing our equity in the variable interest entities. Maturity of the installment notes and termination of the monetization structure is expected to result in a $75 million cash tax payment in the fourth quarter of 2021.
Ilim S.A. Shareholders’ Agreement
In October 2007, in connection with the formation of the Ilim S.A. joint venture (Ilim), International Paper entered into a shareholders' agreement that includes provisions relating to the reconciliation of disputes among the partners. This agreement provides that at any time, either the Company or its partners may commence procedures specified under the deadlock agreement. If these or any other deadlock procedures under the shareholders' agreement are commenced, although it is not obligated to do so, the Company may in certain situations choose to purchase its partners' 50% interest in Ilim. Any such transaction would be subject to review and approval by Russian and other relevant anti-trust authorities. Based on the provisions of the agreement, the Company estimates that the current purchase price for its partners' 50% interest would be approximately $1.0 billion, which could be satisfied by payment of cash or International Paper common stock, or some combination of the two, at the Company's option. The purchase by the Company of its partners’ 50% interest in Ilim would result in the consolidation of Ilim's financial position and results of operations in all subsequent periods. The parties have informed each other that they have no current intention to commence procedures specified under the deadlock provisions of the shareholders' agreement.
CRITICAL ACCOUNTING POLICIES AND SIGNIFICANT ACCOUNTING ESTIMATES
The preparation of financial statements in conformity with accounting principles generally accepted in the United States requires International Paper to establish accounting policies and to make estimates that affect both the amounts and timing of the recording of assets, liabilities, revenues and expenses. Some of these estimates require judgments about matters that are inherently uncertain.
Accounting policies whose application may have a significant effect on the reported results of operations and financial position of International Paper, and that can require judgments by management that affect their application, include accounting for contingencies, impairment or disposal of long-lived assets, goodwill and other intangible assets, pensions and income taxes.
44
The Company has included in its 2020 Form 10-K a discussion of these critical accounting policies, which are important to the portrayal of the Company’s financial condition and results of operations and require management’s judgments. The Company has not made any changes in these critical accounting policies during the first six months of 2021.
While we have taken into account certain impacts arising from COVID-19 in connection with the accounting estimates reflected in this Quarterly Report on Form 10-Q, the full impact of COVID-19 is unknown and cannot be reasonably estimated. However, we have made appropriate accounting estimates based on the facts and circumstances available as of the reporting date. To the extent there are differences between these estimates and actual results, our consolidated financial statements may be affected.
FORWARD-LOOKING STATEMENTS
Certain statements in this Quarterly Report on Form 10-Q that are not historical in nature may be considered “forward-looking statements” within the meaning of the Private Securities Litigation Reform Act of 1995. Words such as “expects”, “anticipates”, “believes”, “estimates” and similar expressions identify forward-looking statements. These statements are not guarantees of future performance and reflect management’s current views and are subject to risks and uncertainties that could cause actual results to differ materially from those expressed or implied in these statements. Factors which could cause actual results to differ include but are not limited to: (i) developments related to the COVID-19 pandemic, including the spread of new variants of the virus, the effectiveness and availability of vaccines and associated levels of vaccination, as well as the possibility that strains of the virus may be resistant to currently available vaccines, global economic conditions arising from the pandemic, impacts of governments' responses to the pandemic on our operations, impacts of the pandemic on commercial activity, our customers and business partners and consumer preferences and demand, supply chain disruptions, and disruptions in the credit or financial markets; (ii) the level of indebtedness and changes in interest rates; (iii) industry conditions, including but not limited to changes in the cost or availability of raw materials, energy sources and transportation sources, the availability of labor and competitive labor market conditions, competition we face, cyclicality and changes in consumer preferences, demand and pricing for our products (including any such changes resulting from the COVID-19 pandemic); (iv) domestic and global economic conditions and political changes, changes in currency exchange rates, trade protectionist policies, downgrades in our credit ratings, and/or the credit ratings of banks issuing certain letters of credit, issued by recognized credit rating organizations, (v) the amount of our future pension funding obligations, and pension and health care costs; (vi) unanticipated expenditures or other adverse developments related to the cost of compliance with existing and new environmental, tax, labor and employment, privacy, and other U.S. and non-U.S. governmental laws and regulations (including new legal requirements arising from the COVID-19 pandemic); (vii) any material disruption at any of our manufacturing facilities or other adverse impact on our operations due to severe weather, natural disasters, climate change or similar causes; (viii) risks inherent in conducting business through joint ventures; (ix) our ability to achieve the benefits expected from, and other risks associated with, acquisitions, joint ventures, divestitures and other corporate transactions, (x) information technology risks; (xi) loss contingencies and pending, threatened or future litigation, including with respect to environmental related matters; (xii) the receipt of regulatory approvals relating to the spin-off transaction without unexpected delays or conditions; (xiii) our ability to successfully separate the SpinCo business (known as Sylvamo Corporation) and realize the anticipated benefits of the spin-off transaction; (xiv) the ability to satisfy any necessary conditions to consummate the spin-off transaction within the estimated timeframes or at all; and (xv) the final terms and conditions of any spin-off transaction, including the amount of any dividend by Sylvamo to us and the terms of any ongoing commercial agreements and arrangements between us and Sylvamo following any such transaction, the costs of any such transaction, the nature and amount of indebtedness incurred by Sylvamo, the qualification of the spin-off transaction as a tax-free transaction for U.S. federal income tax purposes (including whether an IRS ruling will be obtained), diversion of management’s attention and the impact on relationships with customers, suppliers, employees and other business counterparties, and the impact of any such transaction on the businesses of the Company and Sylvamo and the relationship between the two companies following any such transaction. These and other factors that could cause or contribute to actual results differing materially from such forward-looking statements can be found in our press releases and U.S. Securities and Exchange Commission filings. In addition, other risks and uncertainties not presently known to the Company or that we currently believe to be immaterial could affect the accuracy of any forward-looking statements. The Company undertakes no obligation to publicly update any forward-looking statements, whether as a result of new information, future events or otherwise.
Information relating to quantitative and qualitative disclosures about market risk is shown on page 38 of International Paper’s 2020 Form 10-K, which information is incorporated herein by reference. There have been no material changes in the Company’s exposure to market risk since December 31, 2020.
45
ITEM 4.
CONTROLS AND PROCEDURES
Evaluation of Disclosure Controls and Procedures:
Disclosure controls and procedures are controls and other procedures that are designed to ensure that information required to be disclosed in our reports filed or submitted under the Securities Exchange Act of 1934, as amended (Exchange Act), is recorded, processed, summarized and reported (and accumulated and communicated to management, including our Chief Executive Officer and Chief Financial Officer, to allow timely decisions regarding required disclosure) within the time periods specified in the Securities and Exchange Commission’s rules and forms. As of the end of the period covered by this report, we conducted an evaluation, under the supervision and with the participation of our management, including the Chief Executive Officer and Chief Financial Officer, of the effectiveness of our disclosure controls and procedures pursuant to Rules 13a-15 and 15d-15 of the Exchange Act. Based upon that evaluation, our Chief Executive Officer and Chief Financial Officer concluded that the Company’s disclosure controls and procedures were effective as of June 30, 2021 (the end of the period covered by this report).
Changes in Internal Control over Financial Reporting:
There have been no changes in our internal control over financial reporting during the quarter ended June 30, 2021 that have materially affected, or are reasonably likely to materially affect, our internal control over financial reporting.
46
ITEM 1.
LEGAL PROCEEDINGS
A discussion of material developments in the Company’s litigation matters occurring in the period covered by this report is found in
Note 15
of the
Condensed Notes to the Consolidated Financial Statements
in this Form 10-Q, which is incorporated by reference.
ITEM 1A.
RISK FACTORS
There have been no material changes from the risk factors disclosed in our Annual Report on Form 10-K for the fiscal year ended December 31, 2020 (Part I, Item 1A).
PURCHASES OF EQUITY SECURITIES BY THE ISSUER AND AFFILIATED PURCHASERS.
| Period | Total Number of Shares Purchased (a) | Average Price Paid per Share | Total Number of Shares Purchased as Part of a Publicly Announced Plan or Program | Maximum Number (or Approximate Dollar Value) of Shares that May Yet Be Purchased Under the Plans or Programs (in billions) | ||||||||||
| April 1, 2021 - April 30, 2021 | 58,623 | $53.98 | 57,923 | $1.60 | ||||||||||
| May 1, 2021 - May 31, 2021 | 126,073 | 58.73 | 120,762 | 1.59 | ||||||||||
| June 1, 2021 - June 30, 2021 | 763,291 | 61.66 | 763,291 | 1.55 | ||||||||||
| Total | 947,987 | |||||||||||||
(a) 6,012 shares were acquired from employees or board members as a result of share withholdings to pay income taxes under the Company's restricted stock program. The remainder were purchased under a share repurchase program that was approved on September 10, 2013, and increased twice on July 8, 2014, and October 9, 2018. Through this program, which does not have an expiration date, we were authorized to purchase, in open market transactions (including block trades), privately negotiated transactions or otherwise, up to $5 billion of shares of our common stock. As of June 30, 2021, approximately $1.55 billion aggregate amount of shares of our common stock remained authorized for purchase under this program.
47
ITEM 6. EXHIBITS
| 10.1 | ||||||||
| 31.1 | ||||||||
| 31.2 | ||||||||
| 32 | ||||||||
| 101.INS | XBRL Instance Document - the instance document does not appear in the Interactive Data File because its XBRL tags are embedded within the inline XBRL document. | |||||||
| 101.SCH | XBRL Taxonomy Extension Schema. | |||||||
| 101.CAL | XBRL Taxonomy Extension Calculation Linkbase. | |||||||
| 101.DEF | XBRL Taxonomy Extension Definition Linkbase. | |||||||
| 101.LAB | XBRL Taxonomy Extension Label Linkbase. | |||||||
| 101.PRE | XBRL Extension Presentation Linkbase. | |||||||
| 104 | Cover Page Interactive Data File (formatted as Inline XBRL, and contained in Exhibit 101). | |||||||
* Schedules and exhibits have been omitted pursuant to Item 601(a)(5) of Regulation S-K. The registrant agrees to furnish supplementally a copy of any omitted schedule or exhibit to the U.S. Securities and Exchange Commission upon request.
48
Pursuant to the requirements of the Securities Exchange Act of 1934, the registrant has duly caused this report to be signed on its behalf by the undersigned thereunto duly authorized.
|
INTERNATIONAL PAPER COMPANY
(Registrant) |
||||||||
| July 30, 2021 | By | /s/ Tim S. Nicholls | ||||||
| Tim S. Nicholls | ||||||||
|
Senior Vice President and Chief
Financial Officer |
||||||||
| July 30, 2021 | By | /s/ Vincent P. Bonnot | ||||||
| Vincent P. Bonnot | ||||||||
| Vice President – Finance and Controller | ||||||||
49
TABLE OF CONTENTS