IPG PHOTONICS CORP
10-Ks and 10-Qs
|
|
|
|
|
|
|
|
|
|
|
|
|
|
|
|
|
|
|
|
|
|
|
|
|
|
|
|
|
|
|
|
|
|
|
|
|
|
|
|
|
|
|
|
|
|
|
|
|
|
|
|
|
|
|
|
UNITED STATES SECURITIES AND EXCHANGE COMMISSION
Washington, DC 20549
Form 10-K
(Mark One)
|
|
þ
|
ANNUAL REPORT PURSUANT TO SECTION 13 OR 15(d) OF THE SECURITIES EXCHANGE ACT OF 1934
|
For the fiscal year ended
December 31, 2014
OR
|
|
¨
|
TRANSITION REPORT PURSUANT TO SECTION 13 OR 15(d) OF THE SECURITIES EXCHANGE ACT OF 1934
|
Commission File Number: 001-33155
IPG PHOTONICS CORPORATION
(Exact name of registrant as specified in its charter)
|
Delaware
|
|
04-3444218
|
|
(State or other jurisdiction of
incorporation or organization)
|
|
(IRS Employer
Identification No.)
|
|
50 Old Webster Road, Oxford, Massachusetts
|
|
01540
|
|
(Address of principal executive offices)
|
|
(Zip Code)
|
Registrant's telephone number, including area code:
(508) 373-1100
Securities registered pursuant to Section 12(b) of the Act:
|
Title of Class
|
|
Name of Exchange on Which Registered
|
|
Common Stock, Par Value $0.0001 per share
|
|
The NASDAQ Stock Market LLC
|
Securities registered pursuant to Section 12(g) of the Act: None
Indicate by check mark if the registrant is a well-known seasoned issuer, as defined in Rule 405 of the Securities Act. Yes
þ
No
¨
Indicate by check mark if the registrant is not required to file reports pursuant to Section 13 or Section 15(d) of the Act. Yes
¨
No
þ
Indicate by check mark whether the registrant (1) has filed all reports required to be filed by Section 13 or 15(d) of the Securities Exchange Act of 1934 during the preceding 12 months (or for such shorter period that the registrant was required to file such reports), and (2) has been subject to such filing requirements for the past 90 days. Yes
þ
No
¨
Indicate by check mark whether the registrant has submitted electronically and posted on its corporate Web site, if any, every Interactive Data File required to be submitted and posted pursuant to Rule 405 of Regulation S-T (§ 232.405 of this chapter) during the preceding 12 months (or for such shorter period that the registrant was required to submit and post such files). Yes
þ
No
¨
Indicate by check mark if disclosure of delinquent filers pursuant to Item 405 of Regulation S-K is not contained herein, and will not be contained, to the best of registrant's knowledge, in definitive proxy or information statements incorporated by reference in Part III of this Form 10-K or any amendment to this Form 10-K.
þ
Indicate by check mark whether the registrant is a large accelerated filer, an accelerated filer, a non-accelerated filer or a smaller reporting company. See definitions of "large accelerated filer," "accelerated filer" and "smaller reporting company" in Rule 12b-2 of the Exchange Act. (Check one):
|
Large accelerated filer
þ
|
|
Accelerated filer
¨
|
|
Non-accelerated filer
¨
|
|
Smaller reporting company
¨
|
Indicate by check mark whether the registrant is a shell company (as defined in Rule 12b-2 of the Act). Yes
¨
No
þ
The aggregate market value of the registrant's common stock held by non-affiliates of the registrant was approximately $1.9 billion, calculated based upon the closing price as reported by the Nasdaq Global Market on June 30, 2014. For purposes of this disclosure, shares of common stock held by persons who own 5% or more of the outstanding common stock and shares of common stock held by each officer and director have been excluded in that such persons may be deemed to be "affiliates" as that term is defined under the Rules and Regulations of the Exchange Act. This determination of affiliate status is not necessarily conclusive.
As of
February 24, 2015
,
52,482,512
shares of the registrant's common stock were outstanding.
DOCUMENTS INCORPORATED BY REFERENCE
Portions of the registrant's Proxy Statement for its
2015
Annual Meeting of Stockholders to be filed pursuant to Regulation 14A within 120 days of the end of the registrant's fiscal year ended
December 31, 2014
are incorporated by reference into Part III of this Annual Report on Form 10-K to the extent stated herein.
TABLE OF CONTENTS
|
PART I
|
||
|
ITEM 1.
|
BUSINESS
|
|
|
ITEM 1A.
|
RISK FACTORS
|
|
|
ITEM 1B.
|
UNRESOLVED STAFF COMMENTS
|
|
|
ITEM 2.
|
PROPERTIES
|
|
|
ITEM 3.
|
LEGAL PROCEEDINGS
|
|
|
ITEM 4.
|
MINE SAFETY DISCLOSURES
|
|
|
PART II
|
||
|
ITEM 5.
|
MARKET FOR REGISTRANT'S COMMON EQUITY, RELATED STOCKHOLDER MATTERS AND ISSUER PURCHASES OF EQUITY SECURITIES
|
|
|
ITEM 6.
|
SELECTED FINANCIAL DATA
|
|
|
ITEM 7.
|
MANAGEMENT’S DISCUSSION AND ANALYSIS OF FINANCIAL CONDITION AND RESULTS OF OPERATIONS
|
|
|
ITEM 7A.
|
QUANTITATIVE AND QUALITATIVE DISCLOSURES ABOUT MARKET RISK
|
|
|
ITEM 8.
|
FINANCIAL STATEMENTS AND SUPPLEMENTARY DATA
|
|
|
ITEM 9.
|
CHANGES IN AND DISAGREEMENTS WITH ACCOUNTANTS ON ACCOUNTING AND FINANCIAL DISCLOSURE
|
|
|
ITEM 9A.
|
CONTROLS AND PROCEDURES
|
|
|
ITEM 9B.
|
OTHER INFORMATION
|
|
|
PART III
|
||
|
ITEM 10.
|
DIRECTORS, EXECUTIVE OFFICERS AND CORPORATE GOVERNANCE
|
|
|
ITEM 11.
|
EXECUTIVE COMPENSATION
|
|
|
ITEM 12.
|
SECURITY OWNERSHIP OF CERTAIN BENEFICIAL OWNERS AND MANAGEMENT AND RELATED STOCKHOLDER MATTERS
|
|
|
ITEM 13.
|
CERTAIN RELATIONSHIPS AND RELATED TRANSACTIONS, AND DIRECTOR INDEPENDENCE
|
|
|
ITEM 14.
|
PRINCIPAL ACCOUNTING FEES AND SERVICES
|
|
|
PART IV
|
||
|
ITEM 15.
|
EXHIBITS AND FINANCIAL STATEMENT SCHEDULES
|
|
|
SIGNATURES
|
||
|
INDEX TO FINANCIAL STATEMENTS
|
F-
1
|
|
1
This Annual Report on Form 10-K contains certain forward-looking statements within the meaning of Section 27A of the Securities Act of 1933, as amended, and Section 21E of the Securities Exchange Act of 1934, as amended, and we intend that such forward-looking statements be subject to the safe harbors created thereby. For this purpose, any statements contained in this Annual Report on Form 10-K except for historical information are forward-looking statements. Without limiting the generality of the foregoing, words such as "may," "will," "expect," "believe," "anticipate," "intend," "could," "estimate," or "continue" or the negative or other variations thereof or comparable terminology are intended to identify forward-looking statements. In addition, any statements that refer to projections of our future financial performance, trends in our businesses, or other characterizations of future events or circumstances are forward-looking statements.
The forward-looking statements included herein are based on current expectations of our management based on available information and involve a number of risks and uncertainties, all of which are difficult or impossible to accurately predict and many of which are beyond our control. As such, our actual results may differ significantly from those expressed in any forward-looking statements. Factors that may cause or contribute to such differences include, but are not limited to, those discussed in more detail in Item 1 (Business) and Item 1A (Risk Factors) of Part I and Item 7 (Management's Discussion and Analysis of Financial Condition and Results of Operations) of Part II of this Annual Report on Form 10-K. Readers should carefully review these risks, as well as the additional risks described in other documents we file from time to time with the Securities and Exchange Commission (the "SEC"). In light of the significant risks and uncertainties inherent in the forward-looking information included herein, the inclusion of such information should not be regarded as a representation by us or any other person that such results will be achieved, and readers are cautioned not to rely on such forward-looking information. We undertake no obligation to revise the forward-looking statements contained herein to reflect events or circumstances after the date hereof or to reflect the occurrence of unanticipated events.
2
ITEM 1.
BUSINESS
Our Company
IPG Photonics Corporation ("IPG", the "Company", the "Registrant", "we", "us" or "our") is the leading developer and manufacturer of a broad line of high-performance fiber lasers, fiber amplifiers and diode lasers that are used for diverse applications, primarily in materials processing. Fiber lasers are a relatively new generation of lasers that combine the advantages of semiconductor diodes, such as long life and high efficiency, with the high amplification and precise beam qualities of specialty optical fibers to deliver superior performance, reliability and usability.
Our diverse lines of low, mid and high-power lasers and amplifiers are used in materials processing, advanced, communications and medical applications. We sell our products globally to original equipment manufacturers ("OEMs"), system integrators and end users. We market our products internationally primarily through our direct sales force. We have sales offices in the United States, Germany, Russia, Italy, Turkey, the United Kingdom, France, Spain, Poland, China, Japan, South Korea, Singapore and India. Our major manufacturing facilities are located in the United States, Germany and Russia.
We are vertically integrated such that we design and manufacture most of the key components used in our finished products, from semiconductor diodes to optical fiber preforms, finished fiber lasers and amplifiers. We also manufacture complementary products used with our lasers including optical delivery cables, fiber couplers, beam switches, optical processing heads and chillers. In addition, we offer laser-based systems for certain markets and applications. Our vertically integrated operations allow us to reduce manufacturing costs, control quality, rapidly develop and integrate advanced products and protect our proprietary technology.
We are listed on the Nasdaq Global Market (ticker: IPGP). We began operations in 1990 and we incorporated in Delaware in 1998. Our principal executive offices are located at 50 Old Webster Road, Oxford, Massachusetts 01540, and our telephone number is (508) 373-1100.
Industry Background
Conventional Laser Technologies
Since the laser was invented over 50 years ago, laser technology has revolutionized a broad range of applications and products in various industries, including general manufacturing, automotive, medical, research, consumer products, electronics, semiconductors and communications. Lasers provide flexible, non-contact and high-speed ways to process and treat various materials. They are incorporated into manufacturing, medical and other systems by OEMs, system integrators and end users. Also, they are widely used to transmit large volumes of data in optical communications systems, various medical applications and test and measurement systems. For a wide variety of applications, lasers provide superior performance and a more cost-effective solution than non-laser technologies.
Lasers emit an intense light beam that can be focused on a small area, causing metals and other materials to melt, vaporize or change their character. These properties are utilized in applications requiring very high-power densities, such as cutting, marking and engraving, welding, additive manufacturing, printing, drilling, cladding, ablation and other materials processing procedures. Lasers are well-suited for imaging and inspection applications, and the ability to confine laser light to narrow wavelengths makes them particularly effective in medical and sensing applications. A laser works by converting electrical energy to optical energy. In a laser, an energy source excites or pumps a lasing medium, which converts the energy from the source into an emission consisting of particles of light, called photons, at a particular wavelength.
Historically, carbon dioxide ("CO
2
") gas lasers and crystal lasers have been the two principal laser types used in materials processing and many other applications. They are named for the materials used to create the lasing action. A CO
2
laser produces light by electrically stimulating a gas-filled tube and delivers the beam through free space using mirrors to provide direction. A crystal laser uses an arc lamp, pulsed flash lamp or diode stack or array to optically pump a special crystal. The most common crystal lasers use yttrium aluminum garnet ("YAG") crystals infused with neodymium or ytterbium. Some crystal lasers also use mirrors in free space to deliver the beam or direct the beam through fiber optics.
Introduction of Fiber Lasers
Fiber lasers use semiconductor diodes as the light source to pump specialty optical fibers, which are infused with rare earth ions. These fibers are called active fibers and are comparable in diameter to a human hair. The laser emission is created within optical fibers and delivered through a flexible optical fiber cable. As a result of their different design and components,
3
fiber lasers are more reliable, efficient, robust, compact and easier to operate than conventional lasers. In addition, fiber lasers free the end users from fine mechanical adjustments and the high maintenance costs that are typical for conventional lasers.
Although low-power fiber lasers were introduced four decades ago, their recent adoption has been driven primarily by our improvements in their output power levels and cost as well as their superior performance and lower cost of ownership compared with conventional lasers. We have successfully increased output power levels by developing improved optical components such as diodes and active fibers that have increased their power capacities and improved their performance. Fiber lasers now offer output powers that exceed those of conventional lasers in many categories. Also, semiconductor diodes historically have represented the majority of the cost of fiber lasers. In the past, the high cost of diodes meant that fiber lasers could not compete with conventional lasers on price and limited their use to high value-added applications. Over the last decade, however, our semiconductor diodes have become more affordable and reliable due, in part, to substantial advancements in semiconductor diode technology, packaging design and increased production volumes. As a result, the average cost per watt of output power has decreased dramatically over the last decade. Because of these improvements, our fiber lasers can now effectively compete with conventional lasers over a wide range of output powers and applications. As a pioneer in the development and commercialization of fiber lasers, we have contributed to many advancements in fiber laser technology and products.
Advantages of Fiber Lasers over Conventional Lasers
We believe that fiber lasers provide a combination of benefits that include:
|
•
|
Superior Performance.
Fiber lasers provide uniform beam quality over the entire power range. In most conventional laser solutions, the beam quality is sensitive to output power, while in fiber lasers, the output beam is virtually non-divergent over a wide power range. A non-divergent beam enables higher levels of precision, increased power densities and the ability to deliver the beam over greater distances to where processing can be completed. The superior beam quality and greater intensity of a fiber laser's beam allow tasks to be accomplished more rapidly, with lower-power units and with greater flexibility than comparable conventional lasers.
|
|
•
|
Lower Cost.
The purchase price for fiber lasers is generally lower than that of YAG lasers and of many CO
2
lasers. In addition, fiber lasers are less expensive to operate due to their lower energy usage, lower required maintenance costs and better processing speeds. Fiber lasers convert electrical energy to optical energy approximately 2 to 3 times more efficiently than diode-pumped YAG lasers, approximately 3 times more efficiently than conventional CO
2
lasers and approximately 15 to 30 times more efficiently than lamp-pumped YAG lasers. Because fiber lasers are much more energy-efficient and place lower levels of thermal stress on their internal components, they have substantially lower cooling requirements compared to those of conventional lasers, which also improves overall energy efficiency. Fiber lasers have lower maintenance costs due to the high performance and long life of our single-emitter diodes, fiber optics and other optical components, which can be used for up to 100,000 hours without replacement. The higher power density of the fiber laser beam also allows for higher processing speeds in many applications, which increases the operating efficiencies on a per-part basis.
|
|
•
|
Ease of Use.
Many features of fiber lasers make them easier to operate, maintain and integrate into laser-based systems as compared to conventional lasers, many of which require mirrors to direct the beam. There are no moving parts in fiber lasers and the beam is contained in a flexible fiber optic cable so they do not require adjustments of internal components or mirrors to direct the beam.
|
|
•
|
Compact Size.
Fiber lasers are typically smaller and lighter in weight than conventional lasers, saving valuable floor space. While conventional lasers are delicate due to the precise alignment of mirrors, fiber lasers are more durable and able to perform in variable environments.
|
|
•
|
Choice of Wavelengths and Precise Control of Beam.
The design of fiber lasers generally provides a broad range of wavelength choices, allowing users to select the precise wavelength that best matches their application and materials. Because the beam is delivered through fiber optics, it can be directed to the work area over longer distances without loss of beam quality.
|
Fiber amplifiers are similar in design to fiber lasers, use many of the same components, such as semiconductor diodes and specialty optical fibers, and provide many of the same advantages in the applications that require amplification.
Notwithstanding the benefits offered by fiber lasers, there remain applications and processes where conventional laser technologies may provide superior performance with respect to particular features. For example, crystal lasers can provide higher peak power pulses and fiber lasers cannot now generate the deep ultra-violet light that is used for photolithography in
4
many semiconductor applications. In addition, CO
2
lasers operate at wavelengths that are optimal for use on many non-metallic materials, including organic materials like wood.
Our Competitive Strengths
We believe that our key competitive strengths position us to take advantage of opportunities to displace traditional lasers and enable use of fiber lasers in new applications. Our key strengths and competitive advantages include:
World's Leading Producer of Fiber Laser Technology.
We are the world's largest manufacturer of fiber lasers. As a pioneer and technology leader in fiber lasers, we have built leading positions in our various end markets with a large and diverse customer base. Based on our leadership positions, we are able to leverage our scale to reduce costs for our customers and drive the proliferation of fiber lasers in existing and new applications. We rely on several key proprietary technologies, including pumping technology, manufacturing of fiber to withstand the high output power of our lasers, gain blocks and optics that contribute to the superior performance and reliability of our products.
Vertically Integrated Development and Manufacturing.
We develop and manufacture all of our key high-volume specialty components, including semiconductor diodes, active fibers, passive fibers and specialty optical components. We also produce beam switches, fiber delivery cables and certain optical processing heads developed especially for use with our lasers. We believe that our vertical integration and our high-volume production enhances our ability to meet customer requirements, reduce costs, accelerate and focus development, shorten lead times, limit the spread of trade secrets and provide competitive pricing advantages while maintaining high performance and quality standards.
Breadth and Depth of Expertise.
We have extensive know-how in materials sciences, which enables us to make our specialty optical fibers, semiconductor diodes and other critical components. We also have experience in optical, electrical, mechanical and semiconductor engineering, which we use to develop and manufacture our proprietary components, products, accessories and systems. We also operate numerous application development centers worldwide which allow us to assist customers in improving their manufacturing using our deep experience with fiber lasers.
Diverse Customer Base, End Markets and Applications.
Our diverse customer base, end markets and applications provide us with many growth opportunities. In
2014
, we shipped more than 24,800 devices to over 2,700 customers worldwide, with no single customer representing more than
11%
of our sales. Our products are used in a wide variety of applications and end markets worldwide. Our principal end markets and representative applications within those markets include:
5
|
Materials Processing
|
|
|||
|
|
|
|||
|
|
General manufacturing
|
|
• Flat sheet, tube and 3D cutting
• Marking, engraving and printing
• Welding, brazing and hardening
• 3D printing, selective laser melting and sintering
|
|
|
|
|
|||
|
|
Automotive
|
|
• High-strength steel cutting and welding
• Welding tailored metal blanks, frames, seats and transmissions
• Brazing and welding of auto frames
• Seam welding
|
|
|
|
|
|||
|
|
Heavy industry
|
|
• Hardening and welding pipes in nuclear, wind turbine and pipeline industries
• Welding and cutting thick plates for ships and rail cars
• Drilling for natural resources
|
|
|
|
|
|||
|
|
|
Aerospace
|
|
• Welding titanium air frames
• Cladding parts
• Percussion drilling of parts
|
|
|
|
|||
|
|
Consumer
|
|
• Cutting and marking parts for electronics and appliances
• Electronics and credit card marking
• Welding razor blades and batteries
• Stent and pacemaker manufacturing
|
|
|
|
|
|||
|
|
Semiconductor and electronics
|
|
• Computer disk manufacturing and texturing
• Photovoltaic manufacturing
• Memory repair and trim
|
|
|
|
|
|||
|
Advanced Applications
|
|
• Obstacle warning and light detecting and ranging
• Special projects and research
• Directed energy demonstrations
• Sensing and instrumentation
|
||
|
|
|
|||
|
Communications
|
|
• Broadband — fiber to premises
• Broadband — cable video signal transport
• Metro and long-haul wire-line DWDM transport
|
||
|
|
|
|||
|
Medical
|
|
• Skin rejuvenation and wrinkle removal
• General surgery and urology
• Dental
|
||
Broad Product Portfolio and Ability to Meet Customer Requirements.
We offer a broad range of standard and custom fiber lasers and amplifiers, enabling deployment in a wide variety of applications and end markets. Our vertically integrated manufacturing, broad technology expertise and investment in inventory enable us to design, prototype and commence high-volume production of our products rapidly, allowing us to meet customer request for quick deliveries.
Our Strategy
Our objective is to maintain and extend our leadership position in our industry by pursuing the following key elements of our strategy:
Leverage Our Technology to Increase Sales.
As fiber lasers become more widely accepted, we plan to leverage our position as the leader in fiber lasers and our applications expertise to develop solutions for customers and increase our position in the broader laser market. We believe that our fiber lasers will continue to displace traditional lasers in many existing applications due to their superior performance and value. Over the last few years, our high-power lasers have become widely accepted in two- and three-dimension cutting, one of the largest laser materials processing applications. We plan to continue to leverage our fiber laser technology by pursuing large-scale laser applications where our fiber lasers offer improved customer value and performance. Some of the more significant applications we intend to target include: (i) additive manufacturing (also
6
called 3D printing) with higher power ytterbium lasers; (ii) micro-processing, scribing and marking with high-power green lasers, ultra-fast pulsed lasers and ultra-violet ("UV"), lasers now under development and (iii) laser welding.
Target New Applications for Lasers and Expand into Broader Markets.
We intend to expand the use of fiber lasers into additional applications where faster or higher quality processing, higher power, portability, efficiency, size and flexible fiber cable delivery can lead customers to adopt fiber lasers instead of non-laser solutions. We believe that the advantages of fiber laser technology can overcome many of the limitations that have hindered the adoption of conventional lasers in broader industrial markets and processes. Using our manufacturing scale and technology innovations, we have been successful in reducing the cost of manufacturing with lasers, which we believe has made fiber lasers a more attractive manufacturing alternative as compared to conventional lasers and many non-laser methods. We target applications where higher power, portability, efficiency, size and flexible fiber cable delivery can lead customers to adopt fiber lasers instead of non-laser solutions. Certain industry trends such as the use of high-strength steel in automotive manufacturing and decreasing the weight of vehicles are driving the use of fiber lasers over other manufacturing methods such as stamping, non-laser welding and adhesives. Other trends, such as miniaturization of parts and electronics, contribute to the use of lasers because no other tools can work as precisely. We are working on developing new applications for fiber lasers through internal research and in partnership with customers and industrial institutes.
Expand Our Product Portfolio.
We plan to continue to invest in research and development to add additional wavelengths, power levels and other parameters while also improving beam quality, as well as developing new product lines and laser-based systems. Using our core technologies and breadth of experience, we plan to expand the wavelengths at which our lasers operate. This includes UV, orange, red and high power green lasers for fine and micro processing and other novel applications. We are introducing and developing pulsed fiber lasers with ultra-short pulse durations (nanosecond, picosecond and femtosecond) with high peak powers and mid infra-red lasers. We have introduced a line of optical processing heads for optimized use with our laser sources. Further, we will continue to expand sales of specialized laser-based systems to meet the specific needs of manufacturing end users whose requirements are not met by standard systems or in certain geographic areas where fiber laser systems are not currently available.
Lower Our Costs Through Manufacturing Improvements and Innovation.
We plan to seek further improvements in component manufacturing processes and device assembly as well as innovation in components and device designs to improve performance and decrease the overall cost per watt for our products. As we increase our production volumes, we improve our internal manufacturing economies of scale and we believe we will be able to better negotiate price reductions with certain suppliers. We intend to leverage our technology and operations expertise to manufacture additional components in order to reduce costs, ensure component quality, ensure supply and improve product performance. In
2014
, we produced more of our mechanical parts, manufactured more of our printed circuit board and power supplies we use and redesigned certain optical components to improve quality. We further decreased the manufacturing cost of our packaged diodes. In addition, we manufactured additional components that we had previously outsourced, such as mechanical cabinets, printed circuit boards, optical sub-assemblies. By reducing the cost per watt of our lasers and maintaining the lower operating cost of our products, we believe that we can increase laser use in applications in which conventional lasers could not be used economically.
Expand Global Reach to Attract Customers Worldwide.
The acceptance of fiber laser technology has expanded in both developed and emerging markets around the world. As a result, we have increased and will continue to increase our international sales and service locations to respond to our customers' needs. In
2014
, we established a sales office in Poland, an application center in both Shenzhen and Beijing, China and continued to expand our facilities in Russia, U.S. and Germany to increase manufacturing capacity.
Products
We design and manufacture a broad range of high-performance optical fiber-based lasers and amplifiers. We also make packaged diodes, direct diode lasers, laser systems, communications systems and materials processing laser systems that utilize our optical fiber-based products as well as other laser sources. Many of our products are designed to be used as general-purpose energy or light sources, making them useful in diverse applications and markets.
Our products are based on a common proprietary technology platform using many of the same core components, such as semiconductor diodes and specialty fibers, which we configure to our customers' specifications. Our engineers and scientists work closely with OEMs, system integrators and end users to develop and customize our products for their needs. Because of our flexible and modular product architecture, we offer products in different configurations according to the desired application, including modules, rack-mounted units and tabletop units. Our engineers and other technical experts work directly with the customer in our application and development centers to develop and configure the optimal solution for each customer's manufacturing requirements. We also manufacture certain complementary products that are used with our lasers, such as optical delivery cables, fiber couplers, beam switches, optical processing heads and chillers.
7
Lasers
Our laser products include low (1 to 99 watts), medium (100 to 999 watts) and high (1,000 watts and above) output power lasers from 0.3 to 4.5 microns in wavelength. These lasers either may be CW, QCW or pulsed. Our pulsed line includes nanosecond, picosecond and femtosecond lasers. We offer several different types of lasers, which are defined by the type of gain medium they use. These are ytterbium, erbium and thulium, as well as Raman and hybrid fiber-crystal lasers. We also sell fiber pigtailed packaged diodes and fiber coupled direct diode laser systems that use semiconductor diodes rather than optical fibers as their gain medium. In addition, we offer high-energy pulsed lasers, multi-wavelength lasers, tunable lasers, single-polarization and single-frequency lasers, as well as other versions of our products.
We believe that we produce the highest-power solid-state lasers in the industry. Our ytterbium fiber lasers reach power levels of up to 100,000 watts. We also make single-mode and low-mode output ytterbium fiber lasers with power levels of up to 10,000 watts and single-mode, erbium and thulium fiber lasers with power levels of up to 400 watts. Our compact, durable design and integrated fiber optic beam delivery allow us to offer versatile laser energy sources and simple laser integration for complex production processes without compromising quality, speed or power.
We also sell laser diode chips and packaged laser diodes operating at 8XX to 9XX nanometers. We sell our own family of high-power optical fiber delivery cables, fiber couplers, beam switches, chillers, scanners and other accessories for our fiber lasers. Recently, we introduced a line of optical processing heads for use with our fiber lasers.
We offer a retrofit service to replace CO
2
and lamp-pumped YAG laser sources with fiber lasers in many welding, cutting, drilling and other systems, allowing customers to retain their existing laser systems. We also make active and passive laser materials and tunable lasers in the middle-infrared region.
Amplifiers
Our amplifier products range from milliwatts to up to 1,500 watts of output power from 1 to 2 microns in wavelength. We offer erbium-doped fiber amplifiers ("EDFAs"), Raman amplifiers and integrated communications systems that incorporate our amplifiers. These products are predominantly deployed in broadband networks such as fiber to the home ("FTTH"), fiber to the curb ("FTTC"), and passive optical networks ("PON"), and dense wavelength division multiplexing ("DWDM"), networks. We also offer ytterbium and thulium specialty fiber amplifiers and broadband light sources that are used in advanced applications. In addition, we sell single-frequency, linearly polarized and polarization-maintaining versions of our amplifier products. As with our fiber lasers, our fiber amplifiers offer some of the highest output power levels and highest number of optical outputs in the industry. We believe our line of fiber amplifiers offers the best commercially available output power and performance.
Systems
Besides selling laser sources, we also offer integrated laser systems for particular geographic markets or custom-developed for a customer's manufacturing requirements. Through our IPG Microsystems business, we offer industrial grade UV excimer, diode pumped solid state and picosecond laser micromachining systems and materials processing services. Key applications for these systems include advanced laser scribing and laser lift-off ("LLO") of light-emitting diodes ("LEDs"), thin film solar scribing, semiconductor, micro-electro-mechanical systems ("MEMS"), research, biomedical and industrial micromachining. IPG Microsystems' laser systems operate at wavelengths from 157nm to 1,064nm, and are important to a growing set of today's industrial micromachining applications.
IPG also develops and sells specialized fiber laser systems for unique material processing applications as requested by customers desiring a complete laser-based solution, including remote welding, micro-welding and cutting. The platforms include multi-axis workstations for welding, flatbed cutters, and diode markers.
Other systems offerings include a welding seam stepper and picker, which is an automated and integrated fiber laser welding tool providing customers increased processing speeds, better quality and the elimination of certain clamping tools and laser safety enclosures. The seam stepper and picker, an alternative to resistance welding, are used in automotive assembly, appliance, rail cars and other sheet metal fabrication.
The following table lists our principal product lines that generated a substantial majority of our revenues in
2014
, and the principal applications markets in which they are used:
8
|
Product Line
|
|
Principal Markets
|
|
Principal Applications
|
|
|
|
|
||
|
High-Power Ytterbium CW
(1,000 — 100,000 Watts)
|
|
Automotive
Heavy Industry
General Manufacturing
Natural Resources
Aerospace
|
|
• Cutting
• Welding
• Annealing
• Drilling
• Cladding
• Brazing
• Paint stripping
|
|
|
|
|
||
|
Mid-Power Ytterbium CW
(100 — 999 Watts)
|
|
General Manufacturing
Consumer
Medical Devices
Printing
Electronics
|
|
• Cutting
• Welding
• Scribing
• Engraving
• 3D printing
|
|
|
|
|
||
|
Pulsed Ytterbium
(0.1 to 200 Watts)
|
|
General Manufacturing
Semiconductor
Medical Devices
Consumer
Electronics
Panel Displays
|
|
• Marking
• Engraving
• Scribing
• Drilling
• Coating removal
• Cutting
|
|
|
|
|
||
|
Pulsed and CW
Green Lasers
|
|
Microprocessing and Semiconductor
Solar
General Manufacturing
|
|
• Annealing silicon wafers
• Thin film ablation
• Marking plastics
|
|
|
|
|
||
|
Quasi-CW Ytterbium
(100 — 900 Watts)
|
|
Medical Device
Computer Components
Fine-Processing
|
|
• Welding and micro-welding
• Drilling
• Cutting metals and crystals
|
|
|
|
|
||
|
Erbium Amplifiers
|
|
Broadband Access
Cable TV
DWDM
Instrumentation
Scientific Research
|
|
• Telephony
• Video on demand
• High-speed internet
• Ultra-long-haul transmission
• Beam combining
|
Our products are used in a broad range of applications. The major application is materials processing, comprising approximately
95%
of our sales in
2014
. Our products also address other applications, including advanced applications (approximately
3%
of sales), communications (approximately
1%
of sales) and medical (approximately
1%
of sales).
Our Markets
Materials Processing
The most significant materials processing applications for fiber lasers are cutting and welding and marking and engraving. Other applications include micro-processing, surface treatment, drilling, soldering, annealing, hardening, additive manufacturing and laser-assisted machining.
Cutting and Welding Applications.
Laser-based cutting technology has several advantages compared to alternative technologies. Laser cutting is fast, flexible and highly precise and can be used to cut complex contours on flat, tubular or three-dimensional materials. The laser source can be programmed to process many different kinds of materials such as steel, aluminum, brass, copper, glass, ceramic and plastic at various thicknesses. Laser cutting technology is a non-contact process that is easy to integrate into an automated production line and is not subject to wear of the cutting medium. We sell low, mid and high-power ytterbium fiber lasers for laser cutting. High electrical efficiency, low maintenance and operating cost, high beam quality, wide operating power range, power stability and small spot size are some of the qualities offered by IPG fiber lasers for many cutting applications, which enable customers to cut a variety of materials faster.
Laser welding offers several important advantages compared to conventional welding technology as it is non-contact, easy to automate, provides high process speed and results in narrow-seamed, high-quality welds that generally require little or no post-processing machining. The high beam quality of our fiber lasers coupled with high CW power offer deep penetration welding as well as shallow conduction mode welding. In addition, fiber lasers can be focused to a small spot with extremely long focal lengths, enabling remote welding "on the fly," a flexible method of three-dimensional welding in which the laser beam is positioned by a robot-guided scanner. Such remote welding stations equipped with fiber lasers are used for welding door panels and seat backs, the multiple welding of spot and lap welds over the entire auto body frame and welding "body-in-white," which is welding pieces of metal with different thicknesses for automotive applications. Typically, mid to high-power ytterbium fiber lasers and long-pulse QCW ytterbium fiber lasers are used in welding applications. Our products are used also
9
for laser brazing of visible joints in automobiles such as tailgates, roof joints and columns. Brazing is a method of joining sheet metal by using a melted filler material similar to soldering but requiring higher temperatures.
Marking and Engraving.
With the increasing need for source traceability, component identification and product tracking as a means of reducing product liability and preventing falsification, as well as the demand for modern robotic production systems, manufacturers increasingly demand marking systems capable of applying serialized alphanumeric, graphic or bar code identifications directly onto their manufactured components. Laser engraving is similar to marking but forms deeper grooves in the material. In contrast to conventional acid etching and ink-based technologies, lasers can mark a wide variety of metal and non-metal materials, such as ceramic, glass and plastic surfaces, at high speeds and without contact by changing the surface structure of the material or by engraving. Laser marking systems can be easily integrated into a customer's production process and do not subject the item being marked to mechanical stress. Our ytterbium pulsed fiber lasers are used for these applications.
In the semiconductor industry, lasers typically are used to mark wafers and integrated circuits. In the electronics industry, lasers typically are used to mark electrical components such as contactors, relays and printed circuit boards. Consumer electronic devices such as mobile phones, computers and handheld computers contain many parts that are laser-marked, including keyboards, logos and labels. With the increase in marking speed in the past few years, the cost of laser marking has decreased. In the photovoltaic or solar panel industry, pulsed lasers increasingly are used to remove materials and to scribe, or cut, solar cells. The high beam quality, increased peak output powers, flexible fiber delivery and competitive price of fiber lasers have accelerated the adoption of fiber lasers in these low-power applications.
Micro-Processing and Fine Processing.
The trend toward miniaturization in numerous industries such as consumer electronics, as well as innovations in materials and structures, is driving end users to utilize lasers in processing and fabrication. The ability of lasers to cut, weld, drill, ablate, etch and add materials on a fine scale is enabling new technologies and products across many industries. Our low-power CW and QCW lasers are used to cut medical stents and weld medical batteries. In photovoltaic manufacturing, our lasers etch and perform edge isolation processes. The aerospace industry requires precise manufacturing of engine parts so that cooling is effective and aerospace manufacturers use lasers to conduct percussion drilling. Processing of plastics and semi-conductors require short pulse and high energy lasers, in the green, UV and mid infra-red wavelengths.
Advanced Applications
Our fiber lasers and amplifiers are utilized by commercial firms and by academic and government institutions worldwide for manufacturing of commercial systems and for research in advanced technologies and products. These markets may use specialty products developed by us or commercial versions of our products.
Obstacle Warning and Mapping.
Our products are used for obstacle warning and 3-dimensional mapping of earth surfaces.
Special Projects.
Due to the high power, compactness, performance, ruggedness and electrical efficiency of our fiber lasers and amplifiers, we sell our commercial products for government research and projects. These include materials testing, ordnance destruction, coherent beam combining, directed energy demonstrations, advanced communications and research.
Research and Development.
Our products are used in a variety of applications for research and development by scientists and industrial researchers, including atom trapping. In addition, our lasers and amplifiers are used to design, test and characterize components and systems in a variety of markets and applications.
Optical Pumping and Harmonic Generation.
Several types of our lasers are used to optically pump other solid-state lasers and for harmonic generation and parametric converters to support research in sensing, medical and other scientific research in the infrared and visible wavelength domains. Our lasers are used as a power source for these other lasers. Green visible lasers are used to pump titanium sapphire lasers. Visible lasers can be used in optical displays, planetariums and light shows.
Remote Sensing.
Our products are used in light detection and ranging ("LIDAR"), a laser technique for remote sensing. Optical fiber can be used as a sensor for measuring changes in temperature, pressure and gas concentration in oil wells, atmospheric and pollution measurements and seismic exploration.
Communications
We design and manufacture a DWDM transport system for transmission of multiple wavelength channels over a single optical fiber including a full range of fiber amplifiers and Raman pump lasers that enable optical transmission over very long distances. We design and manufacture transponders and muxponders by leveraging our system-on-a-chip design competency
10
requiring very large scale integration. IPG's fiber amplifiers are deployed in some of the world's largest broadband FTTH networks.
DWDM
. DWDM is a technology that expands the capacity of optical networks, allowing service providers to extend the life of existing fiber networks and reduce operating and capital costs by maximizing bandwidth capacity. We provide a broad range of high-power products for DWDM applications including EDFAs and Raman lasers. We provide a DWDM transport system that offers service providers and private network operators a simple, flexible, optical layer solution scalable to 80 channels that aggregates and multiplexes multiprotocol clients into optical transport network signals operating at 10, 40 and 100 gigabits per second per channel.
Broadband Access.
The delivery to subscribers of television programming and Internet-based information and communication services is converging, driven by advances in Internet Protocol ("IP") technology and by changes in the regulatory and competitive environment. Fiber optic lines now offer connection speeds of up to 10 gigabits per second to the subscriber, or 1,000 times faster than digital subscriber lines ("DSL"), or cable links. We offer a series of specialty multi-port EDFAs and cable television ("TV") nodes and transmitters that support different types of passive optical network architectures, enabling high-speed data, voice, video on demand and high-definition TV. We provide an EDFA that supports up to 64 output ports, which allows service providers to support a high number of customers in a small space, reducing overall power consumption and network cost. End users for our products include communications network operators for video wavelength division multiplexing overlay solutions, operators of metro and long-haul networks for DWDM and amplification solutions, as well as cable and multiple system operators for optical amplification solutions.
Medical
We sell our commercial fiber and diode lasers to OEMs that incorporate our products into their medical laser systems. CW erbium and thulium fiber lasers from 1 to 150 watts and diode laser systems can be used in various medical and biomedical applications. Aesthetic applications addressed by lasers include skin rejuvenation, skin resurfacing and stretch mark removal. Purchasers use our diode lasers in dental and skin tightening procedures. Surgical applications include prostate surgery. Fiber lasers have the ability to fine-tune optical penetration depth and absorption characteristics and can be used for ear, nose and throat, urology, gynecology and other surgical procedures.
Technology
Our products are based on our proprietary technology platform that we have developed and refined since our formation. The following technologies are key elements in our products.
Specialty Optical Fibers
We have extensive expertise in the disciplines and techniques that form the basis for the multi-clad active and passive optical fibers used in our products. Active optical fibers form the laser cavity or gain medium in which lasing or amplification of light occurs in our products. Passive optical fibers deliver the optical energy created in our products. Our active fibers consist of an inner core that is infused with the appropriate rare earth ion, such as ytterbium, erbium or thulium, and outer cores of un-doped glass having different indices of refraction. We believe that our large portfolio of specialty active and passive optical fibers has a number of advantages as compared to other commercially available optical fibers. These advantages include higher concentrations of rare earth ions, fibers that will not degrade at the high power levels over the useful life of the product, high lasing efficiency, ability to achieve single-mode outputs at high powers, ability to withstand high optical energies and temperatures and scalable side-pumping capability.
Semiconductor Diode Laser Processing and Packaging Technologies
Another key element of our technology platform is that we use multiple multi-mode, or broad area, single-emitter diodes rather than diode bars or stacks as a pump source. We believe that multi-mode single-emitter diodes are the most efficient and reliable pumping source presently available, surpassing diode bars and stacks in efficiency, brightness and reliability. Single-emitter diodes have substantially reduced cooling requirements and typically have estimated lifetimes of more than 100,000 hours at high operating currents, compared to typical lifetimes of up to 10,000 to 20,000 hours for diode bars.
We developed advanced molecular beam epitaxy techniques to grow alumina indium gallium arsenide wafers for our diodes. This method yields high-quality optoelectronic material for low-defect density and high uniformity of optoelectronic parameters. In addition, we have developed numerous proprietary wafer processes and testing and qualification procedures in order to create a high energy output in a reliable and high-power diode. We package our diodes in hermetically sealed pump modules in which the diodes are combined with an optical fiber output. Characteristics such as the ability of the package to dissipate heat produced by the diode and withstand vibration, shock, high temperature, humidity and other environmental conditions are critical to the reliability and efficiency of the products.
11
Specialty Components and Combining Techniques
We developed a wide range of advanced optical components that are capable of handling high optical power levels and contribute to the superior performance, efficiency and reliability of our products. In addition to fibers and diodes, our optical component portfolio includes fiber gratings, couplers, isolators and combiners. We also developed special methods and expertise in splicing fibers together with low optical energy loss and on-line loss testing. We believe that our internal development and manufacturing of key optical components allows us to lower our manufacturing costs and improve product performance.
Side Pumping of Fibers and Fiber Block Technologies
Our technology platform allows us to efficiently combine a large number of multi-mode single-emitter semiconductor diodes with our active optical fibers that are used in all of our products. A key element of this technology is that we pump our fiber lasers through the cladding surrounding the active core. We splice our specialty active optical fibers with other optical components and package them in a sealed box, which we call a fiber block. The fiber blocks are compact and eliminate the risk of contamination or misalignment due to mechanical vibrations and shocks as well as temperature or humidity variations. Our design is scalable and modular, permitting us to make products with high output power by coupling a large number of diodes with fiber blocks, which can be combined in parallel and serially.
High-Stress Testing
We employ high-stress techniques in testing components and final products that help increase reliability and accelerate product development. For example, we test all of our diodes with high current and temperatures to accelerate aging. We also have built a large database of diode test results that allows us to predict the estimated lifetime of our diodes. This testing allows us to eliminate defective diodes prior to further assembly and thus increase reliability.
Customers
We sell our products globally to OEMs, system integrators and end users in a wide range of diverse markets who have the in-house engineering capability to integrate our products into their own systems. We have thousands of customers worldwide. Our primary end market is materials processing, comprised of general manufacturing, automotive, heavy industry, aerospace, consumer products, medical device manufacturing, natural resources, photovoltaic semiconductor and electronics customers. We also sell our products to other end markets, including advanced applications (comprised of commercial companies, universities, research entities and government entities), communications (comprised of system integrators, utilities and municipalities) and medical (comprised of medical laser systems manufacturers and researchers). We believe that our customer, geographic and end market diversification minimizes dependence on any single industry or group of customers.
The following table shows the allocation of our net sales (in thousands) among our principal markets:
|
|
Year Ended December 31,
|
||||||||||||||||||||
|
|
2014
|
2013
|
2012
|
||||||||||||||||||
|
|
|
% of Total
|
|
% of Total
|
|
|
|||||||||||||||
|
Materials Processing
|
$
|
731,274
|
|
95.0
|
%
|
$
|
608,702
|
|
94.0
|
%
|
$
|
492,013
|
|
87.5
|
%
|
||||||
|
Other applications:
|
|||||||||||||||||||||
|
Advanced Applications
|
25,704
|
|
3.3
|
|
26,190
|
|
4.0
|
|
43,052
|
|
7.6
|
|
|||||||||
|
Communications
|
8,523
|
|
1.1
|
|
9,135
|
|
1.4
|
|
21,706
|
|
3.9
|
|
|||||||||
|
Medical
|
4,331
|
|
0.6
|
|
4,007
|
|
0.6
|
|
5,757
|
|
1.0
|
|
|||||||||
|
Total other applications:
|
38,558
|
|
5.0
|
|
39,332
|
|
6.0
|
|
70,515
|
|
12.5
|
|
|||||||||
|
Total
|
$
|
769,832
|
|
100.0
|
%
|
$
|
648,034
|
|
100.0
|
%
|
$
|
562,528
|
|
100.0
|
%
|
||||||
One of our customers, Han's Laser, headquartered in China, accounted for
11%
of our net sales for both the years ended
December 31, 2014
and
2013
. No other customer accounted for 10% or more of our net sales for
2014
or
2013
. None of our customers accounted for 10% or more of our net sales for the year ended December 31,
2012
.
12
Our net sales (in thousands) were derived from customers in the following geographic regions:
|
|
Year Ended December 31,
|
||||||||||||||||||||
|
|
2014
|
2013
|
2012
|
||||||||||||||||||
|
% of Total
|
% of Total
|
% of Total
|
|||||||||||||||||||
|
United States and other North America (1)
|
$
|
113,233
|
|
14.7
|
%
|
$
|
116,935
|
|
18.0
|
%
|
$
|
108,316
|
|
19.3
|
%
|
||||||
|
Europe:
|
|||||||||||||||||||||
|
Germany
|
77,404
|
|
10.1
|
|
65,147
|
|
10.1
|
|
89,848
|
|
16.0
|
|
|||||||||
|
Other including Eastern Europe/CIS
|
173,018
|
|
22.5
|
|
140,279
|
|
21.7
|
|
110,860
|
|
19.7
|
|
|||||||||
|
Asia and Australia:
|
|||||||||||||||||||||
|
Japan
|
72,573
|
|
9.4
|
|
67,981
|
|
10.5
|
|
69,576
|
|
12.4
|
|
|||||||||
|
China
|
245,102
|
|
31.9
|
|
192,134
|
|
29.7
|
|
138,782
|
|
24.7
|
|
|||||||||
|
Other
|
85,426
|
|
11.1
|
|
64,346
|
|
9.9
|
|
43,445
|
|
7.7
|
|
|||||||||
|
Rest of World
|
3,076
|
|
0.3
|
|
1,212
|
|
0.1
|
|
1,701
|
|
0.2
|
|
|||||||||
|
Total
|
$
|
769,832
|
|
100.0
|
%
|
$
|
648,034
|
|
100.0
|
%
|
$
|
562,528
|
|
100.0
|
%
|
||||||
(1)
The substantial majority of sales in North America are to customers in the United States.
Backlog
At
December 31, 2014
, our backlog of orders (generally scheduled for shipment within one year) was approximately
$321.0 million
compared to $265.0 million at
December 31, 2013
. At
December 31, 2014
, our backlog included
$174.5 million
of orders with firm shipment dates and
$146.5 million
of frame agreements that we expect to ship within one year, compared to $132.6 million of orders with firm shipment dates and $132.4 million of frame agreements at
December 31, 2013
. Frame agreements generally are agreements without committed shipment dates. Orders used to compute backlog are generally cancelable without substantial penalties. Historically, we have not experienced a significant cancellation rate. We manage the risk of cancellation by establishing the right to charge a cancellation fee that generally covers a portion of the purchase price, any materials and development costs incurred prior to the order being canceled. Our ability to enforce this right depends on many factors including, but not limited to, the customer's requested length of delay, the number of other outstanding orders with the customer and our ability to quickly convert the canceled order to another sale.
We anticipate shipping a substantial majority of the present backlog during fiscal year
2015
. However, our backlog at any given date is not necessarily indicative of actual sales for any future period.
Sales, Marketing and Support
We market our products internationally primarily through our direct sales force. Our direct sales force sells to end users, OEMs and systems integrators. Once our fiber laser products are designed into an OEM system, the OEM's sales force markets its systems, allowing us to take advantage of numerous OEMs sales forces, each typically having several sales persons in locations other than where our sales offices are located. We have sales offices in the countries in which we have major manufacturing: United States, Germany and Russia. We also have sales and service offices in the following countries: China, France, India, Italy, Japan, Poland, Singapore. South Korea, Spain, Turkey and the United Kingdom. We have materials processing application centers in the United States, Germany, Russia, China, Italy, Japan and South Korea, which we use to demonstrate our products and develop new applications. Our application centers are fundamental to developing new laser applications for customers and assisting them in integrating lasers into their production processes.
To a lesser extent, we market through agreements with independent sales representatives and distributors. Sales to foreign customers may be priced in non-U.S. currencies and are therefore subject to currency exchange fluctuations.
We maintain a customer support and field service staff in our major markets. We work closely with customers and independent representatives to service equipment and to train customers to use our products. We have expanded our support and field service, particularly in locations where customer concentration or volume requires local service capabilities. We repair products at our facilities or at customer sites.
We typically provide one to three-year parts and service warranties on our lasers and amplifiers. Most of our sales offices provide support to customers in their respective geographic areas. Warranty reserves have generally been sufficient to cover product warranty repair and replacement costs.
13
Manufacturing
Vertical integration is one of our core business strategies through which we control our proprietary processes and technologies as well as the supply of key components and assemblies. We believe that our vertically integrated business model gives us the following advantages:
|
•
|
maintaining a technological lead over competitors;
|
|
•
|
reducing component and final product costs compared to market prices available to competitors;
|
|
•
|
ensuring access to critical components, enabling us to better meet customer demands;
|
|
•
|
controlling performance, quality and consistency;
|
|
•
|
enabling rapid development and deployment of new products and technologies;
|
|
•
|
short lead times for customer deliveries; and
|
|
•
|
limiting the spread our trade secrets.
|
Our vertically integrated manufacturing operations include optical preform making, specialty fiber drawing, semiconductor wafer growth, diode processing and packaging, specialty optical component manufacturing, fiber block and fiber module assembly for different power units, circuit board, software and electronics development and production, machining of metal parts and casings, final assembly, as well as testing, tool manufacturing and automated production systems that we use in our own manufacturing processes. Over the last several years, we added additional production capabilities, including four multi-wafer growth reactors, diode test stations, fiber pre-form and fiber drawing equipment and low, mid and high-power production and testing, in order to increase our capacity as well as reduce the risks associated with our production process.
We operate our own semiconductor foundry for the production of the multi-mode single-emitter diodes. Diodes are the pumps that are used as the light source in each device we make. We also process, package and extensively test all of our diodes. Because pump diodes represent a significant component cost of the final laser or amplifier, we have chosen to develop internal manufacturing capabilities for diodes. As a result of our high-volume production levels of pump diodes, proprietary processes and use of limited chip designs, we have been able to increase yields, lower component costs and assure high quality. We also design, manufacture and optimize many of our own test instruments, diode test racks, robotic and automated assembly tools and machines.
We developed these proprietary components, manufacturing tools, equipment and techniques over many years in an effort to address the major issues that had been inhibiting the development of fiber laser technology and to provide products that differentiate us from our competitors. We believe that the proprietary components, manufacturing tools, equipment, techniques and software utilized in all of our product lines provide extensive barriers to potential competitors. Generally, we do not sell our proprietary components to third parties in significant quantities. Using our technology platform, we configure standard products based upon each customer's specifications. Through our vertically integrated manufacturing operations, we believe that we can develop, test and produce new products and configurations with higher performance and reliability and in less time than by working with external vendors. We have developed proprietary testing methodologies that allow us to develop higher power components and products in short periods of time, enable us to introduce products to the market more quickly, capitalize on new opportunities and provide superior service to our customers.
Our in-house manufacturing generally includes only those operations and components that are critical to the protection of our intellectual property, the reduction of our costs or the achievement of performance and quality standards. We purchase from vendors common and specialized mechanical, electrical and optical parts and raw materials.
Research and Development
We have extensive research and development experience in laser materials, fiber, optoelectronic and optomechanical components. We have assembled a team of scientists and engineers with specialized experience and extensive knowledge in fiber lasers and amplifiers, materials science, optics, critical components, testing and manufacturing process design.
We focus our research and development efforts on designing and introducing new and improved standard and customized products and complementary products, and the mass production of components for our products. In addition to our cladding-pumped specialty fiber platform, we have core competencies in high-power multi-mode and single-mode semiconductor laser diodes, diode packaging, specialty active and passive optical fibers, high-performance optical components, fiber gain blocks and fiber modules, as well as splicing and combining techniques and high-stress test methods. Our research and development efforts are aided by our vertical integration and our proprietary high-stress testing techniques that result in accelerated development cycles. The strategy of developing our proprietary components has allowed us to leverage our optical experience
14
and large volume requirements to lower the cost of our products. We concentrate our research and development efforts on advancements in performance as well as capacity to hold and produce higher optical power levels.
Our research and development efforts are also directed at expanding our product line by increasing power levels, improving beam quality and electrical efficiency, decreasing the size of our products and lowering the cost per watt. We also are engaged in research projects to expand the spectral range of products that we offer, including the development of UV pulsed fiber lasers, ultra-fast pulsed fiber lasers, and a mid-infrared ("IR") line of lasers from 2 to 5 microns, with a hybrid fiber and crystal laser design. Our team of experienced scientists and engineers works closely with many of our customers to develop and introduce custom products that address specific applications and performance requirements.
We incurred research and development costs of approximately
$53.4 million
,
$41.7 million
and
$31.4 million
for the years ended
December 31, 2014
,
2013
and
2012
, respectively. We expect to continue our commitment to research and development and to introduce new products, systems and complementary products that would allow us to maintain our competitive position. See Item 7, "Management's Discussion and Analysis of Financial Condition of Results of Operations."
Intellectual Property
We seek to protect our proprietary technology primarily through the U.S. and foreign laws affording protection for trade secrets, and to seek U.S. and foreign patent, copyright and trademark protection of our products and processes where appropriate. Historically, we relied primarily on trade secrets, technical know-how and other unpatented proprietary information relating to our product development and manufacturing activities. We seek to protect our trade secrets and proprietary information, in part, by requiring our employees to enter into agreements providing for the maintenance of confidentiality and the assignment to us of rights to inventions that they make while we employ them. We also enter into non-disclosure agreements with our consultants and suppliers to protect confidential information delivered to them. We believe that our vertical integration, including our long experience in making a wide range of specialty and high-power capacity components, as well as our technology platform make it difficult for others to reverse engineer our products.
We have increased our efforts to expand our patent portfolio globally. As of February 17, 2015, we have over 170 patents issued and over 260 pending patent applications worldwide relating principally to optical fiber lasers, amplifiers, bulk optics, semiconductors, and laser and telecommunications systems. With respect to the United States, we were issued 20 patents and we filed 24 applications on new subject matter in
2014
. In February 2008, we purchased a portfolio of photonics patents from British Telecommunications plc in the fields of optical fiber lasers and amplifiers, semiconductor devices, integrated optics, fiber gratings, high-speed systems and optical networking. Intellectual property rights, including those that we own, those that we license and those of others, involve significant risks. See Item 1A, "Risk Factors-Our Inability to Protect Our Intellectual Property and Proprietary Technologies Could Result in the Unauthorized Use of Our Technologies by Third Parties, Hurt Our Competitive Position and Adversely Affect Our Operating Results."
Competition
Our markets are competitive and characterized by rapidly changing technology and continuously evolving customer requirements. We believe that the primary competitive factors in our markets are:
|
•
|
product performance and reliability;
|
|
•
|
quality and service support;
|
|
•
|
price and value to the customer;
|
|
•
|
ability to manufacture and deliver products on a timely basis;
|
|
•
|
ability to achieve qualification for and integration into OEM systems;
|
|
•
|
ability to meet customer specifications; and
|
|
•
|
ability to respond quickly to market demand and technological developments.
|
We believe we compete favorably with respect to these criteria. In the materials processing market, the competition is fragmented and includes a large number of competitors. We compete with makers of high-power CO
2,
YAG and disc lasers, including Fanuc, Rofin-Sinar Technologies, Inc. and Trumpf GmbH + Co. KG, makers of mid and low-power CO
2,
solid-state lasers such as Coherent, Inc., GSI Group Inc., Newport Corporation and Rofin-Sinar Technologies, Inc., and direct diode lasers such as Laserline GmbH. We also compete with fiber laser makers, including Rofin-Sinar Technologies, Inc., Trumpf GmbH + Co. KG, GSI Group Inc., Coherent Inc., Hypertherm, Inc., Newport Corporation, The Furukawa Electric Co., Ltd., Keopsys SA, Mitsubishi Cable Industries, Ltd., Amada Co., Ltd., Raycus Fiber Laser Technologies Co. Ltd., Maxphotonics Co., Ltd. and JDS Uniphase Corporation. Several competitors recently introduced fiber lasers or announced plans to introduce fiber
15
lasers that compete with our high-power products. We believe that we compete favorably with other makers of fiber lasers on price and value to customer, reliability, service and performance.
We also compete in the materials processing, advanced and medical applications markets with end users that produce their own solid-state and gas lasers as well as with manufacturers of non-laser methods and tools, such as resistance welding and cutting dies in the materials processing market and scalpels in the medical market.
Some of our competitors are larger than we are and have substantially greater financial, managerial and technical resources, more extensive distribution and service networks, greater sales and marketing capacity, and larger installed customer bases than we do.
Employees
As of
December 31, 2014
, we had approximately 3,030 full-time employees, including 330 in research and development, 2,330 in manufacturing operations, 140 in sales, service and marketing, and 230 in general and administrative functions. Of our total full-time employees at our principal facilities, approximately 1,010 were in the United States, 800 were in Germany, 860 were in Russia and 110 were in China. We have never experienced a work stoppage and none of our employees is subject to a collective bargaining agreement. We believe that our current relations with our employees are good. We also have approximately 340 contractors worldwide who are principally used in manufacturing operations.
Government Regulation
Regulatory Compliance
The majority of our laser and amplifier products sold in the United States are classified as Class IV Laser Products under the applicable rules and regulations of the Center for Devices and Radiological Health ("CDRH") of the U.S. Food and Drug Administration ("FDA"). The same classification system is applied in the European markets. Safety rules are formulated with "Deutsche Industrie Norm" (i.e., German Industrial Standards) or International Organization for Standardization ("ISO") standards, which are internationally harmonized.
CDRH regulations generally require a self-certification procedure pursuant to which a manufacturer must submit a filing to the CDRH with respect to each product incorporating a laser device, make periodic reports of sales and purchases and comply with product labeling standards, product safety and design features and informational requirements. The CDRH is empowered to seek fines and other remedies for violations of their requirements. We believe that our products are in material compliance with applicable laws and regulations relating to the manufacture of laser devices.
Environmental Regulation
Our operations are subject to various federal, state, local and international laws governing the environment, including those relating to the storage, use, discharge, disposal, product composition and labeling of, human exposure to and hazardous and toxic materials. We believe that our operations are in material compliance with applicable environmental protection laws and regulations. Although we believe that our safety procedures for using, handling, storing and disposing of such materials comply with the standards required by federal and state laws and regulations, we cannot completely eliminate the risk of accidental contamination or injury from these materials. In the event of such an accident involving such materials, we could be liable for damages and such liability could exceed the amount of our liability insurance coverage and the resources of our business.
Availability of Reports
Our annual reports on Form 10-K, quarterly reports on Form 10-Q, current reports on Form 8-K and any amendments to such reports are available free of charge on our web site at
www.ipgphotonics.com
as soon as reasonably practicable after such reports are electronically filed with, or furnished to, the Securities and Exchange Commission ("SEC") (
www.sec.gov
). We will also provide electronic or paper copies of such reports free of charge, upon request made to our Corporate Secretary.
16
ITEM 1A.
RISK FACTORS
The factors described below are the principal risks that could materially adversely affect our operating results and financial condition. Other factors may exist that we do not consider significant based on information that is currently available. In addition, new risks may emerge at any time, and we cannot predict those risks or estimate the extent to which they may affect us.
Downturns in the markets we serve, particularly materials processing, could have a material adverse effect on our sales and profitability.
Our business depends substantially upon capital expenditures by our customers, particularly by manufacturers in the materials processing market, which includes general manufacturing, automotive, aerospace, other transportation, heavy industry, electronics and photovoltaic industries. Approximately
95%
of our revenues in
2014
were from customers in the materials processing market. Although applications in this market are broad, sales for these applications are cyclical and have historically experienced sudden and severe downturns and periods of oversupply, resulting in significantly reduced demand for capital equipment, including the products that we manufacture and market. For example, our sales decreased by 25% in the materials processing market in 2009 as a result of the global economic recession. For the foreseeable future, our operations will continue to depend upon capital expenditures by customers in these industries or markets, which, in turn, depend upon the demand for their products or services. Decreased demand for products and services from customers for these applications during an economic downturn may lead to decreased demand for our products, which would reduce our sales and margins. We may not be able to respond by decreasing our expenses quickly enough, due in part, to our fixed overhead structure related to our vertically integrated operations and our commitments to continuing investment in research and development.
Uncertainty and adverse changes in the general economic conditions of markets in which we participate negatively affect our business.
Current and future conditions in the economy have an inherent degree of uncertainty. As a result, it is difficult to estimate the level of growth or contraction for the economy as a whole. It is even more difficult to estimate growth or contraction in various parts, sectors and regions of the economy, including the materials processing, telecommunications, advanced and medical markets and applications in which we participate. Because all components of our budgeting and forecasting are dependent upon estimates of growth or contraction in the markets and applications we serve and demand for our products, the prevailing economic uncertainties render estimates of future income and expenditures very difficult to make. A significant portion of our sales are to customers in China, which accounted for
32%
,
30%
and
25%
in
2014
,
2013
and
2012
, respectively. A slowing of economic growth, or a recession in China, would slow our growth rates or may result in a decrease in our sales. Adverse changes have occurred and may occur in the future as a result of declining or flat global or regional economic conditions, fluctuations in currency and commodity prices, wavering confidence, capital expenditure reductions, unemployment, declines in stock markets, contraction of credit availability, declines in real estate values, or other factors affecting economic conditions generally. These changes may negatively affect the sales of our lasers and amplifiers, increase exposure to losses from bad debts, increase the cost and decrease the availability of financing, increase the risk of loss on investments, or increase costs associated with manufacturing and distributing products. A prolonged economic downturn could have a material adverse effect on our business, financial condition and results of operations.
Our sales growth depends upon our ability to penetrate new applications for fiber lasers and increase our market share in existing applications.
Our level of sales will depend on our ability to generate sales of fiber lasers in applications where conventional lasers, such as CO
2
and YAG lasers, have been used or in new and developing markets and applications for lasers where they have not been used previously. To date, a significant portion of our revenue growth has been derived from sales of fiber lasers primarily for applications where CO
2
and YAG lasers historically have been used. In order to maintain or increase market demand for our fiber laser products, we will need to devote substantial resources to:
|
•
|
demonstrate the effectiveness of fiber lasers in new applications;
|
|
•
|
successfully develop new product lines, such as UV, visible and ultra-fast fiber lasers, that extend our product line to address different applications than our current products;
|
|
•
|
increase our direct and indirect sales efforts;
|
|
•
|
effectively service and support our installed product base on a global basis; and
|
|
•
|
continue to reduce our manufacturing costs and enhance our competitive position.
|
17
If we are unable to implement our strategy to develop new applications for our products or develop new products, our revenues, operating results and financial condition could be adversely affected. We cannot assure you that we will be able to successfully implement our business strategy in part or whole. In addition, any newly developed or enhanced products may not achieve market acceptance or may be rendered obsolete or less competitive by the introduction of new products by other companies.
Our vertically integrated business results in high levels of fixed costs and inventory levels that may adversely impact our gross profits and our operating results in the event that demand for our products declines or we maintain excess inventory levels.
We have a high fixed cost base due to our vertically integrated business model, including the fact that approximately 77% of our approximately 3,030 employees as of
December 31, 2014
were employed in our manufacturing operations. We may not adjust these fixed costs quickly enough to adapt to rapidly changing market conditions. Our gross profit, in absolute dollars and as a percentage of net sales, is impacted by our sales volume, the corresponding absorption of fixed manufacturing overhead expenses and manufacturing yields. In addition, because we are a vertically integrated manufacturer and design and manufacture our key specialty components, insufficient demand for our products may subject us to the risks of high inventory carrying costs and increased inventory obsolescence. If our capacity and production levels are not properly sized in relation to expected demand, we may need to record write-downs for excess or obsolete inventory. Because we are vertically integrated, the rate at which we turn inventory has historically been low when compared to our cost of sales. We do not expect this to change significantly in the future and believe that we will have to maintain a relatively high level of inventory compared to our cost of sales. As a result, we continue to expect to have a significant amount of working capital invested in inventory. Changes in our level of inventory lead to an increase in cash generated from our operations when inventory is sold or a decrease in cash generated from our operations at times when the amount of inventory increases.
Our manufacturing capacity and operations may not be appropriate for future levels of demand and may adversely affect our gross margins.
We have added and are continuing to add substantial manufacturing capacity at our facilities in the United States, Germany and Russia. A significant portion of our manufacturing facilities and production equipment, such as our semiconductor production and processing equipment, diode packaging equipment and diode burn-in stations, are special-purpose in nature and cannot be adapted easily to make other products. If the demand for fiber lasers or amplifiers does not increase or if our revenue decreases from current levels, we may have significant excess manufacturing capacity and under-absorption of our fixed costs, which could in turn adversely affect our gross margins and profitability.
To maintain our competitive position as the leading developer and manufacturer of fiber lasers and to meet anticipated demand for our products, we invest significantly in the expansion of our manufacturing and operations throughout the world and may do so in the future. We incurred in the past and will incur in the future significant costs associated with the acquisition, build-out and preparation of our facilities. We had capital expenditures of
$88.6 million
and
$70.9 million
in
2014
and
2013
, respectively, and we expect to incur approximately
$60 million
to
$65 million
in capital expenditures, excluding acquisitions, in
2015
. In connection with these projects, we may incur cost overruns, construction delays, labor difficulties or regulatory issues which could cause our capital expenditures to be higher than what we currently anticipate, possibly by a material amount, which would in turn adversely impact our operating results. Moreover, we may experience higher costs due to yield loss, production inefficiencies and equipment problems until any operational issues associated with the opening of new manufacturing facilities are resolved.
The markets for our products are highly competitive and increased competition could increase our costs, reduce our sales or cause us to lose market share.
The industries in which we operate are characterized by significant price and technological competition. Our fiber laser and amplifier products compete with conventional laser technologies and amplifier products, some offered by well-established companies. Several of these are larger and have substantially greater financial, managerial and technical resources, more extensive distribution and service networks, greater sales and marketing capacity, and larger installed customer bases than we do. Also, we compete with widely used non-laser production methods, such as water-jet cutting and resistance welding. We believe that competition will be particularly intense from makers of CO
2,
YAG, disc and direct diode lasers, as these makers of lasersolutions may lower prices to maintain or gain current market share and have committed significant research and development resources to pursue opportunities related to these technologies.
In addition, we face competition from a growing number of fiber laser makers, including Rofin-Sinar Technologies, Inc., Trumpf GmbH + Co. KG, GSI Group Inc., Coherent Inc., Hypertherm, Inc., Newport Corporation, The Furukawa Electric Co.,
18
Ltd., Keopsys SA, Mitsubishi Cable Industries, Ltd., Amada Co., Ltd., Raycus Fiber Laser Technologies Co. Ltd., Maxphotonics Co., Ltd. and JDS Uniphase Corporation. Competition from other fiber laser makers has increased and some have introduced fiber lasers or announced plans to introduce fiber lasers that compete with our products. We may not be able to successfully differentiate our current and proposed products from our competitors' products and current or prospective customers may not consider our products to be superior to competitors' products. To maintain our competitive position, we believe that we will be required to continue a high level of investment in research and development, application development and customer service and support, and to react to market pricing conditions. We may not have sufficient resources to continue to make these investments and we may not be able to make the technological advances or price adjustments necessary to maintain our competitive position. In addition, there are no assurances that our investments in research and development, application development and customer service and support will be successful. We also compete against our OEM customers' internal production of competitive laser and amplifier technologies.
A few customers account for a significant portion of our sales, and if we lose any of these customers or they significantly curtail their purchases of our products, our results of operations could be adversely affected.
We rely on a few customers for a significant portion of our sales. In the aggregate, our top five customers accounted for
23%
,
21%
and
16%
of our consolidated net sales in
2014
,
2013
and
2012
, respectively. Our largest customer is located in China and accounted for
11%
,
11%
and
7%
of sales in
2014
,
2013
and
2012
, respectively. We generally do not enter into agreements with our customers obligating them to purchase our fiber lasers or amplifiers. Our business is characterized by short-term purchase orders and shipment schedules. If any of our principal customers discontinues its relationship with us, replaces us as a vendor for certain products or suffers downturns in its business, our business and results of operations could be adversely affected.
Foreign currency transaction risk may negatively affect our net sales, cost of sales and operating margins and could result in exchange losses.
We conduct our business and incur costs in the local currency of most countries in which we operate. In
2014
, our net sales outside the United States represented a substantial majority of our total sales. We incur currency transaction risk whenever one of our operating subsidiaries enters into either a purchase or a sales transaction using a different currency from the currency in which it operates. Changes in exchange rates can also affect our results of operations by changing the U.S. dollar value of sales, expenses and cash denominated in foreign currencies. We cannot accurately predict the impact of future exchange rate fluctuations on our results of operations. Further, given the volatility of exchange rates, we may not be able to effectively manage our currency transaction or translation risks, and any volatility in currency exchange rates may increase the price of our products in local currency to our foreign customers, which may have an adverse effect on our financial condition, cash flows and profitability.
Our inability to manage risks associated with our international customers and operations could adversely affect our business.
We have significant facilities in and our products are sold in numerous countries. Our principal markets include China, The United States, Germany, Switzerland, Italy, Japan, Korea and Russia. A substantial majority of our revenues are derived from customers, and we have substantial tangible assets, outside of the United States. We anticipate that foreign sales will continue to account for a significant portion of our revenues in the foreseeable future. Our operations and sales in these markets are subject to risks inherent in international business activities, including:
|
•
|
fluctuations in the values of foreign currencies;
|
|
•
|
longer accounts receivable collection periods and less developed credit assessment and collection procedures;
|
|
•
|
changes in a specific country's or region's economic conditions, such as recession;
|
|
•
|
compliance with a wide variety of domestic and foreign laws and regulations and unexpected changes in those laws and regulatory requirements, including uncertainties regarding taxes, tariffs, quotas, export controls, export licenses and other trade barriers;
|
|
•
|
certification requirements;
|
|
•
|
environmental regulations;
|
|
•
|
less effective protection of intellectual property rights in some countries;
|
|
•
|
potentially adverse tax consequences;
|
|
•
|
different capital expenditure and budget cycles for our customers, which affect the timing of their spending;
|
19
|
•
|
political, legal and economic instability, foreign conflicts, labor unrest and the impact of regional and global infectious illnesses in the countries in which we and our customers, suppliers, manufacturers and subcontractors are located;
|
|
•
|
preference for locally produced products;
|
|
•
|
difficulties and costs of staffing and managing international operations across different geographic areas and cultures;
|
|
•
|
seasonal reductions in business activities;
|
|
•
|
fluctuations in freight rates and transportation disruptions;
|
|
•
|
investment restrictions or requirements;
|
|
•
|
repatriation restrictions or requirements;
|
|
•
|
export and import restrictions; and
|
|
•
|
limitations on the ability of our employees to travel without restriction to certain countries in which we operate.
|
Political and economic instability and changes in governmental regulations could adversely affect both our ability to effectively operate our foreign sales offices and the ability of our foreign suppliers to supply us with required materials or services. Any interruption or delay in the supply of our required components, products, materials or services, or our inability to obtain these components, materials, products or services from alternate sources at acceptable prices and within a reasonable amount of time, could impair our ability to meet scheduled product deliveries to our customers and could cause customers to cancel orders.
We are subject to risks of doing business in Russia through our subsidiary, NTO IRE-Polus, which provides components and test equipment to us and sells finished fiber devices to customers in Russia and neighboring countries as well as finished pulsed lasers to China. Further, over 30% of our sales are to customers in China. The results of our operations, business prospects and facilities in these two countries are subject to the economic and political environment in Russia and China. In recent years, both countries have undergone substantial political, economic and social change. As is typical of an emerging economy, neither China nor Russia possesses a well-developed business, financial, legal and regulatory infrastructure that would generally exist in a more mature free market economy. In addition, tax, currency and customs legislation is subject to varying interpretations and changes, which can occur frequently. The future economic direction of these two emerging market countries remains largely dependent upon the effectiveness of economic, financial and monetary measures undertaken by the government, together with tax, legal, regulatory and political developments. Our failure to manage the risks associated with our operations in Russia and China and our other existing and potential future international business operations could have a material adverse effect upon our results of operations.
Recent events in Ukraine have resulted in the United States and the European Union imposing and escalating sanctions on Russia and certain businesses, sectors and individuals in Russia. The United States and the European Union also suspended the granting of certain types of export licenses to Russia. Russia has imposed its own sanctions on certain individuals in the U.S. and may be considering other sanctions on the U.S. and the European Union or certain businesses or individuals from them. We have a large manufacturing facility and research and development operations in Russia which supplies components to our U.S. and German manufacturing facilities and finished lasers to our subsidiary in China. In addition, we supply components from our U.S. and German manufacturing facilities to our Russian facility. To date, we have not experienced any material disruptions or impact from current sanctions. Should there be disruption of our supplies from or to our Russian operations, or should the United States, the European Union or Russia implement different sanctions, our production and/or deliveries as well as results of operations would be affected.
We are subject to many laws governing our international operations, including those that prohibit improper payments to government officials, including but not limited to the U.S. Foreign Corrupt Practices Act and the anti-corruption laws of the countries in which we operate. Violations of these laws, which are complex and often difficult to interpret and apply, could result in significant criminal penalties or sanctions that could materially adversely affect our business, financial condition, operating results and cash flows.
The laser and amplifier industries are experiencing declining average selling prices, which could cause our gross margins to decline and harm our operating results.
Products in the laser and amplifier industries generally, and our products specifically, are experiencing and may in the future continue to experience a decline in average selling prices ("ASPs") as a result of new product and technology introductions, increased competition and price pressures from significant customers. If the ASPs of our products decline further and we are unable to increase our unit volumes, introduce new or enhanced products with higher margins or reduce manufacturing costs to offset anticipated decreases in the prices of our existing products, our operating results may be
20
adversely affected. In addition, because of our significant fixed costs, we are limited in our ability to reduce total costs quickly in response to any revenue shortfalls. Because of these factors, we have experienced and we may experience in the future material adverse fluctuations in our operating results on a quarterly or annual basis if the ASPs of our products continue to decline.
We have experienced, and expect to experience in the future, fluctuations in our quarterly operating results. These fluctuations may increase the volatility of our stock price.
We have experienced, and expect to continue to experience, fluctuations in our quarterly operating results. We believe that fluctuations in quarterly results may cause the market price of our common stock to fluctuate, perhaps substantially. Factors which may have an influence on our operating results in a particular quarter include:
|
•
|
the increase, decrease, cancellation or rescheduling of significant customer orders;
|
|
•
|
the timing of revenue recognition based on the installation or acceptance of certain products shipped to our customers;
|
|
•
|
seasonality attributable to different purchasing patterns and levels of activity throughout the year in the areas where we operate;
|
|
•
|
the timing of customer qualification of our products and commencement of volume sales of systems that include our products;
|
|
•
|
our ability to obtain export licenses for our products on a timely basis or at all;
|
|
•
|
the rate at which our present and future customers and end users adopt our technologies;
|
|
•
|
the gain or loss of a key customer;
|
|
•
|
product or customer mix;
|
|
•
|
competitive pricing pressures;
|
|
•
|
our ability to design, manufacture and introduce new products on a cost-effective and timely basis;
|
|
•
|
our ability to manage our inventory levels and any provisions for excess or obsolete inventory;
|
|
•
|
our ability to collect outstanding accounts receivable balances;
|
|
•
|
the incurrence of expenses to develop and improve application and support capabilities, the benefits of which may not be realized until future periods, if at all;
|
|
•
|
different capital expenditure and budget cycles for our customers, which affect the timing of their spending;
|
|
•
|
foreign currency fluctuations;
|
|
•
|
economic and market conditions in a particular geography or country; and
|
|
•
|
our ability to control expenses.
|
These factors make it difficult for us to accurately predict our operating results. In addition, our ability to accurately predict our operating results is complicated by the fact that many of our products have long sales cycles, some lasting as long as twelve months. Once a sale is made, our delivery schedule typically ranges from four weeks to four months, and therefore our sales will often reflect orders shipped in the same quarter that they are received and will not enhance our ability to predict our results for future quarters. In addition, long sales cycles may cause us to incur significant expenses without offsetting revenues since customers typically expend significant effort in evaluating, testing and qualifying our products before making a decision to purchase them. Moreover, customers may cancel or reschedule shipments, and production difficulties could delay shipments. Accordingly, our results of operations are subject to significant fluctuations from quarter to quarter, and we may not be able to accurately predict when these fluctuations will occur.
Because we lack long-term purchase commitments from our customers, our sales can be difficult to predict, which could lead to excess or obsolete inventory and adversely affect our operating results.
We generally do not enter into long-term agreements with our customers obligating them to purchase our fiber lasers or amplifiers. Our business is characterized by short-term purchase orders and shipment schedules and, in some cases, orders may be canceled or delayed without significant penalty. As a result, it is difficult to forecast our revenues and to determine the appropriate levels of inventory required to meet future demand. In addition, due to the absence of long-term volume purchase agreements, we forecast our revenues and plan our production and inventory levels based upon the demand forecasts of our OEM customers, end users and distributors, which are highly unpredictable and can fluctuate substantially. This could lead to
21
increased inventory levels and increased carrying costs and risk of excess or obsolete inventory due to unanticipated reductions in purchases by our customers. In addition, provisions have been recorded as a result of changes in market prices of certain components, the value of those inventories that was realizable through finished product sales due to declines in certain end market demand and uncertainties related to the recoverability of the value of inventories due to technological and product changes, and excess quantities. In this regard, we recorded provisions for slow-moving, obsolete or excess inventory totaling
$11.3 million
,
$15.1 million
and
$8.2 million
in
2014
,
2013
and
2012
, respectively. If our OEM customers, end users or distributors fail to accurately forecast the demand for our products, fail to accurately forecast the timing of such demand, or are unable to consistently negotiate acceptable purchase order terms with customers, our results of operations may be adversely affected.
We may pursue acquisitions and investments in new businesses, products, patents or technologies. These may involve risks which could disrupt our business and may harm our financial results and condition.
We currently have no binding commitments or agreements to make any acquisitions and have limited experience in making acquisitions. In the future, we may make acquisitions of and investments in new businesses, products, patents and technologies and expand into new geographic areas, or we may acquire operations, products or technologies that expand our current capabilities. Acquisitions present a number of potential risks and challenges that could, if not met, disrupt our business operations, increase our operating costs and reduce the value of the acquired company, asset or technology to us. For example, if we identify an acquisition candidate, we may not be able to successfully negotiate or finance the acquisition on favorable terms. Even if we are successful, we may not be able to integrate the acquired businesses, products, patents or technologies into our existing business and products. As a result of the rapid pace of technological change in our industry, we may misjudge the long-term potential of an acquired business, product, patent or technology, or the acquisition may not be complementary to our existing business. Furthermore, potential acquisitions and investments, whether or not consummated, may divert our management's attention and require considerable cash outlays at the expense of our existing operations. In addition, to complete future acquisitions, we may issue equity securities, incur debt, assume contingent liabilities or have amortization expenses and write-downs of acquired assets, which could adversely affect our profitability and result in dilution to our existing and future stockholders.
We rely on the significant experience and specialized expertise of our senior management and scientific staff and if we are unable to retain these key employees and attract other highly skilled personnel necessary to grow our business successfully, our business and results of operations could suffer.
Our future success is substantially dependent on the continued service of our executive officers, particularly our founder and chief executive officer, Dr. Valentin P. Gapontsev, age 76, and the managing director of our German subsidiary IPG Laser GmbH and Senior Vice-President, Europe, Dr. Eugene Scherbakov, age 67, our highly trained team of scientists, many of whom have numerous years of experience and specialized expertise in optical fibers, semiconductors and optical component technology, and other key engineering, sales, marketing, manufacturing and support personnel, any of whom may leave, which could harm our business. The members of our scientific staff who are expected to make significant individual contributions to our business are also members of our executive management team as disclosed under Item 10, "Directors, Executive Officers and Corporate Governance" below. Furthermore, our business requires scientists and engineers with experience in several disciplines, including physics, optics, materials sciences, chemistry and electronics. We will need to continue to recruit and retain highly skilled scientists and engineers for certain functions. Our future success also depends on our ability to identify, attract, hire, train, retain and motivate highly skilled research and development, managerial, operations, sales, marketing and customer service personnel. If we fail to attract, integrate and retain the necessary personnel, our ability to extend and maintain our scientific expertise and grow our business could suffer significantly.
We are subject to litigation alleging that we are infringing third-party intellectual property rights. Intellectual property claims could result in costly litigation and harm our business.
In recent years, there has been significant litigation involving intellectual property rights in many technology-based industries, including our own. We face risks and uncertainties in connection with such litigation, including the risk that patents issued to others may harm our ability to do business; that there could be existing patents of which we are unaware that could be pertinent to our business; and that it is not possible for us to know whether there are patent applications pending that our products might infringe upon, since patent applications often are not disclosed until a patent is issued or published. Moreover, the frequency with which new patents are granted and the diversity of jurisdictions in which they are granted make it impractical and expensive for us to monitor all patents that may be relevant to our business.
From time to time, we have been notified of allegations and claims that we may be infringing patents or intellectual property rights owned by third parties. In 2007, we settled two patent infringement lawsuits filed against us and in 2010 we settled another patent infringement lawsuit filed against us. Following a federal jury trial in 2011, we won a patent infringement
22
lawsuit asserted by IMRA America, Inc. in 2006 alleging that certain products we produce infringe one U.S. patent allegedly owned by IMRA America. IMRA America has also informed us that it has patents and applications in the United States and in foreign jurisdictions directed to fiber lasers and fiber amplifiers, but has not asserted them against us. We are engaged in opposition proceedings in Japan and Germany with respect to two patents allegedly owned by IMRA America related to the patent IMRA America asserted against us in the United States.
We were named a defendant in an action by a former consultant filed in August 2013 in the United States District Court for the District of Massachusetts. The plaintiff alleged in his complaint that we misappropriated certain trade secrets from him, and that we engaged in unfair trade practices. The plaintiff filed in the United States District Court of the District of Massachusetts, a voluntarily dismissal of the lawsuit in August 2014.
There can be no assurance that we will be able to dispose without a material effect any claims or other allegations made or asserted in the future. The outcome of any litigation is uncertain. Even if we ultimately are successful on the merits of any such litigation or re-examination, legal and administrative proceedings related to intellectual property are typically expensive and time-consuming, generate negative publicity and divert financial and managerial resources. Some litigants may have greater financial resources than we have and may be able to sustain the costs of complex intellectual property litigation more easily than we can.
If we do not prevail in any intellectual property litigation brought against us, it could affect our ability to sell our products and materially harm our business, financial condition and results of operations. These developments could adversely affect our ability to compete for customers and increase our revenues. Plaintiffs in intellectual property cases often seek, and sometimes obtain, injunctive relief. Intellectual property litigation commenced against us could force us to take actions that could be harmful to our business, competitive position, results of operations and financial condition, including the following:
|
•
|
stop selling our products or using the technology that contains the allegedly infringing intellectual property;
|
|
•
|
pay actual monetary damages, royalties, lost profits or increased damages and the plaintiff's attorneys' fees, which individually or in the aggregate may be substantial; and
|
|
•
|
attempt to obtain a license to use the relevant intellectual property, which may not be available on reasonable terms or at all.
|
In addition, intellectual property lawsuits can be brought by third parties against OEMs and end users that incorporate our products into their systems or processes. In some cases, we indemnify OEMs against third-party infringement claims relating to our products and we often make representations affirming, among other things, that our products do not infringe the intellectual property rights of others. As a result, we may incur liabilities in connection with lawsuits against our customers. Any such lawsuits, whether or not they have merit, could be time-consuming to defend, damage our reputation or result in substantial and unanticipated costs.
Our inability to protect our intellectual property and proprietary technologies could result in the unauthorized use of our technologies by third parties, hurt our competitive position and adversely affect our operating results.
We rely on patents, trade secret laws, contractual agreements, technical know-how and other unpatented proprietary information to protect our products, product development and manufacturing activities from unauthorized copying by third parties. Our patents do not cover all of our technologies, systems, products and product components and may not prevent third parties from unauthorized copying of our technologies, products and product components. We seek to protect our proprietary technology under laws affording protection for trade secrets. We also seek to protect our trade secrets and proprietary information, in part, by requiring employees to enter into agreements providing for the maintenance of confidentiality and the assignment of rights to inventions made by them while employed by us. We have significant international operations and we are subject to foreign laws which differ in many respects from U.S. laws. Policing unauthorized use of our trade secret technologies throughout the world and proving misappropriation of our technologies are particularly difficult, especially due
to the number of our employees and operations in numerous foreign countries. The steps that we take to acquire ownership of our employees' inventions and trade secrets in foreign countries may not have been effective under all such local laws, which could expose us to potential claims or the inability to protect intellectual property developed by our employees. Furthermore, any changes in, or unexpected interpretations of, the trade secret and other intellectual property laws in any country in which we operate may adversely affect our ability to enforce our trade secret and intellectual property positions. Costly and time-consuming litigation could be necessary to determine the scope of our confidential information and trade secret protection. We also enter into confidentiality agreements with our consultants and other suppliers to protect our confidential information that we deliver to them. However, there can be no assurance that our confidentiality agreements will not be breached, that we will be able to effectively enforce them or that we will have adequate remedies for any breach.
23
Given our reliance on trade secret laws, others may independently develop similar or alternative technologies or duplicate our technologies and commercialize discoveries that we have made. Therefore, our intellectual property efforts may be insufficient to maintain our competitive advantage or to stop other parties from commercializing similar products or technologies. Many countries outside of the United States afford little or no protection to trade secrets and other intellectual property rights. Intellectual property litigation can be time-consuming and expensive, and there is no guarantee that we will have the resources to fully enforce our rights. If we are unable to prevent misappropriation or infringement of our intellectual property rights, or the independent development or design of similar technologies, our competitive position and operating results could suffer.
We depend upon internal production and on outside single or limited-source suppliers for many of our key components and raw materials, including cutting-edge optics and materials. Any interruption in the supply of these key components and raw materials could adversely affect our results of operations.
We rely exclusively on our own production capabilities to manufacture certain of our key components, such as semiconductor diodes, specialty optical fibers and optical components. We do not have redundant production lines for some of our components, such as our diodes, specialty optical fibers and some other components, which are made at a single manufacturing facility. These are not readily available from other sources at our current costs. If our manufacturing activities were obstructed or hampered significantly, it could take a considerable length of time, or it could increase our costs, for us to resume manufacturing or find alternative sources of supply. Many of the tools and equipment we use are custom-designed, and it could take a significant period of time to repair or replace them. Our three major manufacturing facilities are located in Oxford, Massachusetts; Burbach, Germany; and Fryazino, Russia. Despite our efforts to mitigate the impact of any flood, fire, natural disaster, political unrest, act of terrorism, war, outbreak of disease or other similar event, our business could be adversely affected to the extent that we do not have redundant production capabilities if any of our three major manufacturing facilities or equipment should become inoperable, inaccessible, damaged or destroyed.
Also, we purchase certain raw materials used to manufacture our products and other components, such as semiconductor wafer substrates, diode packages, modulators, micro-optics, bulk optics and high-power beam delivery products, from single or limited-source suppliers. We typically purchase our components and materials through purchase orders or agreed-upon terms and conditions and we do not have guaranteed supply arrangements with many of these suppliers. These suppliers are relatively small private companies that may discontinue their operations at any time and may be particularly susceptible to prevailing economic conditions. Some of our suppliers are also our competitors. Some of our suppliers may not be able to meet demand from our growing business or because of global demand for their components. As a result, we experienced and may in the future experience longer lead times or delays in fulfillment of our orders. Furthermore, other than our current suppliers, there are a limited number of entities from whom we could obtain these supplies. We do not anticipate that we would be able to purchase these components or raw materials that we require in a short period of time or at the same cost from other sources in commercial quantities or that have our required performance specifications. Any interruption or delay in the supply of any of these components or materials, or the inability to obtain these components and materials from alternate sources at acceptable prices and within a reasonable amount of time, could adversely affect our business. If our suppliers face financial or other difficulties, if our suppliers do not maintain sufficient inventory on hand or if there are significant changes in demand for the components and materials we obtain from them, they could limit the availability of these components and materials to us, which in turn could adversely affect our business.
If fiber lasers do not achieve broader market acceptance or if market penetration occurs more slowly than we expect, sales and profitability may be negatively impacted.
Fiber lasers are relatively new when compared to conventional lasers and our future success depends on the development and broader acceptance of fiber lasers. Potential customers may be reluctant to adopt fiber lasers as an alternative to conventional lasers, such as CO
2
and YAG, and non-laser methods, such as mechanical tools. Such potential customers may have substantial investments and know-how related to their existing laser and non-laser technologies, and may perceive risks relating to the reliability, quality, usefulness and profitability of integrating of fiber lasers in their systems when compared to other laser or non-laser technologies available in the market or that they manufacture themselves. Despite fiber lasers having better performance and prices compared to other lasers or tools, OEM customers may be reluctant to switch incumbent suppliers or we may miss design cycles of our customers. Many of our target markets, such as the automotive, machine tool and other manufacturing, communications and medical industries, have historically adopted new technologies slowly. These markets often require long test and qualification periods or lengthy government approval processes before adopting new technologies. As a result, we may expend significant resources and time to qualify our products for a new customer application, and we cannot assure that our products will be qualified or approved for such markets. If acceptance of fiber laser technology and of our fiber lasers in particular does not continue to grow within the markets that we serve, then the opportunities to maintain or increase our revenues and profitability may be severely limited.
24
We depend on our OEM customers and system integrators and their ability to incorporate our products into their systems.
Our sales depend in part on our ability to maintain existing and secure new OEM customers. Our revenues also depend in part upon the ability of our current and potential OEM customers and system integrators to develop and sell systems that incorporate our laser and amplifier products. The commercial success of these systems depends to a substantial degree on the efforts of these OEM customers and system integrators to develop and market products that incorporate our technologies. Relationships and experience with traditional laser makers, limited marketing resources, reluctance to invest in research and development and other factors affecting these OEM customers and third-party system integrators could have a substantial impact upon our financial results. If OEM customers or integrators are not able to adapt existing tools or develop new systems to take advantage of the features and benefits of fiber lasers or if they perceive us to be an actual or potential competitor, then the opportunities to increase our revenues and profitability may be severely limited or delayed. Furthermore, if our OEM customers or third-party system integrators experience financial or other difficulties that adversely affect their operations, our financial condition or results of operations may also be adversely affected.
Changes in tax rates, tax liabilities or tax accounting rules could affect future results.
As a global company, we are subject to taxation in the United States and various other countries and jurisdictions. Significant judgment is required to determine worldwide tax liabilities. Our future tax rates could be affected by changes in the composition of earnings in countries or states with differing tax rates, transfer pricing rules, changes in the valuation of our deferred tax assets and liabilities, or changes in the tax laws. In addition, we are subject to regular examination of our income tax returns by the Internal Revenue Service ("IRS") and other tax authorities. From time to time the United States, foreign and state governments make substantive changes to tax rules and the application of rules to companies, including various announcements from the United States government potentially impacting our ability to defer taxes on international earnings. We regularly assess the likelihood of favorable or unfavorable outcomes resulting from these examinations to determine the adequacy of our provision for income taxes. Although we believe our tax estimates are reasonable, there can be no assurance that any final determination will not be materially different than the treatment reflected in our historical income tax provisions and accruals, which could materially and adversely affect our operating results and financial condition.
Failure to effectively build and expand our direct field service and support organization could have an adverse effect on our business.
We believe that it will become increasingly important for us to provide rapid, responsive service directly to our customers throughout the world and to build and expand our own personnel resources to provide these services. Any actual or perceived lack of direct field service in the locations where we sell or try to sell our products may negatively impact our sales efforts and, consequently, our revenues. Accordingly, we have an ongoing effort to develop our direct support systems worldwide. This requires us to recruit and train additional qualified field service and support personnel as well as maintain effective and highly trained organizations that can provide service to our customers in various countries. We may not be able to attract and train additional qualified personnel to expand our direct support operations successfully. We may not be able to find and engage additional qualified third-party resources to supplement and enhance our direct support operations. Further, we may incur significant costs in providing these direct field and support services. Failure to implement our direct support operation effectively could adversely affect our relationships with our customers, and our operating results may suffer.
Our products could contain defects, which may reduce sales of those products, harm market acceptance of our fiber laser products or result in claims against us.
The manufacture of our fiber lasers and amplifiers involves highly complex and precise processes. Despite testing by us and our customers, errors have been found, and may be found in the future, in our products. These defects may cause us to incur significant warranty, support and repair costs, incur additional costs related to a recall, divert the attention of our engineering personnel from our product development efforts and harm our relationships with our customers. These problems could result in, among other things, loss of revenues or a delay in revenue recognition, loss of market share, harm to our reputation or a delay or loss of market acceptance of our fiber laser products. Defects, integration issues or other performance problems in our fiber laser and amplifier products could also result in personal injury or financial or other damages to our customers, which in turn could damage market acceptance of our products. Our customers could also seek damages from us for their losses. A product liability claim brought against us, even if unsuccessful, could be time-consuming and costly to defend.
We may experience lower than expected manufacturing yields, which would adversely affect our gross margins.
The manufacture of semiconductor diodes and the packaging of them is a highly complex process. Manufacturers often encounter difficulties in achieving acceptable product yields from diode and packaging operations. We have from time to time experienced lower than anticipated manufacturing yields for our diodes and packaged diodes. This occurs during the production
25
of new designs and the installation and start-up of new process technologies and new equipment. If we do not achieve planned yields, our product costs could increase resulting in lower gross margins, and key component availability would decrease.
Changing laws, regulations and standards relating to corporate governance and public disclosure may create uncertainty regarding compliance matters.
Federal securities laws, rules and regulations, as well as the rules and regulations of self-regulatory organizations such as NASDAQ and the NYSE, require companies to maintain extensive corporate governance measures, impose comprehensive reporting and disclosure requirements, set strict independence and financial expertise standards for audit and other committee members and impose civil and criminal penalties for companies and their chief executive officers, chief financial officers and directors for securities law violations and other laws such as anti-bribery laws. These laws, rules and regulations have increased and will continue to increase the scope, complexity and cost of our corporate governance, reporting and disclosure practices, which could harm our results of operations and divert management's attention from business operations. Changing laws, regulations and standards relating to corporate governance and public disclosure may create uncertainty regarding compliance matters. New or changed laws, regulations and standards are subject to varying interpretations in many cases. As a result, their application in practice may evolve over time. Complying with evolving interpretations of new or changed legal requirements may cause us to incur higher costs as we revise current practices, policies and procedures, and may divert management time and attention from revenue generating to compliance activities. If our efforts to comply with new or changed laws, regulations and standards differ from the activities intended by regulatory or governing bodies due to ambiguities related to practice, our reputation may also be harmed.
Failure to maintain effective internal controls may cause a loss of investor confidence in the reliability of our financial statements or to cause us to delay filing our periodic reports with the SEC and adversely affect our stock price.
The SEC, as directed by Section 404 of the Sarbanes-Oxley Act of 2002, adopted rules requiring public companies to include a report of management on internal control over financial reporting in their annual reports on Form 10-K that contain an assessment by management of the effectiveness of our internal control over financial reporting. In addition, our independent registered public accounting firm must attest to and report on the effectiveness of our internal control over financial reporting. Although we test our internal control over financial reporting in order to ensure compliance with the Section 404 requirements, our failure to maintain adequate internal controls over financial reporting could result in an adverse reaction in the financial marketplace due to a loss of investor confidence in the reliability of our financial statements or a delay in our ability to timely file our periodic reports with the SEC, which ultimately could negatively impact our stock price.
Difficulties with our information technology systems could harm our business and results of operation. If our network security measures are breached and unauthorized access is obtained to our technology or data or customer data, we may incur significant legal and financial exposure and liabilities.
Like many multinational corporations, we maintain several information technology systems, including software products licensed from third parties. These systems vary from country to country. Any system, network or Internet failures, misuse by system users, the hacking into or disruption caused by the unauthorized access by third parties or loss of license rights could disrupt our ability to timely and accurately manufacture and ship products or to report our financial information in compliance with the timelines mandated by the SEC. Any such failure, misuse, hacking, disruptions or loss would likely cause a diversion of management's attention from the underlying business and could harm our operations. In addition, a significant failure of our various information technology systems could adversely affect our ability to complete an evaluation of our internal controls and attestation activities pursuant to Section 404 of the Sarbanes-Oxley Act of 2002.
As part of our day-to-day business, we store our data and certain data about our customers in our information technology system. While our system is designed with access security, if a third party gains unauthorized access to our data or technology, including information regarding our customers, such security breach could expose us to a risk of loss of this information, loss of business, litigation and possible liability. These security measures may be breached as a result of third-party action, including intentional misconduct by computer hackers, employee error, malfeasance or otherwise. Additionally, third parties may attempt to fraudulently induce employees or customers into disclosing sensitive information such as user names, passwords or other information in order to gain access to our customers' data or our data, including our intellectual property and other confidential business information, employee information or our information technology systems. Because the techniques used to obtain unauthorized access, or to sabotage systems, change frequently and generally are not recognized until launched against a target, we may be unable to anticipate these techniques or to implement adequate preventative measures. Any security breach could result in a loss of confidence by our customers, damage our reputation, disrupt our business, lead to legal liability and negatively impact our future sales.
26
We are subject to export control regulations that could restrict our ability to increase our international sales and may adversely affect our business.
A significant part of our business involves the export of our products to other countries. The U.S. government has in place a number of laws and regulations that control the export, re-export or transfer of U.S.- origin products, software and technology. The governments of other countries in which we do business have similar regulations regarding products, software and technology originating in those countries. These laws and regulations may require that we obtain a license before we can export, re-export or transfer certain products, software or technology. The requirement to obtain a license could put us at a competitive disadvantage by restricting our ability to sell products to customers in certain countries or by giving rise to delays or expenses related to obtaining a license. In applying for a license and responding to questions from licensing authorities, we have experienced and, in the future, may experience delays in obtaining export licenses based on issues solely within the control of the applicable government agency. Under the discretion of the issuing government agency, an export license may permit the export of one unit to a single customer or multiple units to one or more customers. Licenses may also include conditions that limit the use, resale, transfer, re-export, modification, disassembly, or transfer of a product, software or technology after it is exported without first obtaining permission from the relevant government agency. Failure to comply with these laws and regulations could result in government sanctions, including substantial monetary penalties, denial of export privileges, debarment from government contracts and a loss of revenues. Delays in obtaining or failure to obtain required export licenses may require us to defer shipments for substantial periods or cancel orders. Any of these circumstances could adversely affect our operations and, as a result, our financial results could suffer.
We are subject to various environmental laws and regulations that could impose substantial costs upon us and may adversely affect our business, operating results and financial condition.
Some of our operations use substances regulated under various federal, state, local and international laws governing the environment, including those relating to the storage, use, discharge, disposal, product composition and labeling of, and human exposure to, hazardous and toxic materials. We could incur costs, fines and civil or criminal sanctions, third-party property damage or personal injury claims, or could be required to incur substantial investigation or remediation costs, if we were to violate or become liable under environmental laws. Liability under environmental laws can be joint and several and without regard to comparative fault. Compliance with current or future environmental laws and regulations could restrict our ability to expand our facilities or require us to acquire additional expensive equipment, modify our manufacturing processes, or incur other significant expenses in order to remain in compliance with such laws and regulations. At this time, we do not believe the costs to maintain compliance with current environmental laws to be material. Although we do not currently anticipate that such costs will become material, if such costs were to become material in the future, whether due to unanticipated changes in environmental laws, unanticipated changes in our operations or other unanticipated changes, we may be required to dedicate additional staff or financial resources in order to maintain compliance. There can be no assurance that violations of environmental laws or regulations will not occur in the future as a result of the lack of, or failure to obtain, permits, human error, accident, equipment failure or other causes.
We are exposed to credit risk and fluctuations in the market values of our cash, cash equivalents and marketable securities.
Given the global nature of our business, we have both domestic and international investments. Credit ratings and pricing of our investments can be negatively affected by liquidity, credit deterioration, financial results, economic risk, political risk, sovereign risk or other factors. Also, our investments may be negatively affected by events that impact the banks or depositories that hold our investments. As a result, the value and liquidity of our cash, cash equivalents and marketable securities may fluctuate substantially. Therefore, although we have not realized any significant losses on our cash, cash equivalents and marketable securities, future fluctuations in their value could result in a significant realized loss.
Our ability to access financial markets to raise capital or finance a portion of our working capital requirements and support our liquidity needs may be adversely affected by factors beyond our control and could negatively impact our ability to finance our operations, meet certain obligations or implement our operating strategy.
We occasionally borrow under our existing credit facilities to fund operations, including working capital investments. Our major credit lines in the United States and Germany expire in June 2015 and July 2017, respectively. In the past, market disruptions experienced in the United States and abroad have materially impacted liquidity in the credit and debt markets, making financing terms for borrowers less attractive, and, in certain cases, have resulted in the unavailability of certain types of financing. Uncertainty in the financial markets may negatively impact our ability to access additional financing or to refinance our existing credit facilities or existing debt arrangements on favorable terms or at all, which could negatively affect our ability to fund current and future expansion as well as future acquisitions and development. These disruptions may include turmoil in the financial services industry, unprecedented volatility in the markets where our outstanding securities trade, and general economic downturns in the areas where we do business. If we are unable to access funds at competitive rates, or if our short-
27
term or long-term borrowing costs increase, our ability to finance our operations, meet our short-term obligations and implement our operating strategy could be adversely affected.
We also may in the future be required to raise capital through public or private financing or other arrangements. Such financing may not be available on acceptable terms, or at all, and our failure to raise capital when needed could harm our business. Additional equity financing may be dilutive to the holders of our common stock, and debt financing, if available, may involve restrictive covenants and could reduce our profitability. If we cannot raise funds on acceptable terms, we may not be able to grow our business or respond to competitive pressures.
Substantial sales of our common stock, including shares issued upon the exercise of currently outstanding options could cause our stock price to decline.
Sales of a substantial number of shares of common stock, or the perception that sales could occur, could adversely affect the market price of our common stock. As of
December 31, 2014
, we had
52,369,688
shares of common stock outstanding and
2,691,876
shares subject to outstanding options. We have registered all shares of common stock that we may issue under our stock option plans and our employee stock ownership plan. In addition, all of the unregistered shares of our common stock are now eligible for sale under Rule 144 or Rule 701 under the Securities Act. As these shares are issued, they may be freely sold in the public market subject, in the case of any awards under our stock-based compensation plans, to applicable vesting requirements.
We currently have the ability to file a registration statement and immediately offer and sell common stock, preferred stock, warrants, debt and convertible securities because of our current status a well-known seasoned issuer. In the future, we may issue additional options, warrants or other securities convertible into our common stock. Sales of substantial amounts of shares of our common stock or other securities under any future registration statement that we may file covering newly issued shares or shares held by affiliates or others could lower the market price of our common stock and impair our ability to raise capital through the sale of equity securities.
Dr. Valentin P. Gapontsev, our Chairman and Chief Executive Officer, and three trusts he created collectively control approximately 33% of our voting power and have a significant influence on the outcome of director elections and other matters requiring stockholder approval, including a change in corporate control.
Dr. Valentin P. Gapontsev, our Chairman and Chief Executive Officer, and IP Fibre Devices (UK) Ltd. (IPFD), of which Dr. Gapontsev is the managing director, together with three trusts he created beneficially own approximately 33% of our common stock. Trustees of the trusts are officers or employees of the Company.
Dr. Gapontsev and the trusts have a significant influence on the outcome of matters requiring stockholder approval, including:
|
•
|
election of our directors;
|
|
•
|
amendment of our certificate of incorporation or by-laws; and
|
|
•
|
approval of mergers, consolidations or the sale of all or substantially all of our assets.
|
Dr. Gapontsev and the trusts may vote their shares of our common stock in ways that are adverse to the interests of other holders of our common stock. These significant ownership interests could delay, prevent or cause a change in control of our company, any of which could adversely affect the market price of our common stock.
Anti-takeover provisions in our charter documents and Delaware law could prevent or delay a change in control of our company, even if a change in control would be beneficial to our stockholders.
Provisions of our certificate of incorporation and by-laws, including certain provisions that will take effect when Dr. Valentin P. Gapontsev (together with his affiliates and associates) ceases to beneficially own an aggregate of 25% or more of our outstanding voting securities, may discourage, delay or prevent a merger, acquisition or change of control, even if it would be beneficial to our stockholders. The existence of these provisions could also limit the price that investors might be willing to pay in the future for shares of our common stock. These provisions include:
|
•
|
authorizing the issuance of "blank check" preferred stock;
|
|
•
|
establishing a classified board;
|
|
•
|
providing that directors may only be removed for cause;
|
|
•
|
prohibiting stockholder action by written consent;
|
28
|
•
|
limiting the persons who may call a special meeting of stockholders;
|
|
•
|
establishing advance notice requirements for nominations for election to the board of directors and for proposing matters to be submitted to a stockholder vote; and
|
|
•
|
supermajority stockholder approval to change these provisions.
|
Provisions of Delaware law may also discourage, delay or prevent someone from acquiring or merging with our company or obtaining control of our company. Specifically, Section 203 of the Delaware General Corporation Law, which will apply to our company following such time as Dr. Gapontsev (together with his affiliates and associates) ceases to beneficially own 25% or more of the total voting power of our outstanding shares, may prohibit business combinations with stockholders owning 15% or more of our outstanding voting stock.
If securities analysts stop publishing research or reports about our business, or if they downgrade our stock, the price of our stock could decline.
The trading market for our common stock relies in part on the research and reports that industry or financial analysts publish about us. If one or more of these analysts who cover us downgrade our stock, our stock price would likely decline. Further, if one or more of these analysts cease coverage of our company, we could lose visibility in the market, which in turn could cause our stock price to decline.
ITEM 1B.
UNRESOLVED STAFF COMMENTS
None.
ITEM 2.
PROPERTIES
Our main facilities at
December 31, 2014
include the following:
|
Location
|
Owned or
Leased
|
Lease Expiration
|
Approximate
Size (sq. ft.)
|
Primary Activity
|
||||||
|
Oxford, Massachusetts
|
Owned
|
—
|
|
421,300
|
|
Diodes, components, complete device manufacturing, administration
|
||||
|
Marlborough, Massachusetts
|
Owned
|
—
|
|
112,000
|
|
Manufacturing, administration
|
||||
|
Novi, Michigan
|
Owned
|
—
|
|
16,000
|
|
Administration, service
|
||||
|
Mountain View, California
|
Leased
|
February 2015
|
|
12,400
|
|
Components, complete device manufacturing, administration
|
||||
|
Burbach, Germany
|
Owned
|
—
|
|
270,900
|
|
Optical fiber, components, final assembly, complete device manufacturing, administration
|
||||
|
Fryazino, Russia
|
Leased
|
July 2016
|
|
79,000
|
|
Components, complete device
|
||||
|
Owned
|
—
|
|
512,700
|
|
Manufacturing, administration
|
|||||
|
Manchester, New Hampshire
|
Leased
|
December 2016
|
|
63,000
|
|
Components, complete device manufacturing, administration
|
||||
|
Beijing, China
|
Owned
|
—
|
|
34,500
|
|
Administration, service
|
||||
|
Leased
|
January 2019
|
|
20,000
|
|
Service
|
|||||
|
Leased
|
March 2015
|
|
12,800
|
|
Administration, service
|
|||||
|
Shanghai, China
|
Leased
|
April 2016
|
|
15,000
|
|
Administration, service
|
||||
|
Cerro Maggiore, Italy
|
Owned
|
—
|
|
33,000
|
|
Complete device manufacturing, administration
|
||||
|
Daejeon, South Korea
|
Owned
|
—
|
|
24,000
|
|
Administration, service
|
||||
|
Yokohama, Japan
|
Owned
|
—
|
|
11,000
|
|
Administration, service
|
||||
|
Chubu, Japan
|
Owned
|
—
|
|
10,300
|
|
Administration, service
|
||||
|
Total sq.ft. occupied:
|
1,647,900
|
|
||||||||
We maintain our corporate headquarters in Oxford, Massachusetts, and we operate four manufacturing facilities for lasers, amplifiers and components, which are located in the United States, Germany, Russia and Italy. We also manufacture laser systems in the United States, Germany, Russia and India. We are committed to meeting internationally recognized manufacturing standards. Our facilities in the United States and Germany are ISO 9001 certified and we have ISO certification in Russia for specific products. We conduct our major research and development activities in Oxford, Massachusetts, Burbach, Germany and Fryazino, Russia. In addition, research and development are also conducted at our facilities in Manchester, New Hampshire, Birmingham, Alabama, Mountain View, California and Marlborough, Massachusetts. We have sales personnel at each of our manufacturing facilities, and at offices in Novi, Michigan; Santa Clara, California; London, England; Illkirch,
29
France; Bangalore, India; Beijing, Shanghai and Shenzhen, China; Istanbul, Turkey; Singapore; Barcelona, Spain and Gliwice, Poland.
We plan to continue our expansion of our operations in Russia, Germany and the United States to meet the demand for our products and our sales and support needs. We believe that we will be able to obtain additional land or commercial space as needed. The additional expansion for Russia, Germany and the United States will provide an approximately additional
212,200
square feet,
114,500
square feet, and
191,200
square feet (excluding building and land purchases in 2014 for our California and Alabama locations), respectively once these additions are completed and occupied. With the amount occupied as of
December 31, 2014
, once all expansions are completed in
2015
, we will have approximately
2.1 million
square feet of occupied space to continue to execute on our planned strategies.
ITEM 3.
LEGAL PROCEEDINGS
From time to time, we are party to various legal claims and legal proceedings and other disputes incidental to our business, such as employment, intellectual property or product issues. For a discussion of the risks associated with intellectual property legal proceedings and other disputes, see Item 1A. "Risk Factors — We are subject to litigation alleging that we are infringing third-party intellectual property rights. Intellectual property claims could result in costly litigation and harm our business."
ITEM 4.
MINE SAFETY DISCLOSURES
Not applicable.
ITEM 5.
MARKET FOR THE REGISTRANT’S COMMON EQUITY, RELATED STOCKHOLDER MATTERS AND ISSUER PURCHASES OF EQUITY SECURITIES
Price Range of Common Stock
Our common stock is quoted on the Nasdaq Global Market under the symbol "IPGP". The following table sets forth the quarterly high and low sale prices of our common stock as reported on the Nasdaq Global Market.
|
|
Common Stock
Price Range
|
|||||||
|
|
High
|
Low
|
||||||
|
First Quarter ended March 31, 2013
|
$
|
70.11
|
|
$
|
56.89
|
|
||
|
Second Quarter ended June 30, 2013
|
$
|
67.24
|
|
$
|
54.32
|
|
||
|
Third Quarter ended September 30, 2013
|
$
|
67.81
|
|
$
|
53.28
|
|
||
|
Fourth Quarter ended December 31, 2013
|
$
|
79.00
|
|
$
|
56.44
|
|
||
|
First Quarter ended March 31, 2014
|
$
|
77.57
|
|
$
|
63.53
|
|
||
|
Second Quarter ended June 30, 2014
|
$
|
75.73
|
|
$
|
60.31
|
|
||
|
Third Quarter ended September 30, 2014
|
$
|
73.29
|
|
$
|
61.48
|
|
||
|
Fourth Quarter ended December 31, 2014
|
$
|
77.99
|
|
$
|
60.75
|
|
||
As of
February 24, 2015
, there were
52,482,512
shares of our common stock outstanding held by approximately
46
holders of record, which does not include beneficial owners of common stock whose shares are held in the names of various securities brokers, dealers and registered clearing agencies.
Stock Price Performance Graph
The following Stock Price Performance Graph and related information includes comparisons required by the SEC. The graph does not constitute "soliciting material" and should not be deemed "filed" or incorporated by reference into any other filings under the Securities Act of 1933, as amended, or the Securities Exchange Act of 1934, as amended, except to the extent that we specifically incorporate this information by reference into such filing.
The following graph presents the cumulative shareholder returns for our Common Stock compared with the NASDAQ Composite Index and the S&P Technology Sector Index. We selected these comparative groups due to industry similarities and the fact that they contain several direct competitors.
30
COMPARISON OF CUMULATIVE TOTAL RETURN
AMONG THE COMPANY, THE NASDAQ COMPOSITE INDEX AND S&P 500
TECHNOLOGY SECTOR INDEX
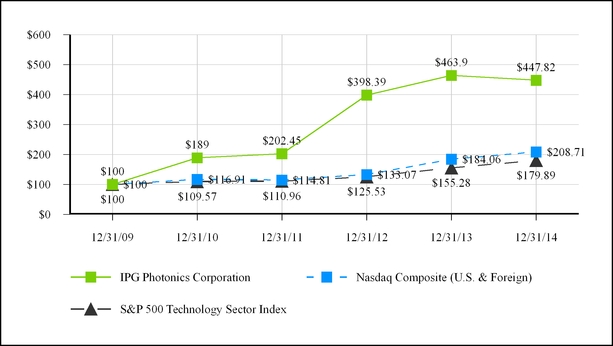
|
|
5-Year Cumulative Total Return
|
|||||||||||||||||||||||
|
|
12/31/2009
|
12/31/2010
|
12/31/2011
|
12/31/2012
|
12/31/2013
|
12/31/2014
|
||||||||||||||||||
|
IPG Photonics Corporation
|
$
|
100.00
|
|
$
|
189.00
|
|
$
|
202.45
|
|
$
|
398.39
|
|
$
|
463.90
|
|
$
|
447.82
|
|
||||||
|
Nasdaq Composite (U.S. & Foreign)
|
$
|
100.00
|
|
$
|
116.91
|
|
$
|
114.81
|
|
$
|
133.07
|
|
$
|
184.06
|
|
$
|
208.71
|
|
||||||
|
S&P 500 Technology Sector Index
|
$
|
100.00
|
|
$
|
109.57
|
|
$
|
110.96
|
|
$
|
125.53
|
|
$
|
155.28
|
|
$
|
179.89
|
|
||||||
The above graph represents and compares the value, through
December 31, 2014
, of a hypothetical investment of $100 made at the closing price on
December 31, 2009
in each of (i) our common stock, (ii) the NASDAQ Composite Stock Index and (iii) the S&P 500 Technology Sector Index, in each case assuming the reinvestment of dividends. The stock price performance shown in this graph is not necessarily indicative of, and not is intended to suggest, future stock price performance.
Dividends
We declared and paid a special cash dividend on our capital stock in December 2012 of $33.4 million or $0.65 per share. We anticipate that we will retain future earnings to support operations, fund acquisitions and to finance the growth and development of our business. Therefore, we do not expect to pay cash dividends in the foreseeable future. Our payment of any future dividends will be at the discretion of our Board of Directors after taking into account any business conditions, any contractual and legal restrictions on our payment of dividends, and our financial condition, operating results, cash needs, growth plans and other factors. In addition, current agreements with certain of our lenders contain, and future loan agreements may contain, restrictive covenants that generally prohibit us from paying cash dividends, making any distribution on any class of stock or making stock repurchases.
Recent Sales of Unregistered Securities; Use of Proceeds from Registered Securities
There have been no sales of unregistered securities during the past three years.
31
Issuer Purchases of Equity Securities
|
Date
|
Total Number of
Shares (or Units)
Purchased
|
|
Average Price
Paid per Share
(or Unit)
|
Total Number of
Shares (or Units)
Purchased as Part
of Publicly
Announced Plans
or Programs
|
Maximum Number
(or Approximate
Dollar Value) of
Shares (or Units)
that May Yet Be
Purchased Under
the Plans or
Programs
|
||||||||||||
|
January 1, 2014 — January 31, 2014
|
—
|
|
(1)
|
$
|
—
|
|
$
|
—
|
|
$
|
—
|
|
|||||
|
February 1, 2014 — February 28, 2014
|
—
|
|
(1)
|
—
|
|
—
|
|
—
|
|
||||||||
|
March 1, 2014 — March 31, 2014
|
2,639
|
|
(1)
|
71.10
|
|
—
|
|
—
|
|
||||||||
|
April 1, 2014 — April 30, 2014
|
—
|
|
(1)
|
—
|
|
—
|
|
—
|
|
||||||||
|
May 1, 2014 — May 31, 2014
|
—
|
|
(1)
|
—
|
|
—
|
|
—
|
|
||||||||
|
June 1, 2014 — June 30, 2014
|
2,785
|
|
(1)
|
68.64
|
|
—
|
|
—
|
|
||||||||
|
July 1, 2014 — July 31, 2014
|
—
|
|
(1)
|
—
|
|
—
|
|
—
|
|
||||||||
|
August 1, 2014 — August 31, 2014
|
24
|
|
(1)
|
67.70
|
|
—
|
|
—
|
|
||||||||
|
September 1, 2014 — September 30, 2014
|
3,148
|
|
(1)
|
68.78
|
|
—
|
|
—
|
|
||||||||
|
October 1, 2014 — October 31, 2014
|
—
|
|
(1)
|
—
|
|
—
|
|
—
|
|
||||||||
|
November 1, 2014 — November 30, 2014
|
—
|
|
(1)
|
—
|
|
—
|
|
—
|
|
||||||||
|
December 1, 2014 — December 31, 2014
|
3,400
|
|
(1)
|
68.78
|
|
—
|
|
—
|
|
||||||||
|
Total
|
11,996
|
|
|
$
|
69.26
|
|
$
|
—
|
|
$
|
—
|
|
|||||
|
(1)
|
In 2012, our Board of Directors approved "withhold to cover" as a tax payment method for vesting of restricted stock awards for certain employees. Pursuant to the "withhold to cover" method, we withheld from such employees the shares noted in the table above to cover tax withholding related to the vesting of their awards. The average prices listed in the above table are averages of the fair market prices at which we valued shares withheld for purposes of calculating the number of shares to be withheld in
2014
.
|
Information Regarding Equity Compensation Plans
The following table sets forth information with respect to securities authorized for issuance under our equity compensation plans as of
December 31, 2014
:
Equity Compensation Plan Information
|
Plan Category
|
Number of Securities
to be Issued upon
Exercise of
Outstanding
Options, Warrants
and Rights
(a)
|
Weighted-Average
Exercise Price of
Outstanding
Options, Warrants
and Rights
(b)
|
Number of Securities
Remaining Available for
Future Issuance under
Equity Compensation
Plans
(Excluding Securities
Reflected in Column (a))
(c)
|
|||||||
|
Equity Compensation Plans Approved by Security Holders
|
2,691,876
|
|
$
|
45.48
|
|
5,491,656
|
|
|||
|
Equity Compensation Plans Not Approved by Security Holders
|
—
|
|
—
|
|
||||||
|
Total
|
2,691,876
|
|
5,491,656
|
|
||||||
32
ITEM 6.
SELECTED FINANCIAL DATA
The following selected consolidated financial data should be read in conjunction with, and is qualified by reference to, our consolidated financial statements and related notes and Item 7, "Management's Discussion and Analysis of Financial Condition and Results of Operations" included elsewhere in this Annual Report on Form 10-K. The data as of
December 31, 2014
and
2013
, and for the years ended
December 31, 2014
,
2013
and
2012
, is derived from our audited consolidated financial statements and related notes included elsewhere in this Annual Report on Form 10-K. The data as of
December 31, 2012
,
2011
and
2010
, and for the years ended
December 31, 2011
and
2010
, is derived from our audited consolidated financial statements and related notes not included in this Annual Report on Form 10-K. Our historical results are not necessarily indicative of the results for any future period.
|
|
Year Ended December 31,
|
|||||||||||||||||||
|
|
2014
|
2013
|
2012
|
2011
|
2010
|
|||||||||||||||
|
|
(In thousands, except per share data)
|
|||||||||||||||||||
|
Consolidated Statement of Income Data:
|
||||||||||||||||||||
|
Net sales
|
$
|
769,832
|
|
$
|
648,034
|
|
$
|
562,528
|
|
$
|
474,482
|
|
$
|
299,256
|
|
|||||
|
Cost of sales
|
353,314
|
|
308,136
|
|
257,801
|
|
217,227
|
|
152,798
|
|
||||||||||
|
Gross profit
|
416,518
|
|
339,898
|
|
304,727
|
|
257,255
|
|
146,458
|
|
||||||||||
|
Operating expenses:
|
||||||||||||||||||||
|
Sales and marketing
|
30,637
|
|
26,692
|
|
23,845
|
|
21,731
|
|
19,100
|
|
||||||||||
|
Research and development
|
53,403
|
|
41,660
|
|
31,401
|
|
25,422
|
|
19,160
|
|
||||||||||
|
General and administrative
|
55,338
|
|
50,863
|
|
39,231
|
|
37,442
|
|
28,645
|
|
||||||||||
|
(Gain) loss on foreign exchange
|
(6,618
|
)
|
2,536
|
|
1,362
|
|
(2,862
|
)
|
(848
|
)
|
||||||||||
|
Total operating expenses
|
132,760
|
|
121,751
|
|
95,839
|
|
81,733
|
|
66,057
|
|
||||||||||
|
Operating income
|
283,758
|
|
218,147
|
|
208,888
|
|
175,522
|
|
80,401
|
|
||||||||||
|
Interest (expense) income, net
|
(77
|
)
|
(1
|
)
|
319
|
|
(681
|
)
|
(1,188
|
)
|
||||||||||
|
Other income (expense), net
|
793
|
|
155
|
|
8
|
|
(257
|
)
|
39
|
|
||||||||||
|
Income before provision for income taxes
|
284,474
|
|
218,301
|
|
209,215
|
|
174,584
|
|
79,252
|
|
||||||||||
|
Provision for income taxes
|
(84,029
|
)
|
(62,521
|
)
|
(61,471
|
)
|
(53,575
|
)
|
(24,900
|
)
|
||||||||||
|
Net income
|
200,445
|
|
155,780
|
|
147,744
|
|
121,009
|
|
54,352
|
|
||||||||||
|
Less: Net income attributable to noncontrolling interests
|
—
|
|
—
|
|
2,740
|
|
3,250
|
|
361
|
|
||||||||||
|
Net income attributable to IPG Photonics Corporation
|
200,445
|
|
155,780
|
|
145,004
|
|
117,759
|
|
53,991
|
|
||||||||||
|
Net income attributable to common shareholders
|
$
|
200,445
|
|
$
|
155,780
|
|
$
|
145,004
|
|
$
|
117,759
|
|
$
|
53,991
|
|
|||||
|
Net income per share:
|
||||||||||||||||||||
|
Basic
|
$
|
3.85
|
|
$
|
3.02
|
|
$
|
2.87
|
|
$
|
2.48
|
|
$
|
1.16
|
|
|||||
|
Diluted
|
$
|
3.79
|
|
$
|
2.97
|
|
$
|
2.81
|
|
$
|
2.41
|
|
$
|
1.13
|
|
|||||
|
Weighted-average shares outstanding:
|
||||||||||||||||||||
|
Basic
|
52,104
|
|
51,548
|
|
50,477
|
|
47,365
|
|
46,424
|
|
||||||||||
|
Diluted
|
52,824
|
|
52,375
|
|
51,536
|
|
48,685
|
|
47,594
|
|
||||||||||
|
Dividends per common share
|
$
|
—
|
|
$
|
—
|
|
$
|
0.65
|
|
$
|
—
|
|
$
|
—
|
|
|||||
|
|
As of December 31,
|
|||||||||||||||||||
|
|
2014
|
2013
|
2012
|
2011
|
2010
|
|||||||||||||||
|
|
(In thousands)
|
|||||||||||||||||||
|
Consolidated Balance Sheet Data:
|
||||||||||||||||||||
|
Cash and cash equivalents
|
$
|
522,150
|
|
$
|
448,776
|
|
$
|
384,053
|
|
$
|
180,234
|
|
$
|
147,860
|
|
|||||
|
Short-term investments
|
—
|
|
—
|
|
—
|
|
25,451
|
|
—
|
|
||||||||||
|
Working capital, excluding cash and cash equivalents and short-term investments
|
249,613
|
|
237,488
|
|
155,451
|
|
135,060
|
|
70,171
|
|
||||||||||
|
Total assets
|
1,210,887
|
|
1,061,216
|
|
895,498
|
|
608,132
|
|
441,855
|
|
||||||||||
|
Revolving line-of-credit facilities
|
2,631
|
|
3,296
|
|
2,442
|
|
7,057
|
|
6,841
|
|
||||||||||
|
Long-term debt, including current portion
|
33,000
|
|
12,666
|
|
15,519
|
|
17,339
|
|
16,977
|
|
||||||||||
|
Redeemable noncontrolling interests
|
—
|
|
—
|
|
—
|
|
46,123
|
|
24,903
|
|
||||||||||
|
IPG Photonics Corporation stockholders' equity
|
1,046,561
|
|
927,969
|
|
742,927
|
|
443,323
|
|
316,600
|
|
||||||||||
33
ITEM 7.
MANAGEMENT’S DISCUSSION AND ANALYSIS OF FINANCIAL CONDITION AND RESULTS OF OPERATIONS
The following discussion and analysis of our financial condition and results of operations should be read in conjunction with Item 6, "Selected Financial Data" and our consolidated financial statements and related notes included in this Annual Report on Form 10-K. This discussion contains forward-looking statements that involve risks and uncertainties. Our actual results could differ materially from those anticipated in these forward-looking statements as a result of certain factors including, but not limited to, those discussed under Item 1A, "Risk Factors."
Overview
We develop and manufacture a broad line of high-performance fiber lasers, fiber amplifiers and diode lasers that are used in numerous applications, primarily in materials processing. We sell our products globally to original equipment manufacturers ("OEMs"), system integrators and end users. We market our products internationally primarily through our direct sales force.
We are vertically integrated such that we design and manufacture most of our key components used in our finished products, from semiconductor diodes to optical fiber preforms, finished fiber lasers and amplifiers. We also manufacture certain complementary products used with our lasers, including optical delivery cables, fiber couplers, beam switches, optical processing heads and chillers. In addition, we offer laser-based systems for certain markets and applications.
Description of Our Net Sales, Costs and Expenses
Net sales.
We derive net sales primarily from the sale of fiber lasers and amplifiers. We also sell diode lasers, communications systems, laser systems and complementary products. We sell our products through our direct sales organization and our network of distributors and sales representatives, as well as system integrators. We sell our products to OEMs that supply materials processing laser systems, communications systems and medical laser systems to end users. We also sell our products to end users that build their own systems which incorporate our products or use our products as an energy or light source. Our scientists and engineers work closely with OEMs, systems integrators and end users to analyze their system requirements and match appropriate fiber laser or amplifier specifications. Our sales cycle varies substantially, ranging from a period of a few weeks to as long as one year or more, but is typically several months.
Sales of our products generally are recognized upon shipment, provided that no obligations remain and collection of the receivable is reasonably assured. Our sales typically are made on a purchase order basis rather than through long-term purchase commitments.
We develop our products to standard specifications and use a common set of components within our product architectures. Our major products are based upon a common technology platform. We continually enhance these and other products by improving their components and developing new components and new product designs.
The average selling prices of our products generally decrease as the products mature. These decreases result from factors such as decreased manufacturing costs and increases in unit volumes, increased competition, the introduction of new products and market share considerations. In the past, we have lowered our selling prices in order to penetrate new markets and applications. Furthermore, we may negotiate discounted selling prices from time to time with certain customers that purchase multiple units.
Cost of sales.
Our cost of sales consists primarily of the cost of raw materials and components, direct labor expenses and manufacturing overhead. We are vertically integrated and currently manufacture all critical components for our products as well as assemble finished products. We believe our vertical integration allows us to increase efficiencies, leverage our scale and lower our cost of sales. Cost of sales also includes personnel costs and overhead related to our manufacturing and engineering operations, related occupancy and equipment costs, shipping costs and reserves for inventory obsolescence and for warranty obligations. Inventories are written off and charged to cost of sales when identified as excess or obsolete.
Due to our vertical integration strategy and ongoing investment in plant and machinery, we maintain a relatively high fixed manufacturing overhead. We may not adjust these fixed costs quickly enough to adapt to rapidly changing market conditions. Our gross margin is therefore significantly affected by our sales volume and the corresponding utilization of capacity and absorption of fixed manufacturing overhead expenses.
Sales and marketing.
Our sales and marketing expense consists primarily of costs related to compensation, trade shows, professional and technical conferences, travel, facilities, depreciation of equipment used for demonstration purposes and other marketing costs.
34
Research and development.
Our research and development expense consists primarily of compensation, development expenses related to the design of our products and certain components, the cost of materials and components to build prototype devices for testing and facilities costs. Costs related to product development are recorded as research and development expenses in the period in which they are incurred.
General and administrative.
Our general and administrative expense consists primarily of compensation and associated costs for executive management, finance, legal and other administrative personnel, outside legal and professional fees, insurance premiums and fees, allocated facilities costs and other corporate expenses such as charges and benefits related to the change in allowance for doubtful debt.
Factors and Trends That Affect Our Operations and Financial Results
In reading our financial statements, you should be aware of the following factors and trends that our management believes are important in understanding our financial performance.
Net sales.
Our net sales grew from
$299.3
million in
2010
to
$769.8
million in
2014
, representing a compound annual growth rate of approximately
27%
. Net sales growth was driven by (i) increasing demand for our products, fueled by their superior performance and decreasing average cost per watt of output power which has resulted in a substantial improvement in their cost competitiveness compared to traditional lasers, (ii) the introduction of new products, including our high-power lasers with higher output power levels, (iii) the growing market acceptance of fiber lasers and (iv) the development of new applications for our products and new OEM customer relationships. Our annual revenue growth rates have varied. Net sales increased by
19%
,
15%
,
19%
,
59%
and
61%
in
2014
,
2013
,
2012
,
2011
and
2010
, respectively.
Our business depends substantially upon capital expenditures by our customers, particularly by manufacturers using our products for materials processing, which includes general manufacturing, automotive, aerospace, heavy industry, consumer, semiconductor and electronics. Approximately
95%
of our revenues in
2014
were from customers using our products for materials processing. Although applications within materials processing are broad, the capital equipment market in general is cyclical and historically has experienced sudden and severe downturns. For the foreseeable future, our operations will continue to depend upon capital expenditures by customers for materials processing and will be subject to the broader fluctuations of capital equipment spending.
Our net sales have historically fluctuated from quarter to quarter. The increase or decrease in sales from a prior quarter can be affected by the timing of orders received from customers, the shipment, installation and acceptance of products at our customers' facilities, the mix of OEM orders and one-time orders for products with large purchase prices, and seasonal factors such as the purchasing patterns and levels of activity throughout the year in the regions where we operate. Historically, our net sales have been higher in the second half of the year than in the first half of the year. Furthermore, net sales can be affected by the time taken to qualify our products for use in new applications in the end markets that we serve. The adoption of our products by a new customer or qualification in a new application can lead to an increase in net sales for a period, which may then slow until we penetrate new markets or obtain new customers.
Gross margin
. Our total gross margin in any period can be significantly affected by total net sales in any period, by product mix, that is, the percentage of our revenue in the period that is attributable to higher or lower-power products and the mix of sales between laser and amplifier sources and complete systems, by sales mix between OEM customers who purchase devices from us in high unit volumes and other customers, by mix of sales in different geographies and by other factors, some of which are not under our control.
Our product mix affects our margins because the selling price per watt is generally higher for mid-power devices and certain specialty products than for high-power devices and certain pulsed lasers sold in large volumes. The overall cost of high-power lasers may be partially offset by improved absorption of fixed overhead costs associated with sales of larger volumes of higher-power products because they use a greater number of optical components and drive economies of scale in manufacturing. Also, the profit margins on systems can be lower than margins for our laser and amplifier sources, depending on the configuration, volume and competitive forces, among other factors.
The mix of sales between OEM customers and other customers can affect gross margin because we provide sales price discounts on products based on the number of units ordered. As the number of OEM customers increases and the number of units ordered increases, the average sales price per unit will be reduced. We expect that the impact of reduced sales price per unit will be offset by the manufacturing efficiency provided by high unit volume orders, but the timing and extent of achieving these efficiencies may not always match the mix of sales in any given time period or be realized at all.
We invested
$88.6 million
,
$70.9 million
and
$68.2 million
in capital expenditures in
2014
,
2013
and
2012
, respectively. Most of this investment relates to expansion of our manufacturing capacity.
35
A high proportion of our costs is fixed so they are generally difficult or slow to adjust in response to changes in demand. In addition, our fixed costs increase as we expand our capacity. If we expand capacity faster than is required by sales growth, gross margins could be negatively affected. Gross margins generally decline if production volumes are lower as a result of a decrease in sales or a reduction in inventory because the absorption of fixed manufacturing costs will be reduced. Gross margins generally improve when the opposite occurs. If both sales and inventory decrease in the same period, the decline in gross margin may be greater if we cannot reduce fixed costs or choose not to reduce fixed costs to match the decrease in the level of production. If we experience a decline in sales that reduces absorption of our fixed costs, or if we have production issues, our gross margins will be negatively affected.
We also regularly review our inventory for items that are slow-moving, have been rendered obsolete or are determined to be excess. Any provision for such slow-moving, obsolete or excess inventory affects our gross margins. For example, we recorded provisions for slow-moving, obsolete or excess inventory totaling
$11.3 million
,
$15.1 million
and
$8.2 million
in
2014
,
2013
and
2012
, respectively.
Sales and marketing expense.
We expect to continue to expand our worldwide direct sales organization, build and expand applications centers, hire additional personnel involved in marketing in our existing and new geographic locations, increase the number of units for demonstration purposes and otherwise increase expenditures on sales and marketing activities in order to support the growth in our net sales. As such, we expect that our sales and marketing expenses will increase in the aggregate.
Research and development expense.
We plan to continue to invest in research and development to improve our existing components and products and develop new components, products and systems. The amount of research and development expense we incur may vary from period to period. In general, if net sales continue to increase we expect research and development expense to increase in the aggregate.
General and administrative expense.
We expect our general and administrative expenses to increase as we continue to invest in systems and resources in management, finance, legal, information technology, human resources and administration to support our worldwide operations. Legal expenses vary from quarter to quarter based primarily upon the level of litigation and transaction activities.
Major customers.
While we have historically depended on a few customers for a large percentage of our annual net sales, the composition of this group can change from year to year. Net sales derived from our five largest customers as a percentage of our annual net sales were
23%
,
21%
and
16%
in
2014
,
2013
and
2012
. In
2014
and
2013
, sales to our largest customer accounted for
11%
of our net sales. No customer accounted for more than 10% of sales in
2012
. We seek to add new customers and to expand our relationships with existing customers. We anticipate that the composition of our significant customers will continue to change. If any of our significant customers were to substantially reduce their purchases from us, our results would be adversely affected.
Critical Accounting Policies and Estimates
The preparation of financial statements in conformity with accounting principles generally accepted in the United States ("GAAP") requires management to make estimates and assumptions that affect the reported amounts of assets and liabilities and disclosure of contingent assets and liabilities at the date of the financial statements and the reported amounts of net sales and expenses. By their nature, these estimates and judgments are subject to an inherent degree of uncertainty. On an ongoing basis we re-evaluate our judgments and estimates including those related to inventories, income taxes and the fair value of certain debt and equity instruments including stock-based compensation. We base our estimates and judgments on our historical experience and on other assumptions that we believe are reasonable under the circumstances, the results of which form the basis for making the judgments about the carrying values of assets and liabilities that are not readily apparent from other sources. Actual results could differ from those estimates, which may materially affect our operating results and financial position. The accounting policies described below are those which, in our opinion, involve the most significant application of judgment, or involve complex estimation, and which could, if different judgments or estimates were made, materially affect our reported results of operations and financial position.
Revenue Recognition.
We recognize revenue in accordance with Financial Accounting Standards Board ("FASB") Accounting Standards Codification ("ASC") 605. Revenue from orders with multiple deliverables is divided into separate units of accounting when certain criteria are met. These separate units generally consist of equipment and installation. The consideration for the arrangement is then allocated to the separate units of accounting based on their relative selling prices. The selling price of equipment is based on vendor-specific objective evidence and the selling price of installation is based on third-party evidence. Applicable revenue recognition criteria are then applied separately for each separate unit of accounting. Revenue for laser and amplifier sources generally is recognized upon the transfer of ownership which is typically at the time of shipment. Installation revenue is recognized upon completion of the installation service which typically occurs within 30 to 90 days of delivery. For laser systems, which may carry customer specific processing requirements, revenue is recognized at
36
the latter of customer acceptance date or shipment date if the customer acceptance is made prior to shipment. Returns and customer credits are infrequent and are recorded as a reduction to revenue. Rights of return generally are not included in sales arrangements.
Accounts Receivable and Allowance for Doubtful Accounts.
Accounts Receivable include $25.2 million and $17.7 million of bank acceptance drafts issued in China at December 31,
2014
and
2013
, respectively. Bank acceptance drafts are bank guarantees of payment on specified dates. The maturity of these bank acceptance drafts is less than 90 days. We maintain an allowance for doubtful accounts to provide for the estimated amount of accounts receivable that will not be collected. The allowance is based upon an assessment of customer creditworthiness, historical payment experience and the age of outstanding receivables.
Inventory.
Inventory is stated at the lower of cost (first-in, first-out method) or market value. Inventory includes parts and components that may be specialized in nature and subject to rapid obsolescence. We maintain a reserve for inventory items to provide for an estimated amount of excess or obsolete inventory. The reserve is based upon a review of inventory materials on hand, which we compare with historic usage, estimated future usage and age. In addition, we review the inventory and compare recorded costs with estimates of current market value. Write-downs are recorded to reduce the carrying value to the net realizable value with respect to any part with costs in excess of current market value. Estimating demand and current market values is inherently difficult, particularly given that we make highly specialized components and products. We determine the valuation of excess and obsolete inventory by making our best estimate considering the current quantities of inventory on hand and our forecast of the need for this inventory to support future sales of our products. We often have limited information on which to base our forecasts. If future sales differ from these forecasts, the valuation of excess and obsolete inventory may change and additional inventory provisions may be required. Because of our vertical integration, a significant or sudden decrease in sales could result in a significant change in the estimates of excess or obsolete inventory valuation. We recorded inventory provision for excess or obsolete inventory of
$11.3 million
,
$15.1 million
and
$8.2 million
in
2014
,
2013
and
2012
, respectively.
Warranty.
We maintain an accrual for warranty claims for units sold that are subject to warranty. We estimate this accrual considering past claims experience, the number of units still carrying warranty coverage and the average life of the remaining warranty period.
Stock-based compensation.
Stock-based compensation is included in the following financial statement captions as follows:
|
|
Year Ended December 31,
|
|||||||||||
|
|
2014
|
2013
|
2012
|
|||||||||
|
Cost of sales
|
$
|
4,153
|
|
$
|
3,187
|
|
$
|
2,184
|
|
|||
|
Sales and marketing
|
1,567
|
|
1,195
|
|
1,052
|
|
||||||
|
Research and development
|
3,033
|
|
1,929
|
|
1,327
|
|
||||||
|
General and administrative
|
6,419
|
|
5,409
|
|
4,002
|
|
||||||
|
Total stock-based compensation
|
15,172
|
|
11,720
|
|
8,565
|
|
||||||
|
Tax benefit recognized
|
(4,865
|
)
|
(3,784
|
)
|
(2,629
|
)
|
||||||
|
Net stock-based compensation
|
$
|
10,307
|
|
$
|
7,936
|
|
$
|
5,936
|
|
|||
We allocate and record stock-based compensation expense on a straight-line basis over the requisite service period.
We calculate the fair value of stock option grants using the Black-Scholes option pricing model. Determining the appropriate fair value model and calculating the fair value of stock-based payment awards require the use of highly subjective assumptions, including the expected life of the stock-based payment awards and stock price volatility. The assumptions used to calculate the fair value of stock-based payment awards represent management’s best estimates, but the estimates involve inherent uncertainties and the application of management judgment. As a result, if factors change and we use different assumptions, our stock-based compensation expense could be materially different in the future. The weighted average assumptions used in the Black-Scholes model or the calculation of compensation were as follows:
37
|
|
Year Ended December 31,
|
|||||
|
|
2014
|
2013
|
2012
|
|||
|
Expected term
|
4.7-6.1 years
|
4.4-6.3 years
|
4.0-6.6 years
|
|||
|
Volatility
|
48%-51%
|
51%-54%
|
49%-56%
|
|||
|
Risk-free rate of return
|
1.46%-1.84%
|
0.74%-1.32%
|
0.59%-1.23%
|
|||
|
Dividend yield
|
0.25%
|
0.25%
|
—%
|
|||
|
Forfeiture rate
|
3.04%-5.86%
|
0%-5.97%
|
0%-6.1%
|
|||
As stock-based compensation expense recorded in our statements of operations is based on options ultimately expected to vest, it has been reduced for estimated forfeitures. We estimate forfeitures at the time of grant and revise these estimates, if necessary, in subsequent periods if actual forfeitures differ from the estimates.
We have offered an employee stock purchase plan covering our U.S. and German employees. The plan allows employees who participate to purchase shares of common stock through payroll deductions at a 15% discount to the lower of the stock price on the first day or last day of the six-month purchase period. Payroll deductions may not exceed 10% of the employee's compensation. Compensation expense related to the employee stock purchase plan for the years ended
2014
,
2013
and
2012
, was approximately
$0.6 million
,
$0.5 million
and
$0.5 million
, respectively.
Income Taxes and Deferred Taxes.
Our annual tax rate is based on our income, statutory tax rates and tax planning opportunities available to us in the various jurisdictions in which we operate.
We file federal and state income tax returns in the United States and tax returns in numerous international jurisdictions. We must estimate our income tax expense after considering, among other factors, if inter-company transactions have been made on an arm’s length basis, differing tax rates between jurisdictions, allocation factors, tax credits, nondeductible items and changes in enacted tax rates. Significant judgment is required in determining our annual tax expense and in evaluating our tax positions. As we continue to expand globally, there is a risk that, due to complexity within and diversity among the various jurisdictions in which we do business, a governmental agency may disagree with the manner in which we have computed our taxes. Additionally, due to the lack of uniformity among all of the foreign and domestic taxing authorities, there may be situations where the tax treatment of an item in one jurisdiction is different from the tax treatment in another jurisdiction or that the transaction causes a tax liability to arise in another jurisdiction.
Deferred taxes arise because of the different treatment between financial statement accounting and tax accounting, known as "temporary differences." The tax effects of these temporary differences are recorded as deferred tax assets and deferred tax liabilities on the consolidated balance sheet. At
December 31, 2014
, we recorded a net deferred tax asset of
$11.7
million. If insufficient evidence of our ability to generate future taxable income arises, we may be required to record a valuation allowance against these assets, which will result in additional income tax expense. On a quarterly basis, we evaluate whether the deferred tax assets may be realized in the future and assess the need for a valuation allowance.
Changes in tax laws and rates may affect recorded deferred tax assets and liabilities and our effective tax rate in the future. The American Taxpayer Relief Act of 2012 (the "Act") was signed into law on January 2, 2013. Because a change in tax law is accounted for in the period of enactment, certain provisions of the Act benefiting our 2012 U.S. federal taxes, including the research and experimentation credit, could not be recognized in our 2012 financial results and instead is reflected in our 2013 financial results.
We provide reserves for potential payments of tax to various tax authorities related to uncertain tax positions and other issues. Reserves recorded are based on a determination of whether and how much of a tax benefit taken by us in our tax filings or positions is "more likely than not" to be realized following resolution of any potential contingencies present related to the tax benefit, assuming that the matter in question will be raised by the tax authorities. Potential interest and penalties associated with such uncertain tax positions is recorded as a component of income tax expense. At
December 31, 2014
, we had unrecognized tax benefits of approximately
$6.5 million
that, if recognized, would be recorded as a reduction in income tax expense.
At
December 31, 2014
, we had
$301.5 million
of cash in the United States and the remainder of
$220.6 million
at foreign locations. Cash outside of the United States is intended to fund working capital, capital expenditures and business expansion outside the United States.
38
Results of Operations
The following table sets forth selected statement of operations data for the periods indicated in dollar amounts and expressed as a percentage of net sales.
|
|
Year Ended December 31,
|
||||||||||||||||||||
|
|
2014
|
2013
|
2012
|
||||||||||||||||||
|
|
(In thousands, except percentages and per share data)
|
||||||||||||||||||||
|
Net sales
|
$
|
769,832
|
|
100.0
|
%
|
$
|
648,034
|
|
100.0
|
%
|
$
|
562,528
|
|
100.0
|
%
|
||||||
|
Cost of sales
|
353,314
|
|
45.9
|
|
308,136
|
|
47.5
|
|
257,801
|
|
45.8
|
|
|||||||||
|
Gross profit
|
416,518
|
|
54.1
|
|
339,898
|
|
52.5
|
|
304,727
|
|
54.2
|
|
|||||||||
|
Operating expenses:
|
|||||||||||||||||||||
|
Sales and marketing
|
30,637
|
|
4.0
|
|
26,692
|
|
4.1
|
|
23,845
|
|
4.2
|
|
|||||||||
|
Research and development
|
53,403
|
|
6.9
|
|
41,660
|
|
6.4
|
|
31,401
|
|
5.6
|
|
|||||||||
|
General and administrative
|
55,338
|
|
7.2
|
|
50,863
|
|
7.8
|
|
39,231
|
|
7.0
|
|
|||||||||
|
(Gain) loss on foreign exchange
|
(6,618
|
)
|
(0.9
|
)
|
2,536
|
|
0.4
|
|
1,362
|
|
0.2
|
|
|||||||||
|
Total operating expenses
|
132,760
|
|
17.2
|
|
121,751
|
|
18.8
|
|
95,839
|
|
17.0
|
|
|||||||||
|
Operating income
|
283,758
|
|
36.9
|
|
218,147
|
|
33.7
|
|
208,888
|
|
37.1
|
|
|||||||||
|
Interest (expense) income, net
|
(77
|
)
|
—
|
|
(1
|
)
|
—
|
|
319
|
|
0.1
|
|
|||||||||
|
Other income (expense), net
|
793
|
|
0.1
|
|
155
|
|
—
|
|
8
|
|
—
|
|
|||||||||
|
Income before provision for income taxes
|
284,474
|
|
37.0
|
|
218,301
|
|
33.7
|
|
209,215
|
|
37.2
|
|
|||||||||
|
Provision for income taxes
|
(84,029
|
)
|
(10.9
|
)
|
(62,521
|
)
|
(9.6
|
)
|
(61,471
|
)
|
(10.9
|
)
|
|||||||||
|
Net income
|
200,445
|
|
26.0
|
|
155,780
|
|
24.0
|
|
147,744
|
|
26.3
|
|
|||||||||
|
Less: Net income attributable to noncontrolling interests
|
—
|
|
—
|
|
—
|
|
—
|
|
2,740
|
|
0.5
|
|
|||||||||
|
Net income attributable to IPG Photonics Corporation
|
$
|
200,445
|
|
26.0
|
%
|
$
|
155,780
|
|
24.0
|
%
|
$
|
145,004
|
|
25.8
|
%
|
||||||
|
Net income attributable to IPG Photonics Corporation per share:
|
|||||||||||||||||||||
|
Basic
|
$
|
3.85
|
|
$
|
3.02
|
|
$
|
2.87
|
|
||||||||||||
|
Diluted
|
$
|
3.79
|
|
$
|
2.97
|
|
$
|
2.81
|
|
||||||||||||
|
Weighted-average shares outstanding:
|
|||||||||||||||||||||
|
Basic
|
52,104
|
|
51,548
|
|
50,477
|
|
|||||||||||||||
|
Diluted
|
52,824
|
|
52,375
|
|
51,536
|
|
|||||||||||||||
Comparison of Year Ended
December 31, 2014
to Year Ended
December 31, 2013
Net sales.
Net sales
increased
by
$121.8 million
, or
18.8%
, to
$769.8 million
in
2014
from
$648.0 million
in
2013
. The table below sets forth sales by application (in thousands, except for percentages):
|
|
Year Ended December 31,
|
|
|
||||||||||||||||||
|
|
2014
|
2013
|
Change
|
||||||||||||||||||
|
|
|
% of Total
|
|
% of Total
|
|
|
|||||||||||||||
|
Materials Processing
|
$
|
731,274
|
|
95.0
|
%
|
$
|
608,702
|
|
93.9
|
%
|
$
|
122,572
|
|
20.1
|
%
|
||||||
|
Other applications
|
38,558
|
|
5.0
|
%
|
39,332
|
|
6.1
|
%
|
(774
|
)
|
(2.0
|
)%
|
|||||||||
|
Total
|
$
|
769,832
|
|
100.0
|
%
|
$
|
648,034
|
|
100.0
|
%
|
$
|
121,798
|
|
18.8
|
%
|
||||||
Sales for materials processing applications
increased
primarily due to higher sales of high-power, medium-power and QCW lasers used in cutting, welding and laser sintering applications, offset by decreased sales of pulsed lasers used in marking and engraving applications. We continue to see increased acceptance of the advantages of fiber laser technology. A growing number of OEM customers have developed cutting systems that use our high-power lasers and sales of these systems are gaining sales from gas laser systems. We also increased sales of QCW lasers used for percussion drilling of holes in the aerospace industry as well as for cutting and welding thin sheet metal as demand increased for these devices from OEM customers because they are displacing lamp pumped YAG lasers. The decrease in sales of pulsed lasers was attributable to a decrease in consumer electronics demand for marking and engraving compared to a year ago and increased competition for certain models of pulsed lasers. The decrease in other applications sales relates primarily to the continued softness in telecommunications sales in Russia and North America.
39
Cost of sales and gross margin.
Cost of sales
increased
by
$45.2 million
, or
14.7%
, to
$353.3 million
in
2014
from
$308.1 million
in
2013
. Our gross margin
increased
to
54.1%
in
2014
from
52.5%
in
2013
. Gross margin
increased
due to sales product mix and a decrease in component cost greater than the decrease in average selling prices. In addition, provisions for excess and obsolete inventory decreased. Expenses related to provisions for excess or obsolete inventory and other valuation adjustments decreased by
$3.8 million
to
$11.3 million
, or
1.5%
of sales, for the year ended
December 31, 2014
, as compared to
$15.1 million
, or
2.3%
of sales, for the year ended
December 31, 2013
.
Sales and marketing expense.
Sales and marketing expense
increased
by
$4.0 million
, or
14.8%
, to
$30.6 million
in
2014
from
$26.7 million
in
2013
, primarily as a result of an increase in personnel costs, premises and depreciation expense. As a percentage of sales, sales and marketing expense decreased to
4.0%
in
2014
from
4.1%
in
2013
. As we continue to expand our worldwide sales organization, we expect sales and marketing expenses to increase in the aggregate.
Research and development expense.
Research and development expense
increased
by
$11.7 million
, or
28.2%
, to
$53.4 million
in
2014
from
$41.7 million
in
2013
, primarily as a result of an increase in personnel and consultant costs, expenses related to research and development contracts to develop new laser systems and application processes as well as an increase in materials, premises and depreciation expense. Research and development continues to focus on developing new products at different wavelengths including UV, developing end user systems, green and mid-infrared, new pulsed products, improving the electrical efficiency of high power products, enhancing the performance of our internally manufactured components, refining production processes to improve manufacturing yields, developing new accessories and achieving higher output powers. As a percentage of sales, research and development expense increased to
6.9%
in
2014
from
6.4%
in
2013
. We expect to continue to invest in research and development and that research and development expense will increase in the aggregate.
General and administrative expense.
General and administrative expense
increased
by
$4.5 million
, or
8.8%
, to
$55.3 million
in
2014
from
$50.9 million
in
2013
, primarily due to increased personnel costs, consultants, bad debt provisions and depreciation and premises expense. As a percentage of sales, general and administrative expense decreased to
7.2%
in
2014
from
7.8%
in
2013
. We expect general and administrative expenses to increase as we invest to support the expected growth in net sales.
Effect of exchange rates on sales, gross margin and operating expenses.
We estimate that if exchange rates had been the same as one year ago, sales in
2014
would have been
$8.5 million
higher, gross margin would have been
$6.3 million
higher and operating expenses in total would have been
$3.6 million
higher. These estimates assume constant exchange rates between fiscal year
2014
and fiscal year
2013
and are calculated using the average exchange rates for the twelve-month period ended
December 31, 2013
for the respective currencies, which were US$1=Euro 0.75, US$1=Japanese Yen 97.58, US$1=Chinese Yuan 6.19 and US$1=Russian Ruble 31.82.
(Gain) loss on foreign exchange.
We incurred a foreign exchange
gain
of
$6.6 million
in
2014
as compared to a
loss
of
$2.5 million
in
2013
. The change is primarily attributable to the appreciation of the U.S. Dollar compared to the Euro and Russian Ruble, partially off-set by the depreciation of the Japanese Yen compared to the U.S. Dollar and Euro.
Interest (expense) income, net.
Interest (expense) income, net was relatively flat at
$0.1 million
of
expense
in
2014
and
2013
.
Other income, net.
Other income, net increased to
$0.8 million
of
income
in
2014
compared to
$0.2 million
of
income
in
2013
. Included in other income, net for
2014
included insurance rebates and government subsidies as well as a small reduction in contingent consideration related to prior year acquisitions. For
2013
, other expense included $2.7 million reduction in contingent consideration related to prior year acquisitions and
$0.5 million
gain on the sale of an investment from our Russian subsidiary partially offset by a $2.9 million goodwill impairment charge.
Provision for income taxes
. Provision for income taxes was
$84.0 million
in
2014
compared to
$62.5 million
in
2013
, representing an effective tax rate of
29.5%
in
2014
and
28.6%
in
2013
. The
increase
in the provision for income taxes was primarily the result of
increased
income before provision for income taxes. The
increase
in effective rate was due primarily to the mix of income earned in various tax jurisdictions partially reduced by the reduced benefit of additional research and development credits claimed in 2014 as compared with 2013. The 2013 research and development credits included the effect of 2012 credits because the legislation authorizing the 2012 credits was not signed into law until 2013.
Net income.
Net income attributable to IPG Photonics Corporation
increased
by
$44.7 million
to
$200.4 million
in
2014
from
$155.8 million
in
2013
. Net income attributable to IPG Photonics Corporation as a percentage of our net sales
increased
by
2.0
percentage points to
26.0%
in
2014
from
24.0%
in
2013
due to the factors described above.
40
Comparison of Year Ended
December 31, 2013
to Year Ended
December 31, 2012
Net sales.
Net sales increased by $85.5 million, or 15.2%, to $648.0 million in 2013 from $562.5 million in 2012. The table below sets forth sales by application (in thousands, except for percentages):
|
|
Year Ended December 31,
|
|
|
||||||||||||||||||
|
|
2013
|
2012
|
Change
|
||||||||||||||||||
|
|
|
% of Total
|
|
% of Total
|
|
|
|||||||||||||||
|
Materials Processing
|
$
|
608,702
|
|
93.9
|
%
|
$
|
492,013
|
|
87.5
|
%
|
$
|
116,689
|
|
23.7
|
%
|
||||||
|
Other applications
|
39,332
|
|
6.1
|
%
|
70,515
|
|
12.5
|
%
|
(31,183
|
)
|
(44.2
|
)%
|
|||||||||
|
Total
|
$
|
648,034
|
|
100.0
|
%
|
$
|
562,528
|
|
100.0
|
%
|
$
|
85,506
|
|
15.2
|
%
|
||||||
Sales for materials processing applications increased primarily due to higher sales of high-power, medium-power and QCW lasers used in cutting and welding applications, offset by decreased sales of pulsed lasers used in marking and engraving applications. We continue to see increased acceptance of the advantages of fiber laser technology. A growing number of OEM customers have developed cutting systems that use our high-power lasers and sales of these systems are gaining sales from gas laser systems. In addition, new welding processes using fiber lasers have been developed, increasing sales of lasers for this application, which are replacing traditional laser and non-laser welding technologies. We also increased sales of QCW lasers used for percussion drilling of holes in the aerospace industry as well as for cutting and welding thin sheet metal and cutting sapphire glass in consumer electronics applications as demand increased for these devices from OEM customers because they are displacing lamp pumped YAG lasers. The decrease in sales of pulsed lasers was attributable to a decrease in consumer electronics demand for marking and engraving compared to a year ago and increased competition for certain models of pulsed lasers. The decrease in other applications sales relates primarily to a decrease in sales of lasers for advanced applications in the current year following fulfillment of large orders a year ago and lower telecommunications sales in Russia and North America. Orders for certain advanced applications can be uneven and of high unit value so that they can both benefit and impact sales depending on their timing.
Cost of sales and gross margin.
Cost of sales increased by $50.3 million, or 19.5%, to $308.1 million in 2013 from $257.8 million in 2012. Our gross margin decreased to 52.5% in 2013 from 54.2% in 2012. Gross margin decreased due to product and geographical mix of sales, an increase in sales volume to OEM customers which earn sales discounts for multiple unit purchases and an increase in provisions for excess and obsolete inventory. Product mix reduced gross margin due to lower sales of high brightness lasers in 2013. High brightness lasers have a higher average selling price per watt than other products. Expenses related to provisions for excess or obsolete inventory and other valuation adjustments increased by $6.9 million to $15.1 million, or 2.3% of sales, for the year ended December 31, 2013, as compared to $8.2 million, or 1.5% of sales, for the year ended December 31, 2012. The increase in inventory provisions primarily relate to inventory in our telecommunications and micro-systems businesses which have both experienced slowdowns.
Sales and marketing expense.
Sales and marketing expense increased by $2.9 million, or 11.9%, to $26.7 million in 2013 from $23.8 million in 2012, primarily as a result of an increase in personnel costs, premises expenses and expenses related to trade shows to support the increase in revenue. As a percentage of sales, sales and marketing expense decreased to 4.1% in 2013 from 4.2% in 2012.
Research and development expense.
Research and development expense increased by $10.3 million, or 32.7%, to $41.7 million in 2013 from $31.4 million in 2012, primarily as a result of an increase in personnel and consultant costs, expenses related to research and development contracts to develop new laser systems and application processes as well as an increase in depreciation expense. Expenses for materials used in research and development were approximately the same as one year ago. Included in the increase are $5.4 million of research and development costs associated with companies which were acquired in the third quarter of 2012 and first quarter of 2013. Research and development continues to focus on developing new products at different wavelengths including UV, green and mid-infrared, new pulsed products, improving the electrical efficiency of high power products, enhancing the performance of our internally manufactured components, refining production processes to improve manufacturing yields, developing new accessories and achieving higher output powers. As a percentage of sales, research and development expense increased to 6.4% in 2013 from 5.6% in 2012.
General and administrative expense.
General and administrative expense increased by $11.7 million, or 29.7%, to $50.9 million in 2013 from $39.2 million in 2012, primarily due to increased personnel costs, consultants, legal, travel, fees and subscriptions, donations, depreciation expense and premises expenses. General and administrative costs increased $2.7 million or by 6.9% due to the additions of general and administrative costs for companies acquired in the third quarter of 2012 and the first quarter of 2013. As a percentage of sales, general and administrative expense increased to 7.8% in 2013 from 7.0% in 2012.
41
Effect of exchange rates on sales, gross margin and operating expenses.
We estimate that if exchange rates had been the same as one year ago, sales in 2013 would have been $2.7 million higher, gross margin would have been $1.5 million higher and operating expenses in total would have been $0.1 million higher. These estimates assume constant exchange rates between fiscal year 2013 and fiscal year 2012 and are calculated using the average exchange rates for the twelve-month period ended December 31, 2012 for the respective currencies, which were US$1=Euro 0.78, US$1=Japanese Yen 79.79, US$1=Chinese Yuan 6.30 and US$1=Russian Ruble 30.99.
(Gain) loss on foreign exchange.
We incurred a foreign exchange loss of $2.5 million in 2013 as compared to a loss of $1.4 million in 2012. The change is primarily attributable to the depreciation of the U.S. Dollar compared to the Euro, the depreciation of the Russian Ruble compared to the U.S. Dollar and the Euro, partially off-set by the appreciation of the Chinese Yuan compared to the U.S. Dollar.
Interest (expense) income, net.
Interest (expense) income, net was $0.1 million of expense in 2013 compared to $0.3 million of income in 2012. The decrease is the result of lower interest earned on deposits as compared to the prior period.
Other income, net.
Other income, net increased to $0.2 million of income in 2013 compared to $0.1 million of income in 2012. Included in other income, net for 2013 were $2.7 million reduction in contingent consideration related to prior year acquisitions and $0.5 million gain on the sale of an investment from our Russian subsidiary partially offset by a $2.9 million goodwill impairment charge. For 2012, other expense included $1.1 million related to final payments of contingent consideration due for a prior acquisition.
Provision for income taxes
. Provision for income taxes was $62.5 million in 2013 compared to $61.5 million in 2012, representing an effective tax rate of 28.6% in 2013 and 29.4% in 2012. The increase in the provision for income taxes was primarily the result of increased income before provision for income taxes. The decrease in effective rate was due primarily to the mix of income earned in various tax jurisdictions, the benefit of additional research and development credits claimed after completion of a study to analyze and document research and development activity as well as the benefit of 2012 research and development credits included in the American Taxpayer Relief Act of 2012 (the "Act") which was signed into law on January 2, 2013. Because a change in tax law is accounted for in the period of enactment, certain provisions of the Act benefiting our 2012 U.S. federal taxes, including the research and experimentation credit, could not be recognized in our 2012 financial results and instead were reflected in our 2013 financial results.
Net income.
Net income attributable to IPG Photonics Corporation increased by $10.8 million to $155.8 million in 2013 from $145.0 million in 2012. Net income attributable to IPG Photonics Corporation as a percentage of our net sales decreased by 1.8 percentage points to 24.0% in 2013 from 25.8% in 2012 due to the factors described above.
Liquidity and Capital Resources
Our principal sources of liquidity as of
December 31, 2014
consisted of cash and cash equivalents of
$522.2 million
, unused credit lines and overdraft facilities of
$66.9 million
and working capital (excluding cash and cash equivalents) of
$249.6 million
. This compares to cash and cash equivalents of
$448.8 million
, unused credit lines and overdraft facilities of
$61.8 million
and working capital (excluding cash and cash equivalents) of
$237.5 million
as of
December 31, 2013
. The increase in cash and cash equivalents of
$73.4 million
from
$448.8 million
relates primarily to cash provided by operating activities in
2014
of
$180.1 million
and cash provided by financing activities of
$11.5 million
which was partially offset by cash used in investing activities of
$90.1 million
. Cash used in investing activities primarily relates to investments in fixed assets in
2014
and a purchase of certain intellectual property rights including patent rights during the third quarter of
2014
.
Our long-term debt consists of a
$11.3 million
unsecured variable-rate note. Of this amount, the entire balance of
$11.3 million
is the current portion because the note expires in June 2015, at which time the outstanding debt balance would be $10.7 million. The variable interest rate was fixed at a rate of 2.57% per annum by means of an interest rate swap instrument. Long-term debt also consists of a
$21.7 million
secured 2.81% per annum fixed-rate note issued in connection with the purchase of our company aircraft. The current portion of this note is
$2.0 million
. The note matures in October 2019, at which time the outstanding debt balance would be $12.0 million.
During 2014, our German subsidiary entered into a new credit facility with Deutsche Bank AG (the "Euro Credit Facility") to replace the prior credit facility that expired on June 30, 2014. The Euro Credit Facility makes available Euro 30.0 million (
$36.5 million
) and will expire in July 2017.
We believe that our existing cash and marketable securities, our cash flows from operations and our existing lines of credit provides us with the financial flexibility to meet our liquidity and capital needs, as well as to complete certain acquisitions of complementary businesses and technologies. Our future long-term capital requirements will depend on many factors including our level of sales, the impact of economic environment on our sales levels, the timing and extent of spending
42
to support development efforts, the expansion of the global sales and marketing activities, government regulation including trade sanctions, the timing and introductions of new products, the need to ensure access to adequate manufacturing capacity and the continuing market acceptance of our products.
The following table details our line-of-credit facilities as of
December 31, 2014
:
|
Description
|
|
Available Principal
|
|
Interest Rate
|
|
Maturity
|
|
Security
|
|
U.S. Revolving Line of Credit (1)
|
|
Up to $35.0 million
|
|
LIBOR plus 1.125% to 1.625%, depending on our performance
|
|
June 2015
|
|
Unsecured
|
|
Euro Credit Facilities (Germany) (2)
|
|
Euro 30.0 million ($36.5 million)
|
|
Euribor + 1.00% or EONIA 1.25%
|
|
July 2017
|
|
Unsecured, guaranteed by parent company and Germany subsidiary
|
|
Euro Overdraft Facilities (3)
|
|
Euro 2.0 million
($2.4 million) |
|
1.0%-6.5%
|
|
October 2015
|
|
Common pool of assets of Italian subsidiary
|
|
(1)
|
$14.1 million of this revolving credit facility is available to our foreign subsidiaries in their respective local currencies, including India, China, Japan and South Korea. At
December 31, 2014
, there were no amounts drawn on this line, however, there were
$0.1 million
of guarantees issued against the line which reduces total availability.
|
|
(2)
|
$19.4 million
is available to our Russian subsidiary,
$9.7 million
of this credit facility is available to our German subsidiary,
$3.6 million
is available to our Chinese subsidiary and
$3.6 million
is available to our Italian subsidiary. Total drawings at
December 31, 2014
were
$1.8 million
with an interest rate of
1.0%
and there were
$4.3 million
of guarantees issued against the line which also reduces total availability.
|
|
(3)
|
At
December 31, 2014
,
$0.8 million
of the
$2.4 million
was drawn upon with an interest rate of
1.0%
.
|
Our largest committed credit lines are with Bank of America and Deutsche Bank in the amounts of $35.0 million and
$36.5 million
(or 30 million Euro as described above), respectively, and neither of them is syndicated.
We are required to meet certain financial covenants associated with our U.S. revolving line of credit and long-term debt facilities. These covenants, tested quarterly, include a debt service coverage ratio and a funded debt to earnings before interest, taxes, depreciation and amortization ("EBITDA") ratio. The debt service coverage covenant requires that we maintain a trailing twelve month ratio of cash flow to debt service that is greater than 1.5:1. Debt service is defined as required principal and interest payments during the period. Cash flow is defined as EBITDA less unfunded capital expenditures. The funded debt to EBITDA covenant requires that the sum of all indebtedness for borrowed money on a consolidated basis shall be less than two times our trailing twelve months EBITDA. We were in compliance with all such financial covenants as of and for the three months ended
December 31, 2014
.
The financial covenants in our loan documents may cause us to not take or to delay investments and actions that we might otherwise undertake because of limits on capital expenditures and amounts that we can borrow or lease. In the event that we do not comply with any one of these covenants, we would be in default under the loan agreement or loan agreements, which may result in acceleration of the debt, cross-defaults on other debt or a reduction in available liquidity, any of which could harm our results of operations and financial condition.
Operating activities.
Net cash provided by operating activities
increased
by
$60.7 million
to
$180.1 million
in
2014
from
$119.4 million
in
2013
, primarily resulting from:
|
•
|
An increase in cash provided by net income after adding back non-cash charges of
$274.7 million
in
2014
as compared to
$222.7 million
in
2013
;
|
|
•
|
An increase in income and other taxes payable of
$5.8 million
in
2014
compared to a decrease of
$30.8 million
in
2013
, which includes cash payments for corporation tax in Germany of approximately $32 million which related to the final payment for fiscal year 2011 and revised estimated payment for fiscal year 2012 which both became due when we filed our fiscal year 2011 German tax return and which would normally have been paid in 2012;
|
|
•
|
An increase in accounts payable of
$3.3 million
in
2014
compared to an increase of
$1.0 million
in
2013
; offset by
|
|
•
|
An increase in accounts receivable of
$48.5 million
in
2014
compared to an increase of
$10.0 million
in
2013
;
|
|
•
|
An increase in inventory of
$42.2 million
in
2014
compared to an increase of
$50.4 million
in
2013
;
|
43
|
•
|
An increase in prepaid expenses and other current assets of
$5.4 million
in
2014
compared to an increase of
$4.0 million
in
2013
;
|
|
•
|
An increase in the tax benefit from exercise of employee stock options of
$6.0 million
in
2014
compared to an increase of
$8.9 million
in
2013
.
|
Given our vertical integration, rigorous and time-consuming testing procedures for both internally manufactured and externally purchased components and the lead time required to manufacture components used in our finished products, the rate at which we turn inventory has historically been comparatively low when compared to our cost of sales. Also, our historic growth rates required investment in inventories to support future sales and enable us to quote short delivery times to our customers, providing what we believe is a competitive advantage. Furthermore, if there was a disruption to the manufacturing capacity of any of our key technologies, our inventories of components should enable us to continue to build finished products for a reasonable period of time. We believe that we will continue to maintain a relatively high level of inventory compared to our cost of sales. As a result, we expect to have a significant amount of working capital invested in inventory. A reduction in our level of net sales or the rate of growth of our net sales from their current levels would mean that the rate at which we are able to convert our inventory into cash would decrease.
Deferred tax liabilities are not recorded for undistributed earnings of a foreign subsidiary that are deemed to be indefinitely reinvested in the foreign jurisdiction. Historically, we have reinvested the undistributed earnings of our foreign subsidiaries. We intend to continue to do this and keep such earnings indefinitely reinvested in the applicable tax jurisdictions.
Investing activities.
Net cash used in investing activities was
$90.1 million
and
$75.9 million
in
2014
and
2013
, respectively. The cash used in investing activities in
2014
related to the construction and purchase of new buildings in the United States, Germany and Russia as well as purchases of machinery and equipment and
$2.0 million
for the purchase of certain patents and patent rights during the third quarter of
2014
. As previously noted, purchases of property, plant and equipment in 2014 detailed above excludes $22 million related to the purchase of an aircraft because this purchase was financed with a note and therefore is a non-cash transaction. The cash used in investing activities in
2013
related to the construction of new buildings in the United States, Germany and Russia as well as purchases of machinery and equipment and
$5.6 million
for an acquisition during the first quarter of
2013
.
We expect to incur approximately
$60 million
to
$65 million
in capital expenditures, excluding acquisitions, in
2015
, as we continue to upgrade facilities and add capacity world wide to support our anticipated revenue growth. The timing and extent of any capital expenditures in and between periods can have a significant effect on our cash flow. Many of the capital expenditure projects that we undertake have long lead times and are difficult to cancel or defer to a later period.
Financing activities.
Net cash provided by financing activities was
$11.5 million
and
$14.1 million
in
2014
and
2013
, respectively. The cash provided by financing activities in
2014
was primarily related to the cash provided by the exercise of stock options, issuances under our employee stock purchase plan, the related tax benefits of the exercises, partially offset by net payments of line-of-credit facilities and on our long-term debt. The cash provided by financing activities in
2013
was primarily related to the cash provided by the exercise of stock options, issuances under our employee stock purchase plan, the related tax benefits of the exercises and net proceeds of line-of-credit facilities partially offset by the payments on our long-term debt.
Contractual Obligations
The following table describes our contractual obligations as of
December 31, 2014
(in thousands):
|
|
Payments Due in
|
|||||||||||||||||||
|
|
Total
|
Less Than
1 Year
|
1-3 Years
|
3-5 Years
|
More Than
5 Years
|
|||||||||||||||
|
Operating lease obligations
|
$
|
13,510
|
|
$
|
4,390
|
|
$
|
6,175
|
|
$
|
2,940
|
|
$
|
5
|
|
|||||
|
Purchase obligations(1)
|
22,288
|
|
22,288
|
|
—
|
|
—
|
|
—
|
|
||||||||||
|
Long-term debt obligations (including interest)(2)
|
35,443
|
|
14,062
|
|
7,412
|
|
13,969
|
|
—
|
|
||||||||||
|
Contingent consideration
|
98
|
|
98
|
|
—
|
|
—
|
|
—
|
|
||||||||||
|
Total(3)
|
$
|
71,339
|
|
$
|
40,838
|
|
$
|
13,587
|
|
$
|
16,909
|
|
$
|
5
|
|
|||||
|
(1)
|
Includes $4.5 million related to an agreed purchase of research and development, know-how and intangible assets related to the development of laser based systems.
|
|
(2)
|
Interest for long-term debt obligations was calculated including the effect of our interest rate swap and fixed rate amount. The effect of the interest rate swap, which is accounted for as a cash flow hedge, is to fix the LIBOR component of the interest rate of the underlying floating rate loan at 2.6% for the remaining term of the debt. The fixed rate amount is 2.8%.
|
44
|
(3)
|
Excludes obligations related to ASC 740, reserves for uncertain tax positions, because we are unable to provide a reasonable estimate of the timing of future payments relating to the remainder of these obligations. See Note 14 to the Consolidated Financial Statements.
|
Recent Accounting Pronouncements
Accounting standards that have been issued or proposed by the FASB or other standards-setting bodies that do not require adoption until a future date are not expected to have a material impact on our financial statements upon adoption.
ITEM 7A.
QUANTITATIVE AND QUALITATIVE DISCLOSURES ABOUT MARKET RISK
We are exposed to market risk in the ordinary course of business, which consists primarily of interest rate risk associated with our cash and cash equivalents and our debt and foreign exchange rate risk.
Interest rate risk
. Our investments have limited exposure to market risk. To minimize this risk, we maintain a portfolio of cash, cash equivalents and short-term investments, consisting primarily of bank deposits, money market funds and short-term government securities. The interest rates are variable and fluctuate with current market conditions. Because of the short-term nature of these instruments, a sudden change in market interest rates would not be expected to have a material impact on our financial condition or results of operations.
We are also exposed to market risk as a result of increases or decreases in the amount of interest expense we must pay on our bank debt and borrowings on our bank credit facilities. Our interest obligations on our long-term debt are fixed by means of interest rate swap agreements. Although our U.S. revolving line of credit and our Euro credit facility have variable rates, we do not believe that a 10% change in market interest rates would have a material impact on our financial position or results of operations.
Exchange rates.
Due to our international operations, a significant portion of our net sales, cost of sales and operating expenses are denominated in currencies other than the U.S. Dollar, principally the Euro, the Chinese Yuan, the Japanese Yen, and the Russian Ruble. As a result, our international operations give rise to transactional market risk associated with exchange rate movements of the U.S. Dollar, the Euro, the Chinese Yuan, the Japanese Yen, and the Russian Ruble. Gain on foreign exchange transactions totaled
$6.6 million
in
2014
and loss on foreign exchange transactions totaled
$2.5 million
in
2013
. Management attempts to minimize these exposures by partially or fully off-setting foreign currency denominated assets and liabilities at our subsidiaries that operate in different functional currencies. Foreign currency derivative instruments can also be used to hedge exposures and reduce the risks of certain foreign currency transactions; however, these instruments provide only limited protection and can carry significant cost. We have no foreign currency derivative instrument hedges as of
December 31, 2014
. We will continue to analyze our exposure to currency exchange rate fluctuations and may engage in financial hedging techniques in the future to attempt to minimize the effect of these potential fluctuations. Exchange rate fluctuations may adversely affect our financial results in the future.
ITEM 8.
FINANCIAL STATEMENTS AND SUPPLEMENTARY DATA
|
This information is incorporated by reference from pages
|
F-
1
|
through
|
F-23
|
of this report.
|
ITEM 9.
CHANGES IN AND DISAGREEMENTS WITH ACCOUNTANTS ON ACCOUNTING AND FINANCIAL DISCLOSURE
None.
ITEM 9A.
CONTROLS AND PROCEDURES
Evaluation of Disclosure Controls and Procedures
Under the supervision of our Chief Executive Officer and our Chief Financial Officer, our management has evaluated the effectiveness of the design and operation of our "disclosure controls and procedures" (as defined in Rules 13a-15(e) and 15d-15(e) promulgated under the Securities Exchange Act of 1934, as amended (the "Exchange Act")), as of the end of the period covered by this Annual Report on Form 10-K (the "Evaluation Date"). Based upon that evaluation, our chief executive officer and our chief financial officer have concluded that, as of the Evaluation Date, our disclosure controls and procedures are effective to ensure that information we are required to disclose in reports that we file or submit under the Exchange Act is recorded, processed, summarized and reported within the time periods specified in the SEC's rules and forms.
45
Management's Annual Report on Internal Control Over Financial Reporting
Our management, including our Chief Executive Officer and Chief Financial Officer, is responsible for establishing and maintaining adequate internal control over financial reporting (as defined in Exchange Act Rules 13a-15(f) and 15d-15(f)) for the Company and its subsidiaries. Internal control over financial reporting is a process designed to provide reasonable assurance regarding the reliability of financial reporting and the preparation of financial statements for external purposes in accordance with generally accepted accounting principles. Our management conducted an assessment of the effectiveness of our internal control over financial reporting as of the Evaluation Date based on criteria established in "Internal Control—Integrated Framework" issued by the Committee of Sponsoring Organizations of the Treadway Commission (COSO). Based on this assessment, our management concluded that, as of the Evaluation Date, our internal control over financial reporting was effective.
Our independent registered public accounting firm, Deloitte & Touche LLP, has audited our internal control over financial reporting, as stated in their report below.
Changes in Internal Controls
There was no change in our internal control over financial reporting (as defined in Rule 13a-15(f) under the Exchange Act) that occurred during the last fiscal quarter that has materially affected, or is reasonably likely to materially affect, our internal control over financial reporting.
Limitations on Effectiveness of Controls
Our management (including our Chief Executive Officer and Chief Financial Officer) does not expect that the disclosure controls and procedures or internal control over financial reporting will prevent or detect all error and all fraud. A control system, no matter how well designed and operated, can provide only reasonable, not absolute, assurance that the objectives of the control system are met. Further, the design of a control system must reflect the fact that there are resource constraints, and the benefits of controls must be considered relative to their costs. Due to the inherent limitations in all control systems, no evaluation of controls can provide absolute assurance that all control issues, errors and instances of fraud, if any, within the company have been or will be detected.
46
REPORT OF INDEPENDENT REGISTERED PUBLIC ACCOUNTING FIRM
To the Board of Directors and Stockholders of
IPG Photonics Corporation
Oxford, Massachusetts
We have audited the internal control over financial reporting of IPG Photonics Corporation and subsidiaries (the "Company") as of
December 31, 2014
, based on criteria established in
Internal Control — Integrated Framework (2013)
issued by the Committee of Sponsoring Organizations of the Treadway Commission. The Company's management is responsible for maintaining effective internal control over financial reporting and for its assessment of the effectiveness of internal control over financial reporting, included in the accompanying Management's Annual Report on Internal Control Over Financial Reporting. Our responsibility is to express an opinion on the Company's internal control over financial reporting based on our audit.
We conducted our audit in accordance with the standards of the Public Company Accounting Oversight Board (United States). Those standards require that we plan and perform the audit to obtain reasonable assurance about whether effective internal control over financial reporting was maintained in all material respects. Our audit included obtaining an understanding of internal control over financial reporting, assessing the risk that a material weakness exists, testing and evaluating the design and operating effectiveness of internal control based on the assessed risk, and performing such other procedures as we considered necessary in the circumstances. We believe that our audit provides a reasonable basis for our opinion.
A company's internal control over financial reporting is a process designed by, or under the supervision of, the company's principal executive and principal financial officers, or persons performing similar functions, and effected by the company's board of directors, management, and other personnel to provide reasonable assurance regarding the reliability of financial reporting and the preparation of financial statements for external purposes in accordance with generally accepted accounting principles. A company's internal control over financial reporting includes those policies and procedures that (1) pertain to the maintenance of records that, in reasonable detail, accurately and fairly reflect the transactions and dispositions of the assets of the company; (2) provide reasonable assurance that transactions are recorded as necessary to permit preparation of financial statements in accordance with generally accepted accounting principles, and that receipts and expenditures of the company are being made only in accordance with authorizations of management and directors of the company; and (3) provide reasonable assurance regarding prevention or timely detection of unauthorized acquisition, use, or disposition of the company's assets that could have a material effect on the financial statements.
Because of the inherent limitations of internal control over financial reporting, including the possibility of collusion or improper management override of controls, material misstatements due to error or fraud may not be prevented or detected on a timely basis. Also, projections of any evaluation of the effectiveness of the internal control over financial reporting to future periods are subject to the risk that the controls may become inadequate because of changes in conditions, or that the degree of compliance with the policies or procedures may deteriorate.
In our opinion, the Company maintained, in all material respects, effective internal control over financial reporting as of
December 31, 2014
, based on the criteria established in
Internal Control — Integrated Framework (2013)
issued by the Committee of Sponsoring Organizations of the Treadway Commission.
We have also audited, in accordance with the standards of the Public Company Accounting Oversight Board (United States), the consolidated financial statements as of and for the year ended
December 31, 2014
of the Company and our report dated
February 28, 2015
expressed an unqualified opinion on those financial statements.
/s/ DELOITTE & TOUCHE LLP
Boston, Massachusetts
February 28, 2015
47
ITEM 9B.
CONTROLS AND PROCEDURES
None.
ITEM 10.
DIRECTORS, EXECUTIVE OFFICERS AND CORPORATE GOVERNANCE
The information required hereunder is incorporated herein by reference to our definitive Proxy Statement to be filed pursuant to Regulation 14A, which Proxy Statement is anticipated to be filed with the SEC within 120 days after
December 31, 2014
.
ITEM 11.
EXECUTIVE COMPENSATION
The information required hereunder is incorporated herein by reference to our definitive Proxy Statement to be filed pursuant to Regulation 14A, which Proxy Statement is anticipated to be filed with the SEC within 120 days after
December 31, 2014
.
ITEM 12.
SECURITY OWNERSHIP OF CERTAIN BENEFICIAL OWNERS AND MANAGEMENT AND RELATED STOCKHOLDER MATTERS
The information required hereunder is incorporated herein by reference to our definitive Proxy Statement to be filed pursuant to Regulation 14A, which Proxy Statement is anticipated to be filed with the SEC within 120 days after
December 31, 2014
, with the exception of the information regarding securities authorized for issuance under our equity compensation plans, which is set forth in Item 5, "Market for the Registrant's Common Equity, Related Stockholder Matters and Issuer Purchases of Equity Securities Information Regarding Equity Compensation Plans" and is incorporated herein by reference.
ITEM 13.
CERTAIN RELATIONSHIPS AND RELATED TRANSACTIONS, AND DIRECTOR INDEPENDENCE
The information required hereunder is incorporated herein by reference to our definitive Proxy Statement to be filed pursuant to Regulation 14A, which Proxy Statement is anticipated to be filed with the SEC within 120 days after
December 31, 2014
.
ITEM 14.
PRINCIPAL ACCOUNTING FEES AND SERVICES
The information required hereunder is incorporated herein by reference to our definitive Proxy Statement to be filed pursuant to Regulation 14A, which Proxy Statement is anticipated to be filed with the SEC within 120 days after
December 31, 2014
.
ITEM 15.
EXHIBITS AND FINANCIAL STATEMENT SCHEDULES
|
(a)
|
The following documents are filed as part of this Annual Report on Form 10-K:
|
|
(1)
|
Financial Statements.
|
See Index to Financial Statements on page F-1.
|
(2)
|
Financial Statement Schedules.
|
All schedules are omitted because they are not applicable or the required information is shown on the financial statements or notes thereto.
|
(3)
|
The exhibits listed in the "Index to Exhibits" preceding the Exhibits attached hereto are filed with this Form 10-K or incorporated by reference as set forth therein.
|
|
(b)
|
Exhibits.
|
See (a)(3) above.
|
(c)
|
Additional Financial Statement Schedules.
|
48
All schedules are omitted because they are not applicable or the required information is shown on the financial statements or notes thereto.
SIGNATURES
Pursuant to the requirements of Section 13 or 15(d) of the Securities Exchange Act of 1934, the Registrant has duly caused this report to be signed on its behalf by the undersigned, thereunto duly authorized, on
February 28, 2015
.
|
IPG P
HOTONICS
C
ORPORATION
|
|
|
By:
|
/s/ Valentin P. Gapontsev
|
|
|
Valentin P. Gapontsev
Chief Executive Officer and
Chairman of the Board
|
Pursuant to the requirements of the Securities Exchange Act of 1934, this report has been signed below by the following persons on behalf of the Registrant and in the capacities and on the dates indicated.
49
|
Signature
|
|
Title
|
|
|
|
/s/ Valentin P. Gapontsev
Valentin P. Gapontsev
|
|
Chief Executive Officer, Chairman of the Board and Director (Principal Executive Officer)
|
|
February 28, 2015
|
|
/s/ Timothy P.V. Mammen
Timothy P.V. Mammen
|
|
Senior Vice President, Chief Financial Officer (Principal Financial Officer)
|
|
February 28, 2015
|
|
/s/ Thomas J. Burgomaster
Thomas J. Burgomaster
|
Vice President, Corporate Controller (Principal Accounting Officer)
|
February 28, 2015
|
||
|
/s/ Robert A. Blair
Robert A. Blair
|
|
Director
|
|
February 28, 2015
|
|
/s/ Michael C. Child
Michael C. Child
|
|
Director
|
|
February 28, 2015
|
|
/s/ Henry E. Gauthier
Henry E. Gauthier
|
|
Director
|
|
February 28, 2015
|
|
/s/ William S. Hurley
William S. Hurley
|
|
Director
|
|
February 28, 2015
|
|
/s/ Eric Meurice
Eric Meurice
|
|
Director
|
|
February 28, 2015
|
|
/s/ John Peeler
John Peeler
|
|
Director
|
|
February 28, 2015
|
|
/s/ Igor Samartsev
Igor Samartsev
|
|
Director
|
|
February 28, 2015
|
|
/s/ Eugene Scherbakov
Eugene Scherbakov
|
|
Director
|
|
February 28, 2015
|
|
/s/ Thomas J. Seifert
Thomas J. Seifert
|
Director
|
February 28, 2015
|
||
50
INDEX TO FINANCIAL STATEMENTS
|
Report of Independent Registered Public Accounting Firm
|
|
|
F-
2
|
|
|
Consolidated Balance Sheets as of December 31, 2014 and 2013
|
|
|
F-
3
|
|
|
Consolidated Statements of Income for the Years Ended December 31, 2014, 2013 and 2012
|
|
|
F-
4
|
|
|
Consolidated Statements of Comprehensive Income for the Years Ended December 31, 2014, 2013 and 2012
|
|
|
F-
5
|
|
|
Consolidated Statements of Equity for the Years Ended December 31, 2014, 2013 and 2012
|
|
|
F-
6
|
|
|
Consolidated Statements of Cash Flows for the Years Ended December 31, 2014, 2013 and 2012
|
|
|
F-
7
|
|
|
Notes to Consolidated Financial Statements
|
|
|
F-
8
|
|
F-
1
REPORT OF INDEPENDENT REGISTERED PUBLIC ACCOUNTING FIRM
To the Board of Directors and Stockholders of
IPG Photonics Corporation
Oxford, Massachusetts
We have audited the accompanying consolidated balance sheets of IPG Photonics Corporation and subsidiaries (the "Company") as of
December 31, 2014
and
2013
, and the related consolidated statements of income, comprehensive income, stockholders' equity and cash flows for each of the three years in the period ended
December 31, 2014
. These financial statements are the responsibility of the Company's management. Our responsibility is to express an opinion on the financial statements based on our audits.
We conducted our audits in accordance with the standards of the Public Company Accounting Oversight Board (United States). Those standards require that we plan and perform the audit to obtain reasonable assurance about whether the financial statements are free of material misstatement. An audit includes examining, on a test basis, evidence supporting the amounts and disclosures in the financial statements. An audit also includes assessing the accounting principles used and significant estimates made by management, as well as evaluating the overall financial statement presentation. We believe that our audits provide a reasonable basis for our opinion.
In our opinion, such consolidated financial statements present fairly, in all material respects, the financial position of IPG Photonics Corporation and subsidiaries as of
December 31, 2014
and
2013
, and the results of their operations and their cash flows for each of the three years in the period ended
December 31, 2014
, in conformity with accounting principles generally accepted in the United States of America.
We have also audited, in accordance with the standards of the Public Company Accounting Oversight Board (United States), the Company's internal control over financial reporting as of
December 31, 2014
, based on the criteria established in
Internal Control — Integrated Framework (2013)
issued by the Committee of Sponsoring Organizations of the Treadway Commission and our report dated
February 28, 2015
expressed an unqualified opinion on the Company's internal control over financial reporting.
/s/ DELOITTE & TOUCHE LLP
Boston, Massachusetts
February 28, 2015
F-
2
IPG PHOTONICS CORPORATION
|
December 31,
|
|||||||
|
|
2014
|
2013
|
|||||
|
|
(In thousands, except share
and per share data)
|
||||||
|
ASSETS
|
|||||||
|
CURRENT ASSETS:
|
|||||||
|
Cash and cash equivalents
|
$
|
522,150
|
|
$
|
448,776
|
|
|
|
Accounts receivable, net
|
143,109
|
|
103,803
|
|
|||
|
Inventories
|
171,009
|
|
172,700
|
|
|||
|
Prepaid income taxes
|
20,967
|
|
15,996
|
|
|||
|
Prepaid expenses and other current assets
|
21,295
|
|
30,836
|
|
|||
|
Deferred income taxes, net
|
15,308
|
|
14,232
|
|
|||
|
Total current assets
|
893,838
|
|
786,343
|
|
|||
|
DEFERRED INCOME TAXES, NET
|
5,438
|
|
4,799
|
|
|||
|
GOODWILL
|
455
|
|
455
|
|
|||
|
INTANGIBLE ASSETS, NET
|
9,227
|
|
9,564
|
|
|||
|
PROPERTY, PLANT AND EQUIPMENT, NET
|
275,082
|
|
252,245
|
|
|||
|
OTHER ASSETS
|
26,847
|
|
7,810
|
|
|||
|
TOTAL
|
$
|
1,210,887
|
|
$
|
1,061,216
|
|
|
|
LIABILITIES AND EQUITY
|
|||||||
|
CURRENT LIABILITIES:
|
|||||||
|
Revolving line-of-credit facilities
|
$
|
2,631
|
|
$
|
3,296
|
|
|
|
Current portion of long-term debt
|
13,333
|
|
1,333
|
|
|||
|
Accounts payable
|
17,141
|
|
18,787
|
|
|||
|
Accrued expenses and other liabilities
|
64,057
|
|
59,336
|
|
|||
|
Deferred income taxes, net
|
3,241
|
|
2,109
|
|
|||
|
Income taxes payable
|
21,672
|
|
15,218
|
|
|||
|
Total current liabilities
|
122,075
|
|
100,079
|
|
|||
|
DEFERRED INCOME TAXES AND OTHER LONG-TERM LIABILITIES
|
22,584
|
|
21,835
|
|
|||
|
LONG-TERM DEBT, NET OF CURRENT PORTION
|
19,667
|
|
11,333
|
|
|||
|
Total liabilities
|
164,326
|
|
133,247
|
|
|||
|
COMMITMENTS AND CONTINGENCIES (NOTE 10)
|
|
|
|||||
|
IPG PHOTONICS CORPORATION STOCKHOLDERS' EQUITY:
|
|||||||
|
Common stock, $0.0001 par value, 175,000,000 shares authorized; 52,369,688 shares issued and outstanding at December 31, 2014; 51,930,978 shares issued and outstanding at December 31, 2013
|
5
|
|
5
|
|
|||
|
Additional paid-in capital
|
567,617
|
|
538,908
|
|
|||
|
Retained earnings
|
591,202
|
|
390,757
|
|
|||
|
Accumulated other comprehensive loss
|
(112,263
|
)
|
(1,701
|
)
|
|||
|
Total IPG Photonics Corporation stockholders' equity
|
1,046,561
|
|
927,969
|
|
|||
|
TOTAL
|
$
|
1,210,887
|
|
$
|
1,061,216
|
|
|
See notes to consolidated financial statements.
F-
3
IPG PHOTONICS CORPORATION
|
|
Year Ended December 31,
|
||||||||||
|
|
2014
|
2013
|
2012
|
||||||||
|
|
(in thousands, except per share data)
|
||||||||||
|
NET SALES
|
$
|
769,832
|
|
$
|
648,034
|
|
$
|
562,528
|
|
||
|
COST OF SALES
|
353,314
|
|
308,136
|
|
257,801
|
|
|||||
|
GROSS PROFIT
|
416,518
|
|
339,898
|
|
304,727
|
|
|||||
|
OPERATING EXPENSES:
|
|||||||||||
|
Sales and marketing
|
30,637
|
|
26,692
|
|
23,845
|
|
|||||
|
Research and development
|
53,403
|
|
41,660
|
|
31,401
|
|
|||||
|
General and administrative
|
55,338
|
|
50,863
|
|
39,231
|
|
|||||
|
(Gain) loss on foreign exchange
|
(6,618
|
)
|
2,536
|
|
1,362
|
|
|||||
|
Total operating expenses
|
132,760
|
|
121,751
|
|
95,839
|
|
|||||
|
OPERATING INCOME
|
283,758
|
|
218,147
|
|
208,888
|
|
|||||
|
OTHER INCOME (EXPENSE), Net:
|
|||||||||||
|
Interest (expense) income, net
|
(77
|
)
|
(1
|
)
|
319
|
|
|||||
|
Other income, net
|
793
|
|
155
|
|
8
|
|
|||||
|
Total other income (expense)
|
716
|
|
154
|
|
327
|
|
|||||
|
INCOME BEFORE PROVISION FOR INCOME TAXES
|
284,474
|
|
218,301
|
|
209,215
|
|
|||||
|
PROVISION FOR INCOME TAXES
|
(84,029
|
)
|
(62,521
|
)
|
(61,471
|
)
|
|||||
|
NET INCOME
|
200,445
|
|
155,780
|
|
147,744
|
|
|||||
|
LESS: NET INCOME ATTRIBUTABLE TO NONCONTROLLING INTERESTS
|
—
|
|
—
|
|
2,740
|
|
|||||
|
NET INCOME ATTRIBUTABLE TO IPG PHOTONICS CORPORATION
|
$
|
200,445
|
|
$
|
155,780
|
|
$
|
145,004
|
|
||
|
NET INCOME ATTRIBUTABLE TO IPG PHOTONICS CORPORATION PER SHARE:
|
|||||||||||
|
Basic
|
$
|
3.85
|
|
$
|
3.02
|
|
$
|
2.87
|
|
||
|
Diluted
|
$
|
3.79
|
|
$
|
2.97
|
|
$
|
2.81
|
|
||
|
WEIGHTED AVERAGE SHARES OUTSTANDING:
|
|||||||||||
|
Basic
|
52,104
|
|
51,548
|
|
50,477
|
|
|||||
|
Diluted
|
52,824
|
|
52,375
|
|
51,536
|
|
|||||
See notes to consolidated financial statements.
F-
4
IPG PHOTONICS CORPORATION
CONSOLIDATED STATEMENTS OF COMPREHENSIVE INCOME
|
|
Year Ended December 31,
|
||||||||||
|
|
2014
|
2013
|
2012
|
||||||||
|
|
(In thousands)
|
||||||||||
|
Net income
|
$
|
200,445
|
|
$
|
155,780
|
|
$
|
147,744
|
|
||
|
Other comprehensive (loss) income, net of tax:
|
|||||||||||
|
Translation adjustments
|
(110,734
|
)
|
1,125
|
|
11,225
|
|
|||||
|
Unrealized gain on derivatives
|
172
|
|
268
|
|
241
|
|
|||||
|
Total other comprehensive (loss) income
|
(110,562
|
)
|
1,393
|
|
11,466
|
|
|||||
|
Comprehensive income
|
89,883
|
|
157,173
|
|
159,210
|
|
|||||
|
Comprehensive income attributable to noncontrolling interest & redeemable noncontrolling interest
|
—
|
|
—
|
|
1,908
|
|
|||||
|
Comprehensive income attributable to IPG Photonics Corporation
|
$
|
89,883
|
|
$
|
157,173
|
|
$
|
157,302
|
|
||
See notes to consolidated financial statements.
F-
5
IPG PHOTONICS CORPORATION
CONSOLIDATED STATEMENTS OF EQUITY
|
|
Year Ended December 31,
|
|||||||||||||||||||
|
|
2014
|
2013
|
2012
|
|||||||||||||||||
|
|
(In thousands, except share and per share data)
|
|||||||||||||||||||
|
|
Shares
|
Amount
|
Shares
|
Amount
|
Shares
|
Amount
|
||||||||||||||
|
COMMON STOCK
|
||||||||||||||||||||
|
Balance, beginning of year
|
51,930,978
|
|
$
|
5
|
|
51,359,247
|
|
$
|
5
|
|
47,616,115
|
|
5
|
|
||||||
|
Exercise of stock options
|
402,647
|
|
—
|
|
540,232
|
|
—
|
|
456,919
|
|
—
|
|
||||||||
|
Common stock issued under employee stock purchase plan
|
36,063
|
|
—
|
|
31,499
|
|
—
|
|
36,213
|
|
—
|
|
||||||||
|
Common stock issued in a public offering
|
—
|
|
—
|
|
—
|
|
—
|
|
3,250,000
|
|
—
|
|
||||||||
|
Balance, end of period
|
52,369,688
|
|
5
|
|
51,930,978
|
|
5
|
|
51,359,247
|
|
5
|
|
||||||||
|
ADDITIONAL PAID-IN CAPITAL
|
||||||||||||||||||||
|
Balance, beginning of year
|
538,908
|
|
511,039
|
|
332,585
|
|
||||||||||||||
|
Stock-based compensation
|
15,172
|
|
11,720
|
|
8,565
|
|
||||||||||||||
|
Exercise of stock options and related tax benefit from exercise
|
11,428
|
|
14,523
|
|
8,954
|
|
||||||||||||||
|
Common stock issued under employee stock purchase plan
|
2,109
|
|
1,626
|
|
1,205
|
|
||||||||||||||
|
Purchase of redeemable noncontrolling interests ("NCI")
|
—
|
|
—
|
|
(7,794
|
)
|
||||||||||||||
|
Common stock issued in follow-on public offering
|
—
|
|
—
|
|
167,928
|
|
||||||||||||||
|
Premium on purchase of redeemable NCI
|
—
|
|
—
|
|
(404
|
)
|
||||||||||||||
|
Balance, end of period
|
567,617
|
|
538,908
|
|
511,039
|
|
||||||||||||||
|
RETAINED EARNINGS
|
||||||||||||||||||||
|
Balance, beginning of year
|
390,757
|
|
234,977
|
|
122,833
|
|
||||||||||||||
|
Net income attributable to IPG Photonics Corporation
|
200,445
|
|
155,780
|
|
145,004
|
|
||||||||||||||
|
Adjustments to redemption value of redeemable NCI
|
—
|
|
—
|
|
493
|
|
||||||||||||||
|
Dividend to shareholders
|
—
|
|
—
|
|
(33,353
|
)
|
||||||||||||||
|
Balance, end of period
|
591,202
|
|
390,757
|
|
234,977
|
|
||||||||||||||
|
ACCUMULATED OTHER COMPREHENSIVE LOSS
|
||||||||||||||||||||
|
Balance, beginning of year
|
(1,701
|
)
|
(3,094
|
)
|
(12,100
|
)
|
||||||||||||||
|
Translation adjustments
|
(110,734
|
)
|
1,125
|
|
11,225
|
|
||||||||||||||
|
Unrealized gain on derivatives, net of tax
|
172
|
|
268
|
|
241
|
|
||||||||||||||
|
Purchase of redeemable NCI
|
—
|
|
—
|
|
(3,292
|
)
|
||||||||||||||
|
Attribution to redeemable NCI
|
—
|
|
—
|
|
832
|
|
||||||||||||||
|
Balance, end of period
|
(112,263
|
)
|
(1,701
|
)
|
(3,094
|
)
|
||||||||||||||
|
TOTAL IPG PHOTONICS CORPORATION STOCKHOLDERS' EQUITY
|
1,046,561
|
|
927,969
|
|
742,927
|
|
||||||||||||||
|
NONCONTROLLING INTERESTS
|
||||||||||||||||||||
|
Balance, beginning of year
|
—
|
|
—
|
|
287
|
|
||||||||||||||
|
Sale of redeemable NCI
|
—
|
|
—
|
|
(700
|
)
|
||||||||||||||
|
Other comprehensive income attributable to redeemable NCI
|
—
|
|
—
|
|
9
|
|
||||||||||||||
|
Premium on purchase of redeemable NCI
|
—
|
|
—
|
|
404
|
|
||||||||||||||
|
Balance, end of period
|
—
|
|
—
|
|
—
|
|
||||||||||||||
|
TOTAL STOCKHOLDERS' EQUITY
|
$
|
1,046,561
|
|
$
|
927,969
|
|
$
|
742,927
|
|
|||||||||||
See notes to consolidated financial statements.
F-
6
IPG PHOTONICS CORPORATION
|
|
Year Ended December 31,
|
||||||||||
|
|
2014
|
2013
|
2012
|
||||||||
|
|
(In thousands)
|
||||||||||
|
CASH FLOWS FROM OPERATING ACTIVITIES:
|
|||||||||||
|
Net income
|
$
|
200,445
|
|
$
|
155,780
|
|
$
|
147,744
|
|
||
|
Adjustments to reconcile net income to net cash provided by operating activities:
|
|||||||||||
|
Depreciation and amortization
|
35,612
|
|
31,524
|
|
26,144
|
|
|||||
|
Deferred income taxes
|
(1,486
|
)
|
(6,168
|
)
|
5,546
|
|
|||||
|
Stock-based compensation
|
15,172
|
|
11,720
|
|
8,565
|
|
|||||
|
(Gains) losses on unrealized foreign currency transactions
|
(3,497
|
)
|
(235
|
)
|
1,250
|
|
|||||
|
Other
|
459
|
|
62
|
|
(19
|
)
|
|||||
|
Provisions for inventory, warranty & bad debt
|
28,036
|
|
29,975
|
|
19,967
|
|
|||||
|
Changes in assets and liabilities that (used) provided cash:
|
|||||||||||
|
Accounts receivable
|
(48,518
|
)
|
(9,991
|
)
|
(22,706
|
)
|
|||||
|
Inventories
|
(42,246
|
)
|
(50,355
|
)
|
(22,975
|
)
|
|||||
|
Prepaid expenses and other current assets
|
(5,351
|
)
|
(3,980
|
)
|
(899
|
)
|
|||||
|
Accounts payable
|
3,262
|
|
974
|
|
4,375
|
|
|||||
|
Accrued expenses and other liabilities
|
(1,567
|
)
|
(281
|
)
|
(8,155
|
)
|
|||||
|
Income and other taxes payable
|
5,763
|
|
(30,784
|
)
|
21,118
|
|
|||||
|
Tax benefit from exercise of employee stock options
|
(5,979
|
)
|
(8,874
|
)
|
(4,679
|
)
|
|||||
|
Net cash provided by operating activities
|
180,105
|
|
119,367
|
|
175,276
|
|
|||||
|
CASH FLOWS FROM INVESTING ACTIVITIES:
|
|||||||||||
|
Purchases of property, plant and equipment
|
(88,601
|
)
|
(70,919
|
)
|
(68,184
|
)
|
|||||
|
Purchase of intangible assets
|
(2,000
|
)
|
—
|
|
—
|
|
|||||
|
Proceeds from sales of property, plant and equipment
|
434
|
|
236
|
|
—
|
|
|||||
|
Proceeds from sale of investment
|
—
|
|
495
|
|
—
|
|
|||||
|
Proceeds from short-term investments
|
—
|
|
—
|
|
25,451
|
|
|||||
|
Acquisition of businesses
|
—
|
|
(5,555
|
)
|
(11,596
|
)
|
|||||
|
Other
|
87
|
|
(143
|
)
|
(928
|
)
|
|||||
|
Net cash used in investing activities
|
(90,080
|
)
|
(75,886
|
)
|
(55,257
|
)
|
|||||
|
CASH FLOWS FROM FINANCING ACTIVITIES:
|
|||||||||||
|
Proceeds from line-of-credit facilities
|
33,282
|
|
16,843
|
|
12,760
|
|
|||||
|
Payments on line-of-credit facilities
|
(33,623
|
)
|
(15,990
|
)
|
(17,190
|
)
|
|||||
|
Purchase of noncontrolling interests
|
—
|
|
—
|
|
(700
|
)
|
|||||
|
Purchase of redeemable noncontrolling interests
|
—
|
|
—
|
|
(55,400
|
)
|
|||||
|
Principal payments on long-term borrowings
|
(1,667
|
)
|
(2,853
|
)
|
(2,117
|
)
|
|||||
|
Exercise of employee stock options and issuances under employee stock purchase plan
|
7,558
|
|
7,275
|
|
5,480
|
|
|||||
|
Tax benefit from exercise of employee stock options
|
5,979
|
|
8,874
|
|
4,679
|
|
|||||
|
Proceeds from follow-on public offering, net of offering expenses
|
—
|
|
—
|
|
167,928
|
|
|||||
|
Distributions to shareholders
|
—
|
|
—
|
|
(33,353
|
)
|
|||||
|
Net cash provided by financing activities
|
11,529
|
|
14,149
|
|
82,087
|
|
|||||
|
EFFECT OF CHANGES IN EXCHANGE RATES ON CASH AND CASH EQUIVALENTS
|
(28,180
|
)
|
7,093
|
|
1,713
|
|
|||||
|
NET INCREASE IN CASH AND CASH EQUIVALENTS
|
73,374
|
|
64,723
|
|
203,819
|
|
|||||
|
CASH AND CASH EQUIVALENTS — Beginning of period
|
448,776
|
|
384,053
|
|
180,234
|
|
|||||
|
CASH AND CASH EQUIVALENTS — End of period
|
$
|
522,150
|
|
$
|
448,776
|
|
$
|
384,053
|
|
||
|
SUPPLEMENTAL DISCLOSURES OF CASH FLOW INFORMATION:
|
|||||||||||
|
Cash paid for interest
|
$
|
253
|
|
$
|
208
|
|
$
|
864
|
|
||
|
Cash paid for income taxes
|
$
|
73,544
|
|
$
|
89,611
|
|
$
|
25,980
|
|
||
|
Non-cash transactions:
|
|||||||||||
|
Demonstration units transferred from inventory to other assets
|
$
|
3,528
|
|
$
|
3,927
|
|
$
|
2,631
|
|
||
|
Property, plant and equipment transferred from inventory
|
$
|
1,551
|
|
$
|
—
|
|
$
|
—
|
|
||
|
Additions to property, plant and equipment included in accounts payable
|
$
|
1,084
|
|
$
|
2,132
|
|
$
|
2,071
|
|
||
|
Property purchase financed with debt
|
$
|
22,000
|
|
$
|
—
|
|
$
|
—
|
|
||
|
Gain on sale of property, plant and equipment offset by related notes
|
$
|
—
|
|
$
|
—
|
|
$
|
322
|
|
||
F-
7
IPG PHOTONICS CORPORATION
NOTES TO CONSOLIDATED FINANCIAL STATEMENTS
(In thousands, except share and per share data)
1. NATURE OF BUSINESS AND SUMMARY OF SIGNIFICANT ACCOUNTING POLICIES
Nature of Business
— IPG Photonics Corporation (the "Company") is the leading developer and manufacturer of a broad line of high-performance fiber lasers, fiber amplifiers and diode lasers that are used for diverse applications, primarily in materials processing. Its world headquarters are located in Oxford, Massachusetts. It also has facilities and sales offices elsewhere in the United States, Europe and Asia.
Principles of Consolidation
— The Company was incorporated as a Delaware corporation in December 1998. The accompanying financial statements include the accounts of the Company and its majority-owned subsidiaries. All intercompany accounts and transactions have been eliminated.
Use of Estimates
— The preparation of financial statements in conformity with accounting principles generally accepted in the United States of America requires management to make estimates and assumptions that affect the reported amounts of assets and liabilities, disclosure of contingent assets and liabilities at the date of the financial statements and the reported amounts of revenue and expenses during the reporting period. The Company bases its estimates on historical experience and on various other assumptions that are believed to be reasonable under the circumstances. Actual results could differ from those estimates.
Foreign Currency
— The financial information for entities outside the United States is measured using local currencies as the functional currency. Assets and liabilities are translated into U.S. dollars at the exchange rate in effect on the respective balance sheet dates. Income and expenses are translated into U.S. dollars based on the average rate of exchange for the corresponding period. Exchange rate differences resulting from translation adjustments are accounted for directly as a component of accumulated other comprehensive loss.
Cash and Cash Equivalents
— Cash and cash equivalents consist primarily of highly liquid investments, such as bank deposits, marketable securities with original maturities of three months or less with insignificant interest rate risk and marketable securities with remaining maturities of three months or less at the date of acquisition.
Inventories
— Inventories are stated at the lower of cost or market on a first-in, first-out basis. Inventories include parts and components that may be specialized in nature and subject to rapid obsolescence. The Company periodically reviews the quantities and carrying values of inventories to assess whether the inventories are recoverable. Because of the Company's vertical integration, a significant or sudden decrease in sales activity could result in a significant change in the estimates of excess or obsolete inventory valuation. The costs associated with provisions for excess quantities, technological obsolescence, or component rejections are charged to cost of sales as incurred.
Property, Plant and Equipment
— Property, plant and equipment are stated at cost, less accumulated depreciation. Depreciation is determined using the straight-line method based on the estimated useful lives of the related assets. In the case of leasehold improvements, the estimated useful lives of the related assets do not exceed the remaining terms of the corresponding leases. The following table presents the assigned economic useful lives of property, plant and equipment:
|
Category
|
|
Economic
Useful Life
|
|
|
|
Buildings
|
|
30 years
|
|
|
|
Machinery and equipment
|
|
5-12 years
|
|
|
|
Office furniture and fixtures
|
|
3-5 years
|
|
|
Expenditures for maintenance and repairs are charged to operations. Interest expense associated with significant capital projects is capitalized as a cost of the project. The Company capitalized
$383
,
$524
and
$142
of interest expense in
2014
,
2013
and
2012
, respectively.
Long-Lived Assets
— Long-lived assets, which consist primarily of property, plant and equipment, are reviewed by management for impairment whenever events or changes in circumstances indicate that the carrying amount may not be recoverable. In cases in which undiscounted expected future cash flows are less than the carrying value, an impairment loss is recorded equal to the amount by which the carrying value exceeds the fair value of assets. No impairment losses have been recorded during the periods presented.
Included in other long-term assets is certain demonstration equipment. The demonstration equipment is amortized over the respective estimated economic lives, generally
3 years
. The carrying value of the demonstration equipment totaled
$3,612
and
F-
8
IPG PHOTONICS CORPORATION
NOTES TO CONSOLIDATED FINANCIAL STATEMENTS - (Continued)
(In thousands, except share and per share data)
$5,524
at
December 31, 2014
and
2013
, respectively. Amortization expense of demonstration equipment for the years ended
December 31, 2014
,
2013
and
2012
, was
$2,068
,
$2,725
and
$2,797
, respectively.
Goodwill —
Goodwill is the amount by which the cost of the acquired net assets in a business acquisition exceeded the fair values of the net identifiable assets on the date of purchase. Goodwill is not amortized which is in accordance with the requirements of Financial Accounting Standards Board ("FASB")
Accounting Standards Codification
("ASC") 350,
Intangibles-Goodwill and Other
("FASB ASC 350"). Goodwill is assessed for impairment at least annually, on a reporting unit basis, or more frequently when events and circumstances occur indicating that the recorded goodwill may be impaired. If the book value of a reporting unit exceeds its fair value, the implied fair value of goodwill is compared with the carrying amount of goodwill. If the carrying amount of goodwill exceeds the implied fair value, an impairment loss is recorded in an amount equal to that excess. As more fully described in Note 13, the Company incurred an impairment loss of
$2,803
in
2013
, which is included in other income (expense) in the accompanying consolidated statements of income.
Intangible Assets
— Intangible assets result from the Company's various business acquisitions. Intangible assets are reported at cost, net of accumulated amortization, and are amortized on a straight-line basis either over their estimated useful lives of
five
to
ten years
or over the period the economic benefits of the intangible asset are consumed.
Revenue Recognition
— The Company recognizes revenue in accordance with FASB ASC 605. Revenue from orders with multiple deliverables is divided into separate units of accounting when certain criteria are met. These separate units generally consist of equipment and installation. The consideration for the arrangement is allocated to the separate units of accounting based on their relative selling prices. The selling price of equipment is based on vendor-specific objective evidence and the selling price of installation is based on third-party evidence. Applicable revenue recognition criteria are applied separately for each separate unit of accounting. Revenue for laser and amplifier sources generally is recognized upon the transfer of ownership which is typically at the time of shipment. Installation revenue is recognized upon completion of the installation service which typically occurs within
30
to
90
days of delivery. For laser systems, which may carry customer specific processing requirements, revenue is recognized at the latter of customer acceptance date or shipment date if the customer acceptance is made prior to shipment. Returns and customer credits are infrequent and are recorded as a reduction to revenue. Rights of return generally are not included in sales arrangements.
Accounts Receivable and Allowance for Doubtful Accounts
— Accounts Receivable include
$25,150
and
$17,679
of bank acceptance drafts at December 31,
2014
and
2013
, respectively. Bank acceptance drafts are bank guarantees of payment on specified dates. The maturity of these bank acceptance drafts is less than
90
days. The Company maintains an allowance for doubtful accounts to provide for the estimated amount of accounts receivable that will not be collected. The allowance is based upon an assessment of customer creditworthiness, historical payment experience and the age of outstanding receivables.
Activity related to the allowance for doubtful accounts was as follows:
|
2014
|
2013
|
2012
|
||||||||||
|
Balance at January 1
|
$
|
2,473
|
|
$
|
2,173
|
|
$
|
1,605
|
|
|||
|
Provision for bad debts, net of recoveries
|
579
|
|
323
|
|
642
|
|
||||||
|
Uncollectable accounts written off
|
(617
|
)
|
(31
|
)
|
(170
|
)
|
||||||
|
Foreign currency translation
|
(545
|
)
|
8
|
|
96
|
|
||||||
|
Balance at December 31
|
$
|
1,890
|
|
$
|
2,473
|
|
$
|
2,173
|
|
|||
Warranties
— The Company typically provides
one
to
three
-year parts and service warranties on lasers and amplifiers. Most of the Company's sales offices provide support to customers in their respective geographic areas. The Company estimates the warranty accrual considering past claims experience, the number of units still covered by warranty and the average life of the remaining warranty period. The warranty accrual has generally been sufficient to cover product warranty repair and replacement costs.
F-
9
IPG PHOTONICS CORPORATION
NOTES TO CONSOLIDATED FINANCIAL STATEMENTS - (Continued)
(In thousands, except share and per share data)
Activity related to the warranty accrual was as follows:
|
2014
|
2013
|
2012
|
||||||||||
|
Balance at January 1
|
$
|
14,997
|
|
$
|
10,714
|
|
$
|
8,631
|
|
|||
|
Provision for warranty accrual
|
15,449
|
|
11,363
|
|
8,112
|
|
||||||
|
Warranty claims
|
(9,165
|
)
|
(7,405
|
)
|
(6,542
|
)
|
||||||
|
Foreign currency translation and other
|
(2,009
|
)
|
325
|
|
513
|
|
||||||
|
Balance at December 31
|
$
|
19,272
|
|
$
|
14,997
|
|
$
|
10,714
|
|
|||
Accrued warranty reported in the accompanying consolidated financial statements as of
December 31, 2014
and
December 31, 2013
consists of
$9,489
and
$7,724
in accrued expenses and other liabilities and
$9,783
and
$7,273
in other long-term liabilities, respectively.
Advertising Expense
— The cost of advertising is expensed as incurred. The Company conducts substantially all of its sales and marketing efforts through trade shows, professional and technical conferences, direct sales and our website. The Company's advertising costs were not material for the periods presented.
Research and Development
— Research and development costs are expensed as incurred.
Income Taxes
— Deferred tax assets and liabilities are recognized for the future tax consequences of temporary differences between the financial statement carrying amounts and tax basis of assets and liabilities and net operating loss carryforwards and credits using enacted rates in effect when those differences are expected to reverse. Valuation allowances are provided against deferred tax assets that are not deemed to be recoverable. The Company recognizes tax positions that are more likely than not to be sustained upon examination by relevant tax authorities. The tax positions are measured at the greatest amount of tax benefit that is more than
50 percent
likely to be realized upon ultimate settlement.
The Company provides reserves for potential payments of tax to various tax authorities related to uncertain tax positions and other issues. The reserves are based on a determination of whether and how much of a tax benefit taken by it in its tax filings or positions is more likely than not to be realized following resolution of uncertainties related to the tax benefit, assuming that the matter in question will be raised by the tax authorities.
Concentration of Credit Risk
— Financial instruments that potentially subject the Company to credit risk consist primarily of cash and cash equivalents, auction rate securities and accounts receivable. The Company maintains substantially all of its cash and marketable securities in
six
financial institutions, which it believes to be high-credit quality financial institutions. The Company grants credit to customers in the ordinary course of business and provide a reserve for potential credit losses. Such losses historically have been within management's expectations (see discussion related to significant customers in Note 15).
Fair Value of Financial Instruments
— The Company's financial instruments consist of cash equivalents, accounts receivable, auction rate securities, accounts payable, drawings on revolving lines of credit, long-term debt, certain derivative instruments and contingent consideration.
The valuation techniques used to measure fair value are based upon observable and unobservable inputs. Observable inputs reflect market data obtained from independent sources, while unobservable inputs reflect internal market assumptions. These two types of inputs create the following fair value hierarchy: Level 1, defined as observable inputs such as quoted prices for identical instruments in active markets; Level 2, defined as inputs other than quoted prices in active markets that are either directly or indirectly observable; and Level 3, defined as unobservable inputs for which little or no market data exists, therefore requiring an entity to develop its own assumptions.
The carrying amounts of cash equivalents, accounts receivable, accounts payable and drawings on revolving lines of credit are considered reasonable estimates of their fair market value, due to the short maturity of these instruments or as a result of the competitive market interest rates, which have been negotiated.
F-
10
IPG PHOTONICS CORPORATION
NOTES TO CONSOLIDATED FINANCIAL STATEMENTS - (Continued)
(In thousands, except share and per share data)
The following table presents information about the Company's assets and liabilities measured at fair value:
|
Fair Value Measurements at December 31, 2014
|
|||||||||||||||
|
|
Total
|
Level 1
|
Level 2
|
Level 3
|
|||||||||||
|
Assets
|
|||||||||||||||
|
Cash equivalents
|
$
|
266,011
|
|
$
|
266,011
|
|
$
|
—
|
|
$
|
—
|
|
|||
|
Auction rate securities
|
1,128
|
|
—
|
|
—
|
|
1,128
|
|
|||||||
|
Total assets
|
$
|
267,139
|
|
$
|
266,011
|
|
$
|
—
|
|
$
|
1,128
|
|
|||
|
Liabilities
|
|||||||||||||||
|
Contingent purchase consideration
|
$
|
98
|
|
$
|
—
|
|
$
|
—
|
|
$
|
98
|
|
|||
|
Interest rate swap
|
151
|
|
—
|
|
151
|
|
—
|
|
|||||||
|
Total liabilities
|
$
|
249
|
|
$
|
—
|
|
$
|
151
|
|
$
|
98
|
|
|||
|
|
|
Fair Value Measurements at December 31, 2013
|
|||||||||||||
|
|
|
||||||||||||||
|
|
Total
|
Level 1
|
Level 2
|
Level 3
|
|||||||||||
|
Assets
|
|||||||||||||||
|
Cash equivalents
|
$
|
240,159
|
|
$
|
240,159
|
|
$
|
—
|
|
$
|
—
|
|
|||
|
Auction rate securities
|
1,120
|
|
—
|
|
—
|
|
1,120
|
|
|||||||
|
Total assets
|
$
|
241,279
|
|
$
|
240,159
|
|
$
|
—
|
|
$
|
1,120
|
|
|||
|
Liabilities
|
|||||||||||||||
|
Contingent purchase consideration
|
$
|
375
|
|
$
|
—
|
|
$
|
—
|
|
$
|
375
|
|
|||
|
Interest rate swap
|
423
|
|
—
|
|
423
|
|
—
|
|
|||||||
|
Total liabilities
|
$
|
798
|
|
$
|
—
|
|
$
|
423
|
|
$
|
375
|
|
|||
Auction rate securities and contingent consideration are measured at fair value on a recurring basis using significant unobservable inputs (Level 3). The fair value of the auction rate securities was determined using prices observed in inactive secondary markets for the securities held by the Company. The auction rate securities are considered available-for-sale securities. They had a cost basis of
$1,450
at
December 31, 2014
and
December 31, 2013
.
The interest rate swap is designated as a cash flow hedge, the fair value of which was estimated based on quoted market prices or pricing models using current market rates. Fair value at
December 31, 2014
and
December 31, 2013
for the interest rate swap considered prices observed in inactive secondary markets for the securities held by the Company.
The fair value of contingent consideration was determined using an income approach at the respective business combination dates and at the reporting date. That approach is based on significant inputs that are not observable in the market and include key assumptions such as assessing the probability of meeting certain milestones required to earn the contingent consideration. The business combinations that give rise to contingent consideration are more fully described in Note 12.
During the second quarter of 2013, the Company reduced the fair value of contingent consideration related to the Company's subsidiary, IPG Microsystems LLC's ("IPGM") acquisition of certain working capital and long-term assets from JP Sercel Associates Inc. ("JPSA") to
$0
because management assessed that there was no possibility that milestones in the earn-out agreements would be achieved. Additionally, the Company reduced other contingent consideration for other agreements by
$196
. Accordingly,
$2,659
is included in other income (expense) in the accompanying Consolidated Statements of Income in
2013
.
F-
11
IPG PHOTONICS CORPORATION
NOTES TO CONSOLIDATED FINANCIAL STATEMENTS - (Continued)
(In thousands, except share and per share data)
The following table presents information about the Company's movement in Level 3 assets and liabilities measured at fair value:
|
2014
|
2013
|
|||||||
|
Auction Rate Securities
|
||||||||
|
Balance, January 1
|
$
|
1,120
|
|
$
|
1,112
|
|
||
|
Change in fair value and accretion
|
8
|
|
8
|
|
||||
|
Balance, December 31
|
$
|
1,128
|
|
$
|
1,120
|
|
||
|
Contingent Purchase Consideration
|
||||||||
|
Balance, January 1
|
$
|
375
|
|
$
|
3,023
|
|
||
|
Change in fair value and currency fluctuations
|
(277
|
)
|
(2,648
|
)
|
||||
|
Balance, December 31
|
$
|
98
|
|
$
|
375
|
|
||
Comprehensive Income
— Comprehensive income includes charges and credits to equity that are not the result of transactions with stockholders. Included within comprehensive income is the cumulative foreign currency translation adjustment and unrealized gains or losses on derivatives. These adjustments are accumulated within the consolidated statements of comprehensive income.
Total components of accumulated other comprehensive loss were as follows:
|
|
December 31,
|
|||||||
|
|
2014
|
2013
|
||||||
|
Foreign currency translation adjustments
|
$
|
(112,411
|
)
|
$
|
(1,677
|
)
|
||
|
Unrealized loss on derivatives, net of tax of $67 and $168
|
(84
|
)
|
(256
|
)
|
||||
|
Change in carrying value of auction rate securities
|
232
|
|
232
|
|
||||
|
Accumulated other comprehensive loss
|
$
|
(112,263
|
)
|
$
|
(1,701
|
)
|
||
Derivative Instruments
— The Company's primary market exposures are to interest rates and foreign exchange rates. The Company uses certain derivative financial instruments to help manage these exposures. The Company executes these instruments with financial institutions it judges to be credit-worthy. The Company does not hold or issue derivative financial instruments for trading or speculative purposes.
The Company recognizes all derivative financial instruments as either assets or liabilities at fair value in the consolidated balance sheets. The Company has interest rate swaps that are classified as a cash flow hedge of its variable rate debt. The Company has
no
derivatives that are not accounted for as a hedging instrument.
Cash Flow Hedges
— The Company's cash flow hedges is an interest rate swap under which it pays fixed rates of interest.
The fair value amounts in the consolidated balance sheets were:
|
Notional Amounts
1
|
Other Assets
|
Other Current Liabilities
2
|
Deferred
Income Taxes
And Other
Long-Term
Liabilities
2
|
|||||||||||||||||||||||||||
|
December 31,
|
December 31,
|
December 31,
|
December 31,
|
|||||||||||||||||||||||||||
|
2014
|
2013
|
2014
|
2013
|
2014
|
2013
|
2014
|
2013
|
|||||||||||||||||||||||
|
$
|
11,333
|
|
$
|
12,666
|
|
$
|
—
|
|
$
|
—
|
|
$
|
151
|
|
$
|
—
|
|
$
|
—
|
|
$
|
423
|
|
|||||||
(1) Notional amounts represent the gross contract/notional amount of the derivative outstanding.
(2) As of
December 31, 2014
, the remaining balance of the U.S. long-term note outstanding is considered current because the term of the note expires in June 2015. Accordingly, the interest rate swap liability has been reclassified.
F-
12
IPG PHOTONICS CORPORATION
NOTES TO CONSOLIDATED FINANCIAL STATEMENTS - (Continued)
(In thousands, except share and per share data)
The derivative gains and losses in the consolidated statements of income for the years ended
December 31, 2014
,
2013
and
2012
, related to the Company's interest rate swap contract was as follows:
|
|
Year Ended December 31,
|
|||||||||||
|
|
2014
|
2013
|
2012
|
|||||||||
|
Effective portion recognized in other comprehensive (loss) income, pretax:
|
||||||||||||
|
Interest rate swap
|
$
|
567
|
|
$
|
881
|
|
$
|
944
|
|
|||
|
Effective portion reclassified from other comprehensive (loss) income to interest expense, pretax:
|
||||||||||||
|
Interest rate swap
|
$
|
(295
|
)
|
$
|
(449
|
)
|
$
|
(576
|
)
|
|||
|
Ineffective portion recognized in income:
|
||||||||||||
|
Interest rate swap
|
$
|
—
|
|
$
|
—
|
|
$
|
—
|
|
|||
The Company made no adjustments to the fair value of this derivative as a result of evaluating counterparty risk.
Business Segment Information
— The Company operates in
one
segment which involves the design, development, production and distribution of fiber lasers, laser systems, fiber amplifiers, and related optical components. The Company has a single, company-wide management team that administers all properties as a whole rather than as discrete operating segments. The chief decision maker, who is the Company's chief executive officer, measures financial performance as a single enterprise and not on legal entity or end market basis. Throughout the year, the chief decision maker allocates capital resources on a project-by-project basis across the Company's entire asset base to maximize profitability without regard to legal entity or end market basis. The Company operates in a number of countries throughout the world in a variety of product lines. Information regarding geographic financial information and product lines is provided in Note 15.
Earnings Per Share
— The Company computes net income per share in accordance with ASC 260-
Earnings Per Share
. Under the provisions of ASC 260, the Company is required to present basic and diluted earnings per share information separately for each class of equity instruments that participate in any income distribution with primary equity instruments. The Company calculates earnings per share in periods where a class of common stock was redeemable for other than fair value through the application of the two-class method. Until June 29, 2012, the Company had redeemable noncontrolling interests reported in the accompanying consolidated financial statements related to a
22.5%
minority interest of IPG Russia. The computation of net income per share is provided in Note 9.
Recent Accounting Pronouncements
— Accounting standards that have been issued or proposed by the FASB or other standards-setting bodies that do not require adoption until a future date are not expected to have a material impact on the Company's financial statements upon adoption.
Subsequent Events
— The Company has considered the impact of subsequent events through the filing date of these financial statements.
2. STOCK-BASED COMPENSATION
Stock-based compensation is included in the following financial statement captions:
|
|
Year Ended December 31,
|
|||||||||||
|
|
2014
|
2013
|
2012
|
|||||||||
|
Cost of sales
|
$
|
4,153
|
|
$
|
3,187
|
|
$
|
2,184
|
|
|||
|
Sales and marketing
|
1,567
|
|
1,195
|
|
1,052
|
|
||||||
|
Research and development
|
3,033
|
|
1,929
|
|
1,327
|
|
||||||
|
General and administrative
|
6,419
|
|
5,409
|
|
4,002
|
|
||||||
|
Total stock-based compensation
|
15,172
|
|
11,720
|
|
8,565
|
|
||||||
|
Tax benefit recognized
|
(4,865
|
)
|
(3,784
|
)
|
(2,629
|
)
|
||||||
|
Net stock-based compensation
|
$
|
10,307
|
|
$
|
7,936
|
|
$
|
5,936
|
|
|||
Compensation cost for all stock-based payment awards is based on the estimated grant-date fair value. The Company allocates and records stock-based compensation expense on a straight-line basis over the requisite service period.
F-
13
IPG PHOTONICS CORPORATION
NOTES TO CONSOLIDATED FINANCIAL STATEMENTS - (Continued)
(In thousands, except share and per share data)
The Company calculates the fair value of stock option grants using the Black-Scholes option pricing model. Determining the appropriate fair value model and calculating the fair value of stock-based payment awards require the use of highly subjective assumptions, including the expected life of the stock-based payment awards and stock price volatility. The assumptions used in calculating the fair value of stock-based payment awards represent management’s best estimates, but the estimates involve inherent uncertainties and the application of management judgment. As a result, if factors change and the Company uses different assumptions, its stock-based compensation expense could be materially different in the future. The weighted average assumptions used in the Black-Scholes model or the calculation of compensation were as follows for the years ended December 31.
|
2014
|
2013
|
2012
|
||||
|
Expected term
|
4.7-6.1 years
|
4.4-6.3 years
|
4.0-6.6 years
|
|||
|
Volatility
|
48%-51%
|
51%-54%
|
49%-56%
|
|||
|
Risk-free rate of return
|
1.46%-1.84%
|
0.74%-1.32%
|
0.59%-1.23%
|
|||
|
Dividend yield
|
0.25%
|
0.25%
|
—%
|
|||
|
Forfeiture rate
|
3.04%-5.86%
|
0%-5.97%
|
0%-6.1%
|
|||
Incentive Plans
— In April 2000, the Company's board of directors adopted the 2000 Incentive Compensation Plan (the "2000 Plan"), and in February 2006, the Company's board of directors adopted the 2006 Incentive Compensation Plan (the "2006 Plan"), which provide for the issuance of stock options and other stock and non-stock based awards to the Company's directors, employees, consultants and advisors. The Company reserved
5,833,333
shares under the 2000 Plan and
4,000,000
shares under the 2006 Plan for the issuance of awards under the plans. During 2011, the Company reserved an additional
6,084,273
shares under the 2006 Plan. In June 2006, the Company's board of directors adopted the Non-Employee Directors Stock Plan (the "Directors Plan"). Only non-employee directors are eligible to receive awards under the Directors Plan. The Company reserved
486,660
shares for issuance under the Directors Plan. Under the
three
plans, the Company may grant nonstatutory stock options at an exercise price at least equal to the fair value of its common stock on the date of grant, unless the board of directors or compensation committee determines otherwise on the date of grant. Incentive stock options may be granted under the 2000 Plan and the 2006 Plan at exercise prices equal to or exceeding the fair value of the common stock on the date of grant. The Company may also grant restricted stock, restricted stock units and other equity-based awards. Incentive awards generally become exercisable over periods of
one
to
five
years and expire
seven
to
ten
years from the date of the grant. The awards under the 2000 Plan and the 2006 Plan may become exercisable earlier upon the occurrence of certain change of control events at the election of the board of directors or compensation committee, and all awards under the Directors Plan automatically become exercisable upon a change of control. All shares issued under the incentive plans are registered shares newly issued by the Company. At
December 31, 2014
,
5,491,656
shares of the Company's stock were available for future grant under the
three
incentive plans.
A summary of option activity, including the employee stock purchase plan, is presented below (see Note 11 for further information):
|
Number of
Options
|
Weighted-
Average
Exercise
Price
|
Weighted-
Average
Remaining
Contractual
Life
|
Aggregate
Intrinsic
Value
|
||||||||||
|
|
|
|
(In years)
|
(In thousands)
|
|||||||||
|
Outstanding — January 1, 2014
|
2,674,897
|
|
$
|
37.63
|
|
||||||||
|
Granted
|
463,289
|
|
70.67
|
|
|||||||||
|
Exercised
|
(414,775
|
)
|
16.97
|
|
|||||||||
|
Forfeited
|
(31,535
|
)
|
62.94
|
|
|||||||||
|
Outstanding — December 31, 2014
|
2,691,876
|
|
$
|
45.48
|
|
6.62
|
$
|
88,500
|
|
||||
|
Vested or expected to vest — December 31, 2014
|
2,554,160
|
|
$
|
44.58
|
|
6.53
|
$
|
85,697
|
|
||||
|
Exercisable — December 31, 2014
|
1,027,303
|
|
$
|
24.29
|
|
4.83
|
$
|
52,018
|
|
||||
The intrinsic value of the options exercised during the years ended
December 31, 2014
,
2013
and
2012
, was
$23,491
,
$30,063
and
$20,792
, respectively.
The weighted-average grant fair value per share for options granted during the years ended
December 31, 2014
,
2013
and
2012
, was
$39.12
,
$28.28
and
$26.80
, respectively.
F-
14
IPG PHOTONICS CORPORATION
NOTES TO CONSOLIDATED FINANCIAL STATEMENTS - (Continued)
(In thousands, except share and per share data)
The total compensation cost related to nonvested awards not yet recorded at
December 31, 2014
was
$27,310
which is expected to be recognized over a weighted average of
2.4
years.
The aggregate fair value of awards vested during the year ended
December 31, 2014
was
$7,076
.
3. INVENTORIES
Inventories consist of the following:
|
December 31,
|
|||||||
|
|
2014
|
2013
|
|||||
|
Components and raw materials
|
$
|
54,925
|
|
$
|
54,539
|
|
|
|
Work-in-process
|
58,603
|
|
64,927
|
|
|||
|
Finished goods
|
57,481
|
|
53,234
|
|
|||
|
Total
|
$
|
171,009
|
|
$
|
172,700
|
|
|
The Company recorded inventory provisions totaling
$11,302
,
$15,128
and
$8,232
for the
years ended December 31, 2014
,
2013
and
2012
, respectively. These provisions relate to the recoverability of the value of inventories due to technological changes and excess quantities. These provisions are reported as a reduction to components and raw materials and finished goods.
4. PROPERTY, PLANT AND EQUIPMENT
Property, plant, and equipment consist of the following:
|
|
December 31,
|
|||||||
|
|
2014
|
2013
|
||||||
|
Land
|
$
|
19,248
|
|
$
|
15,448
|
|
||
|
Buildings
|
144,629
|
|
146,730
|
|
||||
|
Machinery and equipment
|
202,075
|
|
165,050
|
|
||||
|
Office furniture and fixtures
|
25,816
|
|
23,589
|
|
||||
|
Construction-in-progress
|
47,285
|
|
52,911
|
|
||||
|
Total property, plant and equipment
|
439,053
|
|
403,728
|
|
||||
|
Accumulated depreciation
|
(163,971
|
)
|
(151,483
|
)
|
||||
|
Total property, plant and equipment — net
|
$
|
275,082
|
|
$
|
252,245
|
|
||
The Company recorded depreciation expense of
$31,334
,
$26,489
and
$21,108
for the
years ended December 31, 2014
,
2013
and
2012
, respectively.
5. ACCRUED EXPENSES AND OTHER LIABLILITES
Accrued expenses and other liabilities consist of the following:
|
December 31,
|
|||||||
|
|
2014
|
2013
|
|||||
|
Accrued compensation
|
$
|
31,673
|
|
$
|
25,727
|
|
|
|
Customer deposits and deferred revenue
|
16,605
|
|
18,489
|
|
|||
|
Current portion of accrued warranty
|
9,489
|
|
7,724
|
|
|||
|
Other
|
6,290
|
|
7,396
|
|
|||
|
Total
|
$
|
64,057
|
|
$
|
59,336
|
|
|
6. FINANCING ARRANGEMENTS
The Company's borrowings under existing financing arrangements consist of the following:
F-
15
IPG PHOTONICS CORPORATION
NOTES TO CONSOLIDATED FINANCIAL STATEMENTS - (Continued)
(In thousands, except share and per share data)
|
December 31,
|
|||||||
|
|
2014
|
2013
|
|||||
|
Revolving line of credit facilities:
|
|||||||
|
European overdraft facilities
|
$
|
828
|
|
$
|
1,038
|
|
|
|
Euro line of credit
|
1,803
|
|
2,258
|
|
|||
|
Total
|
$
|
2,631
|
|
$
|
3,296
|
|
|
|
Term debt:
|
|||||||
|
U.S. long-term note
|
$
|
11,333
|
|
$
|
12,666
|
|
|
|
Collateralized long-term note
|
21,667
|
|
—
|
|
|||
|
Less: current portion
|
(13,333
|
)
|
(1,333
|
)
|
|||
|
Total long-term debt
|
$
|
19,667
|
|
$
|
11,333
|
|
|
The U.S. and Euro lines of credit are available to certain foreign subsidiaries and allow for borrowings in the local currencies of those subsidiaries.
Revolving Line of Credit Facilities:
U.S. Line of Credit
— The Company maintains an unsecured revolving line of credit with available principal of up to
$35,000
, expiring in June 2015. The line of credit bears interest at a variable rate of LIBOR plus
1.125%
to
1.625%
depending on the Company's financial performance.
$14,100
of this credit facility is available to the Company's foreign subsidiaries including those in India, China, Japan and South Korea. At
December 31, 2014
, there were no drawings, however there were
$87
of guarantees issued against the line which reduced the total availability. At
December 31, 2014
, the remaining availability under the U.S. Line of Credit totaled
$34,913
.
Euro Line of Credit —
The Company maintains an unsecured revolving line of credit with a principal amount of Euro
30,000
(
$36,466
at
December 31, 2014
), expiring in July 2017. The line of credit bears interest at various rates based upon the type of loan.
$19,448
is available to the Company's Russian subsidiary,
$9,724
of this credit facility is available to the Company's German subsidiary,
$3,647
is available to the Company's Chinese subsidiary and
$3,647
is available to the Company's Italian subsidiary. Total drawings at
December 31, 2014
were
$1,803
with an interest rate of
1.0%
and there were
$4,309
of guarantees issued against the line which also reduced the total availability. At
December 31, 2014
, the remaining availability under this line was
$30,354
.
Euro Overdraft Facilities
— The Company maintains a syndicated overdraft facility with available principal of Euro
500
(
$608
at
December 31, 2014
) with no expiration date. This facility bears interest at market rates that vary depending upon the bank within the syndicate that advances the principal outstanding. At
December 31, 2014
, total drawings were
$395
with an interest rate of
1.0%
. The aggregate remaining availability under this line was
$213
.
Other European Facilities
— The Company maintains
two
Euro credit lines in Italy with aggregate available principal of Euro
1,500
(
$1,823
as of
December 31, 2014
) which bear interest at
1.0%
and expire in June and September 2015. Total drawings at
December 31, 2014
were
$433
. At
December 31, 2014
, the aggregate remaining availability under these lines was
$1,390
. These facilities are collateralized by a common pool of the assets of the Company's Italian subsidiary.
U.S. Long-Term Note
— The Company has an outstanding promissory note which bears interest at LIBOR plus
0.9%
to
1.3%
, depending on certain financial ratios and requires monthly principal payments of
$111
and interest through June 2015, at which time the remaining principal is payable. The Company entered into an interest rate swap instrument which converted the variable LIBOR rate on the original term note to a fixed rate of
5.0%
per annum. For the term from August 2013 to June 2015, the Company entered into a separate interest rate swap instrument which converts the variable LIBOR rate to a fixed rate of
2.57%
per annum. Changes in the fair value of the swap is included in accumulated other comprehensive loss on the consolidated balance sheets. The unrealized loss on the swap will be recognized into income over the term of the swap as a charge to interest expense.
The Company is required to meet certain financial covenants associated with its U.S. line of credit and its original U.S. long-term note. These covenants, tested quarterly, include a debt service coverage ratio and a funded debt to earnings before interest, taxes, depreciation and amortization ("EBITDA") ratio. The debt service coverage covenant requires it to maintain a
F-
16
IPG PHOTONICS CORPORATION
NOTES TO CONSOLIDATED FINANCIAL STATEMENTS - (Continued)
(In thousands, except share and per share data)
trailing twelve month ratio of cash flow to debt service that is greater than
1.5
:1. Debt service is defined as required principal and interest payments during the period. Cash flow is defined as EBITDA less unfunded capital expenditures. The funded debt to EBITDA covenant requires that the sum of all indebtedness for borrowed money on a consolidated basis be less than two times the Company's trailing twelve months EBITDA.
As of
December 31, 2014
, the remaining balance of
$11,333
related to the original U.S. long-term note outstanding is considered current because the term of the note expires in June 2015.
Collateralized Long-Term Note
—In October 2014, the Company entered into a collateralized long-term note to finance the purchase of the Company's aircraft which bears a fixed interest rate of
2.81%
per annum. The note requires monthly principal payments of
$167
and interest through October 2019, at which time the remaining principal is payable. As of
December 31, 2014
, the note has a remaining balance of
$21,667
.
7. REDEEMABLE NONCONTROLLING INTERESTS AND STOCKHOLDERS' EQUITY
Redeemable Noncontrolling Interests —
Redeemable noncontrolling interests reported in the accompanying consolidated financial statements related to a
22.5%
minority interest of IPG Russia that was redeemed on June 29, 2012. The associated net income attributable to noncontrolling interest in 2012 was
$2,740
.
Authorized Capital
— The Company has authorized capital stock consisting of
175,000,000
shares of common stock, par value
$0.0001
per share, and
5,000,000
shares of preferred stock, par value
$0.0001
per share. There are
no
shares of preferred stock outstanding as of
December 31, 2014
.
8. RELATED-PARTY TRANSACTIONS
In
2014
and
2013
, the Company purchased various parts and services from a company with which
one
of the Company's independent directors is an executive officer. The payments made for such services for
2014
and
2013
totaled
$3,687
and
$130
, respectively. There were
no
amounts due to this company at
December 31, 2014
, however, the Company had an amount of
$1,155
in Accounts Payable due to this company at
December 31, 2013
.
The Company leased from an unrelated third party approximately
12,000
square feet of office space in Marlborough, Massachusetts under an office lease expiring November 2017. A subsidiary of IP Fibre Devices (UK) Ltd. ("IPFD") purchased the building in October 2014 and acquired the lease. The Company's CEO is the managing director of IPFD, and IPFD is a stockholder of the Company. The
2014
year-end annual lease rate was
$232
with annual increase of approximately
2.5%
per year. The Company reimburses the landlord for its portion of certain operational costs. The Company paid IPFD
$20
under the office lease.
The CEO leases the right to use
25%
of the Company's aircraft annually under a October 2014 lease expiring November 2019. The 2014 year-end annual lease rate was
$684
and future rent payments will be adjusted annually. The CEO also pays direct and incidental operating costs for his private use including pilot fees. The CEO paid the Company
$146
in
2014
under the aircraft lease.
In
2014
, the Company sold products and services of
$2,731
to OAO "RCE" Laser Processing Center ("Laser Center"), an application development and parts processing company. The Company's CEO owns approximately
39%
of Laser Center, which he acquired from an unrelated third party in 2014.
F-
17
IPG PHOTONICS CORPORATION
NOTES TO CONSOLIDATED FINANCIAL STATEMENTS - (Continued)
(In thousands, except share and per share data)
9. NET INCOME ATTRIBUTABLE TO IPG PHOTONICS CORPORATION PER SHARE
The following table sets forth the computation of diluted net income attributable to IPG Photonics Corporation per share:
|
Year Ended December 31,
|
|||||||||||
|
|
2014
|
2013
|
2012
|
||||||||
|
Net income attributable to IPG Photonics Corporation
|
$
|
200,445
|
|
$
|
155,780
|
|
$
|
145,004
|
|
||
|
Adjustments to redemption value of redeemable noncontrolling interests
|
—
|
|
—
|
|
493
|
|
|||||
|
Net income attributable to common stockholders
|
200,445
|
|
155,780
|
|
145,497
|
|
|||||
|
Weighted average shares
|
52,104
|
|
51,548
|
|
50,477
|
|
|||||
|
Dilutive effect of common stock equivalents
|
720
|
|
827
|
|
1,059
|
|
|||||
|
Diluted weighted average common shares
|
52,824
|
|
52,375
|
|
51,536
|
|
|||||
|
Basic net income attributable to IPG Photonics Corporation per share
|
$
|
3.85
|
|
$
|
3.02
|
|
$
|
2.86
|
|
||
|
Adjustments to redemption value of redeemable noncontrolling interests
|
—
|
|
—
|
|
0.01
|
|
|||||
|
Basic net income attributable to common stockholders
|
$
|
3.85
|
|
$
|
3.02
|
|
$
|
2.87
|
|
||
|
Diluted net income attributable to IPG Photonics Corporation per share
|
$
|
3.79
|
|
$
|
2.97
|
|
$
|
2.80
|
|
||
|
Adjustments to redemption value of redeemable noncontrolling interests
|
—
|
|
—
|
|
0.01
|
|
|||||
|
Diluted net income attributable to common stockholders
|
$
|
3.79
|
|
$
|
2.97
|
|
$
|
2.81
|
|
||
The computation of diluted weighted average common shares excludes options to purchase
46,987
shares,
322,301
shares and
164,858
shares for the
years ended December 31, 2014
,
2013
and
2012
, respectively, because the effect would be anti-dilutive.
10. COMMITMENTS AND CONTINGENCIES
Operating Leases
— The Company leases certain facilities under cancelable and noncancelable operating lease agreements which expire through October 2019. In addition, it leases capital equipment under operating leases. Rent expense for the years ended
December 31, 2014
,
2013
and
2012
, totaled
$5,516
,
$4,560
and
$3,885
, respectively.
Commitments under the noncancelable lease agreements as of
December 31, 2014
are as follows:
|
Years Ending December 31
|
Facilities
|
Equipment
|
Total
|
|||||||||
|
2015
|
$
|
3,439
|
|
$
|
951
|
|
$
|
4,390
|
|
|||
|
2016
|
2,775
|
|
573
|
|
3,348
|
|
||||||
|
2017
|
2,491
|
|
336
|
|
2,827
|
|
||||||
|
2018
|
1,544
|
|
145
|
|
1,689
|
|
||||||
|
2019
|
1,224
|
|
27
|
|
1,251
|
|
||||||
|
Thereafter
|
5
|
|
—
|
|
5
|
|
||||||
|
Total
|
$
|
11,478
|
|
$
|
2,032
|
|
$
|
13,510
|
|
|||
Employment Agreements
— The Company has entered into employment agreements with certain members of senior management. The terms of these agreements are up to
three
years and include noncompetition, nonsolicitation and nondisclosure provisions, as well as provisions for defined severance for terminations of employment under certain conditions and a change of control of the Company. The Company also maintains a severance plan for certain of its senior management providing for defined severance for terminations of employment under certain conditions and a change of control of the Company.
Contractual Obligations
— The Company has entered into various purchase obligations that include agreements for construction of buildings, raw materials and equipment. Obligations under these agreements were
$22,288
and
$3,371
as of
December 31, 2014
and
2013
, respectively. Also, included is an obligation of
$4,500
that the Company has as a result of entering into an agreement to purchase certain intellectual property and know-how related to laser based systems.
Legal proceedings
— From time to time, the Company may be involved in disputes and legal proceedings in the ordinary course of its business. These proceedings may include allegations of infringement of intellectual property, commercial disputes
F-
18
IPG PHOTONICS CORPORATION
NOTES TO CONSOLIDATED FINANCIAL STATEMENTS - (Continued)
(In thousands, except share and per share data)
and employment matters. In August 2013, the Company was sued for misappropriation of certain trade secrets, unfair trade practices, and correction of inventorship on a patent owned by the Company related to beam couplers and beam switches. The plaintiff sought damages in an unspecified amount, double damages for misappropriation of trade secrets and treble damages for unfair trade practices and correction of inventorship on
one
patent. The plaintiff filed in the United States District Court of the District of Massachusetts, a voluntarily dismissal of the lawsuit in August 2014. As of
December 31, 2014
and through the date of the Company's subsequent review period of
February 28, 2015
, the Company has no legal proceedings ongoing that management estimates could have a material effect on the Company's Consolidated Financial Statements.
11. EMPLOYEE BENEFIT PLANS
The Company maintains a 401(k) retirement savings plan covering all of its U.S. employees. The Company makes matching contributions equal to
50%
of the employee's contributions, subject to a maximum of
6%
of eligible compensation. Compensation expense related to its contribution to the plan for the years ended
December 31, 2014
,
2013
and
2012
, approximated
$1,445
,
$1,127
and
$848
, respectively.
The Company has an employee stock purchase plan covering its U.S. and German employees. The plan allows employees who participate to purchase shares of common stock through payroll deductions at a
15%
discount to the lower of the stock price on the first day or the last day of the
six
-month purchase period. Payroll deductions may not exceed
10%
of the employee's compensation and are subject to other limitations. Compensation expense related to the employee stock purchase plan was
$607
,
$498
and
$452
for the years ended
December 31, 2014
,
2013
and
2012
, respectively. As of
December 31, 2014
, there were
389,314
shares available for issuance under the employee stock purchase plan.
12. BUSINESS COMBINATIONS
On March 13, 2013, the Company acquired the working capital and long term assets of Mobius Photonics Inc. ("Mobius"), a manufacturer of high-power pulsed ultra-violet ("UV") fiber lasers for micro-machining and fine processing applications. As a result of the acquisition, the Company recorded intangible assets of
$4,480
which related to production know-how with an estimated useful life of
7
years and
$455
of goodwill that is deductible for federal income tax purposes. The acquisition did not have a material effect on the Company's financial results in 2013.
On August 31, 2012, the Company's subsidiary, IPGM acquired certain working capital and long-term assets from JPSA, which is a manufacturer of laser-based systems performing fine processing of materials used in semiconductor, LED and solar applications. As a result of the acquisition, the Company recorded
$2,898
of goodwill and intangible assets of
$3,400
, of which
$2,400
related to technology and production know-how and the remainder related to customer relationships, non-compete agreements and trade names with weighted-average estimated useful lives of
10
years,
10
years,
5
years and
7
years, respectively. The acquisition did not have a material effect on the Company's financial results in 2012. In addition to cash paid, consideration included contingent consideration based on sales targets that extended for
two
one
-year periods beginning October 1, 2012. Total possible additional payouts under these earn-outs were
$18,500
. As discussed in the fair value financial instruments disclosures in Note 1, the Company reduced the fair value of the contingent consideration related to IPGM to
$0
during 2013. Also, as discussed in Note 13, the Company reduced the Goodwill associated with IPGM to
$0
as well.
13. GOODWILL AND INTANGIBLES
The following table sets forth the changes in the carrying amount of goodwill for the
years ended December 31, 2014
and
2013
:
|
|
December 31, 2014
|
December 31, 2013
|
|||||
|
Balance at January 1
|
$
|
455
|
|
$
|
2,898
|
|
|
|
Adjustment
|
—
|
|
(95
|
)
|
|||
|
Impairment
|
—
|
|
(2,803
|
)
|
|||
|
Total goodwill arising from acquisition
|
—
|
|
455
|
|
|||
|
Balance at December 31
|
$
|
455
|
|
$
|
455
|
|
|
The goodwill balance at January 1, 2013 of
$2,898
and the adjustment of
$95
, largely reflected the potential synergies and expansion of the Company's service offerings complementary to its specialized laser systems and UV and short-pulse fiber lasers resulting from the 2012 acquisition from JPSA by IPGM. During
2013
, the Company carried out the two-step goodwill impairment test in accordance with the provisions of ASC 350-20-35. That analysis indicated that the fair value of the IPGM
F-
19
IPG PHOTONICS CORPORATION
NOTES TO CONSOLIDATED FINANCIAL STATEMENTS - (Continued)
(In thousands, except share and per share data)
reporting unit, based on a discounted cash flow analysis, was less than the carrying value. The implied value of goodwill, as measured in step 2, was
zero
. Accordingly, the Company adjusted the value of goodwill associated with IPGM to
$0
.
The goodwill of
$455
arising from the Mobius acquisition relates to the expected synergies for the Company's expansion of product offerings with UV fiber lasers. The goodwill arising from the acquisition in 2013 is deductible over 15 years for federal tax purposes.
Intangible assets, subject to amortization, consisted of the following:
|
|
December 31, 2014
|
|
December 31, 2013
|
|
||||||||||||||||
|
Gross Carrying
Amount
|
Accumulated
Amortization
|
Net Carrying
Amount
|
Weighted-
Average Lives
|
Gross Carrying
Amount
|
Accumulated
Amortization
|
Net Carrying
Amount
|
Weighted-
Average Lives
|
|||||||||||||
|
Patents
|
$
|
6,641
|
|
$
|
(4,221
|
)
|
$
|
2,420
|
|
6 Years
|
$
|
4,667
|
|
$
|
(4,091
|
)
|
$
|
576
|
|
6 Years
|
|
Customer relationships
|
3,660
|
|
(3,308
|
)
|
352
|
|
5 Years
|
4,112
|
|
(3,324
|
)
|
788
|
|
5 Years
|
||||||
|
Production know-how
|
6,844
|
|
(2,630
|
)
|
4,214
|
|
8 Years
|
7,063
|
|
(1,747
|
)
|
5,316
|
|
8 Years
|
||||||
|
Technology, trademark and tradename
|
3,315
|
|
(1,074
|
)
|
2,241
|
|
8 Years
|
4,271
|
|
(1,387
|
)
|
2,884
|
|
8 Years
|
||||||
|
$
|
20,460
|
|
$
|
(11,233
|
)
|
$
|
9,227
|
|
$
|
20,113
|
|
$
|
(10,549
|
)
|
$
|
9,564
|
|
|||
During the third quarter of 2014, the Company purchased certain intellectual property including patent and product design rights in the amount of
$2,000
.
Amortization expense for the
years ended December 31, 2014
,
2013
and
2012
was
$2,210
,
$2,310
and
$2,091
, respectively.
The estimated future amortization expense for intangibles as of
December 31, 2014
is as follows:
|
2015
|
2016
|
2017
|
2018
|
2019
|
Thereafter
|
Total
|
||||||
|
$1,783
|
$1,686
|
$1,686
|
$1,621
|
$1,033
|
$1,418
|
$9,227
|
||||||
Impairment
— In accordance with ASC 350-
Intangibles-Goodwill and Other
, the Company assesses the impairment of its long-lived assets including its definite-lived intangible assets and goodwill, at least annually for goodwill, and whenever changes in events or circumstances indicate that the carrying value of such assets may not be recoverable. During each reporting period, the Company assesses for factors that may be present which would cause an impairment review.
During 2013, the Company performed an impairment analysis to assess whether there was impairment of long-lived assets of IPGM including identifiable intangibles included in the table above using the guidance in ASC 360-10-35. The Company concluded that no impairment existed as the undiscounted cash flows from IPGM are forecasted to be greater than the carrying value of identified long-lived assets.
14. INCOME TAXES
Income before the impact of income taxes for the years ended December 31 consisted of the following:
|
2014
|
2013
|
2012
|
||||||||||
|
U.S.
|
$
|
72,800
|
|
$
|
59,006
|
|
$
|
58,964
|
|
|||
|
Foreign
|
211,674
|
|
159,295
|
|
150,251
|
|
||||||
|
Total
|
$
|
284,474
|
|
$
|
218,301
|
|
$
|
209,215
|
|
|||
F-
20
IPG PHOTONICS CORPORATION
NOTES TO CONSOLIDATED FINANCIAL STATEMENTS - (Continued)
(In thousands, except share and per share data)
The Company's provision for income taxes for the years ended December 31 consisted of the following:
|
2014
|
2013
|
2012
|
||||||||||
|
Current:
|
||||||||||||
|
Federal
|
$
|
(22,549
|
)
|
$
|
(19,285
|
)
|
$
|
(16,675
|
)
|
|||
|
State
|
(2,823
|
)
|
(2,617
|
)
|
(309
|
)
|
||||||
|
Foreign
|
(60,143
|
)
|
(46,787
|
)
|
(38,941
|
)
|
||||||
|
Total current
|
$
|
(85,515
|
)
|
$
|
(68,689
|
)
|
$
|
(55,925
|
)
|
|||
|
Deferred:
|
||||||||||||
|
Federal
|
$
|
454
|
|
$
|
3,834
|
|
$
|
(2,174
|
)
|
|||
|
State
|
27
|
|
203
|
|
(140
|
)
|
||||||
|
Foreign
|
1,005
|
|
2,131
|
|
(3,232
|
)
|
||||||
|
Total deferred
|
$
|
1,486
|
|
$
|
6,168
|
|
$
|
(5,546
|
)
|
|||
|
Provision for income taxes
|
$
|
(84,029
|
)
|
$
|
(62,521
|
)
|
$
|
(61,471
|
)
|
|||
A reconciliation of income tax expense at the U.S. federal statutory income tax rate to the recorded tax provision for the years ended December 31, is as follows:
|
2014
|
2013
|
2012
|
||||||||||
|
Tax at statutory rate
|
$
|
(99,867
|
)
|
$
|
(76,406
|
)
|
$
|
(73,225
|
)
|
|||
|
Non-U.S. rate differential — net
|
14,590
|
|
10,761
|
|
11,744
|
|
||||||
|
State income taxes — net
|
(1,787
|
)
|
(1,512
|
)
|
(1,527
|
)
|
||||||
|
Effect of changes in enacted tax rates on deferred tax assets and liabilities
|
(44
|
)
|
186
|
|
(617
|
)
|
||||||
|
Nondeductible stock compensation expense
|
(483
|
)
|
(101
|
)
|
(1,020
|
)
|
||||||
|
Other nondeductible expenses
|
(2,063
|
)
|
(1,666
|
)
|
(794
|
)
|
||||||
|
Federal and state tax credits
|
5,865
|
|
7,500
|
|
4,623
|
|
||||||
|
Change in reserves, including interest and penalties
|
(7
|
)
|
(1,273
|
)
|
(243
|
)
|
||||||
|
Change in valuation allowance
|
—
|
|
—
|
|
(314
|
)
|
||||||
|
Other — net
|
(233
|
)
|
(10
|
)
|
(98
|
)
|
||||||
|
$
|
(84,029
|
)
|
$
|
(62,521
|
)
|
$
|
(61,471
|
)
|
||||
The tax effects of temporary differences that give rise to significant portions of the deferred tax assets and deferred tax liabilities at December 31, are as follows:
|
2014
|
2013
|
2012
|
||||||||||
|
Property, plant and equipment
|
$
|
(5,310
|
)
|
$
|
(2,230
|
)
|
$
|
(3,629
|
)
|
|||
|
Inventory provisions
|
10,497
|
|
8,261
|
|
7,942
|
|
||||||
|
Allowances and accrued liabilities
|
1,570
|
|
3,634
|
|
(4,829
|
)
|
||||||
|
Other tax credits
|
726
|
|
769
|
|
1,673
|
|
||||||
|
Deferred compensation
|
4,218
|
|
(434
|
)
|
3,538
|
|
||||||
|
Net operating loss carryforwards
|
—
|
|
229
|
|
5
|
|
||||||
|
Net deferred tax assets
|
$
|
11,701
|
|
$
|
10,229
|
|
$
|
4,700
|
|
|||
It is the Company's practice and intention to reinvest the earnings of non-U.S. subsidiaries in those operations. Accordingly, it has not made any provision for additional U.S. or foreign withholding taxes with respect to repatriation of earnings of non-U.S. subsidiaries. At
December 31, 2014
and
2013
, the cumulative unremitted earnings that are reinvested in non-U.S. subsidiaries are approximately
$522,000
and
$346,000
, respectively.
As of
December 31, 2014
,
2013
and
2012
, the Company has state tax credit carry-forwards of
$1,225
,
$2,074
and
$1,419
, respectively. The state tax credit carry-forwards begin expiring in 2017. In addition, the Company has UK net operating loss carry-forwards available for future periods of
$2,509
related to deductions for stock-based compensation. The UK net operating loss can be carry-forward indefinitely. These amounts are not included in deferred tax assets, because when these net operating loss and state tax credit carry-forwards are utilized they will be credited to additional paid-in capital.
F-
21
IPG PHOTONICS CORPORATION
NOTES TO CONSOLIDATED FINANCIAL STATEMENTS - (Continued)
(In thousands, except share and per share data)
The following is a tabular reconciliation of the total amounts of unrecognized tax benefits:
|
2014
|
2013
|
2012
|
||||||||||
|
Balance at January 1
|
$
|
6,501
|
|
$
|
5,392
|
|
$
|
4,509
|
|
|||
|
Reductions of prior period positions
|
(795
|
)
|
(505
|
)
|
(317
|
)
|
||||||
|
Additions for tax positions in current period
|
788
|
|
1,614
|
|
1,200
|
|
||||||
|
Balance at December 31
|
$
|
6,494
|
|
$
|
6,501
|
|
$
|
5,392
|
|
|||
Substantially all of the liability for uncertain tax benefits related to various federal, state and foreign income tax matters, would benefit the Company's effective tax rate, if recognized.
Changes in tax laws and rates may affect recorded deferred tax assets and liabilities and the Company's effective tax rate in the future. The American Taxpayer Relief Act of 2012 (the "Act") was signed into law on January 2, 2013. Because a change in tax law is accounted for in the period of enactment, certain provisions of the Act benefiting the Company's 2012 U.S. federal taxes, including the research and experimentation credit, could not be recognized in the Company's 2012 financial results and instead is reflected in its 2013 financial results.
Estimated penalties and interest related to the underpayment of income taxes are
($192)
,
$374
and
$352
for the years ended
December 31, 2014
,
2013
and
2012
, respectively, and are included within the provision for income taxes. Total accrued penalties and interest related to the underpayment of income taxes are
$670
and
$862
at
December 31, 2014
and
2013
, respectively.
The Company's uncertain tax positions are related to tax years that remain subject to examination by the relevant taxing authorities. If realized, all of the Company's uncertain tax positions would affect its effective tax rate. Certain of the Company's uncertain tax positions are expected to settle within one year. Open tax years by major jurisdictions are:
|
• United States
|
|
2012 — 2014
|
|
• Germany
|
|
2011 — 2014
|
|
• Russia
|
|
2010 — 2014
|
The Company currently has an ongoing audit of our German subsidiary's tax filings for the years 2011-2013.
On September 13, 2013, the United States Treasury and Internal Revenue Service issued final tangible personal property regulations that broadly apply to amounts paid to acquire, produce or improve tangible property, as well as dispositions of such property. In review of these regulations, the Company has concluded that there is no material impact on its consolidated financial position, results of operations or cash flows.
15. GEOGRAPHIC AND PRODUCT INFORMATION
The Company markets and sells its products throughout the world through both direct sales and distribution channels. The geographic sources of the Company's net sales based on billing addresses of its customers are as follows:
|
|
Year Ended December 31,
|
|||||||||||
|
|
2014
|
2013
|
2012
|
|||||||||
|
United States and other North America
|
$
|
113,233
|
|
$
|
116,935
|
|
$
|
108,316
|
|
|||
|
Europe:
|
||||||||||||
|
Germany
|
77,404
|
|
65,147
|
|
89,848
|
|
||||||
|
Other including Eastern Europe/CIS
|
173,018
|
|
140,279
|
|
110,860
|
|
||||||
|
Asia and Australia:
|
||||||||||||
|
Japan
|
72,573
|
|
67,981
|
|
69,576
|
|
||||||
|
China
|
245,102
|
|
192,134
|
|
138,782
|
|
||||||
|
Other
|
85,426
|
|
64,346
|
|
43,445
|
|
||||||
|
Rest of World
|
3,076
|
|
1,212
|
|
1,701
|
|
||||||
|
Total
|
$
|
769,832
|
|
$
|
648,034
|
|
$
|
562,528
|
|
|||
F-
22
IPG PHOTONICS CORPORATION
NOTES TO CONSOLIDATED FINANCIAL STATEMENTS - (Continued)
(In thousands, except share and per share data)
Sales are derived from products for different applications: fiber lasers, diode lasers and diodes for materials processing, fiber lasers and amplifiers for advanced applications, fiber amplifiers for communications applications, and fiber lasers for medical applications. Net sales for these product lines are as follows:
|
|
Year Ended December 31,
|
|||||||||||
|
|
2014
|
2013
|
2012
|
|||||||||
|
Materials Processing
|
$
|
731,274
|
|
$
|
608,702
|
|
$
|
492,013
|
|
|||
|
Other applications
|
38,558
|
|
39,332
|
|
70,515
|
|
||||||
|
Total
|
$
|
769,832
|
|
$
|
648,034
|
|
$
|
562,528
|
|
|||
One
customer comprised
11%
of net sales during the years ended
December 31, 2014
and
2013
. No single customer comprised more than 10% of net sales during the year ended December 31,
2012
. The Company has historically depended on a few customers for a significant percentage of its annual net sales. The composition of this group can change from year to year. Net sales derived from the Company's
five
largest customers as a percentage of its annual net sales were
23%
,
21%
and
16%
in
2014
,
2013
and
2012
, respectively.
The geographic locations of the Company's long-lived assets, net, based on physical location of the assets, as of
December 31, 2014
,
2013
and
2012
, are as follows:
|
|
December 31,
|
|||||||||||
|
|
2014
|
2013
|
2012
|
|||||||||
|
United States
|
$
|
155,428
|
|
$
|
110,441
|
|
$
|
86,226
|
|
|||
|
Germany
|
51,528
|
|
52,791
|
|
47,019
|
|
||||||
|
Russia
|
59,612
|
|
73,747
|
|
60,151
|
|
||||||
|
China
|
6,582
|
|
5,895
|
|
6,424
|
|
||||||
|
Other
|
12,507
|
|
13,480
|
|
15,674
|
|
||||||
|
$
|
285,657
|
|
$
|
256,354
|
|
$
|
215,494
|
|
||||
Long lived assets include property, plant and equipment and demonstration equipment.
16. SELECTED QUARTERLY FINANCIAL DATA (UNAUDITED)
|
2014
|
First
Quarter
|
Second
Quarter
|
Third
Quarter
|
Fourth
Quarter
|
||||||||||||
|
|
(In thousands, except per share data)
|
|||||||||||||||
|
Net sales
|
$
|
170,575
|
|
$
|
192,204
|
|
$
|
199,651
|
|
$
|
207,402
|
|
||||
|
Gross profit
|
89,284
|
|
104,227
|
|
109,090
|
|
113,917
|
|
||||||||
|
Net income attributable to IPG Photonics Corporation
|
40,531
|
|
48,283
|
|
55,200
|
|
56,431
|
|
||||||||
|
Basic earnings per share
|
0.78
|
|
0.93
|
|
1.06
|
|
1.08
|
|
||||||||
|
Diluted earnings per share
|
0.77
|
|
0.92
|
|
1.05
|
|
1.07
|
|
||||||||
|
2013
|
First
Quarter
|
Second
Quarter
|
Third
Quarter
|
Fourth
Quarter
|
||||||||||||
|
|
(In thousands, except per share data)
|
|||||||||||||||
|
Net sales
|
$
|
141,852
|
|
$
|
168,171
|
|
$
|
172,152
|
|
$
|
165,859
|
|
||||
|
Gross profit
|
75,641
|
|
89,922
|
|
92,813
|
|
81,522
|
|
||||||||
|
Net income attributable to IPG Photonics Corporation
|
35,127
|
|
41,720
|
|
42,338
|
|
36,595
|
|
||||||||
|
Basic earnings per share
|
0.68
|
|
0.81
|
|
0.82
|
|
0.71
|
|
||||||||
|
Diluted earnings per share
|
0.67
|
|
0.80
|
|
0.81
|
|
0.70
|
|
||||||||
F-
23
EXHIBIT
|
Exhibit
Number
|
|
Description
|
|
3.1
|
|
Form of Second Amended and Restated Certificate of Incorporation of the Registrant (incorporated by reference to Exhibit 3.2 to Registration Statement No. 333-136521 filed with the Securities and Exchange Commission (the "Commission") on August 11, 2006)
|
|
3.3
|
|
Form of Amended and Restated By-laws of the Registrant (incorporated by reference to Exhibit 3.2 to the Registrant's current Report on Form 8-K filed with the Commission on August 22, 2014)
|
|
4.1
|
|
Specimen Stock Certificate (incorporated by reference to Exhibit 4.1 to Registration Statement No. 333-136521 filed with the Commission on November 14, 2006)
|
|
10.1
|
|
2000 Incentive Compensation Plan (incorporated by reference to Exhibit 10.2 to the Registrant's Quarterly Report on Form 10-Q filed with the Commission on May 15, 2007)
|
|
10.2
|
|
Amendment to Section 4.2 of 2000 Incentive Compensation Plan (incorporated by reference to Exhibit 10.5 to the Registrant's Current Report on Form 8-K filed with the Commission on May 13, 2008)
|
|
10.3
|
Amendment to the 2000 Incentive Compensation Plan (incorporated by reference to Exhibit 10.3 to the Registrant's Current Report on Form 8-K filed with the Commission on August 22, 2014)
|
|
|
10.4
|
|
2006 Stock Incentive Plan, as amended July 28, 2011 (incorporated by reference to Exhibit 10.1 to the Registrant's Current Report on Form 8-K filed with the Commission on August 2, 2011)
|
|
10.5
|
|
Amendment to Section 16.2 of the 2006 Incentive Compensation Plan, as amended (incorporated by reference to Exhibit 10.2 to the Registrant's current Report on Form 8-K filed with the Commission on March 5, 2013)
|
|
10.6
|
Amendment to the 2006 Incentive Compensation Plan, as amended (incorporated by reference to Exhibit 10.2 to the Registrant's Current Report on Form 8-K filed with the Commission on August 22, 2014)
|
|
|
10.7
|
|
Non-Employee Directors Stock Plan, as amended April 2, 2010 (incorporated by reference to Exhibit 10.1 to the Registrant's Current Report on Form 8-K filed with the Commission on June 8, 2010)
|
|
10.8
|
Amendment to the Non-Employee Directors Stock Plan, as amended (incorporated by reference to Exhibit to 10.1 to the Registrant's Current Report on Form 8-K filed with the Commission on August 22, 2014)
|
|
|
10.9
|
|
IPG Photonics Non-Employee Director Compensation Plan, as amended (incorporated by reference to Exhibit 10.1 to the Registrant's Current Report on Form 8-K filed with the Commission on March 5, 2013)
|
|
10.10
|
IPG Photonics Amended and Restated Non-Employee Director Compensation Plan
|
|
|
10.11
|
|
Senior Executive Short-Term Incentive Plan (incorporated by reference to Exhibit 10.5 to Registration Statement No. 333-136521 filed with the Commission on August 11, 2006)
|
|
10.12
|
|
2008 Employee Stock Purchase Plan (incorporated by reference to Exhibit 10.8 to the Registrant's Current Report on Form 8-K filed with the Commission on May 13, 2008)
|
|
10.13
|
|
Amendment to 2008 Employee Stock Purchase Plan (incorporated by reference to Exhibit 10.1 to the Registrant's Current Report on Form 8-K filed with the Commission on June 15, 2009)
|
|
10.14
|
|
Employment Agreement dated October 7, 2013 between the Registrant and Dr. Valentin P. Gapontsev, (incorporated by reference to Exhibit 10.1 to the Registrant's Current Report on Form 8-K filed with the Commission on October 15, 2013)
|
|
10.15
|
|
Service Agreement dated October 7, 2013 between IPG Laser GmbH and Dr. Eugene Scherbakov, (incorporated by reference to Exhibit 10.2 to the Registrant's Current Report on Form 8-K filed with the Commission on October 15, 2013)
|
|
Exhibit
Number
|
Description
|
|
|
10.16
|
|
Form of Employment Agreement dated October 7, 2013 between the Registrant and each of Timothy P.V. Mammen, Angelo P. Lopresti and Alexander Ovtchinnikov, (incorporated by reference to Exhibit 10.3 to the Registrant's Current Report on Form 8-K filed with the Commission on October 15, 2013)
|
|
|
||
|
10.17
|
|
Form of Confidentiality, Non-Competition and Confirmatory Assignment Agreement between the Registrant and each of the named executive officers and certain other executive officers, (incorporated by reference to Exhibit 10.4 to the Registrant's Current Report on Form 8-K filed with the Commission on October 15, 2013)
|
|
10.18
|
|
Form of Indemnification Agreement between the Registrant and each of its Directors and Executive Officers (incorporated by reference to Exhibit 10.13 to Registration Statement No. 333-136521 filed with the Commission on August 11, 2006)
|
|
10.19
|
|
Loan Agreement between the Registrant and Bank of America, N.A. dated as of June 4, 2008 (incorporated by reference to Exhibit 10.1 to the Registrant's Current Report on Form 8-K filed with the Commission on June 9, 2008)
|
|
10.2
|
|
Revolving Credit Note by the Registrant dated June 4, 2008 (incorporated by reference to Exhibit 10.2 to the Registrant's Current Report on Form 8-K filed with the Commission on June 9, 2008)
|
|
10.21
|
|
Term Note by the Registrant dated June 4, 2008 (incorporated by reference to Exhibit 10.3 to the Registrant's Current Report on Form 8-K filed with the Commission on June 9, 2008)
|
|
10.22
|
|
Second Amendment to Loan Agreement, between the Registrant and Bank of America, N.A., dated as of September 30, 2010 (incorporated by reference to Exhibit 10.1 to the Registrant's Quarterly Report on Form 10-Q filed with the Commission on November 9, 2010)
|
|
10.23
|
|
Revolving Credit Note Modification Agreement No. 1, between the Registrant and Bank of America, N.A., dated as of September 30, 2010 (incorporated by reference to Exhibit 10.2 to the Registrant's Quarterly Report on Form 10-Q filed with the Commission on November 9, 2010)
|
|
10.24
|
|
Term Note Modification Agreement No. 1, between the Registrant and Bank of America, N.A., dated as of September 30, 2010 (incorporated by reference to Exhibit 10.3 to the Registrant's Quarterly Report on Form 10-Q filed with the Commission on November 9, 2010)
|
|
10.25
|
|
Credit Facility Agreement between IPG Laser GmbH and Deutsche Bank AG dated June 18, 2012 (incorporated by reference to Exhibit 10.2 to the Registrant's Current Report on Form 8-K filed with the Commission on June 29, 2012)
|
|
10.26
|
|
Guarantee of the Registrant to Deutsche Bank AG dated June 26, 2012 (incorporated by reference to Exhibit 10.3 to the Registrant's Current Report on Form 8-K filed with the Commission on June 29, 2012)
|
|
10.27
|
|
Enclosure 1 to Guarantee to Deutsche Bank AG dated June 26, 2012 (incorporated by reference to Exhibit 10.4 to the Registrant's Current Report on Form 8-K filed with the Commission on June 29, 2012)
|
|
10.28
|
Amendment to Credit Facility Agreement between IPG Laser GmbH and Deutsche Bank AG dated January 17, 2014 (incorporated by reference to Exhibit 10.2 to the Registrant's Current Report on Form 8-K filed with the Commission on March 4, 2014)
|
|
|
10.29
|
Amendment to Credit Facility Agreement between IPG Laser GmbH and Deutsche Bank AG dated June 25, 2014 (incorporated by reference to Exhibit 10.1 to the Registrant's Current Report on Form 8-K filed with the Commission on July 1, 2014)
|
|
|
10.3
|
Credit Facility Agreement between IPG Laser GmbH and Deutsche Bank AG dated August 7, 2014 (incorporated by reference to Exhibit 10.1 to the Registrant's Current Report on Form 8-K filed with the Commission on August 14, 2014)
|
|
|
10.31
|
Guarantee of the Registrant to Deutsche Bank AG dated August 7, 2014 (incorporated by reference to Exhibit 10.2 to the Registrant's Current Report on Form 8-K filed with the Commission on August 14, 2014)
|
|
|
Exhibit
Number
|
Description
|
|
|
10.32
|
Guarantee of IPG Laser GmbH to Deutsche Bank AG dated August 7, 2014 (incorporated by reference to Exhibit 10.3 to the Registrant's Current Report on Form 8-K filed with the Commission on August 14, 2014)
|
|
|
10.33
|
Annex 1 to Guarantee of IPG Laser GmbH to Deutsche Bank AG dated August 11, 2014 (incorporated by reference to Exhibit 10.4 to the Registrant's Current Report on Form 8-K filed with the Commission on August 14, 2014)
|
|
|
21.1
|
|
List of Subsidiaries
|
|
23.1
|
|
Consent of Deloitte & Touche LLP
|
|
31.1
|
|
Certification of Chief Executive Officer pursuant to Rule 13a-14(a) of the Securities Exchange Act of 1934, as amended
|
|
31.2
|
|
Certification of Chief Financial Officer pursuant to Rule 13a-14(a) of the Securities Exchange Act of 1934, as amended
|
|
32.1
|
|
Certification of Chief Executive Officer and Chief Financial Officer pursuant to Section 1350
|
|
101.INS
|
|
XBRL Instance Document
|
|
101.SCH
|
|
XBRL Taxonomy Extension Schema
|
|
101.CAL
|
|
XBRL Taxonomy Extension Calculation Linkbase
|
|
101.DEF
|
|
XBRL Taxonomy Definition Linkbase
|
|
101.LAB
|
|
XBRL Taxonomy Extension Label Linkbase
|
|
101.PRE
|
|
XBRL Taxonomy Extension Presentation Linkbase
|
TABLE OF CONTENTS
Part IItem 1. BusinessItem 1A. Risk FactorsItem 1B. Unresolved Staff CommentsItem 2. PropertiesItem 3. Legal ProceedingsItem 4. Mine Safety DisclosuresPart IIItem 5. Market For The Registrant S Common Equity, Related Stockholder Matters and Issuer Purchases Of Equity SecuritiesItem 6. Selected Financial DataItem 7. Management S Discussion and Analysis Of Financial Condition and Results Of OperationsItem 7A. Quantitative and Qualitative Disclosures About Market RiskItem 8. Financial Statements and Supplementary DataItem 9. Changes in and Disagreements with Accountants on Accounting and Financial DisclosureItem 9A. Controls and ProceduresItem 9B. Controls and ProceduresPart IIIItem 10. Directors, Executive Officers and Corporate GovernanceItem 11. Executive CompensationItem 12. Security Ownership Of Certain Beneficial Owners and Management and Related Stockholder MattersItem 13. Certain Relationships and Related Transactions, and Director IndependenceItem 14. Principal Accounting Fees and ServicesPart IVItem 15. Exhibits and Financial Statement Schedules