PALTALK, INC.
10-Ks and 10-Qs
|
|
|
|
|
|
|
|
|
|
|
|
|
|
|
|
|
|
|
|
|
|
|
|
|
|
|
|
|
|
|
|
|
|
|
|
|
|
|
|
|
|
|
|
|
|
|
|
|
|
UNITED STATES
SECURITIES AND EXCHANGE COMMISSION
Washington, D.C. 20549
Form 10-Q
þ
QUARTERLY REPORT PURSUANT TO SECTION 13 OR 15(d) OF THE SECURITIES EXCHANGE ACT OF 1934
For the quarterly period ended June 30, 2014
OR
¨
TRANSITION REPORT PURSUANT TO SECTION 13 OR 15(d) OF THE SECURITIES EXCHANGE ACT OF 1934
For the transition period from to
Commission File Number 000-52176
SNAP INTERACTIVE, INC.
(Exact name of registrant as specified in its charter)
|
Delaware
|
20-3191847
|
|
|
(State or other jurisdiction of
incorporation or organization)
|
(I.R.S. Employer
Identification No.)
|
462 7th Avenue, 4th Floor,
New York, NY 10018
(Address of principal executive offices)
(Zip Code)
(212) 594-5050
(Registrant’s telephone number, including area code)
Indicate by check mark whether the registrant (1) has filed all reports required to be filed by Section 13 or 15(d) of the Securities Exchange Act of 1934 during the preceding 12 months (or for such shorter period that the registrant was required to file such reports), and (2) has been subject to such filing requirements for the past 90 days. Yes
þ
No
¨
Indicate by check mark whether the registrant has submitted electronically and posted on its corporate Web site, if any, every Interactive Data File required to be submitted and posted pursuant to Rule 405 of Regulation S-T (§232.405 of this chapter) during the preceding 12 months (or for such shorter period that the registrant was required to submit and post such files). Yes
þ
No
¨
Indicate by check mark whether the registrant is a large accelerated filer, an accelerated filer, a non-accelerated filer or a smaller reporting company. See the definitions of “large accelerated filer,” “accelerated filer” and “smaller reporting company” in Rule 12b-2 of the Exchange Act. (Check one):
|
Large accelerated filer
|
o
|
Accelerated filer
|
o
|
|
Non-accelerated filer
|
o
|
Smaller reporting company
|
þ
|
|
(Do not check if a smaller reporting company)
|
|||
Indicate by check mark whether the registrant is a shell company (as defined in Rule 12b-2 of the Exchange Act). Yes
¨
No
þ
Indicate the number of shares outstanding of each of the issuer’s classes of common stock, as of the latest practicable date.
|
Class
|
Outstanding at August 11, 2014
|
|
|
Common Stock, par value $0.001 per share
|
39,182,826
|
SNAP INTERACTIVE, INC.
QUARTERLY REPORT ON FORM 10-Q
FOR THE QUARTER ENDED JUNE 30, 2014
Table of Contents
PART I. FINANCIAL INFORMATION
|
Page
Number
|
||
|
1
|
||
|
2
|
||
|
3
|
||
|
4
|
||
|
5
|
||
|
15
|
||
|
27
|
||
|
27
|
||
|
PART II. OTHER INFORMATION
|
||
|
28
|
||
|
28
|
||
|
28
|
||
|
28
|
||
|
28
|
||
|
28
|
||
|
29
|
||
Unless the context otherwise indicates, references to “Snap,” “we,” “our,” “us” and the “Company” refer to Snap Interactive, Inc. and its subsidiaries on a consolidated basis.
AYI, the AYI logo, Snap, the Snap logo and other trademarks or service marks appearing in this report are the property of Snap Interactive, Inc. Trade names, trademarks and service marks of other companies appearing in this report are the property of their respective owners.
References in this report to “DAUs” and “MAUs” mean daily active users and monthly active users, respectively, of our application. Unless otherwise indicated, metrics for users are based on information that is reported by Facebook® and internally-derived metrics for users across all platforms through which our application is accessed. References in this report to current users mean those persons that have created a user name and password, and active subscribers mean current users that have prepaid a subscription fee for current access to the AYI application and whose subscription period has not yet expired. The metrics for active subscribers are based on internally-derived metrics across all platforms through which our application is accessed.
FORWARD-LOOKING STATEMENTS
Certain statements contained in this Quarterly Report on Form 10-Q constitute “forward-looking statements” as defined in Section 27A of the Securities Act of 1933, as amended (the “Securities Act”) and Section 21E of the Securities Exchange Act of 1934, as amended (the “Exchange Act”), that are based on current expectations, estimates, forecasts and assumptions and are subject to risks and uncertainties. Words such as “anticipate,” “assume,” “believe,” “budget,” “continue,” “could,” “estimate,” “expect,” “forecast,” “goal,” “intend,” “may,” “plan,” “potential,” “predict,” “project,” “seek,” “should,” “began,” “target,” “would” and variations of such words and similar expressions are intended to identify such forward-looking statements. All forward-looking statements speak only as of the date on which they are made. Such forward-looking statements are subject to certain risks, uncertainties and assumptions relating to factors that could cause actual results to differ materially from those anticipated in such statements, including, without limitation, the following:
|
●
|
our ability to generate and sustain increased revenue levels and achieve profitability in the future;
|
|
|
●
|
our heavy reliance on the Facebook platform to run our application and Facebook Inc.’s ability to discontinue, limit or restrict access to its platform by us or our application, change its terms and conditions or other policies or features (including restricting methods of collecting payments or placing advertisements), establish more favorable relationships with one or more of our competitors or develop an application or feature that competes with our application;
|
|
|
●
|
our ability to maintain good relationships with Apple Inc. and Google Inc.;
|
|
|
●
|
our reliance on our president and chief executive officer and chief operating officer and chief financial officer
;
|
|
|
●
|
the intense competition in the online dating industry;
|
|
|
●
|
our reliance on a small percentage of our total users for substantially all of our revenue;
|
|
|
●
|
our ability to develop, establish and maintain a strong brand;
|
|
|
●
|
our ability to develop and market new technologies to respond to rapid technological changes;
|
|
|
●
|
our ability to effectively manage our growth, including attracting and retaining qualified employees;
|
|
|
●
|
our ability to generate subscribers through advertising and marketing agreements with third party advertising and marketing providers;
|
|
|
●
|
our reliance on email campaigns to convert users to subscribers and to retain subscribers;
|
|
|
●
|
the effect of an interruption or failure of our data center;
|
|
|
●
|
the effect of an interruption or failure of our programming code, servers or technological infrastructure;
|
|
|
●
|
the effect of security breaches, computer viruses and computer hacking attacks;
|
|
|
●
|
our ability to comply with laws and regulations regarding privacy and protection of user data;
|
|
|
●
|
our reliance upon credit card processors and related merchant account approvals;
|
|
|
●
|
governmental regulation or taxation of the online dating, social dating or Internet industries;
|
|
|
●
|
the impact of any claim that we have infringed on intellectual property rights of others;
|
|
|
●
|
our ability to protect our intellectual property rights;
|
|
|
●
|
the risk that we might be deemed a “dating service” or an “Internet dating service” under various state regulations;
|
|
|
●
|
the possibility that our users or third parties may be physically or emotionally harmed following interaction with other users;
|
|
|
●
|
our ability to obtain additional capital or financing to execute our business plan;
|
|
|
●
|
our ability to repay indebtedness; and
|
|
|
●
|
our ability to maintain effective internal control over financial reporting.
|
For a more detailed discussion of these and other factors that may affect our business, see the discussion in “Management’s Discussion and Analysis of Financial Condition and Results of Operations” and “Risk Factors” in this report. We caution that the foregoing list of factors is not exclusive, and new factors may emerge, or changes to the foregoing factors may occur, that could impact our business. We do not undertake any obligation to update any forward-looking statement, whether written or oral, relating to the matters discussed in this report, except to the extent required by applicable securities laws.
SNAP INTERACTIVE, INC.
|
June 30,
2014
|
December 31,
2013
|
|||||||
|
(Unaudited)
|
||||||||
|
Assets
|
||||||||
|
Current assets:
|
||||||||
|
Cash and cash equivalents
|
$
|
555,745
|
$
|
927,352
|
||||
|
Restricted cash
|
385,422
|
490,315
|
||||||
|
Credit card holdback receivable
|
686,016
|
232,264
|
||||||
|
Accounts receivable, net of allowances and reserves of $33,653 and $37,850, respectively
|
276,881
|
385,370
|
||||||
|
Prepaid expense and other current assets
|
132,916
|
114,863
|
||||||
|
Total current assets
|
2,036,980
|
2,150,164
|
||||||
|
Fixed assets and intangible assets, net
|
439,320
|
522,462
|
||||||
|
Notes receivable
|
122,749
|
170,566
|
||||||
|
Investments
|
150,000
|
100,000
|
||||||
|
Total assets
|
$
|
2,749,049
|
$
|
2,943,192
|
||||
|
Liabilities and stockholders’ equity (deficit)
|
||||||||
|
Current liabilities:
|
||||||||
|
Accounts payable
|
949,854
|
861,730
|
||||||
|
Accrued expenses and other current liabilities
|
485,858
|
671,142
|
||||||
|
Promissory notes
|
400,000
|
-
|
||||||
|
Deferred subscription revenue
|
1,958,767
|
1,826,771
|
||||||
|
Deferred advertising revenue
|
446,667
|
300,000
|
||||||
|
Total current liabilities
|
4,241,146
|
3,659,643
|
||||||
|
Long term deferred rent
|
-
|
12,058
|
||||||
|
Warrant liability
|
70,275
|
140,550
|
||||||
|
Total liabilities
|
4,311,421
|
3,812,251
|
||||||
|
Stockholders' equity (deficit):
|
||||||||
|
Preferred stock, $0.001 par value, 10,000,000 shares authorized, none issued and outstanding
|
-
|
-
|
||||||
|
Common stock, $0.001 par value, 100,000,000 shares authorized, 49,507,826 and 49,987,826 shares issued, respectively, and 39,182,826 and 39,132,826 shares outstanding, respectively
|
39,183
|
39,133
|
||||||
|
Additional paid-in capital
|
11,312,617
|
10,813,205
|
||||||
|
Accumulated deficit
|
(12,914,172
|
)
|
(11,721,397
|
)
|
||||
|
Total stockholders' equity (deficit)
|
(1,562,372
|
)
|
(869,059
|
)
|
||||
|
Total liabilities and stockholders' equity (deficit)
|
$
|
2,749,049
|
$
|
2,943,192
|
||||
The accompanying notes are an integral part of these condensed consolidated financial statements.
1
(Unaudited)
|
Three Months Ended
|
Six Months Ended
|
|||||||||||||||
|
June 30,
|
June 30,
|
|||||||||||||||
|
2014
|
2013
|
2014
|
2013
|
|||||||||||||
|
Revenues:
|
||||||||||||||||
|
Subscription revenue
|
$
|
3,151,002
|
$
|
3,150,319
|
$
|
6,290,022
|
$
|
6,578,210
|
||||||||
|
Advertising revenue
|
299,008
|
1,670
|
452,341
|
43,339
|
||||||||||||
|
Total revenues
|
3,450,010
|
3,151,989
|
6,742,363
|
6,621,549
|
||||||||||||
|
Costs and expenses:
|
||||||||||||||||
|
Programming, hosting and technology expense
|
669,795
|
1,339,930
|
1,612,206
|
2,701,321
|
||||||||||||
|
Compensation expense
|
864,859
|
1,078,536
|
1,634,262
|
1,899,606
|
||||||||||||
|
Professional fees
|
262,876
|
206,703
|
513,031
|
473,807
|
||||||||||||
|
Advertising and marketing expense
|
1,110,726
|
952,248
|
2,582,937
|
2,083,929
|
||||||||||||
|
General and administrative expense
|
795,854
|
1,118,700
|
1,659,272
|
2,264,725
|
||||||||||||
|
Total costs and expenses
|
3,704,110
|
4,696,117
|
8,001,708
|
9,423,388
|
||||||||||||
|
Loss from operations
|
(254,100
|
)
|
(1,544,128
|
)
|
(1,259,345
|
)
|
(2,801,839
|
)
|
||||||||
|
Interest income (expense), net
|
(5,578
|
)
|
1,440
|
(3,705
|
)
|
3,106
|
||||||||||
|
Gain on change in fair value of warrants
|
-
|
70,275
|
70,275
|
1,171,250
|
||||||||||||
|
Loss before provision for income taxes
|
(259,678
|
)
|
(1,472,413
|
)
|
(1,192,775
|
)
|
(1,627,483
|
)
|
||||||||
|
Provision for income taxes
|
-
|
-
|
-
|
-
|
||||||||||||
|
Net loss
|
$
|
(259,678
|
)
|
$
|
(1,472,413
|
)
|
$
|
(1,192,775
|
)
|
$
|
(1,627,483
|
)
|
||||
|
Net loss per common share:
|
||||||||||||||||
|
Basic and diluted
|
$
|
(0.01
|
)
|
$
|
(0.04
|
)
|
$
|
(0.03
|
)
|
$
|
(0.04
|
)
|
||||
|
Weighted average number of common shares used in calculating net loss per common share:
|
||||||||||||||||
|
Basic and diluted
|
39,152,713
|
38,932,826
|
39,155,340
|
38,920,671
|
||||||||||||
The accompanying notes are an integral part of these condensed consolidated financial statements.
2
CONDENSED CONSOLIDATED STATEMENT OF CHANGES IN STOCKHOLDERS’ EQUITY (DEFICIT)
(Unaudited)
|
Additional
|
Stockholders’
|
|||||||||||||||||||
|
Common Stock
|
Paid-
|
Accumulated
|
Equity
|
|||||||||||||||||
|
Shares
|
Amount
|
in Capital
|
Deficit
|
(Deficit)
|
||||||||||||||||
|
Balance at December 31, 2013
|
39,132,826
|
$
|
39,133
|
$
|
10,813,205
|
$
|
(11,721,397
|
)
|
$
|
(869,059
|
)
|
|||||||||
|
Shares issued for consulting services
|
50,000
|
50
|
(50
|
)
|
-
|
-
|
||||||||||||||
|
Stock-based compensation expense for restricted stock awards
|
-
|
-
|
418,679
|
-
|
418,679
|
|||||||||||||||
|
Stock-based compensation expense for stock options
|
-
|
-
|
76,033
|
-
|
76,033
|
|||||||||||||||
|
Warrants issued for debt issuance cost
|
-
|
-
|
4,750
|
-
|
4,750
|
|||||||||||||||
|
Net loss
|
-
|
-
|
-
|
(1,192,775
|
)
|
(1,192,775
|
)
|
|||||||||||||
|
Balance at June 30, 2014
|
39,182,826
|
$
|
39,183
|
$
|
11,312,617
|
$
|
(12,914,172
|
)
|
$
|
(1,562,372
|
)
|
|||||||||
The accompanying notes are an integral part of these condensed consolidated financial statements.
3
(Unaudited)
|
Six Months Ended
June 30,
|
||||||||
|
2014
|
2013
|
|||||||
|
Cash flows from operating activities:
|
||||||||
|
Net loss
|
$
|
(1,192,775
|
)
|
$
|
(1,627,483
|
)
|
||
|
Adjustments to reconcile net loss to net cash used in operating activities:
|
||||||||
|
Depreciation and amortization
|
86,873
|
85,563
|
||||||
|
Stock-based compensation expense
|
494,712
|
445,069
|
||||||
|
Gain on change in fair value of warrants
|
(70,275
|
)
|
(1,171,250
|
)
|
||||
|
Changes in operating assets and liabilities:
|
||||||||
|
Decrease (increase) in restricted cash
|
104,893
|
(270,211
|
)
|
|||||
|
Decrease (increase) in credit card holdback receivable
|
(453,752
|
)
|
30,369
|
|||||
|
Decrease (increase) in accounts receivable
|
108,489
|
(13,163
|
)
|
|||||
|
Decrease (increase) in prepaid expenses and other current assets
|
(13,303
|
)
|
34,688
|
|||||
|
Increase (decrease) in accounts payable, accrued expenses and other current liabilities
|
(89,913
|
)
|
341,601
|
|||||
|
Decrease in deferred rent
|
(19,306
|
)
|
(14,587
|
)
|
||||
|
Increase (decrease) in deferred subscription revenue
|
131,996
|
(492,527
|
)
|
|||||
|
Increase in deferred advertising revenue
|
146,667
|
-
|
||||||
|
Net cash used in operating activities
|
(765,694
|
)
|
(2,651,931
|
)
|
||||
|
Cash flows from investing activities:
|
||||||||
|
Purchase of fixed assets
|
(3,731
|
)
|
(35,550
|
)
|
||||
|
Purchase of non-marketable equity securities
|
(50,000
|
)
|
(50,000
|
)
|
||||
|
Repayment of notes receivable issued to employees and accrued interest
|
47,818
|
(2,382
|
)
|
|||||
|
Net cash used in investing activities
|
(5,913
|
)
|
(87,932
|
)
|
||||
|
Cash flows from financing activities:
|
||||||||
|
Proceeds from issuance of promissory notes
|
400,000
|
-
|
||||||
|
Net cash provided by financing activities
|
400,000
|
-
|
||||||
|
Decrease in cash and cash equivalents
|
(371,607
|
)
|
(2,739,863
|
)
|
||||
|
Balance of cash and cash equivalents at beginning of period
|
927,352
|
5,357,596
|
||||||
|
Balance of cash and cash equivalents at end of period
|
$
|
555,745
|
$
|
2,617,733
|
||||
|
Supplemental disclosure of cash flow information
|
||||||||
|
AYI.com domain name purchase in exchange for 100,000 shares of common stock
|
$
|
-
|
$
|
100,000
|
||||
|
Warrants issued for debt issuance costs
|
$
|
4,750
|
|
-
|
||||
The accompanying notes are an integral part of these condensed consolidated financial statements.
4
NOTES TO CONDENSED CONSOLIDATED FINANCIAL STATEMENTS
(Unaudited)
1. Basis of Presentation
The accompanying unaudited condensed consolidated financial statements include Snap Interactive, Inc. and its wholly owned subsidiaries, eTwine, Inc. and Snap Mobile Limited (collectively, the “Company”). The condensed consolidated financial statements included in this report have been prepared in accordance with generally accepted accounting principles in the United States of America (“GAAP”) and the rules and regulations of the Securities and Exchange Commission (the “SEC”) for interim financial information. The Company has not included certain information normally included in annual financial statements pursuant to those rules and regulations, although it believes that the disclosure included herein is adequate to make the information presented not misleading.
The financial statements contained herein should be read in conjunction with the Company’s audited consolidated financial statements and the related notes to the audited consolidated financial statements included in the Company’s Annual Report on Form 10-K for the year ended December 31, 2013, filed with the SEC on March 5, 2014.
In the opinion of management, the accompanying unaudited condensed consolidated financial information contains all normal and recurring adjustments necessary to fairly present the consolidated financial condition, results of operations, and changes in cash flows of the Company for the interim periods presented. The Company’s historical results are not necessarily indicative of future operating results and the results for the six months ended June 30, 2014 are not necessarily indicative of results for the year ending December 31, 2014, or for any other period.
Certain amounts from prior periods have been reclassified to conform to the current period presentation, including the reclassification of a letter of credit of $115,104 from cash and cash equivalents to restricted cash.
2. Summary of Significant Accounting Policies
During the six months ended June 30, 2014, there were no material changes to the Company’s significant accounting policies from those disclosed in the Company’s Annual Report on Form 10-K for the year ended December 31, 2013, filed with the SEC on March 5, 2014.
3. Restricted Cash
During 2011, the Company established a line of credit with Sentinel Benefits Group, Inc. (“Sentinel Group”) related to the Company’s office lease and placed a cash security deposit of $115,104 in a letter of credit for the life of the lease. The Company has recorded $115,422 (which includes interest) as restricted cash on the balance sheet as of June 30, 2014 and December 31, 2013.
On January 11, 2013, the Company obtained a letter of credit from JP Morgan Chase Bank, N.A. (“JP Morgan”) in the amount of $200,000 in favor of Hewlett Packard Financial Services Company (“HP”). The amount was subsequently increased to $270,000 in September 2013. This letter of credit expired on January 31, 2014 but was replaced with a new letter of credit in the amount of $270,000 as of June 30, 2014. On July 28, 2014, HP released $100,000 held in the certificate of deposit (See Notes 15 and 17
).
4. Accounts Receivable, Net
Accounts receivable, net consisted of the following as of June 30, 2014 and December 31, 2013:
|
June 30,
|
December 31,
|
|||||||
|
2014
|
2013
|
|||||||
|
(Unaudited)
|
||||||||
|
Accounts receivable
|
$
|
310,534
|
$
|
423,220
|
||||
|
Less: Reserve for future chargebacks
|
(33,653
|
)
|
(37,850
|
)
|
||||
|
Total accounts receivable, net
|
$
|
276,881
|
$
|
385,370
|
||||
Credit card payments for subscriptions and micro-transactions typically settle several days after the date of purchase. The amount of unsettled transactions due from credit card payment processors was $152,827 as of June 30, 2014, compared to $191,656 at December 31, 2013. The amount of accounts receivable due from Apple Inc. was $151,993 as of June 30, 2014, compared to $217,536 at December 31, 2013. These amounts are included in the Company’s accounts receivable.
5
SNAP INTERACTIVE, INC.
NOTES TO CONDENSED CONSOLIDATED FINANCIAL STATEMENTS
(Unaudited)
5. Fair Value Measurements
The fair value framework under the Financial Accounting Standards Board’s guidance requires the categorization of assets and liabilities into three levels based upon the assumptions used to measure the assets or liabilities. Level 1 provides the most reliable measure of fair value, whereas Level 3, if applicable, would generally require significant management judgment. The three levels for categorizing assets and liabilities under the fair value measurement requirements are as follows:
|
●
|
Level 1: Fair value measurement of the asset or liability using observable inputs such as quoted prices in active markets for identical assets or liabilities;
|
|
|
●
|
Level 2: Fair value measurement of the asset or liability using inputs other than quoted prices that are observable for the applicable asset or liability, either directly or indirectly, such as quoted prices for similar (as opposed to identical) assets or liabilities in active markets and quoted prices for identical or similar assets or liabilities in markets that are not active; and
|
|
|
●
|
Level 3: Fair value measurement of the asset or liability using unobservable inputs that reflect the Company’s own assumptions regarding the applicable asset or liability.
|
The following table summarizes the liabilities measured at fair value on a recurring basis as of June 30, 2014:
|
Level 1
|
Level 2
|
Level 3
|
Total
|
|||||||||||||
|
LIABILITIES:
|
||||||||||||||||
|
Warrant liability
|
$
|
—
|
$
|
—
|
$
|
70,275
|
$
|
70,275
|
||||||||
|
Total warrant liability
|
$
|
—
|
$
|
—
|
$
|
70,275
|
$
|
70,275
|
||||||||
The following table summarizes the liabilities measured at fair value on a recurring basis as of December 31, 2013:
|
Level 1
|
Level 2
|
Level 3
|
Total
|
|||||||||||||
|
LIABILITIES:
|
||||||||||||||||
|
Warrant liability
|
$
|
—
|
$
|
—
|
$
|
140,550
|
$
|
140,550
|
||||||||
|
Total warrant liability
|
$
|
—
|
$
|
—
|
$
|
140,550
|
$
|
140,550
|
||||||||
The Company issued warrants to purchase common stock in January 2011 in conjunction with an equity financing. In accordance with Accounting Standards Codification (“ASC”) 480,
Distinguishing Liabilities from Equity
(“ASC 480”), the fair value of these warrants is classified as a liability on the Company’s Condensed Consolidated Balance Sheets because, according to the terms of the warrants, a fundamental transaction could give rise to an obligation of the Company to pay cash to its warrant holders. Corresponding changes in the fair value of the warrants are recognized in earnings on the Company’s Condensed Consolidated Statements of Operations in each subsequent period.
The Company’s warrant liability is carried at fair value and was classified as Level 3 in the fair value hierarchy due to the use of significant unobservable inputs. In order to calculate fair value, the Company uses a custom model developed with the assistance of an independent third-party valuation expert. This model calculates the fair value of the warrant liability at each measurement date using a Monte-Carlo style simulation, as the value of certain features of the warrant liability would not be captured by the standard Black-Scholes model.
6
SNAP INTERACTIVE, INC.
NOTES TO CONDENSED CONSOLIDATED FINANCIAL STATEMENTS
(Unaudited)
The following table summarizes the values of certain assumptions used the Company’s custom model to estimate the fair value of the warrant liability as of June 30, 2014 and December 31, 2013:
|
June 30,
|
December 31,
|
|||||||
|
2014
|
2013
|
|||||||
|
(Unaudited)
|
||||||||
|
Stock price
|
$
|
0.30
|
$
|
0.42
|
||||
|
Strike price
|
$
|
2.50
|
$
|
2.50
|
||||
|
Remaining contractual term (years)
|
1.6
|
2.1
|
||||||
|
Volatility
|
117.2
|
%
|
109.6
|
%
|
||||
|
Adjusted volatility
|
112.8
|
%
|
102.5
|
%
|
||||
|
Risk-free rate
|
0.3
|
%
|
0.4
|
%
|
||||
|
Dividend yield
|
0.0
|
%
|
0.0
|
%
|
||||
For the purposes of determining fair value, the Company used “adjusted volatility” in favor of “historical volatility” in its Monte-Carlo style simulation. Historical volatility of the Company was calculated using weekly stock prices over a look back period corresponding to the remaining contractual term of the warrants as of each valuation date. Management considered the lack of marketability of these instruments by incorporating a 10% incremental discount rate through a reduction of the volatility estimate (also known as volatility haircut) to calculate the adjusted volatility as of each valuation date.
ASU No. 2011-04,
Fair Value Measurement (Topic 820) - Amendments to Achieve Common Fair Value Measurement and Disclosure Requirements in U.S. GAAP and IFRS
(“ASU 2011-04”), indicates that “in the absence of a Level 1 input, a reporting entity should apply premiums or discounts when market participants would do so when pricing the asset or liability.” In accordance with ASU 2011-04, management estimated fair value from the perspective of market participants.
6. Cost-Method Investment
On January 31, 2013, the Company entered into a subscription agreement with Darrell Lerner and DCL Ventures, Inc. (“DCL”) in connection with Mr. Lerner’s separation from the Company. Pursuant to this agreement, the Company has made multiple investments in DCL by purchasing (i) 50,000 shares of DCL’s common stock for an aggregate purchase price of $50,000 in April 2013, (ii) 25,000 shares of DCL’s common stock for an aggregate purchase price of $25,000 in July 2013, (iii) 25,000 shares of DCL’s common stock for an aggregate purchase price of $25,000 in October 2013, (iv) 25,000 shares of DCL’s common stock for an aggregate purchase price of $25,000 in January 2014 and (v) 25,000 shares of DCL’s common stock for an aggregate purchase price of $25,000 in April 2014.
These nonmarketable securities have been recorded in “Investments” on the Company’s Condensed Consolidated Balance Sheet measured on a cost basis (See Note 16).
As of June 30, 2014, the aggregate carrying amount of the Company’s cost-method investment in DCL, which was a non-controlled entity, was $150,000. The Company assesses all cost-method investments for impairment quarterly. No impairment loss was recorded during the six months ended June 30, 2014. The Company does not reassess the fair value of cost-method investments if there are no identified events or changes in circumstances that may have a significant adverse effect on the fair value of the investments (See Note 16).
7
SNAP INTERACTIVE, INC.
NOTES TO CONDENSED CONSOLIDATED FINANCIAL STATEMENTS
(Unaudited)
7. Fixed Assets and Intangible Assets, Net
Fixed assets and intangible assets, net consisted of the following at June 30, 2014 and December 31, 2013:
|
June 30,
|
December 31,
|
|||||||
|
2014
|
2013
|
|||||||
|
(Unaudited)
|
||||||||
|
Computer equipment
|
$
|
256,610
|
$
|
252,879
|
||||
|
Furniture and fixtures
|
142,856
|
142,856
|
||||||
|
Leasehold improvements
|
382,376
|
382,376
|
||||||
|
Software
|
10,968
|
10,968
|
||||||
|
Website domain name
|
124,938
|
124,938
|
||||||
|
Website costs
|
40,500
|
40,500
|
||||||
|
Total fixed assets
|
958,248
|
954,517
|
||||||
|
Less: Accumulated depreciation and amortization
|
(518,928
|
)
|
(432,055
|
)
|
||||
|
Total fixed assets and intangible assets, net
|
$
|
439,320
|
$
|
522,462
|
||||
The Company only holds fixed assets in the United States. Depreciation and amortization expense for the six months ended June 30, 2014 was $86,873, as compared to $85,563 for the six months ended June 30, 2013.
8. Notes Receivable
At June 30, 2014, the Company had notes receivable due in the aggregate amount of $122,749 from three former employees. The employees issued the notes to the Company since the Company paid taxes for stock-based compensation on these employees’ behalf in 2011 and 2012. The outstanding amounts under the notes are secured by pledged stock certificates and are due at various times during 2021-2023. Interest accrues on these notes at rates ranging from 2.31% to 3.57% per annum.
9. Income Taxes
The Company had no income tax benefit or provision for the six months ended June 30, 2014 and 2013. Since the Company incurred a net loss for the six months ended June 30, 2014 and 2013, there was no income tax expense for the period. Increases in deferred tax balances have been offset by a valuation allowance and have no impact on the Company’s deferred income tax provision.
In calculating the provision for income taxes on an interim basis, the Company estimates the annual effective income tax rate based upon the facts and circumstances known for the period and applies that rate to the earnings or losses for the most recent interim period. The Company’s effective income tax rate is based on expected income and statutory tax rates and takes into consideration permanent differences between financial statement income and tax return income applicable to the Company in the various jurisdictions in which the Company operates. The effect of a discrete item, such as changes in estimates, changes in enacted tax laws or rates or tax status, and unusual or infrequently occurring events, is recognized in the interim period in which the discrete item occurs. The accounting estimates used to compute the provision for income taxes may change as new events occur, additional information is obtained or as the result of new judicial interpretations or changes in tax laws or regulations.
10. Accrued Expenses and Other Current Liabilities
Accrued expenses and other current liabilities consisted of the following at June 30, 2014 and December 31, 2013:
|
June 30,
|
December 31,
|
|||||||
|
2014
|
2013
|
|||||||
|
(Unaudited)
|
||||||||
|
Compensation and benefits
|
$
|
228,250
|
$
|
499,500
|
||||
|
Deferred rent
|
30,214
|
37,463
|
||||||
|
Professional fees
|
215,973
|
134,179
|
||||||
|
Other accrued expenses
|
11,421
|
-
|
||||||
|
Total accrued expenses and other current liabilities
|
$
|
485,858
|
$
|
671,142
|
||||
8
SNAP INTERACTIVE, INC.
NOTES TO CONDENSED CONSOLIDATED FINANCIAL STATEMENTS
(Unaudited)
11. Promissory Notes
On April 24, 2014, the Company issued a promissory note in the amount of $300,000 with Clifford Lerner, the Company’s president, chief executive officer and the chairman of the Company’s Board of Directors. The promissory note is due and payable on January 24, 2015 and bears interest at the rate of nine percent (9%) per annum.
On May 20, 2014, the Company issued a promissory note in the amount of $100,000 and a warrant to purchase 25,000 shares of its common stock to Thomas Carrella. The promissory note is due and payable on February 20, 2015 and bears interest at the rate of fifteen percent (15%) per annum. The Company calculated the fair value of the warrant using Black-Scholes option pricing model and recorded $4,750 of deferred financing costs related to the issuance of the warrant that will be amortized over the term of the promissory note (See Note 13
).
At June 30, 2014, the Company had outstanding promissory notes in the aggregate amount of $400,000 recorded on its Condensed Consolidated Balance Sheet.
12. Stock-Based Compensation
The Snap Interactive, Inc. Amended and Restated 2011 Long-Term Incentive Plan (the “Plan”) permits the Company to award stock options (both incentive stock options and non-qualified stock options), stock appreciation rights, restricted stock, restricted stock units, shares of performance stock, dividend equivalent rights, and other stock-based awards and cash-based incentive awards to its employees (including an employee who is also a director or officer under certain circumstances), non-employee directors and consultants. The maximum number of shares of common stock that may be issued pursuant to awards under the Plan is 7,500,000 shares, 100% of which may be pursuant to incentive stock options. As of June 30, 2014, there were 3,325,222 shares available for future issuance under the Plan.
Stock Options
The following table summarizes the assumptions used in the Black-Scholes pricing model to estimate the fair value of the options granted during the six months ended June 30, 2014:
|
Six Months Ended
June 30,
2014
|
||||
|
Expected volatility
|
199.74
|
%
|
||
|
Expected life of option
|
6.18 Years
|
|||
|
Risk free interest rate
|
1.96
|
%
|
||
|
Expected dividend yield
|
0
|
%
|
||
The expected life of the options is the period of time over which employees and non-employees are expected to hold their options prior to exercise. The expected life of options has been determined using the "simplified" method as prescribed by Staff Accounting Bulletin 110, which uses the midpoint between the vesting date and the end of the contractual term. The volatility of the Company’s common stock is calculated using the Company’s historical volatilities beginning at the grant date and going back for a period of time equal to the expected life of the award.
The following table summarizes stock option activity for the six months ended June 30, 2014:
|
Number of
Options
|
Weighted
Average
Exercise Price
|
|||||||
|
Stock Options:
|
||||||||
|
Outstanding at December 31, 2013
|
4,129,790
|
$
|
0.74
|
|||||
|
Granted
|
2,134,000
|
0.31
|
||||||
|
Expired or canceled, during the period
|
(507,500
|
)
|
0.70
|
|||||
|
Forfeited, during the period
|
(1,631,510
|
)
|
0.64
|
|||||
|
Outstanding at June 30, 2014
|
4,124,780
|
0.56
|
||||||
|
Exercisable at June 30, 2014
|
1,987,082
|
$
|
0.75
|
|||||
9
SNAP INTERACTIVE, INC.
NOTES TO CONDENSED CONSOLIDATED FINANCIAL STATEMENTS
(Unaudited)
At June 30, 2014, the aggregate intrinsic value of stock options that were outstanding and exercisable was $24,100 and $3,150, respectively. At June 30, 2013, the aggregate intrinsic value of stock options that were outstanding and exercisable was $82,730 and $82,635, respectively. The intrinsic value for stock options is calculated based on the exercise price of the underlying awards and the fair value of such awards as of the period-end date.
Stock-based compensation expense relating to stock options was $76,033 and $445,069 during the six months ended June 30, 2014 and 2013, respectively. The Company estimates potential forfeitures of stock awards and adjust recorded stock-based compensation expense accordingly. The estimate of forfeitures is adjusted over the requisite service period to the extent that actual forfeitures differ, or are expected to differ, from such estimates. Changes in estimated forfeitures are recognized through a cumulative catch-up adjustment in the period of change and will also impact the amount of stock-based compensation expense that is recognized in future periods.
Non-employee stock option activity described below is also included in the stock option activity summarized on the previous table. The following table summarizes non-employee stock option activity for the six months ended June 30, 2014:
|
Number of
Options
|
Weighted
Average
Exercise Price
|
|||||||
|
Non-Employee Stock Options:
|
||||||||
|
Outstanding at December 31, 2013
|
200,000
|
$
|
0.93
|
|||||
|
Granted
|
25,000
|
0.34
|
||||||
|
Outstanding at June 30, 2014
|
225,000
|
0.87
|
||||||
|
Exercisable at June 30, 2014
|
200,000
|
$
|
0.93
|
|||||
At June 30, 2014 and 2013, the aggregate intrinsic value of non-employee stock options that were outstanding and exercisable was $0.
Stock-based compensation expense relating to non-employee stock options was $2,401 and $23,210 during the three months ended June 30, 2014 and 2013, respectively.
The following table summarizes unvested stock option activity for the six months ended June 30, 2014:
|
|
Number of
Options
|
Weighted
Average
Grant Date
Fair Value
|
||||||
|
Unvested Stock Options:
|
||||||||
|
Unvested stock options outstanding at December 31, 2013
|
1,888,437
|
$
|
0.57
|
|||||
|
Granted
|
2,134,000
|
0.31
|
||||||
|
Vested
|
(253,229
|
) |
0.49
|
|||||
|
Forfeited, during the period
|
(1,631,512
|
)
|
0.63
|
|||||
|
Unvested stock options outstanding at June 30, 2014
|
2,137,696
|
$
|
0.37
|
|||||
There was $740,720 and $1,481,725 of total unrecognized stock-based compensation expense related to unvested stock options at June 30, 2014 and 2013, respectively, which is expected to be recognized over a weighted average remaining vesting period of 3.36 and 2.88 years, respectively
.
10
SNAP INTERACTIVE, INC.
NOTES TO CONDENSED CONSOLIDATED FINANCIAL STATEMENTS
(Unaudited)
Restricted Stock Awards
The following table summarizes restricted stock award activity for the six months ended June 30, 2014:
|
Number of
RSAs
|
Weighted
Average
Grant Date
Fair Value
|
|||||||
|
Restricted Stock Awards:
|
||||||||
|
Outstanding at December 31, 2013
|
10,855,000
|
$
|
0.56
|
|||||
|
Vested
|
(50,000
|
)
|
0.42
|
|||||
|
Forfeited, during the period
|
(480,000
|
)
|
0.52
|
|||||
|
Outstanding at June 30, 2014
|
10,325,000
|
$
|
0.56
|
|||||
At June 30, 2014, there was $4,133,182 of total unrecognized compensation expense related to unvested restricted stock awards, which is expected to be recognized over a weighted average period of 8.07 years. At June 30, 2013, there was $5,804,730 of total unrecognized compensation expense related to unvested non-employee restricted stock awards, which is expected to be recognized over a weighted average period of 6.12 years.
Stock-based compensation expense relating to restricted stock awards was $418,679 and $338,573 for the six months ended June 30, 2014 and 2013, respectively
.
Non-employee restricted stock award activity described below is also included in total restricted stock award activity summarized on the previous table. The following table summarizes non-employee restricted stock award activity for the six months ended June 30, 2014:
|
Number of
RSAs
|
Weighted
Average
Grant Date
Fair Value
|
|||||||
|
Non-Employee Restricted Stock Awards:
|
||||||||
|
Outstanding at December 31, 2013
|
1,125,000
|
$
|
0.42
|
|||||
|
Vested
|
(50,000
|
)
|
0.42
|
|||||
|
Outstanding at June 30, 2014
|
1,075,000
|
$
|
0.42
|
|||||
At June 30, 2014, there was $268,719 of total unrecognized stock-based compensation expense related to non-employee unvested restricted stock awards, which is expected to be recognized over a weighted average period of 7.5 years.
Stock-based compensation expense relating to non-employee restricted stock awards was $5,365 for the six months ended June 30, 2014
.
13. Common Stock Warrants
Warrant Liability
In January 2011, the Company completed an equity financing that raised gross proceeds of $8,500,000 from the issuance of 4,250,000 shares of common stock at a price of $2.00 per share and warrants to purchase an aggregate of 2,125,000 shares of common stock. The warrants are exercisable any time on or before January 19, 2016 and have an exercise price of $2.50 per share. The Company received $7,915,700 in net proceeds from the equity financing after deducting offering expenses of $584,300. The exercise price of the warrants and number of shares of common stock to be received upon the exercise of the warrants are subject to adjustment for reverse and forward stock splits, stock dividends, stock combinations and other similar transactions.
The Company also issued warrants to purchase an aggregate of 255,000 shares of its common stock to the Company’s placement agent and advisors in January 2011 in connection with the equity financing as consideration for their services. These warrants have the same terms, including exercise price, registration rights and expiration, as the warrants issued to the investors in the equity financing.
11
SNAP INTERACTIVE, INC.
NOTES TO CONDENSED CONSOLIDATED FINANCIAL STATEMENTS
(Unaudited)
The Company has recorded a warrant liability on its Condensed Consolidated Balance Sheet at the end of each reporting period based on the estimated fair value of the warrants. The warrants are valued at the end of each reporting period with changes recorded as mark-to-market adjustment on warrant liability on the Company’s Condensed Consolidated Statement of Operations. The fair value of these warrants was $70,275 and $140,550 at June 30, 2014 and December 31, 2013, respectively, based on a model developed with the assistance of an independent third-party valuation expert.
The gain on change in fair value of warrants on these warrants was $0 and $70,275 for the three months ended June 30, 2014 and June 30, 2013, respectively, and $70,275 and $1,171,250 for the six months ended June 30, 2014 and June 30, 2013, respectively, and was not presented within loss from operations.
Warrant Equity
On May 20, 2014, the Company issued a warrant to purchase 25,000 shares of its common stock to Thomas Carrella in connection with the issuance of a promissory note. The warrant has an exercise price equal to $0.32 per share and, if unexercised, expires on May 20, 2019.
The Company calculated the fair value of the warrant issued on May 20, 2014 using Black-Scholes option pricing model and recorded $4,750 of deferred financing costs related to the issuance of the warrant that will be amortized over the term of the promissory note.
Common Stock Issued for Warrants Exercised
In April 2011, the Company issued 37,500 shares of its common stock and received net proceeds of $88,125 after an investor exercised warrants at an exercise price of $2.50 per share.
The following table summarizes warrant activity for the six months ended June 30, 2014:
|
Number of
Warrants
|
Weighted
Average
Exercise Price
|
|||||||
|
Stock Warrants:
|
||||||||
|
Outstanding at December 31, 2013
|
2,342,500
|
$
|
2.50
|
|||||
|
Granted
|
25,000
|
0.32
|
||||||
|
Exercised
|
-
|
- | ||||||
|
Forfeited
|
-
|
- | ||||||
|
Outstanding at June 30, 2014
|
2,367,500
|
2.48
|
||||||
|
Warrants exercisable at June 30, 2014
|
2,367,500
|
$
|
2.48
|
|||||
14. Net Loss Per Common Share
Basic net loss per common share is computed based upon the weighted average common shares outstanding as defined by ASC No. 260,
Earnings Per Share
. Diluted net loss per common share includes the dilutive effects of stock options, warrants and stock equivalents. To the extent stock options, stock equivalents and warrants are antidilutive, they are excluded from the calculation of diluted net loss per share. For the six months ended June 30, 2014, 16,917,278 shares issuable upon the exercise of stock options and warrants were not included in the computation of diluted net loss per share because their inclusion would be antidilutive. For the six months ended June 30, 2013, 7,139,165 shares issuable upon the exercise of stock options and warrants were not included in the computation of diluted net loss per share because their inclusion would have been antidilutive.
12
SNAP INTERACTIVE, INC.
NOTES TO CONDENSED CONSOLIDATED FINANCIAL STATEMENTS
(Unaudited)
The following table provides a reconciliation of the numerator and denominator used in computing basic and diluted net loss per common share:
|
Three Months Ended
|
Six Months Ended
|
|||||||||||||||
|
June 30,
|
June 30,
|
|||||||||||||||
|
2014
|
2013
|
2014
|
2013
|
|||||||||||||
|
Numerator:
|
||||||||||||||||
|
Net loss
|
$
|
(259,678
|
)
|
$
|
(1,472,413
|
)
|
$
|
(1,192,775
|
)
|
$
|
(1,627,483
|
)
|
||||
|
Denominator:
|
||||||||||||||||
|
Basic shares:
|
||||||||||||||||
|
Weighted-average common shares outstanding
|
39,152,713
|
38,932,826
|
39,155,340
|
38,920,671
|
||||||||||||
|
Diluted shares:
|
||||||||||||||||
|
Weighted-average shares used to compute basic net loss per share
|
39,152,713
|
38,932,826
|
39,155,340
|
38,920,671
|
||||||||||||
|
Weighted-average shares used to compute diluted net loss per share
|
39,152,713
|
38,932,826
|
39,155,340
|
38,920,671
|
||||||||||||
|
Net loss per common share:
|
||||||||||||||||
|
Basic
|
$
|
(0.01
|
)
|
$
|
(0.04
|
)
|
$
|
(0.03
|
)
|
$
|
(0.04
|
)
|
||||
|
Diluted
|
$
|
(0.01
|
)
|
$
|
(0.04
|
)
|
$
|
(0.03
|
)
|
$
|
(0.04
|
)
|
||||
15. Commitments
Operating Lease Agreements
On May 23, 2011, the Company executed a non-cancelable operating lease for corporate office space which began on June 1, 2011 and expires on March 30, 2015. Total base rent due during the term of the lease is $973,595. Monthly rent escalates during the term, but is recorded on a straight-line basis over the term of the lease. The Company can terminate the final five months of the lease with eight months prior notice and the payment of unamortized costs. Rent expense under this lease for the six months ended June 30, 2014 and 2013 was $126,991.
During 2012, the Company entered into multiple two-year lease agreements with HP for equipment and certain other assets. During 2013, the Company entered into two additional two-year lease agreements with HP for equipment and certain financed items. Rent expense under this lease for the three months ended June 30, 2014 totaled $73,844. On January 11, 2013, the Company obtained a letter of credit from JP Morgan in the amount of $200,000 in favor of HP. This letter of credit expired on January 31, 2014 but was replaced with a new letter of credit in the amount of $270,000 as of June 30, 2014. On July 28, 2014, HP released $100,000 held in the certificate of deposit (See Notes 3 and 17).
During 2013, the Company entered into a two-year service agreement with Equinix Operating Co., Inc. (“Equinix”) where Equinix agreed to provide certain products and services to the Company from January 2013 to January 2015. Pursuant to the service agreement, the Company agreed to pay monthly recurring fees in the amount of $8,450 and certain nonrecurring fees in the amount of $9,700. The agreement automatically renews for additional twelve month terms unless earlier terminated by either party. Hosting expense under this lease totaled $88,256 for the six months ended June 30, 2014
.
16. Related Party Transactions
On January 31, 2013, the Company entered into a subscription agreement with Darrell Lerner and DCL in connection with his separation from the Company. Pursuant to this agreement, the Company purchased (i) 50,000 shares of DCL’s common stock for an aggregate purchase price of $50,000 in April 2013, (ii) 25,000 shares of DCL’s common stock for an aggregate purchase price of $25,000 in July 2013, (iii) 25,000 shares of DCL’s common stock for an aggregate purchase price of $25,000 in October 2013, (iv) 25,000 shares of DCL’s common stock for an aggregate purchase price of $25,000 in January 2014 and (v) 25,000 shares of DCL’s common stock for an aggregate purchase price of $25,000 in April 2014.
13
SNAP INTERACTIVE, INC.
NOTES TO CONDENSED CONSOLIDATED FINANCIAL STATEMENTS
(Unaudited)
On January 31, 2013, the Company entered into a consulting agreement with Darrell Lerner, pursuant to which Mr. Lerner agreed to serve as a consultant to the Company for a three-year period, beginning on February 1, 2013 (the “Effective Date”). Pursuant to the agreement, Mr. Lerner agreed to assist and advise the Company on legal, financial and other matters for which he has knowledge that pertains to the Company, as the Company reasonably requests. As compensation for his services, the Company agreed to pay Mr. Lerner a monthly fee of $25,000 for the initial two year period of the agreement and a monthly fee of $5,000 for every month thereafter. The monthly payments under the agreement are conditioned upon Mr. Lerner’s compliance with a customary confidentiality covenant covering certain information concerning the Company, a covenant not to compete during the term of the agreement and for a period of one year following the termination of the agreement, a non-disparagement covenant regarding the Company and a non-solicitation covenant for a period of six months immediately following the later of the termination of the agreement or the end of the term of the agreement.
The consulting agreement is for a three-year period; provided, however, that the Company may terminate the agreement at any time without notice and may renew the term of the agreement by providing written notice to Mr. Lerner prior to or at the expiration of the term. If the Company terminates the agreement without “cause” (as defined in the agreement) prior to the three-year anniversary of the Effective Date, the Company has agreed to (i) pay Mr. Lerner the amount of the monthly fees owed to Mr. Lerner for the period from the Effective Date to the two year anniversary of the Effective Date and (ii) take all commercially reasonably actions to cause (A) 325,000 shares of restricted common stock of the Company previously granted to Mr. Lerner, (B) 600,000 shares of restricted common stock of the Company previously granted to Mr. Lerner and (iii) 150,000 shares of restricted common stock of the Company granted to Mr. Lerner pursuant to the agreement, to be vested as of the date of the termination.
On April 24, 2014, the Company entered into a promissory note in the amount of $300,000 with Clifford Lerner, the Company’s chief executive officer and the chairman of the Company’s Board of Directors. The promissory note is due and payable on January 24, 2015 and bears interest at the rate of nine percent (9%) per annum.
On June 17, 2014, the Board of Directors of the Company increased the size of the Board of Directors from one (1) member to two (2) members and appointed Alexander Harrington to the Board of Directors. Mr. Harrington will serve as a director until the Company’s 2015 annual meeting of stockholders. On June 17, 2014, the Company issued a stock option to purchase 25,000 shares of its common stock to Alexander Harrington as consideration for his service as a director on the Company’s Board of Directors. The stock option has an exercise price of $0.31 per share. The shares underlying the stock option will vest on the first anniversary of the date of grant, provided that Mr. Harrington is providing services to the Company on such date
.
17. Subsequent Events
Certificate of Deposit
On July 28, 2014, HP released the $100,000 held in a certificate of deposit for the Company’s leased equipment (See Note 15).
14
This Management’s Discussion and Analysis of Financial Condition and Results of Operations is intended to provide a reader of our financial statements with a narrative from the perspective of our management on our financial condition, results of operations, liquidity, and certain other factors that may affect our future results. The following discussion and analysis should be read in conjunction with: (i) the accompanying unaudited condensed consolidated financial statements and notes thereto for the three and six months ended June 30, 2014, (ii) the consolidated financial statements and notes thereto for the year ended December 31, 2013 included in our Annual Report on Form 10-K (the “Form 10-K”) filed with the Securities and Exchange Commission (the “SEC”) on March 5, 2014 and (iii) the discussion under the caption “Management’s Discussion and Analysis of Financial Condition and Results of Operations” of our Form 10-K. Aside from certain information as of December 31, 2013, all amounts herein are unaudited. Unless the context otherwise indicates, references to “Snap,” “we,” “our,” “us” and the “Company” refer to Snap Interactive, Inc. and its subsidiaries on a consolidated basis.
Forward-Looking Statements
In addition to historical financial information, the following discussion and analysis contains forward-looking statements that involve risks, uncertainties and assumptions. See “Forward-Looking Statements.” Our results and the timing of selected events may differ materially from those anticipated in these forward-looking statements as a result of many factors, including those discussed under “Item 1A. Risk Factors” of the Form 10-K, as updated by “Item 1A. Risk Factors” of our Quarterly Report on Form 10-Q for the quarter ended March 31, 2014 filed with the SEC on May 5, 2014 (the “Form 10-Q”
).
Overview
We provide a leading online dating application under the “Are You Interested?” (“AYI”) brand that is native on Facebook, iOS and Android platforms, and is also accessible on the web, mobile devices and AYI.com. The vast majority of subscribers to our application are between the ages of 30 and 60, with an average age of 46 years old. We target our application to users in this age demographic because of their rapidly growing use of online dating and greater disposable income. We were the #1 grossing application in the Lifestyle Category on the iPhone in the United States as of August 11, 2014. As of August 11, 2014, we had approximately 100,000 active subscribers across all of our platforms
.
We believe the success of our online dating application is the direct result of the superior user experience it provides. While many online dating applications and websites provide similar functionality, most competitive services require meaningful effort and initiative on the part of the user to make contact with other users. AYI is designed to eliminate effort and friction in user-to-user interaction by automating certain aspects of the introductory dialog between users. As a consequence, we believe AYI users find our experience more social and enjoyable than many competitive interactive dating services.
Our data-driven business practices are another differentiator of Snap in the competitive field. The user engagement of our application and the propensity of users to subscribe is continually enhanced through constant experimentation. Our sophisticated A/B testing framework can support millions of different versions of the application in parallel in order to test new features and functionality, design changes, and changes to our algorithms. We have also developed business processes and human capital dedicated to business intelligence to analyze and interpret A/B test data, with the result that every change we make to our application produces a verifiable benefit, and the user experience and economics of the application continually improve. We believe this capability to be a competitive advantage.
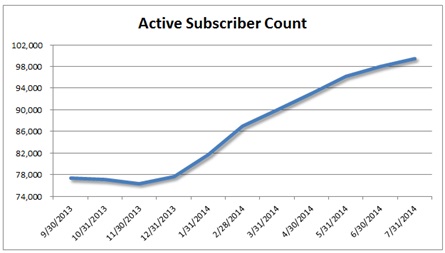
Our application is also available to confirmed users (those who have created a user name and password) and active subscribers (those confirmed users who have prepaid a subscription fee for current unrestricted communication on AYI and whose subscription period has not yet expired). As of July 31, 2014, we had approximately 99,500 active subscribers, which constituted a 28% increase in active subscribers since December 31, 2013. In addition, new subscription transactions increased approximately 34% from January 1, 2014 through July 31, 2014 as compared to the same period in 2013. Our online dating application is extremely scalable and requires limited incremental cost to add additional users or to create new tools catering to additional discrete audiences. We have experienced recent growth in the number of our active subscribers, as seen by the table below:
We generate revenues from subscriptions as well as advertising agreements with third parties. While we transitioned users to the redesigned AYI application during 2012, we significantly reduced advertising and marketing expenses for user acquisition campaigns which in part led to a significant decreased in the number of active subscribers and our revenues. For the years ended December 31, 2012 and 2013, our revenues were $19.2 million and $12.6 million, respectively. We had net losses of $4.0 million and $4.0 million for the years ended December 31, 2012 and 2013, respectively, and $1.6 million and $1.2 million in the six months ended June 30, 2013 and 2014, respectively. As of August 11, 2014, we had 33 employees, all of which were located in our New York City headquarters
.
Our Application
AYI attracts a demographically and geographically diverse user base, with users in approximately 200 different countries. Our application is intuitive, and allows users and subscribers to easily find, connect and communicate with each other. Key features and tools of our online dating application include:
15
Profile Creation
Users can join AYI by creating a personal profile that is connected to their email address or that is connected to a Facebook profile. An AYI user with a Facebook profile can nearly effortlessly import information from such profile, including the user’s photos, friends and interest data, their AYI profiles are updated in real time as they add interests on Facebook. Once a profile has been created, AYI users are able to search for potential matches, including other singles with mutual friends or similar interests. Using this information, AYI has designed features around mutual friends and interests that improve the online dating experience and, compared to traditional online dating websites, more closely mirrors the way singles traditionally meet offline. We continually update AYI’s feature set with new features to increase user engagement, make users more social and to increase the number of users that are converted to active subscribers.
Browse Function
AYI’s game-like “browse” function presents profiles of other users that match user criteria and prompts them to indicate if they are “interested” by either clicking on a “yes” or “skip” button above the profile picture or by sending a message when viewing that user’s profile. Users are notified when another user has clicked “yes” on their profile or if they have received a message from another user. In instances where users select "yes" on each other’s profile, the application automatically introduces the two users, who are likely to have mutual interest. In addition, AYI’s “friends of friends” function allows users view other users that have mutual friends. Users are also able to search for profiles of other users with similar interests.
Subscription Benefits
AYI operates on a “freemium” model, whereby certain application features are free to all users and other features are only available to paid subscribers. All users are allowed to create a profile, browse, search and view other user’s profiles, send instant messages and send an initial message to any user. Unlimited messaging and other premium features require a paid subscription.

Accessibility
Our easy-to-use mobile interface allows our users to engage with our online dating application from virtually anywhere at any time. The availability of our online dating application across mobile devices, tablets and personal computers enables our users to move seamlessly between devices, increasing the opportunities for user engagement and real-time interactions.
Operational Highlights and Objectives
During the six months ended June 30, 2014, we executed key components of our objectives for 2014:
|
●
|
increased our messaging activity, user engagement and user conversion rates;
|
|
|
●
|
increased the number of new subscriptions primarily due to advertising and marketing efficiency;
|
|
|
●
|
reduced total costs and expenses, including programming, hosting and technology expense by approximately 40%, general and administrative expense by approximately 27% and compensation expense by approximately 14% for the six months ended June 30, 2014 as compared to the six months ended June 30, 2013;
|
|
| ● | diversified our user acquisition sources, increasing the percentage of new users acquired through advertisements placed on sources other than Facebook media from 49% in December 2013 to 72% in June 2014; and | |
|
●
|
increased advertising revenues due to the renewal of the advertising agreement with Match.com L.L.C. (“Match.com”) and secured future advertising revenues by entering into a new advertising agreement with Zoosk, Inc. (“Zoosk”).
|
For the remainder of 2014, our business objectives include:
|
●
|
increasing revenue generated from subscribers by reducing subscriber attrition and presenting additional purchases opportunities;
|
|
|
●
|
continuing to seek reductions in general and administrative expense, programming, hosting and technology expense, and in other expense areas in order to generate positive cash flow from operations;
|
|
|
●
|
increasing the prominence of our mobile applications on iOS and Android platforms; and
|
|
| ● | appointing independent directors to the Company's Board of Directors. |
16
Sources of Revenue
AYI operates on a “freemium” model, whereby certain application features are free to all users and other features are only available to paid subscribers. We generate revenue primarily when users purchase a subscription to obtain unlimited messaging and certain other premium features. We also generate a small portion of our revenue through micro-transactions that allow users to access other premium features and advertisements on our application.
Subscription
. We provide our users with the opportunity to purchase a subscription that provides for unlimited messaging and other premium features for the length of the subscription term. We believe that users choose to become paid subscribers to communicate freely with potential matches and to enhance the online dating experience. We believe that users are more likely to purchase subscriptions when they have mutual friends or similar interests with other users.
The majority of our revenue is generated from subscriptions originating through the Facebook platform, and a significant amount of our revenue is being generated from subscriptions through mobile platforms.
Users can purchase subscriptions through various payment methods including credit card, electronic check, PayPal, Fortumo, or as an In-App purchase through Apple Inc.’s iPhone App Store. Pursuant to Apple Inc.’s terms of service, Apple Inc. retains 30% of the revenue that is generated from sales on our iPhone application through In-App purchases in the United States.
We recognize revenue from monthly premium subscription fees in the month in which the services are provided during the subscription term.
Micro-transactions
. We introduced micro-transactions in August 2012 in conjunction with the launch of the redesigned AYI application to allow users to access certain premium features by paying for such features without purchasing a recurring subscription. While micro-transactions are not currently a significant driver of revenue, we believe that such micro-transactions may increase user engagement with the application and the likelihood that users will become a paid subscriber. Revenue from micro-transactions is recognized over a two-month period.
Advertising.
We generate advertising revenue from advertising agreements with third parties. We recognize advertising revenue from these agreements ratably over the term of the agreement.
In December 2013, we entered into a Business Development Agreement (the “Business Development Agreement”) with Match.com, which was amended in April 2014, whereby the Company received upfront payments in exchange for developing various integrations of Match.com’s dating properties into the core AYI.com experience. The initial upfront payments were recognized on the Company’s Consolidated Balance Sheet as deferred advertising revenue. The deferred advertising revenue is recognized on the Company’s Consolidated Statement of Operations ratably over the 90-day term of each agreement.
In June 2014, we entered into a Membership Acquisition Agreement (the “Acquisition Agreement”) with Zoosk, whereby we received an upfront payment of $500,000 in two installments in exchange for implementing certain integration features on our AYI.com website and application that advertise Zoosk during the term of the Acquisition Agreement. We are entitled to a payout (amount up to a maximum of $1,000,000) for each person that registers with Zoosk through the integration features during the term of the Acquisition Agreement. The term of the Acquisition Agreement commences on August 15, 2014 and ends ninety days thereafter, on November 13, 2014.
Prior to these agreements, our advertising revenue was historically a small portion of our revenue and primarily consisted of revenue from display ads. We generally reported our advertising revenue net of amounts due to agencies, brokers and counterparties. We recognized advertising revenue as earned on a click-through, impression, registration or subscription basis. When a user clicked an advertisement (CPC basis), viewed an advertisement impression (CPM basis), registered for an external website via an advertisement clicked on through our application (CPA basis), or clicked on an offer to subscribe to premium features on our application, the contract amount was recognized as revenue.
Costs and Expenses
Programming, hosting and technology
. Our programming, hosting and technology expense includes salary and stock-based compensation for our engineers and developers, data center, domain name and other hosting expenses and software licensing fees and various other technology related expenses.
Compensation.
Our compensation expense includes salary and stock-based compensation for management and employees (other than expense for engineers and developers included in programming, hosting and technology expenses above).
17
Professional fees.
Our professional fees include fees paid to our independent accounting firm, legal expenses and various other professional fees and expenses incurred in our business.
Advertising and marketing.
Our advertising and marketing expense consists of online advertising, primarily consisting of user acquisition campaigns. We execute these campaigns through direct media buys, affiliates or affiliate networks that advertise or promote our application and earn a fee whenever visitors click through their advertisement to our application or website and create a profile on our application. For our user acquisition campaigns, we pay to market and advertise our application across the Internet, including on Facebook and other third party platforms.
General and administrative.
Our general and administrative expense includes investor relations, public relations, credit card processing fees, overhead and various other employee related expenses.
Non-Operating Expenses
Gain (loss) on change in fair value of warrants.
Our outstanding warrants are considered derivative instruments that require liability classification and mark-to-market accounting. Our warrant liability is marked-to-market at the end of each reporting period on our Condensed Consolidated Balance Sheet, with the changes in fair value reported in earnings on our Condensed Consolidated Statements of Operations. We have included the mark-to-market adjustment on warranty liability as a non-operating expense as we do not believe that it is indicative of our core operating results.
We use a custom model that, at each measurement date, calculates the fair value of the warrant liability using a Monte-Carlo style simulation that uses the following assumptions at each valuation date: (i) closing stock price, (ii) contractual exercise price, (iii) remaining contractual term, (iv) historical volatility of the stock price, (v) an adjusted volatility that incorporates a 10% incremental discount rate premium through a reduction of the volatility estimate to reflect the lack of marketability of the warrants and (vi) risk-free interest rates that are commensurate with the term of the warrant.
An increase or decrease in the fair value of the warrant liability will increase or decrease the amount of our earnings, respectively, separate from income or loss from operations. The primary cause of the change in the fair value of the warrant liability is the value of our common stock. If our common stock price goes up, the value of these derivatives will generally increase, and if our common stock price goes down, the value of these derivatives will generally decrease.
Key Metrics
Our management relies on certain performance indicators to manage and evaluate our business. The key performance indicators set forth below help us evaluate growth trends, establish budgets, measure the effectiveness of our advertising and marketing efforts and assess operational efficiencies. We also discuss net cash used in operating activities under ‟Results of Operations” and ‟Liquidity and Capital Resources” sections. Active subscribers, bookings and Adjusted EBITDA are discussed below.
|
Three Months Ended
|
Six Months Ended
|
|||||||||||||||
|
June 30,
|
June 30,
|
|||||||||||||||
|
2014
|
2013
|
2014
|
2013
|
|||||||||||||
|
Active subscribers (at period end)
|
98,000
|
79,200
|
98,000
|
79,200
|
||||||||||||
|
Bookings
|
$
|
3,021,860
|
$
|
3,114,169
|
$
|
6,422,018
|
$
|
6,085,683
|
||||||||
|
Net cash used in operating activities
|
$
|
(
301,174
|
)
|
$
|
(1,480,086
|
)
|
$
|
(
765,694
|
)
|
$
|
(2,651,931
|
)
|
||||
|
Net loss
|
$
|
(259,678
|
) | $ |
(1,472,413
|
) | $ |
(1,192,775
|
) | $ |
(1,627,483
|
) | ||||
|
Adjusted EBITDA
|
$
|
61,746
|
$
|
(1,130,476
|
)
|
$
|
(677,760
|
)
|
$
|
(2,271,207
|
)
|
|||||
|
Adjusted EBITDA as percentage of total revenues
|
1.8
|
%
|
(35.9
|
)%
|
(10.1
|
)%
|
(34.3
|
)%
|
||||||||
Active Subscribers
We believe that the number of active subscribers is a key operating metric to evaluate the effectiveness of our operating strategies and monitor the financial performance of our business. "Active subscribers" means current users that have prepaid a subscription fee for current access to the AYI application and whose subscription period has not yet expired. We plan to increase this metric by increasing user acquisition campaigns, building a recognizable brand and increasing user engagement on AYI through the development of a superior feature set.
18
Bookings
Bookings is a financial measure representing the aggregate dollar value of subscription fees and micro-transactions received during the period but is not a financial measure that is calculated and presented in accordance with generally accepted accounting principles in the United States of America (“GAAP”). We calculate bookings as subscription revenue recognized during the period plus the change in deferred subscription revenue recognized during the period. We record subscription revenue from subscription fees and micro-transactions as deferred subscription revenue and then recognize that revenue ratably over the length of the subscription term. We use bookings internally in analyzing our financial results to assess operational performance and to assess the effectiveness of, and plan future, user acquisition campaigns. We believe that this non-GAAP financial measure is useful in evaluating our business because we believe, as compared to subscription revenue, it is a better indicator of the subscription activity in a given period. We believe that both management and investors benefit from referring to bookings in assessing our performance and when planning, forecasting and analyzing future periods.
While the factors that affect bookings and subscription revenue are generally the same, certain factors may affect subscription revenue more or less than such factors affect bookings in any period. While we believe that bookings is useful in evaluating our business, it should be considered as supplemental in nature and it is not meant to be a substitute for subscription revenue recognized in accordance with GAAP.
The following table presents a reconciliation of subscription revenue to bookings for each of the periods presented:
|
Three Months Ended
|
Six Months Ended
|
|||||||||||||||
|
June 30,
|
June 30,
|
|||||||||||||||
|
2014
|
2013
|
2014
|
2013
|
|||||||||||||
|
Reconciliation of Subscription Revenue to Bookings
|
||||||||||||||||
|
Subscription revenue
|
$
|
3,151,002
|
$
|
3,150,319
|
$
|
6,290,022
|
$
|
6,578,210
|
||||||||
|
Change in deferred subscription revenue
|
(129,142
|
)
|
(36,150
|
)
|
131,996
|
(492,527
|
)
|
|||||||||
|
Bookings
|
$
|
3,021,860
|
$
|
3,114,169
|
$
|
6,422,018
|
$
|
6,085,683
|
||||||||
Limitations of Bookings
Some limitations of bookings as a financial measure include that:
|
●
|
Bookings does not reflect that we recognize subscription revenue from subscription fees and micro-transactions over the length of the subscription term; and
|
|
|
●
|
Other companies, including companies in our industry, may calculate bookings differently or choose not to calculate bookings at all, which reduces its usefulness as a comparative measure.
|
Because of these limitations, you should consider bookings along with other financial performance measures, including total revenues, subscription revenue, deferred subscription revenue, net loss and our financial results presented in accordance with GAAP.
Adjusted EBITDA
Adjusted EBITDA is a non-GAAP financial measure. Adjusted EBITDA is defined as net loss adjusted to exclude interest income (expense), net, depreciation and amortization expense, gain on change in fair value of warrants and stock-based compensation expense.
We present Adjusted EBITDA because it is a key measure used by our management and Board of Directors to understand and evaluate our core operating performance and trends, to develop short- and long-term operational plans, and to allocate resources to expand our business. In particular, the exclusion of certain expenses in calculating Adjusted EBITDA can provide a useful measure for period-to-period comparisons of the cash operating income generated by our business. We believe that Adjusted EBITDA is useful to investors and others to understand and evaluate our operating results and it allows for a more meaningful comparison between our performance and that of competitors
.
19
Limitations of Adjusted EBITDA
Our use of Adjusted EBITDA has limitations as an analytical tool, and you should not consider this performance measure in isolation from or as a substitute for analysis of our results as reported under GAAP. Some of these limitations are:
|
|
●
|
Adjusted EBITDA does not reflect cash capital expenditure requirements for assets underlying depreciation and amortization expense that may need to be replaced or for new capital expenditures;
|
|
|
●
|
Adjusted EBITDA does not reflect our working capital requirements;
|
|
|
●
|
Adjusted EBITDA does not consider the potentially dilutive impact of stock-based compensation;
|
|
|
●
|
Adjusted EBITDA does not reflect interest expense or interest payments on our outstanding indebtedness;
|
|
|
●
|
Adjusted EBITDA does not reflect the change in fair value of warrants; and
|
|
|
●
|
Other companies, including companies in our industry, may calculate Adjusted EBITDA differently, which reduces its usefulness as a comparative measure.
|
Because of these limitations, you should consider Adjusted EBITDA alongside other financial performance measures, including various cash flow metrics, net income (loss) and our other GAAP results. The following unaudited table presents a reconciliation from net income (loss), the most directly comparable financial measure calculated and presented in accordance with GAAP, to Adjusted EBITDA for each of the periods indicated:
|
Three Months Ended
June 30,
|
Six Months Ended
June 30,
|
|||||||||||||||
|
2014
|
2013
|
2014
|
2013
|
|||||||||||||
|
Reconciliation of Net loss to Adjusted EBITDA:
|
||||||||||||||||
|
Net loss
|
$
|
(259,678
|
)
|
$
|
(1,472,413
|
)
|
$
|
(1,192,775
|
)
|
$
|
(1,627,483
|
)
|
||||
|
Interest expense (income), net
|
5,578
|
(1,440
|
)
|
3,705
|
(3,106
|
)
|
||||||||||
|
Depreciation and amortization expense
|
43,610
|
43,530
|
86,873
|
85,563
|
||||||||||||
|
Gain on change in fair value of warrants
|
-
|
(70,275
|
)
|
(70,275
|
)
|
(1,171,250
|
)
|
|||||||||
|
Stock-based compensation expense
|
272,236
|
370,122
|
494,712
|
445,069
|
||||||||||||
|
Adjusted EBITDA
|
$
|
61,746
|
$
|
(1,130,476
|
)
|
$
|
(677,760
|
)
|
$
|
(2,271,207
|
)
|
|||||
Results of Operations
The following table sets forth Condensed Consolidated Statements of Operations data for each of the periods indicated as a percentage of total revenues:
|
Three Months Ended
|
Six Months Ended
|
|||||||||||||||
|
June 30,
|
June 30,
|
|||||||||||||||
|
2014
|
2013
|
2014
|
2013
|
|||||||||||||
|
Revenues
|
100.0
|
%
|
100.0
|
%
|
100.0
|
%
|
100.0
|
%
|
||||||||
|
Costs and expenses:
|
||||||||||||||||
|
Programming, hosting and technology expense
|
19.4
|
%
|
42.5
|
%
|
23.9
|
%
|
40.8
|
%
|
||||||||
|
Compensation expense
|
25.1
|
%
|
34.2
|
%
|
24.2
|
%
|
28.7
|
%
|
||||||||
|
Professional fees
|
7.6
|
%
|
6.6
|
%
|
7.6
|
%
|
7.2
|
%
|
||||||||
|
Advertising and marketing expense
|
32.2
|
%
|
30.2
|
%
|
38.3
|
%
|
31.5
|
%
|
||||||||
|
General and administrative expense
|
23.1
|
%
|
35.5
|
%
|
24.6
|
%
|
34.2
|
%
|
||||||||
|
Total costs and expenses
|
107.4
|
%
|
149.0
|
%
|
118.7
|
%
|
142.3
|
%
|
||||||||
|
Loss from operations
|
(7.4
|
)%
|
(49.0
|
)%
|
(18.7
|
)%
|
(42.3
|
)%
|
||||||||
|
Interest income (expense), net
|
(0.2
|
)%
|
0.0
|
%
|
(0.1
|
)%
|
0.0
|
%
|
||||||||
|
Gain on change in fair value of warrants
|
0.0
|
%
|
2.2
|
%
|
1.0
|
%
|
17.7
|
%
|
||||||||
|
Loss before provision for income taxes
|
(7.5
|
)%
|
(46.7
|
)%
|
(17.7
|
)%
|
(24.6
|
)%
|
||||||||
|
Provision for income taxes
|
0.0
|
%
|
0.0
|
%
|
0.0
|
%
|
0.0
|
%
|
||||||||
|
Net loss
|
(7.5
|
)%
|
(46.7
|
)%
|
(17.7
|
)%
|
(24.6
|
)%
|
||||||||
20
Three Months Ended June 30, 2014 Compared to Three Months Ended June 30, 2013
Revenues
Revenues increased to $3,450,010 for the three months ended June 30, 2014, from $3,151,989 for the three months ended June
30, 2013.
The increase is mainly driven by advertising revenue principally derived from our Business Development Agreement with Match.com.
The following table sets forth our subscription revenue, advertising revenue and total revenues for the three months ended June 30, 2014 and the three months ended June 30, 2013, the increase between those periods, the percentage increase between those periods, and the percentage of total revenue that each represented for those periods:
|
% Revenue
|
||||||||||||||||||||||||
|
Three Months Ended
|
Three Months Ended
|
|||||||||||||||||||||||
|
June 30,
|
June 30,
|
|||||||||||||||||||||||
|
2014
|
2013
|
Increase
|
% Increase
|
2014
|
2013
|
|||||||||||||||||||
|
Subscription revenue
|
3,151,002
|
3,150,319
|
683
|
0.0
|
%
|
91.3
|
%
|
99.9
|
%
|
|||||||||||||||
|
Advertising revenue
|
299,008
|
1,670
|
297,338
|
17,804.7
|
%
|
8.7
|
%
|
0.1
|
%
|
|||||||||||||||
|
Total revenues
|
3,450,010
|
3,151,989
|
298,021
|
9.5
|
%
|
100.0
|
%
|
100.0
|
%
|
|||||||||||||||
Subscription –
The results for the three months ended June 30, 2014 reflect a slight increase in subscription revenue of $683 or 0.0%, as compared to the three months ended June 30, 2013. This increase in subscription revenue for the three months ended June 30, 2014, was primarily driven by a slight increase in subscription volume partially offset by a slight decrease in subscription prices. We expect the increase in subscription volume to support revenue growth throughout the remainder of 2014. Subscription revenue as a percentage of total revenue was 91.3% for the three months ended June 30, 2014, as compared to 99.9% for the three months ended June 30, 2013.
Advertising –
The results for the three months ended June 30, 2014 reflect an increase in advertising revenue of $297,338, or 17,804.7%, as compared to the three months ended June 30, 2013. The increase in advertising revenue resulted from revenue recognized under our Business Development Agreement with Match.com. We anticipate advertising revenue to continue to be a contributor to revenue in-line with 2014 quarter end results. Advertising revenue as a percentage of total revenue was 8.7% for the three months ended June 30, 2014, as compared to 0.1% for the three months ended June 30, 2013.
Costs and Expenses
Total costs and expenses for the three months ended June 30, 2014 reflect a decrease in costs and expenses of $992,007, or 21.1%, as compared to the three months ended June 30, 2013. During the three months ended June 30, 2014, we reduced total costs and expenses, including employee headcount. The following table presents our costs and expenses for the three months ended June 30, 2014 and the three months ended June 30, 2013, the increase or decrease between those periods and the percentage increase or decrease between those periods
:
|
Three Months Ended
|
%
|
|||||||||||||||
|
June 30,
|
Increase
|
Increase
|
||||||||||||||
|
2014
|
2013
|
(Decrease)
|
(Decrease)
|
|||||||||||||
|
Programming, hosting and technology expense
|
$
|
669,795
|
$
|
1,339,930
|
$
|
(670,135
|
)
|
(50.0
|
)%
|
|||||||
|
Compensation expense
|
864,859
|
1,078,536
|
(213,677
|
)
|
(19.8
|
)%
|
||||||||||
|
Professional fees
|
262,876
|
206,703
|
56,173
|
27.2
|
%
|
|||||||||||
|
Advertising and marketing expense
|
1,110,726
|
952,248
|
158,478
|
16.6
|
%
|
|||||||||||
|
General and administrative expense
|
795,854
|
1,118,700
|
(322,846
|
)
|
(28.9
|
)%
|
||||||||||
|
Total costs and expenses
|
$
|
3,704,110
|
$
|
4,696,117
|
$
|
(992,007
|
)
|
(21.1
|
)%
|
|||||||
Programming, Hosting and Technology
– The results for the three months ended June 30, 2014 reflect a decrease in programming, hosting and technology expense of $670,135 or 50.0%, as compared to the three months ended June 30, 2013. The decrease in this expense for the three months ended June 30, 2014, was primarily driven by lower consulting expense and hosting expense, as well as reduced headcount. Programming, hosting and technology expense as a percentage of total revenues was 19.4% for the three months ended June 30, 2014, as compared to 42.5% for the three months ended June 30, 2013.
21
Compensation –
The results for the three months ended June 30, 2014 reflect a decrease in compensation expense, which excludes the cost of developers and programmers included in programming, hosting and technology expense above, of $213,677, or 19.8%, as compared to the three months ended June 30, 2013. The decrease in compensation expense for the three months ended June 30, 2014 was primarily driven by decreased stock-based compensation expense and reduced headcount in management and support areas as compared to the comparable period in 2013. Compensation expense as a percentage of total revenues was 25.1% for the three months ended June 30, 2014, as compared to 34.2% for the three months ended June 30, 2013.
Professional fees –
The results for the three months ended June 30, 2014 reflect an increase in professional fees of $56,173, or 27.2%, as compared to the three months ended June 30, 2013. The increase in professional fees for the three months ended June 30, 2014, was primarily driven by an increase in legal and accounting fees. Professional fees as a percentage of total revenues were 7.6% for the three months ended June 30, 2014, as compared to 6.6% for the three months ended June 30, 2013.
Advertising and Marketing –
The results for the three months ended June 30, 2014 reflect an increase in advertising and marketing expense of $158,478, or 16.6%, as compared to the three months ended June 30, 2013. The increase in advertising and marketing expense for the three months ended June 30, 2014, as compared to the prior year period, was primarily driven by an increase in the number and magnitude of user acquisition campaigns. We anticipate that advertising and marketing expense will increase during the remainder of 2014 (as compared to our advertising and marketing expense for the three months ended June 30, 2014) as we promote our AYI application. Advertising and marketing expense as a percentage of total revenues was 32.2% for the three months ended June 30, 2014, as compared to 30.2% for the three months ended June 30, 2013.
General and Administrative –
The results for the three months ended June 30, 2014 reflect a decrease in general and administrative expense of $322,846, or 28.9%, as compared to the three months ended June 30, 2013. The decrease in general and administrative expense for the three months ended June 30, 2014, as compared to the comparable period in the prior year, was primarily driven by lower recruiting and public relations expenses. General and administrative expense as a percentage of total revenues was 23.1% for the three months ended June 30, 2014, as compared to 35.5% for the three months ended June 30, 2013.
Non-Operating Income (Expense)
The following table presents the components of non-operating income for the three months ended June 30, 2014 and the three months ended June 30, 2013, the decrease between those periods and the percentage decrease between those periods:
|
Three Months Ended
|
||||||||||||||||
|
June 30,
|
||||||||||||||||
|
2014
|
2013
|
(Decrease)
|
%
(Decrease)
|
|||||||||||||
|
Interest income (expense), net
|
$
|
(5,578
|
)
|
1,440
|
(7,018
|
)
|
(487.4)
|
%
|
||||||||
|
Gain on change in fair value of warrants
|
-
|
70,275
|
(70,275
|
)
|
(100.0)
|
%
|
||||||||||
|
Total non-operating income
|
$
|
(5,578
|
)
|
71,715
|
(77,293
|
)
|
(107.8)
|
%
|
||||||||
Interest income (expense), net
Interest expense, net for the three months ended June 30, 2014 was $5,578, an increase of $7,018, or 487.4%, as compared to interest income, net of $1,440 for the three months ended June 30, 2013. Interest income (expense), net represented (0.2%) and 0.0% of total revenues for the three months ended June 30, 2014 and 2013, respectively
.
Gain on change in fair value of warrants
Our warrant liability is marked-to-market at each reporting period, with changes in fair value reported in earnings. The mark-to-market gain of $0 for the three months ended June 30, 2014 and $70,275 for the three months ended June 30, 2013 represented the changes in fair value of the warrant liability during those periods. Gain on change in fair value of warrants represented 0% and 2.2% of total revenues for the three months ended June 30, 2014 and 2013, respectively.
Six Months Ended June 30, 2014 Compared to Six Months Ended June 30, 2013
Revenues
Revenues increased to $6,742,363 for the six months ended June 30, 2014, from $6,621,549 for the six months ended June 30, 2013.
The increase is mainly driven by advertising revenue principally derived from our Business Development Agreement with Match.com.
22
The following table sets forth our subscription revenue, advertising revenue and total revenues for the six months ended June 30, 2014 and the six months ended June 30, 2013, the increase or decrease between those periods, the percentage increase or decrease between those periods, and the percentage of total revenue that each represented for those periods:
|
% Revenue
|
||||||||||||||||||||||||
|
Six Months Ended
|
%
|
Six Months Ended
|
||||||||||||||||||||||
|
June 30,
|
Increase
|
Increase
|
June 30,
|
|||||||||||||||||||||
|
2014
|
2013
|
(Decrease)
|
(Decrease)
|
2014
|
2013
|
|||||||||||||||||||
|
Subscription revenue
|
6,290,022
|
6,578,210
|
(288,188
|
)
|
(4.4
|
)%
|
93.3
|
%
|
99.3
|
%
|
||||||||||||||
|
Advertising revenue
|
452,341
|
43,339
|
409,002
|
943.7
|
%
|
6.7
|
%
|
0.7
|
%
|
|||||||||||||||
|
Total revenues
|
6,742,363
|
6,621,549
|
120,814
|
1.8
|
%
|
100.0
|
%
|
100.0
|
%
|
|||||||||||||||
Subscription –
The results for the six months ended June 30, 2014 reflect a decrease in subscription revenue of $288,188, or 4.4%, as compared to the six months ended June 30, 2013. The decrease in subscription revenue for the six months ended June 30, 2014, was primarily driven by a decrease in subscription prices driven by periodic promotions which was partially offset by higher subscription volume. Subscription revenue as a percentage of total revenue was 93.3% for the six months ended June 30, 2014, as compared to 99.3% for the six months ended June 30, 2013
.
Advertising –
The results for the six months ended June 30, 2014 reflect an increase in advertising revenue of $409,002, or 943.7%, as compared to the six months ended June 30, 2013. The increase in advertising revenue resulted from revenue recognized under our Business Development Agreement with Match.com. We anticipate advertising revenue to continue to be a contributor to revenue in-line with 2014 year to date results. Advertising revenue as a percentage of total revenue was 6.7% for the six months ended June 30, 2014, as compared to 0.7% for the six months ended June 30, 2013.
Costs and Expenses
Total costs and expenses for the six months ended June 30, 2014 reflect a decrease in costs and expenses of $1,421,680, or 15,1%, as compared to the six months ended June 30, 2013. During the six months ended June 30, 2014, we reduced total costs and expenses, including employee headcount. The following table presents our costs and expenses for the six months ended June 30, 2014 and the six months ended June 30, 2013, the increase or decrease between those periods and the percentage increase or decrease between those periods
:
|
Six Months Ended
|
%
|
|||||||||||||||
|
June 30,
|
Increase
|
Increase
|
||||||||||||||
|
2014
|
2013
|
(Decrease)
|
(Decrease)
|
|||||||||||||
|
Programming, hosting and technology expense
|
$
|
1,612,206
|
$
|
2,701,321
|
$
|
(1,089,115
|
)
|
(40.3
|
)%
|
|||||||
|
Compensation expense
|
1,634,262
|
1,899,606
|
(265,344
|
)
|
(14.0
|
)%
|
||||||||||
|
Professional fees
|
513,031
|
473,807
|
39,224
|
8.3
|
%
|
|||||||||||
|
Advertising and marketing expense
|
2,582,937
|
2,083,929
|
499,008
|
23.9
|
%
|
|||||||||||
|
General and administrative expense
|
1,659,272
|
2,264,725
|
(605,453
|
)
|
(26.7
|
)%
|
||||||||||
|
Total costs and expenses
|
$
|
8,001,708
|
$
|
9,423,388
|
$
|
(1,421,680
|
)
|
(15.1
|
)%
|
|||||||
Programming, Hosting and Technology
– The results for the six months ended June 30, 2014 reflect a decrease in programming, hosting and technology expense of $1,089,115 or 40.3%, as compared to the six months ended June 30, 2013. The decrease in this expense for the six months ended June 30, 2014, was primarily driven by reduced consulting expense, hosting expense and reduced headcount. Programming, hosting and technology expense as a percentage of total revenues was 23.9% for the six months ended June 30, 2014, as compared to 40.8% for the six months ended June 30, 2013.
Compensation –
The results for the six months ended June 30, 2014 reflect a decrease in compensation expense, which excludes the cost of developers and programmers included in programming, hosting and technology expense above, of $265,344, or 14.0%, as compared to the six months ended June 30, 2013. The decrease in compensation expense for the six months ended June 30, 2014 was primarily driven by reduced headcount in management and support areas as compared to the comparable period in 2013. Compensation expense as a percentage of total revenues was 24.2% for the six months ended June 30, 2014, as compared to 28.7% for the six months ended June 30, 2013.
Professional fees –
The results for the six months ended June 30, 2014 reflect an increase in professional fees of $39,224, or 8.3%, as compared to the six months ended June 30, 2013. The increase in professional fees for the six months ended June 30, 2014, was primarily driven by an increase in legal and accounting fees. Professional fees as a percentage of total revenues were 7.6% for the six months ended June 30, 2014, as compared to 7.2% for the six months ended June 30, 2013.
23
Advertising and Marketing –
The results for the six months ended June 30, 2014 reflect an increase in advertising and marketing expense of $499,008, or 23.9%, as compared to the six months ended June 30, 2013. The increase in advertising and marketing expense for the six months ended June 30, 2014, as compared to the prior year period, was primarily driven by an increase in the number of user acquisition campaigns. We anticipate that advertising and marketing expense will increase during the remainder of 2014 (as compared to our advertising and marketing expense for the six months ended June 30, 2014) as we promote our AYI application. Advertising and marketing expense as a percentage of total revenues was 38.3% for the six months ended June 30, 2014, as compared to 31.5% for the six months ended June 30, 2013.
General and Administrative –
The results for the six months ended June 30, 2014 reflect a decrease in general and administrative expense of $605,453, or 26.7%, as compared to the six months ended June 30, 2013. The decrease in general and administrative expense for the six months ended June 30, 2014, as compared to the comparable period in the prior year, was primarily driven by lower recruiting expenses, public relations expenses and reduced headcount. General and administrative expense as a percentage of total revenues was 24.6% for the six months ended June 30, 2014, as compared to 34.2% for the six months ended June 30, 2013.
Non-Operating Income (Expense)
The following table presents the components of non-operating income for the six months ended June 30, 2014 and the six months ended June 30, 2013, the decrease between those periods and the percentage decrease between those periods:
|
Six Months Ended
|
||||||||||||||||
|
June 30,
|
%
|
|||||||||||||||
|
2014
|
2013
|
(Decrease)
|
(Decrease)
|
|||||||||||||
|
Interest income (expense), net
|
$
|
(3,705
|
)
|
3,106
|
(6,811
|
)
|
(219.3
|
)%
|
||||||||
|
Gain on change in fair value of warrants
|
70,275
|
1,171,250
|
(1,100,975
|
)
|
(94.0
|
)%
|
||||||||||
|
Total non-operating income
|
$
|
66,570
|
1,174,356
|
(1,107,786
|
)
|
(94.3
|
)%
|
|||||||||
Interest income (expense), net
Interest expense, net for the six months ended June 30, 2014 was $3,705, an increase of $6,811, or 219.3%, as compared to the interest income, net $3,106 for the six months ended June 30, 2013. Interest expense, net represented 0.1% of total revenues for the six months ended June 30, 2014 as compared to 0.0% for the six months ended June 30, 2013.
Gain on change in fair value of warrants
Our warrant liability is marked-to-market at each reporting period, with changes in fair value reported in earnings. The mark-to-market gain of $70,275 for the six months ended June 30, 2014 and $1,171,250 for the six months ended June 30, 2013 represented the changes in fair value of the warrant liability during those periods. Gain on change in fair value of warrants represented 1.0% and 17.7% of total revenues for the six months ended June 30, 2014 and 2013, respectively.
Liquidity and Capital Resources
|
Six Months Ended
|
||||||||
|
June 30,
|
||||||||
|
2014
|
2013
|
|||||||
|
Consolidated Statements of Cash Flows Data:
|
||||||||
|
Net cash used in operating activities
|
$
|
(765,694
|
)
|
$
|
(2,651,931
|
)
|
||
|
Net cash used in investing activities
|
(5,913
|
)
|
(87,932
|
)
|
||||
|
Net cash provided by financing activities
|
400,000
|
-
|
||||||
|
Net decrease in cash and cash equivalents
|
$
|
(371,607
|
)
|
$
|
(2,739,863
|
)
|
||
We have historically financed our operations through cash generated from our equity offering in January 2011, subscription fees received from our application, fees for premium features on our application, advertising revenues and promissory notes from investors.
24
As of June 30, 2014, we had $555,745 in cash and cash equivalents, as compared to cash and cash equivalents of $927,352 as of December 31, 2013. Historically, our working capital has been generated through operations and equity offerings. If we continue to grow and expand our operations, our need for working capital will increase. Though we have reduced cash used in operating activities, we do not anticipate being profitable during 2014. Our growth objectives require a continued investment in advertising and marketing expense during the remainder of 2014 to acquire new users. We intend to finance our business and growth with cash on hand, cash provided from operations, borrowings, debt or equity offerings, or some combination thereof. However, we expect to be cash flow positive during the remainder of 2014 without obtaining any additional capital.
We have also incurred debt as a means of generating liquidity. As of June 30, 2014, the outstanding principal amount of our debt was $400,000, which consisted of two promissory notes, each of which is discussed in more detail below.
Carrella Note
As of June 30, 2014, we had approximately $100,000 of outstanding indebtedness under a promissory note with Thomas Carrella. The promissory note with Mr. Carrella is due and payable on the earlier of February 20, 2015 and an event of default and bears interest at a rate of fifteen percent (15%) per annum. The Company calculated the fair value of the warrant using Black-Scholes option pricing model and recorded $4,750 of deferred financing costs related to the issuance of the warrant that will be amortized over the term of the promissory note.
We used the proceeds from this promissory note for general corporate purposes, including working capital
.
Lerner Note
As of June 30, 2014, we had approximately $300,000 of outstanding indebtedness under a promissory note with Clifford Lerner. The promissory note with Mr. Lerner is due and payable on the earlier of January 24, 2015 and an event of default and bears interest at a rate of nine percent (9%) per annum. We used the proceeds from this promissory note for general corporate purposes, including working capital.
A significant portion of our expenses are related to user acquisition costs. Our advertising and marketing expenses are primarily spent on channels where we can estimate the return on investment without long-term commitments. Accordingly, we can adjust our advertising and marketing expenditures quickly based on the expected return on investment, which provides flexibility and enables us to manage our advertising and marketing expense.
Operating Activities
Net cash used in operating activities was $765,694 for the six months ended June 30, 2014, as compared to net cash used in operating activities of $2,651,931 for the six months ended June 30, 2013. This decrease in net cash used in operating activities of $1,886,237 was primarily a result of the increase in deferred subscription revenue and advertising revenue, as well as our efforts to reduce costs and expenses
.
Significant items impacting cash flow in the six months ended June 30, 2014 included significant cash outlays relating to advertising and marketing expense and programming, hosting and technology expense, increases in compensation expense, professional fees and related benefits. These uses of cash were offset in part by collections in subscription revenues received during the period.
Significant items impacting cash flow in the six months ended June 30, 2013 included significant cash outlays relating to advertising and marketing expense and increases in programming, hosting and technology expense, professional fees and related benefits associated with the growth of our business. These uses of cash were offset in part by collections in subscription revenues received during the period.
Investing Activities
Cash used in investing activities for the six months ended June 30, 2014 and 2013 was $5,913 and $87,932, respectively. Cash used in investing activities included purchases of property and equipment totaling $3,731 and $35,550 during the six months ended June 30, 2014 and 2013, respectively. These purchases consisted primarily of computers and servers during the periods. We continue to invest in technology hardware and software to support our growth. These purchases were offset by the repayment of a promissory note for $47,818 during the six months ended June 30, 2014
.
Financing Activities
Cash provided by financing activities for the six months ended June 30, 2014 was $400,000. The increase relates to promissory notes issued during the period totaling $400,000 (See Note 11 in the Notes to the Condensed Consolidated Financial Statements)
.
There was no cash provided by financing activities for the six months ended June 30, 2013.
Off-Balance Sheet Arrangements
As of June 30, 2014, we did not have any off-balance sheet arrangements.
Contractual Obligations and Commitments
During the six months ended June 30, 2014, there were no material changes to the Company’s contractual obligations and commitments from those disclosed in “Note 15. Commitments” in the Notes to the Condensed Consolidated Financial Statements included in our Annual Report on Form 10-K for the year ended December 31, 2013, filed with the SEC on March 5, 2014, which is hereby incorporated by reference herein.
25
Critical Accounting Policies and Estimates
The discussion and analysis of our financial condition and results of operations are based upon our condensed consolidated financial statements that have been prepared in accordance with GAAP. The preparation of these financial statements requires us to make estimates and assumptions that affect the reported amounts of assets and liabilities at the date of the financial statements and the reported amounts of revenue and expenses during the reporting period. Significant estimates relied upon in preparing these financial statements include the provision for future credit card chargebacks and refunds on subscription revenue, estimates used to determine the fair value of our common stock, stock options, non-cash capital stock issuances, stock-based compensation and common stock warrants, collectability of our accounts receivable and the valuation allowance on deferred tax assets. Management evaluates these estimates on an ongoing basis. Changes in estimates are recorded in the period in which they become known. We base estimates on historical experience and various other assumptions that we believe to be reasonable under the circumstances. Actual results may differ from our estimates.
During the six months ended June 30, 2014, there were no material changes to our significant accounting policies from those contained in our Annual Report on Form 10-K for the year ended December 31, 2013, filed with the SEC on March 5, 2014, which is hereby incorporated by reference herein.
26
Not applicable.
Evaluation of Disclosure Controls and Procedures
Our management, including our chief executive officer and chief financial officer, evaluated the effectiveness of our disclosure controls and procedures (as defined in Rules 13a-15(e) or 15d-15(e) under the Exchange Act) as of the end of the period covered by this report. There are inherent limitations to the effectiveness of any system of disclosure controls and procedures. In designing and evaluating the disclosure controls and procedures, management recognized that any controls and procedures, no matter how well designed and operated, can provide only reasonable assurance of achieving the desired control objectives.
Based on the evaluation as of June 30, 2014, for the reasons set forth below, our chief executive officer and chief financial officer concluded that our disclosure controls and procedures were not effective to provide reasonable assurance that information we are required to disclose in reports that we file or submit under the Exchange Act is recorded, processed, summarized and reported within the time periods specified in the SEC’s rules and forms, and that such information is accumulated and communicated to our management, including our chief executive officer and chief financial officer, as appropriate, to allow timely decisions regarding required disclosure.
A material weakness is a deficiency, or a combination of deficiencies, in internal control over financial reporting, such that there is a reasonable possibility that a material misstatement of the Company's annual or interim financial statements will not be prevented or detected on a timely basis. In its assessment of the effectiveness of internal control our financial reporting as of June 30, 2014, the Company determined that the following items constituted a material weakness:
|
●
|
The Company did not have an independent audit committee in place, which would provide oversight of the Company’s officers, operations and financial reporting function; and
|
|
|
●
|
The Company did not have effective internal controls in place over its financial statement close process, which could result in the Company's failure to detect material misstatements in the Company's financial statements.
|
Changes in Internal Control over Financial Reporting
There have been no changes in our internal control over financial reporting (as defined in Rules 13a-15(f) or 15d-15(f) under the Exchange Act) during the period covered by this report that have materially affected, or are reasonably likely to materially affect, our internal control over financial reporting.
27
To the best of our knowledge, there are no material pending legal proceedings to which we are a party or of which any of our property is the subject.
There were no material changes to the Risk Factors disclosed in “Item 1A. Risk Factors” of our Annual Report on Form 10-K for the year ended December 31, 2013, as updated by the Risk Factors disclosed in “Item 1A. Risk Factors” of our Quarterly Report on Form 10-Q for the quarter ended March 31, 2014. For more information concerning our risk factors, please see “Item 1A. Risk Factors” of our Annual Report on Form 10-K, as updated by “Item 1A. Risk Factors” of our Quarterly Report on Form 10-Q for the quarter ended March 31, 2014
.
Stock Option
On June 17, 2014, we issued a stock option to purchase 25,000 shares of our common stock to Alexander Harrington as consideration for his service as a director on our Board of Directors. The stock option has an exercise price of $0.31 per share. The shares underlying the stock option will vest on the first anniversary of the date of grant, provided that Mr. Harrington is providing services to us on such date. The issuance of the stock option was exempt from registration under Section 4(a)(2) and Regulation D of the Securities Act of 1933, as amended, as a transaction not involving a public offering
.
Warrant
On May 20, 2014, we issued a warrant to purchase 25,000 shares of our common stock to Thomas Carrella in connection with the issuance of a promissory note. The warrant has an exercise price equal to $0.32 per share of common stock underlying the warrant and, if unexercised, expires on May 20, 2019. The issuance of the warrant was exempt from registration under Section 4(a)(2) and Regulation D of the Securities Act of 1933, as amended, as a transaction not involving a public offering.
None.
None.
None.
28
(a) Exhibits required by Item 601 of Regulation S-K.
|
Exhibit
Number
|
Description
|
|
|
3.1
|
Certificate of Incorporation, dated July 19, 2005 (incorporated by reference to Exhibit 3.1 to the Registration Statement on Form S-1 of the Company filed on February 11, 2011 by the Company with the SEC).
|
|
|
3.2
|
Certificate of Amendment of Certificate of Incorporation, dated November 20, 2007 (incorporated by reference to Exhibit 3.2 to the Registration Statement on Form S-1 of the Company filed on February 11, 2011 by the Company with the SEC).
|
|
|
3.3
|
Amended and Restated By-Laws of Snap Interactive, Inc., as amended April 19, 2012 (incorporated by reference to Exhibit 3.1 to the Current Report on Form 8-K of the Company filed on April 25, 2012 by the Company with the SEC).
|
|
|
10.1*†
|
Business Development Agreement, dated November 27, 2013, by and between Snap Interactive, Inc. and Match.com, L.L.C.
|
|
|
10.2*†
|
Amendment No. 1 to Business Development Agreement, dated April 16, 2014, by and between Snap Interactive, Inc. and Match.com, L.L.C.
|
|
|
10.3*
|
Promissory Note, dated April 24, 2014, issued by Snap Interactive, Inc.
|
|
|
10.4*
|
Promissory Note, dated May 20, 2014, issued by Snap Interactive, Inc.
|
|
|
10.5*†
|
Membership Acquisition Agreement, dated as of June 25, 2014, by and between Snap Interactive, Inc. and Zoosk, Inc.
|
|
|
31.1 *
|
Certification of the Chief Executive Officer pursuant to Section 302 of the Sarbanes-Oxley Act of 2002.
|
|
|
31.2 *
|
Certification of the Chief Financial Officer pursuant to Section 302 of the Sarbanes-Oxley Act of 2002.
|
|
|
32.1 *
|
Certification of the Chief Executive Officer and Chief Financial Officer pursuant to Section 906 of the Sarbanes-Oxley Act of 2002.
|
|
|
101 *
|
The following materials from the Company’s Quarterly Report on Form 10-Q for the quarter ended June 30, 2014, formatted in XBRL (eXtensible Business Reporting Language), (i) Condensed Consolidated Balance Sheets, (ii) Condensed Consolidated Statements of Operations, (iii) Condensed Consolidated Statement of Changes in Stockholders’ Equity, (iv) Condensed Consolidated Statements of Cash Flows and (v) Notes to Condensed Consolidated Financial Statements.
|
*Filed herewith.
†Confidential treatment has been requested with respect to certain portions of this Exhibit. Omitted portions have been filed separately with the Securities and Exchange Commission.
29
Pursuant to the requirements of the Securities Exchange Act of 1934, the registrant has duly caused this report to be signed on its behalf by the undersigned, thereunto duly authorized.
|
SNAP INTERACTIVE, INC.
|
|||
|
Date:
August 11, 2014
|
By:
|
/s/ Clifford Lerner
|
|
|
Clifford Lerner
President and Chief Executive Officer
(Principal Executive Officer)
|
|||
|
Date:
August 11, 2014
|
By:
|
/s/ Alexander Harrington
|
|
|
Alexander Harrington
Chief Operating Officer and
Chief Financial Officer
(Principal Financial and Accounting Officer)
|
|||
30
TABLE OF CONTENTS
Part I Financial InformationItem 1. Financial StatementsItem 2. Management S Discussion and Analysis Of Financial Condition and Results Of OperationsItem 3. Quantitative and Qualitative Disclosures About Market RiskItem 4. Controls and ProceduresPart Ii: Other InformationItem 1. Legal ProceedingsItem 1A. Risk FactorsItem 2. Unregistered Sales Of Equity Securities and Use Of ProceedsItem 3. Defaults Upon Senior SecuritiesItem 4. Mine Safety DisclosuresItem 5. Other InformationItem 6. Exhibits