United States
SECURITIES AND
EXCHANGE COMMISSION
Washington, D.C.
20549
FORM
20-F
[
] REGISTRATION STATEMENT PURSUANT TO SECTION 12(b) OR (g) OF
THE SECURITIES EXCHANGE ACT OF 1934
OR
[X] ANNUAL
REPORT PURSUANT TO SECTION 13 OR 15 (d) OF THE SECURITIES EXCHANGE
ACT OF 1934
For the fiscal
year ended June 30, 2017
OR
[
] TRANSITION REPORT PURSUANT TO SECTION 13 OR 15 (d) OF THE
SECURITIES EXCHANGE ACT OF 1934
OR
[ ] SHELL
COMPANY REPORT PURSUANT TO SECTION 13 OR 15 (d) OF THE SECURITIES
AND EXCHANGE ACT OF 1934
Date of event
requiring this shell company report ___
For the
transition period from ____ to ____
Commission file
number 001-13542
IRSA Inversiones
y Representaciones Sociedad Anónima
(Exact name of Registrant as
specified in its charter)
IRSA Investments
and Representations Inc.
(Translation of Registrant’s
name into English)
Republic of
Argentina
(country of incorporation or
organization)
Bolívar
108
(C1066AAD)
Ciudad
Autónoma de Buenos Aires, Argentina
(
Address of principal executive
offices)
Matías
Gaivironsky - Chief Financial and Administrative
Officer
Tel +54(11)
4323-7449 - finanzas@irsa.com.ar
Moreno 877 24th
Floor (C1091AAQ) - Ciudad Autónoma de Buenos Aires,
Argentina
(Name, Telephone, E-mail and/or
address of Company Contact Person)
Securities registered or to be
registered pursuant to Section 12 (b) of the Act
|
|
|
|
|
|
Title of each class
|
|
|
Name of each exchange on which
registered
|
|
Global Depositary Shares, each
representing ten shares of Common Stock
|
|
|
New York Stock Exchange
|
|
Common Stock, par value one Peso per
share
|
|
|
New York Stock
Exchange*
|
*Not for trading, but only in
connection with the registration of Global Depositary Shares,
pursuant to the requirements of the Securities and Exchange
Commission.
Securities registered or to be
registered pursuant to Section 12 (g) of the Act: None
Securities for which there is a
reporting obligation pursuant to Section 15 (d) of the Act:
None
Indicate the number of outstanding
shares of each of the issuer’s classes of capital or common
stock as of the period covered by the annual report:
578,676,460.
Indicate by check mark if the
registrant is a well-known seasoned issuer, as defined in Rule 405
of the Securities Act:
☐
Yes
x
No
If this report is an annual or
transition report, indicate by check mark if the registrant is not
required to file reports pursuant to Section 13 or 15 (d) of the
Securities Exchange Act of 1934.
x
Yes
☐
No
Indicate by check mark whether the
registrant (1) has filed all reports required to be filed by
Section 13 or 15 (d) of the Securities and Exchange Act of 1934
during the preceding 12 months (or of such shorter period that the
registrant was required to file such reports), and (2) has been
subject to such filing requirements for the past 90
days: xYes
☐
No
Indicate by check mark whether the
registrant has submitted electronically and posted on its corporate
Web site, if any, every Interactive Data File required to be
submitted and posted pursuant to Rule 405 of the Regulation S-T
(232.405 of this chapter) during the preceding 12 months (or for
such shorter period that the registrant was required to submit and
post such files).
☐
Yes xNo
Indicate by check mark whether the
registrant is a large accelerated filer, an accelerated filer, a
non-accelerated filer, or an emerging growth company. See
definition of “accelerated filer and large accelerated
filer” in Rule 12b-2 of the Exchange Act. (check
one):
Large accelerated filer
☐
Accelerated filer
x Non-accelerated filer
☐
Emerging growth company
☐
If an emerging growth company
that prepares its financial statements in accordance with U.S.
GAAP, indicate by check mark if the registrant has elected not to
use the extended transition period for complying with any new or
revised financial accounting standards provided pursuant to Section
13(a) of the Exchange Act.
☐
The term “new or revised
financial accounting standard” refers to any update issued by
the Financial Accounting Standards Board to its Accounting
Standards Codification after April 5, 2012.
Indicate by check mark which basis
of accounting the registrant has used to prepare the financial
statements included in this filing:
i
|
U.S. GAAP
☐
|
International Financial Reporting
Standards as issued by the International Accounting statements
included in this filing: x
|
Other
☐
|
If “Other” has been
checked in response to the previous question, indicate by check
mark which financial statement item the registrant has elected to
follow:
Item 17
☐
Item 18
☐
If this is an annual report,
indicate by check mark whether the registrant is a shell company
(as defined in Rule 12b-2 of the Exchange Act):
☐
Yes x
No
(APPLICABLE ONLY TO ISSUERS
INVOLVED IN BANKRUPTCY PROCEEDINGS DURING THE PAST FIVE
YEARS)
Indicate by check mark whether the
registrant has filed all documents and reports required to be filed
by Sections 12, 23 or 15(d) of the Securities Exchange Act of 1934
subsequent to the distribution of securities under a plan confirmed
by the court. Yes
☐
No
☐
Please send
copies of notices and communications from the Securities and
Exchange Commission to:
|
Carolina Zang
|
|
David Williams
Jaime Mercado
|
|
Zang Vergel &
Viñes
|
|
Simpson Thacher & Bartlett
LLP
|
|
Florida 537 piso
18º
C1005AAK Buenos Aires,
Argentina.
|
|
425 Lexington Avenue
New York, NY 10017
|
ii
Table of
Contents
IRSA INVERSIONES
Y REPRESENTACIONES SOCIEDAD ANÓNIMA
|
Disclaimer regarding forward-looking statements
|
v
|
|
Presentation of financial and certain other
information
|
v
|
|
Part I
|
1
|
|
Item 1. Identity of directors, senior management, advisers and
auditors
|
1
|
|
Item 2. Offer statistics and expected timetable
|
1
|
|
Item 3. Key information
|
1
|
|
A. Selected consolidated financial data
|
1
|
|
B. Capitalization and indebtedness
|
9
|
|
C. Reasons for the offer and use of proceeds
|
9
|
|
D. Risk factors
|
9
|
|
Item 4. Information on the company
|
59
|
|
A. History and development of the company
|
59
|
|
B. Business overview
|
72
|
|
C. Organizational structure
|
136
|
|
D. Property, plant and equipment
|
137
|
|
Item 4A. Unresolved staff comments
|
138
|
|
Item 5. Operating and financial review and
prospects
|
138
|
|
A. Operating results
|
139
|
|
B. Liquidity and capital resources
|
193
|
|
C. Research and development, patents and licenses, etc
|
201
|
|
D. Trend information
|
201
|
|
E. Off-balance sheet arrangements
|
203
|
|
F. Tabular disclosure of contractual obligations
|
204
|
|
G. Safe harbor
|
204
|
|
Item 6. Directors, senior management and employees
|
204
|
|
A. Directors and senior management
|
204
|
|
B. Compensation
|
211
|
|
C. Board practices
|
213
|
|
D. Employees
|
214
|
|
E. Share ownership
|
215
|
|
Item 7. Major shareholders and related party
transactions
|
216
|
|
A. Major shareholders
|
216
|
|
B. Related party transactions
|
217
|
|
C. Interests of experts and counsel
|
221
|
iii
|
Item 8. Financial information
|
221
|
|
A. Consolidated statements and other financial
information
|
221
|
|
B. Significant changes
|
229
|
|
Item 9. The offer and listing
|
230
|
|
A. The offer and listing details
|
230
|
|
B. Plan of distribution
|
231
|
|
C. Markets
|
231
|
|
D. Selling shareholders
|
234
|
|
E. Dilution
|
234
|
|
F. Expenses of the issue
|
234
|
|
Item 10. Additional information
|
234
|
|
A. Share capital
|
234
|
|
B. Memorandum and articles of association
|
234
|
|
C. Material contracts
|
240
|
|
D. Exchange controls
|
240
|
|
E. Taxation
|
245
|
|
F. Dividends and paying agents
|
253
|
|
G. Statement by experts
|
253
|
|
H. Documents on display
|
253
|
|
I. Subsidiary information
|
253
|
|
Item 11. Quantitative and qualitative disclosures about market
risk
|
253
|
|
Item 12. Description of securities other than equity
securities
|
253
|
|
A. Debt securities
|
253
|
|
B. Warrants and rights
|
253
|
|
C. Other securities
|
253
|
|
D. American depositary shares
|
254
|
|
Part II
|
255
|
|
Item 13. Defaults, dividend arrearages and
delinquencies
|
255
|
|
Item 14. Material modifications to the rights of security holders
and use of proceeds
|
255
|
|
A. Fair price provision
|
255
|
|
B. Limitations on the payment of dividends
|
257
|
|
Item 15. Controls and procedures
|
257
|
|
A. Disclosure controls and procedures
|
257
|
|
B. Management’s annual report on internal control over
financial reporting
|
257
|
|
C. Attestation report of the registered public accounting
firm
|
258
|
|
D. Changes in internal control over financial
reporting
|
258
|
|
Item 16. [reserved]
|
258
|
|
A. Audit committee financial expert
|
258
|
|
B. Code of ethics
|
258
|
|
C. Principal accountant fees and services
|
259
|
|
D. Exemption from the listing standards for audit
committees
|
259
|
|
E. Purchase of equity securities by the issuer and affiliated
purchasers
|
259
|
|
F. Change in registrant´s certifying account
|
259
|
|
G. Corporate governance
|
269
|
|
H. Mine safety disclosures
|
261
|
|
Part III
|
262
|
|
Item 17. Financial statements
|
262
|
|
Item 18. Financial statements
|
262
|
|
Item 19. Exhibits
|
262
|
iv
DISCLAIMER REGARDING FORWARD-LOOKING STATEMENTS
The
U.S. Private Securities Litigation Reform Act of 1995 provides a
“safe harbor” for forward-looking
statements.
This
annual report includes forward-looking statements, principally
under “Item 3.D. Risk Factors,”
“Item 4. Information on the Company,” and
“Item 5. Operating and Financial Review and
Prospects.” We have based these forward-looking statements
largely on our current beliefs, expectations and projections about
future events and financial trends affecting our business. Many
important factors, in addition to those discussed elsewhere in this
annual report, could cause our actual results to differ
substantially from those anticipated in our forward-looking
statements, including, among other things:
Factors
that could cause actual results to differ materially and adversely
include but are not limited to:
●
changes in general
economic, financial, business, political, legal, social or other
conditions in Argentina or elsewhere in Latin America or in Israel
or changes in developed or emerging markets;
●
changes in capital
markets in general that may affect policies or attitudes toward
lending to or investing in Argentina or Argentine companies,
including volatility in domestic and international financial
markets;
●
deterioration in
regional, national and international business and economic
conditions;
●
inflation;
●
fluctuations in
prevailing interest rates;
●
increases in
financing costs or our inability to obtain additional financing on
attractive terms, which may limit our ability to fund existing
operations and to finance new activities;
●
current and future
government regulation and changes in law or in the interpretation
by Argentine courts of the recently adopted Civil and Commercial
Code, among others;
●
adverse legal or
regulatory disputes or proceedings;
●
fluctuations and
declines in the aggregate principal amount of Argentine public debt
outstanding;
●
political events,
civil strife and armed conflicts;
●
government
intervention in the private sector and in the economy, including
through nationalization, expropriation, regulation or other
actions;
●
restrictions on
transfer of foreign currencies and other exchange
controls;
●
increased
competition in the shopping mall sector, office or other commercial
properties and related industries;
●
potential loss of
significant tenants at our shopping malls, offices and/ or other
commercial properties;
●
our ability to
timely transact in the real estate market in Argentina or
Israel;
●
our ability to meet
our debt obligations;
●
shifts in consumer
purchasing habits and trends;
●
technological
changes and our potential inability to implement new
technologies;
●
deterioration in
regional and national businesses and economic conditions in
Argentina;
●
incidents of
government corruption that adversely impact on the development of
real estate projects;
●
fluctuations in the
exchange rate of the Peso and the NIS against other
currencies;
●
risks related to
our investment in Israel; and
●
the risk factors
discussed under “Item 3.D. Risk
Factors.”
You can
identify forward-looking statements because they contain words such
as “believes,” “expects,”
“may,” “will,” “should,”
“seeks,” “intends,” “plans,”
“estimates,” “anticipates,”
“could,” “target,” “projects,”
“contemplates,” “potential,”
“continue” or similar expressions. Forward-looking
statements include information concerning our possible or assumed
future results of operations, business strategies, financing plans,
competitive position, industry environment, potential growth
opportunities, the effects of future regulation and the effects of
competition. Forward-looking statements speak only as of the date
they were made, and we undertake no obligation to update publicly
or to revise any forward-looking statements after we distribute
this annual report because of new information, future events or
other factors. In light of the risks and uncertainties described
above, the forward-looking events and circumstances discussed in
this annual report might not occur and are not guarantees of future
performance.
As of
June 30, 2017, the Company has established two operations centers
to manage its global business, which we refer to in this annual
report as the “Operations Center in Argentina” and the
“Operations Center in Israel.”
You
should not place undue reliance on such statements which speak only
as of the date that they were made. These cautionary statements
should be considered in connection with any written or oral
forward-looking statements that we might issue in the
future.
CERTAIN MEASUREMENTS AND TERMS
As used
throughout this annual report, the terms “IRSA,” the
“Company,” “we,” “us” and
“our” refer to IRSA Inversiones y Representaciones
Sociedad Anónima
,
together with our consolidated subsidiaries, except where we make
clear that such terms refer only to the parent
company.
In
Argentina the standard measure of area in the real estate market is
the square meter (m2), while in the United States and certain other
jurisdictions the standard measure of area is the square foot (sq.
ft.). All units of area shown in this annual report (
e.g.,
gross leasable area of buildings
(“GLA” or “gross leasable area”,) and size
of undeveloped land) are expressed in terms of square meters. One
square meter is equal to approximately 10.764 square feet. One
hectare is equal to approximately 10,000 square meters and to
approximately 2.47 acres.
As used
herein, GLA in the case of shopping malls, refers to the total
leasable area of the property, regardless of our ownership interest
in such property (excluding common areas and parking and space
occupied by supermarkets, hypermarkets, gas stations and co-owners,
except where specifically stated).
PRESENTATION OF FINANCIAL AND CERTAIN OTHER
INFORMATION
This
annual report contains our Audited Consolidated Financial
Statements as of June 30, 2017 and 2016 for our fiscal years ended
June 30, 2017, 2016 and 2015 (our “Audited Consolidated
Financial Statements”). Our Audited Consolidated Financial
Statements included elsewhere herein have been audited by Price
Waterhouse & Co S.R.L. City of Buenos Aires, Argentina, member
of PriceWaterhouseCoopers International Limited, an independent
registered public accounting firm whose report is included
herein.
Pursuant
to Resolution No. 562/09 issued by the Argentine
Comisión Nacional de Valores
(“CNV”), as subsequently amended by Resolution No.
576/10, and further amended and restated by Resolution No. 622/13
(the “CNV Rules”), all listed companies in Argentina
with certain exceptions (
i.e.
, financial institutions and
insurance entities) were required to present their consolidated
financial statements for accounting periods beginning on or after
January 1, 2012 in accordance with International Financial
Reporting Standards (“IFRS”) as issued by the
International Accounting Standards Board (“IASB”).
Therefore, in 2013 we prepared for the first time our Consolidated
Financial Statements under IFRS for our financial year ended June
30, 2013, which included comparative financial information for the
year ended June 30, 2012. All IFRS issued by the IASB effective at
the time of preparing the Audited Consolidated Financial Statements
have been applied. The opening IFRS statement of financial position
was prepared as of our transition date of July 1,
2011.
IDB
Development Ltd.’s (“IDBD”) fiscal year ends on
December 31 each year and IRSA’s fiscal year ends on June 30.
Furthermore, IDBD’s quarterly and annual reporting follow the
guidelines of Israeli standards, which means that the information
is only available after the applicable statutory terms in
Argentina. Therefore, is possible to include IDBD’s quarterly
results in its Consolidated Financial Statements to be filed with
the CNV within the applicable statutory terms in Argentina. The
IDBD’s results of operations are consolidated with a
three-month lag, adjusted by the effects of material transactions
that may take place during the reported period. Hence, IDBD’s
results of operations for the 12-month period beginning April 1,
2016 through March 31, 2017 are included in the Company’s
Consolidated Statement of Comprehensive Income for the fiscal year
ended June 30, 2017, adjusted by such material transactions
occurred between April 1, 2017 and June 30, 2017. In addition,
IDBD’s results of operations for the period beginning October
11, 2015 (the date of control obtained of IDBD) through March 31,
2016 are included in the Company’s Consolidated Statement of
Comprehensive Income for the fiscal year ended June 30, 2016,
adjusted by such material transactions occurred between April 1,
2016 and June 30, 2016.
v
The Company has established two
Operations Centers to manage its global business, mainly through
the following companies:
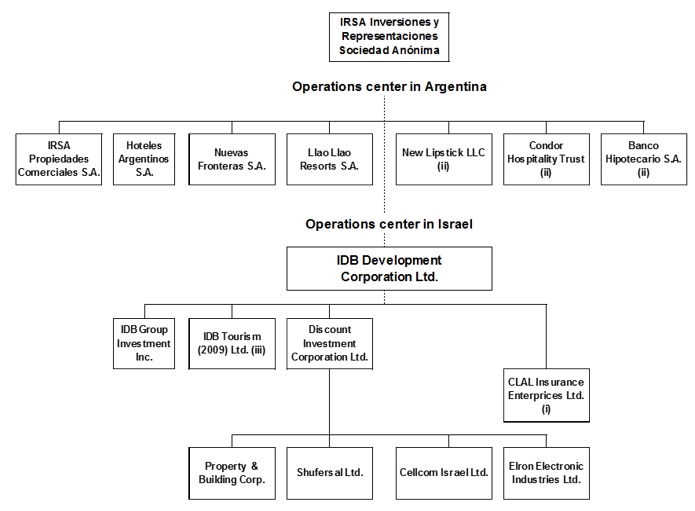
(i)
Remains in current and non-current assets, as
financial asset held for sale.
(ii)
Corresponds to Company’s associates, which
are hence excluded from consolidation.
(iii)
Disclosed in groups of assets and liabilities
held for sale.
vi
Currency
translations and rounding
Our functional and presentation
currency is the Peso, and accordingly our financial statements
included in this annual report are presented in Pesos. We have
translated some of the Peso amounts contained in this annual report
into U.S. dollars for convenience purposes only. Unless otherwise
specified or the context otherwise requires, the rate used to
convert Peso amounts to U.S. dollars is the seller exchange rate
quoted by Banco de la Nación Argentina of Ps.16.6300 per
US$1.00 for information provided as of June 30, 2017. The average
seller exchange rate for the fiscal year 2017, quoted by Banco de
la Nación Argentina was Ps.15.4517. The U.S. dollar-equivalent
information presented in this annual report is provided solely for
the convenience of investors and should not be construed as
implying that the Peso amounts represent, or could have been or
could be converted into, U.S. dollars at such rates or at any other
rate. We have also translated certain NIS amounts into U.S. dollars
at the offer exchange rate for June 30, 2017 which was NIS
3.4854=U.S.$1.00. We make no representation that the Peso, NIS or
U.S. dollar amounts actually represent or could have been or could
be converted into U.S. dollars at the rates indicated, at any
particular rate or at all. See “Item 3 – Key
information - Local Exchange Market and Exchange
Rates.”
Certain numbers and percentages
included in this annual report have been subject to rounding
adjustments. Accordingly, figures shown for the same category
presented in various tables or other sections of this annual report
may vary slightly, and figures shown as totals in certain tables
may not be the arithmetic aggregation of the figures that precede
them.
Fiscal
years
References to fiscal years 2017,
2016, 2015, 2014 and 2013 are to our fiscal years starting on
July 1 and ending on June 30 of each such
year.
Market share
data
Information regarding market share
in a specified region or area is based on data compiled by us from
internal sources and from publications such as Bloomberg, the
International Council of Shopping Centers, or “ICSC,”
the Argentine Chamber of Shopping Malls (Cámara Argentina de
Shopping Centers), and Colliers International. While we believe
that these sources are reliable, we have not independently verified
the information prepared by these sources.
vii
This item is not
applicable.
This item is not
applicable.
A. Selected
Consolidated Financial Data
The following selected consolidated
financial data has been derived from our Audited Consolidated
Financial Statements as of the dates and for each of the periods
indicated below. This information should also be read in
conjunction with our Audited Consolidated Financial Statements
included under “Item 8. Financial Information” and the
discussion in “Item 5. Operating and Financial Review and
Prospects.” The selected Consolidated Statement of
Comprehensive Income data for the years ended June 30, 2017, 2016
and 2015, and the selected Consolidated Statement of Financial
Position data as of June 30, 2017, 2016, 2015 and 2014 have been
derived from our Consolidated Financial Statements included in this
annual report which have been audited by Price Waterhouse & Co.
S.R.L., City of Buenos Aires, Argentina, a member firm of
PricewaterhouseCoopers International Limited, an independent
registered public accounting firm.
On October 11, 2015, we obtained
control of IDBD. In conformity with IFRS 3, IDBD’s
information is included in our financial statements since the
acquisition date, without affecting the information from previous
years. Therefore, the consolidated financial information for
periods after the acquisition date is not comparable to previous
periods. For more information see “Item 5. Operating and
Financial Review and Prospects−Factors Affecting
Comparability of our Results.”
The Company’s Board of
Directors decided to change the accounting policy for investment
property from cost model to fair value model, as permitted under
IAS 40. The Company considers this change more reliably reflects
the current value of its core assets. The Company has therefore
retroactively recast the previously issued Consolidated Financial
Statements as required by IAS 8.
Due to as mentioned in the paragraph
above, we recalculated the SEC rule S-X 3-09 to evaluate
significance of investments accounted using the equity
method. As a results of the test, there are no significant
3-09 entities for three years ended 2017.
1
Summary
Consolidated Financial and Other Information
|
|
For the
fiscal year ended June 30,
|
|||||
|
|
2017
|
2017
|
2016
(recast)
|
2015
(recast)
|
2014
(recast)
|
2013
(recast)
|
|
|
(in millions
of US$) (ii)
|
(in millions
of Ps.) (i)
|
||||
|
CONSOLIDATED STATEMENT OF
INCOME
|
|
|
|
|
|
|
|
Revenues
|
4,460
|
74,172
|
31,523
|
3,403
|
2,845
|
2,188
|
|
Costs
|
(3,098
)
|
(51,521
)
|
(21,099
)
|
(1,369
)
|
(1,157
)
|
(898
)
|
|
Gross
profit
|
1,362
|
22,651
|
10,424
|
2,034
|
1,688
|
1,290
|
|
Net gain from fair
value adjustment of investment properties
|
268
|
4,453
|
17,559
|
3,958
|
4,139
|
3,536
|
|
General and
administrative expenses
|
(231
)
|
(3,843
)
|
(1,839
)
|
(374
)
|
(297
)
|
(195
)
|
|
Selling
expenses
|
(808
)
|
(13,441
)
|
(5,704
)
|
(194
)
|
(146
)
|
(106
)
|
|
Other operating
results, net
|
(16
)
|
(270
)
|
(51
)
|
33
|
(59
)
|
(35
)
|
|
Profit from
operations
|
574
|
9,550
|
20,389
|
5,457
|
5,325
|
4,490
|
|
Share of profit /
(loss) of associates and joint ventures
|
11
|
185
|
508
|
(813
)
|
(328
)
|
91
|
|
Profit from operations before
financial results and income tax
|
585
|
9,735
|
20,897
|
4,644
|
4,997
|
4,581
|
|
Finance
income
|
65
|
1,081
|
1,296
|
137
|
132
|
120
|
|
Finance
costs
|
(519
)
|
(8,628
)
|
(5,668
)
|
(1,107
)
|
(1,749
)
|
(773
)
|
|
Other financial
results
|
176
|
2,929
|
(518
)
|
37
|
(102
)
|
15
|
|
Financial results,
net
|
(278
)
|
(4,618
)
|
(4,890
)
|
(933
)
|
(1,719
)
|
(638
)
|
|
Profit before income
tax
|
308
|
5,117
|
16,007
|
3,711
|
3,278
|
3,943
|
|
Income
tax
|
(175
)
|
(2,915
)
|
(6,373
)
|
(1,581
)
|
(1,392
)
|
(1,338
)
|
|
Profit from continuing
operations
|
132
|
2,202
|
9,634
|
2,130
|
1,886
|
2,605
|
|
Profit from
discontinued operations
|
181
|
3,018
|
444
|
—
|
—
|
—
|
|
Total profit for the
year
|
314
|
5,220
|
10,078
|
2,130
|
1,886
|
2,605
|
|
Profit from continuing
operations attributable to:
|
|
|
|
|
|
|
|
Equity holders of
the parent
|
107
|
1,786
|
9,325
|
1,898
|
1,762
|
2,521
|
|
Non-controlling
interest
|
25
|
416
|
309
|
232
|
124
|
84
|
|
Total profit for the year
attributable to:
|
|
|
|
|
|
|
|
Equity holders of
the parent
|
182
|
3,030
|
9,534
|
1,898
|
1,762
|
2,521
|
|
Non-controlling
interest
|
132
|
2,190
|
544
|
232
|
124
|
84
|
|
Profit per common share from
continuing operations attributable to equity holders of the
parent:
|
|
|
|
|
|
|
|
Basic
|
0.19
|
3.11
|
16.22
|
3.31
|
3.06
|
4.35
|
|
Diluted
|
0.19
|
3.08
|
16.11
|
3.28
|
3.06
|
4.35
|
|
Total profit for the year per
common share attributable to equity holders of the
parent:
|
|
|
|
|
|
|
|
Basic
|
0.32
|
5.27
|
16.58
|
3.31
|
3.06
|
4.35
|
|
Diluted
|
0.31
|
5.23
|
16.47
|
3.28
|
3.06
|
4.35
|
|
|
|
|
|
|
|
|
|
CONSOLIDATED STATEMENT OF
COMPREHENSIVE INCOME
|
|
|
|
|
|
|
|
Profit for the
year
|
314
|
5,220
|
10,078
|
2,130
|
1,886
|
2,605
|
|
Other comprehensive income /
(loss):
|
|
|
|
|
|
|
|
Items
that may be subsequently reclassified to profit or
loss:
|
|
|
|
|
|
|
|
Currency translation
adjustment
|
231
|
3,839
|
4,353
|
(108
)
|
545
|
78
|
|
Net change in fair value of
hedging instruments
|
7
|
124
|
3
|
—
|
—
|
—
|
|
Items that may not be
subsequently reclassified to profit or loss, net of income
tax
|
|
|
|
|
|
|
|
Actuarial loss from defined
benefit plans
|
(1
)
|
(10
)
|
(29
)
|
—
|
—
|
—
|
|
Other
comprehensive income / (loss) from continuing
operations
|
238
|
3,953
|
4,327
|
(108
)
|
545
|
78
|
|
Other comprehensive income
/ (loss) from discontinued operations
|
34
|
560
|
(194
)
|
—
|
—
|
—
|
|
Total
other comprehensive income / (loss) for the year
|
271
|
4,513
|
4,133
|
(108
)
|
545
|
78
|
|
Total
comprehensive income for the year
|
585
|
9,733
|
14,211
|
2,022
|
2,431
|
2,683
|
|
Total comprehensive income
from continuing operations
|
370
|
6,155
|
13,961
|
2,022
|
2,431
|
2,683
|
|
Total comprehensive income
from discontinued operations
|
215
|
3,578
|
250
|
—
|
—
|
—
|
|
Total
comprehensive income for the year
|
585
|
9,733
|
14,211
|
2,022
|
2,431
|
2,683
|
|
Total
comprehensive income from continuing operations attributable
to:
|
|
|
|
|
|
|
|
Equity holders of the
parent
|
143
|
2,380
|
9,466
|
1,773
|
2,202
|
2,588
|
|
Non-controlling
interest
|
227
|
3,775
|
4,495
|
249
|
229
|
95
|
|
Total
comprehensive income for the year attributable to:
|
|
|
|
|
|
|
|
Equity holders of the
parent
|
244
|
4,054
|
9,605
|
1,773
|
2,202
|
2,588
|
|
Non-controlling
interest
|
341
|
5,679
|
4,606
|
249
|
229
|
95
|
|
CASH
FLOW DATA
|
|
|
|
|
|
|
|
Net cash generated by
operating activities
|
545
|
9,059
|
4,139
|
834
|
1,022
|
863
|
|
Net cash (used in) /
generated by investing activities
|
(124
)
|
(2,068
)
|
8,210
|
261
|
(917
)
|
(46
)
|
|
Net cash generated by /
(used in) financing activities
|
92
|
1,537
|
(3,968
)
|
(1,390
)
|
(597
)
|
(306
)
|
2
|
|
For the
fiscal year ended June 30,
|
|||||
|
|
2017
|
2017
|
2016
(recast)
|
2015
(recast)
|
2014
(recast)
|
2013
(recast)
|
|
|
(in millions
of
US$)(ii)
|
(in millions
of Ps.) (i)
|
||||
|
CONSOLIDATED STATEMENTS OF
FINANCIAL POSITION
|
|
|
|
|
|
|
|
ASSETS
|
|
|
|
|
|
|
|
Non-current
assets
|
|
|
|
|
|
|
|
Investment
properties
|
6,010
|
99,953
|
82,703
|
19,217
|
15,796
|
12,642
|
|
Property, plant and
equipment
|
1,630
|
27,113
|
24,049
|
237
|
219
|
213
|
|
Trading
properties
|
273
|
4,532
|
4,730
|
141
|
131
|
95
|
|
Intangible
assets
|
745
|
12,387
|
11,763
|
127
|
124
|
173
|
|
Investment in
associates and joint ventures
|
474
|
7,885
|
16,880
|
2,970
|
2,587
|
1,688
|
|
Deferred income tax
assets
|
17
|
285
|
51
|
57
|
41
|
37
|
|
Income tax and
Minimum Presumed Income Tax (“MPIT”)
credit
|
9
|
145
|
123
|
109
|
110
|
130
|
|
Restricted
assets
|
27
|
448
|
54
|
—
|
—
|
11
|
|
Trade and other
receivables
|
299
|
4,974
|
3,441
|
115
|
92
|
85
|
|
Employee
benefits
|
—
|
—
|
4
|
—
|
—
|
—
|
|
Investments in
financial assets
|
107
|
1,772
|
2,226
|
703
|
275
|
267
|
|
Financial assets and
other assets held for sale
|
374
|
6,225
|
3,346
|
—
|
—
|
—
|
|
Derivative financial
instruments
|
2
|
31
|
8
|
206
|
—
|
21
|
|
Total non-current
assets
|
9,967
|
165,750
|
149,378
|
23,882
|
19,375
|
15,362
|
|
Current
Assets
|
|
|
|
|
|
|
|
Trading
properties
|
75
|
1,249
|
241
|
3
|
5
|
12
|
|
Inventories
|
256
|
4,260
|
3,246
|
23
|
17
|
16
|
|
Restricted
assets
|
30
|
506
|
564
|
9
|
—
|
1
|
|
Income tax
credit
|
20
|
339
|
506
|
19
|
16
|
—
|
|
Group of assets held
for sale
|
161
|
2,681
|
—
|
—
|
1,649
|
—
|
|
Trade and other
receivables
|
1,038
|
17,264
|
13,409
|
1,143
|
707
|
769
|
|
Investments in
financial assets
|
719
|
11,951
|
9,656
|
295
|
234
|
244
|
|
Financial assets and
other assets held for sale
|
141
|
2,337
|
1,256
|
—
|
—
|
—
|
|
Derivative financial
instruments
|
3
|
51
|
19
|
29
|
13
|
—
|
|
Cash and cash
equivalents
|
1,495
|
24,854
|
13,866
|
375
|
610
|
797
|
|
Total Current
Assets
|
3,938
|
65,492
|
42,763
|
1,896
|
3,251
|
1,839
|
|
TOTAL ASSETS
|
13,905
|
231,242
|
192,141
|
25,778
|
22,626
|
17,201
|
|
SHAREHOLDERS’
EQUITY
|
|
|
|
|
|
|
|
Capital and reserves
attributable to equity holders of the
parent
|
|
|
|
|
|
|
|
Share capital
|
35
|
575
|
575
|
574
|
574
|
579
|
|
Treasury
stock
|
—
|
4
|
4
|
5
|
5
|
—
|
|
Inflation adjustment of
share capital and treasury stock
|
7
|
123
|
123
|
123
|
123
|
123
|
|
Share premium
|
48
|
793
|
793
|
793
|
793
|
793
|
|
Additional paid-in capital from treasury
stock
|
1
|
17
|
16
|
7
|
—
|
—
|
|
Legal reserve
|
9
|
143
|
117
|
117
|
117
|
85
|
|
Special reserve
|
165
|
2,751
|
2,755
|
2,755
|
3,126
|
3,146
|
|
Other
reserves
|
130
|
2,165
|
990
|
428
|
931
|
563
|
|
Retained earnings
|
1,160
|
19,293
|
16,259
|
7,235
|
4,551
|
3,027
|
|
Total capital and reserves
attributable to equity holders of the
parent
|
1,555
|
25,864
|
21,632
|
12,037
|
10,220
|
8,316
|
|
Non-controlling
interest
|
1,291
|
21,472
|
14,224
|
943
|
998
|
657
|
|
TOTAL
SHAREHOLDERS’ EQUITY
|
2,846
|
47,336
|
35,856
|
12,980
|
11,218
|
8,973
|
|
LIABILITIES
|
|
|
|
|
|
|
|
Non-current
liabilities
|
|
|
|
|
|
|
|
Trade and other
payables
|
183
|
3,040
|
1,518
|
255
|
202
|
211
|
|
Borrowings
|
6,584
|
109,489
|
90,680
|
3,736
|
3,756
|
2,923
|
|
Derivative financial
instruments
|
5
|
86
|
105
|
265
|
321
|
—
|
|
Deferred income tax
liabilities
|
1,384
|
23,024
|
19,150
|
5,830
|
4,546
|
3,467
|
|
Employee
benefits
|
46
|
763
|
689
|
—
|
—
|
—
|
|
Salaries and social
security liabilities
|
8
|
127
|
11
|
2
|
4
|
3
|
|
Provisions
|
57
|
943
|
532
|
29
|
29
|
19
|
|
Total
non-current liabilities
|
8,267
|
137,472
|
112,685
|
10,117
|
8,858
|
6,623
|
|
Current
liabilities
|
|
|
|
|
|
|
|
Trade and other
payables
|
1,253
|
20,839
|
17,874
|
896
|
679
|
677
|
|
Group of liabilities held
for sale
|
112
|
1,855
|
—
|
—
|
938
|
—
|
|
Salaries and social
security liabilities
|
123
|
2,041
|
1,707
|
123
|
99
|
49
|
|
Borrowings
|
1,198
|
19,926
|
22,252
|
1,237
|
737
|
773
|
|
Derivative financial
instruments
|
5
|
86
|
112
|
238
|
14
|
1
|
|
Provisions
|
54
|
890
|
1,039
|
52
|
18
|
14
|
|
MPIT
liabilities
|
48
|
797
|
616
|
135
|
65
|
91
|
|
Total
current liabilities
|
2,792
|
46,434
|
43,600
|
2,681
|
2,550
|
1,605
|
|
TOTAL LIABILITIES
|
11,059
|
183,906
|
156,285
|
12,798
|
11,408
|
8,228
|
|
TOTAL
SHAREHOLDERS’ EQUITY AND LIABILITIES
|
13,905
|
231,242
|
192,141
|
25,778
|
22,626
|
17,201
|
|
|
|
|
|
|
|
|
3
|
|
For the
fiscal year ended June 30,
|
|||||
|
|
2017
|
2017
|
2016
|
2015
|
2014
|
2013
|
|
OTHER
FINANCIAL DATA
|
(in
millions
of US$)
(ii)
|
(in millions
of Ps.)
|
||||
|
|
(except for
number of shares, per share and GDS data and ratios)
|
|||||
|
Basic profit from continuing operations per
GDS
(3)
|
1.90
|
31.1
|
162.2
|
33.1
|
30.6
|
43.5
|
|
Diluted profit from continuing operations per
GDS
(3)
|
1.90
|
30.8
|
161.1
|
32.8
|
30.6
|
43.5
|
|
Basic profit for the year per
GDS
(3)
|
3.2
|
52.7
|
165.8
|
33.1
|
30.6
|
43.5
|
|
Diluted profit for the year per
GDS
(3)
|
3.1
|
52.3
|
164.7
|
32.8
|
30.6
|
43.5
|
|
Diluted weighted –
average number of common shares outstanding
|
578,700,307
|
578,700,307
|
578,811,837
|
578,004,721
|
578,676,470
|
578,676,470
|
|
Depreciation and
amortization
|
284
|
4,715
|
2,085
|
33
|
29
|
31
|
|
Capital
expenditure
|
330
|
5,482
|
47,059
|
532
|
318
|
921
|
|
Working
capital
|
1,146
|
19,058
|
(837
)
|
(785
)
|
701
|
234
|
|
Ratio of current assets to
current liabilities
|
0.08
|
1.41
|
0.98
|
0.71
|
1.27
|
1.15
|
|
Ratio of
shareholders’ equity to total liabilities
|
0.02
|
0.26
|
0.23
|
1.01
|
0.98
|
1.09
|
|
Ratio of non-current assets
to total assets
|
0.04
|
0.72
|
0.78
|
0.93
|
0.86
|
0.89
|
|
Dividend paid
(4)
|
(151
)
|
(2,512
)
|
(106
)
|
(69.00
)
|
(113
)
|
(240
)
|
|
Dividends per common
share
|
(0.26
)
|
(4.37
)
|
(0.18
)
|
(0.12
)
|
(0.20
)
|
(0.41
)
|
|
Dividends per
GDS
|
(2.63
)
|
(43.69
)
|
(1.84
)
|
(1.20
)
|
(1.97
)
|
(4.15
)
|
|
Number of common shares
outstanding
|
575,254,979
|
575,254,979
|
575,153,497
|
574,450,945
|
573,771,763
|
578,676,460
|
|
Capital
Stock
|
575
|
575
|
575
|
574
|
574
|
579
|
(i) Totals may not sum due to
rounding.
(ii) Solely for the convenience of
the reader we have translated Peso amounts into U.S. Dollars at the
seller exchange rate quoted by Banco de la Nación Argentina as
of June 30, 2017, which was Ps.16.63 per US$1.00. The average
seller exchange rate for the fiscal year 2017, quoted by Banco de
la Nación Argentina was Ps.15.4517. We make no representation
that the Argentine Peso or U.S. Dollar amounts actually represent,
could have been or could be converted into U.S. Dollars at the
rates indicated, at any particular rate or at all. See
“Exchange Rates.” Totals may not sum due to
rounding.
(1)
Basic net income per share
is calculated by dividing the net result available to holders of
common shares for the period / year by the weighted average number
of shares outstanding during the period / year.
(2)
Diluted net income per
share is calculated by dividing the net income for the year by the
weighted average number of ordinary shares including treasury
shares.
(3)
Determined by multiplying
the amounts per share by ten (one GDS is equal to ten common
shares).
(4)
Dividend amounts,
corresponding to fiscal years ending on June 30 of each year, are
determined by the Annual Shareholders
’
Meeting, which takes place in October of each
year.
4
Local Exchange Market
and Exchange Rates
Operations Center in
Argentina
The following table shows the
maximum, minimum, average and closing exchange rates for each
period applicable to purchases of U.S. dollars.
|
|
Maximum
(1)(2)
|
Minimum
(1)(3)
|
Average
(1)(4)
|
At
closing
(1)
|
|
Fiscal year ended
June 30, 2013
|
5.3680
|
4.5650
|
4.9339
|
5.3680
|
|
Fiscal year ended
June 30, 2014
|
8.0830
|
5.4850
|
6.9333
|
8.0830
|
|
Fiscal year ended
June 30, 2015
|
9.0380
|
8.1630
|
8.5748
|
9.0380
|
|
Fiscal year ended
June 30, 2016
|
15.7500
|
9.1400
|
12.2769
|
14.9900
|
|
Fiscal year ended
June 30, 2017
|
16.5800
|
14.5100
|
15.4017
|
16.5800
|
|
Month ended April
30, 2017
|
15.4400
|
15.1400
|
15.3058
|
15.3500
|
|
Month ended May 31,
2017
|
16.1350
|
15.2400
|
15.6679
|
16.0500
|
|
Month ended June 30,
2017
|
16.5800
|
15.8280
|
16.0728
|
16.5800
|
|
Month ended July 31,
2017
|
17.7400
|
16.7500
|
17.1430
|
17.5900
|
|
Month ended August
31, 2017
|
17.6730
|
17.0200
|
17.3728
|
17.2600
|
|
Month ended
September 30, 2017
|
17.5300
|
16.9250
|
17.1888
|
17.2600
|
|
October 2017
(through October 25, 2017)
|
17.4500
|
17.2850
|
17.3652
|
17.4400
|
_________________
Source: Central
Bank
(1) Average between the offer
exchange rate and the bid exchange rate according to Banco de la
Nación Argentina “foreign currency exchange rate,”
against Pesos.
(2) The maximum exchange rate
appearing in the table was the highest end-of-month exchange rate
in the year or shorter period, as indicated.
(3) The minimum exchange rate
appearing in the table was the lowest end-of-month exchange rate in
the year or shorter period, as indicated.
(4) Average exchange rates at the
end of the period.
Exchange
controls
During 2001 and 2015, the Argentine
government established a series of exchange control measures that
restricted the free disposition of funds and the transfer of funds
abroad. In 2011, these measures had significantly curtailed access
to the Mercado Único y Libre de Cambios (“MULC”)
by both individuals and private sector entities. This made it
necessary, among other things, to obtain prior approval from the
Central Bank to enter into certain foreign exchange transactions
such as payments relating to royalties, services or fees payable to
related parties of Argentine companies outside
Argentina.
With the change of government and
political environment, in December 2015, one of the first measures
taken by the Argentine government was to lift the main restrictions
that limited access to individuals to the MULC. Through
Communication “A” 5850 and later, as the local economy
stabilized Communication “A” 6037, the Central Bank
lifted the previous limitations and allowed unrestricted access to
the foreign exchange market, subject to some requirements, as
detailed below.
Although most exchange control
regulations were lifted on August 2016, some remain in place and we
cannot give you any assurance that additional exchange control
regulations will not be adopted in the future. Please see
“—Risk Factors—Risks Relating to
Argentina—Exchange controls, restrictions on transfers abroad
and capital inflow restrictions may limit the availability of
international credit.”
5
Exchange controls regulations currently in
effect in Argentina include the following:
Registration Requirements
All incoming and outgoing funds to
and from the MULC and any foreign indebtedness (financial and
commercial) are subject to registration requirements before the
Central Bank for informative purposes, in accordance with
Communication “A” 3602, as amended.
Corporate profits and dividends
Argentine companies may freely
access the MULC for remittances abroad to pay earnings and
dividends in so far as they arise from closed and fully audited
balance sheets and have satisfied applicable certification
requirements.
Pursuant to Resolution E 1/2017 of
the Ministerio de Hacienda and the Communication “A”
6150 of the Argentine Central Bank, it was deleted the obligation
that required non-residents to perform portfolio investments in the
country intended for the holding of private sector financial assets
to maintain for a period of 120 days of permanence the funds in the
country.
As of that resolution and the
provisions of Communication “A” 6244 of the Argentine
Central Bank, there are no restrictions on entry and exit in the
MULC.
Restrictions on the purchase of foreign currency
Domestic
individuals and companies
Communication “A” 5850
and AFIP Resolution No. 3821 modified and replaced the prior
regimes related to, among others, the purchase of external assets
by Argentine residents—domestic individuals and
companies—for investment purposes and for travel, tourism and
family assistance. The regime currently applicable is characterized
by the following:
●
External assets may only be acquired by
Argentine individuals, legal entities from the private sector
incorporated in Argentina that are not authorized to trade on the
foreign exchange market, assets (
patrimonios
), and other entities
incorporated in Argentina and local government
agencies.
●
Access to the local foreign exchange market
without requiring prior Central Bank approval is allowed for an
unlimited amount, for all of the following: real estate investments
abroad, loans granted to non-Argentine residents, Argentine
residents’ contributions of direct investments abroad,
portfolio investment of Argentine individuals abroad, certain other
investments abroad of Argentine residents, portfolio investments of
Argentine legal entities abroad, purchase of foreign currency bills
to be held in Argentina, donations complying certain conditions, as
well as purchase of traveler checks.
●
In the case of foreign currency sales to
Argentine residents for portfolio investments abroad, the transfer
has to be made directly to the bank account of such Argentine
resident, which must be located at foreign banks or financial
institutions that regularly conduct investment banking activities,
which are not incorporated in countries or territories considered
not to be cooperative for purposes of fiscal transparency in terms
of the provisions of Section 1 of the Decree No. 589/13
and its complementary provisions, or in countries or territories
that do not apply the recommendations of the Financial Action Task
Force, or “FATF.”
●
The proceeds of the sale of foreign currency by
Argentine residents in the foreign exchange market for all the
items can be credited in a checking or savings bank account in a
local financial institution in the client’s name or withdrawn
by cash.
●
Regarding the collection for services provided
to non-Argentine residents and/or resulting from the sale of
non-produced non-financial assets exempted from mandatory sale in
the foreign exchange market.
Argentine
residents that receive funds in foreign currency for the payment of
services rendered to non-Argentine residents or for the sale of
non-produced non-financial assets may receive those funds in a
local foreign currency account without exchanging it for Argentine
pesos in the foreign exchange market. Following Communications
“A” 6011 and 6037 of the Central Bank foreign assets
may be acquired for investment purposes by Argentine residents
without limitations. In addition foreign currency may be purchased
through a debit account or through an unlimited cash withdrawal
without limits.
6
Non-residents
Communication “A” 6150
dated January 13, 2017 abolished all restrictions regarding
prior approval from the Central Bank, minimum amounts, or minimum
holding periods to repatriate portfolio investments or direct
investments of non-residents.
Restrictions on exports, imports and services
Regarding exports, in 2016 the
Central Bank relaxed certain rules related to the inflow and
outflow of foreign currency collected abroad as a result of the
collection of exports of goods, advance payments, and pre-export
financings, establishing that the deadline to repatriate to
Argentina the foreign currency is 10 years. The prior
10-business day period applicable for the transfer of funds
collected abroad as a result of the collection of exports of goods,
advance payments, and pre-export financings to a correspondent bank
account of a local financial institution (
cuenta de corresponsalía
) was
eliminated in December 2015. In relation to the export of services,
Communication “A” 6137 the Central Bank eliminated the
obligation to repatriate to Argentina the foreign currency
obtained.
Regarding imports, access to the
foreign exchange market for the payment of imports with customs
clearance date as of December 17, 2015 can be paid through the
local foreign exchange market without any limit. AFIP Regulation
No. 3252 published on January 5, 2012 which required
importers to file affidavits was eliminated in December 2015 and
the import monitoring system (
Sistema Integral de Monitoreo de
Importaciones,
or “SIMI” was created, which
established an obligation for importers to submit certain
information electronically. Importers do not have to repatriate the
goods within a specified period (previously this period was 365
calendar days from the date of access to the foreign exchange
market).
Regarding the payment of services,
the access to the foreign exchange market for payments of services
rendered as from December 17, 2015 may be carried out without
any limits and without the Central Bank’s prior
authorization.
Direct investments
On March 4, 2005, the Central
Bank issued Communication “A” 4305 that regulates the
reporting system of direct investments and real estate investments
carried out by non-residents in Argentina and by Argentine
residents abroad, which had been implemented through Communication
“A” 4237 dated November 10, 2004.
Direct
investments in Argentina of non-Argentine residents
Non-Argentine residents must comply
with the reporting regime if the value of their investments in
Argentina is equivalent to more than US$500,000—measured in
terms of the net worth of the company in which they participate or
fiscal value of the real estate owned. If such value is less than
US$500,000, compliance with such regime is optional. According to
Communication “A” 4237, companies in which
non-Argentine residents participate and administrators of real
estate of non-Argentine residents must comply with the reporting
regime.
Direct
investments made abroad by Argentine residents
Investors who are Argentine
residents must comply with the reporting regime if the value of
their investments abroad is equivalent to more than
US$1,000,000—measured in terms of net worth of the company in
which they participate or the fiscal value of the real estate they
own. If such value is less than the equivalent of US$5,000,000, the
reporting obligation is annual rather than semi-annual. If such
value is less than the equivalent of US$1,000,000, compliance with
such regime is optional.
7
Future and forward operations
The Central Bank has significantly
amended the foreign exchange regulations in derivatives by
eliminating the restriction on the execution of cross-border
derivative transactions. In August 2016, the Central Bank
introduced new foreign exchange regulations on derivative
transactions which allowed local residents from entering into
derivative transactions with foreign residents. Moreover, the
regulations now provide that Argentine residents may access the
foreign exchange market to pay premiums, post collateral and make
payments related to forwards, futures, options and other
derivatives entered into in foreign exchanges or with non-resident
counterparties.
The foreign exchange regulations now
allow Argentine residents to enter into derivative transaction with
foreign counterparties without the need for authorization of the
Central Bank. They also allow them to purchase foreign currency to
make payments under derivative transactions.
For further details regarding the
exchange regulations applicable in Argentina, investors should
consult their professional advisers and read the full text of the
above cited rules on the website of the Ministry of Treasury and of
the Central Bank.
Operations Center in
Israel
The following table shows the
maximum, minimum, average and closing exchange rates for each
period applicable to purchases of New Israeli Shekels
(NIS).
|
|
Maximum
(1)(2)
|
Minimum
(1)(3)
|
Average
(1)(4)
|
At
closing
(1)
|
|
Fiscal
year ended June 30, 2013
|
4.0145
|
3.5851
|
3.7775
|
3.6376
|
|
Fiscal year ended
June 30, 2014
|
3.6213
|
3.4320
|
3.5075
|
3.4320
|
|
Fiscal year ended
June 30, 2015
|
3.9831
|
3.4260
|
3.8064
|
3.7747
|
|
Fiscal year ended
June 30, 2016
|
3.9604
|
3.7364
|
3.8599
|
3.8596
|
|
Fiscal year ended
June 30, 2017
|
3.8875
|
3.4882
|
3.6698
|
3.4882
|
|
Month ended April 30,
2017
|
3.6718
|
3.6218
|
3.6519
|
3.6218
|
|
Month ended May 31,
2017
|
3.6170
|
3.5402
|
3.5916
|
3.5402
|
|
Month ended June 30,
2017
|
3.5562
|
3.4882
|
3.5291
|
3.4882
|
|
Month ended July 31,
2017
|
3.5789
|
3.5071
|
3.5507
|
3.5616
|
|
Month ended August
31, 2017
|
3.6269
|
3.5627
|
3.5992
|
3.5835
|
|
Month ended September
30, 2017
|
3.5736
|
3.4943
|
3.5318
|
3.5340
|
|
October 2017 (through
October 25, 2017)
|
3.5373
|
3.4868
|
3.5065
|
3.5088
|
Source: Bloomberg
(1)
Average between the offer exchange rate and the
bid exchange rate of the New Israeli Shekel against the U.S.
dollar.
(2)
The maximum exchange rate appearing in the table
was the highest end-of-month exchange rate in the year or shorter
period, as indicated.
(3)
The minimum exchange rate appearing in the table
was the lowest end-of-month exchange rate in the year or shorter
period, as indicated.
(4)
Average exchange rates at the end of the
month.
8
B. Capitalization and
Indebtedness
This section is not
applicable.
C. Reasons for
the Offer and Use of Proceeds
This section is not
applicable.
D. Risk
Factors
You should carefully consider the
risks described below, in addition to the other information
contained in this annual report, before making an investment
decision. We also may face additional risks and uncertainties not
currently known to us, or which as of the date of this annual
report we might not consider significant, which may adversely
affect our business. In general, you take more risk when you invest
in securities of issuers in emerging markets, such as Argentina,
than when you invest in securities of issuers in the United States,
and certain other markets. You should understand that an investment
in our common shares and Global Depository Shares
(“GDSs”) involves a high degree of risk, including the
possibility of loss of your entire investment.
Operations Center in
Argentina
Risks Relating to
Argentina
As of the date of this annual
report, most of our operations, property and customers from our
Operations Center in Argentina are located in Argentina. As a
result, the quality of our assets, our financial condition and the
results of our operations from our Operations Center in Argentina
are dependent upon the macroeconomic, regulatory, social and
political conditions prevailing in Argentina from time to time.
These conditions include growth rates, inflation rates, exchange
rates, taxes, foreign exchange controls, changes to interest rates,
changes to government policies, social instability, and other
political, economic or international developments either taking
place in, or otherwise affecting, Argentina.
Economic and political instability in Argentina may adversely and
materially affect our business, results of operations and financial
condition.
The Argentine economy has
experienced significant volatility in recent decades, characterized
by periods of low or negative growth, high levels of inflation and
currency depreciation, and may experience further volatility in the
future.
During 2001 and 2002, Argentina went
through a period of severe political, economic and social crisis.
Among other consequences, the crisis resulted in Argentina
defaulting on its foreign debt obligations, introducing emergency
measures and numerous changes in economic policies that adversely
affected most sectors of the economy, particularly utilities,
financial institutions, and industrial companies. The Argentine
Peso also was subjected to significant real devaluation and
depreciation, which resulted in many Argentine private sector
debtors with foreign currency exposure to default on their
outstanding debt. Following that crisis, Argentine GDP grew 8.9% in
2005, 8.0% in 2006 and 9.0% in 2007. During 2008 and 2009, however,
the Argentine economy suffered a slowdown attributed to local and
external factors, including an extended drought affecting
agricultural activities, and the effects of the global economic
crisis. Real GDP growth recovered in 2010 and 2011 to 10.1% and
6.0%, respectively. However, GDP contracted 1.0% in 2012 and then
grew by 2.4% in 2013. In 2014, economic again contracted by 2.5%.
The Argentine economy has remained under pressure in recent years
with GDP expanding 2.6% in 2015 and contracting 2.3% in 2016
according to data reported by the National Institute of Statistics
(
Instituto Nacional de
Estadisticas y Censos)
, or “INDEC.”
Presidential and Congressional
elections in Argentina were held on October 25, 2015, and a
runoff election between the two leading Presidential candidates was
held on November 22, 2015, which resulted in Mr. Mauricio
Macri being elected President of Argentina. The Macri
administration assumed office on December 10, 2015. Since
taking office, the new administration has announced a policy agenda
aimed at adopting measures that are market friendly and designed to
ensure long-term macroeconomic performance including reducing the
fiscal deficit, eliminating restrictions on capital flows and
access to the exchange rate market, correcting energy and transport
prices and obtaining financing through the capital
markets.
9
The Macri administration has adopted
the following key economic and policy reforms.
●
INDEC
reforms.
President Macri appointed Mr. Jorge Todesca,
previously a director of a private consulting firm, as head of the
INDEC. On January 8, 2016, the Argentine government declared a
state of administrative emergency relating to the national
statistical system and the INDEC, until December 31, 2016.
During 2016, the INDEC implemented certain methodological reforms
and adjusted certain macroeconomic statistics on the basis of these
reforms. Following the declared emergency, the INDEC ceased
publishing statistical data until a rearrangement of its technical
and administrative structure is finalized. During the course of
implementing these reforms, however, INDEC has used official
Consumer Price Index, or “CPI,” figures and other
statistical information published by the Province of San Luis and
the City of Buenos Aires. On June 29, 2016, the INDEC
published revised GDP data for the years 2004 through 2015. On
August 31, 2016, the IMF Executive Board met to consider the
progress made by Argentina in improving the quality of official GDP
and CPI data and noted the important progress made in strengthening
the accuracy of Argentina’s statistics. On November 10,
2016, the IMF lifted the existing censure on Argentina regarding
these data.
●
Agreement with
holdout creditors.
The Argentine government has reached
agreements with substantially all of the holdout bondholders who
had not previously participated in Argentina’s sovereign debt
restructurings (in terms of claims) and regained access to the
international capital markets, issuing several new series of
sovereign bonds since President Macri took office.
●
Foreign
exchange reforms.
In addition, the Macri administration
eliminated a significant portion of foreign exchange restrictions,
including certain currency controls, that were imposed under the
Kirchner administration. On August 9, 2016, the Central Bank
issued Communication “A” 6037 which substantially
changed the existing legal framework and eliminated certain
restrictions limiting access to the foreign exchange market MULC.
The principal measures adopted as of the date of this annual report
include:
i.
the reestablishment of Argentine
residents’ rights to purchase and remit foreign currency
outside of Argentina without limit and without specific allocation
(
atesoramiento
);
ii.
the elimination of the mandatory,
non-transferable and non-interest bearing deposit previously
required in connection with certain transactions involving foreign
currency inflows by reducing the amount of the deposits from 30% to
0%;
iii.
the elimination of the requirement to transfer
and settle the proceeds from new foreign financial indebtedness
incurred by the foreign financial sector, the non-financial private
sector and local governments through the MULC; and
iv.
the elimination of the requirement that proceeds
from debt issuances abroad must be maintained undistributed for a
minimum of 365 calendar days.
●
Foreign trade
reforms.
The Kirchner and Fernández de Kirchner
administrations imposed export duties and other restrictions on
several sectors, particularly the agricultural sector. The Macri
administration eliminated export duties on wheat, corn, beef and
regional products, and reduced the duty on soybeans by 5% to 30%.
Further, the 5% export duty on most industrial exports was
eliminated. With respect to payments for imports of goods and
services, the Macri administration announced the gradual
elimination of restrictions on access to the MULC for any
transactions originated before December 17, 2015. Regarding
transactions executed after December 17, 2015, no quantitative
limitations apply.
10
●
National
electricity state of emergency and reforms.
Following years
of very limited investment in the energy sector, as well as the
continued freeze on electricity and natural gas tariffs since the
2001-2002 economic crisis, Argentina began to experience energy
shortages in 2011. In response to the growing energy crisis, the
Macri administration declared a state of emergency with respect to
the national electricity system, which will remain in effect until
December 31, 2017. The state of emergency enables the
Government to take actions designed to ensure the supply of
electricity to the country, such as instructing the Ministry of
Energy and Mining to design and implement, with the cooperation of
all federal public entities, a coordinated program to guarantee the
quality and security of the electrical grid. In addition, through
Resolution No. 6/2016 of the Ministry of Energy and Mining and
Resolution No. 1/2016 of the National Electricity Regulatory
Agency (
Ente Nacional Regulador de
la Electricidad
), the Macri administration announced the
elimination of a portion of energy subsidies currently in effect
and a substantial increase in electricity rates. As a result,
average electricity prices have already increased and could
increase further. By correcting tariffs, modifying the regulatory
framework and reducing the Government’s involvement in the
sector, the Macri administration aims to correct distortions in the
energy sector and stimulate investment. However, certain of the
Government’s initiatives have been challenged in the
Argentine courts and resulted in judicial injunctions or rulings
limiting the Government’s initiatives.
●
Tariff
increases.
With the aim of encouraging companies to invest
and improve the services they offer and enabling the Government to
assist those in need, the Macri administration has begun updating
the tariffs for electricity, transportation, gas and water
services. Each of the announced tariff increases contemplates a
tarifa social
(social
tariff), which is designed to provide support to vulnerable groups,
including beneficiaries of social programs, retirees and pensioners
who receive up to two minimum pensions, workers who receive up to
two minimum salaries, individuals with disabilities, individuals
registered in the
Monotributo
Social
program, domestic workers and individuals receiving
unemployment insurance.
On
August 18, 2016, the Supreme Court of Argentina in
“
Centro de Estudios para la
Promoción de la Igualdad y la Solidaridad versus Ministry of
Energy and Mining
,” upheld lower court injunctions
suspending the proposed increases in gas tariffs and instructed the
Ministry of Energy and Mining to conduct a non-binding public
hearing prior to sanctioning any such increases. The public
hearings were held on September 16, 2016. Pursuant to the
holding by the Supreme Court, the Gas Regulatory Entity, or
“Enargas,” issued Resolution No. 3960 and 3961
ordering the reestablishment of the prior tariff scheme as of
March 31, 2016, and implemented an installment regime for the
payment of overdue bills.
●
Tax Amnesty
Law.
In July 2016, the
Régimen de Sinceramiento Fiscal
,
or “Tax Amnesty Law,” was introduced to promote the
voluntary declaration of assets by Argentine residents. The Tax
Amnesty Law allows Argentine tax residents holding undeclared funds
or assets located in Argentina or abroad to (i) declare such
property until March 31, 2017 without facing prosecution for
tax evasion or being required to pay past-due tax liabilities on
the assets, if they could provide evidence that the assets were
held by certain specified cut-off dates, and (ii) keep the
declared property outside Argentina and not repatriate such
property to Argentina. With respect to cash that was not deposited
in bank accounts by the specified cut-off dates, such amounts had
to be disclosed and deposited by October 31, 2016 in special
accounts opened at Argentine financial entities. Depending on the
amount declared, how soon it is declared, the election to subscribe
for certain investment securities and the payment method used,
those who took advantage of the Tax Amnesty Law would pay a special
tax of between 0 and 15% on the total amount declared.
Alternatively, they could invest an equivalent amount in Argentine
government bonds or a fund that would finance, among other things,
public infrastructure projects and small to medium-sized businesses
in general. Taxpayers may elect to subscribe for certain investment
securities and reduce the tax rates payable upon disclosure of
previously undisclosed assets. On April 4, 2017, the Finance
Minister of Argentina announced that, as a result, US$116,800
million undeclared assets were declared.
11
●
Retiree
Programs.
On June 29, 2016, Congress passed a bill
approving the
Ley de
Reparación Histórica a los Jubilados
(Historical
Reparations Program for Retirees and Pensioners), which took effect
upon its publication in the official gazette. The main aspects of
this program, which is designed to conform government social
security policies to Supreme Court rulings, include
(i) payments to more than two million retirees and the
retroactive compensation of more than 300,000 retirees and
(ii) the creation of a
pensión universal
(universal
pension) for the elderly, which guarantees an income for all
individuals over 65 years of age who are otherwise ineligible
for retirement. The Historical Reparations Program for Retirees and
Pensioners will give retroactive compensation to retirees in an
aggregate amount of more than Ps.47.0 billion and involve
expenses of up to Ps.75.0 billion to cover all potential
beneficiaries.
●
Fiscal
policy:
The Macri administration reduced the primary fiscal
deficit by approximately 1.8% of GDP in December 2015 through a
series of tax and other measures, and pursued a primary fiscal
deficit target of 4.8% of GDP in 2016 through the elimination of
subsidies and the reorganization of certain expenditures. However,
the primary fiscal deficit for October 2016 increased 183% compared
to the comparable period in 2015, while the aggregated primary
fiscal deficit as of January 2016 represented a 69% increase
compared to the same period of 2015, reaching 4.6% of GDP. The
Macri administration’s ultimate aim is to achieve a balanced
primary budget by 2019.
On February 22, 2017, Finance
Minister Nicolas Dujovne announced fiscal targets for the period
2017-2019, ratifying the target set in the 2017 budget—which
established a primary deficit of 4.2% of GDP for 2017—and
announcing a deficit target of 3.2% for 2018 and 2.2% for 2019. It
also announced quarterly targets as a percentage of GDP for 2017,
of 0.6% for the first quarter; 2.0% for the second, 3.2% for the
third and 4.2% for the last one. Targets for the first and second
quarters have been met.
●
Correction of
monetary imbalances:
The Macri administration announced the
adoption of an inflation targeting regime in parallel with the
floating exchange rate regime and set inflation targets for the
next four years. The Central Bank has increased the use of
stabilization policies to reduce excess monetary imbalances and
reduced Peso interest rates to offset inflationary
pressure.
While some of the measures adopted
have led to higher inflation, there has been an increase in the
demand for pesos and a recovery of credit points toward a gradual
normalization of macroeconomic conditions. To this end, access to
external financing may have a positive effect, by significantly
reducing the monetization of the fiscal deficit without requiring
an abrupt fiscal adjustment that would put economic growth under
pressure. Simultaneously, the inflow of foreign capital would
generate a greater supply of foreign exchange in the MULC limiting
the depreciation of the Argentine peso and its direct impact on
inflation. This, in turn, would increase the demand for real
balances in pesos, allowing for a reduction in interest rates and
further revival of credit demand and economic
activity.
As of the date of this annual
report, the impact that the measures taken by the Macri
administration will have on the Argentine economy as a whole and
the real-estate sector in particular cannot be predicted. In
addition, although the results from the mid-term elections held in
October 2017, were characterized as positive for the Macri
administration, opposition political parties retained a majority of
the seats in the Argentine Congress, which has required and will
require the Macri administration to seek political support from
these parties to implement its proposals creating additional
uncertainty regarding the ability of the Macri administration to
effectively implement its policy agenda.
Higher rates of inflation, any
decline in GDP growth rates and/or other future economic, social
and political developments in Argentina, a lack of stability and
competitiveness of the Peso against other currencies, and a decline
in confidence among consumers and foreign and domestic investors,
among other factors, may materially adversely affect the
development of the Argentine economy which could adversely affect
our financial condition or results of operations.
12
There were concerns about the accuracy of
Argentina
’
s
official inflation statistics.
In January 2007, the INDEC changed
the methodology used to calculate the CPI. At the same time that
the INDEC adopted this change in methodology the Argentine
government also replaced several key officers at the INDEC,
prompting complaints of governmental interference from the
technical staff at the INDEC. In addition, during this period the
IMF requested a number of times that INDEC clarify its methodology
for measuring inflation rates.
On November 23, 2010, the
Argentine government began consulting with the IMF for technical
assistance in order to prepare new national CPI data with the aim
of modernizing the existing statistical system. During the first
quarter of 2011, a team from the IMF started collaborating with the
INDEC in order to create such index. Notwithstanding these efforts,
reports subsequently published by the IMF stated that its staff
also used alternative measures of inflation for macroeconomic
surveillance, including data produced by private sources, and such
measures have shown inflation rates that are considerably higher
than those published by the INDEC since 2007. Consequently, the IMF
called on Argentina to adopt measures to improve the quality of
data used by the INDEC. At a meeting held on February 1, 2013,
the Executive Board of the IMF emphasized that the progress in
implementing remedial measures since September 2012 had been
insufficient. As a result, the IMF issued a declaration of censure
against Argentina in connection with the breach of its related
obligations to the IMF and called on Argentina to adopt remedial
measures to address the inaccuracy of inflation and GDP data
promptly.
In order to address the quality of
official data, a new consumer price index denominated Urban
National Consumers Price Index (
Índice de Precios al Consumidor Nacional
Urbano)
, or the “IPCNu,” was enacted on
February 13, 2014. Inflation measured by the IPCNu was 23.9%
for 2014, 29.2% for 2015 and 33.7% for 2016. The IPCNu represents
the first national indicator in Argentina to measure changes in
prices of household goods for final consumption. While the previous
price index only measured inflation in the Greater Buenos Aires
area, the IPCNu is calculated by measuring prices of goods across
the entire urban population of the 23 provinces of Argentina and
the City of Buenos Aires. On December 15, 2014, the IMF
recognized the progress of Argentine authorities to remedy the
inaccurate provision of data, but has delayed the definitive
evaluation of the new index.
On January 8, 2016, as a result
of the INDEC’s historical inability to produce reliable
statistical data, the Macri administration issued an emergency
decree and ceased publication of national statistics. The INDEC
suspended all publications of statistical data until the technical
reorganization process was completed and the administrative
structure of the INDEC was recomposed. Following this process of
reorganization and recovery, the INDEC began to gradually publish
official data. The INDEC recalculated historical GDP data dating
back to 2014, and GDP growth measures were revised to growth of
2.3% in 2013, contraction of 2.1% in 2014, growth of 2.4% in 2015
and contraction of 2.1% in 2016. GDP as reported by INDEC for the
fourth quarter of 2016 grew 0.5% compared to the comparable quarter
of 2015, in the seasonally adjusted measurement.
The Budget Law for fiscal year 2017
includes targets for CPI variation between 17% and 12% for 2017,
between 8% and 12% for 2018 and between 3.5% and 6.5% for 2019. On
November 9, 2016, the IMF, after analyzing Argentina’s
progress in improving quality of official data on the CPI, decided
to lift the “censure motion” that was imposed in 2013,
concluding that the CPI of Argentina is now in compliance with
international standards. However, we cannot assure you that such
inaccuracy in relation with the economic indicators will not occur
again in the future and, consequently, this circumstance may have
an adverse effect on the Argentine economy and on our financial
results. If despite the changes introduced in the INDEC by the new
government, there are still differences between the figures
published by the INDEC and those recorded by private consultants,
there could be a significant decrease in confidence in the
Argentine economy, which could have an impact on our results of
operations and financial condition.
13
Continuing high inflation may impact the Argentine economy and
adversely affect our results of operations.
Inflation has, in the past,
materially undermined the Argentine economy and the
government’s ability to foster conditions that would permit
stable growth. In recent years, Argentina has confronted
inflationary pressures, evidenced by significantly higher fuel,
energy and food prices, among other factors. In response, the prior
Argentine administration implemented programs to control inflation
and monitor prices for essential goods and services, including
freezing the prices of key products and services, and price support
arrangements agreed between the Argentine government and private
sector companies in several industries and markets.According to
data published by the INDEC, the rate of inflation reached 10.9% in
2010, 9.5% in 2011, 10.8% in 2012, 10.9% in 2013, 23.9% in 2014 and
26.9% in 2015. In November 2015, the INDEC suspended the
publication of the CPI. After implementing certain methodological
reforms and adjusting certain macroeconomic statistics on the basis
of these reforms, in June 2016 the INDEC resumed its publications
of the CPI. At the beginning of 2017, the inflation statistics
started to show a stable deceleration trend in its rates
accordingly with the new inflation targeting policies of the
Central Bank. The inflation rates published by the INDEC for
January, February, March, April, May, June, July, August and
September 2017 were 1.3%, 2.5%, 2.4%, 2.6%, 1.3%, 1.2%, 1.7%, 1.4%,
and 1.9%, respectively. An inflationary environment would undermine
Argentina’s foreign competitiveness by diluting the effects
of a peso devaluation, negatively impact the level of economic
activity and employment and undermine confidence in
Argentina’s banking system, which could further limit the
availability of domestic and international credit. In addition, a
portion of the Argentine debt is adjusted by the Stabilization
Coefficient (
Coeficiente de
Estabilización de Referencia
), or “CER,” a
currency index, that is strongly related to inflation. Therefore,
any significant increase in inflation would cause an increase in
the principal amount of sovereign external debt and consequently in
Argentina’s financial obligations, which could negatively
affect the Argentine economy. A high level of uncertainty and a
general lack of stability in terms of inflation could also lead to
shortened contractual terms and affect the ability to plan and make
investment decisions.Inflation remains a challenge for Argentina.
The Macri administration has set goals to reduce the primary fiscal
deficit as a percentage of GDP over time and also reduce the
Argentine government’s reliance on Central Bank financing. If
despite these measures the Macri administration is unable to
address Argentina’s structural inflationary imbalances, the
prevailing high rates of inflation may continue, which would have
an adverse effect on Argentina’s economy that could lead to
an increase in the principal amount of Argentina’s debt
outstanding as measured in Pesos. Moreover, certain objectives of
the Macri administration, such as the increase in tariffs to
incentivize investment in the energy sector, may result in higher
rates of inflation. Inflation in Argentina has contributed to a
material increase in our costs of operations, in particular labor
costs, and has negatively impacted our financial condition and
results of operations.Inflation rates could increase further in the
future, and there is uncertainty regarding the effects and
effectiveness of the measures adopted, or that may be adopted in
the future, by the Argentine government to control inflation.
Public speculation about possible additional actions have also
contributed significantly to economic uncertainty and heightened
the volatility of the economy. If inflation remains high or
continues to rise, Argentina’s economy may be negatively
impacted and our results of operations could be materially
affected.
Significant fluctuations in the value of the Peso may adversely
affect the Argentine economy as well as our financial
performance.
Since the strengthening of exchange
controls began in late 2011 and after measures were introduced to
limit access to foreign currency by private companies and
individuals (such as requiring an authorization from tax
authorities to access the foreign currency exchange market), the
implied exchange rate, as reflected in the quotations for Argentine
securities that traded on foreign securities markets compared to
the corresponding quotations in the local market, had increased
significantly over the official exchange rate. These measures were
mostly lifted on December 16, 2015. Any reenactment of these
measures may prevent or limit us from offsetting the risk derived
from our exposure to the U.S. dollar and, if so, we cannot predict
the impact of these changes on our financial condition and results
of operations.
14
After several years of moderate
variations in the nominal exchange rate, in 2012 the peso
depreciated approximately 14.3% against the U.S. dollar. This was
followed in 2013 and 2014 by a 32.5% depreciation of the peso
against the U.S. dollar in 2013 and 30.3% in 2014, including a loss
of approximately 21.6% in January 2014 alone. In 2015, the Peso
depreciated 52.7% against the dollar with a 33% depreciation in the
last weeks of December 2015. In 2016 the Peso depreciated a further
20.5% against the dollar. During the first and second quarter of
2017 the exchange rate has remained stable, mainly as a consequence
of the Tax Amnesty Law and its effects on the foreign currency
market.
During the third
quarter of 2017, the political impact of the mid term elections
caused ceratin volatile in the exchange market.
From time to time the Central Bank
may intervene in the foreign exchange market in order to stabilize
the exchange rate of the peso. Additional volatility, appreciation
or depreciation of the peso, or reduction of the Central
Bank’s foreign currency reserves as a result of currency
intervention, could adversely affect the Argentine economy and our
ability to service our obligations as they become due.
If the Peso continues to depreciate,
the Argentine economy may be negatively affected with adverse
consequences on our business and financial condition. Particularly
as a result of our exposure to liabilities denominated in U.S.
dollars. While certain of our office leases are set in U.S.
dollars, we are only partially protected against depreciation of
the Peso and there can be no assurance we will be able to maintain
our U.S. dollar-denominated leases.
On the other hand, a substantial
appreciation of the Peso against the U.S. dollar also presents
risks for the Argentine economy. The appreciation of the Peso
against the U.S. dollar negatively impacts the financial condition
of entities whose foreign currency denominated assets exceed their
foreign currency-denominated liabilities. In addition, in the short
term, a significant real appreciation of the Peso would adversely
affect exports. This could have a negative effect on economic
growth and employment as well as reduce the revenues of the
Argentine public sector by reducing tax collection in real terms,
given its current heavy reliance on taxes on exports.
Certain measures that may be taken by the Argentine government may
adversely affect the Argentine economy and, as a result, our
business and results of operations
In the past, the Argentine
government has increased its intervention in the economy through
the implementation or change of laws and regulations;
nationalizations and expropriations; restrictions on production,
imports and exports; exchange and/or transfer restrictions; direct
and indirect price controls; tax increases, changes in the
interpretation or application of tax laws and other retroactive tax
claims or challenges; cancellation of contract rights; or delays or
denials of governmental approvals.
In November 2008, the Argentine
government enacted Law No. 26,425 which provided for the
nationalization of the
Administradoras de Fondos de Jubilaciones y
Pensiones
. Beginning in April 2012, the Argentine government
moved to nationalize YPF S.A., or “YPF,” and
imposed major changes to the system under which oil companies
operate, principally through the enactment of Law No. 26,741
and Decree No. 1277/2012. In February 2014, the Argentine
government and Repsol S.A., or “Repsol,” announced
that they had reached an agreement on the terms of the compensation
payable to Repsol, as the former principal shareholder of YPF for
the expropriation of Repsol’s YPF shares. Such compensation
totaled US$5 billion, payable by delivery of Argentine
sovereign bonds with various maturities. On April 23, 2014,
the agreement with Repsol was approved by the Argentine Congress
and the matter was resolved on May 8, 2014.
Additionally, on December 19,
2012, the Argentine government issued Decree No. 2,552/12,
which ordered the expropriation of the Predio Rural de Palermo. On
January 4, 2013, the Federal Civil and Commercial Chamber
granted an injunction that blocked the enforceability of such
Decree. However, on June 1, 2015, the injunction was removed.
This decision was appealed and the injunction was reinstated. The
Argentine government lost an appeal to have the injunction revoked.
The government filed a request for dismissal in April 2016. The
court granted registration of the matter and ordered a formal
notification to plaintiff Sociedad Rural Argentina, which filed its
response in November 2016. As of the date of this annual report,
the proceedings are still pending before the Federal Civil and
Commercial Courts No. 8, Secretariat No. 15 of the City
of Buenos Aires. The expropriation of this development without fair
compensation may affect our interest in Entertainment
Holding S.A., or “EHSA,” a joint venture and the
entity that owns the property.
15
Furthermore, on May 18, 2015,
we were notified that the
Agencia
de Administración de Bienes del Estado
, or
“AABE,” revoked the concession agreement granted to our
subsidiary Arcos del Gourmet S.A., through Resolution
No. 170/2014. On June 2, 2015, we filed before the AABE a
request to declare the notification void, as certain formal
proceedings required under Argentine law were not complied with by
the AABE. Furthermore, we filed an administrative appeal requesting
the dismissal of the revocation of the concession agreement and a
lawsuit seeking to declare Resolution No. 170/2014 void. We
also filed a lawsuit in order to judicially pay the monthly rental
fees of the property. As of the date of this annual report, the
“Distrito Arcos” shopping mall continues to operate
normally.
Other examples of government
intervention by the prior administration, include regulations
relating to domestic capital markets approved by the Argentine
Congress in December 2012 and August 2013. These regulations
generally provide for increased intervention in the capital markets
by the government, authorizing, for example, the CNV to appoint
observers with authority to veto the decisions of the board of
directors of publicly-listed companies under certain circumstances
and suspend the board of directors for a period of up to
180 days. Nevertheless, since November 2016 the government has
been working on an amendment to the Capital Markets Law
No. 26,831, or the “Capital Markets Law” which, if
approved, will eliminate CNV’s authorization to appoint the
aforementioned observers.
We cannot assure you that these or
other measures that may be adopted by the Argentine government,
such as expropriation, nationalization, forced renegotiation or
modification of existing contracts, new taxation policies, changes
in laws, regulations and policies affecting foreign trade,
investment, among others, will not have a material adverse effect
on the Argentine economy and, as a consequence, adversely affect
our financial condition, our results of operations and the market
value of our securities.
The Argentine government may order that salary increases be paid to
employees in the private sector, which would increase our operating
costs.
In the past, the Argentine
government has passed laws, regulations and decrees requiring
companies in the private sector to maintain minimum wage levels and
provide specified benefits to employees and may do so again in the
future. In the aftermath of the Argentine economic crisis,
employers both in the public and private sectors experienced
significant pressure from their employees and labor organizations
to increase wages and to provide additional employee benefits.
Since July 2017, the minimum monthly salary of employees to is
Ps.8,860. Due to persistent high rates of inflation, employers in
both the public and private sectors continue to experience
significant pressure from unions and their employees to increase
minimum salaries.
In the future, the government could
take new measures requiring salary increases or additional benefits
for workers, and the labor force and labor unions may apply
pressure for such measures. As of the date of this annual report,
the government and labor representatives were engaged in
negotiations to set national guidelines for salary increases during
2017. Any such increase in wage or worker benefit could result in
added costs and adversely affect the results of operations of
Argentine companies, including us.
Property values in
Argentina could decline significantly.
Property values are influenced by
multiple factors that are beyond our control, such as a decrease in
the demand for real estate properties due to a deterioration of
macroeconomic conditions or an increase in supply of real estate
properties that could adversely affect the value of real estate
properties. We cannot assure you that property values will increase
or that they will not be reduced. A significant part of our
properties are located in Argentina. As a result, a reduction in
the value of properties in Argentina could materially affect our
business and our financial statements due to the valuation of our
investment properties at fair market value.
16
Restrictions on transfers of foreign currency and the repatriation
of capital from Argentina may impair our ability to pay dividends
and distributions.
According to Argentine practices,
the Argentine government may impose restrictions on the exchange of
Argentine currency into foreign currencies and on the remittance to
foreign investors of proceeds from investments in Argentina in
circumstances where a serious imbalance develops in
Argentina’s balance of payments or where there are reasons to
foresee such an imbalance. Beginning in December 2001, the
Argentine government implemented a number of monetary and foreign
exchange control measures that included restrictions on the free
disposition of funds deposited with banks and on the transfer of
funds abroad without prior approval by the Central Bank. With the
administration of President Macri, many of the former restrictions
were lifted.
On January 7, 2003, the Central
Bank issued communication “A” 3859, as amended, which
is still in force and pursuant to which there are no limitations on
companies’ ability to purchase foreign currency and transfer
it outside Argentina to pay dividends, provided that those
dividends arise from net earnings corresponding to approved and
audited financial statements. The transfer of funds abroad by local
companies to pay annual dividends only to foreign shareholders,
based on approved and fully audited financial statements, does not
require formal approval by the Central Bank.
Notwithstanding the above, for many
years, and as a consequence of a decrease in availability of U.S.
dollars in Argentina, the previous Argentine government imposed
informal restrictions on certain local companies and individuals
for purchasing foreign currency. These restrictions on foreign
currency purchases started in October 2011 and tightened
thereafter. As a result of these informal restrictions, local
residents and companies were prevented from purchasing foreign
currency through the MULC for the purpose of making payments
abroad, such as dividends, capital reductions, and payment for
imports of goods and services.
Such restrictions and other foreign
exchange control measures were lifted by the new administration,
moving towards opening Argentina’s foreign exchange market.
In this sense, on December 17, 2015, Communication
“A” 5850 of the Central Bank reestablished the
possibility for non-residents to repatriate their investment
capital and, recently, Communication “A” 6037 of the
Central Bank defined the new regulations that apply to the
acquisition of foreign currency and the elimination of all other
restrictions that impair residents and non-residents to have access
to the foreign exchange market. However, in the future, the
Argentine government or the Central Bank may impose formal
restrictions to the payment of dividends abroad, on capital
transfers and establish additional requirements. Such measures may
negatively affect Argentina’s international competitiveness,
discouraging foreign investments and lending by foreign investors
or increasing foreign capital outflow which could have an adverse
effect on economic activity in Argentina, and which in turn could
adversely affect our business and results of operations.
Furthermore, any restrictions on transferring funds abroad imposed
by the government could undermine our ability to pay dividends on
our ADSs in U.S. dollars.
Exchange controls, restrictions on transfers abroad and capital
inflow restrictions may limit the availability of international
credit.
Until December 2015, many foreign
exchange restrictions and controls had limited the access the
exchange market. On December 16, 2015, the new authorities issued
Communication “A” 5850 of the Central Bank, lifting
most of the restrictions then in place. Among these measures, free
access to the exchange market was granted for the purchase of
foreign currency intended for general purposes, without requiring
prior approval of the Central Bank or the Federal Administration of
Public Revenues (
Administración Federal de Ingresos
Públicos
), or “AFIP,” and the requirement
to deposit 30% of certain capital inflows into Argentina was
eliminated. Towards the end of 2016, the remaining exchange control
restrictions were also lifted by the Central Bank’s
Communication A 6037 and “A” 6150, so to date there is
free access to the exchange market. Pursuant to Resolution E 1/2017
of the Ministerio de Hacienda and the Communication "A" 6150 of the
Argentine Central Bank, it was deleted the obligation that required
non-residents to perform portfolio investments in the country
intended for the holding of private sector financial assets to
maintain for a period of 120 days of permanence the funds in the
country. As of that resolution and the provisions of Communication
“A” 6244 of the Argentine Central Bank, there are no
restrictions on entry and exit in the MULC.
17
Notwithstanding recent measures
adopted by the Macri administration, in the future the Argentine
government could impose further exchange controls or restrictions
on the movement of capital and/or take other measures in response
to capital flight or a significant depreciation of the peso, which
could limit our ability to access the international capital
markets. Such measures could lead to political and social tensions
and undermine the Argentine government’s public finances, as
has occurred in the past, which could adversely affect
Argentina’s economy and prospects for economic growth. For
more information, see “Item 3. Key Information - Local
Exchange Market and Exchange Rates.”
The Argentine economy could be adversely affected by political and
economic developments in other global markets.
Argentina’s economy is
vulnerable to external shocks that could be caused by adverse
developments affecting its principal trading partners. A
significant decline in the economic growth of any of
Argentina’s major trading partners (including Brazil, the
European Union, China and the United States) could have a material
adverse impact on Argentina’s balance of trade and adversely
affect Argentina’s economic growth. In 2016, there were
declines in exports of 4.5% with Chile, 14.3% with MERCOSUR
(Brazil) and 13.5% with China. On the other hand, exports increased
15.6% with NAFTA (the United States, Mexico and Canada), 3.6% with
the European Union and 26.7% with Asian countries each as compared
to 2015. Declining demand for Argentine exports could have a
material adverse effect on Argentina’s economic growth. For
example, the recent significant depreciation of the Brazilian and
Chinese currencies and the current slowdown of their respective
economies may negatively affect the Argentine economy. Moreover,
the political and social instability in Brazil, which includes the
recent removal of the President Dilma Rousseff from office
following an impeachment vote in the Senate, and the uncertainties
arising therefrom and the contraction of Brazil’s economy,
may have an adverse impact on Argentine’s
economy.
In addition, financial and
securities markets in Argentina have been influenced by economic
and market conditions in other markets worldwide. Such was the case
in 2008, when the global economic crisis led to a sudden economic
decline in Argentina in 2009, accompanied by inflationary
pressures, depreciation of the peso and a drop in consumer and
investor confidence. Although economic conditions vary from country
to country, investors’ perception of the events occurring in
one country may substantially affect capital flows into other
countries. International investors’ reactions to events
occurring in one market sometimes demonstrate a
“contagion” effect in which an entire region or class
of investment is disfavored by international investors. Argentina
could be adversely affected by negative economic or financial
developments in other countries, which in turn may have an adverse
effect on our financial condition and results of operations. Lower
capital inflows and declining securities prices negatively affect
the real economy of a country through higher interest rates or
currency volatility. Moreover, Argentina may also be affected by
other countries that have influence over world economic
cycles.
In addition, emerging market
economies have been affected by the recent change in the U.S.
monetary policy, resulting in the unwinding of investments and
increased volatility in the value of their currencies. If interest
rates rise significantly in developed economies, including the
United States, emerging market economies, including Argentina,
could find it more difficult and expensive to borrow capital and
refinance existing debt, which would negatively affect their
economic growth. There is also global uncertainty about the degree
of economic recovery in the United States. Moreover, the recent
challenges faced by the European Union to stabilize certain of its
member economies, such as Greece, have had and may continue to have
international implications affecting the stability of global
financial markets, which has hindered economies
worldwide.
18
The effects of the United Kingdom’s vote to exit from the
European Union and its impact on economic conditions in Latin
America and Argentina and, particularly, on our business,
financial condition, results of operations, prospects and trading
of our notes are uncertain.
On June 23, 2016, the United Kingdom
voted in favor of the United Kingdom exiting the European Union, or
“Brexit.” The possible negative consequences of Brexit
include an economic crisis in the United Kingdom, a short-term
recession and a decrease of investments in public services and
foreign investments. The greatest impact of Brexit may be on the
United Kingdom, however the impact may also be significant to other
members states. As of the date of this annual report, the actions
that the United Kingdom will take to effectively exit from the
European Union or the length of such process are uncertain. Brexit
has caused, and is anticipated to continue causing, volatility in
the financial markets, which may adversely affect business activity
and economic and market conditions in the United Kingdom, the
Eurozone and globally, and could contribute to instability in
global financial and foreign exchange markets. All these effects
could in turn have a material adverse effect on our business,
financial condition and results of operations.
The possible independence of Catalonia may have an impact on
economic conditions in Latin America and Argentina and,
particularly, on our business, financial condition, results of
operations, prospects, generating uncertainty over the trading of
our notes.
In these days, Spain is going
through a very critical and delicate situation, since Catalonia
intends to become independent and to be a separate country from
Spain. At the moment, several debates, confrontations and
political, economic and social conflicts are carried out to define
the situation between the Spanish government and the
Catalan.
On October 27, 2017
the
Parliament of
Catalonia
approved a resolution
creating an independent Republic unilaterally by a vote considered
illegal by the lawyers of the Parliament of Catalonia for violating
the decisions of the
Constitutional Court of
Spain
.
As
of October 28, 2017, the Catalan Republic is unrecognized by the
international community, which regards the region as part of of
Spain.
As of the date of this annual
report, the actions that Spain and Catalonia will take to define
independence or not are uncertain. Such a situation together with
any measure that the European Union may take, could cause
volatility in financial markets, which may adversely affect
business activity and economic and market conditions in Spain and
therefore in the United Kingdom abd the European Union. All these
effects could in turn have a material adverse effect on our
business, financial condition and results of
operations.
A decline in the international prices for Argentina’s main
commodity exports could have an adverse effect on Argentina’s
economic growth and on our business.
In December 2015, the Argentine
administration announced a plan to gradually reduce the exports tax
payable on certain agricultural products. Export taxes on soy
products and wheat, maize, sorghum and sunflower have since been
eliminated in an attempt to increase agricultural production.
However, this reliance on the export of certain commodities, such
as soy, has made the Argentine economy more vulnerable to
fluctuations in their prices. If international commodity prices
decline, the Argentine government’s revenues would decrease
significantly affecting Argentina’s economic activity.
Accordingly, a decline in international commodity prices could
adversely affect Argentina’s economy, which in turn would
produce a negative impact on our financial condition and results of
operations.
In addition, adverse weather
conditions can affect the production of commodities by the
agricultural sector, which account for a significant portion of
Argentina’s export revenues. These circumstances would have a
negative impact on the levels of government revenues, availability
of foreign exchange and the government’s ability to service
its sovereign debt, and could either generate recessionary or
inflationary pressures, depending on the government’s
reaction. Either of these results would adversely impact
Argentina’s economy growth and, therefore, our business,
financial condition and results of operations.
19
Restrictions on the supply of energy could negatively affect
Argentina’s economy.
As a result of prolonged recession,
and the forced conversion into Pesos and subsequent freeze of
natural gas and electricity tariffs in Argentina, there has been a
lack of investment in natural gas and electricity supply and
transport capacity in Argentina in recent years. At the same time,
domestic demand for natural gas and electricity has increased
substantially, driven by a recovery in economic conditionsand the
implementation of price constraints, which has prompted the
government to adopt a series of measures that have resulted in
industry shortages and/or costs increase. In particular, Argentina
has been importing natural gas in order to compensate forshortages
in local production. In order to pay for natural gas imports, the
Argentine government has frequently used the Central Bank reserves
due to the absence of incoming currencies from investment. If the
government is unable to pay for the natural gas imported in order
to produce electricity, business and industries may be adversely
affected.
The Argentine government has been
taking a number of measures to alleviate the short-term impact of
energy shortages on residential and industrial users. If these
measures prove to be insufficient, or if the investment that is
required to increase natural gas production, transportation
capacity and energy generation over the medium and long-term fails
to materialize on a timely basis, economic activity in Argentina
could be curtailed which may have a significant adverse effect on
our business.
As a first step of these measures,
subsidies on energy tariffs were withdrawn from industries and high
income consumers. Additionally, since 2011, a series of rate
increases and the reduction of subsidies mainly among industries
and high-income consumers were implemented. On December 17,
2015 and after the publication of Decree No. 134/2015, the new
government declared the National Electricity System Emergency until
December 31, 2017, and ordered the Energy and Mining Ministry
to prepare and propose measures and guarantee the electrical supply
in suitable technical conditions. Within this context, and by the
Energy and Mining Ministry Resolution No. 06/2016 of January
2016, the new seasonal reference prices for power and energy in the
“Mercado Electrónico Mayorista” were issued for
the period from February 1, 2016 and April 30, 2016. The
objective of the aforementioned resolution was to adjust the
quality and security of electricity supply and ensure the provision
of public electricity services under technical and economically
appropriate conditions.
In February 2016, the Argentine
government revised the tariff schedule for electricity and gas
rates and eliminated the subsidies for these utilities that would
have resulted in increases in energy costs of 500% or more, except
for tariffs for certain lower income consumers. By correcting
tariffs, modifying the regulatory framework and reducing the
federal government’s involvement in the energy sector, the
Macri administration aims to correct distortions in the energy
sector and stimulate necessary investment. In July 2016, a federal
court in the city of La Plata suspended the increase in gas tariffs
across the Province of Buenos Aires. In addition, on August 3,
2016, a federal court in San Martín suspended the increase in
gas tariffs across the country until a public hearing to discuss
the electricity tariff increase was held. The case was appealed,
and heard by, the Supreme Court on August 18, 2016, which
court agreed that the gas tariff increases to residential customers
could not be imposed without public hearings. A public hearing was
held on September 16, 2016, where it was agreed that the gas
tariffs would be increased approximately 200% in October 2016, with
semi-annual increases until 2019.
In relation to other services,
including electricity, on October 28, 2016, a public hearing
was held to consider a 31% increase in tariffs requested by power
distributors. Afterwards, the government announced electricity
tariff increases that will raise customers’ invoices 60% to
148%. In addition, on March 31, 2017, the Energy Ministry
reported a new tariff schedule with increases of approximately 36%
for the supply of natural gas for networks that have been partially
regulated since April 1, 2017, and which will have two
additional adjustments in November and April of 2018. On September
22, 2017, the Ministry of Energy and Mines announced the release of
the fuel price, where oil companies could modify the sale price of
their fuels for consumption in the automotive market, wich was
effective as of October, 2017.This change in the regulatory
framework and the fixing of new economic values in the supply of
gas and electricity could change our cost structure, increasing the
operating and utilities costs inherent to fixed
assets.
20
High public expenditure could result in long-lasting adverse
consequences for the Argentine economy.
Over the last several years, the
Argentine government has substantially increased public
expenditures. In 2014, public sector expenditures increased 43% as
compared to 2013 and the government reported a primary fiscal
deficit of 0.9%. During recent years, the Argentine government has
resorted to the Central Bank and to the
Administración Nacional de la Seguridad
Social
, or “ANSES,” to source part of its
funding requirements. In 2015, this trend continued as the primary
fiscal balance showed a deficit of 5.4% as of December 31,
2015.
The Argentine government has begun
to adopt measures to reduce the deficit, adjusting its subsidy
policies, particularly those related to energy, electricity and
gas, water and public transportation, among other measures. On
December 31, 2016, the primary fiscal result was Ps.359,382
million, which represents a deficit of 4.6% of GDP. Changes in
these policies could materially and adversely impact consumer
purchase capacity and economic activity and may lead to an increase
in prices.
Moreover, the primary fiscal balance
could be negatively affected in the future if public expenditures
increase at a rate higher than revenues as a result of subsidies to
lower-income sectors, social security benefits, financial
assistance to provinces with financial problems, increased spending
on public works and subsidies to the energy and transportation
sectors. A further deterioration in fiscal accounts could
negatively affect the government’s ability to access the
long-term financial markets and could in turn result in more
limited access to such markets by Argentine companies.
Failure to adequately
address actual and perceived risks of institutional deterioration
and corruption may adversely affect Argentina’s economy and
financial condition.
A lack of institutional framework
and notorious incidents of corruption have been identified as, and
continue to be, a significant problem for Argentina. In
Transparency International’s 2015 Corruption Perceptions
Index of 167 countries, Argentina was ranked 107, the same as in
2014. In the World Bank’s Doing Business 2016 report,
Argentina ranked 121 out of 189 countries, up from 124 in 2015.
Recognizing that the failure to address these issues could increase
the risk of political instability, distort decision-making
processes and adversely affecting Argentina’s international
reputation and ability to attract foreign investment, the Macri
administration has announced several measures aimed at
strengthening Argentina’s institutions and reducing
corruption. These measures include entering plea bargaining
arrangements with convicted officials providing increased access to
public information, seizing assets from convicted officials,
increasing the powers of the Anticorruption Office (Oficina
Anticorrupción) and adopting a new public ethics law, among
others. The government’s ability to implement these
initiatives is uncertain as it would require the involvement of the
judiciary branch as well as legislative support from opposition
parties. We cannot assure you that the implementation of such
measures will be successful.
Foreign shareholders of
companies operating in Argentina have initiated investment
arbitration proceedings against Argentina that have resulted and
could result in arbitral awards and/or injunctions against
Argentina and its assets and, in turn, limit its financial
resources
.
In response to the emergency
measures implemented by the Argentine government during the
2001-2002 economic crisis, a number of claims were filed before the
International Centre for Settlement of Investment Disputes, or
“ICSID,” against Argentina. Claimants allege that the
emergency measures were inconsistent with the fair and equitable
treatment standards set forth in various bilateral investment
treaties by which Argentina was bound at the time. Claimants have
also filed claims before arbitral tribunals under the rules of the
United Nations Commission on International Trade Law, or
“UNCITRAL,” and under the rules of the International
Chamber of Commerce, or “ICC.” As of the date of this
annual report, it is not certain that Argentina will prevail in
having any or all of these cases dismissed, or that if awards in
favor of the plaintiffs are granted, that it will succeed in having
those awards annulled. Ongoing claims before the ICSID tribunal and
other arbitral tribunals could lead to new awards against
Argentina, which could have a material adverse effect on our
capacity to access international credit or equity
markets
.
21
The Argentine government
may lack of political support on the Senators and the Deputies
Chamber and may have a negative impact on argentiniean economy and,
subsequently affect our financial condition and results of
operations
.
The legislative elections held on
October 22, 2017 for the partial renovation of both chambers of the
Congress had a favorable outcome for the Macri government. Macri
administration outnumbered its opponents in some of the most
important districts of Argentina, making it the most voted force
nationwide, but do not have enough seats to reach the quorum in
either of the chambers which could prevent or limit the Macri
government to continue its policies and effectively implement
economic reforms or react appropriately in future
circumstances.
A lack of political support that
prevents the Macri administration from fully implementing its
agenda may adversely affect the Argentine economy and financial
condition and, therefore, our business, financial condition and
results of operations.
Risks relating to
our business in Argentina
We are subject to risks inherent to the operation of shopping malls
that may affect our profitability.
Our shopping malls are subject to
various factors that affect their development, administration and
profitability, including:
●
decline in our lease prices or increases in
levels of default by our tenants due to economic conditions,
increases in interest rates and other factors out of our
control;
●
the accessibility and the attractiveness of the
area where the shopping mall is located;
●
the intrinsic attractiveness of the shopping
mall;
●
the flow of people and the level of sales of
each shopping mall rental unit;
●
the increasing competition from internet
sales;
●
the amount of rent collected from each shopping
mall rental unit;
●
changes in consumer demand and availability of
consumer credit (considering the limits impose by the Central Bank
to interest rates charged by financial institutions), both of which
are highly sensitive to general macroeconomic conditions;
and
●
fluctuations in occupancy levels in our shopping
malls.
An increase in our operating costs,
caused by inflation or by other factors, could have a material
adverse effect on us if our tenants are unable to pay higher rent
as a result of increased expenses. Moreover, the shopping mall
business is closely related to consumer spending and affected by
prevailing economic conditions. All of our shopping malls and
commercial properties, under Operations Center in Argentina, are
located in Argentina, and, as a consequence, their business is
vulnerable to recession and economic downturns in Argentina. For
example, during the economic crisis in Argentina that began in
2001, consumer spending decreased significantly, and higher
unemployment, political instability and high rates of inflation
significantly reduced consumer spending and resulted in lower sales
that led some tenants to shutdown. Persistently poor economic
conditions in Argentina in the future could result in a decline in
discretionary consumer spending which will likely have a material
adverse effect on the revenues from shopping mall activity and thus
on our business.
22
Our assets are highly concentrated in certain geographic areas and
an economic downturn in such areas could have a material adverse
effect on our results of operations and financial
condition.
For the fiscal year ended June
30, 2017, 80% of our sales from leases and services provided by the
Shopping Malls segment were derived from shopping malls located in
the City of Buenos Aires and the Greater Buenos Aires area. In
addition, all of our office buildings are located in the City of
Buenos Aires and a substantial portion of our revenues in Argentina
are derived from such properties. Although we own properties and
may acquire or develop additional properties outside of the City of
Buenos Aires and the Greater Buenos Aires area, we expect to
continue to depend to a large extent on economic conditions
affecting those areas. Consequently, an economic downturn in those
areas could have a material adverse effect on our financial
condition and results of operations by reducing our rental income
and adversely affect our ability to meet our debt obligations and
fund our operations.
Our performance is subject to risks associated with our properties
and with the real estate industry.
Our operating performance and the
value of our real estate assets are subject to the risk that our
properties may not be able to generate sufficient revenues to meet
our operating expenses, including debt service and capital
expenditures, our cash flow and ability to service our debt and to
cover other expenses may be adversely affected.
Events or conditions beyond our
control that may adversely affect our operations or the value of
our properties include:
●
downturns in the national, regional and local
economic climate;
●
volatility and decline in discretionary
spending;
●
competition from other shopping malls and
office, and commercial buildings;
●
local real estate market conditions, such as
oversupply or reduction in demand for retail, office, or other
commercial space;
●
decreases in consumption levels;
●
changes in interest rates and availability of
financing;
●
the exercise by our tenants of their legal right
to early termination of their leases;
●
vacancies, changes in market rental rates and
the need to periodically repair, renovate and re-lease
space;
●
increased operating costs, including insurance
expense, salary increases, utilities, real estate taxes, state and
local taxes and heightened security costs;
●
civil disturbances, earthquakes and other
natural disasters, or terrorist acts or acts of war which may
result in uninsured or underinsured losses;
●
significant expenditures associated with each
investment, such as debt service payments, real estate taxes,
insurance and maintenance costs;
●
declines in the financial condition of our
tenants and our ability to collect rents from our
tenants;
●
changes in our ability or our tenants’
ability to provide for adequate maintenance and insurance, possibly
decreasing the useful life of and revenue from
property;
●
changes in law or governmental regulations (such
as those governing usage, zoning and real property taxes) or
government action such as expropriation, confiscation or revocation
of concessions; and
●
judicial
interpretation of the New Civil and Commercial Code (in force since
August 1, 2015) which may be adverse to our interests.
If any one or more of the foregoing conditions
were to affect our business, it could have a material adverse
effect on our financial condition and results of operations could
be materially adversely affected.
23
An adverse economic environment for real estate companies such as a
credit crisis may adversely impact our results of operations and
business prospects significantly.
The success of our business and
profitability of our operations depend on continued investment in
real estate and access to capital and debt financing. A prolonged
crisis of confidence in real estate investments and lack of credit
for acquisitions may constrain our growth. As part of our strategy,
we intend to increase our properties portfolio though strategic
acquisitions of core properties at favorable prices, where we
believe we can bring the necessary expertise to enhance property
values. In order to pursue acquisitions, we may need access to
equity capital and/or debt financing. Any disruptions in the
financial markets may adversely impact our ability to refinance
existing debt and the availability and cost of credit in the near
future. Any consideration of sales of existing properties or
portfolio interests may be offset by lower property values. Our
ability to make scheduled payments or to refinance our existing
debt obligations depends on our operating and financial
performance, which in turn is subject to prevailing economic
conditions. If a recurrence of the disruptions in financial markets
remains or arises in the future, there can be no assurances that
government responses to such disruptions will restore investor
confidence, stabilize the markets or increase liquidity and the
availability of credit.
The loss of tenants could adversely affect the operating revenues
and value of our properties.
Although no
single tenant represents more than 3% of our revenue, if a
significant number of tenants at our retail or office properties
were to experience financial difficulties, including bankruptcy,
insolvency or a general downturn of business, or if we failed to
retain them, our business could be adversely affected. Further, our
shopping malls typically have a significant “anchor”
tenant, such as well-known department stores that generate consumer
traffic at each mall. A decision by such tenants to cease
operations at our shopping malls or our office buildings, as
applicable, could have a material adverse effect on our financial
condition and the results of our operations. In addition, the
closing of one or more stores with high consumer traffic may
motivate other tenants to terminate or to not renew their leases,
to seek rent relief and/or close their stores or otherwise
adversely affect the occupancy rate at the property. Moreover,
tenants at one or more properties might terminate their leases as a
result of mergers, acquisitions, consolidations, dispositions or
bankruptcies. The bankruptcy and/or closure of multiple stores, if
we are not able to successfully re-lease the affected space, could
have a material adverse effect on both the operating revenues and
underlying value of the properties involved.
We may face risks associated with property
acquisitions.
We have in the past acquired, and
intend to acquire in the future, properties, including large
properties that would increase the size of our company and
potentially alter our capital structure. Although we believe that
the acquisitions that we have completed in the past and that we
expect to undertake in the future have, and will, enhance our
future financial performance, the success of such transactions is
subject to a number of uncertainties, including the risk
that:
●
we may not be able to obtain financing for
acquisitions on favorable terms;
●
acquired properties may fail to perform as
expected;
●
the actual costs of repositioning or
redeveloping acquired properties may be higher than our estimates;
and
●
acquired properties may be located in new
markets where we may have limited knowledge and understanding of
the local economy, absence of business relationships in the area or
unfamiliarity with local governmental and permitting
procedures.
If we acquire new properties, we may
not be able to efficiently integrate acquired properties,
particularly portfolios of properties, into our organization and to
manage new properties in a way that allows us to realize cost
savings and synergies, which could impair our results of
operations.
24
Our future acquisitions may not be profitable.
We seek to acquire additional
properties to the extent that we manage to acquire them on
favorable terms and conditions and they meet our investment
criteria. Acquisitions of commercial properties entail general
investment risks associated with any real estate investment,
including:
●
our estimates of the cost of improvements needed
to bring the property up to established standards for the market
may prove to be inaccurate;
●
properties we acquire may fail to achieve,
within the time frames we project, the occupancy or rental rates we
expect to achieve at the time we make the decision to acquire,
which may result in the properties’ failure to achieve the
returns we projected;
●
our pre-acquisition evaluation of the physical
condition of each new investment may not detect certain defects or
identify necessary repairs, which could significantly increase our
total acquisition costs; and
●
our investigation of a property or building
prior to its acquisition, and any representations we may receive
from the seller of such building or property, may fail to reveal
various liabilities, which could reduce the cash flow from the
property or increase our acquisition cost.
If we acquire a business, we will be
required to merge and integrate the operations, personnel,
accounting and information systems of such acquired business. In
addition, acquisitions of or investments in companies may cause
disruptions in our operations and divert management’s
attention away from day-to-day operations, which could impair our
relationships with our current tenants and employees.
Properties we acquire may subject us to unknown
liabilities.
Properties that we acquire may be
subject to unknown liabilities and we generally would have no
recourse, or only limited recourse to the former owners of the
properties in respect thereof. Thus, if a liability were asserted
against us based on ownership of an acquired property, we may be
required to pay significant sums to settle it, which could
adversely affect our financial results and cash flow. Unknown
liabilities relating to acquired properties could
include:
●
liabilities for clean-up of undisclosed
environmental contamination;
●
law reforms and governmental regulations (such
as those governing usage, zoning and real property taxes);
and
●
liabilities incurred in the ordinary course of
business.
Our dependence on rental income may adversely affect our ability to
meet our debt obligations.
A substantial part of our income is
derived from rental income from real property. As a result, our
performance depends on our ability to collect rent from tenants.
Our income and funds for distribution would be negatively affected
if a significant number of our tenants:
●
delay lease commencements;
●
decline to extend or renew leases upon
expiration;
●
fail to make rental payments when due;
or
●
close stores or declare bankruptcy.
Any of these actions could result in
the termination of leases and the loss of related rental income. In
addition we cannot assure you that any tenant whose lease expires
will renew that lease or that we will be able to re-lease space on
economically advantageous terms or at all. The loss of rental
revenues from a number of our tenants and our inability to replace
such tenants may adversely affect our profitability and our ability
to meet debt service and other financial obligations.
25
It may be difficult to buy and sell real estate quickly and
transfer restrictions may apply to part of our portfolio of
properties.
Real estate investments are
relatively illiquid and this tends to limit our ability to vary our
portfolio in response to economic changes or other conditions. In
addition, significant expenditures associated with each investment,
such as mortgage payments, real estate taxes and maintenance costs,
are generally not reduced when circumstances cause a decrease in
income from an investment. If income from a property declines while
the related expenses do not decline, our business would be
adversely affected. Further, if it becomes necessary or desirable
for us to dispose of one or more of our mortgaged properties, we
may not be able to obtain a release of the lien on the mortgaged
property without payment of the associated debt. The foreclosure of
a mortgage on a property or inability to sell a property could
adversely affect our business.
Some of the land we have purchased is not zoned for development
purposes, and we may be unable to obtain, or may face delays in
obtaining, the necessary zoning permits and other
authorizations.
We own several plots of land which
are not zoned for the type of projects we intend to develop. In
addition, we do not yet have the required land-use, building,
occupancy and other required governmental permits and
authorizations for these properties. We cannot assure you that we
will continue to be successful in our attempts to rezone land and
to obtain all necessary permits and authorizations, or that
rezoning efforts and permit requests will not be unreasonably
delayed or rejected. Moreover, we may be affected by building
moratorium and anti-growth legislation. If we are unable to obtain
all of the governmental permits and authorizations we need to
develop our present and future projects as planned, we may be
forced to make unwanted modifications to such projects or abandon
them altogether.
Our ability to grow will be limited if we cannot obtain additional
financing.
We must maintain liquidity to fund
our working capital, service our outstanding indebtedness and
finance investment opportunities. Without sufficient liquidity, we
could be forced to curtail our operations or we may not be able to
pursue new business opportunities.
Our growth strategy is focused on
the development and redevelopment of properties we already own and
the acquisition and development of additional properties. As a
result, we are likely to depend to an important degree on the
availability of debt or equity capital, which may or may not be
available on favorable terms or at all. We cannot assure you that
additional financing, refinancing or other capital will be
available in the amounts we require or on favorable terms. Our
access to debt or equity capital markets depends on a number of
factors, including the market’s perception of risk in
Argentine, of our growth potential, our ability to pay dividends,
our financial condition, our credit rating and our current and
potential future earnings. Depending on these factors, we could
experience delays or difficulties in implementing our growth
strategy on satisfactory terms or at all.
The capital and credit markets have
been experiencing extreme volatility and disruption since the last
credit crisis. If our current resources do not satisfy our
liquidity requirements, we may have to seek additional financing.
The availability of financing will depend on a variety of factors,
such as economic and market conditions, the availability of credit
and our credit ratings, as well as the possibility that lenders
could develop a negative perception of the prospects of risk in
Argentine, of our company or the industry generally. We may not be
able to successfully obtain any necessary additional financing on
favorable terms, or at all.
Disease outbreaks or other public health concerns could reduce
traffic in our shopping malls.
As a result of the outbreak of Swine
Flu during the winter of 2009, consumers and tourists dramatically
changed their spending and travel habits to avoid contact with
crowds. Furthermore, several governments enacted regulations
limiting the operation of schools, cinemas and shopping malls. Even
though the Argentine government only issued public service
recommendations to the population regarding the risks involved in
visiting crowded places, such as shopping malls, and did not issue
specific regulations limiting access to public places, a
significant number of consumers nonetheless changed their habits
vis-à-vis shopping centers and malls. Similarly, the current
zika virus pandemic may result in similar courses and outcomes. We
cannot assure you that a new disease outbreak or health hazard
(such as the Ebola outbreak in recent years) will not occur in the
future, or that such an outbreak or health hazard would not
significantly affect consumer and/or tourists activity. The
ocurrence of such a scenario could adversely affect our businesses
and our results of operations.
26
Adverse incidents that occur in our shopping malls may result in
damage to our image and a decrease in the number of
customers.
Given that shopping malls are open
to the public, with ample circulation of people, accidents, theft,
robbery and other incidents may occur in our facilities, regardless
of the preventative measures we adopt. In the event such an
incident or series of incidents occurs, shopping mall customers and
visitors may choose to visit other shopping venues that they
believe are safer and less violent, which may cause a reduction in
the sales volume and operating income of our shopping
malls
.
Argentine Law governing leases imposes restrictions that limit our
flexibility.
Argentine laws governing leases
impose certain restrictions, including the following:
●
a prohibition on including automatic price
adjustment clauses based on inflation increases in lease
agreements; and
●
the imposition of a two-year minimum lease term
for all purposes, except in particular cases such as embassy,
consulate or international organization venues, room with furniture
for touristic purposes for less than three months, custody and
bailment of goods, exhibition or offering of goods in fairs or in
cases where due to the circumstances, the subject matter of the
lease agreement requires a shorter term.
As a result of the foregoing, we are
exposed to the risk of increases of inflation under our leases, and
the exercise of rescission rights by our tenants could materially
and adversely affect our business. We cannot assure you that our
tenants will not exercise such right, especially if rent values
stabilize or decline in the future or if economic conditions
deteriorate.
In addition, on October 1,
2014, the Argentine Congress adopted a new Civil and Commercial
Code which is in force since August 1, 2015. The Civil and
Commercial Code requires that lease agreements provide for a
minimum term of two years, and a maximum term of 20 years for
residential leases and of 50 years for non-residential leases.
Furthermore, the Civil and Commercial Code modifies the regime
applicable to contractual provisions relating to foreign currency
payment obligations by establishing that foreign currency payment
obligations may be discharged in Pesos. This amends the prior legal
framework, pursuant to which debtors could only discharge their
foreign currency payment obligations by making payment in that
currency. Although certain judicial decisions have held that this
feature of the regulation can be set aside by the parties to an
agreement, it is still too early to determine whether or not this
is legally enforceable. Moreover, and regarding the new provisions
for leases, there are no judicial decisions on the scope of this
amendment and, in particular, in connection with the ability of the
parties to any contract to set aside the new provision and enforce
such agreements before an Argentine court.
We may be liable for some defects in our buildings.
According to the Civil and
Commercial Code, real estate developers (
i.e.
, any person who sells real estate
built by either themselves or by a third party contractor),
builders, technical project managers and architects are liable in
case of property damage—damages that compromise the
structural integrity of the structure and/or defects that render
the building no longer useful—for a period of three years
from the date of possession of the property, including latent
defects, even when those defects did not cause significant property
damage.
In our real estate developments, we
usually act as developers and sellers while construction is carried
out by third-party contractors. Absent a specific claim, we cannot
quantify the potential cost of any obligation that may arise as a
result of a future claim, and we have not recorded provisions
associated with them in our financial statements. If we were
required to remedy any defects on completed works, our financial
condition and results of operations could be adversely
affected.
Eviction proceedings in Argentina are difficult and time
consuming.
Although Argentine law permits an
executive proceeding to collect unpaid rent and a special
proceeding to evict tenants, eviction proceedings in Argentina are
difficult and time-consuming. Historically, the heavy workloads of
the courts and the numerous procedural steps required have
generally delayed landlords’ efforts to evict tenants.
Eviction proceedings generally take between six months and two
years from the date of filing of the suit to the time of actual
eviction.
27
Historically, we have sought to
negotiate the termination of lease agreements with defaulting
tenants after the first few months of non-payment in order to avoid
legal proceedings. Delinquency may increase significantly in the
future, and such negotiations with tenants may not be as successful
as they have been in the past. Moreover, new Argentine laws and
regulations may forbid or restrict eviction, and in each such case
they would likely have a material and adverse effect on our
financial condition and results of operation.
We are subject to risks inherent to the operation of office
buildings that may affect our profitability.
Office buildings are subject to
various factors that affect their development, administration and
profitability, including:
●
a decrease in demand for office
space;
●
a deterioration in the financial condition of
our tenants may result in defaults under leases due to bankruptcy,
lack of liquidity or for other reasons;
●
difficulties or delays renewing leases or
re-leasing space;
●
decreases in rents as a result of oversupply,
particularly of newer buildings;
●
competition from developers, owners and
operators of office properties and other commercial real estate,
including sublease space available from our tenants;
and
●
maintenance, repair and renovation costs
incurred to maintain the competitiveness of our office
buildings.
If we are unable to adequately
address these factors, any one of them could adversely impact our
business, which would have an adverse effect on our financial
condition and results of operations.
Our investment in property development and management activities
may be less profitable than we anticipate.
We are engaged in the development
and management of shopping malls, office buildings and other rental
properties, frequently through third-party contractors. Risks
associated with our development and management activities include
the following, among others:
●
abandonment of development opportunities and
renovation proposals;
●
construction costs of a project may exceed our
original estimates for reasons including raises in interest rates
or increases in the costs of materials and labor, making a project
unprofitable;
●
occupancy rates and rents at newly completed
properties may fluctuate depending on a number of factors,
including market and economic conditions, resulting in lower than
projected rental rates and a corresponding lower return on our
investment;
●
pre-construction buyers may default on their
purchase contracts or units in new buildings may remain unsold upon
completion of construction;
●
the unavailability of favorable financing
alternatives in the private and public debt markets;
●
aggregate sale prices of residential units may
be insufficient to cover development costs;
●
construction and lease-up may not be completed
on schedule, resulting in increased debt service expense and
construction costs;
●
failure or delays in obtaining necessary zoning,
land-use, building, occupancy and other required governmental
permits and authorizations, or building moratoria and anti-growth
legislation;
●
significant time lags between the commencement
and completion of projects subjects us to greater risks due to
fluctuation in the general economy;
●
construction may not be completed on schedule
because of a number of factors, including weather, labor
disruptions, construction delays or delays in receipt of zoning or
other regulatory approvals, or man-made or natural disasters (such
as fires, hurricanes, earthquakes or floods), resulting in
increased debt service expense and construction costs;
28
●
general changes in our tenants’ demand for
rental properties; and
●
we may incur capital expenditures that could
result in considerable time consuming efforts and which may never
be completed due to government restrictions.
In addition, we may face
contractors’ claims for the enforcement of labor laws in
Argentina (sections 30, 31, 32 under Law No. 20,744), which provide
for joint and several liability. Many companies in Argentina hire
personnel from third-party companies that provide outsourced
services, and sign indemnity agreements in the event of labor
claims from employees of such third company that may affect the
liability of such hiring company. However, in recent years several
courts have denied the existence of independence in those labor
relationships and declared joint and several liabilities for both
companies.
While our policies with respect to
expansion, renovation and development activities are intended to
limit some of the risks otherwise associated with such activities,
we are nevertheless subject to risks associated with the
construction of properties, such as cost overruns, design changes
and timing delays arising from a lack of availability of materials
and labor, weather conditions and other factors outside of our
control, as well as financing costs that, may exceed original
estimates, possibly making the associated investment unprofitable.
Any substantial unanticipated delays or expenses could adversely
affect the investment returns from these redevelopment projects and
harm our operating results.
Greater than expected increases in construction costs could
adversely affect the profitability of our new
developments.
Our businesses
activities include real estate developments. One of the main risks
related to this activity corresponds to increases in constructions
costs, which may be driven by higher demand and new development
projects in the shopping malls and buildings sectors. Increases
higher than those included in the original budget may result in
lower profitability than expected.
We face significant competitive pressure.
Our real estate activities are
highly concentrated in the Buenos Aires metropolitan area, where
the real estate market is highly competitive due to a scarcity of
properties in sought-after locations and the increasing number of
local and international competitors. Furthermore, the Argentine
real estate industry is generally highly competitive and fragmented
and does not have high barriers to entry restricting new
competitors from entering the market. The main competitive factors
in the real estate development business include availability and
location of land, price, funding, design, quality, reputation and
partnerships with developers. A number of residential and
commercial developers and real estate services companies compete
with us in seeking land for acquisition, financial resources for
development and prospective purchasers and tenants. Other
companies, including joint ventures of foreign and localcompanies,
have become increasingly active in the real estate business and
shopping mall business in Argentina, further increasing this
competition. To the extent that one or more of our competitors are
able to acquire and develop desirable properties, asa result of
greater financial resources or otherwise, our business could be
materially and adversely affected. If we are not able to respond to
such pressures as promptly as our competitors, or the level of
competition increases, our financial condition and results of our
operations could be adversely affected.
Substantially all of our shopping
malls and commercial offices are located in Argentina. There are
other shopping malls and numerous smaller retail stores and
residential properties within the market area of each of our
properties. The number of competing properties in a particular area
could have a material adverse effect on our ability to lease retail
space in our shopping malls or sell units in our residential
complexes and on the amount of rent or the sale price that we are
able to charge. We cannot assure you that other shopping mall
operators, including international shopping mall operators, will
not invest in Argentina in the near future. If additional companies
become active in the Argentine shopping mall market in the future,
such competition could have a material adverse effect on our
results of operations.
29
Substantially all of our offices and
other non-shopping mall rental properties are located in developed
urban areas. There are many office buildings, shopping malls,
retail and residential premises in the areas where our properties
are located. This is a highly fragmented market, and the abundance
of comparable properties in our vicinity may adversely affect our
ability to rent or sell office space and other real estate and may
affect the sale and lease price of our premises. In the future,
both national and foreign companies may participate in
Argentina’s real estate development market, competing with us
for business opportunities.
Some potential losses are not covered by insurance and certain
kinds of insurance coverage may become prohibitively
expensive.
We currently carry insurance
policies that cover potential risks such as civil liability, fire,
loss profit, floods, including extended coverage and losses from
leases on all of our properties. Although we believe the policy
specifications and insured limits of these policies are generally
customary, there are certain types of losses, such as lease and
other contract claims, terrorism and acts of war that generally are
not insured under the insurance policies offered in the national
market. Should an insured loss or a loss in excess of insured
limits occur, we could lose all or a portion of the capital we have
invested in a property, as well as the anticipated future revenue
from the property. In such an event, we might nevertheless remain
obligated for any mortgage debt or other financial obligations
related to the property. We cannot assure you that material losses
in excess of insurance proceeds will not occur in the future. If
any of our properties were to experience a catastrophic loss, it
could seriously disrupt our operations, delay revenue and result in
large expenses to repair or rebuild the property. If any of our key
employees were to die or become incapacitated, we could experience
losses caused by a disruption in our operations which will not be
covered by insurance, and this could have a material adverse effect
on our financial condition and results of operations.
In addition, we cannot assure you
that we will be able to renew our insurance coverage in an adequate
amount or at reasonable prices. Insurance companies may no longer
offer coverage against certain types of losses, such as losses due
to terrorist acts and mold, or, if offered, these types of
insurance may be prohibitively expensive.
An uninsured loss or a loss that exceeds policies on our properties
could subject us to lost capital or revenue on those
properties.
Under the terms and conditions of
the leases currently in force on our properties, tenants are
required to indemnify and hold us harmless from liabilities
resulting from injury to persons, or property, on or off the
premises, due to activities conducted on the properties, except for
claims arising from our negligence or intentional misconduct or
that of our agents. Tenants are generally required, at the
tenant’s expense, to obtain and keep in full force during the
term of the lease, liability and property damage insurance
policies. In addition, we cannot enssure you that our tenants will
properly maintain their insurance policies or have the ability to
pay the deductibles.
Should a loss occur that is
uninsured or in an amount exceeding the combined aggregate limits
for the policies noted above, or in the event of a loss that is
subject to a substantial deductible under an insurance policy, we
could lose all or part of our capital invested in, and anticipated
revenue from, one or more of the properties, which could have a
material adverse effect on our operating results and financial
condition.
Demand for our premium properties may not be
sufficient.
We have focused on development
projects that cater to affluent individuals and have entered into
property barter agreements pursuant to which we contribute our
undeveloped properties to ventures with developers who will deliver
us units at premium locations. At the time the developers return
these properties to us, demand for premium residential units could
be significantly lower. In such case, we would be unable to sell
these residential units at the estimated prices or time frame,
which could have an adverse effect on our financial condition and
results of operations.
30
Our level of debt may adversely affect our operations and our
ability to pay our debt as it becomes due.
We had, and expect to have,
substantial liquidity and capital resource requirements to finance
our business. As of June 30, 2017, our consolidated financial debt
amounted to Ps.129,415 million (including IDBD’s debt
outstanding as of that date plus accrued and unpaid interest on
such indebtedness and deferred financing costs). We cannot assure
you that we will have sufficient cash flows and adequate financial
capacity in the future. While the commitments and other covenants
applicable to IDBD’s debt obligations do not have apply IRSA
since such it is not recourse to IRSA and it is not guaranteed by
IRSA’s assets, these covenants and restrictions may impair or
restrict our ability to operate IDBD and implement our business
strategy.
The fact that we are highly
leveraged may affect our ability to refinance existing debt or
borrow additional funds to finance working capital requirements,
acquisitions and capital expenditures. In addition, the recent
disruptions in the global financial markets, including the
bankruptcy and restructuring of major financial institutions, may
adversely impact our ability to refinance existing debt and the
availability and cost of credit in the future. In such conditions,
access to equity and debt financing options may be restricted and
it may be uncertain how long these economic circumstances may last.
This would require us to allocate a substantial portion of cash
flow to repay principal and interest, thereby reducing the amount
of money available to invest in operations, including acquisitions
and capital expenditures. Our leverage could also affect our
competitiveness and limit our ability to changes in market
conditions, changes in the real estate industry and economic
downturns.
We may not be able to generate
sufficient cash flows from operations to satisfy our debt service
requirements or to obtain future financing. If we cannot satisfy
our debt service requirements or if we default on any financial or
other covenants in our debt arrangements, the lenders and/or
holders of our debt will be able to accelerate the maturity of such
debt or cause defaults under the other debt arrangements. Our
ability to service debt obligations or to refinance them will
depend upon our future financial and operating performance, which
will, in part, be subject to factors beyond our control such as
macroeconomic conditions and regulatory changes in Argentina. If we
cannot obtain future financing, we may have to delay or abandon
some or all of our planned capital expenditures, which could
adversely affect our ability to generate cash flows and repay our
obligations as they become due.
The recurrence of a credit crisis could have a negative impact on
our major customers, which in turn could materially adversely
affect our results of operations and liquidity.
The global credit crisis that began
in 2008 had a significant negative impact on businesses around the
world. The impact of a future credit crisis on our major tenants
cannot be predicted and may be quite severe. A disruption in the
ability of our significant tenants to access liquidity could cause
serious disruptions or an overall deterioration of their businesses
which could lead to a significant reduction in their future orders
of their products and the inability or failure on their part to
meet their payment obligations to us, any of which could have a
material adverse effect on our results of operations and
liquidity.
We are subject to risks affecting the hotel industry.
The full-service segment of the
lodging industry in which our hotels operate is highly competitive.
The operational success of our hotels is highly dependent on our
ability to compete in areas such as access, location, quality of
accommodations, rates, quality food and beverage facilities and
other services and amenities. Our hotels may face additional
competition if other companies decide to build new hotels or
improve their existing hotels to increase their
attractiveness.
In addition, the profitability of
our hotels depends on:
●
our ability to form successful relationships
with international and local operators to run our
hotels;
●
changes in tourism and travel trends, including
seasonal changes and changes due to pandemic outbreaks, such as the
A H1N1 and zika viruses, a potential ebola outbreak, among others,
or weather phenomena’s or other natural events, such as the
eruption of the Puyehué and the Calbuco volcano in June 2011
and April 2015, respectively;
●
affluence of tourists, which can be affected by
a slowdown in global economy; and
●
taxes and governmental regulations affecting
wages, prices, interest rates, construction procedures and
costs.
31
The shift of consumers to purchasing goods over the Internet, where
barriers to entry are low, may negatively affect sales at our
shopping malls.
In recent years, internet retail
sales have grown significantly in Argentina, even though the market
share of such sales is still modest. The Internet enables
manufacturers and retailers to sell directly to consumers,
diminishing the importance of traditional distribution channels
such as retail stores and shopping malls. We believe that our
target consumers are increasingly using the Internet, from home,
work or elsewhere, to shop electronically for retail goods, and
this trend is likely to continue. Retailers at our properties face
increasing competition from online sales and this could cause the
termination or non renewal of their lease agreements or a reduction
in their gross sales, affecting our Percentage Rent (as defined
below) based revenue. If e commerce and retail sales through the
Internet continue to grow, retailers’ and consumers’
reliance on our shopping malls could be materially diminished,
having a material adverse effect on our financial condition,
results of operations and business prospects.
Our business is subject to
extensive regulation and additional regulations may be imposed in
the future.
Our activities are subject to
Argentine federal, state and municipal laws, and to regulations,
authorizations and licenses required with respect to construction,
zoning, use of the soil, environmental protection and historical
patrimony, consumer protection, antitrust and other requirements,
all of which affect our ability to acquire land, buildings and
shopping malls, develop and build projects and negotiate with
customers. In addition,companies in this industry are subject to
increasing tax rates, the creation of new taxes and changes in the
taxation regime. We are required to obtain licenses and
authorizations with different governmental authorities in order to
carry out our projects.Maintaining our licenses and authorizations
can be a costly provision. In the case of non-compliance with such
laws, regulations, licenses and authorizations, we may face fines,
project shutdowns, and cancellation of licenses and revocation of
authorizations.
In addition, public authorities may
issue new and stricter standards, or enforce or construe existing
laws and regulations in a more restrictive manner, which may force
us to make expenditures to comply with such new rules. Development
activities are also subject to risks relating to potential delays
in obtaining or an inability to obtain all necessary zoning,
environmental, land-use, development, building, occupancy and other
required governmental permits and authorizations. Any such delays
or failures to obtain such government approvals may have an adverse
effect on our business.
In the past, the Argentine
government imposed strict and burdensome regulations regarding
leases in response to housing shortages, high rates of inflation
and difficulties in accessing credit. Such regulations limited or
prohibited increases on rental prices and prohibited eviction of
tenants, even for failure to pay rent. Most of our leases provide
that the tenants pay all costs and taxes related to their
respective leased areas. In the event of a significant increase in
the amount of such costs and taxes, the Argentine government may
respond to political pressure to intervene by regulating this
practice, thereby negatively affecting our rental income. We cannot
assure you that the Argentine government will not impose similar or
other regulations in the future. Changes in existing laws or the
enactment of new laws governing the ownership, operation or leasing
of properties in Argentina could negatively affect the Argentine
real estate market and the rental market and materially and
adversely affect our operations and profitability.
Labor relations may negatively impact us.
As of June 30,
2017, 47.8% of our workforce was represented by unions under two
separate collective bargaining agreements. Although we currently
enjoy good relations with our employees and their unions, we cannot
assure you that labor relations will continue to be positive or
that deterioration in labor relations will not materially and
adversely affect us.
32
Our results of operations include unrealized revaluation
adjustments on investment properties, which may fluctuate
significantly over financial periods and may materially and
adversely affect our business, results of operations and financial
condition.
During the
fiscal years ended on June 30, 2017 and 2016, IRSA had unrealized
fair value gains on investment properties.
Although the
upward revaluation adjustments reflect unrealized capital gains on
our investment properties during the relevant periods, the
adjustments were not actual cash flow or profit generated from the
sales or rental of our investment properties. Unless such
investment properties are disposed of at similarly revalued
amounts, we will not realize the actual cash flow. The amount of
revaluation adjustments has been, and will continue to be,
significantly affected by the prevailing property markets and will
be subject to market fluctuations in those markets.
We cannot
guarantee whether changes in market conditions will increase,
maintain or decrease the fair value gains on our investment
properties at historical levels or at all. In addition, the fair
value of our investment properties may materially differ from the
amount we receive from any actual sale of an investment property.
If there is any material downward adjustment in the revaluation of
our investment properties in the future or if our investment
properties are disposed of at significantly lower prices than their
valuation or appraised value, our business, results of operations
and financial condition may be materially and adversely
affected.
If the
bankruptcy of Inversora Dársena Norte S.A. is extended to our
subsidiary Puerto Retiro, we will likely lose a significant
investment in a unique waterfront land reserve in the City of
Buenos Aires.
On April 18, 2000, Puerto Retiro
S.A. (“Puerto Retiro”) was served notice of a filing
made by the Argentine Government, through the Ministry of Defense,
seeking to extend bankruptcy of Inversora Dársena Norte S.A.
(“Indarsa”) to the Company. Upon filing of the
complaint, the bankruptcy court issued an order restraining the
ability of Puerto Retiro to dispose of, in any manner, the real
property purchased in 1993 from Tandanor. Indarsa had acquired 90%
of the capital stock in Tandanor from the Argentine Government in
1991. Tandanor’s main business involved ship repairs
performed in a 19-hectare property located in the vicinity of La
Boca neighborhood and where the Syncrolift is installed. As Indarsa
failed to comply with its payment obligation for acquisition of the
shares of stock in Tandanor, the Ministry of Defense filed a
bankruptcy petition against Indarsa, seeking to extend it to
us.
The evidentiary stage of the legal
proceedings has concluded. We lodged an appeal from the injunction
order, and such order was confirmed by the Court of Appeals on
December 14, 2000. The parties filed the arguments in due time and
proper manner. After the case was set for judgment, the judge
ordered the suspension of the judicial order requesting the case
records for issuance of a decision based on the alleged existence
of pre-judgmental status in relation to the criminal case against
former officials of the Ministry of Defense and our former
executive officers, for which reason the case will not be
adjudicated until a final judgment is entered in respect of the
criminal case.
It has been made known to the
commercial court that the expiration of the statute of limitations
has been declared in the criminal action and the criminal
defendants have been acquitted. However, this decision was reversed
by the Criminal Court (
Cámara
de Casación Penal
). An extraordinary appeal was filed
and rejected, therefore an appeal was directly lodged with the
Argentine Supreme Court for improper refusal to permit the appeal,
and a decision is still pending.
Our Management and external legal
counsel believe that there are sufficient legal and technical
arguments to consider that the petition for an extension of the
bankruptcy will be dismissed by the court. However, in view of the
particular features and progress of the case, this position cannot
be held to be conclusive.
In turn, Tandanor filed a civil
action against Puerto Retiro and the other defendants in the
criminal case for violation of Section 174 (5) based on Section 173
(7) of the Criminal Code. Such action seeks -on the basis of the
nullity of the decree that approved the bidding process involving
the Dársena Norte property- a reimbursement in favor of
Tandanor for all such amounts it has allegedly lost as a result of
a suspected fraudulent transaction involving the sale of the
property disputed in the case.
33
In July 2013, the answer to the
civil action was filed, which contained a number of defenses.
Tandanor requested the intervention of the Argentine Government as
third party co-litigant in this case, which petition was granted by
the Court. In March 2015, both theArgentine Government and the
criminal complainant answered the asserted defenses. On July 12,
2016, Puerto Retiro was legally notified of the decision adopted by
the Tribunal Oral Federal No. 5 related to the preliminary
objections above mentioned. Two of them were rejected –lack
of information and lack of legitimacy (passive). We filed an appeal
with regard to the rejection of these two objections. But, on the
other hand, the other two objections will be considered at
sentencing by the court, which is an important step in order to
obtain a favorable decision. As of the date hereof, no resolution
has been issued in such regard. We cannot assure you that we will
be successful in getting this case dismissed.
Property ownership through joint ventures or minority participation
may limit our ability to act exclusively in our
interest.
In some cases, we develop and
acquire properties through joint ventures with other persons or
entities when we believe circumstances warrant the use of such
structures. For example, we currently own 80% of Panamerican Mall
S.A. (“PAMSA”), while another 20% is owned by Centro
Comercial Panamericano S.A., and 50% of Quality Invest S.A.
(“Quality Invest”). We could engage in a dispute with
one or more of our joint venture partners that might affect our
ability to operate a jointly-owned property. Moreover, our joint
venture partners may, at any time, have business, economic or other
objectives that are inconsistent with our objectives, including
objectives that relate to the timing and terms of any sale or
refinancing of a property. For example, the approval of certain of
the other investors is required with respect to operating budgets
and refinancing, encumbering, expanding or selling any of these
properties. In some instances, our joint venture partners may have
competing interests in our markets that could create conflicts of
interest. If the objectives of our joint venture partners are
inconsistent with our own objectives, we will not be able to act
exclusively in our interests.
If one or more of the investors in
any of our jointly owned properties were to experience financial
difficulties, including bankruptcy, insolvency or a general
downturn of business, there could be an adverse effect on the
relevant property or properties and in turn, on our financial
performance. Should a joint venture partner declare bankruptcy, we
could be liable for our partner’s common share of joint
venture liabilities.
Dividend restrictions in our subsidiaries’ debt agreements
may adversely affect it.
Dividends paid by our subsidiaries
are an important source of funds for us as are other permitted
payments from subsidiaries. The debt agreements of our subsidiaries
contain covenants restricting their ability to pay dividends or
make other distributions. If our subsidiaries are unable to make
payments to us, or are able to pay only limited amounts, we may be
unable to make payments on its indebtedness.
We are dependent on our Board of Directors and our
personnel.
Our success, to a significant
extent, depends on the continued employment of Eduardo Sergio
Elsztain and certain other members of our board of directors and
senior management, who have significant expertise and knowledge of
our business and industry. The loss or interruption of their
services for any reason could have a material adverse effect on our
business and results of operations. Our future success also depends
in part upon our ability to attract and retain other highly
qualified personnel. We cannot assure you that we will be
successful in hiring or retaining qualified personnel, or that any
of our personnel will remain employed by us.
We may face potential conflicts of interest relating to our
principal shareholders.
Our largest beneficial owner is Mr.
Eduardo S. Elsztain, through his indirect shareholding through
Cresud S.A.C.I.F.y A. (“Cresud”). As of June 30, 2017,
such beneficial ownership consisted of: (i) 366,788,251 common
shares held by Cresud, and (ii) 900 common shares held directly by
Mr. Elsztain. See “Item 7 – Major Shareholders and
Related Party Transactions.” Conflicts of interest between
our management, Cresud and our affiliates may arise in the
performance of our business activities. As of June 30, 2017, Mr.
Elsztain also beneficially owned (i) approximately 30.9% of
Cresud’s common shares and (ii) approximately 94.6% of the
common shares of our subsidiary IRSA Commercial Properties
(“IRSA CP”).
Likewise, on
October 27, 2017, we reported that it has been completed the sale
in the secondary market of 2,560,000 ADSs of IRSA CP, which
represents 8.1% of IRSA CP. For more information please see
“Recent developments –
Selling of IRSA CP’ ADSs.”
We
cannot assure you that our principal shareholders and their
affiliates will not limit or cause us to forego business
opportunities that our affiliates may pursue or that the pursuit of
other opportunities will be in our interest.
34
Due to the currency mismatches between our assets and liabilities,
we have currency exposure.
As of June 30, 2017, the majority of
our liabilities in our Operations Center in Argentina, such as our
Series II and VIII Notes issued by the us, and the Series II and IV
issued by IRSA CP, were denominated in U.S. dollars while our
revenues are mainly denominated in Pesos. This currency gap exposes
us to a risk of volatility in the rate of exchange between the Peso
and the U.S. dollar, and our financial results are adversely
affected when the U.S. dollar appreciates against the Peso. Any
depreciation of the Peso against the U.S. dollar correspondingly
increases the nominal amount of our debt in Pesos, with further
adversely effects our results of operation and financial condition
and may increase the collection risk of our leases and other
receivables from our tenants, most of which generate
Peso-denominated revenues.
Risks Related to
our Investment in Banco Hipotecario
As of June 30, 2017, we owned
approximately 29.91% of the outstanding capital stock of Banco
Hipotecario S.A. (“Banco Hipotecario”), which
represented 0,7% of our consolidated assets from our operations
center in Argentina as of such date. All of Banco
Hipotecario’s operations, properties and customers are
located in Argentina. Accordingly, the quality of Banco
Hipotecario’s loan portfolio, financial condition and results
of operations depend on economic, regulatory and political
conditions prevailing in Argentina. These conditions include growth
rates, inflation rates, exchange rates, changes to interest rates,
changes to government policies, social instability and other
political, economic or international developments either taking
place in, or otherwise affecting, Argentina.
Risks Relating to
the Argentine Financial System and Banco Hipotecario
Capital stock in Banco Hipotecario
As of June 30, 2017, we owned
approximately 29.91% of the outstanding capital stock of Banco
Hipotecario, which represented 0.7% of our consolidated assets from
our operations center in Argentina as of such date. All of Banco
Hipotecario’s operations, properties and customers are
located in Argentina. Accordingly, the quality of Banco
Hipotecario’s loan portfolio, financial condition and results
of operations depend on economic, regulatory and political
conditions prevailing in Argentina. These conditions include growth
rates, inflation rates, exchange rates, changes to interest rates,
changes to government policies, social instability and other
political, economic or international developments either taking
place in, or otherwise affecting, Argentina.
The short-term structure of the deposit base of the Argentine
financial system, including Banco Hipotecario, could lead to a
reduction in liquidity levels and limit the long-term expansion of
financial intermediation.
Given the short-term structure of
the deposit base of the Argentine financial system, credit lines
are also predominantly short-term, with the exception of mortgages,
which represent a low proportion of the existing credit base.
Although liquidity levels are currently reasonable, no assurance
can be given that these levels will not be reduced due to a future
negative economic scenario. Therefore, there is still a risk of low
liquidity levels that could increase funding cost in the event of a
withdrawal of a significant amount of the deposit base of the
financial system, and limit the long-term expansion of financial
intermediation including Banco Hipotecario.
The stability of the financial system depends upon the ability of
financial institutions, including ours, to maintain and increase
the confidence of depositors.
The measures implemented by the
Argentine government in late 2001 and early 2002, in particular the
restrictions imposed on depositors to withdraw money freely from
banks and the “pesification” and restructuring of their
deposits, were strongly opposed by depositors due to the losses on
their savings and undermined their confidence in the Argentine
financial system and in all financial institutions operating in
Argentina.
If depositors once again withdraw
their money from banks in the future, there may be a substantial
negative impact on the manner in which financial institutions,
including ours, conduct their business, and on their ability to
operate as financial intermediaries. Loss of confidence in the
international financial markets may also adversely affect the
confidence of Argentine depositors in local banks.
In the future, an adverse economic
situation, even if it is not related to the financial system, could
trigger a massive withdrawal of capital from local banks by
depositors, as an alternative to protect their assets from
potential crises. Any massive withdrawal of deposits could cause
liquidity issues in the financial sector and, consequently, a
contraction in credit supply.
The occurrence of any of the above
could have a material and adverse effect on Banco
Hipotecario’s expenses and business, results of operations
and financial condition.
35
The asset quality of financial institutions is exposed to the
non-financial public sector’s and Central Bank’s
indebtedness.
Financial institutions carry
significant portfolios of bonds issued by the Argentine government
and by provincial governments as well as loans granted to these
governments. The exposure of the financial system to the
non-financial public sector’s indebtedness had been shrinking
steadily, from 49.0% of total assets in 2002 to 10.3% in 2015 and
9.6% for the period of six months ended as June 30, 2017. To an
extent, the value of the assets held by Argentine banks, as well as
their capacity to generate income, is dependent on the
creditworthiness of the non-financial public sector, which is in
turn tied to the government’s ability to foster sustainable
long-term growth, generate fiscal revenues and reduce public
expenditure.
In addition, financial institutions
currently carry securities issued by the Central Bank in their
portfolios, which generally are short-term. As of June 30, 2017,
such securities issued by the Central Bank represented
approximately 27.6% of the total assets of the Argentine financial
system. As of June 30, 2017, Banco Hipotecario’s total
exposure to the public sector was Ps.3,122.1 million, which
represented 6.3% of its assets as of that date, and the total
exposure to securities issued by the Central Bank was Ps.3,306.8
million, which represented 6.3% of its total assets as of June 30,
2017.
The Consumer Protection Law may limit some of the rights afforded
to Banco Hipotecario
Argentine Law N° 24,240 (the
“Consumer Protection Law”) sets forth a series of rules
and principles designed to protect consumers, which include Banco
Hipotecario’s customers. The Consumer Protection Law was
amended by Law N° 26,361 on March 12, 2008 to expand its
applicability and the penalties associated with violations thereof.
Additionally, Law N° 25,065 (as amended by Law N° 26,010
and Law N° 26,361, the “Credit Card Law”) also
sets forth public policy regulations designed to protect credit
card holders. Recent Central Bank regulations, such as
Communication “A” 5388, also protect consumers of
financial services.
In addition, the Civil and
Commercial Code has a chapter on consumer protection, stressing
that the rules governing consumer relations should be applied and
interpreted in accordance with the principle of consumer protection
and that a consumer contract should be interpreted in the sense
most favorable to it.
The application of both the Consumer
Protection Law and the Credit Card Law by administrative
authorities and courts at the federal, provincial and municipal
levels has increased. This trend has increased general consumer
protection levels. If Banco Hipotecario is found to be liable for
violations of any of the provisions of the Consumer Protection Law
or the Credit Card Law, the potential penalties could limit some of
Banco Hipotecario’s rights, for example, with respect to its
ability to collect payments due from services and financing
provided by us, and adversely affect Banco Hipotecario’s
financial results of operations. We cannot assure you that court
and administrative rulings based on the newly-enacted regulation or
measures adopted by the enforcement authorities will not increase
the degree of protection given to Banco Hipotecario’s debtors
and other customers in the future, or that they will not favor the
claims brought by consumer groups or associations. This may prevent
or hinder the collection of payments resulting from services
rendered and financing granted by us, which may have an adverse
effect on Banco Hipotecario’s business and results of
operations.
Class actions against financial institutions for unliquidated
amounts may adversely affect the financial system’s
profitability.
Certain public and private
organizations have initiated class actions against financial
institutions in Argentina. The National Constitution and the
Consumer Protection Law contain certain provisions regarding class
actions. However, their guidance with respect to procedural rules
for instituting and trying class action cases is limited.
Nonetheless, through an ad hoc doctrine, Argentine courts have
admitted class actions in some cases, including various lawsuits
against financial entities related to “collective
interests” such as alleged overcharging on products, interest
rates and advice in the sale of public securities, etc. If class
action plaintiffs were to prevail against financial institutions,
their success could have an adverse effect on the financial
industry in general and indirectly on Banco Hipotecario’s
business.
36
Banco Hipotecario operates
in a highly regulated environment, and its operations are subject
to regulations adopted, and measures taken, by several regulatory
agencies.
Financial institutions are subject
to a major number of regulations concerning functions historically
determined by the Central Bank and other regulatory authorities.
The Central Bank may penalize Banco Hipotecario and its directors,
members of the Executive Committee, and members of its Supervisory
Committee, in the event of any breach the applicable regulation.
Potential sanctions, for any breach on the applicable regulations
may vary from administrative and/or disciplinary penalties to
criminal sanctions. Similarly, the CNV, which authorizes securities
offerings and regulates the capital markets in Argentina, has the
authority to impose sanctions on us and Banco Hipotecario’s
Board of Directors for breaches of corporate governance established
in the capital markets laws and the CNV Rules. The Financial
Information Unit (
Unidad de
Información Financiera
, or “UIF” as per its
acronym in Spanish) regulates matters relating to the prevention of
asset laundering and has the ability to monitor compliance with any
such regulations by financial institutions and, eventually, impose
sanctions.
We cannot assure you whether such
regulatory authorities will commence proceedings against Banco
Hipotecario, its shareholders or directors, or its Supervisory
Committee, or penalize Banco Hipotecario. This notwithstanding, and
in addition to “Know Your Customer” compliance, Banco
Hipotecario has implemented other policies and procedures to comply
with its duties under currently applicable rules and
regulations.
In addition to regulations specific
to the banking industry, Banco Hipotecario is subject to a wide
range of federal, provincial and municipal regulations and
supervision generally applicable to businesses operating in
Argentina, including laws and regulations pertaining to labor,
social security, public health, consumer protection, the
environment, competition and price controls. We cannot assure that
existing or future legislation and regulation will not require
material expenditures by Banco Hipotecario or otherwise have a
material adverse effect on Banco Hipotecario’s consolidated
operations.
Increased competition and M&A activities in the banking
industry may adversely affect Banco Hipotecario.
Banco Hipotecario foresees increased
competition in the banking sector. If the trend towards decreasing
spreads is not offset by an increase in lending volumes, the
ensuing losses could lead to mergers in the industry. These mergers
could lead to the establishment of larger, stronger banks with more
resources than us. Therefore, although the demand for financial
products and services in the market continues to grow, competition
may adversely affect Banco Hipotecario’s results of
operations, resulting in shrinking spreads and
commissions.
Future governmental measures may adversely affect the economy and
the operations of financial institutions.
The Argentine government has
historically exercised significant influence over the economy, and
financial institutions, in particular, have operated in a highly
regulated environment. We cannot assure you that the laws and
regulations currently governing the economy or the banking sector
will remain unaltered in the future or that any such changes will
not adversely affect Banco Hipotecario’s business, financial
condition or results of operations and Banco Hipotecario’s
ability to honor its debt obligations in foreign
currency.
Several legislative bills to amend
the Financial Institutions Law have been sent to the Argentine
Congress. If the law currently in force were to be comprehensively
modified, the financial system as a whole could be substantially
and adversely affected. If any of these legislative bills were to
be enacted or if the Financial Institutions Law were amended in any
other way, the impact of the subsequent amendments to the
regulations on the financial institutions in general, Banco
Hipotecario’s business, its financial condition and the
results of operations is uncertain.
Law N° 26,739 was enacted to
amend the Central Bank’s charter, the principal aspects of
which are: (i) to broaden the scope of the Central Bank’s
mission (by establishing that such institution shall be responsible
for financial stability and economic development while pursuing
social equity); (ii) to change the obligation to maintain an
equivalent ratio between the monetary base and the amount of
international reserves; (iii) to establish that the board of
directors of the institution will be the authority responsible for
determining the level of reserves required to guarantee normal
operation of the foreign exchange market based on changes in
external accounts; and (iv) to empower the monetary authority to
regulate and provide guidance on credit through the financial
system institutions, so as to “promote long-term production
investment.”
37
In addition, the Civil and
Commercial Code, among other things, modifies the applicable regime
for contractual provisions relating to foreign currency payment
obligations by establishing that foreign currency payment
obligations may be discharged in Pesos. This amends the legal
framework, pursuant to which debtors may only discharge their
foreign currency payment obligations by making payment in the
specific foreign currency agreed upon in their agreements; provided
however that the option to discharge in Pesos a foreign currency
obligation may be waived by the debtor is still under
discussion.
We are not able to ensure that any
current or future laws and regulations (including, in particular,
the amendment to the Financial Institutions Law and the amendment
to the Central Bank’s charter) will not result in significant
costs to us, or will otherwise have an adverse effect on Banco
Hipotecario’s operations.
Banco
Hipotecario’s
obligations as trustee of
the Programa de Crédito Argentino del Bicentenario para la
Vivienda Única Familiar (“PROCREAR”) trust are
limited.
Banco Hipotecario currently acts as
trustee of the PROCREAR Trust, which aims to facilitate access to
housing solutions by providing mortgage loans for construction and
developing housing complexes across Argentina. Under the terms and
conditions of the PROCREAR Trust, all the duties and obligations
under the trust have to be settled with the trust estate.
Notwithstanding, if the aforementioned is not met, Banco
Hipotecario could have its reputation affected. In addition, if the
Argentine government decides to terminate the PROCREAR Trust and/or
terminate Banco Hipotecario’s role as trustee of the PROCREAR
Trust, this may adversely affect Banco Hipotecario’s results
of operations.
Operations
Center in Israel
Risks relating to
Israel
The implementation of the provision of the Israeli Law to Promote
Competition and Reduce Concentration, 5774-2013 may have
implications on IDBD and its subsidiaries.
In
December 2013, the official “Reshumot” published in
Israel the Promotion of Competition and Reduction of Centralization
Law, No. 5774-2013 (the “Reduced Centralization Act”)
which limits the use of pyramidal structures (or multiholding
companies) that control “reporting entities”
(principally entities whose securities are held by public
shareholders) such regulation limits to two layers of reporting
entities, being the holding company the first layer without
including a reporting entity that has no controlling shareholder.
Pursuant to the terms of this law, we may have to sell or dispose
certain subsidiaries.
Following
the implementation of the Reduced Centralization Act, in August
2014, IDBD’s board of directors appointed an advisory
committee to examine various alternatives to comply with the
limitations set forth in the Reduced Centralization Act. Since
then, the Company and IDBD have been taking measures and steps
towards streamlining their organization to comply with such
requirements, including the appointment of independent directors
and the divestment from certain subsidiaries. For more information,
see “Item 4. Business Overview - General regulations
applicable to our business in Israel - Reduced Centralization
Act.” In case that a “layer” is not eliminated in
IDBD and its subsidiaries by December 2017, the applicable
authority in Israel may impose penalties on IDBD pursuant to the
terms of the Reduced Centralization Act.
On
August 2017, Dolphin Netherlands B.V. (“Dolphin”) made
a non-binding offer to purchase all the shares held by IDBD in
Discount Investment Corporation Ltd. (“DIC”). On
September 20, 2017, complying with the Reduced Centralization Act
in respect to the pyramid participation structure, Dolphin executed
a binding term sheet for the acquisition of the entire shares held
by IDBD in DIC. The term sheet has been approved by the independent
directors committee created for the purposes of such transaction
which has been participated in the negotiations, analyzed and
assessed the term sheet. This term sheet shall continue in
negotiations between the parties so as to define the terms and
conditions of the definitive documents to be executed. The Audit
Committee of the Company has issued an opinion without objections
to make with respect to the referred transaction. On September
2017, IDBD announced that following the negotiations of DIC’s
independent board committee such non-binder offer was accepted
pursuant to which Dolphin bought all IDBD’s interest in DIC
at a price of NIS 16.6 per share (and in total of NIS 1.77 billion
in respect of all the shares which will be sold) by means of a
debenture that will be issued by the purchaser to IDBD, for the
entire amount of the consideration for the shares.
The
offer is subject to the parties’ executing the final
agreement (which is subject to further negotiation) until November
16, 2017 as well as to the approval of the transaction by the
companies’ corporate bodies and the fulfillment of additional
conditional terms by December 10, 2017. No assurance may be given
that the parties will execute or perform any binding agreement.
This transaction could significantly extend over time or could fail
to be consummated or be consummated under different terms, as it
must be approved by IDBD’s corporate bodies and other
entities, which could withhold their consent.
38
The deterioration of the global economy and changes in capital
markets in Israel and around the world may affect IDBD and its
subsidiaries.
A recession
or deterioration of capital markets around the world and in Israel
(including volatility in securities prices, exchange rates and
interest rates), whether those which affect the entire economy, or
those which affect specific market branches, are affecting and may
affect IDBD and its subsidiaries, inter alia, as
follows:
●
Negative effects on the state of their business
affairs (including the demand for products of the subsidiaries of
IDBD);
●
Negative effects on the value of the marketable
securities and on the value of non-marketable assets which are held
by them;
●
Negative effects on their ability to generate
profits or an increase in capital attributed to shareholders of the
companies, and realization of their holdings;
●
Negative effects on their liquidity and
equity;
●
Negative effects on their ability to perform
issuances on stock exchanges, in Israel and abroad;
●
Negative effects on the financial ratios of
those companies, in a manner which could impose difficulties on
capital raisings and/or affect their terms, or harm the fulfillment
of financial covenants, insofar as any have been determined, in
connection with the provision of loans by financing entities, or
require them to provide additional securities to financing
entities, and even to repay the foregoing credit, or constitute
grounds for demanding the realization of securities which were
given to secure the foregoing credit;
●
Negative effects on their debt ratings, as given
by rating entities and their debt repayment ability;
●
Negative effects on their ability to distribute
dividends;
●
Negative effects on the need for recording of
impairment and on the data reported in their financial statements,
due to the accounting standards which apply to them;
and
●
Difficulties imposed on the identification of
financing sources and on the raising or refinancing of debt funds,
if these are required by them in order to finance their operating
activities and long term activities, as well as on the terms of
financing from financial entities and from banks.
Certain subsidiries import or buy
raw materials which are required for their activities, and
therefore, their business results may also be affected by changes
in the prices of raw materials around the world.
Changes in legislation, standardization and regulation may have an
impact on IDBD operations.
In recent years, a trend of
increased legislation, standardization and regulation has taken
place, horizontally and in various operating segments in the
Israeli economy. This trend has an effect, including a significant
effect, on the operations of certain material subsidiaries of IDBD,
on their financial results, and on the prices of their securities,
as well as on the activities of IDBD.
Legislative amendments in various
areas in Israel and abroad, such as legislation regarding
concentration, promotion of competition and antitrust laws, tax
laws, regulation over the communication market, supervision of
insurance business operations, legislation in the field of
encouragement of capital investments, companies and securities
laws, laws pertaining to the supervision of prices of products and
services, increased competition in the food market, consumer
protection laws, environmental laws, planning and construction
laws, etc., may have an effect on the business operations and
results of IDBD and of its subsidiaries. Additionally, there may be
such effects due to changes in the policy which is adopted by the
various authorities by virtue of these laws.
Changes in the tariffs and in the policy regarding protection of
local products may affect the results of some of the subsidiaries
which are held by IDBD.
Some of the subsidiaries which are
held by IDBD operate abroad, or have securities which are traded on
foreign stock exchanges. Changes in legislation and in the
regulatory policies of the relevant foreign countries, as well as
the characteristics of the business environment in the country of
operation, may affect the financial results and the business
position of those companies.
39
Changes in IFRS or in the accounting
principles which apply to IDBD and its subsidiaries may have an
impact, and even a significant impact, on their financial results,
on various lines (including capital attributable to shareholders
and profit) reported in the financial statements of IDBD and its
subsidiaries, on their fulfillment of financial covenants, insofar
as any have been determined for them, on their fulfillment of the
conditions of permits and licenses which were given to them, and on
their ability to distribute dividends.
IDBD and its subsidiaries are exposed to financial
risks.
IDBD and its subsidiaries are
exposed to changes in interest rates and price indexes, and to
changes in exchange rates which affect, directly or indirectly,
their business results and the value of their assets and
liabilities (due to the scope of their CPI-linked liabilities and
due to their investments in real estate properties outside Israel).
There is also an effect on capital attributable to shareholders of
IDBD, with respect to the reserve for adjustments to capital due to
the translation of financial statements of subsidiaries in foreign
currency, primarily Real Estate Corporations in Las Vegas and
foreign subsidiaries of PBC.
IDBD and its subsidiaries are exposed to risks associated with
foreign operations.
IDBD and its subsidiaries operate in
the real estate segment outside Israel, and primarily in the United
States, both in the revenue-generating properties segment and in
the residential construction segment. Material adverse changes in
the state of the economy in a country in which such properties are
located affect the ability to operate and realize such investments,
and the receipt of financing under reasonable conditions. A global
economic crisis and a recession in the global economy may adversely
affect the various markets in which IDBD and its subsidiaries
operate, especially in the United States. The characteristics of
the business environment outside Israel, including the local
regulation, the purchasing power of consumers, the financing
possibilities (under reasonable conditions, if at all), and the
selection of entities (including local entities in Israel) which
are engaged in the field on financing with whom the collaboration
is done with, and these entities business status, may affect the
possibilities for financing, their terms, and the success of the
foreign operation, and accordingly, may have an adverse effect on
their business operations and the results of operations of IDBD and
its subsidiaries.
Some activities of IDBD and/or its subsidiaries may be restricted
by the terms of certains government grants and benefits and/or
budgetary policy.
Some of the subsidiaries of IDBD
receive funds from government entities, such as grants for research
and development activities, which are provided in accordance with
the Encouragement of Industrial Research and Development Law,
5744-1984, and regulations enacted pursuant thereto, as well as
grants and/or various tax benefits which are provided in accordance
with the Encouragement of Capital Investments Law, which are
granted under certain conditions. These conditions may restrict the
activities of the companies which receive such funds.
Non-compliance of such restrictions may lead to the imposition of
various penalties on them, including financial and criminal
sanctions. Additionally, a decrease or other changes in the budgets
of the aforementioned government entities, in a manner which
prevents or reduces the grants and/or benefits which the
subsidiaries of IDBD may receive from them in the future, may
adversely affect the operations and results of those
companies.
Additionally, investments of foreign
entities, and particularly in the technology and communication
sectors, receive certain benefits derived from the encouragement of
foreign investments by regulatory entities in Israel, including
certain tax benefits. If the aforementioned benefits are stopped
and/or restricted, the foregoing may negatively affect investments
of foreign entities in subsidiaries which are held by IDBD may
cause them to loose such benefits which, may negatively affect
their business results,which may adversely affect the business
results of IDBD, or the marketability of their
securities.
40
Regional conflict may affect IDBD or its subsidiary’s
activities, especially Cellcom (“Cellcom”)
activities.
The activities of Cellcom and its
network are located in Israel, as are some of its suppliers. A
significant part of Cellcom’s communication network, as well
as a significant part of Cellcom’s information systems, are
located within the range of missile attacks launched from the Gaza
Strip and Lebanon. Any damage caused to the communication network
and/or to the information systems may adversely affect
Cellcom’s ability to continue providing services, in whole or
in part, and/or may negatively affect the activities of Cellcom in
other ways, and may adversely affect its business results and
IDBD’s business. Additionally, negative effects of this kind
may materialize due to an increase in criticism of Israel by
international community. In general, any armed conflict, terror
attack or political instability in the region may result in a
decrease in Cellcom’s income, including from roaming services
of incoming tourism, and may thereby adversely affect its business
results.
Changes in the characteristics of the foreign business environment
may impact in IDBD or its subsidiary’s activities, especially
Property & Building (“PBC”) foreign
operations.
In its foreign activities, it is the
practice of PBC to cooperate with local entities engaged in the
segment. The characteristics of the foreign business environment,
including local regulation, the purchasing power of citizens, and/
or financing possibilities, may affect the success of the foreign
operation, which is also dependent upon the choices of the local
entities. Additionally, if the profitability considerations of PBC
failed to take into account all of the relevant factors in the
relevant country, the foregoing may adversely affect the results of
operations of PBC, which in turn would have an adverse effect on
IDBD’s results of operations.
A deterioration in the political-security and economical situation
in Israel may affect IDBD or its subsidiary’s
activities.
A significant deterioration in the
political-security situation in Israel, and in light of the
political instability in the Middle East, may result in decreased
demand for rental areas and residential units, an exacerbation of
the manpower deficit in the construction and agriculture segment,
and the increased costs of works. These factors may adversely
affect the results of PBC, and consequently affect IDBD’s
results of operations. Additionally, all of Shufersal’s
(“Shufersal”) income is produced in Israel, and a
significant part of the products sold by it are grown, produced or
processed in Israel. Therefore, the business results of Shufersal
are directly affected by the political, economic and security
conditions in Israel. A significant deterioration in the security
situation or political situation in Israel may adversely affect
Shufersal’s business operations, financial position and
results of operations, which in turn would have an negatively
effect on IDBD’s results of operations.
Shufersal management routinely
evaluates the possible impact and implication of the general
economic situation in Israel, in particular on the retail food
market. Developments and shocks in the Israeli economy, as well as
an economic downturn or recession due to an economic crisis, may
have negative effects on the food retail market in Israel, and as a
result, also on Shufersal’s revenues and profitability, due
to the intensification of competition and due to changes in the
consumption habits of its customers. Likewise, the cost of living
issue may affect Shufersal’s business results, due to the
considerable pressure from consumers which is being applied on
Shufersal to reduce the prices of the products which it sells, and
the increasing competition from the discount chains, which are
expanding their operations. Deceleration in the Israeli economy may
negatively impact Clal's business, particularly in the long term
savings segment. Additionally, as a result of the aforementioned
deceleration, the risk associated with the exposure of Clal to
entities in Israel through its investments may increase due to the
deterioration of Israel's political and economic
situation.
IDBD and its subsidiaries are exposed to capital market and finance
risks.
IDBD and certain of its affiliates
are subject to supervision by the Israeli Supervisor of Banks
relating to “Proper Conduct of Banking Business” which
impose, among others limits on the aggregate principal amount of
loans a financial institution can have outstanding to a single
borrower, a group of related borrowers, and to the largest
borrowers and groups of related borrowers of a banking entity (as
these terms are defined in the aforesaid directives).
41
Changes to Proper Banking Management
Directives, changes to the list of entities and corporations which
are associated, jointly with IDBD, under the same group of
borrowers, and the balance of their debt to banks in Israel, as
well as changes in equity of the banks themselves, may restrict the
ability of the banking system in Israel to provide credit to IDBD
and its subsidiaries. However, since 2013 and until the publication
date of this report, a decrease has occurred in the scope of credit
used from the banking system in Israel for the group of borrowers
which includes IDBD due, among other reasons, to changes of control
of certain subidiaries.
The legislation and regulation which
apply to the investments of institutional entities, including the
implementation of the provision of credit to business groups, may
have an impact on the possibilities to raise capital from
institutional entities, and on the conditions of its
raising.
IDBD holds assets and manages its
business affairs in Israel. Therefore, almost all of IDBD’s
assets, liabilities, income and expenses are in NIS. IDBD’s
financing income and expenses are also subject to volatility due to
changes in interest rates on loans from banks and deposits which
were deposited in banks. IDBD’s policy regarding the
management of market risks, certain sibsidiaries used, in 2016,
derivative financial instruments with the aim of adjusting, where
possible, the linkage bases of its financial assets and liabilities
(hedging transactions). However, an increase of the rate at which
we finance our operations or the lack of financing at acceptable
terms, may have an adverse effect on IDBD’s results of
operations.
Lastly, developments and shocks in
the state of the economy, as stated above, may have negative
effects on the business results of IDBD and its subsidiaries, on
their liquidity, the value of their assets, results of operations,
their credit rating, their ability to distribute dividends, and
their ability to raise financing for its operations at acceptable
terms, insofar as it will be required to do so, and also on their
financing terms.
In addition, the prices of assets
and returns in capital markets in Israel and around the world have
a very significant impact on the business results of Clal. The
amount of management fees (fixed or variable) charged by Clal may
be reduced as the value of managed assets decreases, both as a
result of the negative returns, and as a result of the decrease in
the value of deposits or accruals.
Risks relating to
our business in Israel
IDBD and its subsidiaries are exposed to changes in permits and
licenses.
IDBD and some of its subsidiaries
operate in accordance with approvals, permits or licenses which
were granted to them by various authorities, such as the
Commissioner of Capital Markets, the Ministry of Communication, the
Ministry of Environmental Protection, and the Commissioner of Oil
Affairsin the Ministry of National Infrastructures, Energy and
Water. A breach of the terms of these approvals, permits or
licenses may lead to the imposition of penalties (including
criminal) against the IDBD or the relevant subsidiaries, including
fines and/orrevocation of such approvals, licenses or permits.
Revocation of such approvals, permits or licenses may adversely
affect such subsidiaries, whose operations are dependent upon them
(such as Clal and Cellcom). Some of the aforementioned licenses are
subject to an expiration date, and are renewable from time to time,
in accordance with their terms and the provisions of the law. There
is no certainty that the aforementioned licenses will be renewed in
the future and/or under conditions acceptable for IDBD. Non-renewal
of a permit or license, as stated above, and/or the directives of
regulators in segments in which subsidiaries of IDBD operate, may
have an adverse effect on the business position, capital, cash
flows and profitability of the relevant company which holds the
aforementioned permit or license, and accordingly, on the results
of operations of IDBD.
Class actions on consumer issues and environmental protection
issues may have an impact on IDBD and its
subsidiaries.
Subsidiaries of IDBD, primarily
including Cellcom, Shufersal and Clal, may be subject, from time to
time, to class actions on consumer issues and on environmental
issues (including in connection with non-ionizing radiation from
mobile devices, air emissions, and water, noise and odor
pollution), in material amounts, which are sometimes even higher
than their equity, and must defend themselves against them at
significant cost, even if such claims are unfounded from the
outset.
42
The provision of the Antitrust Law may affect IDBD
operations.
IDBD is subject to, inter alia, the
provisions of the Restrictive Trade Practices Law, with respect to
its transactions or transactions of its subsidiaries, which
constitute a merger and/or which include restrictive arrangements,
as these terms are defined in the aforementioned law.
IDBD and its subsidiaries may face environmental
risks.
Some of the subsidiaries which are
held by IDBD are subject to various requirements from different
authorities which oversee environmental protection. In recent
years, there is an ongoing trend of increased regulatory
requirements with respect to the environment, health and
agriculture, in Israel and around the world, which has and may
cause an increase in the costs of the companies in the
aforementioned segments. Changes in the policy of those supervising
authorities, new regulation or enhanced requirements to comply with
these regulations may affect the profitability of the relevant
subsidiaries, and in turn, the profitability of IDBD.
If debenture holders decide to iniciate actions IDBD activities may
be affected.
The trustee for the debenture
holders (Series I) of IDBD (the “Trustee”) raised, in
early 2016 (including within the framework of legal proceedings in
amendment of the debt settlement in IDB Holding Corporations Ltd.
(“IDBH”)) assertions regarding IDBD being insolvency,
and the debenture holders (Series I) also decided to appoint a
representation for that series. In June 2016, the trustee filed
with the District Court of Tel Aviv-Yafo (the “Court”)
a motion to order the liquidation of IDBD, and a motion to order
the appointment of a provisional liquidator (the “Motion To
Appoint A Provisional Liquidator”). On July 18, 2016, the
Court issued a ruling, in which the Court accepted the consensus
motion which was filed by the trustee to strike the motion to
liquidate. The initiation of legal actions against IDBD by its
debenture holders may harm the ability of IDBD to continue repaying
its debts in accordance with their current amortization schedules,
and may also lead to a demand for the immediate repayment of future
liabilities (primarily to lending corporations).
IDBD is exposed to changes in cash flows from
subsidiaries.
IDBD is a holding company and, as
such, relies on the dividends from it subsidiaries. In recent
years, the cash flows of IDBD have primarily been used to repay
debt (principal and interest payments). In recent years, the amount
of dividends distributed by the subsidiaries of IDBD has decreased
significantly, as a result of changes in the operating results, in
regulation, in profitability (including a decrease in the balance
of distributable earnings, or the existence of negative balances of
profits). Changes which have occurred in connection with Clal,
including capital requirements from insurers which are held by it,
and the appointment of a trustee has affected, and may continue to
adversely affect the dividend flows from Clal.
We have not
received a dividend from Clal in the last four years. DIC
distributed a dividend recently, but that was a relatively
extraordinary event, after more than two years during which
dividends were not distributed by DIC.
A
decrease of the cash flows from the subsidiaries may adversely
affect the cash flows of IDBD, and its business
activities.
IDBD and some of its subsidiaries may be affected by restrictions
on the sale of assets, including shares in
subsidiaries.
IDBD and some of its subsidiaries
are subject to legal and contractual restrictions, including those
which are included in permits and licenses, which may restrict the
possibility of selling and transferring IDBD’s equity
interest in its subsidiaries, or the possibility of pledging such
interests (including due to restrictions on the realization of such
pledges) by IDBD or by its subsidiaries.
For example, the
sale by IDBd of control over Clal may be subject to the purchaser
receiving a consent from the Insurance Commissioner, IDB is
restricted from pledging more than 5% of the shares of Clal without
an approval from the Insurance Commissioner and the sale of shares
of DIC representing more than 10% equity interest in Cellcom
requires an approval from the Ministry of
Communications.
IDBD and some of its subsidiaries may be affected by restrictions
on the performance of investments and continued investment in
existing companies.
IDBD and some of its subsidiaries
may be restricted from making new investments in ceretain areas in
certain areas or the increase of its investments in subsidiaries.
IDBD and some of its subsidiaries are also subject to restrictions
in accordance with the law or in accordance with the provisions of
various regulatory entities with respect to their business
activities, in Israel and abroad. These restrictions may limit the
possibility of IDBD to take advantage of business opportunities for
new investments, or to increase or realize existing investments,
and thus, may affect IDBD’s results of
operations.
43
IDBD and some of its subsidiaries may be affected by changes in
legal proceedings in the field of companies laws and securities
laws.
In recent years, an increasing trend
has taken place in the filing of class actions and derivative
claims in the field of companies laws and securities laws. In
consideration of the above, and of the financial position of IDBD
and the Group’s holding structure, claims in material amounts
may be filed against IDBD, including in connection with its
financial position and cash flows, issuances which it performs, and
transactions which were performed or which were not completed,
including in connection with assertions and claims by the
Company’s controlling shareholders.
Changes in controlling shareholder status may impact DIC’s
results of operations.
The intention of financial
institutions to reduce their credit exposure to corporations in the
IDB Group, may have an adverse impact on the ratings given for
DIC’s debentures and/or may impose difficulties on
DIC’s ability to raise capital and/or to refinance its debts,
if it is interested in doing so (and/or may worsen the refinancing
terms with respect to such debt). As of the publication date of the
report, DIC is unable to estimate the full impact of the results of
the aforementioned proceedings and events on DIC.
DIC may be affected by cash requirements, reliance on cash flows of
subsidiaries and liquidity.
The cash flows of DIC are used to
repay debt (principal and interest payments), to finance general
and administrative expenses, to make investments, and, if relevant,
to distribute dividends as well. One of the main sources for
DIC’s current cash flows includes dividends distributed by
its subsidiaries (if and insofar as any are distributed). An
additional source for DIC’s cash flows is the sale of assets,
including the sale of equity interests in subsidiaries. Changes in
the amount of dividends and/or in the value of asset realizations
accordingly affects DIC’s cash flows.
The state of capital markets in
Israel and around the world (which affects, inter alia, the value
of DIC’s investments), the financial ratios of DIC, the
decline in the value of its main holdings, and the returns at which
DIC’s debentures are traded, may have an adverse effect on
the rating of DIC’s debentures and/or may impair DIC’s
ability to raise capital and/or to refinance its debts, if it
wishes to do so (and/or may worsen the refinancing terms with
respect to such debt).
DIC and/or its subsidiaries may be affected by changes in financial
institutions which hold cash deposits and financial
assets.
Cash deposits and material financial
assets of DIC or of its subsidiaries (including listed shares of
their subsidiaries) are held on their behalf by financial
institutions and brokers. DIC and its subsidiaries, as stated
above, are exposed to the risk of losses in connection with these
assets, in certain cases involving a deterioration in the financial
stability of those financial institutions and brokers.
Cellcom is exposed to an aggressive competition.
The communication market is
characterized by significant competition in many of its segments,
including mobile communication and internet provider services. The
current level of competition in all markets in which Cellcom is
active, including the market for the sale of end user devices and
the offering of aggressive price plans by Cellcom’s
competitors, is expected to continue. The materialization of any
one of the developments described below will result in a
significantly adverse impact on Cellcom’s profitability, and,
thus, in its ability to pay dividends to IDBD:
(a) Difficulties or non-execution of
the network sharing and hosting agreement with Electra, which came
into force as of the beginning of the second quarter of 2017, or
any other development which will result in loss of income from
Golan, and an inability for Cellcom to compensate for the
foregoing, for example, in case of Golan’s insolvency, or
increased efforts by the other competitors on the market to recruit
Golan’s customers;
(b) Tariffs remaining at their
current rates, or an additional decrease in rates, including as
part of a package of services;
44
(c) An ineffective wholesale market
for landline communication, including due to the effective
exclusion of Hot infrastructure, the effective exclusion of
telephone services from the wholesale market, the offering of
services not in accordance with the criteria of the wholesale
market, without implementation of enforcement measures by the
Ministry of Communication, or the pricing thereof in a manner which
could negatively affect Cellcom’s ability to offer
competitive services packages, and to compete against Bezeq and Hot
(due to their dominant status in the landline communication
market), particularly if the structural separation which applies to
the Bezeq and Hot groups is canceled before the creation of an
effective landline wholesale market;
(d) Cancellation or easement of the
structural separation which applies to the Bezeq and Hot
groups;
(e) The entry of new competitors
into markets in which Cellcom is engaged, or the entry of existing
competitors into segments in which they were not previously active,
or were partially active;
(f) Distribution or acquisition of a
landline infrastructure by one of Cellcom’s competing
companies, which does not own such infrastructure, or collaboration
of a competitor company with an operator which has such
infrastructure, if Cellcom does not distribute or acquire such
infrastructure, or enter into a collaboration with an operator
which holds such infrastructure;
(g) Regulatory changes which
facilitate the transition of customers between operators;
or
(h) Continued increased competition
in the end user equipment market, and the entry of additional
competitors into the end user equipment market and/or legislation
or new judicial decisions which may restrict Cellcom’s
activities in the end user equipment sale market, and adversely
affect its income or profitability.
Changes in legislation and significant regulatory intervention may
have an impact on Cellcom activities.
Cellcom develops its activity in a
highly regulated market and relies on a license issued by the
Ministry of Communications of Israel to operate its business. Such
License has to be renewed every six years and may be amended
without Cellcom’s consent. See “Item 4. Business
– Regulation – Telecommunications.” Other changes
in legislation and the extent of such regulatory changes may have
adverse effects on Cellcom’s activities, including but not
limited to:
(a)
cancellation or easement of the structural
separation obligation which applies to Bezeq and Hot, particularly
if such cancellation or easement is given before the creation of an
effective wholesale market in the landline communication
market;
(b)
competition-encouraging tariffs;
(c)
the provision of easements and benefits to
competitors, over Cellcom;
(d)
granting permissions for other operators to
provide services to Cellcom subscribers which were previously
provided only by Cellcom;
(e)
non-renewal of Cellcom’s licenses and/or
frequencies, or restriction of their use, and non-allocation of
additional frequencies, if required;
(f)
the establishment of additional requirements for
the provision of easements to competitors with respect to safety or
health, including with respect to the construction and operation of
base sites;
(g)
the establishment of additional restrictions or
requirements regarding the provision of services and products
and/or intervention in their terms of marketing, advertising and
provision, including regarding existing agreements;
(h)
the establishment of a higher standard of
service;
(i)
the establishment of a more stringent policy
with respect to protection privacy; or
(j)
the imposition of regulations on Cellcom’s
television over internet service, the establishment of
non-beneficial conditions for the use of DTT broadcasts, or the
imposition of such non-beneficial conditions on Cellcom and not on
other operators of the television over internet
service.
Regulatory developments also affect the risk
factors of tariff oversight, licensing of sites and the
indemnification obligation, non-ionizing radiation and dependence
on licenses.
45
Cellcom may face difficulties in obtaining approvals related to the
construction and operation of certain infrastructure.
Cellcom (and its competitors)
encounters difficulties in obtaining some of the required approvals
for the construction and operation of base sites, and particularly
in obtaining the building permits from the various planning
authorities. Cellcom’s ability to maintain the quality of its
mobile services is partially based on Cellcom’s ability to
build base sites. The difficulties encountered by Cellcom in
obtaining the required permits and approvals may adversely affect
the currently existing infrastructure, and the continued
development of its mobile network. Additionally, the inability to
obtain these approvals on time nay also prevent achievement of the
mobile service quality targets which were determined in
Cellcom’s mobile license, may result in loss of customers,
and may adversely affect its business results, which, in turn, may
adversely affect IDBD’s results of operations.
Cellcom provides communication
services in accordance with licenses which were given by the
Ministry of Communication, which are subject to changes by such
Ministry, including changes that may negatively affect
Cellcom’s interests and operations. A breach of the terms of
the licenses may result in the cancellation of the licenses. Tha
inability to function as it currently does or the imposition of
fines may adversely affect Cellcom’s operation which, in
turn, may affect IDBD’s operating results. and, as a result,
in Cellcom’s inability to continue operating in each of the
fields of communication in which it operates by virtue of the
aforementioned licenses. Also, a breach of the provisions of the
licenses may result in the imposition of significant financial
sanctions on Cellcom.
If the public’s concern with respect to non-ionizing
radiation increases, that may have a significantly adverse impact
on Cellcom.
Non-ionizing radiation is emitted
from two sources: end user equipment and mobile sites of various
kinds. The construction and operation of base sites is conditional
upon the receipt of a construction permit and an operation permit
from the Radiation Commissioner.
If it is determined or perceived
that there are health risks connected to non-ionizing radiation, or
that the radiation standards in the sites or in the end user
equipment are being exceeded, or a court rules against Cellcom or
against another mobile operator, or if a settlementis reached in a
claim which pertains to health damages derived from radiation,
claims of various types for damages with respect to property damage
and physical injury of significant scopes may increase, regulation
in the construction, operation and rentalof sites, decrease in
income as a result of a decrease in the use of mobile
communication, and realization of letters of indemnity which were
deposited with planning institutions in connection with section 197
of the Planning and Construction Law. Cellcom has no insurance
coverage for such cases. The increase in litigation or a reduction
in our revenues may have an adverse effect on Cellcom’s and
IDBD’s operating results.
46
Cellcom
depends significantly on technology and technological improvements
which require investments in order to maintain
competitive.
The communication market
is characterized by rapid and significant changes in technology,
requiring investment in advanced technologies in order to stay
competitive.
The increase in the consumption of
internet and content provider services through advanced mobile end
user equipment has resulted in increased data communication volumes
on mobile networks, and is expected to continue growing rapidly.
The transition of subscribers to unlimited packages has
significantly contributed to the increasing demand for data
transmission on Cellcom’s network, as well as text messages
and calls. In order to meet the increasing demand for data
communication, Cellcom is required to upgrade its transmission
network, and also to continue investing in its 4G network, which
will allow greater capacity and faster data transfer. Additionally,
in order to provide provider performance on the 4G network, Cellcom
makes use of additional frequencies on the Cellcom network, beyond
those which were allocated to it in the 4G frequencies
auctions.
Cellcom’s activities are
dependent upon several complex information systems and
technologies. Additionally, Cellcom’s array of packages
including mobile and landline services has increased the number of
information systems and complex technological systems which are
involved in the provision of service to Cellcom customers.
Malfunctions in the constantly changing and expanding complex
systems are unavoidable. A malfunction in any one of
Cellcom’s systems which adversely affects its ability to
provide services and products to its customers, or to charge for
them, may result in loss of income for Cellcom, and may adversely
affect the perception of Cellcom’s brand, and could expose
Cellcom to claims. Additionally, Cellcom is in the process of
implementing a shared customer service system for the mobile
segment and the landline segment, which may result in higher costs
than expected, may require significant managerial attention, which
could have been referred to routine management, and may also result
in unexpected operational difficulties and failures, which may
result in loss of income, legal claims and regulatory sanctions.
All of the above may have an adverse effect on Cellcom’s
results of operations.
Cellcom is exposed, to frequent
cyber attacks. Additionally, unauthorized penetration to the
information systems of Cellcom, or disruptions to their operation,
including due to internet hacks (including in customer systems
which are protected by information security products provided by
Cellcom), may cause damages and losses to Cellcom and its
customers, including due to the inability to provide certain
services, or due to the provision of such services in a disrupted
manner, which may lead to the inability to charge those services,
loss of information of Cellcom or of customers, or malicious use of
customer information. Cellcom has no insurance coverage for this
type of claims and liabilities.
A decrease of Cellcom’s
operating income and result due to higher costs vinculated to
technological changes, malfunctions or cyberattacks may have an
adverse effect on IDBD’s operating results.
Cellcom depends on the provision of services from other
operators.
Cellcom’s roaming services are
provided through foreign operators. Connecting to the other
networks requires certain infrastructure and the ability to connect
the networks between Cellcom and those operators. The absence of
accessible or high-quality service may negatively affect
Cellcom’s ability to compete in the market, and may affect
its business results and, thus, IDBD’s operating
results.
Cellcom may have to face emergency situations.
In emergency situations, the
applicable laws and certain provisions of the mobile license confer
upon the entities which are authorized by law to take steps as
required to ensure state security and/or public peace, including,
requiring Cellcom (as a mobile license holder) to provide service
to the security forces, the recruitment of Cellcom’s
engineering equipment and facilities, and even taking control of
the system. Such measures may have an adverse effect on our assets
and operating results.
47
Cellcom may be affected by its debt.
Cellcom has raised a significant
amount of debt and it is highly leveraged. This situation increases
Cellcom’s exposure to market changes, and makes it difficult
to respond quickly to changes in the industry and in the
competitive market conditions, including raising additional debt.
As of June 30, 2017, Cellcom’s net debt amounts to
approximately NIS 3,166 million (includes NIS 43 million which is
attributed to accrued interest). A change for the worse in
Cellcom’s results of operations, and any additional reduction
of Cellcom’s rating and its debentures may adversely affect
also the price and terms of Cellcom’s current debt, and the
raising of additional debt. An increase of interest debt services
may cause us to default and our obligations which may have an
adverse effect on Cellcom and IDBD.
Cellcom dependens on certain suppliers.
Cellcom is dependent upon several
suppliers which provide it with network equipment, end user
equipment, content and content operation services, information
systems and infrastructures. Cellcom’s business results may
be adversely affected if any of those suppliers do not provide its
support products and/or services at the required level of quality
or on time, or in conditions which do not benefit Cellcom, or
provides to Cellcom’s competitors preferable conditions, or
if the suppliers do not succeed in creating successful or in-demand
products or content, in the absence of an equivalent alternative.
Thus, for example, Bezeq suffered from strikes and breaches of
regulatory duties with respect to the provision of wholesale
services in an egalitarian manner to those which are provided to
its retail customers, or refused to offer services at all. Similar
scenarios to the foregoing may occur in the future and adversely
affect Cellcom.
Cellcom is subject to a dividend distribution policy.
If Cellcom does not comply with its
dividend distribution policy, or if it distributed dividends at a
rate lower than expected by the investors, this may result in an
adverse impact on Cellcom’s share price. Furthermore, the
aforementioned dividend policy may reduce Cellcom’s cash
balances and adversely affect its ability to finance unexpected
expenses in the future. As a result, Cellcom may be required to
borrow additional funds or to issue additional shares in accordance
with unattractive conditions which may dilute IDBD’s equity
interest in Cellcom, or Cellcom may encounter difficulties in
obtaining financing sources for these funds, which may affect its
financial resultas..
Cellcom may not be successful with its investments in new lines of
business.
Cellcom invested, and is expected to
continue investing, in the development of new lines of business,
with the aim of expanding and supplementing its services and its
array of offered products, such as television over internet
services, and a possible investment in a nationally distributed,
broad scale cable infrastructure which Cellcom is considering.
These efforts involve significant risks and uncertainties,
including deviating managerial attention, loss of focus in sales
and marketing efforts from core operations, absence of sufficient
income to balance out the liabilities and expenses which are
associated with the new investments, adverse effects on cash flows,
particularly in business operations which require a long term
investment and fixed amounts, such as with respect to the
acquisition of content for the television over internet service,
insufficient return on investment, regulatory changes which may
impose additional unplanned liabilities, inability to effectively
compete with the current competitors in the market or with new
competitors entering the market, issues which were not identified
in the evaluation of the aforementioned strategies and products,
such as operational difficulties and significant investments which
were insufficiently predicted, if at all. Such circumstances may
also affect Cellcom’s ability to distribute dividends and,
thus, adversely affects IDBD’s results of operations. These
investments are risky by nature, and therefore, there is no
certainty that the aforementioned strategies or products will be
successful, and, if not, that they will not have a significantly
adverse effect on Cellcom’s goodwill, financial position and
results of operations. Additionally, its entry to new business
operations, as stated above, may result in the intensification of
the competitive pressures by the current suppliers of competing
services over Cellcom’s core operations, in order to prevent
its efforts to compete against them in the relevant
market.
48
Employee unions may limit Cellcom’s operating
activities.
The employee union may restrict
Cellcom’s operating activities, including Cellcom’s
possibility of implementing organizational and personnel changes,
and may require significant managerial attention. Additionally,
future disputes with representatives of the employee union, such as
concerning the renewed fight over the collective agreement, may
result in the initiation of organizational steps and in adverse
effects on the services and on the customer service of Cellcom.
Such measures may also cause changes, may fail to be implemented in
a manner significantly different than planned, and as a result, may
result in lower savings than planned, or in conficts with our
employees.
An increase in construction costs may affect PBC results of
operations.
Changes in the consumer price index
and/or in the construction input price index may have an adverse
effect on the construction price of new properties, and indirectly
on the results of operations of PBC. Additionally, the economic
situation of the executing contractors in Israel may have an effect
on PBC, due to the decrease in the supply of contractors, the
increase in construction costs, and the extension of timetables for
the construction of projects. An increase of the construction costs
may affect our operating margins and profitability, and thus have a
negative effect on PBX’s results of operations.
PBC results of operations may be affected by the increase of the
supply of rental areas.
A significant decrease in the growth
rate in the Israeli economy, and a significant increase in the
surplus supply of rental areas, due to the construction of
additional office and commercial areas which may cause a decrease
in the rental prices, and may affect the income of PBC from
revenue-generating properties.
PBC
’s
operational
activities depends on availability of raw materials and
workforce.
An ongoing delay or shortage in raw
materials or skilled construction workers may affect the ability of
the prime contractors with whom PBC engages to meet the original
timetables for the completion of the PBC’s projects, and the
cost of the works which are paid by PBC. Intensification of the
shortage of workforce in the construction segment in general, and
of the foreign workers in the construction segment in particular,
also affect wages in the construction segment, which may affect
construction costs and timetables for the completion of projects.
The cost of salary also affects the operations of PBC, such as
security and cleaning works, by changes in the minimum wage in the
market, and to collective agreements which apply to the
aforementioned activities.
PBC is exposed to changes in legislation and
standardization.
Changes in permits, regulations,
restrictions and government oversight, such as changes in municipal
tax laws in areas where PBC properties are located, may increase
costs and negatively affect the operations and results of PBC. The
activities of PBC in the residential segment may also be affected
by regulatory changes in connection with the marketing of
apartments and lands, and in taxation in connection therewith.
Higher taxes on costs related to the compliance with new
regulations may adversely affect PBC’s results.
PBC is exposed to changes in securities prices.
PBC is exposed volatility in the
prices of securities (primarily debentures) on the stock exchange,
with respect to the investment of some of its cash surplus in such
securities.
PBC is exposed to foreign currency fluctuations.
The activities of PBC in Israel are
not directly affected by fluctuations in the US$:NIS exchange rate,
due to the fact that the rent charged by PBC from its customers,
and the loans which it has raised, are linked to the consumer price
index. However, PCB has foreign currency risk due to its foreign
investing activities, the financing used in connection therewith,
and the operating cost related to those investments. Additionally,
in light of the fact that some of the customers of PBC in Israel
are international companies, which managed their activities in US$,
in case of a decrease in the exchange rate, rent becomes more
expensive relative to the US$, and therefore, there is pressure on
international lessees to reduce the NIS rent accordingly. In
addition, an increase in the rent we charge may cause some clients
to terminate their agreements and, thus, affect our results.
Therefore, a decrease in the rent we charge or the decrease of
occupancy of our buildings may negatively affect our results of
operations.
49
Important changes in interest rate risks may affect the value of
PBC’s properties.
Extreme changes in interest rate
risks in Israel and abroad may affect the value of PBC’s
properties. The higher the interest rates increase, the higher the
required return on the properties, and the lower the value of the
property as a result, and vice versa.
PBC may have to face difficulties in financing and raising
capital.
Developments in the financial crisis
in Israel and around the world may negatively affect the
possibilities of PBC to raise funding for additional investments.
Additionally, restrictions on the maximum scope of credit which the
commercial banks in Israel are entitled to provide to each of the
member companies of the IDB Group as a “single
borrower,” including PBC and the other member companies of
PBC, may affect the ability of PBC to receive financing from
financial institutions, or the scope thereof. Additionally, PBC may
be affected by specific restrictions which could affect the
banks’ ability to provide financing to the real estate
segment, such as stringent requirements regarding capital adequacy
and restrictions regarding branch-specific exposure.
Shufersal on key suppliers.
Shufersal business depends on the
provision of certain products by key providers. There is no
certainty that these key suppliers, or other large suppliers, will
continue to provide their products or maintain the terms at which
we acquire them, or that they will not significantly change their
pricing policies, or encounter difficulties in the provision of
products to Shufersal. In such cases, we may not continue to offer
our products in the current terms or provide them at all, therefore
Shufersal’s business affairs, financial position and results
of operations may be negatively affected.
Shufersal may have to affront risks related to approvals and
licenses.
The operation of branches in the
Shufersal chain, acquisition of new branches, and Shufersal’s
operations with respect to land development, require obtaining
approvals and licenses from governmental entities. Some of the
branches in the Shufersal chain require licenses or approvals which
have not yet been obtained, or whose validity has expired, and
require renewal. If Shufersal is unsuccessful in obtaining or
renewing such approvals or licenses, including those related to its
main branches, Shufersal may be required to close those branches,
or to take corrective actions with respect to such branches or real
estate developments. The inabillity to open new shops or maintain
our main branches may have a negative effect on our
operations.
Shufersal may have to face risks related to changes in
regulation.
Shufersal is subject to legislation
with respect to business and sanitation, as well as new consumer
legislation which confers extensive authorities upon the Israel
Consumer Protection and Fair Trade Authority, consumer legislation,
price regulation and the minimum wage legislation. Changes in such
regulations may adversely affect the business affairs of Shufersal,
its financial position and its results of operations. It is noted
that an increase in the minimum wage may result in adverse effects
to the financial results of Shufersal, including its profitability.
Additionally, the Commissioner’s determinations regarding the
rules for conduct between the large marketing chains, of which
Shufersal is one, and dominant suppliers in the good segment,
including by virtue of the provisions of the Food Law, and
regarding the merger of Shufersal with Clubmarket, may adversely
affect Shufersal’s business affairs, financial position and
results of operations.
Shufersal may be affected by the competition.
The retail business in Israel is
highly competitive. Shufersal closely monitors the developments in
the Israel retail sector, and adjusts its operations, if and
insofar as is required, in accordance with those developments.
Shufersal is dealing with the competition in this sector, by
continuing the implementation of its business plan. Competitive
pressures, including the responses of competitors and of the market
to Shufersal’s strategy and the manner of its implementation,
may result in adverse effects to Shufersal’s ability to deal
with the foregoing, and may lead to the reduction of prices, lower
margins, and the loss of market share in a manner which may have an
adverse effect on Shufersal’s business affairs, financial
position and results of operations.
50
Shufersal may have to face risks associated with changes of real
estate.
Shufersal owns, wholly or partially,
several shopping malls and commercial centers, in which its
branches constitutes anchor stores, as well as additional areas
which are used by Shufersal branches. The ownerships of these
properties is exposed to risks associated with real estate
properties, such as adverse changes in the state of the local
economy, excess of supply, decreased demand, adverse regional real
estate markets, and lower occupancy rates, rent, and revenues, and
changes in the value of the properties. Such events may have an
adverse effect on Shufersal’s operations and financial
position. In addition, a failure by Shufersal to recruit or
maintain tenants to occupy its properties in general, and tenants
of large properties in particular, may have an adverse effect on
Shufersal’s real estate business activities.
Additionally, an ongoing recession,
if any, due to an economic downturn or crisis, may cause an
increase of vacancy of the rented properties and/or a reduction in
rent we charge for those properties.
Shufersal is subject to risks related to product liability and
production quality.
Shufersal, through a wholly owned
subsidiary, operates three production plants, and accordingly,
Shufersal is subject to risks related to themanufacturing of food
products. A significant defect in those products or in itd
designmay adversely affect Shufersal’s business affairs,
financial position and results of operations.
Shufersal markets different
products, including drugs, food products and hygiene products,
which have a particular impact on the health of our customers. Many
laws and regulations grant the rights and causes of actions to an
injured party or a group of injured parties whichsuffered any
damage due to a defective product which is assembled, stored,
marketed or sold by Shufersal. Although Shufersal is insured
against risks with respect to the aforementioned product liability,
if damage is caused to a consumer and/or to a group of consumers as
a result of such products, Shufersal may be liable for such damage
in a manner which could have an adverse effect on Shufersal’s
business affairs, financial position and results of
operations.
If Shufersal is unable to make use of its logistical centers, for
any reason whatsoever, its ability to distribute its products to
its branches may be impaired.
According to Shufersal’s
estimate, it will be able to prepare for direct distribution of the
majority of its products to all of its stores within a reasonable
period of time, and in accordance with the ability of suppliers to
supply the products directly to the stores. In light of
Shufersal’s insurance coverage, Shufersal estimates that this
matter will not significantly affect its results. Additionally, if
physical damage is caused to the building of the logistical center
where Shufersal management is located or to the aforementioned
logistical centers, the matter may have a significantly adverse
impact on Shufersal’s operations and results.
Shufersal may have risks related to the collective labor
agreement.
Most of Shufersal’s employees
are covered by collective labor agreement, and Shufersal cannot be
certain that this agreement will be renewed, from time to time, or
renegotiated in the same or familiar terms, or without involving
any direct action by the union, such as a strike. If a dispute
arises with employees which involves a strike or adverse effect to
the activities of Shufersal or such events may have an adverse
effect on Shufersal’s business affairs, financial position
and results of operations. Additionally, any re-negotiation of
collective agreements results in additional payroll expenses which
may affect our profitability and result of operations.
A defect in a product of Shufersal’s brand may imply a fall
in reputation.
Shufersal has a wide variety of
branded food and beverage products which enjoy many years of
reputation, as well as products under the private brand. Negative
publicity to this reputation by means of various publications, or
by other means, may affect our sales and adversely affect
Shufersal’s profitability, regardless of the correctness of
those publications. Additionally, a defect in a certain product may
also affect the brand under which we sell that product, as well as
the entire family of products which is marketed under the same
brand. However, Shufersal endeavors to protect its brands and
reputation, by strictly overseeing the quality of the raw materials
which it uses in the manufacturing of the products, the production
processes, the finished products and the advertising
messages.
51
Shufersal is exposed to risks associated with the issuance of the
voucher cards, including as regards fraud and theft.
Shufersal issues vouchers and
electronic voucher cards for the acquisition of products in its
stores and at other retailers with whom Shufersal has engaged for
this purpose. Despite the fact that Shufersal has taken measures to
reduce these risks, significant fraud may have an adverse effect on
Shufersal’s business affairs, financial position and results
of operations.
A failure in information processing and IT systems may adversely
affect Shufersal’s operating activities.
Shufersal makes use of various
information and IT systems. Shufersal’s central information
systems (and their backup systems) are located in and around the
logistical centers which are used to manage its distribution
network. Shufersal takes various steps in order to ensure the
functionality and reliability of the various information and IT
systems, including by securing and backing up the information.
However, a collapse of the information and IT systems may have an
adverse effect on Shufersal’s operating activities. Shufersal
makes use of systems and computer programs, some in accordance with
licenses which it has acquired. A significant part of the
aforementioned licenses are not restricted by time. However,
Shufersal engages with the license holders in agreements for the
receipt of service and support for the aforementioned systems and
programs, for periods of one year. Shufersal ensures to engage with
suppliers with a solid reputation and financial stability. However,
if such suppliers are unable to continue providing Shufersal with
their services, Shufersal will be forced to engage with other
suppliers, which may have an adverse effect on ourprocesseswhich
may have an andverse effect on our results.
Shufersal may face restrictions of the Bank of Israel regarding a
“single borrower” and a “group of
borrowers.
Shufersal is considered as belonging
to a “group of borrowers,” as part of the IDB Group. As
of the reporting date, the balance of bank credit of Shufersal and
its subsidiaries is insignificant.
Shufersal may be limited by the Anti-trust law in case it pursues
any future operations in the food retail segment.
Shufersal achieved a significant
part of its past growth by acquiring various retail operations.
Future acquisitions of various operations in the food retail
segment by Shufersal may require approval of the Antitrust
Authority, which may not be granted or under terms favorable to
Shufersal. As of the reporting date, taking into consideration of
the structure of the retail market, the restrictions which are
imposed on Shufersal by law, and the provisions of the Food Law we
estimate that Shufersal may not be able to acquire material entity
in the retail segment.
Important variations in interest rates may affect the value of
Clal.
One of the primary exposure of Clal
is to interest rate decreases, since the average lifetime of its
liabilities is significantly longer than the average lifetime of
the assets. Clal invests its assets in different securities and
such return of investments is subject to the variations of the
interest rates. Therefore our capacity and results depend,in part,
on the return o our investments. In the current interest rate
environment, the Clal is also exposed, from an accounting
perspective, to losses in certain scenarios involving an interest
rate decrease due to the impact of such changes on the discount
rates that are used in the calculation of the reserves for pension,
and in the liability adequacy test (“LAT”) and in a
scope which may exceed the capital gains which will be created in
that scenario with respect to interest-sensitive
assets.
Clal may have to face risks related to inflation.
Clal is exposed to an increase in
the inflation rate, due to the fact that the majority of insurance
liabilities of Clal are adjusted on a quarterly basis in accordance
with the inflation rate, while the assets held against them are not
necessarily CPI-linked. Our results depend on our revenues and
return of invetments, so, in a high inflation environment our
assets may not generate enough return to cover the CPI- adjusted
liabilities.
52
Other assets price risk.
Some of the assets of Clal and some
of the assets managed for others are invested in alternative
investments, which include investments in real estate and in real
estate funds, investment funds, non-marketable stocks and
additional investment instruments which are exposed changes in
their value.
International economic slowdown and price declines in capital
markets may affect Clal’s operating activities.
Clal invests in financial assets in
international capital markets, and in other foreign assets.
Therefore, a price decline due to a global or regional crisis or
slowdown may affect our investment portfolio and the return of such
investments.
Clal may face credit risks.
Clal is exposed to the possibility
of financial loss as a result of the insolvency of borrowers and
other debtors (through financial assets in the assets portfolio,
through activities involving policies in accordance with the Sales
Law, and credit insurance) with respect to its investments in debt
instruments. Additionally, an increase in insolvency of businesses
in Israel may also increase the amounts of claims of the
directors
’
and
officers
’
liability
insurance sector in which Clal operates, and the scope of
employers’ debts with respect to the non-transfer of payments
for pension insurance with respect to their employees. In its
portfolio of assets, Clal is exposed to the various market sectors,
of which the main ones are the banking and financial industries,
the real estate in Israel sector, and the infrastructure and energy
sector. A decline in activity, slow downs or crisis in such sectors
may have a negative impact on our investments and, thus, on the
results of our operations.
Clal may face insurance risks.
Clal is primarily exposed to the
occurrence of more events or to greater severity of events covered
by its policies, as compared with the actuarial assumptions, or an
accumulation of damages due to a catastrophic event, which may
cause liabilities higher than our reserves and provisions. Loss
reserves are established such that the provisionfor losses and
benefits represents an amount that is believed to be greater than
the mathematically expected amount that will be required to
ultimately settle all claims incurred in a certain period of time.
As such the provision makes allowance for identified sensitivities
underlying the reserve estimates. These estimates are based on
actuarial and statistical projections, at a given time, of facts
and circumstances known at that time and estimates of trends in
loss severity and other variable factors, including new concepts of
liability or other changes in legal precedents and general economic
conditions.
A decrease on the portfolio level may imply a risk for
Clal.
The rates of cancellation, freezing
and transfers constitute a significant assumption in the life and
health insurance businesses, due to the fact that the profitability
in this segment is based on a margin in premiums, and on the
collection of management fees throughout the lifetime of the
policy. The cancellation of policies also leads to the write-off of
deferred acquisition costs with respect to those policies.
Likewise, stability of reinsurers also means a risk for Clal. Clal
transfers some of their business risk with reinsurance, mostly
through foreign reinsurers. However, the reinsurance does not
release the direct insurers from their obligation towards their
policyholders according to the insurance policies. Such reinsurers
may become financially unable or unwilling to honour their
commitments by the time they are called upon to pay amounts due,
which may not occur for many years. In addition, reinsurance may
prove inadequate to protect against losses or may become
unavailable in the future at commercially reasonable
rates.
Clal may affront claims due to catastrophes.
Clal may be subject to a sudden
increase in claims due to a single large impact event (catastrophe)
witha large scope of damages,such as an earthquake. Clal is exposed
to other catastrophic events such as war and terrorism risks in
Israel.
53
Changes in legislation and regulation may affect Clal.
Clal is an insurance company and, as
such, develops its business in a highly regulated industry and is
exposed to continuing changes in legislation and regulation
pertaining to its operating segments. In particular, some of the
regulatory changes which were recently performed and which are
proposed, some as non-final drafts, may have an adverse effect on
Clal’s business model. Additionally, changes in legislation
and regulation, including circulars, determinations in principle,
position papers and provisions which the Commissioner of Capital
Markets is authorized to impose in connection with changes to
policy terms, including tariffs which may affect Clal, including to
products which were sold in the past, both by way of retroactive
application and due to their effect on the interpretation of
agreements which were signed in the past, may have an adverse
effect on Clal’s business.
Significant operations in
Clal are subject to detailed and complex
regulation
.
In particular, the insurance and
long term savings activities are subject to regulatory directives
which change from time to time, with respect to products which were
sold over many years, and which have long insurance coverage
periods and/or savings periods.
The institutional entities in Clal
are exposed to the risk of decline below the minimum capital
required, which may result in the initiation of regulatory actions
against them. Clal is subject to restrictions and conditions by
virtue of control permits for the institutional entities which are
under its control, including the capital maintenance
requirement.
Clal may face liquidity risks.
Clal may face liquidity challenges
due to the uncertainty associated with the date in which Clal will
be required to pay claims and other benefits to policyholders and
to other beneficiaries, relative to the total amount of reserves
which are available for this purpose at that time. Loss reserves
are established based on certain assumptions and actuarial
calculations. An increase of claims, lower return on investments or
the inability to sell our investments on time or at attractive
prices may cause our claims to be in excess of our loss reserves.
Liquidity risk may increase upon the materialization of a
significant catastrophic event.
Clal may have to face risks related to model, risk and underwriting
risk.
Clal is exposed, in its insurance
activities, to the risk of the selection of a wrong model for
pricing, for the estimation of insurance liabilities, to risk of
the use of incorrect parameters in models, and to risk of the use
of incorrect pricing as a result of deficiencies in the
underwriting process.
Clal is exposed to operational risks.
Risk of loss due to inadequacy or
failure of internal processes, people and systems, or due to
external events. In light of the scope of activities of Clal, and
despite the actions taken by it to identify the risks and to
establish appropriate controls, the scope of its exposure to the
operational risks of the type specified above is
significant.
Clal depends significantly on technology and technological changes
may imply investments in order to maintain
competitive.
A significant part of the activities
of Clal relies on different information systems. The absence of
sufficient infrastructure and/or deficiencies and/or failures in
the computerized information systems may cause significant adverse
effects to Clal operations. A disruption of operations may have
significant operating and financial losses.
The activities of Clal depends of external suppliers, and any
change on them may imply a risk for Clal.
As part of its activities, Clal
engages in agreements with various suppliers and service providers.
Clal is exposed to the risk of harm to its reputation and
profitability as a result of harm to the service quality which is
provided to it and to its customers, as well as risks associated
with difficulty in finding an alternative provider, if
necessary.
54
The
non-binding offer for Clal shares may have a negative impact on its
market price and, consequently, on our results of
operations.
On May 2017, IDBD agreed to the sale
of 5% of Clal’s shares jointly with a swap transaction.
Accordingly, such shares were sold on May 4, 2017, free from any
encumbrance, for a price of NIS59.86 per share (i.e., for an
aggregate amount of approximately NIS166 million, equivalent to
approximately US$697 million at the exchange rate prevailing on
such date).
Under the terms of the swap
agreement, IDBD retains the main risks and benefits of all of
Clal’s shares; for such reason, as of June 2017 all of
Clal’s shares were recorded as a financial assets held for
sale, and a liability of Ps.783 million was recorded. The valuation
of such shares as of June 30, 2017, is Ps.8,564 million and a gain
of Ps.2,513 million has been recorded under net financial results
for this fiscal year as a result of the increase in the fair value
of these shares.
Following instructions imparted by
Israel’s Capital Market, Insurance and Savings Commission to
the Trustee regarding the guidelines for selling Clal’s
shares, on August 2017, IDBD sold 5% of its equity interest in Clal
by way of a swap transaction, pursuant to terms identical to those
applied to the swap transaction made and reported to the market on
May 2017. The consideration for the transaction was an amount of
approximately NIS 164 million. Upon completion of the
transaction, IDBD’s equity interest in Clal was reduced from
49.9% to 44.9% of its stock capital.
On September 2017, IDBD’s
Board of Directors approved entering into a non-binding offer with
Huabang Financial Holdings Limited for the sale of its entire
equity interest in Clal, representing 44.9% of its stock capital.
The transaction is subject to a due diligence process, to be
conducted by the purchaser for a term of 60 days after the
execution of a memorandum of understanding, and the execution of a
binding agreement among the parties, among other requirements.
Moreover, the consummation of the transaction is subject to the
approval of Israel’s Capital Market, Insurance and Savings
Commission reporting to the Israeli Ministry of Finance. For more
information, see “Recent development – Operations
Center in Israel – Sale of Interest in Clal.” On
September 5, 2017 it was announced that Clal had made an erroneous
calculation of the amounts standing to the credit of the plaintiff
and the members of the class in profit-sharing policies, and
regarding the filing of a settlement in the action and a motion to
approve it, the Company gave an update that Clal reported, since
the Attorney- General did not file any opposition, the Tel Aviv
District Labor Law Court approved the settlement between the
parties.
The request to sell the shares of
CLAL in 5% tranches and the non-binding offer could cause a
negative impact on the market price. A decrease in the market price
of Clal’s shares would cause an immediate effect in our
income statements and financial results.
Risks Related to
the GDSs and the Common Shares
Shares eligible for sale could adversely affect the price of our
common shares and GDSs.
The market prices of our common
shares and GDS could decline as a result of sales by our existing
shareholders of common shares or GDSs in the market, or the
perception that these sales could occur. These sales also might
make it difficult for us to sell equity securities in the future at
a time and at a price that we deem appropriate.
The GDSs are freely transferable
under U.S. securities laws, including common shares sold to our
affiliates. Cresud, which as of June 30, 2017, owned approximately
63.38% of our common shares (or approximately 366.788.251 common
shares which may be exchanged for an aggregate of 36.678.825 GDSs),
is free to dispose of any or all of its common shares or GDSs at
any time in its discretion. Sales of a large number of our common
shares and/or GDSs would likely have an adverse effect on the
market price of our common shares and GDSs.
55
If we issue additional equity securities in the future, you may
suffer dilution, and trading prices for our equity securities may
decline.
We may issue additional shares of
our common stock for financing future acquisitions or new projects
or for other general corporate purposes. Any such issuance could
result in a dilution of your ownership stake and/or the perception
of any such issuances could have an adverse impact on the market
price of the GDSs.
We are subject to certain different corporate disclosure
requirements and accounting standards than domestic issuers of
listed securities in the United States
There is less publicly available
information about the issuers of securities listed on the Argentine
stock exchanges than information publicly available about domestic
issuers of listed securities in the United States and certain other
countries.
Although the GDSs are listed on the
NYSE, as a foreign private issuer we are able to rely on home
country governance requirements rather than relying on the NYSE
corporate governance requirements. See “Item 16G. Corporate
Governance—Compliance with NYSE listing Standards on
Corporate Governance.” Additionally, as a foreign private
issuer, we are exempt from certain rules under the Exchange Act
including (i) the sections of the Exchange Act regulating the
solicitation of proxies, consents or authorizations in respect of a
security registered under the Exchange Act; (ii) the sections
of the Exchange Act requiring insiders to file public reports of
their stock ownership and trading activities and liability for
insiders who profit from trades made in a short period of time; and
(iii) the rules under the Exchange Act requiring the filing
with the SEC of quarterly reports on Form 10-Q containing
unaudited financial and other specified information, or current
reports on Form 8-K, upon the occurrence of specified
significant events. In addition, foreign private issuers are not
required to file their annual report on Form 20-F until four
months after the end of each fiscal year, while U.S. domestic
issuers that are accelerated filers are required to file their
annual report on Form 10-K within 75 days after the end
of each fiscal year. Foreign private issuers are also exempt from
the Regulation Fair Disclosure, aimed at preventing issuers from
making selective disclosures of material information. As a result
of the above, you may not have the same protections afforded to
shareholders companies that are not foreign private
issuers.
Investors may not be able to effect service of process within the
U.S., limiting their recovery of any foreign judgment.
We are a
publicly held corporation (sociedad anónima) organized under
the laws of Argentina. Most of our directors and our senior
managers, are located in Argentina. As a result, it may not be
possible for investors to effect service of process within the
United States upon us or such persons or to enforce against us or
them in United States courts judgments obtained in such courts
predicated upon the civil liability provisions of the United States
federal securities laws. We have been advised by our Argentine
counsel, Zang, Bergel & Viñes, that there is doubt
whether the Argentine courts will enforce, to the same extent and
in as timely a manner as a U.S. or foreign court, an action
predicated solely upon the civil liability provisions of the United
States federal securities laws or other foreign regulations brought
against such persons or against us.
If we are considered to be a passive foreign investment company for
United States federal income tax purposes, U.S. Holders of our
common shares or GDSs would suffer negative
consequences.
Based on the current and projected
composition of our income and valuation of our assets, including
goodwill, we do not believe we were a passive foreign investment
company, or “PFIC” for United States federal income tax
purposes for the taxable year ending June 30, 2017, and do not
currently expect to become a PFIC, although there can be no
assurance in this regard. The determination of whether we are a
PFIC is made annually. Accordingly, it is possible that we may be a
PFIC in the current or any future taxable year due to changes in
our asset or income composition or if our projections are not
accurate. The volatility and instability of Argentina’s
economic and financial system may substantially affect the
composition of our income and assets and the accuracy of our
projections. In addition, this determination is based on the
interpretation of certain U.S. Treasury regulations relating to
rental income, which regulations are potentially subject to
differing interpretation. If we become a PFIC, U.S. Holders (as
defined in “Item 10. Additional
Information—Taxation—United States Taxation”) of
our common shares or GDSs will be subject to certain United States
federal income tax rules that have negative consequences for
U.S.
56
Holders such as additional tax and
an interest charge upon certain distributions by us or upon a sale
or other disposition of our common shares or GDSs at a gain, as
well as reporting requirements. See “Item 10.
E—Taxation—United States Taxation—Passive Foreign
Investment Company” for a more detailed discussion of the
consequences if we are deemed a PFIC. You should consult your own
tax advisors regarding the application of the PFIC rules to your
particular circumstances.
Changes
in Argentine tax laws may affect the tax treatment of our common
shares or GDSs.
On September 23, 2013, the
Argentine income tax law was amended by the passage of Law
No. 26,893. Under the amended law, the sale, exchange or other
transfer of shares and other securities is subject to a capital
gain tax at a rate of 15% for Argentine resident individuals and
foreign beneficiaries. There is an exemption for Argentine resident
individuals if certain requirements are met; however, there is no
such exemption for non-Argentine residents. See “Item 10.
Additional Information—Taxation—Argentine
Taxation.” However, as of the date hereof many aspects of the
amended tax law remain unclear and, pursuant to certain
announcements made by Argentine tax authorities, they are subject
to further rulemaking and interpretation, which may adversely
affect the tax treatment of our common shares and/or the GDSs.
Also, the amended law had established an income tax at a rate of
10% in the distribution of dividends; however, this has been
repealed by Law No. 27,260.
The income tax treatment of income
derived from the sale of GDSs or exchanges of shares from the GDSs
facility may not be uniform under the revised Argentine income tax
law. The possibly varying treatment of source income could impact
both Argentine resident holders as well as non-Argentine resident
holders.
In addition, should a sale of GDSs
be deemed to give rise to Argentine source income, as of the date
of this annual report no regulations are in force regarding the
mechanism for paying the Argentine capital gains tax when the sale
exclusively involves non-Argentine parties, despite the fact that
Law No. 27,260 further provides that in such case (i.e. both
seller and buyer are non residents) the buyer is in charge of
paying the tax.
In this connection, on July 20,
2017, General Resolution (AFIP) 4095-E suspended for 180 days the
entry into force of General Resolution 4094-E by which, almost four
years after Congress –by virtue of passing Law No 26,893-
imposed a capital gains tax on the gains recognized by nonresidents
on the sale of shares, quotas or other equity participations in
Argentine companies as well as “other securities” of
Argentine residents, the AFIP had implemented a payment mechanism
for resident and nonresident buyers. The new
resolution, currently suspended, was applicable to
transactions that occurred on or after September 23,
2013.
Therefore, holders of our common
shares, including in the form of GDSs, are encouraged to consult
their tax advisors as to the particular Argentine income tax
consequences under their specific facts.
Holders of the GDS may be unable to exercise voting rights with
respect to the common shares underlying their GDSs.
As a holder of GDS, we will not
treat you as one of our shareholders and you will not have
shareholder rights. The depositary will be the holder of the common
shares underlying your GDSs and holders may exercise voting rights
with respect to the common shares represented bythe GDSs only in
accordance with the deposit agreement relating to the GDSs. There
are no provisions under Argentine law or under our bylaws that
limit the exercise by GDS holders of their voting rights through
the depositary with respect to the underlying common shares.
However, there are practical limitations on the ability of GDS
holders to exercise their voting rights due to the additional
procedural steps involved in communicating with these holders. For
example, holders of our common shares will receive notice of
shareholders’ meetings through publication of a notice in the
CNV’s website, an Official Gazette in Argentina, an Argentine
newspaper of general circulation and the bulletin of the Buenos
Aires Stock Exchange, and will be able to exercise their voting
rights by either attending the meeting in person or voting by
proxy. GDS holders, by comparison, will not receive notice directly
from us. Instead, in accordance with the deposit agreement, we will
provide the notice to the GDS Depositary. If we ask the GDS
Depositary to do so, the GDS Depositary will mail to holders of
GDSs the notice of the meeting and a statement as to the manner in
which instructions may be given by holders. To exercise their
voting rights, GDS holders must then instruct the GDS Depositary as
to voting the common shares represented by their GDSs. Under the
deposit agreement, the GDS Depositary is not required to carry out
any voting instructions unless it receives a legal opinion from us
that the matters to be voted would not violate our by-laws or
Argentine law.
We are not required to
instruct our legal counsel to give that opinion. Due to these
procedural steps involving the GDS Depositary, the process for
exercising voting rights may take longer for GDS holders than for
holders of common shares and common shares represented by GDSs may
not be voted as you desire.
57
Under Argentine law, shareholder rights may be fewer or less well
defined than in other jurisdictions.
Our corporate affairs are governed
by our by-laws and by Argentine corporate law, which differ from
the legal principles that would apply if we were incorporated in a
jurisdiction in the United States, such as the States of Delaware
or New York, or in other jurisdictions outside Argentina. In
addition, your rights or the rights of holders of our common shares
to protect your or their interests in connection with actions by
our board of directors may be fewer and less well defined under
Argentine corporate law than under the laws of those other
jurisdictions. Although insider trading and price manipulation are
illegal under Argentine law, the Argentine securities markets are
not as highly regulated or supervised as the U.S. securities
markets or markets in some other jurisdictions. In addition, rules
and policies against self-dealing and regarding the preservation of
shareholder interests may be less well defined and enforced in
Argentina than in the United States, putting holders of our common
shares and GDSs at a potential disadvantage.
Restrictions
on the movement of capital out of Argentina may impair your ability
to receive dividends and distributions on, and the proceeds of any
sale of, the common shares underlying the GDSs.
The Argentine government may impose
restrictions on the conversion of Argentine currency into foreign
currencies and on the remittance to foreign investors of proceeds
from their investments in Argentina. Argentine law currently
permits the government to impose these kind of restrictions
temporarily in circumstances where a serious imbalance develops in
Argentina’s balance of payments or where there are reasons to
foresee such an imbalance. We cannot assure you that the Argentine
government will not take measures in the future. In such a case,
the GDS Depositary for the GDSs may hold the Pesos it cannot
convert for the account of the GDS holders who have not been
paid.
The
protections afforded to minority shareholders in Argentina are
different from and more limited than those in the United States and
may be more difficult to enforce.
Under Argentine law, the protections
afforded to minority shareholders are different from, and much more
limited than, those in the United States and some other Latin
American countries. For example, the legal framework with respect
to shareholder disputes, such as derivative lawsuits and class
actions, is less developed under Argentine law than under U.S. law
as a result of Argentina’s short history with these types of
claims and few successful cases. In addition, there are different
procedural requirements for bringing these types of shareholder
lawsuits. As a result, it may be more difficult for our minority
shareholders to enforce their rights against us or our directors or
controlling shareholder than it would be for shareholders of a U.S.
company.
We may
not pay any dividends.
In accordance with Argentine
corporate law, we may pay dividends to shareholders out of net and
realized profits, if any, as set forth in our Audited Financial
Statements prepared in accordance with IFRS. The approval, amount
and payment of dividends are subject to the approval by our
shareholders at our annual ordinary shareholders meeting. The
approval of dividends requires the affirmative vote of a majority
of the shareholders entitled to vote present at the meeting. As a
result, we cannot assure you that we will be able to generate
enough net and realized profits so as to pay dividends or that our
shareholders will decide that dividends will be paid.
Our
ability to pay dividends is limited by law and our
by-laws.
In accordance with Argentine
corporate law, we may pay dividends in Pesos out of retained
earnings, if any, to the extent set forth in our audited financial
statements. Our ability to generate retained earnings is subject to
the results of our operations. Therefore, our ability to pay
dividends is subject to the compliance with the Argentine Corporate
Law.
58
A. History and
Development of the Company
General
Information
Our legal and commercial name is
IRSA Inversiones y Representaciones Sociedad Anónima. We were
incorporated and organized on April 30, 1943, under Argentine law
as a stock corporation (
Sociedad
Anónima
), and we were registered with the Public
Registry of Commerce of the City of Buenos Aires (
Inspección General de Justicia
or
“IGJ”) on June 23, 1943, under number 284, on page 291,
book 46 of volume A. Pursuant to our bylaws, our term of duration
expires on April 5, 2043. Our common shares are listed and traded
on Bolsas y Mercados Argentinos (“BYMA”) and our GDSs
representing our common shares are listed on the New York Stock
Exchange (“NYSE”). Our principal executive offices are
located at Bolivar 108 1st floor, Ciudad Autónoma de Buenos
Aires (C1066AAD), Argentina. Our headquarters are located at Moreno
877, (C1091AAQ), Ciudad Autónoma de Buenos Aires. Our
telephone is +54 (11) 4323-7400. Information contained in or
accessible through our website is not a part of this annual report.
All references in this annual report to this or other internet
sites are inactive textual references to these URLs, or
“uniform resource locators” and are for your
information reference only. We assume no responsibility for the
information contained on these sites. Our Depositary Agent for the
GDSs in the United States is The Bank of New York whose address is
P.O. Box 358516 Pittsburgh, PA 15252-8516, and whose telephones are
+ 1-888-BNY-ADR for U. S. calls and + 1 - 201-680-6825 for calls
outside U.S.
History
We have been actively engaged in a
range of diversified real estate activities in Argentina since
1991. After our global public offering in 1994, we launched our
real estate activities in the office rental market by acquiring
three office towers located in prime office zones of Buenos
Aires.
Since 1996, through our subsidiary
IRSA Commercial Properties (former Alto Palermo S.A.), we have
expanded our real estate activities in the Shopping Malls segment
through the development and acquisition of controlling interests in
sixteen shopping malls: Alto Palermo, Abasto Shopping, Alto
Avellaneda, Alcorta Shopping, Patio Bullrich, Buenos Aires Design,
Dot Baires Shopping, Soleil Premium Outlet, Distrito Arcos, Alto
NOA Shopping, Alto Rosario Shopping, Mendoza Plaza Shopping,
Córdoba Shopping Villa Cabrera, La Ribera Shopping, Alto
Comahue Sopping and Patio Olmos (operated by a third party). Since
1996, we have also expanded our operations into the residential
real estate market through the development and construction of
multi-tower apartment complex in the City of Buenos Aires and
through the development of private residential communities in the
greatest Buenos Aires metropolitan area.
In 1997, we entered the hotel market
through the acquisition of a 50% interest in the Llao Llao Hotel
near Bariloche and 76.34% of the Intercontinental Hotel in the City
of Buenos Aires. In 1998, we also acquired Libertador Hotel in the
City of Buenos Aires and subsequently sold a 20% interest to an
affiliate of Sheraton Hotels.
In 1999, we acquired 2.9% of the
shares of Banco Hipotecario. Over the years, we have acquired
additional common shares increasing our interest to 29.91% as of
the date of this annual report.
Attractive prospects in our Office
business led us to make an important investment in this segment by
acquiring Bouchard 710 building in fiscal year 2005, covering
15,014 square meters of rentable premium space.
In December 2006, we started the
operation of Córdoba Shopping, a shopping mall located in the
neighborhood of Villa Cabrera in the City of Córdoba, Province
of Córdoba. Also, through our subsidiaries, we started in 2007
the construction of one of our most important projects, Dot Baires
Shopping, a shopping mall and an office building located in the
neighborhood of Saavedra.
During 2007, we made several
significant acquisitions in the Shopping Malls and Offices
segments. We purchased Bouchard Plaza building, also known as
“Edificio La Nación,” located in the downtown of
the City of Buenos Aires, and during 2015, we completed the sale of
all of the floors in Edificio La Nación, remaining in the
portfolio 116 parking spaces for rent. In 2007, we bought Dock del
Plata building with a gross leasable area of 7,921 square meters,
located in the exclusive area of Puerto Madero,
already sold in its entirety.
59
We also launched the development of
an office building at Dock IV of Puerto Madero, opened in May 2009,
which was entirely sold in December 2015. In addition, we acquired
a 50% interest in an office building including current leases with
a gross leasable area of 31,670 square meters, known as Torre
BankBoston, which is located in Carlos Maria Della Paolera 265,
Buenos Aires, and was designed by the recognized architect Cesar
Pelli (who also designed the World Financial Center in New York and
the Petronas Towers in Kuala Lumpur). We currently have a 47%
ownership interest in this building.
In March 2008, we launched a
residential project through a partnership with Cyrela Brazil Realty
to develop a new homebuilding concept in Argentina accompanied by
an innovative sale and financing policy. The partnership’s
first project named “Horizons” is located in the
Vicente López neighborhood, Province of Buenos Aires. The
project was a commercial success, all the units were sold in record
time.
In April 2008, we acquired a
building known as “Edificio República,” in the
City of Buenos Aires. This property, designed by the architect
César Pelli, is a premium office building in the downtown area
of the City of Buenos Aires, which added approximately 19,885 gross
leasable square meters to our portfolio.
In July 2008, we decided to expand
internationally into the United States, taking advantage of certain
investment opportunities generated after the global financial
crisis. We acquired a 49% interest in
Metropolitan 885 3rd Ave
("Metropolitan")
, a limited liability company
incorporated under the laws of Delaware. Metropolitan’s main
asset is a 34-story building with 59,000 sqm of gross leasable area
named Lipstick Building, located at 885 Third Avenue, New
York.
In May 2009, we opened the Dot
Baires Shopping, which has four levels and basement levels,
consisting of a total area of 173,000 square meters, 49,499 square
meters of which is gross leasable area. We, through IRSA CP, are
currently developing the project called “Polo Dot,”
which will consist of three office buildings (one of them may
include a hotel) on land reserves we own through IRSA CP and the
expansion of Dot Baires Shopping by approximately 15,000 square
meters of gross leasable area. In the first phase, we will develop
an 11-floor office building expansion with an area of approximately
32,000 square meters, in respect of which we have already executed
lease agreements for approximately 75% of the available leasable
area. Construction had an advance grade of 7.4% at the close of
this fiscal year and we estimate its opening for fiscal year 2019.
The second stage of the project consists of two office/ hotel
buildings that will add 38,400 square meters of GLA to the complex.
We have experienced an important demand for premium office spaces
in this new commercial center and we are confident that we will be
able to generate a quality enterprise similar to the ones that the
company has done in the past with attractive income levels and high
occupancy.
On August 4, 2009, we acquired a
12.86% interest of Hersha Hospitality Trust (“Hersha”)
for approximately US$60.0 million. Hersha is a U.S. Real Estate
Investment Trust (“REIT”), listed in NYSE, which owned
at that time participations in 77 hotels throughout the northeast
cost of the United States, which contain approximately 9,800 rooms.
By 2014, we had sold most of our interest in Hersha at prices by
common share that almost doubled the amount invested.
During 2010, we acquired from Parque
Arauco S.A. a 31.6% stake in IRSA CP, for a total purchase price of
US$126 million, as a consequence of which, we increased our
shareholding in IRSA CP from 63.4% to 94.9%. As of June 30, 2017,
our holding in IRSA CP was 94.61%.
On October 27,
2017, we reported that it has been completed the sale in the
secondary market of 2,560,000 ADSs of IRSA CP, which represent 8.1%
of IRSA CP. For more information please see
“Recent developments – Selling of
IRSA CP’ ADSs.”
In December 2010, we acquired a 49%
interest in the entity that then owned the building located at 183
Madison Avenue, New York, for a purchase price of US$85.1 million.
In November 2012, we increased our participation by an additional
25.5%, to 74.50% of the outstanding share capital. In September
2014, we completed the sale of 183 Madison Avenue, for a sale price
of US$185 million.
In March 2011, we bought the Nobleza
Piccardo warehouse, through a subsidiary in which we have a 50%
stake. This property is located in the city of San Martín,
Province of Buenos Aires, and due to its size and location
represents an excellent venue for the future development of
different segments. The total plot area is 160,000 square meters
with floor area of 81,786 square meters. We are currently working
in a draft project for the development of a thematic Shopping Mall
named “Hipercentro para el Hogar” to be constructed in
the existing main warehouse.
60
The project will involve 50,000 sqm,
divided into 30,000 sqm for a shopping mall and 20,000 sqm for
parking. For more information, please see “– Business
Overview – Sale and Development of Properties and Land
Reserves – Future developments.”
At the same time, we are working
jointly with an urban development firm in a comprehensive master
plan to design the remaining areas of the facility. At present, the
facility has a construction capacity of over 500,000 sqm that may
be used for different commercial purposes as well as to build
residential properties.
In August 2011, we acquired through
our subsidiary IRSA CP, 50% of Nuevo Puerto Santa Fe S.A.
(“NPSF”) common shares, a corporation that is tenant of
a building in which La Ribera Shopping was built and currently
operates, a mall of approximately 8,000 square meters of gross
leasable area, located within Dique I of the port of the city Santa
Fe.
In March 2012, we entered into an
agreement with Supertel Hospitality Inc. (“Supertel”)
whereby we acquired 3,000,000 convertible preferred shares in which
we invested approximately US$20 million. Supertel is a U.S. REIT
listed on Nasdaq, which began operations in late 70s and in 1994
completed its initial public offering. During 2015, it appointed a
new CEO who is working on the relaunching of the company. It has
also changed its name to “Condor Hospitality Trust” and
its symbol on Nasdaq to “CDOR” (“Condor”).
Condor is a REIT listed in Nasdaq focused on medium-class hotels
located in various states of the United States of America, managed
by various operators and franchises. For more information, please
see “B.Business Overview- Internacional”
In December 2014, we renamed Alto
Palermo S.A. into IRSA Commercial Properties S.A., and we
transferred 83,789 square meters of five buildings of our premium
office portfolio to it. As of June 30, 2017, we owned 94.61% of
shares of IRSA CP, which is listed on BYMA and on Nasdaq, under the
symbol “IRCP.” The premium office buildings transferred
included Edificio República, Torre Bank Boston, Edificio
Intercontinental Plaza, Edificio Bouchard 710 and Edificio
Suipacha. We also transferred to IRSA CP the reserve of land known
as Intercontinental II, adjoining Edificio Intercontinental Plaza,
which has potential for the development of 19,597 m2.
In December 2014, we opened a new
shopping mall, “Distrito Arcos, Premium Outlet.”
Located in Palermo (City of Buenos Aires), this new project of
approximately 13,000 square meters of gross leasable area, 52 shops
and 15 stands was established as an outlet with variety of premium
brands in an open-air environment.
In March 2015, we inaugurated the
sixteenth mall of our portfolio. Alto Comahue Shopping, located in
the center of the city of Neuquén, which has an area of 9,500
square meter gross leasable area, about 1,066 parking spaces
between indoor and outdoor and a major entertainment and leisure
space. The mall has 104 retail shops that feature the most
prestigious brands in Argentina. The project is part of a mixed-use
complex, to be complemented by a supermarket already in operation
and two parcels of additional land. One of them is for the
development of a hotel, and the other of 18,000 square meters, is
for future housing development.
In October 11, 2015, continuing with
our strategy of expansion and diversification in the international
markets, we gained control of the Israeli conglomerate IDBD. IDBD
is one of the largest and most diversified holding companies in
Israel. Through its subsidiaries, associates, joint ventures and
other investments, IDBD is engaged in numerous markets and industry
sectors in Israel and other countries, including real estate (PBC),
supermarkets (Shufersal), insurance (Clal), and telecommunications
(Cellcom). The Company is listed on the Tel Aviv Stock Exchange
(“TASE”) as a “Debentures Company” pursuant
to Israeli law, as it has publicly listed bonds. As a result of the
consolidation of this investment in the Company’s financial
statements, we decided to break down reporting into an Operations
Center in Argentina and an Operations Center in Israel. From the
Operations Center in Argentina, the Company, through IRSA and its
subsidiaries, manages the businesses in Argentina and the
international investments in the Lipstick Building in New York and
the Condor Hospitality Trust Hotel REIT. From the Operations Center
in Israel, the Company manages IDBD and its
subsidiaries.
On November 22,
2016, the sale to China National Agrochemical Corporation
(“ChemChina”) of 40% of the shares in Adama held by
Koor, indirectly controlled by IDBD through DIC, was consummated.
The proceeds of the sale were US$230 million in excess of the full
repayment of a non-recourse loan, plus interest, which had been
granted to Koor by a Chinese bank.
61
As of June 30, 2017, this value
amounted an approximate sum of NIS 4.88 billion. The
transaction is subject to due diligence by the buyer for a period
of 60 days from the signature of the memorandum of understanding
and signature of a binding agreement between the parties, among
other requirements. In addition, the completion of the transaction
is subject to the regulatory approval of the Capital Market,
Insurance and Savings Market Commission of the Israeli Ministry of
Finance
.
On June 5, 2017, the Company
informed the acquisition of the historic Philips Building, adjacent
to the Dot Baires Shopping Mall, and in front to General Paz Avenue
in the City of Buenos Aires. The building has 4 floors of offices
with a total gross leasable area of approximately 10,000 square
meters and with construction capacity (FOT) of additional 18,000
square meters. The Company owns 100% of the building. We had the
possesion of the building since June 2017 and it is currently
leased to the seller of the building until January 19,
2018.
Significant
acquisitions, dispositions and development of business
Operations Center in
Argentina
Purchase of
Philips Building
On June 5, 2017, the Company through
IRSA CP acquired the Philips Building located in Saavedra,
Autonomous City of Buenos Aires, next to the Dot Baires Shopping.
The building has a constructed area of 10,142 square meters and is
intended for office development and lease. The acquisition price
was US$29 million, which was fully paid as of June 30, 2017.
Furthermore, IRSA CP has entered into an agreement with the seller
for the use of the building for a term of 7 months and 15 days,
which expires automatically on January 19, 2018.
Capital increase
in Condor
In January 2017, Condor issued
150,540 new warrants in favor of RES with the right to one share
each, at an exercise price of US$0.001 per share, maturing in
January 2019. The new warrants replace the previous 3,750,000
warrants issued in May 2012, which granted a right to one share
each, at an exercise price of US$1.92 per share, maturing on
January 31, 2017. The new warrants cannot be exercised if the
interest in Condor exceeds 49.5% as a result of such exercise.
Additionally, the Company exercised the conversion right of the
3,245,156 series D preferred shares (with a par value of US$10 per
share) held by RES, converting them into 20,282,225 common shares
of Condor (with a par value of US$0.01 per share), i.e., at the
conversion price established of US$1.60 per share, which represents
a total value of US$32.4. Besides, it received 487,738 series E
preferred shares that can be converted into common shares at 2.13
US$ per share as from February 28, 2019, and pay dividends on a
quarterly basis at an annual rate of 6.25%. RES allocated the
considerations paid among the different identifiable net assets of
Condor; as a result, it recognized a higher value for property,
plant and equipment, a lower value of loans and goodwill in the
amount of US$5.69, US$0.27 and US$6.37, respectively.
During February, Condor’s
Board of Directors approved a reverse stock split, consisting of 1
(one) common share for every 6.5 shares issued and outstanding,
which was carried out after the market closing on March 15, 2017.
The par value of the shares remained at US$ 0.01 per share, while
the conversion price of series E preferred shares became US$13.845
per share and the exercise price of the warrants became
US$0.0065.
During March 2017, Condor made a
public offering of its shares, which resulted in the issuance of
4,772,500 new shares (including 622,500 additional shares for the
exercise of one call option granted to the subscribers), at a price
of US$10.50 per share. The Company did not purchase any shares in
it.
As of June 30, 2017, the Company
held 3,314,453 common shares of Condor representing approximately
28.5% of the Company’s share capital and voting rights. It
also held 487,738 series E preferred shares, 23,160 warrants and a
promissory note convertible into 97,269 common shares (at US$10.4
per share). The Board of Directors of Condor is formed by 4
directors appointed by the company, 3 directors appointed by
Stepstone Real Estate and 2 independent directors. In addition, the
voting power held by the Company in Condor amounts to 49% of the
votes, thus keeping significant influence over Condor.
62
BACS Banco de
Crédito y Securitización S.A.
(“BACS”)
The Company through Tyrus,
subscribed a purchase agreement of shares of BACS, representing an
interest of 6.125%. The acquisition price was US$1.35. On August
24, 2016 the transaction was approved by the BCRA.
On June 17, 2015, the Company,
through IRSA, subscribed Ps.100 nominal value of BACS’
Convertible Notes. On June 21, 2016 we notified BACS the exercise
of our right to convert all of the convertible notes into common
shares. On February 7, 2017, the BCRA approved the conversion
whereby IRSA was given 25,313,251 shares of BACS. As a result, as
of June 30, 2017, the Company holds an interest of 37.72% in
BACS.
Acquisition of
equity interest in EHSA
On July 2016, the Company, through
IRSA CP, acquired 20% of the share of EHSA, a company of which it
already owned 50%, and 1.25% of the share of Entretenimiento
Universal S.A. (“ENUSA”). The amount paid was Ps.53
million. As a result, the Company now holds 70% of the share
capital and voting stock of EHSA. In addition, EHSA holds, both
directly and indirectly, 100% of the shares of Ogden Argentina
S.A.(“OASA”) and 95% of the shares of ENUSA.
Furthermore, OASA holds 50% of the voting stock of La Rural S.A.
(“LRSA”), a company that holds the rights to
commercially operate the emblematic “Predio Ferial de
Palermo” in the Autonomous City of Buenos Aires, where the
Sociedad Rural Argentina holds the remaining 50%.
Acquisition of
additional interest in Banco Hipotecario
During the year ended June 30, 2015,
the Company acquired 3,289,029 additional shares of Banco
Hipotecario in a total amount of Ps.14.2 million, thus increasing
its interest in such company from 29.77% to 29.99%, without
consideration of treasury shares. During the year ended June 30,
2016, the Company sold 1,115,165 shares of Banco Hipotecario in a
total amount of Ps.7.7 million, thus decreasing its interest to
29.91%, without consideration of treasury shares.
Rigby capital
reduction
During fiscal year 2015, Rigby
reduced its capital stock by distributing the gain from the sale of
Madison building among existing shareholders, proportionally to
their shareholdings. The total amount distributed was US$103.8
million, of which the Company received US$77.4 million (US$26.5
million through IRSA International and US$50.9 million through
IMadison LLC) and US$26.4 million were distributed to other
shareholders. As a result of such reduction, the Company has
decided to reverse the corresponding accumulated conversion
difference on a pro rata basis, which amounted to Ps.219 million.
This reversal has been recognized in the line “Other
operating results, net” in the Statements of
income.
Sale of units in
Intercontinental Building
IRSA CP sold 2,432 profitable square
meters corresponding to three floors of office and 24 parking lots
in the Intercontinental Plaza building to an unrelated third party,
the Company still holds 3,876 square meters profitable of the
building. The transaction price was US$9 million, which has already
been fully paid as of June 30, 2017.
Operations Center in
Israel
Purchase
of DIC shares by a related party of Dolphin.
On September 24, 2017, IDBD reported
that the Company and Dolphin signed a Term Sheet for the purchase
of DIC shares by a related party of Dolphin. The completion of the
Transaction contemplated under the Term Sheet is subject to the
Parties' execution of the definitive transaction documents (the
"Definitive Documents") on or prior to November 16, 2017, as well
as to the approval of the Transaction by the authorized organs of
the Parties and to the fulfillment of additional pending warranties
up to December 10, 2017 (the "Date of Completion of the
Transaction").
The main points of the Term Sheet
are as follows:
63
●
Transaction: The buyer will
acquire the total of DIC shares held by IDBD at a stated price of
NIS 16.6 per share (equivalent to approximately Ps. 80 per share at
the date of these financial statements).
●
Payment: Payment will be made
through the issuance of a promissory note by the buyer, which will
expire 5 years from the date of completion of the transaction and
will accrue a minimum annual interest of 5.5%. Until the payment is
canceled in full, any DIC distribution will be paid in an Israeli
bank and will be pledged in favor of the seller.
●
DIC shares that are guaranteeing
DIC debt must maintain the same encumbrance and the shares that are
not currently guaranteeing debt will be held in favor of the
selling party until the cancellation of the payment.
Acquisition of non-controlling interest
Dolphin was required to carry out
the first tranche of tender offers in December 2015.
Before expiration of such first tranche, Dolphin
and the agreement trustees (the “trustees”) entered
into an extension agreement (the “Extension
Agreement”), which was subsequentlty replaced by the final
agreement, which was approved by approximately 95% of the
non-controlling shareholders of IDBD (excluding IFISA) by warrants
holders of IDBD on March 2, 2016 and by the competent court on
March 10, 2016. The major amendments to the Agreement
were:
On replacement of the obligation to conduct tender offers, Dolphin
acquired all the shares outstanding on March 29, 2016 from
non-controlling shareholders of IDBD (except for those held by
IFISA) on March 31, 2016. The price paid for each IDBD share held
by non-controlling shareholders was NIS 1.25 per share in cash plus
NIS 1.20 per share in bonds of the IDBD Series I (the “IDBD
Bonds”), which IDBD will issue directly to non-controlling
shareholders and holders of warrants. Additionally, Dolphin
undertook to pay NIS 1.05 per share (subject to adjustments) in
cash if Dolphin, either directly or indirectly, gain control of
Clal (more than 30% voting interest), or else if IDBD sells a
controlling shareholding in Clal (more than 30% to a third party)
under certain parameters (the “payment by Clal”), which
refers mainly to Clal’s sale price (at a price which exceeds
75% of its book value upon execution of the sale agreement, subject
to adjustments) and, under certain circumstances, the proportion of
Clal shares sold by IDBD. The obligation to make such contingent
payment will only expire if the sale of a controlling interest is
completed (more than 30% to a third party), or if Dolphin obtains
the control permission from Clal.
The warrants held by non-controlling shareholders that had not been
exercised until March 28, 2016 expired on March 31, 2016. Each
warrant holder was entitled to elect whether: (a) to receive IDBD
bonds (based on the adjusted nominal value) in an amount equal to
the difference between NIS 2.45 per share and the exercise price of
the warrants and be entitled to the Clal payment; or (b) to receive
a payment determined by an independent
appraiser.
Dolphin
compromised that would provide IDBD a total amount of NIS 515
million through several subordinated loans for a total amount of
NIS 348.5 in addition to the issuance of IDBD Bonds in the amount
of NIS 166.8 million, which were used to comply with the
liabilities mentioned in (ii). The subordinated loans have the
following features:
(a) they are subordinated, even in the
case of insolvency, to all current or future debts of IDBD; (b)
will be reimbursed after payment of all the debts to their
creditors; (c) accrues interest at a rate of 0.5%, which will be
added to the amount of the debt and will be payable only on the
date the subordinated debt is amortized; (d) Dolphin will not have
a right to participate or vote in the meetings with IDBD creditors
with respect to the subordinated debt; (e) as from January 1, 2016,
Dolphin has the right, at its own discretion,to convert the debt
balance into IDBD shares, that time, whether wholly or partially,
including the interest accrued over the debt until that date
(subject to the limit set forth in (iv) below); (f) if Dolphin opt
to exercise the conversion, the debt balance will be converted so
that Dolphin will receive IDBD shares according to a share price
that will be 10% less than the average price of the last 30 days
prior to the date the conversion option is exercised. In the event
there is no market price per share, this will be determined in
accordance with an average of three valuations made by external or
independent experts, who shall be determined by mutual consent and,
in the event of a lack of consent, they will be set by the
President of the Institute of Certified Public Accountants in
Israel.
64
Dolphin
had to pledge 28% of its IDBD shares, as well as all rights in
relation to the subordinated loan granted in the amount of NIS 210
million in December 2015, until the payment obligation to Clal has
been completed or has expired, after which the pledge will be
discharged. Should new shares be issued by IDBD, Dolphin will have
to pledge additional shares until completing the 28% of all IDBD
share capital. This pledge replaces the pre-existing
pledge.
Dolphin agreed not to exercise its right to convert the
subordinated loans into shares of IDBD until the pledge described
above has been released
.
Dolphin
acquired from the minority shareholders all of the shares of IDBD,
in a manner whereby the control group began holding 100% of the
shares of IDBD, which became a debenture company (as defined in the
Israeli Companies Law). The consideration to the minority
shareholders for the acquired shares, and the cancellation of the
undertaking to perform the aforementioned tender offers, included:
(a) payment, on March 31, 2016, in cash, of NIS 1.25 per share; (b)
payment, on March 31, 2016, of NIS 1.20 per share, which was paid
through debentures (Series I), in an amount which was determined
based on their adjusted par value, and which were issued by IDBD
against the transfer by Dolphin to IDBD of an amount equal to the
adjusted par value of each debenture which was issued, as stated
above; and (c) an undertaking to pay a total of NIS 1.05 per share,
contingent upon the sale of shares of Clal or upon the receipt of a
permit for control of Clal, in accordance with the conditions which
were determined in the Amendment to The Settlement. Within the
framework of the Amendment To the Settlement, Dolphin injected into
IDBD a total of NIS 515 million (including, inter alia a
subordinated loan in the amount of NIS 15, as stated above, and
including the injection of funds against the allocation of
debentures (Series I) by IDBD, and any amount which was injected
into the Company within the framework of the exercise of the
options). On March 15, 2016, and March 31, 2016, a total of NIS 85
million and NIS 248 million, respectively, were injected into IDBD,
by Dolphin, as part of the implementation of the Amendment to The
Settlement, as a subordinated loan convertible into shares of IDBD.
Additionally, within the framework of the Amendment to The
Settlement, all of the options for shares of IDBD which were held
by the public expired, and the warrant holders of IDBD received
payments or rights to payments in accordance with the alternatives
which were determined in the Amendment to The
Settlement.
Within the
framework of the Amendment To The Settlement and in connection with
the acquisition of ordinary shares, options (Series D), options
(Series E), which were already deleted from trade on the TASE,
Dolphin Fund and Dolphin still holds options (Series F) in IDBD, in
which as of July, 2017 Dolphin Fund holds 31,960 warrants (Series
F) and Dolphin holds 220,801,9 warrants (Series F). As of June
30, 2017, IRSA’s indirect interest in IDBD was 68.28% without
considering dilution (and 81.23% on a fully diluted
basis).
The transaction
described above represented the acquisition of an additional
interest of 19.28% in IDBD for a total amount of Ps.1,249 million.
As a result of this transaction, the non-controlling interest was
increased by Ps.346 million and the interest attributable to the
shareholders’ of the controlling parents was increased by
Ps.234 million. As of June 30, 2017, IRSA’s indirect interest
in IDBD was 68.28% without considering dilution.
Negotiations between Israir and Sun
d
’
Or
On June 30, 2017, IDB Tourism was at
an advanced stage of negotiations with Sun d’Or International
Airlines Ltd. (“Sun d’Or”), a subsidiary of El Al
Israel Airlines Ltd. (“El Al”), and on July 2, 2017 an
agreement was signed, which consists of:
●
Israir will sell the aircrafts it owns through a
sale and lease back agreement for an estimated value of US$70
million;
●
Israir will repay a loan owed to IDB Tourism in
the amount of US$18 million;
●
Following the repayment of the loan and the sale
of airplanes mentioned above, IDB Tourism will receive up to US$45
million (which includes a loan of up to US$8.8 million to be
discharged through the distribution of dividends of Sun D’
Or), plus a 25% of Sun D´Or shares, with El Al holding a 75%
of the shares of such company;
65
●
The parties will enter into a shareholder
agreement that would give El Al a call option (and a sale option to
IDB Tourism) for the acquisition of Sun D’Or’s shares
in accordance with a price and terms that will be established in
due course.
As a consequence of this agreement,
the Company’s Financial Statements as of June 30, 2017
present the investment in Israir as assets and liabilities held for
sale, and a loss of nearly NIS 56 million (approximately equivalent
to Ps.231 million as of December 31, 2016 when it was reclassified
to discontinued operation), as a result of measuring these net
assets at the estimated recoverable value. The transaction is
subject to (i) approval by the Anti-Trust Authority; (ii) Sun
D´Or´s and Israir’s equity as of December 31, 2017
may not be negative in their related Financial Statements and
Israir’s tangible equity should not be lower than US$7
million; (iii) the validity and effectiveness of licenses held by
Israir as granted by the Civil Aviation Authority and
Transportation Ministry; (iv) the sale of the airplanes indicated
above; (v) the execution of collective bargaining agreements with
pilots, etc. The transaction is expected to be closed by the end of
2017.
Agreement for
New Pharm
On April 6, 2017, Shufersal entered
into an agreement with Hamashbir 365 Holdings Ltd. (
“Hamashbir”) for the purchase of the shares of New
Pharm Drugstores Ltd. (“New Pharm”), representative of
100% of that Company’s share capital, for an amount of NIS
130 million (equivalent to Ps.611 million as of the date of these
Consolidated Financial Statements), payable upon execution of the
transaction, which is subject to fulfillment of the following
conditions; among others:
●
approval by the Antitrust Authority - if the
approval is not obtained within 3 months following the date the
request is filed (extendable for one additional month under certain
circumstances), the agreement will be automatically terminated,
unless the parties agree on a term extension.
●
the release and termination of all the existing
guarantees of New Pharm over the liabilities of the companies of
Hamashbir Group, and the release and invalidation of all the
existing guarantees of the companies of Hamashbir Group over the
liabilities of New Pharm.
Upon execution of the agreement, a
non-competition clause will be signed. As of the date of issuance
of this annual report, not all of the mentioned conditions has been
fulfilled.
On August 30, 2017, Shufersal and
the seller agreed to extend the approval of the Antitrust Authority
until September 14, 2017 and until September 30, 2017 the
fulfillment of the conditions precedent and the delivery of
Financial Statements. On September 6, 2017, the Anti-trust
Commission approved the merger between Shufersal and New Pham
subject to certain conditions.
After the approval of the antitrust
commission, on September 28, 2017, the parties signed an addendum
to that agreement which states that nine New Pharm stores will be
sold to a third party and a Shufersal store to another. The sale of
New Pharm stores will be collected by New Pharm prior to the
merger, which changes the price of the transaction but not
significantly. The last date to sign the sales agreement was
stipulated to be on November 30, 2017 and the execution date on
December 31, 2017.
Partial sale of
equity interest in Gav Yam
On December 5, 2016, PBC sold
280,873 shares of its subsidiary Gav-Yam Land Corporation Ltd. for
an amount of NIS 391 million (equivalent to Ps.1,616 million as of
that date). As a result of this transaction, the Company’s
equity interest in Gav-Yam has decreased to 55.06%.
Partial
sale of equity interest in PBC
DIC sold 12% of its equity interest
in PBC for a total consideration of NIS 217 million (approximately
equivalent to Ps.810 million); as a result, DIC’s interest in
PBC has declined to 64.4%.
Share-holding
increase in DIC
On September 23, 2016, Tyrus
acquired 8,888,888 of DIC’s shares from IDBD for a total
amount of NIS 100 million (equivalent to Ps.401 million as of that
date), which represent 8.8% of the DIC’s outstanding shares
at such date.
66
During March 2017, IDBD exercised
all of DIC’s Series 5 and 6 warrants for nearly NIS 210
million (approximately equivalent to Ps.882 million as of that
date), thereby increasing its direct interest in DIC to nearly 70%
of such company’s share capital as of that date and the
Company’s equity interest to 79.47%. Subsequently, third
parties not related to the Company, also exercised their warrants,
thus diluting the Company’s interest in DIC to
77.25%.
Changes of
interest in Shufersal
During the fiscal year ended June
30, 2017, the Company – through DIC and several transactions
– increased its interest in Shufersal capital stock by 7.7%
upon payment of a net amount of NIS 235 million (equivalent to
approximately Ps.935 million) and in March 2017, DIC sold 1.38% of
Shufersal in an amount of NIS 50 million (equal to Ps.210 million
as of that date). As of June 30, 2017, the Company held through DIC
an direct interest of 54.19% in Shufersal.
Sale of
Adama
In 2011, Koor
(a wholly own subsidiary of DIC) sold 60% of Adama’s shares
to ChemChina and was also granted a non-recourse loan in the
aggregate amount of US$960 million, which was secured by the
remaining 40% of Adama shares held by Koor as of June 30,
2016.
On July 17, 2016 DIC accepted the
offer by ChemChina for the acquisition of 40% of Adama’s
shares which were held by Koor. On August 2016, Koor and a
subsidiary of ChemChina executed the corresponding agreement. The
price of the transaction included a payment in cash of US$230
million plus the total repayment of the non-recourse loan and its
interests, which had been granted to Koor by a Chinese bank. On
November 22, 2016, the transaction was closed and Koor received
cash in the amount of US$230 million. Our equity interest in the
results of Adama and the finance costs related to the hybrid
financial instrument were retrospectively classified as
discontinued operations in the Company’s Consolidated
Statements of Income as from July 17, 2016. On June 30, 2017, the
Company recorded a gain of Ps.4,216 million pursuant to the
sale
IDBD
Acquisition
of Control
On May 2014, the Company, acting
indirectly through Dolphin, acquired jointly with ETH an aggregate
number of 106.6 million common shares in IDBD, representing 53.30%
of its stock capital, whithin the debt restructuring process of
IDBH, IDBD’s parent company, with its creditors (the
“Arrangement”). Under the terms of the agreement
entered into, Dolphin acquired a 50% interest in this investment,
and ETH acquired the remaining 50% and both entities entered into a
shareholders’ agreement. The initial total investment amount
was NIS 950 million, equivalent to approximately US$272 million at
the exchange rate prevailing on that date. On May 2015, ETH
launched the BMBY mechanism provided in the Shareholders’
Agreement (clause which establishes that each party of the
Shareholders’ Agreement may offer to the counterparty to
acquire (or sell, as the case may be), the shares it holds in IDBD
at a fixed price). On June 2015, Dolphin gave notice to ETH of its
intention to buy all the shares of IDBD held by ETH.
After
certain aspects of the offer were resolved through an arbitration
process initiated by the parties, on September 24, 2015, the
competent arbitrator resolved that: (i) Dolphin and IFISA were
entitled to buy the shares pursuant to the BMBY process, and
consequently; (ii) the buyer would have the obligation to fulfil
all of the commitments included in the seller’s Arrangement,
including the commitment to carry out the Tender Offers; (iii) the
buyer might pledged in favor of the Arrangement Trustees the shares
that the seller had pledged to them.
Notwithstanding the
foregoing, there is an arbitration process going on between Dolphin
and ETH in relation to certain issues connected to the acquisition
of control of IDBD.
On October 11, 2015, the BMBY
process concluded, and IFISA acquired all IDBD’s shares of
stock held by ETH (92,665,925 shares) at a price equal to NIS 1.64
per share. Consequently, the Shareholders’ Agreement ceased
and members of IDBD’s Board of Directors representing ETH
submitted their irrevocable resignation to the Board. Subsequently,
Dolphin appointed new members to the Board. Additionally, on the
same date, Dolphin pledged the additional shares
acquired.
67
Later on, following the exercise of
the BMBY, Dolphin entered into an option agreement with IFISA that
grants Dolphin the right, but not the obligation, to acquire the
shares in IDBD which IFISA had acquired in the BMBY process, at a
price of NIS 1.64 per share plus an annual interest rate of 8.5%.
The option may be exercised within two years counted from the
execution date. Additionally, Dolphin is entitled to a first
refusal right in case that IFISA agrees to sell these shares to a
third party. The option has no value as of June 30,
2017.
As a consequence, the Company gained
control of IDBD and started to consolidate Financial Statements as
from that date. The following chart shows the consideration, the
fair value of the acquired assets, the assumed liabilities and the
non-controlling interest as of the acquisition date.
|
|
As of
October 11, 2015
|
|
Fair value of the interest
in IDBD’s equity held before the business combination and
warrants
|
1,416
|
|
Total
consideration
|
1,416
|
|
|
As of
October 11, 2015
|
|
Fair
value of identifiable assets and assumed liabilities:
|
|
|
Investment
properties
|
29,586
|
|
Property, plant and
equipment
|
15,104
|
|
Intangible
assets
|
6,603
|
|
Joint ventures and investment in
associates
|
9,268
|
|
Financial assets and other assets held for
sale
|
5,129
|
|
Trading
properties
|
2,656
|
|
Inventories
|
1,919
|
|
Income tax
credits
|
91
|
|
Trade and other
receivables
|
9,713
|
|
Investments in financial
assets
|
5,824
|
|
Cash and cash
equivalents
|
9,193
|
|
Deferred income
tax
|
(4,681
)
|
|
Provisions
|
(969
)
|
|
Borrowings
|
(60,306
)
|
|
Derivative financial instruments,
net
|
(54
)
|
|
Income
tax
|
(267
)
|
|
Employee
benefits
|
(405
)
|
|
Trade and other
payables
|
(19,749
)
|
|
Total net identifiable
assets
|
8,655
|
|
Non-controlling
interest
|
(8,630
)
|
|
Goodwill
|
1,391
|
|
Total
|
1,416
|
The group asses the fair value of
the investment property with the assistance of qualified
independent appraisers. As of the acquisition date, the Company
estimates that recognized assets are recoverable. The value of the
non-controlling interest in IDBD has been determined on a
proportional basis to the fair value of net acquired assets and the
fair value of warrants.
Following the control of IDBD, the
cumulative currency translation accumulated in shareholders’
equity from the interest held in IDBD before the business
combination in the amount of Ps.143 million was recognized in the
Income Statement. Such result was disclosed under “Other
operating results, net” line in the Income
Statement.
68
The revenues IDBD has generated
since October 11, 2015 and that have been disclosed in the
Consolidated Income Statement amount to Ps.28,229 million. IDBD has
also incurred in a net result of Ps.(1,643) million during said
period. If IDBD had been consolidated since July 1st, 2015, the
Company´s Consolidated Income Statement would have shown
pro-forma revenues of Ps.49,637 million and pro-forma net loss of
Ps.1,651 million.
Recent
Developments:
Operations Center in
Argentina
Selling of IRSA CP’ ADSs
On
October 27, 2017, the Company reported that it has completed the
sale in the secondary market of 2,560,000
ADSs
of IRSA
CP,
each representing
four common shares
. The ADSs were exclusively offered and
sold outside Argentina. J.P. Morgan served as underwriter for the
offering.
The
proceeds from such offering will be used for funding current or new
investment projects, the payment of dividends, for working capital
or repayment of indebtedness, among others.
Metropolitan’s debt refinancing
On
October 23, 2017,
Metropolitan has
extended the term of a non-recurse loan until April 30, 2020 for
the amount of US$53.1 million as a result of having canceled US$40
million in cash, of which we have contributed US$20 million, and of
having received an additional haircut of US$20 million from the
lender bank. In the context of this renegotiation, the interest
rate of the loan has been reduced from Libor plus 4% to Libor plus
2%.
Shareholders
’
Meeting
Our 2017 annual meeting of shareholders has been called for October
31, 2017, in order to consider, among others:
●
Treatment and allocation of net income for the fiscal year ended
June 30, 2017;
●
Payment of a cash dividend
for up to Ps.1,400 million.
●
Consideration of appointment of regular and alternate directors due
to expiration of term;
●
Creation of a new Global
Note Program for the issuance of simple, non-convertible notes,
secured or not, or guaranteed by third parties, for a maximum
outstanding amount of up to US$350,000,000 (three hundred and fifty
million US dollars) (or its equivalent in any other currency)
pursuant to the provisions set forth in the Negotiable Obligations
Law No. 23,576, as amended and supplemented (the
"
program") due to the expiration
of the program currently in force.
●
Consideration of (i)
delegation to the board of directors of the broadest powers to
determine all the program
’
s
terms and conditions not expressly approved by the
shareholders
’
meeting as well as the time, amount, term, placement method and
further terms and conditions of the various series and/or tranches
of notes issued thereunder; (ii) authorization for the board of
directors to (a) approve, execute, grant and/or deliver any
agreement, contract, document, instrument and/or security related
to the creation of the program and/or the issuance of the various
series and/or tranches of notes thereunder; (b) apply for and
secure authorization by the Argentine Securities Commission to
carry out the public offering of such notes; (c) as applicable,
apply for andsecure before any authorized securities market of
Argentina and/or abroad the authorization for listing and trading
such notes; and (d) carry out any proceedings, actions, filings
and/or applications related to the creation of the program and/or
the issuance of the various series and/or tranches of notes under
the program; and (iii) authorization for the board of directors to
sub-delegate the powers and authorizations referred to in items (i)
and (ii) above to one or more of its members.
●
Treatment of amounts paid
as personal asset tax levied on the shareholders.
69
Issue of Series
IV Notes
On September 12, 2017, IRSA CP
issued the Series IV Notes, for US$140,000,000, bearing a fixed
interest rate of 5.00%, which matures on September 14,
2019.
Acquisition
Exhibition and Convention Center
On August 4, 2017, we subscribed a
concession agreement for the “Exhibition and Convention
Center of the City of Buenos Aires,” which was awarded by
public auction on July 24, 2017 to a joint venture (Unión
Transitoria de Empresa) named “LA RURAL SA - OFC SRL - OGDEN
ARGENTINA SA - ENTERPRISE UNIVERSAL SA UNION TRANSITORIA”
(the “Joint Venture”). The concession is for the term
of 15 years. We own 70% of EHSA and Diego Finkelstein is the other
shareholder with 30% interest. We indirectly hold a 54.25% interest
in the Joint Venture. The Exhibition and Convention Center has
approximately 22,800 square meters of surface area and can
accommodate approximately 5,000 people, with an auditorium plenary
room and an auxiliary room, offices and conference center. It
consists of three underground levels along an area that sits
between the Law School of the University Buenos Aires and Park
Thays.
Investment in
TGLT S.A.
On August 1, 2017, we acquired
22,225,000 Subordinated Notes Convertible into shares of TGLT S.A.
(“TGLT”) for US$22,225,000 (US$1 Nominal Value) due
2027. As a consecuenceof this acquisition and in the event of the
exercise of the right of conversion by all the holders, our holding
on TGLT would increase to 13.80%.
Suspention
notice
On July
21, 2017, IRSA CP announced that it would not proceed with the
announced proposed
global offering of 14,000,000 of newly
issued common shares and an additional of 14,000,000 shares owned
by us.
Sale of BAICOM
land reserve
On July 19, 2017, the Company,
acting through a subsidiary, sold to an unrelated third party a
land reserve of approximately 6,905 sqm located at Av. P.
Ramón Castillo, at the corner of Av. Antártida Argentina,
in the neighborhood of Retiro, City of Buenos Aires. This land
reserve was owned by BAICOM Networks S.A. (“Baicom”), a
company in which IRSA held an indirect controlling interest of
50%.
The transaction amount was
US$14,000,000 (US$7 million corresponding to IRSA), and as of the
date of this report it has been fully paid.
Operations Center in
Israel
Transaction for
the Purchase of IDBD
’
s
shares in DIC by Dolphin
On August 2017, under the scope of
the Concentration Law, Dolphin made a non-binding offer to
purchase, all the shares held by IDBD in DIC. On September 2017,
IDBD announced that following the negotiations of
DIC
’
s
independent board committee the non-binder offer was signed,
according to which, IDBD would sell all the shares in DIC, at a
price of NIS 16.6 per share (and in total of NIS 1.77 billion in
respect of all the shares which will be sold) by means of a
debenture that will be issued by the purchaser to
IDBD.
We cannot assure that the parties
will execute or perform any binding agreement. The offer is subject
to the parties’ execution of the final agreements (which is
subject to further negotiations) until Novermber 16, 2017 as well
as the approval of the transaction by the Companies’
corporate bodies and the fulfillment of additional conditional
terms by December 10, 2017. This transaction could significantly
extend over time or could fail to be consummated or be consummated
under different terms, as it must be approved by IDBD’s
corporate bodies and other entities, which could withhold their
consent.
Non-binding
Offer for Clal
On September 2017,
IDBD
’
s
Board of Directors approved IDBD engagement with a non-binding
offer with Huabang Financial Holdings Limited to acquire its entire
equity interest in Clal, representing 44.9% of its stock
capital.
70
The amount payable will be
equivalent to Clal’s shareholders’ equity as reflected
in its Financial Statements on the transaction’s closing
date. As of June 2017, such amount was approximately NIS 4,880
million.
The transaction is subject to a due
diligence process, to be conducted by the purchaser for a term of
60 days after the execution of the memorandum of understanding, and
the execution of a binding agreement among the parties, among other
requirements.
Moreover, the consummation of the
transaction is subject to the approval of Israel’s Capital
Market, Insurance and Savings Commission reporting to the Israeli
Ministry of Finance.
Sale of the
entire issued and paid-up share capital between Israir (subsidiary
of IDB Tourism) and Sun D’or
On July 2017, IDB, IDB Tourism and
Israir entered into an agreement with El Al and Sun Dor in an
agreement to sell the entire issued and paid-up share capital of
Israir to Sun D’or. For more information, see
“Significant acquisitions, dispositions, and developments
– Negotiations between Israir and Sun
D’or.”
Agreement for
the acquisition of New Pharm
On April 2017, Shufersal entered
into an agreement for the purchase of New Pharm. See
“Significant acquisitions, dispositions, and developments
– Agreement for New Pharma.”
Bond
Issues
On July 2017, IDBD issued debentures
(Series N) for a total gross consideration of approximately NIS 642
million, secured by a lien on the shares of DIC and the interest
rate shall be 5.30%, subject to compliance with the financial
covenants. The debentures shall mature on 2022.
On October
2017, Gav Yam issued debentures (Series H) for a total gross
consideration of approximately NIS 423 million. The debentures
shall accrue interest of 2.55% per annum and shall mature on
2034.
Update of rating of
DIC
’
s
debentures
On August 2017, Standard &
Poor
’
s
Maalot Ltd. updated the forecast of the rating of
DIC
’
s
debentures from BBB with a stable outlook for BBB with a positive
outlook. In addition, on September 2017 and in connection with
the
DIC
’
s
trade in offer, as aforesaid, Standard &
Poor
’
s
Maalot Ltd.
granted ilBBB
rating to the issue of debentures of up to NIS 2
billion.
DIC
’
s
second tranche dividend to
IDBD
On September 2017 IDB received its
share in the second tranche of the dividend in the amount of NIS
128 million.
DIC
’
s
trade in offer
On September 28, 2017 DIC made a
partial exchange offer to the holders of DIC’s series F
bonds, in return for DIC’s series J bonds (a new
series).
DIC’s series J bonds has terms
that are materially different from the series F, so this will be
treated in accordance with international accounting rules as the
repayment of the existing original financial undertaking and the
recognition of a new financial undertaking at fair
value
As a result of this exchange, DIC
registered a loss for the difference between the cancellation and
the value of the new debt, in the approximate amount of NIS 459
million (approximately PS. 2,228 at the date of the
exchange).
Tax to be paid
by PBC
On July 2017, PBC published on the
TASE that on July 2017 PBC received tax assessments for the 2012 to
2015 tax years from the Tax Authority, according to which the
company is required to pay a tax in the total amount of NIS 172
million (NIS 187 million including linkage differentials and
interest as per the date of the report), as a result of the failure
to allow the offsetting of losses. PBC intends to appeal those
assessments.
71
Cellcom
’
s
non payment of dividends
On August 2017,
Cellcom
’
s
Board of Directors decided not to declare a cash dividend for the
second quarter of 2017. In making its decision, the board of
directors considered the Cellcom
’
s
dividend policy and business status and decided not to distribute a
dividend at this time, given the intensified competition and its
adverse effect on Cellcom
’
s
results of operations, and in order to strengthen
Cellcom
’
s
balance sheet.
Licences to Modi
’
in
Energy - Limited Partnership
On August 2017,
Modi
’
in
Energy - Limited Partnership ("Modi
’
in")
reported that at the operating committee meeting of the joint
venture regarding the license area 391 / "Daniel East" and license
392 / "Daniel West" (together, the "Licenses"), that the Licenses
operator recommended the partners of the joint venture to return
all the rights in the Licenses to Israel. With that in mind, the
general partner in Modi
’
in
decided to return all the participation rights of
Modi
’
in
In the licenses to Israel and instructed the management of the
General Partner to act accordingly.
Bonds (Series 14
- Use of dividend Funds)
IDBD announced on September 27,
2017, further to the announcement of DIC, dated August 28, 2017
that, regarding a dividend distribution to its shareholders
(payment of the dividend
’
s
second tranch), and in accordance with the provisions of the deed
of trust for the Company
’
s
bonds (Series 14), the interest payment to the bondholders which
was scheduled for October 1, 2017 (and whose effective date was
September 24, 2017), in the amount of NIS 5.98 million was paid out
of the dividend funds wich were received in the trust account of
the trustee for the bondholders. It is noted that the total sum of
the dividend funds which were received in the trust account is NIS
74.44 million.
B. Business
Overview
Operations and
principal activities
Founded in 1943, IRSA Inversiones y
Representaciones Sociedad Anónima ("IRSA" or the "Company") is
one of Argentina
’
s
leading real estate companies and the only Argentine real estate
company whose shares are listed both on ByMA and on the
NYSE.
We are engaged, directly and
indirectly through subsidiaries and joint ventures, in a range of
diversified activities, primarily in real estate,
including:
i.
the acquisition, development and operation of shopping
malls,
ii.
the acquisition and development of office
buildings and other non-shopping mall properties primarily for
rental purposes,
iii.
the development and sale of residential
properties,
iv.
the acquisition and operation of luxury
hotels,
v.
the acquisition of undeveloped land reserves for
future development or sale, and
vi.
selective investments mostly in Argentina,
United States and Israel.
On October 11, 2015, the Company
obtained control of the Israeli company IDBD and it began to
include it in its consolidated financial statements.
IDBD is one of the largest and most
diversified holding companies in Israel. Through its subsidiaries,
associates, joint ventures and other investments, IDBD is engaged
in numerous markets and industry sectors in Israel and other
countries, including real estate (PBC), supermarkets (Shufersal),
agroindustry (Adama), insurance (Clal), and telecommunications
(Cellcom), among others. IDBD is registered with the TASE as a
"Debentures Company" pursuant to Israeli law, as it has publicly
listed bonds.
72
As a result of the consolidation of
this investment in the company
’
s
financial statements, we decided to break down reporting into an
Operations Center in Argentina and an Operations Center in Israel.
From the Operations Center in Argentina, the Company manages the
businesses in Argentina and the international investments in the
Lipstick Building in New York and the Condor Hospitality Trust
Hotel REIT. From the Operations Center in Israel, the Company
manages IDBD.As of June 30, 2017 we owned 29.91% of Banco
Hipotecario, one of the leading financial institutions in
Argentina, 28.7% of the voting power of the US REIT named Condor
Hospitality Trust (formerly known as Supertel Hospitality Inc.) and
indirectly 68.3% of the Israeli company IDBD.
Operations Center in
Argentina
We operate our business in Argentina
through six reportable segments, namely "Shopping Malls," "Offices
and Others," "Sales and Developments," "Hotels," "International"
and "Financial Operations and Others" as further described
below:
Our "Shopping Malls" segment
includes the operating results from our portfolio of shopping malls
principally comprised of lease and service revenue from tenants.
Our Shopping Malls segment had assets of Ps.28,878 million and
Ps.26,688 million as of June 30, 2017 and 2016, respectively,
representing 64% and 68% of our operating assets for the Operations
Center in Argentina at such dates, respectively. Our Shopping Malls
segment generated operating income of Ps.4,253 million and
Ps.17,895 million for the fiscal years ended June 30, 2017 and
2016, respectively, representing 66% and 89% of our consolidated
operating income in Argentina for such years,
respectively.
Our "Offices and Others" segment
includes the operating results of our lease and service revenues of
office space and other non-retail building properties principally
comprised of lease and service revenue from tenants. Our Offices
and Others segment had assets of Ps.7,859 million and
Ps.5,866million as of June 30, 2017 and 2016, respectively,
representing 18% and 15% of our operating assets for the Operations
Center in Argentina at such dates, respectively. Our Offices and
Others segment generated operating income of Ps.1,701 million and
Ps.1,585 million for the fiscal years ended June 30, 2017 and 2016,
respectively, representing 26% and 8% of our consolidated operating
income for the Operations Center in Argentina for such years,
respectively.
Our "Sales and Developments" segment
includes the operating results of our acquisition and/or
construction of housing and other properties for sale in the
ordinary course of business. Our Sales and Developments segment had
assets of Ps.5,468 million and Ps.4,728 million as of June 30, 2016
and 2015, respectively, representing 12% of our operating assets
for the Operations Center in Argentina for both years. Our Sales
and Developments segment generated operating income of Ps.821
million and Ps.681 million for the financial years ended June 30,
2017 and 2016, respectively, representing 13% and 3% of our
consolidated operating income for the Operations Center in
Argentina for such years, respectively.
Our "Hotels" segment includes the
operating results of our hotels mainly comprised of room, catering
and restaurant revenues. Our Hotels segment had assets of Ps.167
million and Ps.164 million as of June 30, 2017 and 2016,
respectively, representing 0.4% of our operating assets for the
Operations Center in Argentina for both years. Our Hotels segment
generated operating income of Ps.9 million and operating losses of
Ps.1 million for the fiscal years ended June 30, 2017 and 2016,
respectively, representing 0.1% and 0.005% of our consolidated
operating income for the Operations Center in Argentina for such
years.
Our "International" segment includes
investments that mainly operate in the United States in relation to
the lease of office buildings and hotels in that country. We intend
to continue evaluating investment opportunities outside Argentina
as long as they offer attractive investment and development
options. Our International segment had assets of Ps.572 million and
Ps.145 million as of June 30, 2017 and 2016, respectively,
representing 1.3% and 0.4% of our operating assets for the
Operations Center in Argentina for such years.Our International
segment generated operating losses of Ps.51 million and operating
income of Ps.53 million for the fiscal years ended June 30, 2017
and 2016, respectively, representing 1% and 0.3% of our
consolidated operating income for the Operations Center in
Argentina for such years, respectively.
73
Our "Financial Operations and
Others" segment primarily includes the financial activities carried
out by Banco Hipotecario and Tarshop S.A.
(“Tarshop”)and other residual financial operations and
corporate expenses related to the Operations Center in Argentina.
As of June 30, 2017, our investment in Banco Hipotecario generated
income of Ps.83 million. Tarshop is a company specialized in the
sale of consumer financing products and cash advances to
non-banking customers. Our Financial Operations and Others segment
had assets of Ps.1,941 million and Ps.1,703 million as of June 30,
2017 and 2016, respectively, representing 4.3% of our operating
assets for the Operations Center in Argentina for both dates. Our
Financial Operations and Others segment generated operating losses
of Ps.119 million and operating income of Ps.80 million for the
fiscal years ended June 30, 2017 and 2016, respectively,
representing 1.8% and 0.4% and of our consolidated operating income
for the Operations Center in Argentina for such years.
Operations Center in
Israel
We operate our business in Israel
through five reportable segments, namely "Real Estate,"
"Supermarkets," "Telecommunications," "Insurances" and "Others" as
further described below:
Our "Real Estate" segment includes
mainly assets and operating income derived from business related to
the subsidiary PBC. PBC is engaged, independently and through its
subsidiaries and associate companies, some of which are public
companies, in various areas of the real estate industry in Israel
and abroad. The main operating segments of PBC include the
revenue-generating properties segment - its core activity, and the
residential construction segment. PBC is also engaged in the
agriculture segment. Our Real Estate segment had operating assets
(liabilities), net of Ps.15,327 million and Ps.11,102 million as of
June 30, 2017 and 2016, representing 64.6% and 76.7% of our
operating assets for the Operations Center in Israel at such years,
respectively. Our Real Estate segment generated operating income of
Ps.2,670 million and Ps.878 million for the fiscal years ended June
30, 2017 and 2016, respectively, representing 79.3% and 96.5% of
our consolidated operating income for the Operations Center in
Israel for such years, respectively.
Our "Supermarkets" segment includes
assets and operating income derived from the business related to
the subsidiary Shufersal. Shufersal operates both directly and
through its investee corporations, and owns the largest supermarket
chain in Israel in terms of sales volume. Our Supermarkets segment
had operating assets (liabilities), net of Ps.9,282 million and
Ps.5,826 million as of June 30, 2017 and 2016, representing 39.1%
and 40.2% of our operating assets for the Operations Center in
Israel at such years, respectively. Our Supermarkets segment
generated operating income of Ps.1,724 million and Ps.411 million
for the fiscal years ended June 30, 2017 and 2016, respectively,
representing 51.2% and 45.2%of our consolidated operating income
for the Operations Center in Israel for such years,
respectively.
Our "Telecommunications" segment
includes assets and operating income derived from the business
related to our subsidiary Cellcom. Cellcom is a provider of
communication services, which offers to its customers primarily
mobile communication services, landline telephone services,
international telephone services, internet connectivity services
and associated services, and beginning in December 2014, also
television over internet services. Our Telecommunications segment
had operating assets (liabilities), net of Ps.6,616 million and
5,688 million as of June 30, 2017 and 2016, representing 27.9% and
39.3% of our operating assets for the Operations Center in Israel
at such years, respectively. Our Telecommunications segment
generated operating losses of Ps.253 million and Ps.71 million for
the fiscal years ended June 30, 2017 and 2016, respectively,
representing 7.5% and 7.8% of our consolidated operating income for
the Operations Center in Israel for such years,
respectively.
Our "Insurance" segment includes the
investment in Clal. Clal is a holding company which is primarily
engaged in the insurance, pension and provident funds segments, and
in the holding of assets and real and other related businesses
(such as insurance agencies), and which constitutes one of the
largest insurance groups in Israel. Our Insurance segment had
operating assets (liabilities), net of Ps.8,562 million and
Ps.4,602 million as of June 30, 2017 and 2016, representing 36.1%
and 31.8% of our operating assets for the Operations Center in
Israel at such years, respectively.
74
Our "Others" segment includes the
assets and income derived from other diverse business activities,
such as technological developments, oil and gas assets,
electronics, and others. Our Others segment had operating assets
(liabilities), net of Ps.(16,058) million and (12,737) million as
of June 30, 2017 and 2016. Our Others segment generated operating
losses of Ps.774 million and Ps.308 million for the fiscal years
ended June 30, 2017 and 2016, respectively, representing 23.0% and
33.8%, of our consolidated operating income for the Operations
Center in Israel for such years, respectively.
Business Strategy
As a leading company in Argentina
engaged in acquiring, developing and managing real estate, we seek
to (i) generate stable cash flows through the operation of our real
estate rental assets (shopping malls, office buildings, hotels),
(ii) achieve long-term appreciation of our asset portfolio by
taking advantage of development opportunities, (iii) increase the
productivity of our land reserves and enhance the margins of our
development and sale of properties segment through partnerships
with other developers, and (iv) look for opportunities abroad
offering capital gain potential.
Operations Center in
Argentina
Shopping
Malls
Our main purpose is to maximize our
shareholders
’
profitability. By using our know-how in the shopping mall industry
in Argentina as well as our leading position, we seek to generate a
sustainable growth of cash flow and to increase the long-term value
of our real estate assets.
We attempt to take advantage of the
unsatisfied demand for purchase in different urban areas of the
region, as well as of our customers
’
purchase experience. Therefore, we seek to develop new shopping
malls in urban areas with attractive prospects for growth,
including Buenos Aires
’
Metropolitan area, some cities in the provinces of Argentina and
possibly, other places abroad. To achieve this strategy, the close
business relationship we have had for years with more than 1000
retail companies and trademarks composing our selected group of
tenants is of utmost importance, as it allows us to offer an
adequate mix of tenants for each particular
case.
Offices and
Others
Since the Argentine economic crisis
in 2001 and 2002, there has been limited investment in high-quality
office buildings in Buenos Aires and, as a result, we believe there
is currently substantial demand for those desirable office spaces.
We seek to purchase and develop premium office buildings in
strategically-located business districts in the City of Buenos
Aires and other strategic locations that we believe offer return
and potential for long-term capital gain. We expect to continue our
focus on attracting premium corporate tenants to our office
buildings. Furthermore, we intend to consider new opportunities on
a selective basis to acquire or construct new rental office
buildings.
Sales and
Developments
We seek to purchase undeveloped
properties in densely-populated areas and build apartment complexes
offering green spaces for recreational activities. We also seek to
develop residential communities by acquiring undeveloped properties
with convenient access to the City of Buenos Aires, developing
roads and other basic infrastructure such as electric power and
water, and then selling lots for the construction of residential
units. After the economic crisis in 2001 and 2002, the scarcity of
mortgage financing restricted the growth in middle class home
purchases, and as a result, we mainly focused on the development of
residential communities for middle and high-income individuals, who
do not need to finance their home purchases. Furthermore, we seek
to continue to acquire undeveloped land at attractive locations
inside and outside Buenos Aires for the purpose of their
appreciation for subsequent sale. We believe that holding a
portfolio of desirable undeveloped plots of land enhances our
ability to make strategic long-term investments and affords us a
valuable "pipeline" of new development projects for upcoming
years.
75
Hotels
We believe our portfolio of three
luxury hotels is positioned to take advantage of future growth in
tourism and travel in Argentina. We seek to continue with our
strategy to invest in high-quality properties which are operated by
leading international hotel companies to capitalize on their
operating experience and international reputation.
International
In this segment, we seek investments
that represent an opportunity of capital appreciation potential in
the long term. After the international financial crisis in 2008, we
took advantage of the price opportunity in the real estate sector
in the United States and invested in two office buildings in
Manhattan, New York. In 2015, we sold the Madison building and we
hold a 49.9% interest in a US company, whose main asset is the
so-called "Lipstick" office building located in the City of New
York. In addition, jointly with subsidiaries, we hold 28.7% of
Condor
’
s
voting rights. We intend to continue evaluating, on a selective
basis, investment opportunities outside Argentina as long as they
offer attractive investment and development options.
Financial
Operations and Others
We keep our investment in Banco
Hipotecario, the main mortgage-lending bank in Argentina, as we
believe that we are able to reach good synergies in the long term
with a developed mortgage market.
Operations Center in
Israel
We develop our operations in Israel
through IDBD. IDBD is a holding company, which invests (directly
and indirectly) in companies, which operate in several different
fields, primarily in the communication, real estate, commerce,
services and insurance branches. IDBD strives to promote and
maximize the value of its existing investments, and to improve
them, and also to sell them in suitable cases, through influence
and involvement in the majority of its subsidiaries. This effect is
realized, whether through the appointment of directors on its
behalf and the provision of candidates on its behalf for corporate
officer positions, or through involvement in the business strategic
processes of the subsidiaries.
In parallel with substantiating the
control of the control group in IDBD and DIC, in early 2016, the
managerial headqaurters of IDBD was replaced, including, as of the
publication date of the periodic report for 2016 the joint General
Manager, CFO, VP Legal Counsel, VP Accounting and Corporate
Secretary, and an emphasis was placed on active management of the
group.
Most of the subsidiaries of IDBD are
public companies and leaders in their fields, with strong access to
capital markets and to the banking system.
Discount Investments is a holding
company that invests in companies which operates in a variety of
fields, mainly in communications, real estate, commerce and
services. DIC strives to promote and maximize the value of its
existing investments until they are sold in appropriate
cases
.
We
have accepted a non-binding offer
for the sale of our equity interest in DIC. Please see "- History
and Development of the Company- Significant dispositions and
development of business."
Real
Estate
PBC
’
s
policy is to continue to implement its growth strategy, to develop
its yield bearer properties and to increase revenues from this
activity, which is its main activity, by building on land, which
PBC owns, and locating new investments opportunities. Concurrently,
PBC will act to realize assets in which their improvement potential
was fully utilized and PBC will also act to maintain a strong
financial stability. In addition, on August 2017,
PBC
’
s
Board of Directors decided to begin the process of examining the
realization of the PBC
’
s,
directly and indirectly, holdings in Ispro Israeli Building Rental
Company Ltd., and within this framework, to receive proposals from
various parties for the acquisition of the menctioned
company.
76
Supermarkets
Implementation of
Shufersal
’
s
strategy launched in the summer of 2014, the main elements of which
are strengthening of Shufersal
’
s
competitive position, especially in the discount segment, promotion
and significant growth in Shufersal
’
s
own brand, which includes the launch of new products in more
leading categories (such as pharma and products for infants)
alongside improvement in its terms of trade and relationships with
its suppliers, substantial growth in sales of Shufersal Online and
promotion of the digital operation, including Shufersal App,
promotion of growth engines and development of specialized areas of
activity, which includes, development of "Shufersal for Business"
(Wholesale Sales Offers), and further implementation of the
streamlining plan and changes in work procedures while saving
costs.
Telecommunications
Cellcom
’
s
business strategy is divided into the following
categories:
●
Cell site construction and
licensing
’
Cellcom construct cell sites based on its strategy to expand the
geographical coverage and improve the quality of its network and as
necessary to replace other obsolete cell sites.
●
Sales and customer care - Cellcom combine their
sales and customer care efforts in order to maximize sales
opportunities alongside accessible and quality customer
service.
●
Marketing - Cellcom marketing strategy
emphasizes their position as a communications group and cellular
market leader, its value for money and its provision of a
comprehensive solution for their customers
’
communication needs, by offering services bundles for families and
for the office for small and mid-sized businesses. Cellcom aims to
provide its customers with a comprehensive quality experience
through the various means of communications that they use,
including their mobile handset, tablet and laptop. Alongside its
focus on packages for a fixed sum, Cellcom has substantially
reduced the number of calling plans available to its customers,
thus reducing its back office operation.
Insurance
The investment managers make use of
an advanced research department and an effective trading execution,
to ensure a competitive advantage in order to achieve a fair
long-term yield for policy holders, maximizing income from
investments in accordance with the company
’
s
risk appetite and the structure of liabilities in the portfolios.
On September 5, 2017, the Company reported that IDBD has received a
non-binding offer from Huabang Financial Holdings Limited to
acquire its entire stake in Clal, representative of 44.9% of
its share capital. For more information, please see "-History and
development of the Company-Significant dispositions and development
of business."
Others
Includes the assets and income from
other miscellaneous businesses, such as technological developments,
tourism, oil and gas, electronics, and other sundry
activities.
Overview
Operations Center in
Argentina
Shopping
Malls
As of June 30, 2017, we own, through
our subsidiary IRSA CP, a majority interest in a portfolio of 16
shopping malls in Argentina, 15 of which are operated by us. Of our
16 shopping malls, seven are located in the City of Buenos Aires,
two in the greater Buenos Aires area, and the rest located in
different provinces of Argentina (Alto Noa in the City of Salta,
Alto Rosario in the City of Rosario, Mendoza Plaza in the City of
Mendoza, Córdoba Shopping Villa Cabrera and Patio Olmos,
operated by a third party, in the City of Córdoba, La Ribera
Shopping in Santa Fe, through a joint venture, and Alto Comahue in
the City of Neuquén).
77
The shopping malls we operate
comprise a total of 341,289 square meters (3,673,604 square feet)
of gross leasable area. Total tenant sales in our shopping malls,
as reported by retailers, were Ps.34,426 million for the
fiscal year ended June 30, 2017 and Ps.28,854 million for
fiscal year ended June 30, 2016, representing an increase of 19.3%.
Tenant sales at our shopping malls are relevant to our revenues and
profitability because they are one of the factors that determine
the amount of rent that we charge our tenants. They also affect the
tenants’ overall occupancy costs as a percentage of the
tenant’s sales.
For the fiscal year ended June 30,
2017, our shopping malls welcomed 105.8 million visitors and
for the fiscal year ended June 30, 2016, total visitors was
112.3 million.
Total Number of
Visitors Per Fiscal Year at our Shopping Malls
(in
millions)
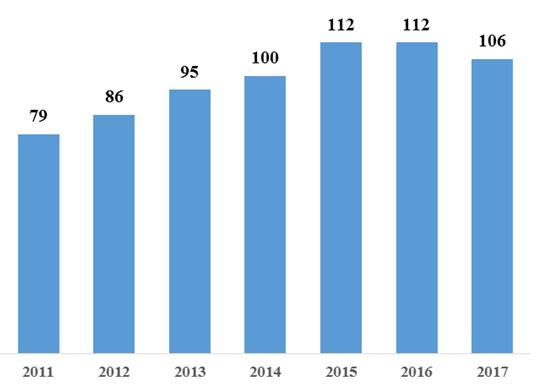
78
The following table shows certain
information concerning our shopping malls as of June 30,
2017:
|
Shopping malls
|
Date
ofacquisition/development
|
Location
|
GLA(sqm)(1)
|
Numberof
stores
|
Occupancyrate(2)
|
Ourownershipinterest
|
Rental
revenue
|
|
|
|
|
|
|
(%)
|
(%)
|
(in
thousands of Ps.)
|
|
Alto
Palermo
|
Dec-97
|
City of Buenos
Aires
|
18,945
|
143
|
99.3
|
100.0
|
507,048
|
|
Abasto
Shopping(3)
|
Nov-99
|
City of Buenos
Aires
|
36,795
|
171
|
96.8
|
100.0
|
542,219
|
|
Alto
Avellaneda
|
Dec-97
|
Buenos Aires
Province
|
36,063
|
136
|
99.3
|
100.0
|
343,930
|
|
Alcorta
Shopping
|
Jun-97
|
City of Buenos
Aires
|
15,613
|
113
|
98.1
|
100.0
|
238,355
|
|
Patio
Bullrich
|
Oct-98
|
City of Buenos
Aires
|
11,760
|
91
|
97.6
|
100.0
|
145,803
|
|
Buenos Aires
Design
|
Nov-97
|
City of Buenos
Aires
|
13,697
|
62
|
97.2
|
53.7
|
55,837
|
|
Dot Baires
Shopping
|
May-09
|
City of Buenos
Aires
|
49,499
|
158
|
99.9
|
80.0
|
332,968
|
|
Soleil Premium
Outlet
|
Jul-10
|
Buenos Aires
Province
|
15,227
|
79
|
100.0
|
100.0
|
115,468
|
|
Distrito
Arcos
|
Dec-14
|
City of Buenos
Aires
|
14,692
|
67
|
100.0
|
90.0
|
120,351
|
|
Alto Noa
Shopping
|
Mar-95
|
Salta
|
19,059
|
90
|
99.4
|
100.0
|
88,515
|
|
Alto Rosario
Shopping(4)
|
Nov-04
|
Santa
Fe
|
31,807
|
150
|
99.6
|
100.0
|
247,190
|
|
Mendoza Plaza
Shopping
|
Dec-94
|
Mendoza
|
42,867
|
142
|
97.1
|
100.0
|
148,239
|
|
Córdoba
Shopping Villa Cabrera
|
Dec-06
|
Córdoba
|
15,445
|
108
|
98.1
|
100.0
|
87,752
|
|
La Ribera
Shopping(5)
|
Aug-11
|
Santa
Fe
|
10,054
|
68
|
97.6
|
50.0
|
28,293
|
|
Alto
Comahue
|
Mar-15
|
Neuquén
|
9,766
|
104
|
96.4
|
99.9
|
58,164
|
|
Patio
Olmos(6)
|
Sep-07
|
Córdoba
|
—
|
—
|
—
|
—
|
—
|
|
Total
|
|
|
341,289
|
1,682
|
98.5
|
|
3,060,134
|
(1) Gross leasable area of each
property. Excludes common areas and parking spaces.
(2) Calculated by dividing occupied
square meters by leasable area.
(3) Excludes Museo de los Niños
(3,732 square meters).
(4) Excludes Museo de los Niños
(1,261 square meters).
(5) Owned through our joint venture
NPSF.
(6) We own the historic building in
the province of Cordoba where Patio Olmos shopping is located,
which mall is operated by a third party.
79
The following table sets forth total
rental income for each of our 16 shopping malls for the periods
indicated:
|
|
For the
fiscal years ended June 30, (2)
|
||
|
|
2017
|
2016
|
2015
|
|
|
(in
thousands of Ps.)
|
||
|
Alto
Palermo
|
507,048
|
413,815
|
310,717
|
|
Abasto
Shopping
|
542,219
|
403,231
|
313,323
|
|
Alto
Avellaneda
|
343,930
|
279,949
|
208,515
|
|
Alcorta
Shopping
|
238,355
|
193,959
|
149,318
|
|
Patio
Bullrich
|
145,803
|
123,395
|
104,142
|
|
Buenos Aires
Design
|
55,837
|
47,160
|
37,950
|
|
Dot Baires
Shopping
|
332,968
|
271,411
|
210,121
|
|
Soleil Premium
Outlet
|
115,468
|
84,615
|
61,026
|
|
Distrito
Arcos
|
120,351
|
81,252
|
27,426
|
|
Alto Noa
Shopping
|
88,515
|
75,724
|
52,342
|
|
Alto Rosario
Shopping
|
247,190
|
189,335
|
145,762
|
|
Mendoza Plaza
Shopping
|
148,239
|
124,118
|
95,214
|
|
Córdoba
Shopping Villa Cabrera
|
87,752
|
70,302
|
56,286
|
|
La Ribera
Shopping(1)
|
28,293
|
21,884
|
15,255
|
|
Alto
Comahue
|
58,164
|
49,611
|
16,347
|
|
Total
|
3,060,134
|
2,429,763
|
1,803,743
|
(1)
Through our joint venture NPSF
(2)
Includes Base Rent, Percentage Rent, Admission
Rights, Fees, Parking, Commissions, Revenues from non-traditional
advertising and Others.
The following table sets forth our
revenues from cumulative leases by revenue category for the periods
presented:
|
|
For the
fiscal year ended June 30,
|
||
|
|
2017
|
2016
|
%
Change
|
|
|
(in
thousands of Ps.)
|
|
|
|
Base
Rent(1)
|
1,685,900
|
1,261,418
|
33.7
|
|
Percentage
Rent
|
637,323
|
599,033
|
6.4
|
|
Total
Rent
|
2,323,223
|
1,860,451
|
24.9
|
|
Admission
rights
|
262,489
|
207,531
|
26.5
|
|
Fees
|
47,697
|
37,593
|
26.9
|
|
Parking
|
192,750
|
153,213
|
25.8
|
|
Commissions
|
122,389
|
105,013
|
16.5
|
|
Revenues from
non-traditional advertising
|
63,001
|
59,984
|
5.0
|
|
Others
|
48,588
|
5,977
|
712.8
|
|
Revenues before
Expenses and Collective Promotion Fund
|
3,060,134
|
2,429,763
|
25.9
|
|
Expenses and
Collective Promotion Fund
|
1,375,915
|
1,101,251
|
24.9
|
|
Total(2)
|
4,436,049
|
3,531,014
|
25.6
|
(1)
Includes Ps.209.2 million in revenues from
stands operating at our shopping malls.
(2)
Does not include Patio Olmos.
80
Tenant
retail sales
Total sales by our
shopping mall tenants, as reported by retailers, increased 19.3%,
to Ps.34,426 million for the period ended June 30, 2017 from
Ps.28,854 million for period ended June 30, 2016. Tenant sales
at our shopping malls are relevant to our revenues and
profitability because they are one of the factors that determine
the amount of rent that we charge our tenants. They also affect the
tenants’ overall occupancy costs as a percentage of the
tenant’s sales.
The following table sets forth the
total retail sales of our shopping mall tenants for the periods
indicated:
|
|
For the
fiscal years ended June 30,
|
||
|
|
2017
|
2016
|
2015
|
|
|
(in millions
of Ps.)
|
||
|
Alto
Palermo
|
4,169
|
3,499
|
2,662
|
|
Abasto
Shopping
|
4,604
|
4,043
|
3,150
|
|
Alto
Avellaneda
|
4,344
|
3,776
|
2,913
|
|
Alcorta
Shopping
|
2,207
|
1,899
|
1,475
|
|
Patio
Bullrich
|
1,236
|
1,061
|
889
|
|
Buenos Aires
Design
|
537
|
414
|
326
|
|
Dot Baires
Shopping
|
3,748
|
3,254
|
2,571
|
|
Soleil
|
1,726
|
1,282
|
938
|
|
Distrito
Arcos
|
1,455
|
962
|
340
|
|
Alto Noa
Shopping
|
1,587
|
1,325
|
1,069
|
|
Alto Rosario
Shopping
|
3,175
|
2,627
|
1,952
|
|
Mendoza Plaza
Shopping
|
2,734
|
2,369
|
1,907
|
|
Córdoba
Shopping
|
1,178
|
991
|
756
|
|
La Ribera
Shopping(1)
|
771
|
634
|
398
|
|
Alto
Comahue(2)
|
954
|
717
|
182
|
|
Total
|
34,426
|
28,854
|
21,526
|
(1)
Owned by Nuevo Puerto Santa Fe S.A., in which we
are a joint venture partner.
(2)
Opened on March 17, 2015.
The following chart depicts
aggregate gross sales for the fiscal years represented of our
shopping mall tenants.
Aggregate Gross
Sales per Fiscal Year
(in millions of
Ps.)
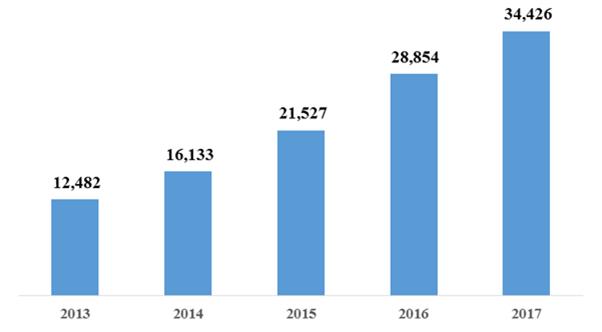
81
Total sales by
type of business
The following table sets forth the
retail sales of our shopping mall tenants by type of business for
the periods indicated:
|
|
For the
fiscal years ended June 30,
|
||
|
|
2017
|
2016
|
2015
|
|
|
(in millions
of Ps.)
|
||
|
Anchor
Store
|
1,875
|
1,590
|
1,299
|
|
Clothing and
footwear
|
18,463
|
15,156
|
11,125
|
|
Entertainment
|
1,178
|
1,021
|
741
|
|
Home
|
957
|
784
|
617
|
|
Restaurant
|
3,671
|
2,723
|
1,938
|
|
Miscellaneous
|
3,963
|
3,368
|
2,589
|
|
Services
|
255
|
351
|
223
|
|
Electronic
appliances
|
4,064
|
3,861
|
2,994
|
|
Total
|
34,426
|
28,854
|
21,526
|
Occupancy
rate
The following table sets forth the
occupancy rate expressed as a percentage of gross leasable area of
each of our shopping malls for the periods indicated:
|
|
As of
June 30,
|
||
|
|
2017
|
2016
|
2015
|
|
|
(%)
|
||
|
Abasto
Shopping
|
96.8
|
99.8
|
100.0
|
|
Alto
Palermo
|
99.3
|
99.5
|
99.7
|
|
Alto
Avellaneda
|
99.3
|
100.0
|
99.9
|
|
Alcorta
Shopping
|
98.1
|
89.1
|
100.0
|
|
Patio
Bullrich
|
97.6
|
99.1
|
100.0
|
|
Alto
Noa
|
99.4
|
100.0
|
100.0
|
|
Buenos Aires
Design
|
97.2
|
95.7
|
94.6
|
|
Mendoza
Plaza
|
97.1
|
95.2
|
96.1
|
|
Alto
Rosario
|
99.6
|
100.0
|
97.9
|
|
Córdoba
Shopping Villa Cabrera
|
98.1
|
99.2
|
99.8
|
|
Dot Baires
Shopping
|
99.9
|
100.0
|
99.7
|
|
Soleil Premium
Outlet
|
100.0
|
100.0
|
99.4
|
|
La Ribera
Shopping
|
97.6
|
99.3
|
99.3
|
|
Distrito
Arcos(1)
|
100.0
|
97.0
|
97.3
|
|
Alto
Comahue(2)
|
96.4
|
96.6
|
94.2
|
|
Total
|
98.5
|
98.4
|
98.7
|
(1)
Opened on December 18, 2014.
(2)
Opened on March 17, 2015.
82
The
following chart depicts the average occupancy rate for all our
shopping malls for each fiscal year presented
:
Shopping
Malls—Occupancy rates (%) per fiscal year
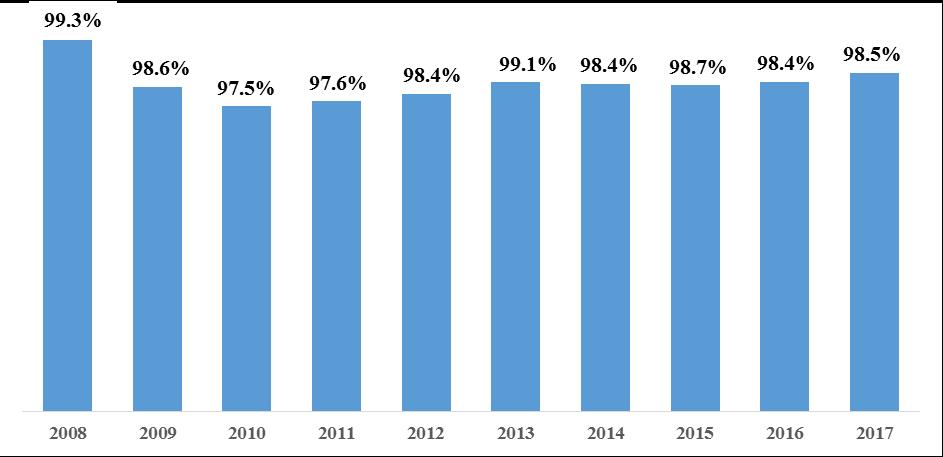
Rental
price
The following table shows the annual
average rental price per square meter for the periods
indicated:
(1)
|
|
For the
fiscal years endedJune 30,
|
||
|
|
2017
|
2016
|
2015
|
|
|
(in
Ps.)
|
||
|
Abasto
Shopping
|
14,736
|
9,964
|
7,755
|
|
Alto
Palermo
|
26,765
|
21,819
|
15,898
|
|
Alto
Avellaneda
|
9,537
|
7,801
|
5,677
|
|
Alcorta
Shopping
|
15,267
|
12,217
|
9,675
|
|
Patio
Bullrich
|
12,399
|
10,473
|
8,950
|
|
Alto Noa
Shopping
|
4,644
|
3,977
|
2,744
|
|
Buenos Aires
Design
|
4,077
|
3,403
|
2,733
|
|
Mendoza
Plaza
|
3,458
|
2,952
|
2,264
|
|
Alto Rosario
Shopping
|
7,772
|
6,299
|
4,915
|
|
Córdoba
Shopping Villa Cabrera
|
5,682
|
4,512
|
3,672
|
|
Dot Baires
Shopping
|
6,727
|
5,468
|
4,215
|
|
Soleil Premium
Outlet
|
7,583
|
6,048
|
4,361
|
|
La Ribera
Shopping
|
2,814
|
2,222
|
1,564
|
|
Distrito
Arcos(2)
|
8,192
|
7,274
|
2,262
|
|
Alto
Comahue(3)
|
5,956
|
5,017
|
1,729
|
(1)
Corresponds to consolidated annual accumulated
rental prices divided by gross leasable square meters. Does not
include income from Patio Olmos.
(2)
Opened on December 18, 2014.
(3)
Opened on March 17, 2015.
83
Lease expirations
The following table sets forth the
schedule of estimated lease expirations for our shopping malls for
leases in effect as of June 30, 2017, assuming that none of our
tenants exercise their option to renew or terminate their leases
prior to expiration:
|
|
As of June 30,
2017
|
||||
|
Expiration (2)
|
Number of
agreements/stores
|
Square meters
due to expire
(2)(3)
|
Due to
expire(%)
|
Amount of lease
payments(in thousands of Ps.)
(3)
|
Agreements(%)
|
|
Vacant
stores
|
59
|
13,141
|
3.9
|
|
|
|
2017
(1)
|
360
|
66,577
|
19.4
|
308,613,566
|
22.2
|
|
2018
|
460
|
89,732
|
26.3
|
423,644,277
|
30.5
|
|
2019
|
516
|
114,262
|
33.5
|
410,043,421
|
29.5
|
|
2020 and subsequent
years
|
287
|
57,577
|
16.9
|
248,712,291
|
17.8
|
|
Total(2)
|
1,682
|
341,289
|
100.0
|
1,391,013,556
|
100
%
|
(1)
Includes vacant
stores as of June 30, 2017.
A
lease may be associated with one or more stores.
(2)
Does not reflect
our ownership interest in each property.
(3)
Reflects the annual
Base Rent of agreements due to expire as of June 30,
2017.
Five largest
tenants of the portfolio
The five largest tenants of the
portfolio (in terms of sales) conforms approximately 14.6% of their
gross leasable area as of June 30, 2017 and represent approximately
9.2% of the annual base rent for the fiscal year ending on June 30,
2017.
New leases and
renewals
The following table shows certain
information about our lease agreements as of June 30,
2017:
|
|
|
|
|
Average
annual baserent per sqm (Ps.)
|
|
|
|
|
Type of business
|
Number of
agreements
|
Annual base
rent amount(in millions of Ps.)
|
Annual
admission rights amount(in millions of Ps.)
|
New and
renewed
|
Former
agreements
|
Number of
non-renewed agreements(1)
|
Non-renewed
agreements(1)annual base rent amount (in millions of
Ps.)
|
|
Clothing and
footwear
|
132
|
19.1
|
21.7
|
1,461.8
|
1,103.6
|
843
|
117.3
|
|
Restaurant
|
15
|
1.5
|
1.3
|
1,154,7
|
803.9
|
198
|
21.7
|
|
Miscellaneous(2)
|
27
|
3.6
|
7.8
|
1,111.7
|
824.4
|
248
|
34.2
|
|
Home
|
21
|
2.1
|
2.2
|
693.4
|
620.7
|
71
|
7.2
|
|
Services
|
1
|
0.0
|
0.0
|
790.2
|
1,865.9
|
67
|
4.3
|
|
Entertainment
|
2
|
0.5
|
0.1
|
93.3
|
70.5
|
25
|
5.6
|
|
Total
|
198
|
27.0
|
33.1
|
5,305.1
|
5,289
|
1,452
|
190.3
|
(1)
Includes vacant stores as of June 30, 2017.
Gross leasable area with respect to such vacant stores is included
under the type of business of the last tenant to occupy such
stores.
(2)
Miscellaneous includes anchor
store.
Principal Terms of our
Leases
Under the Argentine Civil and
Commercial Code lease terms may not exceed 20 or 50 years,
except for leases regulated by Law No. 25,248 which states
leases on real property are not subject to term restrictions.
Generally, terms of our lease agreements range from three to ten
years.
Leasable space in our shopping malls
is marketed through an exclusive arrangement with our wholly owned
subsidiary and real estate broker Fibesa S.A., or
“Fibesa.” We use a standard lease agreement for most
tenants at our shopping malls, the terms and conditions of which
are described below. However, our largest or “anchor”
tenants generally negotiate better terms for their respective
leases. No assurance can be given that lease terms will be as set
forth in the standard lease agreement.
84
Rent amount specified in our leases
generally is the higher of (i) a monthly Base Rent and
(ii) a specified percentage of the tenant’s monthly
gross sales in the store, which generally ranges between 3% and 10%
of tenant’s gross sales. In addition, pursuant to the rent
escalation clause in most of our leases, a tenant’s Base Rent
generally increases between 21% and 25% on an annual and cumulative
basis from the thirteenth (13
th
) month of
effectiveness of the lease. Although many of our lease agreements
contain price adjustment provisions, these are not based on an
official index nor do they reflect the inflation index. In the
event of litigation, there can be no assurance that we may be able
to enforce such clauses contained in our lease
agreements.
In addition to rent, we charge most
of our tenants an admission right, which must be paid upon
execution of the lease agreement and upon its renewal. The
admission right is normally paid as a lump sum or in a small number
of monthly installments. If the tenants pay this fee in
installments, the tenants are responsible for paying the balance of
any such unpaid amount if they terminate the lease prior to its
expiration. In the event of unilateral termination and/or
resolution for breach by the tenants, tenants will not be refunded
their admission payment without our consent. We lease our stores,
kiosks and spaces in our shopping malls through our wholly-owned
subsidiary Fibesa. We charge our tenants a fee for the brokerage
services, which usually amounts to approximately three months of
the Base Rent plus the admission right.
We are responsible for providing
each shopping mall rental unit with electricity, a main telephone
switchboard, central air conditioning and a connection to a general
fire detection system. We also provide the food court tenants with
sanitation and with gas systems connections. Each tenant is
responsible for completing all necessary installations within its
rental unit, in addition to paying direct related expenses,
including electricity, water, gas, telephone and air conditioning.
Tenants must also pay for a percentage of total expenses and
general taxes related to common areas. We determine this percentage
based on different factors. The common area expenses include, among
others, administration, security, operations, maintenance, cleaning
and taxes.
We carry out promotional and
marketing activities to draw consumer traffic to our shopping
malls. These activities are paid for with the tenants’
contributions to the Common Promotional Fund, or “CPF,”
which is administered by us. Tenants are required to contribute 15%
of their rent (Base Rent plus Percentage Rent) to the CPF. We may
increase the percentage tenants must contribute to the CPF with up
to 25% of the original amount set forth in the corresponding lease
agreement for the contributions to the CPF. We may also require
tenants to make extraordinary contributions to the CPF to fund
special promotional and marketing campaigns or to cover the costs
of special promotional events that benefit all tenants. We may
require tenants to make these extraordinary contributions up to
four times a year provided that each extraordinary contribution may
not exceed 25% of the tenant’s preceding monthly lease
payment.
Each tenant leases its rental unit
as a shell without any fixtures and is responsible for the interior
design of its rental unit. Any modifications and additions to the
rental units must be pre-approved by us. We have the option to
charge the tenant for all costs incurred in remodeling the rental
units and for removing any additions made to the rental unit when
the lease expires. Furthermore, tenants are responsible for
obtaining adequate insurance for their rental units, which must
cover, among other things, damage caused by fire, glass breakage,
theft, flood, civil liability and workers’
compensation.
Control Systems
We have computer systems equipped to
monitor tenants’ sales (except stands) in all of our shopping
malls. We also conduct regular audits of our tenants’
accounting sales records in all of our shopping malls. Almost every
store in our shopping malls has a point of sale that is linked to
our main server. We use the information generated from the computer
monitoring system to prepare statistical data regarding, among
other things, total sales, average sales and peak sale hours for
marketing purposes and as a reference for the internal audit. Most
of our shopping mall lease agreements require the tenant to have
its point of sale system linked to our server.
85
Competition
Given that most of our shopping
malls are located in densely populated areas, there are competing
shopping malls within, or in close proximity to, our target areas.
The number of shopping malls in a particular area could have a
material effect on our ability to lease space in our shopping malls
and on the rent that we are able to charge. We believe that due to
the limited availability of large plots of land and
zoningrestrictions in the City of Buenos Aires, it is difficult for
other companies to compete with us in areas through the development
of new shopping malls. Our principal competitor is Cencosud S.A.
which owns and operates Unicenter Shopping and the Jumbo
hypermarket chain, among others.
The following table shows certain
information concerning the most significant owners and operators of
shopping malls in Argentina, as of June 30, 2017.
|
Entity
|
Shopping malls
|
Location(1)
|
GLA
|
Stores
|
GLA at
national level(2)
|
Market
share(3)
|
|
|
|
|
|
|
(%)
|
(%)
|
|
IRSA
CP
|
Abasto de Buenos
Aires(5)
|
CABA
|
36,795
|
171
|
2.98
|
2.35
|
|
|
Alto
Comahue
|
Neuquén
|
9,766
|
104
|
0.79
|
1.43
|
|
|
Alto Palermo
Shopping
|
CABA
|
18,945
|
143
|
1.54
|
1.96
|
|
|
Buenos Aires
Design(7)
|
CABA
|
13,697
|
62
|
1.09
|
0.81
|
|
|
Dot Baires
Shopping(6)
|
CABA
|
49,499
|
158
|
4.01
|
2.17
|
|
|
Paseo
Alcorta(4)
|
CABA
|
15,613
|
113
|
1.26
|
1.55
|
|
|
Patio
Bullrich
|
CABA
|
11,760
|
91
|
0.95
|
1.25
|
|
|
Córdoba
Shopping(4)
|
Córdoba
|
15,445
|
108
|
1.25
|
1.48
|
|
|
Alto
Avellaneda(4)
|
GBA
|
36,063
|
136
|
2.92
|
1.87
|
|
|
Mendoza Plaza(4)
Shopping
|
Mendoza
|
42,867
|
142
|
3.46
|
1.95
|
|
|
Alto
Rosario(4)
|
Rosario
|
31,807
|
150
|
2.57
|
2.06
|
|
|
Alto
Noa(4)
|
Salta
|
19,059
|
90
|
1.54
|
1.23
|
|
|
La Ribera
Shopping(7)
|
Santa
Fe
|
10,054
|
68
|
0.80
|
0.91
|
|
|
Distrito
Arcos
|
CABA
|
14,692
|
67
|
1.18
|
0.92
|
|
|
Soleil Premium
Outlet(4)
|
GBA
|
15,227
|
79
|
1.23
|
1.08
|
|
Subtotal
|
|
|
341,289
|
1,682
|
27.56
|
23.02
|
|
Cencosud S.A.
|
|
|
277,203
|
1,237
|
22.44
|
16.95
|
|
Other
operators
|
|
|
617,594
|
4,378
|
50.00
|
60.03
|
|
Total
|
|
|
1,236,086
|
7,297
|
100.00
|
100.00
|
(1)
“GBA” means Greater Buenos Aires,
the Buenos Aires metropolitan area, and “CABA” means
the City of Buenos Aires.
(2)
Gross leasable area percentage equals the gross
leasable area divided by nationwide GLA.
(3)
Maket share equals
to Stores divided Total of Stores.
(4)
Includes supermarkets.
(5)
Includes Museo de los Niños.
(6)
We own 80% of the equity of PAMSA.
(7)
Our effective participation in ERSA is 53.68%,
which operates the concession related to this
property.
Source:
Argentine Chamber of Shopping
Malls.
Seasonality
Our business is directly affected by
seasonality, influencing the level of our tenants’ sales.
During Argentine summer holidays (January and February) our
tenants’ sales typically reach their lowest level, whereas
during winter holidays (July) and in Christmas (December) they
reach their maximum level. Clothing retailers generally change
their collections in spring and autumn, positively affecting our
shopping malls’ sales. Discount sales at the end of each
season are also one of the main seasonal factors affecting our
business.
Offices and
Others
According to Colliers International,
as of March 2017, the A+ and A office inventory increased since
2016, at 1,757,659 sqm. In terms of rental availability, there was
a 0.3% increase in the vacancy rate to 4.5% during the second
quarter of 2017 compared to the same period the previous year.
These values indicate that the market is healthy in terms of its
operations, allowing an optimum level of supply with balanced
values. According to the market segments, class A properties show a
vacancy rate of 8.6% for the entire stock, while A+ properties
buildings show a vacancy rate of 4.5%.
86
We are engaged in the acquisition
and management of office buildings and other rental properties in
Argentina. As of June 30, 2017, we directly and indirectly owned
interests in office buildings and other rental properties, which
comprised 331,571 square meters of gross leaseable area. Out of
these properties, 9 were office properties, which comprised 87,920
square meters of gross leaseable area. For fiscal year 2017, we had
revenues from offices and other non-shopping mall rental properties
of Ps.431 million.
All our office rental properties in
Argentina are located in the City of Buenos Aires. For the year
ended June 30, 2017, the average occupancy rate for all our
properties in the Offices and Others segment was approximately
96.2%, without considering the Philips building, acquired on June
5, 2017 as there is a loan-for-use agreement executed with the
seller until January 2018.
Compared to the previous quarter, a
3.3% increase was recorded (from US$24.3 per square meter to
US$25.1 per square meter). This slight increase shows a 0.3%
decrease in rental prices for A+ properties (US$28.8 per square
meter in the first quarter of the year 2017 against US$28.7 per
square meter in the fourth quarter of the year 2016) and a 1.2%
decrease in rental prices for A properties (US$23.6 per square
meter in the first quarter of 2017 against US$23.3 per square meter
in the fourth quarter).
The following table shows certain
information regarding our office buildings, as of June 30,
2017:
|
|
2017
|
2016
|
2015
|
|
Leasable area
(square meters)
|
87,920
|
81,020
|
111,678
|
|
Occupancy of total
portfolio
(1)
|
96.2
%
|
98.7
%
|
98.1
%
|
|
Rent in Ps./square
meter
(1)
|
419.3
|
358.4
|
225.8
|
|
Rent in US$/square
meter
(1)
|
25.3
|
24.0
|
24.90
|
(1) Excludes the Phillips Building
as there is a loan-for-use agreement signed with the seller in
effect until January 2018.
The following table shows certain
information regarding our office buildings, as of June 30,
2017:
|
|
|
|
|
|
|
Annual
accumulated rental income (in millions of Ps.)
(4)
|
||
|
|
Date of
Acquisition
|
Gross
Leaseable Area (sqm)
(1)
|
Occupancy
(2)
|
IRSA’s
Effective Interest
|
Monthly
Rental Income (in thousands of Ps.)
(3)
|
2017
|
2016
|
2015
|
|
Offices
|
|
|
|
|
|
|
|
|
|
Edificio República
(5)
|
04/28/08
|
19,885
|
95.2
%
|
100.0
%
|
9,114
|
112
|
72
|
62
|
|
Torre Bankboston
(5)
|
08/27/07
|
14,873
|
100.0
%
|
100.0
%
|
6,408
|
81
|
56
|
42
|
|
Bouchard 551
|
03/15/07
|
-
|
-
|
100.0
%
|
235
|
3
|
3
|
10
|
|
Intercontinental Plaza
(5)
|
11/18/97
|
3,876
|
100.0
%
|
100.0
%
|
1,415
|
19
|
28
|
56
|
|
Bouchard 710
(5)
|
06/01/05
|
15,014
|
100.0
%
|
100.0
%
|
7,881
|
86
|
68
|
48
|
|
Dique IV
|
12/02/97
|
-
|
-
|
-
|
-
|
0
|
15
|
32
|
|
Maipú
1300
|
09/28/95
|
803
|
50.6
%
|
100.0
%
|
143
|
6
|
6
|
16
|
|
Libertador 498
|
12/20/95
|
620
|
100.0
%
|
100.0
%
|
600
|
7
|
6
|
2
|
|
Suipacha 652/64
(5)
|
11/22/91
|
11,465
|
86.3
%
|
100.0
%
|
2,470
|
30
|
22
|
16
|
|
Dot Building
(5)
|
11/28/06
|
11,242
|
100.0
%
|
80.0
%
|
4,345
|
50
|
31
|
27
|
|
Philips Building
(5)
|
06/05/17
|
10,142
|
-
|
100.0
%
|
-
|
-
|
-
|
-
|
|
Subtotal
Offices
|
|
87,920
|
96.2
%
|
N/A
|
32,611
|
394
|
307
|
311
|
|
|
|
|
|
|
|
|
|
|
|
Other
Properties
|
|
|
|
|
|
|
|
|
|
Santa María del Plata
S.A
|
10/17/97
|
116,100
|
91.4
%
|
100.0
%
|
988
|
12
|
12
|
-
|
|
Nobleza Piccardo
(6)
|
05/31/11
|
109,610
|
94.0
%
|
50.0
%
|
1,775
|
13
|
2
|
8
|
|
Other Properties
(7)
|
N/A
|
17,941
|
N/A
|
N/A
|
1,317
|
13
|
11
|
7
|
|
Subtotal
Other Properties
|
|
243,651
|
90.0
%
|
N/A
|
4,080
|
38
|
25
|
15
|
|
|
|
|
|
|
|
|
|
|
|
Total
Offices and Others
|
|
331,571
|
91.5
%
|
N/A
|
36,691
|
432
|
332
|
326
|
(1) Corresponds to the total
leaseable surface area of each property as of June 30, 2017.
Excludes common areas and parking spaces.
(2) Calculated by dividing occupied
square meters by leaseable area as of June 30, 2017.
(3) The lease agreements in effect
as of June 30, 2017 were computed for each property.
(4) Corresponds to total
consolidated lease agreements.
(5) Through IRSA CP.
(6) Through Quality
Invest.
(7) Includes the following
properties: Ferro, Dot Adjoining Plot, Anchorena 665, Anchorena 545
(Chanta IV) and Intercontinental plot.
87
Management of
office buildings
We generally act as the manager of
the office properties in which we own an interest. We typically own
the entire building or a substantial number of floors in the
building. The buildings in which we own floors are generally
managed pursuant to the terms of a condominium agreement that
typically provides for control by a simple majority of the
interests based on owned area. As building manager, we handle
services such as security, maintenance and housekeeping, which are
generally outsourced. The cost of the services is passed through
to, and paid for by, the tenants, except in the case of our units
that have not been leased, if any, for which we bear the cost. We
market our leasable area through commissioned brokers or directly
by us.
Leases
We usually lease our offices and
other rental properties by using contracts with an average term of
three years, with the exception of a few contracts with terms of
five years. These contracts are renewable for two or three years at
the tenant’s option. Contracts for the rental of office
buildings and other commercial properties are generally stated in
U.S. dollars, and in accordance with Argentine law, they are not
subject to inflation adjustment. Rental rates for renewed periods
are negotiated at market value.
Occupancy
rate
The following table shows the
occupancy rate of our offices for fiscal years 2017 and
2016:
|
|
Occupancy
Percentage
(1)
|
|
|
|
2017
|
2016
|
|
Offices
|
|
|
|
Edificio
República
|
95.2
%
|
100.0
%
|
|
Torre
Bankboston
|
100.0
%
|
100.0
%
|
|
Intercontinental
Plaza
|
100.0
%
|
100.0
%
|
|
Bouchard
710
|
100.0
%
|
100.0
%
|
|
Suipacha
652/64
|
86.3
%
|
90.7
%
|
|
Dot
Building
|
100.0
%
|
100.0
%
|
|
Maipú
1300
|
50.6
%
|
100.0
%
|
|
Libertador
498
|
100.0
%
|
100.0
%
|
|
Philips
Building
|
-
|
-
|
|
Subtotal
Offices
|
96.2
%
|
98.7
%
|
Annual average
income per surface area as of June 30, 2015, 2016 and
2017
(1)
|
|
Annual
average income per square meter
(1)
|
||
|
|
2017
(1)
|
2016
(1)
|
2015
(1)
|
|
Offices
|
(Ps./sqm)
|
||
|
Edificio
República
|
5,671
|
3,615
|
3,115
|
|
Torre
Bankboston
|
5,345
|
3,778
|
2,819
|
|
Bouchard
551
|
0
|
0
|
-
|
|
Intercontinental
Plaza
|
5,409
|
4,291
|
2,484
|
|
Bouchard
710
|
5,692
|
4,539
|
3,219
|
|
Dique
IV
|
-
|
-
|
2,847
|
|
Maipú
1300
|
6,425
|
4,790
|
3,330
|
|
Libertador
498
|
9,739
|
10,464
|
3,149
|
|
Suipacha
652/64
|
2,617
|
1,961
|
1,399
|
|
Dot
Building
|
4,463
|
2,778
|
2,439
|
|
Philips
Building
|
-
|
-
|
-
|
|
(1)
Calculated by dividing annual rental income by
the gross leaseable area of offices based on our interest in each
building as of June 30 for each fiscal year.
|
|
||
88
New agreements and renewals
The following
table sets forth certain Information on lease agreements as of June
30, 2017:
|
Property
|
Number of
Agreements
(1)(5)
|
Annual
Rental Income
(2)
|
Rental
income per sqm New and Renewed
(3)
|
Previous
rental income per sqm
(3)
|
No. of
non-renewed agreements
|
Non-renewed
agreements Annual rental income
(4)
|
|
Maipú
1300
|
1
|
912,402
|
659
|
528
|
1
|
1,604,411
|
|
Av. Del Libertador
498
|
1
|
3,831,017
|
515
|
468
|
-
|
-
|
|
Intercontinental
Plaza
|
1
|
8,681,505
|
403
|
388
|
2
|
3,236,708
|
|
Bouchard
710
|
4
|
19,197,834
|
475
|
473
|
2
|
7,105,419
|
|
Torre
BankBoston
|
5
|
49,861,824
|
423
|
452
|
1
|
876,401
|
|
Edificio
República
|
5
|
37,819,319
|
439
|
435
|
1
|
13,641,466
|
|
Dot
Building
|
5
|
36,963,345
|
356
|
316
|
-
|
-
|
|
Suipacha
664
|
6
|
22,087,186
|
234
|
246
|
-
|
-
|
|
Total Offices
|
28
|
179,354,432
|
379
|
376
|
7
|
26,464,405
|
(1)
Includes new and renewed agreements executed in
fiscal year 2017.
(2)
Agreements stated in US dollars converted into
Pesos at the exchange rate prevailing in the initial month of the
agreement multiplied by 12 months.
(3)
Monthly value.
(4)
Agreements stated in US dollars converted into
Pesos at the exchange rate prevailing in the last month of the
agreement, multiplied by 12 months.
(5)
Does not include agreements of parking spaces,
antennas or terrace space.
Hotels
According to the Hotel Vacancy
Survey (EOH) prepared by INDEC, as of May 2017, overnight stays at
hotel and parahotel establishments were estimated at 2.8 million,
10.5% higher than the same month the previous year. Overnight stays
of resident and nonresident travelers increased by 10.3% and 11.3%,
respectively. Total travelers who stayed at hotels during May
2017were 1.3 million, accounting for a 9.9% increase compared to
the same month the previous year. The number of resident and
nonresident travelers increased by 10.0% and 9.6%, respectively.
The 1.1 million resident travelers represented 81.0% of the total
number of travelers who stayed at hotels. The Room Occupancy Rate
in April was 35.3%, showing a slight decline compared to the same
month the previous year. Moreover, the Bed Occupancy Rate for the
same period was 25.2%, which represents a slight decrease compared
to May 2016.
During fiscal year 2017, we kept our
76.34% interest in Intercontinental hotel, 80.00% interest in
Sheraton Libertador hotel and 50.00% interest in Llao
Llao.
The following chart shows certain
information regarding our luxury hotels:
|
|
|
|
|
|
|
Fiscal Year
Sales as of June 30 (in millions)
|
||
|
Hotels
|
Date of
Acquisition
|
IRSA’s
Interest
|
Number of
rooms
|
Occupancy
(1)
|
Average
Price per Room Ps.
(2)
|
2017
|
2016
|
2015
|
|
Intercontinental
(3)
|
11/01/1997
|
76.34
%
|
309
|
73.9
%
|
2,216
|
272
|
195
|
143
|
|
Sheraton Libertador
(4)
|
03/01/1998
|
80.00
%
|
200
|
73.2
%
|
1,954
|
151
|
119
|
94
|
|
Llao Llao
(5)
|
06/01/1997
|
50.00
%
|
205
|
51.6
%
|
5,245
|
302
|
220
|
159
|
|
Total
|
|
-
|
714
|
67.3
%
|
2,803
|
725
|
534
|
396
|
|
|
||||||||
|
(1) Accumulated average in the
twelve-month period.
|
||||||||
|
(2) Accumulated average in the
twelve-month period.
|
||||||||
|
(3) Through Nuevas Fronteras
S.A.
|
||||||||
|
(4) Through Hoteles Argentinos
S.A.
|
||||||||
|
(5) Through Llao Llao Resorts
S.A.
|
89
Hotel Llao Llao,
San Carlos de Bariloche, Province of Rio Negro
In June 1997 we acquired the Hotel
Llao Llao from Llao Llao Holding S.A. Fifty percent is currently
owned by the Sutton Group. The Hotel Llao Llao is located on the
Llao Llao peninsula, 25 kilometers from the City of San Carlos de
Bariloche, and it is one of the most important tourist hotels in
Argentina. Surrounded by mountains and lakes, this hotel was
designed and built by the famous architect Bustillo in a
traditional alpine style and first opened in 1938. The hotel was
renovated between 1990 and 1993 and has a total constructed surface
area of 15,000 sqm and 158 original rooms. The hotel-resort also
includes an 18-hole golf course, tennis courts, fitness facility,
spa, game room and swimming pool. The hotel is a member
of
The Leading Hotels
of the World, Ltd., a prestigious luxury hospitality organization
representing 430 of the world
’
s
finest hotels, resorts and spas. The Hotel Llao Llao is currently
being managed by Compaa de Servicios Hoteleros S.A.,
operator, among others, of the Alvear Palace Hotel, a luxury hotel
located in the Recoleta neighborhood of Buenos Aires. During 2007,
the hotel was subject to an expansion and the number of suites in
the hotel rose to 205 rooms.
Hotel
Intercontinental, City of Buenos Aires
In November 1997, we acquired 76.34%
of the Hotel Intercontinental. The Hotel Intercontinental is
located in the downtown City of Buenos Aires neighborhood of
Montserrat, near the Intercontinental Plaza office building.
Intercontinental Hotels Corporation, a United States corporation,
currently owns 24% of the Hotel Intercontinental. The
hotel
’
s
meeting facilities include eight meeting rooms, a convention center
and a divisible 588 sqm ballroom. Other amenities include a
restaurant, a business center, a sauna and a fitness facility with
swimming pool. The hotel was completed in December 1994 and has 309
rooms.
Hotel Sheraton
Libertador, City of Buenos Aires
In March 1998 we acquired 100% of
the Sheraton Libertador Hotel from Citicorp Equity Investment for
an aggregate purchase price of US$23 million. This hotel is located
in downtown Buenos Aires. The hotel contains 193 rooms and 7
suites, eight meeting rooms, a restaurant, a business center, a spa
and fitness facilities with a swimming pool. In March 1999, we sold
20% of our interest in the Sheraton Libertador
Hotel for US$4.7 million to
Hoteles Sheraton de Argentina. The hotel is currently managed by
Sheraton Overseas Management Corporation, a United States
corporation.
Bariloche
Plot, "El Rancho", San Carlos de Bariloche, Province of Río
Negro
On December 14, 2006, through our
hotel operator subsidiary, Llao Llao Resorts S.A., we acquired a
land covering 129,533 sqm of surface area in the City of San Carlos
de Bariloche in the Province of Río Negro. The total price of
the transaction was US$7 million, of which US$4.2 million were paid
in cash and the balance of US$2.8 million was financed by means of
a mortgage to be paid in 36 monthly, equal and consecutive
installments of US$0.086 million each. The land is in the border of
the Lago Gutiérrez, close to the Llao Llao Hotel in an
outstanding natural environment and it has a large cottage covering
1,000 sqm of surface area designed by the architect Ezequiel
Bustillo.
Sale and
Development of Properties and Land Reserves
Residential
Development Properties
The acquisition and development of
residential apartment complexes and residential communities for
sale is one of our core activities. Our development of residential
apartment complexes consists of the new construction of high-rise
towers or the conversion and renovation of existing structures such
as factories or warehouses. In connection with our development of
residential communities, we frequently acquire vacant land, develop
infrastructure such as roads, utilities and common areas, and sell
plots of land for construction of single-family homes. We may also
develop or sell portions of land for others to develop
complementary facilities such as shopping areas within residential
developments.
In fiscal year ended June 30, 2017,
revenues from the development and sale of properties segment
amounted to Ps.99 million, compared to Ps.
8 million posted in the fiscal year
ended June 30, 2016.
Construction and renovation works on
our residential development properties are currently performed,
under our supervision, by independent Argentine construction
companies that are selected through a bidding process. We enter
into turnkey contracts with the selected company for the
construction of residential development properties pursuant to
which the selected company agrees to build and deliver the
development for a fixed price and at a fixed date. We are generally
not responsible for any additional costs based upon the turnkey
contract. All other aspects of the construction, including
architectural design, are performed by third parties.
Another modality for the development
of residential undertakings is the exchange of land for constructed
square meters. In this way, we deliver undeveloped pieces of land
and another firm is in charge of building the project. In this
case, we receive finished square meters for commercialization,
without taking part in the construction works.
90
|
Development
|
Company
|
Interest
|
Date of
Acquisition
|
Surface area
sqm
|
Area intended
for sale sqm (1)
|
Area intended
for construction
|
Sold
(2)
|
Location
|
|
Residential
properties
|
|
|
|
|
|
|
|
|
|
Available for
sale
|
|
|
|
|
|
|
|
|
|
Condominios del Alto
I
|
IRSA CP
|
100
%
|
04/30/1999
|
-
|
2,082
|
-
|
100
%
|
Santa Fe
|
|
Condominios del Alto
II
|
IRSA CP
|
100
%
|
04/30/1999
|
-
|
4,082
|
-
|
100
%
|
Santa Fe
|
|
Caballito
Nuevo
|
IRSA
|
100
%
|
11/03/1997
|
-
|
7,323
|
-
|
100
%
|
CABA
|
|
Barrio
Chico
|
IRSA
|
100
%
|
03/01/2003
|
-
|
2,872
|
-
|
100
%
|
CABA
|
|
El
Encuentro
|
IRSA
|
100
%
|
11/18/1997
|
-
|
127,748
|
-
|
100
%
|
Buenos
Aires
|
|
Abril Club de Campo
– Plots
|
IRSA
|
100
%
|
01/03/1995
|
-
|
5,135
|
-
|
100
%
|
Buenos
Aires
|
|
Abril Club de Campo
– Manor House (3)
|
IRSA
|
100
%
|
01/03/1995
|
31,224
|
34,605
|
-
|
100
%
|
Buenos
Aires
|
|
Torres
Jard
í
n
|
IRSA
|
100
%
|
07/18/1996
|
-
|
-
|
|
-
|
CABA
|
|
Horizons
|
IRSA
|
50
%
|
01/16/2007
|
-
|
60,232
|
-
|
100
%
|
Buenos
Aires
|
|
Intangible –
Receivable units
|
|
|
|
|
-
|
|
|
|
|
Beruti (Astor
Palermo) (4)
|
IRSA CP
|
100
%
|
06/24/2008
|
-
|
2,170
|
-
|
-
|
CABA
|
|
Caballito Manzana 35
(11)
|
IRSA
|
100
%
|
10/22/1998
|
-
|
6,952
|
-
|
-
|
CABA
|
|
CONIL - Güemes 836
– Mz. 99 and Güemes 902 – Mz. 95
and Retail
Stores
|
IRSA CP
|
100
%
|
07/19/1996
|
1,389
|
-
|
5,994
|
-
|
Buenos
Aires
|
|
Canteras Natal Crespo (2
commercial parcels)
|
IRSA
|
-
|
-
|
40,333
|
-
|
-
|
100
%
|
Córdoba
|
|
Isla
Sirgadero
|
IRSA
|
100
%
|
02/16/2007
|
826,276
|
-
|
N/
A
|
100
%
|
Santa Fe
|
|
Pereiraola
(Greenville)
|
IRSA
|
100
%
|
04/21/2010
|
-
|
39,634
|
-
|
-
|
Buenos
Aires
|
|
Subtotal Residential
properties
|
|
|
|
899,222
|
292,835
|
5,994
|
|
|
|
Land
Reserves
|
|
|
|
|
|
|
|
|
|
Pilar R8 Km
53
|
IRSA
|
100
%
|
05/29/1997
|
74,828
|
-
|
-
|
-
|
Buenos
Aires
|
|
Pontevedra
|
IRSA
|
100
%
|
02/28/1998
|
730,994
|
-
|
-
|
-
|
Buenos
Aires
|
|
Mariano Acosta
Plot
|
IRSA
|
100
%
|
02/28/1998
|
967,290
|
-
|
-
|
-
|
Buenos
Aires
|
|
Merlo
|
IRSA
|
100
%
|
02/28/1998
|
1,004,987
|
-
|
-
|
-
|
Buenos
Aires
|
|
San Luis
Plot
|
IRSA
|
50
%
|
03/31/2008
|
3,250,523
|
-
|
-
|
-
|
San Luis
|
|
Subtotal Land
reserves
|
|
|
|
6,028,622
|
-
|
-
|
|
|
|
Future
Developments
|
|
|
|
|
|
|
|
|
|
Mixed
Uses
|
|
|
|
|
|
|
|
|
|
UOM Luján
(5)
|
IRSA CP
|
100
%
|
05/31/2008
|
1,160,000
|
-
|
N/A
|
N/A
|
Buenos
Aires
|
|
La Adela
|
IRSA
|
100
%
|
08/01/2014
|
10,580,000
|
-
|
-
|
N/A
|
Buenos
Aires
|
|
Predio San Martin (Ex
Nobleza Piccardo) (6)
|
IRSA CP
|
50
%
|
05/31/2011
|
159,995
|
-
|
500,000
|
N/A
|
Buenos
Aires
|
|
Puerto
Retiro
|
IRSA
|
50
%
|
05/18/1997
|
82,051
|
-
|
N/A
|
N/A
|
CABA
|
|
Solares Santa
María (7)
|
IRSA
|
100
%
|
07/10/1997
|
716,058
|
-
|
N/A
|
N/A
|
CABA
|
|
Residential
|
|
|
|
|
|
|
-
|
|
|
Coto Abasto Air
Space
|
IRSA CP
|
100
%
|
09/24/1997
|
-
|
-
|
21,536
|
N/A
|
CABA
|
|
Neuquén –
Residential parcel
|
IRSA CP
|
100
%
|
07/06/1999
|
13,000
|
-
|
18,000
|
N/A
|
Neuquén
|
|
Uruguay
Zetol
|
IRSA
|
90
%
|
06/01/2009
|
152,977
|
62,756
|
-
|
N/A
|
Uruguay
|
|
Uruguay Vista al
Muelle
|
IRSA
|
90
%
|
06/01/2009
|
102,216
|
62,737
|
-
|
N/A
|
Uruguay
|
|
|
|
|
|
|
|
|
|
|
|
Retail
|
|
|
|
|
|
|
|
|
|
Caballito Shopping
plot (8)
|
IRSA CP
|
100
%
|
-
|
23,791
|
-
|
N/A
|
N/A
|
CABA
|
|
Building Annexed to
Dot
|
IRSA CP
|
80
%
|
-
|
15,881
|
-
|
47,643
|
N/A
|
CABA
|
|
Offices
|
|
|
|
|
|
|
|
|
|
Philips Adjoining
plots - Offices 1 and 2
|
IRSA CP
|
80
%
|
11/28/2006
|
12,800
|
-
|
38,400
|
N/A
|
CABA
|
|
Baicom
(10)
|
IRSA
|
50
%
|
12/23/2009
|
6,905
|
-
|
34,500
|
N/A
|
CABA
|
|
Intercontinental
Plaza II (9)
|
IRSA CP
|
100
%
|
02/28/1998
|
6,135
|
-
|
19,598
|
N/A
|
CABA
|
|
Catalinas Norte
Plot
|
IRSA
|
100
%
|
12/17/2009
|
3,649
|
-
|
35,468
|
13
%
|
CABA
|
|
Subtotal Future
Developments
|
|
|
|
13,035,458
|
125,493
|
715,145
|
|
|
|
Total Land
Reserves
|
|
|
|
19,963,302
|
418,328
|
721,139
|
|
|
|
|
|
|
|
|
|
|
|
|
(1)
Saleable Area means the
housing square meters proper, excluding parking and storage spaces.
It is recorded at 100%, before making any sales.
(2)
% Sold includes those sale
transactions for which there is a Preliminary Sales Agreement,
Possession or a Title Deed executed. Includes housing square meters
only, excludes parking and storage spaces.
(3)
Saleable Area includes
31,224 sqm of the plot and 4,712.81 total sqm of the Manor House
(discounting 1,331.76 sqm of Ground Floor).
(4)
Saleable Area excludes 171
commercial parking spaces to be received and the units as
compensation.
(5)
Mixed Used Feasibility
requested, pending provincial approval.
(6)
Since January 2016,
the plot has been subject to a regulation called “CP”
(
Comercial
Principal
), this regulation
allows the development of at least 500,000 sqm for mixed uses
(Commercial, Residential Properties, etc.)
(7)
Feasibility requested for
716,058 buildable square meters, pending approval from the
Legislative body of the City of Buenos Aires.
(8)
Draft project of 71,374
buildable square meters, pending approval of zoning
parameters.
(9)
6,135
sqm of surface area correspond to the parcel, which includes
Intercontinental I and II.
(10)
On July 19, 2017,
the Company sold land reserve which was owned by Baicom. For more
information, please se “Recent developments – Sale of
BAICOM land reserve.”
(11)
As a
consequence of the unfavorable rulings rendered by lower courts and
appellate courts, the Company and TGLT reached a settlement
agreement dated December 30 2016, whereby they agree to provide a
deed for the revocation of the barter agreement entered into 2011,
after TGLT resolves certain issues.
91
Residential Properties (available for sale)
In the residential market, we
acquire undeveloped properties strategically located in densely
populated areas of the City of Buenos Aires, particularly
properties located near shopping malls and hypermarkets or those to
be constructed. We then develop multi-building high-rise complexes
targeting the middle- and high- income market. These are equipped
with modern comforts and services, such as open "green areas,"
swimming pools, sports and recreation facilities and 24-hour
security. In the loft buildings market, our strategy is to acquire
old buildings no longer in use located in densely populated middle
and upper-middle income areas. The properties are then renovated
into unfinished lofts allowing buyers the opportunity to design and
decorate them according to their preferences.
Condominios del
Alto II – City of Rosario, Province of Santa Fe (IRSA
CP)
As of June 30, 2017, works in parcel
H have been completed; all units under the barter agreement have
been received and 11 parking spaces are available for
sale.
Barrio Chico
– City of Buenos Aires
This is a unique Project located in
Barrio Parque, an exclusive residential area in the City of Buenos
Aires. During May 2006, the commercialization of the project was
launched with successful results. The image of the product was
originally developed under the name “Barrio Chico”
through advertisements in the most important media. As of June 30,
2017, the project has been completed and 2 parking spaces are yet
to be sold.
El Encuentro -
Benavidez, Tigre – Province of Buenos Aires
In the district of Benavidez,
Municipality of Tigre, 35 kilometers north of downtown Buenos
Aires, there is a 110-hectare gated residential complex known as
“El Encuentro,” consisting of a total of 527 lots and a
total saleable area of 610,785.15 sqm with two privileged front
accesses: the main one to Vía Bancalari and the service one to
Highway No. 9, allowing an easy way to and from the city. As of
June 30, 2017, marketing of the project has been
completed.
Horizons,
Vicente López, Olivos, Province of Buenos Aires.
The IRSA-CYRELA Project, developed
over two adjacent blocks, was launched in March 2008 under the name
Horizons. Horizons is one of the most significant developments in
Greater Buenos Aires, featuring a new concept in residential
complexes given its emphasis on the use of common spaces. This
project includes two complexes with a total of six buildings: one
complex faces the river and consists of three 14-floor buildings,
the “Río” complex, and the other one, facing
Libertador Avenue, consists of three 17-floor buildings, it is
known as the “Parque” complex, thus totaling 59,000
square meters built of saleable area distributed in 467 units
(excluding the units to be delivered as consideration for the
purchase of the lands). Horizons is a unique and style-innovating
residential complex offering 32 amenities, including a meeting
room, work zone, heated swimming pools, mansion with spa, sauna,
gym, children room, teen room, thematically landscaped areas, and
aerobic trail. The showroom was opened to the public in March 2008
with great success. As of June 30, 2017, the project was fully
built and 2 apartments and 2 parking spaces are pending execution
of the title deed. The stock available for sale consists of 1
parking space and 30 storage spaces.
Intangibles – Units to be received under barter
agreements
Beruti Plot
– City of Buenos Aires (IRSA CP)
On October 13, 2010, we and
TGLT entered into an exchange agreement in connection with a plot
of land located at Beruti 3351/59 in the City of Buenos Aires for
cash and 2,170 square meters in future residential apartments to be
constructed by TGLT on the plot. In accordance with the terms of
the agreement, TGLT will transfer to us (i) certain units to
be determined, representing 17.33% of the aggregate surface of the
residential space, (ii) a number of parking spaces to be
determined, representing 15.82% of the aggregate surface of the
parking spaces, (iii) all the commercial parking spots in the
future building and (iv) the sum of US$10.7 million. To
ensure performance of the obligations assumed by TGLT under the
deed of sale, a mortgage over the property was granted in our
favor.
92
On December 30, 2016, we and
TGLT signed the possession certificate for 36 residential
apartments totaling 2,413 square meters, 32 residential parking
spaces, and 171 commercial parking spaces. As of June 30,
2017, we assigned the possession of 22 residential apartments in
exchange for of US$6.2 million and five apartments in exchange
for US$1.8 million.
Caballito Plot
– City of Buenos Aires
On June 29, 2011, the Company and
TGLT, a residential developer, entered into an agreement to barter
a plot of land located in Méndez de Andes street in the
neighborhood of Caballito in the City of Buenos Aires for cash and
future residential apartments to be constructed by TGLT on the
mentioned land. TGLT plans to construct an apartment building with
parking spaces.The value of the transaction was agreed upon US$12.8
million and consisted on a payment in cash of US$0.2 million
(US$159,375) and the transfer to IRSA: (i) a number of apartments
to be determined representing 23.10% of total square meters of
residential space; (ii) a number of parking spaces to be determined
representing 21.10% of total square meters of parking space; and
(iii) in case TGLT builds complementary storage rooms, a number to
be determined, representing 21.10% of square meters of storage
space. TGLT is committed to build, finish and obtain authorization
for the three buildings making up the project within 36 to 48
months. TGLT mortgaged the land in favor of IRSA as
guarantee.
A neighborhood association named
Asociación Civil y Vecinal
SOS Caballito
secured a preliminary injunction which
suspended the works to be carried out by TGLT in the abovementioned
property. Once said preliminary injunction was deemed final, the
Government of the City of Buenos Aires and TGLT were served notice
of the complaint. At present, the Legislature of the City of Buenos
Aires has received a legislative bill to approve the zoning
parameters corresponding to this property which already has the
consent of the Executive Branch.
Conil –
Avellaneda, Province of Buenos Aires (IRSA CP)
These plots of the Company face Alto
Avellaneda shopping mall, totaling 2,398 sqm distributed in two
opposite corners and according to urban planning standards, around
6,000 sqm may be built. Its intended use, either through an own
development or sale to a third party, is residential with the
possibility of a retail space as well. In November 2014, a barter
deed was executed for the purpose of developing a residential
project and as consideration for it, the Company will receive 1,389
sqm of retail stores located on the ground floors of blocks 99 and
95, at Güemes 836 and Güemes 902, respectively. Delivery
of the consideration for block 95 is expected to take place in
January 2018, and that corresponding to block 99 is scheduled for
September 2018. The barter price was US$0.7 million.
Pereiraola
(Greenville), Hudson – Province of Buenos Aires
In April de 2010 we sold Pereiraola
S.A., a company owner of certain lands adjacent to Abril Club de
Campo that comprised 130 hectares, for US$11.7 million. The
purchaser would develop a project that includes the fractioning
into lots, a condo-hotel, two polo fields, and apartment buildings.
The delivery to the Company of 39,634 square meters of lots
amounting to approximately US$3 million was included in the sale
price. At present the company is marketing its 52
lots.
Canteras Natal
Crespo, La Calera – Province of Córdoba
On June 26, 2013, we sold 100% of
our interest in Canteras Natal Crespo S.A. representing 50% of its
capital stock, to Euromayor S.A. de Inversiones for US$4,215,000
according to the following payment schedule: US$3,815,000 in cash
and US$400,000 through the transfer of almost 40,000 sqm for
business purposes within the project to be developed in the site
known as Laguna Azul. Delivery of the non-monetary consideration is
pending.
Land Reserves and developments properties
Other Land
Reserves – Pilar, Pontevedra, Mariano Acosta, Merlo and San
Luis Plots
We grouped here those plots of land
with a significant surface area the development of which is not
feasible in the short term either due to their current urban and
zoning parameters, their legal status or the lack of consolidation
of their immediate environment. This group totals around 14 million
sqm.
93
Isla
Sirgadero
On September 3, 2015, the entire
property was sold to several companies for US$3.9 million, payable
in 16 quarterly installments, plus an installment in kind, land
resulting from the final blueprint, equivalent to 10% of the
surface area. Delivery of the non-monetary consideration is
pending.
CAPEX
2017
|
|
Developments
|
||
|
|
Greenfields
|
Expansions
|
|
|
|
Polo Dot
(1)
(First
Stage)
|
Catalinas
(2)
|
Alto Palermo
(3)
|
|
Beginning of
Works
|
FY2017
|
FY2017
|
FY2017
|
|
Estimated opening
date
|
FY2019
|
FY2020
|
FY2019
|
|
Total GLA
(sqm)
|
32,000
|
35,468
|
4,000
|
|
Investment amount at
100% (in millions)
|
Ps.1,000
|
Ps.1,600
|
US$28.5
|
|
Work progress
(%)
|
7.4%
|
3.0%
|
0%
|
(1)
Our ownership on the development is through
PAMSA, which owns 80% of it. (subsidiary of IRSA CP).
(2)
55% of the development corresponds to the
Company. 45% corresponds to our subsidiary IRSA CP.
(3)
100% of the development owned by IRSA
CP.
Alto Palermo
Expansion
The expansion project of the Alto
Palermo shopping mall is currently expected to add approximately
4,000 square meters of gross leasable area to the shopping mall and
consists of moving the food court to a third level by using the
area of an adjacent building acquired in 2015. During the fiscal
year 2017, the demolition stage of this expansion was
finished.
First stage of
Polo Dot
The project called “Polo
Dot” located in the commercial complex adjacent to Dot Baires
Shopping, has experienced significant growth since our first
investment in the area. The total project is currently expected to
consist of several office buildings (one of which may include a
hotel) on land reserves owned by us and the expansion of the
shopping mall by approximately 15,000 square meters of gross
leasable area. At a first stage, we intend to develop an office
building with a proposed area of approximately 32,000 square meters
on an existing building, in respect of which we have already
executed lease agreements for approximately 75% of the projected
development. The construction stage of this expansion started in
late 2016, and we expect that the building will become operational
by late 2018. The second stage of the project is currently expected
to include two office/hotel buildings that would add 38,400 square
meters of gross leasable area to the complex. We have seen a
significant demand for premium office spaces in this new commercial
hotspot, and we believe that these buildings have attractive
prospects.
Catalinas
Building
The proposed building to be
developed is currently expected to have approximately 35,000 square
meters of gross leasable area consisting of 30 office floors and
more than 300 parking spaces, and will be located in the
“Catalinas” area in the City of Buenos Aires, one of
the most sought after neighborhoods for premium office development
in Argentina. IRCP acquired from us certain units in the building
representing approximately 45% of the value of the development and
we maintains the remaining 55%. On December 4, 2015, we sold to
Globant S.A. 4,896 square meters corresponding to four office
floors. The price for the acquisition of these units was (i)
Ps.180.3 million paid at signing of the purchase agreement; (ii)
US$8.6 million is payable in 12 quarterly installments that started
in June 2016; and (iii) the US$3.7 million balance is due when the
property deed is transferred to us. Construction work started in
late 2016, and is currently expected to be completed in
approximately 3 years. As of June 30, 2017, we had completed 3.0%
of the construction work.
94
Future
Developments
Mixed
Use
Ex UOM –
Luján, Province of Buenos Aires (IRSA CP)
This 116-hectare plot of land is
located in the 62 Km of the West Highway, in the intersection with
Route 5 and was originally purchased by Cresud on May 31, 2008 from
Birafriends S.A. for US$3 million. In May 2012, the Company
acquired the property through a purchase and sale agreement entered
into between related parties, thus becoming the current owner. Our
intention is to carry out a mixed-use project, taking advantage of
the environment consolidation and the strategic location of the
plot. At present, dealings are being carried out so as to change
the zoning parameters, thus enabling the consummation of the
project.
Ex Nobleza
Piccardo Plant – San Martín, Province of Buenos Aires
(IRSA CP)
On March 31, 2011, Quality
Invest and Nobleza Piccardo S.A.I.C. y F., or “Nobleza
Piccardo,” executed the title deed for the purchase of a plot
of land extending over 160,000 square meters located in the
District of San Martín, Province of Buenos Aires, currently
intended for industrial purposes and suitable in terms of
characteristics and scale for mixed-use developments. The price for
the property was US$33 million.
Simultaneously with execution of the
title deed, the parties entered into a lease agreement whereby
Nobleza leased the whole property for a term of up to
36 months from May 2011. This lease agreement contained a
clause providing for partial return of the property from month
eight to month 14 from the date of execution. Prior to expiration,
an extension was executed for two to six months due to expire in
December 2012, and Quality Invest obtained usufruct rights to more
than half the plot of land. The return of the remaining area set
forth in the agreement and due to occur in May 2014 was further
extended until December 31, 2014. On March 2, 2015, a
certificate was executed by Nobleza and Quality Invest for full
return of the property, and the contract relationship between the
parties came to an end.
On May 16, 2012, the
Municipality of San Martín granted a pre-feasibility permit
for commercial use, entertainment, events, offices, etc., which
would enable performance of a mixed-use development
thereon.
Pursuant to an Ordinance enacted on
December 30, 2014, a process was initiated to obtain a
rezoning permit for the plot of land to be used mainly for
commercial purposes, which considerably expands the uses and
potential buildable square meters through new urban indicators. On
January 5, 2016, a Provincial Decree was published in the
Official Gazette of the Province of Buenos Aires granting its
approval, and the new urban and rezoning standards thus became
effective.
As approved in the Ordinance, on
January 20, 2015, Quality Invest entered into a zoning
agreement with the Municipality of San Martín which governs
various issues related to applicable regulations and provides for a
mandatory assignment of square meters in exchange for monetary
contributions subject to fulfillment of certain administrative
milestones of the rezoning process, the first of which (for Ps.20
million) was paid to the Municipality ten days after the execution
of the aforementioned agreement.
Moreover, on June 27, 2016, the
plot subdivision plan was filed with the Municipality, in
compliance with another significant milestone agreed under the
zoning agreement.
Currently we are working in a draft
project for the development of a thematic Shopping Mall
conceptualized as “Home Hipercenter” to be constructed
in the existing main warehouse. The project will involve 50,000
sqm, divided into 30,000 sqm for the Shopping Mall and 20,000 sqm
for parking.
Also, we are working jointly with an
urban development firm in a comprehensive master plan to design the
remaining areas of the facility. At present, the facility has a
construction capacity of over 500,000 sqm that may be used for
different commercial purposes as well as to build residential
properties.
Concerning the legal framework for
the development and operation of the Shopping Mall and the
remaining segments, an addendum to the original Agreement was
already executed is being negotiated with the Municipality of San
Martín aimed at ensuringhaving ensured certain rights in favor
of Quality Invest that will be essential for the consummation of
the development.
95
Solares de Santa
María – City of Buenos Aires
Solares de Santa María is a
70-hectare property facing the Río de la Plata in the south of
Puerto Madero, 10 minutes from downtown Buenos Aires. We are owners
of this property in which we intend to develop an entrepreneurship
for mixed purposes, i.e. our development project involves
residential complexes as well as offices, stores, hotels, sports
and sailing clubs, services areas with schools, supermarkets and
parking lots.
In the year 2000, we filed a master
plan for the Santa María del Plata site, which was assessed by
the Environmental Urban Plan Council (
Consejo del Plan Urbano Ambiental,
“COPUA”
) and submitted to the Town
Treasurer’s Office for its consideration. In 2002, the
Government of the City of Buenos Aires issued a notice of public
hearing and in July 2006, the COPUA made some recommendations about
the project, and in response to the recommendations made by COPUA
to the project on December 13, 2006, we filed an amendment to the
project to adjust it to the recommendations made by COPUA, making
material amendments to our development plan for the area, which
amendments included the donation of 50% of the site to the City of
Buenos Aires for public use and convenience and a perimetrical
pedestrian lane along the entire site on the river
bank.
In March 2007, a committee of the
Government of the City of Buenos Aires, composed of representatives
from the Legislative and Executive Branches issued a report stating
that such Committee had no objections to our development plan and
requested that the Town Treasurer’s Office render a decision
concerning the scope of the development plan submitted for the
project. In November 2007, 15 years after the Legislative Branch of
the City of Buenos Aires granted the general zoning standards for
the site, the Government Chief of the City of Buenos Aires executed
Decree No. 1584/07, which passed the specific ruling, set forth
certain rules for the urban development of the project, including
types of permitted constructions and the obligation to assign
certain spaces for public use and convenience.
Notwithstanding the approval of
Decree No. 1584/07 in 2007, several municipal approvals are still
pending and in December 2007, a municipal court rendered a decision
restricting the implementation of our proposed development plan,
due to objections made by a legislator of the City of Buenos Aires,
alleging the suspension of Decree No. 1584/07, and each
construction project and/or the municipal permits granted for
business purposes. Notwithstanding the legality and validity of
Decree No. 1584/07, we entered into an agreement 5/10 that was
executed with the Government of the City of Buenos Aires, which has
been sent with a legislative bill to the Legislature of the City of
Buenos Aires under number 976-J-2010, for approval.
On October 30, 2012 a new agreement
was executed with the Government of the City of Buenos Aires,
replacing all those already executed, whereby new obligations were
agreed upon between the parties for the consummation of the
project. To that end, such Agreement, as well as the previous ones,
shall be countersigned and approved by the Legislative Branch of
the City of Buenos Aires by enacting a bill that is attached to the
project. The docket containing the Bill of Law was reserved and is
pending such legislative treatment. The Agreement provided that if
by February 28, 2014 the Bill of Law was not enacted, it would
become invalidated -current status to date.
During 2016, a new Agreement was
executed with the Executive Branch of the City of Buenos Aires,
including a new Bill of Law. The new Bill of Law was submitted to
the Legislative Branch of the City of Buenos Aires for
consideration and was approved by the relevant commissions; yet, it
was reserved as it had happened in 2012, and its legislative
treatment is still pending. The new Bill of Law may remain in such
status during legislative year 2017.
In order to ensure the enactment of
the desired law, treatment of the previous bill must be resumed or
a new Agreement including a Bill of Law must be executed with the
executive branch of the Government of the City of Buenos Aires, and
subsequently ratified through the enactment of a Law by the
Legislature of the Government of the City of Buenos
Aires.
Puerto Retiro
– City of Buenos Aires
During fiscal year 1998, the Company
initiated negotiations with the authorities of the Government of
the City of Buenos Aires in order to obtain a rezoning permit for
the property, allowing a change in the use of the property and
setting forth new regulations for its development.
96
At present, this 8.3 hectare plot of
land, which is located in one of the most privileged areas of the
city, near Catalinas, Puerto Madero and Retiro and is the only
privately owned waterfront property facing directly Río de la
Plata, is affected by a zoning regulation defined as
U.P.
which prevents the property from
being used for any purposes other than strictly port
activities.
Under the records of the proceedings
for the extension of bankruptcy, Puerto Retiro requested
authorization to execute both leases with the companies Los
Cipreses S.A. and Flight Express S.A. for certain areas of the
property acquired for a term of five years each. While
authorization was granted by the lower court, the Court of Appeals
in Commercial Matters reversed such decision upon request of the
National Government and the receiver of Indarsa. Puerto Retiro
filed an extraordinary appeal that was denied.
The Company was involved in a
judicial action brought by the National Government, to which this
Board of Directors is totally alien. The Management and the legal
counsel to the Company believe that there are sufficient legal and
technical arguments to consider that the petition for extension of
the bankruptcy case will be dismissed by the court. However, in
view of the current status of the action, its result cannot be
predicted.
In turn, Tandanor filed a civil
action against Puerto Retiro and the other defendants in the
criminal case for violation of Section 174 (5) based on Section 173
(7) of the Criminal Code. Such action seeks -on the basis of the
nullity of the decree that approved the bidding process involving
the Dársena Norte property- the restitution of the property
and a reimbursement in favor of Tandanor for all such amounts it
has allegedly lost as a result of a suspected fraudulent
transaction involving the sale of the property. In the criminal
action, the claimant reported the violation by Puerto Retiro of the
injunction ordered by the criminal court consisting in an order to
stay (
prohibición de
innovar
) and not to contract with respect to the property
disputed in the civil action. As a result of such report, the
Federal Court (
Tribunal Oral
Federal
) No. 5 started interlocutory proceedings, and on
June 8, 2017, it ordered and carried out the closing of the
property that was subject to the above mentioned lease agreements
with Los Cipreses S.A. and Flight Express S.A. with the aim of
enforcing the referred order. As a result, the proceedings were
forwarded to the Criminal Court for it to appoint the court that
will investigate the alleged commission of the crime of
contempt.
Our legal counsel considers that
there is a chance of success of the defense of Puerto Retiro,
always taking into account that this is a complex issue subject to
more than one interpretation by legal scholars and case
law.
Residential
Coto Residential
Project (IRSA CP)
The Company owns approximately 23,000 sqm in
air space over the top of the Coto hypermarket that is close to the
Abasto Shopping Mall in the heart of the City of Buenos Aires. The
Company and Coto Centro Integral de Comercialización S.A.
(“Coto”) executed and delivered a deed dated September
24, 1997 whereby the Company acquired the rights to receive parking
units and the rights to build on top of the premises located in the
block formed by the streets Agüero, Lavalle, Guardia Vieja and
Gallo, in the Abasto neighborhood.
In June 2016, a preliminary barter
agreement was signed, subject to certain conditions, for a term of
one year, at the end of which the deed will be signed. The project
will be a residential development and, as consideration, the
Company will receive 3,621 square meters in apartments plus a
monetary payment of US$1 million. The consideration for Torre I
will be delivered by June 2021, while the consideration for Torre
II will be delivered by September 2022. The value of the barter was
set at US$7.5 million.
Córdoba
Shopping Mall Project (IRSA CP)
The Company owns a few plots
adjacent to Córdoba Shopping Mall with a construction capacity
of approximately 17,300 square meters in the center of the City of
Córdoba.
97
In May 2016, a preliminary Barter
Agreement was signed for 13,500 square meters out of the total
construction capacity, subject to certain conditions, for a term of
one year, at the end of which the deed will be signed. It will be a
mixed residential and office project and, as part of the
consideration, the Company will receive 2,160 square meters in
apartments, parking spaces, plus the management of permits,
unifications and subdivisions in 3 plots. The consideration will be
delivered by May 2021 for Torre I and by July 2023 for Torre II.
The value of the barter was US$4 million.
Neuquén
Residential parcels– Neuquén, Province of Neuquén
(IRSA CP)
Through Shopping Neuquén S.A.,
we own a plot of 13,000 sqm and a construction capacity per FOT of
18,000 sqm of residential properties in an area with significant
potential. This area is located close to the recently inaugurated
shopping mall, the hypermarket recently opened and a hotel to be
constructed in months to come.
Zetol S.A. and
Vista al Muelle S.A. – District of Canelones –
Uruguay
In the course
of fiscal year 2009 we acquired a 100% ownership interest in Liveck
S.A., a company organized under the laws of Uruguay. In June 2009,
Liveck had acquired a 90% stake in the capital stock of Vista al
Muelle S.A. and Zetol S.A., two companies incorporated under the
laws of Uruguay, for
US$7.8 million. The remaining
10% ownership interest in both companies is in the hands of Banzey
S.A. These companies have undeveloped lands in Canelones, Uruguay,
close to the capital city of Uruguay, Montevideo.
We intend to carry out an urban
project consisting in the development and commercialization of 13
apartment buildings. Such project has the “urban
feasibility” status for the construction of approximately
200,000 sqm for a term of 10 years, which was granted by the
Mayor’s Office of the Canelones department and by its Local
Legislature. Zetol S.A. and Vista al Muelle S.A. agreed to carry
out the infrastructure works for US$8 million as well as minimum
amount of sqm of properties. The satisfaction of this commitment
under the terms and conditions agreed upon will grant an additional
10-year effective term to the urban feasibility
status.
The total
purchase price for Zetol S.A. was
US$7 million; of
which US$2 million were paid. Sellers may opt to receive the
balance in cash or through the delivery of units in the buildings
to be constructed in the land owned by Zetol S.A. equivalent to 12%
of the total marketable meters to be constructed.
Besides, Vista
al Muelle S.A. owned since September 2008 a plot of land purchased
for
US$0.83 million. Then, in February 2010, plots of
land were acquired for US$1 million, the balance of which as of to
date amounts to US$0.28 million plus interest and will be repaid in
December 2014. In December 2010, Vista al Muelle S.A. executed the
title deed of other plots for a total amount of US$2.66 million, of
which US$0.3 million were paid. The balance will be repaid by
delivering 2,334 sqm of units and/or retail stores to be
constructed or in cash.
On June 30, 2009, the Company sold a
50% stake in Liveck S.A. to Cyrela Brazil Realty S.A. for US$1.3
million. On December 17, 2010, together with Cyrela Brazil Realty
S.A. we executed a stock purchase agreement pursuant to which we
repurchased from Cyrela Brazil Realty S.A. a 50% shareholding in
Liveck S.A. for US$2.7 million. Accordingly, as of June 30, 2016,
our stake, through Tyrus, in Liveck is 100%.
As a result of the plot barter agreements
executed in due time between the IMC, Zetol S.A. and Vista al
Muelle S.A. in March 2014, the parcel redistribution dealing was
concluded. This milestone, as set forth in the amendment to the
Master Agreement executed in 2013, initiates the 10-year term for
the investment in infrastructure and construction of the buildings
mentioned above. At present, the urban project and the design of
the first tower are being developed.
98
Retail
Caballito Plot
– City of Buenos Aires (IRSA CP)
This is a property of approximately
23,791 square meters in the City of Buenos Aires, in the
neighborhood of Caballito, one of the most densely populated of the
city, which we purchased in November 1997. This plot would allow
developing a shopping mall having 30,000 square meters, including a
hypermarket, a cinema complex, and several recreation and
entertainment activity areas. As of the date of this annual report
construction permits are still pending and the legislature of the
City of Buenos Aires hasd received in 2016 a legislative bill to
approve the zoning parameters corresponding to this property which
hasd been approved by the Executive Branch on the same year,
currently the bill´s draft´s status at the Legislature is
pending.
Dot Adjoining
Plot – City of Buenos Aires (IRSA CP)
On May 3, 2012,
the Government of the City of Buenos Aires, through the General
Office of Zoning Interpretation (
Dirección General de Interpretación
Urban’stica
) approved, through a pre-feasibility
study, the parcel subdivision of the ex-Philips plot contingent
upon the observance of the applicable building regulations in each
of the resulting parcels. In addition, all the uses and parameters
established under the municipal ordinance previously issued by the
above mentioned authority are being observed.
On June 3, 2013, we were given
notice that the Government of the City of Buenos Aires had approved
the requested parcel subdivision of the ex-Philips plot. As a
result, the property was divided into three parcels: 2 parcels of
approximately 6,400 sqm and a parcel adjoining DOT Baires Shopping,
where at present the first stage of the Polo Dot is being
developed.
Offices
Philips
Adjoining Plots 1 and 2 – City of Buenos Aires (IRSA
CP)
These two parcels of 6,400 sqm with
construction capacity of 19,200 sqm each, are at present a
significant land reserve jointly with a plot where the extension of
Dot Baires Shopping is planned. As a result of major developments,
the intersection of Av. General Paz and the Panamerican Highway has
experienced a significant growth in recent years. The project of
these parcels will conclude the consolidation of this
area.
Intercontinental Plaza II Plot -
City of Buenos Aires (IRSA CP)
The
Intercontinental Plaza
complex is
located in the heart of the Monserrat district, situated a few
meters away from the most important avenue in the city and the
financial district. It comprises an office tower and the exclusive
Intercontinental Hotel. In the 6,135 square meter plot, it would be
feasible to develop a second office tower, including 19,600 square
meters and 25 floors, that would supplement the one already erected
in the intersection of Moreno and Tacuarí
streets.
Disposals of Investment Properties in Fiscal Year 2017
Sale of units in Intercontinental Building
IRSA
Propiedades Comerciales sold 2,693 leasable square meters
corresponding to three office floors and 24 parking units of
Intercontinental Plaza building, with the remaining 3,876 sqm in
such building being held by the company. The transaction amount was
US$9 million, and has been fully collected as of June 30,
2017.
Partial sales of
“Maipú 1300” building
In May 2017, 550 sqm were sold
corresponding to the ground-floor store and the 23
rd
floor in the
Maipú 1300 building, with the remaining 1,235 sqm being held
by the company. The transaction amount was agreed upon in US$0.75
million for the ground-floor store and US$1.4 million for the 23th
Floor.
Sale of
Rivadavia 2768 building
In May 2017, the remaining footage
of Rivadavia 2768 building was sold. The transaction amount was
US$0.2 million.
99
International
Lipstick
Building, New York, United States
The Lipstick Building is a landmark
building in the City of New York, located at Third Avenue and
53
th
Street in Midtown Manhattan, New York. It was designed by
architects John Burgee and Philip Johnson (Glass House and Seagram
Building, among other renowned works) and it is named after its
elliptical shape and red façade. Its gross leaseable area is
approximately 58,000 sqm and consists of 34 floors.
As of June 30, 2017, the
building’s occupancy rate was 95.15%, thus generating an
average rent of US$69.20 per sqm.
|
|
As of June
30,
|
|
|
|
Lipstick
|
2016
|
2017
|
YoY
Var
|
|
Gross Leaseable Area
(sqm)
|
58,094
|
58,094
|
-
|
|
Occupancy
|
97.33
%
|
95.15
%
|
2.18 p.p.
|
|
Rental price
(US$/sqm)
|
66.67
|
69.20
|
3.79
%
|
Since June 2016, various leases have
been renewed, equivalent to 4,995 sqm in aggregate (53,763 sf) with
an average rent of US$84 per sqm. In the same period, the entire
floor 28 was occupied, with an average rent of US$87 per sqm, for a
term of 11 years. The difference in the occupancy rate is explained
by the release of floor 27 and floor 31.
Moreover, we successfully completed
the building’s certification process and obtained the LEED
EB: O&M Gold certification. The implementation of this project
started in July 2015, and it has concluded with a certification
that endorses the best environmental practices, transforming the
building’s operational standards.
Finally, in the southern wing of the
lobby there is an exhibition since September 2014 showcasing part
of the work and life of the celebrated Argentine architect
César Pelli. The exhibition has been conceived, designed and
executed in close cooperation with César Pelli’s
architectural firm.
On
October 23, 2017, we communicated the extension of the term of
the
non-recourse debt to IRSA
of Metropolitan, owner of the Lipstick Building in Manhattan,
indirectly controlled by us in 49.9% for an amount of US$113.1
million.
For more
information, please see “Recent developments -
Metropolitan’s debt refinancing.”
Investment in
Condor Hospitality Trust
We maintain our investment in the
Condor Hospitality Trust Hotel REIT (NASDAQ: CDOR) mainly through
our subsidiary Real Estate Strategies L.P. (“RES”), in
which we hold a 66.3% interest. Condor is a REIT listed in Nasdaq
focused on medium-class hotels located in various states of the
United States of America, managed by various operators and
franchises.
In January 2017, Condor issued
150,540 new warrants in favor of RES, which are entitled to one
share each, at an exercise price of US$0.001 per share and due in
January 2019. The new warrants replaced the former 3,750,000
warrants which entitled their holders to one share each, at an
exercise price of US$1.92 and due on January 31, 2017. In addition,
the Company exercised its conversion rights in respect of the
3,245,156 Series D preferred shares (with a par value of US$10
each) held by RES, into 20,282,225 common shares of Condor (with a
par value of US$0.01 per share), at the agreed conversion price of
US$1.60 per share, accounting for US$32.4 million in the aggregate.
At the same time, the Company received 487,738 Series E preferred
shares that are convertible into common shares at US$2.13 each as
from February 28, 2019, paying dividends on a quarterly basis at
6.25% per year.
100
Also in February, Condor’s
Board of Directors approved a one-for-6.5 reverse stock split,
which was carried out after the close of trading on March 15, 2017.
The par value of the shares involved in the reverse stock split
remained at US$0.01 each, with the conversion price of Series E
preferred shares standing at US$13.845 and the exercise price of
the warrants, at US$0.0065.
Subsequently, in March, Condor
conducted an initial public offering pursuant to which it issued
4,772,500 new shares (including 622,500 additional shares for the
exercise of a call option granted to subscribers) at a price of
US$10.50 per share. The Company did not participate in the
offering.
As a consequence of the
aforementioned events, as of June 30, 2017, the Company held
3,314,453 common shares of Condor’s capital stock, accounting
for approximately 28.5% of that company’s capital stock and
votes. The Company also held 487,738 Series E preferred shares,
23,160 warrants and a promissory note convertible into 97,269
common shares (at a price of US$10.4 each).
Financial Operations and Others
Our interest in
Banco Hipotecario
As of June 30, 2017, we held a
29.91% interest in Banco Hipotecario. Established in 1886 by the
argentine government and privatized in 1999, Banco Hipotecario has
historically been Argentina’s leading mortgage lender,
provider of mortgage-related insurance and mortgage loan services.
All of its operations are located in Argentina where it operates a
nationwide network of 65 branches in the 23 Argentine provinces and
the City of Buenos Aires, and 15 additional sales offices
throughout Argentina. Additionally, its subsidiary Tarshop S.A. has
24 sales offices.
Banco Hipotecario is an inclusive
commercial bank that provides universal banking services, offering
a wide variety of banking products and activities, including a wide
range of individual and corporate loans, deposits, credit and debit
cards and related financial services to individuals, small-and
medium-sized companies and large corporations. As of April 30,
2017, Banco Hipotecario ranked thirteenth in the Argentine
financial system in terms of shareholders’ equity and
fifteenth in terms of total assets. As of June 30, 2017, Banco
Hipotecario’s shareholders’ equity was Ps.6,681.2
million, its consolidated assets were Ps.55,261.9 million, and its
net income for the twelve-month period ended June 30, 2017 was
Ps.865.0 million. Since 1999, Banco Hipotecario’s shares have
been listed on the Buenos Aires Stock Exchange in Argentina, and
since 2006 it has had a Level I ADR program.
Banco Hipotecario continues its
business strategy of diversifying its loan portfolio. As a result,
non-mortgage loans increased from Ps.14,845.9 million as of
December 31, 2014 to Ps.17,944.7 million as of December 31, 2015,
from Ps.24,305.4 million as of December 31, 2016 to Ps.28,147.3
million as of June 30, 2017, increasing the interest in the
aggregate loan portfolio to the non-financial private sector
(without considering mortgage loans) from 84.1% as of December 31,
2014 to 89.9% as of June 30, 2017. Non-performing loans represented
2.9% of its total portfolio as of June 30, 2017.
Furthermore, Banco Hipotecario has
diversified its funding sources, by developing its presence in the
local and international capital markets and increasing its deposit
base. Its financial debt represented 49.4% of the total financing
as of June 30, 2017.
Its subsidiaries include BACS, a
bank specialized in investment banking, assets securitization and
asset management, BHN Vida S.A., a life insurance company, BHN
Seguros Generales S.A., a homeowners’ insurance company and
Tarshop S.A., a company focused on selling consumer finance
products and making cash advances to unbanked clients.
101
Operations Center in
Israel
Investment in IDB
Development Corporation
Acquisition of
Control of IDBD
On May 7, 2014, the Company, acting
indirectly through Dolphin, acquired, jointly with E.T.H.M.B.M.
Extra Holdings Ltd. (“ETH,” company incorporated under
the laws of the State of Israel) controlled by Mordechay Ben
Moshé, entered into a transaction to acquire an aggregate of
106.6 million common shares in IDBD representing 53.30% of its
stock capital, in the context of a debt restructuring transaction
related to IDBD’s holding company, IDBH. Under the terms of
the agreement, Dolphin and ETH executed a Shareholders’
Agreement and Dolphin and ETH each acquired a 50% interest in IDBD.
The initial amount invested by each Company was NIS 950 million,
equivalent to approximately US$272 million at the exchange rate
prevailing on that date. On October 11, 2015, IFISA (a company
indirectly controlled by Eduardo S. Elsztain) acquired ETH, and the
directors appointed by ETH in IDBD tendered their irrevocable
resignation from the Board of Directors and Dolphin became entitled
to appoint new board members. Since that date, we started to
consolidate IDBD into our results of operations. As of the date of
this annual report, the investment made from IRSA in IDBD is US$515
million, and IRSA’s indirect equity interest reached 68.3% of
IDBD’s undiluted stock capital. For additional information
please see “
Significant
acquisitions, dispositions and development of
business
.”
Tender
Offers
On March 31, 2016, Dolphin satisfied
its commitments under the amendment to the debt restructuring
agreement of IDBD’s controlling company, IDBH, with its
creditors (the “Arrangement”). Such amendment was
approved by 95% of IDBD’s minority shareholders on March 2,
2016 and by the competent court on March 10, 2016. As a result, as
of March 3, 2016: (i) Dolphin purchased all the shares held by
IDBD’s minority shareholders; (ii) all the warrants held by
IDBD’s minority shareholders expired; and (iii) Dolphin made
additional contributions to IDBD in the form of a subordinated
loan, as described below.
The price paid for each IDBD share
to holders of record as of March 29, 2016 was: (i) NIS 1.25 million
in cash, resulting in a total payment of NIS 159.6 million (US$42.2
million); (ii) NIS 1.20 per share through the subscription and
delivery of IDBD’s Series I bonds (“IDBD Bonds”)
that was paid by Dolphin at par; therefore, it subscribed bonds for
NIS 166.5 million, including the payments due to warrant holders;
and (iii) the commitment to pay NIS 1.05 million (subject to
adjustment) in cash if Dolphin receives authorization to assume
control of Clal Insurance Company Ltd. and Clal Insurance Business
Holdings Ltd. or IDBD sells its interest in Clal for a sale price
per Clal share in excess of 75% of its book value Dolphin being
would be required to pay approximately NIS 155.8 million
(approximately US$40.8 million) in aggregate.
Any warrants held by minority
shareholders that were not exercised as of March 28, 2016, would be
convertible at a price equal to the difference (if positive)
between NIS 2.45 and the warrant exercise price, and payable in
IDBD Bonds. In addition, Dolphin made a capital contribution of NIS
348.4 million into IDBD, in exchange for a subordinated loan,
convertible into shares.
As security for payment of each cash
due to Clal shareholders, on March 31, 2016, Dolphin granted a
pledge over 28% of the stock capital in IDBD it owns and its rights
under a NIS 210 million subordinated loan made on December 1, 2015
due from IDBD. If IDBD issues new shares, additional shares shall
be pledged until reaching 28% of IDBD’s total stock
capital.
Dolphin has committed to abstain
from exercising its right to convert the subordinated loan into
IDBD shares until the above mentioned pledge is released. However,
if the pledge is enforced, the representatives of IDBH’s
creditors will be entitled to convert the subordinated debt into
IDBD shares, up to a maximum of 35% of all IDBD shares
outstanding.
102
On April 3, 2016, IDBD’s
shares were delisted from the TASE and all the minority warrants
were cancelled. IDBD continues to be listed on TASE as a
“Debentures Company” pursuant to Israeli law, as it has
bonds listed on such exchange.
In March 2016, after the receipt of
approval from the shareholders’ meeting and the warrant
holders of IDBD, and approval of the Court, the Debt Settlement in
IDBH was amended with respect to the undertaking to perform tender
offers for shares of IDBD (the “Amendment To The
Settlement”). The Amendment To The Settlement included
provisions according to which Dolphin acquired from the minority
shareholders all of the shares of IDBD, in a manner whereby the
control group began holding 100% of the shares of IDBD, which
became a debenture company (as defined in the Companies Law). The
consideration to the minority shareholders for the acquired shares,
and the cancellation of the undertaking to perform the
aforementioned tender offers, included: (a) payment, on March 31,
2016, in cash, of NIS 1.25 per share; (b) payment, on March 31,
2016, of NIS 1.20 per share, which was paid through debentures
(Series I), in an amount which was determined based on their
adjusted par value, and which were issued by IDBD against the
transfer by Dolphin to IDBD of an amount equal to the adjusted par
value of each debenture which was issued, as stated above; and (c)
an undertaking to pay a total of NIS 1.05 per share, contingent
upon the sale of shares of Clal or upon the receipt of a permit for
control of Clal, in accordance with the conditions which were
determined in the Amendment To The Settlement. Within the framework
of the Amendment To The Settlement, Dolphin injected into IDBD a
total of NIS 515 million (including, inter alia a subordinated loan
in the amount of NIS 15, as stated above, and including the
injection of funds against the allocation of debentures (Series I)
by IDBD, and any amount which was injected into the Company within
the framework of the exercise of the options). On March 15, 2016
and March 31, 2016, a total if NIS 85 million and NIS 248 million,
respectively, was injected into IDBD, by Dolphin, as part of the
implementation of the Amendment To The Settlement, as a
subordinated loan convertible into shares of IDBD. Additionally,
within the framework of the Amendment To The Settlement, all of the
options for shares of IDBD which were held by the public expired,
and the warrant holders of IDBD received payments or rights to
payments in accordance with the alternatives which were determined
in the Amendment To The Settlement. For additional infornation
please see “
Significant
acquisitions, dispositions and development of
business.”
Within the Operations Center in
Israel, the Company operates in the following
segments:
Real
Estate
PBC has extensive activities in the
revenue-generating properties segment in Israel and in the United
States, within the framework of two operating segments which are
reported as separate operating segments of PBC- the yield bearer
property segment in Israel and abroad, and the Residential
construction segment in the in Israel and abroad. Moreover, PBC
deals with the in agriculture, which is not material to IDBD. As of
the reporting date, PBC owns areas intended for rent, in Israel, at
a scope of approximately 1,160,000 square meters
(as compared with approximately
1,110,000 square meters as of December 31, 2015),
revenue-generating properties in the United States - the HSBC Tower
in New York with an area of approximately 80,000 square meters, and
the Tivoli project in Las Vegas, with an area of approximately
31,000 square meters (the share of PBC), as well as land reserves
with associated building rights at a scope of approximately 655,000
square meters, which are intended for the construction of
revenue-generating properties in Israel, most of which include
approved rights in accordance with the relevant zoning plan. The
construction on these lands will be performed in accordance with
demand.
The revenue-generating areas of PBC
in Israel and in the United States are used for various uses, of
which the primary ones are as follows:
●
Areas rented for the use of
offices and high tech industries (“Office and Hi-Tech
Uses”).
The areas of PBC which are leased
for Office and Hi-Tech Uses in Israel are divided into two main
types:
Business parks and office buildings for
hi-tech industries.
PBC has expertise in the provision of
solutions for the special requirements of this industry, and builds
designated buildings which are adjusted to the needs of the
lessees, and also provides management services for those
buildings.
103
Office buildings.
The office buildings
of PBC are located in high demand areas, and most are leased, at
high occupancy rates, to lessees which are mostly large, stable
companies, some international, generally for long lease periods.
Areas for office use are characterized by areas used as parking
lots, which constitute an inseparable part of the buildings. In the
foreign activities of PBC, the main property for office use is the
HSBC Tower on Fifth Avenue in New York.
●
Areas rented for industry,
workshop, logistics and storage uses (“Industry and Logistics
Uses”).
Areas for Industry and Logistics
Uses in Israel are characterized by areas with a large single
space, service yards and large operational areas. In light of the
rent which can be collected for areas of this kind, which is
relatively low, and the fact that their construction generally
requires construction on large areas of land, PBC concentrates, as
do other companies operating in the segment, most of its industrial
areas in periphery areas and in areas located close to airports and
seaports. The turnover rate of lessees in areas for industrial use
is low, and a significant part of the industrial areas of PBC are
leased to lessees who have been using the same areas for many
years.
●
Shopping malls, commercial
centers and recreational areas (“Uses for Commercial and
Recreational Centers”).
PBC’s areas which are leased
to commercial and recreational centers in Israel include commercial
centers, “Power Center” areas, which are located in
central areas or areas near major junctions at highways from major
cities, conference centers and recreational centers. The areas of
PBC which are rented for commercial purposes abroad primarily
include its share in the Tivoli project in Las Vegas.
Associated
services in the revenue-generating properties segment in
Israel.
PBC also provides management and
maintenance services, primarily to lessees in areas which are used
for office and commercial purposes.
Geographical
distribution
PBC divides its properties into two
main regions - Israel and the United States, and five sub-regions:
in Israel - North, Center and South; in the United States -
Northeast and West.
According to the assessment of PBC,
the difference between the regions in Israel is primarily due the
fact that, in Central Israel, rent is significantly higher than the
average rent in Northern and Southern Israel. The common uses in
Central and Northern Israel are offices, hi-tech and commerce,
while in Southern Israel most properties are used for logistics and
industry, as well as commerce.
In the United States, the properties
of PBC are located in various states, with different economic
characteristics. According to the assessment of PBC, the difference
between the regions in the United States is primarily due to the
fact that the average rent in the Northeast United States is
significantly higher than the average rent in Western United
States, primarily due to the different locations and uses (luxury
office and commercial buildings in the Northeastern United States,
as compared with commercial centers in occupancy and positioning
processes in Western United States), as well as the location of the
properties (the centers of large cities such as New York in the
Northeastern United States, as compared with their locations in
residential neighborhoods in the Western United
States).
However, even within each region
(both in Israel and in the United States), there are differences
between the various sites, as well as difference, in some cases,
between the various properties in each site, due to the type of
property, the different designation of each property, the age of
the property, its physical condition, etc.
104
Mix of
lessees
The revenue-generating
properties segment is characterized by a wide variety of customers,
including large and small companies and business customers, as well
as private customers.
PBC engages with its customers
mostly through medium and longer term rental contracts, and in
general, rental contracts in Israel involve unprotected leases, and
rent linked to the consumer price index. The policy of PBC is to
engage, as much as possible, in long term contracts with
high-quality lessees.
The agreements with respect to areas
which are built according to the designated construction method in
Israel are characterized by buildings which are adapted to the
specific requirements of the designated customer. In light of the
relatively significant initial investment in the property, and the
adjustment thereof to the lessee’s specific needs, rental
agreements for buildings of this kind are signed for long periods,
and generally include options for the lessee to extend the lease
period. Additionally, some of the Group’s lessees perform, at
their own expense, works in the areas of the leased properties, and
adapt them to their needs. According to the assessment of PBC,
these investments may lessen the profitability of lessees in
transferring to other areas.
PBC has no major lessee whose rent
paid in 2016 constituted 10% or more of the total income in the
consolidated financial statements of PBC.
105
Presented below is a structural
diagram of the primary holdings of PBC, from the perspective of
IDBD, as of December 31, 2016:
Property &
Building Corporation
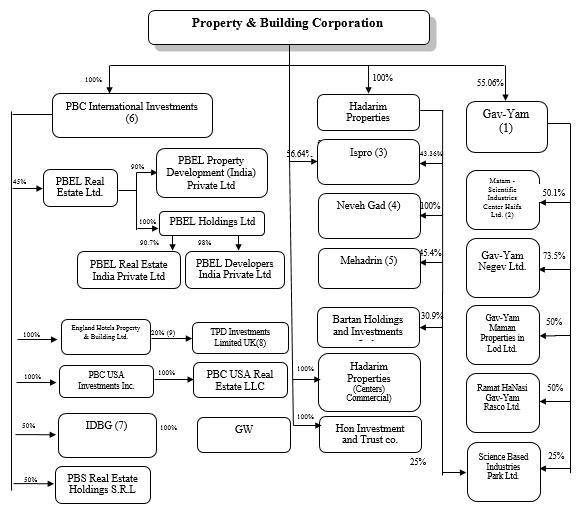
106
(1)
Gav-Yam is a public company whose securities are
listed for trading on the TASE. Most of Gav-Yam’s activities
are in the revenue-generating properties segment, primarily hi-tech
parks, business parks, offices and logistical centers, as well as
construction and marketing, together with a partner, of a
residential neighborhood in Haifa. On December 5, 2016, PBC sold,
to several institutional entities, 14% of the issued share capital
of Gav-Yam, for a gross consideration of approximately NIS 391
million. As a result, the holding rate of PBC in the issued capital
of Gav-Yam decreased to approximately 55.06%. for details, see Note
3(H)(2) to the Financial Statements.
(2)
Matam is the rights holder to revenue-generating
properties in Science Based Industries Park, one of the largest
hi-tech industry parks in Israel, located in the southern suburbs
of the city of Haifa.
(3)
Ispro is a wholly owned company of PBC, whose
activities primarily include revenue-generating properties,
primarily commercial centers and logistical areas.
(4)
Neveh-Gad - a private company wholly owned by
PBC, whose activities are primarily in the residential construction
segment.
(5)
Mehadrin is a public company whose securities
are listed for trading on the TASE. Most of Mehadrin’s
activities are in the agricultural segment. Hadarim Properties and
Phoenix Holdings Ltd. (which holds, through a wholly owned
subsidiary, 41.4% of Mehadrin) are considered to be joint holders,
by virtue of the shareholders agreement between them, of
approximately 86.8% of the voting rights and of the right to
appoint directors in Mehadrin.
(6)
PBC International Investments was incorporated
in Israel for the purpose of operating in the field of
revenue-generating properties and residential construction abroad,
through foreign subsidiaries and associate companies.
(7)
As of proximate to the publication date of the
periodic report of 2016 of IDBD, a wholly owned subsidiary of IDBD
holds the balance of IDBG’s share capital (50%). IDBG holds,
together with additional investors, real estate corporations which
operate in Las Vegas. The real estate corporation GW holds the
rights to a commercial and office areas (which is being built in
stages). Tivoli project (“GW” project) - As of
proximate to the publication date of the report, IDBG holds,
directly and indirectly, the entire share capital and voting rights
of GW. The Tivoli project is a real estate project which is located
near a prestigious neighborhood in Las Vegas, which is intended to
mixed use, primarily including commercial and office areas, as a
unique recreational and shopping center, and which includes three
parts, with a total area of approximately 80 thousand square meters
(the “Commercial Area”).The first part of the Tivoli
project (“Triad A”) is open to the public. Triad A has
an area of 368 thousand square feet (approximately 34 thousand
square meters), which includes approximately 196 thousand square
feet (approximately 18 thousand square meters) of commercial areas,
and approximately 172 thousand square feet (approximately 16
thousand square meters) of office areas. Additionally, the
underground parking lot of the entire commercial area is under
construction. As of the end of 2016, approximately 87% of the
commercial and office areas in Triad A have been rented. Proximate
to the publication date of the report, GW is working to market the
remainder of areas for rent. The construction of the second part of
the Tivoli project (“Triad B”) has concluded, and it
opened to the general public in October 2016. It includes
commercial areas with an area of approximately 155 thousand square
meters (approximately 14 thousand square meters), and office areas
of approximately 149 thousand square feet (approximately 14
thousand square meters). Until now, rental agreements have been
signed in Triad B with an anchor tenant and additional tenants,
with respect to commercial areas of approximately 95 thousand
square feet (approximately 9 thousand square meters), and with
respect to office areas of approximately 52 thousand square feet
(approximately 5 thousand square meters).The third part of the
Tivoli project (“Triad C”) is planned to include
commercial and office areas with an area of approximately 198
thousand square feet (approximately 18 thousand square meters). The
construction of Triad C is in the planning stages, and is scheduled
for implementation in accordance with progress in marketing. It is
also noted that GW has rights for the construction of 300
residential units on land located near the GW project.GW has a loan
from a local bank, the balance of which, as of December 31, 2016,
is approximately US$59 million. The interest with respect to the
aforementioned loan was set as LIBOR plus 5% per year. The
repayment date of the loan was extended by an additional two years
to December 31, 2018. The project is presented in the reports of GW
at fair value, based on a valuation of an external independent
valuer as of June 30, 2016, in the amount of US$295 million. As a
result, IDBD and PBC each recorded an amortization of approximately
NIS 21 million in the second quarter of 2016. Until proximate to
the publication date of the report, the share of PBC in the
investments in GW amounted to a total of approximately US$274
million (including a total of US$212 million with respect to loans
(which bear interest of 15% per year), in accordance with the
memorandum of understanding, and includes a total of US$50 million
of loans, in accordance with the framework agreement.
(8)
TPD Investment Limited (in England) - PBC and
DIC, through England Hotels - Property & Building Ltd. (a
company wholly owned by PBC) (“Property & Building
Hotels”) owns rights (20%) to TPD Investment Limited
(“TPD” or the “English Company”), which
primarily holds two hotels: the Hilton in London, and the Hilton in
Birmingham, as well as the rights associated therewith (including
approximately 1,900 hotel rooms (cumulatively) and conference
halls). The aforementioned hotels are primarily geared to
businesses and the conferences and conventions market, and are
managed by the Hilton chain, in accordance with long term
management agreements (until 2036), with options to extend the
management periods. The overall acquisition cost of the Hilton
London and Hilton Birmingham by TPD amounted to approximately GBP
455 million, including expenses. The acquisition cost was financed
through a bank loan, which was provided by a British bank,
repayable in July 2014, with no right of recourse, in the total
amount of approximately GBP 395 million. The balance of the
acquisition amount, as stated above, in the amount of approximately
GBP 60 million, was financed from equity, where the share of PBC in
equity amounted to a total of approximately GBP 16.6 million, which
was given as a shareholder’s loan, and which bears annual
interest of 6%. In March 2014, the English partner (the
“English Partner”) in the English Company announced
that refinancing had been performed, in which the English Partner
announced, inter alia, to PBC, that it has the option to maintain
its holdings (20%) through the provision of a shareholder’s
loan in the amount of GBP 5 million, and conversion of the previous
shareholder’s loan in the amount of GBP 5.6 million to
capital, or alternatively, to have its holding rate diluted to
6.39%, and also stated, in its announcement, that the dilution had
been effectively implemented. After the failure of the negotiations
which were conducted between PBC and the additional partner with
the English Partner, PBC filed, together with the additional
partner, in April 2014, a claim with the Court in London, demanding
that the English Partner acquire their holdings in TPD, in
accordance with their market value, as will be determined by the
Court, as well as additional conventional remedies in accordance
with English law (the “Claim”). On March 3, 2015, the
English Partner and TPD filed a motion for the receipt of an
injunction against PBC and the additional partner, according to
which PBC and the additional partner would refrain from performing
any action in connection with the sale of the hotels, and for the
receipt of damages in the amount of over GBP 100 thousand (the
“Counterclaim”). PBC and the additional partner reject
the assertions raised in the aforementioned motion, in all
respects. In August 2015, PBC, the additional partner and their
corporate officers received a statement of claim from the English
Partner and from TPD, in which damages were claimed which were
allegedly incurred by TPD and the English Partner, in an amount
which will not fall below GBP 88.5 million (the “Statement Of
Claim”). PBC rejected the statement of claim in all respects.
The hearing of the Claim commenced in the Court in London at the
end of June 2016, continued in January 2017, and concluded in
February 2017. A ruling has not yet been given.
(9)
As described below, PBC filed a claim against
the dilution of its holdings to 6.39
107
The following are the main Rental
Properties and Properties under development of PBC as of June 30,
2017:
|
|
|
Initial
costs
|
Subsequent
costs
|
Costs at
end of the year
|
|
|
|
|
|
|||
|
Name
|
Encumbrances
|
Plot of
land
|
Buildings,
facilities and improvements
|
Improvements
/ Additions
|
Plot of
land
|
Buildings,
facilities and improvements
|
Total
|
Capitalized
costs, net
|
Fair
value adjustments
|
Fair
Value at the end of the year
|
Date of
construction
|
Date of
acquisition
|
|
Rental
properties
|
|
|
|
|
|
|
|
|
|
|
|
|
|
Tivoli
|
-
|
150
|
1,881
|
2,564
|
267
|
4,328
|
4,595
|
-
|
(588
)
|
4,007
|
Apr-11
|
oct-15
|
|
Kiryat Ono
Mall
|
-
|
392
|
731
|
1,180
|
763
|
1,540
|
2,303
|
-
|
(4
)
|
2,299
|
nov-07
|
oct-15
|
|
Shopping Center
Modi’in A
|
Mortgage
|
223
|
289
|
510
|
434
|
588
|
1,022
|
-
|
4
|
1,026
|
Aug-05
|
oct-15
|
|
HSBC
|
Mortgage
|
5,753
|
2,136
|
6,587
|
11,190
|
3,286
|
14,476
|
-
|
830
|
15,306
|
1927-1984
|
oct-15
|
|
Matam park -
Haifa
|
Mortgage
|
576
|
2,913
|
3,576
|
1,121
|
5,944
|
7,065
|
-
|
56
|
7,121
|
1979-2015
|
oct-15
|
|
Herzeliya
North
|
-
|
944
|
1,403
|
2,524
|
1,836
|
3,035
|
4,871
|
-
|
(30
)
|
4,841
|
1996-2015
|
oct-15
|
|
Gav-Yam Center -
Herzeliya
|
Mortgage
|
748
|
817
|
1,518
|
1,455
|
1,628
|
3,083
|
-
|
60
|
3,143
|
1997-2006
|
oct-15
|
|
Neyar Hadera
Modi’in
|
-
|
186
|
272
|
550
|
363
|
645
|
1,008
|
-
|
(11
)
|
997
|
jun-05
|
oct-15
|
|
Gav yam park - Beer
Sheva
|
Mortgage
|
34
|
402
|
455
|
67
|
824
|
891
|
-
|
30
|
921
|
jul-05
|
oct-15
|
|
Haifa Bay
|
-
|
123
|
235
|
351
|
238
|
471
|
709
|
-
|
11
|
720
|
jun-05
|
oct-15
|
|
Others PBC
|
Mortgage
|
1,790
|
2,052
|
4,523
|
3,482
|
4,833
|
8,365
|
-
|
305
|
8,67
0
|
|
|
|
Ispro planet -BeerSheva
-Phase1
|
-
|
154
|
294
|
973
|
300
|
1,121
|
1,421
|
-
|
-
|
1,421
|
jun-05
|
oct-15
|
|
SHARON
|
Mortgage
|
329
|
319
|
660
|
639
|
669
|
1,308
|
-
|
56
|
1,364
|
jun-05
|
oct-15
|
|
MERKAZ
|
-
|
110
|
81
|
280
|
215
|
256
|
471
|
-
|
(4
)
|
467
|
Jan-69
|
oct-15
|
|
ZAFON
|
-
|
12
|
10
|
76
|
24
|
74
|
98
|
-
|
26
|
124
|
|
|
|
Mizpe Sapir
|
-
|
59
|
22
|
79
|
114
|
46
|
160
|
-
|
7
|
167
|
|
|
|
Others
|
-
|
172
|
498
|
951
|
334
|
1,287
|
1,621
|
-
|
119
|
1,740
|
n/a
|
oct-15
|
|
Total
Rental properties
|
|
11,755
|
14,355
|
27,357
|
23,611
|
29,611
|
53,467
|
-
|
867
|
54,334
|
|
|
|
Undeveloped
parcels of land
|
|
|
|
|
|
|
|
|
|
|
|
|
|
Tivoli
|
-
|
498
|
-
|
318
|
816
|
-
|
816
|
-
|
(320
)
|
496
|
Apr-11
|
oct-15
|
|
Others
|
-
|
1,113
|
5
|
1,156
|
2,166
|
108
|
2,274
|
-
|
168
|
2,442
|
n/a
|
oct-15
|
|
Total
Undeveloped parcels of land
|
|
1,611
|
5
|
1,474
|
2,838
|
108
|
3,090
|
-
|
(152
)
|
2,938
|
|
|
|
Total
|
|
13,366
|
14,360
|
28,831
|
26,449
|
29,763
|
56,557
|
-
|
715
|
57,272
|
|
|
|
Tivoli
|
-
|
32
|
456
|
434
|
62
|
860
|
922
|
-
|
(555)
|
367
|
in
progress
|
oct-15
|
|
Ispro Planet – Beer
Sheva – Phase 1
|
-
|
42
|
44
|
113
|
81
|
118
|
199
|
-
|
11
|
210
|
in
progress
|
oct-15
|
|
Others
|
-
|
463
|
178
|
1,202
|
902
|
941
|
1,843
|
-
|
(30)
|
1,813
|
in
progress
|
oct-15
|
|
Total
properties under development
|
|
537
|
678
|
1,749
|
1,045
|
1,919
|
2,964
|
-
|
(584)
|
2,390
|
|
|
|
Total
|
|
13,903
|
15,038
|
30,580
|
27,494
|
31,682
|
59,521
|
-
|
131
|
59,662
|
|
|
108
Activities
of PBC in the residential construction segment in
Israel
The products which are sold by PBC
in the residential construction segment are residential units
offered for sale. The residential units are built in the framework
of complete residential neighborhoods, including full environmental
development and associated community services. The activities of
PBC in the residential construction segment also include the
identification and development of new lands which are appropriate
for residential construction, in urban renewal projects
(demolition-construction). As of the reporting date, the balance of
approved construction rights for the projects in which PBC is a
partner amounted to approximately 1,790 residential units intended
for construction (of which the share of PBC is approximately 1,076
residential units), where approximately 1,230 residential units are
currently in construction stages (of which, the share of PBC is
approximately 820 residential units). In 2016, the construction of
approximately 230 residential units was commenced, as compared with
approximately 590 residential units in 2015. In 2016, 480
residential units were sold (as compared with approximately 355
residential units in 2015). PBC’s revenues from the sale of
residential units and land which were applied to the statement of
income in 2016 amounted to approximately NIS 337 million, as
compared with approximately NIS 216 million in 2015. The scope of
income from residential units in the Financial Statements is
affected by the timing of the recognition of profit, in accordance
with international accounting standards, according to which income
is only recognized when the apartments are transferred to the
apartment buyers. In 2016, 230 of PBC’s residential units
were occupied, as compared with approximately 130 in 2015.
Additionally, in 2016, approximately 70 residential units were
occupied in a project which is being built by an associate company
of PBC (50%), whose results are reported as part of PBC’s
share in the profits (losses) of subsidiaries, as compared with
approximately 140 residential units in 2015. PBC builds and
markets, in the residential construction segment in Israel, as of
the reporting date, approximately 900 residential units in 8
different complexes throughout the country.
Supermarkets
Shufersal is a public company which
was incorporated in Israel, whose shares and debentures are listed
for trading on the TASE. It is primarily engaged in the ownership
and management of a supermarket chain - the largest and leading
chain in Israel, in terms of sales volume. Shufersal is also active
in the real estate segment and in the customer club credit card
segment.
Shufersal operates in three
operating segments: the retail segment, the real estate segment,
and the credit card customer club management segment, as described
below:
Retail segment.
Retail marketing in the
food and other products segment is the primary operating segment of
Shufersal, which is the owner of the largest supermarket chain in
Israel. As of December 31, 2016, Shufersal operated 272 branches
(as compared with 277 branches at the end of 2015), within the
framework of two groups of branches: the “discount branches
group” and the “neighborhood branches group,”
distributed throughout the entire country, including four main
retail formats, as well as Shufersal Online, and activities in the
health products segment (under the brands “Organic
Market” and “Green”). In 2016, in addition to
Shufersal, marketing chains operated in the retail food market in
Israel which operate throughout the entire country, primarily in
the discount market, such as Rami Levy Hashikma Marketing, Yeinot
Bitan, Victory Supermarket Chain, Yohananof, Machsanei HaShuk,
Hatzi Hinam, Osher Ad, and others (the “Additional Marketing
Chains,” and jointly with Shufersal: the “Marketing
Chains”); as well as urban convenience stores and gas
stations which generally operate with continuous opening hours,
throughout the entire week; neighborhood grocery stores; open and
closed markets; and specialty stores. As of December 31, 2016 (with
no significant change until proximate to the publication of the
report), Shufersal operated two groups of branches throughout the
entire country - the “discount branches group” and the
“neighborhood branches group.”
109
The aforementioned two groups
include four main retail formats throughout the country, which are
intended primarily for marketing purposes, and the positioning of
the specific branch for the relevant target market, as follows: (A)
The discount branches group: 113 branches according to the discount
branches format, featuring low prices throughout the entire year
(“Shufersal Deal”); 24 branches in the discount
branches format, which are intended for the general population, and
adapted to the needs of various population groups, by adjusting the
variety of products to the customer group, strict adherence to
Jewish dietary (“kashrut”) laws, and a simple shopping
experience (under the name “Yesh” (which includes two
sub-formats: “Yesh Neighborhood” and “Yesh
Chesed”)); Shufersal’s discount activity also includes
the marketing of products throughout the entire country through
various media (Shufersal Online). In 2016, the trend of increased
Shufersal sales through Shufersal Online continued. During 2016,
Shufersal sales through Shufersal Online constituted approximately
9% of Shufersal’s sales volume (as compared with
approximately 6% in 2015). Sales through Shufersal Online
contribute to an increase in sales, while retaining the high
service level given to Shufersal customers, including improvement
of the Shufersal Online channel for the benefit of Shufersal
customers by expanding the variety of products and content worlds.
This service provides a solution for the developing needs and
changes in the consumption habits of Shufersal customers, and for
the technological development which affect lifestyle, and therefore
withdrawal continues to place an emphasis on the development and
quality of the service which is given to Shufersal customers who
use this channel. Shufersal Online is accessible to Shufersal
customers via telephone, fax and an application for the performance
of acquisitions using smartphones. Shufersal acts on a continuous
basis to improve service and to maintain itself at the forefront of
the relevant technology.
Real estate segment. The real estate
activities of Shufersal were separated, beginning on April 1, 2013,
into Shufersal Real Estate Ltd. (“Shufersal Real
Estate”), a wholly owned subsidiary whose assets include both
branches which are rented to Shufersal (which are classified in
Shufersal’s consolidated financial statements as fixed
assets), and real estate properties which are rented out to third
parties) which are classified in Shufersal’s consolidated
financial statements as investment property). The aforementioned
properties do not include Shufersal’s logistical center in
Rishon Letzion (including the attached branch), and
Shufersal’s new logistical center in Shoham. The real estate
activity includes: (A) The development and betterment of the real
estate as an additional, independent business segment generating
returns for Shufersal (such as the rental of commercial areas to
third parties), and unlocking value for Shufersal and its
shareholders; and (B) Integrating Shufersal’s primary
activity in the retail segment, including: betterment and
development of existing properties, acquisition of lands for the
purpose of building and operating regional and local operating
branches, and betterment and construction of surrounding commercial
areas to increase the scope of activity in the complex. (B) The
neighborhood branches group: 82 branches in the neighborhood branch
format (“My Shufersal”), with an emphasis on providing
solutions in terms of convenience, availability, freshness, and
personalized service, as well as 48 branches in the very small
branches format in neighborhoods and city centers, operated
primarily by franchisees (“Shufersal Express”); The
activity in the neighborhood branches group also includes the
“Organic Market” activity. Shufersal operates in its
branches, as of December 31, 2016, 62 health areas throughout the
country, under the brand “Green,” and also operates 5
independent stores under the brand “Organic
Market.”
110
Presented below are details
regarding the real estate properties which are owned by Shufersal
Real Estate as of December 31, 2016:
|
|
Number of
properties
|
Total area
(thousands of square meters)
|
Fair value
(NIS millions)
|
|
Branches rented to
Shufersal
|
68
|
130
|
1,646
(1)
|
|
Properties under
construction which will be rented to Shufersal and to
externals
|
4
|
9
(2)
|
76
(1)(3)
|
|
Real estate
properties rented to externals
(4)
|
21
|
49
|
501
|
|
Total
|
93
|
188
|
2,223
|
(1) The fair value is in accordance
with the presentation of these properties in the books of Shufersal
Real Estate. In the books of Shufersal, these properties are
classified according to their amortized cost of acquisition, and
not at fair value. The balance of the amortized cost in the books
of Shufersal as of December 31, 2016, which includes branches which
are leased to Shufersal, and branches under construction which will
be leased to Shufersal, amounted to NIS 965 million.
(2) Not including lot areas
regarding which, in 2016, a zoning plan was approved which permits
construction at a scope of approximately 40,000 built square
meters
(3) Including branches under
construction with a total fair value of NIS 34
million.
(4) Rent and management fees with
respect to these properties in 2016 amounted to approximately NIS
44 million, and the NOI with respect to them (gross profit with
respect to them in Shufersal Real Estate, in annual terms) is
approximately NIS 25 million.
Credit customer club management segment.
This segment constitutes a reportable operating segment in
Shufersal’s financial statements, beginning with the
financial statements as of December 31, 2015. Under this operating
segment, Shufersal offers to the general public (subject to the
fulfillment of the minimum conditions), the “Shufersal”
credit card and the “Yesh” credit card, which provide
an extra-banking credit facility and benefits to customers, in the
vast majority of Shufersal branches and refueling stations of Paz
Ltd., and which confer membership in Shufersal’s customer
club. Shufersal was engaged in an agreement with Leumi Card Ltd.
(“Leumi Card”) on all matters associated with the
operation of credit cards. Shufersal is also a limited partner in
Shufersal Finance Limited Partnership (and a shareholder in the
general partner of Shufersal Finance), together with Leumi Card and
Paz Oil Company Ltd. (“Paz”), whose purpose is the
operation of credit card activity and the provision of credit
through the aforementioned credit cards, and the provision of
financial services, the provision of agency services and the
distribution of various financial products to credit card holders
and to private customers (through Leumi Card). It is noted that the
regulation associated with the issuance and operation of the credit
cards does not apply to Shufersal, or to Shufersal
Finance.
Telecommunications
Cellcom is a public company which
was incorporated in Israel, whose shares are listed for trading on
the TASE and on the New York Stock Exchange, and whose debentures
are listed for trading on the TASE.
Cellcom operates and sells to its
customers various communication services. Cellcom’s activity
is divided into two segments - the mobile segment and the landline
segment.
Cellcom’s activity in the
mobile segment includes the provision of mobile communication
services in Israel, in accordance with licenses which are extended
from time to time, the sale of mobile equipment to end users, and
supplementary services. Cellcom holds a general license from the
Ministry of Communication which is valid until the end of January
2022 (the “Mobile License”). As of the reporting date,
Cellcom provided mobile services to approximately 2,779 million
subscribers, over several networks, most of which feature a
national distribution, which include calls, sending and receipt of
messages, and internet browsing. Cellcom also provides its
customers with accompanying services, such as content and data
services, and also offers end user equipment, and repair services
for end user equipment.
Cellcom’s activity in the
landline segment includes internet infrastructure services (based
on the wholesale landline market), beginning in May 2015, internet
connectivity services (“internet provider services),”
television over internet services, beginning in December 2014
(“Cellcom TV”), including television channel
broadcasts, including channels which are provided by Idan+
broadcasts, video on demand (VOD) broadcasts, and additional
advanced features, landline telephone services (“Landline
Services”) to the business and private sectors, data
communication services to business customers and communication
operators, international telephone services (“International
Telephone Services”) and additional services such as
conference call services, cloud computing services and information
security.
111
Cellcom has licenses for the
provision of the services (except with respect to the television
over internet services, which do not require a
license).
In June 2016, DIC acquired Cellcom
shares at a total scope of approximately NIS 13
million.
In January 2017, Cellcom terminated
the agreement for the acquisition of the share capital of Golan
Telecom Ltd. (“Golan” and the “Golan Acquisition
Agreement,” respectively).
In January 2017, after the end of
the reporting period, Cellcom annulled the 2015 agreement for the
purchase of Golan Telecom Ltd. (“Golan”), after the
regulators’ refusal to approve it and continuous litigation
with Golan due to Golan’s repeated breaches of its agreements
with Cellcom. Following a mediation process held with Golan: Golan
entered a share purchase agreement with Electra Consumer Products
Ltd. ("Electra"),in which came into force as of the beginning of
the second quarter of 2017. Following the execution of the
aforementioned share purchase agreement with Electra the 3G and 4G
network sharing and 2G hosting sharing agreement between Cellcom
and Golan came into force; the aforementioned Company's 2015
purchase agreement of Golan was annulled; legal actions filed by
the Company and Golan against each other were
dismissed.
Cellcom markets its products through
dozens of service and sale centers and dozens of licensed marketers
throughout the country, a telephone sales channel and an internet
sales channel. Business customers receive routine services through
designated portfolio managers. Cellcom provides services to its
customers through telephone hotlines, service centers, and several
self-service channels (including its website).
Mobile
segment
Cellcom operates in a highly
competitive environment, which intensified after the entry into the
market of additional mobile communication providers and regulatory
changes which reduced barriers to entry and barriers to transition.
As of the reporting date, it competes against eight other mobile
communication operators: four mobile communication operators which
are license holders for the construction of mobile networks (MNO):
Partner, Pelephone Communications Ltd. (“Pelephone”),
Hot Mobile and Golan (additionally, Xfone frequencies in a
frequencies tender for the 4G network, and has not yet entered the
market), along with four virtual operators - Rami Levy Hashikma
Marketing Communications Ltd. (“Rami Levy”), Home
Mobile Ltd. (whose operations were purchased by Cellcom, subject to
the required approvals), Azi Communications Ltd. and Select
Communications Ltd.
According to Cellcom’s
estimate, the subscriber market shares of the various mobile
operators (based on “active subscribers”) as of
December 31, 2016 are as follows: Cellcom - approximately 27.5%,;
Partner approximately 26%,; Pelephone - approximately 23%; Hot
Mobile - approximately 13.8%; Golan - approximately 7.8%; the other
virtual operators together - approximately 1.9%. Cellcom’s
assessment regarding the market share is based on the reports which
were published to the public by other operators, and on
Cellcom’s assessments with respect to operators which do not
issue public reports. However, there is no standard method for
counting subscribers.
The average annual churn rate of
mobile subscribers in the Israeli market in 2015 and in 2016 is
estimated at approximately 38% and 36%, respectively, which is high
relative to the churn rate in other developed countries. The churn
rate from Cellcom in 2015 and 2016 was 42% and 42.4%,
respectively.
End user equipment
- Creating a
connection between transactions for the provision of mobile
services and transactions for the acquisition of end user equipment
(including by way of the provision of airtime refunds for the
acquisition of end user equipment) is prohibited. This prohibition
has resulted in increased competition on the market. The increasing
competition in the mobile device sales segment has resulted in a
decrease in the scope of mobile devices sold by
Cellcom.
Landline
segment
The Hot and Bezeq groups are the
only ones that own full landline infrastructures in Israel. In June
2016, Partner announced that it intends to create a national
landline infrastructure. Cellcom is evaluating the possibility of
investment in IBC group (a company owned by the Electric
Corporation and an international group led by Via Europa)
(“IBC”), or the creation of the broad landline
infrastructure which it owns.
112
Internet services - access and
infrastructure
- The two main internet infrastructure
providers for the private sector and the only groups that own
infrastructure which offer internet infrastructure services both
for to the internet access providers and to end user customers are
Bezeq and Hot. Bezeq also provides internet infrastructure services
to operators which do not own infrastructure, within the framework
of the wholesale landline market. In 2014, IBC also began
distributing its infrastructure and providing broadband services in
select areas. IBC’s license allows it to provide broadband
infrastructure services on the fiber optic infrastructure of the
Electric Corporation to other license holders, and to large
business customers. In 2016, IBC’s shareholders announced
their intention to raise capital by introducing additional
investors. As of the reporting date, Cellcom is evaluating the
possibility of investing in IBC.
Internet provider services are
provided, as of the reporting date, by the three major internet
providers: Cellcom, Bezeq International, Smile Telecom (a
subsidiary of Partner) and additional small providers, including
Xfone Communication Ltd. As of December 31, 2016, Cellcom provides
internet provider services to approximately 638,000 households, and
Cellcom estimates its market share as 25% of the market share, as
compared with 40% of the market share for Bezeq International, and
23% of the market share for Smile Telecom. The internet provider
market is highly competitive, saturated and characterized by
relatively low barriers to entry. The competition primarily focuses
on the ability to offer high internet connectivity speeds relative
to price. Insofar as IBC’s infrastructure is available to
possibility, this will boost Cellcom’s opportunity to compete
in the infrastructure and internet provider market, since this
would decrease Cellcom’s dependence on Bezeq and Hot as
infrastructure providers.
Multi-channel television
services
- The market for multi-channel television for
payment is controlled by Hot and Yes (which provide this service,
as of September 30, 2016, to approximately 816,000 and 618,000
households, respectively). Cellcom began operating in this segment
at the end of December 2014, through a hybrid television service
which includes DTT broadcasts (television channels provided by the
digital cable television broadcast network which operates in Israel
and is distributed for free by the Second Authority for Television
and Radio (Idan+) (“DTT Broadcasts”) and OTT TV
services (television over internet), and as of December 31, 2016,
it provides this service to approximately 111,000 households. Other
market players can also use the DTT broadcasts in combination with
their own OTT services, similarly to Cellcom’s method of
operation in the segment. According to Partner’s
announcement, it will enter the television market in the first half
of 2017. In 2016, Netflix and Amazon Prime, began operating in
Israel, which provide internet-based VOD services, and Cellcom
estimates that these services are expected to constitute a
supplementary service to the television services which are offered
by the existing competitors. in March and September 2014, the
Antitrust Commissioner published the following requirements as a
condition for the merger in the Bezeq group, in order to facilitate
opening up the multi-channel television market to competition by
reducing barriers to entry in the television segment: (1) in
general, Bezeq will not charge a fee to internet providers with
respect to the consumption of internet provider services which are
due to multi-channel television broadcasts, and all of the existing
exclusivity arrangements to which Bezeq and Yes are party will be
canceled, with respect to non-original production television
content, and the engagement of exclusivity arrangements of this
kind will be prohibited in the future; and (2) The Bezeq / Yes
group will allow new television service providers to acquire
certain original productions of Bezeq for two years. The legal
merger between Bezeq and Yes was completed in 2015.
International call services
-
Cellcom is a large provider of international call services.
Cellcom’s main competitors are Bezeq (through its subsidiary
- Bezeq International) and Partner (through its subsidiary - Smile
Telecom), and additionally, there are other competitors, such as
Xfone Communication Ltd., Rami Levy, Golan and Hot, through their
wholly owned subsidiaries or related companies. As of September 30,
2016, Cellcom’s market share is estimated at approximately
20%, Bezeq International at approximately 35%, Smile Telecom at
approximately 24%, and Hot-Net at approximately 12%. The
international call service market is highly competitive, with the
competition primarily based on the operator’s ability to
offer attractive pricing. Regulatory changes in this market have
resulted in increased competition. In recent years, the use of
alternative communication technologies, such as voice over IP, have
resulted in reduction of the telephone market, and particularly,
international telephone services. This trend is expected to
continue in the future at a moderate rate. This trend, together
with the inclusion of international telephone services in mobile
service and landline service communication packages at no
additional charge, have resulted in a decrease in income from these
services.
113
The adoption of the proposed changes
in regulation of the international telephone services market, which
includes the possibility for offering international telephone
services by landline operators and the mobile operator themselves,
and not through separate companies, may increase competition and
adversely affect Cellcom’s results of
operations.
Local landline services
- The
landline telephone market has been controlled for many years by
Bezeq, a monopoly in the landline telephone market, which held
approximately 2/3 of the landline telephone market share (and a
larger market share among business customers), according to the
publications of the Ministry of Communication, and Hot. Additional
providers in the landline telephone services market include
Cellcom, Netvision (wholly owned by Cellcom), Partner-012 Smile and
Bezeq International. Cellcom’s penetration into the landline
telephone market is an important component in Cellcom’s
ability to offer a comprehensive package of services to its
subscribers. As of the reporting date, Cellcom offers landline
telephone services to business customers, and through VOB
technology, to its private customers. Cellcom estimates that its
market share in the landline telephone services market is
immaterial. Insofar as the wholesale landline market will include
landline telephone, Cellcom will be able to offer home landline
telephone services to its private customers through the wholesale
market.
According to
Cellcom's second quarter 2017 results, in June 2017, the Ministry
of Communications published regulations setting Bezeq's resale
telephony service to be provided by Bezeq as of July 2017, as a
temporary 14 month alternative for wholesale landline telephony
service. In addition, the Ministry of Communications resolved that
Bezeq's obligation to offer wholesale telephony service, which was
to be offered by Bezeq as of May 2015, will be postponed until the
lapse of said resale telephony service period. The resolution
further notes that the Ministry of communications will consider the
resale telephony service as a permanent replacement of the
telephony wholesale service. The tariffs set for the resale
telephony service are substantially higher than those set for
Bezeq's telephony wholesale service. The Ministry of Communications
is holding a public hearing in relation to the aforementioned
tariffs, to be applied retroactively after its
conclusion.
Other landline services
-
transmission services and data communication services are provided
by Bezeq, Hot, Partner and Cellcom, and are intended for business
customers and communication operators. In 2016, the competition in
this segment increased, primarily due to the plans offered by Hot
and Partner.
Fixed
assets and facilities
Most of Cellcom’s fixed assets
include the mobile network equipment, which includes base sites
which are distributed throughout the country, which provide broad
communication coverage for the vast majority of populated areas in
the country, as well as a transmission network (which includes
optic fibers in a total length of approximately 1,800 km., and
microwave infrastructure), which provides connectivity for Cellcom
between most of its base sites, and through which Cellcom also
provides, to select business customers, transmission services, data
transfer and advanced landline communication services. In 2017,
Cellcom intends to continue the distribution of its LTE network,
and to continue optimizing its networks in order to provide to its
customers maximum support for video and other content requiring
broadband.
Cellcom has a backup network for
disaster recovery with respect to its engineering systems, which
was intended to increase network resiliency in case of damage to
one of its components, and has adopted a business continuity plan
and a disaster recovery plan in accordance with the requirements of
its license.
As of June 30, 2017, Cellcom’s
fixed assets and intangible assets
amounted to approximately NIS 2,916 million. In
2016, Cellcom’s investments consisted in fixed assets and
intangible assets, including communication networks, network
equipment and transmission infrastructure.
Cellcom rents 78 service centers and
points of sale. Additionally, Cellcom rents from various entities
sites for the purpose of the construction, maintenance and
operation of communication facilities which are used in
Cellcom’s communication network. Based on past experience,
Cellcom encounters difficulties in extending the leases of
approximately 5% of the sites used for communication
facilities.
In June 2013, Cellcom renewed the
permission agreement with the Israel Land Administration, which
manages the lands of the Development Authority and the Jewish
National Fund, for the use of land for the construction and
operation of small broadcast facilities.
The permission agreement determined
that, subject to the receipt of advance approval from the land
managers, which will be given at the request of Cellcom with
respect to each site, Cellcom is entitled to build and operate
transmission facilities on land, during the permission period, and
specific permissions and contracts which will be signed following
the permission agreement are cancelable by the land managers, by
providing advance notice, in case of certain events. Additionally,
the permission agreement includes a prohibition on the transfer of
control of Cellcom without providing a definition of the term
control for this purpose.
Cellcom has two main rental
properties in Israel: (1) A long term agreement for its
technological center in Netanya, with an area of approximately
11,000 square meters. The rental is for a period of ten years, from
August 2011, and Cellcom has the option to extend the agreement for
an additional period of 5 years, while in the event that Cellcom
does not exercise the option, it will be required to pay
compensation of approximately NIS 11 million. In January 2015,
Cellcom rented approximately 1,100 square metersthrough a sublease
for a period of five years, and in 2016, Cellcom rented, through a
sublease, an additional area of approximately 5,000 square meters,
for a period of 6 years. The sublessees have the option to extend
the sublease for an additional period, under certain conditions;
and (2) A long term agreement for Cellcom headquarters in Netanya,
with an area of approximately 58,000 square meters (of which,
approximately 26,000 square meters are used for underground
parking) until December 2022, which can be extended by two
additional periods of 5 years each. beginning in 2015, Cellcom has
leased, through subleases, approximately one quarter of the leased
area for periods of up to five years. The lessees have the option
to extend the sublease for additional periods. Cellcom also has two
additional properties which it leases: one in Haifa, with an area
of approximately 8,900 square meters, and the other in Rosh
Ha’ayin, with an area of approximately 3,300 square
meters.
Intangible
assets
Cellcom has the right to use
frequencies for the provision of communication services in its
communication networks.
In August 2015, Cellcom was
allocated 3 megahertz (“MHz”) in the 1800 MHz range for
4G networks (in light of Cellcom’s existing 1800 MHz
frequencies). As opposed to the frequencies which were provided in
the past to Cellcom, which are valid during Cellcom’s license
period, the frequencies won by Cellcom, as part of the tender, were
provided for a period of 10 years. Additionally, in order to
provide optimal performance on the 4G network, Cellcom will require
additional frequencies beyond those which were allocated to it in
accordance with the 4G frequencies tender, and due to the fact that
the Ministry of Communication believes that, for this purpose,
Cellcom will clear 12 MHz in the 1800 MHz frequencies which were
allocated to it for the purpose of the 2G network, Cellcom cleared
such frequencies in locations where the low use of the 2G network,
in combination with advanced and modern software programs which
allow it, with minimum adverse impact on the performance of the 2G
network. Additionally, insofar as the network sharing agreements
with Electra and Xfone, are realized, Cellcom will be able to enjoy
10 MHz in the 1800 MHz frequencies of Golan and Xfone. If the
aforementioned frequencies are not provided to Cellcom, Cellcom
will hold a lower number of frequencies than its competitors, which
may result in harm to Cellcom’s competitive
position.
The Ministry of Communication is
evaluating the possibility of replacing 850 MHz frequencies with
900 MHz frequencies. This process will require Cellcom to perform
significant investments in its networks.
Cellcom is a member of the GSM
association, which includes various operators from all over the
world which use GSM technology, and which meet the standards of the
association. As a member of the association, Cellcom is entitled to
make use of the association’s intellectual property rights,
including use of the GSM logo and trademark.
Cellcom has rights to a large number
of trademarks and trade names which are registered under the names
of Cellcom and Netvision, as applicable. Additionally, several
patents are registered under Cellcom’s name.
Insurance
Clal Insurance Enterprises Holdings
is a public company which was incorporated in 1987, in accordance
with the laws of the State of Israel. The shares of Clal have been
listed for trading on the stock exchange since 1988. Clal is a
holding company which is primarily engaged in the insurance,
pension and provident funds segments, and in the holding of assets
and real and other businesses (such as insurance agencies), and
which constitutes one of the largest insurance groups in Israel.
Clal has three operating segments: long term savings, non-life
insurance and health insurance.
114
Long
term savings segment
General information regarding operating
segment
This operating segment includes the life insurance
branch, the pension funds branch, the provident funds and study
funds branch. The activities in the life insurance branch were
performed in 2016 through Clal Insurance. The activity in the
pension and provident fund branch was performed in 2016 through the
holdings of Clal Insurance in Clal Pension and Provident Funds
(100%) and in Atudot Havatika (50%).
Products and
services.
The products in the segment
primarily provide solutions for the retirement period to salaried
employees and self-employed workers, private investment solutions
and coverages in case of death, disability and loss of income due
to loss of working capacity. Life insurance products constitute a
contractual undertaking between the insurer and the policyholder,
and include insurance plans which allow the accrual of savings, for
different time ranges, and insurance plans and/or combinations in
insurance plans which include insurance covers for death, illness,
loss of working capacity and disability. A policyholder who has
reached the end of the insurance period is entitled to insurance
benefits (the amounts which have accrued in the savings component
of the policy), in accordance with the policy terms. The
policyholder may choose, subject to the provisions of the
legislative arrangement, to receive these amounts in a one-time
amount (“Capital Payment”), in lifetime payout
installments (“Annuity”), or as a combination of the
two, according to the policy terms; In some Annuity products, the
policyholder benefits from an Annuity factor which is protected
against extended life expectancy, and which is determined on the
acquisition date of the policy, or on the commencement date of the
payment of the Annuity to the policyholder, or which can be
acquired once the policyholder reaches at least age 60. Pension
funds constitute a mutual insurance fund, and operate in accordance
with regulations which may change from time to time. A pension fund
member is entitled to receive, beginning on the retirement date,
lifetime Annuity payments, which are based on Annuity factors which
do not guarantee life expectancy, and the Annuity may change from
time to time, in accordance with the actuarial balance of the fund.
Comprehensive pension funds allow pension savings for pension
purposes and insurance coverage for death and disability which
partially benefit from designated debentures, and to which it can
be can be made subject to the limits prescribed in law;General
(supplementary) pension funds which do not benefit from designated
debentures, and which allow pension savings for Annuity purposes,
and to which deposits cam be made beyond the limit prescribed in
law. Some of the general funds including additional insurance
coverages, beyond the old age Annuity;Provident funds provide
savings solutions both for the long term (such as provident funds
for severance pay and compensation to salaried employees) and for
the medium term (study funds), without insurance coverages acquired
directly from the managing company. A member is entitled to
withdraw the amounts which accrued in his favor in the provident
funds, excluding study funds, in a one-time amount or as an
Annuity, in accordance with the period when they deposited them.
Funds which accrued in favor of a member in study funds are
withdrawn in a one-time payment. Beginning in June 2016, provident
funds for investment were established in the branch, which are
intended to allow a capital savings track for individual funds, and
which will include an incentive for the withdrawal of funds accrued
therein as an Annuity during the retirement period.
Restrictions, legislation, standardization and
special constraints which apply to the operating segment.
The activity in this segment is subject to the provisions of the
law which apply to insurers and to pension funds and provident
funds which operate in this segment, including the Insurance Law,
the Control of Financial Services (Provident Funds) Law, 5765-2005
(the “Provident Funds Law”), the Income Tax Regulations
(Rules for Approval and Management of Provident Funds), 5724-1964
(the “Provident Fund Regulations”), the Control of
Financial Services Law (Pension Advice, Marketing and Clearing
Systems), 5765-2005 (the “Pension Advice Law”), and
subject to and in accordance with the directives of the
Commissioner of Capital Markets, as issued from time to
time.
General
insurance segment
General information regarding operating
segments
This segment includes the activities of Clal in the
general insurance branches and in the personal accidents insurance
branch (up to one year), which are recorded under general insurance
business operations.
115
Details regarding
the primary details included in the operating segment.
Compulsory motor insurance
- The product
is insurance which the vehicle owner is required to purchase with
respect to physical harm only which may be caused to the driver of
the insured vehicle, or to passengers therein, or to pedestrians
who were injured as a result of the damage of the insured
vehicle.
Motor property insurance
- Motor
property insurance is insurance which covers property damage which
was caused to the vehicle, as specified in the policy.
Liability insurance
- (A) Third party
liability insurance;(B) Employers’ liability insurance;(C)
Product liability insurance;(D) Professional liability
insurance;(E) Officers’ liability insurance.
Other property and others insurance
-
(A) Home insurance;(B) Other property insurance.
Guarantees
- Policies in accordance with
the Sales Law - Policies which are intended to secure the
investments of residential unit buyers in accordance with the Sales
Law, and which rely on its provisions.
Accident, illness and disability
insurance
- Personal accidents insurance
- Provides coverage to the
policyholder in case of death and/or permanent disability (full or
partial) due to an accident and/or temporary loss of working
capacity, as a result of an accident or illness.
Credit and foreign trade risks insurance
- The policy is intended for companies which sell on credit, both
in Israel and abroad, to other businesses (B2B). The insurance
covers liabilities due to the sale of goods and/or the provision of
services on credit.
Health
insurance segment
General information regarding operating
segments
This segment includes the Group’s activities
in health insurance, in the illness and hospitalization branch, and
in the long term care branch. This segment includes insurance plans
designed for individual policyholders, and insurance plans designed
for collectives.
Products and
services.
Illness and hospitalization branch
-
Including illness and hospitalization insurance, international
travel insurance, foreign residents insurance, personal accidents
insurance, dental insurance and health insurance for Israelis
abroad. Some of these products are supplementary and/or extended
and/or alternative to the services which are provided within the
framework of the basic health basket which is provided to the
citizens of the country by virtue of the Health Insurance Law
and/or to the services which are provided within the framework of
the additional services of the health funds, in accordance with the
provisions of the National Health Insurance Law.
Long
term care branch
- Long term care insurance provides
solutions for policyholders who have been defined as requiring long
term care, according to the definition of the insurance event in
the policy, i.e., anyone who cannot independently perform part of
the activities of daily living, and therefore requires assistance
or supervision. In the long term care branch, insurance coverages
are sold which are paid in addition to payments or services which
are provided by the state, as individual insurance and as
collective insurance.
Restrictions, legislation,
standardization and special constraints The activity in this
segment is subject to the provisions of the law which apply to
insurers engaged in the segment, and to the directives of the
Commissioner of Capital Markets which are published from time to
time, and to the provisions of the law which apply to insurers
operating in the field. The activity in this segment requires a
license, in accordance with the Insurance Law, and is overseen by
the Division of Capital Markets.
Others
Includes the assets and income from
other miscellaneous businesses, such as technological developments,
tourism, oil and gas assets, electronics, and other sundry
activities.
The Effect of Seasonality on
Shufersal
116
In Israel retail segment business
results are subject to seasonal fluctuations as a result of the
consumption behavior of the population proximate to the Pesach
holidays (March and/or April) and Rosh Hashanah and Sukkoth
holidays (September and/or October). This also affects the balance
sheet values of inventory, customers and suppliers. Our revenues
from cellular services are usually affected by seasonality with the
third quarter of the year characterized by higher roaming revenues
due to increased incoming and outgoing tourism.
In 2017, the Passover holiday
fell at the middle of April, compared to 2016 when it was at the
end of April. The timing of the holiday affects Shufersal’s
sales and special offers in the second quarter of 2017, compared to
last year.
The Passover holiday in the second
quarter of 2017 had a greater effect on Shufersal’s results
than in the corresponding quarter in 2016, therefore analysis of
the results for the first half of the year compared to the
corresponding period in 2016 better represents the changes between
the periods.
Legal
Framework
Operations Center in
Argentina
Regulation and
Governmental Supervision
The laws and regulations governing
the acquisition and transfer of real estate, as well as municipal
zoning ordinances are applicable to the development and operation
of our properties. Currently, Argentine law does not specifically
regulate shopping malls lease agreements. Since our shopping malls
leases generally differ from ordinary commercial leases, we have
created provisions which govern the relationship with our shopping
malls tenants.
Leases
Argentine law imposes certain
restrictions on property owners, including:
●
a prohibition to include automatic price
adjustment clauses based on inflation increases in lease
agreements; and
●
the imposition of a two-year minimum lease term
for all purposes, except in particular cases such as embassy,
consulate or international organization venues, room with furniture
for touristic purposes for less than three months, custody and
bailment of goods, exhibition or offering of goods in fairs or in
cases where the subject matter of the lease agreement is the
fulfillment of a purpose specified in the agreement and which
requires a shorter term.
Rent
Increases
In addition, there are contradictory
court rulings regarding whether rent may be increased during the
term of the lease agreement. For example, Section 10 of the Public
Emergency Law prohibits the adjustment of rent under leases subject
to official inflation rates, such as the consumer price index or
the wholesale price index. Most of our leases provide for
incremental rent increases that are not based on any official
index. As of the date of this annual report no tenant has filed any
legal action against us challenging incremental rent increases, but
we cannot ensure that such actions will not be filed in the future
and, if any such actions were successful, that they will not have
an adverse effect on us.
Lease Terms
Limits
Under the Argentine Civil and
Commercial Code lease terms may not exceed fifty years. Generally,
our leases are for terms of three to ten years.
117
Rescission
Rights
The Argentine Civil and Commercial
Code provides that tenants may terminate leases earlier after the
first six months of the effective date. Such termination is subject
to penalties which range from one to one and a half months of rent
payable. If the tenant terminates the lease during the first year
of the lease the penalty is one and a half month’s rent and
if termination occurs after the first year of lease the penalty is
one month’s rent.
Other
The Argentine Civil and Commercial
Code requires a tenant to give at least 60 days’ prior notice
of termination. There are no court rulings related to: (i) the
tenants’ unilateral right to terminate; or (ii) the
possibility of establishing a penalty different from that
prescribed by law.
While current Argentine government
discourages government regulation of leases, there can be no
assurance that additional regulations will not be imposed in the
future, including regulations similar to those previously in place.
Furthermore, most of our leases provide that the tenants pay all
costs and taxes related to the property in proportion to their
respective leaseable areas. If a significant increase in the amount
of such costs and taxes occurs, the Argentine government may
respond to political pressure to intervene by regulating this
practice, thereby increasing our costs.
Argentine law enables lessors
to pursue an “executory proceeding” if lessees’
fail to pay rent when due. In executory proceedings, debtors have
fewer defenses available to prevent foreclosure, making these
proceedings substantially shorter than in normal proceedings. In
executory proceedings the origin of the debt is not under
discussion; the trial focuses on the formalities of debt instrument
itself. The code also permits special eviction proceedings, which
are carried out in the same way as ordinary proceedings. The
Argentine Civil and Commercial Code requires that notice be given
to a tenant demanding payment of amounts due in the event of breach
priorto eviction, of no less than ten days for residential leases,
and establishes no limitation or minimum notice for other leases.
However, historically, backlogs in court dockets and numerous
procedural hurdles have resulted in significant delays to eviction
proceedings, which generally last from six months to two years from
the date of filing of the suit.
Development and
Use of the Land
In the City of Buenos Aires, where
the vast majority of our properties are located, we are subject to
the following regulations:
Buenos Aires Urban Planning Code.
The
Buenos Aires Urban Planning Code (
Código de Planeamiento Urbano de la
Ciudad de Buenos Aires
) generally restricts the density and
use of property and controls physical features of improvements on
property, such as height, design, set-back and overhang, consistent
with the city’s urban landscape policy. The administrative
agency in charge of the Urban Planning Code is the Secretary of
Urban Planning of the City of Buenos Aires.
Buenos Aires Building Code.
The Buenos
Aires Building Code (
Código
de Edificación de la Ciudad de Buenos Aires
)
complements the Buenos Aires Urban Planning Code and regulates the
structural use and development of property in the city of Buenos
Aires. The Buenos Aires Building Code requires builders and
developers to file applications for building permits, including the
submission to the Secretary of Work and Public Services
(
Secretar’a de Obras y
Servicios Públicos
) of architectural plans for review,
to assure compliance therewith.
Buenos Aires Enablement Code.
The Buenos
Aires Enablemant Code (
Código
de Habilitaciones de la Ciudad de Buenos Aires
) regulates
the conditions under which the licenses or licenses to operate
commercial establishments are granted and the rules and procedures
that they must follow. The General Direction of Habilitations and
Permits is the administrative division responsible for implementing
and enforcing the Enablement Code of the City of Buenos
Aires.
118
In other jurisdictions, our real
estate activities are subject to various municipal regulations
regarding urban planning, construction, occupation and the
environment. The latter must respect federal principles.
Additionally, in some jurisdictions we may be subject to the
regulation of large commercial areas, which requires government
approval of the location of certain commercial
establishments.
We believe that all of our real
estate properties are in material compliance with all relevant
laws, ordinances and regulations.
Sales and
Ownership
Buildings Law.
Buildings Law No. 19,724
(
Ley de Pre-horizontalidad
)
was superseded by the Argentine Civil and Commercial Code which
became effective on August 1, 2015. The new regulations provide
that for purposes of execution of agreements with respect to build
units or condo units under construction, the owner or developer
must purchase insurance in favor of prospective purchasers against
the risk of frustration of the contract. A breach of this
obligation prevents the owner from exercising any right against the
purchaser, such as demanding payment of any outstanding
installments due, unless the owner fully complies with its
obligations, but does not prevent the purchaser from exercising its
rights against seller.
Protection for the Disabled Law.
The
Protection for the Disabled Law No. 22,431 (
Ley de Protección del
Discapacitado
), enacted on March 20, 1981, as amended,
provides that in connection with the construction and renovation of
buildings, obstructions to access must be eliminated in order to
enable access by handicapped individuals. In the construction of
public buildings, entrances, transit pathways and adequate
facilities for mobility impaired individuals must be provided for.
Buildings developed before the Law came into effect must be
retrofitted to provide access, transit pathways and adequate
facilities for mobility-impaired individuals. Those pre-existing
buildings, which due to their architectural design may not be so
retrofitted, are exempted from compliance. The Protection for the
Disabled Law provides that residential buildings must ensure access
by mobility impaired individuals to elevators and aisles.
Architectural requirements refer to pathways, stairs, ramps and
parking.
Real
Estate Installment Sales Law.
The Real Estate Installment
Sales Law No. 14,005, as amended by Law No. 23,266 and Decree No.
2015/85 (
Ley de Venta de Inmuebles
Fraccionados en Lotes en Cuotas
), imposes a series of
requirements on contracts for the sale of subdivided real estate
property regarding, for example, the sale price which is paid in
installments and the deed, which is not conveyed until final
payment of such price. The provisions of this law require, among
other things:
●
The registration of the intention to sell the
property in subdivided plots with the Real Estate Registry
(
Registro de la Propiedad
Inmueble
) corresponding to the jurisdiction of the property.
Registration will only be possible with regard to unencumbered
property. Mortgaged property may only be registered where creditors
agree to divide the debt in accordance with the subdivided plots.
However, creditors may be judicially compelled to agree to the
division.
●
Preliminary registration with the Real Estate
Registry of the deed of transfer within 30 days of execution of the
sales contract.
Once the property is registered, the
installment sale must be consistent with the requirements of the
Real Estate Installment Sales Act, unless seller affirms that it
will not provide for the sale in installments. If a title dispute
arises, the installment purchaser who has duly registered the
purchase instrument with the Real Estate Registry will be entitled
to the deed. Further, the purchaser can demand conveyance of title
after at least 25% of the purchase price has been paid, although
the seller may demand a mortgage to secure payment of the balance
of the purchase price.
After payment of 25% of the purchase
price or the construction of improvements on the property equal to
at least 50% of the value of the property, the Real Estate
Installment Sales Act prohibits termination of the sales contract
for failure by the purchaser to pay the balance of the purchase
price. However, in such event the seller may take action under any
mortgage on the property.
119
Other
Regulations
Consumer Relationship.
Consumer or End User Protection.
The
Argentine Constitution expressly establishes in Article 42 that
consumers and users of goods and services have a right to
protection of health, safety and economic interests in a consumer
relationship. Consumer Protection Law No. 24,240, as amended,
provides protection of consumers and end users in a consumer
relationship, in the arrangement and execution of
contracts.
The Consumer Protection Law, and the
applicable provisions of the Argentine Civil and Commercial Code
regulate the rights conferred under the Constitution focused on the
weakest party in the consumer relationship as a means to prevent
potential abuses by vendors of goods and services in a mass-market
economy where standard contracts are the norm.
As a result, contractual provisions
included in consumer contracts are voided and unenforceable if
they:
●
Are inconsistent with the essence of the service
to be provided or limit liability for damages;
●
imply a waiver or restriction of consumer rights
and an extension of seller rights; or
●
shift the burden of proof to
consumers.
In addition, the Consumer Protection
Law imposes penalties ranging from warnings to the forfeiture of
concession rights, privileges, tax regimes or special credits to
which the sanctioned party may be entitled, including closing down
of establishments for a term of up to 30 days.
The Argentine Civil and Commercial
Code defines a consumer agreement as are entered into between a
consumer or end user and an individual or legal entity that
provides professional services or a private or public company that
manufactures goods or offers services to consumers in the stream of
commerce.
In addition, the Consumer Protection
Law establishes a joint and several liability system under which
for any damages caused to consumers, if resulting from a defect or
risk inherent in the thing or the provision of a service, the
producer, manufacturer, importer, distributor, supplier, seller and
anyone who has placed its trademark on the good or service is
liable. The Consumer Protection Law excludes professional services
that require a college degree and that are provided by members of
professional organizations or those provided by a governmental
authority. However, this law regulates professional
advertisements.
The Consumer Protection Law
determines that the information contained in the offer addressed to
undetermined prospective consumers, binds the offeror during the
period in which the offer takes place and until its public
revocation. Further, it determines that specifications included in
advertisements, announcements, prospectuses, circulars or other
media bind the offeror and are considered part of the contract
entered into by the consumer.
Pursuant to Resolution No. 104/05
issued by the Secretariat of Technical Coordination reporting to
the Argentine Ministry of Economy, the Consumer Protection Law
adopted Resolution No. 21/2004 issued by the Mercorsur’s
Common Market Group which requires that those who engage in
commerce over the Internet (E-Business) shall disclose in a precise
and clear manner the characteristics of the products and/or
services offered and the sale terms. Failure to comply with the
terms of the offer is deemed an unjustified denial to sell and
gives rise to sanctions.
On September 17, 2014, a new
Consumer Protection Law was enacted by the Argentine Congress
–Law No. 26,993. This law, known as “System for
Conflict Resolution in Consumer Relationships,” provided for
the creation of new administrative and judicial procedures. It
created a two-tiered administrative system: the Preliminary
Reconciliation Agency for Consumer Relationships (
Servicio de Conciliación Previa en las
Relaciones de Consumo, COPREC
) and the Consumer Relationship
Audit, and a number of courts assigned to conflicts between
consumers and producers (
Fuero
Judicial Nacional de Consumo
). A claim may not exceed a
fixed amount equivalent to 55 adjustable minimum living wages, as
determined by the Ministry of Labor, Employment and Social
Security. The claim must be filed with the administrative agency.
If an agreement is not reached between the parties, the claimant
may file the claim in court. The COPREC is currently in full force
and effect.
120
However, the court system is not in
force yet, therefore, any court claims currently must filed with
existing courts. A considerable volume of claims filed against us
are expected to be settled pursuant to the system.
Antitrust Law.
Law No. 25,156, as
amended, prevents monopolistic practices and requires
administrative authorization for transactions that according to the
Antitrust Law constitute an economic concentration. According to
this law, mergers, transfers of goodwill, acquisitions of property
or rights over shares, capital or other convertible securities, or
similar operations by which the acquirer controls or substantially
influences a company, are considered as an economic concentration.
Whenever an economic concentration involves a company or companies
and the aggregate volume of business of the companies concerned
exceeds in Argentina the amount of Ps.200 million, in such case the
respective concentration should be submitted for approval to the
Argentine Antitrust Authority (
Comisión Nacional de Defensa de la
Competencia, “
CNDC
”
). The request for approval may
be filed either prior to the transaction or within a week after its
completion.
When a request for approval is
filed, the CNDC may (i) authorize the transaction, (ii) condition
the transaction to satisfaction of certain conditions, or (iii)
reject the application.
The Antitrust Law provides that
economic concentrations in which the transaction amount and the
value of the assets absorbed, acquired, transferred or controlled
in Argentina, do not exceed Ps.20 million are exempted from the
law. Notwithstanding the foregoing, when the transactions
consummated by the companies involved in the prior 12-month period
exceed in the aggregate Ps.20 million or Ps.60 million in the last
36 months, these transactions must be notified to the
CNDC.
As our consolidated annual sales
volume and our parent’s consolidated annual sales volume
exceed Ps.200 million, we should give notice to the CNDC of any
concentration provided for by the Antitrust Law.
Credit Card Law.
Law No. 25,065, as
amended by Law No. 26,010 and Law No. 26,361, governs certain
aspects of the business activity known as “credit card
system.” Regulations impose minimum contract contents and
approval thereof by the Argentine Ministry of Industry, as well as
limitations on chargeable interest by users and commissions charged
by the retail stores that adhere to the system. The Credit Card Law
applies both to banking and non-banking cards, such as
“Tarjeta Shopping,” issued by Tarshop S.A. Pursuant to
Communication “A” 5477 issued by the Argentine Central
Bank, loans granted under credit cards by non-financial entities
cannot exceed 25% of the monthly interest rate published by the
Argentine Central Bank for loans to individuals without security
interests.
Environmental Law.
Our activities are
subject to a number of national, provincial and municipal
environmental provisions.
Article 41 of the Argentine
Constitution, as amended in 1994, provides that all Argentine
inhabitants have the right to a healthy and balanced environment
fit for human development and have the duty to preserve it.
Environmental damage shall bring about primarily the obligation
torestore it as provided by applicable law. The authorities shall
control the protection of this right, the rational use of natural
resources, the preservation of the natural and cultural heritage
and of biodiversity, and shall also provide for environmental
information and education. The National Government shall establish
minimum standards for environmental protection whereas Provincial
and Municipal Governments shall fix specific standards and
regulatory provisions.
On November 6, 2009, the Argentine
Congress passed Law No. 25,675, which regulates the minimum
standards for the achievement of a sustainable environment, the
preservation and protection of biodiversity and sets forth the
environmental policy goals. Law No. 25,675 establishes the
activities that will be subject to an environmental impact
assessment procedure and certain requirements applicable thereto.
In addition, such Law sets forth the duties and obligations that
will be triggered by any damage to the environment and mainly
provides for restoration of the environment to its former condition
or, if that is not technically feasible, for payment of
compensation in lieu thereof. Such Law also fosters environmental
education and provides for certain minimum reporting obligations to
be fulfilled by natural and legal entities.
121
In addition, the CNV Rules require
the obligation to report to the Commission any events of any nature
and fortuitous acts that seriously hinder or could potentially
hinder performance of our activities, including any events that
generate or may generate significant impacts on the environment,
providing details on the consequences thereof.
The Argentine Civil and Commercial
Code introduced as a novel feature the acknowledgement of
collective rights, including the right to a healthy and balanced
environment expressly sets forth that the law does not protect an
abusive exercise of individual rights if such exercise could have
an adverse impact on the environment and collective rights in
general. For additional information see “Item 3 (d). Risk
Factors–Risk relating to our Business–Our business is
subject to extensive regulation and additional regulations may be
imposed in the future.”
Control
Systems
IRSA CP owns computer systems to
monitor tenants’ sales (except stands) in all of its shopping
malls. IRSA CP also conducts regular manual audits of its tenants
accounting sales records in all of its shopping malls. Almost every
store in those shopping malls has a point of sale that is linked to
a main computer server in the administrative office of such
shopping mall. IRSA CP uses the information generated from the
computer monitoring system for statistics regarding total sales,
average sales, peak sale hours, etc., for marketing purposes and as
a reference for the processes of internal audit. The lease
contracts for tenants in Alto Avellaneda, Alto Palermo, Alcorta
Shopping, Patio Bullrich, Buenos Aires Design, Abasto, Alto
Rosario, Alto NOA, Dot Baires Shopping, Córdoba Shopping,
Soleil Premium Outlet, La Ribera Shopping, Mendoza Plaza, Distrito
Arcos and Alto Comahue contain a clause requiring tenants to be
linked to the computer monitoring system, there being certain
exceptions to this requirement.
Insurance
We carry all-risk insurance for the
shopping malls and other buildings covering property damage caused
by fire, explosion, gas leak, hail, storms and wind, earthquakes,
vandalism, theft and business interruption. In addition, we carry
liability insurance covering any potential damage to third parties
or property caused by the conduct of our business throughout
Argentina. We are in compliance with all legal requirements related
to mandatory insurance, including insurance required by the
Occupational Risk Law (
Ley de
Riesgos del Trabajo
), life insurance required under
collective bargaining agreements and other insurance required by
laws and executive orders. Our history of damages is limited to one
single claim resulting from a fire in Alto Avellaneda Shopping in
March 2006, a loss which was substantially recovered from our
insurers. These insurance policies contain specifications, limits
and deductibles which we believe are adequate to the risks to which
we are exposed in our daily operations. We further maintain
liability insurance covering our directors’ and corporate
officers’ liability.
Operations Center in
Israel
IDBD is a holding company that
invests, either directly or through its subsidiaries, associates
and joint ventures in companies that operate in various sectors of
the economy in Israel. IDBD is directly affected by the political,
economic, military and regulatory conditions of Israel. The main
regulations applicable to IDBD’s business are described
below. For more information, see “Risk Factors–Risks
related to IDBD and IDBD’s subsidiaries.”
General
regulations applicable to our business in Israel
Proper Conduct
of Banking Business
IDBD and certain of its affiliates
are subject to supervision by the Israeli Supervisor of Banks
relating to “Proper Conduct of Banking Business” which
impose, among others limits on the aggregate principal amount of
loans a financial institution can have outstanding to a single
borrower, a group of related borrowers, and to the largest
borrowers and groups of related borrowers of a banking entity (as
these terms are defined in the aforesaid directives). IDBD, its
controlling shareholders and its affiliates are considered a single
group of borrowers for purposes of this regulation.
122
These restrictions limit the ability
of IDBD and its affiliates to borrow from a single bank in Israel,
their ability to make investments where they require bank lines of
credit, to invest in companies that have loans outstanding from
banks in Israel, and to make business transactions together with
groups that have such credit outstanding. In the period from 2013
and until the date of publication of the report, the concentration
of credit risk of IDBD and its affiliates decreased as a result of
a reduction in the amount of utilized credit for the group that
includes IDBD, including as a result of a change of control that
resulted in a re-characterization of the group for purposes of
applicable regulation.
Reduced Centralization Act
In December 2013, the official
“Reshumot” published in Israel the Promotion of
Competition and Reduction of Centralization Law, No. 5774-2013 (the
“Reduced Centralization Act”) pursuant to which the use
of a pyramidal structures (or multiholding companies) for the
control of “reporting entities” (principally entities
whose securities are held by public shareholders) is limited to two
layers of reporting entities, being the holding company in the
first layer not including a reporting entity that has no
controlling shareholder. For this purpose, on the date of
publication of the law in Reshumot, IDBD was considered a
second-tier company and DIC was considered a third-tier company,
and as such, DIC would not have been permitted to continue to
control the operating companies after December 2019. As a
result of the change in control of IDBD, IDBD and DIC are no longer
considered as second and third-tier companies, respectively, for
the purpose of the Reduced Centralization Act. If DIC is considered
a second-tier company, it would be required by December 2019 at the
latest, to cease controlling entities with publicly held
securities.
In connection with evaluating the
application of the Reduced Centralization Act, in August 2014,
IDBD’s Board of Directors appointed an advisory committee to
examine various alternatives to address the implications of the
Reduced Centralization Act to comply with the provisions that apply
to control in a pyramid o multiholding company structure in order
to enable continued control of IDBD and/or DIC in “other tier
companies” (currently held directly by Discount Investments)
as of December 2019. The advisory committee has recommended the
following alternatives:
(a)
Taking either IDBD or DIC private thereby
removing the requirement that they be reporting entities (and as a
result not a “tier company”); and
(b)
Merge IDBD and DIC.
The Board of Directors of Discount
Investments has appointed an advisory committee with a similar
function. As of the date of this Annual Report, no specific
alternatives have been identified. The implementation of an
alternative that would be adopted is likely to take several
years.
Based on these analyses, IDBD
considers it more likely that the completion of one of the
specified alternatives will be adopted to comply with the
restrictions of the Reduced Centralization Act regarding pyramidal
holdings, while allowing IDBD to continue to control DIC, and DIC
to continue to control Cellcom after December 2019. PBC, which
currently is a third-tier company that controls each of Gav-Yam,
Ispro and Mehadrin, has preliminarily evaluated application of the
Law on its holding structure and determined that it will be able to
maintain said control, as it has concluded that the Law has no
effect over its financial statements.
IDBD, as a first-tier company, and
DIC, as a second-tier company, are not required to designate
independent directors to their respective boards of directors or to
appoint outside directors as required by the Reduced Centralization
Act.
123
Pursuant to the provisions of the
Reduced Centralization Act, the boards of directors of Cellcom,
PBC, Elron, Gav-Yam, Ispro and Mehadrin, include a majority of
independent outside directors. In June 2014, the Promotion of
Competition and Reduction of Centralization (Classification of a
Company as a Tier Company) Regulations, No. 5774-2014, came into
effect, as part of which exemptions were provided for certain
“third-tier” entities from changing the composition of
their boards of directors to comply with the Reduced Centralization
Act. Pursuant to this law and the Promotion of Competition and
Reduction of Centralization (Concessions Regarding the Number of
Outside directors) Regulations, No. 5774-2014, and in view of the
number of directors who may be appointed with the consent of the
Bronfman-Fisher Group (per the terms of the shareholders’
agreement between it and DIC), the Board of Directors of Shufersal
includes a majority of independent outside directors. In this
context, in August 2014, DIC entered into an agreement with an
affiliate of the Bronfman-Fisher (which at the time held
approximately 19% of the share capital of Shufersal), pursuant to
which DIC will vote in favor of the four directors designated by
Bronfman-Fisher at the meeting of shareholders of Shufersal (out of
a board of fifteen members), for so long as it holds the minimum
defined percentage of the share capital of Shufersal, although DIC
reserves the right to object to any candidate on reasonable
grounds.
These arrangements will be in effect
so long as the restrictions of section 25(d) to the Reduced
Centralization Act apply to Shufersal. Accordingly, DIC, which as
of December 31, 2015, owned approximately 53% of Shufersal’s
share capital, is effectively able to appoint the majority of the
members of Shufersal’s Board of Directors.
The Reduced Centralization Act
includes provisions relating to a separation between significant
affiliates and significant financial institutions. Consequently, so
long as IDBD will be a significant operating entity, after December
11, 2019, IDBD will not be able to control Clal Insurance and
additional financial affiliates within the Clal or to hold more
than 10% of the equity of any such entity (or more than a 5% stake
in such an entity if it is regarded as an insurer without a
controlling shareholder).
In May 2015, updated lists were
published on the website of the Ministry of Finance and the
official gazette in connection with the Reduced Centralization Act,
which includes a list of the centralization factors, the list of
the significant corporations and a list of the significant
financial institutions. In accordance with the provisions of the
Reduced Centralization Act, a substantial financial institution or
a significant real corporation will be deemed as a centralization
factor that subjects these entities to the provisions of the
Reduced Centralization Act, as well as any entity that is part of a
business group that includes a significant financial entity or a
significant real corporation. IDBD and its controlling shareholders
(Eduardo Elsztain and entities through which he holds his interest
in IDBD) and the companies of the IDBD Group (including DIC,
Cellcom, PBC, Shufersal, Adama, Clal, IDB Tourism, Noya Oil and Gas
Explorations Ltd. and companies under the control of these
companies) were included in the list of centralization factors, and
these entities, except for Adama (excluding Eduardo Elsztain
himself), were also included in the list of significant
corporations. In addition, companies of Clal, including Clal
Insurance (except Clal Holdings Insurance Enterprises) and Epsilon
Investment House Ltd. (held by DIC) were also included in the list
of the significant financial institutions.
Insofar as Clal Holdings Insurance
Enterprises will continue to be considered a significant real
entity, this may affect its ability to retain control of Clal
Insurance, directly or indirectly after December 2019, which may
adversely affect its ability to appoint joint directors in both of
the companies (Clal Holdings Insurance Enterprises and Clal
Insurance).
In light of the directives issued by
the Commissioner in connection with the appointment of a trustee
for holding control in Clal Holdings Insurance Enterprises, which
currently are held by IDBD and considering the letter issued by the
Commissioner on December 30, 2014 pursuant to which IDBD is
required to sell its control shares in Clal Holdings Insurance
Enterprises, Clal Holdings Insurance Enterprises has appealed to
the Concentration Committee in connection with its classification
as a significant real entity.
124
In November 2014, IDBD’s Board
of Directors resolved, subject to requisite corporate approvals, to
promote a consolidation of management functions at IDBD and DIC, in
order to achieving costs savings. In this regard, on March 29,
2016, IDBD’s Board of Directors approved the terms of office
and of employment of Mr. Shalom Lapidot to be chief executive
officer of both IDBD and DIC, which was subsequently approved by
the compensation committee of DIC. The term of office of Mr.
Lapidot is subject to approval of a general meeting of shareholders
of DIC.
On
September 20, 2017, complying with the Reduced Centralization Act
in respect to the pyramid participation structure, Dolphin, a
subsidiary of the Company, has executed a binding term sheet for
the acquisition of the entire shares held by IDBD in DIC through a
company that it is controlled by the Company, currently existing or
to be incorporated in Israel.
The term sheet has been approved by the
independent directors committee created for the purposes of such
transaction which has been participated in the negotiations,
analyzed and assessed the term sheet. This term sheet shall
continue in negotiations between the parties so as to define the
terms and conditions of the definitive documents to be executed.
The Audit Committee of the Company has issued an opinion without
objections to make with respect to the referred
transaction.
Regulations
applicable to each of the businesses in Israel
Real Estate
In recent years, there has been
continued shortage in manpower in the construction and agricultural
industries which typically are labor intensive and depend on
foreign workers, including in the areas of Judea and Samaria. The
security situation in Israel, as well as the shutdown of Judea and
Samaria during certain periods of the year, have resulted in
continued shortage in the workforce, driven by lower numbers of
foreign workers from Judea and Samaria. In July 2015, the Minister
of Finance increased the quota of foreign work permits to
approximately 20,000 through the end of 2016, as a means to
achieving the goal of increasing new construction projects by
70,000 during the year and to promote newhousing starts to
alleviate the housing crisis. Given the shortage of skilled
workers, wages increased in general and in particular those of
foreign construction workers. The shortage and unavailability of a
skilled workforce, increased construction costs and resulted in
longer timetables for the execution of new projects.
Supermarkets
Labor
Law
The retail sector activities of
Shufersal are subject to labor laws including the Employment of
Workers by Human Resources Subcontractors Law, 5756-1996, the
Extension Order in the Matter of Contract Workers in the Cleaning
Branch in the Private Sector, the Minimum Wage Law, 5747-1987 and
the Increased Enforcement of Labor Laws Law, 5772-2011. As of June
30, 2017, Shufersal employed approximately 13,900 workers, majority
of which are subject to minimum wage requirements. The majority of
Shufersal’s employees, in an estimated number of 11,000 of
Shufersal employees, are parties to a collective bargaining
agreement.
The provisions of the Minimum Wage
Law (Increase of Minimum Wage - Emergency Provision), 5772 - 2015
and the amendment of the Minimum Wage Law, 5747 – 1987,
resulted in an increase in the minimum wage effective as of July
2016 and led to an increase of NIS 40 million in Shufersal’s
wage expense in 2016 (compared with 2015). In Shufersal’s
evaluation the increase of the minimum wage in Israel, changes to
labor laws in Israel and the increased possibility of organized
workers may detrimentally affect the business results of Shufersal
and result in higher wage expenses of Shufersal.
Retail and
Production
The activities of Shufersal are also
subject to consumer protection laws, including the Food Law, the
Defective Products Liability Law, 5740-1980, the Consumer
Protection Law, 5741-1981, and the Consumer Product and Service
Price Supervision Law, 5756-1996 that allows a consumer to
institute a class action suit for damages caused to consumers as a
whole based on the causes of action set out in that
law.
125
The Public Health Protection (Food)
Law, 5776-2015, sets forth quality standards and food safety
measures and provides the relevant regulator supervisory and
criminal and administrative enforcement powers. The provisions of
the Food Protection Law affect production activities of Shufersal,
including importation and food marketing activities. Shufersal is
continuing the process of implementing procedures to comply with
the provisions of the Food Protection Law that apply to its
activities. Shufersal also operates pharmacies in certain of its
stores, and is therefore subject to the provisions of the
Pharmacists Ordinance (New Version), 5741-1981.
Shufersal is involved in
manufacturing activities at three owned facilities where it
produces principally private-branded baked goods which are subject
to compliance with applicable production and quality assurance
standards. Shufersal is continuously evaluating compliance of these
facilities with the provisions of the Food Protection Law and as of
the date of this Annual Report, Shufersal believes its operations
comply in all material respects with the applicable provisions of
this law.
The retail activities of each
Shufersal store requires compliance with the Business License Order
(Businesses Requiring a License), 5773-2013, principally providing
that they obtain a business operating license for each unit. As of
the date of this Annual Report, there are two units that are
subject to legal proceedings regarding business licenses that are
pending against Shufersal and its directors. Shufersal’s
operating units are also subject to land development approvals and
licensing, substantially all of which are in
compliance.
The
Food Law and the Anti Trusts Law
The Antitrust Law affects the
activities of Shufersal, especially with respect of the possibility
of carrying out future acquisitions for which approval is required
from the Antitrust Commissioner (the “Commissioner”)
and the influence on the trade arrangements of Shufersal with its
suppliers. The Food Law regulates Shufersal’s trade
arrangements with its suppliers which are regulated in detail which
are designed to promote competition in the food supply industry. As
of the date of this Annual Report, Shufersal believes that growth
through acquisitions of a significant entity in the retail market
would be limited. Moreover, provisions of the Food Law relating to
geographical competition of retailers may influence the ability of
Shufersal to expand organically through opening new stores in
certain areas and under certain circumstances Shufersal may be
required to close active branches under certain
circumstances.
The Food Law includes the following
three systems:
(a) with respect to activities of
suppliers and retail trade, the Food Law prohibits:
i. a supplier interfering with the
retail price of the products of another supplier;
ii. a retailer interfering with a
supplier in the matter of the consumer price imposed by another
retailer;
iii. a large supplier imposing its
market position to influence the ordering or presentation of retail
products within stores of a large retailer (Shufersal is included
in the list of large retailers);
iv. a large supplier interfering
with the price a retailer charges consumers for the products of
that supplier, in the allocation of sales areas at any rate for the
products of the supplier, for the acquisition of a product from the
supplier in any scope from the total retail purchases of the
product and of competing products, and for the purchase or sale of
products which another supplier supplies to the retailer, including
purchase quantities and goals, the sale area allocated to them in a
store and any other commercial condition sought to be
imposed;
v. a large retailer and a large
supplier agreeing to set the pricing of a basket of products at a
price that is lower than the marginal cost of production of the
related product or that would require a consumer to purchase a
minimum amount of the related product to achieve the reduces
price;
vi. a large supplier conditioning
the sale of its product to a retailer on the purchase of another
product of that large supplier; and
vii. a supplier forwarding payments to the large
retailer, unless by way of a price reduction of the product
units.
126
(b) Restrictions on geographical
competition of retailers have adversely affected Shufersal’s
expansion through organic growth and acquisitions. On September 28,
2014 Shufersal received a notification from the Antitrust Authority
regarding demand areas of Shufersal’s large stores
(“Notice of Demand Areas”). The stores that were the
subject of the Commissioner’s request under the Law are 14
stores located in Haifa, 3 stores in Carmiel, 4 stores in Hadera,
and 3 stores in Safed. As of the date of this Annual Report,
Shufersal has not been required to close or dispose of any of its
stores.
(c) Provisions designed to increase
transparency of consumer prices,
inter alia,
by requiring a large
retailer to publish on the internet and without cost to consumers,
various data on prices of consumer goods it sells in its stores to
allow consumers to compare prices with those of other
retailers.
(d) Provisions regarding the
contemporaneous application of the Food Law and the Antitrust law -
In December 2015, the Commissioner published a statement on the
parallel application of the Antitrust Law and the Food Law listing
cases in which only the provisions of the Food Law will apply and
no additional regulation will be required under the Antitrust Law.
As of the date of the notice Shufersal’s operations comply
with the Food Law. As of December 31, 2016 the implementation of
the Food Law has had no significant impact on Shufersal’s
business.
Shufersal’s acquisition of
Clubmarket was approved by the Commissioner in 2005, and within
this framework the Commissioner imposed a number of limitations on
Shufersal’s activities including: prohibiting Shufersal from
pricing products that result in a loss that is not proportionate to
its business activities and are aimed to affect the operations of
competitors from the market; prohibiting Shufersal from entering
into agreements with suppliers that impose restrictions on those
suppliers from doing business with competitors of Shufersal; and
prohibiting Shufersal from attempting to influence commercial
conditions between its suppliers and competitors.
Shufersal obtained an exemption from
the Commissioner, available until October 14, 2018, regarding the
operation of the Fourth Chain, which is a label company owned by a
number of supermarket chains that was established to develop
consumer goods. The Commissioner’s decision took into account
the fact that Fourth Chain contracted with a third party that
develops products for it under a private brand and the stipulated
exemption exclusively permits these joint activities for the
development of the private brand. Shufersal believes the Fourth
Chain private label increases competition by establishing a
cost-effective alternative to dominant branded consumer
products.
The findings of the Commissioner in
the matter of the rules of conduct among the largest store chains
and the dominant suppliers in the food supply market, including
under the provisions of the Food Law, and in the matter of the
merger of Shufersal with Clubmarket, may have a detrimental effect
on Shufersal’s business, its financial condition and
operating results.
Telecommunnications
Communications
Regulations
Cellcom’s operations are
subject to general legal provisions regulating the relationships
and method of contracting with its customers. These provisions
include the Consumer Protection Law, 5721-1981 and regulations
promulgated thereunder and other laws detailed below. A substantial
part of Cellcom’s operations are subject to the
Communications Law, regulations enacted by the Ministry of
Communications, and the provisions of the licenses granted to
Cellcom by the Minister of Communications. Cellcom’s actives
which include providing cellular service, landline, international
telephone services and internet access, and infrastructure services
are subject to licensing.
127
Supervision of Rates.
The Communications
Regulations (Telecommunications and Broadcasts) (Payments for
Interconnect), 5760 - 2000 requires cellular operators to phase in
gradual reduction of communications rates (i.e. payments that will
be made by an in-country operator, another cellular operator or
international operator to complete one minute of call time in the
network of a cellular operator or for the sending of an SMS between
cellular operators). This reduction has led to a considerable
reduction in Cellcom’s revenues.
Moreover, in August 2013 the
Communications Law was amended to authorize the Minister of
Communications to set interconnection prices and regulate the use
of networks owned by another operator based not only on the cost
incurred to establish the network (according to the calculation
method to be determined by the Minister of Communication) plus a
reasonable profit, but also on one of the following: (1) flat
payment for a service provided by the license holder; (2) reference
to tariffs charged for a comparable service; or (3) reference to
the cost of these services or with the interconnection costs
charged in other countries. The Minister of Communications was also
empowered to give instructions on structural separation for the
providing various services, including segregating services provided
by a license holder from services provided to a
subscriber.
In the last few years, contract
termination charges for cellular plans have been banned in the
cellular and other communications markets, other than for customers
who have more than a certain number of cellular lines or whose
monthly payments exceed a certain amount for bundled service. The
elimination of these charges led to a considerable increase in plan
cancellations, increased the costs of retaining and acquiring
customers, and accelerated erosion of rates.
Virtual Operators (MVNO).
The
Communications Law and related pronouncements regulate the
activities of virtual operators. Notwithstanding that the MVNO
regulations apply only to the activities of a virtual operator
which has an operating agreement with a cellular operator, the
regulations empower the Ministry of Communications together with
the Economic Ministry to impose terms of an agreement including
fixing the price to be charged for the services
provided.
Other Third Generation Operators
(UMTS). In 2012, Golan and Hot Mobile began to offer UMTS services.
The conditions of the tender according to which Golan and Hot
Mobile were granted those licenses included a number of benefits
and concessions, including minimally low license fees and a
mechanism to reduce the royalties they undertook to pay for the
frequencies based on the operator’s market share in the
private sector and setting long timetables to meet the geographical
coverage requirements of the network and the right to use
in-country migration services via other cellular operators’
networks. The Communications Law obliges the other cellular
operators to provide in-country migration services to Golan and Hot
Mobile for a period ranging from seven to ten years subject to
certain conditions. In 2011, Cellcom entered into a contract with
Golan to provide in-country migration services. Hot Mobile entered
into a similar in-country migration agreement with Pelephone and
later with Partner (which was subsequently replaced by a joint
networks agreement with Partner) without intervention from the
Ministry of Communications.
Regulation of Multi-Channel Television
Services
As at the date of this Annual
Report, television program streaming via the Internet is not
subject to regulation in Israel. Should the recommendations of the
committee for the examination of the arrangement of commercial
broadcasts be adopted and the committee requires Cellcom to make
additional investments or regulation is imposed that is not
beneficial for Cellcom’s streaming services or for its
ability to use the DTT infrastructures, the results of
Cellcom’s streaming services may be adversely
affected.
128
Cellcom’s
Communications Licenses
Cellcom holds a general license for
providing cellular services, valid until January 31, 2022, setting
out conditions (including duties and restrictions) applicable to
its activities, officers and shareholders holding certain
percentages of Cellcom’s shares. The license may be extended
by the Ministry of Communications for consecutive periods of six
years, if Cellcom is in compliance with the provisions of the
license and law, and makes requisite investments to its service and
network. The Ministry of Communications has amended the license
conditions in the past, and may amend them in the future, without
Cellcom’s consent and in a manner that may limit its ability
to conduct business. The license provides that Cellcom does not
have exclusivity for providing services.
The cellular license can be revoked,
suspended or limited in the following cases: total holdings of the
founding shareholders or their successors (as defined in the
license) is less than 26% of the control shares of Cellcom; total
holdings of Israeli parties (as defined in the license), who are
among the founding shareholders or their successors, is less than
20% of the total issued share capital and control shares of
Cellcom; a majority of directors are not Israeli citizens or
residents of Israel; fewer than 20% of the directors of Cellcom
were appointed by Israeli parties; an act or omission of Cellcom
that adversely affects or restricts competition in the cellular
sector; the aggregate equity of Cellcom, together with the
aggregate equity of shareholders each holding 10% or more of the
share capital, is less than US$200 million.
In light of the 2015 change in the
control structure of IDBD, the Cellcom control structure has also
changed, and requires the approval of the Ministry of
Communications, including with regard to Israeli holding
requirements included in the licenses of Cellcom, as Mr. Eduardo
Elsztain is not a citizen of Israel. IDBD and Cellcom formally
applied to the Ministry of Communications to approve these changes
and amend the telecommunications licenses of Cellcom accordingly.
If the request is not approved and another arrangement is not
offered by the Ministry of Communications, Cellcom may face
sanctions, which under the terms of its license, can include
suspension or cancellation of its licenses.
According to Telecommunications Law,
the Ministry of Communications may impose on telecommunication
companies, including Cellcom, financial sanctions for breach of
license and law. The amount of the sanction is calculated as a
percentage of the revenue of the operator, and according to the
degree of severity and extent of the breach, said may be
significant.
In July 2015, Cellcom received
(through a wholly owned entity) a uniform and general license for
the provision of landline telephony services (which replaced the
previous license for providing this service), for the period ending
April 2026. A uniform and general license was also awarded to
Netvision and replaced its general license for providing internet
access services, international carriers, and a network access point
for the period ending February 2022. In addition, an entity, fully
controlled by Cellcom received a uniform and general license which
replaced the landline telephony service license, for the period
ending March 2026. These licenses can be extended for an additional
period of 10 years, under terms similar to the terms of extension
of the general cellular license.
The Ministry of Communications has
issued rules providing for unification of all uniform licenses. The
uniform license allows providers to also offer virtual operator
services. The process of unifying the uniform licenses and the
timetable have not yet been determined and it is possible that this
process will have a legal, financial, tax and accounting effect on
Cellcom’s and Netvision’s businesses. The provision of
a number of services by one entity will require limitations also on
discrimination between operators.
Cellcom holds other communications
licenses: a special license for the provision of data transmission
and communication services in Israel, a license to provide internet
services, and licenses to provide cellular services, landline
telecommunication services and internet services in the West Bank,
for periods ending 2016-2018. These licenses include conditions
similar to those of the general license for the provision of
cellular services, as noted above.
According to regulations that apply
to the uniform license, there are certain limitations on cross
ownership among license holders.
129
2.
Further Regulation Applicable to
Communications Services
In July 2014, the Ministry of
Communications announced a public hearing on the coverage and
quality requirements for second-generation and third generation
networks. The proposed requirements are stricter than those
currently existing and if adopted, could have an adverse effect on
the results of Cellcom. Cellcom is unable to assess whether the
proposed changes will be adopted, and what the impact of these
changes will have in practice on Cellcom’s operating
results.
In addition, in August 2014, the
Ministry of Communications announced a public hearing to consider
call centers owned by communications operators. In addition, the
Ministry of Communications proposed to amend the Communications Law
(Telecommunications and Broadcasting), 1982, providing that a
customer may claim pre-set financial compensation if the telephone
call center does not reply within an average response time or if
there is an overcharge error. Cellcom believes that adoption of
these proposed changes could have a material adverse effect on
Cellcom’s business.
3. Permits
for Setting Up Base Sites
a.
Cellcom’s cellular services
generlly are provided through base sites across Israel, their
construction and licensing are included in TAMA 36 (District Zoning
Plan) – Part A - National Master Plan for Communications -
Small and Micro Broadcasting Facilities (“TAMA 36”),
and Radiation Law. Regulating the deployment of wireless access
devices, which are base sites with smaller dimensions, are, for the
most part, regulated by Communications Law and Radiation Law. The
construction of base sites requires a permit as per Planning and
Building Law, 1965 (“Planning and Building Law”), and
is subject to other approvals from multiple
regulators.
Legal proceedings (civil, criminal
and administrative) are pending against Cellcom, under which a
number of arguments were raised concerning the legal compliance of
some of Cellcom’s sites, alleging failure to obtain permits
under Planning and Building Law, or based on development of sites
in contravention of a permit.
Cellcom did not apply for a building
permit for approximately 33% of its base sites on the basis of the
exemptions for wireless access facilities provided by law. In 2010,
the Supreme Court issued a Temporary Order at the request of the
Government’s Attorney General, enjoining Cellcom, Partner,
and Pelephone from proceeding with construction of these facilities
on the basis of the exemption. A final determination of the
regulatory authorities regarding applications for exemptions is
pending as of the date of this Annual Report.
In addition, Cellcom provides
in-building repeaters and micro-sites (“
femtocells
”) for its subscribers
seeking a solution to poor indoor reception. Based on an opinion
Cellcom received from legal counsel, Cellcom did not request
building permits for the repeaters that were installed on roof
tops, which are a small fraction of all repeaters installed. It is
not clear whether the installation of a different type of
in-building repeaters and micro-sites requires a building permit.
Some require a specific permit while others require a permit from
the Ministry of Environmental Protection, depending on their
radiation levels. Cellcom alsobuilds and operates microwave
facilities as part of its transmission network. The different types
of microwave facilities receive permits from the Ministry of
Environmental Protection regarding their radiation levels. Based on
an opinion of legal counsel, Cellcom believes that building permits
are not required for the installation of microwave facilities on
rooftops.
b.
Indemnification obligation
-
under Planning and Construction Law, local planning and building
committees may demand and receive, as a condition for granting a
building permit for a site, a letter of indemnity for claims under
Section 197 of Planning and Construction Law. By December 31, 2015,
Cellcom had executed approximately 400 letters of indemnity as a
condition for receiving permits. In some cases, Cellcom has not yet
been built any sites. As at December 31, 2015, two requests for
indemnification were received from one local committee on the basis
of a letter of indemnity as noted, in an immaterial
amount.
130
As a result of the requirement to
deposit letters of indemnity, Cellcom may decide to dismantle or
move some sites to less advantageous locations, or build certain
sites, if it concludes that the risk of granting letters of
indemnity exceeds the benefit derived from those sites, which may
result in a deterioration of cellular services and damage network
coverage.
c.
Radiation Law, Regulations and Permits
Thereunder
- Radiation Law, Regulations and Principles
thereunder included provisions relating to all aspects related to
regulating the issue of non-ionizing radiation, including,
inter alia
, levels of
exposure that are permissible.
In May 2012, the Ministries of
Communications, Health and Environmental Protection, based on their
assessment of the potential health consequences of
fourth-generation telecommunications services in Israel, including
increased exposure to non-ionizing radiation, issued a memorandum
advising that deployment of the fourth-generation network should be
based on existing base stations, other smaller base sites both
internal and external, and if possible, using the wired
infrastructure so that data traffic will be carried mainly through
fixed communication lines and not through any cellular
infrastructure. In August 2014, the Ministry of Communications
allowed the use of fourth-generation infrastructures, and in
January 2015 fourth-generation frequencies were awarded to cellular
operators. The recommendations of May 2012, as noted, were not
included in the tender documents or in said approval.
Insurance
Areas of
Activity of Clal Insurance Business Holdings
Clal Holdings offers general
insurance such as car insurance, homeowners’ insurance, and
credit and foreign trade risk insurance, among others, as well as
health insurance. The activities of Clal Holdings and its
subsidiaries are subject to the provisions of laws applicable
insurance companies and to regulatory supervision. Clal
Holdings’ subsidiaries are supervised by the Capital Markets,
Insurance and Savings Commissioner (the “Insurance
Commissioner”). Clal Insurance and its subsidiary, Clalbit
Financing, are supervised by the Israel Securities Authority.
Subsidiaries of the Clal Holdings Insurance Group have been subject
to administrative enforcement proceedings and the imposition of
fines. Clal Insurance is not in breach of any material regulatory
provision applicable to its operations.
Capital
Requirements of Insurance Companies
Minimum Capital
– The
Supervision of Financial Services (Insurance) (Minimum Equity
Required of an Insurer), Regulations, 1998 (“Capital
Regulations”) law prescribes minimum capital requirements for
insurance companies. The capital required for insurance activities
consists of a first layer of capital, based the greater of the
initial capital and capital derived from the volume of activity in
general insurance, the higher of the calculation based on premiums
and the calculation based on outstanding claims, as well as other
capital requirements. Failure to comply with the Capital
Regulations will require the insurer to increase its equity up to
the amount stated in the Capital Regulations or reduce the scope of
its business accordingly, no later than the date of publication of
the report, except in exceptional circumstances as approved by the
Insurance Commissioner, that will then determine any supplementary
capital requirements.
Breakdown of an Insurer’s
Capital
– The Insurance Commissioner issued a circular
in August 2011 (“Circular”) that provides a framework
for determining the composition of an insurer’s equity, in
conjunction with the adoption in Israel of the Solvency II
Directive (“Directive” or “Solvency II”),
as amended and updated.
·
Initial (core) capital (basic tier
1), equals the components included in capital attributable to
shareholders of Clal Insurance. The overall capital ratio must be
at least 60% of the total equity of the insurer.
131
·
Secondary (tier 2) capital includes
complex secondary capital instruments (excluding periodic accrued
interest payments), subordinate secondary capital instruments (as
defined by the Circular) and any other component or instrument
approved by the Insurance Commissioner. A complex secondary capital
instruments is one that is subordinated to any other instrument,
except for initial capital, including financial instruments
available to absorb losses by postponing payment of principal and
interest. The first repayment date of secondary capital instruments
will be after the end of the period that reflects the weighted
average maturity of insurance liabilities, plus two years, or after
20 years, whichever is first, but no earlier than eight years from
the date an instrument is issued. If the complex secondary capital
instrument includes an incentive for early redemption, the first
incentive payment date may not be earlier than five years from the
date of issue of the instrument.
·
Tertiary (tier 3) capital includes
complex tertiary capital instruments (excluding periodic accrued
interest payments) and any other component or instrument approved
by the Insurance Commissioner. A tertiary capital instrument is
subordinate to any other instrument, except for primary and
secondary capital, and includes financial instruments available to
absorb the insurer’s losses by postponing the payment of
principal. Tertiary capital will must be junior to secondary
capital and equal in the order of credit repayments. The first
repayment date on tertiary capital instruments may not be earlier
than five years from the date of issuance. If the complex tertiary
capital instrument includes an incentive for early redemption, the
first indentive payment date may not be earlier than five years
from the date of issue of the instrument. Tertiary capital may not
exceed 15% of the total capital of the insurer.
Insurance liabilities include
liabilities that are not yield dependent but excludes any liability
fully backed by lifetime indexed bonds and net of any reinsurance
costs. Approval of the Insurance Commissioner is required for
inclusion of hybrid capital instruments (primary, secondary or
tertiary) in equity. The Circular includes a Temporary Order
regarding the breakdown of an insurer’s equity
(“Temporary Order”), which will apply until full
implementation of the Directive in Israel, when announced by the
Insurance Commissioner. The Temporary Order defines the secondary
capital issued according to Capital Regulations, before amendment,
as subordinate secondary capital and imposes a limit equal to 50%
of basic capital.
Distribution of dividends
– In accordance with rules promulgated by the Insurance
Commissioner, a dividend distribution may not be approved, unless,
after giving pro forma effect to the proposed distribution, the
insurer has a ratio of recognized equity to required equity of at
least 105%, as confirmed in filings with the Insurance
Commissioner. Prior approval of the Insurance Commissioner is not
required for any distribution of dividends if the total equity of
the insurance company, as defined by Supervision of Financial
Services (Insurance) (Minimum Equity Required of an Insurer),
Regulations, 1998 (“Minimum Capital Regulations”),
after giving effect to the distribution of the proposed dividend,
exceeds 115% of the required equity.
In November 2014, the Insurance
Commissioner outlined solvency rules (“rules” or
“regime,” as applicable) based on Solvency II, in
Israel, in a letter addressed to managers of the insurance
companies (“Letter”). In the Letter, the Insurance
Commissioner outlined a plan to adopt the 2016 European model for
calculating capital and capital requirements for the local market,
effective as of the annual reports for 2016 (“First Adoption
Date”). During a period to be determined by the Insurance
Commissioner and as conditions require, insurance companies will
also be required to comply with capital requirements under existing
regulations. The Letter stated that until final adoption, insurance
companies must prepare additional quantitative assessment exercises
(IQIS) for the 2014-2015 period. These requirements are intended to
assess the quantitative effects of adopting the model, as well as
providing data for calibrating and adjusting the model. In
addition, the Letter addressed an initiative to develop a framework
for quarterly reporting of insurance companies’ solvency
ratio. The Letter also referred to the Commissioner’s
intention to publish provisions for managing capital and targets
for internal capital, to address a gap survey that insurers will
undertake with respect to their risk management systems, controls
and corporate governance and a consultation paper to promote the
process of self-assessment of risks and solvency
(ORSA).
132
In April 2015, the Insurance
Commissioner published a second letter titled “Plan for the
Adoption of Rules for Solvency, based on Solvency II” and
provisions for the IQIS4 exercises to be undertaken regarding the
2014 historical financial statements. The letter emphasized that
the exercise reflects the decision of the Insurance Commissioner to
impose adjustments required for the Israeli insurance market. The
Letter further stated in connection with the proposed adoption of
IQIS5 that the Insurance Commissioner would continue to monitor
developments in the European markets and would consider adjustments
relevant for Israel.
In July 2015, the Insurance
Commissioner issued a letter concerning “transitional
provisions regarding the application of solvency rules, based on
Solvency II” (the “Letter on Transitional
Provisions”). The transitional provisions were provided by
reference to certain solvency rules set forth in the European
Directive relating to, inter alia, a gradual adoption of capital
requirements in respect of holdings of equity shares which may a
component to be included in the calculation of core capital. In
addition, the letter included transitional provisions regarding
submission of a plan to improve the capital ratios ofinsurance
companies whose ratios are negatively affected following adoption
of the new solvency rules beginning with the financial statements
for 2018. Adoption of the solvency rules are expected to change
both the recognized regulatory and required regulatory capital and
according to indications existing today, is expected to result in a
significant decline in the ratio between recognized capital and
required capital of Clal Insurance compared to capital ratios
calculated according to capital ratio requirements currently in
effect, and is expected to adversely affect the ability of Clal
Insurance and Clal Insurance Enterprises to distribute dividends
upon such adoption. However, as a rule, the capital requirements
under the solvency rule are intended to serve as a capital cushion
against more serious events, with a lower loss probability than the
capital requirements under current rules.
In May 2015, the Board of Directors
of Clal Insurance Enterprises and the Board of Directors of Clal
Insurance directed its management team and the Risk Management
Committee, which also functions as the Solvency Committee
(“Committee”), to examine measures Clal Insurance may
be able to employ to improve its capital ratio, in accordance with
the new solvency rules and to recommend a course of action to the
Board, including in relation to business adjustments and/or
financial transactions related to Clal Insurance’s capital,
its breakdown, and/or its responsibilities. The Committee and
Management have begun this examination, and during the first stage,
recommended that the Board issue secondary capital instruments. The
Committee will continue to examine other measures in an effort to
prepare the company for possible adoption of these proposed capital
requirements, and related measures.
Clal Insurance has calculated its
capital ratio using results as of December 31, 2014
(“Calculation Date”) and based on the IQIS4 rules and
has determined that it would be in compliance, as of the
Calculation Date, with the proposed capital requirements, in the
context of the transitional provisions, even before taking pro
forma account of the positive impact on the capital ratio provided
by the subsequent issuance of subordinated notes. The related
calculations were submitted to the Insurance Commissioner on August
31, 2015. The Insurance Commissioner has not yet published binding
provisions for adoption, and there is uncertainty regarding the
details of the final provisions. Clal Insurance will continue to
monitor the quantitative aspects of the proposed solvency rules
towards final adoption, in an effort to anticipate requisite
controls and capital requirements.
On March 14, 2016, “IQIS
Provisions for 2015” (“Draft”) was published in
preparation for the adoption of Solvency II. Insurance companies
are required to submit an additional quantitative evaluation survey
on the basis of December 2015 results (“IQIS5”), by
June 30, 2016. The Draft was issued by reference to the European
legislation adapted for requirements of the local market and that
goes beyond provisions for quantitative evaluation surveys
previously issued. The main changes relate to establishing
risk-free interest curves, through extrapolation to the ultimate
forward rate point, the components of recognized capital, capital
requirementsless investments in infrastructure (capital and debt),
adjusting capital requirements for management companies, and
updating the formula for calculating capital requirements for risk
premiums and reserves for general insurance. Clal Insurance is
unable toassess the overall impact of the changes based on the
provisions in the Draft to carry out a further quantitative
evaluation survey, and will carry out an assessment of the current
capital status, when the binding provisions will be finalized.
According to the Draft, the IQIS5 calculation will be a factor in
assessing preparedness of insurance companies and to the
implementation and scope of the final provisions to be
adopted.
133
Capital requirements under the
Capital Regulations are based on the separate individual financial
statements of an insurance company. For purposes of calculating
recognized capital, an investment by an insurance company in an
insurance company or a controlled management company, and in other
subsidiaries will be calculated on the equity basis, according to a
holding rate, which includes indirect holdings.
The minimum capital required of Clal
Insurance has been reduced, with approval of the Insurance
Commissioner, by 35% of the original difference attributed to the
managing companies and provident funds under its control. However,
when calculating the amount of dividends permitted for
distribution, this difference will be added at level of the capital
structure. In September 2013, the Insurance Commissioner notified
Clal Insurance that the deducted amount to be added back to the
minimum capital required, will be after a deduction for a tax
reserve accrued by Clal Insurance following the acquisition of
provident fund operations. The approval of the Insurance
Commissioner, as noted above, will be canceled with adoption of
capital requirements under the Directive that will replace the
Capital Regulations.
In March 2013, Clal Insurance
received a letter from the Insurance Commissioner regarding the
determination of credit ratings according to an internal model used
by Clal Insurance (“internal model”), to be applied as
a risk rating methodology for a subject insured, according to
conditions of the relevant sector. The Insurance Commissioner
authorized Clal Insurance to allocate capital for adjusted loans,
ranked according to its internal model and with reference to the
rates specified in the Capital Regulations. If there is an external
rating available, the capital allocation will be made using the
lower of the available ratings. The letter alsorequires Clal
Insurance to submit immediate and periodic reports as specified
regarding these activities that make the specified transactions
subject to review by the Commissioner of Insurance. As a result of
its compliance with the provisions of the letter, Clal
Insurance’s capital requirements were reduced by NIS 69
million, as at the end of the reporting period.
Permit Issued by
the Insurance Commissioner to the Former Controlling Shareholders
of IDBH to Retain Control of Clal Insurance Enterprises and
Consolidated Institutional Entities
On May 8, 2014, legal counsel for
the former controlling shareholders of IDBD (Ganden, Manor, and
Livnat Groups) was notified by the Commissioner that in the context
of arrangements among the creditors of IDBH, and given that they no
longer controlled the Clal Insurance Enterprises Group, the
authorization previously issued by the Insurance Commissioner for
control of these entities was terminated, including, with respect
to Clal Insurance, Clal Credit Insurance and Clal Pension and
Provident Funds. IDBH undertook to supplement (or to cause its
controlled affiliates to supplement) the required equity of the
insurers in compliance with the Capital Regulations, subject to the
a cap of 50% of the required capital of an insurer, and that the
obligation will take effect only if the insurer’s equity is
determined to be negative, and such funding amount will then be
equal to the amount of negative capital, up to the 50%
cap.
In addition, IDBH undertook to
contribute to the equity of Clal Pension and Provident Funds up to
the amount prescribed by the Provident Fund Regulations, for as
long as IDBH is the controlling shareholder of the institutional
entities. The authorization specifies conditions and imposes
restrictions on the ability of a holding entity to impose liens on
the equity of IDBD’s institutional entities it holds. The
former controlling shareholders were also required, as long as any
liens existed on their equity interest of IDBH, to ensure that Clal
Insurance Enterprises complied with applicable capital
requirements, such that the equity of Clal Insurance Enterprises at
no time was less than the product of the holding rate of Clal
Insurance Enterprises in Clal Insurance and 140% of the required
minimum equity of Clal Insurance, calculated according to the
Capital Regulations on September 30, 2005 (as the holding rate was
linked to the CPI of September 2005).
At the end of the reporting period,
the required minimum capital of Clal Insurance Enterprises was NIS
2.9 billion, greater that the amount required based on the
foregoing calculation. The capital requirement is calculated on the
basis of the financial statements of Clal Insurance Enterprises.
Following termination of the control authorization, the former
controlling shareholders have questioned whether the capital
requirements applicable to Clal Insurance Enterprises thereunder
continue to apply.
134
Clal Insurance is committed to
finding a strategy to supplement its required equity in compliance
with the Capital Regulations if the equity of Clal Credit Insurance
becomes negative, and as long as Clal Insurance is the controlling
shareholder of Clal Credit Insurance. Clal Insurance is committed
to supplement the equity of Clal Pension and Provident Funds as
necessary to ensure it complies with the minimum amount required by
Income Tax Regulations (Rules for Approval and Management of
Provident Funds), 1964 (“Income Tax Regulations”). This
commitment is valid as long as Clal Insurance controls, directly or
indirectly, Clal Pension and Provident Funds.
In February 2012, Supervision of
Financial Services Regulations (Provident Funds) (Minimum Capital
Required of a Management Company of a Provident Fund or Pension
Fund), 2012, was published along with Income Tax Regulations (Rules
for Approval and Management of Provident Funds) (Amendment 2), 2012
(“new regulations”).
Pursuant to the new regulations, the
capital requirements for management companies were expanded to
include capital requirements based on the volume of assets under
management and applicable annual expenses, but not less than the
initial capital of NIS 10 million. In addition, liquidity
requirements were also prescribed. A fund management company may
distribute dividends only to the extent of any excess above the
minimum amount of equity required by said regulations. In addition,
a fund management company must provide additional capital in
respect of controlled management companies. As at the end of the
reporting period, the management companies controlled by Clal
Insurance have capital balances in excess of the minimum capital
required by the capital regulations for management companies. In
light of capital regulations for management companies and in order
to finance the expansion of operating and investing activities of
Clal Pension and Provident Funds, the Boards of Directors of Clal
Insurance and Clal Pension and Provident Funds in 2015 and 2014
approved an subscribed shares of Clal Pension and Provident Funds
in consideration for NIS 100 million and NIS 80 million,
respectively.
Anti-Money Laundering.
In
September 2015, a draft Anti-Money Laundering Order was proposed
which seeks to expand its application to certain provident funds,
and reduced the amounts of accumulations, deposits and withdrawals
subject to reporting. Furthermore, the draft order specifies a
‘know your customer’ process that must be undertaken
before issuing a life insurance policy or opening a provident fund.
In October 2015, a draft addendum to the Anti-Money Laundering Law,
5776-2015 was published to provide for changes to existing law that
set forth stricter criminal penalties under the Anti-Money
Laundering Law and set forth provisions for sharing of information
between the Anti-Money Laundering Authority and the insurance
commissioner. In the evaluation of Clal Insurance, the draft order
and draft bill may adversely affect the sale of its
products.
135
C. Organizational
Structure
The following table presents
information relating to our ownership interest and the percentage
of our consolidated total net revenues represented by our
subsidiaries as of June 30, 2017:
|
|
|
|
% of
ownership interest held
|
||
|
Name of the
entity
|
Country
|
Main activity
|
06.30.2017
|
06.30.2016
|
06.30.2015
|
|
IRSA
’
s direct interest:
|
|
|
|
|
|
|
IRSA CP
(1)
|
Argentina
|
Real
estate
|
94.61
%
|
94.61
%
|
95.80
%
|
|
E-Commerce Latina
S.A.
|
Argentina
|
Investment
|
100.00
%
|
100.00
%
|
100.00
%
|
|
Efanur
S.A.
|
Uruguay
|
Investment
|
100.00
%
|
100.00
%
|
100.00
%
|
|
Hoteles Argentinos
S.A.
|
Argentina
|
Hotel
|
80.00
%
|
80.00
%
|
80.00
%
|
|
Inversora
Bol’var S.A.
|
Argentina
|
Investment
|
100.00
%
|
100.00
%
|
100.00
%
|
|
Llao Llao Resorts
S.A. (2)
|
Argentina
|
Hotel
|
50.00
%
|
50.00
%
|
50.00
%
|
|
Nuevas Fronteras
S.A.
|
Argentina
|
Hotel
|
76.34
%
|
76.34
%
|
76.34
%
|
|
Palermo Invest
S.A.
|
Argentina
|
Investment
|
100.00
%
|
100.00
%
|
100.00
%
|
|
Ritelco
S.A.
|
Uruguay
|
Investment
|
100.00
%
|
100.00
%
|
100.00
%
|
|
Solares de Santa
María S.A. (3)
|
Argentina
|
Real
estate
|
-
|
-
|
100.00
%
|
|
Tyrus
S.A.
|
Uruguay
|
Investment
|
100.00
%
|
100.00
%
|
100.00
%
|
|
Unicity S.A.
(3)
|
Argentina
|
Investment
|
-
|
-
|
100.00
%
|
|
IRSA CP
’
s direct interest:
|
|
|
|
|
|
|
Arcos del Gourmet
S.A.
|
Argentina
|
Real
estate
|
90.00
%
|
90.00
%
|
90.00
%
|
|
Emprendimiento
Recoleta S.A.
|
Argentina
|
Real
estate
|
53.68
%
|
53.68
%
|
53.68
%
|
|
Fibesa S.A.
(4)
|
Argentina
|
Real
estate
|
100.00
%
|
100.00
%
|
100.00
%
|
|
Panamerican Mall
S.A.
|
Argentina
|
Real
estate
|
80.00
%
|
80.00
%
|
80.00
%
|
|
Shopping
Neuquén S.A.
|
Argentina
|
Real
estate
|
99.92
%
|
99.14
%
|
99.14
%
|
|
Torodur
S.A.
|
Uruguay
|
Investment
|
100.00
%
|
100.00
%
|
100.00
%
|
|
EHSA
|
Argentina
|
Investment
|
70.00
%
|
-
|
-
|
|
Tyrus S.A.
’
s direct interest:
|
|
|
|
|
|
|
DFL (4)
|
Bermudas
|
Investment
|
91.57
%
|
91.57
%
|
91.57
%
|
|
I Madison
LLC
|
USA
|
Investment
|
100.00
%
|
100.00
%
|
100.00
%
|
|
IRSA Development
LP
|
USA
|
Investment
|
100.00
%
|
100.00
%
|
100.00
%
|
|
IRSA International
LLC
|
USAs
|
Investment
|
100.00
%
|
100.00
%
|
100.00
%
|
|
Jiwin
S.A.
|
Uruguay
|
Investment
|
100.00
%
|
100.00
%
|
100.00
%
|
|
Liveck
S.A.
|
Uruguay
|
Investment
|
100.00
%
|
100.00
%
|
100.00
%
|
|
Real Estate
Investment Group IV LP (REIG IV)
|
Bermudas
|
Investment
|
100.00
%
|
100.00
%
|
100.00
%
|
|
Real Estate
Investment Group V LP
|
Bermudas
|
Investment
|
100.00
%
|
100.00
%
|
100.00
%
|
|
Real Estate
Strategies LLC
|
USA
|
Investment
|
100.00
%
|
100.00
%
|
100.00
%
|
|
Efanur S.A.'s direct
interest:
|
|
|
|
|
|
|
Real Estate
Strategies LP
|
Bermudas
|
Investment
|
66.83
%
|
66.83
%
|
66.83
%
|
|
DFL's direct
interest:
|
|
|
|
|
|
|
IDB Development
Corporation Ltd.
|
Israel
|
Investment
|
68.28
%
|
68.28
%
|
-
|
|
IDBD's direct
interest:
|
|
|
|
|
|
|
Discount Investment
Corporation Ltd. (5)
|
Israel
|
Investment
|
77.25
%
|
76.43
%
|
-
|
|
IDB Tourism (2009)
Ltd.
|
Israel
|
Tourism
services
|
100.00
%
|
100.00
%
|
-
|
|
IDB Group Investment
Inc.
|
Israel
|
Investment
|
100.00
%
|
100.00
%
|
-
|
|
DIC's direct
interest:
|
|
|
|
|
|
|
Property &
Building Corporation Ltd.
|
Israel
|
Investment
|
64.44
%
|
76.45
%
|
-
|
|
Shufersal
Ltd.
|
Israel
|
Investment
|
54.19
%
|
52.95
%
|
-
|
|
Koor Industries
Ltd.
|
Israel
|
Investment
|
100.00
%
|
100.00
%
|
-
|
|
Cellcom Israel Ltd.
(6)
|
Israel
|
Investment
|
42.26
%
|
41.77
%
|
-
|
|
Elron Electronic
Industries Ltd.
|
Israel
|
Investment
|
50.32
%
|
50.32
%
|
-
|
|
Bartan Holdings and
Investments Ltd.
|
Israel
|
Investment
|
55.68
%
|
55.68
%
|
-
|
|
Epsilon Investment
House Ltd.
|
Israel
|
Investment
|
68.75
%
|
68.75
%
|
-
|
136
(1)
Includes
interest held through Tyrus S.A. On October 27, 2017, we reported
that it has been completed the sale in the secondary market of
2,560,000 ADSs of IRSA CP, which represents 8.1% of IRSA CP. For
more information please see
“Recent developments – Selling of
IRSA CP’ ADSs.”
(2)
The
Company has
consolidated the investment in Llao Llao Resorts S.A. considering
its equity interest and a shareholder agreement that confers it
majority of votes in the decision making
process.
(3)
Were
merged on July 1,
2015.
(4)
In
cludes interest
held through Ritelco S.A.
(5)
Includes Tyrus's
equity interest held through DFL.
(6)
D
IC considers it
exercises effective control over Cellcom because DIC is the group
with the higher percentage of votes vis-à-vis other
shareholders, also taking into account the historic voting
performance in the Shareholders’
Meetings.
D. Property,
Plant and Equipment
In the ordinary course of business,
the leases property or spaces for administrative or commercial use
both in Argentina and Israel under operating lease arrangements.
The agreements entered into include several clauses, including but
not limited, to fixed, variable or adjustable
payments.
The following table sets forth
certain information about our properties for the Operation Center
in Argentina as of June 30, 2017:
|
Property
(6)
|
Date of
Acquisition
|
Leasable/
Sale m2
(1)
|
Location
|
Net
Book
Value
Ps.
(2)
|
Use
|
Occupancy
rate
(7)
|
|
Edificio
República
|
Apr-08
|
19,885
|
City of Buenos
Aires
|
1,534
|
Office Rental
|
95
%
|
|
Bankboston
Tower
|
Aug-07
|
14,873
|
City of Buenos
Aires
|
1,148
|
Office Rental
|
100
%
|
|
Bouchard 551
|
Mar-07
|
0
|
City of Buenos
Aires
|
55
|
Office Rental
|
-
|
|
Intercontinental
Plaza
|
Nov-97
|
3,876
|
City of Buenos
Aires
|
80
|
Office Rental
|
100
%
|
|
Bouchard 710
|
Jun-05
|
15,014
|
City of Buenos
Aires
|
1,077
|
Office Rental
|
100
%
|
|
Dot Building
|
Nov-06
|
11,242
|
City of Buenos
Aires
|
751
|
Office Rental
|
100
%
|
|
Santa María del
Plata
|
Oct-97
|
116,100
|
City of Buenos
Aires
|
442
|
Other Rentals
|
91
%
|
|
San Martín (ex Nobleza
Picardo)
|
May-11
|
109,610
|
Province of Buenos Aires,
Argentina
|
739
|
Other Rentals
|
94
%
|
|
Other Properties
(5)
|
N/A
|
N/A
|
City and Province of Buenos
Aires
|
1,339
|
Mainly Rental offices and
properties under development
|
N/A
|
|
Abasto
(3)
|
Nov-99
|
36,795
|
City of Buenos Aires,
Argentina
|
5,374
|
Shopping Mall
|
96.8
%
|
|
Alto Palermo
(3)
|
Dec-97
|
18,945
|
City of Buenos Aires,
Argentina
|
5,064
|
Shopping Mall
|
99.3
%
|
|
Alto Avellaneda
(3)
|
Dec-97
|
36,063
|
Province of Buenos Aires,
Argentina
|
3,277
|
Shopping Mall
|
99.3
%
|
|
Alcorta Shopping
(3)
|
Jun-97
|
15,613
|
City of Buenos Aires,
Argentina
|
2,370
|
Shopping Mall
|
98.1
%
|
|
Patio Bullrich
(3)
|
Oct-98
|
11,760
|
City of Buenos Aires,
Argentina
|
1,379
|
Shopping Mall
|
97.6
%
|
|
Alto Noa
(3)
|
Nov-95
|
19,059
|
City of Salta,
Argentina
|
678
|
Shopping Mall
|
97.2
%
|
|
Buenos Aires Design
(3)
|
Dec-97
|
13,967
|
City of Buenos Aires,
Argentina
|
25
|
Shopping Mall
|
97.2
%
|
|
Mendoza Plaza
(3)
|
Dec-94
|
42,867
|
Mendoza,
Argentina
|
1,299
|
Shopping Mall
|
97.1
%
|
|
Alto Rosario
(3)
|
Dec-04
|
31,807
|
Santa Fe,
Argentina
|
2,379
|
Shopping Mall
|
99.6
%
|
|
Córdoba Shopping –Villa
Cabrera
(3)(11)
|
Dec-06
|
15,445
|
City of Córdoba,
Argentina
|
759
|
Shopping Mall
|
98.1
%
|
|
Dot Baires Shopping
(3)
|
May-09
|
49,499
|
City of Buenos Aires,
Argentina
|
3,287
|
Shopping Mall
|
99.9
%
|
|
Soleil Premium Outlet
(3)
|
Jul-10
|
15,227
|
Province of Buenos Aires,
Argentina
|
922
|
Shopping Mall
|
100,00
%
|
|
La Ribera Shopping
(3)
|
Aug-11
|
10,054
|
Santa Fe,
Argentina
|
146
|
Shopping Mall
|
97.6
%
|
|
Distrito Arcos
(3)
|
Dec-14
|
14,692
|
City of Buenos Aires,
Argentina
|
891
|
Shopping Mall
|
100,00
%
|
|
Alto Comahue
(3)
|
Mar-15
|
9,766
|
Neuquén,
Argentina
|
802
|
Shopping Mall
|
96.4
%
|
|
Patio Olmos
(3)
|
Sep-97
|
-
|
City of Córdoba,
Argentina
|
147
|
Shopping Mall
|
N/A
|
|
Caballito Plot of
Land
|
Nov-97
|
5,000
|
City of Buenos
Aires
|
209
|
Land Reserve
|
N/A
|
|
Santa María del
Plata
|
Oct-97
|
116,100
|
City of Buenos
Aires
|
3,132
|
Other Rentals
|
91
%
|
|
Luján plot of land
(3)
|
May-08
|
1,160,000
|
Province of Buenos Aires,
Argentina
|
167
|
Mixed uses
|
N/A
|
|
Other Land Reserves
(4)
|
N/A
|
N/A
|
City and Province of Buenos
Aires
|
1,231
|
Land Reserve
|
N/A
|
|
Intercontinental
(7)
|
Nov-97
|
24,000
|
City of Buenos
Aires
|
62
|
Hotel
|
74
%
|
|
Sheraton Libertador
(8)
|
Mar-98
|
37,600
|
City of Buenos
Aires
|
29
|
Hotel
|
73
%
|
|
Llao Llao
(9)(10)
|
Jun-97
|
17,463
|
City of
Bariloche
|
77
|
Hotel
|
52
%
|
(1)
Total leasable area for each property. Excludes
common areas and parking spaces.
(2)
Cost of acquisition or development plus
improvements, less accumulated depreciation, less
allowances.
(3)
Through IRSA CP.
(4)
Includes the following land reserves: Pontevedra
plot; Mariano Acosta, San Luis Plot, Pilar plot and Merlo plot
(through IRSA) and Intercontinental Plot, Dot Adjoining Plot,
Mendoza Plot, Puerto Retiro (through IRSA Commercial
Properties).
(5)
Includes the following properties: Anchorena
665, Anchorena 545 (Chanta IV), Zelaya 3102, 3103 y 3105,
Constitución 1111, Madero 1020, La Adela, Paseo del Sol,
Edificio Phillips, Maipú 1300, Libertador 498 and Suipacha
652.
(6)
Percentage of occupation of each property. The
land reserves are assets that the company remains in the portfolio
for future development.
(7)
Through Nuevas Fronteras S.A.
(8)
Through Hoteles Argentinos S.A.
(9)
Through Llao Llao
Resorts S.A.
(10)
Includes Ps.21,900,000 of book value that
corresponds to “Terreno Bariloche.”
Included in Investment Properties is the cinema
building located at Córdoba Shopping – Villa Cabrera,
which is encumbered by a right of antichresis as a result of loan
due to Empalme by NAI INTERNACIONAL II Inc. The total amount of the
loan outstanding was Ps.12.2 million as of June 30,
2017.
137
The following table sets forth
certain information about our properties for the Operation Center
in Israel as of June 30, 2017:
|
Property
|
Date of
acquisition
|
Location
|
Net book
amount
|
Use
|
|
|
|
|
|
|
|
Tivoli
|
Oct-15
|
United
States
|
4,007
|
Rental
properties
|
|
Kiryat
Ono Mall
|
Oct-15
|
Israel
|
2,299
|
Rental
properties
|
|
Shopping
Center Modi’in A
|
Oct-15
|
Israel
|
1,026
|
Rental
properties
|
|
HSBC
|
Oct-15
|
United
States
|
15,306
|
Rental
properties
|
|
Matam
park - Haifa
|
Oct-15
|
Israel
|
7,121
|
Rental
properties
|
|
Caesarea
- Maichaley Carmel
|
Oct-15
|
Israel
|
0
|
Rental
properties
|
|
Herzeliya North
|
Oct-15
|
Israel
|
4,841
|
Rental
properties
|
|
Gav-Yam
Center - Herzeliya
|
Oct-15
|
Israel
|
3,143
|
Rental
properties
|
|
Neyar
Hadera Modi’in
|
Oct-15
|
Israel
|
997
|
Rental
properties
|
|
Gav yam
park - Beer Sheva
|
Oct-15
|
Israel
|
921
|
Rental
properties
|
|
Haifa
|
Oct-15
|
Israel
|
720
|
Rental
properties
|
|
Ispro
planet -BeerSheva -Phase1
|
Oct-15
|
Israel
|
1,421
|
Rental
properties
|
|
SHARON
|
Oct-15
|
Israel
|
1,364
|
Rental
properties
|
|
Merkaz
|
Oct-15
|
Israel
|
467
|
Rental
properties
|
|
Zafon
|
Oct-15
|
Israel
|
124
|
Rental
properties
|
|
Mizpe
Sapir
|
Oct-15
|
Israel
|
167
|
Rental properties
|
|
Others
|
Oct-15
|
Israel
|
10,410
|
Rental
properties
|
|
Tivoli
|
Oct-15
|
United
States
|
496
|
Undeveloped parcels of
land
|
|
Others
|
Oct-15
|
Israel
|
2,442
|
Undeveloped parcels of
land
|
|
Tivoli
|
Oct-15
|
United
States
|
367
|
Properties under
development
|
|
Ispro
Planet – Beer Sheva – Phase 1
|
Oct-15
|
Israel
|
210
|
Properties under
development
|
|
Others
|
Oct-15
|
Israel
|
1,813
|
Properties under
development
|
|
Total
|
|
|
59,662
|
|
Not applicable.
The following management’s
discussion and analysis of our financial condition and results of
operations should be read together with “Selected
Consolidated Financial Data” and our audited consolidated
financial statements and related notes appearing elsewhere in this
annual report. This discussion and analysis of our financial
condition and results of operations contains forward-looking
statements that involve risks, uncertainties and assumptions. These
forward-looking statements include such words as,
“expects,” “anticipates,”
“intends,” “believes” and similar language.
Our actual results may differ materially and adversely from those
anticipated in these forward-looking statements as a result of many
factors, including without limitation those set forth elsewhere in
this annual report. See Item 3 “Key Information – D.
Risk Factors” for a more complete discussion of the economic
and industry-wide factors relevant to us.
For purposes of the following
discussion and analysis, unless otherwise specified, references to
fiscal years 2017 and 2016 relate to the fiscal years ended June
30, 2017 and 2016, respectively.
138
A.
Operating Results
Evolution of our
Business Segments
Operations Center in
Argentina
Shopping
Malls
Our main purpose is to maximize our
shareholders’ profitability. By using our know-how in the
shopping mall industry in Argentina as well as our leading
position, we seek to generate a sustainable growth of cash flow and
to increase the long-term value of our real estate
assets.
We attempt to take advantage of the
unsatisfied demand for purchase in different urban areas of the
region, as well as of our customers’ purchase experience.
Therefore, we seek to develop new shopping malls in urban areas
with attractive prospects for growth, including Buenos Aires’
Metropolitan area, some cities in the provinces of Argentina and
possibly, other places abroad. To achieve this strategy, the close
business relationship we have had for years with more than 1000
retail companies and trademarks composing our selected group of
tenants is of utmost importance, as it allows us to offer an
adequate mix of tenants for each particular
case.
Offices and
Others
Since the Argentine economic crisis
in 2001 and 2002, there has been limited investment in high-quality
office buildings in Buenos Aires and, as a result, we believe there
is currently substantial demand for those desirable office spaces.
We seek to purchase and develop premium office buildings in
strategically-located business districts in the City of Buenos
Aires and other strategic locations that we believe offer return
and potential for long-term capital gain. We expect to continue our
focus on attracting premium corporate tenants to our office
buildings. Furthermore, we intend to consider new opportunities on
a selective basis to acquire or construct new rental office
buildings.
Sales and
Developments
We seek to purchase undeveloped
properties in densely-populated areas and build apartment complexes
offering green spaces for recreational activities. We also seek to
develop residential communities by acquiring undeveloped properties
with convenient access to the City of Buenos Aires, developing
roads and other basic infrastructure such as electric power and
water, and thenselling lots for the construction of residential
units. After the economic crisis in 2001 and 2002, the scarcity of
mortgage financing restricted the growth in middle class home
purchases, and as a result, we mainly focused on the development of
residential communities for middle and high-income individuals, who
do not need to finance their home purchases. Furthermore, we seek
to continue to acquire undeveloped land at attractive locations
inside and outside Buenos Aires for the purpose of their
appreciation for subsequent sale. We believe that holding a
portfolio of desirable undeveloped plots of land enhances our
ability to make strategic long-term investments and affords us a
valuable “pipeline” of new development projects for
upcoming years.
Hotels
We believe our portfolio of three
luxury hotels is positioned to take advantage of future growth in
tourism and travel in Argentina. We seek to continue with our
strategy to invest in high-quality properties which are operated by
leading international hotel companies to capitalize on their
operating experience and international reputation.
International
In this segment, we seek investments
that represent an opportunity of capital appreciation potential in
the long term. After the international financial crisis in 2008, we
took advantage of the price opportunity in the real estate sector
in the United States and invested in two office buildings in
Manhattan, New York. In 2015, we sold the Madison building and we
hold a 49.9% interest in a US company, whose main asset is the
so-called “Lipstick” office building located in the
City of New York. In addition, jointly with subsidiaries, we hold
28.7% of Condor Hospitality Trust REIT’s voting rights
(NASDAQ: CDOR). We intend to continue evaluating -on a selective
basis- investment opportunities outside Argentina as long as they
offer attractive investment and development options.
139
Financial
Operations and Others
We keep our investment in Banco
Hipotecario, the main mortgage-lending bank in Argentina, as we
believe that we are able to reach good synergies in the long term
with a developed mortgage market.
Operations Center in
Israel
Real
Estate
PBC’s policy is to continue to
implement its growth strategy - to develop its yield bearer
properties and to increase revenues from this activity, which is
its main activity, by building on land, which PBC owns, and
locating new investments opportunities. Concurrently, PBC will act
to realize assets in which their improvement potential was fully
utilized and PBC will also act to maintain a strong financial
stability. In addition, on August 2017, PBC’s Board of
Directors decided to begin the process of examining the realization
of the PBC’s, directly and indirectly, holdings in Ispro
Israeli Building Rental Company Ltd., and within this framework, to
receive proposals from various parties for the acquisition of the
menctioned company.
Supermarkets
Implementation of Shufersal’s
strategy launched in the summer of 2014, the main elements of which
are strengthening of Shufersal’s competitive position,
especially in the discount segment, promotion and significant
growth in Shufersal’s own brand, in which includes the launch
of new products in more leading categories (such as Pharma and
products for infants) alongside improvement in its terms of trade
and relationships with its suppliers, substantial growth in sales
of Shufersal Online and promotion of the digital operation,
including Shufersal App, promotion of growth engines and
development of specialized areas of activity, which includes, inter
alia, development of "Shufersal for Business" (Wholesale Sales
Offers), and further implementation of the streamlining plan and
changes in work procedures while saving costs.
Telecommunications
Cellcom’s business strategy is
divided into the following categories: (1) Cell site construction
and licensing – Cellcom construct cell sites based on its
strategy to expand the geographical coverage and improve the
quality of its network and as necessary to replace cell sites that
need to be removed. (2) Sales and customer care - Cellcom combine
their sales and customer care efforts in order to maximize sales
opportunities alongside accessible and quality customer service.
(3) Marketing - Cellcom marketing strategy emphasizes their
position as a communications group and cellular market leader, its
value for money and its provision of a comprehensive solution for
their customers’ communication needs, by offering services
bundles for families and for the office for small and mid-sized
businesses. Cellcom aims to provide its customers with a
comprehensive quality experience through the various means of
communications that they use, including their mobile handset,
tablet and laptop. Alongside its focus on packages for a fixed sum,
Cellcom has substantially reduced the number of calling plans
available to its customers, thus reducing its back office
operation.
Insurance
The investment managers make use of
an advanced research department and an effective trading execution,
to ensure a competitive advantage in order to achieve a fair
long-term yield for policy holders, maximizing income from
investments in accordance with the company’s risk appetite
and the structure of liabilities in the portfolios.
Others
Includes the assets and income from
other miscellaneous businesses, such as technological developments,
tourism, oil and gas assets, electronics, and other sundry
activities.
Variability of
Results
Income derived from the lease of
office space and retail stores and sales of properties are the two
core sources of our income. The historical results of our
operations have varied over time based on the available
opportunities to acquire and sell properties. No assurance can be
given that our results will not continue to be influenced by
fluctuations in values of properties.
140
For additional information, see
“Comparability of information.”
Critical
Accounting Policies and Estimates
Our significant accounting policies
are stated in Note 2 to our Audited Consolidates Financial
Statements, “Summary of significant accounting
policies.” The discussion below should be read in conjunction
with the referred note. Not all of these significant accounting
policies require management to make subjective or complex judgments
or estimates. The following is intended to provide an understanding
of the policies that management considers critical because of the
level of complexity, judgment or estimations involved in their
application and their impact on the Consolidated Financial
Statements. These judgments involve assumptions or estimates in
respect of future events. Actual results may differ from these
estimates.
141
|
Estimation
|
Main
assumptions
|
Potential
implications
|
|
Business combination - Allocation of
acquisition prices
|
Assumptions regarding timing, amount
of future revenues and expenses, revenue growth, expected rate of
return, economic conditions, discount rate, among
other.
|
Should the assumptions made be
inaccurate, the recognized combination may not be
correct.
|
|
Recoverable amounts of
cash-generating units (even those including goodwill), associates
and assets.
|
The discount rate and the expected
growth rate before taxes in connection with cash-generating
units.
The discount rate and the expected
growth rate after taxes in connection with associates.
Cash flows are determined based on
past experiences with the asset or with similar assets and in
accordance with the Company’s best factual assumption
relative to the economic conditions expected to
prevail.
Business continuity of
cash-generating units.
Appraisals made by external
appraisers and valuators with relation to the assets’ fair
value, net of realization costs (including real estate
assets).
|
Should any of the assumptions made
be inaccurate, this could lead to differences in the recoverable
values of cash-generating units.
|
|
Control, joint control or
significant influence
|
Judgment relative to the
determination that the Company holds an interest in the shares of
investees (considering the existence and influence of significant
potential voting rights), its right to designate members in the
executive management of such companies (usually the Board of
directors) based on the investees’ bylaws; the composition
and the rights of other shareholders of such investees and their
capacity to establish operating and financial policies for
investees or to take part in the establishment
thereof.
|
Accounting treatment of investments
as subsidiaries (consolidation) or associates (equity
method)
|
|
Estimated useful life of intangible
assets and property, plant and equipment
|
Estimated useful life of assets
based on their conditions.
|
Recognition of accelerated or
decelerated depreciation by comparison against final actual
earnings (losses).
|
|
Fair value valuation of investment
properties
|
Fair value valuation made by
external appraisers and valuators. See Note 10.
|
Incorrect valuation of investment
property values
|
|
Income tax
|
The Company estimates the income tax
amount payable for transactions where the Treasury’s Claim
cannot be clearly determined.
Additionally, the Company evaluates
the recoverability of assets due to deferred taxes considering
whether some or all of the assets will not be
recoverable.
|
Upon the improper determination of
the provision for income tax, the Group will be bound to pay
additional taxes, including fines and compensatory and punitive
interest.
|
|
Allowance for doubtful
accounts
|
A periodic review is conducted of
receivables risks in the Company’s clients’ portfolios.
Bad debts based on the expiration of account receivables and
account receivables’ specific conditions.
|
Improper recognition of charges /
reimbursements of the allowance for bad debt.
|
|
Level 2 and 3 financial
instruments
|
Main assumptions used by the Company
are:
●
Discounted projected income by interest
rate
●
Values determined in accordance with the shares
in equity funds on the basis of its Financial Statements, based on
fair value or investment assessments.
●
Comparable market multiple (EV/GMV
ratio).
●
Underlying asset price
(Market price); share price volatility (historical) and market
interest-rate (Libor rate curve).
|
Incorrect recognition of a charge to
income / (loss).
|
|
Probability estimate of
contingent liabilities.
|
Whether more economic resources may
be spent in relation to litigation against the Company; such
estimate is based on legal advisors’ opinions.
|
Charge / reversal of provision in
relation to a claim.
|
142
Overview
We are engaged, directly and
indirectly through subsidiaries and joint ventures, in a range of
diversified activities, primarily in real estate,
including:
i.
the acquisition, development and operation of
shopping malls,
ii.
the acquisition and development of office
buildings and other non-shopping mall properties primarily for
rental purposes,
iii.
the development and sale of residential
properties,
iv.
the acquisition and operation of luxury
hotels,
v.
the acquisition of undeveloped land reserves for
future development or sale, and
vi.
selective investments mostly in Argentina,
United States and Israel.
Effects
of the global macroeconomic factors
Most of our assets are located in
Argentina, where we conduct our operations, and in Israel.
Therefore, our financial condition and the results of our
operations are significantly dependent upon the economic conditions
prevailing in both countries.
The table below shows
Argentina’s GDP growth, inflation rates, dollar exchange
rates, the appreciation (depreciation) of the Peso against the U.S.
dollar, and the appreciation (depreciation) of the NIS against the
U.S. dollar for the indicated periods (inter-annual
information—which is the 12 month period preceding the
dates presented—is presented to conform to our fiscal year
periods).
|
|
Fiscal year
ended June 30,
|
||
|
|
2017
|
2016
|
2015
|
|
|
(inter-annual
data)
|
||
|
GDP
growth(4)
|
2.7
%
|
(3.4
)%
|
1.2
%
|
|
Inflation
(IPIM)(1)
|
14.2
%
|
26.7
%
|
13.6
%
|
|
Inflation
(CPI)
|
21.9
%
|
37.6
%
|
14.0
%
|
|
Depreciation of the
Peso against the U.S. dollar(2)
|
(10.6
)%
|
(65.9
)%
|
(12.0
)%
|
|
Average exchange
rate per US$1.00(3)
|
Ps.16.5800
|
Ps.14.9900
|
Ps.9.0380
|
|
Appreciation/
(depreciation) of the NIS against the U.S. Dollar
|
9.6
%
|
(2.3
)%
|
(10.0
)%
|
(1)
IPIM (Índice de Precios Internos al por
Mayor) is the wholesale price index as measured by the Argentine
Ministry of Treasury.
(2)
Depreciation during fiscal year 2016 was mostly
due to the depreciation of the Peso that took place on
December 17, 2015.
(3)
Represents average of the selling and buying
exchange rate.
(4)
Represents GDP variation as of June 30,
2016.
Sources: INDEC, Argentine Ministry
of Treasury, Ministry of Treasury of the City of Buenos Aires,
Central Bank and Bloomberg.
Argentine GDP increased 2.7% during
our 2017 fiscal year, compared to decrease of 3.4% in our fiscal
2016. Shopping mall sales grew 11.3% in the fiscal 2017 compared to
fiscal 2016. As of June 30, 2017, the unemployment rate was at 8.7%
of the country’s economically active population compared to
9.3% as of June 30, 2016.
Changes in short- and long-term
interest rates, unemployment and inflation rates may reduce the
availability of consumer credit and the purchasing power of
individuals who frequent shopping malls. These factors, combined
with low GDP growth, may reduce general consumption rates at our
shopping malls. Since most of the lease agreements in our shopping
malls, our main source of revenue, require tenants to pay a
percentage of their total sales as rent, a general reduction in
consumption may reduce our revenue. A reduction in the number of
shoppers at our shopping malls and, consequently, in the demand for
parking, may also reduce our revenues from services
rendered.
Regarding Israel’s economy,
and based on information published by OECD, the maintenance of
expansionary monetary and fiscal policies and projected wage
increases will continue to shore up domestic demand, which will
remain
as
the main driver of
growth
.
After picking up to 4%
in 2016, growth is projected to be around 3% in 2017/18. Inflation
is projected to firm up gradually.
143
Effects
of inflation
The following are annual inflation
rates during the fiscal years indicated, based on information
published by the INDEC, an entity dependent of the Argentine
Ministry of Treasury.
|
|
Consumerprice
index
|
Wholesaleprice
index
|
|
|
(inter-annual
data)
|
|
|
Fiscal Year ended
June 30,
|
|
|
|
2013
|
10.5
%
|
13.5
%
|
|
2014
|
15.0
%
|
27.7
%
|
|
2015
|
14.0
%
|
13.6
%
|
|
2016
|
37.6
%
(1)
|
26.7
%
|
|
2017
|
21.9
%
|
14.2
%
|
(1)
Given the modifications to the system that INDEC
uses to measure CPI, there is no data for any price variations from
July 1, 2015 to June 30, 2016. For that reason, we
present aggregate prices from January 1, 2016 to June 30,
2016, published by INDEC.
Continuing increases in the rate of
inflation are likely to have an adverse effect on our operations.
Additionally, the minimum lease payments we receive from our
shopping mall tenants are generally adjusted in accordance with the
CER, an inflation index published by the Central Bank. Although
higher inflation rates in Argentina may increase minimum lease
payments, given that tenants tend to pass on any increases in their
expenses to consumers, higher inflation may lead to an increase in
the prices our tenants charge consumers for their products and
services, which may ultimately reduce their sales volumes and
consequently the portion of rent we receive based on our
tenants’ gross sales.
For the leases of spaces at our
shopping malls we use for most tenants a standard lease agreement,
the terms and conditions of which are described below. However, our
largest tenants generally negotiate better terms for their
respective leases. No assurance can be given that lease terms will
be as set forth in the standard lease agreement.
The rent specified in our leases
generally is the higher of (i) a monthly Base Rent and
(ii) a specified percentage of the store’s monthly gross
sales, which generally ranges between 3% and 10% of such sales. In
addition, pursuant to the rent escalation clause in most of our
leases, a tenant’s Base Rent generally increases between 21%
and 25% on an annual and cumulative basis from the thirteenth month
of effectiveness of the lease. Although many of our lease
agreements contain price adjustment provisions, these are not based
on an official index nor do they reflect the inflation index. In
the event of litigation regarding these adjustment provisions,
there can be no assurance that we may be able to enforce such
clauses contained in our lease agreements. See
“Business—Our Shopping Malls—Principal Terms of
our Leases.”
An increase in our operating costs
caused by higher inflation could have a material adverse effect on
us if our tenants are unable to pay higher rent due to the increase
in expenses. Moreover, the shopping mall business is affected by
consumer spending and by prevailing economic conditions that affect
potential customers. All of our shopping malls and commercial
properties are located in Argentina, and, as a consequence, their
business and that of our tenants could be adversely affected by a
recession in Argentina.
Since the INDEC modified its
methodology used to calculate the CPI in January 2007, there have
been concerns about the accuracy of Argentina’s official
inflation statistics, which led to the creation of the IPCNu in
February 2014 in order to address the quality of official data. See
“Risk Factors—Risks Relating to Argentina—There
were concerns about the accuracy of Argentina’s official
inflation statistics.”
Regarding rates of inflation in
Israel, the Consumer Price Index, according to OECD, showed a 0.5%
increase in the prices in 2014, followed by a deflation of 0.6% in
2015 and 0.5% in 2016. Likewise, inflation projections for 2017 and
2018 are expected to be around 1.0% and 1.7%,
respectively.
Seasonality
Our business is directly affected by
seasonality, influencing the level of our tenants’ sales.
During Argentine summer holidays (January and February) our
tenants’ sales typically reach their lowest level, whereas
during winter holidays (July) and in Christmas (December) they
reach their maximum level. Clothing retailers generally change
their collections in spring and autumn, positively affecting our
shopping malls’ sales. Discount sales at the end of each
season are also one of the main seasonal factors affecting our
business.
144
In Israel retail segment business
results are subject to seasonal fluctuations as a result of the
consumption behavior of the population proximate to the Pesach
holidays (March and/or April) and Rosh Hashanah and Sukkoth
holidays (September and/or October). This also affects the balance
sheet values of inventory, customers and suppliers. Our revenues
from cellular services are usually affected by seasonality with the
third quarter of the year characterized by higher roaming revenues
due to increased incoming and outgoing tourism.
In 2017, the Passover
holiday fell at the middle of April, compared to 2016 when it was
at the end of April. The timing of the holiday affects
Shufersal’s sales and special offers in the second quarter of
2017, compared to last year.
The Passover holiday in
the second quarter of 2017 had a greater effect on
Shufersal’s results than in the corresponding quarter in
2016, therefore analysis of the results for the first half of the
year compared to the corresponding period in 2016 better represents
the changes between the periods.
Effects
of interest rate fluctuations
Most of our U.S. dollar-denominated
debt accrues interest at a fixed rate. An increase in interest
rates will result in a significant increase in our financing costs
and may materially affect our financial condition or our results of
operations.
Effects
of foreign currency fluctuations
A significant portion of our
financial debt is denominated in U.S. dollars. Therefore, a
devaluation or depreciation of the Peso against the U.S. dollar
would increase our indebtedness measured in Pesos and materially
affect our results of operations. Foreign currency exchange rate
fluctuations significantly increase the risk of default on our
lease receivables. Foreign currency exchange restrictions that may
be imposed by the Argentine government could prevent or restrict
our access to U.S. dollars, affecting our ability to service our
U.S. dollar-denominated liabilities.
Typically real estate transactions
in Argentina are negotiated and prices are set in U.S. dollars.
Therefore, a devaluation or depreciation of the Peso against the
U.S. dollar would increase the value of our real estate properties
measured in Pesos and an appreciation of the Peso would have the
opposite effect.
During fiscal 2017 and fiscal 2016,
the Peso depreciated against the U.S. dollar by approximately 11%
and 66%, respectively, which caused an impact on the comparability
of our results of operations for the year ended June 30, 2017
to our results of operations for the year ended June 30, 2016,
primarily in our revenues from office rentals and our net assets
and liabilities denominated in foreign currency. The depreciation
of the Peso affected our assets and liabilities denominated in
foreign currency, as reflected in “financial results,
net” in our consolidated statement of comprehensive
income.
As a result of the depreciation of
the Peso and the discontinuation of the official exchange rate in
December 2015, the seller exchange rate was Ps.9.6880 per US$1.00
on November 30, 2015, Ps.13.0400 per US$1.00 on
December 31, 2015, Ps.15.0400 per US$1.00 on June 30, 2016,
and Ps.16.6300 per US$1.00 on June 30, 2017. See “Local
Exchange Market and Exchange Rates.”
During fiscal year 2017, Israeli New
Shekel appreciated against the U.S. dollar by approximately 9.6%,
while during fiscal year 2016 that currency depreciated by 2.2%,
which caused an impact on the comparability of our results of
IDBD´s operations for the year ended June 30, 2017 to
IDBD´s results of operations for the year ended June 30, 2016.
As of June 30 2017, the offer exchange rate was NIS3.4882 per
US$1.00, and NIS3.5340 per US$1.00 on September 30, 2017. For more
information about the exchange rates, see “Local Exchange
Market and Exchange Rates.”
145
Factors Affecting
Comparability of our Results
Business
Segment Reporting
IFRS 8 requires an entity to report
financial and descriptive information about its reportable
segments, which are operating segments or aggregations of operating
segments that meet specified criteria. Operating segments are
components of an entity about which separate financial information
is available that is evaluated regularly by the CODM. According to
IFRS 8, the CODM represents a function whereby strategic decisions
are made and resources are assigned. The CODM function is carried
out by the President of the Group, Mr. Eduardo S. Elsztain. In
addition, and due to the acquisition of IDBD, two responsibility
levels have been established for resource allocation and assessment
of results of the two operations centers, through executive
committees in Argentina and Israel.
Segment information is reported from
two perspectives: geographic presence and products and services.
From the geographic point of view, the Company has established two
Operations Centers to manage its global interests: Argentina and
Israel. Within each operations center, the Company considers
separately the various activities being developed, which represent
reporting operating segments given the nature of its products,
services, operations and risks. Management believes the operating
segment clustering in each operations center reflects similar
economic characteristics in each region, as well as similar
products and services offered, types of clients and regulatory
environments.
Below is the segment information
prepared as follows:
Operations center in
Argentina
Within this center, the Company
operates in the following segments:
●
The “Shopping Malls” segment
includes the assets and operating results of the activity of
shopping malls portfolio principally comprised of lease and service
revenues related to rental of commercial space and other spaces in
the shopping malls of the Company.
●
The “Offices and others” segment
includes the assets and operating results from lease revenues of
offices and other rental space and other service revenues related
to the office activities.
●
The “Sales and Developments” segment
includes the assets and operating results of the sales of
undeveloped parcels of land and/or trading properties, as the
results related with its development and maintenance. Also included
in this segment are the results of the sale of real property
intended for rent, sales of hotels and other properties included in
the international segment.
●
The "Hotels" segment includes the operating
results of hotels mainly comprised of room, catering and restaurant
revenues.
●
The “International” segment includes
assets and operating profit or loss from business related to
associates Condor and Lipstick. Through these associates, the
Company derives revenue from hotels and an office building in USA,
respectively. Until September 30, 2014, this segment included
revenues from a subsidiary that owned the building located at 183
Madison Ave. in New York, USA, which was sold on that date.
Additionally, until October 11, 2015, this international segment
included results from the investment in IDBD carried at fair
value.
●
The “Financial operations, Corporate and
others” segment primarily includes the financial activities
carried out by BHSA and Tarshop and other residual financial
operations and corporate expenses related to the Operations Center
in Argentina.
Starting in fiscal year 2017, the
CODM reviews certain corporate expenses associated to all segments
of the operations center in Argentina on an aggregate and separate
basis, and such expenses have been accounted for under Other
Segments and Corporate. As of June 2016 and 2015, the segment
information has been retrospectively recast for comparability
purposes.
The assets’ categories
examined by the CODM are: investment properties, property, plant
and equipment, trading properties, inventories, right to receive
future units under barter agreements, investment in associates and
goodwill. The sum of these assets, classified by business segment,
is reported under “assets by segment.” Assets are
allocated to each segment based on the operations and/or their
physical location.
146
Within the operations center in
Argentina, most revenue from its operating segments is derived
from, and their assets are located in, Argentina, except for
earnings of associates included in the “International”
segment located in USA.
Revenues for each reporting segments
derive from a large and diverse client base and, therefore, there
is no revenue concentration in any particular segment.
Operations center in
Israel
Within this center, the Company
operates in the following segments:
●
The “Real Estate” segment includes
mainly assets and operating income derived from business related to
the subsidiary PBC. Through PBC, the Company operates rental
properties and residential properties in Israel, United States and
other parts of the world and carries out commercial projects in Las
Vegas, USA.
●
The “Supermarkets” segment includes
assets and operating income derived from the business related to
the subsidiary Shufersal. Through Shufersal, the Company mainly
operates a supermarket chain in Israel.
●
The “Telecommunications” segment
includes assets and operating income derived from the business
related to the subsidiary Cellcom. Cellcom is a provider of
telecommunication services and its main activities include the
provision of mobile phone services, fixed line phone services, data
and Internet, among others.
●
The “Insurance” segment includes the
investment in Clal. This company is one of the most important
insurance groups in Israel, and is mainly engaged in pension and
social security insurance, among others. As stated in Note 14, the
Company does not have control over Clal; therefore, the business is
not consolidated on a line-by-line basis but rather reported in a
single line as a financial asset held for sale and valued at fair
value, as required by the IFRS.
●
The “Others” segment includes the
assets and income derived from other diverse business activities,
such as technological developments, tourism, oil and gas assets,
electronics, and others.
The CODM periodically reviews the
results and certain asset categories and assesses performance of
operating segments of this operations center based on a measure of
profit or loss of the segment composed by the operating income plus
the equity in earnings of joint ventures and associates. The
valuation criteria used in preparing this information are
consistent with IFRS standards used for the preparation of the
Consolidated Financial Statements.
The Company consolidates results
derived from its operations center in Israel with a three month
lag, adjusted for the effects of significant transactions. Hence,
IDBD’s results for the period extending from October 11, 2015
(acquisition date) through March 31, 2016 are included under
comprehensive income of the Company for the fiscal year ended June
30, 2016. For the fiscal year ended June 30, 2017, a full
twelve-month period is consolidated, also with a three-month lag
and adjusted for the effects of significant
transactions.
Goods and services exchanged between
segments are calculated on the basis of market prices. Intercompany
transactions between segments, if any, are eliminated.
As to those business segments
involving the operations center in Argentina where assets are
reported under the proportional consolidation method, each reported
asset includes the proportional share of the Company in the same
class of assets of the associates and/or joint ventures. Only as an
example, the amount of investment properties reported includes (i)
the balance of investment properties as stated in the Statement of
Financial Position, plus (ii) the Company’s share in the
balances of investment properties of joint ventures.
Within the operations center in
Israel, most revenue from its operating segments are derived from,
and their assets are located in, Israel, except for part of
earnings from the Real Estate segment, which are generated from
activities outside Israel, mainly in USA.
Below is a summary of the Companys
lines of business for the years ended June 30, 2017, 2016 and
2015:
147
Business Segment
Reporting
Operations Center in
Argentina
|
|
June 30,
2017
|
||
|
|
Operations
Center in Argentina
|
Operations
Center in Israel
|
Total
|
|
Revenues
|
4,311
|
68,422
|
72,733
|
|
Costs
|
(912
)
|
(49,110
)
|
(50,022
)
|
|
Gross
profit
|
3,399
|
19,312
|
22,711
|
|
Net gain from fair value
adjustments of investment properties
|
4,271
|
374
|
4,645
|
|
General and administrative
expenses
|
(721
)
|
(3,135
)
|
(3,856
)
|
|
Selling
expenses
|
(355
)
|
(13,093
)
|
(13,448
)
|
|
Other operating results,
net
|
(68
)
|
(196
)
|
(264
)
|
|
Profit
from operations
|
6,526
|
3,262
|
9,788
|
|
Share of (loss) / profit of
associates and joint ventures
|
(94
)
|
105
|
11
|
|
Segment
profit
|
6,432
|
3,367
|
9,799
|
|
Reportable
assets
|
44,885
|
178,964
|
223,849
|
|
Reportable
liabilities
|
-
|
(155,235
)
|
(155,235
)
|
|
Net
reportable assets
|
44,885
|
23,729
|
68,614
|
|
|
June 30,
2016 (recast)
|
||
|
|
Operations
Center in Argentina
|
Operations
Center in Israel
|
Total
|
|
Revenues
|
3,289
|
27,077
|
30,366
|
|
Costs
|
(658
)
|
(19,252
)
|
(19,910
)
|
|
Gross
Profit
|
2,631
|
7,825
|
10,456
|
|
Net gain / (loss) from fair
value adjustments of investment properties
|
18,209
|
(271
)
|
17,938
|
|
General and administrative
expenses
|
(554
)
|
(1,293
)
|
(1,847
)
|
|
Selling
expenses
|
(264
)
|
(5,442
)
|
(5,706
)
|
|
Other operating results,
net
|
(12
)
|
(32
)
|
(44
)
|
|
Profit
from operations
|
20,010
|
787
|
20,797
|
|
Share of (loss) / profit of
associates and joint ventures
|
127
|
123
|
250
|
|
Segment
profit
|
20,137
|
910
|
21,047
|
|
Reportable
assets
|
39,294
|
147,470
|
186,764
|
|
Reportable
liabilities
|
-
|
(132,989
)
|
(132,989
)
|
|
Net
reportable assets
|
39,294
|
14,481
|
53,775
|
|
|
June 30,
2015 (recast)
|
||
|
|
Operations
Center in Argentina
|
Operations
Center in Israel
|
Total
|
|
Revenues
|
2,548
|
-
|
2,548
|
|
Costs
|
(481
)
|
-
|
(481
)
|
|
Gross
Profit
|
2,067
|
-
|
2,067
|
|
Net gain from fair value
adjustments of investment properties
|
4,007
|
-
|
4,007
|
|
General and administrative
expenses
|
(378
)
|
-
|
(378
)
|
|
Selling
expenses
|
(196
)
|
-
|
(196
)
|
|
Other operating results,
net
|
33
|
-
|
33
|
|
Profit
from operations
|
5,533
|
-
|
5,533
|
|
Share of loss of associates
and joint ventures
|
(858
)
|
-
|
(858
)
|
|
Segment
profit
|
4,675
|
-
|
4,675
|
|
Reportable
assets
|
23,052
|
-
|
23,052
|
|
Reportable
liabilities
|
-
|
-
|
-
|
|
Net
reportable assets
|
23,052
|
-
|
23,052
|
148
Below is a summarized analysis of
the lines of business of Company’s operations center in
Argentina for the fiscal year ended June 30, 2017:
|
|
June 30,
2017
|
||||||
|
|
Operations
Center in Argentina
|
||||||
|
|
Shopping
Malls
|
Offices
and others
|
Sales
and developments
|
Hotels
|
International
|
Financial
operations, Corporate and others
|
Total
|
|
Revenues
|
3,043
|
443
|
99
|
725
|
-
|
1
|
4,311
|
|
Costs
|
(350
)
|
(33
)
|
(43
)
|
(486
)
|
-
|
-
|
(912
)
|
|
Gross
profit
|
2,693
|
410
|
56
|
239
|
-
|
1
|
3,399
|
|
Net gain from fair value
adjustments of investment properties
|
2,068
|
1,354
|
849
|
-
|
-
|
-
|
4,271
|
|
General and administrative
expenses
|
(261
)
|
(33
)
|
(32
)
|
(135
)
|
(78
)
|
(182
)
|
(721
)
|
|
Selling
expenses
|
(188
)
|
(34
)
|
(16
)
|
(94
)
|
-
|
(23
)
|
(355
)
|
|
Other operating results,
net
|
(59
)
|
4
|
(36
)
|
(1
)
|
27
|
(3
)
|
(68
)
|
|
Profit /
(loss) from operations
|
4,253
|
1,701
|
821
|
9
|
(51
)
|
(207
)
|
6,526
|
|
Share of profit / (loss) of
joint ventures and associates
|
-
|
-
|
14
|
-
|
(196
)
|
88
|
(94
)
|
|
Segment
profit / (loss)
|
4,253
|
1,701
|
835
|
9
|
(247
)
|
(119
)
|
6,432
|
|
|
|
|
|
|
|
|
|
|
Investment
properties
|
28,799
|
7,669
|
4,739
|
-
|
-
|
-
|
41,207
|
|
Property, plant and
equipment
|
55
|
40
|
-
|
157
|
2
|
-
|
254
|
|
Trading
properties
|
-
|
-
|
587
|
-
|
-
|
-
|
587
|
|
Goodwill
|
1
|
36
|
-
|
-
|
-
|
-
|
37
|
|
Right to receive future
units under barter agreements
|
-
|
-
|
47
|
-
|
-
|
-
|
47
|
|
Inventories
|
23
|
1
|
-
|
10
|
-
|
-
|
34
|
|
Investments in joint
ventures and associates
|
-
|
113
|
95
|
-
|
570
|
1,941
|
2,719
|
|
Operating
assets
|
28,878
|
7,859
|
5,468
|
167
|
572
|
1,941
|
44,885
|
From all the revenues corresponding
to the operations Center in Argentina, the 100% are originated in
Argentina. No external client represents 10% or more of revenue of
any of the reportable segments.
From all of the assets corresponding
to the operations Center in Argentina segments, Ps.44,123 million
are located in Argentina and Ps.762 million in other countries,
principally in the United States for Ps.570 million and Uruguay for
Ps.192 million.
149
Below is a summarized analysis of
the lines of business of Company’s operations center in
Argentina for the fiscal year ended June 30, 2016:
|
|
June 30,
2016 (recast)
|
||||||
|
|
Operations
Center in Argentina
|
||||||
|
|
Shopping
Malls
|
Offices
and others
|
Sales
and developments
|
Hotels
|
International
|
Financial
operations, Corporate and others
|
Total
|
|
Revenues
|
2,406
|
340
|
8
|
534
|
-
|
1
|
3,289
|
|
Costs
|
(256
)
|
(21
)
|
(20
)
|
(361
)
|
-
|
-
|
(658
)
|
|
Gross
profit / (loss)
|
2,150
|
319
|
(12
)
|
173
|
-
|
1
|
2,631
|
|
Net gain from fair value
adjustments of investment properties
|
16,132
|
1,304
|
773
|
-
|
-
|
-
|
18,209
|
|
General and administrative
expenses
|
(179
)
|
(24
)
|
(23
)
|
(103
)
|
(91
)
|
(134
)
|
(554
)
|
|
Selling
expenses
|
(145
)
|
(8
)
|
(23
)
|
(69
)
|
-
|
(19
)
|
(264
)
|
|
Other operating results,
net
|
(63
)
|
(6
)
|
(34
)
|
(2
)
|
92
|
1
|
(12
)
|
|
Profit /
(loss) from operations
|
17,895
|
1,585
|
681
|
(1
)
|
1
|
(151
)
|
20,010
|
|
Share of profit / (loss) of
joint ventures and associates
|
-
|
20
|
5
|
-
|
(129
)
|
231
|
127
|
|
Segment
profit / (loss)
|
17,895
|
1,605
|
686
|
(1
)
|
(128
)
|
80
|
20,137
|
|
|
|
|
|
|
|
|
|
|
Investment
properties
|
26,613
|
5,786
|
3,975
|
-
|
-
|
-
|
36,374
|
|
Property, plant and
equipment
|
49
|
17
|
2
|
156
|
2
|
-
|
226
|
|
Trading
properties
|
-
|
-
|
598
|
-
|
-
|
-
|
598
|
|
Goodwill
|
7
|
4
|
-
|
-
|
-
|
-
|
11
|
|
Right to receive future
units under barter agreements
|
-
|
-
|
90
|
-
|
-
|
-
|
90
|
|
Inventories
|
19
|
-
|
1
|
8
|
-
|
-
|
28
|
|
Investments in joint
ventures and associates
|
-
|
59
|
62
|
-
|
143
|
1,703
|
1,967
|
|
Operating
assets
|
26,688
|
5,866
|
4,728
|
164
|
145
|
1,703
|
39,294
|
From all the revenues corresponding
to the operations Center in Argentina, the 100% are originated in
Argentina. No external client represents 10% or more of revenue of
any of the reportable segments.
From all of the assets corresponding
to the operations Center in Argentina segments, Ps.38,991 million
are located in Argentina and Ps.303 million in other countries,
principally in the United States for Ps.145 million and Uruguay for
Ps.158 million.
150
Below is a summarized analysis of
the lines of business of Company’s operations center in
Argentina for the fiscal year ended June 30, 2015:
|
|
June 30,
2015 (recast)
|
||||||
|
|
Operations
Center in Argentina
|
||||||
|
|
Shopping
Malls
|
Offices
and others
|
Sales
and developments
|
Hotels
|
International
|
Financial
operations, Corporate and others
|
Total
|
|
Revenues
|
1,778
|
333
|
15
|
396
|
26
|
-
|
2,548
|
|
Costs
|
(164
)
|
(13
)
|
(19
)
|
(278
)
|
(7
)
|
-
|
(481
)
|
|
Gross
profit / (loss)
|
1,614
|
320
|
(4
)
|
118
|
19
|
-
|
2,067
|
|
Net gain from fair value
adjustments of investment properties
|
729
|
1,871
|
1,407
|
-
|
-
|
-
|
4,007
|
|
General and administrative
expenses
|
(136
)
|
(3
)
|
(3
)
|
(78
)
|
(56
)
|
(102
)
|
(378
)
|
|
Selling
expenses
|
(113
)
|
(13
)
|
(2
)
|
(52
)
|
-
|
(16
)
|
(196
)
|
|
Other operating results,
net
|
(49
)
|
(117
)
|
(13
)
|
-
|
214
|
(2
)
|
33
|
|
Profit /
(loss) from operations
|
2,045
|
2,058
|
1,385
|
(12
)
|
177
|
(120
)
|
5,533
|
|
Share of profit / (loss) of
joint ventures and associates
|
-
|
5
|
1
|
1
|
(1,020
)
|
155
|
(858
)
|
|
Segment
profit / (loss)
|
2,045
|
2,063
|
1,386
|
(11
)
|
(843
)
|
35
|
4,675
|
|
|
|
|
|
|
|
|
|
|
Investment
properties
|
10,415
|
5,460
|
3,694
|
-
|
-
|
-
|
19,569
|
|
Property, plant and
equipment
|
48
|
23
|
1
|
165
|
1
|
-
|
238
|
|
Trading
properties
|
-
|
-
|
149
|
-
|
-
|
-
|
149
|
|
Goodwill
|
7
|
4
|
-
|
-
|
-
|
-
|
11
|
|
Right to receive future
units under barter agreements
|
-
|
-
|
90
|
-
|
-
|
-
|
90
|
|
Inventories
|
16
|
-
|
-
|
7
|
-
|
-
|
23
|
|
Investments in joint
ventures and associates
|
-
|
43
|
47
|
-
|
1,478
|
1,404
|
2,972
|
|
Operating
assets
|
10,486
|
5,530
|
3,981
|
172
|
1,479
|
1,404
|
23,052
|
From all revenues corresponding to
the operations Center in Argentina Ps.2,522 million are generated
in Argentina and Ps.26 million in USA. No external client
represents 10% or more of revenue of any of the reportable
segments.
From all of the assets corresponding
to the operations Center in Argentina segments, Ps.21,467 million
are located in Argentina and Ps.1,585 million in other countries,
principally in the United States for Ps.1,479 million and Uruguay
for Ps.106 million.
151
Below is a summarized analysis of
the lines of business of Company’s operations center in
Israel for the year ended June 30, 2017:
|
|
Real
Estate
|
Supermarkets
|
Telecommunications
|
Insurance
|
Others
|
Total
|
|
Revenues
|
4,918
|
47,277
|
15,964
|
-
|
263
|
68,422
|
|
Costs
|
(2,333
)
|
(35,432
)
|
(11,183
)
|
-
|
(162
)
|
(49,110
)
|
|
Gross
Profit
|
2,585
|
11,845
|
4,781
|
-
|
101
|
19,312
|
|
Net gain from fair value
adjustments of investment properties
|
374
|
-
|
-
|
-
|
-
|
374
|
|
General and administrative
expenses
|
(290
)
|
(627
)
|
(1,592
)
|
-
|
(626
)
|
(3,135
)
|
|
Selling
expenses
|
(91
)
|
(9,517
)
|
(3,406
)
|
-
|
(79
)
|
(13,093
)
|
|
Other operating results,
net
|
46
|
(52
)
|
(36
)
|
-
|
(154
)
|
(196
)
|
|
Profit /
(loss) from operations
|
2,624
|
1,649
|
(253
)
|
-
|
(758
)
|
3,262
|
|
Share of profit / (loss) of
joint ventures and associates
|
46
|
75
|
-
|
-
|
(16
)
|
105
|
|
Segment
profit / (loss)
|
2,670
|
1,724
|
(253
)
|
-
|
(774
)
|
3,367
|
|
|
|
|
|
|
|
|
|
Operating
assets
|
79,427
|
38,521
|
31,648
|
8,562
|
20,806
|
178,964
|
|
Operating
liabilities
|
(64,100
)
|
(29,239
)
|
(25,032
)
|
-
|
(36,864
)
|
(155,235
)
|
|
Operating
assets (liabilities), net
|
15,327
|
9,282
|
6,616
|
8,562
|
(16,058
)
|
23,729
|
From all revenues corresponding to
the Operations Center in Israel, Ps.1,102 are originated in the
United States and Ps.67,320 in Israel. No external client
represents 10% or more of the revenue of any of the reportable
segments. From all assets corresponding to the Operations Center in
Israel segments, Ps.20,176 are located in USA, Ps.3,678 in India
and the remaining are located in Israel.
Below is a summarized analysis of
the lines of business of Company’s operations center in
Israel for the year ended June 30, 2016 (recast):
|
|
Real
Estate
|
Supermarkets
|
Telecommunications
|
Insurance
|
Others
|
Total
|
|
Revenues
|
1,538
|
18,610
|
6,655
|
-
|
274
|
27,077
|
|
Costs
|
(467
)
|
(14,076
)
|
(4,525
)
|
-
|
(184
)
|
(19,252
)
|
|
Gross
Profit
|
1,071
|
4,534
|
2,130
|
-
|
90
|
7,825
|
|
Net loss from fair value
adjustments of investment properties
|
(271
)
|
-
|
-
|
-
|
-
|
(271
)
|
|
General and administrative
expenses
|
(100
)
|
(203
)
|
(708
)
|
-
|
(282
)
|
(1,293
)
|
|
Selling
expenses
|
(29
)
|
(3,907
)
|
(1,493
)
|
-
|
(13
)
|
(5,442
)
|
|
Other operating results,
net
|
(19
)
|
(13
)
|
-
|
-
|
-
|
(32
)
|
|
Profit /
(loss) from operations
|
652
|
411
|
(71
)
|
-
|
(205
)
|
787
|
|
Share of profit / (loss) of
associates and joint ventures
|
226
|
-
|
-
|
-
|
(103
)
|
123
|
|
Segment
profit / (loss)
|
878
|
411
|
(71
)
|
-
|
(308
)
|
910
|
|
|
|
|
|
|
|
|
|
Operating
assets
|
60,678
|
29,440
|
27,345
|
4,602
|
25,405
|
147,470
|
|
Operating
liabilities
|
(49,576
)
|
(23,614
)
|
(21,657
)
|
-
|
(38,142
)
|
(132,989
)
|
|
Operating
assets (liabilities), net
|
11,102
|
5,826
|
5,688
|
4,602
|
(12,737
)
|
14,481
|
From all revenues corresponding to
the Operations Center in Israel, Ps.512 million are originated in
the United States and Ps.26,565 million in Israel. No external
client represents 10% or more of the revenue of any of the
reportable segments. From all assets corresponding to the
Operations Center in Israel segments, Ps.14,070 million are located
in USA, Ps.786 million in India and the remaining are located in
Israel.
Share of
profit/(loss) of joint ventures of Argentina’s Operating
Center:
As stated in Note 2.3(e) to the
consolidated financial statements as of June 30, 2017 and for the
fiscal years ended June 30, 2016, 2015 and 2014, share of
profit/(loss) of joint ventures Cyrsa S.A. (“Cyrsa”),
Puerto Retiro, Baicom, NPSF, Quality Invest, EHSA and LRSA, are
presented by application of the equity method in the line
“Shares of profit/(loss) of associates and joint
ventures” in the consolidated statement of
income.
However, as indicated in Note 6 to
the consolidated financial statements as of June 30, 2017 and for
the years ended June 30, 2016, 2015 and 2014, in the business
segment reporting, the operating results of these joint ventures
are presented by application of proportionate consolidation. This
method presents the results of joint ventures in the income
statement line by line. The operating results of joint ventures are
allocated to each business segment based on the nature of the
operations that give rise to them. In addition, reporting
contemplates certain transactions between related parties that have
been eliminated at the level of the income statement but are,
nonetheless, representative of genuine revenues and/or costs of
each segment. These transactions include, mainly, leases of spaces
and management fees.
Comparability of
information:
As required by IFRS 3, the
information of IDBD is included in the Consolidated Financial
Statements of the Company as from takeover was secured, that is
from October 11, 2015, and the prior periods are not modified by
this situation. Therefore, the consolidated financial information
for periods after the acquisition is not comparative with prior
periods. Additionally, results for the fiscal year ended June 30,
2017 includes 12 full months of results from IDBD, for the period
beginning April 1, 2016 through March 31, 2017, while results for
the fiscal year ended June 30, 2016 includes the results from IDBD
for the period beginning October 11, 2015 through March 31, 2016;
both adjusted for significant transactions that took place between
April 1
and June 30, 2016 and 2017, respectively. Hence, the result for the
reported periods are not comparable.
Furthermore, during the fiscal year
ended as of June 30, 2016, the Argentine Peso devalued against the
US Dollar and other currencies by around 65%, which has an impact
in comparative information presented in the Financial Statements,
due mainly to the currency exposure of our income and costs from
the “offices and other properties” segment, and our
assets and liabilities in foreign currency.
Certain items from prior fiscal
years have been reclassified for consistency purposes. The loans
granted to associates and joint ventures, with features of
long-term investments, are considered part of the investment in
such associates and joint ventures; as a result, financial income
derived from those loans have been reclassified to present them
net, with the share of profit of associates and joint-ventures in
the amount of Ps.116 million. The Company considers that it is more
accurate and provides more relevant information to users of
Financial Statements.
Additionally, costs associated to
the sale in the supermarket line have been reclassified. They were
previously included under selling expenses and have been
reclassified now to costs in the amount of Ps.151
million.
Operations Center in
Argentina
Shopping Malls
For the fiscal
years ended June 30, 2017 and 2016
During fiscal year 2017 we
maintained the same portfolio of operating shopping malls. For this
reason, there were no material effects on the comparison of
information.
For the fiscal
years ended June 30, 2016 and 2015
During fiscal year 2016 we
maintained the same portfolio of operating shopping
malls.
As it concerns the new shopping
malls inaugurated in fiscal year 2015, “Distrito Arcos”
and “Alto Comahue,” the periods during which profit
from operations was recorded were different in both years. Fiscal
year 2016 includes 12 months of operations of Distrito Arcos and
Alto Comahue, while fiscal year 2015 includes six months and a
half, and three months and a half of operations, respectively.
However, the income from these new developments, both in the income
statement and in the information by segment, was not significant
against the total figures of this segment, for the indicated years.
For this reason, there were no material effects on the comparison
of information.
152
Offices and Others
For the fiscal
years ended June 30, 2017 and 2016
During fiscal year 2017, the
comparability of revenues and costs from the Offices and Others
segment was affected by the partial sales of rental property
allocated to this segment. In this regard, during fiscal year 2017
the Company sold 2,693 sqm in the Intercontinental Plaza building
and several floors at the Maipú 1300 building.
For the fiscal
years ended June 30, 2016 and 2015
During fiscal years ended June 30,
2016 and 2015, the comparability of revenues and costs from the
Offices and Others segment was affected by the partial sale of
rental property allocated to this segment. In this regard, during
fiscal years ended June 30, 2016 and 2015 the Company sold several
floors at the Maipú 1300, Intercontinental Plaza, Bouchard 551
and the entire Dique IV buildings (a leasable area of 30,658 sqm,
accounting for approximately 27% of the total leasable area at the
beginning of the year) and Isla Sirgadero.
Additionally, in December 2014,
there was a transfer within the Company of 83,789 sqm of rental
buildings from IRSA to IRSA PC. This transaction, though at the
consolidated level it did not have effects because it was a related
party transaction, was considered a Business Combination, and
therefore, costs related to this transaction for Ps.110.5 million
were recognized as income during fiscal year 2015 in “Other
operating results, net.”
Sales and Developments
Revenues and costs from this segment
often vary significantly from one fiscal year to another due to the
non-recurrence of different sales transactions performed by the
Company throughout the time.
Hotels
For the fiscal
years ended June 30, 2017, 2016 and 2015
During these fiscal years, there
were no factors affecting comparability.
International
For the fiscal
years ended June 30, 2016 and 2015
The most affected line in terms of
comparability was “Share of profit / (loss) of associates and
joint ventures” for, until October 11, 2015, the profit
(loss) from the investment in IDBD at fair value was reported
within the International segment.
On the other hand, profit from
operations from this segment was also affected, but to a lesser
extent, by the profits (losses) derived from the Madison building,
which was disposed of during fiscal year 2015. No operation
involving this building was accounted for during fiscal year 2016
while operations with this building were included during fiscal
year 2015 until September 2014.
Financial Operations, Corporate and Others
For the fiscal
years ended June 30, 2016 and 2015
During fiscal year 2016 there were
no factors affecting comparability, except for the effect of the
change in the valuation of our investment in Avenida accounted for
during the previous year. No profit from operations was accounted
for during 2016 in relation to this investment, as compared to
fiscal year 2015 when profit from operations was recorded for the
first 3 months of the year.
153
Results of
Operations for the fiscal years ended June 30, 2017 and
2016
Revenues
|
|
Year
ended on June 30, 2017
|
||||
|
Revenues
|
Income
statement
|
Interest
in joint ventures
|
Expenses
and collective promotion fund
|
Inter-segment
eliminations
|
Segment-reporting
|
|
Operations
Center in Argentina
|
(in
millions of Ps.)
|
||||
|
Shopping Malls
|
4,392
|
26
|
(1,375
)
|
-
|
3,043
|
|
Offices and
Others
|
536
|
14
|
(115
)
|
8
|
443
|
|
Sales and
Developments
|
98
|
1
|
-
|
-
|
99
|
|
Hotels
|
723
|
-
|
-
|
2
|
725
|
|
International
|
-
|
-
|
-
|
-
|
-
|
|
Financial Operations,
Corporate and Others
|
1
|
-
|
-
|
-
|
1
|
|
Total
Operations Center in Argentina
|
5,750
|
41
|
(1,490
)
|
10
|
4,311
|
|
|
|
|
|
|
|
|
Operations
Center in Israel
|
|
|
|
|
|
|
Real Estate
|
4,918
|
-
|
-
|
-
|
4,918
|
|
Supermarkets
|
47,277
|
-
|
-
|
-
|
47,277
|
|
Telecommunications
|
15,964
|
-
|
-
|
-
|
15,964
|
|
Insurance
|
-
|
-
|
-
|
-
|
-
|
|
Others
|
263
|
-
|
-
|
-
|
263
|
|
Total
Operations Center in Israel
|
68,422
|
-
|
-
|
-
|
68,422
|
|
Total
revenues
|
74,172
|
41
|
(1,490
)
|
10
|
72,733
|
|
|
Year
ended on June 30, 2016 (recast)
|
||||
|
Revenues
|
Income
statement
|
Interest
in joint ventures
|
Expenses
and collective promotion fund
|
Inter-segment
eliminations
|
Segment-reporting
|
|
Operations
Center in Argentina
|
(in
millions of Ps.)
|
||||
|
Shopping Malls
|
3,487
|
20
|
(1,101
)
|
-
|
2,406
|
|
Offices and
Others
|
422
|
4
|
(93
)
|
7
|
340
|
|
Sales and
Developments
|
3
|
5
|
-
|
-
|
8
|
|
Hotels
|
533
|
-
|
-
|
1
|
534
|
|
International
|
-
|
-
|
-
|
-
|
-
|
|
Financial Operations,
Corporate and Others
|
1
|
-
|
-
|
-
|
1
|
|
Total
Operations Center in Argentina
|
4,446
|
29
|
(1,194
)
|
8
|
3,289
|
|
|
|
|
|
|
|
|
Operations
Center in Israel
|
|
|
|
|
|
|
Real Estate
|
1,538
|
-
|
-
|
-
|
1,538
|
|
Supermarkets
|
18,610
|
-
|
-
|
-
|
18,610
|
|
Telecommunications
|
6,655
|
-
|
-
|
-
|
6,655
|
|
Insurance
|
-
|
-
|
-
|
-
|
-
|
|
Others
|
274
|
-
|
-
|
-
|
274
|
|
Total
Operations Center in Israel
|
27,077
|
-
|
-
|
-
|
27,077
|
|
Total
revenues
|
31,523
|
29
|
(1,194
)
|
8
|
30,366
|
Revenues from sales, leases and
services, increased by Ps. 42,649 million, a 135.3% up from
Ps. 31,523 million during fiscal year 2016 to Ps. 74,172
million during fiscal year 2017 (out of which Ps. 68,422 million
were generated the Operations Center in Israel and Ps. 5,750
million were generated in the Operations Center in
Argentina).
154
Without considering the revenues
from the Operations Center in Israel, revenues from sales, leases
and services increased by 29.3%. Revenues from sales, leases and
services in the operations Center In Israel are not comparable year
to year due to two main factors: (i) the results of operations for
the fiscal year ended June 30, 2016 include only six months of
operations from the operations from the Operations center in
Israel, from October 11, 2015 (the date we acquired control of
IDBD) through March 31, 2016 (adjusted by such material
transactions occurred between April 1, 2016 and June 30, 2016,)
while the results of operations for the fiscal year ended June 30,
2017 include twelve months of operations from the operations
centers in Israel, from April 1, 2016 through March 31, 2017
(adjusted by such material transactions occurred between April 1st,
2017 and June 30, 2017) and (ii) fluctuations between the Israeli
Shekel, the functional currency of the Operation Center in Israel
and the Argentine Peso, the groups reporting currency, i.e. the
Israeli Shekel appreciated approximately 24% from 2016 to
2017.
In turn, revenues from expenses and
collective promotion fund increased by 24.8%, from Ps.1,194 million
(of which Ps.1,101 million are allocated to the Shopping Malls
segment and Ps.93 million are allocated to the Offices and Others
segment within the Operations Center in Argentina) during fiscal
year 2016 to Ps.1,490 million (of which Ps.1,375 million are
allocated to the Shopping Malls segment and Ps.115 million are
allocated to the Offices and Others segment) during fiscal year
2017 for the Operation Center in Argentina.
Furthermore, revenues from interests
in our joint ventures showed a 44.8% increase, up from Ps.29
million during fiscal year 2016 (of which Ps.20 million are
allocated to the Shopping Malls segment, Ps.4 million to the
Offices and Others segment, and Ps.5 million to the Sales and
Developments segment within the Operations Center in Argentina) to
Ps.42 million during fiscal year 2017 (of which Ps.26 million are
allocated to the Shopping Malls segment, Ps.15 million to the
Offices and Others segment, and Ps.1 million to the Sales and
Developments segment within the Operations Center in Argentina)
during fiscal year 2017.
Finally, inter-segment revenues
increased by 12.5%, from Ps.8 million during fiscal year 2016 (of
which Ps.7 million are allocated to the Offices and Others segment
and Ps.1 million to the Hotels segment within the Operations Center
in Argentina) to Ps.9 million during fiscal year 2017 (of which
Ps.7 million are allocated to the Offices and Others segment and
Ps.2 million to the Hotels segment within the Operations Center in
Argentina).
Thus, according to business segment
reporting (taking into consideration the revenues from our joint
ventures and without considering the revenues from expenses and
collective promotion fund or inter-segment revenues), revenues grew
by Ps.42,367 million from Ps.30,366 million during fiscal year 2016
to Ps.72,733 million during fiscal year 2017 (of which Ps.68,422
million are derived from the Operations Center in Israel and
Ps.4,311 million are derived from the Operations Center in
Argentina). Without considering the revenues from the Operations
Center in Israel, revenues, pursuant to business segment reporting,
grew by 31.1%.
Operations Center in Argentina
Shopping Malls
. Revenues from the
Shopping Malls segment rose by 26.5%, up from Ps.2,406 million
during fiscal year 2016 to Ps.3,043 million during fiscal year
2017. This increase was mainly attributable to: (i) a Ps.408
million increase in the revenues from base and percentage rents
stemming from a 19.4% increase in our tenants’ total sales,
up from Ps.28.8 million during fiscal year 2016 to Ps.34.4 million
during fiscal year 2017, (ii) a Ps.55 million increase in revenues
from admission fees, (iii) a Ps.39.5 million increase in revenues
from parking lot, and (iv) a Ps.134.5 million increase in revenues
from commissions, among other items.
Offices and Others
. Revenues from the
Offices and Others segment rose by 30.3%, up from Ps.340 million
during fiscal year 2016 to Ps.443 million during fiscal year 2017.
They were affected by the partial sales of investment properties
that took place during fiscal year 2017, which caused a reduction
in the segment’s total leasable surface area. Rental revenues
rose by 29.3%, up from Ps.331 million during fiscal year ended June
30, 2016 to Ps.428 million during fiscal year ended June 30, 2017,
mainly due to the devaluation.
Sales and Developments
. Revenues from
the Sales and Developments segment increased from Ps.8 million
during fiscal year 2016 to Ps.99 million during fiscal year 2017.
This segment often exhibits significant changes from period to
period because of the non-recurrence of the sales of properties
performed by the Company throughout the time. Such increase is
mainly due to the sales of the floors in the Beruti building and
parking spaces in Rosario.
155
Hotels
. Revenues from our Hotels segment
rose by 35.8%, up from Ps.534 million during fiscal year 2016 to
Ps.725 million during fiscal year 2017, primarily due to an
increase in the average rate per room (measured in Ps.) of our
hotel portfolio.
International
. Revenues from our
International segment showed no significant changes for the
reported periods.
Financial Operations, Corporate and
Others
. Revenues from the Financial Operations, Corporate
and Others segment did not experience significant changes during
the reported periods.
Operations Center in Israel
Real
Estate.
Revenues from the Real estate segment increased from
Ps.1,538 million during fiscal year 2016 to Ps.4,918 million during
fiscal year 2017. Such variation was due to (i) the comparability
of the figures, (ii) a 24% revaluation of the NIS against the
Argentine peso, and (iii) the recording of revenues from the sale
of apartments and real estate is affected by the timing of the
occupation of apartments, which was higher in 2017.
Supermarkets.
Revenues from the
Supermarket segment increased from Ps.18,610 million during fiscal
year 2016 to Ps.47,277 million during fiscal year 2017. Such
variation was due to (i) the comparability of the figures, and (ii)
a 24% revaluation of the NIS against the Argentine
peso.
Telecommunications.
Revenues from the
Telecomunications segment increased from Ps.6,655 million during
fiscal year 2016 to Ps.15,964 million during fiscal year 2017. Such
variation was due to (i) the comparability of the figures and (ii)
a 24% revaluation of the NIS against the Argentine
peso.
Others.
Revenues from the Others segment
decreased from Ps.274 million during fiscal year 2016 to Ps.263
million during fiscal year 2017. Such variation was due to (i) the
comparability of the figures, (ii) a 24% revaluation of the NIS
against the Argentine peso, and (iii) the sale of some revenue
generating assets of DIC.
Costs
|
|
Year
ended on June 30, 2017
|
||||
|
Costs
|
Income
statement
|
Interest
in joint ventures
|
Expenses
and collective promotion fund
|
Inter-segment
eliminations
|
Segment-reporting
|
|
Operations
Center in Argentina
|
(in
millions of Ps.)
|
||||
|
Shopping Malls
|
(1,745
)
|
(4
)
|
1,399
|
-
|
(350
)
|
|
Offices and
Others
|
(141
)
|
(10
)
|
118
|
-
|
(33
)
|
|
Sales and
Developments
|
(39
)
|
(4
)
|
-
|
-
|
(43
)
|
|
Hotels
|
(486
)
|
-
|
-
|
-
|
(486
)
|
|
International
|
-
|
-
|
-
|
-
|
-
|
|
Financial Operations,
Corporate and Others
|
-
|
-
|
-
|
-
|
-
|
|
Total
Operations Center in Argentina
|
(2,411
)
|
(18
)
|
1,517
|
-
|
(912
)
|
|
|
|
|
|
|
|
|
Operations
Center in Israel
|
|
|
|
|
|
|
Real Estate
|
(2,333
)
|
-
|
-
|
-
|
(2,333
)
|
|
Supermarkets
|
(35,432
)
|
-
|
-
|
-
|
(35,432
)
|
|
Telecommunications
|
(11,183
)
|
-
|
-
|
-
|
(11,183
)
|
|
Insurance
|
-
|
-
|
-
|
-
|
-
|
|
Others
|
(162
)
|
-
|
-
|
-
|
(162
)
|
|
Total
Operations Center in Israel
|
(49,110
)
|
-
|
-
|
-
|
(49,110
)
|
|
Total
costs
|
(51,521
)
|
(18
)
|
1,517
|
-
|
(50,022
)
|
156
|
|
Year
ended on June 30, 2016 (recast)
|
||||
|
Costs
|
Income
statement
|
Interest
in joint ventures
|
Expenses
and collective promotion fund
|
Inter-segment
eliminations
|
Segment-reporting
|
|
Operations
Center in Argentina
|
(in
millions of Ps.)
|
||||
|
Shopping Malls
|
(1,361
)
|
(2
)
|
1,113
|
(6
)
|
(256
)
|
|
Offices and
Others
|
(110
)
|
(5
)
|
94
|
-
|
(21
)
|
|
Sales and
Developments
|
(15
)
|
(5
)
|
-
|
-
|
(20
)
|
|
Hotels
|
(361
)
|
-
|
-
|
-
|
(361
)
|
|
International
|
-
|
-
|
-
|
-
|
-
|
|
Financial Operations,
Corporate and Others
|
-
|
-
|
-
|
-
|
-
|
|
Total
Operations Center in Argentina
|
(1,847
)
|
(12
)
|
1,207
|
(6
)
|
(658
)
|
|
|
|
|
|
|
|
|
Operations
Center in Israel
|
|
|
|
|
|
|
Real Estate
|
(467
)
|
-
|
-
|
-
|
(467
)
|
|
Supermarkets
|
(14,076
)
|
-
|
-
|
-
|
(14,076
)
|
|
Telecommunications
|
(4,525
)
|
-
|
-
|
-
|
(4,525
)
|
|
Insurance
|
-
|
-
|
-
|
-
|
-
|
|
Others
|
(184
)
|
-
|
-
|
-
|
(184
)
|
|
Total
Operations Center in Israel
|
(19,252
)
|
-
|
-
|
-
|
(19,252
)
|
|
Total
costs
|
(21,099
)
|
(12
)
|
1,207
|
(6
)
|
(19,910
)
|
Costs increased by Ps.30,422
million, up from Ps.21,099 million during fiscal year 2016 to
Ps.51,521 million during fiscal year 2017 (out of which Ps.49,110
million where generated in the Operations Center in Israel and
Ps.2,411 million were generated in the Operations Center in
Argentina). Without considering the costs from the Operations
Center in Israel, costs rose by 30.5%. Costs as a percentage of
Revenues also increased by 66.9% during fiscal year 2016 to 69.5%
during fiscal year 2017, and such increase is mainly attributable
to the Operations Center in Israel. Without considering the costs
from the Operations Center in Israel, Costs as a percentage of
total revenues experienced a slight increase from 41.5% during
fiscal year 2016 to 41.9% during fiscal year 2017.
The Costs, leases and services in
the Operations Center in Israel are not comparable year to year due
to two main factors: (i) the results of operations for the fiscal
year ended June 30, 2016 include only six months of operations from
the Operations Center in Israel, from October 11, 2015 (the date
control was acquired) through March 31, 2016 (adjusted by such
material transactions occurred between April 1, 2016 and June 30,
2016.) While the results of operations for the fiscal year ended
June 30, 2017 include twelve months of operations from the
Operations Center in Israel, from April 1, 2016 through March 31,
2017 (adjusted by such material transactions occurred between April
1, 2017 and June 30, 2017) and (ii) fluctuations between the
Israeli Shekel, the functional currency of the Operations Center
Israel and the Argentine Peso, the Group´s reporting currency,
i.e. the Israeli Shekel appreciated approximately 24% from 2016 to
2017.
In turn, costs from expenses and
collective promotion fund increased by 25.7%, from Ps.1,207 million
during fiscal year 2016 (of which Ps.1,113 million are allocated to
the Shopping Malls segment and Ps.94 million to the Offices and
Others segment within the Operations Center in Argentina) to
Ps.1,517 million during fiscal year 2017 (of which Ps.1,399 million
are allocated to the Shopping Malls segment and Ps.118 million to
the Offices and Others segment within the Operations Center in
Argentina), mainly due to increased costs originated by our
Shopping Malls, which rose by 25.7% from Ps.1,113 million in fiscal
year 2016 to Ps.1,399 million in fiscal year 2017, mainly as a
result of: (i) an increase in maintenance, security, cleaning,
repair and other expenses of Ps.142 million (caused mainly by price
raises in security and cleaning services and in public utilities
rates); (ii) an increase in salaries, social security charges and
other personnel expenses of Ps.109 million; (iii) an increase in
taxes, rates and contributions, and other expenses of Ps.36
million, among others. Such change was also attributable to an
increase in expenses resulting from the Offices and Others segment
by Ps.24 million, from Ps.94 million during fiscal year 2016 to
Ps.118 million during fiscal year 2017, mainly due to: (i)
maintenance, cleaning expenses, and rentals and expenses and others
in the amount of Ps.21.5 million; (ii) salaries and social security
charges by Ps.6.1 million; (iii) taxes, rates and contributions by
Ps.3.5 million for the Operation Center in Argentina
157
Furthermore, costs from our joint
ventures showed a net increase of 50%, up from Ps.12 million during
fiscal year 2016 (of which Ps.2 million are allocated to the
Shopping Malls segment, Ps.5 million to the Offices and Others
segment, and Ps.5 million to the Sales and Developments segment
within the Operations Center in Argentina) to Ps.18 million during
fiscal year 2017, of which Ps.4 million are allocated to the
Shopping Malls segment, Ps.10 million to the Offices and Others
segment, and Ps.4 million to the Sales and Developments segment
within the Operations Center in Argentina.
Finally, costs from
inter-segment
transactions where
null during fiscal year 2017 while they where amounted Ps.6 during
fiscal year 2016 (which are fully allocated to the Shopping Malls
segment within the Operations Center in
Argentina).
Therefore, according to business
segment reporting (taking into consideration the costs from our
joint ventures and without considering the costs from expenses and
collective promotion fund or costs from inter-segment operations),
costs rose by Ps.30,112 million from Ps.19,910 million during
fiscal year 2016 to Ps.50,022 million during fiscal year 2017 (of
which Ps.49,110 million are attributable to the Operations Center
in Israel and Ps.912 million to the Operations Center in
Argentina). Without considering the costs from the Operations
Center in Israel, costs rose by 38.6% from Ps.658 million in 2016,
to Ps.912 million in 2017. Furthermore, total costs as a percentage
of total revenues, pursuant to business segment reporting,
increased from 65.6% during fiscal year 2016 to 68.8% during fiscal
year 2017, and such increase is mainly attributable to the increase
of Costs related to the Operations Center in Israel. Without
considering the effect of the Operations Center in Israel, total
costs as a percentage of total revenues increased from 20% during
fiscal year 2016 to 21.2% during fiscal year 2017.
Operations Center in Argentina
Shopping Malls
. Costs from the Shopping
Malls segment increased by 36.7%, from Ps.256 million during fiscal
year 2016 to Ps.350 million during fiscal year 2017. This increase
is mainly due to: (i) increased lease and expenses by Ps.41
million; (ii) a Ps.30 million increase in maintenance, security,
cleaning, repair and other expenses; and (iii) a Ps.23 million
increase in salaries, social security charges and other personnel
expenses, among other items. Costs from the Shopping Malls segment,
as a percentage of revenues derived from this segment, increased
from 10.6% during fiscal year 2016 to 11.5% during fiscal year
2017.
Offices and Others
. Costs in the Offices
and Others segment rose by 57.1%, from Ps.21 million during fiscal
year 2016 to Ps.33 million during fiscal year 2017, mainly as a
consequence of: (i) a Ps.3 million increase in taxes, rates and
contributions; (ii) a Ps.2 million increase in fees and payment for
services and (iii) a Ps.2 million increase in maintenance, repair
expenses and services. Costs in the Offices and Others segment, as
a percentage of this segment’s revenues, rose from 6.2%
during fiscal year 2016 to 7.4% during fiscal year
2017.
Sales and Developments
. This
segment’s costs often exhibit significant changes from period
to period because of the non-recurrence of the sales of properties
performed by the Company throughout the time. The costs associated
to our Sales and Developments segment increased by 115%, from Ps.20
million during fiscal year 2016 to Ps.43 million during fiscal year
2017. Costs in the Sales and Developments segment, as a percentage
of this segment’s revenues, decreased from 250% during fiscal
year 2016 to 43.4% during fiscal year 2017.
Hotels
. Costs in the Hotels segment rose
by 34.6%, from Ps.361 million during fiscal year 2016 to Ps.486
million during fiscal year 2017, mainly due to: (i) a Ps.68 million
increase in salaries, social security charges and other personnel
expenses; (ii) increased charges, amounting to Ps.26 million, as
maintenance and repairs; and (iii) an increase of Ps.30 million in
the cost of food, beverages and other hotel-related expenses,
respectively. Costs in the Hotels segment, as a percentage of this
segment’s revenues, decreased from 67.6% during fiscal year
2016 to 67% during fiscal year 2017.
158
International
. Costs in the
International segment did not exhibit significant changes compared
to fiscal year 2016.
Operations Center in Israel
Real
Estate.
Costs from the Real estate segment increased from
Ps.467 million during fiscal year 2016 to Ps.2,333 million during
fiscal year 2017. Such variation was due to (i) the comparability
of the figures, (ii) a 24% revaluation of the NIS against the
Argentine peso, and (iii) the occupancy of revenue-generating
projects in Israel, and the higher occupation of residential
apartments. In addition, costs, as a percentage of the revenues
derived from this segment, accounted for 47.4% in 2017 while it was
a 30.4% in 2016.
Supermarkets.
Costs from the Supermarket
segment increased from Ps.14,076 million during fiscal year 2016 to
Ps.35,432 million during fiscal year 2017. Such variation was due
to (i) the comparability of the figures and (ii) a 24% revaluation
of the NIS against the Argentine peso. In addition, costs, as a
percentage of the revenues derived from this segment, accounted for
74.9%, in 2017 with no significant changes form 2016.
Telecommunications.
Costs from
Telecommunications segment increase from Ps.4,525 million during
fiscal year 2016 to Ps.11,183 million during fiscal year 2017. Such
variation was due to (i) the comparability of the figures and (ii)
a 24% revaluation of the NIS against the Argentine peso. In
addition, costs, as a percentage of the revenues derived from this
segment, accounted for 70.1%, in 2017 with no significant changes
form 2016.
Others.
Costs from the Others segment
decrease from Ps.184 million during fiscal year 2016 to Ps.162
million during fiscal year 2017. Such variation was due to (i) the
comparability of the figures, (ii) a 24% revaluation of the NIS
against the Argentine peso, and (iii) the sale of assets from DIC.
In addition, costs, as a percentage of revenues derived from this
segment, accounted for 61.6%, in 2017 with no significant changes
form 2016.
Gross profit
|
|
Year
ended on June 30, 2017
|
||||
|
Gross profit
|
Income
statement
|
Interest
in joint ventures
|
Expenses
and collective promotion fund
|
Inter-segment
eliminations
|
Segment-reporting
|
|
Operations
Center in Argentina
|
(in
millions of Ps.)
|
||||
|
Shopping Malls
|
2,647
|
22
|
24
|
-
|
2,693
|
|
Offices and
Others
|
395
|
4
|
3
|
8
|
410
|
|
Sales and
Developments
|
59
|
(3
)
|
-
|
-
|
56
|
|
Hotels
|
237
|
-
|
-
|
2
|
239
|
|
International
|
-
|
-
|
-
|
-
|
-
|
|
Financial Operations,
Corporate and Others
|
1
|
-
|
-
|
-
|
1
|
|
Total
Operations Center in Argentina
|
3,339
|
23
|
27
|
10
|
3,399
|
|
|
|
|
|
|
|
|
Operations
Center in Israel
|
|
|
|
|
|
|
Real Estate
|
2,585
|
-
|
-
|
-
|
2,585
|
|
Supermarkets
|
11,845
|
-
|
-
|
-
|
11,845
|
|
Telecommunications
|
4,781
|
-
|
-
|
-
|
4,781
|
|
Insurance
|
-
|
-
|
-
|
-
|
-
|
|
Others
|
101
|
-
|
-
|
-
|
101
|
|
Total
Operations Center in Israel
|
19,312
|
-
|
-
|
-
|
19,312
|
|
Total
gross profit
|
22,651
|
23
|
27
|
10
|
22,711
|
159
|
|
Year
ended on June 30, 2016 (recast)
|
||||
|
Gross profit
|
Income
statement
|
Interest
in joint ventures
|
Expenses
and collective promotion fund
|
Inter-segment
eliminations
|
Segment-reporting
|
|
Operations
Center in Argentina
|
(in
millions of Ps.)
|
||||
|
Shopping Malls
|
2,126
|
18
|
12
|
(6
)
|
2,150
|
|
Offices and
Others
|
312
|
(1
)
|
1
|
7
|
319
|
|
Sales and
Developments
|
(12
)
|
-
|
-
|
-
|
(12
)
|
|
Hotels
|
172
|
-
|
-
|
1
|
173
|
|
International
|
-
|
-
|
-
|
-
|
-
|
|
Financial Operations,
Corporate and Others
|
1
|
-
|
-
|
-
|
1
|
|
Total
Operations Center in Argentina
|
2,599
|
17
|
13
|
2
|
2,631
|
|
|
|
|
|
|
|
|
Operations
Center in Israel
|
|
|
|
|
|
|
Real Estate
|
1,071
|
-
|
-
|
-
|
1,071
|
|
Supermarkets
|
4,534
|
-
|
-
|
-
|
4,534
|
|
Telecommunications
|
2,130
|
-
|
-
|
-
|
2,130
|
|
Insurance
|
-
|
-
|
-
|
-
|
-
|
|
Others
|
90
|
-
|
-
|
-
|
90
|
|
Total
Operations Center in Israel
|
7,825
|
-
|
-
|
-
|
7,825
|
|
Total
gross profit
|
10,424
|
17
|
13
|
2
|
10,456
|
Gross profit, pursuant to the income
statement, increased by Ps.12,227 million, up from Ps.10,424
million during fiscal year 2016 (of which Ps.7,825 million are
derived from the Operations Center in Israel and Ps.2,599 million
from the Operations Center in Argentina) to Ps.22,651 million
during fiscal year 2017 (of which Ps.19,312 million are derived
from the Operations Center in Israel and Ps.3,339 million from the
Operations Center in Argentina). Without considering the effect of
the Operations Center in Israel, gross profit rose by 28.5%. Gross
profit, as a percentage of revenues from sales, leases and
services, decreased from 33.1% during fiscal year 2016 to 30.5%
during fiscal year 2017. Without considering the effect of the
Operations Center in Israel, gross profit, as a percentage of
revenues from sales, leases and services, pursuant to the income
statement, experienced a slight decline from 58.5% during fiscal
year 2016 to 58.1% during fiscal year 2017. The Gross Profit,
leases and services in the Operations Center in Israel are not
comparable year to year due two main factors: (i) the results of
operations for the fiscal year ended Junes 30, 2016 include only
six months of operations from the Operations Center in Israel, from
October 11, 2015 (the date control was acquired) through March 31,
2016 (adjusted by such material transactions occurred between April
1, 2016 and June 30, 2016) While the results of operations for the
fiscal year ended June 30, 2017 include twelve months of operations
from the Operations Center in Israel, from April1, 2016 through
March 31, 2017 (adjusted by such material transactions occurred
between April 1, 2017 and June 30, 2017) and (ii) fluctuations
between the Israeli Shekel, the functional currency of the
Operations Center Israel and the Argentine Peso, the Group´s
reporting currency, i.e. the Israeli Shekel appreciated
approximately 24% from 2016 to 2017.
In turn, total gross profit from
expenses and collective promotion fund increased by Ps.14 million,
from Ps.13 million during fiscal year 2016 (of which Ps.12 million
are derived from the Shopping Malls segment and Ps.1 million from
the Offices and Others segment) to Ps.27 million during fiscal year
2017 (of which Ps.24 million are derived from the Shopping Malls
segment and Ps.3 million from the Offices and Others segment) for
the Operation Center in Argentina
Furthermore, gross profit from our
joint ventures increased by 35.3% from Ps.17 million in fiscal year
2016 to Ps.23 million in fiscal year 2017.
160
Therefore, according to business
segment reporting (taking into consideration the gross profit from
our joint ventures and without considering the gross profit from
expenses and collective promotion fund or inter-segment gross
profits), gross profit rose by Ps.12,255 million from Ps.10,456
million during fiscal year 2016 (of which Ps.7,825 million are
derived from the Operations Center in Israel and Ps.2,631 million
from the Operations Center in Argentina) to Ps.22,711 million
during fiscal year 2017 (of which Ps.19,312 million are
attributable to the Operations Center in Israel and Ps.3,399
million to the Operations Center in Argentina). Without considering
the effect of the Operations Center in Israel, gross profit rose by
29.2%. Furthermore, gross profit as a percentage of revenues,
pursuant to business segment reporting, decreased from 34.4% during
fiscal year 2016 to 31.2% during fiscal year 2017. Without
considering the effect of the Operations Center in Israel, gross
profit as a percentage of total revenues experienced a slight
decline from 80% during fiscal year 2016 to 78.8% during fiscal
year 2017.
Operations Center in Argentina
Shopping Malls
. Gross profit at the
Shopping Malls segment increased by 25.3%, up from Ps.2,150 million
during fiscal year 2016 to Ps.2,693 million during fiscal year
2017, mainly due to an increase in our tenants’ total sales,
resulting in higher percentage rents under our lease agreements.
Gross profit from the Shopping Malls segment as a percentage of
this segment’s revenues experienced a slight decline from
89.4% during fiscal year 2016 to 88.5% during fiscal year
2017.
Offices and Others
. Gross profit from
the Offices and Others segment increased by 28.5%, from Ps.319
million during fiscal year 2016 to Ps.410 million during fiscal
year 2017. Gross profit from the Offices and Others segment as a
percentage of this segment’s revenues decreased from 93.8%
during fiscal year 2016 to 92.6% during fiscal year
2017.
Sales and Developments
. Gross profit /
(loss) from the Sales and Developments segment increased by Ps.68
million, from a loss of Ps.12 million during fiscal year 2016 to a
profit of Ps.56 million during fiscal year 2017, mainly due to
higher sales accounted for during fiscal year 2017 and a decrease
in maintenance and preservation costs in connection with these
properties.
Hotels
. Gross profit from the Hotels
segment rose by 38.2%, up from Ps.173 million during fiscal year
2016 to Ps.239 million during fiscal year 2017. Gross profit for
the Hotels segment, as a percentage of this segment’s
revenues, rose slightly from 32.4% during fiscal year 2016 to 33%
during fiscal year 2017.
International
. Gross profit at the
International segment did not experience significant changes during
the reported periods.
Financial Operations, Corporate and
Others
. Gross profit at the Financial Operations, Corporate
and Others segment did not experience significant changes during
the reported periods.
Operations Center in Israel
Real
Estate.
Gross profit from the Real Estate segment increased
from Ps.1,071 million during fiscal year 2016 to Ps.2.585 million
during fiscal year 2017. Such variation was due to (i) the
comparability of the figures and (ii) a 24% revaluation of the NIS
against the Argentine peso. In 2017 gross profit as a percentage of
the revenues derived from this segment, accounted for
52.6%.
Supermarkets.
Gross profit from the
Supermarkets segment increased from Ps.4,534 million during fiscal
year 2016 to Ps.11,845 million during fiscal year 2017. Such
variation was due to (i) the comparability of the figures and (ii)
a 24% revaluation of the NIS against the Argentine peso. In 2017
gross profit as a percentage of the revenues derived from this
segment, accounted for 25.1%.
Telecommunications.
Gross profit from
the Telecommunications segment increased from Ps.2,130 million
during fiscal year 2016 to Ps.4,781 million during fiscal year
2017. Such variation was due to (i) the comparability of the
figures and (ii) a 24% revaluation of the NIS against the Argentine
peso. In 2017 gross profit as a percentage of the revenues derived
from this segment, accounted for 29.9%.
161
Others.
Gross profit from the Others
segment increased from Ps.90 million during fiscal year 2016 to
Ps.101 million during fiscal year 2017. Such variation was due to
(i) the comparability of the figures, (ii) a 24% revaluation of the
NIS against the Argentine peso and (iii) the sale of some revenue
generating assets from DIC. In 2017 gross profit as a percentage of
the revenues derived from this segment, accounted for
38,4%.
Net gain from fair value adjustment of investment
properties
|
|
Year
ended on June 30, 2017
|
||||
|
Net gain from fair value
adjustment of investment properties
|
Income
statement
|
Interest
in joint ventures
|
Expenses
and collective promotion fund
|
Inter-segment
eliminations
|
Segment-reporting
|
|
Operations
Center in Argentina
|
(in
millions of Ps.)
|
||||
|
Shopping Malls
|
2,058
|
10
|
-
|
-
|
2,068
|
|
Offices and
Others
|
1,172
|
182
|
-
|
-
|
1,354
|
|
Sales and
Developments
|
849
|
-
|
-
|
-
|
849
|
|
Hotels
|
-
|
-
|
-
|
-
|
-
|
|
International
|
-
|
-
|
-
|
-
|
-
|
|
Financial Operations,
Corporate and Others
|
-
|
-
|
-
|
-
|
-
|
|
Total
Operations Center in Argentina
|
4,079
|
192
|
-
|
-
|
4,271
|
|
Operations
Center in Israel
|
|
|
|
|
|
|
Real Estate
|
374
|
-
|
-
|
-
|
374
|
|
Supermarkets
|
-
|
-
|
-
|
-
|
-
|
|
Telecommunications
|
-
|
-
|
-
|
-
|
-
|
|
Insurance
|
-
|
-
|
-
|
-
|
-
|
|
Others
|
-
|
-
|
-
|
-
|
-
|
|
Total
Operations Center in Israel
|
374
|
-
|
-
|
-
|
374
|
|
Total net gain from fair
value adjustment of investment properties
|
4,453
|
192
|
-
|
-
|
4,645
|
|
|
|
|
|
|
|
|
|
Year
ended on June 30, 2016 (recast)
|
||||
|
Net gain from fair value
adjustment of investment properties
|
Income
statement
|
Interest
in joint ventures
|
Expenses
and collective promotion fund
|
Inter-segment
eliminations
|
Segment-reporting
|
|
Operations
Center in Argentina
|
(in
millions of Ps.)
|
||||
|
Shopping Malls
|
16,049
|
83
|
-
|
-
|
16,132
|
|
Offices and
Others
|
1,055
|
249
|
-
|
-
|
1,304
|
|
Sales and
Developments
|
726
|
47
|
-
|
-
|
773
|
|
Hotels
|
-
|
-
|
-
|
-
|
-
|
|
International
|
-
|
-
|
-
|
-
|
-
|
|
Financial Operations,
Corporate and Others
|
-
|
-
|
-
|
-
|
-
|
|
Total
Operations Center in Argentina
|
17,830
|
379
|
-
|
-
|
18,209
|
|
Operations
Center in Israel
|
|
|
|
|
|
|
Real Estate
|
(271
)
|
-
|
-
|
-
|
(271
)
|
|
Supermarkets
|
-
|
-
|
-
|
-
|
-
|
|
Telecommunications
|
-
|
-
|
-
|
-
|
-
|
|
Insurance
|
-
|
-
|
-
|
-
|
-
|
|
Others
|
-
|
-
|
-
|
-
|
-
|
|
Total
Operations Center in Israel
|
(271
)
|
-
|
-
|
-
|
(271
)
|
|
Total net gain from fair
value adjustment of investment properties
|
17,559
|
379
|
-
|
-
|
17,938
|
Net gain from fair value adjustment
of investment properties, pursuant to the income statement,
decreased by Ps.13,106 million, from Ps.17,559 million during
fiscal year 2016 (of which a Ps.271 million loss derives from the
Operations Center in Israel and a Ps.17,830 million income from the
Operations Center in Argentina) to Ps.4,453 million during fiscal
year 2017 (of which Ps.374 million derive from the Operations
Center in Israel and Ps.4,079 million from the Operations Center in
Argentina).
162
The Net gain from Fair Value
adjustment of investment properties, leases and services in the
Operations Center in Israel are not comparable year to year due two
main factors: (i) the results of operations for the fiscal year
ended Junes 30, 2016 include only six months of operations from the
Operations Center in Israel, from October 11, 2015 (the date
control was acquired) through March 31, 2016 (adjusted by such
material transactions occurred between April 1, 2016 and June 30,
2016) While the results of operations for the fiscal year ended
June 30, 2017 include twelve months of operations from the
Operations Center in Israel, from April1, 2016 through March 31,
2017 (adjusted by such material transactions occurred between April
1, 2017 and June 30, 2017) and (ii) fluctuations between the
Israeli Shekel, the functional currency of the Operations Center
Israel and the Argentine Peso, the Group´s reporting currency,
i.e. the Israeli Shekel appreciated approximately 24% from 2016 to
2017.
Operations Center in Argentina:
Net gain from fair value adjustment
of our investment properties for the fiscal year ended June 30,
2017 amounted to Ps.4,079 million (Ps.2,058 million from
our Shopping Malls segment; Ps.1,172 million from the Offices and
Others segment; and Ps.849 million from the Sales and
Developments segment). The significant increase in the values of
our properties as measured in Argentine Peso was primarily a
consequence of: (i) a slight decrease of 16 basis points in
the discount rate applied under the discounted cash flows method,
which was driven mainly by macroeconomic improvements leading to a
decrease in the cost of capital; and (ii) a depreciation
during the fiscal year of Argentine Peso against U.S. dollar of
approximately 11% (from Ps.14.99 per US$1.00 at June 2016 to
Ps.16.58 per US$1.00 at June 2017).
We maintained the same portfolio of
shopping malls during the fiscal years ended June 30, 2017 and
2016. The values of our shopping mall properties increased by 8.2%
during the fiscal year ended June 30, 2017, largely due to a
decrease in our cost of capital and the impact of the peso
depreciation.
The value of our office buildings
increased by 34% during the fiscal year ended June 30, 2017 largely
as a result of the impact of the depreciation of the peso and
higher rental rates for our properties. In addition, we realized a
profit of Ps.100 million during the fiscal year ended June 30,
2017 compared to Ps.908 million in the comparable period in
2016, due to the sale of leasable offices and parking spaces at
several buildings.
Operations Center in Israel
Real
Estate.
In fiscal year 2017, the net gain from fair value
adjustment of investment properties from the Real Estate segment
was Ps.374 million, which, as a percentage of revenues from this
segment, accounted for 7.6%. In 2016 the result of this segment was
a loss of Ps.271 million. Such variation is mainly due to the
impairment of Las Vegas project (Tivoli) and the small revaluation
of the HSBC building, compensated by the increase in fair value of
the rest of the properties.
General and administrative expenses
|
|
Year
ended on June 30, 2017
|
||||
|
General
and administrative expenses
|
Income
statement Interest in joint ventures
|
Expenses
and collective promotion fund
|
Inter-segment
eliminations
|
Segment-reporting
|
|
|
Operations
Center in Argentina
|
(in
millions of Ps.)
|
||||
|
Shopping Malls
|
(256
)
|
(2
)
|
-
|
(3
)
|
(261
)
|
|
Offices and
Others
|
(32
)
|
(1
)
|
-
|
-
|
(33
)
|
|
Sales and
Developments
|
(30
)
|
(2
)
|
-
|
-
|
(32
)
|
|
Hotels
|
(133
)
|
-
|
-
|
(2
)
|
(135
)
|
|
International
|
(78
)
|
|
-
|
-
|
(78
)
|
|
Financial Operations,
Corporate and Others
|
(179
)
|
-
|
-
|
(3
)
|
(182
)
|
|
Total
Operations Center in Argentina
|
(708
)
|
(5
)
|
-
|
(8
)
|
(721
)
|
|
|
|
|
|
|
|
|
Operations
Center in Israel
|
|
|
|
|
|
|
Real Estate
|
(290
)
|
-
|
-
|
-
|
(290
)
|
|
Supermarkets
|
(627
)
|
-
|
-
|
-
|
(627
)
|
|
Telecommunications
|
(1,592
)
|
-
|
-
|
-
|
(1,592
)
|
|
Insurance
|
-
|
-
|
-
|
-
|
-
|
|
Others
|
(626
)
|
-
|
-
|
-
|
(626
)
|
|
Total
Operations Center in Israel
|
(3,135
)
|
-
|
-
|
-
|
(3,135
)
|
|
Total
general and administrative expenses
|
(3,843
)
|
(5
)
|
-
|
(8
)
|
(3,856
)
|
163
|
|
Year
ended on June 30, 2016 (recast)
|
||||
|
General
and administrative expenses
|
Income
statement
|
Interest
in joint ventures
|
Expenses
and collective promotion fund
|
Inter-segment
eliminations
|
Segment-reporting
|
|
Operations
Center in Argentina
|
(in
millions of Ps.)
|
||||
|
Shopping Malls
|
(178
)
|
-
|
-
|
(1
)
|
(179
)
|
|
Offices and
Others
|
(24
)
|
-
|
-
|
-
|
(24
)
|
|
Sales and
Developments
|
(22
)
|
(1
)
|
-
|
-
|
(23
)
|
|
Hotels
|
(101
)
|
-
|
-
|
(2
)
|
(103
)
|
|
International
|
(91
)
|
-
|
-
|
-
|
(91
)
|
|
Financial Operations,
Corporate and Others
|
(130
)
|
-
|
-
|
(4
)
|
(134
)
|
|
Total
Operations Center in Argentina
|
(546
)
|
(1
)
|
-
|
(7
)
|
(554
)
|
|
|
|
|
|
|
|
|
Operations
Center in Israel
|
|
|
|
|
|
|
Real Estate
|
(100
)
|
-
|
-
|
-
|
(100
)
|
|
Supermarkets
|
(203
)
|
-
|
-
|
-
|
(203
)
|
|
Telecommunications
|
(708
)
|
-
|
-
|
-
|
(708
)
|
|
Insurance
|
-
|
-
|
-
|
-
|
-
|
|
Others
|
(282
)
|
-
|
-
|
-
|
(282
)
|
|
Total
Operations Center in Israel
|
(1,293
)
|
-
|
-
|
-
|
(1,293
)
|
|
Total
general and administrative expenses
|
(1,839
)
|
(1
)
|
-
|
(7
)
|
(1,847
)
|
Total general and administrative
expenses, pursuant to the income statement, increased by Ps.2,004
million, up from Ps.1,839 million during fiscal year 2016 (of which
Ps.1,293 million are attributable to the Operations Center in
Israel and Ps.546 million to the Operations Center in Argentina) to
Ps.3,843 million during fiscal year 2017 (of which Ps.3,135 million
are attributable to the Operations Center in Israel and Ps.708
million to the Operations Center in Argentina). Without considering
the effect of the Operations Center in Israel, general and
administrative expenses rose by 29. 7%. Total general and
administrative expenses, as a percentage of revenues from sales,
leases and services, decreased slightly from 5.8% during fiscal
year 2016 to 5.2% during fiscal year 2017. Without considering the
effect of the Operations Center in Israel, total general and
administrative expenses, as a percentage of total revenues from
sales, leases and services, pursuant to the income statement,
maintened at 12.3% for both periods.
General administrative and expenses
in the Operations Center in Israel are not comparable year to year
due two main factors: (i) the results of operations for the fiscal
year ended Junes 30, 2016 include only six months of operations
from the Operations Center in Israel, from October 11, 2015 (the
date control was acquired) through March 31, 2016 (adjusted by such
material transactions occurred between April 1, 2016 and June 30,
2016) While the results of operations for the fiscal year ended
June 30, 2017 include twelve months of operations from the
Operations Center in Israel, from April1, 2016 through March 31,
2017 (adjusted by such material transactions occurred between April
1, 2017 and June 30, 2017) and (ii) fluctuations between the
Israeli Shekel, the functional currency of the Operations Center
Israel and the Argentine Peso, the Group´s reporting currency,
i.e. the Israeli Shekel appreciated approximately 24% from 2016 to
2017.
In turn, general and administrative
expenses from our joint ventures increased by Ps.4 million, from
Ps.1 million in fiscal year 2016 to Ps.5 million during fiscal year
2017 for the Operation Center in Argentina
Finally, general and administrative
expenses from inter-segment transactions did not exhibit
significant changes for the reported periods.
Therefore, according to business
segment reporting (taking into consideration administrative
expenses from our joint ventures and without considering those
related to expenses and collective promotion fund or expenses
related to inter-segment operations), general and administrative
expenses rose by Ps.2,009 million from Ps.1,847 million during
fiscal year 2016 (of which Ps.1,293 million derive from the
Operations Center in Israel and Ps.554 million from the Operations
Center in Argentina) to Ps.3,856 million during fiscal year 2017
(of which Ps.3,135 million are attributable to the Operations
Center in Israel and Ps.721 million to the Operations Center in
Argentina).
164
Without considering the general and
administrative expenses from the Operations Center in Israel,
expenses rose by 30.1%. General and administrative expenses as a
percentage of revenues, pursuant to business segment reporting,
declined from 6.1% during fiscal year 2016 to 5.3% during fiscal
year 2017. Without considering the effect of the Operations Center
in Israel, total general and administrative expenses, as a
percentage of total revenues, experienced a slight decrease from
16.8% during fiscal year 2016 to 16.7% during fiscal year
2017.
Operations Center in Argentina
Shopping Malls
. General and
administrative expenses in the Shopping Malls segment rose by
45.8%, up from Ps.179 million during fiscal year 2016 to Ps.261
million during fiscal year 2017, mainly as a result of: (i) a Ps.33
million increase in salaries, social security charges and other
personnel expenses; (ii) a Ps.22 million increase in fees and
payment for services, among other items; (iii) a Ps.13 million
increase in Directors’ fees; and (iv) a Ps.7 million increase
in fees and payment for services, among other items. General and
administrative expenses of Shopping Malls, as a percentage of this
segment’s revenues, increased from 7.4% during fiscal year
2016 to 8.6% during fiscal year 2017.
Offices and Others
. General and
administrative expenses in our Offices and Others segment increased
by 37.5%, from Ps.24 million during fiscal year 2016 to Ps.33
million during fiscal year 2017, primarily due to: (i) a Ps.4
million increase in salaries, social security charges and other
personnel expenses; and (ii) a Ps.5 million increase in fees and
payment for services, among other items. The segment’s
general and administrative expenses, as a percentage of this
segment’s revenues, showed a slight increase from 7.1% during
fiscal year 2016 to 7.4% during fiscal year 2017.
Sales and Developments
. General and
administrative expenses associated to our Sales and Developments
segment rose by Ps.9 million, up from Ps.23 million during fiscal
year 2016 to Ps.32 million during fiscal year 2017, primarily owing
to: (i) a Ps.5 million increase in fees and payment for services;
(ii) a Ps.2 million increase in salaries, social security charges
and other personnel expenses, (iii) a Ps.2 million increase in
Directors’ fees, among other items. General and
administrative expenses, as a percentage of this segment’s
revenues, decreased from 287.5% during fiscal year 2016 to 32.3%
during fiscal year 2017.
Hotels
. General and administrative
expenses associated to our Hotels segment rose by 31.1%, from
Ps.103 million during fiscal year 2016 to Ps.135 million during
fiscal year 2017, mainly as a result of: (i) a Ps.16 million
increase in salaries, social security charges and other personnel
expenses; (ii) a Ps.4 million increase in taxes, rates and
contributions; and (iii) Ps.4 million increase in fees and payments
for services, among other items. General and administrative
expenses associated to the Hotels segment, as a percentage of this
segment’s revenues, decreased from 19.3% during fiscal year
2016 to 18.6% during fiscal year 2017.
International
. General and
administrative expenses associated to our International segment
decreased by 14.3%, from Ps.91 million during fiscal year 2016 to
Ps.78 million during fiscal year 2017, mainly as a result of fees
for services incurred in connection with our investment in
IDBD.
Financial Operations, Corporate and
Others
. General and administrative expenses associated to
our Financial Operations, Corporate and Others segment increased by
35.8% from Ps.134 million during fiscal year 2016 to Ps.182 million
during fiscal year 2017, mainly due to (i) a Ps.23 million increase
in salaries, social security charges and other personnel expenses
and (ii) a Ps.22 million increase in maintenance, repair and
services expenses.
Operations Center in Israel
Real
Estate.
General and administrative expenses from the Real
Estate segment increased from Ps.100 million during fiscal year
2016 to Ps.290 million during fiscal year 2017. Such variation was
due to (i) the comparability of the figures, (ii) a 24% revaluation
of the NIS against the Argentine peso, and (iii) a higher occupancy
of the investment property and an increase in the
headcount.
Supermarkets.
General and administrative
expenses from the Supermarket segment from Ps.203 million during
fiscal year 2016 to Ps.627 million during fiscal year 2017. Such
variation was due to (i) the comparability of the figures, (ii) a
24% revaluation of the NIS against the Argentine peso, and (iii) an
increase in the minimum wage salary as well as an increase in the
headcount.
165
Telecommunications.
General and
administrative expenses from the Telecommunications segment
increased from Ps.708 million during fiscal year 2016 to Ps.1,592
million during fiscal year 2017. Such variation was due to (i) the
comparability of the figures, (ii) a 24% revaluation of the NIS
against the Argentine peso, and (iii) the increased efficiency
measures which were implemented by Cellcom, and the decrease in
depreciation and amortization expenses.
Others.
General and administrative
expenses from the Others segment increased from Ps.282 million
during fiscal year 2016 to Ps.626 million during fiscal year 2017.
Such variation was due to (i) the comparability of the figures,
(ii) a 24% revaluation of the NIS against the Argentine peso, and
(iii) a decreased in the payroll.
Selling expenses
|
|
Year
ended on June 30, 2017
|
||||
|
Selling
expenses
|
Income
statement
|
Interest
in joint ventures
|
Expenses
and collective promotion fund
|
Inter-segment
eliminations
|
Segment-reporting
|
|
Operations
Center in Argentina
|
(in
millions of Ps.)
|
||||
|
Shopping Malls
|
(185
)
|
(1
)
|
-
|
(2
)
|
(188
)
|
|
Offices and
Others
|
(33
)
|
(1
)
|
-
|
-
|
(34
)
|
|
Sales and
Developments
|
(13
)
|
(3
)
|
-
|
-
|
(16
)
|
|
Hotels
|
(94
)
|
-
|
-
|
-
|
(94
)
|
|
International
|
-
|
-
|
-
|
-
|
-
|
|
Financial Operations,
Corporate and Others
|
(23
)
|
-
|
-
|
-
|
(23
)
|
|
Total
Operations Center in Argentina
|
(348
)
|
(5
)
|
-
|
(2
)
|
(355
)
|
|
|
|
|
|
|
|
|
Operations
Center in Israel
|
|
|
|
|
|
|
Real Estate
|
(91
)
|
-
|
-
|
-
|
(91
)
|
|
Supermarkets
|
(9,517
)
|
-
|
-
|
-
|
(9,517
)
|
|
Telecommunications
|
(3,406
)
|
-
|
-
|
-
|
(3,406
)
|
|
Insurance
|
-
|
-
|
-
|
-
|
-
|
|
Others
|
(79
)
|
-
|
-
|
-
|
(79
)
|
|
Total
Operations Center in Israel
|
(13,093
)
|
-
|
-
|
-
|
(13,093
)
|
|
Total s
elling expenses
|
(13,441
)
|
(5
)
|
-
|
(2
)
|
(13,448
)
|
|
|
Year
ended on June 30, 2016 (recast)
|
||||
|
Selling
expenses
|
Income
statement
|
Interest
in joint ventures
|
Expenses
and collective promotion fund
|
Inter-segment
eliminations
|
Segment-reporting
|
|
Operations
Center in Argentina
|
(in
millions of Ps.)
|
||||
|
Shopping Malls
|
(144
)
|
(1
)
|
-
|
-
|
(145
)
|
|
Offices and
Others
|
(8
)
|
-
|
-
|
-
|
(8
)
|
|
Sales and
Developments
|
(22
)
|
(1
)
|
-
|
-
|
(23
)
|
|
Hotels
|
(69
)
|
-
|
-
|
-
|
(69
)
|
|
International
|
-
|
-
|
-
|
-
|
-
|
|
Financial Operations,
Corporate and Others
|
(19
)
|
-
|
-
|
-
|
(19
)
|
|
Total
Operations Center in Argentina
|
(262
)
|
(2
)
|
-
|
-
|
(264
)
|
|
|
|
|
|
|
|
|
Operations
Center in Israel
|
|
|
|
|
|
|
Real Estate
|
(29
)
|
-
|
-
|
-
|
(29
)
|
|
Supermarkets
|
(3,907
)
|
-
|
-
|
-
|
(3,907
)
|
|
Telecommunications
|
(1,493
)
|
-
|
-
|
-
|
(1,493
)
|
|
Insurance
|
-
|
-
|
-
|
-
|
-
|
|
Others
|
(13
)
|
-
|
-
|
-
|
(13
)
|
|
Total
Operations Center in Israel
|
(5,442
)
|
-
|
-
|
-
|
(5,442
)
|
|
Total s
elling expenses
|
(5,704
)
|
(2
)
|
-
|
-
|
(5,706
)
|
166
Selling expenses, pursuant to the
income statement, increased by Ps.7,737 million, up from Ps.5.704
million during fiscal year 2016 to Ps.13,441 million during fiscal
year 2017 (of which Ps.13,093 million are attributable to the
Operations Center in Israel and Ps.348 million to the Operations
Center in Argentina). Without considering the effect of the
Operations Center in Israel, selling expenses rose by 32.8%.
Selling expenses, as a percentage of revenues from sales, leases
and services, was 18.1% for both fiscal years 2016 and 2017.
Without considering the effect of the Operations Center in Israel,
total selling expenses, as a percentage of revenues from sales,
leases and services, experienced a slight increase from 5.9% during
fiscal year 2016 to 6.1% during fiscal year 2017.
Selling Expenses in the Operations
Center in Israel are not comparable year to year due two main
factors: (i) the results of operations for the fiscal year ended
Junes 30, 2016 include only six months of operations from the
Operations Center in Israel, from October 11, 2015 (the date
control was acquired) through March 31, 2016 (adjusted by such
material transactions occurred between April 1, 2016 and June 30,
2016) While the results of operations for the fiscal year ended
June 30, 2017 include twelve months of operations from the
Operations Center in Israel, from April1, 2016 through March 31,
2017 (adjusted by such material transactions occurred between April
1, 2017 and June 30, 2017) and (ii) fluctuations between the
Israeli Shekel, the functional currency of the Operations Center
Israel and the Argentine Peso, the Group´s reporting currency,
i.e. the Israeli Shekel appreciated approximately 24% from 2016 to
2017.
In turn, selling expenses associated
to our joint ventures increased by Ps.3 million from Ps.2 million
in fiscal year 2016 to Ps.5 million in fiscal year 2017 for the
Operation Center in Argentina.
Therefore, according to business
segment reporting (taking into consideration the selling expenses
from our joint ventures and without considering those related to
expenses and collective promotion fund or inter-segment expenses),
selling expenses rose by Ps.7,742 million from Ps.5,706 million
during fiscal year 2016 to Ps.13,448 million during fiscal year
2017 (of which Ps.13,093 million are attributable to the Operations
Center in Israel and Ps.355 million to the Operations Center in
Argentina). Without considering the effect of the Operations Center
in Israel, selling expenses rose by 34.5%. Selling expenses, as a
percentage of revenues, pursuant to business segment reporting,
increased from 18.8% during fiscal year 2016 to 18.5% during fiscal
year 2017. Without considering the effect of the Operations Center
in Israel, total selling expenses as a percentage of total revenues
pursuant to business segment reporting, experienced a slight
increase from 8% during fiscal year 2016 to 8.2% during fiscal year
2017.
Operations Center in Argentina
Shopping Malls
. Selling expenses in the
Shopping Malls segment rose by 29.7%, up from Ps.145 million during
fiscal year 2016 to Ps.188 million during fiscal year 2017,
primarily as a result of higher taxes, rates and contributions and
higher loan loss charges. Selling expenses, as a percentage of the
Shopping Malls segment’s revenues, rose from 6% during fiscal
year 2016 to 6.2% during fiscal year 2017.
Offices and Others
. Selling expenses
associated to our Offices and Others segment increased by 325%,
from Ps.8 million during fiscal year 2016 to Ps.34 million during
fiscal year 2017. Such variation was mainly due to higher loan loss
charges, among other factors. The selling expenses associated to
our Offices and Others segment, as a percentage of this
segment’s revenues, rose from 2.4% during fiscal year 2016 to
7.7% during fiscal year 2017.
Sales and Developments
. Selling expenses
for the Sales and Developments segment decreased by Ps.7 million,
from Ps.23 million during fiscal year 2016 to Ps.16 million during
fiscal year 2017, mainly as a result of a decrease in taxes, rates
and contributions.
Hotels
. Selling expenses associated to
our Hotels segment rose by 36.2%, from Ps.69 million during fiscal
year 2016 to Ps.94 million during fiscal year 2017, mainly due to
an increase in taxes, rates and contributions, an increase in fees
and payment for services and salaries and social security charges,
among others. Selling expenses associated to our Hotels segment as
a percentage of this segment’s revenues experienced a slight
increase from 12.9% during fiscal year 2016 to 13% during fiscal
year 2017.
Financial Operations, Corporate and
Others
. Selling expenses in the Financial Operations,
Corporate and Others segment increased by Ps.4 million from Ps.19
million in fiscal year 2016 to Ps.23 million in fiscal year 2017,
mainly due to an increase in advertising, publicity and
others.
167
Operations Center in Israel
Real
Estate.
Selling expenses from the Real Estate segment
increased from Ps.29 million during fiscal year 2016 to Ps.91
million during fiscal year 2017. Such variation was due to (i) the
comparability of the figures, (ii) a 24% revaluation of the NIS
against the Argentine peso, and (iii) an increase in marketing due
to the higher efforts to increase the occupancy of the investment
properties and the promotion of new projects.
Supermarkets.
Selling expenses from the
Supermarket segment increased from Ps.3,907 million during fiscal
year 2016 to Ps.9,517 million during fiscal year 2017. Such
variation was due to (i) the comparability of the figures and (ii)
a 24% revaluation of the NIS against the Argentine
peso.
Telecommunications.
Selling expenses
from the Telecommunications segment increased from Ps.1,493 million
during fiscal year 2016 to Ps.3,406 million during fiscal year
2017. Such variation was due to (i) the comparability of the
figures, (ii) a 24% revaluation of the NIS against the Argentine
peso, and (iii) the increased efficiency measures which were
implemented by Cellcom, which led to a decrease in advertising
expenses and other expenses.
Others.
Selling expenses from the Others
segment increased from Ps.13 million during fiscal year 2016 to
Ps.79 million during fiscal year 2017. Such variation was due to
(i) the comparability of the figures, (ii) a 24% revaluation of the
NIS against the Argentine peso, and (iii) due to commission and
other commercial costs related to the sale of some
assets.
Other operating results, net
|
|
Year
ended on June 30, 2017
|
||||
|
Other
operating results, net
|
Income
statement
|
Interest
in joint ventures
|
Expenses
and collective promotion fund
|
Inter-segment
eliminations
|
Segment-reporting
|
|
Operations
Center in Argentina
|
(in
millions of Ps.)
|
||||
|
Shopping Malls
|
(59
)
|
-
|
-
|
-
|
(59
)
|
|
Offices and
Others
|
3
|
1
|
-
|
-
|
4
|
|
Sales and
Developments
|
(41
)
|
5
|
-
|
-
|
(36
)
|
|
Hotels
|
(1
)
|
-
|
-
|
-
|
(1
)
|
|
International
|
27
|
-
|
-
|
-
|
27
|
|
Financial Operations,
Corporate and Others
|
(3
)
|
-
|
-
|
-
|
(3
)
|
|
Total
Operations Center in Argentina
|
(74
)
|
6
|
-
|
-
|
(68
)
|
|
|
|
|
|
|
|
|
Operations
Center in Israel
|
|
|
|
|
|
|
Real Estate
|
46
|
-
|
-
|
-
|
46
|
|
Supermarkets
|
(52
)
|
-
|
-
|
-
|
(52
)
|
|
Telecommunications
|
(36
)
|
-
|
-
|
-
|
(36
)
|
|
Insurance
|
-
|
-
|
-
|
-
|
-
|
|
Others
|
(154
)
|
-
|
-
|
-
|
(154
)
|
|
Total
Operations Center in Israel
|
(196
)
|
-
|
-
|
-
|
(196
)
|
|
Total
other operating results, net
|
(270
)
|
6
|
-
|
-
|
(264
)
|
168
|
|
Year
ended on June 30, 2016 (recast)
|
||||
|
Other
operating results, net
|
Income
statement
|
Interest
in joint ventures
|
Expenses
and collective promotion fund
|
Inter-segment
eliminations
|
Segment-reporting
|
|
Operations
Center in Argentina
|
(in
millions of Ps.)
|
||||
|
Shopping Malls
|
(61
)
|
(2
)
|
-
|
-
|
(63
)
|
|
Offices and
Others
|
(7
)
|
-
|
-
|
1
|
(6
)
|
|
Sales and
Developments
|
(42
)
|
4
|
-
|
4
|
(34
)
|
|
Hotels
|
(2
)
|
-
|
-
|
-
|
(2
)
|
|
International
|
92
|
-
|
-
|
-
|
92
|
|
Financial Operations,
Corporate and Others
|
1
|
-
|
-
|
-
|
1
|
|
Total
Operations Center in Argentina
|
(19
)
|
2
|
-
|
5
|
(12
)
|
|
|
|
|
|
|
|
|
Operations
Center in Israel
|
|
|
|
|
|
|
Real Estate
|
(19
)
|
-
|
-
|
-
|
(19
)
|
|
Supermarkets
|
(13
)
|
-
|
-
|
-
|
(13
)
|
|
Telecommunications
|
-
|
-
|
-
|
-
|
-
|
|
Insurance
|
-
|
-
|
-
|
-
|
-
|
|
Others
|
-
|
-
|
-
|
-
|
-
|
|
Total
Operations Center in Israel
|
(32
)
|
-
|
-
|
-
|
(32
)
|
|
Total
other operating results, net
|
(51
)
|
2
|
-
|
5
|
(44
)
|
Other operating results, net,
pursuant to the income statement, declined by Ps.219 million, from
a net loss of Ps.51 million during fiscal year 2016 to a net loss
of Ps.270 million during fiscal year 2017 (Ps.74 million from the
Operations Center in Argentina and Ps.196 million from the
Operations Center in Israel). Such decline is mostly attributable
to a decrease in the exchange difference as a result of
consolidating IDBD for Ps. 107 million.
Other operating results, net from
our joint ventures increased by Ps.4 million, from Ps.2 million
during fiscal year 2016 (of which a Ps.4 million gain is allocated
to the Sales and Developments segment within the Operations Center
in Argentina, while a loss of Ps.2 million is allocated to the
Shopping Malls segment within the Operations Center in Argentina)
to Ps.6 million during fiscal year 2017 (of which a gain of Ps.5
million is allocated to the Sales and Developments segment within
the Operations Center in Argentina, and Ps.1 million to the Offices
and Others segment).
Finally, other operating results
from inter-segment operations where null during fiscal year 2017
while they amounted Ps.5 during fiscal year 2016 (of which Ps.4
million are allocated to the Sales and Developments segment within
the Operations Center in Argentina and Ps.1 million allocated to
the Offices and Others segment within the Operations Center in
Argentina).
Therefore, according to business
segment reporting (taking into consideration the other operating
results, net from our joint ventures and without considering those
related to inter-segment operations), other operating results, net
decreased by Ps.220 million from a net loss of Ps.44 million during
fiscal year 2016 to a net loss of Ps.264 million during fiscal year
2017. Without considering the effect of the Operations Center in
Israel, Other operating results declined by Ps.56
million.
Operations Center in Argentina
Shopping Malls
. Other operating results,
net for the Shopping Malls segment declined by 6.3%, from Ps.63
million during fiscal year 2016 to Ps.59 million during fiscal year
2017, mainly as a consequence of a decrease in the provision for
lawsuits and contingencies of Ps.4 million.
Offices and Others
. Other operating
results, net associated with our Offices and Others segment
increased by Ps.10 million, from a loss of Ps.6 million during
fiscal year 2016 to a gain of Ps.4 million during fiscal year 2017,
mainly due to BAICOM S.A.
169
Sales and Developments
. Other operating
results, net in connection with our Sales and Developments segment
decreased by Ps.2 million, from a loss of Ps.34 million during
fiscal year 2016 to a loss of Ps.36 million during fiscal year
2017, mainly due to the sale and reversal of property, plant and
equipment.
Hotels
. Other operating results, net
associated to the Hotels segment increased by Ps.1 million,
primarily owing to an increase in provisions for lawsuits and other
contingencies.
International
. Other operating results,
net in this segment declined by 70.7% from a net gain of Ps.92
million during fiscal year 2016 to a net gain of Ps.27 million
during fiscal year 2017, primarily due to a decline in income
caused by the partial reversal of cumulative conversion
differences. As of June 30, 2016, it corresponds mainly to the
reversal of the conversion differences prior to IDBD’s
business combination.
Financial Operations, Corporate and
Others
. Other operating results, net associated to our
Financial Operations, Corporate and Others segment decreased by
Ps.4 million, from a gain of Ps.1 million during fiscal year 2016
to a net loss of Ps.3 million during fiscal year 2017, due to lower
income from the sale of subsidiaries which amounted to 4 million in
2016.
Operations Center in Israel
Real
Estate.
During fiscal year 2017, Other operating results,
net from the Real Estate segment totaled Ps.46 million, in
comparison with a loss of Ps.19 million in 2016 due to the
impairment of some property, plant and equipment.
Supermarkets.
During fiscal year 2017,
Other operating results, net from the Supermarkets segment amounted
to a loss of Ps.52 million. Such variation was due to (i) the
comparability of the figures, (ii) a 24% revaluation of the NIS
against the Argentine peso, and (iii) an increased in the
impairment of the supermarket stores.
Telecommunications.
During fiscal year
2017, Other operating results, net from the Telecommunications
segment amounted a loss of Ps.36. Such variation was due to the
comparability of the figures.
Others.
During fiscal year
2017, Other operating results, net from the Others segment amounted
to a loss of Ps.154. Such variation was due to (i) the
comparability of the figures and (ii) a 24% revaluation of the NIS
against the Argentine peso.
Profit / (loss) from operations
|
|
Year
ended on June 30, 2017
|
||||
|
Profit /
(loss) from operations
|
Income
statement
|
Interest
in joint ventures
|
Expenses
and collective promotion fund
|
Inter-segment
eliminations
|
Segment-reporting
|
|
Operations
Center in Argentina
|
(in
millions of Ps.)
|
||||
|
Shopping Malls
|
4,205
|
29
|
24
|
(5
)
|
4,253
|
|
Offices and
Others
|
1,505
|
185
|
3
|
8
|
1,701
|
|
Sales and
Developments
|
824
|
(3
)
|
-
|
-
|
821
|
|
Hotels
|
9
|
-
|
-
|
-
|
9
|
|
International
|
(51
)
|
-
|
-
|
-
|
(51
)
|
|
Financial Operations,
Corporate and Others
|
(204
)
|
-
|
-
|
(3
)
|
(207
)
|
|
Total
Operations Center in Argentina
|
6,288
|
211
|
27
|
-
|
6,526
|
|
|
|
|
|
|
|
|
Operations
Center in Israel
|
|
|
|
|
|
|
Real Estate
|
2,624
|
-
|
-
|
-
|
2,624
|
|
Supermarkets
|
1,649
|
-
|
-
|
-
|
1,649
|
|
Telecommunications
|
(253
)
|
-
|
-
|
-
|
(253
)
|
|
Insurance
|
-
|
-
|
-
|
-
|
-
|
|
Others
|
(758
)
|
-
|
-
|
-
|
(758
)
|
|
Total
Operations Center in Israel
|
3,262
|
-
|
-
|
-
|
3,262
|
|
Total
profit from operations
|
9,550
|
211
|
27
|
-
|
9,788
|
170
|
|
Year
ended on June 30, 2016 (recast)
|
||||
|
Profit /
(loss) from operations
|
Income
statement
|
Interest
in joint ventures
|
Expenses
and collective promotion fund
|
Inter-segment
eliminations
|
Segment-reporting
|
|
Operations
Center in Argentina
|
(in
millions of Ps.)
|
||||
|
Shopping Malls
|
17,792
|
98
|
12
|
(7)
|
17,895
|
|
Offices and
Others
|
1,328
|
248
|
1
|
8
|
1,585
|
|
Sales and
Developments
|
628
|
49
|
-
|
4
|
681
|
|
Hotels
|
-
|
-
|
-
|
(1
)
|
(1
)
|
|
International
|
1
|
-
|
-
|
-
|
1
|
|
Financial Operations,
Corporate and Others
|
(147
)
|
-
|
-
|
(4)
|
(151
)
|
|
Total
Operations Center in Argentina
|
19,602
|
395
|
13
|
-
|
20,010
|
|
|
|
|
|
|
|
|
Operations
Center in Israel
|
|
|
|
|
|
|
Real Estate
|
652
|
-
|
-
|
-
|
652
|
|
Supermarkets
|
411
|
-
|
-
|
-
|
411
|
|
Telecommunications
|
(71
)
|
-
|
-
|
-
|
(71
)
|
|
Insurance
|
-
|
-
|
-
|
-
|
-
|
|
Others
|
(205
)
|
-
|
-
|
-
|
(205
)
|
|
Total
Operations Center in Israel
|
787
|
-
|
-
|
-
|
787
|
|
Total
profit from operations
|
20,389
|
395
|
13
|
-
|
20,797
|
Profit from operations, pursuant to
the income statement, decreased by 53.2%, from Ps.20,389 million
during fiscal year 2016 to Ps.9,550 million during fiscal year 2017
(of which Ps.3,262 million are attributable to the Operations
Center in Israel and Ps.6,288 million to the Operations Center in
Argentina). Without considering the effect of the Operations Center
in Israel, Profit from operations decreased by 67.9%. Profit from
operations, as a percentage of revenues from sales, leases and
services, declined from 64.7% during fiscal year 2016 to 12.9%
during fiscal year 2017. Without considering the effect of the
Operations Center in Israel, profit from operations, as a
percentage of total revenues, decreased from 440.9% during fiscal
year 2016 to 109.4% during fiscal year 2017.
The profit /(loss) from operations
in the Operations Center in Israel are not comparable year to year
due two main factors: (i) the results of operations for the fiscal
year ended Junes 30, 2016 include only six months of operations
from the Operations Center in Israel, from October 11, 2015 (the
date control was acquired) through March 31, 2016 (adjusted by such
material transactions occurred between April 1, 2016 and June 30,
2016) While the results of operations for the fiscal year ended
June 30, 2017 include twelve months of operations from the
Operations Center in Israel, from April1, 2016 through March 31,
2017 (adjusted by such material transactions occurred between April
1, 2017 and June 30, 2017) and (ii) fluctuations between the
Israeli Shekel, the functional currency of the Operations Center
Israel and the Argentine Peso, the Group´s reporting currency,
i.e. the Israeli Shekel appreciated approximately 24% from 2016 to
2017.
For the Operation Center in
Argentina, profit from operations from our joint ventures decreased
by Ps.46.6%, from Ps.395 million during fiscal year 2016 (of which
a profit of Ps.98 million is allocated to the Shopping Malls
segment; a profit of Ps.248 million is allocated to the Offices and
Others segment, and a profit of Ps.49 million is allocated to the
Sales and Developments segment within the Operations Center in
Argentina) to Ps.211 million during fiscal year 2017 (of which a
profit of Ps.29 million is allocated to the Shopping Malls segment;
a profit of Ps.185 million is allocated to the Offices and Others
segment, and a loss of Ps.3 million is allocated to the Sales and
Developments segment within the Operations Center in Argentina),
mainly as a result of a decrease in net gain from fair value
adjustment of investment properties.
In turn, profit from operations
associated to expenses and collective promotion fund increased by
107.7%, from a profit of Ps.13 million in fiscal year 2016 to a
profit of Ps.27 million during fiscal year 2017.
Finally, profit from operations from
inter-segment operations did not experience significant changes
during the reported period.
171
Therefore, according to business
segment reporting (taking into consideration the profit from
operations from our joint ventures and without considering profit
from operations related to expenses and collective promotion fund
or inter-segment operations), profit from operations decreased by
52.9% from Ps.20,797 million during fiscal year 2016 to Ps.9,788
million during fiscal year 2017 (of which Ps.3,262 million are
attributable to the Operations Center in Israel and Ps.6,526
million to the Operations Center in Argentina). Without considering
the profit from operations from the Operations Center in Israel,
profit from operations decreased by 67.4%. Profit from operations
as a percentage of revenues, pursuant to business segment
reporting, decreased from 68.5% during fiscal year 2016 to 13.5%
during fiscal year 2017. Without considering the effect of the
Operations Center in Israel, total profit from operations as a
percentage of total revenues, pursuant to business segment
reporting, declined from 608.4% during fiscal year 2016 to 151.4%
during fiscal year 2017.
Operations Center in Argentina
Shopping Malls
. Profit from operations
in our Shopping Malls segment decreased by 76.2%, from Ps.17,895
million in income during fiscal year 2016 to Ps.4,253 million in
income during fiscal year 2017. This change is mainly due to a
Ps.14,064 million decrease in net gain from fair value adjustment
of investment properties.
Profit from operations associated to
our Shopping Malls segment, as a percentage of this segment’s
revenues, decreased from 743.8% during fiscal year 2016 to 139.8%
during fiscal year 2017.
Offices and Others
. Profit from
operations in our Offices and Others segment rose by 7.3%, from
Ps.1,585 million in income during fiscal year 2016 to Ps.1,701
million in income during fiscal year 2017. The main changes are
attributable to higher income from partial disposals of investment
properties during fiscal year 2017 and net loss from fair value
adjustment of investment properties (Ps.50 million), partially
offset by an increase in Selling Expenses of Ps.26
million.
Sales and Developments
. Profit from
operations in our Sales and Developments segment rose by 20.6%, up
from income for Ps.681 million during fiscal year 2016 to income
for Ps.821 million during fiscal year 2017. Such increase was
mainly due to higher income from sales of the floors in the Beruti
building and parking spaces in Rosario (Ps.91 million) and the net
loss from fair value adjustment of investment properties (Ps.76
million), which were partially offset by a Ps.23 million increase
in Costs.
Hotels
. Profit from operations in the
Hotels segment grew by Ps.10 million, up from a loss of Ps.1
million during fiscal year 2016 to Ps.9 million in income during
fiscal year 2017. The rise in the average rate per room in our
hotel portfolio (in Pesos), generated an increase in revenues,
along with higher costs (Ps.125 million), general and
administrative expenses (Ps.32 million) and selling expenses (Ps.25
million), among others.
International
. Profit from operations in
our International segment decreased by Ps.52 million from Ps.1
million in income during fiscal year 2016 to a Ps.51 million loss
during fiscal year 2017. The main changes resulted from a decrease
in Other income and expenses of Ps.117 million.
Financial Operations, Corporate and
Others
. Loss from operations for our Financial Operations,
Corporate and Others segment exhibited an increase in the loss of
37.1%, from a Ps.151 million loss during fiscal year 2016 to a
Ps.207 million loss during fiscal year 2017, mainly as a result of
a Ps.48 million change in general and administrative
expenses.
Operations Center in Israel
Real
Estate.
Profit from operations from the Real Estate segment
increased from Ps.652 million during fiscal year 2016 to Ps.2,624
million during fiscal year 2017. Such variation was due to (i) the
comparability of the figures, (ii) a 24% revaluation of the NIS
against the Argentine peso, and (iii) to the occupancy of
revenue-generating projects in Israel. Also the recording of
revenues from the sale of apartments and real estate is affected by
the timing of the occupation of apartments, which was higher in
2017 a reduction of costs and an profit related to the changes in
fair value of investment properties.
172
Supermarkets.
Profit from operations
from the Supermarket segment rose from Ps.411 million during fiscal
year 2016 to Ps.1,649 million during fiscal year 2017. Such
variation was due to (i) the comparability of the figures, (ii) a
24% revaluation of the NIS against the Argentine peso, and (iii the
increase in franchisees, the increase in the share of the private
brand, the improvement in trade terms, the components of the
basket, the mix of sales, and the increased efficiency due to the
implementation of the business plan.
Telecommunications.
Profit from
operations from the Telecommunications segment increased from a
loss of Ps.71 million during fiscal year 2016 to a loss of Ps.253
million during fiscal year 2017. Such variation was due to (i) the
comparability of the figures, (ii) a 24% revaluation of the NIS
against the Argentine peso, and (iii) the continued erosion in
income from services, which was partly offset by the decrease in
operating expenses, due to the increased efficiency measures which
were implemented by Cellcom.
Others.
Profit from operations from the
Others segment increased from a loss of Ps.205 million during
fiscal year 2016 to a loss of Ps.758 million during fiscal year
2017. Such variation was due to (i) the comparability of the
figures, (ii) a 24% revaluation of the NIS against the Argentine
peso, and (iii) the lack of income derived by the sale of some
revenue generating assets of DIC
Share of profit / (loss) of associates and joint
ventures
|
|
Year
ended on June 30, 2017
|
||||
|
Share of
profit / (loss) of associates and joint ventures
|
Income
statement
|
Interest
in joint ventures
|
Expenses
and collective promotion fund
|
Inter-segment
elimination
|
Segment-reporting
|
|
Operations
Center in Argentina
|
(in
millions of Ps.)
|
||||
|
Shopping Malls
|
20
|
(20
)
|
-
|
-
|
-
|
|
Offices and
Others
|
132
|
(132
)
|
-
|
-
|
-
|
|
Sales and
Developments
|
36
|
(22
)
|
-
|
-
|
14
|
|
Hotels
|
-
|
-
|
-
|
-
|
-
|
|
International
|
(196
)
|
-
|
-
|
-
|
(196
)
|
|
Financial Operations,
Corporate and Others
|
88
|
-
|
-
|
-
|
88
|
|
Total
Operations Center in Argentina
|
80
|
(174
)
|
-
|
-
|
(94
)
|
|
|
|
|
|
|
|
|
Operations
Center in Israel
|
|
|
|
|
|
|
Real Estate
|
46
|
-
|
-
|
-
|
46
|
|
Supermarkets
|
75
|
-
|
-
|
-
|
75
|
|
Telecommunications
|
-
|
-
|
-
|
-
|
-
|
|
Insurance
|
-
|
-
|
-
|
-
|
-
|
|
Others
|
(16
)
|
-
|
-
|
-
|
(16
)
|
|
Total
Operations Center in Israel
|
105
|
-
|
-
|
-
|
105
|
|
Total
share of profit / (loss) of associates and joint
ventures
|
185
|
(174
)
|
-
|
-
|
11
|
|
|
Year
ended on June 30, 2016 (recast)
|
||||
|
Share of
profit / (loss) of associates and joint ventures
|
Income
statement
|
Interest
in joint ventures
|
Expenses
and collective promotion fund
|
Inter-segment
elimination
|
Segment-reporting
|
|
Operations
Center in Argentina
|
(in
millions of Ps.)
|
||||
|
Shopping Malls
|
61
|
(61
)
|
-
|
-
|
-
|
|
Offices and
Others
|
175
|
(155
)
|
-
|
-
|
20
|
|
Sales and
Developments
|
47
|
(42
)
|
-
|
-
|
5
|
|
Hotels
|
-
|
-
|
-
|
-
|
-
|
|
International
|
(129
)
|
-
|
-
|
-
|
(129
)
|
|
Financial Operations,
Corporate and Others
|
231
|
-
|
-
|
-
|
231
|
|
Total
Operations Center in Argentina
|
385
|
(258
)
|
-
|
-
|
127
|
|
|
|
|
|
|
|
|
Operations
Center in Israel
|
|
|
|
|
|
|
Real Estate
|
226
|
-
|
-
|
-
|
226
|
|
Supermarkets
|
-
|
-
|
-
|
-
|
-
|
|
Telecommunications
|
-
|
-
|
-
|
-
|
-
|
|
Insurance
|
-
|
-
|
-
|
-
|
-
|
|
Others
|
(103
)
|
-
|
-
|
-
|
(103
)
|
|
Total
Operations Center in Israel
|
123
|
-
|
-
|
-
|
123
|
|
Total
share of loss of associates and joint ventures
|
508
|
(258
)
|
-
|
-
|
250
|
173
Our share of profit / (loss) of
associates and joint ventures, pursuant to the income statement,
decreased by 63.6%, from a gain of Ps.508 million during fiscal
year 2016 to a gain of Ps.185 million during fiscal year 2017 (of
which a gain of Ps.80 million is attributable to the Operations
Center in Argentina and a gain of Ps.105 million to the Operations
Center in Israel). Without considering the effect of the Operations
Center in Israel, our share of loss of associates and joint
ventures decreased by 79.2%, mainly as a result of higher losses
derived from our International segment and a decrease in income
from our Financial Operations, Corporate and Others
segment.
Share of profit/ (loss) of
associates and joint ventures in the Operations Center in Israel
are not comparable year to year due two main factors: (i) the
results of operations for the fiscal year ended Junes 30, 2016
include only six months of operations from the Operations Center in
Israel, from October 11, 2015 (the date control was acquired)
through March 31, 2016 (adjusted by such material transactions
occurred between April 1, 2016 and June 30, 2016) While the results
of operations for the fiscal year ended June 30, 2017 include
twelve months of operations from the Operations Center in Israel,
from April1, 2016 through March 31, 2017 (adjusted by such material
transactions occurred between April 1, 2017 and June 30, 2017) and
(ii) fluctuations between the Israeli Shekel, the functional
currency of the Operations Center Israel and the Argentine Peso,
the Group´s reporting currency, i.e. the Israeli Shekel
appreciated approximately 24% from 2016 to 2017.
Furthermore, our net share of profit
(loss) of joint ventures mainly from NPSF (Shopping Malls segment),
Quality Invest S.A. (Offices and Others segment), and Cyrsa S.A.,
Puerto Retiro S.A. and Baicom Networks S.A. (Sales and Developments
segment) experienced a change of 95.6%, from a gain of Ps.250
million during fiscal year 2016 to a gain of Ps.11 million during
fiscal year 2017, mostly due to the results of the Quality S.A.
joint venture, following a decline in that company’s
revenues.
Operations Center in Argentina
Shopping Malls.
According to business
segment reporting, the share of profit of the joint venture NPSF is
presented on a line by line consolidated basis in this
segment.
Offices and Others.
The
share of profit of a associates and joint ventures from the Office
and Others segment where Ps.20.4 million during fiscal year 2016
while they where null during fiscal year 2017, related to
LRSA.
Sales and developments.
The share of
profit of joint ventures Cyrsa, Puerto Retiro S.A. and Baicom
Networks S.A. is presented on a line by line consolidated basis.
The share of profit / (loss) of our associate Manibil S.A.,
presented in this line, rose by Ps.9 million, from Ps.5 million
during fiscal year 2016 to Ps.14 million during fiscal year
2017.
Hotels.
No share of profit / (loss) of
associates and joint ventures was accounted for during the year in
connection with this segment.
International.
Our share of loss of
associates in this segment increased by 51.9%, from a loss of
Ps.129 million during fiscal year 2016 to a loss of Ps.196 million
during fiscal year 2017, mainly due to increased losses from our
investment in New Lipstick LLC for Ps.76 million and the
non-recurrence of losses by Ps.79 million from our investment in
IDBD; partially offset by increased gains from Condor for Ps.88
million.
Financial Operations, Corporate and
Others.
The share of profit of our associates in the
Financial Operations, Corporate and Others segment decreased by
61.9%, from Ps.231 million during fiscal year 2016 to Ps.88 million
during fiscal year 2017, mainly due to: (i) lower gains from our
investments in BHSA for Ps.174 million and a loss of Ps.7 million
corresponding to our investment in Avenida, partialy offset by:
(ii) lower losses from our investment in Tarshop for Ps.24 million
and increased gains from our investment in Banco de Crédito y
Securitización for Ps.13 million.
174
Operations Center in Israel
Real
Estate.
During fiscal year 2017, the share of profit of
associates and joint ventures associated to the Real Estate segment
totaled Ps.46 million. Such variation was due to (i) the
comparability of the figures, (ii) a 24% revaluation of the NIS
against the Argentine peso, and (iii) a decrease of sales in
PBEL.
Supermarkets.
During fiscal year 2017,
the share of profit of associates and joint ventures associated to
the Supermarkets segment totaled Ps.75 million, comparing to a cero
result from 2016. This is due to an improvement in the associates
of shufersal which were considered impaired in 2016
Others.
During fiscal year 2017, the
share of loss of associates and joint ventures associated to the
Others segment totaled Ps.16 million, showing a decrease in
comparison with the loss of Ps.103 million in 2016, mainly due to
the improvements of the investments of Elron.
Financial
results, net
The net financial loss decreased by
Ps.272 million, from a loss of Ps.4,890 million during fiscal year
2016 to a loss of Ps.4,618 million during fiscal year 2017 (of
which Ps.3,370 million are derived from the Operations Center in
Israel and Ps.1,248 million are derived from the Operations Center
in Argentina).
Operations Center in Argentina:
The net financial loss decreased by
32.6%, from Ps.1,853 million during fiscal year 2016 to Ps.1,248
million during fiscal year 2017, mainly as a result of: (i) a
decrease in costs and financial income in the amount of Ps.1,023
million (mostly caused by: (a) a decrease in currency exchange
losses of Ps.1,022 million; (b) an increase in the interest expense
on loans for Ps.453 million and in income on notes for Ps.261
million, and (c) a decrease in other financial costs for Ps.182
million); partially offset by: (ii) decreased gains from other
financial results of Ps.839 million (mainly attributable to results
from financial derivatives for Ps.880 million).
Operations Center in Israel:
The net financial loss from the
Operations Center in Israel amounted to Ps.3,370 million, mainly
attributable to interest expense and offset by a gain from
Clal’s shares.
Income
Tax
The Company applies the deferred tax
method to calculate the income tax applicable to the fiscal periods
under consideration, thus recognizing the temporary differences as
tax assets and liabilities. The income tax expense for the year
went from a Ps.6,373 million loss during fiscal year 2016 to a
Ps.2,915 million loss during fiscal year 2017, of which a Ps.2,421
million loss was derived from the Operations Center in Argentina
and a Ps.494 million loss was derived from the Operations Center in
Israel.
Profit for the
year
As a result of the factors described
above, profit for the year went from Ps.10,078 million during
fiscal year 2016 to Ps.5,220 million during fiscal year 2017, of
which a profit of Ps.2,699 million is attributable to the
Operations Center in Argentina and a profit of Ps.2,521 million is
attributable to the Operations Center in Israel
(of which a gain of
Ps.3,018 corresponds to discontinued operations and a loss of
Ps.497 to continuing operations).
Discontinued
operations
The results of Israir Open Sky and
IDB Tourism operations, the share of profit of Adama and the
finance costs associated to the non-recourse loan, until its sale,
and the results from sale of the investment in Adama have been
reclassified in the Statements of Income under discontinued
operations.
175
Results of
Operations for the fiscal years ended June 30, 2016 and
2015
Revenues
|
|
Year
ended on June 30, 2016 (recast)
|
||||
|
Revenues
|
Income
statement
|
Interest
in joint ventures
|
Expenses
and collective promotion fund
|
Inter-segment
eliminations
|
Segment-reporting
|
|
Operations
Center in Argentina
|
(in
millions of Ps.)
|
||||
|
Shopping Malls
|
3,487
|
20
|
(1,101
)
|
-
|
2,406
|
|
Offices and
Others
|
422
|
4
|
(93
)
|
7
|
340
|
|
Sales and
Developments
|
3
|
5
|
-
|
-
|
8
|
|
Hotels
|
533
|
-
|
-
|
1
|
534
|
|
International
|
-
|
-
|
-
|
-
|
-
|
|
Financial Operations,
Corporate and Others
|
1
|
-
|
-
|
-
|
1
|
|
Total
Operations Center in Argentina
|
4,446
|
29
|
(1,194
)
|
8
|
3,289
|
|
|
|
|
|
|
|
|
Operations
Center in Israel
|
|
|
|
|
|
|
Real Estate
|
1,538
|
-
|
-
|
-
|
1,538
|
|
Supermarkets
|
18,610
|
-
|
-
|
-
|
18,610
|
|
Telecommunications
|
6,655
|
-
|
-
|
-
|
6,655
|
|
Insurance
|
-
|
-
|
-
|
-
|
-
|
|
Others
|
274
|
-
|
-
|
-
|
274
|
|
Total
Operations Center in Israel
|
27,077
|
-
|
-
|
-
|
27,077
|
|
Total
revenues
|
31,523
|
29
|
(1,194
)
|
8
|
30,366
|
|
|
Year
ended on June 30, 2015 (recast)
|
||||
|
Revenues
|
Income
statement
|
Interest
in joint ventures
|
Expenses
and collective promotion fund
|
Inter-segment
eliminations
|
Segment-reporting
|
|
Operations
Center in Argentina
|
(in
millions of Ps.)
|
||||
|
Shopping Malls
|
2,571
|
13
|
(806
)
|
-
|
1,778
|
|
Offices and
Others
|
398
|
9
|
(79
)
|
5
|
333
|
|
Sales and
Developments
|
10
|
5
|
-
|
-
|
15
|
|
Hotels
|
396
|
-
|
-
|
-
|
396
|
|
International
|
28
|
-
|
(2
)
|
-
|
26
|
|
Financial Operations,
Corporate and Others
|
-
|
-
|
-
|
-
|
-
|
|
Total
revenues
|
3,403
|
27
|
(887
)
|
5
|
2,548
|
Revenues from sales, leases and
services, increased Ps.28,120 million, from Ps.3,403 million during
fiscal year 2015 to Ps.31,523 million during fiscal year 2016
(Ps.27,077 million of which derive from the Operations Center in
Israel and Ps.4,446 million from the Operations Center in
Argentina). Without considering the revenues from the Operations
Center in Israel, revenues from sales, leases and services
increased by 30.6%.
Revenues from expenses and
collective promotion fund increased by 34.6%, from Ps.887 million
(of which Ps.806 million are allocated to the Shopping Malls
segment, Ps.79 million are allocated to the Offices and Others
segment and Ps.2 million are allocated to the International segment
within the Operations Center in Argentina) during fiscal year 2015
to Ps.1,194 million (of which Ps.1,101 million are allocated to the
Shopping Malls segment and Ps.93 million are allocated to the
Offices and Others segment) during fiscal year 2016.
Furthermore, revenues from interests
in our joint ventures increased 7.4%, from Ps.27 million during
fiscal year 2015 (of which Ps.13 million are allocated to the
Shopping Malls segment, Ps.9 million to the Offices and Others
segment, and Ps.5 million to the Sales and Developments segment
within the Operations Center in Argentina) to Ps.29 million during
fiscal year 2016 (of which Ps.20 million are allocated to the
Shopping Malls segment, Ps.4 million to the Offices and Others
segment, and Ps.5 million to the Sales and Developments segment
within the Operations Center in Argentina), mainly as a result of
increased revenues from our joint venture Nuevo Puerto Santa Fe
S.A, and partially offset by a decline in revenues from our joint
venture Quality Invest S.A.
176
Finally, inter-segment revenues
increased by 60%, from Ps.5 million during fiscal year 2015
(allocated to the Offices and Others segment within the Operations
Center in Argentina) to Ps.8 million during fiscal year 2016 (of
which Ps.7 million are allocated to the Offices and Others segment
and Ps.1 million to the Hotels segment within the Operations Center
in Argentina).
Thus, according to business segment
reporting (taking into consideration the revenues from our joint
ventures and without considering the revenues from expenses and
collective promotion fund or inter-segment revenues), revenues grew
by Ps.27,818 million from Ps.2,548 million during fiscal year 2015
to Ps.30,366 million during fiscal year 2016 (of which Ps.27,077
million are derived from the Operations Center in Israel and
Ps.3,289 million are derived from the Operations Center in
Argentina). Without considering the revenues from the Operations
Center in Israel, revenues, pursuant to business segment reporting,
grew by 29.1%.
Operations Center in Argentina
Shopping Malls
. Revenues from the
Shopping Malls segment increased by 35.3%, from Ps.1,778 million
during fiscal year 2015 to Ps.2,406 million during fiscal year
2016. This increase was mainly attributable to: (i) a Ps.471
million increase in the revenues from base and percentage rents
stemming from a 34.4% increase in our tenants’ total sales,
from Ps.21,509 million during fiscal year 2015 to Ps.28,905 million
during fiscal year 2016, (ii) a Ps.51 million increase in revenues
from admission fees, (iii) a Ps.41 million increase in revenues
from parking lot, and (iv) a Ps.36 million increase in revenues
from commissions, among other items.
Offices and Others
. Revenues from the
Offices and Others segment rose by 2.1% from Ps.333 million during
fiscal year 2015 to Ps.340 million during fiscal year 2016. They
were affected by the partial sales of investment properties that
took place during fiscal year 2016 and caused a reduction in the
segment’s total leasable surface area. Rental revenues,
considering properties that are similar for both fiscal years on
account of no reductions in their leasable area, rose by 34%, from
Ps.200 million during fiscal year ended June 30, 2015 to Ps.268
million during fiscal year ended June 30, 2016, mainly due to the
depreciation of the Peso while rental revenues associated with
properties whose leasable area had sustained a reduction, dropped
by 49.5%, from Ps.111 million during fiscal year 2015 to Ps.56
million during fiscal year 2016. At the end of fiscal year 2016,
the average occupancy rate for the portfolio of premium offices had
been 97.7% and the average rental remained close to US$27 per
square meter.
Sales and Developments
. Revenues from
the Sales and Developments segment decreased by 46.7%, from Ps.15
million during fiscal year 2015 to Ps.8 million during fiscal year
2016. This reduction is mainly due to lower revenues from the sales
of units at Condominios I and II (Ps.7 million).
Hotels
. Revenues from our Hotels segment
rose by 34.8%, from Ps.396 million during fiscal year 2015 to
Ps.534 million during fiscal year 2016, primarily due to a 34.4%
increase in the average rate per room (measured in pesos) of our
hotel portfolio.
International
. Revenues from the
International segment dropped by 100% as compared to the Ps.26
million accounted for in fiscal year 2015 due to the sale of the
Madison 183 building completed by the Company in fiscal year
2015.
Financial Operations, Corporate and
Others
. Revenues from the Financial Operations, Corporate
and Others segment did not experience significant changes during
the reported periods.
Operations Center in Israel
Real
Estate.
During fiscal year 2016, revenues from the Real
Estate segment totaled Ps.1,538 million.
Supermarkets.
During fiscal year 2016,
revenues from the Supermarkets segment totaled Ps.18,610
million.
Telecommunications.
During fiscal year
2016, revenues from the Telecommunications segment totaled Ps.6,655
million.
177
Others.
During fiscal year 2016,
revenues from the Others segment totaled Ps.274
million.
Costs
|
|
Year
ended on June 30, 2016 (recast)
|
||||
|
Costs
|
Income
statement
|
Interest
in joint ventures
|
Expenses
and collective promotion fund
|
Inter-segment
eliminations
|
Segment-reporting
|
|
Operations
Center in Argentina
|
(in
millions of Ps.)
|
||||
|
Shopping Malls
|
(1,361
)
|
(2
)
|
1,113
|
(6
)
|
(256
)
|
|
Offices and
Others
|
(110
)
|
(5
)
|
94
|
-
|
(21
)
|
|
Sales and
Developments
|
(15
)
|
(5
)
|
-
|
-
|
(20
)
|
|
Hotels
|
(361
)
|
-
|
-
|
-
|
(361
)
|
|
International
|
-
|
-
|
-
|
-
|
-
|
|
Financial Operations,
Corporate and Others
|
-
|
-
|
-
|
-
|
-
|
|
Total
Operations Center in Argentina
|
(1,847
)
|
(12
)
|
1,207
|
(6
)
|
(658
)
|
|
|
|
|
|
|
|
|
Operations
Center in Israel
|
|
|
|
|
|
|
Real Estate
|
(467
)
|
-
|
-
|
-
|
(467
)
|
|
Supermarkets
|
(14,076
)
|
-
|
-
|
-
|
(14,076
)
|
|
Telecommunications
|
(4,525
)
|
-
|
-
|
-
|
(4,525
)
|
|
Insurance
|
-
|
-
|
-
|
-
|
-
|
|
Others
|
(184
)
|
-
|
-
|
-
|
(184
)
|
|
Total
Operations Center in Israel
|
(19,252
)
|
-
|
-
|
-
|
(19,252
)
|
|
Total
costs
|
(21,099
)
|
(12
)
|
1,207
|
(6
)
|
(19,910
)
|
|
|
Year
ended on June 30, 2015 (recast)
|
||||
|
Costs
|
Income
statement
|
Interest
in joint ventures
|
Expenses
and collective promotion fund
|
Inter-segment
eliminations
|
Segment-reporting
|
|
Operations
Center in Argentina
|
(in
millions of Ps.)
|
||||
|
Shopping Malls
|
(979
)
|
(1
)
|
820
|
(4
)
|
(164
)
|
|
Offices and
Others
|
(89
)
|
(3
)
|
79
|
-
|
(13
)
|
|
Sales and
Developments
|
(14
)
|
(5
)
|
-
|
-
|
(19
)
|
|
Hotels
|
(278
)
|
-
|
-
|
-
|
(278
)
|
|
International
|
(9
)
|
-
|
2
|
-
|
(7
)
|
|
Financial Operations,
Corporate and Others
|
-
|
-
|
-
|
-
|
-
|
|
Total
costs
|
(1,369
)
|
(9
)
|
901
|
(4
)
|
(481
)
|
Costs, pursuant to the income
statement, increased by Ps.19,730 million, from Ps.1,369 million
during fiscal year 2015 to Ps.21,099 million during fiscal year
2016 (of which Ps.19,252 million are derived from the Operations
Center in Israel and Ps.1,847 million from the Operations Center in
Argentina). Without considering the costs from the Operations
Center in Israel, costs rose by 34.9%. Costs as a percentage of
Revenues also increased by 40.2% during fiscal year 2015 to 66.9%
during fiscal year 2016, and such increase is mainly attributable
to the Operations Center in Israel. Without considering the costs
from the Operations Center in Israel, consolidated costs as a
percentage of Revenues experienced a slight increase from 40.2%
during fiscal year 2015 to 41.5% during fiscal year
2016.
178
In turn, costs from expenses and
collective promotion fund increased by 34%, from Ps.901 million
during fiscal year 2015 (of which Ps.820 million are allocated to
the Shopping Malls segment, Ps.79 million to the Offices and Others
segment within the Operations Center in Argentina and Ps.2 million
to the International segment) to Ps.1,207 million during fiscal
year 2016 (of which Ps.1,113 million are allocated to the Shopping
Malls segment and Ps.94 million to the Offices and Others segment
within the Operations Center in Argentina), mainly due to increased
costs originated by our Shopping Malls, which rose by 35.7% from
Ps.820 million in fiscal year 2015 to Ps.1,113 million in fiscal
year 2016, mainly as a result of: (i) an increase in advertising
expenses of Ps.111.8 million, (ii) an increase in salaries, social
security charges and other personnel expenses of Ps.103.1 million;
(iii) an increase in maintenance, security, cleaning, repair and
other expenses of Ps.100.8 million(caused mainly by price raises in
security and cleaning services and in public utilities rates), (iv)
an increase in taxes, rates and contributions, and other expenses
of Ps.25.5 million; and (v) an increase in other expenses of Ps.42
million (to cover the deficit in the expenses and collective
promotion fund). Such change was also attributable to: a Ps.54.1
million increase from Ps.28.3 million during fiscal year 2015 to
Ps.82.4 million during fiscal year 2016, mostly caused by the
acquisition of new buildings (maintenance, cleaning, lease, common
maintenance and other expenses of Ps.36.1 million, salaries and
social security charges of Ps.10.8 million, and taxes, rates and
contributions, and utilities of Ps.8.9 million).
Furthermore, costs from our joint
ventures showed a net increase of 33.3%, from Ps.9 million during
fiscal year 2015 (of which Ps.1 million are allocated to the
Shopping Malls segment, Ps.3 million to the Offices and Others
segment, and Ps.5 million to the Sales and Developments segment
within the Operations Center in Argentina) to Ps.12 million during
fiscal year 2016 (of which Ps.2 million are allocated to the
Shopping Malls segment, Ps.5 million to the Offices and Others
segment, and Ps.5 million to the Sales and Developments segment
within the Operations Center in Argentina).
Finally, costs from inter-segment
transactions increased by 50%, from Ps.4 million during fiscal year
2015 to Ps.6 million during fiscal year 2016 (which are fully
allocated to the Shopping Malls segment within the Operations
Center in Argentina).
Therefore, based on business segment
reporting (taking into consideration the costs from our joint
ventures and without considering the costs from expenses and
collective promotion fund or costs from inter-segment operations),
costs rose by Ps.19.429 million from Ps.481 million during fiscal
year 2015 to Ps.19.910 million during fiscal year 2016 (of which
Ps.19.252 million are attributable to the Operations Center in
Israel and Ps.658 million to the Operations Center in Argentina).
Without considering the costs from the Operations Center in Israel,
costs rose by 36.8%. Furthermore, total costs as a percentage of
total revenues, pursuant to business segment reporting, increased
from 18.9% during fiscal year 2015 to 65.6% during fiscal year
2016, and such increase is mainly attributable to the Operating
Center in Israel. Without considering the effect of the Operations
Center in Israel, total costs as a percentage of total revenues
experienced a slight increase from 18.9% during fiscal year 2015 to
20% during fiscal year 2016.
Operations Center in Argentina
Shopping Malls
. Costs from the Shopping
Malls segment increased by 56.1%, from Ps.164 million during fiscal
year 2015 to Ps.256 million during fiscal year 2016. This increase
is mainly due to: (i) higher costs related to a deficit in expenses
and collective promotion fund of our Shopping Malls for Ps.59
million; (ii) a Ps.10 million increase in maintenance, security,
cleaning, repair and other expenses (caused mainly by higher
security and cleaning services expenses and increased public
utilities costs); and (iii) a Ps.10 million increase in salaries,
social security charges and other personnel expenses, among other
items. Costs from the Shopping Malls segment, as a percentage of
revenues derived from this segment, increased slightly from 9.2%
during the fiscal year ended June 30, 2015 to 10.6% during fiscal
year 2016.
Offices and Others
. Costs in the Offices
and Others segment increased by 61.5%, from Ps.13 million during
fiscal year 2015 to Ps.21 million during fiscal year 2016, mainly
as a consequence of an increase in lease and common maintenance
expenses of Ps.6 million, among others. Total costs in the Offices
and Others segment, as a percentage of this segment’s
revenues, rose from 3.9% during fiscal year 2015 to 6.2% during
fiscal year 2016.
179
Sales and Developments
. This
segment’s costs often exhibit significant changes from period
to period because of the non-recurrence of the sales of properties
by the Company over time. The costs associated to our Sales and
Developments segment increased by 5.3%, from Ps.19 million during
fiscal year 2015 to Ps.20 million during fiscal year 2016. Costs in
the Sales and Developments segment, as a percentage of this
segment’s revenues, increased from 126.7% during fiscal year
2015 to 250% during fiscal year 2016.
Hotels
. Costs in the Hotels segment rose
by 29.9%, from Ps.278 million during fiscal year 2015 to Ps.361
million during fiscal year 2016, mainly due to: (i) a Ps.52 million
increase in salaries, social security charges and other personnel
expenses; (ii) increased charges, amounting to Ps.19 million, as
maintenance and repairs; and (iii) an increase of Ps.7 million and
Ps.5 million in service fees and in the cost of food, beverages and
other hotel-related expenses, respectively. Costs in the Hotels
segment, as a percentage of segment revenues, decreased from 70.2%
during fiscal year 2015 to 67.6% during fiscal year
2016.
International
. Costs in the
International segment dropped by 100%, as compared to the Ps.7
million accounted for during fiscal year 2015. Such decrease is
mainly attributable to the sale of the Madison 183 building in
fiscal year 2015, which used to be allocated to rental
property.
Operations Center in Israel
Real
Estate.
During fiscal year 2016, costs from the Real Estate
segment totaled Ps.467 million. In addition, costs, as a percentage
of the revenues derived from this segment, amounted to
30.4%.
Supermarkets.
During fiscal year 2016,
costs from the Supermarkets segment totaled Ps.14,076 million. In
addition, costs, as a percentage of the revenues derived from this
segment, amounted to 75.6%.
Telecommunications.
During fiscal year
2016, costs from the Telecommunications segment totaled Ps.4,525
million. In addition, costs, as a percentage of the revenues
derived from this segment, amounted to 68.0%.
Others.
During fiscal year 2016, costs
from the Others segment totaled Ps.184 million. In addition, costs,
as a percentage of the revenues derived from this segment, amounted
to 67.2%.
Gross profit
|
|
Year
ended on June 30, 2016 (recast)
|
||||
|
Gross profit
|
Income
statement
|
Interest
in joint ventures
|
Expenses
and collective promotion fund
|
Inter-segment
eliminations
|
Segment-reporting
|
|
Operations
Center in Argentina
|
(in
millions of Ps.)
|
||||
|
Shopping Malls
|
2,126
|
18
|
12
|
(6
)
|
2,150
|
|
Offices and
Others
|
312
|
(1
)
|
1
|
7
|
319
|
|
Sales and
Developments
|
(12
)
|
-
|
-
|
-
|
(12
)
|
|
Hotels
|
172
|
-
|
-
|
1
|
173
|
|
International
|
-
|
-
|
-
|
-
|
-
|
|
Financial Operations,
Corporate and Others
|
1
|
-
|
-
|
-
|
1
|
|
Total
Operations Center in Argentina
|
2,599
|
17
|
13
|
2
|
2,631
|
|
|
|
|
|
|
|
|
Operations
Center in Israel
|
|
|
|
|
|
|
Real Estate
|
1,071
|
-
|
-
|
-
|
1,071
|
|
Supermarkets
|
4,534
|
-
|
-
|
-
|
4,534
|
|
Telecommunications
|
2,130
|
-
|
-
|
-
|
2,130
|
|
Insurance
|
-
|
-
|
-
|
-
|
-
|
|
Others
|
90
|
-
|
-
|
-
|
90
|
|
Total
Operations Center in Israel
|
7,825
|
-
|
-
|
-
|
7,825
|
|
Total
gross profit
|
10,424
|
17
|
13
|
2
|
10,456
|
180
|
|
Year
ended on June 30, 2015 (recast)
|
||||
|
Gross
profit
|
Income
statement
|
Interest
in joint ventures
|
Expenses
and collective promotion fund
|
Inter-segment
eliminations
|
Segment-reporting
|
|
Operations
Center in Argentina
|
(in
millions of Ps.)
|
||||
|
Shopping Malls
|
1,592
|
12
|
14
|
(4
)
|
1,614
|
|
Offices and
Other
|
309
|
6
|
-
|
5
|
320
|
|
Sales and
Developments
|
(4
)
|
-
|
-
|
-
|
(4
)
|
|
Hotels
|
118
|
-
|
-
|
-
|
118
|
|
International
|
19
|
-
|
-
|
-
|
19
|
|
Financial Operations,
Corporate and Others
|
-
|
-
|
-
|
-
|
-
|
|
Total
gross profit
|
2,034
|
18
|
14
|
1
|
2,067
|
Gross profit increased by Ps.8,390
million, from Ps.2,034 million during fiscal year 2015 to Ps.10,424
million during fiscal year 2016 (of which Ps.7,825 million was
derived from the Operations Center in Israel and Ps.2,599 million
from the Operations Center in Argentina). Excluding the results of
the Operations Center in Israel, gross profit rose by 27.8%. Gross
profit, as a percentage of revenues from sales, leases and
services, decreased 59.8% during fiscal year 2015 to 33.1% during
fiscal year 2016. Excluding the results of the Operations Center in
Israel, Gross profit experienced a slight decline from 59.8% during
fiscal year 2015 to 58.5% during fiscal year 2016.
Total gross profit from expenses and
collective promotion fund did not experience significant changes
and remained at approximately Ps.14 million in both fiscal years
(mostly allocated to the Shopping Malls segment).
Furthermore, gross profit from our
joint ventures decreased by 5.6% from Ps.18 million in fiscal year
2015 to Ps.17 million in fiscal year 2016.
Therefore, based on business segment
reporting (taking into consideration the gross profit from our
joint ventures and without considering the gross profit from
expenses and collective promotion fund or inter-segment gross
profits), gross profit rose by Ps.8,389 million from Ps.2,067
million during fiscal year 2015 to Ps.10,456 million during fiscal
year 2016 (of which Ps.7,825 million was attributable to the
Operations Center in Israel and Ps.2,631 million to the Operations
Center in Argentina). Without considering the effect of the
Operations Center in Israel, gross profit rose by
27.3%.Furthermore, gross profit as a percentage of revenues,
pursuant to business segment reporting, decreased from 81.1% during
fiscal year 2015 to 34.4% during fiscal year 2016. Excluding the
results of the Operations Center in Israel, gross profit as a
percentage of total revenues experienced a slight decline from
81.1% during fiscal year 2015 to 80% during fiscal year
2016.
Operations Center in Argentina
Shopping Malls
. Gross profit at the
Shopping Malls segment increased by 33.2%, from Ps.1,614 million
during fiscal year 2015 to Ps.2,150 million during fiscal year
2016, mainly due to an increase in our tenants’ total sales,
resulting in higher lease payments as a percentage of volume sales.
Gross profit from the Shopping Malls segment as a percentage of
this segment’s revenues experienced a slight decline from
90.8% during fiscal year 2015 to 89.4% during fiscal year
2016.
Offices and Others
. Gross profit at the
Offices and Others segment fell by 0.3%, from Ps.320 million during
fiscal year 2015 to Ps.319 million during fiscal year 2016. Gross
profit for the Offices and Others segment as a percentage of this
segment’s revenues decreased from 96.1% during fiscal year
2015 to 93.8% during fiscal year 2016.
181
Sales and Developments
. Gross profit /
(loss) at the Sales and Developments segment increased by Ps.8
million, from a loss of Ps.4 million during fiscal year 2015 to a
loss of Ps.12 million during fiscal year 2016, mainly due to lower
sales accounted for during fiscal year 2016 and an increase in
maintenance and preservation costs in connection with these
properties.
Hotels
. Gross profit at the Hotels
segment rose by 46.6%, from Ps.118 million during fiscal year 2015
to Ps.173 million during fiscal year 2016. Gross profit for the
Hotels segment, as a percentage of this segment’s revenues,
rose from 29.8% during fiscal year 2015 to 32.4% during fiscal year
2016.
International
. Gross profit at the
International segment dropped by 100% from the Ps.19 million
accounted for during fiscal year 2015.
Financial Operations, Corporate and
Others
. Gross profit at the Financial Operations, Corporate
and Others segment did not experience significant changes during
the reported periods.
Operations Center in Israel
Real
Estate.
During fiscal year 2016, gross profit from the Real
Estate segment totaled Ps.1,071 million, which, as a percentage of
the revenues derived from this segment, amounted to
69.6%.
Supermarkets.
During fiscal year 2016,
gross profit from the Supermarkets segment totaled Ps.4,534
million. Gross profit, as a percentage of segment revenues amounted
to 24.4%. Shufersal’s results in the first half of calendar
year 2016 were affected by the following key factors: (i) continued
increased efficiency with respect to its real estate assets;(ii)
Shufersal is continuing to prepare strategies for various scenarios
in connection with the change in ownership of the Mega chain in the
city centers;(iii) continued acceleration of the development of
Shufersal’s digital platform, which primarily included the
Shufersal Online, including the opening of designated warehouses;
and (iv) continued building of its private brand.
Telecommunications.
During fiscal year
2016, gross profit from the Telecommunications segment totaled
Ps.2,130 million, which, as a percentage of the revenues derived
from this segment, amounted to 32%.
Others.
During fiscal year 2016, gross
profit from the Others segment totaled Ps.90 million, which, as a
percentage of the revenues derived from this segment, amounted to
32.8%.
Net gain from fair value adjustment of investment
properties
|
|
Year
ended on June 30, 2016 (recast)
|
||||
|
Net gain from fair value
adjustment of investment properties
|
Income
statement
|
Interest
in joint ventures
|
Expenses
and collective promotion fund
|
Inter-segment
eliminations
|
Segment-reporting
|
|
Operations
Center in Argentina
|
(in
millions of Ps.)
|
||||
|
Shopping Malls
|
16,049
|
83
|
-
|
-
|
16,132
|
|
Offices and
Others
|
1,055
|
249
|
-
|
-
|
1,304
|
|
Sales and
Developments
|
726
|
47
|
-
|
-
|
773
|
|
Hotels
|
-
|
-
|
-
|
-
|
-
|
|
International
|
-
|
-
|
-
|
-
|
-
|
|
Financial Operations,
Corporate and Others
|
-
|
-
|
-
|
-
|
-
|
|
Total
Operations Center in Argentina
|
17,830
|
379
|
-
|
-
|
18,209
|
|
Operations
Center in Israel
|
|
|
|
|
|
|
Real Estate
|
(271
)
|
-
|
-
|
-
|
(271
)
|
|
Total
Operations Center in Israel
|
(271
)
|
-
|
-
|
-
|
(271
)
|
|
Total n
et gain from fair value adjustment
of investment properties
|
17,559
|
379
|
-
|
-
|
17,938
|
|
|
|
|
|
|
|
182
|
|
Year
ended on June 30, 2015 (recast)
|
||||
|
Net gain from fair value
adjustment of investment properties
|
Income
statement
|
Interest
in joint ventures
|
Expenses
and collective promotion fund
|
Inter-segment
eliminations
|
Segment-reporting
|
|
Operations
Center in Argentina
|
(in
millions of Ps.)
|
||||
|
Shopping Malls
|
729
|
-
|
-
|
-
|
729
|
|
Offices and
Others
|
1,830
|
41
|
-
|
-
|
1,871
|
|
Sales and
Developments
|
1,399
|
8
|
-
|
-
|
1,407
|
|
Hotels
|
-
|
-
|
-
|
-
|
-
|
|
International
|
-
|
-
|
-
|
-
|
-
|
|
Financial Operations,
Corporate and Others
|
-
|
-
|
-
|
-
|
-
|
|
Total
net gain from fair value adjustment
of investment properties
|
3,958
|
49
|
-
|
-
|
4,007
|
Net gain from fair value adjustment
of investment properties, pursuant to the income statement,
increased by Ps.13,601 million, from Ps.3,958 million during fiscal
year 2015 to Ps.17,559 million during fiscal year 2016 (of which a
Ps.271 million loss derives from the Operations Center in Israel
and Ps.17,830 million from the Operations Center in
Argentina).
Operations Center in Argentina
Net gain from fair value adjustment
of our combined portfolio of investment properties for fiscal year
2016 was Ps.18,209 million (Ps.16,132 million for Shopping
Malls; Ps.1,304 million for Offices and Others; and
Ps.773 million for Sales and Developments). The significant
increase in the value of our investment properties as measured in
Pesos was primarily due to: (i) a 364 basis points decrease in
the discount rate applied under the discounted cash flows method,
which was driven mainly by macroeconomic improvements and lower
cost for Argentina to raise capital after the presidential
elections held in October 2015 and the agreement with holdout
bondholders reached in April 2016; and (ii) a depreciation
during the fiscal year of Argentine Peso against U.S. dollar for
more than 65.9% (from Ps.9.04 to US$1.00 at June 2016 to Ps.14.99
to US$1.00 at June 2015).
We maintained the same portfolio of
shopping malls during fiscal years ended June 30, 2016 and 2015.
Overall, the appraised values of our shopping mall properties
increased by 155.5% during fiscal year 2016 largely due to rental
value growth and the impact of the depreciation of the
Peso.
The appraised value of our office
buildings increased by 6% in fiscal year 2016 as compared to fiscal
year 2015, largely as a result of the impact of the depreciation of
the Peso and rental value growth during the period. In addition, we
realized a profit of Ps.908 million on disposal of office
properties in fiscal year 2016 as compared to Ps.645 million
in fiscal year 2015.
Operations Center in Israel
Real
Estate.
In fiscal year 2016, the net gain from fair value
adjustment of investment properties from the Real Estate segment
was a Ps.271 million loss, which, as a percentage of revenues from
this segment, accounted for 17.6%.
183
General and administrative expenses
|
|
Year
ended on June 30, 2016 (recast)
|
||||
|
General
and administrative expenses
|
Income
statement
|
Interest
in joint ventures
|
Expenses
and collective promotion fund
|
Inter-segment
eliminations
|
Segment-reporting
|
|
Operations
Center in Argentina
|
(in
millions of Ps.)
|
||||
|
Shopping Malls
|
(178
)
|
-
|
-
|
(1
)
|
(179
)
|
|
Offices and
Others
|
(24
)
|
-
|
-
|
-
|
(24
)
|
|
Sales and
Developments
|
(22
)
|
(1
)
|
-
|
-
|
(23
)
|
|
Hotels
|
(101
)
|
-
|
-
|
(2
)
|
(103
)
|
|
International
|
(91
)
|
|
-
|
-
|
(91
)
|
|
Financial Operations,
Corporate and Others
|
(130
)
|
-
|
-
|
(4
)
|
(134
)
|
|
Total
Operations Center in Argentina
|
(546
)
|
(1
)
|
-
|
(7
)
|
(554
)
|
|
|
|
|
|
|
|
|
Operations
Center in Israel
|
|
|
|
|
|
|
Real Estate
|
(100
)
|
-
|
-
|
-
|
(100
)
|
|
Supermarkets
|
(203
)
|
-
|
-
|
-
|
(203
)
|
|
Telecommunications
|
(708
)
|
-
|
-
|
-
|
(708
)
|
|
Insurance
|
-
|
-
|
-
|
-
|
-
|
|
Others
|
(282
)
|
-
|
-
|
-
|
(282
)
|
|
Total
Operations Center in Israel
|
(1,293
)
|
-
|
-
|
-
|
(1,293
)
|
|
Total
general and administrative expenses
|
(1,839
)
|
(1
)
|
-
|
(7
)
|
(1,847
)
|
|
|
Year
ended on June 30, 2015 (recast)
|
||||
|
General
and administrative expenses
|
Income
statement
|
Interest
in joint ventures
|
Expenses
and collective promotion fund
|
Inter-segment
eliminations
|
Segment-reporting
|
|
Operations
Center in Argentina
|
(in
millions of Ps.)
|
||||
|
Shopping Malls
|
(136
)
|
-
|
-
|
-
|
(136
)
|
|
Offices and
Others
|
(3
)
|
-
|
-
|
-
|
(3
)
|
|
Sales and
Developments
|
(2
)
|
(1
)
|
-
|
-
|
(3
)
|
|
Hotels
|
(75
)
|
-
|
-
|
(3
)
|
(78
)
|
|
International
|
(56
)
|
-
|
-
|
-
|
(56
)
|
|
Financial Operations,
Corporate and Others
|
(102
)
|
-
|
-
|
-
|
(102
)
|
|
Total
general and administrative expenses
|
(374
)
|
(1
)
|
-
|
(3
)
|
(378
)
|
Total general and administrative
expenses increased by Ps.1,465 million, from Ps.374 million during
fiscal year 2015 to Ps.1,839 million during fiscal year 2016 (of
which Ps.1,293 million are attributable to the Operations Center in
Israel and Ps.546 million to the Operations Center in Argentina).
Without considering the effect of the Operations Center in Israel,
total general and administrative expenses rose by 46%. Total
general and administrative expenses, as a percentage of revenues
from sales, leases and services, fell from 11% during fiscal year
2015 to 5.8% during fiscal year 2016. Without considering the
effect of the Operations Center in Israel, total general and
administrative expenses, pursuant to the income statement,
experienced a slight increase from 11% during fiscal year 2015 to
12.3% during fiscal year 2016.
General and administrative expenses
from our joint ventures did not experience significant changes
during the reported periods.
General and administrative expenses
from inter-segment transactions increased by Ps.4 million, from
Ps.3 million during fiscal year 2015 to Ps.7 million during fiscal
year 2016 (which are mainly allocated to the Shopping Malss, Hotels
and Financial Operations, Corporate and Others segments within the
Operations Center in Argentina in 2016 and to Hotels in
2015).
184
Therefore, based on business segment
reporting (taking into consideration the general and administrative
expenses from our joint ventures and without considering expenses
and collective promotion fund and expenses related to inter-segment
operations), general and administrative expenses rose by Ps.1,469
million from Ps.378 million during fiscal year 2015 to Ps.1,847
million during fiscal year 2016 (of which Ps.1,293 million are
attributable to the Operations Center in Israel and Ps.546 million
to the Operations Center in Argentina). Without considering the
general and administrative expenses from the Operations Center in
Israel, general and administrative expenses pursuant to business
segment reporting rose by 46.6%. Furthermore, general and
administrative expenses as a percentage of revenues, pursuant to
business segment reporting, declined from 14.8% during fiscal year
2015 to 6.1% during fiscal year 2016. Without considering the
effect of the Operations Center in Israel, total general and
administrative expenses as a percentage of total revenues
experienced a slight increase from 14.8% during fiscal year 2015 to
16.8% during fiscal year 2016.
Operations Center in Argentina
Shopping Malls
. General and
administrative expenses in the Shopping Malls segment increased by
31.6%, from Ps.136 million during fiscal year 2015 to Ps.179
million during fiscal year 2016, mainly as a result of: (i) a Ps.18
million increase in salaries, social security charges and other
personnel expenses; (ii) a Ps.13 million increase in
Director’s fees; and (iii) a Ps.7 million rise in fees and
payment for services, among other reasons. General and
administrative expenses of Shopping Malls, as a percentage of this
segment’s revenues, fell slightly from 7.6% during fiscal
year 2015 to 7.4% during fiscal year 2016.
Offices and Others
. General and
administrative expenses in our Offices and Others segment declined
by 700%, from Ps.3 million during fiscal year 2015 to Ps.24 million
during fiscal year 2016, primarily due to: (i) an increase in
salaries, social security charges and other personnel expenses;
(ii) a Ps.11 million increase in Directors’ fees; and (iii)
an increase in banking fees, among other reasons. The
segment’s general and administrative expenses, as a
percentage of this segment’s revenues, fell from 0.9% during
fiscal year 2015 to 7.1% during fiscal year 2016.
Sales and Developments
. General and
administrative expenses associated to our Sales and Developments
segment increased by Ps.20 million, from Ps.3 million during fiscal
year 2015 to Ps.23 million during fiscal year 2016, primarily owing
to: (i) a Ps.6 million increase in maintenance, repair and
services, and (ii) a Ps.12 million increase in Director’s
fees, among other reasons.
Hotels
. General and administrative
expenses associated to our Hotels segment rose by 32.1%, from Ps.78
million during fiscal year 2015 to Ps.103 million during fiscal
year 2016, mainly as a result of: (i) a Ps.12 million increase in
salaries, social security charges and other personnel expenses; and
(ii) a Ps.6 million increase in fees and payments for services,
among others. General and administrative expenses associated with
the Hotels segment as a percentage of this segment’s revenues
rose from 19.7% during fiscal year ended 2015 to 19.3% during
fiscal year 2016.
International
. General and
administrative expenses associated to our International segment
increased by 62.5%, from Ps.56 million during fiscal year 2015 to
Ps.91 million during fiscal year 2016, mainly as a result of fees
incurred in connection with our investment in IDBD.
Financial Operations, Corporate and
Others
. General and administrative expenses associated to
our Financial Operations, Corporate and Others segment increased by
31.4% from Ps. 102 million during fiscal year 2015 to Ps. 134
million during fiscal year 2016, mainly due to: (i) a Ps. 6 million
increase in salaries, social security charges and other personnel
expenses; partially offset by (ii) a decrease in directors’
fees of Ps. 5 million, (iii) a Ps. 25 million increase in fees and
payment for services, (iv) a Ps. 1 million increase in banking
fees, and (v) a Ps. 2 million increase in rentals and
expenses.
Operations Center in Israel
Real
Estate.
During fiscal year 2016, general and administrative
expenses associated to the Real Estate segment totaled Ps.100
million. General and administrative expenses as a percentage of the
revenues derived from this segment amounted to 6.5%.
185
Supermarkets.
During fiscal year 2016,
general and administrative expenses associated to the Supermarkets
segment totaled Ps.203 million. General and administrative expenses
as a percentage of the revenues derived from this segment amounted
to 1.1%.
Telecommunications.
During fiscal year
2016, general and administrative expenses associated to the
Telecommunications segment totaled Ps.708 million. General and
administrative expenses as a percentage of the revenues derived
from this segment amounted to 10.6%.
Others.
During fiscal year 2016, general
and administrative expenses associated to the Others segment
totaled Ps.282 million. General and administrative expenses as a
percentage of the revenues derived from this segment amounted to
102.9%.
Selling expenses
|
|
Year
ended on June 30, 2016 (recast)
|
||||
|
Selling
expenses
|
Income
statement
|
Interest
in joint ventures
|
Expenses
and collective promotion fund
|
Inter-segment
eliminations
|
Segment-reporting
|
|
Operations
Center in Argentina
|
(in
millions of Ps.)
|
||||
|
Shopping Malls
|
(144
)
|
(1
)
|
-
|
-
|
(145
)
|
|
Offices and
Others
|
(8
)
|
-
|
-
|
-
|
(8
)
|
|
Sales and
Developments
|
(22
)
|
(1
)
|
-
|
-
|
(23
)
|
|
Hotels
|
(69
)
|
-
|
-
|
-
|
(69
)
|
|
International
|
-
|
-
|
-
|
-
|
-
|
|
Financial Operations,
Corporate and Others
|
(19
)
|
-
|
-
|
-
|
(19
)
|
|
Total
Operations Center in Argentina
|
(262
)
|
(2
)
|
-
|
-
|
(264
)
|
|
|
|
|
|
|
|
|
Operations
Center in Israel
|
|
|
|
|
|
|
Real Estate
|
(29
)
|
-
|
-
|
-
|
(29
)
|
|
Supermarkets
|
(3,907
)
|
-
|
-
|
-
|
(3,907
)
|
|
Telecommunications
|
(1,493
)
|
-
|
-
|
-
|
(1,493
)
|
|
Insurance
|
-
|
-
|
-
|
-
|
-
|
|
Others
|
(13
)
|
-
|
-
|
-
|
(13
)
|
|
Total
Operations Center in Israel
|
(5,442
)
|
-
|
-
|
-
|
(5,442
)
|
|
Total
selling expenses
|
(5,704
)
|
(2
)
|
-
|
-
|
(5,706
)
|
|
|
Year
ended on June 30, 2015 (recast)
|
||||
|
Selling
expenses
|
Income
statement
|
Interest
in joint ventures
|
Expenses
and collective promotion fund
|
Inter-segment
eliminations
|
Segment-reporting
|
|
Operations
Center in Argentina
|
(in
millions of Ps.)
|
||||
|
Shopping Malls
|
(112
)
|
(1
)
|
-
|
-
|
(113
)
|
|
Offices and
Others
|
(13
)
|
-
|
-
|
-
|
(13
)
|
|
Sales and
Developments
|
(1
)
|
(1
)
|
-
|
-
|
(2
)
|
|
Hotels
|
(52
)
|
-
|
-
|
-
|
(52
)
|
|
International
|
-
|
-
|
-
|
-
|
-
|
|
Financial Operations,
Corporate and Others
|
(16
)
|
-
|
-
|
-
|
(16
)
|
|
Total
selling expenses
|
(194
)
|
(2
)
|
-
|
-
|
(196
)
|
Selling expenses, increased by
Ps.5,510 million, from Ps.194 million during fiscal year 2015 to
Ps.5,704 million during fiscal year 2016 (of which Ps.5,442 million
are attributable to the Operations Center in Israel and Ps.262
million to the Operations Center in Argentina). Without considering
the effect of the Operations Center in Israel, selling expenses
increased by 34.7%. Selling expenses, as a percentage of revenues
from sales, leases and services, increased from 5.7% during fiscal
year 2015 to 18.1% during fiscal year 2016. Without considering the
effect of the Operations Center in Israel, total selling expenses,
as a percentage of revenues from sales, leases and services,
experienced a slight increase from 5.7% during fiscal year 2015 to
5.9% during fiscal year 2016.
186
In turn, selling expenses associated
to our joint ventures did not experience significant changes during
the reported periods.
Business segment reporting (taking
into consideration the selling expenses from our joint ventures and
without considering those related to expenses and collective
promotion fund or inter-segment expenses), selling expenses
increased by Ps.5,510 million from Ps.196 million during fiscal
year 2015 to Ps.5,706 million during fiscal year 2016 (of which
Ps.5,442 million are attributable to the Operations Center in
Israel and Ps.262 million to the Operations Center in Argentina).
Without considering the effect of the Operations Center in Israel,
selling expenses increased by 34.7%. Furthermore, selling expenses
as a percentage of revenues, pursuant to business segment
reporting, rose from 7.7% during fiscal year 2015 to 18.8% during
fiscal year 2016. Without considering the effect of the Operations
Center in Israel, selling expenses as a percentage of total
revenues pursuant to business segment reporting, experienced a
slight increase from 7.7% during fiscal year 2015 to 8% during
fiscal year 2016.
Operations Center in Argentina
Shopping Malls
. Selling expenses in the
Shopping Malls segment rose by 28.3%, from Ps.113 during fiscal
year 2015 to Ps.145 million during fiscal year 2016, primarily as a
result of: (i) a Ps.29 million increase in the charge associated to
taxes, rates and contributions; mainly due to higher charges
associated to turnover tax, among other factors. Selling expenses,
as a percentage of the Shopping Malls segment’s revenues,
declined from 6.4% during fiscal year 2015 to 6% during fiscal year
2016.
Offices and Others
. Selling expenses
associated to our Offices and Others segment declined by 38.5%,
from Ps.13 million during fiscal year 2015 to Ps.8 million during
fiscal year 2016. Such variation was mainly due to a recovery of
Ps.6 million from the loan loss charges, among other factors. The
selling expenses associated to our Offices and Others segment, as a
percentage of segment revenues, decreased from 3.9% during fiscal
year 2015 to 2.4% during fiscal year 2016.
Sales and Developments
. Selling expenses
for the Sales and Developments segment increased by Ps.21 million,
from Ps.2 million during fiscal year 2015 to Ps.23 million during
fiscal year 2016, mainly as a result of an increase in taxes, rates
and contributions of Ps.18 million, mostly attributable to an
increase in turnover tax.
Hotels
. Selling expenses associated to
our Hotels segment rose by 32.7%, from Ps.52 million during fiscal
year 2015 to Ps.69 million during fiscal year 2016, mainly due to:
(i) a Ps.6 million increase in taxes, rates and contributions; and
(ii) a Ps.5 million increase in fees and payments for services,
among others. Selling expenses associated with our Hotels segment
as a percentage of segment revenues experienced a slight decline
from 13.1% during fiscal year 2015 to 12.9% during fiscal year
2016.
Financial Operations, Corporate and
Others
. Selling expenses in the Financial Operations,
Corporate and Others segment did not experience significant changes
during the reported years.
Operations Center in Israel
Real
Estate.
During fiscal year 2016, selling expenses associated
to the Real Estate segment totaled Ps.29 million. Selling expenses
as a percentage of the revenues derived from this segment amounted
to 1.9%.
Supermarkets.
During fiscal year 2016,
selling expenses associated to the Supermarkets segment totaled
Ps.3,907 million. Selling expenses as a percentage of the revenues
derived from this segment amounted to 21.0%.
Telecommunications.
During fiscal year
2016, selling expenses associated to the Telecommunications segment
totaled Ps.1,493 million. Selling expenses as a percentage of the
revenues derived from this segment amounted to 22.4%.
187
Others.
During fiscal year 2016, selling
expenses associated to the Others segment totaled Ps.13 million.
Selling expenses as a percentage of the revenues derived from this
segment amounted to 4.7%.
Other operating results, net
|
|
Year
ended on June 30, 2016 (recast)
|
|||||
|
Other
operating results, net
|
Income
statement
|
Interest
in joint ventures
|
Expenses
and collective promotion fund
|
Inter-segment
eliminations
|
Segment-reporting
|
|
|
Operations
Center in Argentina
|
(in
millions of Ps.)
|
|||||
|
Shopping Malls
|
(61
)
|
(2
)
|
-
|
-
|
(63
)
|
|
|
Offices and
Others
|
(7
)
|
-
|
-
|
1
|
(6
)
|
|
|
Sales and
Developments
|
(42
)
|
4
|
-
|
4
|
(34
)
|
|
|
Hotels
|
(2
)
|
-
|
-
|
-
|
(2
)
|
|
|
International
|
92
|
-
|
-
|
-
|
92
|
|
|
Financial Operations,
Corporate and Others
|
1
|
-
|
-
|
-
|
1
|
|
|
Total
Operations Center in Argentina
|
(19
)
|
2
|
-
|
5
|
(12
)
|
|
|
|
|
|
|
|
|
|
|
Operations
Center in Israel
|
|
|
|
|
|
|
|
Real Estate
|
(19
)
|
-
|
-
|
-
|
(19
)
|
|
|
Supermarkets
|
(13
)
|
-
|
-
|
-
|
(13
)
|
|
|
Telecommunications
|
-
|
-
|
-
|
-
|
-
|
|
|
Insurance
|
-
|
-
|
-
|
-
|
-
|
|
|
Others
|
-
|
-
|
-
|
-
|
-
|
|
|
Total
Operations Center in Israel
|
(32
)
|
-
|
-
|
-
|
(32
)
|
|
|
Total
other operating results, net
|
(51
)
|
2
|
-
|
5
|
(44
)
|
|
|
|
Year
ended on June 30, 2015 (recast)
|
||||
|
Other
operating results, net
|
Income
statement
|
Interest
in joint ventures
|
Expenses
and collective promotion fund
|
Inter-segment
eliminations
|
Segment-reporting
|
|
Operations
Center in Argentina
|
(in
millions of Ps.)
|
||||
|
Shopping Malls
|
(47
)
|
(2
)
|
-
|
-
|
(49
)
|
|
Offices and
Others
|
(119
)
|
-
|
-
|
2
|
(11
7)
|
|
Sales and
Developments
|
(13
)
|
-
|
-
|
-
|
(13
)
|
|
Hotels
|
-
|
-
|
-
|
-
|
-
|
|
International
|
214
|
-
|
-
|
-
|
214
|
|
Financial Operations,
Corporate and Others
|
(2
)
|
-
|
-
|
-
|
(2
)
|
|
Total
other operating results, net
|
33
|
(2
)
|
-
|
2
|
33
|
Other operating results, net,
pursuant to the income statement, declined by Ps.84 million, from a
net gain of Ps.33 million during fiscal year 2015 to a net loss of
Ps.51 million during fiscal year 2016 ( a loss of Ps.19 million
from the Operations Center in Argentina and a loss of Ps.32 million
from the Operations Center in Israel).
Other operating results, net from
our joint ventures increased by Ps.4 million, from a loss of Ps.2
million during fiscal year 2015 (allocated to the Shopping Malls
segment within the Operations Center in Argentina) to a gain of
Ps.2 million during fiscal year 2016 (of which a gain of Ps.4
million is allocated to the Sales and Developments segment within
the Operations Center in Argentina, and a loss of Ps.2 million to
the Shopping Malls segment within the Operations Center in
Argentina).
Other operating results from
inter-segment operations increased by Ps.3 million, from Ps.2
million during fiscal year 2015 (allocated to the Offices and
Others segment within the Operations Center in Argentina) to Ps.5
million during fiscal year 2016 (of which Ps.4 million are
allocated to the Sales and Developments segment within the
Operations Center in Argentina and Ps.1 million to the Offices and
Others segment within the Operations Center in
Argentina).
188
Therefore, according to business
segment reporting (taking into consideration the Other operating
results, net from our joint ventures and without considering those
related to inter-segment operations), Other operating results, net
declined by Ps.77 million from a net gain of Ps.33 million during
fiscal year 2015 to a net loss of Ps.44 million during fiscal year
2016 (allocated to the Operations Center in Argentina). Without
considering the effect of the Operations Center in Israel, Other
operating results, net rose by Ps.7 million.
Operations Center in Argentina
Shopping Malls
. Other operating losses,
net for the Shopping Malls segment declined by 28.6%, from Ps.49
million during fiscal year 2015 to Ps.63 million during fiscal year
2016, mainly as a consequence of a decrease in the provision for
lawsuits and contingencies of Ps.8 million. Other operating losses,
net, as a percentage of revenues from the Shopping Malls segment,
shrank from 2.8% during fiscal year 2015 to 2.6% during fiscal year
2016.
Offices and Others
. Other operating
losses, net associated with our Offices and Others segment declined
by Ps.111 million, from a loss of Ps.117 million during fiscal year
2015 to a loss of Ps.6 million during fiscal year
2016.
Sales and Developments
. Other operating
income, net in connection with our Sales and Developments segment
declined by Ps.21 million, from a loss of Ps.13 million during
fiscal year 2015 to a loss of Ps.34 million during fiscal year
2016, mainly due to Ps.16 million in income during fiscal year 2015
owing to the sale of our share interest in Bitania, among other
factors.
Hotels
. Other operating losses, net
associated to the Hotels segment increased by Ps.2 million,
primarily owing to an increase in provisions for lawsuits and other
contingencies.
International
. Other operating results,
net in this segment declined by 57% from a net gain of Ps.214
million during fiscal year 2015 to a net gain of Ps.92 million
during fiscal year 2016, primarily due to a decline in income
caused by the partial reversal of accumulated conversion
differences. As of June 30, 2016, it is attributable to the
reversal of conversion differences prior to IDBD’s business
combination, whilst as of June 30, 2015, it is attributable to the
reversal of the provision for conversion differences generated by
the Rigby, following the partial repayment of the company’s
capital stock.
Financial Operations, Corporate and
Others
. Other operating results, net associated to our
Financial Operations, Corporate and Others segment did not show
significant changes for the reported periods.
Profit / (loss) from operations
|
|
Year
ended on June 30, 2016 (recast)
|
||||
|
Profit /
(loss) from operations
|
Income
statement
|
Interest
in joint ventures
|
Expenses
and collective promotion fund
|
Inter-segment
eliminations
|
Segment-reporting
|
|
Operations
Center in Argentina
|
(in
millions of Ps.)
|
||||
|
Shopping Malls
|
17,792
|
98
|
12
|
(7
)
|
17,895
|
|
Offices and
Others
|
1,328
|
248
|
1
|
8
|
1,585
|
|
Sales and
Developments
|
628
|
49
|
-
|
4
|
681
|
|
Hotels
|
-
|
-
|
-
|
(1
)
|
(1
)
|
|
International
|
1
|
-
|
-
|
-
|
1
|
|
Financial Operations,
Corporate and Others
|
(147
)
|
-
|
-
|
(4
)
|
(151
)
|
|
Total
Operations Center in Argentina
|
19,602
|
395
|
13
|
-
|
20,010
|
|
|
|
|
|
|
|
|
Operations
Center in Israel
|
|
|
|
|
|
|
Real Estate
|
652
|
-
|
-
|
-
|
652
|
|
Supermarkets
|
411
|
-
|
-
|
-
|
411
|
|
Telecommunications
|
(71
)
|
-
|
-
|
-
|
(71
)
|
|
Insurance
|
-
|
-
|
-
|
-
|
-
|
|
Others
|
(205
)
|
-
|
-
|
-
|
(205
)
|
|
Total
Operations Center in Israel
|
787
|
-
|
-
|
-
|
787
|
|
Total
profit from operations
|
20,389
|
395
|
13
|
-
|
20,797
|
189
|
|
Year
ended on June 30, 2015 (recast)
|
||||
|
Profit /
(loss) from operations
|
Income
statement
|
Interest
in joint ventures
|
Expenses
and collective promotion fund
|
Inter-segment
eliminations
|
Segment-reporting
|
|
Operations
Center in Argentina
|
(in
millions of Ps.)
|
||||
|
Shopping Malls
|
2,025
|
9
|
14
|
(3
)
|
2,045
|
|
Offices and
Others
|
2,005
|
47
|
-
|
6
|
2,058
|
|
Sales and
Developments
|
1,379
|
6
|
-
|
-
|
1,385
|
|
Hotels
|
(9
)
|
-
|
-
|
(3
)
|
(12
)
|
|
International
|
177
|
-
|
-
|
-
|
177
|
|
Financial Operations,
Corporate and Others
|
(120
)
|
-
|
-
|
-
|
(120
)
|
|
Total
Operations Center in Argentina
|
5,457
|
62
|
14
|
-
|
5,533
|
Operating income, pursuant to the
income statement, increased by 273.6%, from Ps.5,547 million during
fiscal year 2015 to Ps.20,389 million during fiscal year 2016 (of
which Ps.787 million are attributable to the Operations Center in
Israel and Ps.19,602 million to the Operations Center in
Argentina). Without considering the effect of the Operations Center
in Israel, operating income rose by 259.2%. Operating income, as a
percentage of revenues from sales, leases and services, declined
from 160.4% during fiscal year 2015 to 64.7% during fiscal year
2016. Without considering the effect of the Operations Center in
Israel, operating income / (loss), as a percentage of total
revenues, decreased from 160.4% during fiscal year 2015 to 440.9%
during fiscal year 2016.
Operating income from our joint
ventures increased by 527%, from Ps.62 million during fiscal year
2015 (of which a gain of Ps.10 million is allocated to the Shopping
Malls segment; a gain of Ps.47 million is allocated to the Offices
and Others segment, and a profit of Ps.6 million is allocated to
the Sales and Developments segment within the Operations Center in
Argentina) to Ps.395 million during fiscal year 2016 (of which a
gain of Ps.98 million is allocated to the Shopping Malls segment; a
profit of Ps.248 million is allocated to the Offices and Others
segment, and a gain of Ps.49 million is allocated to the Sales and
Developments segment within the Operations Center in Argentina),
mainly as a result of an increase in net gain from fair value
adjustment of investment properties.
Operating income associated to
expenses and collective promotion fund did not experience
significant changes and remained at approximately Ps.14 million in
both fiscal years (allocated mainly to the Shopping Malls
segment).
Operating income from inter-segment
operations did not experience significant changes during the
reported periods.
Based on business segment reporting
(taking into consideration the operating income from our joint
ventures and without considering operating income related to
expenses and collective promotion fund or inter-segment
operations), operating income rose by 275.9% from Ps.5,533 million
during fiscal year 2015 to Ps.20,797 million during fiscal year
2016 (of which Ps.787 million are attributable to the Operations
Center in Israel and Ps.20,010 million to the Operations Center in
Argentina). Without considering the effect of the Operations Center
in Israel, operating income increased by 261.6%. Furthermore,
operating income as a percentage of revenues, pursuant to business
segment reporting, increased from 217.2% during fiscal year 2015 to
68.5% during fiscal year 2016. Without considering the effect of
the Operations Center in Israel, total operating income/(loss) as a
percentage of total revenues, pursuant to business segment
reporting, declined from 217.2% during fiscal year 2015 to 608.4%
during fiscal year 2016.
Operations Center in Argentina
Shopping Malls
. Operating income in our
Shopping Malls segment grew by 775.1%, from Ps.2,045 million in
income during fiscal year 2015 to Ps.17,895 million in income
during fiscal year 2016. The change es mainly attributable to a
Ps.15,403 million increase in net gain from fair value adjustment
of investment properties.
190
Operating income for our Shopping
Malls segment, as a percentage of this segment’s revenues,
increased from 115% during fiscal year 2015 to 743.8% during fiscal
year 2016.
Offices and Others
. Operating income in
our Offices and Others segment decreased by 23%, from Ps.2,058
million in income during fiscal year 2015 to Ps.1,585 million in
income during fiscal year 2016. The main changes are attributable
to a decrease in net gain from fair value adjustment of investment
properties (Ps.567 million), partially offset by an increase of
Ps.111 million in income from Other income and
expenses.
Operating income in our Offices and
Others segment measured as percentage of segment revenues decreased
from 618% during fiscal year 2015 to 446.2% during fiscal year
2016.
Sales and Developments
. Operating income
in our Sales and Developments segment fell by 50.8%, from income
for Ps.1,385 million during fiscal year 2015 to income for Ps.681
million during fiscal year 2016.
Hotels
. Operating loss in the Hotels
segment decreased by 91.7%, from a loss of Ps.12 million during
fiscal year 2015 to a loss of Ps.1 million during fiscal year
2016.
International
. Operating income in our
International segment shrank by 176 million from Ps.177 million in
income during fiscal year 2015 to Ps.1 million gain during fiscal
year 2016.
Financial Operations, Corporate and
Others
. Loss from operations for our Financial Operations,
Corporate and Others segment exhibited an increase in the loss of
25.8%, from a loss of Ps. 120 million during fiscal year 2015 to a
loss of Ps. 151 million during fiscal year 2016. The increase in
expenses, mainly in General and administrative expenses, resulted
in an increase in the loss for the segment.
Operations Center in Israel
Real
Estate.
During fiscal year 2016, profit from operations
associated to the Real Estate segment totaled Ps.652 million,
which, as a percentage of the revenues derived from this segment,
accounted for 42.4%.
Supermarkets.
During fiscal year 2016,
profit from operations associated to the Supermarkets segment
totaled Ps.411 million which, as a percentage of the revenues
derived from this segment, accounted for 2.2%.
Telecommunications.
During fiscal year
2016, profit from operations associated to the Telecommunications
segment was a loss of Ps.71 million, which, as a percentage of
revenues derived from this segment, accounted for
1.1%.
Others.
During fiscal year 2016, loss
from operations associated to the Others segment totaled Ps.205
million, which, as a percentage of revenues derived from this
segment, accounted for 74.8%.
Share of profit / (loss) of associates and joint
ventures
|
|
Year
ended on June 30, 2016 (recast)
|
|||||
|
Share of
profit / (loss) of associates and joint ventures
|
Income
statement
|
Interest
in joint ventures
|
Expenses
and collective promotion fund
|
Inter-segment
elimination
|
Segment-reporting
|
|
|
Operations
Center in Argentina
|
(in
millions of Ps.)
|
|||||
|
Shopping Malls
|
61
|
(61
)
|
-
|
-
|
-
|
|
|
Offices and
Others
|
175
|
(155
)
|
-
|
-
|
20
|
|
|
Sales and
Developments
|
47
|
(42
)
|
-
|
-
|
5
|
|
|
Hotels
|
-
|
-
|
-
|
-
|
-
|
|
|
International
|
(129
)
|
-
|
-
|
-
|
(129
)
|
|
|
Financial Operations,
Corporate and Others
|
231
|
-
|
-
|
-
|
231
|
|
|
Total
Operations Center in Argentina
|
385
|
(258
)
|
-
|
-
|
127
|
|
|
|
|
|
|
|
|
|
|
Operations
Center in Israel
|
|
|
|
|
|
|
|
Real Estate
|
226
|
-
|
-
|
-
|
226
|
|
|
Supermarkets
|
-
|
-
|
-
|
-
|
-
|
|
|
Telecommunications
|
-
|
-
|
-
|
-
|
-
|
|
|
Insurance
|
-
|
-
|
-
|
-
|
-
|
|
|
Others
|
(103
)
|
-
|
-
|
-
|
(103
)
|
|
|
Total
Operations Center in Israel
|
123
|
-
|
-
|
-
|
123
|
|
|
Total
share of profit of associates and joint ventures
|
508
|
(258
)
|
-
|
-
|
250
|
|
191
|
|
Year
ended on June 30, 2015 (recast)
|
||||
|
Share of
profit / (loss) of associates and joint ventures
|
Income
statement
|
Interest
in joint ventures
|
Expenses
and collective promotion fund
|
Inter-segment
eliminations
|
Segment-reporting
|
|
Operations
Center in Argentina
|
(in
millions of Ps.)
|
||||
|
Shopping Malls
|
6
|
(6
)
|
-
|
-
|
-
|
|
Offices and
Others
|
3
3
|
(28
)
|
-
|
-
|
5
|
|
Sales and
Developments
|
12
|
(11
)
|
-
|
-
|
1
|
|
Hotels
|
1
|
-
|
-
|
-
|
1
|
|
International
|
(1,020
)
|
-
|
-
|
-
|
(1,020
)
|
|
Financial Operations,
Corporate and Others
|
155
|
-
|
-
|
-
|
155
|
|
Total
share of loss of associates and joint ventures
|
(813
)
|
(45
)
|
-
|
-
|
(858
)
|
Our share of loss of associates and
joint ventures, pursuant to the income statement, increased by
162.5%, from a loss of Ps.813 million during fiscal year 2015 to a
gain of Ps.508 million during fiscal year 2016 (of which a gain of
Ps.123 million is attributable to the Operations Center in Israel
and a gain of Ps.385 million to the Operations Center in
Argentina). Without considering the effect of the Operations Center
in Israel, our share of profit of associates and joint ventures
rose by 114.8%, mainly as a result of lower losses derived from our
International segmentand an increase in income from our Offices and
Others segment.
Furthermore, our net share of profit
of associates and joint ventures from Nuevo Puerto Santa Fe S.A.
(Shopping Malls segment), Quality Invest S.A. (Offices and Others
segment), and Cyrsa S.A., Puerto Retiro S.A. and Baicom Networks
S.A. (Sales and Developments segment) experienced a change of
473.3%, from a loss of Ps.45 million during fiscal year 2015 to a
loss of Ps.258 million during fiscal year 2016, mostly due to a
decrease in results of the joint venture Cyrsa S.A..
Shopping Malls.
According to business
segment reporting, the share of profit of the joint venture Nuevo
Puerto Santa Fe S.A. is presented on a line by line consolidated
basis in this segment.
Offices and Others.
According to
business segment reporting, the share of profit / (loss) of the
joint venture Quality Invest S.A. is presented on a line by line
consolidated basis in this segment whereas the share of
profit/(loss) generated by the indirect share interest in our
associate La Rural S.A., through the joint ventures Entertainment
Holding S.A. and Entretenimiento Universal S.A., remains net in
this line and increased from Ps.5 million during fiscal year 2015
to Ps.20 million during fiscal year 2016.
Sales and Developments.
The share of
profit of joint ventures Cyrsa S.A., Puerto Retiro S.A. and Baicom
Networks S.A. is presented on a line by line consolidated basis.
The share of profit of our associate Manibil S.A., presented in
this line, rose by Ps.4 million, from Ps.1 million during fiscal
year 2015 to Ps.5 million during fiscal year 2016.
Hotels.
No share of profit / (loss) of
associates and joint ventures was accounted for during the year in
connection with this segment.
International.
Our share of loss of
associates in this segment inclined by 87.4%, from Ps.1,020 million
in loss during fiscal year 2015 to Ps.129 million in loss during
fiscal year 2016, mainly due to: (i) a change in the results from
our investment in IDBD from a loss of Ps.1,001 during fiscal year
2015 to a gain of Ps.79 during fiscal year 2016 (the profit /
(loss) derived from changes in the fair value of such investment
was disclosed within the International segment until October 11,
2015); and (ii) increased gains from Condor for Ps.15 million;
partially offset by (iii) the results derived from our investment
in New Lipstick from a gain of Ps.27 during fiscal year 2015 to a
loss of Ps.172 during fiscal year 2016.
192
Financial Operations, Corporate and
Others.
The share of profit of our associates in the
Financial Operations, Corporate and Others segment increased by
49%, from Ps.155 million during fiscal year 2015 to Ps.231 million
during fiscal year 2016, mainly due to: (i) increased gains from
our investments in BHSA for Ps.114 million and BACS for Ps.3
million, partially offset by: (ii) increased losses from our
investment in Tarshop for Ps.23 million and (iii) the Ps.19 million
non-recurring profit from our investment in Avenida made during
fiscal year 2015, until the time the Company ceased to consider
this investment as an associate.
Operations Center in Israel
Real
Estate.
During fiscal year 2016, the share of profit of
associates and joint ventures associated to the Real Estate segment
totaled Ps.226 million.
Others.
During fiscal year 2016, the
share of loss of associates and joint ventures associated to the
Others segment totaled Ps.103 million.
Financial
results, net
Net financial loss increased by
Ps.3.957 million, from a loss of Ps.933 million during fiscal year
2015 to a loss of Ps.4,890 million during fiscal year 2016 (of
which Ps.3,037 million are derived from the Operations Center in
Israel and Ps.1,853 million are derived from the Operations Center
in Argentina).
Operations Center in Argentina
Net financial loss increased by
98.6%, from Ps.933 million during fiscal year 2015 to Ps.1,853
million during fiscal year 2016, mainly as a result of: (i) an
increase of Ps.1,835 million in financial costs (mostly caused by:
(a) an increase in currency exchange losses of Ps.1,552 million;
(b) an increase in the interest expense on loans and notes for
Ps.415 million; partially offset by: (ii) increased gains from
other financial results of Ps.1,346 million (mainly attributable
to: (d) the exposure of financial derivatives at fair value for
Ps.973 million and (e) other financial assets for Ps.401
million).
Operations Center in Israel
The net financial loss from the
Operations Center in Israel amounted to Ps.3,037 million, of which
Ps.1,937 million are attributable to the exposure of financial
assets and liabilities at fair value, mostly Clal’s shares of
stock (Ps.1,945 million).
Income
Tax
The Company applies the deferred tax
method to calculate the income tax applicable to the fiscal years
under consideration, thus recognizing the temporary differences as
tax assets and liabilities. Income tax expense was Ps.1,581 million
loss during fiscal year 2015 and a Ps.6,373 million loss during
fiscal year 2016, of which a Ps.6,303 million loss was derived from
the Operations Center in Argentina and a Ps.70 million gain was
derived from the Operations Center in Israel.
Profit for the
year
As a result of the factors described
above, profit for 2016 increased from a profit of Ps.2,130 million
during fiscal year 2015 to a profit of Ps.10,078 million during
fiscal year 2016, of which a gain of Ps.11,831 million is
attributable to the Operations Center in Argentina and a loss of
Ps.1,753 million is attributable to the Operations Center in
Israel.
B.
Liquidity and Capital Resources
Our principal sources of liquidity
have historically been:
●
Cash generated by operations;
●
Cash generated by issuance of debt
securities;
●
Cash from borrowing and financing
arrangements;and
●
Cash proceeds from the sale of real estate
assets.
193
Our principal cash requirements or
uses (other than in connection with our operating activities) have
historically been:
●
capital expenditures for acquisition or
construction of investment properties and property, plant and
equipment;
●
interest payments and repayments of
debt;
●
acquisition of shares in companies;
●
payments of dividends; and
●
acquisitions or purchases of real
estate.
Our liquidity and capital resources
include our cash and cash equivalents, proceeds from bank
borrowings and long-term debt, capital financing and sales of real
estate investments.
As of June 30, 2017, our Operation
Center in Argentina had positive working capital of Ps.4,060
million while our Operations Center in Israel had positive working
capital of Ps.14,998 million, resulting in a consolidated positive
working capital of Ps.19,058 million (calculated as current assets
less current liabilities as of such date).
At the same date, our Operations
Center in Argentina had cash and cash equivalents of Ps.2,041
million while our Operations Center in Israel had cash and cash
equivalents of Ps.22,813 million, totaling consolidated cash and
cash equivalents for Ps.24,854 million.
IDBD is subject to certain
restrictions and financial covenants in relation to its financial
debt, including its notes and loans from banks and financial
institutions. As concerns IDBD’s financial position, flow of
funds and capacity to discharge its financial debt commitments, it
should be noted that:
●
From September 2016, following the sale of Adama
and the increased value recorded by its subsidiaries in the market,
IDBD believes it will be able to secure financing in the market or
refinance its debts. In this regard, IDBD has recently completed
successful placements of debt. Moreover, it made early repayments
of its financial debt and has managed to renegotiate the financial
restrictions related to its debt.
●
DIC declared dividends and IDBD received
approximately NIS 271 million (equivalent to approximately Ps.1,219
million), net of the exercise of warrants.
●
In February 2017, Standard & Poor’s
Maalot (S&P Maalot) upgraded the rating of IDBD’s notes
from CCC to BB. Subsequently, in July 2017, S&P Maalot upgraded
IDBD’s rating again to BBB with a stable
outlook.
●
IDBD sold part of its interest in Clal and
entered into a swap agreement for its future sale.
For the reasons explained above,
IDBD understands that it has sufficient resources to continue doing
business for at least 12 months after the date of these
consolidated financial statements.
IDBD’s Board of Directors has
cash flow projections for 24 months until June 30, 2019 that assume
that IDBD will receive, cash from the realization of private
investments directly held by IDBD. Therefore, IDBD expects to
satisfy all its obligations until the end of the second quarter of
2019. Although the materialization of these plans does not depend
entirely on factors within its control, IDBD estimates that it will
be successful in the consummation of these or other
plans.
Based on the foregoing, IDBD’s
management believes that at present there are no material
uncertainties regarding its capacity to operate as a going concern,
in light of IDBD’s current financial position, as it is
capable of satisfying its financial commitments as and when due,
and its ability to carry its business plan into
execution.
194
Notwithstanding the foregoing, IDBD
expects to discharge financial liabilities for NIS 1,413 million
(equivalent to approximately Ps.6,641 million as of the date of
these consolidated financial statements) in November 2019. Payment
of these liabilities could be affected by factors beyond
IDBD’s control, including IDBD’s capacity to implement
its plan to sell its interest in Clal, taking into account the
mechanism determined by the Commissioner, the requirements of the
Concentration Law, and IDBD’s capacity to deal with the
implications of the Concentration Law and to satisfy the specific
requirements imposed on it regarding the control of companies
through a pyramidal structure.
IDBD expects that the consideration
to be received for the sale of Clal, according to the mechanism
imposed by the Commissioner (i.e., the sale in tranches of 5% each
every four months), to the extent it is implemented, will be low or
even significantly low as compared to a sale in bulk of
Clal’s controlling stake. However, the Company believes that,
even if it continued selling Clal’s shares according to the
Commissioner’s mechanism, it would have additional cash flow
available to satisfy its commitments in November 2019. In the
opinion of IDBD’s management, IDBD will be able to address
its commitments in due time and continue doing
business.
It should be noted that the
financial position of IDBD and its subsidiaries in the operations
center in Israel does not adversely affect IRSA´s cash flows
to satisfy the debts of IRSA.
Moreover, the commitments and other
restrictions resulting from IDBD’s indebtedness have no
effects on IRSA, as it qualifies as non-recourse debt against IRSA,
and IRSA has not given its assets as collateral for such debt
either.
The table below shows our cash flow
for the fiscal years ended June 30, 2017, 2016 and
2015:
|
|
Year ended
June 30
|
||
|
|
2017
|
2016
|
2015
|
|
|
(in millions
of Ps.)
|
||
|
Net cash flow generated by
operations
|
9,059
|
4,139
|
834
|
|
Net cash flow generated by
investment activities
|
(2,068
)
|
8,210
|
261
|
|
Net cash flow used in
financing activities
|
1,537
|
(3,968
)
|
(1,390
)
|
|
Net increase/ (decrease) in
cash and cash equivalents
|
8,528
|
8,381
|
(295
)
|
Cash Flow
Information
Operating activities
Fiscal year
ended June 30, 2017
Our operating activities for the
fiscal year ended June 30, 2017 generated net cash inflows of
Ps.9,059 million, of which Ps.322 are originated in discontinued
operations and Ps.8,737 from continuing operations, mainly due to
operating income of Ps.9,984 million, a decrease in trading
properties of Ps.510 million and an increase in trades and other
payables charges of Ps.1,316 million, partially offset by increased
trade and other receivables of Ps.1,779 million and Ps.967 million
related to income tax paid.
Fiscal year
ended June 30, 2016
Our operating activities generated
net cash inflows of Ps.4,139 million, of which Ps.77 are originated
in discontinued operations and Ps.4,062 from continuing operations,
mainly due to operating income of Ps.5,320 million and a decrease
in trading properties of Ps.202 million, partially offset by a
decrease in provisions of Ps.143 million, an increase in trade and
other receivables of Ps.541 million and Ps.804 million related to
income tax paid.
195
Fiscal Year
ended June 30, 2015
Our operating activities generated
net cash inflows of Ps.834 million, mainly due to operating income
of Ps.1,418 million, an increase in salaries and social security
charges of Ps.22 million, an increase in trade and other account
payables of Ps.233 million, which were partially offset by an
increase in trade and other receivables of Ps.400 million and
Ps.429 million related to income tax paid.
Investment activities
Fiscal year
ended June 30, 2017
Our investing activities resulted in
net cash outflows of Ps.2,068 million, Ps.3,943 million
discontinued activities inflows offset by Ps.6,011 million
continuing operations outflows for the fiscal year ended June 30,
2017, mainly due to (i) Ps.2,853 million and Ps.2,629 million used
in the acquisition of investment properties and property, plant and
equipment, respectively, (ii) Ps.501 million used in the
acquisition of intangible assets, (iii) Ps.183 million used in
capital contributions in associates and joint ventures, partially
offset by (iv) Ps.291 million from collection from the sale of
investment properties, (v) Ps.251 million from collection of
dividends.
Fiscal Year
ended June 30, 2016
Without considering Ps.9,193 million
cash added from business combination with IDBD, our investing
activities for the fiscal year ended June 30, 2016 resulted in net
cash outflows of Ps.983 million, corresponding to Ps.454
discontinued activities inflows offset by Ps.1,437 continuing
operations outflows, of which (i) Ps.888 million and Ps.1,021
million were related to the acquisition of investment properties
and property, plant and equipment, respectively, (ii) Ps.131
million were related to the acquisition of intangible assets, (iii)
Ps.207 million were related to capital contributions in associates
and joint ventures, and (iv) Ps.852 million were related to loans
granted to related parties; partly offset by (v) Ps.1,393 million
related to collection from the sale of investment properties, and
(vi) Ps.99 million related to collection of dividends.
Fiscal Year
ended June 30, 2015
Our investing activities resulted in
net cash inflows of Ps.261 million for the fiscal year ended June
30, 2015, of which (i) Ps.2,447 million were related to the sale of
investment properties and (ii) Ps.56 million were related to the
sale of interests in companies: Ps.17 million were related to the
sale of Avenida Inc. and Ps.39 million were related to the sale of
Bitania 26 S.A., partially offset by (iii) Ps.1,231 million
representing a 25% increase in IDBD’s share interest over its
stock capital, (iv) Ps.407 million related to the acquisition of
investment properties and (v) Ps.595 million net related to the
acquisition of investments in financial assets.
Financing activities
Fiscal year
ended June 30, 2017
Our financing activities for the
fiscal year ended June 30, 2017 resulted in net cash outflows of
Ps.1,537 million, corresponding to Ps.2,376 continuing activities
inflows offset by Ps.839 discontinued operations outflows, mainly
due to (i) the payment of loans of Ps.14,577 million; (ii) the
payment of interest on short-term and long-term debt of Ps.5,692
million; (iii) net disposal of non-controlling interest in
subsidiaries of Ps.1,689 million, (iv) Ps.2,512 million related to
dividend distributions and (v) the payment of principal on notes of
Ps.5,531 million, partially offset by (vi) borrowings for Ps.6,250
million; (vii) Ps.20,435 million related to the issuance of
non-convertible notes , (viii) Ps.2,112 related to issuance of
capital of non-controlling interest, and (ix) Ps.20 million related
to derivative financial instruments, net.
196
Fiscal year
ended June 30, 2016
Our financing activities for the
fiscal year ended June 30, 2016 resulted in net cash outflows of
Ps.3,968 million, corresponding to Ps.499 discontinued activities
outflows and Ps.3,469 continuing operations outflows, mainly due to
(i) the payment of loans of Ps.9,554 million; (ii) the payment of
interest on short-term and long-term debt of Ps.3,365 million;
(iii) the acquisition of non-controlling interest in subsidiaries
of Ps.1,047 million and (iv) the payment of principal on notes of
Ps.4,253 million, partially offset by (v) borrowings for Ps.6,011
million; (vi) Ps.7,622 million related to the issuance of
non-convertible notes and (vii) Ps.1,331 million related to
derivative financial instruments, net.
Fiscal Year
ended June 30, 2015
Our financing activities for the
fiscal year ended June 30, 2015 resulted in net cash outflows of
Ps.1,390 million, mainly due to (i) the payment of loans of Ps.967
million, (ii) the payment of loans for the purchase of companies of
Ps.106 million, (iii) the payment of interest on short-term and
long-term debt of Ps.547 million, (vi) capital distributions of
Ps.228 million, (vii) Ps.111 million related to the acquisition of
derivative financial instruments, (viii) Ps.69 million related to
dividend distributions; partially offset by (ix) borrowings for
Ps.628 million.
Capital Expenditures
Fiscal year
ended June 30, 2017
During the fiscal year ended June
30, 2017, we invested Ps.5,482 million, mainly as follows: (a)
acquisitions and improvements of property, plant and equipment of
Ps.2,751 million, primarily i) Ps.737 million in buildings and
facilities, mainly in supermarkets in Israel, ii) Ps.711 million in
communication networks, and iii) Ps.634 million in machinery and
equipment; (b) improvements in our rental properties of Ps.1,204
million, primarily in our operation center in Argentina’s
shopping centers; and (c) the development of properties for
Ps.1,592 million, mainly in our operation center in
Israel.
Fiscal Year
2016
During the fiscal year ended June
30, 2016, we invested Ps.2,369 million (without considering
Ps.44,690 million related to addition of assets due to the business
combination with IDBD), corresponding Ps.35 to discontinued
operations and Ps.2,334 to continuing operations, as follows: (a)
acquisitions and improvements of property, plant and equipment of
Ps.1,172 million, primarily i) Ps.379 million in buildings and
facilities, mainly in supermarkets in Israel, ii) Ps.310 million in
communication networks, and iii) Ps.291 million in machinery and
equipment; (b) improvements in our rental properties of Ps.260
million, primarily in our operation center in Argentina’s
shopping malls; and (c) the development of properties for Ps.919
million, mainly in our operation center in Israel.
Fiscal Year
2015
During the fiscal year ended June
30, 2015, we invested Ps.532 million, as follows: (a) improvements
at our Sheraton Libertador, Intercontinental and Llao Llao hotels
(Ps.1.2 million, Ps.9 million and Ps.4.5 million, respectively),
(b) Ps.14 million allocated to advances for the acquisition of
investments in general, (c) Ps.35 million related to the
acquisition of furniture and fixtures, machinery, equipment, and
facilities, (d) Ps.186.5 million related to the development of
properties, of which Ps.1.5 million are related to Distrito Arcos
and Ps.185 million are related to Alto Comahue, (e) Ps.60.4 million
related to improvements in our shopping malls, (f) Ps.5.6 million
related to improvements to our offices and other rental properties,
(g) Ps.214.6 million related to the acquisition of “La
Adela,” (h) Ps.1.6 million related to the acquisition of land
reserves.
197
Indebtedness
The following table sets forth the
scheduled maturities of our outstanding debt as of June 30,
2017:
|
|
Operations
Center in Argentina
|
Operations
Center in Israel
|
Total
|
|
Less than 1
year
|
673
|
19,252
|
19,925
|
|
More than 1 and up
to 2 years
|
211
|
14,145
|
14,356
|
|
More than 2 and up
to 3 years
|
3,605
|
11,400
|
15,005
|
|
More than 3 and up
to 4 years
|
1,379
|
10,558
|
11,937
|
|
More than 4 and up
to 5 years
|
222
|
10,520
|
10,742
|
|
More than 5
years
|
5,886
|
51,560
|
57,446
|
|
|
11,976
|
117,435
|
129,411
|
198
|
Operation
Center in Argentina
|
Currency
|
Annual
Average Interest Rate
|
Nominal
value
(in
million at the inssuance currency)
|
Book
value
(in
million Ps.)
|
|
IRSA Commercial
Properties’ 2023 Notes
|
US$
|
8.75
%
|
360
|
5,991
|
|
IRSA’s 2020
Notes
|
US$
|
11.50
%
|
76
|
1,239
|
|
IRSA’s 2019
Notes
|
Ps.
|
Badlar +
299ptos
|
384
|
387
|
|
IRSA’s 2019
Notes
|
US$
|
7.00
%
|
184
|
3,041
|
|
Intercompany loan with
Cyrsa
|
Ps.
|
Badlar
|
7
|
5
|
|
Bank
loan
|
US$
|
5.95
%
|
50
|
825
|
|
Financial
Leases
|
US$
|
from 3.20% to
14.40%
|
-
|
4
|
|
Bank loans
|
Ps.
|
21.20
%
|
200
|
201
|
|
Bank loans
|
Ps.
|
26.50
%
|
5
|
2
|
|
Intercompany with Equity
Investee NPSF
|
Ps.
|
Badlar 8.5 %
|
6
|
3
|
|
Bank loans and
others
|
Ps.
|
15.25
%
|
1
|
-
|
|
Bank loans and
others
|
Ps.
|
29.02
%
|
3
|
2
|
|
AABE Debt
|
Ps.
|
Libor
|
44
|
67
|
|
Seller
financing
|
US$
|
N/A
|
2
|
39
|
|
Seller
financing
|
US$
|
3.50
%
|
5
|
96
|
|
Bank
overdrafts
|
Ps.
|
from 25.00% to
28.75%
|
|
77
|
|
Operation
Center in Israel
|
|
|
|
|
|
Non-convertible Notes IDBD
Serie G
|
NIS
|
4.50
%
|
267
|
1,406
|
|
Non-convertible Notes IDBD
Serie I
|
NIS
|
4.95
%
|
1,013
|
4,058
|
|
Non-convertible Notes IDBD
Serie J
|
NIS
|
6.60
%
|
206
|
930
|
|
Non-convertible Notes IDBD
Serie K
|
NIS
|
4.84
%
|
86
|
404
|
|
Non-convertible Notes IDBD
Serie L
|
NIS
|
7.58
%
|
384
|
1,811
|
|
Non-convertible Notes IDBD
Serie M
|
NIS
|
8.08
%
|
924
|
4,323
|
|
Non-convertible Notes DIC
Serie D
|
NIS
|
5.00
%
|
103
|
-
|
|
Non-convertible Notes DIC
Serie F
|
NIS
|
4.95
%
|
3,466
|
16,432
|
|
Non-convertible Notes DIC
Serie H
|
NIS
|
4.45
%
|
93
|
510
|
|
Non-convertible Notes DIC
Serie I
|
NIS
|
6.70
%
|
220
|
1,030
|
|
Non-convertible Notes
Shufersal Serie B
|
NIS
|
5.20
%
|
95
|
577
|
|
Non-convertible Notes
Shufersal Serie D
|
NIS
|
2.99
%
|
384
|
1,808
|
|
Non-convertible Notes
Shufersal Serie E
|
NIS
|
5.09
%
|
827
|
4,159
|
|
Non-convertible Notes
Shufersal Serie F
|
NIS
|
4.30
%
|
918
|
4,665
|
|
Non-convertible Notes
Cellcom Serie D
|
NIS
|
5.19
%
|
300
|
1,731
|
|
Non-convertible Notes
Cellcom Serie F
|
NIS
|
4.60
%
|
643
|
3,296
|
|
Non-convertible Notes
Cellcom Serie G
|
NIS
|
6.99
%
|
228
|
1,169
|
|
Non-convertible Notes
Cellcom Serie H
|
NIS
|
1.98
%
|
950
|
4,317
|
|
Non-convertible Notes
Cellcom Serie I
|
NIS
|
4.14
%
|
804
|
3,821
|
|
Non-convertible Notes
Cellcom Serie J
|
NIS
|
2.62
%
|
103
|
491
|
|
Non-convertible Notes
Cellcom Serie K
|
NIS
|
3.75
%
|
304
|
1,445
|
|
Non-convertible Notes PBC
Serie C
|
NIS
|
5.00
%
|
275
|
1,616
|
|
Non-convertible Notes PBC
Serie D
|
NIS
|
4.95
%
|
1,317
|
8,085
|
|
Non-convertible Notes PBC
Serie F
|
NIS
|
4.95
%
|
866
|
4,535
|
|
Non-convertible Notes PBC
Serie G
|
NIS
|
7.05
%
|
595
|
3,288
|
|
Non-convertible Notes PBC
Serie H
|
NIS
|
4.55
%
|
102
|
487
|
|
Non-convertible Notes PBC
Serie I
|
NIS
|
4.75
%
|
932
|
4,502
|
|
Non-convertible Notes PBC
Gav-Yam Serie E
|
NIS
|
4.55
%
|
141
|
832
|
|
Non-convertible Notes PBC
Gav-Yam Serie F
|
NIS
|
4.75
%
|
1,887
|
12,346
|
|
Non-convertible Notes PBC
Gav-Yam Serie G
|
NIS
|
6.41
%
|
107
|
528
|
|
Non-convertible Notes PBC
Ispro Serie B
|
NIS
|
5.40
%
|
204
|
1,254
|
|
Non-convertible Notes PBC
Gav-Yam Serie A
|
NIS
|
3.19
%
|
400
|
1,903
|
|
Bank loans and
others
|
NIS
|
Prime + 1.30%
|
83
|
372
|
|
Bank loans and
others
|
NIS
|
Prime + 1.00%
|
13
|
55
|
|
Bank loans and
others
|
NIS
|
Prime + 0.65%
|
7
|
32
|
|
Bank loans and
others
|
NIS
|
6.90
%
|
164
|
783
|
|
Bank loans and
others
|
NIS
|
5.39
%
|
9
|
43
|
|
Bank loans and
others
|
NIS
|
2.12
%
|
56
|
253
|
|
Bank loans and
others
|
NIS
|
5.90
%
|
55
|
248
|
|
Bank loans and
others
|
NIS
|
2.20
%
|
55
|
238
|
|
Bank loans and
others
|
NIS
|
4.95
%
|
-
|
2
|
|
Bank loans and
others
|
NIS
|
4.95
%
|
-
|
2
|
|
Bank loans and
others
|
NIS
|
4.75
%
|
-
|
1
|
|
Bank loans and
others
|
NIS
|
4.40
%
|
-
|
1
|
|
Bank loans and
others
|
NIS
|
3.25
%
|
-
|
2
|
|
Bank loans and
others
|
NIS
|
4.60
%
|
400
|
1,917
|
|
Bank loans and
others
|
NIS
|
4.90
%
|
140
|
677
|
|
Bank loans and
others
|
NIS
|
1.97
%
|
31
|
150
|
|
Bank loans and
others
|
NIS
|
2.65
%
|
83
|
385
|
|
Bank loans and
others
|
NIS
|
3.07
%
|
14
|
70
|
|
Bank loans and
others
|
NIS
|
1.55
%
|
44
|
222
|
|
Bank loans and
others
|
NIS
|
1.73
%
|
43
|
270
|
|
Bank loans and
others
|
NIS
|
1.87
%
|
92
|
436
|
|
Bank loans and
others
|
NIS
|
1.77
%
|
71
|
339
|
|
Bank loans and
others
|
NIS
|
1.87
%
|
45
|
220
|
|
Bank loans and
others
|
NIS
|
1.86
%
|
36
|
172
|
|
Bank loans and
others
|
NIS
|
1.88
%
|
93
|
448
|
|
Bank loans and
others
|
NIS
|
1.26
%
|
325
|
1,551
|
|
Bank loans and
others
|
NIS
|
1.57
%
|
17
|
82
|
|
Bank loans and
others
|
NIS
|
2.14
%
|
50
|
231
|
|
Bank loans and
others
|
NIS
|
2.35
%
|
1
|
5
|
|
Bank loans and
others
|
NIS
|
2.89
%
|
4
|
19
|
|
Bank loans and
others
|
NIS
|
2.95
%
|
4
|
19
|
|
Bank loans and
others
|
US$
|
5.57
%
|
-
|
1,022
|
|
Bank loans and
others
|
US$
|
7.00
%
|
-
|
715
|
|
Non-recourse
loan
|
US$
|
from 4.07% to
5.91%
|
400
|
7,025
|
|
Others
|
NIS
|
from 0.98% to
3.34%
|
347
|
1,655
|
|
Bank
overdrafts
|
NIS
|
3.5
%
|
-
|
14
|
199
Operations Center in
Argentina
On March 3, 2016, IRSA and IRSA CP
announced that they would launch offers to buy in cash: (i) 11.50%
Class II Notes due 2020 and issued by IRSA for principal amount up
to US$76.5 million, (ii) any and 8.50% Class 1 Notes due 2017 and
issued by IRSA, and (iii) any and 7.875% Class 1 Notes notes due
2017 and issued by IRSA CP.
On March 23, 2016, IRSA CP issued
Notesin an aggregate principal amount of US$360 million under its
Global Notes Program. Class II Notes accrue interest semi-annually,
at an annual fixed rate of 8.75% and mature on March 23, 2023. The
issue price was 98.722% of nominal value.
IRSA CP’s Notes due 2023 are
subject to certain covenants, events of default and limitations,
such as the limitation on incurrence of additional indebtedness,
limitation on restricted payments, limitation on transactions with
affiliates, and limitation on merger, consolidation and sale of all
or substantially all assets.
To incur additional indebtedness,
IRSA CP is required to meet a minimum 2.00 to 1.00 Consolidated
Interest Coverage Ratio. The Consolidated Interest Coverage Ratio
is defined as Consolidated EBITDA divided by consolidated interest
expense. Consolidated EBITDA is defined as operating income plus
depreciation and amortization and other consolidated non-cash
charges.
The Class II Notes contain financial
covenants limiting IRSA CP’s ability to declare or pay
dividends in cash or in kind, unless the following conditions are
met at the time of payment:
a)
no Event of Default shall have occurred and be
continuing;
b)
IRSA CP may incur at least US$1.00 worth of
additional debt pursuant to the “Restriction on Additional
Indebtedness”;
c)
and the aggregate amount of such dividend
exceeds the sum of:
i.
100% of cumulative EBITDA for the period
(treated as one accounting period) from July 1, 2015 through the
last day of the last fiscal quarter ended prior to the date of such
Restricted Payment
minus
an
amount equal to 150% of consolidated interest expense for such
period; and
ii.
any reductions of Indebtedness of IRSA on a
consolidated bais after the Issue Date any reductions of
Indebtedness of after the Issue Date exchanged for to Capital Stock
of the IRSA or its Subsidiaries.
On April 7, 2016, the Meeting of
IRSA’s Notes holders by majority vote approved the proposed
amendments to IRSA’s 2017 Trust Indenture, which included
basically the elimination of all restrictive covenants on such
class effective as of April 8, 2016.
During the months of March, April
and May of 2016, the Company acquired all IRSA CP’s 7.875%
Notes Class I due 2017 for a total amount US$120 million and
US$75.4 million of IRSA Notes. On October 11, 2016 the Company
acquired the remaining US$74.6 million of IRSA’s 8.50% Notes
due 2017, so the following notes remains outstanding:
●
IRSA’s Notes Class II at 11.50% maturing
in 2020 US$71.4 million.
Such payments were accounted for as
a cancellation of debt.
In relation to financial covenants
under 11.50% Notes due in 2020 issued by IRSA, the Meeting of
Noteholders held on March 23, 2016 approved:
i.
to modify the covenant on Limitation on
Restricted Payments, so that the original covenant was replaced so
as to take into consideration IRSA’s capability to make any
restricted payment provided that (a) no Event of Default has
occurred and persisted, and (b) IRSA may incur at least US$1.00 of
additional debt pursuant to the Limitation on Additional
Indebtedness; and
ii.
the exclusion of IDBD or any of its subsidiaries
for purposes of the definition of “Subsidiary” or any
of the definitions or commitments under the Trust Indenture of
Notes due in 2020 and issued by IRSA (regardless of whether the
financial statements of any of these companies has any time been
consolidated into IRSA’s financial statements).
200
iii.
a Supplementary Trust Indenture reflecting all
the amendments approved, entered into with the Bank of New York
Mellon on March 28, 2016.
On September 8, 2016, IRSA issued
Series VII and VIII Notes for an aggregate amount of US$210
million:
a)
Series VII Notes for a principal amount of
Ps.384.2 million at BADLAR plus 299 bps due on September 9,
2019.
b)
Series VIII Notes for a principal amount of
US$184.5 million at a fixed rate of 7% due on September 9,
2019.
The proceeds were mainly used to
repay preexisting debt.
On September 12, 2017, IRSA CP
issued the Series IV Notes, for US$140,000,000, bearing a fixed
interest rate of 5.00%, which matures on September 14, 2019. For
more information, please see “Recent developments -
Issue of Series IV
Notes”
Operations Center in
Israel
IDBD is subject to certain
restrictions and financial covenants in relation to its financial
debt, including its notes and loans from banks and financial
institutions. For more information regarding IDBD’s
restrictions and financial covenants please see “B. Liquidity
and Capital Resources.”
Agreements not included in the Balance
Shee
t
We currently have no agreement that
is not included in the balance sheet or significant transactions
with non-consolidated entities that are not reflected in our
Audited Consolidated Financial Statements. All of our interests
and/or relationships with our subsidiaries or controlled entities
on a joint basis are recorded in our Audited Consolidated Financial
Statements.
C. Research and
Development, Patents and Licenses, Etc.
We have several trademarks
registered with the
Instituto
Nacional de la Propiedad Industrial
, the Argentine institute
for industrial property. We do not own any patents nor benefit from
licenses from third parties.
A substantial part of
Cellcom’s operations are subject to the Communications Law,
regulations enacted by the Ministry of Communications, and the
provisions of the licenses granted to Cellcom by the Minister of
Communications. Cellcom’s activities which include providing
cellular service, landline, international telephone services and
internet access, and infrastructure services are subject to
licensing. For more information, please see “Legal
framework–Operations Center in
Israel.”
D. Trend
Information
International
Macroeconomic Outlook
As reported in the IMF’s
“World Economic Outlook,” world growth is expected to
reach 3.5% in 2017 and 3.6% in 2018. In 2017 and 2018, growth in
advanced economies is expected to remain steady at about 2%, driven
by the growth in the United States of 2.3%, and in the Euro area,
of 1.7%. Global GDP expanded by 3.1% in 2016, slightly below the
projections mainly as a result of a strong decline in activity
during the last quarter in the year.
Emerging economies continue facing
challenges as regards the inflow of foreign capital. Countries
which are more flexible in terms of foreign exchange responded
better to the global flow of capital than in previous
decelerations.
The IMF’s Primary Commodities
Price Index declined by 5 percent between February 2017
and August 2017. While energy and food prices declined
substantially, by 6.5 percent and 4.3 percent, respectively, metal
prices increased modestly, by 0.8 percent.
Soybean prices trended downward from
February because supply from South America remains plentiful
following a record harvest in Brazil, even though a stronger real
discourages farmers from selling their produce.
201
In
advanced economies, inflation is forecast to pick up from 0.8
percent in 2016 to 1.7 percent in 2017, reflecting the continued
cyclical recovery in demand and the increase in commodity prices in
the second half of 2016. Headline inflation is expected to stay at
1.7 percent in 2018 before converging to 2 percent over the medium
term. Inflation in emerging market and developing economies
(excluding Argentina and Venezuela) is projected to remain roughly
stable in 2017 and 2018 (at 4.2 percent and 4.4 percent,
respectively—close to the 2016 estimate of 4.3
percent).
Argentine
macroeconomic context
On April, 2017, IMF published its
growth projection for 2017 and 2018 for 2.2% and 2.3%, increase of
the GDP, respectively. This projection was due to stronger
consumption and public investment, and reflects the gradual rebound
of private investment and exports.
Shopping malls and supermarket sales
reached a total Ps.5,249.6 million in June 2017, which represents a
11.3% increase as compared to the same period last year.
Accumulated sales for the first six months of the year totaled
Ps.26,351 million, representing a 12.8% increase as compared to the
same period last year.
The INDEC reports that, as of June
2017, industrial activity in Argentina increased by 6.6% as
compared to the same month in 2016. Textile industry accumulated a
4.0% decline during the first six months of the year as compared to
the same period last year.
Regarding the balance of payments,
in the first quarter of 2017 the current account deficit reached
US$6,871 million, with US$3,715 million allocated to the goods and
services trade balance, and US$3,676 million to the net primary
income, and US$520 million to the net secondary
income.
During the first quarter of 2017,
the financial account showed net income of US$6,556 million,
accentuating the net indebtedness of same quarter of the previous
year, for which US$4,872 million were estimated. As a result of the
Balance transactions, the stock of international reserves increased
by US$11,535 million during the first quarter of 2017.
Total gross external debt stock at
the end of March 2017 is estimated at US$ 204,509 million, with an
increase of US$ 16,293 million, 8.7% compared to the previous
quarter and US$28,237 million, 16.0% compared to March 2016. 62.8%
of the debt corresponds to the Government; 6.6% to the Argentine
Central Bank; 16.6% to non-financial corporations and households,
11.1% to direct investment between related companies, 2.2% to
deposit-taking companies and 0.8% to other financial
companies. The financial sector debt excluding the Argentine
Central Bank increased by US$493 million during the first quarter
of 2017, reaching a total of US$4,453 million.
In local financial markets, the
Private Badlar rate in Pesos ranged from 18% to 27% in the period
from July 2016 to June 2017, averaging 20% in June 2017 against 29%
in June 2016. As of June 30, 2016, the seller exchange rate quoted
by Banco de la Nación Argentina was of Ps.16.63 pesos per
US$1.00. As of June 30, 2017, Argentina’s country risk
decreased by 86 basis points in year-on-year terms, maintaining a
high spread vis-à-vis the rest of the countries in the region.
The debt premium paid by Argentina was at 432 basis points in June
2017, compared to the 289 basis points paid by Brazil and 193 basis
points paid by Mexico.
Israeli
macroeconomic context
The year 2016 was characterized by
improvement in the economic parameters in Israel, alongside an
increase in growth to a level of approximately 4.0% (as compared
with approximately 2.5% in 2015), and very low unemployment of
approximately 4.3% (as compared with approximately 5.3% in 2015).
Growth per capita amounted in 2016 to approximately 2.3%. At the
end of December 2016, the Bank of Israel updated the macro-economic
forecast, according to which the expected growth in 2017 and in
2018 is expected to amount to approximately 3.2% and 3.1%,
respectively. Additionally, the Bank of Israel predicts a continued
low unemployment rate of approximately 4.6%. Israel is
significantly affected by developments in the global economy. Real
global activity continued to be moderate in 2016. PBC estimates
that its financial stability and the status of its properties, cash
balances and significant operating cash flows which it generates
will allow it to deal adequately with the possible continuation of
the economic crisis, and to continue financing its activities and
service its liabilities.
202
The year 2016 was characterized by
continued stability in the revenue-generating real estate branch,
which is reflected both on the level of demand and on the level of
rental prices and occupancy rates. During the reporting period,
demand for office, commercial, industry and logistics areas was
evident in most operating areas of PBC in Israel, which were
reflected in the stability of prices and maintenance of a high
occupancy rate of approximately 97%.
In 2016, stability was apparent in
the demand for residential apartments in Israel, although in the
months October to December of 2016, relatively low numbers of
transactions were recorded, in light of the decrease in
acquisitions on the part of investors. In 2016, approximately
29,000 new apartments were sold (through private and public
initiative), a decrease of approximately 5% relative to 2015. 2015,
a year in which approximately 31,000 units were sold, was a record
year in terms of apartment sales in the market, and the level of
sales in 2016 is still higher than the level in the years
2011-2014. In 2016, an increase was apparent in the mortgage
interest rate, which amounted to approximately 3.8% per year
(CPI-linked) at the end of 2016, as compared with approximately
2.6% at the end of 2015. The inventory of new apartments in the
market (through private and public initiative) amounted, in
November 2016, to approximately 31,000 residential units, as
compared with approximately 28,000 residential units at the end of
2015.
According to the OECD, for the year
ended at December 31, 2015, Israel’s growth reached 2.5%.
Israel’s economic growth is projected to remain at 2.5% in
2016, before rising to 3% in 2017.
Since March 2015, the Bank of Israel
has kept interest rates at 0.10% and has continued with its policy
to intervene in the currency market to support economic policies.
For both July and August 2016, the Monetary Committee also decided
to leave the interest rate at the same level. Similar to the
announcements of the interest rate decisions for November and
December of 2015, all announcements in the first half of 2016
included guidance that monetary policy is expected to remain
accommodative for a considerable time.
Since March 2015, the Bank of Israel
has pursued a policy to intervene in the currency market. It
continued to purchase foreign currency, purchasing US$4 billion,
about US$0.9 billion of which were purchased as part of the program
intended to offset the effects of natural gas production on the
exchange rate. The rest were purchased as part of a program
designed to moderate excessive fluctuations in the exchange
rate.
During the twelve months ending June
30, 2016, the CPI in Israel declined by 0.8%. The energy component
continued to contribute to the decline of the CPI, as a result of
the sharp decline in global oil prices, even though this trend
reversed itself during the first half of the year.
During the first half of 2016, the
NIS remained stable in terms of the nominal effective exchange rate
(the average in June relative to the average in December), and
relative to the U.S. dollar. Relative to the euro, the NIS
appreciated by about 3%. Various models of the equilibrium exchange
rate indicate that the NIS may be overvalued.
Activity in the housing market
remained robust during the reviewed period: Home prices continued
to increase, and the volumes of transactions and of new mortgages
originated remain high. At the beginning of the first half of 2016,
the Research Department presented a forecast in which it projected
that inflation would return to within the target range at the
beginning of 2017, and that the Bank of Israel interest rate would
increase gradually starting in the last quarter of
2016.
In regards to the seasonality, in
Israel retail segment business results are subject to seasonal
fluctuations as a result of the consumption behavior of the
population proximate to the Pesach holidays (March and/or April)
and Rosh Hashanah and Sukkoth holidays (September and/or October).
This also affects the balance sheet values of inventory, customers
and suppliers. Our revenues from cellular services are usually
affected by seasonality with the third quarter of the year
characterized by higher roaming revenues due to increased incoming
and outgoing tourism.
E. Off-Balance
Sheet Arrangements
As of June 30, 2017, we did not have
any off-balance sheet transactions, arrangements or obligations
with unconsolidated entities or others that are reasonably likely
to have a material effect on our financial condition, results of
operations or liquidity.
203
F. Tabular
Disclosure of Contractual Obligations
The following table sets forth our
contractual obligations as of June 30, 2017:
Payments due by
period
|
As of June
30, 2017
|
||||||
|
|
Less than 1
year
|
Between 1
and 2 years
|
Between 2
and 3 years
|
Between 3
and 4 years
|
More than 4
years
|
Total
(1)
|
|
|
(in millions
of Pesos)
|
|||||
|
Trade and other
payables
|
17,602
|
1,592
|
698
|
2
|
5
|
19,899
|
|
Borrowings
|
25,389
|
18,613
|
21,365
|
13,878
|
74,286
|
153,531
|
|
Derivative Financial
Instruments
|
67
|
76
|
-
|
-
|
-
|
143
|
|
Finance
Lease
|
12
|
6
|
6
|
5
|
-
|
29
|
|
Operating
Lease
|
2,736
|
1,945
|
1,943
|
1,941
|
3,810
|
12,375
|
|
Purchase
obligations
|
1,135
|
1,140
|
873
|
5
|
-
|
3,153
|
|
Total
|
46,941
|
23,372
|
24,885
|
15,831
|
78,101
|
189,130
|
(1)
Includes accrued and prospective interest, if
applicable
.
Where the interest payable is
not fixed, the amount disclosed has been determined by reference to
the existing conditions at the reporting date.
G. Safe
Harbor
See the discussion at the beginning
of this Item 5 and “Forward Looking Statements” in the
introduction of this annual report for the forward looking safe
harbor provisions.
A. Directors
and Senior Management
Composition
of the Board of Directors
We are managed by a Board of
Directors. Our by-laws provide that our Board of Directors will
consist of a minimum of eight and a maximum of fourteen regular
directors and a like or lesser number of alternate directors. Our
directors are elected for three-fiscal year terms by a majority
vote of our shareholders at a general ordinary shareholders’
meeting and may be reelected indefinitely.
Currently our Board of directors is
composed of fourteen regular directors and two alternate directors.
Alternate directors will be summoned to exercise their functions in
case of absence, vacancy or death of a regular director or until a
new director is designated.
204
The table below shows information
about our regular directors and alternate directors:
|
Name
|
Date of
Birth
|
Position in
IRSA
|
Date of current
appointment
|
Term
expiration
|
Current position
held since
|
|
Eduardo S. Elsztain
|
01/26/1960
|
Chairman
|
2015
|
2018
|
1991
|
|
Saúl Zang
|
12/30/1945
|
First Vice-Chairman
|
2015
|
2018
|
1994
|
|
Alejandro G. Elsztain
|
03/31/1966
|
Second Vice-Chairman
|
2016
|
2019
|
2001
|
|
Fernando A. Elsztain
|
01/04/1961
|
Regular Director
|
2014
|
2017
(1)
|
1999
|
|
Carlos R. Esteves
|
05/25/1949
|
Regular Director
|
2014
|
2017
(1)
|
2005
|
|
Cedric D. Bridger
|
11/09/1935
|
Regular Director
|
2015
|
2018
|
2003
|
|
Marcos Fischman
|
04/09/1960
|
Regular Director
|
2015
|
2018
|
2003
|
|
Fernando Rubín
|
06/20/1966
|
Regular Director
|
2016
|
2019
|
2004
|
|
Gary S. Gladstein
|
07/07/1944
|
Regular Director
|
2016
|
2019
|
2004
|
|
Mario Blejer
|
06/11/1948
|
Regular Director
|
2014
|
2017
(1)
|
2005
|
|
Mauricio E. Wior
|
10/23/1956
|
Regular Director
|
2015
|
2018
|
2006
|
|
Gabriel A. G. Reznik
|
11/18/1958
|
Regular Director
|
2014
|
2017
(1)
|
2008
|
|
Ricardo H. Liberman
|
12/18/1959
|
Regular Director
|
2014
|
2017
(1)
|
2008
|
|
Daniel R. Elsztain
|
12/22/1972
|
Regular Director
|
2014
|
2017
(1)
|
2007
|
|
Gastón A. Lernoud
|
06/04/1968
|
Alternate Director
|
2014
|
2017
(1)
|
2014
|
|
Enrique Antonini
|
03/16/1950
|
Alternate Director
|
2016
|
2019
|
2007
|
(1)
The term of office
of Board members shall be in force until a
Shareholders
’
Meeting is
called to renew their powers and/or to appoint new Board members. A
shareholders meeting has been called for October 31,
2017.
Ricardo Esteves, Cedric Bridger,
Mario Blejer, Ricardo H. Liberman and Enrique Antonini are
independent directors, pursuant to CNV Rules.
The following is a brief
biographical description of each member of our Board of
Directors:
Eduardo Sergio
Elsztain.
Mr. Elsztain
has been engaged in the real estate business for more than twenty
five years and has served as chairman of our board of directors
since 1994. He is chairman of the board of directors of IRSA CP,
IRSA, Cresud, BrasilAgro, Austral Gold Ltd. and Banco
Hipotecario SA, among others. He is also chairman of the board
of directors of IDBD Development Corporation Ltd. and Discount
Investment Corporation. Mr. Elsztain is also a member of the
World Economic Forum, the Council of the Americas, the Group of 50
and Argentina’s Business Association (AEA). He is President
of Fundación IRSA, which promotes education initiatives
targeting children and young adults; President of
TAGLIT—Birthright Argentina; Co-Founder of Endeavor
Argentina; and Vice-President of the World Jewish Congress. He is
Fernando Adrián Elsztain’s cousin and Alejandro Gustavo
Elsztain and Daniel Ricardo Elsztain’s brother.
Saúl
Zang.
Mr. Zang
obtained a law degree from the University of Buenos Aires. He is a
member of the International Bar Association and of the
Interamerican Federation of Lawyers. He is a founding partner of
Zang, Bergel & Viñes Law Firm. Mr. Zang is
chairman of the board of directors of Puerto Retiro S.A. and
vice-chairman of the board of directors of IRSA, Fibesa S.A.
and Cresud, among other companies. He is also a member of the board
of directors of Banco Hipotecario S.A., Nuevas
Fronteras S.A., BrasilAgro Companhia Brasileira de Propiedades
Agrícolas, IDBD Development Corporation Ltd., BACS Banco
de Crédito & Securitización S.A.,
Tarshop S.A. and Palermo Invest S.A., among other
companies.
Alejandro Gustavo
Elsztain.
Mr. Elsztain
obtained a degree in agricultural engineering from the University
of Buenos Aires. He is currently chairman of the board of directors
of Fibesa S.A., and second vice-chairman of the boards of
directors of IRSA and Cresud. In addition, he is vice-chairman of
the boards of directors of Nuevas Fronteras S.A. and Hoteles
Argentinos S.A. He is also a member of the boards of directors
of BrasilAgro Companhia Brasileira de Propiedades Agrícolas,
Emprendimientos Recoleta S.A. and IDBD Development
Corporation Ltd., among other companies. Mr. Alejandro
Gustavo Elsztain is the brother of our chairman, Eduardo Sergio
Elsztain and of Daniel Ricardo Elsztain. He is also Fernando
Adrián Elsztain’s cousin.
205
Fernando Adrián
Elsztain.
Mr. Elsztain earned an architecture degree from the University
of Buenos Aires. He has been engaged in the real estate business as
a consultant and as managing officer of a real estate agency. He is
chairman of the boards of directors of Llao Resorts S.A.,
Palermo Invest S.A. and Nuevas Fronteras S.A. He is also
a member of the boards of directors of IRSA and Hoteles
Argentinos S.A., and alternate director of Banco Hipotecario
and Puerto Retiro S.A. He is the cousin of Eduardo Sergio
Elsztain, Alejandro Gustavo Elsztain and Daniel Ricardo
Elsztain.
Carlos Ricardo
Esteves.
Mr.
Esteves has a degree in Political Sciences from Universidad El
Salvador. He was a member of the Boards of Directors of Banco
Francés del Río de la Plata, Bunge & Born Holding,
Armstrong Laboratories, Banco Velox and Supermercados Disco. He was
one of the founders of CEAL (Consejo Empresario de América
Latina) and is a member of the board of directors of Encuentro de
Empresarios de América Latina (padres e hijos) and is
co-President of Foro Iberoamericano.
Cedric D.
Bridger.
Mr.
Bridger is qualified as a certified public accountant in the United
Kingdom. From 1992 through 1998, he served as chief financial
officer of YPF S.A. Mr. Bridger was also financial director of
Hughes Tool Argentina, chief executive officer of Hughes Tool in
Brazil and Hughes’ corporate vice-president for South
American operations. He is also a director of Banco Hipotecario
S.A.
Fernando
Rubín.
Mr.
Rubín has a degree in psychology from Universidad de Buenos
Aires and attended a post-graduate course in Human Resources and
Organizational Analysis at E.P.S.O. He has been the manager of
organizational development at Banco Hipotecario and then CEO in
that entity. He served as corporate manager of human resources for
the Company, director of human resources for LVMH (Moet Hennessy
Louis Vuitton) in Argentina and Bodegas Chandon in Argentina and
Brazil. He also served as manager of the human resources division
for the international consulting firm Roland Berger &
Partner-International Management Consultants. He currently serves
as president of Tarshop S.A.
Gary S.
Gladstein.
Mr.
Gladstein has a degree in economics from the University of
Connecticut and a master’s degree in business administration
from Columbia University. He was operations manager in Soros Fund
Management LLC and is currently a senior consultant of Soros Fund
Management LLC.
Mario
Blejer.
Mr.
Blejer obtained a Ph.D. in economy from the University of Chicago.
He has been Senior Counselor to the IMF in the European and Asian
departments from 1980 to 2001. He was also vice-chairman and
chairman of the Argentine Central Bank from 2001 to 2002. He also
served as director of the Center for Studies of Central Banks of
the Bank of England from 2003 to 2008 and as counselor of the
Governor of the Bank of England during that same period. At
present. Mr. Blejer is regular director of Banco Hipotecario S.A.,
among other companies. He was also External Counselor to the
Currency Policy Council of the Central Bank of Mauritius and is
Postgraduate professor at Torcuato Di Tella
University.
Mauricio Elías
Wior.
Mr. Wior
obtained a master’s degree in finance, as well as a
bachelors’ degree in economics and accounting from Tel Aviv
University in Israel. Mr. Wior is currently a director of Banco
Hipotecario, TGLT, Vice-president of Shufersal, Vice-president of
Tarshop S.A. and President of BHN Sociedad de Inversión S.A.
He has held positions at Bellsouth where he was Vice President for
Latin America from 1995 to 2004. Mr. Wior was also CEO of Movicom
Bellsouth from 1991 to 2004. In addition, he led the operations of
various cellular phone companies in Uruguay, Chile, Peru, Ecuador
and Venezuela. He was president of Asociación Latinoamericana
de Celulares (ALCACEL); the U.S. Chamber of Commerce in Argentina
and the Israeli-Argentine Chamber of Commerce. He was a director of
Instituto para el Desarrollo Empresarial de la Argentina (IDEA),
Fundación de Investigaciones Económicas Latinoamericanas
(FIEL) and Tzedaka.
Gabriel A. G.
Reznik.
Mr.
Reznik obtained a degree in Civil Engineering from Universidad de
Buenos Aires. He worked for the Company from 1992 until May 2005,
when he resigned. He had previously worked for an independent
construction company in Argentina. He is regular director of Banco
Hipotecario S.A.
Ricardo
Liberman.
Mr.
Liberman graduated as a Public Accountant from Universidad de
Buenos Aires. He is also an independent consultant in audit and tax
matters.
206
Daniel Ricardo
Elsztain.
Mr.
Elsztain graduated with a major in Economic Sciences from the
Torcuato Di Tella University and has a Master in Business
Administration. He serves as Director in Condor Hospitality Inc. He
has been our operating manager since 1998. Mr. Elsztain is brother
of Mr. Eduardo Sergio Elsztain, and Mr. Alejandro Gustavo Elsztain
and cousin of Fernando Adrián Elsztain.
Gastón Armando
Lernoud.
Mr.
Lernoud obtained a law degree in Universidad El Salvador in 1992.
He obtained a Master in Corporate Law in Universidad de Palermo in
1996. He has been senior associate in Zang, Bergel & Viñes
Law Firm until June 2002, when he joined CRESUD as legal
counsel.
Enrique
Antonini.
Mr.
Antonini holds a degree in law from the School of Law of
Universidad de Buenos Aires. He has been director of Banco Mariva
S.A. since 1992 until today, and alternate director of Mariva
Bursátil S.A. since 2015. He is a member of the Argentine
Banking Lawyers Committee and the International Bar Association. At
present, he is Alternate Director of CRESUD.
Employment
Contracts with our Directors
We do not have written contracts
with our directors. However, Messrs. Eduardo Sergio Elsztain,
Saúl Zang, Alejandro Gustavo Elsztain, Daniel Ricardo
Elsztain, Fernando Elsztain, Fernando Rubín and Marcos
Moisés.
Fishman are employed by our Company
under the Labor Contract Law No. 20,744. In addition, our alternate
director Gastón Armando Lernoud rendered services under the
corporate services agreement. Law No. 20,744 governs certain
conditions of the labor relationship, including remuneration,
protection of wages, hours of work, holidays, paid leave, maternity
protection, minimum age requirements, protection of young workers
and suspension and termination of the contract.
Executive
Committee
Pursuant to our by-laws, our
day-to-day business is managed by an Executive Committee consisting
of five regular directors and one alternate director, among which
there should be the chairman, first vice-chairman and second
vice-chairman of the board of directors. The current members of the
Executive Committee are Messrs. Eduardo Sergio Elsztain, Saúl
Zang, Alejandro Elsztain and Fernando Elsztain, as regular members.
The Executive Committee meets as needed by our business, or at the
request of one or more of its members.
The executive committee is
responsible for the management of the daily business pursuant to
the authority delegated by the Board of Directors in accordance
with applicable laws and our by-laws. Pursuant to Section 269 of
the Argentine Corporations Law, the Executive Committee is only
responsible for the management of the day-to-day business. Our
by-laws authorize the Executive Committee to:
●
designate the managers of our Company and
establish the duties and compensation of such
managers;
●
grant and revoke powers of attorney on behalf of
our Company;
●
hire, discipline and fire personnel and
determine wages, salaries and compensation of
personnel;
●
enter into contracts related to our
business;
●
manage our assets;
●
enter into loan agreements for our business and
set up liens to secure our obligations; and
●
perform any other acts necessary to manage our
day-to-day business.
Senior
Management
Appointment of
Senior Management
Our Board of Directors appoints and
removes senior management.
207
Senior
Management Information
The following table shows
information about our current Senior Management appointed by the
Board of Directors:
|
Name
|
Date of
birth
|
Position
|
Current position
held since
|
|
Eduardo S. Elsztain
|
01/26/1960
|
Chief Executive Officer
|
1991
|
|
Daniel R. Elsztain
|
12/22/1972
|
Chief Real Estate Operating
Officer
|
2012
|
|
Javier E. Nahmod
|
11/10/1977
|
Chief Real Estate
Officer
|
2014
|
|
Matías I.
Gaivironsky
|
02/23/1976
|
Chief Administrative and Finance
Officer
|
2011
|
|
Walter Daniel
Vallini
|
07/09/1971
|
Compliance Officer
|
2017(1)
|
(1)
Appointed on
October 23, 2017.
For a biographical description of
Eduardo S. Elsztain, Daniel R. Elsztain please see “A.
Directors and Senior Management -
Composition of the Board of
Directors
.” The following is a description of each of
our senior managers who are not directors:
Javier Ezequiel
Nahmod.
Mr. Javier Nahmod started his professional
career in the Company in 1998, he has served in different areas
within IRSA and IRSA CP’ real estate business. During the
first years he has served as Stands Marketer (Comercializador de
Góndolas) and then, in 2003 he became Center Manager at Abasto
Shopping Mall. Afterwards, he became Rental Business Manager
(Gerente de Negocios de Renta) within the Real Estate Department,
and then Regional Manager of Shopping Malls. He has served as Real
Estate Manager within the Real Estate Business of the Company since
2014.
Matías
Iván Gaivironsky.
Mr. Matías Gaivironsky
obtained a degree in business administration from Universidad de
Buenos Aires. He has a master
’
s
degree in Finance from CEMA University. Since 1997 he has served in
various positions at Cresud, IRSA CP and the Company, and was
appointed Chief Financial Officer in December 2011
and in early 2016 he was appointed as Chief Financial and
Administrative Officer
.
Previously, Mr. Gaivironsky acted as Chief Financial Officer
of Tarshop S.A. until 2008.
Walter
Daniel Vallini.
Mr. Vallini
obtained a degree in administration from Universidad del Museo
Social Argentino and also has a degree in philosophy from
Universidad de Buenos Aires. He has a Master in Economy and
Business Administration from Escuela Superior de Economía y
Administración de Empresas (ESEADE). Since 2002 he has served
in various positions at BBVA Banco Francés and in April, 2013,
he was designated as Director in regulatory compliance. He is also
the Compliance Officer of CRESUD and IRSA CP.
The following table shows
information about our current Senior Management of the Operations
Center in Israel:
|
Name
|
Date of
birth
|
Position
|
Current position
held since
|
|
Sholem Lapidot
|
10/22/1979
|
Chief Executive Officer
|
2016
|
|
Gil Kotler
|
04/10/1966
|
Chief Financial Officer
|
2016
|
|
Aaron Kaufman
|
03/03/1970
|
VP & General
Counsel
|
2015
|
Sholem
Lapidot.
Mr.
Lapidot has studied Rabbinical Studies and Jewish Philosophy in
Argentina, Canada and Israel. Mr. Lapidot serves as CEO and
director in DIC since January 2016., and as a director in several
subsidiaries in the IDBD’s group. Mr. Lapidot has been the
CEO of IDBD since January 2016.
Gil
Kotler.
Mr.
Kotler obtained a bachelors’ degree in economics and
accounting from Tel Aviv University in Israel in 1993 as well as a
GMP at Harvard Business School in 2011. He serves as the chief
financial officer of IDBD since April 2016 and the chief financial
officer of DIC since January 2016. Mr. Kotler also serves as a
director in several subsidiaries in the IDBD group.
Aaron
Kaufman.
Mr.
Kaufman obtained a law degree in Tel Aviv University in 1996. He
has been partner in Epstein Law Firm until November 2015, when he
joined IDBD as a VP and General Counsel. Mr. Kaufman serves as VP
and General Counsel in DIC since April 2016 and as a director in
several subsidiaries in the IDBD group.
208
Supervisory
Committee
Our Supervisory Committee
(
Comisión
Fiscalizadora
) is responsible for reviewing and supervising
our administration and affairs and verifying compliance with our
by-laws and resolutions adopted at the shareholders’
meetings. The members of the Supervisory Committee are appointed at
our annual general ordinary shareholders’ meeting for a
one-fiscal year term. The Supervisory Committee is composed of
three regular members and three alternate members and pursuant to
Section 294 of the Argentine Corporations Law No. 19,550, as
amended, must meet at least every three months.
The following table shows
information about the members of our Supervisory Committee, who
were elected at the annual ordinary shareholders’ meeting,
held on October 31, 2016:
|
Name
|
Date of
Birth
|
Position
|
Expiration
Date
|
Current position
held since
|
|
José D. Abelovich
|
07/20/1956
|
Regular Member
|
2016
|
1992
|
|
Marcelo H. Fuxman
|
11/30/1955
|
Regular Member
|
2016
|
1992
|
|
Noem’ I. Cohn
|
05/20/1959
|
Regular Member
|
2016
|
2010
|
|
Sergio L. Kolaczyk
|
11/28/1964
|
Alternate Member
|
2016
|
2003
|
|
Roberto D. Murmis
|
04/07/1959
|
Alternate Member
|
2016
|
2005
|
|
Alicia G. Rigueira
|
12/02/1951
|
Alternate Member
|
2016
|
2006
|
Set forth below is a brief
biographical description of each member of our Supervisory
Committee:
José D.
Abelovich.
Mr. Abelovich obtained a degree in accounting
from Universidad de Buenos Aires. He is a founding member and
partner of Abelovich, Polano & Asociados S.R.L., a law firm
member of Nexia International, a public accounting firm in
Argentina. Formerly, he had been a manager of Harteneck, López
y C’a/Coopers & Lybrand and has served as a senior
advisor in Argentina for the United Nations and the World Bank. He
is a member of the Supervisory Committees of CRESUD, IRSA CP,
Hoteles Argentinos S.A., Inversora Bol’var and Banco
Hipotecario.
Marcelo H. Fuxman.
Mr. Fuxman obtained a degree in accounting from Universidad de
Buenos Aires. He is a partner of Abelovich, Polano y Asociados
S.R.L., a law firm member of Nexia International, a public
accounting firm in Argentina. He is also a member of the
supervisory committee of CRESUD, IRSA CP, Inversora Bol’var
and Banco Hipotecario S.A.
Noemí L. Cohn.
Mrs. Cohn obtained a degree in accounting from Universidad de
Buenos Aires. She is a partner of Abelovich, Polano y Asociados
S.R.L. / Nexia International, an accounting firm in Argentina, and
she works in the Audit sector. Mrs. Cohn worked in the audit area
of Harteneck, López and Company, Coopers & Lybrand in
Argentina and in Los Angeles, California. Mrs. Cohn is a member of
the Supervisory Committees of CRESUD and IRSA CP, among
others.
Sergio L. Kolaczyk.
Mr. Kolaczyk obtained a degree in accounting from Universidad de
Buenos Aires. He is a professional from Abelovich, Polano &
Asociados S.R.L./Nexia International. Mr. Kolaczyk is also
alternate member of the Supervisory Committee of CRESUD and the
Company, among other companies.
Roberto D. Murmis.
Mr. Murmis holds a degree in accounting from Universidad de Buenos
Aires. Mr. Murmis is a partner at Abelovich, Polano & Asociados
S.R.L., a law firm member of Nexia International. Mr. Murmis worked
as an advisor to Secretar’a de Ingresos Públicos del
Ministerio de Econom’a of Argentina. Furthermore, he is a
member of the supervisory committee of CRESUD, Alto Palermo
Shopping S.A., Futuros y Opciones.Com S.A. and Llao Llao Resorts
S.A.
Alicia G. Rigueira.
Mrs. Rigueira holds a degree in accounting from Universidad de
Buenos Aires. Since 1998 she has been a manager at Estudio
Abelovich, Polano & Asociados SRL, a law firm member of Nexia
International. From 1974 to 1998, Mrs. Rigueira performed several
functions at Harteneck, Lopez y C’a./Coopers & Lybrand.
Mrs. Rigueira was professor at the School of Economic Sciences at
Universidad de Lomas de Zamora.
209
Internal
Control
Management uses the Integrated
Framework-Internal Control issued by the Committee of Sponsoring
Organizations of the Treadway Commission (“2013 COSO
Report”) to assess the effectiveness of internal control over
financial reporting.
The 2013 COSO Report sets forth that
internal control is a process performed by the Board of Directors,
management and other personnel, designed to provide reasonable
assurance regarding the achievement of the entity’s
objectives in the following categories:
●
Effectiveness and efficiency of
operations
●
Reliability of financial reporting,
and
●
Compliance with applicable laws and
regulations
Based on the above, the
company’s internal control system involves all the levels
actively involved in exercising control:
●
the Board of Directors, by establishing the
objectives, principles and values, setting the tone at the top and
making the overall assessment of results;
●
the management of each area is responsible for
the internal control in relation to objectives and activities of
the relevant area, i.e. the implementation of policies and
procedures to achieve the results of the areas and, therefore,
those of the entity as a whole;
●
the rest of the personnel plays a role in
exercising control, by generating information used in the control
system or taking action to ensure control.
Audit
Committee
In accordance with the Regime of
Transparency in Public Offerings provided by Decree No. 677/01,
currently by application of Capital Markets Law No. 26,831 and the
CNV Rules, our Board of Directors established an Audit
Committee.
The Audit Committee is a committee
of the Board of Directors, the main function of which is to assist
the Board of Directors in (i) exercising its duty of care,
diligence and competence in issues relating to us, specifically as
concerns the enforcement of accounting policies, and disclosure of
accounting and financial information, (ii) management of our
business risk, the management of our internal control systems,
(iii) behavior and ethical conduct of the Company’s
businesses, (iv) monitoring the sufficiency of our financial
statements, (v) our compliance with the laws, (vi) independence and
competence of independent auditors, (vii) performance of our
internal audit duties both by our Company and the external auditors
and (viii) it may render, upon request of the Board of Directors,
its opinion on whether the conditions of the related parties’
transactions for relevant amounts may be considered reasonably
sufficient under normal and habitual market
conditions.
In accordance with the provisions of
the Capital Markets Law and the CNV’s Rules, our Audit
Committee is made up by three Board members who qualify as
independent directors. The NYSE Regulations establish that as of
July 31, 2005, foreign companies listing securities in the United
States must have an Audit Committee fully formed by independent
directors.
Currently, we have a fully
independent Audit Committee composed of Messrs. Cedric D. Bridger,
Ricardo H. Liberman and Mario Blejer.
210
Aspects
related to the decision-making processes and internal control
system of the company
The decision-making process is led
in the first place by the Executive Committee in exercise of the
duties and responsibilities granted to it under the bylaws. As part
of its duties, a material aspect of its role is to draft the
Company’s strategic plan and annual budget projections, which
are submitted to the Board of Directors for review and
approval.
The Executive Committee analyzes the
objectives and strategies that will be later considered and
resolved by the Board of Directors and outlines and defines the
main duties and responsibilities of the various management
departments.
The Company’s internal control
system also involves all levels that participate in active control:
the Board of Directors establishes the objectives, principles and
values, it provides general guidance and assesses global results;
the Departments are responsible for compliance with internal
policies, procedures and controls to achieve results within their
sectors and –of course- achieve the results for the entire
organization, and the other personnel members also have a role in
exercising control upon generating information used by the control
system, or by taking certain actions to ensure
control.
In addition, the Company has an
Internal Audit Department reporting to the CEO that is responsible
for overseeing compliance with internal controls by the departments
above mentioned and works, in turn, together with the Audit
Committee by submitting periodic reports to the
latter.
B.
Compensation
Board of
Directors
Under the Argentine Corporations
Law, if the compensation of the members of the Board of Directors
and the Supervisory Committee is not established in the by-laws of
the Company, it should be determined by the shareholders’
meeting. The maximum amount of total compensation to the members of
the Board of Directors and the Supervisory Committee, including
compensation for technical or administrative permanent activities,
cannot exceed 25% of the earnings of the company. That amount
should be limited to 5% when there is no distribution of dividends
to shareholders and will be increased in proportion to the
distribution up to such limit if all earnings are distributed. For
purposes of applying this provision, the reduction in the
distribution of dividends derived from reducing the Board of
Directors’ and Supervisory Committee’s fees will not be
considered.
When one or more directors perform
special commissions or technical or administrative activities, and
there are no earnings to distribute, or they are reduced, the
shareholders meeting may approve compensation in excess of the
above mentioned limits. The compensation of our directors for each
fiscal year is determined pursuant to the Argentine Corporations
Law and taking into consideration whether the directors performed
technical or administrative activities and our fiscal year’s
results. Once the amounts are determined, they are considered at
the shareholders’ meeting.
The total aggregate compensation
paid to our Directors for the fiscal year ended June 30, 2017
was Ps.125.8 million.
Senior
Management
We pay our senior management
pursuant to a fixed amount, established by taking into
consideration their background, capacity and experience and an
annual bonus which varies according to their individual performance
and the Company’s overall results.
The total aggregate compensation
paid to our Senior Management of the Operations Center in Argentina
for the fiscal year ended June 30, 2017 was Ps.14.4
million.
The aggregate compensation paid to
our Senior Management of the Operations Center in Israel since we
gained control of IDBD on October 11, 2015 and until June 30, 2016,
was Ps.11,36 million. For the fiscal year ended on June 30, 2017
the aggregate compensation was of Ps.13.11 million.
211
Supervisory
Committee
The shareholders meeting to be held
on October 31, 2016, considered the compensation for Ps.600,000 to
the Supervisory Committee for the duties performed during the
fiscal year ended June 30, 2017.
Audit
Committee
The members of our Audit Committee
do not receive compensation in addition to that received for their
service as members of our Board of Directors.
Compensation
Plan for Executive Management
Since 2006 we develop a special
compensation plan (the “Management Plan”) for key
managers by means of contributions made by the employees and by the
Company.
Such Management Plan is directed to
key managers selected by us and aims to retain them by increasing
their total compensation package through an extraordinary reward,
granted to those who have met certain conditions.
Participation and contributions
under the Management Plan are voluntary. Once the invitation to
participate has been accepted by the employee, he or she may make
two kinds of contributions: monthly contributions (salary based)
and extraordinary contribution (annual bonus based). The suggested
contribution to be made by Management Participants is: up to 2.5%
of their monthly salary and up to 15% of their annual bonus. Our
contribution will be 200% of the Management Participant’s
monthly contributions and 300% of the extraordinary
employees’ contributions.
The funds collected as a result of
the Management Participants’ contributions are transferred to
a special independent vehicle created in Argentina as an Investment
Fund approved by the CNV.
The funds collected as a result of
our contributions are transferred to another independent vehicle
separate from the previous one. In the future, participants will
have access to 100% of the benefits of the Plan (that is, including
our contributions made on the participants’ behalf to the
specially created vehicle) under the following
circumstances:
●
ordinary retirement in accordance with
applicable labor regulations;
●
total or permanent incapacity or disability;
and
●
death.
In case of resignation or
termination without cause, the Participant may redeem amounts
contributed by us only if he or she has participated in the Plan
for at least 5 years subject to certain conditions.
Long Term
Incentive Program
The Company has developed a medium
and long term incentive and retention stock program for its
management team and key employees under which share-based
contributions were calculated based on the annual bonus for the
years 2011, 2012, 2013 and 2014.
The Shareholders’ Meetings
held on October 31, 2011, October 31, 2012 and October 31, 2013
ratified the resolutions approved thereat as regards the incentive
plan for the Company’s executive officers, up to 1% of its
shareholders’ equity by allocating the same number of own
treasury stock (the “Executive Plan”), and delegated on
the Board of Directors the broadest powers to fix the price, term,
form, modality, opportunity and other conditions to implement such
Executive Plan. In this sense and in accordance with the new
Capital Markets Law, the Company has made the relevant filing with
the CNV and pursuant to the comments received from such entity, it
has made the relevant amendments to the Executive Plan which, after
the CNV had stated to have no further comments, were explained and
approved at the Shareholders’ Meeting held on November 14,
2014, where the broadest powers were also delegated to the Board of
Directors to implement such Executive Plan.
The beneficiaries under the
Executive Plan are invited to participate by the Board of Directors
and their decision to access the Executive Plan is
voluntary.
212
In the future, the Executive
Participants or their successors in interest will have access to
100% of the benefit (IRSA’s shares contributed by the
Company) in the following cases:
●
if an employee resigns or is dismissed for no
cause, he or she will be entitled to the benefit only if 5 years
have elapsed from the moment of each contribution;
●
retirement;
●
total or permanent disability;
●
death.
While Executive Participants are
part of the program and until the conditions mentioned above are
met to receive the shares corresponding to the contributions based
on the 2011 to 2013 bonus, Executive Participants will receive the
economic rights corresponding to the shares assigned to
them.
As regards the year 2014, the
program sets forth an extraordinary reward consisting of freely
available stock payable in a single opportunity on a date to be
determined by the Company. The date was fixed for June 26, 2015 for
payroll employees of IRSA, IRSA CP, PAMSA, Emprendimiento Recoleta
S.A., ARCOS and FIBESA S.A. who received IRSA’s
shares.
Besides, the Company has decided to
grant a bonus to all the personnel with more than two years of
seniority and who do not participate in the program described
above, which bonus consists of a number of shares equivalent to
their compensation for June 2014.
The shares allocated to the
Executive Plan by the Company are shares purchased in 2009, which
the Shareholders’ Meeting held on October 31, 2011 has
specifically decided to allocate to the Executive
Program.
DIC's
CEO
of the
Operation Center in Israel, has a stock option
plan which includes 5,310,000 options, that will
be given in five series, and which may be exercised for 5,310,000
ordinary shares, par value NIS per share of Discount Investments.
DIC's CEO has exercised the first stage and as of April 2017 holds
4,248,000 options. DIC's CFO
of the Operation Center in Israel, has a stock
option plan which includes
621,362 options, which
124,272 of the said options were exercised and as of April 2017
holds 497,090 options
.
Code of
Ethics
The Code of Ethics is effective as
from July 31, 2005 with the aim of providing a wide range of
guidelines as concerns accepted individual and corporate behavior.
It is applicable to directors, managers and employees of IRSA and
its subsidiaries. The Code of Ethics that governs our business, in
compliance with the laws of the countries where we operate, may be
found on our website
www.irsa.com.ar
.
Information
found on this website is not incorporated by reference into this
document.
A committee of ethics composed of
managers and board members is responsible for providing solutions
to issues related to the Code of Ethics and is in charge of taking
disciplinary measures in case of breach of the code.
C. Board
Practices
For information about the date of
expiration of the current term of office and the period during
which each director has served in such office see “Item 6.
Directors, Senior Management and employees – A. Directors and
Senior Management.”
Benefits upon
Termination of Employment
There are no contracts providing for
benefits to Directors upon termination of employment., other than
those described under the following sections: (i) ITEM 6:
Directors, Senior Management and Employees – B. Compensation
– Capitalization Plan and (ii) ITEM 6: Directors, Senior
Management and Employees – B. Compensation – Incentive
Plan for Managers.
Audit Committe
In accordance with the Capital
Markets Law and CNV rules, our board of directors has established
an Audit Committee.
213
The Audit Committee is a committee
of the board of directors, the main function of which is to assist
the board of directors in (i) exercising its duty of care,
diligence and competence in issues relating to us, specifically as
concerns the enforcement of accounting policies, and disclosure of
accounting and financial information, (ii) management of our
business risk, the management of our internal control systems,
(iii) behavior and ethical conduct of the Company’s
businesses, (iv) monitoring the sufficiency of our financial
statements, (v) our compliance with the laws, (vi) independence and
competence of independent auditors, (vii) performance of our
internal audit and the external auditors (viii) and it may render,
upon request of the Board of Directors, its opinion on whether the
conditions of the related parties’ transactions for relevant
amounts may be considered reasonably sufficient under normal and
habitual market conditions.
In accordance with the applicable
rules our Audit Committee must hold sessions at least with the same
frequency required to the board of directors (on a three month
basis).
Capital Markets Law No. 26,831 and
the CNV Rules requires that public companies in Argentina as us
must have an Audit Committee comprise of three members of the board
of directors, the majority of which must be independent.
Notwithstanding, our Audit Committee is comprised by three
independent directors in compliance with the requirements lead down
by the SEC.
Currently, we have a fully
independent Audit Committee composed of Messrs. Cedric Bridger,
Ricardo Liberman and Mario Blejer.
D.
Employees
Operations Center in
Argentina
As of June 30, 2017, we had 1,759
employees. Our Development and Sale of Properties and Other
Non-Shopping Mall Businesses segment had 22 employees, 4 of whom
were represented by the Commerce Union (Sindicato de Empleados de
Comercio, SEC) and 10 were represented by the Horizontal Property
Union (Sindicato Único de Trabajadores de Edificios de Renta y
Horizontal, SUTERH). Our Shopping Malls segment had 947 employees,
including 453 under collective labor agreements. Our Hotels segment
had 790 employees, with 656 represented by the Tourism, Hotel and
Gastronomic Workers Union (Unión de Trabajadores del Turismo,
Hoteleros y Gastronómicos de la República Argentina,
UTHGRA).
|
|
Year ended
on June 30,
|
||
|
|
2017
|
2016
|
2015
|
|
Development and Sale
of Properties and Other Non-Shopping Mall
Businesses
(1)
|
22
|
31
|
34
|
|
Shopping Centers and
Offices
(3)
|
947
|
964
|
973
|
|
Hotels
(2)
|
790
|
758
|
704
|
|
Total
|
1,759
|
1,753
|
1,711
|
(1)
Includes IRSA, Consorcio Libertador S.A. and
Consorcio Maipú 1300 S.A.
(2)
Includes Hotel Intercontinental, Sheraton
Libertador and Llao Llao.
(3)
In April and May 2015, the employees assigned to
IRSA, who discharge duties in connection with building’s
operations and the Real Estate business were transferred to IRSA
CP.
214
Operations
Center in Israel
The following table shows the number
of employees as of June 30, 2017 of our operations center in Israel
divided by company:
|
|
As of
June 30,
|
|
|
|
2017
|
2016
|
|
IDBD
|
24
|
29
|
|
DIC (1)
|
18
|
31
|
|
Shufersal
|
13,790
|
13,792
|
|
Cellcom (2)
|
2,940
|
3,158
|
|
PBC (3)
|
118
|
115
|
|
Other(4)
|
821
|
802
|
(1)
Includes Elron’s employees.
(2)
Includes Netvision’s employees. Does not
include temporary or external employees.
(3)
Includes Gav-Yam’s employees.
(4)
Includes IDBG and IDB Tourism.
E. Share
Ownership
The following table sets forth the
amount and percentage of our common shares beneficially owned by
our directors, senior managers and members of the supervisory
committee as of June 30, 2017.
|
Name
|
Position
|
Number of
Shares
|
Percentage
|
|
Directors
|
|
|
|
|
Eduardo S. Elsztain
(1)
|
Chairman
|
366,870,083
|
63.4
%
|
|
Saúl
Zang
|
Vice-Chairman
I
|
8
|
0.0
%
|
|
Alejandro G.
Elsztain
|
Vice- Chairman
II
|
550,000
|
0.1
%
|
|
Fernando A.
Elsztain
|
Regular
Director
|
-
|
-
|
|
Carlos R.
Esteves
|
Regular
Director
|
-
|
-
|
|
Cedric D.
Bridger
|
Regular
Director
|
-
|
-
|
|
Marcos M.
Fischman
|
Regular
Director
|
-
|
-
|
|
Fernando
Rubín
|
Regular
Director
|
29,943
|
0.01
%
|
|
Gary S.
Gladstein
|
Regular
Director
|
210,030
|
0.0
%
|
|
Mario
Blejer
|
Regular
Director
|
-
|
-
|
|
Mauricio E.
Wior
|
Regular
Director
|
-
|
-
|
|
Gabriel A. G.
Reznik
|
Regular
Director
|
-
|
-
|
|
Ricardo
Liberman
|
Regular
Director
|
-
|
-
|
|
Daniel R.
Elsztain
|
Regular
Director
|
146,320
|
0.0
%
|
|
Gaston A.
Lernoud
|
Alternate
Director
|
4,782
|
0.0
%
|
|
Enrique
Antonini
|
Alternate
Director
|
-
|
-
|
|
Senior
Management
|
|
|
|
|
Matías I.
Gaivironsky
|
Chief Financial and
Administrative Officer
|
43,150
|
0.0
%
|
|
Javier E.
Nahmod
|
Chief Real Estate
Officer
|
-
|
-
|
|
Supervisory
Committee
|
|
|
|
|
José D.
Abelovich
|
Member
|
-
|
-
|
|
Marcelo H.
Fuxman
|
Member
|
-
|
-
|
|
Noemí I.
Cohn
|
Member
|
-
|
-
|
|
Sergio L.
Kolaczyk
|
Alternate
member
|
-
|
-
|
|
Roberto D.
Murmis
|
Alternate
member
|
-
|
-
|
|
Alicia G.
Rigueira
|
Alternate
member
|
-
|
-
|
(1)
Includes (i) 366,869,183 common shares
beneficially owned by Cresud, and (ii) 900 common shares owned
directly by Mr. Eduardo S. Elsztain.
D
Option
Ownership
No options to purchase common shares
have been granted to our Directors, Senior Managers, members of the
Supervisory Committee, or Audit Committee.
215
Employee
Participation in our share Capital
There are no arrangements for
involving our employees in our capital stock or related to the
issuance of options, common shares or securities, other than those
described under the following sections: (i) Item 6 – B.
Compensation – Capitalization Plan and (ii) Item 6 – B.
Compensation – Mid and Long Term Incentive
Program.
A. Major
Shareholders
Information
about Major Shareholders
Share Ownership
The following table sets forth
information regarding ownership of our capital stock by each person
known to us to own beneficially at least 5% of our common shares,
ANSES and all our directors and officers as a group.
|
|
Share
Ownership as of June 30, 2017
|
|
|
Shareholder
|
Number of
Shares
|
Percentage
(3)
|
|
Cresud
(1) (2)
(4)
|
366,870,083
|
63.4
%
|
|
Directors and
officers (excluding Eduardo Elsztain)
|
966,032
|
0.2
%
|
|
ANSES
|
25,914,834
|
4.5
%
|
|
Total
|
393,750,949
|
68.1
%
|
(1)
Eduardo S. Elsztain is the beneficial owner of
154,557,259 which includes (i) 154,462,970 common shares
beneficially owned by IFISA, and (ii) 94,289 common shares held
directly by him, representing 30.8% of its total share capital.
Although Mr. Elsztain does not own a majority of the common shares
of Cresud, he is its largest shareholder and exercises substantial
influence over Cresud. If Mr. Elsztain is considered to be the
beneficial owner of Cresud due to his substantial influence over
it, he would be the beneficial owner of 63.4% of our common shares
by virtue of his investment in Cresud.
(2)
Includes (i) 366,869,183 common shares
beneficially owned by Cresud, and (ii) 900 common shares owned
directly by Mr. Eduardo S. Elsztain. As a result, Mr.
Elsztain’s aggregate beneficial ownership of our outstanding
common shares may be as high as 366,870,083 common shares,
representing 63.4% of our outstanding common shares.
(3)
As of June 30, 2017, the number of outstanding
common shares was 578,676,460.
(4)
Cresud is a leading Argentine producer of basic
agricultural products. Cresud’s common shares began trading
in the MERVAL
on
December 12, 1960, under the trading symbol “CRES” and
on March 1997 its GDSs began trading in the Nasdaq under the
trading symbol “CRESY.”
Changes in Share Ownership
|
Shareholder
|
June 30,
2017 (%)(1)
|
June 30,
2016 (%)
|
June 30,
2015(%)
|
June 30,
2014 (%)
|
June 30,
2013 (%)
|
|
Cresud
(1)
|
63.4
|
63.4
|
64.3
|
65.5
|
65.5
|
|
Inversiones
Financieras del Sur S.A.
(2)
|
-
|
-
|
-
|
0.5
|
0.6
|
|
Directors and
officers
(3)
|
0.2
|
0.2
|
0.2
|
0.3
|
0.5
|
|
ANSES
|
4.5
|
4.5
|
4.5
|
4.5
|
4.5
|
|
Total
|
68.1
|
68.1
|
69.0
|
70.8
|
71.1
|
(1)
Eduardo S. Elsztain is the beneficial owner of
154,557,259 common shares of Cresud, representing 30.8% of its
total share capital. Although Mr. Elsztain does not own a majority
of the common shares of Cresud, he is its largest shareholder and
exercises substantial influence over Cresud. If Mr. Elsztain is
considered to be the beneficial owner of Cresud due to his
substantial influence over it, he would be the beneficial owner of
63.4% of our common shares by virtue of his investment in
Cresud.
(2)
Eduardo S. Elsztain is the Chairman of the board
of directors of IFIS Limited, a corporation organized under the
laws of Bermuda and Inversiones Financieras del Sur S.A., a
corporation organized under the laws of Uruguay. Mr. Elsztain holds
(through companies controlled by him and proxies) a majority of the
voting power in IFIS Limited., which owns 100% of
IFISA.
(3)
Includes only direct ownership of our directors
and senior management.
216
Differences in Voting Rights
Our major shareholders do not have
different voting rights.
Arrangements for change in control
We are not aware of any arrangements
that may, when in force, result in a change in
control.
Securities held in the host country
As of June 30, 2017, our total
issued capital stock outstanding consisted of 578,676,460 common
shares. As of June 30, 2017, there were approximately 35,256,622
Global Depositary Shares (representing 352,566,220 of our common
shares, or 60.9% of all or our outstanding common shares) held in
the United States by approximately 76 registered
holders.
B. Related Party
Transactions
A related party transaction is any
transaction entered into directly or indirectly by us or any of our
subsidiaries that is material based on the value of the transaction
to (a) us or any director, officer or member of our management or
shareholders; (b) any entity in which any such person described in
clause (a) is interested; or (c) any person who is connected or
related to any such person described in clause (a).
Offices and
shopping malls spaces leases
We rent office space for our
executive offices located at the Intercontinental Plaza tower at
Moreno 877 in the Autonomous City of Buenos Aires, which IRSA CP
has owned since December 2014. We also rent space that IRSA CP owns
at the Abasto Shopping Mall.
The offices of Eduardo Sergio
Elsztain, the chairman of our board of directors and our
controlling shareholder are located at 108 Bolivar, in the City of
Buenos Aires. The property has been rented to a company controlled
by family members of Mr. Elsztain, and to a company controlled
by Fernando A. Elsztain, one of our directors, and members of his
family.
●
In addition, we, Cresud, Tarshop, BACS, BHN
Sociedad de Inversión S.A., BHN Seguros Generales S.A. and BHN
Visa S.A. rent offices owned by IRSA CP in different
buildings.
●
Furthermore, we also lease various spaces in
IRCP´s shopping malls (stores, stands, storage space or
advertising space) to third parties and related parties such as
Tarshop and Banco Hipotecario.
Lease agreements entered into with
associates have included similar provisions and amounts to those
included in agreements with third parties.
Agreement for the
exchange of corporate services with Cresud and IRSA CP
Considering that each of IRSA CP,
Cresud and us have operations that overlap to a certain extent, our
board of directors deemed it advisable to implement alternatives
designed to reduce certain fixed costs of our combined activities
and to mitigate their impact on our operating results while seizing
and optimizing the individual efficiencies of each of them in the
different areas comprising the management of
operations.
To such end, on June 30, 2004,
a Master Agreement for the Exchange of Corporate Services, or the
“Framework Agreement,” was entered into between IRSA
CP, Cresud and us, which was amended several times to bring it in
line with evolving operating requirements. The goal of the
amendment is to increase efficiency in the distribution of
corporate resources and reduce operating costs. The agreement had
an initial term of 24 months and is renewable automatically
for equal periods, unless it is terminated by any of the parties
upon prior notice.
217
The Framework Agreement currently
provides for the exchange and sharing of services among the
following areas: Human Resources, Finance, Institutional Relations,
Administration and Control, Insurance, Security, Agreements,
Technical Tasks, Infrastructure and Services, Procurement,
Architecture and Design, Development and Works, Real Estate,
Hotels, Board of Directors, Board of directors of Real Estate
Business, General Manager Office, Board Safety, Audit Committee,
Real Estate Business Management, Human Resources of Real Estate
Business, Fraud Prevention, Internal Audit and Agricultural
Investment Management.
Pursuant to the Framework Agreement,
we, IRSA CP and Cresud hired Deloitte & Co., an
external consulting firm, to review and evaluate semi-annually the
criteria used in the process of liquidating the corporate services,
as well as the basis for distribution and source documentation used
in the process indicated above, by means of a half-yearly
report.
The operations indicated above allow
both IRSA CP and Cresud to keep our strategic and commercial
decisions fully independent and confidential, with cost and profit
apportionment allocated on the basis of operating efficiency and
equity, without pursuing individual economic benefits for any of
the related companies.
Hospitality
services
We and our related parties hire, on
certain occasions, hotel services and lease conference rooms for
events held at, our subsidiaries, Nuevas Fronteras S.A., Hoteles
Argentinos S.A. and Llao Llao Resorts S.A., all on
arm’s-length terms and conditions.
Financial and
service operations
We work with several financial
entities in Argentina for operations including, but not limited to,
credit, investment, purchase and sale of securities and financial
derivatives. Such entities include Banco Hipotecario S.A. and
its subsidiaries. Furthermore, Banco Hipotecario and BACS. usually
act as underwriters in capital market transactions we
undertake.
Donations granted
to Fundación IRSA and Fundación Museo de los
Niños
Fundación IRSA is a non-profit
charity that seeks to support and generate initiatives concerning
education, the promotion of corporate social responsibility and the
entrepreneurial spirit of young adults. It carries out corporate
volunteer programs and fosters donations from our employees. The
main members of Fundación IRSA’s board of directors are:
Eduardo S. Elsztain (President); Saúl Zang (Vice President I);
Alejandro Elsztain (Vice President II); and Mariana C. de Elsztain
(Secretary). It finances its activities with donations from us,
IRSA CP, Cresud and other related companies.
On October 31, 1997, IRSA CP entered
into an agreement with Fundación IRSA whereby 3,800 square
meters of the developed area at Abasto Shopping was granted under a
gratuitous bailment agreement for a term of 30 years. Subsequently,
on October 29, 1999, Fundación IRSA assigned free of cost all
the rights of use over such store and its respective obligations to
Fundación Museo de los Niños. On November 29, 2005, IRSA
CP signed another agreement with Fundación Museo de los
Niños granting under gratuitous bailment 2,670 square meters
of the developed area at Alto Rosario shopping mall for a term of
30 years.
Fundación Museo de los
Niños has used these spaces to set up Abasto Shopping and
Museo de los Niños and Rosario, two interactive learning
centers intended for children and adults. Both agreements establish
the payment of common charges and direct expenses related to the
services performed by these stores must be borne by Fundación
Museo de los Niños.
Borrowings
In the normal course of our
activities, we enter into diverse loan agreements or credit
facilities between the related companies and/or other related
parties. These loans accrue interest at prevailing market
rates.
218
Line of credit granted to IRSA
On June 25, 2014, IRSA CP
increased to US$60.0 million an existing credit line that extended
to us that was due to expire on June 25, 2015, which was
priced at the one year LIBOR rate plus 3.0%. Under this credit
line, IRCP and any of their subsidiaries are lenders and we and/or
our subsidiaries (but excluding IRSA CP subsidiaries) were the
borrowers. In June 2015, the line of credit was renewed for an
additional year and, on July 5, 2016, the credit line was
increased to US$120.0 million, the interest rate was set at 9%
per annum and the maturity further extended to June 24, 2017.
This revolving credit facility expired on June 24, 2017. As of the
date of this annual report, we had cancelled all of our obligations
under this line of credit.
Purchase of
financial assets
We usually invest excess cash in
several instruments that may include those issued by related
companies, acquired at issuance or from unrelated third parties
through secondary market deals.
Investment in
mutual funds of BACS Administradora de Activos S.A.
S.G.F.C.I.
We invest from time to time our
liquid fund in mutual funds managed by BACS Administradora de
Activos S.A. S.G.F.C.I., which is a subsidiary of Banco
Hipotecario, among other entities.
Legal
services
We hire legal services from Estudio
Zang, Bergel & Viñes, in which Saúl Zang is a
partner. Mr. Zang is a member of our board of directors and
that of our related companies.
Cresud purchase
of agrochemicals from Adama
Adama is a company specialized in
agrochemicals, particularly used in farming, and is a worldwide
leader in active ingredients used in agricultural production.
Cresud, in the normal course of its business, acquires agrochemical
products and/or hires services from Adama. On July 17, 2016, DIC
reported that it had signed an agreement with ChemChina to sell 40%
of Adama Agricultural Solutions Ltd.’s shares, indirectly
controlled by IDBD through DIC.
Property
purchase—sale
In the ordinary course of business,
we may acquire from or sell to our related parties certain real
estate properties used for rental purposes or otherwise, subject to
our Audit Committee’s approval. The Audit Committee must
render an opinion as to whether the terms of these transactions can
reasonably be expected to have been obtained by us in a comparable
transaction in arm’s-length dealings with a non-related
party. In addition, if the Audit Committee so requires, valuation
reports by independent specialist third parties must be
obtained.
Investment Properties transferred to IRSA CP
On December 22, 2014, we transferred
to IRSA CP, 83,789 square meters of our premium office portfolio
including the buildings Edificio República, Bouchard 710,
Della Paolera 265, Intercontinental Plaza and Suipacha 652 and the
“Intercontinental II” plot of land in order to
consolidate assets for the main corporate purpose to develop and
operate commercial properties in Argentina. Based on third party
appraisals, the total purchase price of the transaction was
US$308.0 million, which was fully paid as of June 30,
2016.
On April 7, 2016, we sold to IRSA
CP, 16,012 square meters covering 14 floors and 142 garages in a
building to be developed in the area of “Catalinas,”
City of Buenos Aires. The price of the transaction was established
based on two components: a “determined” or fixed part
equal to Ps.455.7 million corresponding to the price of the
land acquired based on the number of square meters of the plot,
which has been fully paid, and a “determinable”
component, where we will transfer to IRSA CP the real cost per
square meter of the construction. Our Audit Committee had no
objections with respect to this transaction.
Investment in
Dolphin
As of the date of this annual
report, we have invested approximately US$544 million in
Dolphin, through our subsidiaries. Dolphin Fund Ltd, is an
investment fund incorporated under the laws of Bermuda, whose
investment manager is Consultores Venture Capital Uruguay S.A., a
company controlled indirectly by our Chairman, Eduardo S. Elsztain.
Dolphin is a subsidiary of Dolphin Fund Ltd, incorporated in the
Netherlands. Such investments were made in order to carry out the
investment in IDBD.
)
For more
information please see Item 4. Information on the Company –
A. History and development of the Company – “Investment
of IDB Development Corporation Ltd. (IDBD).
We agreed with Dolphin to not pay any fee to
Dolphin related to this
investment.
219
Loan between
Dolphin and IDBD
As described in note 4.H to the
Audited Consolidated Financial Statements, Dolphin had granted a
series of subordinated loans to IDBD (“the debt”). This
debt has the following characteristics: i) it is subordinated, even
in the case of insolvency, to all current or future debts of IDBD;
(ii) will be reimbursed after payment of all the debts to their
creditors; (iii) accrues interest at a rate of 0.5%, which will be
added to the amount of the debt and will be payable only on the
date the subordinated debt is amortized; (iv) Dolphin will not have
a right to participate or vote in the meetings with IDBD creditors
with respect to the subordinated debt; (v) as from January 1, 2016,
Dolphin has the right, at its own discretion, to convert the debt
balance into IDBD shares, at that time, whether wholly or
partially, including the interest accrued over the debt until that
date; (vi) should Dolphin opt to exercise the conversion, the debt
balance will be converted so that Dolphin will receive IDBD shares
according to a share price that will be 10% less than the average
price of the last 30 days prior to the date the conversion option
is exercised. In the event there is no market price per share, this
will be determined in accordance with an average of three
valuations made by external or independent experts, who shall be
determined it by mutual consent and, in the event of a lack of
consent, they will be set by the President of the Institute of
Certified Public Accountants in Israel.
Acquisition of DIC shares from
IDBD
On September 23, 2016, we acquired
from IDBD 8,888,888 shares of DIC for of NIS 99 million
(approximately US$26.7 million), equivalent to the 8.8% of its
shares outstanding.
Transactions with
IFISA
On
February 10, 2015, Dolphin, sold 71,388,470 IDBD shares to IFISA,
for an amount of US$25.6 million, US$4.0 million of which were paid
upon execution and the remaining balance of US$21.6 million were
financed for a term of up to 360 days and priced at Libor 1M (one
month) + 3%. On May 9, 2016, effective as of February 10, 2016, the
parties agreed to extend the expiration date for 30 days as from
execution of the addenda, to be automatically renewable every 30
days for a maximum term of 180 days, and increasing the rate to 9%
since February10, 2016. On November 22, 2016, effective as of
November 5, 2017, the parties agreed to extend the expiration date
for an additional period of 30 days to be automatically renewable
every 30 days for a maximum term of 180 days. Finally, on April 10,
2017, effective as of April 6, 2017, the parties agreed to fix the
expiration date in February 5, 2018. Additionally, the parties
undertook to capitalize the interest until April 6, 2017, therefore
the new amount as remaining balance shall be US$24.6 million amount
which shall accrued interest at a rate of 9% annual
basis.
On May
31, 2015, IRSA, through Dolphin, sold to IFISA 46 million of
warrants Series 4 for a total amount of NIS 0.46 million
(equivalent to US$ 0.12 million at the time of the transaction),
provided IFISA agreed to exercise them fully when Dolphin were so
required by IDBD.
On July
28, 2015, Dolphin granted a loan to IFISA for an amount of US$ 7.1
million, due in July 2016, which accrues interest at Libor 1M (one
month) + 3%. On May 9, the parties agreed to extend the expiration
date to June 8, 2016, to be automatically renewable every 30 days
for a maximum term of 180 days, and increased the rate to 9%. On
November 22, 2016, effective as of November 5, 2017, the parties
agreed to extend the expiration date until December 5, 2016 to be
automatically renewable every 30 days for a maximum term of 180
days. Additionally, IFISA create a first degree pledge over
12,915,000 IDBD’s shares in order to guarantee the payment of
the debt. Finally, on April 10, 2017, effective as of April 6,
2017, the parties agreed to fix the expiration date in February 5,
2018. Additionally, the parties undertook to capitalize the
interest until April 6, 2017, therefore the new amount as remaining
balance shall be US$7.9 million amount which shall accrued interest
at a rate of 9% annual basis.
On
October 9, 2015, IRSA, through its subsidiary Real Estate
Investment Group V LP, granted a loan in the amount of US$ 40
million to IFISA. The term of the loan is one year calculated from
the disbursement and will bear interest at a rate of 3% + Libor 1M,
to be determined monthly. On October 9, 2016, the parties agreed to
extend the expiration date to be automatically renewable every 30
days for a maximum term of 180 days and increase the rate to 9%. On
April 10, 2017, effective as of April 6, 2017, the parties agreed
to extend the expiration date until February 5, 2018. Additionally,
the parties undertook to capitalize the interest until April 6,
2016, therefore the new amount shall be US$43.1 million which shall
accrue interest at a rate of 9% annual basis.
In
February 2016, DN B.V., a subsidiary of Dolphin, entered into an
option contract with IFISA whereby Dolphin is granted the right,
but not the obligation to acquire 92,665,925 shares of IDBD held by
IFISA at a share price of NIS 1.64 plus an annual interest of 8.5%.
The exercise date for the option extends for two
years.
All
transactions are carried out at arm’s length.
220
Transfer of tax
credits
Sociedad Anónima Carnes
Pampeanas S.A. (a company controlled by Cresud) and Cresud,
assigned credits to IRSA CP and other related parties corresponding
to value added tax export refunds related to such companies’
business activity.
For further information regarding
related party transactions see Note 29 to our Audited
Financial Statements.
C. Interests of
Experts and Counsel
This section is not
applicable
A. Consolidated
Statements and Other Financial Information
See Item 18 for our Audited
Consolidated Financial Statements.
Legal or
Arbitration Proceedings
Legal Proceedings
Operations Center in
Argentina
Set forth below is a description of
certain material legal proceedings to which we are a party. We are
not engaged in any other material litigation or arbitration and no
other material litigation or claim is known to us to be pending or
threatened against us or our subsidiaries. Nevertheless, we may be
involved in other litigation from time to time in the ordinary
course of business.
Puerto
Retiro
On November 18, 1997, in connection
with our acquisition of our subsidiary Inversora Bol’var, we
indirectly acquired 35.2% of the capital stock of Puerto Retiro.
Inversora Bol’var had purchased such common shares of Puerto
Retiro from Redona Investments Ltd. N.V. in 1996. In 1999, we,
through Inversora Bol’var, increased our interest in Puerto
Retiro to 50.0% of its capital stock. On April 18, 2000, Puerto
Retiro was served notice of a filing made by the Argentine
government, through the Ministry of Defense, seeking to extend the
bankruptcy of Indarsa to the Company. Upon filing of the complaint,
the bankruptcy court issued an order restraining the ability of
Puerto Retiro to dispose of, in any manner, the real property it
had purchased in 1993 from Tandanor. Puerto Retiro appealed the
restraining order which was confirmed by the Court on December 14,
2000.
In 1991, Indarsa had purchased 90%
of Tandanor, a former government-owned company, which owned a piece
of land near Puerto Madero of approximately 8 hectares, divided
into two parcels: Planta 1 and 2. After the purchase of Tandanor by
Indarsa, in June 1993, Tandanor sold “Planta 1” to
Puerto Retiro, for a sum of US$18 million pursuant to a valuation
performed by J.L. Ramos, a well-known real estate brokerage firm in
Argentina. Indarsa failed to pay to the Argentine government the
price for its purchase of the stock of Tandanor, and as a result
the Ministry of Defense requested the bankruptcy of Indarsa. Since
the only asset of Indarsa was its holding in Tandanor, the
Argentine government is seeking to extend Indarsa’s
bankruptcy to other companies or individuals which, according to
its view, acted as a single economic group. In particular, the
Argentine government has requested the extension of Indarsa’s
bankruptcy to Puerto Retiro which acquired Planta 1 from
Tandanor.
221
The
deadline for producing evidence in relation to these legal
proceedings has expired. The parties have submitted their closing
arguments and are awaiting a final judgment. However, the judge has
delayed his decision until a final judgment in the criminal
proceedings against the former Defense Minister and former
directors of Indarsa has been delivered. It should be noticed,
regarding the abovementioned criminal procedure, that on February
23, 2011 it was resolved to declare its expiration, and to dismiss
certain defendants. However, this resolution is not final because
it was appealed. We cannot give you any assurance that we will
prevail in this proceeding, and if the plaintiff’s claim is
upheld by the courts, all of the assets of Puerto Retiro would
likely be used to pay Indarsa’s debts and our investment in
Puerto Retiro, would be lost. As of June 30, 2016, we had not
established any reserve with respect of this
contingency.
Tandanor has filed a civil action
against Puerto Retiro and the people charged in the referred
criminal case looking forward to be reimbursed from all the losses
which have arose upon the fraud committed. On March 7, 2015 Puerto
Retiro responded filing certain preliminary objections, such as
prescription or limitation, lack of information to respond the
lawsuit, lack of legitimacy (active and passive). On July 12, 2016
Puerto Retiro was legally notified of the decision adopted by the
Tribunal Oral Federal No. 5 related to the preliminary objections
above mentioned. Two of them were rejected –lack of
information and lack of legitimacy (passive). We filed an appeal
with regard to the rejection of these two objections. But, on the
other hand, the other two objections will be studied at the moment
of deliver the sentence, which is an important step in order to
obtain a favorable decision.
The appeal was rejected. As of the
date of this document, the file is on evidence stage.
Legal issues
with the City Hall of Neuquén
In June 2001, Shopping Neuquén
requested that the City of Neuquén allow it to transfer
certain parcels of land to third parties so that each participant
in the commercial development to be constructed would be able to
build on its own land. Neuquén’s Executive Branch
previously rejected this request under Executive Branch Decree No.
1437/2002 which also established the expiration of the rights
arising from Ordinance 5178 due to not building the shopping center
in time, including the loss of the land and of any improvement and
expenses incurred. As a result, Shopping Neuquén had no right
to claim indemnity charges and annulled its buy-sell land
contracts.
Shopping Neuquén submitted a
written appeal to this decision on January 21, 2003. It also sought
permission to submit a revised schedule of time terms for the
construction of the shopping center, taking into account the
economic situation at that time and including reasonable short and
medium term projections. Neuquén’s Executive Branch
rejected this request in their Executive Branch Decree 585/2003.
Consequently, on June 25, 2003, Shopping Neuquén filed an
“Administrative Procedural Action” with the High Court
of Neuquén requesting, among other things, the annulment of
Executive Branch Decrees 1,437/2002 and 585/2003 issued by the City
Executive Branch. On December 21, 2004, the High Court of
Neuquén communicated its decision that the administrative
procedural action that Shopping Neuquén had filed against the
City of Neuquén had expired. Shopping Neuquén filed an
extraordinary appeal for the case to be sent to the Argentine
Supreme Court.
On December 13, 2006, while the case
was under study in the Argentine Supreme Court, Shopping
Neuquén signed an agreement with both the City and the
Province of Neuquén that put an end to the lawsuit between
them and stipulated a new timetable for construction of the
commercial and housing enterprises (the “Agreement”).
Also, Shopping Neuquén was permitted to transfer certain
parcels to third parties so that each participant in the commercial
development to be constructed would be able to build on its own
land, with the exception of the land in which the shopping center
would be constructed. The Legislative Council of the City of
Neuquén duly ratified the Agreement. The City Executive Branch
promulgated the ordinance issued on February 12, 2007.
Shopping Neuquén came to an
agreement and paid all of the City’s lawyers, including
pending fees contested in court.
Shopping Neuquén finished the
construction and opened the shopping center in March, 2015,
obtaining also all necessary provincial and city authorizations for
it.
222
Arcos del
gourmet
IRSA CP has been named as a party in
a case titled “
Federación de Comercio e Industria de la
Ciudad de Buenos Aires y Otros c/ Gobierno de la Ciudad
Autónoma de Buenos Aires s/ Amparo
.” The
plaintiff filed a petition for injunctive relief against the local
government claiming that the Arcos del Gourmet project lacked the
necessary environmental approvals and did not meet zoning
requirements. On August 29, 2014, the lower court rendered a
decision dismissing the case. This resolution was appealed but
affirmed in December 2014. Therefore, on December 18, 2014,
the “Arcos” Project was opened to the public, and
currently is operating normally. Notwithstanding, the plaintiff
appeared before the Superior Court of the City of Buenos Aires to
request the review of the case based on constitutional matters
allegedly at issue. On July 4, 2017, the Court ordered the
Appeals court to review the case.
On May 18, 2015, we were
notified that the AABE, revoked the concession agreement granted to
IRSA CP’s subsidiary Arcos del Gourmet S.A., through
Resolution No. 170/2014. On June 2, 2015, IRSA CP filed
before the AABE a request to declare the notification void, as
certain formal proceedings required under Argentine law were not
complied with by the AABE. Furthermore, IRSA CP filed an
administrative appeal requesting the dismissal of the revocation of
the concession agreement and a lawsuit seeking to declare
Resolution No. 170/2014 void. IRSA CP also filed a lawsuit in
order to judicially pay the monthly rental fees of the property. As
of the date of this annual report, the “Distrito Arcos”
shopping mall continues to operate normally.
Other Litigation
As of July 5, 2006, the
Administración Federal de Ingresos Públicos
(“AFIP”) filed a preliminary injunction with the
Federal Court for Administrative Proceedings against IRSA CP for an
aggregate amount of Ps.3.7 million, plus an added amount,
provisionally estimated, of Ps.0.9 million for legal fees and
interest. The main dispute is about the income tax due for
admission rights. In the first instance, AFIP pleaded for a general
restraining order. On November 29, 2006, the Federal Court issued
an order substituting such restraining order for an attachment on
the parcel of land located in Caballito neighborhood, City of
Buenos Aires, where IRSA CP is planning to develop a shopping
center. As of June 30, 2011, under court proceedings, the building
was subject to a legal attachment for Ps.36.8 million. On December
12, 2012, the legal attachment was lifted and accredited in the
file concerned in February 2013.
After we sold the Edificio Costeros,
dique II, on November 20, 2009, we requested an opinion to the
Argentine Antitrust Authority as to whether it was necessary to
report this transaction. The Argentine Antitrust Authority advise
us that it was required to notify the transaction. We challenged
this decision, but it was confirmed. On December 5, 2011, we
notified the transaction and on April 30, 2013 the transaction was
approved by the Argentine Antitrust Authority by Resolution No 38,
as a result of that this legal proceeding was
concluded.
On January 15, 2007 we were notified
of two claims filed against us before the Argentine Antitrust
Authority, one by a private individual and the other one by the
licensee of the shopping center, both opposing the acquisition from
the province of Córdoba of a property known as Ex-Escuela
Gobernador Vicente de Olmos. On February 1, 2007 we responded the
claims. On June 26, 2007, the Argentine Antitrust Authority
notified us that it has initiated a summary proceeding to determine
whether the completion of the transaction breaches the Antitrust
Law. As of the date of this filing the result of this proceeding
has not been determined.
On December 3, 2009, IRSA CP filed a
request for the Argentine Antitrust Authority’s opinion
regarding IRSA CP’s acquisition of common shares of Arcos del
Gourmet S.A. The Argentine Antitrust Authority advised the parties
that the transaction had to be notified. On December, 2010 the
transaction was filed with the Argentine Antitrust Authority. As of
the date of this annual report, the decision of the Argentine
Antitrust Authority is still pending.
223
On April 11, 2011, Quality Invest
requested the Argentine Antitrust Authority opinion regarding
Quality Invest’s acquisition Property of a warehouse owned by
Nobleza Piccardo located in San Martín, Province of Buenos
Aires. The Argentine Antitrust Authority stated that there was an
obligation to notify the situation, but Quality Invest filed an
appeal against this decision. Subsequently, the Court of Appeals
confirmed the Argentine Antitrust Authorities’ decision
regarding the obligation to notify and, therefore, on February 23,
2012, the transaction was filed. As of the date of this annual
report, the Argentine Antitrust Authority is analyzing this
decision.
On August 23, 2011, IRSA CP notified
the Argentine Antitrust Authority the direct and indirect
acquisition of common shares of NPSF, the transaction involved the
direct acquisition of 33.33% of NPSF and 16.66% through our
controlled vehicle Torodur S.A. As of the date of this annual
report the transaction is being analyzed by the Argentine Antitrust
Authority.
On June 16, 2012, we sold to
Cabaña Don Francisco S.A. certain Costeros Dique IV’s
functional units, to be used for office space, and complementary
units to be used for parking. In addition, we assigned upon the
purchaser all rights and interests arising from lease agreements
involving the conveyed units. As a result, an advisory opinion was
requested from the Argentine Antitrust Authority as to the need to
report such transaction. The Argentine Antitrust Authority resolved
that the transaction was exempt from report on May 21, 2014, so
this legal process was finished.
On December 7, 2012, we
notified the Argentine Antitrust Authority of the acquisition of
50% of the common shares of EHSA, which owns 50% of the common
shares of La Rural, which operates a convention mall (
Predio Ferial de Palermo
);on July 25,
2017 the transaction was approved by the Argentine Antitrust
Authority. See “Item 3. Key Information—Risk
Factors—Risk Relating to Our Business—Our business is
subject to extensive regulation and additional regulations may be
imposed in the future.”
Through the issuance of Resolution
No. 16,521 dated February 17, 2011 the CNV commenced a summary
proceeding against the members of IRSA’s board of directors
and its supervisory committee members (all of them at that time,
including among others Eduardo S. Elsztain), alleging certain
formal errors in the Inventory and Balance Sheet Book, specifically
the failure by the Company to comply with certain formalities in
the presentation of a table included in the Memoria (annual
report); arising from an investigation carried out by the CNV in
October 2010. Applicable law requires that the corrections of any
errors in the annual reportinclude a legend identifying each error
and the way in which it was corrected, including insertion of the
holographic signature from the chairman of the board. In this case,
we first corrected the mistake and after the request from the CNV
included the legend and the holographic signature of the chairman,
required by the relevant formalities.
IRSA’s response to the
CNV’s allegations containing the arguments for the defense
was filed in March 2011 and the first hearing was held in May 2011.
In April, 2013, the CNV imposed (as a result of the aforementioned
alleged charge) a fine on the members of IRSA’s board of
directors and its supervisory committee members. The fine imposed
by the CNV amounts to Ps.270,000 equivalent to US$49,632 and it was
imposed against IRSA and the members of the board together. The
amount of the fine demonstrates the immaterial nature of the
alleged violations. Even though the fine was paid, in April 2013,
IRSA appealed such resolution, which is still ongoing in Court Room
No. IV of the National Chamber of Appeals in Federal Administrative
Procedures (Cámara Nacional de Apelaciones en lo Contencioso
Administrativo Federal).
For more information see
“Item. 3(d) Risk Factors—Risk related to our
Business—Our business is subject to extensive regulation and
additional regulations may be imposed in the
future.”
224
Class actions in
the United States
On May 9, 2016, a putative
shareholder class action was filed in the United States District
Court for the Eastern District of Pennsylvania against IRSA, Cresud
Cresud, Eduardo Sergio Elsztain, Alejandro Gustavo Elsztain,
Saúl Zang and Matías Iván Gaivironsky (collectively,
the “Defendants”). The complaint, as amended on
February 13, 2017, asserts violations of the federal securities
laws on behalf of persons that purchased or otherwise acquired IRSA
Global Depositary Receipts between February 11, 2015 and December
30, 2015, and alleges that defendants made materially false and
misleading statements and omissions relating to IRSA’s
investment in IDBD. More specifically, the complaint alleges that
IRSA’s disclosures during that time period misrepresented and
failed to disclose that (1) IDBD’s US$6.7 billion net debt
should have been consolidated in IRSA’s financial statements
and (2) as so consolidated, IRSA’s debt would violate the
covenants specified in IRSA’s Global Notes Indenture. A
similar class action complaint was filed against Cresud, Eduardo
Sergio Elsztain, Alejandro Gustavo Elsztain, Saúl Zang, and
Matías Iván Gaivironsky on April 29, 2016.
Both class actions were transferred
to the United States District Court for the Southern District of
New York on July 14, 2016, and were referred to Judge Vernon S.
Broderick on July 19, 2016.
On December 8, 2016, the Court
entered orders appointing Stefan Sachsenberg as lead plaintiff for
the putative class in the IRSA class action and John Tomka as lead
plaintiff for the putative class in the Cresud class action.
The Court appointed the Rosen Law Firm as lead counsel for
the putative classes in both actions.
On February 13, 2017, plaintiffs in
both actions filed amended complaints. On April 12, 2017, the
Court entered an order adopting a stipulation entered by the
parties to stay the class action against Cresud until the Court
rules on Defendants’ motion to dismiss the amended complaint
filed in the IRSA class action. On April 14, 2017, IRSA and
Cresud, as the only Defendants served with a summons and complaint,
filed a motion to dismiss the amended complaint in the IRSA class
action. Briefing on the motion to dismiss was completed July
7, 2017, and the Court has not yet ruled on the motion to dismiss
or scheduled oral argument.
Defendants believe that there is no
merit to the claims alleged and intend to vigorously defend these
actions. Nevertheless, no assurance can be given that we will be
successful in defending these claims.
Operations Center in
Israel
Litigation
against IDBD
In recent years there has been an
increasing trend of filing derivative and class action claims in
the area of corporate and securities laws in Israel. While taking
into account such issues and the financial position of IDBD and its
holding structure, claims in considerable amounts may be filed
against IDBD, including in connection with its financial position
and cash flows, with offerings that it makes, and transactions that
were carried out or not completed, including with regards to the
contentions and claims of the controlling shareholders that took
place in IDBD.
Arbitration
proceedings relating to the obtainment of control in
IDBD.
On May 7, 2014, Dolphin acquired
jointly with ETH (a non-related company established under the laws
of the State of Israel, which was presented to Dolphin as a company
controlled by Mordechay Ben Moshé), an aggregate number of
106.6 million common shares in IDBD, representing 53.30% of its
stock capital, under the scope of the debt restructuring
Arrangement of IDBH, IDBD’s parent company, with its
creditors.
Under the terms of the
Shareholders’ Agreement, Dolphin and ETH acquired each the
remaining 50% of the 106.6 million common shares. The initial total
investment amount was NIS 950 million, equivalent to approximately
US$272 million at the exchange rate prevailing on that
date.
On May 28, 2015, ETH offered Dolphin
to acquire Dolphin’s shares pursuant to the BMBY mechanism
provided in the Shareholders’ Agreement, which establishes
that each party of the Shareholders’ Agreement may offer to
the counterparty to acquire (or sell, as the case may be), the
shares it holds in IDBD at a fixed price. In addition, ETH further
added that the purchaser thereunder required to assume all
obligations of seller.
225
On June 10 and 11, 2015, Dolphin
gave notice to ETH of its intention to buy all the shares of IDBD
held by ETH.
After certain aspects of the offer
were resolved through an arbitration process brought by Dolphin and
ETH, on September 24, 2015, the competent arbitrator resolved that:
(i) Dolphin and IFISA (related company to the Company) were
entitled to act as buyers in the BMBY process, and ETH had to sell
all of the IDBD shares held by it (92,665,926 shares) at a price of
NIS 1.64 per share; (ii) The buyer had to fulfill all of the
commitments included in the Arrangement, including the commitment
to carry out Tender Offers; (iii) The buyer had to pledge in favor
of the Arrangement Trustees the shares that were previously pledged
in favor of the Arrangement Trustees by the seller.
On October 11, 2015, the BMBY
process concluded, and IFISA acquired all IDBD’s shares of
stock held by ETH. Consequently, the Shareholders’ Agreement
was terminated and members of IDBD’s Board of Directors
representing ETH submitted their irrevocable resignation to the
Board, therefore Dolphin was hence empowered to appoint the new
members to the Board. Additionally, on the same date, Dolphin
pledged additional shares as collateral to secure compliance with
the stock purchase agreement, thereby increasing the number of
pledged shares to 64,067,710.
In addition to the competent
arbitrator’s decision issued on September 24, 2015, ETH and
Dolphin still have counterclaims of different kinds which are
subject to such arbitration proceeding. As of the filing date of
this Annual Report, the proceeding is still being
heard.
Litigation
against Clal Insurance and its subsidiaries
This exposure is especially high in
the areas of long-term savings and long-term health insurance in
which Clal Insurance operates,
in view of the fact that in these
areas the policies were issued decades ago, while at present, after
significant changes in the regulatory environment and against the
background of developments in legal precedent and the Israeli
authority’s position, the same policies may be interpreted
differently, retrospectively, and may be subjected to different
interpretation standards than those that were customary at the time
that the policies were made. Moreover, in these areas the policies
are valid for dozens of years and, therefore, there is a risk that
in those cases in which a customer’s claim is accepted and a
new interpretation is given to the policy, the future profitability
of Clal Insurance in respect of the existing policy portfolio will
also be affected. This is in addition to the possible compensation
that could be given to the customers due to past
activity.
Alongside these aspects, during 2015
amendments were made to reflect a significant reform in the field
of approving an insurance program which allows the Israeli
authority, under certain conditions, to order the insurer to stop
introducing an insurance policy or to order an insurer to make a
change to an insurance policy, even with regard to policies that
have already been marketed by the insurer. It is not possible to
foresee to what extent insurers are exposed to claims in connection
with the provisions of the policy, the manner of implementing the
Israeli authority’s powers pursuant to the insurance policy
reform and its implications, which may be raised, by means of the
procedural mechanism provided in the Israeli Class Actions
Law.
There are claims that have been
recognized as class action suits, claims for which there are
pending motions to have them certified as class action suits, and
other claims which are immaterial. These claims include mainly
claims of improper actions, not in accordance with laws, licenses
or breaches of agreements with customers or performance of tort
damages toward customers (especially misleading a customer, or a
negligent misrepresentation), causing damage, either monetary or
non-monetary, to customers. A significant amount of these claims
also include claims of charging excessive premiums and payment of
lower than called for insurance compensation. In addition, there
are pending motions to have claims certified as derivative
actions.
226
Sale of shares of
Clal
On August 21, 2013, on the
background of concerns about the ability of the previous
controlling shareholders of IDBD (Dankner group) to meet the
requirements to have control over an insurance company, the
Commissioner required that IDBD transfer 51% of the shares in Clal
to Mr. Moshe Terry (“the Trustee”) and to grant the
Trustee an irrevocable power of attorney with regard to the voting
of such shares in Clal.
On November 27, 2013, and as part of
the debt arrangement In IDBH, the Commissioner set forth an outline
to enable the change of control in IDBD (as part of the debt
arrangement), whereby the Commissioner would not view such change
of control as being a breach of the Supervision of Financial
Services (Insurance) Law, 1981 (the “Insurance Law”),
subject to certain conditions, including terms whereby if until
December 31, 2014 a control permit for Clal Insurance will not be
obtained for the new controlling shareholders in IDBD, or, that an
agreement for the sale of the controlling stake in Clal Insurance
will not have been signed, then the Trustee will be authorized to
sell the Clal Insurance shares that the Trustee holds. Both groups
that had submitted proposals in the debt arrangement process
(including the Dolphin group) approved such
outline.
On December 30, 2014, the
Commissioner sent an additional letter setting a term by which
IDBD’s control over and equity interests in Clal were to be
sold and giving directions as to the Trustee’s continuity in
office, among other aspects. For more information, please see
“Legal Framework – Operations Center in Israel –
Reduced Centralization Act.”
On May 26, 2016 IDBD’s board
decided to commence a competitive process for the sale of a control
stake in Clal. Following such decision, on July 1, 2016 IDBD
entered into an agreement with JP Morgan to serve as an investment
bank on behalf of IDBD for the sale of a control stake in
Clal.
In addition, in June 2015, an
application for a Israeli court to approve the commencement of a
class action against IDBD, IDBD’s directors (some of which
are also our directors), Dolphin and C.A.A Extra Holdings Ltd. was
filed by individuals who argue that IDBD’s controlling
shareholders and board of directors acted in concert to frustrate
the sale of shares of Clal to JT Capital Fund. The applicants argue
that this caused them material damages as under the terms of the
debt restructuring of IDBD’s holding company, IDBH. with its
creditors, they would have been entitled to receive a larger
payment had the above mentioned sale been consummated. Furthermore,
they allege that the 2014 and 2015 rights offerings of IDBD
discriminated against the minority shareholders. On March 21,
2016, the respondents filed a motion to dismiss this class action
application. On June 2, 2016, the Court partially accepted this
motion, and ordered the applicants to file an amended class action
application that would include only the arguments and remedies with
respect to the said Clal transaction. On August 2, 2016, the
respondents filed a motion to appeal (regarding the decision not to
dismiss the arguments concerning the Clal transaction) and, on
August 14, 2016, the applicants filed an appeal (regarding the
decision to dismiss the arguments concerning the rights offering)
both before the Israeli Supreme Court. As of the date of this
annual report, the Supreme Court has decided that the motion to
appeal and the appeal will be heard jointly, and has ordered a stay
of the proceedings.
Litigation
against Cellcom and its subsidiaries
In the normal course of business,
claims have been filed against Cellcom by its customers. These are
mostly motions for approval of class actions, primarily concerning
allegations of illegal collection of funds, unlawful conduct or
breach of license, or a breach of agreements with customers,
causing monetary and non-monetary damage to them.
In addition, in the normal course of
business, claims have been filed against Cellcom in issues related
to the environment, including claims regarding non-ionizing
radiation from cellular handsets and claims in respect of sites
belonging to Cellcom. These are mostly motions for approval of
class actions, relating to allegations of unlawful conduct or
breach of license causing monetary and non-monetary damage
(including claims for future damages).
227
Litigation
against Adama and its subsidiaries
In the normal course of business,
Adama is involved in various legal claims involving environmental
claims for smell and noise hazards relating to its site.
claims
by employees,
subcontractors, suppliers, authorities and others which concern,
claims for breaches of provisions of the law regarding termination
of employment and obligatory payments to employees, claims for
breach of contract and patent infringement, and compulsory payments
to authorities.
Litigation
against Shufersal
In the normal course of business,
legal claims were filed against Shufersal by its customers. These
are mostly motions for certification of class actions, which mainly
concern claims of charging money unlawfully, acting contrary to the
law or a license, or a breach of the agreements with customers,
causing financial and non-financial loss to them.
In addition in the normal course of
business, legal claims were filed with the courts against Shufersal
by employees, subcontractors, suppliers, authorities and others,
which relate mainly to claims of breaches of the provisions of the
law in relation to the termination of workers’ employment and
compulsory payments to employees, claims of breaches of contract
and compulsory payments to authorities.
Dividend Policy
Pursuant to Argentine law, the
distribution and payment of dividends to shareholders is allowed
only if they result from realized and net profits of the company
pursuant to annual financial statements approved by our
shareholders. The approval, amount and payment of dividends are
subject to the approval by our shareholders at our annual ordinary
shareholders’ meeting. The approval of dividends requires the
affirmative vote of a majority of the shares entitled to vote at
the meeting.
In accordance with Argentine law and
our by-laws, net and realized profits for each fiscal year are
allocated as follows:
1.
5% to our legal reserve, up to 20% of our
capital stock;
2.
a certain amount determined at a
shareholders’ meeting is allocated to compensation of our
directors and the members of our Supervisory
Committee;
3.
to an optional reserve, a contingency reserve, a
new account or for whatever other purpose our shareholders may
determine.
According to rules issued by
Comisión Nacional de Valores, cash dividends must be paid to
shareholders within 30 days of the resolution approving their
distribution. In the case of stock dividends, the shares must be
delivered to shareholders within three months of the annual
ordinary shareholders’ meeting that approved
them.
Our dividend policy consists in the
distribution of an amount not to exceed the higher of a) twenty
percent (20%) of the sales, leases and services of “Offices
and Others” segment, as recorded in Segment reporting, as of
June 30 of each year, or b) 20% of Net income as recorded in the
Consolidated Statements of Income as of June 30 of each year. This
policy requires that we must at all times comply with the covenants
imposed by our financial obligations. Given the recent transfer of
office buildings to our subsidiary IRSA Commercial Properties, the
company is evaluating to make certain modifications to the policy
set forth.
The table below presents the
dividend payment ratio and the total amount of dividends paid for,
each paid entirely in common shares, for the mentioned years.
Figures in Pesos are stated in historical Pesos of their respective
payment date.
228
|
Year declared
|
Cash
dividends
|
Cash
dividends
(1)
|
Stock
dividends
(1)
|
Total per
common share
|
|
|
(in millions
of Ps.)
|
(Ps.)
|
(Ps.)
|
(Ps.)
|
|
1997
|
15.0
|
0.110
|
—
|
0.110
|
|
1998
|
13.0
|
0.060
|
0.05
|
0.110
|
|
1999
|
18.0
|
0.076
|
0.04
|
0.116
|
|
2000
|
—
|
—
|
0.20
|
0.204
|
|
2001-2008
|
—
|
—
|
—
|
—
|
|
2009
|
31.7
|
0.055
|
—
|
0.055
|
|
2010
|
120.0
|
0.207
|
—
|
0.207
|
|
2011
|
311.6
|
0.539
|
—
|
0.539
|
|
2012
|
99.0
|
0.171
|
—
|
0.171
|
|
2013
|
180.0
|
0.311
|
—
|
0.311
|
|
2014
|
306.6
|
0.532
|
—
|
0.532
|
|
2015
|
56.6
|
0.9869
|
—
|
0.9869
|
|
2016
|
—
|
—
|
—
|
—
|
|
2017
|
—
|
—
|
—
|
—
|
(1)
Corresponds to payments per common
share.
The table below presents the
dividend payment ratio to the total amount of dividends paid for by
our subsidiary IRSA CP, from which we collect dividends in our
capacity as shareholders, each fully paid, for the years indicated
in the table below.
|
Year declared
|
Cash
dividends
(1)
|
Stock
dividends
(1)
|
Total per
share
|
|
|
(Ps.)
|
(Ps.)
|
(Ps.)
(1)
|
|
2014
|
407,522,074
|
-
|
3.2339
|
|
2015
|
437,193,000
|
-
|
3.4694
|
|
2016
|
283,580,353
|
-
|
2.2504
|
|
2017
(2)
|
770,000,000
|
-
|
6.1104
|
(1)
On November 30, 2016, we changed the par
value of our common shares from Ps.0.10 to Ps.1.00 per share. The
aforementioned change was taken into account in the presentation of
the date in the table.
(2)
An interim dividend was paid on April 25,
2017.
B. Significant
Changes.
Shareholders
’
Meeting
Our 2017 annual meeting of shareholders has been called for October
31, 2017, in order to consider, among others:
●
Treatment and allocation of net income for the fiscal year ended
June 30, 2017;
●
Payment of a cash dividend
for up to Ps.1,400 million.
●
Consideration of appointment of regular and alternate directors due
to expiration of term;
●
Creation of a new Global
Note Program for the issuance of simple, non-convertible notes,
secured or not, or guaranteed by third parties, for a maximum
outstanding amount of up to US$350,000,000 (three hundred and fifty
million US dollars) (or its equivalent in any other currency)
pursuant to the provisions set forth in the Negotiable Obligations
Law No. 23,576, as amended and supplemented (the
“program”) due to the expiration of the program
currently in force.
229
●
Consideration of (i)
delegation to the board of directors of the broadest powers to
determine all the program’s terms and conditions not
expressly approved by the shareholders’ meeting as well as
the time, amount, term, placement method and further terms and
conditions of the various series and/or tranches of notes issued
thereunder; (ii) authorization for the board of directors to (a)
approve, execute, grant and/or deliver any agreement, contract,
document, instrument and/or security related to the creation of the
program and/or the issuance of the various series and/or tranches
of notes thereunder; (b) apply for and secure authorization by the
Argentine Securities Commission to carry out the public offering of
such notes; (c) as applicable, apply for and secure before any
authorized securities market of Argentina and/or abroad the
authorization for listing and trading such notes; and (d) carry out
any proceedings, actions, filings and/or applications related to
the creation of the program and/or the issuance of the various
series and/or tranches of notes under the program; and (iii)
authorization for the board of directors to sub-delegate the powers
and authorizations referred to in items (i) and (ii) above to one
or more of its members.
●
Treatment of amounts paid
as personal asset tax levied on the shareholders.
A. Offer and
Listing Details
The following summary provides
information concerning our share capital.
Stock Exchanges
in which our securities are listed
Our common shares are listed in the
ByMA and our GDSs in the NYSE.
The following description of the
material terms of our capital stock is subject to our certificate
of incorporation and bylaws, which are included as exhibits to this
Form 20-F, and the provisions of applicable Argentine
Law.
Price history of our stock in the ByMA and
NYSE
Our common shares are traded
in Argentina on the ByMA, under the trading symbol
“IRSA.” Since 1994, our GDSs, each presenting 10 common
shares, have been listed in the NYSE under the trading symbol
“IRS.” The Bank of New York Mellon is the depositary
with respect to the GDSs.
The table below shows the high
and low daily closing prices of our common shares in Pesos and the
quarterly trading volume of our common shares on the Buenos Aires
Stock Exchange for the first quarter of 2012 through October 25,
2017. The table also shows the high and low daily closing prices of
our GDSs in U.S. Dollars and the quarterly trading volume of our
GDSs on the NYSE. Each GDS represents ten common
shares.
230
|
|
ByMA
|
NYSE
|
||||
|
|
Share
|
Ps. per
Share
|
GDS
|
US$ per
GDS
|
||
|
|
Volume
|
High
|
Low
|
Volume
|
High
|
Low
|
|
Fiscal Year 2013
|
|
|
|
|
|
|
|
1st
Quarter
|
1,604,625
|
4.90
|
4.25
|
2,809,916
|
7.35
|
6.55
|
|
2nd
Quarter
|
1,311,872
|
5.65
|
4.40
|
2,584,636
|
8.10
|
6.88
|
|
3rd
Quarter
|
5,462,061
|
8.00
|
4.95
|
3,557,654
|
9.48
|
7.26
|
|
4th
Quarter
|
2,942,227
|
8.50
|
5.80
|
5,672,720
|
9.53
|
7.00
|
|
Annual
|
11,320,785
|
8.50
|
4.25
|
14,624,926
|
9.53
|
6.55
|
|
Fiscal Year 2014
|
|
|
|
|
|
|
|
1st
Quarter
|
2,330,230
|
8.15
|
5.60
|
3,003,517
|
8.92
|
7.28
|
|
2nd
Quarter
|
2,151,557
|
11.50
|
8.10
|
3,821,126
|
12.22
|
9.06
|
|
3rd
Quarter
|
1,059,532
|
12.00
|
10.45
|
1,469,214
|
12.06
|
9.41
|
|
4th
Quarter
|
1,040,356
|
18.45
|
10.70
|
4,515,032
|
17.73
|
10.71
|
|
Annual
|
6,581,675
|
18.45
|
5.60
|
12,808,889
|
17.73
|
7.28
|
|
Fiscal Year 2015
|
|
|
|
|
|
|
|
1st
Quarter
|
4,641,423
|
21.00
|
14.00
|
3,942,683
|
17.39
|
13.76
|
|
2nd
Quarter
|
597,858
|
21.00
|
16.90
|
4,186,746
|
17.72
|
12.90
|
|
3rd
Quarter
|
1,816,246
|
25.00
|
17.50
|
4,887,484
|
21.10
|
15.26
|
|
4th
Quarter
|
1,273,656
|
24.00
|
20,50
|
3,739,942
|
19.88
|
17.61
|
|
Annual
|
8,329,183
|
25.00
|
14.00
|
16,756,855
|
21.10
|
12.90
|
|
Fiscal Year 2016
|
|
|
|
|
|
|
|
1st
Quarter
|
2,217,315
|
24.50
|
18.50
|
3,058,409
|
18.54
|
13.92
|
|
2nd
Quarter
|
1,944,661
|
25.50
|
16.70
|
8,991,424
|
18.15
|
12.01
|
|
3rd
Quarter
|
3,195,317
|
21.90
|
11.60
|
6,577,472
|
14.96
|
8.60
|
|
4th
Quarter
|
2,075,033
|
25.10
|
19.10
|
4,803,840
|
16.81
|
14.03
|
|
Annual
|
9,432,326
|
25.50
|
11.60
|
23,431,145
|
18.54
|
8.60
|
|
Fiscal Year 2017
|
|
|
|
|
|
|
|
1st
Quarter
|
4,880,744
|
29.80
|
24.00
|
4,387,317
|
19.49
|
16.58
|
|
2nd
Quarter
|
5,132,615
|
31.00
|
25.85
|
4,931,113
|
20.14
|
17.06
|
|
3rd
Quarter
|
3,791,351
|
38.90
|
29.35
|
3,124,159
|
24.87
|
19.00
|
|
4th
Quarter
|
2,915,572
|
40.80
|
37.00
|
2,538,946
|
26.15
|
23.35
|
|
Annual
|
16,720,282
|
40.80
|
24.00
|
14,981,535
|
26.15
|
16.58
|
|
Fiscal Year 2018
|
|
|
|
|
|
|
|
July,
2017
|
844,783
|
41.95
|
38.05
|
1,043,473
|
24.74
|
22.17
|
|
August,
2017
|
840,595
|
44.00
|
38.50
|
1,068,225
|
25.50
|
22.00
|
|
September,
2017
|
2,387,666
|
43.70
|
41.90
|
836,098
|
25.05
|
23.95
|
|
As of October 25,
2017
|
2,677,224
|
50.55
|
42.50
|
1,767,609
|
28.95
|
24.25
|
Source:
Bloomberg
B. Plan of
Distribution
This section is not
applicable.
C.
Markets
Argentine
Securities Markets
In December 2012, the Argentine
government enacted the new Capital Markets Law, which sets out the
rules governing capital markets, its participants, and the rules by
which securities traded therein are subject to regulation and
monitoring by the CNV. On September 5, 2013, the CNV enacted
the CNV Rules that regulate the enforcement of the Capital Markets
Law for issuers of securities, with regard to initial public
offerings and reporting obligations.
231
Substantially all provisions of
Decree No. 677/2011, were incorporated into the Capital
Markets Law and the CNV Rules. The Capital Markets Law sets forth
the following key goals and principles:
●
Promoting the participation of small investors,
employee unions, industry groups and trade associations,
professional associations and all public savings entities in the
capital markets, promoting mechanisms designed to promote domestic
savings and channel such funds toward the development of
production;
●
Strengthening mechanisms to prevent abuses and
protect small investors;
●
Promoting access to the capital market by small
and medium-sized companies;
●
Using state-of-the-art technology to foster
creation of an integrated capital market through mechanisms
designed to achieve interconnection of computer systems among
trading markets; and
●
Encouraging simpler trading procedures available
to users to increase liquidity and competitiveness to develop
favorable conditions for transaction execution.
The CNV is a self-administered
agency of the Argentine Government with jurisdiction covering the
territory of Argentina, governed by the provisions of the Capital
Markets Law, and the CNV Rules among other related statutory
regulations. The relationship of the CNV and the Argentine
Executive branch is maintained through the
Ministerio de Finanzas
(Ministry of
Finance), which hears any appeals filed against decisions made by
the CNV, notwithstanding any other legal actions and remedies
contemplated in the Capital Markets Law.
The CNV supervises and regulates the
authorized markets in which the securities and the collective
investment products are traded, the corporations authorized in the
public offer regime, and all the other players authorized to
operate in the public offer regime, as the registered agents, the
trading agents, the financial advisors, the underwriters and
distributors, the brokers, the settlement and clearing agents, the
managers of collective investment products, the custodians of
collective investment products, the collective depositories, and
the risk rating agencies, among others. Argentine institutional
investors and insurance companies are regulated by separate
government agencies, whereas financial institutions are regulated
mainly by the Central Bank.
Before offering securities to the
public in Argentina, an issuer must meet certain requirements
established by the CNV with regard to its assets, operating history
and management. Only securities offerings approved by the CNV may
be listed on a stock exchange. However, CNV approval does not imply
certification as to the quality of the securities or the solvency
of the issuer issuers of listed securities are required to file
unaudited quarterly financial statements and audited annual
financial statements prepared in accordance with IFRS, as issued by
the IASB (excluding financial institutions under the supervision of
the Central Bank, insurance companies under the supervision of the
Insurance Superintendence and medium and small enterprises) and
various other periodic reports with the CNV and the stock exchange
on which their securities are listed. In addition, issuers must
report to the CNV and the relevant stock exchange any event related
to the issuer and its shareholders that may affect materially the
value of the securities traded.
In Argentina, debt and equity
securities traded on an exchange must, unless otherwise instructed
by their shareholders, be deposited with a Central Securities
Depository based in Argentina. Currently the only depositary
authorized to act in accordance with the Capital Markets Law and
CNV Rules is Caja de Valores S.A., a corporation owned by ByMA
which provides central depositary facilities, as well as acting as
a clearinghouse for securities trading and as a transfer and paying
agent for securities transactions.
Before the enactment of the Capital
Markets Law and the CNV Rules there were 12 stock exchanges in
Argentina, which were located in the City of Buenos Aires,
Bah’a Blanca, Chaco, Corrientes, Córdoba, La Plata,
La Rioja, Mendoza, Rosario, Salta, Santa Fe, and Tucumán. Six
of these exchanges (City of Buenos Aires, Rosario, Córdoba, La
Rioja, Mendoza, and Santa Fe) had affiliated stock markets in
accordance with the requirements of Law No. 17,811 which was
derogated by the Capital Markets Law.
232
Pursuant to the Capital Markets Law,
the CNV has authorized six stock markets since September 2014,
namely: Mercado Abierto Electrónico S.A., or
“MAE,” Mercado a Término de Buenos
Aires S.A., Mercado a Término de Rosario S.A.,
Mercado de Valores de Córdoba S.A., Mercado Argentino de
Valores S.A. and the Merval.
In December 2016, the CNV authorized
a new stock exchange, the ByMA. As the product of a federal
alliance of stock exchanges to foster the growth of the Argentine
capital markets, ByMA established itself as the single access point
to the Argentine market, lowering legal costs, and improving
connectivity and access to market information. This new stock
exchange is a spin-off of Merval and its shareholders are the
Buenos Aires Stock Exchange and Merval’s shareholders
ByMA’s shares will be publicly traded in
Argentina.
Historically, the Merval was the
principal stock market in Argentina. Securities including stocks,
corporate bonds, convertible bonds, close-ended investment funds,
financial trust, indexes, derivatives and public bonds, could all
be listed on the Merval. The Merval was authorized to admit,
suspend and delist securities based on its governing rules approved
by the CNV.
Another relevant stock exchange is
the MAE, an electronic platform that processes over-the-counter
transactions, involving government securities and corporate bonds
traded through spot and forward contracts. MAE broker-dealers
include national banks, provincial banks, municipal banks, private
national banks, foreign banks, cooperative banks, financial
institutions, foreign exchange entities and pure brokers/dealers
(exclusively engaged in brokerage activities). Both Argentine and
foreign capital banks and financial institutions may be eligible
broker-dealers on the MAE. In order to be eligible for trading,
securities must be registered with the pertinent supervising
authorities and may be traded on the MAE, on other exchanges or on
both of them concurrently.
Argentina’s equity markets
have historically been composed of individual investors, though in
recent years there has been an increase in the level of investment
by banks and insurance companies in these markets. However,
Argentine mutual funds (
fondos
comunes de inversión
) continue to have very low
participation.
Information
regarding the ByMA
(1)
|
|
As of
June 30,
|
|
|
|
2017
|
2016
|
|
Market
capitalization (in billions of Ps.)
|
5,557
|
3,625
|
|
Average daily
trading volume (2) (in millions of Ps.)
|
452
|
310
|
|
Number of listed
companies
|
101
|
100
|
(1)
Reflects Merval historical data.
(2)
During the month of June.
Although companies may list all of
their capital stock on the ByMA, in many cases a controlling block
is retained by the listed company’s shareholders, resulting
in a relatively small percentage of many companies’ stock
being available for active trading by the public.
As of June 30, 2017,
approximately 101 companies had equity securities listed on,
or being transitioned to, the ByMA. The Argentine securities
markets generally have substantially more volatility than
securities markets in the United States and certain developed
countries. The Merval index experienced a 15.9% increase in 2012,
an 88.9% increase in 2013, a 59.1% increase in 2014, a 36.1%
increase in 2015, a 44.9% increase in 2016, and a 29.3% increase
for the six months of 2017. In order to avoid major fluctuations in
securities prices, the ByMA operates a system pursuant to which the
negotiation of a particular security is suspended for 15 minutes
when the price of the security registers a variation between 10%
and 15% and between 15% and 20%, during any trading session. Any
additional 5% variation in the price of the security results in
additional 10 minutes successive suspension
periods.
233
The NYSE
Our Global Depositary Shares are
listed on the NYSE under the trading symbol
“IRS.”
D. Selling
Shareholders
This item is not
applicable.
E. Dilution
This item is not
applicable.
F. Expenses of
the Issue
This item is not
applicable.
A. Share
Capital
This item is not
applicable.
B. Memorandum and
Articles of Association
Our corporate
purpose
Our legal name is IRSA Inversiones y
Representaciones Sociedad Anónima. We were incorporated under
the laws of Argentina on April 30, 1943 as a
sociedad anónima
(stock
corporation) and were registered with the Public Registry of
Commerce of the City of Buenos Aires (
Inspección General de Justicia
or
“IGJ”) on June 23, 1943 under number 284, on page 291,
book 46 of volume A. Pursuant to our by-laws, our term of duration
expires on April 5, 2043.
Pursuant to article 4 of our by-laws
our purpose is to perform the following activities:
●
Invest, develop and operate real estate
developments;
●
Invest, develop and operate personal property,
including securities;
●
Construct and operate works, services and public
property;
●
Agency activities;
●
Manage real or personal property, whether owned
by us or by third parties;
●
Build, recycle, or repair real property whether
owned by us or by third parties;
●
Advise third parties with respect to the
aforementioned activities;
●
Finance projects, undertakings, works and/or
real estate transactions of third parties;
●
Finance, create, develop and operate projects
related to Internet.
Board of Directors
Voting on proposals in which directors have material
interest
●
shall not be allowed to make use of any
corporate assets or confidential information for his/her own
private purposes;
●
shall not be allowed to profit or permit a third
party to profit, whether by an action or an omission to act, from
any business opportunities available to the company;
●
shall be required to exercise any powers
conferred to them solely for the purposes for which they were
conferred under the law or the corporate bylaws or by a
shareholders’ meeting or the board of directors;
●
shall be required to meticulously ensure that no
conflict of interest, whether direct or indirect, shall under any
circumstances arise between his/her actions and the company’s
interests.
In case of doubt as to a
director’s compliance with his/her duty of loyalty, the
burden of proof shall be borne by such person.
234
The Argentine Corporations Law
establishes in Section 271 that directors may enter into agreements
with the company, that concern the business in which the company
engages, always provided that they are entered into under market
conditions. The agreements that do not fulfill the requirements
mentioned above may only be executed with the prior approval of the
board of directors.
Furthermore, the Capital Markets Law
(as defined below) in Section 72 states for companies authorized in
the public offer regime, that any acts performed or contracts
executed between the company and a related party and involving a
significant amount shall be performed or executed pursuant to the
procedure set forth below:
a) A “related party”
shall mean any of the following persons with respect to the
issuer:
i.
Directors, members of the supervisory body or
surveillance committee, as well as chief executive officers or
special managers of the issuing company appointed under section 270
of Argentine Corporation Law;
ii.
Natural persons or legal entities controlling or
holding a substantial interest, as determined by the CNV, in the
capital stock of the issuer or the issuer’s controlling
entity;
iii.
Any other company under the common control of
the same controlling entity;
iv.
The ascendants, descendants, spouses or siblings
of any of the natural persons referred to in paragraphs i) and ii)
above;
v.
Companies in which any of the persons referred
to in paragraphs i) to iv) above hold a significant direct or
indirect interest. Provided none of the circumstances described
above is present, a subsidiary of the issuer shall not be deemed a
“related party.”
b) A “significant
amount” shall be deemed involved in an act or contract when
such amount exceeds 1% of the company’s shareholders’
equity as shown in the most recently approved balance
sheet.
The board of directors or any
members thereof shall request the audit committee to state whether
in its opinion the terms of a transaction may be reasonably deemed
adapted to regular and usual market conditions. The audit committee
shall issue its pronouncement within 5 business days.
Notwithstanding the above inquiry
from the audit committee, a resolution may be adopted by the
company on the basis of a report from 2 independent evaluation
companies, which shall express their opinion on the same matter and
other terms of the transaction.
Nevertheless that, Section 272 of
the Argentine Corporations Law provides that when a director has an
opposite interest to the one of the company, he or she should
notify that situation to the board of directors and the supervisory
committee and abstain to vote in that respect. The violation of
this provision results in the director being jointly and severally
unlimitedly liable.
Approval of
compensation of the members of the Board of Directors, Senior
Management and Supervisory Committee
Our bylaws do not establish the
compensation to be paid to members of the board of directors and
the supervisory committee, and therefore pursuant to Section 261 of
the Argentine Corporations Law No.19,550, it should be approved by
the shareholders. The maximum amount that may be paid as
compensation to members of the board of directors and the
supervisory committee should not exceed 25% of the realized and net
earnings of the company and 5% when there is no distribution of
dividends. If the company does not distribute the total earnings,
the amount of the compensation should be proportional to that
distribution and within the mentioned limits. These limits may only
be surpassed by express approval of the
shareholders.
Powers of directors
Our bylaws establish, in Section 18,
that the board of directors has full and broad powers to organize,
manage and direct us to fulfilling the corporate
purpose.
235
Retirement of directors
Our bylaws do not establish any
requirements or provisions regarding age limits for
director’s retirement, nor do they require a number of common
shares a director must own to qualify for the
position.
Meetings of the Board of Directors
Through the shareholders’
meeting held on October 31, 2012, the by-laws were amended to
incorporate the possibility of holding meetings at a distance. To
these effects, the Board of Directors shall adopt its resolutions
by a majority vote of those present whose count shall include the
directors present through the simultaneous means of simultaneous
transmission of sound or image and sound or to be created in the
future and according to the current legislation. In case of a tie,
the President, or whoever replaces him, has the right to double
vote.
Rights,
preferences and restrictions attaching to the common
shares
Dividend
rights
The Corporations Law establishes
that the distribution and payment of dividends to shareholders is
valid only if they result from realized and net earnings of the
company pursuant to an annual financial statements approved by the
shareholders. The approval, amount and payment of dividends is
subject to the approval of our annual ordinary shareholders meeting
of the company. That approval requires the affirmative vote of the
majority of the present votes with right to vote at the
meeting.
Pursuant to the Corporations Law and
Section 28 of our bylaws, liquid and realized profits of each
fiscal year shall be distributed as follows:
●
allocate 5% of such net profits to legal
reserve, until the amount of such reserve equals 20% of the capital
stock;
●
the sum established by the shareholders’
meeting as remuneration of the of Directors and the supervisory
committee;
●
dividends, additional dividends to preferred
shares if any, or to optional reserve funds or contingency reserves
or to a new account, or for whatever purpose the
shareholders’ meeting determines.
Dividends are paid
pro rata
according to the interests
held by shareholders within thirty days after approval and the
right to collection expires upon the expiration of a term of three
years since they were made available to shareholders.
The shareholders’ meeting may
authorize payment of dividends on a quarterly basis provided no
applicable regulations are violated. In that case, all and each of
the members of the Board of Directors and the supervisory committee
will be jointly and severally liable for the refund of those
dividends if, as of the end of the respective fiscal year, the
realized and net earnings of the company are not sufficient to
allow the payment of dividends.
Voting rights and staggered elections
Our stock capital is composed by
book-entry common shares with face value of Ps.1 per share and
entitled to one vote each. All directors and alternate directors
are elected for a three-year term.
Our by laws consider staggered
elections
by which the
members of the Board of Directors are elected by thirds each year
with a term of office of three years each member.
Rights to share in IRSA’s profits
The holders of our common shares
have the right to participate in our net and realized profits on a
pro rata
basis of their
respective interests.
236
Pursuant to the Corporations Law and
Section 29 of our bylaws, liquidated and realized profits of each
fiscal year shall be distributed as follows:
●
allocate 5% of such net profits to legal
reserve, until the amount of such reserve equals 20% of our capital
stock;
●
the sum established by the shareholders’
meeting as remuneration of the board of Directors and the
supervisory committee; and
●
dividends, additional dividends to preferred
shares if any, or to optional reserve funds or contingency reserves
or to a new account, or for whatever purpose the shareholders
determine at the shareholders’ meeting.
Rights to share in any surplus in the event of
liquidation
In the event of liquidation,
dissolution or winding-up of our company, our assets
are:
●
to be applied to satisfy our liabilities;
and
●
to be proportionally distributed among holders
of preferred stock in accordance with the terms of the preferred
stock, if any. If any surplus remains, our shareholders are
entitled to receive and share proportionally in all net assets
available for distribution to our shareholders, subject to the
order of preference established by our by-laws.
Provisions related to a shareholder’s ownership of certain
amount of common shares
Section 9 of our by-laws provides
that the acquisition by any person or group, directly or indirectly
of our common shares, convertible securities, rights to receive any
of those securities that may grant that person the control of our
company or 35% or more of our capital stock may only be done by
complying with certain tender offer rules for all of our common
shares, except for:
●
acquisitions by persons holding or controlling
common shares or convertible securities in accordance to Decree No.
677/2001, supersede by Law No. 26,831, notwithstanding the
provisions of the Comisión Nacional de Valores ;
and
●
holdings
of more than 35%, which derive from the distribution of common
shares or dividends paid in shares approved by the shareholders, or
the issuance of common shares as a result of a merger approved by
the shareholders; in both cases, the excess holding shall be
disposed of within 180 days of its registration in the relevant
shareholder’s account, or prior to the holding of our
shareholders meeting, whatever occurs first.
Our shareholders modified the first
of the above exceptions in their shareholder meeting on October 10,
2007, to include the control concept under the Transparency Decree,
which provides for the effective control regularly held in addition
to the legal control.
Directors, senior managers,
executive officers, members of the supervisory committee, and
controlling shareholders of an Argentine company whose securities
are publicly listed, should notify the
CNV on a monthly basis, of their
beneficial ownership of common shares, debt securities, and call
and put options related to securities of such companies and their
controlling, controlled or affiliated companies.
In addition, the CNV must be
immediately notified of transactions which cause a person’s
holdings of capital stock of an Argentine company whose securities
are publicly listed to hold 5% or more of the voting power and of
every change in the holdings of such person that represents a
multiple of 5% of the voting power. Holders of more than 50% of the
common shares of a company or who otherwise have voting control of
a company, as well as directors, officers and members of the
supervisory committee, must provide the CNV with annual reports
setting forth their holdings in the capital stock of such companies
and monthly reports of any change in their holdings.
237
Procedure to
change the rights of stockholders
The rights of holders of stock are
established in the Argentine Corporations Law and in the bylaws.
The rights of shareholders provided for by the Argentine
Corporations Law may not be diminished by the bylaws. Section 235
of the Argentine Corporations Law establishes that the amendment of
the bylaws should be approved by the absolute majority of our
shareholders at an extraordinary shareholders meeting.
Ordinary and
extraordinary shareholders’ meetings
Our by-laws provide that
shareholders’ meetings may be called by our board of
directors or by our Supervisory Committee or at the request of the
holders of common shares representing no less than 5% of the common
shares. Any meetings called at the request of shareholders must be
held within 30 days after the request is made. Any shareholder may
appoint any person as its duly authorized representative at a
shareholders meeting, by granting a proxy. Co-owners of common
shares must have single representation.
In general, the following matters
can be considered only at a special shareholders’ meeting
(
asamblea
extraordinaria
):
●
matters that may not be approved at an ordinary
shareholders’ meeting;
●
the amendment of our by-laws;
●
reductions in our share capital;
●
redemption, reimbursement and amortization of
our shares;
●
mergers, and other corporate changes, including
dissolution and winding-up;
●
limitations or suspensions to preemptive rights
to the subscription of the new shares; and
●
issuance
of debentures, convertible negotiable obligations and bonds that
not qualify as notes (obligaciones negociables).
In addition, pursuant to the Capital
Markets Law, at an ordinary shareholders’ meeting, our
shareholders must consider (i) the disposition of, or creation of
any lien over, our assets as long as such decision has not been
performed under the ordinary course of business; (ii) the execution
of administration or management agreements; and (iii) whether to
approve the payment of any agreement providing assets or services
to us as long as such payment is material when measured against the
volume of the ordinary course of business and our
shareholders’ equity.
In accordance with our by-laws,
ordinary and special shareholders’ meetings (
asamblea extraordinaria
) are subject to
a first and second quorum call, the second to occur upon the
failure of the first. The first and second notice of ordinary
shareholders’ meetings may be made simultaneously. In the
event that both are made on the same day, the second must occur at
least one hour after the first. If simultaneous notice was not
given, the second notice must be given within 30 days after the
failure to reach quorum at the first. Such notices must be given in
compliance with applicable regulations.
A quorum for an ordinary
shareholders’ meeting on the first call requires the presence
of a number of shareholders holding a majority of the common shares
entitled to vote and, on the second call, the quorum consists of
the number of shareholders present, whatever that number. Decisions
at ordinary shareholders’ meetings must be approved by a
majority of the votes validly exercised by the
shareholders.
A quorum for a special
shareholders’ meeting (
asamblea extraordinaria
) on the first
call requires the presence of persons holding 60% of the shares
entitled to vote and, on the second call, the quorum consists of
the number of shareholders present, whatever that number. Decisions
at special shareholders’ meeting (
asamblea extraordinaria
) generally must
be approved by a majority of the votes validly
exercised.
However, pursuant to the Argentine
Corporations Law, all shareholders’ meetings, whether
convened on a first or second quorum call, require the affirmative
vote of the majority of shares with right to vote in order to
approve the following decisions:
238
●
advanced winding-up of the company;
●
transfer of the domicile of the company outside
of Argentina;
●
fundamental change in the purpose of the
company; total or partial mandatory repayment by the shareholders
of the paid-in capital; and
●
a merger
or a spin-off, when our company will not be the surviving
company.
Holders of common shares are
entitled to one vote per share. Owners of common shares represented
by GDRs exercise their voting rights through the GDR Depositary,
who acts upon instructions received from such shareholders and, in
the absence of instructions, votes in accordance with the
instructions given to the GDR Depositary by the board of directors
as set forth in a written notice delivered to the GDR Depositary
prior to the meeting.
The holders of preferred stock are
not entitled to voting rights. However, in the event that no
dividends are paid to such holders for their preferred stock, the
holders of preferred stock are entitled to voting rights. Holders
of preferred stock are also entitled to vote on certain special
matters, such as a transformation of the corporate type, early
dissolution, change to a foreign domicile, fundamental change in
the corporate purposes, total or partial replacement of capital
losses, mergers in which our company is not the surviving entity,
and spin-offs. The same exemption will apply in the event the
preferred stock is traded on any stock exchange and such trading is
suspended or canceled.
Limitations to
own securities by non-resident or foreign shareholders
There are no legal limitations on
ownership of securities or exercise of voting rights, by
non-resident or foreign shareholders. However, foreign shareholders
must fulfill certain requirements with the IGJ in order to assure
that they will be able to properly exercise their voting rights.
General Resolution No. 7 passed in July 2015 by the IGJ with
effects as of November 2015, and other related regulations set
forth certain requirements for foreign entities registered with the
IGJ. It provides, among other requirements, disclosure of
information related to their proprietary interests in assets
located outside Argentinato be at least equivalent in value to
those located inside Argentina. The entities must comply with these
requirements in order to (1) perform activities on a regular basis
through their Argentine branches (Section 118 Argentine Corporate
Law), or (2) exercise their ownership rights in Argentine Companies
(Section 123 Argentine Corporate Law). In cases where the IGJ has
concluded that the entities (a) do not have assets outside
Argentina; or (b) have non-current assets that are not materially
significant compared to those non-current assets which are owned by
them and located in Argentina; or (c) the entity’s address in
Argentina becomes the place where this entity makes a majority of
its decisions, corporate or otherwise, the entities may be required
to amend and register their by-laws to comply with Argentine law,
thereby becoming an Argentine entity subject to Argentine law
according to Section 124 of Argentine Corporation Law. In addition,
Argentine companies with shareholders consisting of such
entitiesthat fail to comply with these requirements may be subject
to the following sanctions: the IGJ may not register corporate
decisions adopted by the Argentine Company when its off-shore
shareholder votes as a shareholder. Any decisions made pursuant to
such vote related to the approval of its annual balance sheet may
be declared null and void for administrative purposes.
Ownership
threshold above which ownership should be disclosed
CNV Rules require that transactions,
which cause a person’s holdings of capital stock of a
registered Argentine company, to equal or exceed 5% of the voting
power, should be immediately notified to the
CNV. Thereafter, every change in
the holdings that represents a multiple of 5% of the voting power
should also be notified.
Directors, senior managers,
executive officers, members of the supervisory committee, and
controlling shareholders of an Argentine company whose securities
are publicly offered, should notify the CNV on a monthly basis, of
their beneficial ownership of common shares, debt securities, and
call and put options related to securities of such companies and
their controlling, controlled or affiliated companies.
239
Furthermore, the CNV must be
immediately notified of transactions which cause a person’s
holdings of capital stock of an Argentine company whose securities
are publicly offered to equal or exceed 5% of the voting power and
every change in the holdings that represents a multiple of 5% of
the voting power. Holders of more than 50% of the common shares or
who otherwise control decision making in shareholders’
meetings, as well as directors, officers and members of the
supervisory committee must provide the CNV with annual reports of
their holdings in the capital stock of such companies and monthly
reports of any change in their holdings.
Amendment to the
by-laws
On the shareholders’ meeting
held on October 25, 2007, our shareholders decided to amend the
following sections of the by-laws: (i) Section Twelve in order to
adapt the performance bonds granted by directors to current rules
and regulations, and (ii) Section Fifteen in order to incorporate
the possibility of holding remote board meetings pursuant to the
provisions of section 65 of Decree 677/01. Such amendment is
attached hereto as Exhibit 1.2.
On October 31, 2012, the annual
shareholders meeting passed an amendment to the corporate by-laws
which allowed the Board of Directors to celebrate their meetings
using teleconference technology. An absolute majority of the
directors will constitute the quorum. Only the directors physically
present at the time and those using teleconference technologies
will be taken into consideration for the quorum. The resolutions of
the Board of Directors will be passed by the vote of the majority
present at the meeting. Such amendment is attached hereto of
Exhibit 1.3 to this annual report.
On November 14, 2014, the
shareholder’s meeting decided to amend the following sections
of the by-laws: (i) Section First in order to comply with the
Capital Markets Law No. 26,831, and (ii) Section Twenty-Four in
order to incorporate the regulation of the shareholders’
meeting held with shareholders present or communicated through
teleconference technologies.
The Section First was approved in
the shareholder’s meeting in October 31, 2014 and the Section
Twenty-Four was approved in the shareholder’s meeting in
October 31, 2016. Such amendment is attached hereto of Exhibit 1.4
to this annual report.
C. Material
Contracts
We do not have any material contract
entered into outside the ordinary course of business other than
some of the operations previously described under the sections
Related Party Transactions, Recent Developments, and Our
Indebtedness.
D. Exchange
Controls
Foreign Currency Regulation
Under Decree No.260/2002, the
Argentine government had set up an exchange market through which
all foreign currency exchange transactions are made. Such
transactions were subject to the regulations and requirements
imposed by the Argentine Central Bank. Under Communication
“A” 3471, as amended, the Central Bank established
certain restrictions and requirements applicable to foreign
currency exchange transactions.
Under Communication “A”
6037, dated August 8
th
, 2016, and
Communication “A” 6150, of the Argentine Central Bank,
no further authorization is required for residents and
non-residents to have access to local exchange market and there is
no amount or matter that limits the access thereto.
Outflow and
Inflow of Capital
Inflow of capital
Under Argentine Foreign Investment
Law No. 21,382, as amended, and the wording restated under
Executive Branch Decree No. 1853/1993, the purchase of stock of an
Argentine company by an individual or legal entity domiciled abroad
or by an Argentine “foreign capital” company (as
defined under the Foreign Investment Law) represents a foreign
investment.
240
Pursuant to Resolution E 1/2017 of
the Ministerio de Hacienda and the Communication “A”
6150 of the Argentine Central Bank, it was deleted the obligation
that required non-residents to perform portfolio investments in the
country intended for the holding of private sector financial assets
to maintain for a period of 120 days of permanence the funds in the
country.
As of that resolution and the
provisions of Communication “A” 6244 of the Argentine
Central Bank, there are no restrictions on entry and exit in the
MULC.
Obligation for the
settlement of funds through the MULC.
General rules.
Exports.
Pursuant to Executive Decree No.
1606/2011 and Communications “A” 3602 and
“A” 3493 of the Central Bank any foreign currency
derived from foreign trade must be settled through the
MULC.
Within 365 running days as of the
date of the disbursement of the funds abroad, corresponding to the
payment of exportation of goods, advance payments of exports and
pre financing loans for exports, such funds must be settled through
the MULC. Such funds shall be credited in a local bank account duly
opened in favor of the client, which may be either in Pesos or in
another currency.
Services
Communication “A” 5264
set forth that the payments in foreign currency received by
residents for the export of services and payment of losses for
insurance policies hired with nonresidents under the applicable
rules must be settled through the MULC within 365 running days as
of its collection abroad or locally or its deposit in foreign bank
accounts.
Such funds are exempted to be
settled through the MULC to the extent such exemption is actually
contemplated in the foreign exchange regulations and such amounts
are applied for the cancellation of foreign financial
indebtedness.
Outflow of capital, including the availability of cash or cash
equivalents
Exchange
Transactions Inquiry Program
Communication “A” 5850,
of December 2015, revoke Communication “A” 5245 that
regulated an Exchange Transaction Inquiry Program established on
October 28, 2011, by the Federal Administration of Public Revenues
(
Administración Federal de
Ingresos Públicos
, or “AFIP”) through which
the entities authorized by the Central Bank to deal in foreign
exchange were supposed to inquire and register through an IT system
the total Peso amount of each exchange transaction at the moment it
is closed.
Financial
Indebtedness
Pursuant to Resolution E 1/2017 of
the Ministerio de Hacienda and the Communication “A”
6150 of the Argentine Central Bank, it was deleted the obligation
that required non-residents to perform portfolio investments in the
country intended for the holding of private sector financial assets
to maintain for a period of 120 days of permanence the funds in the
country.
As of that resolution and the
provisions of Communication “A” 6244 of the Argentine
Central Bank, there are no restrictions on entry and exit in the
MULC.
Formation of
off-shore assets by residents with and without subsequent
allocation to specific purposes
Under Communication “A”
5850, 5899, 6037, 6058, 6137 and 6244 and its amended of the
Central Bank, residents shall have access to the local exchange
market without prior authorization of the Central Bank in order to
purchase foreign currency for the formation of off-shore
assets.
Outflow of funds for
payment to non-residents
According to Communication
“A” 5264, amended by Communication “A” 5377
(issued on December 14, 2012) and Communication “A”
6037,
6058, 6137 and 6244
and its amended of the Central Bank, there are no limits or
restrictions applicable for residents who access the foreign
exchange market to pay services, debts and profits to
non-residents.
241
The access to the MULC requires the
filing of certain documentation by residents demonstrating the
validity of transactions in which the funds are purchased for its
remittance abroad.
Payment of
services
As it was mentioned above, there is
no restriction applicable for payments to be made to non-residents
for performed services. The regulation covers all types of services
without making any specifications. The financial entity shall
require the filing of documentation supporting the authenticity of
the transaction, the service rendered by the non-resident to the
resident and the amount to be transferred abroad.
Should performed services are not
related to the activities actually developed by the resident; the
financial entity shall require a copy of the contract by which the
payment obligation arises from and an auditor report. Such
requirements intend to demonstrate the actual rendering of services
to the non-resident and the existence of the debt.
Payment of rents
(interest, profits and dividends)
As of January 8, 2003, Communication
“A” 3859, item 3, allowed Argentine companies to
transfer abroad profits and dividends related to closed financial
statements certified by independent accountants without being
required to obtain the prior authorization of the Central Bank.
Such Communication was replaced by Communication “A”
5264, amended by Communication “A” 5377 and
Communication “A” 6037, 6058, 6137 and 6244 and its
amended of the Central Bank.
The payments of profits and
dividends to non-residents or ADR’s is authorized, insofar
such payments are made according to financial statements duly
closed, audited and approved by shareholders’
meeting.
Payment of
foreign financial indebtedness
Access to the exchange market is
allowed for payments of principal amounts due.
In general terms, access to MULC for
payment of principal, interest and prepayment of financial
indebtedness incurred by Argentine residents in the private
non-financial sector and financial sector are allowed subject to
regulations set forth by Communications “A” 6037 of
August 8
th
, 2016.
Pursuant to Resolution E 1/2017 of
the Ministerio de Hacienda and the Communication “A”
6150 of the Argentine Central Bank, it was deleted the obligation
that required non-residents to perform portfolio investments in the
country intended for the holding of private sector financial assets
to maintain for a period of 120 days of permanence the funds in the
country.
As of that resolution and the
provisions of Communication “A” 6244 of the Central
Bank, there are no restrictions on entry and exit in the
MULC.
Direct Investment Reporting System
Direct
Investments made in Argentina by nonresidents
Under Communication “A”
4237, the Central Bank established a reporting system in connection
with direct investments and real estate investments made by
nonresidents in Argentina and by residents abroad.
Nonresidents must comply every
semester with the above mentioned reporting system if the amount of
the investment in Argentina reaches or exceeds U.S. 500,000. If
such amount is not reached, the reporting system is
optional.
In this regard, on December 17,
2015, Communication “A” 5850 issued by the Central Bank
restored the possibility of nonresidents to repatriate their
investment capital and through Communications “A” 6037
and “A” 6244 of the Central Bankl of dates August 8,
2016 and May 19, 2017, respectively, were defined the new
regulations that apply to the acquisition of foreign currency and
the elimination of all other restrictions that prevent residents
and nonresidents from accessing the market of changes.
242
Direct
investments made outside Argentina by Argentine
residents
Argentine residents are required to
meet the reporting system set forth in Communication
“A” 4237 every year if the value of their investments
abroad reaches or exceeds US$1.0 million and its under US$5.0
million, and every semester if it reaches or exceeds US$5.0
million. If the value of such investments abroad does not reach
US$1.0 million, compliance with the reporting system is
optional.
Sales of foreign
exchange to nonresidents
Access to local exchange market
shall be given as well to non residents for them to transfer to
their own foreign accounts the payments collected in the country.
Specific documentation that backs up the cause of the payment may
be required by the Central Bank.
For further details of the totality
of the exchange and controlling restrictions applicable in
Argentina, investors is suggested to read the Communication
“A” 6037, Communication “A” 6058,
Communication “A” 6137 and the Communication
“A” 6244 and its modifications of the Argentina Central
Bank, and Decree No. 616/2005 with its regulations and
complementary and / or modifying rules, to which the interested
parties may consult the same on the website of the Ministerio de
Hacienda (www.minhacienda.gob.ar) and the Ministerio de Finanzas
(www.minfinanzas.gob.ar), or the Argentine Central Bank
(http://www.bcra.gob.ar).
Money
Laundering
Argentine Law No. 25,246, as amended
by Laws Nos.26,118, 26,268, 26,683 and 27,270, categorizes money
laundering as a crime, which is defined as the exchange, transfer,
management, sale or any other use of money or other assets obtained
through a crime, by a person who did not take part in such original
crime, with the potential result that such original assets (or new
assets resulting from such original assets) have the appearance of
having been obtained through legitimate means. In spite of the fact
that there is a specific amount for the money laundering category
(Ps.300,000), the crimes committed for a lower amount are also
punished, but the prison sentence is reduced.
After the enactment of Law No.
26,683, money laundering was included in the Penal Code as an
independent crime against economic and financial order and it was
split from the title “Concealment” as originally
disposed. Therefore, money laundering is a crime which may be
prosecuted independently.
The money laundering law created the
Financial Information Unit (UIF). UIF is in charge of the analysis,
treatment and transmission of information to prevent and impede the
money laundering originating from, among others:
a) Crimes related to the traffic and
illegal commercialization of drugs (Law No.
23,737)
b) Crimes related to arms traffic
(Law No. 22,415);
c) Crimes related to illegal
association of terrorist association
d) Crimes committed by illegal
associations organized to commit crimes for political or racial
purposes;
e) Crimes against Public
Administration
f) Crimes of minor’s
prostitution and child pornography, and
g) Crimes related to terrorism
financing
The UIF analyzes the information
received by entities that have the obligation to report suspicious
activities or operations and, as the case may be, inform the Public
Ministry to carry out the investigations that may be considered
relevant or necessary.
243
The money laundering legal framework
in Argentina also assigns information and control duties to certain
private sector entities, such as banks, agents, non-profits
organizations, stock exchanges, insurance companies, according to
the regulations of the Financial Information Unit, and for
financial entities, the Central Bank. These regulations apply to
many Argentine companies, including us. These obligations consist
mainly of: (i) maintaining internal policies and procedures aimed
at money laundering prevention and financing of terrorism,
especially through the application of the policy “know your
client”; (ii) reporting any suspicious activity or operation
and (iii) acting according the Money Laundering Law with respect to
the confidentiality of the information obtained from the clients.
For that purpose, each entity involved must appoint an officer
responsible for the monitoring and control under the Money
Laundering Law.
On May 8, 2009, and in its capacity
as obliged subject under the rules enacted by UIF, the CNV issued
Resolution No. 554 which incorporated within the exchange market
many provisions aimed at comply with money laundering prevention
pursuant to Law No. 25,246, as amended. In that regard, such
resolution established that any entity subject to the supervision
of CNV could only take part in securities transactions if they were
ordered by parties that were registered or domiciled in
jurisdictions not included in the list of tax havens detailed in
Decree No. 1344/98. Furthermore, the Resolution provided that
securities transactions made by parties registered or domiciled in
jurisdictions that are not included in such list, but that act as
intermediaries of securities’ markets under the supervision
of an agency similar to the CNV, were allowed only if such agency
has signed a memorandum of mutual understanding with the
CNV.
On February 2, 2012, Resolution No.
554 was replaced by Resolution No. 602 so as to adapt and
complement the instructions issued by UIF applying to the entities
under the supervision of CNV, including some payment modalities and
control proceedings for the reception and deliver of funds to the
clients, fixing amounts and instruments to be used. Moreover, such
resolution updated the reference to the Decree which referred to
tax havens (No. 1,037).
As part of a more comprehensive
modification of the rules that govern the scope of supervision of
CNV, derive from the enactment of the Capital Markets Law and the
CNV Rules, which stablished a new regime for the public offer of
securities, CNV issued a new re-arranged text of its rules. Through
the CNV Rules, the CNV incorporates a new chapter of Money
Laundering and Terrorist Financing including dispositions related
to the fulfillment of duties to be complied by “
Agentes de Negociación,
”
“
Agentes de Liquidación
y Compensación,
” “
Agentes de Distribución y
Colocación
” and “
Agentes de Administración de Productos de
Inversión Colectiva,
” considered as obliged
subject under the terms of sections 4, 5 and 22 of article 20 of
Law No. 25,246. Such agents are obliged to comply with any
provision arising from Law No. 25,246 and its amendments,
regulations enacted by UIF, including decrees of National Executive
Power with reference to the decisions adopted by the United Nations
Security Council, in the fight against terrorism and to comply with
the resolutions issued by the Ministry of Foreign Affairs,
International Trade and Religion. Furthermore, “
Agentes de Custodia de Productos de
Inversión Colectiva (Sociedades Depositarias de Fondos Comunes
de Inversión”); “Agentes de corretaje,”
“Agentes de depósito colectivo
” and listed
companies with respect to contribution, irrevocable contributions
or indebtedness made by a shareholder or a third person to become a
shareholder in the future, are also reached by the
resolution.
Those subjects must send by internet
(through the online application of CNV) their tax identification
number. Additionally, in case of companies, it must be informed the
personal data of the “Compliance Officer” (both regular
and alternate).
The CNV Rules provide that the
subjects under their jurisdiction, may only take action to
transactions in the scope of public offering of securities,
stipulated, future or optional contracts of any nature and other
instruments and financial products when made or directed by
registered, domiciled or domestic subjects or those who reside in
dominions, jurisdictions, territories or associated states that
appear included in the list of cooperating countries provided in
article 2º, subsection b) of Decree No. 589/2013.
When those subjects are not included
in the referred list and, in their origin jurisdictions, are only
registered intermediates of an entity subject to control and
supervision of a body who fulfills similar duties such as the CNV,
the transactions shall only have effect provided that the body in
their origin jurisdiction has signed a memorandum of understanding,
cooperation and exchange of information with the CNV.
244
With the purpose of strengthen the
requirements in order to grant the authorization to operate in the
exchange market, some new requisites were established in connection
with: (i) competence and capacity; (ii) moral integrity and honesty
and (iii) solvency. Such requisites are subject to the appraisal of
CNV and must be fulfilled by managers, directors, auditors and any
other individual who perform duties or activities within the
company.
Pursuant to Decree 360/2016 dated
February 16, 2016, the Argentine government created the
“National Coordination Program for Combating Money Laundering
and Terrorist Financing” within the purview of the Ministry
of Justice and Human Rights. Its purpose is to rearrange,
coordinate and strengthen the anti-money laundering and
anti-terrorist financing system at national level, in light of the
actual risks that could impact the Argentine territory and the
global requirements to be met under the scope of the obligations
and international recommendations of the United Nations and FATF
standards.
Moreover, Law No. 27.260, which
introduced certain tax modifications and a new regime for residents
to disclose undeclared assets, established that the UIF would now
be within the purview of the Ministry of Economy and
Finances.
Nowaydays, as a
result of the reorganization of said ministry, the UIF depends on
the Ministry of Finance. For its part, the UIF recently issued
Resolution No. 4/2017, which requires certain specific due
diligence procedures (commonly called “know your
client”) to be performed when a national or foreign depositor
opens a bank account for the purpose of investment.
Some other measures are set forth
related to listed companies or their shareholders or beneficial
owners who had been convicted or condemned in connection with money
laundering and/or terrorist financing activities or appeared in the
list published by the United Nation Security Council.
E.
Taxation
United States
Taxation
The following summary describes the
material United States federal income tax consequences of the
ownership of common shares and GDSs as of the date hereof. The
discussion set forth below is applicable to U.S. Holders (as
defined below). Except where noted, this discussion deals only with
U.S. Holders that hold the common shares or GDSs as capital assets.
This summary does not represent a detailed description of the
United States federal income tax consequences applicable to you if
you are subject to special treatment under the United States
federal income tax laws, including if you are:
●
a bank;
●
a dealer in securities or
currencies;
●
a financial institution;
●
a regulated investment company;
●
a real estate investment trust;
●
an insurance company;
●
a tax-exempt organization;
●
a person holding the common shares or GDSs as
part of a hedging, integrated or conversion transaction,
constructive sale or straddle;
●
a trader in securities that has elected the
mark-to-market method of accounting for your
securities;
●
a person liable for alternative minimum
tax;
●
a person who owns or is deemed to own 10% or
more of the voting stock of our company;
●
a partnership or other pass–through entity
for United States federal income tax purposes; or
●
a person whose “functional currency”
is not the U.S. Dollar.
245
Furthermore, the discussion below is
based upon the provisions of the Internal Revenue Code of 1986, as
amended (the “Code”), and regulations, rulings and
judicial decisions thereunder as of the date hereof, and such
authorities may be repealed, revoked or modified so as to result in
United States federal income tax consequences different from those
discussed below. This summary does not contain a detailed
description of all the United States federal income tax
consequences to you in light of your particularcircumstances and
does not address the Medicare tax on net investment income, or the
effects of any state, local or non-United States tax laws. In
addition, this summary is based, in part, upon representations made
by the GDS depositary to us and assumes that the deposit agreement
governing the GDSs, and all other related agreements, will be
performed in accordance with their terms.
As used herein, the term “U.S.
Holder” means a beneficial owner of common shares or GDSs
that is for United States federal income tax purposes:
●
an individual citizen or resident of the United
States;
●
a corporation created or organized in or under
the laws of the United States, any state thereof or the District of
Columbia;
●
an estate the income of which is subject to
United States federal income taxation regardless of its source;
or
●
a trust if it (1) is subject to the primary
supervision of a court within the United States and one or more
United States persons have the authority to control all substantial
decisions of the trust or (2) has a valid election in effect under
applicable United States Treasury regulations to be treated as a
United States person.
If a partnership holds common shares
or GDSs, the tax treatment of a partner will generally depend on
the status of the partner and the activities of the partnership. If
you are a partner of a partnership holding common shares or GDSs,
you should consult your tax advisors.
IF YOU ARE
CONSIDERING THE PURCHASE, OWNERSHIP OR DISPOSITION OF COMMON SHARES
OR GDSS YOU SHOULD CONSULT YOUR OWN TAX ADVISOR CONCERNING THE
UNITED STATES FEDERAL INCOME TAX CONSEQUENCES TO YOU AS WELL AS ANY
CONSEQUENCES ARISING UNDER THE LAWS OF ANY OTHER TAXING
JURISDICTION.
GDSs
If you hold GDSs, for United States
federal income tax purposes, you generally will be treated as the
owner of the underlying common shares that are represented by such
GDSs. Accordingly, deposits or withdrawals of common shares for
GDSs by U.S. Holders will not be subject to United States federal
income tax.
Distributions on Common Shares or GDSs
Subject to the discussion under
“—Passive Foreign Investment Company” below, the
gross amount of distributions on our common shares or GDSs
(including amounts withheld to reflect Argentine withholding taxes,
if any) will be taxable as dividends to the extent paid out of our
current or accumulated earnings and profits, as determined under
United States federal income tax principles. Such dividends will be
includable in your gross income as ordinary income on the day
actually or constructively received by you, in the case of our
common shares, or by the GDS depositary, in the case of our GDSs.
Such dividends will not be eligible for the dividends received
deduction allowed to corporations.
With respect to United States
non-corporate investors, certain dividends received from a
qualified foreign corporation may be subject to reduced rates of
taxation. A foreign corporation is treated as a qualified foreign
corporation with respect to dividends received from that
corporation on common shares (or GDSs representing such common
shares) that are readily tradable on an established securities
market in the United States. United States Treasury Department
guidance indicates that our GDSs (which are listed on the NYSE),
but not our common shares, are readily tradable on an established
securities market in the United States.
246
Thus, we do not believe that
dividends that we pay on our common shares that are not represented
by GDSs currently meet the conditions required for these reduced
tax rates. Non-corporate holders that do not meet a minimum holding
period requirement during which they are not protected from the
risk of loss or that elect to treat the dividend income as
“investment income” pursuant to Section 163(d)(4) of
the Code will not be eligible for the reduced rates of taxation
regardless of our status as a qualified foreign corporation. In
addition, the rate reduction will not apply to dividends if the
recipient of a dividend is obligated to make related payments with
respect to positions in substantially similar or related property.
This disallowance applies even if the minimum holding period has
been met. Non-corporate U.S. Holders should consult their own tax
advisors regarding the application of these rules given their
particular circumstances.
The amount of any dividend paid in
Pesos will equal the U.S. Dollar value of the Pesos received
calculated by reference to the exchange rate in effect on the date
the dividend is actually or constructively received by you, in the
case of our common shares, or by the GDS depositary, in the case of
our GDSs, regardless of whether the Pesos are converted into U.S.
Dollars. If the Pesos received as a dividend are not converted into
U.S. Dollars on the date of receipt, you will have a tax basis in
the Pesos equal to their U.S. Dollar value on the date of receipt.
Any gain or loss realized on a subsequent conversion or other
disposition of the Pesos will be treated as United States source
ordinary income or loss.
Subject to certain complex
conditions and limitations, Argentine withholding taxes on
dividends, if any, may be treated as foreign taxes eligible for
credit against your United States federal income tax liability. For
purposes of calculating the foreign tax credit, dividends paid on
our common shares or GDSs will be treated as income from sources
outside the United States and will generally constitute passive
category income. If you do not elect to claim a credit for any
foreign taxes paid during a taxable year, you may instead claim a
deduction in respect of such foreign taxes. Further, in certain
circumstances, if you have held our common shares or GDSs for less
than a specified minimum period during which you are not protected
from risk of loss, or are obligated to make payments related to the
dividends, you will not be allowed a foreign tax credit for foreign
taxes imposed on dividends paid on our common shares or GDSs. The
rules governing the foreign tax credit are complex. You are urged
to consult your tax advisors regarding the availability of the
foreign tax credit under your particular
circumstances.
To the extent that the amount of any
distribution (including amounts withheld to reflect Argentine
withholding taxes, if any) exceeds our current and accumulated
earnings and profits for a taxable year, as determined under United
States federal income tax principles, the distribution will first
be treated as a tax-free return of capital, causing a reduction in
the adjusted basis of our common shares or GDSs, and thereafter as
capital gain recognized on a sale or exchange (as discussed below
under “—Taxation of Capital Gains”). However, we
do not expect to keep earnings and profits in accordance with
United States federal income tax principles. Therefore, you should
expect that a distribution will generally be treated as a dividend
(as discussed above).
Distributions of our common shares
that are received as part of a pro rata distribution to all of our
shareholders generally will not be subject to United States federal
income taxes.
Passive Foreign Investment Company
Based on the current and projected
composition of our income and the valuation of our assets,
including goodwill, we do not believe we were a passive foreign
investment company (“PFIC”) for United States federal
income tax purposes for the taxable year ending June 30, 2017, and
we do not currently expect to become a PFIC, although there can be
no assurance in this regard. The determination of whether we are a
PFIC is made annually. Accordingly, it is possible that we may be a
PFIC in the current or any future taxable year due to changes in
our asset or income composition or if our projections are not
accurate. The volatility and instability of Argentina’s
economic and financial system may substantially affect the
composition of our income and assets and the accuracy of our
projections. In addition, this determination is based on the
interpretation of certain U.S. Treasury regulations relating to
rental income, which regulations are potentially subject to
differing interpretation.
247
In general, we will be a PFIC for
any taxable year in which:
●
at least 75% of our gross income is passive
income; or
●
at least 50% of the value (determined based on a
quarterly average) of our assets is attributable to assets that
produce or are held for the production of passive
income.
For this purpose, cash is a passive
asset and passive income generally includes dividends, interest,
royalties, and rents (other than royalties and rents derived in the
active conduct of a trade or business and not derived from a
related person). If we own at least 25% by value of the stock of
another corporation, we will be treated, for purposes of the PFIC
tests, as owning our proportionate share of that other
corporation’s assets and receiving our proportionate share of
its income. If we are a PFIC for any taxable year during which you
hold our common shares or GDSs, unless you make the mark-to-market
election discussed below, you will be subject to special tax rules
discussed below.
If we are a PFIC for any taxable
year during which you hold our common shares or GDSs, you will be
subject to special tax rules with respect to any “excess
distributions” received and any gain realized from a sale or
other disposition, including a pledge, of such common shares or
GDSs. Distributions received in a taxable year that are greater
than 125% of the average annual distributions received during the
shorter of the three preceding taxable years or your holding period
for the common shares or GDSs will be treated as excess
distributions. Under these special tax rules:
●
the excess distribution or gain will be
allocated ratably over your holding period for the common shares or
GDSs;
●
the amount allocated to the current taxable
year, and any taxable year prior to the first taxable year in which
we become a PFIC, will be treated as ordinary income;
and
●
the amount allocated to each other year will be
subject to tax at the highest tax rate in effect for that year and
the interest charge generally applicable to underpayments of tax
will be imposed on the resulting tax attributable to each such
year.
If we are a PFIC for any taxable
year during which you hold our common shares or GDSs and any of our
non- United States subsidiaries is also a PFIC, you would be
treated as owning a proportionate amount (by value) of the common
shares of the lower tier PFIC for purposes of the application of
these rules. You are urged to consult your tax advisors about the
application of the PFIC rules to any of our
subsidiaries.
In addition, non-corporate U.S.
Holders will not be eligible for reduced rates of taxation on any
dividends received from us, if we are a PFIC in the taxable year in
which such dividends are paid or in the preceding taxable year. You
will generally be required to file Internal Revenue Service Form
8621 if you hold our common shares or GDSs in any year in which we
are classified as a PFIC.
In certain circumstances, in lieu of
being subject to the excess distribution rules discussed above, you
may make an election to include gain on the stock of a PFIC as
ordinary income under a mark-to-market method, provided that such
stock is regularly traded on a qualified exchange. Under current
law, the mark-to-market election is only available for stock traded
on certain designated United States exchanges and foreign exchanges
which meet certain trading, listing, financial disclosure and other
requirements to be treated as a qualified exchange under applicable
United States Treasury regulations. Our common shares are listed on
the Buenos Aires Stock Exchange, which must meet the trading,
listing, financial disclosure and other requirements under
applicable United States Treasury regulations for purposes of the
mark-to-market election, and no assurance can be given that the
common shares are or will be “regularly traded” for
purposes of the mark-to-market election. Our GDSs are currently
listed on the NYSE, which constitutes a qualified exchange under
the United States Treasury regulations, although there can be no
assurance that the GDSs are or will be “regularly
traded.”
If you make an effective
mark-to-market election, you will include in ordinary income each
year that we are a PFIC the excess of the fair market value of our
common shares or GDSs at the end of the year over your adjusted tax
basis in our common shares or GDSs. You will be entitled to deduct
as an ordinary loss in each such year the excess of your adjusted
tax basis in our common shares or GDSs over their fair market value
at the end of the year, but only to the extent of the net amount
previously included in income as a result of the mark-to-market
election. Any gain or loss on the sale of the common shares or GDSs
will be ordinary income or loss, except that such loss will be
ordinary loss only to the extent of the previously included net
mark-to-market gain.
248
Your adjusted tax basis in our
common shares or GDSs will be increased by the amount of any income
inclusion and decreased by the amount of any deductions under the
mark-to-market rules. If you make a mark-to market election, it
will be effective for the taxable year forwhich the election is
made and all subsequent taxable years unless our common shares or
GDSs are no longer regularly traded on a qualified exchange or the
Internal Revenue Service consents to the revocation of the
election. You are urged to consult your tax advisors about the
availability of the mark-to-market election, and whether making the
election would be advisable in your particular
circumstances.
In some cases, holders of common
shares or GDSs in a PFIC may be able to avoid the rules described
above by electing to treat the PFIC as a “qualified electing
fund” under Section 1295 of the Code. This option will not be
available to you because we do not intend to comply with certain
calculation and reporting requirements necessary to permit you to
make this election.
You are urged to consult your tax
advisors concerning the United States federal income tax
consequences of holding our common shares or GDSs if we are
considered a PFIC in any taxable year.
Taxation of Capital Gains
Subject to the discussion under
“—Passive Foreign Investment Company” above, for
United States federal income tax purposes, you will generally
recognize capital gain or loss on any sale, exchange, redemption or
other taxable disposition of our common shares or GDSs in an amount
equal to the difference between the U.S. Dollar value of the amount
realized for the common shares or GDSs and your tax basis in the
common shares or GDSs determined in U.S. Dollars. Capital gains of
non-corporate U.S. Holders derived with respect to capital assets
held for more than one year are eligible for reduced rates of
taxation. The deductibility of capital losses is subject to
limitations under the Code. Any gain or loss recognized by you will
generally be treated as United States source gain or loss for
United States foreign tax credit purposes. Consequently, you may
not be able to use the foreign tax credit arising from any
Argentine tax imposed on the disposition of our common shares or
GDSs unless such credit can be applied (subject to applicable
limitations) against tax due on other income treated as derived
from foreign sources.
Argentine Personal Assets Tax
Amounts paid on account of the
Argentine personal assets tax, if any, will not be eligible as a
credit against your United States federal income tax liability, but
may be deductible subject to applicable limitations in the
Code.
Information Reporting and Backup Withholding
In general, information reporting
will apply to dividends in respect of our common shares or GDSs and
the proceeds from the sale, exchange or redemption of our common
shares or GDSs that are paid to you within the United States (and
in certain cases, outside the United States), unless you are an
exempt recipient. A backup withholding tax may apply to such
payments if you fail to provide a correct taxpayer identification
number or certification of exempt status or fail to report in full
dividend and interest income.
Backup withholding is not an
additional tax. Any amounts withheld under the backup withholding
rules will be allowed as a refund or a credit against your United
States federal income tax liability provided the required
information is timely furnished to the Internal Revenue
Service.
249
Argentine
Taxation
The following discussion is a
summary of certain Argentine tax considerations associated with an
investment in, ownership or disposition of, the common shares or
the GDSs by (i) an individual holder that is resident in Argentina,
(ii) an individual holder that is neither domiciled nor resident in
Argentina, (iii) a legal entity organized under the laws of
Argentina (iv) a permanent business establishment in Argentina
owned by a foreign entity and (v) a legal entity that is not
organized under the laws of Argentina, that does not have a
permanent establishment in Argentina and is not otherwise doing
business in Argentina on a regular basis. The discussion is for
general information only and is based on current Argentine tax
laws. Moreover, while this summary is considered to be a correct
interpretation of existing laws in force a sof the date of this
20-F Form, no assurance can be given that the courts or
administrative authorities responsible for the administration of
such laws will agree with this interpretation or that changes in
such laws or interpretations will not occur.
PROSPECTIVE INVESTORS ARE URGED TO CONSULT
THEIR OWN TAX ADVISOR REGARDING THE PARTICULAR TAX CONSEQUENCES
ARISING UNDER ANY TAXING JURISDICTION
.
Income tax
Law No. 26,893, enacted on September
12, 2013 and published in the Official Gazette on September 23,
2013, introduced several amendments to Income Tax Law No. 20,628 in
connection with, among others, the taxation of gains derived from
transfers of shares and other securities, including the derogation
of Section 78 of Decree No. 2,284/1991, which provided that foreign
holders with no permanent establishment in Argentina were exempt
from paying income tax on the capital gains arising from the sale
or other disposition of shares or GDSs.
On February 7, 2014, the Executive
Branch issued Decree No. 2,334/13, which regulates Law No.
26,893.
The changes introduced by Law No.
26,893 are effective as from the date of publication of such law in
the Official Gazette and are applicable to taxable events
consummated from such date onwards.
Taxation on Dividends
Dividends, whether in cash, in
shares or in kind, approved by our shareholders are not subject to
income tax withholding except for the application of the
“Equalization Tax” described below.
An income tax withholding will be
applied to the amount of dividends distributed in excess of a
company’s net taxable income determined in accordance with
general income tax regulations for the fiscal years preceding the
date of the distribution of such dividends (the “Equalization
Tax”). The legislation requires that companies withhold 35%
of the amount of distributed dividends in excess of the net taxable
income of such distribution, as determined in accordance with the
income tax law. Dividends distributed by an Argentine company are
not subject to this tax to the extent that those dividends arise
from dividend income or other distributions received by such
company from other Argentine companies.
Dividend distributions made in kind
(other than cash) will be subject to the same tax rules as cash
dividends. Stock dividends on fully paid shares are not subject to
Equalization Tax.
Certain tax treaties contemplate the
application of a ceiling tax rate on dividends (i.e. 10% on gross
dividends).
Taxation on Capital Gains
From the effectiveness of Law No.
26,893 income from sale, exchange, disposition or transfer of
common shares or GDSs is subject to income tax, irrespective of the
person that obtains such income, exception made of transactions
made by resident individuals involving common shares and other
securities that are listed on securities exchanges or markets
and/or authorized to be offered to the public.
250
Resident
individuals
Capital gains obtained by resident
individuals or undivided estates situated in Argentina from the
sale or disposition of common shares and other securities are
subject to income tax at a 15% rate on net income (non resident
sellers may opt to determine the taxable income subject to tax
under one of the following mechanisms: a) apply a deemed taxable
base of 90% of the gross proceeds derived from the transaction -
the effective rate is, therefore, 13.5% of the sale price; or b)
calculate the actual net income by offsetting from the sale price
the cost basis and other expenses incurred to purchase the shares),
unless such securities were traded in stock markets and/or have
public offering authorization, in which case an exemption applies.
The amendments introduced by the implementing Decree
No. 2,334/13 state that the exemption includes income derived
from the sale of common shares and other securities made through a
stock exchange market duly authorized by the CNV.
It is not clear whether the term
“includes” (as used in the implementing Decree
2334/2013) means that the exemption only refers to sales of
securities made through a stock exchange market duly authorized by
the CNV or whether the implementing Decree 2334/2013 intended to
clarify that such sales were just one of the possibilities that may
be covered by the exemption (in addition to publicly offering
authorized securities, as provided in the Argentine Income Tax
Law). Certain qualified tax authorities have publicly opined that
the exemption exclusively refers to sales of securities made
through a stock exchange market duly authorized by the
CNV.
Losses arising from the sale,
exchange or other disposition of common shares or GDSs can be
applied only to offset such capital gains arising from the sale,
exchange or other disposition of these securities, for a five-year
carryover period.
Foreign
beneficiaries
Capital gains obtained by
non-Argentine individuals or non-Argentine entities from the sale,
exchange or other disposition of common shares are subject to
income tax, as the abovementioned exemption for shares is not
applicable to non-Argentine beneficiaries. Therefore, the gain
derived from the disposition of common shares by foreign
beneficiaries is subject to Argentine income tax at a 15% rate on
the net capital gain or at a 13.5% rate on the gross price at the
seller’s election. Argentine Tax Authority (AFIP) by General
Resolution No. 4094-E, enacted on July 17, 2017, regulated with
respect to how this election is made, notwithstanding, this General
Resolution has been suspended until January 16, 2018.
When both the seller and the buyer
are non-residents, the person liable to pay the tax shall be the
buyer of the shares, quotas, equity interests and other securities
transferred. Argentine Tax Authority (AFIP) by General Resolution
No. 4094-E, enacted on July 17, 2017, regulated the withholding and
payment mechanism that the non-resident buyer should follow,
notwithstanding, this General Resolution has been suspended until
January 16, 2018.
Notwithstanding the above, based on
certain tax precedents, there may be support to argue that gains
obtained by a non-resident from the disposal of GDSs should be
regarded as foreign source income and, therefore, not subject to
Argentine income tax. As this is a controversial issue, further
analysis is required.
Argentine
entities
Capital gains obtained by Argentine
entities (in general entities organized or incorporated under
Argentine law, certain traders and intermediaries, local branches
of non-Argentine entities, sole proprietorships and individuals
carrying on certain commercial activities in Argentina) derived
from the sale, exchange or other disposition of common shares or
GDSs are subject to income tax at the rate of 35%.
Losses arising from the sale,
exchange or other disposition of common shares or GDSs can be
applied only to offset such capital gains arising from the sale,
exchange or other disposition of these securities, for a five-year
carryover period.
WE RECOMMEND
PROSPECTIVE INVESTORS TO CONSULT THEIR OWN TAX ADVISOR REGARDING
THE PARTICULAR TAX CONSEQUENCES CONCERNING THE SALE OR OTHER
DISPOSITIONS OF COMMON SHARES AND GDSs.
251
Value Added Tax
The sale, exchange, disposition, or
transfer of common shares or GDSs is not subject to value added
tax. Dividend distributions are not levied with value added tax
either.
Personal Assets Tax
Argentine entities, such as us, have
to pay the personal assets tax corresponding to Argentine and
foreign domiciled individuals and foreign domiciled entities for
the holding of our shares. The applicable tax rate is 0.25% and is
levied on the proportional net worth value (valor patrimonial
proporcional), or the book value, of the shares arising from the
last balance sheet of the Argentine entity calculated under
Argentine GAAP. Pursuant to the Personal Assets Tax Law, the
Argentine company is entitled to seek reimbursement of such paid
tax from the applicable Argentine domiciled individuals and/or
foreign domiciled shareholders.
Our shareholders approved the
absorption of personal asset tax by us for the years 2002 to 2016.
There can be no assurance that in the future this tax will be
absorbed by us.
Tax on Minimum Notional Income (Impuesto a la Ganancia M’nima
Presunta, IGMP)
Entities domiciled in Argentina,
partnerships, foundations, sole proprietorships, trusts, certain
mutual funds organized in Argentina, and permanent business
establishments owned by foreign persons, among other taxpayers,
shall apply a 1% rate to the total value of assets held by such
persons, above an aggregate nominal amount of Ps.200,000.
Nevertheless, common shares and GDSs issued by entities subject to
such tax are exempt from the IGMP.
Law No. 27.260 has repealed this tax
for fiscal years commenced since January 1, 2019.
Turnover Tax
The gross turnover tax is a local
tax; therefore, the rules of the relevant provincial jurisdiction
should be considered, which may levy this tax on the customary
purchase and sale, exchange or other disposition of common shares
and GDSs, and/or the collection of dividends at an average rate of
6%, unless an exemption is applicable. In the particular case of
the City of Buenos Aires, any transaction involving common shares
and/or the collection of dividends and revaluations is exempt from
this tax.
There is no gross income tax
withholding system applicable to the payments made to foreign
beneficiaries.
Stamp Tax
Stamp tax is a local tax that is
generally levied on the formal execution of onerous transactions
within a certain provincial jurisdiction or outside a certain
provincial jurisdiction but with effects in such jurisdiction;
therefore, the rules of the relevant provincial jurisdiction should
be considered for the issuance of instruments which implement
onerous transactions (including issuance, subscription, placement
and transfer) involving the common shares or GDSs, executed in
those jurisdictions, or with effects in those
jurisdictions.
Notwithstanding, for the City of
Buenos Aires, any instrument related to the transfer of common
shares which public offering is authorized by the CNV is exempt
from this tax.
Tax on Credits and Debits in Bank Accounts
Credits to and debits from bank
accounts held at Argentine financial institutions, as well as
certain cash payments, are subject to this tax, which is assessed
at a general rate of 0.6%. There are also increased rates of 1.2%
and reduced rates of 0.075%. Owners of bank accounts subject to the
general 0.6% rate may consider34% of the tax paid upon credits to
such bank accounts as a tax credit while taxpayers subject to the
1.2% rate may consider 17% of all tax paid upon credits to such
bank accounts as a credit. Such amounts can be utilized as a credit
for income tax or tax on presumed minimum income.
252
Other Taxes
There are no Argentine federal
inheritance or succession taxes applicable to the ownership,
transfer or disposition of our common shares or GDSs. The provinces
of Buenos Aires and Entre Ríos establish a tax on free
transmission of assets, including inheritance, legacies, donations,
etc. Free transmission of our shares could be subject to this
tax.
In the case of litigation regarding
the shares before a court of the City of Buenos Aires, a 3% court
fee would be charged, calculated on the basis of the
claim.
Tax Treaties
Argentina has entered into tax
treaties with several countries. There is currently no tax treaty
or convention in effect between Argentina and the United
States.
F. Dividends
and Paying Agents
This Section is not
applicable.
G. Statement
by Experts
This section is not
applicable.
H. Documents on
display
We file annual, quarterly and other
information with the SEC. You may read and copy any document that
we file at the public reference rooms of the SEC at 450 Fifth
Street, N.W., Washington, D.C. 20549; and 500 West Madison Street,
Suite 1400, Chicago, Illinois 60661
and www.sec.gov. You may obtain
information on the operation of the Public Reference Rooms by
calling the SEC at 1-800-SEC-0330. Our Internet address is
http://www.irsa.com.ar
. It
should be noted that nothing on our website should be considered
part of this annual report. You may request a copy of these filings
at no cost, by writing or calling our offices, Bolivar 108,
(C1066AAB) City of Buenos Aires, Argentina. Our telephone number is
+54-11-4323-7400.
I. Subsidiary
Information
This section is not
applicable.
In the normal course of business, we
are exposed to foreign exchange risk, interest rate risks and other
price risk, primarily related to changes in exchange rates and
interest rates. We manage our exposure to these risks through the
use of various financial instruments, none of which are entered
into for trading purposes. We have established policies and
procedures governing the use of financial instruments, specifically
as they relate to the type and volume of such financial
instruments. For further information on our market risks, please
see Note 4 to our Audited Consolidated Financial
Statements.
A. Debt
Securities
This item is not
applicable
B. Warrants
and Rights
This item is not
applicable
C. Other
Securities
This item is not
applicable
253
D.
American Depositary Shares
The Bank of New York Mellon, as
depositary for the GDSs (the “Depositary”) collects its
fees for delivery directly from investors depositing shares or
surrendering GDSs for the purpose of withdrawal. The Depositary
also collects taxes and governmental charges from the holders of
GDSs. The Depositary collects these fees and charges by deducting
those fees from the amounts distributed or by selling a portion of
distributable property to pay the fees (after attempting by
reasonable means to notify the holder prior to such
sale).
The Depositary has agreed to
reimburse or pay on our behalf, certain reasonable expenses related
to our GDS program and incurred by us in connection with the
program (such as NASDAQ listing fees, legal and accounting fees
incurred with preparation of Form 20-F and ongoing SEC compliance
and listing requirements, distribution of proxy materials, investor
relations expenses, etc).
The amounts the Depositary
reimbursed or paid are not perforce related to the fees collected
by the depositary from GDSs holders.
We agree to pay the fees, reasonable
expenses and out-of-pocket charges of the Depositary and those of
any registrar only in accordance with agreements in writing entered
into between the Depositary and the Company from time to time. The
Depositary shall present its statement for such charges and
expenses to the Company once every three months. The charges and
expenses of the custodian are for the sole account of the
Depositary.
The following charges shall be
incurred by any party depositing or withdrawing common shares or by
any party surrendering receipts or to whom receipts are issued
(including, without limitation, issuance pursuant to a stock
dividend or stock split declared by the Issuer or an exchange
regarding the receipts or deposited securities or a distribution of
receipts), whichever applicable: (1) taxes and other governmental
charges, (2) such registration fees as may from time to time be in
effect for the registration of transfers of common shares generally
onour common share register or foreign registrar and applicable to
transfers of common shares to the name of the Depositary or its
nominee or the custodian or its nominee on the making of deposits
or withdrawals hereunder, (3) such cable, telex and fax
transmission expenses as are expressly provided in the deposit
agreement, (4) such expenses as are incurred by the Depositary in
the conversion of foreign currency (5) a fee of US$5.00 or less per
100 GDS (or portion), (6) a fee of US$0.02 or less per GDS (or
portion) for any cash distribution made pursuant to the deposit
agreement, and (7) a fee for the distribution of securities, such
fee being in an amount equal to the fee for the excecution and
delivery of GDS referred to above which would have been charged as
a result of the deposit of such securities, but wich securities are
instead distributed by the Depositary to owners.
254
This item is not
applicable.
A. Fair
Price Provision
At our annual meeting held on
October 30, 2000, our shareholders approved an amendment to our
bylaws which included the adoption of a fair price provision (the
“Fair Price Provision”). On March 8, 2002 our
shareholders decided to make a new amendment to Article Nine of our
bylaws including, among others, an increase in the minimum
percentage of capital obliged to comply with the Fair Price
Provision, from twenty percent (20%) to thirty five percent (35%),
according to Decree No. 677/2001. On October 10, 2007, our
shareholders decided to make a new amendment to Article Nine of our
bylaws, to include the control concept under Decree No. 677/2001,
which provides for the effective control regularly held in addition
to the legal control.
The following description is a
summary of the main provisions of the Fair Price Provision, which
constitutes Article Nine of our bylaws and does not contain a
description of all of the terms of the Fair Price Provision. The
Fair Price Provision prohibits a party seeking to acquire, directly
or indirectly, either control or (together with such party’s
other holdings) thirty five percent (35%) or more of our capital
stock without complying with the procedural and price requirements
described below. Acquisitions made in violation of the Fair Price
Provision are deemed ineffective against us and will not be
registered in our share registry. Common shares acquired in
violation of the Fair Price Provision shall have no voting or
equity rights until the Fair Price Provision has been complied
with. The Fair Price Provision applies to transactions involving
shares of our common stock and any securities convertible in shares
of our common stock, including, without limitation, convertible
debentures and bonds and our GDRs. The Fair Price Provision
excludes certain acquisitions of common shares in certain limited
circumstances.
The Fair Price Provision provides
that a party seeking to acquire, directly or indirectly, control of
our company or thirty five percent (35%) or more of our capital
stock shall be required to make a public tender offer for all of
the outstanding common stock of us and any shares of common stock
into which outstanding securities of our company are presently
convertible or exchangeable in accordance with the procedural and
price terms of the Fair Price Provision and in accordance with
applicable law. For purposes of the thirty five percent threshold
contained in the Fair Price Provision parties acting in concert or
which are under common control or administration are deemed a
single party.
There are cases excluded from the
tender offer requirements:
●
acquisitions by existing shareholders or by
those exercising control over shares or convertible securities in
accordance with CNV Rules; and
●
holdings of more than 35%, which derive from the
distribution of common shares or dividends paid in shares approved
by the shareholders, or the issuance of common shares as a result
of a merger approved by the shareholders; in both cases, the excess
holding shall be disposed of within 180 days of its registration in
the relevant shareholder’s account, or prior to the holding
of our shareholders meeting, whatever occurs first.
The Fair Price Provision requires the
offering party to notify use of the tender offer simultaneously
with its filing of the public tender offer with the
Comisión
Nacional de Valores
.
The notice to us is required to set forth all of the terms and
conditions of any agreement that the offering party has made with
any other of our shareholders with respect to the proposed
transaction and to provide, among other things, the following
information:
255
●
the identity and nationality of the offering
party and, in the event the offer is made by a group, the identity
of each member of the group;
●
the terms and conditions of the offering,
including the price, the tender offer period and the requirements
for accepting the tender offer;
●
accounting documentation required by Argentine
law relating to the offering party;
●
details of all prior acquisitions by the
offering party of common shares or securities convertible into
shares of our capital stock.
We will distribute the information
provided by the offering party to our shareholders.
The CNV
regulations
require that transactions which cause a person’s holdings of
capital stock of a registered Argentine company, to hold 5% or more
of the voting power, should be immediately notified to the CNV.
Thereafter, every change in the holdings that represents a multiple
of 5% of the voting power should also be
notified.
The Fair Price Provision requires that the consideration paid in
the tender offer be paid in cash and that the price paid for each
common share in the tender offer be the same and not less than the
highest price per common share derived from the five following
alternative valuation methods:
●
the highest price per share of our common stock
paid by the offering party, or on behalf of the offering party, for
any acquisition of shares or convertible securities within the 2
years prior to the commencement of the tender offer;
●
the highest closing selling price of a share of
our common stock on the BASE during the thirty day period
immediately preceding the commencement of the tender
offer;
●
the highest price resulting from the
calculations made according to the provisions of (i) and (ii) above
multiplied by a fraction the numerator of which is such highest
price and the denominator of which is the lowest closing price of a
share of our common stock on the BASE during the two-year period
prior to the period referred to in sub-sections (i) or (ii), as
applicable;
●
our aggregate net earnings per common share
during our preceding four completed fiscal quarters prior to the
commencement of the tender offer, multiplied by our highest price
to earnings ratio during the two-year period immediately preceding
the commencement of the tender offer. Such multiples shall be
determined considering the average closing selling price of our
common stock in the BASE, and our aggregate net income from our
preceding four completed fiscal quarters; and,
●
the book value per share of our common stock at
the time the tender offer is commenced, multiplied by the highest
ratio determined by a fraction the numerator of which is the
closing selling price of a share of our common stock on the BASE on
each day during the two year period prior to the commencement of
the tender offer and the denominator of which is the latest known
book value per share of our common stock on each such
date.
B. Limitations on the payment of
dividends.
On February 2, 2007, we issued our
Series I Notes for an aggregate principal amount of US$150.0
million.
In addition, on July 20, 2010, we
issued our Series II Notes.
The Indentures of the Notes
contained restrictions on the distribution of dividends. However,
on March 28, 2016 and on April 7, 2016, the Trustee and us entered
into First Supplemental Indentures to the 2020 Notes Indenture and
to the 2017 Notes Indenture, respectively. The Supplemental
Indentures amended, modified and/or deleted certain provisions of
the Indentures. Among them, the restrictions on the distribution of
dividends.
As a result, we cannot give you any
assurance that we will pay any dividends with respect to our common
shares in the future.
256
C.
This section is not
applicable.
D.
This section is not
applicable.
E.
This section is not
applicable.
A. Disclosure
Controls and Procedures.
We maintain disclosure controls and
procedures that are designed to ensure that information required to
be disclosed in the reports we file or submit under the Exchange
Act is recorded, processed, summarized and reported within the time
periods specified in the SEC’s rules and forms, and that such
information is accumulated and communicated to management,
including our Chief Executive Officer and Chief Financial and
Administrative Officer, to allow our management to make timely
decisions regarding required disclosure. Any controls and
procedures, no matter how well designed and operated, can provide
only reasonable assurance of achieving the desired control
objective. In connection with the preparation of this Annual Report
on Form 20-F, we carried out an evaluation under the supervision
and with the participation of members of our management team,
including our Chief Executive Officer and Chief Financial and
Administrative Officer, of the effectiveness of the design and
operation of our disclosure controls and procedures (as defined in
Rules 13a-15(e) and 15d-15(e) under the Exchange Act) as of June
30, 2017. Based upon this evaluation our Chief Executive Officer
and Chief Financial and Administrative Officer concluded that our
disclosure controls and procedures as of the end of the period
covered by this Annual Report on Form 20-F were effective at the
reasonable assurance level.
B.
Management’s Annual Report on Internal Control Over Financial
Reporting
Our management is responsible for
establishing and maintaining adequate Internal Control over
Financial Reporting (as defined in Rules 13a-15(f) and 15d-15(f)
under the Exchange Act). Our Internal Control over Financial
Reporting includes a series of procedures designed to provide
reasonable assurance regarding thereliability of financial
reporting and the preparation of consolidated financial statements
for external purposes, in accordance with International Financial
Reporting Standards and includes those policies and procedures that
(1) pertain to the maintenance of records that, in reasonable
detail, accurately and fairly reflect the transactions and
dispositions of our assets, (2) provide reasonable assurance that
transactions are recorded as necessary to permit preparation of
consolidated financial statements in accordance with International
Financial Reporting Standards and that a company’s receipts
and expenditures are being made only in accordance with
authorizations of our management and directors, and (3) provide
reasonable assurance regarding prevention or timely detection of
unauthorized acquisition, use, or disposition of our assets that
could have a material effect on our consolidated financial
statements.
Because of its inherent limitations,
Internal Control over Financial Reporting may not prevent or detect
misstatements. Also, projections of any evaluation of effectiveness
to future periods are subject to the risk that controls may become
inadequate because of changes in conditions, or that the degree of
compliance with policies and procedures may
deteriorate.
Management assessed the
effectiveness of our Internal Control over Financial Reporting as
of June 30, 2017. In making this assessment, management used the
criteria set forth by the Committee of Sponsoring Organizations of
the Treadway Commission (COSO) in Internal Control–Integrated
Framework (2013). Based on this evaluation, management concluded
that our Internal Control over Financial Reporting was effective as
of June 30, 2017.
C. Attestation
Report of the Registered Public Accounting Firm
The effectiveness of the
Company’s internal control over financial reporting as of
June 30, 2017 has been audited by Price Waterhouse & Co S.R.L,
Buenos Aires Argentina- member firm of PricewaterhouseCoopers
International Limited-, an independent registered public accounting
firm, as stated in their report which appears herein.
257
D. Changes in
Internal Control Over Financial
Reporting
During
the year ended June 30, 2017, to integrate the acquisition of IDBD
into our financial reporting system, we have made several
enhancements to our consolidation process including the
implementation of new sub-consolidation policies and procedures at
our Operations Center in Israel level. We also enhanced our
accounting policies, procedures and reporting manuals to provide
additional guidance to our newly incorporated subsidiaries. These
changes that we implemented to our internal controls aimed at
strengthening our internal controls necessary for the integration
of IDBD and its subsidiaries that have materially affected, or are
reasonably likely to materially affect, our internal control over
financial reporting.
Pursuant to the former applicable
rules regarding the Capital Market Law (former Transparency Decree)
and the applicable Rules of the CNV at such moment, our board of
directors has established on May 2004 an Audit Committee. The main
functions of the Audit Committee are to assist the board of
directors in performing their duty of exercising due care,
diligence and competence in issues relating to us, specifically in
the enforcement of the accounting policy and in the issue of
accounting and financial information, the management of business
risk and of internal control systems, the conduct and ethical
soundness of the company’s business, the supervision of the
integrity of our financial statements, the compliance by our
company with the legal provisions, the independence and capability
of the independent auditor and the performance of the internal
audit function of our company and of the external auditors. Also,
according to the applicable regulations, we may request to our
audit committee to render its opinion in certain transactions, and
its conditions, as is the case of related party transactions, as
may be reasonably considered adequate according to normal market
conditions.
Since November 3, 2008 the member of
the Audit Committee are Cedric Bridger, Ricardo Liberman and Mario
Blejer, all of them as independent members. Cedric Bridger is the
financial expert in accordance with the relevant SEC rules. We have
a fully independent audit committee as per the standard provided in
Rule 10 (A) -3(B) (1).
We have adopted a code of ethics
that applies to our directors, officers and employees. Our code of
ethics is posted in our website www.irsa.com.ar. On July 25 2005,
our Code of Ethics was amended by our Board of Directors. The
amendment was reported in a report on Form 6-K on August 1,
2005.
If we make any substantive amendment
to the code of ethics or grant any waivers, including any implicit
waiver to any of its provision we will disclose the nature of such
amendment or waiver in a report on Form 6-K or in our next annual
report and we will post it in our website.
Audit
Fees
During the fiscal years ended June
30, 2017 and 2016, we were billed a total amount of Ps.40.7 million
and Ps. 12.3 million respectively, for professional services
rendered by our principal accountants for the audit of our annual
Audited Consolidated Financial Statements, performance of the audit
of internal controls over financial reporting of the company and
other services normally provided in connection with regulatory
filings or engagements.
Audit-Related
Fees
During the fiscal year ended June
30, 2017 we were billed a total amount of Ps. 1.2 million for
professional services rendered by our principal accountants mainly
in connection with the review of debt prospectus. During the fiscal
year ended June 30, 2016, no audit-related services were
provided.
Tax
Fees
During the fiscal year ended June
30, 2017 and 2016, we were billed a total amount of Ps.0.7 million
and Ps. 0.01 million, respectively, for professional services
rendered by our principal accountants for tax compliance, tax
advice and tax planning.
258
All Other
Fees
During the fiscal year ended June
30, 2017 and June 30, 2016 we were billed for professional services
rendered by our principal accountants, including fees mainly
related to statutory certifications and training seminaries, a
total amount of Ps.4 million and Ps. 0.1 million,
respectively.
Audit Committee
Pre-Approval Policies and Procedures
Audit Committee pre-approves all
services and fees provided by the external auditors to ensure
auditors’ independence. One of the main tasks of the Audit
Committee is to give it opinion in relation to the appointment of
the external auditors, proposed by the Board of Directors to the
General Shareholder’s Meeting. In order to accomplish such
task, the Audit Committee shall:
●
Require any additional and complementary
documentation related to this analysis.
●
Verify the independence of the external
auditors;
●
Analyze different kinds of services that the
external auditor would provide to the company. This description
must also include an estimate of the fees payable for such
services, specifically in order to maintain the principle of
independence;
●
Inform the fees billed by the external auditor,
separating the services related to the audit services and other
special services that could be not included in the audit services
previously mentioned.
●
Take notice of any strategy proposed by of the
external auditors and review it in accordance with the reality
other business and the risks involved;
●
Analyze and supervise the working plan of the
external auditors considering the business’ reality and the
estimated risks;
●
Propose adjustments (if necessary) to such
working plan;
●
Hold meetings with the external auditors in
order to: (a) analyze the difficulties, results and conclusions of
the proposed working plan; (b) analyze eventual possible conflicts
of interests, related party transactions, compliance with the legal
framework and information transparency; and
●
Evaluate the performance of external auditors
and their opinion regarding the Financial Statements.
ITEM 16.
D.
Exemption from the Listing Standards for Audit
Committees
This section is not
applicable.
This section is not
applicable.
This section is not
applicable.
Compliance with
NYSE listing standards on corporate governance
NYSE and
Argentine Corporate Governance Requirements
Our corporate governance practices
are governed by the applicable Argentine law; particularly, the
Argentine Corporation Law, Capital Markets Law Nº 26,831 and
CNV Rules, as well as by our bylaws. We have securities that are
registered with the Securities and Exchange Commission and are
NYSE, and is therefore subject to corporate governance requirements
applicable to NYSE-listed non-U.S. companies (a
“NYSE-listed” company).
NYSE-listed non-U.S. companies that
are categorized as “Foreign Private Issuers” may, in
general, follow their home country corporate governance practices
in lieu of most of the new NYSE corporate governance requirements
(the “NYSE Sections”) codified in Section 303A of the
NYSE’s Listed Company Manual. However, Foreign Private
Issuers must comply with NYSE Sections 303A.06, 303A.11 and
303A.12(b) and 303A.12(c). Foreign Private Issuers must comply with
Section 303A.06 prior to July 31, 2005 and with Sections 303A.11
and 303A.12(b) prior to the first annual meeting of shareholders
held after January 15, 2004, or by October 31, 2004.
259
NYSE Section 303A.11 requires that
Foreign Private Issuers disclose any significant ways in which
their corporate governance practices differ from U.S. companies
under NYSE standards. A Foreign Private Issuer is simply required
to provide a brief, general summary of such significant differences
to its U.S. investors either 1) on the company’s website (in
English) or 2) in Form 20-F as distributed to their U.S. investors.
In order to comply with Section 303A.11, we have prepared and have
updated the comparison in the table below.
THE MOST RELEVANT DIFFERENCES BETWEEN OUR CORPORATE GOVERNANCE
PRACTICES AND NYSE STANDARDS FOR LISTED COMPANIES ARE AS
FOLLOWS:
260
|
NYSE Standards
for U.S. companies Listed Companies Manual Section
303.A
|
IRSA’s
Corporate Practices
|
|
|
|
|
Section 303A.01 A NYSE-listed
company must have a majority of independent directors on its board
of directors.
|
We follow Argentine law which does
not require that a majority of the board of directors be comprised
of independent directors. Argentine law instead requires that
public companies in Argentina have a sufficient number of
independent directors to be able to form an audit committee of at
least three members, the majority of which must be independent
pursuant to the criteria established by CNV Rules.
|
|
|
|
|
Section 303A.02 This section
establishes general standards to evaluate directors’
independence (no director qualifies as “independent”
unless the board of directors affirmatively determines that the
director has no material relationship with the listed company
(either directly or as a partner, shareholder or officer of an
organization that has a relationship with the company)), and
emphasizes that the concern is independence from management. The
board is also required to express an opinion with regard to the
independence or lack of independence, on a case by case basis, of
each individual director.
|
CNV standards (former General
Resolution No. 400 and now General Resolution 622/2013, as amended)
for purposes of identifying an independent director are
substantially similar to NYSE’s standards. CNV standards
provide that independence is required with respect to the company
itself and to its shareholders with direct or indirect material
holdings (35% or more). To qualify as an independent director, such
person must not perform executive functions within the company.
Close relatives of any persons who would not qualify as
“independent directors” shall also not be considered
“independent.” When directors are appointed, each
shareholder that nominates a director is required to report at the
meeting whether or not such director is independent.
|
|
|
|
|
Section 303A.03 Non-management
directors must meet at regularly scheduled executive meetings not
attended by management.
|
Neither Argentine law nor our
by-laws require that any such meetings be held.
Our board of directors as a whole is
responsible for monitoring the company’s affairs. In
addition, under Argentine law, the board of directors may approve
the delegation of specific responsibilities to designated directors
or non-director managers of a company. Also, it is mandatory for
public companies to form a supervisory committee (composed of
syndics) which is responsible for monitoring legal compliance by a
company under Argentine law and compliance with its
by-laws.
|
|
|
|
|
Section 303A.05(a) Listed companies
shall have a “Compensation Committee” comprised
entirely of independent directors.
|
Neither Argentine law nor our
by-laws require the formation of a “Compensation
Committee.” Under Argentine law, if the compensation of the
members of the board of directors and the supervisory committee is
not established in the by-laws of a company, it should be
determined at the shareholders meeting.
|
|
|
|
|
Section 303A.05(b). The
“Compensation Committee” shall have a written charter
addressing the committee’s purpose and certain minimum
responsibilities as set forth in Section 303A.05(b)(i) and
(ii).
|
Neither Argentine law nor our
by-laws require the formation of a “Compensation
Committee.”
|
|
|
|
|
Section 303A.06 Listed companies
must have an “Audit Committee” that satisfies the
requirements of Rule 10 A-3 under the 1934 Exchange Act (the
“Exchange Act”). Foreign private issuers must satisfy
the requirements of Rule 10 A-3 under the Exchange Act as of July
31, 2005.
|
Pursuant to the Capital Markets Law
and the CNV Rules, from May 27, 2004 we have appointed an
“Audit Committee” composed of three of the members of
the Board of Directors. Since December 21, 2005 all of its members
are independent as per the criteria of Rule 10 A-3 under the
Exchange Act.
|
|
|
|
|
Section 303A.07(a) The Audit
Committee shall consist of at least three members. All of its
members shall be financially literate or must acquire such
financial knowledge within a reasonable period and at least one of
its members shall have experience in accounting or financial
administration.
|
In accordance with Argentine law, a
public Company must have an Audit Committee with a minimum of three
members of the board of directors, the majority of which shall be
independent pursuant to the criteria established by the
CNV. There is no requirement
related to the financial expertise of the members of the Audit
Committee. However, our Audit Committee has a financial expert. The
committee creates its own written internal code that addresses
among others: (i) its purpose; (ii) an annual performance
evaluation of the committee; and (iii) its duties and
responsibilities.
|
H. Mine Safety
Disclosures
This section is not
applicable.
261
We have responded to Item 18 in lieu
of responding to this Item.
Reference is made to pages F-1
through F-125
Index to Financial Statements (see
page F-1).
INDEX OF EXHIBITS
|
Exhibit No.
|
Description of
Exhibit
|
|
1.1
(1)
|
Estatutos of the registrant, which
serve as the registrant’s articles of incorporation and
bylaws, and an English translation thereof.
|
|
1.2
(4)
|
English translation of the amendment
to the bylaws.
|
|
1.3
(10)
|
Amended and restated English
translation of the bylaws.
|
|
1.4
|
Amended and restated English
translation of the bylaws.
|
|
2.1
(1)
|
Form of Deposit Agreement among us,
The Bank of New York, as Depositary, and the holders from time to
time of American Depositary Receipts issued there
under
|
|
2.2
(1)
|
Shareholders Agreement, dated
November 18, 1997, among IRSA International Limited, Parque Arauco
S.A. and Sociedad Anónima Mercado de Abasto Proveedor
(SAMAP).
|
|
2.3
(1)
|
Put Option Agreement dated November
17, 1997, among IRSA Inversiones y Representaciones Sociedad
Anónima and GSEM/AP.
|
|
2.4
(1)
|
Offering Circular, dated March 24,
2000, regarding the issuance of Ps.85,000,000 of our 14.875% Notes
due 2005.
|
262
|
2.5
(7)
|
Indenture, dated July 20, 2010,
between us as Issuer, The Bank of New York Mellon as Trustee,
Co-Registrar, Principal Paying Agent and Transfer Agent, and Banco
Santander Río S.A. as Registrar, Paying Agent, Transfer Agent
and Representative of the Trustee in Argentina, with respect to our
US$400,000,000 Global Note Program, pursuant to which
US$150,000,000 aggregate principal amount of our 11.500% Notes due
2020, Series No. 2, were issued.
|
|
2.6
(13)
|
First Supplemental Indenture, dated
March 28, 2016, between us as Issuer and The Bank of New York
Mellon as Trustee, Co-Registrar, Principal Paying Agent and
Transfer Agent to the Indenture, dated July 20, 2010, between us as
Issuer, The Bank of New York Mellon as Trustee, Co-Registrar,
Principal Paying Agent and Transfer Agent, and Banco Santander
Río S.A. as Registrar, Paying Agent, Transfer Agent and
Representative of the Trustee in Argentina, with respect to our
US$400,000,000 Global Note Program, pursuant to which
US$150,000,000 aggregate principal amount of our 11.500% Notes due
2020, Series No. 2, were issued.
|
|
2.7
(13)
|
Indenture, dated March 23, 2016,
between IRSA Propiedades Comerciales S.A. as Issuer, The Bank of
New York Mellon as Trustee, Co-Registrar, Principal Paying Agent
and Transfer Agent, and Banco Santander Río S.A. as Registrar,
Paying Agent, Transfer Agent and Representative of the Trustee in
Argentina, with respect to IRSA Propiedades Comerciales
S.A.’s US$500,000,000 Global Note Program, pursuant to which
US$360,000,000 aggregate principal amount of IRSA Propiedades
Comerciales S.A.´s 8.750% Notes due 2023, Series No. 2, were
issued.
|
|
2.8
(13)
|
First Supplemental Indenture, dated
March 23, 2016, between IRSA Propiedades Comerciales S.A., as
Issuer and The Bank of New York Mellon, as Trustee, Co-Registrar,
Principal Paying Agent and Transfer Agent, The Bank of New York
Mellon (Luxembourg) S.A., as Luxembourg Paying Agent and Luxembourg
Transfer Agent and Banco Santander Río S.A., as Registrar,
Paying Agent, Transfer Agent and Representative of the Trustee in
Argentina to the Indenture, dated March 23, 2016, between IRSA
Propiedades Comerciales S.A. as Issuer, The Bank of New York Mellon
as Trustee, Co-Registrar, Principal Paying Agent and Transfer
Agent, and Banco Santander Río S.A. as Registrar, Paying
Agent, Transfer Agent and Representative of the Trustee in
Argentina, with respect to IRSA Propiedades Comerciales
S.A.’s US$500,000,000 Global Note Program, pursuant to which
US$360,000,000 aggregate principal amount of IRSA Propiedades
Comerciales S.A.’s 8.750% Notes due 2023, Series No. 2, were
issued.
|
|
4.1
(2)
|
Agreement for the exchange of
Corporate Service between us, IRSA and Cresud dated June 30,
2004.
|
|
4.2
(4)
|
English translation of the Amendment
to the Agreement for the exchange of Corporate Service between us,
IRSA and Cresud dated August 23, 2007
|
|
4.3
(5)
|
English translation of the Second
Agreement for the Implementation of the Amendment to the Corporate
Services Master Agreement, dated August 14, 2008.
|
|
4.4
(6)
|
English translation of the Third
Agreement for the Implementation of the Amendment to the Corporate
Services Master Agreement, dated November 27, 2009.
|
263
|
4.5
(7)
|
English translation of the Amendment
to the Agreement for the exchange of Corporate Service between us,
IRSA and Cresud, dated March 12, 2010.
|
|
4.6
(8)
|
English translation of the Amendment
to the Agreement for the exchange of Corporate Service between us,
IRSA and Cresud, dated July 11, 2011.
|
|
4.7
(9)
|
English translation of the Fifth
Agreement for the implementation of Amendments to the Corporate
Services Master Agreement, October 15, 2012.
|
|
4.8
(10)
|
English translation of the Sixth
Agreement for the Implementation of the Amendment to the Corporate
Services Master Agreement dated November 12, 2013.
|
|
4.9
(11)
|
English translation of the Second
Amendment to the exchange of Operating Services Agreement
between the Company, Cresud and Alto Palermo, dated February 24,
2014.
|
|
4.10
(12)
|
English translation of the Seventh
Agreement for the Implementation of the Amendment to the Corporate
Services Master Agreement dated February 18, 2015.
|
|
4.11
(13)
|
English translation of the Eighth
Agreement for the Implementation of the Amendment to the Corporate
Services Master Agreement dated November 12,
2015.
|
|
4.12
|
English translation of the Ninth
Agreement for the Implementation of the Amendment to the Corporate
Services Master Agreement dated May 5, 2017.
|
|
8.1
|
List of Subsidiaries.
|
|
11.1
(3)
|
Code of Ethics of the
Company.
|
|
12.1
|
Certification pursuant to Section
302 of the Sarbanes-Oxley Act 2002
|
|
12.2
|
Certification pursuant to Section
302 of the Sarbanes-Oxley Act 2002.
|
|
13.1
|
Certification pursuant to 18 U.S.C.
1350, as adopted pursuant to Section 906 of the Sarbanes-Oxley Act
of 2002.
|
|
13.2
|
Certification pursuant to 18 U.S.C.
1350, as adopted pursuant to Section 906 of the Sarbanes-Oxley Act
of 2002
|
264
|
(1)
|
Incorporated herein by reference to
the same-numbered exhibit to the registrant’s registration
statement on Form 20-F (File N° 000-30982).
|
|
(2)
|
Incorporated herein by reference to
the registrant’s registration statement on Form 6-K (SEC File
N° 000-30982).
|
|
(3)
|
Incorporated herein by reference to
the registrant’s registration statement on Form 6-K reported
on August 1, 2005.
|
|
(4)
|
Incorporated herein by reference to
the annual report on Form 20-F (File N° 128 0-30982)
filed with the SEC on December 27, 2007.
|
|
(5)
|
Incorporated herein by reference to
the annual report on Form 20-F (File N° 128 0-30982)
filed with the SEC on December 30, 2008.
|
|
(6)
|
Incorporated herein by reference to
the annual report on Form 20-F (File N° 1280-30982) filed
with the SEC on December 30, 2009.
|
|
(7)
|
Incorporated herein by reference to
the annual report on Form 20-F (File N° 1280-30982) filed with
the SEC on December 30, 2010.
|
|
(8)
|
Incorporated herein by reference to
the annual report on Form 20-F (File N° 1280-30982) filed with
the SEC on December 28, 2011.
|
|
(9)
|
Incorporated herein by reference to
the annual report on Form 20-F (File N° 1280-30982) filed with
the SEC on October 26, 2012.
|
|
(10)
|
Incorporated herein by reference to
the annual report on Form 20-F (File N° 1280-30982) filed with
the SEC on October 31, 2014.
|
|
(11)
|
Incorporated herein by reference to
the annual report on Form 20-F (File N° 1280-30982) filed with
the SEC on November 17, 2015.
|
|
(12)
|
Incorporated herein by reference to
the annual report on Form 20-F (File N° 1280-30982) filed with
the SEC on November 17, 2015.
|
|
(13)
|
Incorporated herein by reference to the annual
report on Form 20-F (File N° 1280-30982) filed with the SEC on
November 1, 2016.
|
265
SIGNATURES
The registrant hereby certifies that
it meets all of the requirements for filing on Form 20-F and that
it has duly caused and authorized the undersigned to sign this
annual report on its behalf.
|
|
IRSA Inversiones
y Representaciones Sociedad Anónima
|
|
|
|
|
|
|
|
|
Date October 31, 2017
|
By:
|
/s/ Matías I.
Gaivironsky
|
|
|
|
|
Name Matías I.
Gaivironsky
|
|
|
|
|
Title Chief Financial and
Administrative Officer
|
|
266
Index
|
Report
of Independent Registered Public Accounting Firm
|
F-2
|
|
Glossary
|
F-3
|
|
Consolidated
Statements of Financial Position
|
F-4
|
|
Consolidated
Statements of Income
|
F-5
|
|
Consolidated
Statements of Comprehensive Income
|
F-6
|
|
Consolidated
Statements of Changes in Shareholders’ Equity
|
F-7
|
|
Consolidated
Statements of Cash Flows
|
F-10
|
|
Notes
to Consolidated Financial Statements
|
|
|
|
F-11
|
|
|
F-13
|
|
|
F-38
|
|
Note 4
– Acquisitions and dispositions
|
F-39
|
|
|
F-45
|
|
|
F-55
|
|
|
F-65
|
|
|
F-67
|
|
|
F-70
|
|
Note 10
– Investment properties
|
F-73
|
|
Note 11
– Property, plant and equipment
|
F-78
|
|
|
F-79
|
|
Note 13
– Intangible assets
|
F-80
|
|
Note 14
– Financial instruments by category
|
F-81
|
|
Note 15
– Trade and other receivables
|
F-88
|
|
|
F-89
|
|
|
F-90
|
|
|
F-93
|
|
Note 19
– Provisions
|
F-93
|
|
|
F-96
|
|
Note 21
– Taxes
|
F-99
|
|
|
F-102
|
|
|
F-103
|
|
|
F-102
|
|
|
F-104
|
|
|
F-107
|
|
|
F-107
|
|
|
F-107
|
|
|
F-108
|
|
|
F-119
|
|
|
F-120
|
|
|
F-121
|
|
|
F-121
|
|
Schedule
I
|
F-123
|
F-1
Report of
Independent Registered Public Accounting Firm
To the Board of
Directors and Shareholders of
IRSA Inversiones
y Representaciones Sociedad Anónima
In our opinion, the accompanying
consolidated statements of financial position and the related
consolidated statements of income, comprehensive income, changes in
shareholders’ equity and cash flows present fairly, in all
material respects, the financial position of IRSA Inversiones y
Representaciones Sociedad Anónima and its subsidiaries at June
30, 2017 and 2016, and the results of their operations and their
cash flows for each of the three years in the period ended June 30,
2017 in conformity with International Financial Reporting Standards
as issued by the International Accounting Standards Board. In
addition, in our opinion, the financial statement schedules listed
in the accompanying index
present
fairly, in all material respects, the information set forth therein
when read in conjunction with the related consolidated
financial statements. Also, in our
opinion, the Company maintained, in all material respects,
effective internal control over financial reporting as of June 30,
2017, based on criteria established in Internal Control -
Integrated Framework 2013 issued by the Committee of Sponsoring
Organizations of the Treadway Commission (COSO). The Company's
management is responsible for these financial statements and
financial statement schedules, for maintaining effective internal
control over financial reporting and for its assessment of the
effectiveness of internal control over financial reporting,
included in accompanying Management’s Annual Report on
Internal Control Over Financial Reporting under Item
15.
Our responsibility is to express
opinions on these financial statements, on the financial statement
schedules, and on the Company's internal control over financial
reporting based on our integrated audits. We conducted our audits
in accordance with the standards of the Public Company Accounting
Oversight Board (United States). Those standards require that we
plan and perform the audits to obtain reasonable assurance about
whether the financial statements are free of material misstatement
and whether effective internal control over financial reporting was
maintained in all material respects. Our audits of the financial
statements included examining, on a test basis, evidence supporting
the amounts and disclosures in the financial statements, assessing
the accounting principles used and significant estimates made by
management, and evaluating the overall financial statement
presentation. Our audit of internal control over financial
reporting included obtaining an understanding of internal control
over financial reporting, assessing the risk that a material
weakness exists, and testing and evaluating the design and
operating effectiveness of internal control based on the assessed
risk. Our audits also included performing such other procedures as
we considered necessary in the circumstances. We believe that our
audits provide a reasonable basis for our opinions.
As discussed in Note
2.1b to the consolidated financial
statements, the Company changed the manner in which it accounts for
investment
property from the cost model to the fair value model
in
2017.
A company’s internal control
over financial reporting is a process designed to provide
reasonable assurance regarding the reliability of financial
reporting and the preparation of financial statements for external
purposes in accordance with generally accepted accounting
principles. A company’s internal control over financial
reporting includes those policies and procedures that
(i) pertain to the maintenance of records that, in reasonable
detail, accurately and fairly reflect the transactions and
dispositions of the assets of the company; (ii) provide
reasonable assurance that transactions are recorded as necessary to
permit preparation of financial statements in accordance with
generally accepted accounting principles, and that receipts and
expenditures of the company are being made only in accordance with
authorizations of management and directors of the company; and
(iii) provide reasonable assurance regarding prevention or
timely detection of unauthorized acquisition, use, or disposition
of the company’s assets that could have a material effect on
the financial statements.
Because of its inherent limitations,
internal control over financial reporting may not prevent or detect
misstatements. Also, projections of any evaluation of effectiveness
to future periods are subject to the risk that controls may become
inadequate because of changes in conditions, or that the degree of
compliance with the policies or procedures may
deteriorate.
PRICE WATERHOUSE & Co.
S.R.L.
By:/s/
Eduardo Alfredo Loiácono (Partner)
Eduardo Alfredo
Loiácono
Buenos Aires, Argentina
October 31, 2017
F-2
Glossary
The followings are not technical
definitions, but help the reader to understand certain terms used
in the wording of the notes to the Group´s Consolidated
Financial Statements.
|
Terms
|
|
Definitions
|
|
Adama
|
|
Adama Agricultural Solutions
Ltd.
|
|
BACS
|
|
Banco de Crédito y
Securitización S.A.
|
|
Bartan
|
|
Bartan Holdings and Investments
Ltd.
|
|
BASE
|
|
Buenos Aires Stock
Exchange
|
|
BCRA
|
|
Central Bank of the Argentine
Republic
|
|
BHSA
|
|
Banco Hipotecario S.A.
|
|
BMBY
|
|
Buy Me Buy You (Note
4.H.a)
|
|
BNSA
|
|
Boulevard Norte S.A.
|
|
Cellcom
|
|
Cellcom Israel Ltd.
|
|
IFRIC
|
|
International Financial Reporting
Standards Interpretation Committee
|
|
Clal
|
|
Clal Holdings Insurance Enterprises
Ltd.
|
|
CNV
|
|
Securities Exchange
Commission
|
|
CODM
|
|
Chief Operating Decision
Maker
|
|
Condor
|
|
Condor Hospitality Trust
Inc.
|
|
Cresud
|
|
Cresud S.A.C.I.F. y A.
|
|
DFL
|
|
Dolphin Fund Ltd.
|
|
DIC
|
|
Discount Investment Corporation
Ltd.
|
|
DN B.V.
|
|
Dolphin Netherlands
B.V.
|
|
Dolphin
|
|
Dolphin Fund Ltd. and Dolphin
Netherlands B.V.
|
|
EHSA
|
|
Entertainment Holdings
S.A.
|
|
Electra
|
|
Electra Consumer Products
Ltd.
|
|
ENUSA
|
|
Entretenimiento Universal
S.A.
|
|
ERSA
|
|
Emprendimiento Recoleta
S.A.
|
|
ETH
|
|
C.A.A. Extra Holdings
Ltd.
|
|
CPF
|
|
Collective Promotion
Funds
|
|
GCBA
|
|
Autonomous City of Buenos Aires
Government
|
|
Golan
|
|
Golan Telecom Ltd
|
|
IASB
|
|
International Accounting
Interpretations Board
|
|
IDB Tourism
|
|
IDB Tourism (2009) Ltd
|
|
IDBD
|
|
IDB Development Corporation
Ltd.
|
|
IDBGI
|
|
IDB Group Investment
Inc.
|
|
IDBH
|
|
IDB Holdings Corporation
Ltd.
|
|
IFISA
|
|
Inversiones Financieras del Sur
S.A.
|
|
CPI
|
|
Consumer Price Index
|
|
IRSA, “The Company”,
“Us”, “We”
|
|
IRSA Inversiones y Representaciones
Sociedad Anónima
|
|
IRSA CP
|
|
IRSA Propiedades Comerciales
S.A.
|
|
Israir
|
|
Israir Airlines & Tourism
Ltd.
|
|
Koor
|
|
Koor Industries Ltd.
|
|
Lipstick
|
|
Lipstick Management LLC
|
|
LRSA
|
|
La Rural S.A.
|
|
Metropolitan
|
|
Metropolitan 885 Third Avenue
Leasehold LLC
|
|
MPIT
|
|
Minimum Presumed Income
Tax
|
|
New Lipstick
|
|
New Lipstick LLC
|
|
IAS
|
|
International Accounting
Standards
|
|
IFRS
|
|
International Financial Reporting
Standards
|
|
NIS
|
|
New Israeli Shekel
|
|
NFSA
|
|
Nuevas Fronteras S.A.
|
|
NPSF
|
|
Nuevo Puerto Santa Fe
S.A.
|
|
NYSE
|
|
New York Stock Exchange
|
|
OASA
|
|
OGDEN Argentina S.A.
|
|
NCN
|
|
Non-Convertible Notes
|
|
PAMSA
|
|
Panamerican Mall S.A.
|
|
PBC
|
|
Property & Building Corporation
Ltd.
|
|
PBEL
|
|
Real Estate LTD
|
|
Puerto Retiro
|
|
Puerto Retiro S.A.
|
|
Quality
|
|
Quality Invest S.A.
|
|
Rigby
|
|
Rigby 183 LLC
|
|
Rock Real
|
|
Rock Real Estate Partners
Limited
|
|
Shufersal
|
|
Shufersal Ltd.
|
|
SRA
|
|
Sociedad Rural
Argentina
|
|
Tarshop
|
|
Tarshop S.A.
|
|
TASE
|
|
Tel Aviv Stock Exchange
|
|
Tender offers
|
|
Repurchase agreement
|
F-3
IRSA
Inversiones y Representaciones Sociedad
Anónima
as of
June 30, 2017, 2016, 2015 and 2014
(All amounts in millions of
Argentine Pesos, except otherwise indicated)
|
|
06.30.17
|
06.30.16
(recast)
|
06.30.15
(recast)
|
06.30.14
(recast)
|
|
|
|
Note
|
|
|
|
|
|
ASSETS
|
|
|
|
|
|
|
Non-current
assets
|
|
|
|
|
|
|
Investment
properties
|
10
|
99,953
|
82,703
|
19,217
|
15,796
|
|
Property, plant and
equipment
|
11
|
27,113
|
24,049
|
237
|
219
|
|
Trading
properties
|
12
|
4,532
|
4,730
|
141
|
131
|
|
Intangible
assets
|
13
|
12,387
|
11,763
|
127
|
124
|
|
Investments in
associates and joint ventures
|
8 and
9
|
7,885
|
16,880
|
2,970
|
2,587
|
|
Deferred income tax
assets
|
21
|
285
|
51
|
57
|
41
|
|
Income tax and MPIT
credit
|
|
145
|
123
|
109
|
110
|
|
Restricted
assets
|
14
|
448
|
54
|
-
|
-
|
|
Trade and other
receivables
|
15
|
4,974
|
3,441
|
115
|
92
|
|
Employee
benefits
|
|
-
|
4
|
-
|
-
|
|
Investments in
financial assets
|
14
|
1,772
|
2,226
|
703
|
275
|
|
Financial assets held
for sale
|
14
|
6,225
|
3,346
|
-
|
-
|
|
Derivative financial
instruments
|
14
|
31
|
8
|
206
|
-
|
|
Total non-current
assets
|
|
165,750
|
149,378
|
23,882
|
19,375
|
|
Current assets
|
|
|
|
|
|
|
Trading
properties
|
12
|
1,249
|
241
|
3
|
5
|
|
Inventories
|
|
4,260
|
3,246
|
23
|
17
|
|
Restricted
assets
|
14
|
506
|
564
|
9
|
-
|
|
Income tax and MPIT
credit
|
|
339
|
506
|
19
|
16
|
|
Group of assets held
for sale
|
31
|
2,681
|
-
|
-
|
1,649
|
|
Trade and other
receivables
|
15
|
17,264
|
13,409
|
1,143
|
707
|
|
Investments in
financial assets
|
14
|
11,951
|
9,656
|
295
|
234
|
|
Financial assets held
for sale
|
14
|
2,337
|
1,256
|
-
|
-
|
|
Derivative financial
instruments
|
14
|
51
|
19
|
29
|
13
|
|
Cash and cash
equivalents
|
14
|
24,854
|
13,866
|
375
|
610
|
|
Total current
assets
|
|
65,492
|
42,763
|
1,896
|
3,251
|
|
TOTAL ASSETS
|
|
231,242
|
192,141
|
25,778
|
22,626
|
|
SHAREHOLDERS’
EQUITY
|
|
|
|
|
|
|
Capital and reserves
attributable to equity holders of the parent
|
|
|
|
|
|
|
Share
capital
|
|
575
|
575
|
574
|
574
|
|
Treasury
shares
|
|
4
|
4
|
5
|
5
|
|
Inflation adjustment of
share capital and treasury shares
|
|
123
|
123
|
123
|
123
|
|
Share
premium
|
|
793
|
793
|
793
|
793
|
|
Additional paid-in
capital from treasury shares
|
|
17
|
16
|
7
|
-
|
|
Legal
reserve
|
|
143
|
117
|
117
|
117
|
|
Special
reserve
|
17
|
2,751
|
2,755
|
2,755
|
3,126
|
|
Other
reserves
|
17
|
2,165
|
990
|
428
|
931
|
|
Retained
earnings
|
|
19,293
|
16,259
|
7,235
|
4,551
|
|
Total attributable to equity
holders of the parent
|
|
25,864
|
21,632
|
12,037
|
10,220
|
|
Non-controlling
interest
|
|
21,472
|
14,224
|
943
|
998
|
|
TOTAL SHAREHOLDERS’
EQUITY
|
|
47,336
|
35,856
|
12,980
|
11,218
|
|
LIABILITIES
|
|
|
|
|
|
|
Non-current
liabilities
|
|
|
|
|
|
|
Trade and other
payables
|
18
|
3,040
|
1,518
|
255
|
202
|
|
Borrowings
|
20
|
109,489
|
90,680
|
3,736
|
3,756
|
|
Derivative financial
instruments
|
14
|
86
|
105
|
265
|
321
|
|
Deferred income tax
liabilities
|
21
|
23,024
|
19,150
|
5,830
|
4,546
|
|
Employee
benefits
|
|
763
|
689
|
-
|
-
|
|
Salaries and social
security liabilities
|
|
127
|
11
|
2
|
4
|
|
Provisions
|
19
|
943
|
532
|
29
|
29
|
|
Total non-current
liabilities
|
|
137,472
|
112,685
|
10,117
|
8,858
|
|
Current
liabilities
|
|
|
|
|
|
|
Trade and other
payables
|
18
|
20,839
|
17,874
|
896
|
679
|
|
Group of liabilities
held for sale
|
31
|
1,855
|
-
|
-
|
938
|
|
Salaries and social
security liabilities
|
|
2,041
|
1,707
|
123
|
99
|
|
Borrowings
|
20
|
19,926
|
22,252
|
1,237
|
737
|
|
Derivative financial
instruments
|
14
|
86
|
112
|
238
|
14
|
|
Provisions
|
19
|
890
|
1,039
|
52
|
18
|
|
Income tax and MPIT
liabilities
|
|
797
|
616
|
135
|
65
|
|
Total current
liabilities
|
|
46,434
|
43,600
|
2,681
|
2,550
|
|
TOTAL
LIABILITIES
|
|
183,906
|
156,285
|
12,798
|
11,408
|
|
TOTAL SHAREHOLDERS’
EQUITY AND LIABILITIES
|
|
231,242
|
192,141
|
25,778
|
22,626
|
The accompanying notes are an
integral part of these Consolidated Financial
Statements.
Prior periods have been recast for
the company’s change in accounting policy for investment
properties as described in Note 2.1.b.
F-4
IRSA Inversiones y Representaciones Sociedad
Anónima
for the fiscal years ended June 30, 2017, 2016 and
2015
(All
amounts in millions of Argentine Pesos, except otherwise
indicated)
|
|
Note
|
06.30.17
|
|
06.30.16 (recast)
|
|
06.30.15 (recast)
|
|
Revenues
|
23
|
74,172
|
|
31,523
|
|
3,403
|
|
Costs
|
24
|
(51,521)
|
|
(21,099)
|
|
(1,369)
|
|
Gross profit
|
|
22,651
|
|
10,424
|
|
2,034
|
|
Net
gain from fair value adjustments of investment
properties
|
10
|
4,453
|
|
17,559
|
|
3,958
|
|
General
and administrative expenses
|
24
|
(3,843)
|
|
(1,839)
|
|
(374)
|
|
Selling
expenses
|
24
|
(13,441)
|
|
(5,704)
|
|
(194)
|
|
Other
operating results, net
|
25
|
(270)
|
|
(51)
|
|
33
|
|
Profit from operations
|
|
9,550
|
|
20,389
|
|
5,457
|
|
Share
of profit / (loss) of associates and joint ventures
|
8 and 9
|
185
|
|
508
|
|
(813)
|
|
Profit from operations before financial results and income
tax
|
|
9,735
|
|
20,897
|
|
4,644
|
|
Finance
income
|
26
|
1,081
|
|
1,296
|
|
137
|
|
Finance
costs
|
26
|
(8,628)
|
|
(5,668)
|
|
(1,107)
|
|
Other
financial results
|
26
|
2,929
|
|
(518)
|
|
37
|
|
Financial results, net
|
26
|
(4,618)
|
|
(4,890)
|
|
(933)
|
|
Profit before income tax
|
|
5,117
|
|
16,007
|
|
3,711
|
|
Income
tax
|
21
|
(2,915)
|
|
(6,373)
|
|
(1,581)
|
|
Profit
for the year from continuing
operations
|
|
2,202
|
|
9,634
|
|
2,130
|
|
Profit
from
discontinued
operations
|
32
|
3,018
|
|
444
|
|
-
|
|
Profit for the year
|
|
5,220
|
|
10,078
|
|
2,130
|
|
|
|
|
|
|
|
|
|
Profit
from continuing
operations attributable to:
|
|
|
|
|
|
|
|
Equity
holders of the parent
|
|
1,786
|
|
9,325
|
|
1,898
|
|
Non-controlling
interest
|
|
416
|
|
309
|
|
232
|
|
|
|
|
|
|
|
|
|
Profit
from discontinued
operations attributable to:
|
|
|
|
|
|
|
|
Equity
holders of the parent
|
|
1,244
|
|
209
|
|
-
|
|
Non-controlling
interest
|
|
1,774
|
|
235
|
|
-
|
|
|
|
|
|
|
|
|
|
Profit for the year
attributable
to:
|
|
|
|
|
|
|
|
Equity
holders of the parent
|
|
3,030
|
|
9,534
|
|
1,898
|
|
Non-controlling
interest
|
|
2,190
|
|
544
|
|
232
|
|
|
|
|
|
|
|
|
|
Profit from continuing operations per share
attributable to equity holders of the
parent:
|
|
|
|
|
|
|
|
Basic
|
|
3.11
|
|
16.22
|
|
3.31
|
|
Diluted
(i)
|
|
3.08
|
|
16.11
|
|
3.28
|
|
|
|
|
|
|
|
|
|
Profit from discontinued operations per share
attributable to equity holders of the
parent:
|
|
|
|
|
|
|
|
Basic
|
|
2.16
|
|
0.36
|
|
-
|
|
Diluted
(i)
|
|
2.15
|
|
0.36
|
|
-
|
|
|
|
|
|
|
|
|
|
Profit for the year per share attributable to equity holders of the
parent:
|
|
|
|
|
|
|
|
Basic
|
|
5.27
|
|
16.58
|
|
3.31
|
|
Diluted
(i)
|
|
5.23
|
|
16.47
|
|
3.28
|
The
accompanying notes are an integral part of these Consolidated
Financial Statements.
Prior
periods have been recast for the company’s change in
accounting policy for investment properties as described in Note
2.1.b.
F-5
IRSA
Inversiones y Representaciones Sociedad
Anónima
Consolidated
Statements of Comprehensive Income
for the fiscal years ended June
30, 2017, 2016 and 2015
(All amounts in
millions of Argentine Pesos, except otherwise
indicated)
|
|
06.30.17
|
06.30.16
(recast)
|
06.30.15
(recast)
|
|
Profit for the
year
|
5,220
|
10,078
|
2,130
|
|
Other comprehensive income /
(loss):
|
|
|
|
|
Items
that may be reclassified subsequently to profit or
loss:
|
|
|
|
|
Cumulative
translation adjustment
|
3,839
|
4,353
|
(108
)
|
|
Change in the fair
value of hedging instruments net of income taxes
|
124
|
3
|
-
|
|
Items
that may not be reclassified subsequently to profit or loss, net of
income tax:
|
|
|
|
|
Actuarial loss from
defined benefit plans
|
(10
)
|
(29
)
|
-
|
|
Other
comprehensive income / (loss) for the year from continuing
operations
|
3,953
|
4,327
|
(108
)
|
|
Other comprehensive income
/ (loss) for the year from discontinued operations
|
560
|
(194
)
|
-
|
|
Total
other comprehensive income / (loss) for the year
|
4,513
|
4,133
|
(108
)
|
|
Total
comprehensive income for the year
|
9,733
|
14,211
|
2,022
|
|
|
|
|
|
|
Total comprehensive income
from continuing operations
|
6,155
|
13,961
|
2,022
|
|
Total comprehensive income
from discontinuing operations
|
3,578
|
250
|
-
|
|
Total
comprehensive income for the year
|
9,733
|
14,211
|
2,022
|
|
|
|
|
|
|
Total
comprehensive income for the year from continuing operations
attributable to:
|
|
|
|
|
Equity holders of the
parent
|
2,380
|
9,466
|
1,773
|
|
Non-controlling
interest
|
3,775
|
4,495
|
249
|
|
|
|
|
|
|
Total comprehensive income
for the year
attributable
to
:
|
|
|
|
|
Equity holders of the
parent
|
4,054
|
9,605
|
1,773
|
|
Non-controlling
interest
|
5,679
|
4,606
|
249
|
The accompanying notes are an
integral part of these Consolidated Financial
Statements.
Prior periods have been recast for
the company’s change in accounting policy for investment
properties as described in Note 2.1.b.
F-6
IRSA
Inversiones y Representaciones Sociedad
Anónima
Consolidated
Statements of Changes in Shareholders’ Equity
for the
fiscal years ended June 30, 2017, 2016 and 2015
(All amounts in millions of
Argentine Pesos, except otherwise indicated)
|
|
Attributable
to equity holders of the parent
|
|
|
|||||||||
|
|
Share
capital
|
Treasury
shares
|
Inflation
adjustment
of share
capital and treasury shares (1)
|
Share
premium
|
Additional
paid-in capital from treasury shares
|
Legal
reserve
|
Special
Reserve
(2)
|
Other
reserves
(Note
17)
|
Retained
earnings
|
Subtotal
|
Non-controlling
interest
|
Total
Shareholders’ equity
|
|
Balances as of June 30, 2016
(recast
)
|
575
|
4
|
123
|
793
|
16
|
117
|
2,755
|
990
|
16,259
|
21,632
|
14,224
|
35,856
|
|
Profit for the
year
|
-
|
-
|
-
|
-
|
-
|
-
|
-
|
-
|
3,030
|
3,030
|
2,190
|
5,220
|
|
Other comprehensive
income for the year
|
-
|
-
|
-
|
-
|
-
|
-
|
-
|
1,024
|
-
|
1,024
|
3,489
|
4,513
|
|
Total comprehensive income
for the year
|
-
|
-
|
-
|
-
|
-
|
-
|
-
|
1,024
|
3,030
|
4,054
|
5,679
|
9,733
|
|
Out-of-period
adjustments(Note 2.27)
|
-
|
-
|
-
|
-
|
-
|
-
|
-
|
-
|
-
|
-
|
(133
)
|
(133
)
|
|
Incorporated by business
combination (Note 4)
|
-
|
-
|
-
|
-
|
-
|
-
|
-
|
-
|
-
|
-
|
40
|
40
|
|
Irrevocable contributions
from non-controlling interest
|
-
|
-
|
-
|
-
|
-
|
-
|
-
|
-
|
-
|
-
|
2
|
2
|
|
Capitalization of
contributions at subsidiaries
|
-
|
-
|
-
|
-
|
-
|
-
|
-
|
-
|
-
|
-
|
(1
)
|
(1
)
|
|
Issuance of capital of
subsidiaries
|
-
|
-
|
-
|
-
|
-
|
-
|
-
|
-
|
-
|
-
|
2,267
|
2,267
|
|
Appropriation of retained
earnings approved by Shareholders’ meeting held
10.31.16
|
-
|
-
|
-
|
-
|
-
|
26
|
(4
)
|
(26
)
|
4
|
-
|
-
|
-
|
|
Share-based
compensation
|
-
|
-
|
-
|
-
|
1
|
-
|
-
|
12
|
-
|
13
|
87
|
100
|
|
Capital reduction of
subsidiaries
|
-
|
-
|
-
|
-
|
-
|
-
|
-
|
-
|
-
|
-
|
(6
)
|
(6
)
|
|
Dividends distribution to
non-controlling interest
|
-
|
-
|
-
|
-
|
-
|
-
|
-
|
-
|
-
|
-
|
(2,232
)
|
(2,232
)
|
|
Changes in non-controlling
interest
|
-
|
-
|
-
|
-
|
-
|
-
|
-
|
165
|
-
|
165
|
1,545
|
1,710
|
|
Balances
as of June 30, 2017
|
575
|
4
|
123
|
793
|
17
|
143
|
2,751
|
2,165
|
19,293
|
25,864
|
21,472
|
47,336
|
The accompanying notes are
an integral part of these Consolidated Financial
Statements.
Prior periods have been
recast for the company’s change in accounting policy for
investment properties as described in Note 2.1.b.
(1) Includes Ps. 1
of inflation adjustment of treasury shares. See Note
17.
(2) Related to CNV
General Resolution Nº609/12. It includes the effect as of July
1st 2011, due to the change in the valuation method of investment
properties. See Notes 2.1.b) and 17.
F-7
IRSA
Inversiones y Representaciones Sociedad
Anónima
Consolidated Statements of Changes in Shareholders’
Equity
for the fiscal years ended June 30, 2017, 2016 and
2015
(All amounts in millions of
Argentine Pesos, except otherwise indicated)
|
|
Attributable
to equity holders of the parent
|
|
|
|||||||||
|
|
Share
capital
|
Treasury
shares
|
Inflation
adjustment
of share
capital and treasury shares (1)
|
Share
premium
|
Additional
paid-in capital from treasury shares
|
Legal
reserve
|
Special
Reserve
(2)
|
Other
reserves
(Note
17)
|
Retained
earnings
|
Subtotal
|
Non-controlling
interest
|
Total
Shareholder’s equity
|
|
Balances
as of June 30, 2015 (recast)
|
574
|
5
|
123
|
793
|
7
|
117
|
2,755
|
428
|
7,235
|
12,037
|
943
|
12,980
|
|
Profit for the
year
|
-
|
-
|
-
|
-
|
-
|
-
|
-
|
-
|
9,534
|
9,534
|
544
|
10,078
|
|
Other comprehensive income
for the year
|
-
|
-
|
-
|
-
|
-
|
-
|
-
|
71
|
-
|
71
|
4,062
|
4,133
|
|
Total
comprehensive income for the year
|
-
|
-
|
-
|
-
|
-
|
-
|
-
|
71
|
9,534
|
9,605
|
4,606
|
14,211
|
|
Appropriation of retained
earnings approved by Shareholders’ meeting held
11.26.15
|
-
|
-
|
-
|
-
|
-
|
-
|
-
|
520
|
(520
)
|
-
|
-
|
-
|
|
Share-based
compensation
|
1
|
(1
)
|
-
|
-
|
9
|
-
|
-
|
8
|
-
|
17
|
34
|
51
|
|
Share of changes in
subsidiaries’ equity
|
-
|
-
|
-
|
-
|
-
|
-
|
-
|
37
|
-
|
37
|
51
|
88
|
|
Cumulative translation
adjustment for interest held before business
combination
|
-
|
-
|
-
|
-
|
-
|
-
|
-
|
(91
)
|
-
|
(91
)
|
-
|
(91
)
|
|
Incorporated by business
combination
|
-
|
-
|
-
|
-
|
-
|
-
|
-
|
-
|
-
|
-
|
8,630
|
8,630
|
|
Capital reduction of
subsidiaries
|
-
|
-
|
-
|
-
|
-
|
-
|
-
|
-
|
-
|
-
|
(4
)
|
(4
)
|
|
Changes in non-controlling
interest
|
-
|
-
|
-
|
-
|
-
|
-
|
-
|
17
|
-
|
17
|
568
|
585
|
|
Capital contribution from
non-controlling interest
|
-
|
-
|
-
|
-
|
-
|
-
|
-
|
-
|
-
|
-
|
11
|
11
|
|
Reimbursement of expired
dividends
|
-
|
-
|
-
|
-
|
-
|
-
|
-
|
-
|
10
|
10
|
-
|
10
|
|
Dividends distribution to
non-controlling interest
|
-
|
-
|
-
|
-
|
-
|
-
|
-
|
-
|
-
|
-
|
(615
)
|
(615
)
|
|
Balances
as of June 30, 2016 (recast)
|
575
|
4
|
123
|
793
|
16
|
117
|
2,755
|
990
|
16,259
|
21,632
|
14,224
|
35,856
|
The accompanying notes are
an integral part of these Consolidated Financial
Statements.
Prior periods have been
recast for the company’s change in accounting policy for
investment properties as described in Note 2.1.b.
(1) Includes Ps. 1
of inflation adjustment of treasury shares. See Note
17.
(2) Related to CNV
General Resolution Nº609/12. It includes the effect as of July
1st 2011, due to the change in the valuation method of investment
properties. See Notes 2.1.b) and 17.
F-8
IRSA
Inversiones y Representaciones Sociedad
Anónima
Consolidated Statements of Changes in Shareholders’
Equity
for the fiscal years ended June 30, 2017, 2016 and
2015
(All amounts in millions of
Argentine Pesos, except otherwise indicated)
|
|
Attributable
to equity holders of the parent
|
|
|
|||||||||
|
|
Share
capital
|
Treasury
shares
|
Inflation
adjustment
of share
capital and treasury shares (1)
|
Share
premium
|
Additional
paid-in capital from treasury shares
|
Legal
reserve
|
Special
Reserve
(2)
|
Other
reserves
(Note
17)
|
Retained
earnings
|
Subtotal
|
Non-controlling
interest
|
Total
Shareholder’s equity
|
|
Balances
as of June 30, 2014
|
574
|
5
|
123
|
793
|
-
|
117
|
375
|
806
|
(785
)
|
2,008
|
548
|
2,556
|
|
Revaluation adjustment at
fair value of investment property (Note 2.1.b)
|
-
|
-
|
-
|
-
|
-
|
-
|
2,751
|
125
|
5,336
|
8,212
|
450
|
8,662
|
|
Balances
as of July 1, 2014 (recast)
|
574
|
5
|
123
|
793
|
-
|
117
|
3,126
|
931
|
4,551
|
10,220
|
998
|
11,218
|
|
Profit for the
year
|
-
|
-
|
-
|
-
|
-
|
-
|
-
|
-
|
1,898
|
1,898
|
232
|
2,130
|
|
Other comprehensive (loss)
/ income for the year
|
-
|
-
|
-
|
-
|
-
|
-
|
-
|
(125
)
|
-
|
(125
)
|
17
|
(108
)
|
|
Total comprehensive (loss) /
income for the year
|
-
|
-
|
-
|
-
|
-
|
-
|
-
|
(125
)
|
1,898
|
1,773
|
249
|
2,022
|
|
Appropriation of retained
earnings approved by Shareholder’s’ meeting held
06.19.14
|
-
|
-
|
-
|
-
|
-
|
-
|
(371
)
|
(414
)
|
785
|
-
|
-
|
-
|
|
Reserve for share-based
compensation
|
-
|
-
|
-
|
-
|
-
|
-
|
-
|
22
|
-
|
22
|
-
|
22
|
|
Share-based
compensation
|
-
|
-
|
-
|
-
|
7
|
-
|
-
|
(7
)
|
-
|
-
|
-
|
-
|
|
Capital
reduction
|
-
|
-
|
-
|
-
|
-
|
-
|
-
|
-
|
-
|
-
|
(228
)
|
(228
)
|
|
Changes in non-controlling
interest
|
-
|
-
|
-
|
-
|
-
|
-
|
-
|
21
|
-
|
21
|
(27
)
|
(6
)
|
|
Reimbursement of expired
dividends
|
-
|
-
|
-
|
-
|
-
|
-
|
-
|
-
|
1
|
1
|
-
|
1
|
|
Dividends distribution to
non-controlling interest
|
-
|
-
|
-
|
-
|
-
|
-
|
-
|
-
|
-
|
-
|
(65
)
|
(65
)
|
|
Capital contribution of
non-controlling interest
|
-
|
-
|
-
|
-
|
-
|
-
|
-
|
-
|
-
|
-
|
16
|
16
|
|
Balances
as of June 30, 2015 (recast)
|
574
|
5
|
123
|
793
|
7
|
117
|
2,755
|
428
|
7,235
|
12,037
|
943
|
12,980
|
The accompanying notes are
an integral part of these Consolidated Financial
Statements.
Prior periods have been
recast for the company’s change in accounting policy for
investment properties as described in Note 2.1.b.
(1) Includes Ps. 1
of inflation adjustment of treasury shares. See Note
17.
(2) Related to CNV
General Resolution Nº609/12. It includes the effect as of July
1st 2011, due to the change in the valuation method of investment
properties. See Notes 2.1.b) and 17.
F-9
IRSA
Inversiones y Representaciones Sociedad
Anónima
for the
fiscal years ended June 30, 2017, 2016 and 2015
(All amounts in
millions of Argentine Pesos, except otherwise
indicated)
|
|
06.30.17
|
06.30.16
(recast)
|
06.30.15
(recast)
|
|
|
|
Note
|
|
|
|
|
Operating
activities:
|
|
|
|
|
|
Net cash generated
from continuing operating activities before income tax
paid
|
16
|
9,704
|
4,866
|
1,263
|
|
Income tax and MPIT
paid
|
|
(967
)
|
(804
)
|
(429
)
|
|
Net cash
generated from continuing operating activities
|
|
8,737
|
4,062
|
834
|
|
Net cash generated
from discontinued operating activities
|
|
322
|
77
|
-
|
|
Net cash
generated from operating activities
|
|
9,059
|
4,139
|
834
|
|
Investing
activities:
|
|
|
|
|
|
Capital increases
contributions to joint ventures and associates
|
|
(183
)
|
(207
)
|
(39
)
|
|
Purchases of
investment properties
|
|
(2,853
)
|
(888
)
|
(407
)
|
|
Proceeds from sales
of investment properties
|
|
291
|
1,393
|
2,447
|
|
Purchases of
property, plant and equipment
|
|
(2,629
)
|
(1,021
)
|
(48
)
|
|
Proceeds from sales
of property, plant and equipment
|
|
8
|
-
|
-
|
|
Purchases of
intangible assets
|
|
(501
)
|
(131
)
|
(5
)
|
|
Purchases of joint
ventures and associates
|
|
(348
)
|
-
|
(1,242
)
|
|
Proceeds from sales
of associates and joint ventures
|
|
-
|
9
|
56
|
|
Purchases of
subsidiaries, net of cash acquired
|
16
|
(46
)
|
-
|
-
|
|
Cash incorporated by
business combination, net of cash paid
|
16
|
-
|
9,193
|
-
|
|
Dividends
received
|
|
251
|
99
|
13
|
|
Purchases of
investments in financial assets
|
|
(4,782
)
|
(11,901
)
|
(2,934
)
|
|
Proceeds from sales
of investments in financial assets
|
|
4,569
|
11,957
|
2,339
|
|
Interests received of
financial assets
|
|
216
|
112
|
95
|
|
Loans granted to
related parties
|
|
(4
)
|
(852
)
|
-
|
|
Suppliers
advances
|
|
-
|
(7
)
|
(14
)
|
|
Net cash
(used in) generated from continuing investing
activities
|
(6,011
)
|
7,756
|
261
|
|
|
Net cash
generated from discontinued investing activities
|
3,943
|
454
|
-
|
|
|
Net cash
(used in) generated in investing activities
|
|
(2,068
)
|
8,210
|
261
|
|
Financing
activities:
|
|
|
|
|
|
Borrowings
|
|
6,250
|
6,011
|
606
|
|
Payment of
borrowings
|
|
(14,577
)
|
(9,554
)
|
(1,073
)
|
|
Issuance of
non-convertible notes
|
|
20,435
|
7,622
|
-
|
|
Payment of principal
from non-convertible notes
|
|
(5,531
)
|
(4,253
)
|
-
|
|
Loans from related
parties
|
|
-
|
4
|
22
|
|
Payment of borrowings
from joint ventures and associates
|
|
(14
)
|
(6
)
|
(2
)
|
|
Interests
paid
|
|
(5,692
)
|
(3,365
)
|
(547
)
|
|
Issuance of capital
in subsidiaries
|
|
2,112
|
-
|
-
|
|
Capital distribution
to non-controlling interest in subsidiaries
|
|
(6
)
|
(197
)
|
(228
)
|
|
Capital contributions
of non-controlling interest
|
|
202
|
1
|
16
|
|
Acquisition of
non-controlling interest in subsidiaries
|
|
(1,049
)
|
(1,047
)
|
(6
)
|
|
Proceeds from sale of
non-controlling interest in subsidiaries
|
|
2,738
|
-
|
-
|
|
Dividends
paid
|
|
(2,512
)
|
(106
)
|
(69
)
|
|
Receipts from
claims
|
|
-
|
90
|
-
|
|
Acquisition of
derivative financial instruments
|
|
(131
)
|
(620
)
|
(111
)
|
|
Proceeds from
derivative financial instruments
|
|
151
|
1,951
|
2
|
|
Net
cash generated from (used in) continuing financing
activities
|
|
2,376
|
(3,469
)
|
(1,390
)
|
|
Net cash used in
discontinued financing activities
|
|
(839
)
|
(499
)
|
-
|
|
Net
cash generated from (used in) financing activities
|
|
1,537
|
(3,968
)
|
(1,390
)
|
|
Net increase
(decrease) in cash and cash equivalents from continuing
activities
|
|
5,102
|
8,349
|
(295
)
|
|
Net increase in cash
and cash equivalents by discontinued activities
|
3,426
|
32
|
-
|
|
|
Net
Increase (decrease) in cash and cash equivalents
|
|
8,528
|
8,381
|
(295
)
|
|
Cash and cash
equivalents at beginning of year
|
14
|
13,866
|
375
|
610
|
|
Cash and cash
equivalents reclassified to held for sale
|
|
(157
)
|
-
|
-
|
|
Foreign exchange gain
on cash and cash equivalents
|
|
2,617
|
5,110
|
60
|
|
Cash
and cash equivalents at end of the year
|
14
|
24,854
|
13,866
|
375
|
The accompanying notes are
an integral part of these Consolidated Financial
Statements.
Prior periods have been
recast for the company’s change in accounting policy for
investment properties as described in Note 2.1.b.
F-10
IRSA Inversiones
y Representaciones Sociedad Anónima
Notes to Consolidated Financial Statements
(Amounts in millions of Argentine
Pesos, except otherwise indicated)
1.
The Group’s business
and general information
IRSA was founded in 1943, and it is
engaged in a diversified range of real estate activities in
Argentina since 1991.
IRSA and its subsidiaries are
collectively referred to hereinafter as “the
Group”.
Cresud is our direct parent company
and IFIS Limited our ultimate parent company.
These Consolidated Financial
Statements have been approved for issue by the Board of Directors
on October 31, 2017.
The Group has established two
Operations Centers, Argentina and Israel, to manage its global
business, mainly through the following companies:
(i)
Remains in current and non-current assets, as
financial asset held for sale.
(ii)
Corresponds to Group’s associates, which
are hence excluded from consolidation.
(iii)
Disclosed in groups of assets and liabilities
held for sale.
F-11
IRSA Inversiones
y Representaciones Sociedad Anónima
Operations
Center in Argentina
The activities of the operations
center in Argentina are mainly developed through IRSA and its
principal subsidiary, IRSA CP. Through IRSA and IRSA CP, the Group
owns, manages and develops 16 shopping malls across Argentina, a
portfolio of offices and other rental properties in the Autonomous
City of Buenos Aires, and it entered the United States of America
(“USA”) real estate market in 2009, mainly through the
acquisition of non-controlling interests in office buildings and
hotels. Through IRSA or IRSA CP, the Group also develops
residential properties for sale. The Group, through IRSA, is also
involved in the operation of branded hotels. The Group uses the
term “real estate” indistinctively in these
Consolidated Financial Statements to denote investment, development
and/or trading properties activities. IRSA CP's shares are listed
and traded on both the BASE (BYMA: IRCP) and the NASDAQ (NASDAQ:
IRCP). IRSA's shares are listed on the BASE (Merval: IRSA) and the
NYSE (NYSE: IRSA).
The activities of the Group’s
segment “financial operations, corporate and others” is
carried out mainly through BHSA, where IRSA holds, directly or
indirectly, a 29.91% interest (without considering treasury
shares). BHSA is a commercial bank offering a wide variety of
banking activities and related financial services to individuals,
small and medium-sized companies and large corporations, including
the provision of mortgaged loans. BHSA's shares are listed on the
BASE (BYMA: BHIP). Besides that, the Group has a 43.93% indirect
equity interest in Tarshop, whose main activities are credit card
and loan origination transactions.
Operations
Center in Israel
During the fiscal year ended June
30, 2014, the Group made an investment in the Israeli market,
through DFL and DN B.V., in IDBD (an Israeli Company), with of an
initial interest of 26.65%. On October 11, 2015, the Group gain
control over IDBD (see Note 4). As a result, the Group has
consolidated significant figures of several industries from IDBD
and its subsidiaries.
IDBD is one of the Israeli largest
and most diversified conglomerates, which is involved, through its
subsidiaries and other investments, in several markets and
industries, including real estate, supermarkets, insurance,
telecommunications, etc.; controlling or holding any equity
interest in companies such as Clal (Insurance), Cellcom
(Telecommunications), Shufersal (Supermarkets), PBC (Real Estate),
among others.
IDBD is listed in the
TASE as a “Debentures Company” in accordance with
Israeli law, since some series of bonds are traded in that
Exchange.
IDBD has certain restrictions and
financial covenants in connection with its financial debt, included
in its debentures, loans from banks and financial institutions. In
relation to IDBD’s financial position, its cash flows and its
ability to meet its financial debt commitments, the following
should be taken into consideration:
●
Since September 2016, after the sale of Adama
and the increase in value of its subsidiaries in the market, IDBD
considers that it is possible to obtain new financing in the market
or refinance its actual debts. In this regard, IDBD has recently
completed successful issuance of debentures, as mentioned in Note
20. Additionally, it has made early repayments of its financial
debt and has managed to renegotiate the related financial
restrictions.
●
As mentioned in Note 7. DIC declared dividends,
out of which IDBD received approximately NIS 271 (equivalent to
approximately Ps. 1,219), net of the exercise of warrants mentioned
in Note 4.C.
●
In February 2017, Standard & Poor’s
Maalot (S&P Maalot) upgraded the rating of IDBD debentures,
from CCC to BB. Subsequently, in July 2017, S&P Maalot
increased the rating again to BBB with stable outlook.
●
As mentioned in Note 14, IDBD sold part of its
stake in Clal and signed a swap agreement for the future
sale.
Given the reasons described above,
IDBD considers that it has enough resources to continue operating
for at least 12 months after the date of these Consolidated
Financial Statements.
F-12
IRSA Inversiones
y Representaciones Sociedad Anónima
It should be noted that the Board of
Directors of IDBD has in place a 24-month cash flow forecast to
June 30, 2019, which assumes that IDBD will receive cash from the
realization of private investments directly held by IDBD. As a
result, IDBD expects to honor all its liabilities until the second
quarter of 2019. Even though consummation of such plans does not
depend entirely on factors under its control, IDBD believes it will
succeed in finalizing these or other plans.
Based on the foregoing, IDBD’s
management considers that there are currently no material
uncertainties regarding its ability to operate as a going concern,
given its current financial position and its ability to fulfil its
financial commitments in time and in due form and its capacity to
carry out its business plan.
Notwithstanding the foregoing, IDBD
expects to pay financial liabilities for NIS 1,413 (equivalent to
approximately Ps. 6,641 as of the closing date of these
Consolidated Financial Statements) in November 2019, that payment
would be affected by factors that are out of IDBD control, such as,
its ability to carry out its plans to sell its equity interest in
Clal considering the scheme determined by the Capital Market,
Insurance and Saving Commission of Israel (“the
Commissioner”), the requirements of the Act to Promote
Competition and Reduce Concentration (“Concentration
Act”) and its ability to deal with the implications of the
Concentration Act and to comply with the restrictions set out
therein regarding the control of companies through a pyramidal
structure (Note 7), among others.
IDBD expects that the consideration
to be received from the sale of Clal pursuant to the
Commissioner’s scheme, (i.e., the sale in tranches of 5% each
every four months) to the extent it is implemented, will be lower
and even significantly lower as compared to a block sale of its
controlling interest in Clal. However, even if Clal’s shares
continue to be sold in accordance to the scheme established by the
Commissioner, IDBD’s management considers that it would as
well have additional sources of cash flows available to satisfy its
commitments in November 2019. IDBD’s management considers
that it will be able to address its commitments timely and continue
with its operations.
It should be noted that the
financial position of IDBD and its subsidiaries on the Operations
Center in Israel does not adversely affect IRSA
’s cash
flows to satisfy the debts of IRSA
.
In addition, the commitments and
other covenants resulting from IDBD’s financial debt do not
have impact on IRSA since such indebtedness has no recourse against
IRSA and it is not guaranteed by IRSA’s assets.
2.
Summary of significant
accounting policies
2.1.
Basis of preparation of the
Consolidated Financial Statement
(a)
Basis of
preparation
These Consolidated Financial
Statements have been prepared in accordance with IFRS issued by
IASB and interpretations issued by the IFRIC. All IFRS applicable
as of the date of these Consolidated Financial Statements have been
applied.
Under IAS 29 “Financial
Reporting in Hyperinflationary Economies”, the Financial
Statements of an entity whose functional currency belongs to a
hyperinflationary economy, regardless of whether they apply
historic cost or current cost methods, should be stated at the
current unit of measure as of the date of this Consolidated
Financial Statements. For such purpose, in general, inflation is to
be computed in non-monetary items from the acquisition or
revaluation date, as applicable. In order to determine whether an
economy is to be considered hyperinflationary, the standard lists a
set of factors to be taken into account, including an accumulated
inflation rate near or above 100% over a three-year
period.
For the Operations Center in
Argentina, considering the released inflation data in Argentina and
the declining inflation trend in recent years, the Board of
Directors is of the view that there is not enough evidence to
conclude that Argentina is a hyperinflationary economy. Therefore,
no restatement has been applied on financial information, as set
forth by IAS 29, for the current fiscal year.
F-13
IRSA Inversiones
y Representaciones Sociedad Anónima
However, over the last years,
certain macroeconomic variables affecting the Company’s
business, such as payroll costs and input prices, have experienced
significant annual changes. This factor should be taken into
consideration in assessing and interpreting the financial situation
and results of operations of the Company in these Consolidated
Financial Statements.
IDBD’s fiscal year ends on
December 31 each year and IRSA’s fiscal year ends on June 30.
Furthermore, IDBD’s quarterly and annual reporting follow the
guidelines of Israeli standards, which means that the information
is available after the applicable statutory terms in Argentina.
Therefore, the Group is not able to include IDBD’s results in
its Consolidated Financial Statements to be filed with the CNV
within the applicable statutory terms in Argentina. The
IDBD’s results of operations are consolidated with a
three-month lag, adjusted for the effects of material transactions
that may take place during the reported period. Hence, IDBD’s
results of operations for the 12-month period beginning April
1
st
. 2016
through March 31, 2017 are included in the Group’s
Consolidated Statement of Comprehensive Income for the fiscal year
ended June 30, 2017, adjusted by such material transactions
occurred between April 1
st
. 2017 and June 30,
2017. In addition, IDBD’s results of operations for the
period beginning October 11, 2015 (the acquisition of control)
through March 31, 2016 are included in the Group’s
Consolidated Statement of Comprehensive Income for the fiscal year
ended June 30, 2016, adjusted by such material transactions
occurred between April 1
st
. 2016 and June 30,
2016.
(b)
Recast of
Financial Statements previously issued due to change in accounting
policies
The Group’s Board of Directors
decided to change the accounting policy for investment property
from cost model to fair value model, as permitted under IAS 40. The
Group considers this change better reflects the current value of
its core assets and therefore provides more relevant information to
Management, users of the Financial Statements and others.
Therefore, the previously issued Consolidated Financial Statements
were retroactively changed as required by IAS 8.
The tables below include
reconciliations between the Statements of Comprehensive Income for
the fiscal years ended June 30, 2016 and 2015, and the Statements
of Financial Position as of June 30, 2016, 2015, and 2014 as they
were originally issued, and these recast Consolidated Financial
Statements. There is no impact on any of the relevant total sums of
the Consolidated Statement of Cash Flows.
b.1. Statement of Income
and Statement of Other Comprehensive Income for the fiscal year
ended June 30, 2016:
|
|
06.30.2016
(originally
issued)
|
06.30.2016
(adjustment)
|
|
06.30.2016(other
reclassifications) h)
|
06.30.2016(recast)
|
|
Revenues
|
32,675
|
-
|
|
(1,152
)
|
31,523
|
|
Costs
|
(22,499
)
|
541
|
a)
|
859
|
(21,099
)
|
|
Gross
profit
|
10,176
|
541
|
|
(293
)
|
10,424
|
|
Gain from disposal of
investment properties
|
1,113
|
(1,113
)
|
b)
|
-
|
-
|
|
Net gain from fair value
adjustments of investment properties
|
-
|
17,898
|
c)
|
(339
)
|
17,559
|
|
General and administrative
expenses
|
(1,933
)
|
-
|
|
94
|
(1,839
)
|
|
Selling
expenses
|
(5,948
)
|
-
|
|
244
|
(5,704
)
|
|
Other operating results,
net
|
24
|
(49
)
|
d)
|
(26
)
|
(51
)
|
|
Profit
from operations
|
3,432
|
17,277
|
|
(320
)
|
20,389
|
|
Share of (loss) / profit of
associates and joint ventures
|
447
|
289
|
e)
|
(228
)
|
508
|
|
Profit
before finance results and income tax
|
3,879
|
17,566
|
|
(548
)
|
20,897
|
|
Finance income
|
1,788
|
-
|
|
(492
)
|
1,296
|
|
Finance cost
|
(5,938
)
|
-
|
|
270
|
(5,668
)
|
|
Other financial
results
|
(870
)
|
-
|
|
352
|
(518
)
|
|
Financial results,
net
|
(5,020
)
|
-
|
|
130
|
(4,890
)
|
|
(Loss) /
Profit before income tax
|
(1,141
)
|
17,566
|
|
(418
)
|
16,007
|
|
Income tax
|
(149
)
|
(6,198
)
|
f)
|
(26
)
|
(6,373
)
|
|
(Loss) /
Profit from continuing operations
|
(1,290
)
|
11,368
|
|
(444
)
|
9,634
|
|
Profit from discontinued
operations
|
-
|
-
|
|
444
|
444
|
|
(Loss) /
Profit for the year
|
(1,290
)
|
11,368
|
|
-
|
10,078
|
|
|
|
|
|
|
|
|
Attributable
to:
|
|
|
|
|
|
|
Equity holders of the
parent
|
(693
)
|
10,227
|
|
-
|
9,534
|
|
Non-controlling
interest
|
(597
)
|
1,141
|
|
-
|
544
|
F-14
IRSA Inversiones
y Representaciones Sociedad Anónima
|
|
06.30.16
(originally
issued)
|
06.30.16
(adjustment)
|
|
06.30.2016(other
reclassifications) h)
|
06.30.16(recast)
|
|
(Loss) /
Profit for the year
|
(1,290
)
|
11,368
|
|
-
|
10,078
|
|
Other comprehensive income /
(loss)
|
|
|
|
|
|
|
Items
that may be reclassified subsequently to profit or
loss:
|
|
|
|
|
|
|
Cumulative translation
adjustment
|
4,005
|
263
|
g)
|
85
|
4,353
|
|
Change in the fair
value of hedging instruments net of income taxes
|
(93
)
|
-
|
|
96
|
3
|
|
Items
that may not be reclassified subsequently to profit or loss, net of
income tax
|
|
|
|
|
|
|
Actuarial loss from
defined benefit plans
|
(42
)
|
-
|
|
13
|
(29
)
|
|
Other comprehensive income
for the year from continuing operations
|
3,870
|
263
|
|
194
|
4,327
|
|
Other comprehensive
loss for the year from discontinued operations
|
-
|
-
|
|
(194
)
|
(194
)
|
|
Total comprehensive income
for the year
|
2,580
|
11,631
|
|
-
|
14,211
|
|
|
|
|
|
|
|
|
Attributable
to:
|
|
|
|
|
|
|
Equity holders of the
parent
|
(840
)
|
10,445
|
|
-
|
9,605
|
|
Non-controlling
interest
|
3,420
|
1,186
|
|
-
|
4,606
|
|
|
|
|
|
|
|
b.2. Statement of Income
and Statement of Other Comprehensive Income for the fiscal year
ended June 30, 2015:
|
|
06.30.2015
(originally
issued)
|
06.30.2015
(adjustment)
|
|
06.30.2015(recast)
|
|
Revenues
|
3,403
|
-
|
|
3,403
|
|
Costs
|
(1,511
)
|
142
|
a)
|
(1,369
)
|
|
Gross
Profit
|
1,892
|
142
|
|
2,034
|
|
Gain from disposal of
investment properties
|
1,163
|
(1,163
)
|
b)
|
-
|
|
Net gain from fair value
adjustments of investment properties
|
-
|
3,958
|
c)
|
3,958
|
|
General and administrative
expenses
|
(374
)
|
-
|
|
(374
)
|
|
Selling
expenses
|
(194
)
|
-
|
|
(194
)
|
|
Other operating results,
net
|
28
|
5
|
d)
|
33
|
|
Profit
from operations
|
2,515
|
2,942
|
|
5,457
|
|
Share of (loss) / profit of
associates and joint ventures
|
(1,023
)
|
210
|
e)
|
(813
)
|
|
Profit
before finance results and income tax
|
1,492
|
3,152
|
|
4,644
|
|
Finance income
|
137
|
-
|
|
137
|
|
Finance cost
|
(1,107
)
|
-
|
|
(1,107
)
|
|
Other financial
results
|
37
|
-
|
|
37
|
|
Financial results,
net
|
(933
)
|
-
|
|
(933
)
|
|
Profit
before income tax
|
559
|
3,152
|
|
3,711
|
|
Income tax
|
(489
)
|
(1,092
)
|
f)
|
(1,581
)
|
|
Profit
for the year
|
70
|
2,060
|
|
2,130
|
|
|
|
|
|
|
|
Attributable
to:
|
|
|
|
|
|
Equity holders of the
parent
|
(41
)
|
1,939
|
|
1,898
|
|
Non-controlling
interest
|
111
|
121
|
|
232
|
|
|
06.30.15
(originally
issued)
|
06.30.15
(adjustment)
|
|
06.30.15(recast)
|
|
Profit
for the year
|
70
|
2,060
|
|
2,130
|
|
Other comprehensive income /
(loss)
|
|
|
|
|
|
Items
that may be reclassified subsequently to profit or
loss:
|
|
|
|
|
|
Cumulative translation
adjustment
|
(108
)
|
-
|
g)
|
(108
)
|
|
Other comprehensive loss for
the year from continuing operations
|
(108
)
|
-
|
|
(108
)
|
|
Other comprehensive
income for the year from discontinued operations
|
-
|
-
|
|
-
|
|
Total comprehensive income
for the year
|
(38
)
|
2,060
|
|
2,022
|
|
|
|
|
|
|
|
Attributable
to:
|
|
|
|
|
|
Equity holders of the
parent
|
(165
)
|
1,938
|
|
1,773
|
|
Non-controlling
interest
|
127
|
122
|
|
249
|
Explanation of the changes in the Statement of Comprehensive Income
and Statement of Other Comprehensive Income
a)
Corresponds to the elimination of depreciation
expense for investment property, and the adjustment, if applicable,
to the depreciation of property, plant and equipment (see
“Explanation of changes in the Statement of Financial
Position” – point b)).
b)
It relates to the elimination of the gain from
disposal of investment property, as such property is accounted for
at its fair value on the date of sale, which generally coincides
with the transaction price (see point d)).
c)
It represents the net change in fair value of
investment property.
F-15
IRSA Inversiones
y Representaciones Sociedad Anónima
d)
The expenses related to the disposal of
investment property have been reclassified under this line.
Previously they were included under “Gain from disposal of
investment property”.
e)
It relates to changes in share of profit /
(loss) in associates and joint ventures after applying the change
to equity method valuation implemented by the Group.
f)
It reflects the tax effect on the items
indicated above, as applicable.
g)
It pertains to exchange differences related to
the change in the accounting policy implemented by the Group in
subsidiaries, associates and joint ventures with functional
currency other than the peso.
h)
See Note 2.26 and Note 32.
b.3. Statement of
Financial Position as of June 30, 2016:
|
|
06.30.2016
(originally
issued)
|
06.30.2016
(adjustment)
|
|
06.30.2016(recast)
|
|
ASSETS
|
|
|
|
|
|
Non-current
Assets
|
|
|
|
|
|
Investment
properties
|
49,872
|
32,831
|
a
)
|
82,703
|
|
Property, plant and
equipment
|
24,055
|
(6
)
|
b
)
|
24,049
|
|
Trading
properties
|
4,471
|
259
|
b
)
|
4,730
|
|
Intangible
assets
|
11,763
|
-
|
|
11,763
|
|
Investments in associates
and joint ventures
|
16,236
|
644
|
c
)
|
16,880
|
|
Deferred income tax
assets
|
638
|
(587
)
|
d
)
|
51
|
|
Income tax and MPIT
credit
|
123
|
-
|
|
123
|
|
Restricted
assets
|
54
|
-
|
|
54
|
|
Trade and other
receivables
|
3,441
|
-
|
|
3,441
|
|
Employee
benefits
|
4
|
-
|
|
4
|
|
Investments in financial
assets
|
2,226
|
-
|
|
2,226
|
|
Financial assets held
for sale
|
3,346
|
-
|
|
3,346
|
|
Derivative financial
instruments
|
8
|
-
|
|
8
|
|
Total
Non-current Assets
|
116,237
|
33,141
|
|
149,378
|
|
Current
Assets
|
|
|
|
|
|
Trading
properties
|
241
|
-
|
|
241
|
|
Inventories
|
3,246
|
-
|
|
3,246
|
|
Restricted
assets
|
564
|
-
|
|
564
|
|
Income tax and MPIT
credit
|
506
|
-
|
|
506
|
|
Trade and other
receivables
|
13,409
|
-
|
|
13,409
|
|
Investments in financial
assets
|
9,656
|
-
|
|
9,656
|
|
Financial assets held
for sale
|
1,256
|
-
|
|
1,256
|
|
Derivative financial
instruments
|
19
|
-
|
|
19
|
|
Cash and cash
equivalents
|
13,866
|
-
|
|
13,866
|
|
Total
Current Assets
|
42,763
|
-
|
|
42,763
|
|
TOTAL
ASSETS
|
159,000
|
33,141
|
|
192,141
|
|
SHAREHOLDERS’
EQUITY
|
|
|
|
|
|
Share Capital
|
575
|
-
|
|
575
|
|
Treasury
shares
|
4
|
-
|
|
4
|
|
Inflation adjustment of
share capital and treasury shares
|
123
|
-
|
|
123
|
|
Share premium
|
793
|
-
|
|
793
|
|
Additional paid-in capital
from treasury shares
|
16
|
-
|
|
16
|
|
Legal reserve
|
117
|
-
|
|
117
|
|
Special
reserve
|
4
|
2,751
|
|
2,755
|
|
Cost of treasury
shares
|
(29
)
|
-
|
|
(29
)
|
|
Changes in non-controlling
interest
|
94
|
(73
)
|
|
21
|
|
Reserve for share-based
payments
|
67
|
-
|
|
67
|
|
Reserve for future
dividends
|
520
|
-
|
|
520
|
|
Hedging
instruments
|
(37
)
|
-
|
|
(37
)
|
|
Reserve for defined benefit
plans
|
(10
)
|
-
|
|
(10
)
|
|
Cumulative translation
adjustment reserve
|
84
|
337
|
|
421
|
|
Other reserves from
subsidiaries
|
37
|
-
|
|
37
|
|
(Accumulated deficit) /
Retained earnings
|
(1,243
)
|
17,502
|
|
16,259
|
|
Total attributable to equity
holders of the parent
|
1,115
|
20,517
|
e
)
|
21,632
|
|
Non-controlling
interest
|
12,386
|
1,838
|
f
)
|
14,224
|
|
TOTAL SHAREHOLDERS’
EQUITY
|
13,501
|
22,355
|
|
35,856
|
|
LIABILITIES
|
|
|
|
|
|
Non-Current
Liabilities
|
|
|
|
|
|
Trade and other
payables
|
1,518
|
-
|
|
1,518
|
|
Borrowings
|
90,680
|
-
|
|
90,680
|
|
Derivative financial
instruments
|
105
|
-
|
|
105
|
|
Deferred income tax
liabilities
|
7,571
|
11,579
|
d
)'
|
19,150
|
|
Employee
benefits
|
689
|
-
|
|
689
|
|
Salaries and social
security liabilities
|
11
|
-
|
|
11
|
|
Provision
allowances
|
1,325
|
(793
)
|
c)'
|
532
|
|
Total
Non-current Liabilities
|
101,899
|
10,786
|
|
112,685
|
|
Current
Liabilities
|
|
|
|
|
|
Trade and other
payables
|
17,874
|
-
|
|
17,874
|
|
Salaries and social
security liabilities
|
1,707
|
-
|
|
1,707
|
|
Income tax and MPIT
liabilities
|
616
|
-
|
|
616
|
|
Borrowings
|
22,252
|
-
|
|
22,252
|
|
Derivative financial
instruments
|
112
|
-
|
|
112
|
|
Provision
allowances
|
1,039
|
-
|
|
1,039
|
|
Total
Current Liabilities
|
43,600
|
-
|
|
43,600
|
|
TOTAL
LIABILITIES
|
145,499
|
10,786
|
|
156,285
|
|
TOTAL
SHAREHOLDERS’ EQUITY AND LIABILITIES
|
159,000
|
33,141
|
|
192,141
|
F-16
IRSA Inversiones y
Representaciones Sociedad Anónima
b.4. Statement of
Financial Position as of June 30, 2015:
|
|
06.30.2015
(originally
issued)
|
06.30.2015
(adjustment)
|
|
06.30.2015(recast)
|
|
ASSETS
|
|
|
|
|
|
Non-current
Assets
|
|
|
|
|
|
Investment
properties
|
3,490
|
15,727
|
a
)
|
19,217
|
|
Property, plant and
equipment
|
243
|
(6
)
|
b
)
|
237
|
|
Trading
properties
|
128
|
13
|
b
)
|
141
|
|
Intangible
assets
|
127
|
-
|
|
127
|
|
Investments in associates
and joint ventures
|
2,552
|
418
|
c
)
|
2,970
|
|
Deferred income tax
assets
|
53
|
4
|
d
)
|
57
|
|
Income tax and MPIT
credit
|
109
|
-
|
|
109
|
|
Trade and other
receivables
|
115
|
-
|
|
115
|
|
Investments in financial
assets
|
703
|
-
|
|
703
|
|
Derivative financial
instruments
|
206
|
-
|
|
206
|
|
Total
Non-current Assets
|
7,726
|
16,156
|
|
23,882
|
|
Current
Assets
|
|
|
|
|
|
Trading
properties
|
3
|
-
|
|
3
|
|
Inventories
|
23
|
-
|
|
23
|
|
Restricted
assets
|
9
|
-
|
|
9
|
|
Income tax and MPIT
credit
|
19
|
-
|
|
19
|
|
Trade and other
receivables
|
1,143
|
-
|
|
1,143
|
|
Investments in financial
assets
|
295
|
-
|
|
295
|
|
Derivative financial
instruments
|
29
|
-
|
|
29
|
|
Cash and cash
equivalents
|
375
|
-
|
|
375
|
|
Total
Current Assets
|
1,896
|
-
|
|
1,896
|
|
TOTAL
ASSETS
|
9,622
|
16,156
|
|
25,778
|
|
SHAREHOLDERS’
EQUITY
|
|
|
|
|
|
Share Capital
|
574
|
-
|
|
574
|
|
Treasury
shares
|
5
|
-
|
|
5
|
|
Inflation adjustment of
share capital and treasury shares
|
123
|
-
|
|
123
|
|
Share premium
|
793
|
-
|
|
793
|
|
Additional paid-in capital
from treasury shares
|
7
|
-
|
|
7
|
|
Legal reserve
|
117
|
-
|
|
117
|
|
Special
reserve
|
4
|
2,751
|
|
2,755
|
|
Cost of treasury
shares
|
(34
)
|
-
|
|
(34
)
|
|
Changes in non-controlling
interest
|
(6
)
|
10
|
|
4
|
|
Reserve for share-based
payments
|
64
|
-
|
|
64
|
|
Cumulative translation
adjustment reserve
|
275
|
119
|
|
394
|
|
(Accumulated deficit) /
Retained earnings
|
(40
)
|
7,275
|
|
7,235
|
|
Total attributable to equity
holders of the parent
|
1,882
|
10,155
|
e
)
|
12,037
|
|
Non-controlling
interest
|
376
|
567
|
f)
|
943
|
|
TOTAL
SHAREHOLDERS’ EQUITY
|
2,258
|
10,722
|
|
12,980
|
|
LIABILITIES
|
|
|
|
|
|
Non-Current
Liabilities
|
|
|
|
|
|
Trade and other
payables
|
255
|
-
|
|
255
|
|
Borrowings
|
3,736
|
-
|
|
3,736
|
|
Derivative financial
instruments
|
265
|
-
|
|
265
|
|
Deferred income tax
liabilities
|
51
|
5,779
|
c)
|
5,830
|
|
Salaries and social
security liabilities
|
2
|
-
|
|
2
|
|
Provision
allowances
|
374
|
(345
)
|
d)
|
29
|
|
Total
Non-current Liabilities
|
4,683
|
5,434
|
|
10,117
|
|
Current
Liabilities
|
|
|
|
|
|
Trade and other
payables
|
896
|
-
|
|
896
|
|
Salaries and social
security liabilities
|
123
|
-
|
|
123
|
|
Income tax and MPIT
liabilities
|
135
|
-
|
|
135
|
|
Borrowings
|
1,237
|
-
|
|
1,237
|
|
Derivative financial
instruments
|
238
|
-
|
|
238
|
|
Provision
allowances
|
52
|
-
|
|
52
|
|
Total
Current Liabilities
|
2,681
|
-
|
|
2,681
|
|
TOTAL
LIABILITIES
|
7,364
|
5,434
|
|
12,798
|
|
TOTAL
SHAREHOLDERS’ EQUITY AND LIABILITIES
|
9,622
|
16,156
|
|
25,778
|
F-17
IRSA Inversiones
y Representaciones Sociedad Anónima
b.5. Statement of
Financial Position as of July 1, 2014:
|
|
07.01.2014
(originally
issued)
|
07.01.2014(adjustment)
|
|
07.01.2014(recast)
|
|
ASSETS
|
|
|
|
|
|
Non-current
Assets
|
|
|
|
|
|
Investment
properties
|
3,270
|
12,526
|
a)
|
15,796
|
|
Property, plant and
equipment
|
219
|
-
|
|
219
|
|
Trading
properties
|
130
|
1
|
b)
|
131
|
|
Intangible
assets
|
124
|
-
|
|
124
|
|
Investments in associates
and joint ventures
|
2,261
|
326
|
c)
|
2,587
|
|
Deferred income tax
assets
|
369
|
(328
)
|
d)
|
41
|
|
Income tax and MPIT
credit
|
110
|
-
|
|
110
|
|
Trade and other
receivables
|
92
|
-
|
|
92
|
|
Investments in financial
assets
|
275
|
-
|
|
275
|
|
Total
Non-current Assets
|
6,850
|
12,525
|
|
19,375
|
|
Current
Assets
|
|
|
|
|
|
Trading
properties
|
5
|
-
|
|
5
|
|
Inventories
|
17
|
-
|
|
17
|
|
Income tax and MPIT
credit
|
16
|
-
|
|
16
|
|
Group of assets held
for sale
|
1,358
|
291
|
b)
|
1,649
|
|
Trade and other
receivables
|
707
|
-
|
|
707
|
|
Investments in financial
assets
|
234
|
-
|
|
234
|
|
Derivative financial
instruments
|
13
|
-
|
|
13
|
|
Cash and cash
equivalents
|
610
|
-
|
|
610
|
|
Total
Current Assets
|
2,960
|
291
|
|
3,251
|
|
TOTAL
ASSETS
|
9,810
|
12,816
|
|
22,626
|
|
SHAREHOLDERS’
EQUITY
|
|
|
|
|
|
Share Capital
|
574
|
-
|
|
574
|
|
Treasury
shares
|
5
|
-
|
|
5
|
|
Inflation adjustment of
share capital and treasury shares
|
123
|
-
|
|
123
|
|
Share premium
|
793
|
-
|
|
793
|
|
Legal reserve
|
117
|
-
|
|
117
|
|
Special
reserve
|
375
|
2,751
|
|
3,126
|
|
Cost of treasury
shares
|
(38
)
|
-
|
|
(38
)
|
|
Changes in non-controlling
interest
|
(22
)
|
5
|
|
(17
)
|
|
Reserve for share-based
payments
|
53
|
-
|
|
53
|
|
Reserve for new
developments
|
414
|
-
|
|
414
|
|
Cumulative translation
adjustment reserve
|
399
|
120
|
|
519
|
|
(Accumulated deficit) /
Retained earnings
|
(785
)
|
5,336
|
|
4,551
|
|
Total attributable to equity
holders of the parent
|
2,008
|
8,212
|
e)
|
10,220
|
|
Non-controlling
interest
|
548
|
450
|
f)
|
998
|
|
TOTAL
SHAREHOLDERS’ EQUITY
|
2,556
|
8,662
|
|
11,218
|
|
LIABILITIES
|
|
|
|
|
|
Non-Current
Liabilities
|
|
|
|
|
|
Trade and other
payables
|
202
|
-
|
|
202
|
|
Borrowings
|
3,756
|
-
|
|
3,756
|
|
Derivative financial
instruments
|
321
|
-
|
|
321
|
|
Deferred income tax
liabilities
|
346
|
4,200
|
d)
|
4,546
|
|
Salaries and social
security liabilities
|
4
|
-
|
|
4
|
|
Provision
allowances
|
206
|
(177
)
|
c)
|
29
|
|
Total
Non-current Liabilities
|
4,835
|
4,023
|
|
8,858
|
|
Current
Liabilities
|
|
|
|
|
|
Trade and other
payables
|
679
|
-
|
|
679
|
|
Group of liabilities held
for sale
|
807
|
131
|
b)
|
938
|
|
Salaries and social
security liabilities
|
99
|
-
|
|
99
|
|
Income tax and MPIT
liabilities
|
65
|
-
|
|
65
|
|
Borrowings
|
737
|
-
|
|
737
|
|
Derivative financial
instruments
|
14
|
-
|
|
14
|
|
Provision
allowances
|
18
|
-
|
|
18
|
|
Total
Current Liabilities
|
2,419
|
131
|
|
2,550
|
|
TOTAL
LIABILITIES
|
7,254
|
4,154
|
|
11,408
|
|
TOTAL
SHAREHOLDERS’ EQUITY AND LIABILITIES
|
9,810
|
12,816
|
|
22,626
|
Explanation of the changes in the Statement of Financial
Position
a)
It corresponds to the net change in the fair
value of investment property, the elimination of depreciation
expense and, if applicable, the valuation adjustment for transfers
to other items (see point b)).
b)
It corresponds to the valuation adjustment of
transfers of investment properties to these line (see note
2.6).
c)
It relates to change in the value, as per the
equity method, in associates and joint ventures after applying the
change to equity in the accounting policy implemented by the
Group.
d)
It represents the tax impact on the above items,
as applicable.
e)
Corresponds to the
effect of the
aforementioned
items on equity attributable to the shareholders of the parent
company.
See Note 17.
f)
Corresponds to the
effect of previous concepts attributable to non-controlling
interest
.
F-18
IRSA Inversiones y
Representaciones Sociedad Anónima
(c)
Current and non-current
classification
The Group presents current and
non-current assets, and current and non-current liabilities, as
separate classifications in its Statement of Financial Position
according with the operating cycle of each activity. Current assets
and current liabilities include the assets and liabilities that are
either realized or settled within 12 months from the end of the
fiscal year.
All other assets and liabilities are
classified as non-current. Current and deferred tax assets and
liabilities (income tax liabilities) are presented separately from
each other and from other assets and liabilities as current and
non-current, respectively.
(d)
Presentation
currency
The Consolidated Financial
Statements are presented in millions of Argentine Pesos. Unless
otherwise stated or the context otherwise requires, references to
‘Peso amounts’ or ‘Ps.’, are millions of
Argentine Pesos, references to ‘US$’ or ‘US
Dollars’ are millions of US Dollars and references to "NIS"
are millions of New Israeli Shekel.
(e)
Fiscal year-end
The fiscal year begins on July 1st
and ends on June 30 of each year.
(f)
Accounting
criteria
The Consolidated Financial
Statements have been prepared under historical cost criteria,
except for investment properties, financial assets and financial
liabilities (including derivative instruments), financial assets
held for sale and share-based compensation, which were measured at
fair value.
(g)
Reporting cash
flows
The Group reports operating
activities cash flows using the indirect method. Interest paid is
presented within financing activities. Interest received is
presented within investing activities. The acquisitions and
disposals of investment properties are disclosed within investing
activities as this most appropriately reflects the Group’s
business activities. Cash flows in respect to trading properties
are disclosed within operating activities because these items are
sold in the ordinary course of business.
(h)
Use of estimates
The preparation of Financial
Statements at a certain date requires the Management to make
estimations and evaluations affecting the amount of assets and
liabilities recorded and contingent assets and liabilities
disclosed at such date, as well as income and expenses recorded
during the year. Actual results might differ from the estimates and
evaluations made at the date of preparation of these Consolidated
Financial Statements. The most significant judgments made by
Management in applying the Group’s accounting policies and
the major estimations and significant judgments are described in
Note 3.
2.2.
New accounting
standards
The following standards, amendments
and interpretations have been issued by the IASB and by the IFRIC.
Below we outline the standards, amendments and interpretations that
may potentially have an impact on the Group at the time of
application.
F-19
IRSA Inversiones y
Representaciones Sociedad
Anónima
Amendments to IAS 40 "Transfers of
Investment Properties". The amendments clarify the conditions that
should be met for an entity to transfer a property to, or from,
investment properties. Becomes effective for fiscal years beginning
on January 1, 2018, that is, in the case of the Group for the
fiscal year ended on June 30, 2019. Earlier adoption is permitted.
The Group is currently assessing the impact of the amendments on
its Financial Statements.
Cycle of annual improvements
2014-2016. IFRS 12 “Disclosure of Interests in other
entities”. Clarifies the standard scope. Becomes effective
for fiscal years beginning on January 1, 2017, that is, in the case
of the Group for the fiscal year ended on June 30, 2018. Earlier
adoption is permitted. The Group is currently assessing the impact
of the amendments on its Financial Statements.
Cycle of annual improvements
2014-2016. IAS 28 “Investments in Associates and Joint
ventures”. It clarifies that the option to measure an
associate or a joint venture at fair value for a qualifying entity
is available upon initial recognition. Becomes effective for fiscal
years beginning on January 1, 2018, that is, in the case of the
Group for the fiscal year ended on June 30, 2019. Earlier adoption
is permitted. The Group is currently assessing the impact of the
amendments on its Financial Statements.
IFRS 16 "Leases". Will supersede IAS
17 currently in force (and associated interpretations) and its
scope includes all leases, with a few specific exceptions. Under
the new standard, lessees are required to account for leases under
one single model in the balance sheet that is similar to the one
used to account for financial leases under IAS 17. There are two
exceptions to this rule: to recognize the lease of low-cost assets
(for example, personal computers) and short-term leases (for
instance, leases for a 12-month or shorter term). As regards the
lease commencement date, the lessee shall recognize the obligation
to make rental payments (for instance, leases payable) and an asset
that represents the right to use the leased asset during the term
of the lease agreement (rights of use). There is almost no changes
to lessor accounting. Becomes effective for fiscal years beginning
on January 1, 2019, that is, in the case of the Group for the
fiscal year ended on June 30, 2020. It may be applied earlier
provided IFRS 15 is also adopted. The Group is currently assessing
the impact of the amendments on its Financial
Statements.
Amendments to IAS 7 "Disclosure
initiative". Amendments provide that the entity shall disclose
information so that users of the Financial Statements may assess
the changes in liabilities resulting from financing activities,
including both cash-flow and non-cash-flow derivatives. Becomes
effective for fiscal years beginning on January 1, 2017, that is,
in the case of the Group for the fiscal year ended on June 30,
2018. Comparative information for prior fiscal years is not
mandatory. Earlier adoption is permitted. The Group is currently
assessing the impact of the amendments on its Financial
Statements.
Amendments to IAS 12 "Recognition of
deferred tax assets for unrealized losses". The amendments clarify
the accounting of deferred income tax assets in the case of
unrealized losses on instruments measured at fair value. Becomes
effective for fiscal years beginning on January 1, 2017, that is,
in the case of the Group for the fiscal year ended on June 30,
2018. Earlier adoption is permitted. The Group is currently
assessing the impact of the amendments on its Financial
Statements.
IFRS 9 “Financial
Instruments”. Adds a new impairment model based on expected
losses and introduces some minor amendments to the classification
and measurement of financial assets. The new standard replaces all
previous versions of IFRS 9 and becomes effective for fiscal years
starting on or after January 1, 2018, that is, in the case of the
Group for Financial Statements ended on June 30, 2019. The Group is
currently assessing the impact of the amendments on its Financial
Statements.
IFRS 15 “Revenues from
contracts with customers”. Replaces IAS 11
“Construction Contracts”, IAS 18 “Revenue”,
IFRIC 13 “Customer Loyalty Programs”, IFRIC 15
“Agreements for the Construction of Real Estate”, IFRIC
18 “Transfer of Assets from Customers” and SIC 31
“Revenue - Barter Transactions Involving Advertising
Services”. Provides the new revenue recognition model derived
from contracts with customers. The core principle underlying the
model is satisfaction of obligations assumed with customers.
Applies to all contracts with customers, other than those covered
by other IFRSs, such as leases, insurance and financial instruments
contracts. The standard does not address recognition of interest
or
F-20
IRSA Inversiones y
Representaciones Sociedad Anónima
dividend income. IFRS 15 becomes
effective for all fiscal years beginning as from January 1st, 2018,
that is, for Financial Statements ended on June 30, 2019 and may be
adopted earlier. Application is retroactive. As of the date of
these Consolidated Financial Statements, the Group is assessing the
impact that this standard will have on its financial position and
the results of operations.
Amendments to IFRS 2 "Share-based
Payment". The amendments clarify the scope of the standard in
relation to (i) accounting of the effects that the concession
consolidation conditions have on cash settled share-based payments,
(ii) the Classification of the share-based payment transactions
subject to net settlement, and (iii) accounting for the amendment
of terms and conditions of the share-based payment transaction that
reclassifies the transaction from cash settled to equity settled.
Becomes effective for fiscal years beginning on January 1, 2018,
that is, in the case of the Group for the fiscal year ended on June
30, 2019. Earlier adoption is permitted. The Group is currently
assessing the impact of the amendments on its Financial
Statements.
On the issue date of these
Consolidated Financial Statements, there are no other standards,
amendments and interpretations issued by the IASB of the IFRIC that
are yet to become effective and that are expected to have a
material effect on the Group.
2.3.
Scope of
consolidation
(a)
Subsidiaries
Subsidiaries are all entities
(including structured entities) over which the Group has control.
The Group controls an entity when the Group is exposed to, or has
rights to variable returns from its involvement with the entity and
has the ability to affect those returns through its power over the
entity. The Group also analyzes whether there is control when it
does not hold more than 50% of the voting rights of an entity, but
does have capacity to define its relevant activities because of
de-facto control.
The Group uses the acquisition
method of accounting to account for business combinations. The
consideration transferred for the acquisition of a subsidiary is
the fair value of the assets transferred, the liabilities incurred
and the equity interests issued by the Group. Acquisition-related
costs are expensed as incurred. Identifiable assets acquired and
liabilities and contingent liabilities assumed in a business
combination are measured initially at their fair values at the
acquisition date.
The Group recognizes any
non-controlling interest in the acquire on an
acquisition-by-acquisition basis either at fair value or at the
non-controlling interest’s proportionate share of the
acquirer’s net assets. The Group chooses the method to be
used on a case-by-case base.
The excess of the sum of the
consideration transferred, the amount of any non-controlling
interest in the acquire and the acquisition-date fair value of any
previous equity interest in the acquire over the fair value of the
identifiable net assets acquired is recorded as goodwill. If the
total of consideration transferred, non-controlling interest
recognized and previously held interest measured is less than the
fair value of the net assets of the subsidiary acquired in the case
of a bargain purchase, the difference is recognized directly in the
Statement of Income as “Bargain purchase
gains”.
The Group conducts its business
through several operating and investment companies, the principal
are listed below:
F-21
IRSA Inversiones
y Representaciones Sociedad Anónima
|
|
|
|
% of
ownership interest held by the Group
|
||
|
Name of the
entity
|
Country
|
Main activity
|
06.30.2017
|
06.30.2016
|
06.30.2015
|
|
IRSA's direct
interest:
|
|
|
|
|
|
|
IRSA CP
(1)
|
Argentina
|
Real
estate
|
94.61
%
|
94.61
%
|
95.80
%
|
|
E-Commerce Latina
S.A.
|
Argentina
|
Investment
|
100.00
%
|
100.00
%
|
100.00
%
|
|
Efanur
S.A.
|
Uruguay
|
Investment
|
100.00
%
|
100.00
%
|
100.00
%
|
|
Hoteles Argentinos
S.A.
|
Argentina
|
Hotel
|
80.00
%
|
80.00
%
|
80.00
%
|
|
Inversora Bolívar
S.A.
|
Argentina
|
Investment
|
100.00
%
|
100.00
%
|
100.00
%
|
|
Llao Llao Resorts S.A.
(2)
|
Argentina
|
Hotel
|
50.00
%
|
50.00
%
|
50.00
%
|
|
Nuevas Fronteras
S.A.
|
Argentina
|
Hotel
|
76.34
%
|
76.34
%
|
76.34
%
|
|
Palermo Invest
S.A.
|
Argentina
|
Investment
|
100.00
%
|
100.00
%
|
100.00
%
|
|
Ritelco
S.A.
|
Uruguay
|
Investment
|
100.00
%
|
100.00
%
|
100.00
%
|
|
Solares de Santa
María S.A. (3)
|
Argentina
|
Real
estate
|
-
|
-
|
100.00
%
|
|
Tyrus S.A.
|
Uruguay
|
Investment
|
100.00
%
|
100.00
%
|
100.00
%
|
|
Unicity S.A.
(3)
|
Argentina
|
Investment
|
-
|
-
|
100.00
%
|
|
IRSA
CP's direct interest:
|
|
|
|
|
|
|
Arcos del Gourmet
S.A.
|
Argentina
|
Real
estate
|
90.00
%
|
90.00
%
|
90.00
%
|
|
Emprendimiento Recoleta
S.A.
|
Argentina
|
Real
estate
|
53.68
%
|
53.68
%
|
53.68
%
|
|
Fibesa S.A.
(4)
|
Argentina
|
Real
estate
|
100.00
%
|
100.00
%
|
100.00
%
|
|
Panamerican Mall
S.A.
|
Argentina
|
Real
estate
|
80.00
%
|
80.00
%
|
80.00
%
|
|
Shopping Neuquén
S.A.
|
Argentina
|
Real
estate
|
99.92
%
|
99.14
%
|
99.14
%
|
|
Torodur
S.A.
|
Uruguay
|
Investment
|
100.00
%
|
100.00
%
|
100.00
%
|
|
EHSA
|
Argentina
|
Investment
|
70.00
%
|
-
|
-
|
|
Tyrus S.A.'s direct
interest:
|
|
|
|
|
|
|
DFL (4)
|
Bermudas
|
Investment
|
91.57
%
|
91.57
%
|
91.57
%
|
|
I Madison
LLC
|
USA
|
Investment
|
100.00
%
|
100.00
%
|
100.00
%
|
|
IRSA Development
LP
|
USA
|
Investment
|
100.00
%
|
100.00
%
|
100.00
%
|
|
IRSA International
LLC
|
USAs
|
Investment
|
100.00
%
|
100.00
%
|
100.00
%
|
|
Jiwin S.A.
|
Uruguay
|
Investment
|
100.00
%
|
100.00
%
|
100.00
%
|
|
Liveck
S.A.
|
Uruguay
|
Investment
|
100.00
%
|
100.00
%
|
100.00
%
|
|
Real Estate Investment
Group IV LP (REIG IV)
|
Bermudas
|
Investment
|
100.00
%
|
100.00
%
|
100.00
%
|
|
Real Estate Investment
Group V LP
|
Bermudas
|
Investment
|
100.00
%
|
100.00
%
|
100.00
%
|
|
Real Estate Strategies
LLC
|
USA
|
Investment
|
100.00
%
|
100.00
%
|
100.00
%
|
|
Efanur S.A.'s direct
interest:
|
|
|
|
|
|
|
Real Estate Strategies
LP
|
Bermudas
|
Investment
|
66.83
%
|
66.83
%
|
66.83
%
|
|
DFL's direct
interest:
|
|
|
|
|
|
|
IDB Development
Corporation Ltd.
|
Israel
|
Investment
|
68.28
%
|
68.28
%
|
-
|
|
IDBD's direct
interest:
|
|
|
|
|
|
|
Discount Investment
Corporation Ltd. (5)
|
Israel
|
Investment
|
77.25
%
|
76.43
%
|
-
|
|
IDB Tourism (2009)
Ltd.
|
Israel
|
Tourism
services
|
100.00
%
|
100.00
%
|
-
|
|
IDB Group Investment
Inc.
|
Israel
|
Investment
|
100.00
%
|
100.00
%
|
-
|
|
DIC's direct
interest:
|
|
|
|
|
|
|
Property & Building
Corporation Ltd.
|
Israel
|
Investment
|
64.44
%
|
76.45
%
|
-
|
|
Shufersal
Ltd.
|
Israel
|
Investment
|
54.19
%
|
52.95
%
|
-
|
|
Koor Industries
Ltd.
|
Israel
|
Investment
|
100.00
%
|
100.00
%
|
-
|
|
Cellcom Israel Ltd.
(6)
|
Israel
|
Investment
|
42.26
%
|
41.77
%
|
-
|
|
Elron Electronic
Industries Ltd.
|
Israel
|
Investment
|
50.32
%
|
50.32
%
|
-
|
|
Bartan Holdings and
Investments Ltd.
|
Israel
|
Investment
|
55.68
%
|
55.68
%
|
-
|
|
Epsilon Investment
House Ltd.
|
Israel
|
Investment
|
68.75
%
|
68.75
%
|
-
|
(1)
Includes interest held through Tyrus S.A.
On
October 27, 2017, we reported that it has been completed the sale
in the secondary market of 2,560,000 ADSs of IRSA CP, which
represent 8.1% of IRSA CP. IRSA holds, after the executed
transaction, a 86.5% equity interest in IRSA PC. For more
information please see
“Recent developments – Selling of
IRSA CP’ ADSs.”
(2)
The Company has consolidated the investment in
Llao Llao Resorts S.A. considering its equity interest and a
shareholder agreement that confers it majority of votes in the
decision making process.
(3)
Were merged on July 1, 2015.
(4)
Includes interest held through Ritelco
S.A..
(5)
Includes Tyrus's equity interest held through
DFL.
(6)
DIC considers it exercises effective control
over Cellcom because DIC is the group with the higher percentage of
votes vis-à-vis other shareholders, also taking into account
the historic voting performance in the Shareholders’
Meetings.
F-22
IRSA Inversiones y Representaciones Sociedad
Anónima
The Group takes into account both
quantitative and qualitative aspects in order to determine which
non-controlling interests in subsidiaries are considered
significant.
(b)
Changes in ownership
interests in subsidiaries without change of control
Transactions with non-controlling
interests that do not result in loss of control are accounted for
as equity transactions – i.e., as transactions with the
owners in their capacity as owners. The recorded value corresponds
to the difference between the fair value of the consideration paid
and/or receive and the relevant share acquired and/or transferred
of the carrying value of net assets of the subsidiary.
(c)
Disposal of subsidiaries with
loss of control
When the Group ceases to have
control any retained interest in the entity is re-measured at its
fair value at the date when control is lost, with changes in
carrying amount recognized in profit or loss. The fair value is the
initial carrying amount for the purposes of subsequently accounting
for the retained interest as an associate, joint venture or
financial asset. In addition, any amounts previously recognized in
other comprehensive income in respect of that entity are accounted
for as if the Group had directly disposed of the related assets or
liabilities. This may mean that amounts previously recognized in
other comprehensive income are reclassified to profit or
loss.
(d)
Associates
Associates are all entities over
which the Group has significant influence but not control,
representing an interest between 20% and at least 50% of the voting
rights. Investments in associates are accounted for using the
equity method of accounting, except as otherwise indicated as
explained below. Under the equity method, the investment is
initially recognized at cost, and the carrying amount is increased
or decreased to recognize the investor’s share of the profit
or loss of the investee after the date of acquisition. The
Group’s investment in associates includes goodwill identified
on acquisition.
IAS 28 “Investments in
Associates” provides an exemption from applying the equity
method where investments in associates are held through
“Venture Capital Organizations” (VCO) or venture
capital entities, as defined in Spanish, even when the Group is not
a VCO. This type of investment may be accounted for at fair value
with changes in net income for the years because such measure
proves to be more useful to users of Financial Statements than the
equity method.
As of each year-end or upon the
existence of evidence of impairment, a determination is made as to
whether there is any objective indication of impairment in the
value of the investments in associates. If this is the case, the
Group calculates the amount of impairment as the difference between
the recoverable amount of the Associates and its carrying value and
recognizes the amount adjacent to "Share of profit / (loss) of
associates and joint ventures " in the Statement of
Income.
(e)
Joint
arrangements
Joint arrangements are arrangements
of which the Group and other party or parties have joint control
bound by a contractual arrangement. Under IFRS 11, investments in
joint arrangements are classified as either joint ventures or joint
operations depending on the contractual rights and obligations each
investor has rather than the legal structure of the joint
arrangement. A joint venture is a joint arrangement whereby the
parties that have joint control of the arrangement have rights to
the net assets of the arrangement. A joint operation is a joint
arrangement whereby the parties that have joint control of the
arrangement have rights to the assets, and obligations for the
liabilities, relating to the arrangement. The Group has assessed
the nature of its joint arrangements and determined them to be
joint ventures.
Investments in joint ventures are
accounted for under the equity method. Under the equity method of
accounting, interests in joint ventures are initially recognized in
the Consolidated Statements of Financial Position at cost and
adjusted
F-23
IRSA Inversiones y Representaciones Sociedad
Anónima
thereafter to recognize the
Group’s share of post-acquisition profits or losses in the
Statements of Income and Other Comprehensive Income.
The Group determines at each
reporting date whether there is any objective evidence that the
investment in a joint ventures is impaired. If this is the case,
the Group calculates the amount of impairment as the difference
between the recoverable amount of the joint venture and its
carrying value and recognizes the amount adjacent to "Share of
profit / (loss) of associates and joint ventures" in the Statement
of Income.
2.4.
Segment
information
Operating segments are reported in a
manner consistent with the internal reporting provided to the Chief
Operating Decision-Maker (“CODM”), responsible for
allocating resources and assessing performance. The operating
segments are described in Note 6.
2.5.
Foreign currency
translation
(a)
Functional and presentation
currency
Items included in the Financial
Statements of each of the Group’s entities are measured using
the currency of the primary economic environment in which the
entity operates (‘the functional currency’). The
Consolidated Financial Statements are presented in Argentine Pesos,
which is the Group’s presentation currency.
(b)
Transactions and balances in
foreign currency
Foreign currency transactions are
translated into the functional currency using the exchange rates
prevailing at the dates of the transactions. Foreign exchange gains
and losses resulting from the settlement of such transactions and
from the translation at year-end exchange rates of monetary assets
and liabilities nominated in foreign currencies are recognized in
the profit or loss for the year.
Foreign exchange gains and losses
are presented in the Statement of Income within finance income and
finance costs, as appropriate, unless they are
capitalized.
(c)
Group companies
The results and financial position
of all the Group entities (none of which has the currency of a
hyperinflationary economy) that have a functional currency
different from the presentation currency are translated into the
presentation currency as follows:
(i)
assets, liabilities and goodwill for each
Statement of Financial Position presented are translated at the
closing rate at the date of that financial position;
(ii)
income and expenses for each Statement of
Comprehensive Income are translated at average exchange rates
(unless this average is not a reasonable approximation of the
cumulative effect of the rates prevailing on the transaction dates,
in which case income and expenses are translated at the rate on the
dates of the transactions); and
(iii)
all resulting exchange differences are
recognized in the Statement of Comprehensive Income.
2.6.
Investment
properties
Investment properties are those
properties owned by the Group that are held either to earn
long-term rental income or for capital appreciation, or both, and
that are not occupied by the Group for its own operations.
Investment property also includes property that is being
constructed or developed for future use as investment
property.
F-24
IRSA Inversiones y Representaciones Sociedad
Anónima
The Group also classifies as
investment properties land whose future use has not been determined
yet. The Group’s investment properties primarily comprise the
Group’s portfolio of shopping malls and offices, certain
property under development and undeveloped land.
Where a property is partially
owner-occupied, with the rest being held for rental income or
capital appreciation, the Group accounts for the portions
separately. The portion that is owner-occupied is accounted for as
property, plant and equipment under IAS 16 “Property, Plant
and Equipment” and the portion that is held for rental income
or capital appreciation, or both, is treated as investment
properties under IAS 40 “Investment
Properties”.
Investment properties are measured
initially at cost. Cost comprises the purchase price and directly
attributable expenditures, such as legal fees, certain direct
taxes, commissions and in the case of properties under
construction, the capitalization of financial costs.
For properties under development,
capitalization of costs includes not only financial costs, but also
all costs directly attributable to works in process, from
commencement of construction until it is completed and property is
in conditions to start operating.
Direct expenses related to lease
contract negotiation (such as payment to third parties for services
rendered and certain specific taxes related to execution of such
contracts) are capitalized as part of the book value of the
relevant investment properties and amortized over the term of the
lease.
Borrowing costs associated with
properties under development or undergoing major refurbishment are
capitalized. The finance cost capitalized is calculated using the
Group’s weighted average cost of borrowings after adjusting
for borrowings associated with specific developments. Where
borrowings are associated with specific developments, the amount
capitalized is the gross interest incurred on those borrowings less
any investment income arising on their temporary investment.
Finance cost is capitalized from the commencement of the
development work until the date of practical completion. The
capitalization of finance costs is suspended if there are prolonged
periods when development activity is interrupted. Finance cost is
also capitalized on the purchase cost of land or property acquired
specifically for redevelopment in the short term but only where
activities necessary to prepare the asset for redevelopment are in
progress.
After initial recognition,
investment property is carried at fair value. Investment property
that is being redeveloped for continuing use as investment property
or for which the market has become less active continues to be
measured at fair value. Investment properties under construction
are measured at fair value if the fair value is considered to be
reliably determinable. On the other hand, properties under
construction for which the fair value cannot be determined
reliably, but for which the Group expects it to be determinable
when construction is completed, are measured at cost less
impairment until the fair value becomes reliably determinable or
construction is completed, whichever is earlier.
Fair values are determined
differently depending on the type of property being
measured.
Generally, for the Operations center
in Argentina, fair value of office buildings and land reserves is
based on active market prices, adjusted, if necessary, for
differences in the nature, location or condition of the specific
asset. If this information is not available, the Group uses
alternative valuation methods, such as recent prices on less active
markets or discounted cash flow projections.
The fair value of the Group’s
portfolio of Shopping Malls is based on discounted cash flow
projections. This method of valuation is commonly used in the
shopping mall industry in the region where the Group conducts its
operations.
Fair value of office building for
the Operations center in Israel is based on discounted cash flow
projections.
As required by CNV Ruling 576/10,
valuations are performed as of the financial position date by
accredited externals appraisers who have recognized professional
qualifications and have recent experience in the location
and
category of the investment property being valued. These valuations form the basis for the carrying amounts in the Consolidated Financial Statements. The fair value of investment property reflects, among other things, rental income from current leases and other assumptions market participants would make when pricing the property under current market conditions.
category of the investment property being valued. These valuations form the basis for the carrying amounts in the Consolidated Financial Statements. The fair value of investment property reflects, among other things, rental income from current leases and other assumptions market participants would make when pricing the property under current market conditions.
F-25
IRSA Inversiones y Representaciones Sociedad
Anónima
Subsequent expenditures are
capitalized to the asset’s carrying amount only when it is
probable that future economic benefits associated with the
expenditure will flow to the Group and the cost can be measured
reliably. All other repairs and maintenance costs are expensed when
incurred. When part of an investment property is replaced, the
carrying amount of the replaced part is derecognized.
Changes in fair values are
recognized in the Statement of Income under the line item
“Net gain from fair value adjustments of investment
properties”.
Asset transfers, including assets
classified as investments properties which are reclassified under
other items or vice-versa, may only be carried out when there is a
change of use evidenced by: a) commencement of occupation of real
property by the Group, where investment property is transferred to
property, plant and equipment; b) commencement of development
activities for sale purposes, where investment property is
transferred to property for sale; c) the end of Group occupation,
where it is transferred from Property, plant and equipment to
investment properties; or d) commencement of an operating lease
transaction with a third party, where properties for sale are
transferred to investment property. The value of the transfer is
the one that the property had at the time of the transfer and
subsequently is valued in accordance with the accounting policy
related to the item.
The Group may sell its investment
property when it considers that such property no longer forms part
of the lease business. The carrying value immediately prior to the
sale is adjusted to the transaction price, and the adjustment is
recorded in the Statement of Income in the line “Net gain
from fair value adjustments of investment
properties”.
Investment properties are
derecognized when they are disposed of or when they are permanently
withdrawn from use and no future economic benefits are expected to
arise from their disposals. The disposal of properties is
recognized when the significant risks and rewards have been
transferred to the buyer. As for unconditional agreements, proceeds
are accounted for when title to property passes to the buyer and
the buyer intends to make the respective payment therefor. In the
case of conditional agreements, where such conditions have been
met. Where consideration receivable for the sale of the properties
is deferred, it is discounted to present. The difference between
the discounted amount and the amount receivable is treated as
interest income and recognized over the period using the effective
interest method. Direct expenses related to the sale are recognized
in the line "Other operating results, net" in the Statement of
Income at the time they are incurred.
2.7.
Property, plant and
equipment
This category primarily comprises,
buildings or portions of a building used for administrative
purposes, machines, computers, and other equipment, motor vehicles,
furniture, fixtures and fittings and improvements to the
Group’s corporate offices.
The Group has also several hotel
properties. Based on the respective contractual arrangements with
hotel managers and / or given their direct operators nature, the
Group considers it retains significant exposure to the variations
in the cash flows of the hotel operations, and accordingly, hotels
are treated as owner-occupied properties and classified under
"Property, plant and equipment".
All property, plant and equipment
(“PPE”) is stated at acquisition cost less depreciation
and accumulated impairment, if any. The acquisition cost includes
expenditure that is directly attributable to the acquisition of the
items. For properties under development, capitalization of costs
includes not only financial costs, but also all costs directly
attributable to works in process, from commencement of construction
until it is completed and property is in conditions to start
operating.
F-26
IRSA Inversiones y Representaciones Sociedad
Anónima
Subsequent costs are included in the
asset’s carrying amount or recognized as a separate asset, as
appropriate, only when it is probable that future economic benefits
associated with the item will flow to the Group and the cost of the
item can be measured reliably. Such costs may include the cost of
improvements and replacement of parts as they meet the conditions
to be capitalized. The carrying amount of those parts that are
replaced is derecognized. Repairs and maintenance are charged as
incurred in the Statement of Income. Depreciation, based on a
component approach, is calculated using the straight-line method to
allocate the cost over the assets’ estimated useful
lives.
The remaining useful life as of June
30, 2017 is as follows:
|
Buildings and
facilities
|
Between 5 and
50 years
|
|
Machinery and
equipment
|
Between 3 and
24 years
|
|
Communication
networks
|
Between 4 and
20 years
|
|
Others
|
Between 3 and
25 years
|
As of each fiscal year-end, an
evaluation is performed to determine the existence of indicators of
any decrease in recoverable value or useful life of assets. If
there are any indicators, the recoverable amount and/or residual
useful life of impaired asset(s) is estimated, and an impairment
adjustment is made, if applicable. As of each fiscal year-end, the
residual useful life of assets is estimated and adjusted, is
necessary.
Gains from the sale of these assets
are recognized when the significant risks and rewards have
transferred to the buyer. This will normally take place on
unconditional exchange, generally when legal title passes to the
buyer and it is probable that the buyer will pay. For conditional
exchanges, sales are recognized when these conditions are
satisfied. Gains and losses on disposals are determined by
comparing the proceeds net of direct expenses related to such
sales, with the carrying amount as of the date of each transaction.
Gains and losses from the disposal of property, plant and equipment
items are recognized within “Other operating results,
net” in the Statement of Income.
2.8.
Leases
Leases are classified at their
inception as either operating or finance leases based on the
economic substance of the agreement.
A Group company is the
lessor:
Properties leased out to tenants
under operating leases are included in “Investment
Properties” in the Statement of Financial Position. See Note
2.23 for the recognition of rental income.
A Group company is the
lessee:
The Group acquires certain specific
assets (especially machinery and computer equipment) under finance
leases. Finance leases are capitalized at the commencement of the
lease at the lower of the fair value of the property and the
present value of the minimum lease payments. Capitalized lease
assets are depreciated over the shorter of the estimated useful
life of the assets and the lease term. The finance charges are
charged over the lease period so as to produce a constant periodic
rate of interest on the remaining balance of the liability for each
period. Liabilities corresponding to finance leases, measured at
discounted value, are included in current and non-current
borrowings.
Operating leases where the Group
acts as lessee mainly include offices.
F-27
IRSA Inversiones
y Representaciones Sociedad Anónima
2.9.
Intangible
assets
(a)
Goodwill
Goodwill represents future economic
benefits arising from assets that are not capable of being
individually identified and separately recognized by the Group on
an acquisition. Goodwill is initially measured as the difference
between the fair value of the consideration transferred, plus the
amount of non-controlling interest in the acquisition and, in
business combinations achieved in stages, the acquisition-date fair
value of the previously held equity interest in the acquisition;
and the net fair value of the identifiable assets and liabilities
assumed on the acquisition date.
Goodwill is not amortized but tested
for impairment at each fiscal year-end, or more frequently if there
is an indication of impairment.
For the purpose of impairment
testing, assets are grouped at the lowest levels for which there
are separately identifiable cash flows, referred to as
cash-generating units (“CGU”). In order to determine
whether any impairment loss should be recognized, the book value of
CGU or CGU groups is compared against its recoverable value. Net
book value of CGU and CGU groups include goodwill and assets with
limited useful life (such as, investment properties, property,
plant and equipment, intangible assets and working
capital).
If the recoverable amount of the CGU
is less than the carrying amount of the unit, the impairment loss
is allocated first to reduce the carrying amount of any goodwill
allocated to the unit and then to the other assets of the unit pro
rata on the basis of the carrying amount of each asset in the unit.
Impairment losses recognized for goodwill are not reversed in a
subsequent period.
The recoverable amount of a CGU is
the higher of the fair value less costs-to-sell and the
value-in-use. The fair value is the amount at which a CGU may be
sold in a current transaction between unrelated, willing and duly
informed parties. Value-in-use is the present value of all
estimated future cash flows expected to be derived from CGU or CGU
groups.
(b)
Computer
software
Acquired computer software licenses
are capitalized on the basis of the costs incurred to acquire and
bring to use the specific software. These costs are amortized over
their estimated useful lives of three years. Costs associated with
maintaining computer software programs are recognized as an expense
as incurred.
(c)
Branding and client
relationships
This relates to the fair value of
brands and client relationships arising at the time of the business
combination with IDBD. They are subsequently valued at cost, less
the accumulated amortization or impairment. Client relationships
have a twelve-year useful life, while one of the brands have an
indefinite useful life and the other ten-year useful
life.
(d)
Right to receive future units
under barter agreements
The Group also enters into barter
transactions where the Group normally exchanges undeveloped parcels
of land with third-party developers for future property to be
constructed on the bartered land. The Group generally receives
monetary assets as part of the transactions and/or a right to
receive future units to be constructed by developers. Such rights
are initially recognized at cost (which is the fair value of the
land assigned) and are not adjusted later, unless there is any sign
of impairment.
At the date of each Statements of
Financial Position, the Group reviews the carrying amounts of its
intangible assets to determine whether there is any indication that
those assets have suffered an impairment loss.
If any such
indication exists, the recoverable amount of the asset is estimated
in order to determine the extent, if any, of the impairment
loss.
F-28
IRSA Inversiones y Representaciones Sociedad
Anónima
2.10.
Trading
properties
Trading properties comprises those
properties either intended for sale or in the process of
construction for subsequent sale. Trading properties are carried at
the lower of cost and net realizable value. Where there is a change
in use of investment properties evidenced by the commencement of
development with a view to sale, the properties are reclassified as
trading properties at cost, which is the carrying value at the date
of change in use. They are subsequently carried at the lower of
cost and net realizable value. Cost comprises all costs of
purchase, costs of conversion and other costs incurred in bringing
the trading properties to their present location and
condition.
2.11.
Inventories
Inventories include assets held for
sale in the ordinary course of the Group's business activities,
assets in production or construction process for sale purposes, and
materials, supplies or other assets held for consumption in the
process of producing sales and/or services.
Inventories are measured at the
lower of cost or net realizable value.
Net realizable value is the
estimated selling price in the ordinary course of business less
selling expenses. It is determined on an ongoing basis, taking into
account the product type and aging, based on the accumulated prior
experience with the useful life of the product. The Group
periodically reviews the inventory and its aging and books an
allowance for impairment, as necessary.
The cost of consumable supplies,
materials and other assets is determined using the weighted average
cost method, the cost of inventories of mobile phones, related
accessories and spare parts is priced under the moving average
method, and the cost of the remaining inventories is priced under
the first in, first out (FIFO) method.
Cost comprises all costs of
purchase, costs of conversion and other costs incurred in bringing
the inventories to their present location and condition.
Inventories and materials are initially recognized at cash price,
and the difference being charged as finance cost.
2.12.
Financial
instruments
The Group classifies financial
assets in the following categories: those to be measured
subsequently at fair value, and those to be measured at amortized
cost. This classification depends on whether the financial asset is
an equity investment or a debt investment.
Debt
investments
A debt investment is classified at
amortized cost only if both of the following criteria are met: (i)
the objective of the Group’s business model is to hold the
asset to collect the contractual cash flows; and (ii) the
contractual terms give rise on specified dates to cash derived
solely from payments of principal and interest due on the principal
outstanding. The nature of any derivatives embedded in the debt
investment are considered in determining whether the cash derives
solely from payment of principal and interest due on the principal
outstanding and are not accounted for separately.
If either of the two criteria
mentioned in the previous paragraph is not met, the debt instrument
is classified at fair value through profit or loss. The Group has
not designated any debt investment as measured at fair value
through profit or loss to eliminate or significantly reduce an
accounting mismatch. Changes in fair values and gains from disposal
of financial assets at fair value through profit or loss are
recorded within “Financial results, net” in the
Statement of Income.
F-29
IRSA Inversiones y Representaciones Sociedad
Anónima
Equity
investments
All equity investments, which are
neither subsidiaries nor associate companies nor joint venture of
the Group, are measured at fair value. Equity investments that are
held for trading are measured at fair value through profit or loss.
For all other equity investments, the Group can make an irrevocable
election at initial recognition to recognize changes in fair value
through other comprehensive income rather than profit or loss. The
Group decided to recognize changes in fair value of equity
investments through changes in profit or loss.
At initial recognition, the Group
measures a financial asset at its fair value plus, in the case of a
financial asset not at fair value through profit or loss,
transaction costs that are directly attributable to the acquisition
of the financial asset. Transaction costs of financial assets
carried at fair value though profit or loss are expensed in the
Statement of Income.
In general, the Group uses the
transaction price to ascertain the fair value of a financial
instrument on initial recognition. In the other cases, the Group
records a gain or loss on initial recognition only if the fair
value of the financial instrument can be supported by other
comparable transactions observable in the market for the same type
of instrument or if based on a technical valuation that only inputs
observable market data. Unrecognized gains or losses on initial
recognition of a financial asset are recognized later on, only to
the extent they arise from a change in factors (including time)
that market participants would consider upon setting the
price.
Gains/losses on debt instruments
measured at amortized cost and not identified for hedging purposes
are charged to income where the financial assets are derecognized
or an impairment loss is recognized, and during the amortization
process under the effective interest method. The Group is required
to reclassify all affected debt investments when and only when its
business model for managing those assets changes.
The Group assesses at the end of
each reporting period whether there is objective evidence that a
financial asset or group of financial assets measured at amortized
cost is impaired. A financial asset or a group of financial assets
is impaired and impairment losses are incurred only if there is
objective evidence of impairment as a result of one or more events
that occurred after the initial recognition of the asset (a
‘loss event’) and that loss event (or events) can be
reliably estimated. The amount of the loss is measured as the
difference between the asset’s carrying amount and the
present value of estimated future cash flows (excluding future
credit losses that have not been incurred) discounted at the
financial asset’s original effective interest
rate.
Financial assets and liabilities are
offset, and the net amount reported in the statement of financial
position, when there is a legally enforceable right to offset the
recognized amounts and there is an intention to settle on a net
basis, or realize the asset and settle the liability
simultaneously.
2.13.
Derivative financial
instruments and hedging activities and options
Derivative financial instruments are
initially recognized at fair value. The method of recognizing the
resulting gain or loss depends on whether the derivative is
designated as a hedging instrument, and if so, the nature of the
item being hedged.
The Group manages exposures to
various risks using hedging instruments that provide coverage. The
Group does not use derivative financial instruments for speculative
purposes. To date, the Group has used put and call options, foreign
currency future and forward contracts and interest rate swaps, as
appropriate.
The Group’s policy is to apply
hedge accounting where it is permissible under IFRS 9, practical to
do so and its application reduces volatility, but transactions that
may be effective hedges in economic terms may not always qualify
for hedge accounting under IFRS 9.
The fair values of financial
instruments that are traded in active markets are computed by
reference to market prices. The fair value of financial instruments
that are not traded in an active market is determined by using
valuation
techniques. The Group uses its judgment to
select a variety of methods and make assumptions that are mainly
based on market conditions existing at the end of each reporting
year.
The stock call options involving
shares of subsidiaries agreed at a fixed price are accounted for
under shareholders’ equity.
F-30
IRSA Inversiones y Representaciones Sociedad
Anónima
2.14.
Groups of assets and
liabilities held for sale
The groups of assets and liabilities
are classified as available for sale where the Group is expected to
recover their value by means of a sale transaction (rather than
through use) and where such sale is highly probable. Groups of
assets and liabilities available for sale are valued at the lower
of their net book value and fair value less selling
costs.
2.15.
Trade and other
receivables
Trade receivables are recognized
initially at fair value and subsequently measured at amortized cost
using the effective interest method.
An allowance for doubtful accounts
is recorded where there is objective evidence that the Group may
not be able to collect all receivables within their original
payment term. Indicators of doubtful accounts include significant
financial distress of the debtor, the debtor potentially filing a
petition for reorganization or bankruptcy, or any event of default
or past due account.
In the case of larger
non-homogeneous receivables, the impairment provision is calculated
on an individual basis.
The Group collectively evaluates
smaller-balance homogeneous receivables for impairment. For that
purpose, they are grouped on the basis of similar risk
characteristics, and account asset type, collateral type, past-due
status and other relevant factors are taken into
account.
The amount of the allowance is the
difference between the asset’s carrying amount and the
present value of estimated future cash flows, discounted at the
original effective interest rate. The carrying amount of the asset
is reduced through the use of a separate account, and the amount of
the loss is recognized in the Statements of Income within
“Selling expenses”. Subsequent recoveries of amounts
previously written off are credited against “Selling
expenses” in the Statements of Income.
2.16.
Trade and other
payables
Trade payables are initially
recognized at fair value and subsequently measured at amortized
cost using the effective interest method.
2.17.
Borrowings
Borrowings are recognized initially
at fair value, net of transaction costs incurred. Borrowings are
subsequently stated at amortized cost; any difference between the
proceeds (net of transaction costs) and the redemption value is
recognized as finance cost over the period of the borrowings using
the effective interest method.
2.18.
Provision
Provisions are recognized when: (i)
the Group has a present legal or constructive obligation as a
result of past events; (ii) it is probable that an outflow of
resources will be required to settle the obligation; and (iii) a
reliable estimate of the amount of the obligation can be made.
Provisions are not recognized for future operating
losses.
F-31
IRSA Inversiones y Representaciones Sociedad
Anónima
The Group bases its accruals on
up-to-date developments, estimates of the outcomes of the matters
and legal counsel´s experience in contesting, litigating and
settling matters. As the scope of the liabilities becomes better
defined or more information is available, the Group may be required
to change its estimates of future costs, which could have a
material adverse effect on its results of operations and financial
condition or liquidity.
Provisions are measured at the
present value of the expenditures expected to be required to settle
the obligation using a pre-tax rate that reflects current market
assessments of the time value of money and the risks specific to
the obligation. The increase in the provisions due to passage of
time is recognized in the Statements of Income.
Onerous
contracts
A provision for onerous contracts is
recognized when the expected benefits are lower than the costs of
complying with contract obligations. The provision is measured at
the present value of the lower of expected cost of terminating the
contract and the net expected cost of continuing the contract.
Before recognizing a provision, the Group recognizes the impairment
of the assets related to the mentioned contract.
2.19.
Irrevocable right of use of
the capacity of underwater communication lines
Transactions carried out to acquire
an irrevocable right of use of the capacity of underwater
communication lines are accounted for as service contracts. The
amount paid for the rights of use of the communication lines is
recognized as “Prepaid expenses” under trade and other
receivables, and is amortized over a straight-line basis during the
period set forth in the contract (including the option term), which
is the estimated useful life of such capacity.
2.20.
Employee
benefits
(a)
Defined contribution
plans
The Group operates a defined
contribution plan, which is a pension plan under which the Group
pays fixed contributions into a separate entity. The Group has no
legal or constructive obligations to pay further contributions if
the fund does not hold sufficient assets to pay all employees the
benefits relating to employee service in the current year or prior
periods. The contributions are recognized as employee benefit
expense in the Statements of Income in the fiscal year they are
due.
(b)
Termination
benefits
Termination benefits are payable
when employment is terminated by the Group before the normal
retirement date, or whenever an employee accepts voluntary
redundancy in exchange for these benefits. The Group recognizes
termination benefits when it is demonstrably committed to either
terminating the employment of current employees according to a
detailed formal plan without possibility of withdrawal or as a
result of an offer made to encourage voluntary termination as a
result of redundancy.
(c)
Bonus plans
The Group recognizes a liability and
an expense for bonuses based on a formula that takes into
consideration the profit attributable to the Company’s
shareholders after certain adjustments. The Group recognizes a
provision where contractually obliged or where there is a past
practice that has created a constructive obligation.
(d)
Defined benefit
plans
The Group’s net obligation
concerning defined benefit plans are calculated on an individual
basis for each plan, estimating the future benefits employees have
gained in exchange for their services in the current and prior
periods. The
benefit is disclosed at its present value, net
of the fair value of the plan assets. Calculations are made on an
annual basis by a qualified actuary.
F-32
IRSA Inversiones y Representaciones Sociedad
Anónima
(e)
Share-based
payments
The fair value of the equity settled
awards is measured at the date of grant. The Group measures the
fair value using the valuation technique that it considers to be
the most appropriate to value each class of award. Methods used may
include Black-Scholes calculations or other models as appropriate.
The valuations take into account factors such as
non-transferability, exercise restrictions and behavioral
considerations.
The fair value of the share-based
payment is expensed and charged to income under the straight-line
method over the vesting period in which the right to the equity
instrument becomes irrevocable (“vesting period”); such
value is based on the best available estimate of the number of
equity instruments expected to vest. Such estimate is revised if
subsequent information available indicating that the number of
equity instruments expected to vest differs from original
estimates.
(f)
Other long-term
benefits
The net obligation of IDBD and its
subsidiaries concerning employee long-term benefits, other than
retirement plans, is the amount of the future benefits employees
have gained in exchange for their services in the current and prior
periods. These benefits are discounted at their present
values.
2.21.
Current income tax, deferred
income tax and minimum presumed income tax
Tax expense for the year comprises
the charge for tax currently payable and deferred income. Income
tax is recognized in the statements of income, except to the extent
that it relates to items recognized in other comprehensive income
or directly in equity, in which case, the tax is also recognized in
other comprehensive income or directly in equity,
respectively.
Current income tax charge is
calculated on the basis of the tax laws enacted or substantially
enacted at the date of the Statements of Financial Position in the
countries where the Company and its subsidiaries operate and
generate taxable income. The Group periodically evaluates positions
taken in tax returns with respect to situations in which applicable
tax regulation is subject to interpretation. The Group establishes
provisions where appropriate on the basis of amounts expected to be
paid to the tax authorities.
Deferred income tax is recognized,
using the liability method, on temporary differences arising
between the tax bases of assets and liabilities and their carrying
amounts in the Consolidated Financial Statements. However, deferred
tax liabilities are not recognized if they arise from the initial
recognition of goodwill; deferred income tax is not accounted for
if it arises from initial recognition of an asset or liability in a
transaction other than a business combination that at the time of
the transaction affects neither accounting nor taxable profit or
loss. Deferred income tax is determined using tax rates (and laws)
that have been enacted or substantively enacted by the date of the
Statements of Financial Position and are expected to apply when the
related deferred income tax asset is realized or the deferred
income tax liability is settled.
Deferred income tax assets are
recognized only to the extent that it is probable that future
taxable profit will be available against which the temporary
differences can be utilized. Deferred income tax is provided on
temporary differences arising on investments in subsidiaries, joint
ventures and associates, except for deferred income tax liabilities
where the timing of the reversal of the temporary difference is
controlled by the Group and it is probable that the temporary
difference will not reverse in the foreseeable future.
Deferred income tax assets and
liabilities are offset when there is a legally enforceable right to
offset current tax assets against current tax liabilities and when
the deferred income taxes assets and liabilities relate to income
taxes levied
by the same
taxation authority on either the same taxable entity or different
taxable entities where there is an intention to settle the balances
on a net basis.
F-33
IRSA Inversiones y Representaciones Sociedad
Anónima
The Group is able to control the
timing of dividends from its subsidiaries and hence does not expect
taxable profit. Hence, deferred tax is recognized in respect of the
retained earnings of overseas subsidiaries only if at the date of
the Statements of Financial Position, dividends have been accrued
as receivable or a binding agreement to distribute past earnings in
future has been entered into by the subsidiary or else, there are
sale plans in the foreseeable.
Entities in Argentina are subject to
the Minimum Presumed Income Tax (“MPIT”). Pursuant to
this tax regime, an entity is required to pay the greater of the
income tax or the MPIT. The MPIT provision is calculated on an
individual entity basis at the statutory asset tax rate of 1% and
is based upon the taxable assets of each company as of the end of
the year, as defined by Argentine law. Any excess of the MPIT over
the income tax may be carried forward and recognized as a tax
credit against future income taxes payable over a 10-year period.
When the Group assesses that it is probable that it will use the
MPIT payment against future taxable income tax charges within the
applicable 10-year period, recognizes the MPIT as a current or
non-current receivable, as applicable, within “Trade and
other receivables” in the Statements of Financial
Position.
2.22.
Cash and cash
equivalents
Cash and cash equivalents include
cash on hand, deposits held with banks, and other short-term highly
liquid investments with original maturities of three months or
less. Bank overdrafts are not included.
2.23.
Revenue
recognition
Group's revenue is measured at the
fair value of the consideration received or
receivable.
Revenue from the sale of property is
recognized when: (a) material risks and benefits derived from title
to property have been transferred; (b) the Company does not retain
any management function on the assets sold nor does it have any
control whatsoever on such assets; (c) the amount of revenues and
costs associated to the transaction may be measured on a reliable
basis; and (d) the Company is expected to accrue the economic
benefits associated to the transaction.
Revenue derived from the provision
of services is recognized when: (a) the amount of revenue and costs
associated to services may be measured on a reliable basis; (b) the
Company is expected to accrue the economic benefits associated to
the transaction, and (c) the level of completion of services may be
measured on a reliable basis.
●
Rental and services - Shopping malls
portfolio
Revenues derived from business
activities developed in the Group’s shopping malls mainly
include rental income under operating leases, admission rights,
commissions and revenue from several complementary services
provided to the Group’s lessees.
Rental income from shopping mall,
admission rights and commissions, are recognized in the Statements
of Income on a straight-line basis over the term of the leases.
When lease incentives are granted, they are recognized as an
integral part of the net consideration for the use of the property
and are therefore recognized on the same straight-line
basis.
Contingent rents, i.e. lease
payments that are not fixed at the inception of a lease, are
recorded as income in the periods in which they are known and can
be determined. Rent reviews are recognized when such reviews have
been agreed with tenants.
F-34
IRSA Inversiones y Representaciones Sociedad
Anónima
The Group´s lease contracts
also provide that common area maintenance charges and collective
promotion funds of the Group’s shopping malls are borne by
the corresponding lessees, generally on a proportionally basis.
These common area maintenance charges include all expenses
necessary for various purposes including, but not limited to, the
operation, maintenance, management, safety, preservation, repair,
supervision, insurance and enhancement of the shopping malls. The
lessor is responsible for determining the need and suitability of
incurring a common area expense. The Group makes the original
payment for such expenses, which are then reimbursed by the
lessees. The Group considers that it acts as a principal in these
cases. Service charge income is presented separately from property
operating expenses. Property operating expenses are expensed as
incurred.
●
Rental and services - Offices and other rental
properties
Rental income from offices and other
rental properties include rental income from office leased out
under operating leases, income for services and expenses recovery
paid by tenant.
Rental income from offices and other
rental properties is recognized in the Statements of Income on a
straight-line basis over the term of the leases. When lease
incentives are granted, they are recognized as an integral part of
the net consideration for the use of the property and are therefore
recognized on the same straight-line basis.
A substantial portion of the
Group’s leases require the tenant to reimburse the Group for
a substantial portion of operating expenses, usually a
proportionate share of the allocable operating expenses. Such
property operating expenses includes necessary expenses such as
property operating, repairs and maintenance, security, janitorial,
insurance, landscaping, leased properties and other administrative
expenses, among others. The Group manages its own rental
properties. The Group makes the original payment for these
expenses, which are then reimbursed by the lessees. The Group
considers that it acts as a principal in these cases. The Group
accrues reimbursements from tenants as service charge revenue in
the period the applicable expenditures are incurred and is
presented separately from property operating expenses. Property
operating expenses are expensed as incurred.
●
Revenue from supermarkets
Revenue from the sale of goods in
the ordinary course of business are recognized at the fair value of
the consideration collected or receivable, net of returns and
discounts. When the credit term is short and financing is that
typical in the industry, consideration is not discounted. When the
credit term is longer than the industry’s average, in
accounting for the consideration, the Group discounts it to its net
present value by using the client’s risk premium or the
market rate. The difference between the fair value and the nominal
amount is accounted for under financial income. If discounts are
granted and their amount can be measured reliably, the discount is
recognized as a reduction of revenue.
Generally, the Group recognizes
revenue upon delivery of goods to the client. In international
sales, revenue is recognized upon loading goods with the forwarder.
Where two or more products are sold under one single contract, the
Group separates each component and gives them a separate accounting
treatment. The attribution of value to each component is based on
the relative fair value of each unit. Should the fair value not be
measurable on a reliable basis, then revenue is attributed based on
the difference arising between the total amount of the executed
contract and the fair value of the goods delivered.
As regards client loyalty programs,
the fair value of the consideration received or receivable in
relation to the initial sale is allocated across the rewards
credits and the other components of the sale. The amount allocated
to rewards credits is estimated based on the market value of the
goods to be delivered. The fair value of the right to purchase
products at a discount is calculated considering the expected
exchange ratio and the expected terms. Such amount is deferred and
revenue is recognized only where rewards credits are exchanged and
the Group has complied with its obligation to provide the products
at a discount, or else when such reward credits have expired. The
amount of revenue recognized under such circumstances is based on
the number of reward credits that have been exchanged for products
with discounts, in relation
F-35
IRSA Inversiones y Representaciones Sociedad
Anónima
to the total number of reward
credits expected to be exchanged. Deferred revenue is then reversed
when reward credits are no longer likely to be
exchanged.
In addition, when the Group acts as
agent and not as main supplier in a transaction, revenue is
recognized at the net amount of commissions. Revenue from
commissions is recognized based on transactions conducted by credit
card companies at the rate and on the date they are credited.
Revenue from credit margins of credit cards is recognized on the
date the client is bound to pay and revenue for subscription fees
is recognized on a monthly basis.
●
Revenue from communication services and sale of
communication equipment
Revenue derived from the use of
communication networks by the Group, including mobile phones,
Internet services, international calls, fixed line calls,
interconnection rates and roaming service rates, are recognized
when the service is provided, proportionally to the extent the
transaction has been realized, and provided all other criteria have
been met for revenue recognition.
Revenue from the sale of mobile
phone cards are initially recognized as deferred revenue and then
recognized as revenue as they are used or upon expiration,
whichever takes place earlier.
A transaction involving the sale of
equipment to a final user normally also involves a service sale
transaction. In general, this type of sale is performed without a
contractual obligation by the client to consume telephone services
for a minimum amount over a predetermined period. As a result, the
Group records the sale of equipment separately and recognizes
revenue pursuant to the transaction value upon delivery of the
equipment to the client. Revenue from telephone services are
recognized and accounted for as they are provided. When the client
is bound to make a minimum consumption of services during a
predefined period, the contract formalizes a transaction of several
elements and, therefore, revenue from the sale of equipment is
recorded at an amount that should not exceed its fair value, and is
recognized upon delivery of the equipment to the client and
provided the criteria for recognition are met. The Group ascertains
the fair value of individual elements, based on the price at which
it is normally sold, after taking into account the relevant
discounts.
Revenue derived from long-term
contracts is recognized at the present value of future cash flows,
discounted at market rates prevailing on the transaction date. Any
difference between the original credit and its net present value is
accounted for as interest income over the credit term.
2.24.
Cost of sales
The cost of sales of supermarkets,
includes the acquisition costs for the products less discounts
granted by suppliers, as well as all expenses associated with
storing and handling inventories. It also includes operational and
management costs for shopping malls held by the Group as part of
its real estate investments.
The Group’s cost of sales in
relation to the supply of communication services mainly includes
the costs to purchase equipment, salaries and related expenses,
service costs, royalties, ongoing license dues, interconnection and
roaming expenses, cell tower lease costs, depreciation and
amortization expenses and maintenance expenses directly related to
the services provided.
2.25.
Share capital
Ordinary shares are classified as
equity. Incremental costs directly attributable to the issue of new
ordinary shares or options are shown in equity as a deduction, net
of tax, from the proceeds.
When any Group´s subsidiary
purchases the Company’s equity share capital (treasury
shares), the consideration paid, including any directly
attributable incremental costs (net of income taxes) is deducted
from equity attributable to the Company’s equity holders
until the shares are cancelled or reissued. When such ordinary
shares are subsequently
reissued, any consideration received, net of any
directly attributable incremental transaction costs and related
income tax effects, is included in equity.
Instruments issued by the Group that
will be settled by the Company delivering a fixed number of its own
equity instruments in exchange for a fixed amount of cash or
another financial asset are classified as equity.
F-36
IRSA Inversiones y Representaciones Sociedad
Anónima
2.26.
Comparability of
information
As required by IFRS 3, the
information of IDBD is included in the Consolidated Financial
Statements of the Group as from takeover was secured, that is from
October 11, 2015, and the prior periods are not modified by this
situation. Therefore, the consolidated financial information for
periods after the acquisition is not comparable with prior periods.
Additionally, results for the fiscal year ended June 30, 2017
includes 12 full months of results from IDBD, for the period
beginning April 1
st
2016 through March
31, 2017, while results for the fiscal year ended June 30, 2016
includes the results from IDBD for the period beginning October 11,
2015 through March 31, 2016; both adjusted for significant
transactions that took place between April 1
st.
and June 30, 2016
and 2017,
respectively,
such as change in fair
value of financial instruments, issuance of debentures, sale of
significant assets, transactions with non-controlling shareholders,
and any other significant transaction . Hence, the result for the
reported periods are not comparable.
Furthermore, during the fiscal year
ended as of June 30, 2016, the Argentine Peso devalued against the
US Dollar and other currencies by around 65%, which has an impact
in comparative information presented in the Financial Statements,
due mainly to the currency exposure of our income and costs from
the "offices and other properties" segment, and our assets and
liabilities in foreign currency.
Certain items from prior fiscal
years have been reclassified for consistency purposes. The loans
granted to associates and joint ventures, with features of
long-term investments, are considered part of the investment in
such associates and joint ventures; as a result, financial income
derived from those loans have been reclassified to present them
net, with the share of profit of associates and joint-ventures in
the amount of Ps. 116. The group considers that it is more accurate
and provides more relevant information to users of Financial
Statements.
2.27.
Out-of-period
adjustment
During the fiscal year ended June
30, 2017, the Group reclassified Ps. 31 into intangible assets, Ps.
224 into investment property, Ps. 59 into deferred tax liabilities
and Ps. 133 into non-controlling interests, with modifications to
such items by those amounts for the previous fiscal year. These
adjustments were not material to the Financial Statements
previously issued, and are not material to these Consolidated
Financial Statements, either individually or as a
whole.
F-37
IRSA Inversiones
y Representaciones Sociedad Anónima
Not all of these significant
accounting policies require management to make subjective or
complex judgments or estimates. The following is intended to
provide an understanding of the policies that management considers
critical because of the level of complexity, judgment or
estimations involved in their application and their impact on the
Consolidated Financial Statements. These judgments involve
assumptions or estimates in respect of future events. Actual
results may differ from these estimates.
|
Estimation
|
Main
assumptions
|
Potential
implications
|
Main
references
|
|
Business combination - Allocation of
acquisition prices
|
Assumptions regarding timing, amount
of future revenues and expenses, revenue growth, expected rate of
return, economic conditions, discount rate, among
other.
|
Should the assumptions made be
inaccurate, the recognized combination may not be
correct.
|
|
|
Recoverable amounts of
cash-generating units (even those including goodwill), associates
and assets.
|
The discount rate and the expected
growth rate before taxes in connection with cash-generating
units.
The discount rate and the expected
growth rate after taxes in connection with associates.
Cash flows are determined based on
past experiences with the asset or with similar assets and in
accordance with the Group’s best factual assumption relative
to the economic conditions expected to prevail.
Business continuity of
cash-generating units.
Appraisals made by external
appraisers and valuators with relation to the assets’ fair
value, net of realization costs (including real estate
assets).
|
Should any of the assumptions made
be inaccurate, this could lead to differences in the recoverable
values of cash-generating units.
|
Note 11 – Property, plant and
equipment
Note 13 – Intangible
assets
|
|
Control, joint control or
significant influence
|
Judgment relative to the
determination that the Group holds an interest in the shares of
investees (considering the existence and influence of significant
potential voting rights), its right to designate members in the
executive management of such companies (usually the Board of
directors) based on the investees’ bylaws; the composition
and the rights of other shareholders of such investees and their
capacity to establish operating and financial policies for
investees or to take part in the establishment
thereof.
|
Accounting treatment of investments
as subsidiaries (consolidation) or associates (equity
method)
|
Note 2.3
|
|
Estimated useful life of intangible
assets and property, plant and equipment
|
Estimated useful life of assets
based on their conditions.
|
Recognition of accelerated or
decelerated depreciation by comparison against final actual
earnings (losses).
|
|
|
Fair value valuation of investment
properties
|
Fair value valuation made by
external appraisers and valuators. See Note 10.
|
Incorrect valuation of investment
property values
|
|
|
Income tax
|
The Group estimates the income tax
amount payable for transactions where the Treasury’s Claim
cannot be clearly determined.
Additionally, the Group evaluates
the recoverability of assets due to deferred taxes considering
whether some or all of the assets will not be
recoverable.
|
Upon the improper determination of
the provision for income tax, the Group will be bound to pay
additional taxes, including fines and compensatory and punitive
interest.
|
|
|
Allowance for doubtful
accounts
|
A periodic review is conducted of
receivables risks in the Group’s clients’ portfolios.
Bad debts based on the expiration of account receivables and
account receivables’ specific conditions.
|
Improper recognition of charges /
reimbursements of the allowance for bad debt.
|
|
|
Level 2 and 3 financial
instruments
|
Main assumptions used by the Group
are:
●
Discounted projected income by interest
rate
●
Values determined in accordance with the shares
in equity funds on the basis of its Financial Statements, based on
fair value or investment assessments.
●
Comparable market multiple (EV/GMV
ratio).
●
Underlying asset price
(Market price); share price volatility (historical) and market
interest-rate (Libor rate curve).
|
Incorrect recognition of a charge to
income / (loss).
|
|
|
Probability estimate of
contingent liabilities.
|
Whether more economic resources may
be spent in relation to litigation against the Group; such estimate
is based on legal advisors’ opinions.
|
Charge / reversal of provision in
relation to a claim.
|
|
F-38
IRSA Inversiones
y Representaciones Sociedad Anónima
4.
Acquisitions and
disposals
Operations Center
in Argentina
A.
Acquisition
of equity interest in EHSA
On July 2016, the Group, through
IRSA CP, acquired 20% of the share of EHSA, a company of which it
already owned 50%, and 1.25% of the share of ENUSA. The amount paid
was Ps. 53. As a result, the Group now holds 70% of the share
capital and voting stock of EHSA. In addition, EHSA holds, both
directly and indirectly, 100% of the shares of OASA and 95% of the
shares of ENUSA. Furthermore, OASA holds 50% of the voting stock of
LRSA, a company that holds the rights to commercially operate the
emblematic "Predio Ferial de Palermo" in the Autonomous City of
Buenos Aires, where the SRA holds the remaining 50%.
The following chart shows the
consideration, the fair value of the acquired assets, the assumed
liabilities and the non-controlling interest as of the acquisition
date.
|
|
July
2016
|
|
Fair
value of identifiable assets and assumed liabilities:
|
|
|
Investments in joint
ventures
|
(107
)
|
|
Trade and other
receivables
|
(97
)
|
|
Borrowings
|
55
|
|
Deferred income
tax
|
6
|
|
Income tax and MPIT
liabilities
|
1
|
|
Trade and other
payables
|
13
|
|
Provisions
|
2
|
|
Cash and cash equivalents
acquired
|
(7
)
|
|
Total
net identifiable assets
|
(134
)
|
|
Non-controlling
interest
|
40
|
|
Goodwill
|
(26
)
|
|
Total
|
(120
)
|
|
Fair value of the interest
held before the business combination
|
67
|
|
Total
consideration
|
(53
)
|
B.
Condor
In January 2017, Condor issued
150,540 new warrants in favor of RES with the right to one share
each, at an exercise price of 0.001 US$ per share, maturing in
January 2019. The new warrants replace the previous 3,750,000
warrants, which granted a right to one share each, at an exercise
price of 1.92 US$ per share, maturing on January 31, 2017. It
should be noted that the new warrants cannot be exercised if the
interest in Condor exceed 49.5% as a result of the exercise.
Additionally, the Group exercised the conversion right of the
3,245,156 series D preferred shares (with a par value of 10 US$ per
share) held by RES, converting them into 20,282,225 common shares
of Condor (with a par value of 0.01 US$ per share), i.e., at the
conversion price established of 1.60 US$ per share, which
represents a total value of US$ 32.4. Besides, it received 487,738
series E preferred shares that can be converted into common shares
at 2.13 US$ per share as from February 28, 2019, and pay dividends
on a quarterly basis at an annual rate of 6.25%. RES allocated the
considerations paid among the different identifiable net assets of
Condor; as a result, it recognized a higher value for property,
plant and equipment, a lower value of loans and goodwill in the
amount of US$ 5.69, US$ 0.27 and US$ 6.37,
respectively.
During February, Condor’s
Board of Directors approved a reverse stock split, consisting of 1
(one) common share for every 6.5 shares issued and outstanding,
which was carried out after the market closing on March 15, 2017.
The par value of the shares remained at 0.01 US$ per share, while
the conversion price of series E preferred shares became 13.845 US$
per share and the exercise price of the warrants became US$ 0.0065.
During March, Condor made a public offering of its shares, which
resulted in the issuance of 4,772,500 new shares (including 622,500
additional shares for the exercise of one call option granted to
the subscribers), at a price of 10.50 US$ per share. The Group did
not take part in it.
F-39
IRSA Inversiones y Representaciones Sociedad
Anónima
As a
consequence of the events described above, as of June 30, 2017, the
Group held 3,314,453 common shares of Condor representing roughly
28.5% of the Company’s share capital and voting rights. It
also held 487,738 series E preferred shares, 23,160 warrants and a
promissory note convertible into 97,269 common shares (at 10.4 US$
per share). The Board of Directors of Condor is formed by 4
directors of the company, 3 directors appointed by Stepstone Real
Estate and 2 independent directors. In addition, the voting power
held by the company in Condor amounts to 49%, thus keeping
significant influence.
C.
Purchase
of Philips Building
On June 5, 2017, the Group through
IRSA CP acquired the Philips Building located in Saavedra,
Autonomous City of Buenos Aires, next to the DOT Shopping Mall. The
building has a constructed area of 10,142 square meters and is
intended for office development and lease. The acquisition price
was US$ 29 million, which was fully paid up as of June 30, 2017.
Furthermore, IRSA CP has signed a bailment contract with the seller
for a term of 7 months and 15 days, which expires automatically on
January 19, 2018.
D.
Acquisition
of additional interest in BHSA
During the year ended June 30, 2015,
the Group acquired 3,289,029 additional shares of BHSA in a total
amount of Ps. 14.2, thus increasing its interest in such company
from 29.77% to 29.99%, without consideration of treasury shares.
During the year ended June 30, 2016, the Group sold 1,115,165
shares of BHSA in a total amount of Ps. 7.7, thus decreasing its
interest to 29.91%, without consideration of treasury
shares.
E.
BACS
The Group through Tyrus, subscribed
a purchase agreement of shares of BACS, representing an interest of
6.125%. The acquisition price was US$ 1.35. On August 24, 2016 the
transaction was approved by the BCRA.
On June 17, 2015, the Group, through
IRSA, subscribed Ps. 100 nominal value of BACS’ Convertible
Notes. On June 21, 2016 we notified BACS the exercise of our right
to convert all of the convertible notes into common shares. On
February 7, 2017, the BCRA approved the conversion whereby IRSA was
given 25,313,251 shares of BACS. As a result, as of June 30, 2017,
the Group holds an interest of 37.72% in BACS.
F.
Rigby
capital reduction
During fiscal year 2015, Rigby
reduced its capital stock by distributing the gain from the sale of
Madison building among existing shareholders, proportionally to
their shareholdings. The total amount distributed was US$ 103.8, of
which the Group received US$ 77.4 (US$ 26.5 through IRSA
International and US$ 50.9 through IMadison LLC) and US$ 26.4 were
distributed to other shareholders. As a result of such reduction,
the Group has decided to reverse the corresponding accumulated
conversion difference on a pro rata basis, which amounted to Ps.
219. This reversal has been recognized in the line “Other
operating results, net" in the Statements of income.
Operations Center
in Israel
A.
Sale
of Adama
In 2011, Koor
(a wholly own subsidiary of DIC) sold 60% of Adama’s shares
to China National Agrochemical Corporation
(“ChemChina”) and was also granted a non-recourse loan
in the aggregate amount of US$ 960, which was secured by the
remaining 40% of ADAMA shares held by Koor as of June 30,
2016.
F-40
IRSA Inversiones y Representaciones Sociedad
Anónima
On July 17, 2016 DIC announced to
the market that it had accepted the offer by ChemChina for the
acquisition of 40% of Adama’s shares which were held by Koor,
a company indirectly controlled by IDBD through DIC. On August
2016, Koor and a subsidiary of ChemChina executed the corresponding
agreement. The price of the transaction included a payment in cash
of US$ 230 plus the total repayment of the non-recourse loan and
its interests, which had been granted to Koor by a Chinese bank. On
November 22, 2016, the sale transaction was finalized and Koor
received cash in the amount of US$ 230. Our share in the results of
Adama and the finance costs related to the hybrid financial
instrument were retrospectively classified as discontinued
operations in the Group’s Consolidated Statements of Income
as from July 17, 2016 (Note 32). On June 30, 2017, the Company
recorded a gain of Ps. 4,216 pursuant to the sale.
B.
Changes
of interest in Shufersal
During the
fiscal year ended June 30, 2017, the Group – through DIC and
several transactions – increased its interest in Shufersal
capital stock by 7.7% upon payment of a net amount of NIS 235
(equivalent to approximately Ps. 935) and in March 2017, DIC sold
1.38% of Shufersal in an amount of NIS 50 (equal to Ps. 210 as of
that date). (Note 7)
C.
Share-holding
increase in DIC
On September 23, 2016 Tyrus acquired
8,888,888 of DIC’s shares from IDBD for a total amount of NIS
100 (equivalent to Ps. 401 as of that date), which represent 8.8%
of the Company’s outstanding shares at such date.
During March 2017, IDBD exercised
all of DIC’s Series 5 and 6 warrants for nearly NIS 210
(approximately equivalent to Ps. 882 as of that date), thereby
increasing its direct interest in DIC to nearly 70% of such
company’s share capital as of that date and the Group's
equity interest to 79.47%. Subsequently, third parties not related
to the Group, exercised their warrants, thus diluting the
Group’s interest in DIC to 77.25%.
D.
Partial sale of equity interest in PBC
DIC sold 12% of its equity interest
in PBC for a total consideration of NIS 217 (approximately
equivalent to Ps. 810); as a result, DIC’s interest in PBC
has declined to 64.4%.
E.
Partial
sale of equity interest in Gav Yam
On December 5, 2016, PBC sold
280,873 shares of its subsidiary Gav-Yam Land Corporation Ltd. for
an amount of NIS 391 (equivalent to Ps. 1,616 as of that date). As
a result of this transaction, the equity interest has decreased to
55.06%.
F.
Negotiations
between Israir and Sun d'Or
On June 30, 2017 IDB Tourism was at
an advanced stage of negotiations with Sun d’Or International
Airlines Ltd. (“Sun d’Or”), a subsidiary of El Al
Israel Airlines Ltd. ("El Al"), and on July 2, 2017 an agreement
was signed, which consists of:
-
Israir will sell the aircrafts it owns through a
sale and lease back agreement for an estimated value of US$
70;
-
Israir will repay a loan owed to IDB Tourism in
the amount of US$ 18;
-
Following the repayment of the loan and the sale
of airplanes mentioned above, IDB Tourism will receive up to US$ 45
(which includes a loan of up to US$ 8.8 to be discharged through
the distribution of dividends of Sun D’ Or), plus a 25% of
Sun D´Or shares, with El Al holding a 75% of the shares of
such company;
-
The parties will enter into a shareholder
agreement that would give El Al a call option (and a sale option to
IDB Tourism) for the acquisition of Sun D’Or’s shares
in accordance with a price and terms that will be established in
due course.
F-41
IRSA Inversiones y Representaciones Sociedad
Anónima
As a consequence of this process,
the Group’s Financial Statements as of June 30, 2017 present
the investment in Israir as assets and liabilities held for sale,
and a loss of nearly NIS 56 (approximately equivalent to Ps. 231 as
of December 31, 2016 when it was reclassified to discontinued
operation), as a result of measuring these net assets at the
estimated recoverable value. The transaction is subject to (i)
approval by the Anti-Trust Authority; (ii) Sun D´Or´s and
Israir’s equity as of December 31, 2017 may not be negative
in their related Financial Statements and Israir’s tangible
equity should not be lower than US$ 7; (iii) the validity and
effectiveness of licenses held by Israir as granted by the Civil
Aviation Authority and Transportation Ministry; (iv) the sale of
the airplanes indicated above; (v) the execution of collective
bargaining agreements with pilots, etc. The transaction is expected
to be finalized by the end of 2017.
G.
Agreement
for New Pharm acquisition
On April 6, 2017, Shufersal entered
into an agreement (the "agreement") with Hamashbir 365 Holdings
Ltd. ("the seller" or "Hamashbir") for the purchase of the shares
of New Pharm Drugstores Ltd. ("New Pharm"), representative of 100%
of that Company’s share capital ("the shares sold"), for an
amount of NIS 130 (equivalent to Ps. 611 as of the date of these
Consolidated Financial Statements), payable upon execution of the
transaction, which is subject to fulfillment of the following
conditions; among others:
●
approval by the Antitrust Commission of Israel.
If the approval is not obtained within 3 months following the date
the request is filed (extendable for one additional month under
certain circumstances), the agreement will be automatically
invalidated, unless the parties agree on a term
extension.
●
the release and invalidation of all the existing
guarantees of New Pharm over the liabilities of the companies of
Hamashbir Group, and the release and invalidation of all the
existing guarantees of the companies of Hamashbir Group over the
liabilities of New Pharm.
Upon execution of the agreement, a
non-competition clause will be signed. As of the date of issuance
of these Consolidated Financial Statements, not all of the
mentioned conditions has been fulfilled.
On August 30, 2017, Shufersal and
the seller agreed to extend the approval of the Anti-trust
Authority until September 14, 2017 and the fulfillment of the
conditions precedent and the delivery of Financial Statements until
September 30, 2017. On September 6, 2017, the Anti-trust Commission
approved the merger between Shufersal and New Pham subject to
certain conditions.
After the
approval of the antitrust commission, on September 28, 2017, the
parties signed an addendum to that agreement which states that nine
New Pharm stores will be sold to a third party and a Shufersal
store to another. The sale of New Pharm stores will be collected by
New Pahrm prior to the merger, which changes the price of the
transaction but not significantly. The last date to sign the sales
agreement was stipulated to be on November 30, 2017 and the
execution date on December 31, 2017.
H.
IDBD
a)
Control
obtainment
On May 2014, the Group, acting
indirectly through Dolphin, acquired jointly with ETH an aggregate
number of 106.6 million common shares in IDBD, representing 53.30%
of its stock capital, under the scope of the debt restructuring of
IDBH, IDBD's parent company, with its creditors (the
"Arrangement"). Under the terms of the agreement entered into,
Dolphin acquired a 50% interest in this investment, and ETH
acquired the remaining 50% (the "Shareholders' Agreement). The
initial total investment amount was NIS 950, equivalent to
approximately US$ 272 at the exchange rate prevailing on that date.
On May 2015, ETH launched the BMBY mechanism provided in the
Shareholders’ Agreement (clause which establishes that each
party of the Shareholders’ Agreement may offer to the
counterparty to acquire (or sell, as the case may be), the shares
it holds in IDBD at a fixed price). On June 2015, Dolphin gave
notice to ETH of its intention to buy all the shares of IDBD held
by ETH.
After
certain aspects of the offer were resolved through an arbitration
process initiated by the parties, on September 24, 2015, the
competent arbitrator resolved that: (i) Dolphin and IFISA (related
Company to the Group) were entitled to act as buyers in the BMBY
process, and consequently; (ii) the buyer would have the obligation
to fulfil all of the commitments included in the seller’s
Arrangement, including the commitment to carry out the Tender
Offers; (iii) the buyer might pledged in favor of the Arrangement
Trustees the shares that the seller had pledged to them.
Notwithstanding the
foregoing, there is an arbitration process going
on between Dolphin and ETH in relation to certain issues connected
to the control obtainment of IDBD. As of the date of these
Consolidated Financial Statements, there are no other news in
relation to the process which is still pending (Note
7).
F-42
IRSA Inversiones y Representaciones Sociedad
Anónima
On October 11, 2015, the BMBY
process concluded, and IFISA acquired all IDBD's shares of stock
held by ETH (92,665,925 shares) at a price of NIS 1.64 per share.
Consequently, the Shareholders' Agreement ceased and members of
IDBD's Board of Directors representing ETH submitted their
irrevocable resignation to the Board, therefore Dolphin was hence
empowered to appoint the new members to the Board. Additionally, on
the same date, Dolphin pledged the additional shares
acquired.
Later on, following the exercise of
the BMBY, Dolphin entered into an option agreement with IFISA that
grants Dolphin the right, but not the obligation, to acquire
92,665,925 shares in IDBD which IFISA acquired in the BMBY process
at a price of NIS 1.64 per share plus an annual interest rate of
8.5%. The exercise date for the option extends for two years.
Additionally, Dolphin is entitled to a first refusal right in case
that IFISA agrees to sell these shares to a third party. The option
has no value as of June 30, 2017 and 2016.
As a consequence, the Group gained
control of IDBD and started to consolidate Financial Statements as
from that date. The following chart shows the consideration, the
fair value of the acquired assets, the assumed liabilities and the
non-controlling interest as of the acquisition date.
|
|
10.11.15
|
|
Fair value of the interest
in IDBD’s equity held before the business combination and
warrants
|
1,416
|
|
Total
consideration
|
1,416
|
|
|
10.11.15
|
|
Fair
value of identifiable assets and assumed liabilities:
|
|
|
Investment
properties
|
29,586
|
|
Property, plant and
equipment
|
15,104
|
|
Intangible
assets
|
6,603
|
|
Joint ventures and
investment in associates
|
9,268
|
|
Financial assets and other
assets held for sale
|
5,129
|
|
Trading
properties
|
2,656
|
|
Inventories
|
1,919
|
|
Income tax
credits
|
91
|
|
Trade and other
receivables
|
9,713
|
|
Investments in financial
assets
|
5,824
|
|
Cash and cash
equivalents
|
9,193
|
|
Deferred income
tax
|
(4,681
)
|
|
Provisions
|
(969
)
|
|
Borrowings
|
(60,306
)
|
|
Derivative financial
instruments, net
|
(54
)
|
|
Income tax
|
(267
)
|
|
Employee
benefits
|
(405
)
|
|
Trade and other
payables
|
(19,749
)
|
|
Total
net identifiable assets
|
8,655
|
|
Non-controlling
interest
|
(8,630
)
|
|
Goodwill
|
1,391
|
|
Total
|
1,416
|
The group asses the fair value of
the investment property with the assistance of qualified
independent appraisers. As of the acquisition date, the Group
estimates that recognized assets are recoverable. The value of the
non-controlling interest in IDBD has been determined on a
proportional basis to the fair value of net acquired assets and the
fair value of warrants.
F-43
IRSA Inversiones y Representaciones Sociedad
Anónima
Following the control of IDBD, the
cumulative currency translation accumulated in shareholders’
equity from the interest held in IDBD before the business
combination in the amount of Ps. 143 was recognized in the
Statement of Income. Such result was disclosed under "Other
operating results, net" line in the Statement of
Income.
The revenues IDBD has generated
since October 11, 2015 and that have been disclosed in the
Consolidated Statement of Income amount to Ps. 28,229. IDBD has
also run a net result of Ps. (1,643) during said period. If IDBD
had been included in the consolidation since July 1st, 2015, the
Group´s Consolidated Statement of Income would have shown
pro-forma revenues in the amount of Ps. 49,637 and pro-forma net
result of Ps. (1,651).
b)
Acquisition
of non-controlling interest
Dolphin was required to carry out
the first tranche of tender offers in December 2015.
Before expiration of such first tranche, Dolphin
and the agreement trustees (the "trustees") entered into an
extension agreement (the "Extension Agreement"), which was replaced
by the final agreement approved by approximately 95% of the
non-controlling shareholders of IDBD (excluding IFISA) and by
warrants holders of IDBD on March 2, 2016 and by the competent
court on March 10, 2016. The major amendments to the Agreement
were:
(i)
Replacement of the
obligation to conduct tender offers, Dolphin acquired all the
shares outstanding on March 29, 2016 from non-controlling
shareholders of IDBD (except for those held by IFISA) on March 31,
2016. The price paid for each IDBD share held by non-controlling
shareholders was NIS 1.25 per share in cash plus NIS 1.20 per share
in bonds of the IDBD Series 9 (the “IDBD Bonds”), which
IDBD will issue directly to non-controlling shareholders and
holders of warrants. Additionally, Dolphin undertaked to pay NIS
1.05 per share (subject to adjustments) in cash if Dolphin, either
directly or indirectly, gain control of Clal (more than 30%), or
else if IDBD sells a controlling shareholding in Clal (more than
30% to a third party) under certain parameters (the “payment
by Clal”), which refers mainly to Clal’s sale price (at
a price which exceeds 75% of its book value upon execution of the
sale agreement, subject to adjustments) and, under certain
circumstances, the proportion of Clal shares sold by IDBD. It is
worth noting that, the obligation to make such contingent payment
will only expire if the sale of a controlling interest is completed
(more than 30% to a third party), or if Dolphin obtains the control
permission from Clal.
(ii)
The warrants held by
non-controlling shareholders that have not been exercised until
March 28, 2016 expired on March 31, 2016. Each warrant holder was
entitled to elect whether: (a) to receive IDBD bonds (based on the
adjusted nominal value) in an amount equal to the difference
between NIS 2.45 per share and the exercise price of the warrants
and be entitled to the Clal payment; or (b) to receive a payment
determined by an independent appraiser.
(iii)
Dolphin compromised
that would provide IDBD a total amount of NIS 515 through several
subordinated loans for a total amount of NIS 348.5 in addition to
the issuance of IDBD Bonds in the amount of NIS 166.8, which were
used to comply with the liabilities mentioned in (ii). The
subordinated loans have the following features:
(a) it is
subordinated, even in the case of insolvency, to all current or
future debts of IDBD; (b) will be reimbursed after payment of all
the debts to their creditors; (c) accrues interest at a rate of
0.5%, which will be added to the amount of the debt and will be
payable only on the date the subordinated debt is amortized; (d)
Dolphin will not have a right to participate or vote in the
meetings with IDBD creditors with respect to the subordinated debt;
(e) as from January 1, 2016, Dolphin has the right, at its own
discretion, to convert the debt balance into IDBD shares, at that
time, whether wholly or partially, including the interest accrued
over the debt until that date; (f) if Dolphin opt to exercise the
conversion, the debt balance will be converted so that Dolphin will
receive IDBD shares according to a share price that will be 10%
less than the average price of the last 30 days prior to the date
the conversion option is exercised. In the event there is no market
price per share, this will be determined in accordance with an
average of three valuations made by external or independent
experts, who shall be determined by mutual consent and, in the
event of a lack of consent, they will be set by the President of
the Institute of Certified Public Accountants in
Israel.
(iv)
Dolphin had to pledge 28%
of its IDBD shares, as well as all rights in relation to the
subordinated loan granted in the amount of NIS 210 in December
2015, until the payment obligation to Clal has been completed or
has expired
after which the pledge will
be discharged. Should new shares be issued by IDBD, Dolphin will
have to pledge additional shares until completing the 28% of all
IDBD share capital. This pledge replaces the pre-existing
pledge.
(v)
Dolphin agreed not to
exercise its right to convert the subordinated loans into shares of
IDBD until the pledge described above has been
released.
F-44
IRSA Inversiones y Representaciones Sociedad
Anónima
As of the date
of issuance of these Consolidated Financial Statements, the only
outstanding payment is that owed to Clal, in the event that the
described conditions are fulfilled. Besides, Dolphin is bound to
exercise its warrants in the event the following conditions occur
jointly: (i) an agreement is reached to renegotiate the debt
covenants of IDBD and its subsidiaries and (ii) control over Clal
is secured. If both situations take place, the obligation would
amount to NIS 391. The warrants mature on February 10,
2018.
The transaction
described above represented the acquisition of an additional
interest of 19.28% in IDBD for a total amount of Ps. 1,249. As a
result of this transaction, the non-controlling interest was
increased by Ps. 346 and the interest attributable to the
shareholders’ of the controlling parents was increased by Ps.
234. As of June 30, 2017, IRSA’s indirect interest in IDBD
was 68.28% without considering dilution.
5.
Financial risk management and
fair value estimates
The Group's activities expose it to
a variety of financial risks: market risk (including foreign
currency risk, interest rate risk, indexing risk due to specific
clauses and other price risks), credit risk, liquidity risk and
capital risk. Within the Group, risk management functions are
conducted in relation to financial risks associated to financial
instruments to which the Group is exposed during a certain period
or as of a specific date.
The general risk management policies
of the Group seek both to minimize adverse potential effects on the
financial performance of the Group and to manage and control the
financial risks effectively. The Group uses financial instruments
to hedge certain risk exposures when deemed appropriate based on
its internal management risk policies, as explained
below.
Given the diversity of
characteristics corresponding to the business conducted in its
operations centers, the Group has decentralized the risk management
policies geographically based on its two operations centers in
order to identify and properly analyze the various types of risks
to which each subsidiary is exposed. Below is a list of the main
risk management policies of each of the operations
centers:
5.1.
Risk management in the
operations center in Argentina:
The risk management function within
the Group is carried out in respect of financial risks. Financial
risks are risks arising from financial instruments to which the
Group is exposed during or at the end of the reporting period.
Financial risk comprises market risk (including foreign currency
risk, interest rate risk and other price risk), credit risk,
liquidity risk and capital risk.
The Group’s diverse activities
are exposed to a variety of financial risks in the normal course of
business. The Group’s overall risk management policy focuses
on the unpredictability of financial markets and seeks to minimize
the Group’s capital costs by using suitable means of
financing and to manage and control the Group’s financial
risks effectively. The Group uses financial instruments to hedge
certain risk exposures when deemed appropriate based on its
internal management risk policies.
The Group’s principal
financial instruments comprise cash and cash equivalents,
receivables, payables, interest bearing assets and liabilities,
other financial liabilities, other investments and derivative
financial instruments. The Group manages its exposure to key
financial risks in accordance with the Group’s risk
management policies.
F-45
IRSA Inversiones y Representaciones Sociedad
Anónima
The Group’s management
framework includes policies, procedures, limits and allowed types
of derivative financial instruments. The Group has established a
Risk Committee, comprising members of senior management and a
member of Cresud’s Audit Committee (Parent Company of IRSA),
which reviews and oversees management’s compliance with these
policies, procedures and limits and has overall accountability for
the identification and management of risk across the
Group.
This section provides a description
of the principal risks that could have a material adverse effect on
the Group’s strategy, performance, results of operations and
financial condition. The risks facing the businesses, set out
below, do not appear in any particular order of potential
materiality or probability of occurrence.
The analysis of sensitivities to
market risks included below are based on a change in one factor
while holding all other factors constant. In practice this is
unlikely to occur, and changes in some of the factors may be
correlated – for example, changes in interest rate and
changes in foreign currency rates.
This sensitivity analysis provides
only a limited, point-in-time view. The actual impact on the
Group’s financial instruments may differ significantly from
the impact shown in the sensitivity analysis.
(a)
Market risk
management
The market risk is the risk of
changes in the market price of financial instruments with whom the
Group operates. The Group’s market risks arise from open
positions in foreign currencies, interest-bearing assets and
liabilities and equity securities of certain companies, to the
extent that these are exposed to market value movements. The Group
sets limits on the exposure to these risks that may be accepted,
which are monitored on a regular basis.
Foreign
Exchange risk and associated derivative financial
instruments
The Group publishes its Consolidated
Financial Statements in Argentine pesos but conducts operations and
holds positions in other currencies. As a result, the Group is
exposed to foreign currency exchange risk through exchange rate
movements, which affect the value of the Group’s foreign
currency positions. Foreign exchange risk arises when future
commercial transactions or recognized assets or liabilities are
denominated in a currency that is not the entity’s functional
currency.
The real estate, commercial and/or
financial activities of the Group’s subsidiaries from the
operations center in Argentina have the Argentine Peso as
functional currency. An important part of the business activities
of these subsidiaries is conducted in that currency, thus not
exposing the Group to foreign exchange risk. Other Group's
subsidiaries have other functional currencies, principally US
Dollar. In the ordinary course of business, the Group, through its
subsidiaries, transacts in currencies other than the respective
functional currencies of the subsidiaries. These transactions are
primarily denominated in US Dollars and New Israeli Shekel. Net
financial position exposure to the functional currencies is managed
on a case-by-case basis, partly by entering into foreign currency
derivative instruments and/or by borrowings in foreign currencies,
or other methods, considered adequate by the Management, according
to circumstances.
Financial instruments are considered
sensitive to foreign exchange rates only when they are not in the
functional currency of the entity that holds them. The following
table shows the net carrying amounts of the Company’s
financial instruments nominated in US$ and NIS, broken down by the
functional currencies in which the Company operates for the years
ended June 30, 2017, 2016 and 2015. The amounts are presented in
Argentine Pesos, the presentation currency of the
Group:
F-46
IRSA Inversiones
y Representaciones Sociedad Anónima
|
|
Net
monetary position (Liability)/Asset
|
|||||
|
Functional
currency
|
June 30,
2017
|
June 30,
2016
(recast)
|
June 30,
2015
(recast)
|
|||
|
|
US$
|
NIS
|
US$
|
NIS
|
US$
|
NIS
|
|
Argentine Peso
|
(11,436
)
|
-
|
(5,370
)
|
-
|
(2,576
)
|
-
|
|
Uruguayan Peso
|
(131
)
|
-
|
6
|
-
|
(67
)
|
-
|
|
US
Dollar
|
-
|
1
|
-
|
(7
)
|
-
|
(254
)
|
|
Total
|
(11,567
)
|
1
|
(5,364
)
|
(7
)
|
(2,643
)
|
(254
)
|
The Group estimates that, other
factors being constant, a 10% appreciation of the US Dollar against
the respective functional currencies at year-end would result in a
net additional loss before income tax for the years ended June 30,
2017, 2016 and 2015 for an amount of Ps. 1,157, Ps. 536 and Ps.
264, respectively. A 10% depreciation of the US Dollar against the
functional currencies would have an equal and opposite effect on
the statements of income.
On the other hand, the Group also
uses derivatives, such as forward exchange contracts, to manage its
exposure to foreign currency risk. As of June 30, 2017, 2016 and
2015 the Group has future exchanges contract pending for an amount
of US$ 12.9, US$ 21.0 and US$ 15.0, respectively, which book value
amounted to Ps. 14.9, Ps. (2.9) and Ps. (7.5),
respectively.
Interest
rate risk
The Group is exposed to interest
rate risk on its investments in debt instruments, short-term and
long-term borrowings and derivative financial
instruments.
The primary objective of the
Group’s investment activities is to preserve principal while
at the same time maximizing yields without significantly increasing
risk. To achieve this objective, the Group diversifies its
portfolio in accordance with the limits set by the Group. The Group
maintains a portfolio of cash equivalents and short-term
investments in a variety of securities, including both government
and corporate obligations and money market funds.
The Group’s interest rate risk
principally arises from long-term borrowings (Note 20). Borrowings
issued at variable rates expose the Group to cash flow interest
rate risk. Borrowings issued at fixed rates expose the Group to
fair value interest rate risk. The Group manages this risk by
maintaining an appropriate mix between fixed and floating rate
interest bearing liabilities. These activities are evaluated
regularly to determine that the Group is not exposed to interest
rate fluctuations that could adversely impact its ability to meet
its financial obligations and to comply with its borrowing
covenants.
The Group occasionally manages its
cash flow interest rate risk exposure by different hedging
instruments, including but not limited to interest rate swap,
depending on each particular case. For example, interest rate swaps
have the economic effect of converting borrowings from floating
rates to fixed rates or vice versa.
The interest rate risk policy is
approved by the Board of Directors. Management analyses the
Group’s interest rate exposure on a dynamic basis. Various
scenarios are simulated, taking into consideration refinancing,
renewal of existing positions and alternative financing sources.
Based on these scenarios, the Group calculates the impact on profit
and loss of a defined interest rate shift. The scenarios are run
only for liabilities that represent the major interest-bearing
positions. Trade payables are normally interest-free and have
settlement dates within one year. The simulation is done on a
regular basis to verify that the maximum potential loss is within
the limits set by management.
Note 20 shows a breakdown of the
Group’s fixed-rate and floating-rate borrowings per currency
denomination and functional currency of the subsidiary that holds
the loans for the fiscal years ended June 30, 2017, 2016 and
2015.
F-47
IRSA Inversiones y Representaciones Sociedad
Anónima
The Group estimates that, other
factors being constant, a 1% increase in floating rates at year-end
would increase net loss before income tax for the years ended June
30, 2017 in the amount of Ps. 6.6 (Ps. 13.7 in 2016 and Ps. 8.7 in
2015). A 1% decrease in floating rates would have an equal and
opposite effect on the Statement of Income.
Other
price risk
The Group is exposed to equity
securities price risk or derivative financial instruments because
of investments held in entities that are publicly traded, which
were classified on the Consolidated Statements of Financial
Position at “fair value through profit or loss”. The
Group regularly reviews the prices evolution of these equity
securities in order to identify significant movements.
As of June 30, 2017, 2016 and 2015
the total value of Group´s investments in shares and
derivative financial instruments of public companies amounts to Ps.
300, Ps. 822 and Ps. 437, respectively.
The Group estimates that, other
factors being constant, a 10% decrease in quoted prices of equity
securities and in derivative financial instruments portfolio at
year-end would generate a loss before income tax for the year ended
June 30, 2017 of Ps. 24 (Ps. 87 in 2016 and Ps. 250 in 2015). An
increase of 10% on these prices would have an equal and opposite
effect in the Statement of Income.
(b)
Credit
risk management
The credit risk arises from the
potential non-performance of contractual obligations by the
parties, with a resulting financial loss for the Group. Credit
limits have been established to ensure that the Group deals only
with approved counterparties and that counterparty concentration
risk is addressed and the risk of loss is mitigated. Counterparty
exposure is measured as the aggregate of all obligations of any
single legal entity or economic entity to the Group.
The Group is subject to credit risk
arising from deposits with banks and financial institutions,
investments of surplus cash balances, the use of derivative
financial instruments and from outstanding receivables Credit risk
is managed on a country-by-country basis. Each local entity is
responsible for managing and analyzing the credit
risk.
The Group’s policy is to
manage credit exposure from deposits, short-term investments and
other financial instruments by maintaining diversified funding
sources in various financial institutions. All the institutions
that operate with the Group are well known because of their
experience in the market and high credit quality. The Group places
its cash and cash equivalents, investments, and other financial
instruments with various high credit quality financial
institutions, thus mitigating the amount of credit exposure to any
one institution. The maximum exposure to credit risk is represented
by the carrying amount of cash and cash equivalents and short-term
investments in the Statements of Financial Position.
Trade receivables related to leases
and services provided by the Group represent a diversified tenant
base and account for 89.6%, 94.9% and 95.1% of the Group’s
total trade receivables of the operations center as of June 30,
2017, 2016 and 2015, respectively. The Group has specific policies
to ensure that rental contracts are transacted with counterparties
with appropriate credit quality. The majority of the Group’s
shopping mall, offices and other rental properties’ tenants
are well recognized retailers, diversified companies, professional
organizations, and others. Owing to the long-term nature and
diversity of its tenancy arrangements, the credit risk of this type
of trade receivables is considered to be low. Generally, the Group
has not experienced any significant losses resulting from the
non-performance of any counterpart to the lease contracts and, as a
result, the allowance for doubtful accounts balance is low.
Individual risk limits are set based on internal or external
ratings in accordance with limits set by the Group. If there is no
independent rating, risk control assesses the credit quality of the
customer, taking into account its past experience, financial
position, actual experience and other factors. Based on the
Group’s analysis, the Group determines the size of the
deposit that is required from the tenant at inception. Management
does not expect any material losses from non-performance by these
counterparties. See details on Note 15.
F-48
IRSA Inversiones y Representaciones Sociedad
Anónima
On the other hand, property
receivables related to the sale of trading properties represent
4.4%, 3.7% and 0.1% of the Group’s total trade receivables as
of June 30, 2017, 2016 and 2015, respectively. Payments on these
receivables have generally been received when due. These
receivables are generally secured by mortgages on the properties.
Therefore, the credit risk on outstanding amounts is considered
very low.
(c)
Liquidity
risk management
The Group is exposed to liquidity
risks, including risks associated with refinancing borrowings as
they mature, the risk that borrowing facilities are not available
to meet cash requirements, and the risk that financial assets
cannot readily be converted to cash without loss of value. Failure
to manage liquidity risks could have a material impact on the
Group’s cash flow and Statements of Financial Position.
Prudent liquidity risk management implies maintaining sufficient
cash, the availability of funding through an adequate amount of
committed credit facilities and the ability to close out market
positions. Due to the dynamic nature of the underlying businesses,
the Group aims to maintain flexibility in funding its existing and
prospective debt requirements by maintaining diversified funding
sources.
The Group monitors its current and
projected financial position using several key internally generated
reports: cash flow; debt maturity; and interest rate exposure. The
Group also undertakes sensitivity analysis to assess the impact of
proposed transactions, movements in interest rates and changes in
property values on the key profitability, liquidity and balance
sheet ratios.
The Group’s debt and
derivative positions are continually reviewed to meet current and
expected debt requirements. The Group maintains a balance between
longer-term and shorter-term financings. Short-term financing is
principally raised through bank facilities and overdraft positions.
Medium- to longer-term financing comprises public and private bond
issues, including private placements. Financing risk is spread by
using a variety of types of debt. The maturity profile is managed
in accordance with Group’s needs, by spreading the repayment
dates and extending facilities, as appropriate.
The tables below show financial
liabilities, including Group’s derivative financial
liabilities groupings based on the remaining period at the
Statements of Financial Position to the contractual maturity date.
The amounts disclosed in the tables are the contractual
undiscounted cash flows and as a result, they do not reconcile to
the amounts disclosed on the Statements of Financial Position.
However, undiscounted cash flows in respect of balances due within
12 months generally equal their carrying amounts in the Statements
of Financial Position, as the impact of discounting is not
significant. The tables include both interest and principal
flows.
Where the interest payable is not
fixed, the amount disclosed has been determined by reference to the
existing conditions at the reporting date.
|
As of
June 30, 2017
|
Less
than 1 year
|
Between
1 and 2 years
|
Between
2 and 3 years
|
Between
3 and 4 years
|
Later
than 4 years
|
Total
|
|
Trade and other
payables
|
752
|
8
|
6
|
2
|
5
|
773
|
|
Borrowings (excluding
finance leases)
|
1,656
|
529
|
528
|
525
|
6,749
|
9,987
|
|
Finance leases
|
2
|
1
|
1
|
-
|
-
|
4
|
|
Derivative financial
instruments
|
5
|
-
|
-
|
-
|
-
|
5
|
|
Total
|
2,415
|
538
|
535
|
527
|
6,754
|
10,769
|
|
As of
June 30, 2016(recast)
|
Less
than 1 year
|
Between
1 and 2 years
|
Between
2 and 3 years
|
Between
3 and 4 years
|
Later
than 4 years
|
Total
|
|
Trade and other
payables
|
627
|
204
|
1
|
-
|
-
|
832
|
|
Borrowings (excluding
finance leases)
|
3,518
|
494
|
475
|
491
|
6,760
|
11,738
|
|
Finance leases
|
2
|
1
|
1
|
-
|
-
|
4
|
|
Derivative financial
instruments
|
3
|
-
|
-
|
-
|
-
|
3
|
|
Total
|
4,150
|
699
|
477
|
491
|
6,760
|
12,577
|
F-49
IRSA Inversiones y Representaciones Sociedad
Anónima
|
As of
June 30, 2015(recast)
|
Less
than 1 year
|
Between
1 and 2 years
|
Between
2 and 3 years
|
Between
3 and 4 years
|
Later
than 4 years
|
Total
|
|
Trade and other
payables
|
447
|
11
|
3
|
-
|
-
|
461
|
|
Borrowings (excluding
finance leases)
|
876
|
2,822
|
147
|
143
|
1,553
|
5,541
|
|
Finance leases
|
2
|
1
|
-
|
-
|
-
|
3
|
|
Derivative financial
instruments
|
238
|
265
|
-
|
-
|
-
|
503
|
|
Total
|
1,563
|
3,099
|
150
|
143
|
1,553
|
6,508
|
(d)
Capital
risk management
The capital structure of the Group
consists of shareholders’ equity and net borrowings. The
Group’s equity is analyzed into its various components in the
statements of changes in equity. Capital is managed so as to
promote the long-term success of the business and to maintain
sustainable returns for shareholders. The Group seeks to manage its
capital requirements to maximize value through the mix of debt and
equity funding, while ensuring that Group entities continue to
operate as going concerns, comply with applicable capital
requirements and maintain strong credit ratings.
The Group assesses the adequacy of
its capital requirements, cost of capital and gearing (i.e.,
debt/equity mix) as part of its broader strategic plan. The Group
continuously reviews its capital structure to ensure that (i)
sufficient funds and financing facilities are available to
implement the Group’s property development and business
acquisition strategies, (ii) adequate financing facilities for
unforeseen contingencies are maintained, and (iii) distributions to
shareholders are maintained within the Group’s dividend
distribution policy. The Group also protects its equity in assets
by obtaining appropriate insurance.
The Group’s strategy is to
maintain key financing metrics (net debt to total equity ratio or
gearing and debt ratio) in order to ensure that asset level
performance is translated into enhanced returns for shareholders
whilst maintaining an appropriate risk reward balance to
accommodate changing financial and operating market
cycles.
The following table details the
Group’s key metrics in relation to managing its capital
structure. The ratios are within the ranges previously established
by the Group´s strategy.
|
|
June 30,
2017
|
June 30,
2016
(recast)
|
June 30,
2015
(recast)
|
|
Gearing ratio
(i)
|
31.66
%
|
29.91
%
|
28.30
%
|
|
Debt ratio
(ii)
|
29.13
%
|
25.27
%
|
25.31
%
|
(i)
Calculated as total of borrowings over total
borrowings plus equity attributable equity holders of the parent
company.
(ii)
Calculated as total borrowings over total
properties (including trading properties, property, plant and
equipment, investment properties and rights to receive units under
barter agreements).
(e)
Property
risk
There are several risks affecting
the Group’s property investments. The composition of the
Group’s property portfolio including asset concentration and
lot size may affect liquidity and relative property performance.
The Group has a large multi-asset portfolio and monitors its
concentration and average property plot of land size.
A change in trends and economic
conditions causes shifts in customer demands for properties with
impact on new lettings, renewal of existing leases and reduced
rental growth. In addition, it increases risk of tenant
insolvencies. The Group conducts several actions to mitigate some
of these risks whenever possible. The variety of asset types and
geographical spread as well as a diversified tenant base, with
monitoring of its concentration, helps mitigating these
risks.
The development, administration and
profitability of shopping malls are impacted by various factors
including: the accessibility and the attractiveness of the area
where the shopping mall is located. The intrinsic attractiveness of
it, the flow of people, the level of sales of each shopping mall
rental unit, the increasing competition from internet sales, the
amount of rent collected from each shopping mall rental unit and
the fluctuations in occupancy levels. In the event that
there is an increase in operational
costs, caused by inflation or other factors, it could have a
material adverse effect on the Group if its tenants are unable to
pay their higher rent obligations due to the increase in expenses.
Civil and Commercial Code of the Nation provides that tenants may
rescind commercial lease agreements after the initial six months
upon not less than sixty days written notice, subject to penalties
of only one-and-a-half month rent if the tenant rescinds during the
first year of the lease, and one-month rent if the tenant rescinds
during the second year of the lease. The exercise of such
rescission rights could materially and adversely affect the
Group.
F-50
IRSA Inversiones y Representaciones Sociedad
Anónima
Risks associated with development of
properties include the following: a) the potential abandonment of
development opportunities; b) construction costs exceeding original
budgets, possibly making a project uneconomical; c) occupancy rates
and rents at newly completed projects may be insufficient to make
the project profitable. On the other hand, a) the Group may not be
able to obtain project financing on favorable terms; b)
construction and leasing may not be completed on schedule,
resulting in increased debt service expense and construction costs;
c) the Group may not be able to obtain, or may delay in obtaining,
all necessary zoning, land-use, building, occupancy and other
required governmental permits and authorizations; d)
preconstruction buyers may default on their purchase contracts or
units in new buildings may remain unsold upon completion of
constructions; and e) prices for residential units may be
insufficient to cover development cost. The Group also takes
several actions to monitor these risks and respond appropriately
whenever it is under its control. The Group has in-house property
market research capability and development teams that monitor
development risks closely. The Group generally adopts conservative
assumptions on leasing and other variables and monitors the level
of committed future capital expenditure on development programs
relative to the level of undrawn facilities.
The Group’s hotel properties
face specific risks as well. The success of the Group’s hotel
properties will depend, in large part, upon the Group’s
ability to compete in areas such as access, location, quality of
accommodations, room rate structure and the quality and type of
services offered. The Group’s hotels may face additional
competition if other companies decide to build new hotels or
improve their existing hotels such that they are more attractive to
potential guests. In addition, their profitability depends on (i)
the Group’s ability to form successful relationships with
international operators to run the hotels; (ii) changes in travel
patterns, including seasonal changes; and (iii) taxes and
governmental regulations which influence or determine wages,
prices, interest rates, construction procedures and
costs.
5.2.
Risk management in the
operations center in Israel:
Given the diversity of the
activities conducted by IDBD and its subsidiaries, and the
resulting risks, IDBD manages the exposure to its own key financial
risks and those of its wholly-owned subsidiaries (except for IDB
Tourism) in conformity with a centralized risk management policy,
with the non-wholly owned IDBD subsidiaries being responsible for
establishing the risk policy, taking action to cover market risks
and managing their activities in a decentralized way. Both IDBD as
holding and each subsidiary are responsible for managing their own
financial risks in accordance with agreed global guidelines. The
Chief Financial Officers of each entity are responsible for
managing the risk management policies and systems, the definition
of hedging strategies, insofar as applicable and based on any
restriction that may be apply as a result of financial debt, the
supervision of its implementation and the answer to such
restrictions. The management framework includes policies,
procedures, limits and allowed types of derivative financial
instruments.
This section provides a description
of the principal risks related to the operations center in Israel
that could have a material adverse effect on the IDBD’s
strategy, performance, results of operations and financial
condition. The risks facing the businesses, set out below, do not
appear in any particular order of potential materiality or
probability of occurrence.
F-51
IRSA Inversiones
y Representaciones Sociedad Anónima
(a)
Market
risk management
Foreign
currency risk
Real estate, business and/or
financial activities of IDBD subsidiaries in the operations center
in Israel are developed mainly in Israeli currency, although some
operations, mostly borrowing, are expressed in US Dollars, thereby
exposing IDBD to a foreign currency risk.
Net financial position exposure to
the functional currencies is managed in a decentralized way on a
case-by-case basis, by entering into foreign currency derivative
instruments and/or by borrowings in foreign currencies, as the case
may be, or by other methods, considered adequate by the Management,
according to circumstances.
As of June 30, 2017 and 2016, the
net position of financial instruments in US Dollars, which exposes
the Group to the foreign currency risk amounts to Ps. (4,376) and
Ps. (12,415), respectively. The Group estimates that, other factors
being constant, a 5% appreciation of the US Dollar against the
Israeli currency would increase gain before income tax for the year
ended June 30, 2017 for an amount of Ps. 231 (Ps. 498 loss in
2016). An equivalent depreciation would generate an additional net
loss before income tax for the fiscal year ended June 30, 2017 of
Ps. 236 (a profit of Ps. 489 in 2016).
Risk of
fluctuations of the Consumer Price Index ("CPI") of
Israel
IDBD has financial liabilities
indexed by the Israeli CPI. As of the date of this Consolidated
Financial Statements, more than half of financial liabilities
arising from the center of operations in Israel were adjusted by
the Israeli CPI.
Net financial position exposure to
the Israeli CPI fluctuations is managed in a decentralized way on a
case-by-case basis, by entering into different derivative financial
instruments, as the case may be, or by other methods, considered
adequate by the Management, based on the
circumstances.
The Group estimates that, other
factors being constant, a 1% appreciation of the CPI would increase
loss before income tax for the year ended June 30, 2017 and 2016
for an amount of Ps. 427 and Ps. 415 respectively. An equivalent
depreciation of the CPI would have an equal and opposite effect on
the Statement of Income.
Interest
rate risk
The IDBD’s interest rate risk
principally arises from long-term borrowings. Borrowings issued at
floating rate expose IDBD to cash flow interest rate risk,
partially offset by financial assets at floating interest rate.
Borrowings issued at fixed rates expose IDBD to fair value interest
rate risk.
IDBD manages the exposure to the
interest rate risk on a dynamic basis. Various scenarios are
simulated by IDBD, taking into consideration refinancing, renewal
of existing positions, alternative financing sources or hedging
instruments, maintaining an appropriate mix between fixed and
floating rate interest bearing liabilities. The exposure to the
interest rate risk is managed in a decentralized way and is
monitored regularly by different management offices with a view to
confirming that there are no adverse effects over its ability to
meet its financial obligations and to comply with its borrowings
covenants.
As of June 30, 2017 and 2016, the
96.6% and 95.7%, respectively, of the Group’s long-term
financial borrowings in this operations center are at fixed
interest rate, therefore, IDBD is not significantly exposed to the
interest rate fluctuation risk.
IDBD estimates that, other factors
being constant, a 1% increase in floating rates at year-end would
increase net loss before income tax for the year ended June 30,
2017, in Ps. 21, approximately (Ps. 27, approximately in 2016). A
1% decrease in floating rates would have an equal and opposite
effect on the Statement of Income.
F-52
IRSA Inversiones y Representaciones Sociedad
Anónima
Other
price risk
IDBD is exposed to equity securities
price risk or derivative financial instruments price risk because
of investments held in entities that are publicly traded. As
indicated in Note 14, investment in Clal is classified on the
Statements of Financial Position at “fair value through
profit or loss” and represents the most significant
IDBD’s exposure to price risk. IDBD has not used hedging
against these risks.
IDBD estimates that, other factors
being constant, a 10% decrease in quoted prices of equity
securities and in derivative financial instruments portfolio at
year-end would generate a loss before income tax for the year ended
June 30, 2017 of Ps. 856. An increase of 10% on these prices would
have an equal and opposite effect in the Statement of
Income.
IDBD regularly reviews the prices
evolution of these equity securities in order to identify
significant movements.
(b)
Credit
risk management
The credit risk arises from the
potential non-performance of contractual obligations by the
parties, with a resulting financial loss for IDBD. IDBD’s
credit risk, as well as that of its wholly-owned subsidiaries
(except for IDB Tourism), is managed in a centralized manner by
IDBD. In contrast, the credit risk of the other subsidiaries is
managed in a decentralized fashion by each subsidiary. Each entity
is responsible for managing and analyzing the credit risk and
limits have been established to ensure that IDBD deals only with
approved counterparties and that counterparty concentration risk is
addressed and the risk of loss is mitigated. Counterparty exposure
is measured as the aggregate of all obligations of any single legal
entity or economic entity to IDBD.
IDBD is subject to credit risk
arising from deposits with banks and financial institutions,
investments of surplus cash balances, the use of derivative
financial instruments and from outstanding
receivables.
Under the policy established by
IDBD’s board of directors, the management deposits excess
cash in local banks which are not company creditors, in order to
keep minimum risk values in cash balances.
The IDBD’s policy is to manage
credit exposure to deposits, short-term investments and other
financial instruments by maintaining diversified funding sources in
various financial institutions. All the institutions that operate
with IDBD are well known because of their experience in the market
and high credit quality. IDBD places its cash and cash equivalents,
investments, and other financial instruments with various high
credit quality financial institutions, thus mitigating the amount
of credit exposure to any one institution. The maximum exposure to
credit risk is represented by the carrying amount of cash and cash
equivalents and short-term investments in the Statements of
Financial Position.
IDBD’s primary objective for
holding derivative financial instruments is to manage currency
exchange rate risk and interest rate risk. IDBD generally enters
into derivative transactions with high-credit-quality
counterparties and, by policy, limits the amount of credit exposure
to each counterparty. The amounts subject to credit risk related to
derivative instruments are generally limited to the amounts, if
any, by which counterparty’s obligations exceed the
obligations that IDBD has with that counterparty. The credit risk
associated with derivative financial instruments is representing by
the carrying value of the assets positions of these
instruments.
The IDBD’s policy is to manage
credit exposure to trade and other receivables within defined
trading limits. All IDBD’s significant counterparties have
internal trading limits.
Trade receivables from investment
and development property activities are primarily derived from
leases and services from shopping malls, offices and other rental
properties; receivables from the sale of trading properties and
investment properties (primarily undeveloped land and non-retail
rental properties). IDBD has a large customer base and is not
dependent on any single customer. (See Note 15 for
details).
F-53
IRSA Inversiones y Representaciones Sociedad
Anónima
There is not a high credit risk
concentration in trade receivables from telecommunications and
supermarket activity, as the business does not rely on few
customers and most of the transactions are paid in cash or by
credit card. (See Note 15 for details).
(c)
Liquidity
risk management
The most important risk in the
operations center in Israel is liquidity risk, including risks
associated with refinancing borrowings as they mature, the risk
that borrowing facilities are not available to meet cash
requirements, and the risk that financial assets cannot readily be
converted to cash without loss of value. Failure to manage
liquidity risks could have a material impact on the IDBD’s
cash flow and Statements of Financial Position. Prudent liquidity
risk management implies maintaining sufficient cash, the
availability of funding through an adequate amount of committed
credit facilities and the ability to close out market positions.
Due to the dynamic nature of the underlying businesses, IDBD aims
to maintain flexibility in funding its existing and prospective
debt requirements by maintaining diversified funding
sources.
IDBD monitors its current and
projected financial position using several key internally generated
reports: cash flow forecasts; debt maturity; and interest rate
exposure. IDBD also undertakes sensitivity analysis to assess the
impact of proposed transactions, movements in interest rates and
changes in property values on the key profitability, liquidity and
balance sheet ratios.
IDBD’s debt and derivative
positions are continually reviewed to meet current and expected
debt requirements. IDBD maintains a balance between longer-term and
shorter-term financings. Short-term financing is principally raised
through bank facilities and overdraft positions. Medium- to
longer-term financing comprises public and private bond issues,
including private placements. Financing risk is spread by using a
variety of types of debt. The maturity profile is managed in
accordance with IDBD’s needs, by spreading the repayment
dates and extending facilities, as appropriate.
The table below shows financial
liabilities, including Group’s derivative financial
liabilities groupings based on the remaining period at the
Statements of Financial Position to the contractual maturity date.
The amounts disclosed in the table are the contractual undiscounted
cash flows and as a result, they do not reconcile to the amounts
disclosed on the Statements of Financial Position.
However, undiscounted cash flows in
respect of balances due within 12 months generally equal their
carrying amounts in the Statements of Financial Position, as the
impact of discounting is not significant. The tables include both
interest and principal flows. When the interest payable is not
fixed, the amount disclosed has been determined by reference to the
existing conditions at the reporting date.
|
As of
June 30, 2017
|
Less
than 1 year
|
Between
1 and 2 years
|
Between
2 and 3 years
|
Between
3 and 4 years
|
Later
than 4 years
|
Total
|
|
Trade and other
payables
|
16,850
|
1,584
|
692
|
-
|
-
|
19,126
|
|
Borrowings
|
23,733
|
18,084
|
20,837
|
13,353
|
67,537
|
143,544
|
|
Leases
|
10
|
5
|
5
|
5
|
-
|
25
|
|
Purchase
obligations
|
1,135
|
1,140
|
873
|
5
|
-
|
3,153
|
|
Derivative financial
instruments
|
62
|
76
|
-
|
-
|
-
|
138
|
|
Total
|
41,790
|
20,889
|
22,407
|
13,363
|
67,537
|
165,986
|
|
As of
June 30, 2016 (recast)
|
Less
than 1 year
|
Between
1 and 2 years
|
Between
2 and 3 years
|
Between
3 and 4 years
|
Later
than 4 years
|
Total
|
|
Trade and other
payables
|
13,046
|
234
|
561
|
54
|
4
|
13,899
|
|
Borrowings
|
20,714
|
19,328
|
29,522
|
9,435
|
52,232
|
131,231
|
|
Leases
|
2,254
|
2,086
|
1,802
|
1,487
|
3,398
|
11,027
|
|
Purchase
obligations
|
1,089
|
162
|
15
|
-
|
-
|
1,266
|
|
Derivative financial
instruments
|
105
|
47
|
58
|
-
|
-
|
210
|
|
Total
|
37,208
|
21,857
|
31,958
|
10,976
|
55,634
|
157,633
|
See Note 20 that includes a
description of commitments and restrictions related to loans and
renegotiation processes under way.
F-54
IRSA Inversiones y Representaciones Sociedad
Anónima
6.
Segment information
IFRS 8 requires an entity to report
financial and descriptive information about its reportable
segments, which are operating segments or aggregations of operating
segments that meet specified criteria. Operating segments are
components of an entity about which separate financial information
is available that is evaluated regularly by the CODM. According to
IFRS 8, the CODM represents a function whereby strategic decisions
are made and resources are assigned. The CODM function is carried
out by the President of the Group, Mr. Eduardo S. Elsztain. In
addition, and due to the acquisition of IDBD, two responsibility
levels have been established for resource allocation and assessment
of results of the two operations centers, through executive
committees in Argentina and Israel.
Segment information is reported from
two perspectives: geographic presence and products and services.
From the geographic point of view, the Group has established two
Operations Centers to manage its global interests: Argentina and
Israel. Within each operations center, the Group considers
separately the various activities being developed, which represent
reporting operating segments given the nature of its products,
services, operations and risks. Management believes the operating
segment clustering in each operations center reflects similar
economic characteristics in each region, as well as similar
products and services offered, types of clients and regulatory
environments.
Below is the segment information
prepared as follows:
●
Operations
center in Argentina:
Within this operations center, the
Group operates in the following segments:
o
The
“Shopping Malls”
segment
includes the assets and operating results of the activity of
shopping malls portfolio principally comprised of lease and service
revenues related to rental of commercial space and other spaces in
the shopping malls of the Group.
o
The
“Offices and others”
segment
includes the assets and operating results from lease revenues of
offices and other rental space and other service revenues related
to the office activities.
o
The
“Sales
and Developments”
segment includes the assets and
operating results of the sales of undeveloped parcels of land
and/or trading properties, as the results related with its
development and maintenance. Also included in this segment are the
results of the sale of real property intended for rent, sales of
hotels and other properties included in the international
segment.
o
The
"Hotels"
segment includes the operating
results of hotels mainly comprised of room, catering and restaurant
revenues.
o
The
“International”
segment
includes assets and operating profit or loss from business related
to associates Condor and Lipstick. Through these associates, the
Group derives revenue from hotels and an office building in USA,
respectively. Until September 30, 2014, this segment included
revenues from a subsidiary that owned the building located at 183
Madison Ave. in New York, USA, which was sold on that date.
Additionally, until October 11, 2015, this international segment
included results from the investment in IDBD carried at fair
value.
o
The
“Financial operations, Corporate and
others”
segment primarily includes the financial
activities carried out by BHSA and Tarshop and other residual
financial operations and corporate expenses related to the
Operations Center in Argentina.
The CODM periodically reviews the
results and certain asset categories and assesses performance of
operating segments of this operations center based on a measure of
profit or loss of the segment composed by the operating income plus
the equity in earnings of joint ventures and associates. The
valuation criteria used in preparing this information are
consistent with IFRS standards used for the preparation of the
Consolidated Financial Statements, except for the
following:
●
Operating results from joint ventures: Cyrsa
S.A., NPSF, Puerto Retiro, Baicom Networks S.A. and Quality are
evaluated by the CODM applying proportional consolidation method.
Under this method the income/loss generated and assets are reported
in the Statement of Income line-by-line based on the percentage
held in
joint ventures rather
than in a single item as required by IFRS. Management believes that
the proportional consolidation method provides more useful
information to understand the business return. On the other hand,
the investment in the joint venture La Rural S.A. is accounted for
under the equity method since this method is considered to provide
more accurate information in this case.
F-55
IRSA Inversiones y Representaciones Sociedad
Anónima
●
Operating results from Shopping Malls and
Offices segments do not include the amounts pertaining to building
administration expenses and collective promotion funds
(“FPC”, as per its Spanish acronym) as well as total
recovered costs, whether by way of expenses or other concepts
included under financial results (for example default interest and
other concepts). The CODM examines the net amount from these items
(total surplus or deficit between building administration expenses
and FPC and recoverable expenses).
Starting in fiscal year 2017, the
CODM reviews certain corporate expenses associated to all segments
of the operations center in Argentina on an aggregate and separate
basis, and such expenses have been accounted for under Other
Segments and Corporate. As of June 2016 and 2015, the segment
information has been retrospectively recast for comparability
purposes.
The assets’ categories
examined by the CODM are: investment properties, property, plant
and equipment, trading properties, inventories, right to receive
future units under barter agreements, investment in associates and
goodwill. The sum of these assets, classified by business segment,
is reported under “assets by segment”. Assets are
allocated to each segment based on the operations and/or their
physical location.
Within the operations center in
Argentina, most revenue from its operating segments is derived
from, and their assets are located in, Argentina, except for
earnings of associates included in the “International”
segment located in USA.
Revenues for each reporting segments
derive from a large and diverse client base and, therefore, there
is no revenue concentration in any particular segment.
●
Operations
center in Israel:
Within this operations center, the
Group operates in the following segments:
o
The
“Real
Estate”
segment includes mainly assets and operating
income derived from business related to the subsidiary PBC. Through
PBC, the Group operates rental properties and residential
properties in Israel, USA and other parts of the world and carries
out commercial projects in Las Vegas, USA.
o
The
“Supermarkets”
segment
includes assets and operating income derived from the business
related to the subsidiary Shufersal. Through Shufersal, the Group
mainly operates a supermarket chain in Israel.
o
The
“Telecommunications”
segment
includes assets and operating income derived from the business
related to the subsidiary Cellcom. Cellcom is a provider of
telecommunication services and its main activities include the
provision of mobile phone services, fixed line phone services, data
and Internet, among others.
o
The
"Insurance"
segment includes the
investment in Clal. This company is one of the most important
insurance groups in Israel, and is mainly engaged in pension and
social security insurance, among others. As stated in Note 14, the
Group does not have control over Clal; therefore, the business is
not consolidated on a line-by-line basis but rather reported in a
single line as a financial asset held for sale and valued at fair
value, as required by the IFRS.
o
The
"Others"
segment includes the assets and
income derived from other diverse business activities, such as
technological developments, tourism, oil and gas assets,
electronics, and others.
As stated in Notes 31 and 32 to
these Financial Statements, Adama, Israir and Open Sky are
presented within discontinued operations, therefore the Group has
ceased to present the following segments: (i) Agrochemicals (Adama)
and (ii) Tourism (previously included within “Others”
segments).
F-56
IRSA Inversiones y Representaciones Sociedad
Anónima
The CODM periodically reviews the
results and certain asset categories and assesses performance of
operating segments of this operations center based on a measure of
profit or loss of the segment composed by the operating income plus
the equity in earnings of joint ventures and associates. The
valuation criteria used in preparing this information are
consistent with IFRS standards used for the preparation of the
Consolidated Financial Statements.
As stated under Note 2, the Group
consolidates results derived from its operations center in Israel
with a three month lag, adjusted for the effects of significant
transactions Hence, IDBD’s results for the period extending
from October 11, 2015 (acquisition date) through March 31, 2016 are
included under comprehensive income of the Group for the fiscal
year ended June 30, 2016. For the fiscal year ended June 30, 2017,
a full twelve-month period is consolidated, also with a three-month
lag and adjusted for the effects of significant
transactions.
Goods and services exchanged between
segments are calculated on the basis of market prices. Intercompany
transactions between segments, if any, are eliminated.
As to those business segments
involving the operations center in Argentina where assets are
reported under the proportional consolidation method, each reported
asset includes the proportional share of the Group in the same
class of assets of the associates and/or joint ventures. Only as an
example, the amount of investment properties reported includes (i)
the balance of investment properties as stated in the Statement of
Financial Position, plus (ii) the Group’s share in the
balances of investment properties of joint ventures.
Within the operations center in
Israel, most revenue from its operating segments are derived from,
and their assets are located in, Israel, except for part of
earnings from the Real Estate segment, which are generated from
activities outside Israel, mainly in USA.
Below is a summary of the
Group´s lines of business for the years ended June 30, 2017,
2016 and 2015:
|
|
June 30,
2017
|
||
|
|
Operations
Center in Argentina
|
Operations
Center in Israel
|
Total
|
|
Revenues
|
4,311
|
68,422
|
72,733
|
|
Costs
|
(912
)
|
(49,110
)
|
(50,022
)
|
|
Gross
profit
|
3,399
|
19,312
|
22,711
|
|
Net gain from fair value
adjustments of investment properties
|
4,271
|
374
|
4,645
|
|
General and administrative
expenses
|
(721
)
|
(3,135
)
|
(3,856
)
|
|
Selling
expenses
|
(355
)
|
(13,093
)
|
(13,448
)
|
|
Other operating results,
net
|
(68
)
|
(196
)
|
(264
)
|
|
Profit
from operations
|
6,526
|
3,262
|
9,788
|
|
Share of (loss) / profit of
associates and joint ventures
|
(94
)
|
105
|
11
|
|
Segment
profit
|
6,432
|
3,367
|
9,799
|
|
Reportable
assets
|
44,885
|
178,964
|
223,849
|
|
Reportable
liabilities
|
-
|
(155,235
)
|
(155,235
)
|
|
Net
reportable assets
|
44,885
|
23,729
|
68,614
|
|
|
June 30,
2016 (recast)
|
||
|
|
Operations
Center in Argentina
|
Operations
Center in Israel
|
Total
|
|
Revenues
|
3,289
|
27,077
|
30,366
|
|
Costs
|
(658
)
|
(19,252
)
|
(19,910
)
|
|
Gross
Profit
|
2,631
|
7,825
|
10,456
|
|
Net gain / (loss) from fair
value adjustments of investment properties
|
18,209
|
(271
)
|
17,938
|
|
General and administrative
expenses
|
(554
)
|
(1,293
)
|
(1,847
)
|
|
Selling
expenses
|
(264
)
|
(5,442
)
|
(5,706
)
|
|
Other operating results,
net
|
(12
)
|
(32
)
|
(44
)
|
|
Profit
from operations
|
20,010
|
787
|
20,797
|
|
Share of (loss) / profit of
associates and joint ventures
|
127
|
123
|
250
|
|
Segment
profit
|
20,137
|
910
|
21,047
|
|
Reportable
assets
|
39,294
|
147,470
|
186,764
|
|
Reportable
liabilities
|
-
|
(132,989
)
|
(132,989
)
|
|
Net
reportable assets
|
39,294
|
14,481
|
53,775
|
F-57
IRSA Inversiones y Representaciones Sociedad
Anónima
|
|
June 30,
2015 (recast)
|
||
|
|
Operations
Center in Argentina
|
Operations
Center in Israel
|
Total
|
|
Revenues
|
2,548
|
-
|
2,548
|
|
Costs
|
(481
)
|
-
|
(481
)
|
|
Gross
Profit
|
2,067
|
-
|
2,067
|
|
Net gain from fair value
adjustments of investment properties
|
4,007
|
-
|
4,007
|
|
General and administrative
expenses
|
(378
)
|
-
|
(378
)
|
|
Selling
expenses
|
(196
)
|
-
|
(196
)
|
|
Other operating results,
net
|
33
|
-
|
33
|
|
Profit
from operations
|
5,533
|
-
|
5,533
|
|
Share of loss of associates
and joint ventures
|
(858
)
|
-
|
(858
)
|
|
Segment
profit
|
4,675
|
-
|
4,675
|
|
Reportable
assets
|
23,052
|
-
|
23,052
|
|
Reportable
liabilities
|
-
|
-
|
-
|
|
Net
reportable assets
|
23,052
|
-
|
23,052
|
F-58
IRSA Inversiones
y Representaciones Sociedad Anónima
Below is a summarized analysis of
the lines of business of Group’s operations center in
Argentina for the fiscal year ended June 30, 2017:
|
|
June 30,
2017
|
||||||
|
|
Operations
Center in Argentina
|
||||||
|
|
Shopping
Malls
|
Offices
and others
|
Sales
and developments
|
Hotels
|
International
|
Financial
operations, Corporate and others
|
Total
|
|
Revenues
|
3,043
|
443
|
99
|
725
|
-
|
1
|
4,311
|
|
Costs
|
(350
)
|
(33
)
|
(43
)
|
(486
)
|
-
|
-
|
(912
)
|
|
Gross
profit
|
2,693
|
410
|
56
|
239
|
-
|
1
|
3,399
|
|
Net gain from fair value
adjustments of investment properties
|
2,068
|
1,354
|
849
|
-
|
-
|
-
|
4,271
|
|
General and administrative
expenses
|
(261
)
|
(33
)
|
(32
)
|
(135
)
|
(78
)
|
(182
)
|
(721
)
|
|
Selling
expenses
|
(188
)
|
(34
)
|
(16
)
|
(94
)
|
-
|
(23
)
|
(355
)
|
|
Other operating results,
net
|
(59
)
|
4
|
(36
)
|
(1
)
|
27
|
(3
)
|
(68
)
|
|
Profit /
(loss) from operations
|
4,253
|
1,701
|
821
|
9
|
(51
)
|
(207
)
|
6,526
|
|
Share of profit / (loss) of
joint ventures and associates
|
-
|
-
|
14
|
-
|
(196
)
|
88
|
(94
)
|
|
Segment
profit / (loss)
|
4,253
|
1,701
|
835
|
9
|
(247
)
|
(119
)
|
6,432
|
|
|
|
|
|
|
|
|
|
|
Investment
properties
|
28,799
|
7,669
|
4,739
|
-
|
-
|
-
|
41,207
|
|
Property, plant and
equipment
|
55
|
40
|
-
|
157
|
2
|
-
|
254
|
|
Trading
properties
|
-
|
-
|
587
|
-
|
-
|
-
|
587
|
|
Goodwill
|
1
|
36
|
-
|
-
|
-
|
-
|
37
|
|
Right to receive future
units under barter agreements
|
-
|
-
|
47
|
-
|
-
|
-
|
47
|
|
Inventories
|
23
|
1
|
-
|
10
|
-
|
-
|
34
|
|
Investments in joint
ventures and associates
|
-
|
113
|
95
|
-
|
570
|
1,941
|
2,719
|
|
Operating
assets
|
28,878
|
7,859
|
5,468
|
167
|
572
|
1,941
|
44,885
|
From all the revenues corresponding
to the operations Center in Argentina, the 100% are originated in
Argentina. No external client represents 10% or more of revenue of
any of the reportable segments.
From all of the assets corresponding
to the operations Center in Argentina segments, Ps. 44,123 are
located in Argentina and Ps. 762 in other countries, principally in
USA for Ps. 570 and Uruguay for Ps. 192.
F-59
IRSA Inversiones
y Representaciones Sociedad Anónima
Below is a summarized analysis of
the lines of business of Group’s operations center in
Argentina for the fiscal year ended June 30, 2016:
|
|
June 30,
2016 (recast)
|
||||||
|
|
Operations
Center in Argentina
|
||||||
|
|
Shopping
Malls
|
Offices
and others
|
Sales
and developments
|
Hotels
|
International
|
Financial
operations, Corporate and others
|
Total
|
|
Revenues
|
2,406
|
340
|
8
|
534
|
-
|
1
|
3,289
|
|
Costs
|
(256
)
|
(21
)
|
(20
)
|
(361
)
|
-
|
-
|
(658
)
|
|
Gross
profit / (loss)
|
2,150
|
319
|
(12
)
|
173
|
-
|
1
|
2,631
|
|
Net gain from fair value
adjustments of investment properties
|
16,132
|
1,304
|
773
|
-
|
-
|
-
|
18,209
|
|
General and administrative
expenses
|
(179
)
|
(24
)
|
(23
)
|
(103
)
|
(91
)
|
(134
)
|
(554
)
|
|
Selling
expenses
|
(145
)
|
(8
)
|
(23
)
|
(69
)
|
-
|
(19
)
|
(264
)
|
|
Other operating results,
net
|
(63
)
|
(6
)
|
(34
)
|
(2
)
|
92
|
1
|
(12
)
|
|
Profit /
(loss) from operations
|
17,895
|
1,585
|
681
|
(1
)
|
1
|
(151
)
|
20,010
|
|
Share of profit / (loss) of
joint ventures and associates
|
-
|
20
|
5
|
-
|
(129
)
|
231
|
127
|
|
Segment
profit / (loss)
|
17,895
|
1,605
|
686
|
(1
)
|
(128
)
|
80
|
20,137
|
|
|
|
|
|
|
|
|
|
|
Investment
properties
|
26,613
|
5,786
|
3,975
|
-
|
-
|
-
|
36,374
|
|
Property, plant and
equipment
|
49
|
17
|
2
|
156
|
2
|
-
|
226
|
|
Trading
properties
|
-
|
-
|
598
|
-
|
-
|
-
|
598
|
|
Goodwill
|
7
|
4
|
-
|
-
|
-
|
-
|
11
|
|
Right to receive future
units under barter agreements
|
-
|
-
|
90
|
-
|
-
|
-
|
90
|
|
Inventories
|
19
|
-
|
1
|
8
|
-
|
-
|
28
|
|
Investments in joint
ventures and associates
|
-
|
59
|
62
|
-
|
143
|
1,703
|
1,967
|
|
Operating
assets
|
26,688
|
5,866
|
4,728
|
164
|
145
|
1,703
|
39,294
|
From all the revenues corresponding
to the operations Center in Argentina, the 100% are originated in
Argentina. No external client represents 10% or more of revenue of
any of the reportable segments.
From all of the assets corresponding
to the operations Center in Argentina segments, Ps. 38,991 are
located in Argentina and Ps. 303 in other countries, principally in
USA for Ps. 145 and Uruguay for Ps. 158.
F-60
IRSA Inversiones
y Representaciones Sociedad Anónima
Below is a summarized analysis of
the lines of business of Group’s operations center in
Argentina for the fiscal year ended June 30, 2015:
|
|
June 30,
2015 (recast)
|
||||||
|
|
Operations
Center in Argentina
|
||||||
|
|
Shopping
Malls
|
Offices
and others
|
Sales
and developments
|
Hotels
|
International
|
Financial
operations, Corporate and others
|
Total
|
|
Revenues
|
1,778
|
333
|
15
|
396
|
26
|
-
|
2,548
|
|
Costs
|
(164
)
|
(13
)
|
(19
)
|
(278
)
|
(7
)
|
-
|
(481
)
|
|
Gross
profit / (loss)
|
1,614
|
320
|
(4
)
|
118
|
19
|
-
|
2,067
|
|
Net gain from fair value
adjustments of investment properties
|
729
|
1,871
|
1,407
|
-
|
-
|
-
|
4,007
|
|
General and administrative
expenses
|
(136
)
|
(3
)
|
(3
)
|
(78
)
|
(56
)
|
(102
)
|
(378
)
|
|
Selling
expenses
|
(113
)
|
(13
)
|
(2
)
|
(52
)
|
-
|
(16
)
|
(196
)
|
|
Other operating results,
net
|
(49
)
|
(117
)
|
(13
)
|
-
|
214
|
(2
)
|
33
|
|
Profit /
(loss) from operations
|
2,045
|
2,058
|
1,385
|
(12
)
|
177
|
(120
)
|
5,533
|
|
Share of profit / (loss) of
joint ventures and associates
|
-
|
5
|
1
|
1
|
(1,020
)
|
155
|
(858
)
|
|
Segment
profit / (loss)
|
2,045
|
2,063
|
1,386
|
(11
)
|
(843
)
|
35
|
4,675
|
|
|
|
|
|
|
|
|
|
|
Investment
properties
|
10,415
|
5,460
|
3,694
|
-
|
-
|
-
|
19,569
|
|
Property, plant and
equipment
|
48
|
23
|
1
|
165
|
1
|
-
|
238
|
|
Trading
properties
|
-
|
-
|
149
|
-
|
-
|
-
|
149
|
|
Goodwill
|
7
|
4
|
-
|
-
|
-
|
-
|
11
|
|
Right to receive future
units under barter agreements
|
-
|
-
|
90
|
-
|
-
|
-
|
90
|
|
Inventories
|
16
|
-
|
-
|
7
|
-
|
-
|
23
|
|
Investments in joint
ventures and associates
|
-
|
43
|
47
|
-
|
1,478
|
1,404
|
2,972
|
|
Operating
assets
|
10,486
|
5,530
|
3,981
|
172
|
1,479
|
1,404
|
23,052
|
From all revenues corresponding to
the operations Center in Argentina Ps. 2,522 are generated in
Argentina and Ps. 26 in USA. No external client represents 10% or
more of revenue of any of the reportable segments.
From all of the assets corresponding
to the operations Center in Argentina segments, Ps. 21,467 are
located in Argentina and Ps. 1,585 in other countries, principally
in USA for Ps. 1,479 and Uruguay for Ps. 106.
F-61
IRSA Inversiones
y Representaciones Sociedad Anónima
Below is a summarized analysis of
the lines of business of Group’s operations center in Israel
for the year ended June 30, 2017:
|
|
Real
Estate
|
Supermarkets
|
Telecommunications
|
Insurance
|
Others
|
Total
|
|
Revenues
|
4,918
|
47,277
|
15,964
|
-
|
263
|
68,422
|
|
Costs
|
(2,333
)
|
(35,432
)
|
(11,183
)
|
-
|
(162
)
|
(49,110
)
|
|
Gross
Profit
|
2,585
|
11,845
|
4,781
|
-
|
101
|
19,312
|
|
Net gain from fair value
adjustments of investment properties
|
374
|
-
|
-
|
-
|
-
|
374
|
|
General and administrative
expenses
|
(290
)
|
(627
)
|
(1,592
)
|
-
|
(626
)
|
(3,135
)
|
|
Selling
expenses
|
(91
)
|
(9,517
)
|
(3,406
)
|
-
|
(79
)
|
(13,093
)
|
|
Other operating results,
net
|
46
|
(52
)
|
(36
)
|
-
|
(154
)
|
(196
)
|
|
Profit /
(loss) from operations
|
2,624
|
1,649
|
(253
)
|
-
|
(758
)
|
3,262
|
|
Share of profit / (loss) of
joint ventures and associates
|
46
|
75
|
-
|
-
|
(16
)
|
105
|
|
Segment
profit / (loss)
|
2,670
|
1,724
|
(253
)
|
-
|
(774
)
|
3,367
|
|
|
|
|
|
|
|
|
|
Operating
assets
|
79,427
|
38,521
|
31,648
|
8,562
|
20,806
|
178,964
|
|
Operating
liabilities
|
(64,100
)
|
(29,239
)
|
(25,032
)
|
-
|
(36,864
)
|
(155,235
)
|
|
Operating
assets (liabilities), net
|
15,327
|
9,282
|
6,616
|
8,562
|
(16,058
)
|
23,729
|
From all revenues corresponding to
the Operations Center in Israel, Ps. 1,102 are originated in USA
and Ps. 67,320 in Israel. No external client represents 10% or more
of the revenue of any of the reportable segments. From all assets
corresponding to the Operations Center in Israel segments, Ps.
20,176 are located in USA, Ps. 3,678 in India and the remaining are
located in Israel.
Below is a summarized analysis of
the lines of business of Group’s operations center in Israel
for the year ended June 30, 2016 (recast):
|
|
Real
Estate
|
Supermarkets
|
Telecommunications
|
Insurance
|
Others
|
Total
|
|
Revenues
|
1,538
|
18,610
|
6,655
|
-
|
274
|
27,077
|
|
Costs
|
(467
)
|
(14,076
)
|
(4,525
)
|
-
|
(184
)
|
(19,252
)
|
|
Gross
Profit
|
1,071
|
4,534
|
2,130
|
-
|
90
|
7,825
|
|
Net loss from fair value
adjustments of investment properties
|
(271
)
|
-
|
-
|
-
|
-
|
(271
)
|
|
General and administrative
expenses
|
(100
)
|
(203
)
|
(708
)
|
-
|
(282
)
|
(1,293
)
|
|
Selling
expenses
|
(29
)
|
(3,907
)
|
(1,493
)
|
-
|
(13
)
|
(5,442
)
|
|
Other operating results,
net
|
(19
)
|
(13
)
|
-
|
-
|
-
|
(32
)
|
|
Profit /
(loss) from operations
|
652
|
411
|
(71
)
|
-
|
(205
)
|
787
|
|
Share of profit / (loss) of
associates and joint ventures
|
226
|
-
|
-
|
-
|
(103
)
|
123
|
|
Segment
profit / (loss)
|
878
|
411
|
(71
)
|
-
|
(308
)
|
910
|
|
|
|
|
|
|
|
|
|
Operating
assets
|
60,678
|
29,440
|
27,345
|
4,602
|
25,405
|
147,470
|
|
Operating
liabilities
|
(49,576
)
|
(23,614
)
|
(21,657
)
|
-
|
(38,142
)
|
(132,989
)
|
|
Operating
assets (liabilities), net
|
11,102
|
5,826
|
5,688
|
4,602
|
(12,737
)
|
14,481
|
From all revenues corresponding to
the Operations Center in Israel, Ps. 512 are originated in USA and
Ps. 26,565 in Israel. No external client represents 10% or more of
the revenue of any of the reportable segments. From all assets
corresponding to the Operations Center in Israel segments,
Ps.14,070 are located in USA, Ps. 786 in India and the remaining
are located in Israel.
F-62
IRSA Inversiones
y Representaciones Sociedad Anónima
The following tables present a
reconciliation between the results from operations as per segment
information and the results from operations as per the Statements
of Income. The adjustments are related to the presentation of the
results of joint ventures from the Operations Center in Argentina
accounted for under the equity method under IFRS and the
non-elimination of the inter-segment transactions.
|
|
June 30,
2017
|
||||
|
|
Total as
per segment information
|
Adjustment
for share of profit / (loss) of joint ventures
|
Expenses
and collective promotion funds
|
Adjustment
to income for elimination of inter segment
transactions
|
Total as
per Statement of Income
|
|
Revenues
|
72,733
|
(41
)
|
1,490
|
(10
)
|
74,172
|
|
Costs
|
(50,022
)
|
18
|
(1,517
)
|
-
|
(51,521
)
|
|
Gross
profit
|
22,711
|
(23
)
|
(27
)
|
(10
)
|
22,651
|
|
Net gain from fair value
adjustments of investment properties
|
4,645
|
(192
)
|
-
|
-
|
4,453
|
|
General and administrative
expenses
|
(3,856
)
|
5
|
-
|
8
|
(3,843
)
|
|
Selling
expenses
|
(13,448
)
|
5
|
-
|
2
|
(13,441
)
|
|
Other operating results,
net
|
(264
)
|
(6
)
|
-
|
-
|
(270
)
|
|
Profit
from operations
|
9,788
|
(211
)
|
(27
)
|
-
|
9,550
|
|
Share of profit of joint
ventures and associates
|
11
|
174
|
-
|
-
|
185
|
|
Profit
before financial results and income tax
|
9,799
|
(37
)
|
(27
)
|
-
|
9,735
|
|
|
June 30,
2016 (recast)
|
||||
|
|
Total as
per segment information
|
Adjustment
for share of profit / (loss) of joint ventures
|
Expenses
and collective promotion funds
|
Adjustment
to income for elimination of inter segment
transactions
|
Total as
per Statement of Income
|
|
Revenues
|
30,366
|
(29
)
|
1,194
|
(8
)
|
31,523
|
|
Costs
|
(19,910
)
|
12
|
(1,207
)
|
6
|
(21,099
)
|
|
Gross
profit
|
10,456
|
(17
)
|
(13
)
|
(2
)
|
10,424
|
|
Net gain from fair value
adjustments of investment properties
|
17,938
|
(379
)
|
-
|
-
|
17,559
|
|
General and administrative
expenses
|
(1,847
)
|
1
|
-
|
7
|
(1,839
)
|
|
Selling
expenses
|
(5,706
)
|
2
|
-
|
-
|
(5,704
)
|
|
Other operating results,
net
|
(44
)
|
(2
)
|
-
|
(5
)
|
(51
)
|
|
Profit
from operations
|
20,797
|
(395
)
|
(13
)
|
-
|
20,389
|
|
Share of (loss) / profit of
joint ventures and associates
|
250
|
258
|
-
|
-
|
508
|
|
Profit
before financial results and income tax
|
21,047
|
(137
)
|
(13
)
|
-
|
20,897
|
|
|
June 30,
2015 (recast)
|
||||
|
|
Total as
per segment information
|
Adjustment
for share of profit / (loss) of joint ventures
|
Expenses
and collective promotion funds
|
Adjustment
to income for elimination of inter segment
transactions
|
Total as
per Statement of Income
|
|
Revenues
|
2,548
|
(27
)
|
887
|
(5
)
|
3,403
|
|
Costs
|
(481
)
|
9
|
(901
)
|
4
|
(1,369
)
|
|
Gross
profit
|
2,067
|
(18
)
|
(14
)
|
(1
)
|
2,034
|
|
Net gain fair value
adjustments of investment properties
|
4,007
|
(49
)
|
-
|
-
|
3,958
|
|
General and administrative
expenses
|
(378
)
|
1
|
-
|
3
|
(374
)
|
|
Selling
expenses
|
(196
)
|
2
|
-
|
-
|
(194
)
|
|
Other operating results,
net
|
33
|
2
|
-
|
(2
)
|
33
|
|
Profit
from operations
|
5,533
|
(62
)
|
(14
)
|
-
|
5,457
|
|
Share of (loss) / profit of
associates
|
(858
)
|
45
|
-
|
-
|
(813
)
|
|
Profit
before financial results and income tax
|
4,675
|
(17
)
|
(14
)
|
-
|
4,644
|
F-63
IRSA Inversiones
y Representaciones Sociedad Anónima
The following table presents a
reconciliation between total segment assets as per segment
information of Operations Centers in Argentina and Israel and total
assets as per the Statement of Financial Position.
|
|
June 30,
2017
|
June 30,
2016 (recast)
|
June 30,
2015
(recast)
|
|||||
|
|
Operations
Center in Argentina
|
Operations
Center in Israel
|
Total
|
Operations
Center in Argentina
|
Operations
Center in Israel
|
Total
|
Operations
Center in Argentina
|
Total
|
|
Total
assets based on segment information
|
44,885
|
178,964
|
223,849
|
39,294
|
147,470
|
186,764
|
23,052
|
23,052
|
|
Proportionate share in
assets per segment of joint ventures (3)
|
(928
)
|
-
|
(928
)
|
(763
)
|
-
|
(763
)
|
(362
)
|
(362
)
|
|
Investment in joint
ventures (1)
|
735
|
-
|
735
|
621
|
-
|
621
|
342
|
342
|
|
Other non-reportable assets
(2)
|
7,586
|
-
|
7,586
|
5,519
|
-
|
5,519
|
2,746
|
2,746
|
|
Total
assets as per Statement of Financial Position
|
52,278
|
178,964
|
231,242
|
44,671
|
147,470
|
192,141
|
25,778
|
25,778
|
(1)
Represents the equity value of joint ventures
that were proportionately consolidated for information by segment
purposes.
(2)
Includes deferred income tax asset, income tax
and MPIT credits, trade and other receivables, investment in
financial assets, cash and cash equivalents and intangible assets
except for right to receive future units under barter agreements,
net of investments in associates with negative equity which are
included in provisions in the amount of Ps. 72, Ps. 45 and Ps. 18,
as of June 30, 2017, 2016 and 2015, respectively.
(3)
Below is a detail of the proportionate share in
assets by segment of joint ventures of the Operations Center in
Argentina, included in the segment information:
|
|
June 30,
2017
|
June 30,
2016 (recast)
|
June 30,
2015
(recast)
|
|
Investment
properties
|
916
|
669
|
353
|
|
Property, plant and
equipment
|
1
|
1
|
1
|
|
Trading
properties
|
5
|
88
|
3
|
|
Goodwill
|
5
|
5
|
5
|
|
Inventories
|
1
|
-
|
-
|
|
Total
proportionate share in assets per segment of joint
ventures
|
928
|
763
|
362
|
The following
table presents a reconciliation between total segment liabilities
as per segment information of Operations Centers in Argentina and
Israel and total liabilities as per the Statement of Financial
Position.
|
|
June 30,
2017
|
June 30,
2016 (recast)
|
June 30,
2015
(recast)
|
|||||
|
|
Operations
Center in Argentina
|
Operations
Center in Israel
|
Total
|
Operations
Center in Argentina
|
Operations
Center in Israel
|
Total
|
Operations
Center in Argentina
|
Total
|
|
Total
liabilities based on segment information
|
-
|
155,235
|
155,235
|
-
|
132,989
|
132,989
|
-
|
-
|
|
Plus:
|
|
|
|
|
|
|
|
|
|
Other non-reportable
liabilities
|
28,671
|
-
|
28,671
|
23,296
|
-
|
23,296
|
12,798
|
12,798
|
|
Total liabilities as per
Statement of Financial Position
|
28,671
|
155,235
|
183,906
|
23,296
|
132,989
|
156,285
|
12,798
|
12,798
|
F-64
IRSA Inversiones
y Representaciones Sociedad Anónima
7.
Information about the main
subsidiaries
The Group conducts its business
through several operating and holding subsidiaries. The Group
considers that the subsidiaries below are the ones with significant
non-controlling interests to the Group.
|
|
As of
June 30, 2017
|
Year
ended June 30, 2017
|
||||||||||||||
|
|
Direct
interest of non-controlling interest %
|
Current
Assets
|
Non-current
Assets
|
Current
Liabilities
|
Non-current
Liabilities
|
Net
assets
|
Book
value of non-controlling interests
|
Revenues
|
Net
income / (loss)
|
Total
comprehensive income / (loss)
|
Total
comprehensive profit / (loss) attributable to non-controlling
interest
|
Cash of
Operating activities
|
Cash of
investing activities
|
Cash of
financial activities
|
Net
Increase (decrease) in cash and cash equivalents
|
Dividends
distribution to non-controlling shareholders
|
|
Elron
|
49.68
%
|
1,669
|
1,183
|
162
|
10
|
2,680
|
1,975
|
-
|
(427
)
|
(63
)
|
(342
)
|
(235
)
|
147
|
(200
)
|
(288
)
|
106
|
|
PBC
|
35.56
%
|
10,956
|
64,345
|
10,503
|
49,902
|
14,896
|
11,161
|
4,877
|
886
|
(353
)
|
1,254
|
2,470
|
(2,208
)
|
283
|
545
|
(975
)
|
|
Cellcom
|
57.74
%
|
11,209
|
18,273
|
8,171
|
15,974
|
5,337
|
3,706
|
15,739
|
(329
)
|
-
|
(224
)
|
2,348
|
(1,574
)
|
(1,348
)
|
(574
)
|
-
|
|
Shufersal
|
39.33
%
|
12,764
|
23,482
|
16,556
|
12,983
|
6,707
|
3,840
|
47,192
|
1,000
|
(7
)
|
601
|
2,883
|
(1,590
)
|
(1,798
)
|
(505
)
|
(265
)
|
|
|
|
|
|
|
|
|
|
|
|
|
|
|
|
|
|
|
|
|
|
|
|
|
|
|
|
|
|
|
|
|
|
|
|
|
|
|
As of
June 30, 2016 (recast)
|
Year
ended June 30, 2016 (recast)
|
||||||||||||||
|
|
Direct
interest of non-controlling interest %
|
Current
Assets
|
Non-current
Assets
|
Current
Liabilities
|
Non-current
Liabilities
|
Net
assets
|
Book
value of non-controlling interests
|
Revenues
|
Net
income / (loss)
|
Total
comprehensive income / (loss)
|
Total
comprehensive profit / (loss) attributable to non-controlling
interest
|
Cash of
Operating activities
|
Cash of
investing activities
|
Cash of
financial activities
|
Net
Increase (decrease) in cash and cash equivalents
|
Dividends
distribution to non-controlling shareholders
|
|
Elron
|
49.68
%
|
2,145
|
922
|
82
|
31
|
2,954
|
2,522
|
3
|
(97
)
|
(200
)
|
(126
)
|
(171
)
|
(58
)
|
13
|
(216
)
|
-
|
|
PBC
|
23.55
%
|
10,435
|
48,010
|
9,925
|
37,684
|
10,836
|
7,220
|
1,606
|
957
|
675
|
795
|
1,085
|
292
|
(2,519
)
|
(1,142
)
|
(336
)
|
|
Cellcom
|
58.23
%
|
9,368
|
16,113
|
7,629
|
13,210
|
4,642
|
3,795
|
6,655
|
(64
)
|
(67
)
|
(39
)
|
1,442
|
(241
)
|
(776
)
|
425
|
(6
)
|
|
Shufersal
|
47.05
%
|
9,929
|
18,791
|
13,202
|
10,419
|
5,099
|
3,040
|
19,427
|
343
|
322
|
343
|
803
|
(504
)
|
(2,543
)
|
(2,244
)
|
(158
)
|
|
|
|
|
|
|
|
|
|
|
|
|
|
|
|
|
|
|
|
|
|
|
|
|
|
|
|
|
|
|
|
|
|
|
|
|
|
|
As of
June 30, 2015 (recast)
|
Year
ended June 30, 2015 (recast)
|
||||||||||||||
|
|
Direct
interest of non-controlling interest %
|
Current
Assets
|
Non-current
Assets
|
Current
Liabilities
|
Non-current
Liabilities
|
Net
assets
|
Book
value of non-controlling interests
|
Revenues
|
Net
income / (loss)
|
Total
comprehensive income / (loss)
|
Total
comprehensive profit / (loss) attributable to non-controlling
interest
|
Cash of
Operating activities
|
Cash of
investing activities
|
Cash of
financing activities
|
Net
Increase (decrease) in cash and cash equivalents
|
Dividends
distribution to non-controlling shareholders
|
|
PAMSA
|
20.00
%
|
488
|
2,376
|
310
|
671
|
1,882
|
376
|
333
|
580
|
580
|
116
|
120
|
(154
)
|
-
|
(34
)
|
(43
)
|
|
DLF
|
8.43
%
|
330
|
1,729
|
299
|
264
|
1,496
|
13
|
-
|
(418
)
|
(390
)
|
(82
)
|
-
|
-
|
-
|
-
|
-
|
|
Rigby
|
25.50
%
|
19
|
-
|
-
|
-
|
19
|
5
|
28
|
398
|
212
|
109
|
-
|
1,538
|
(1,537
)
|
1
|
-
|
|
RES
|
33.17
%
|
30
|
356
|
11
|
14
|
361
|
120
|
-
|
119
|
119
|
40
|
(1
)
|
-
|
-
|
(1
)
|
-
|
N/A: Not applicable. Not considered
a significant non-controlling interest.
F-65
IRSA Inversiones
y Representaciones Sociedad Anónima
Restrictions, commitments and other relevant issues
Cellcom
In November
2015, Cellcom signed an agreement with Golán Telecom Ltd
(“Golan”) and its shareholders for the acquisition of
100% of Golan’s shares of stock. Such agreement was not
accepted by the Ministry of Telecommunications. Furthermore, in
July 2016, Cellcom started legal proceedings against Golan for
failure to comply with the stock purchase agreement. On January 17,
2017 Electra Consumer Products Ltd (“Electra”) entered
into a stock purchase agreement with Golan and its shareholders and
also an agreement with Cellcom on the use of its net and hosting
services. At the same time, Cellcom cancelled the agreement to
purchase Golan and agreed to grant Electra a loan in the amount of
NIS 130 (then equivalent to around Ps. 546) for a term of 10 years,
which will be repaid in 6 semi-annual installments starting on the
eight anniversary of the execution of the agreement. The loan is
backed by several assets of Golan. It is worth mentioning that, the
agreement regarding the use of the network and hosting services was
approved by the Ministry of Telecommunications. The purchase of
Golan by Electra was approved in April 2017 and the loan was
granted.
Analysis of the impact of the Concentration Law
On December
2013, was published in the Official Gazette of Israel the Promotion
of Competition and Reduction of Concentration Law N°, 5774-13
(‘the Concentration Law’) which has material
implications for IDBD and its investors, including the disposal of
the controlling interest in Clal.
In May 2017,
the alternative chosen by the Board and the Audit Committee of IDBD
was the sale of DIC’s shares to a special purpose vehicle
controlled by Dolphin. Thus, IDBD would cease controlling DIC and
its subsidiaries. Under this alternative, IDBD complies with the
concentration law as of the end of fiscal year 2017.
After June 30,
2017, Dolphin Netherlands B.V. made a non-binding tender offer for
the acquisition of all the shares of Discount Investment
Corporation Ltd. (“DIC”) held by IDB Development
Corporation Ltd. (“IDBD”). There is no certainty that
the parties will sign or execute a binding agreement. The tender
offer is to be examined by a committee of independent directors of
IDBD and, once examined, the terms and conditions of the
transaction will be negotiated. This transaction may take a long
time to be finalized or may even never be realized, or else be
consummated under different terms over the course of the
negotiations, as it requires approval of IDBD’s competent
corporate bodies, as well as approval by other entities that may
deny.
For purposes of
the transaction, a committee of independent directors has been set
up to assess the tender offer and negotiate the terms and
conditions. In response to an inquiry, the Audit Committee has
issued an opinion without reservations as to the transaction in
accordance with the terms of section 72 et al. of the Capital
Markets Law N° 26,831.
On September 24, 2017, IDBD reported
that the Company and Dolphin signed a Term Sheet for the purchase
of DIC shares by a related party of Dolphin. The completion of the
Transaction contemplated under the Term Sheet is subject to the
Parties' execution of the definitive transaction documents (the
"Definitive Documents") on or prior to November 16, 2017, as well
as to the approval of the Transaction by the authorized organs of
the Parties and to the fulfillment of additional pending warranties
up to December 10, 2017 (the "Date of Completion of the
Transaction"). The main points of the Term Sheet are as
follows:
●
The buyer will acquire the total of DIC shares
held by IDBD at a stated price of NIS 16.6 per share (equivalent to
approximately Ps. 80 per share at the date of these financial
statements).
●
Payment will be made through the issuance of a
promissory note by the buyer, which will expire 5 years from the
date of completion of the transaction and will accrue a minimum
annual interest of 5.5%. Until the payment is canceled in full, any
DIC distribution will be paid in an Israeli bank and will be
pledged in favor of the seller.
●
DIC debt must maintain the same encumbrance and
the shares that are not currently guaranteeing debt will be held in
favor of the selling party until the cancellation of the
payment.
As of the date
of issuance of these Consolidated Financial Statements IDBD is
currently analyzing the next steps to continue taking over the
control of its subsidiaries in 2019.
Dolphin arbitration process
As mentioned in
Note 4 H.a) to these Consolidated Financial Statements there is an
arbitration process going on between Dolphin and ETH in relation to
certain issues connected to the control obtainment of IDBD. In the
arbitration process the parties have agreed to designate Eyal
Rosovshy and Giora Erdinas to promote a mediation. On August 17,
2017, a mediation hearing was held and the parties failed to reach
an agreement. As of the date of these Consolidated Financial
Statements, there are no other news in relation to the process and
the proceeding is pending.
F-66
IRSA Inversiones
y Representaciones Sociedad Anónima
Reporting dividends by DIC
On March 22,
2017, DIC’s Board of Directors approved a distribution of
dividends for NIS 4.5 per share, in two tranches, as follows: (i)
NIS 3.3 per share (equivalent to Ps. 13.86 per share) payable on
April 20, 2017, and (ii) NIS 1.2 per share (equivalent to Ps. 5.04
per share) payable on September 19, 2017, subject to a solvency
test to be performed at the time of payment. The tranche
corresponding to April was already paid in.
Reporting dividends by other subsidiaries
In April 2017,
Shufersal, PBC and Gav Yam declared and paid out dividends in the
amount of NIS 160, NIS 150 and NIS 180, respectively (equivalent to
approximately Ps. 720, Ps. 675 and Ps. 810, respectively, on the
payment date).
Capital issuance
During April
2017, Shufersal issued approximately 12 million shares for a total
net consideration of NIS 210 (equivalent to approximately Ps. 882
as of the date of the issuance). As a result of such issuance,
DIC’s interest in Shufersal went down to nearly 56.11%. In
June 2017, Shufersal issued 8 million shares as part of a private
offering for a total amount of NIS 139 (equivalent to approximately
Ps. 654 on the issue date), thus diluting DIC’s interest to
54.19%.
During April
2017, Gav Yam increased its capital stock by NIS 180 (equivalent to
approximately Ps. 810 on the issue date); PBC did not take part in
the offering, thus reducing its interest to 51.70%.
8.
Investments in joint
ventures
Changes if the Group´s
investments in joint ventures for the fiscal years ended June 30,
2017, 2016 and 2015 were as follows:
|
|
June 30,
2017
|
June 30,
2016 (recast)
|
June 30,
2015 (recast)
|
|
Beginning
of the year
|
2,406
|
384
|
471
|
|
Decrease for control
obtainment (Note 4)
|
(59
)
|
-
|
-
|
|
Balance incorporated by
business combination (Note 4)
|
107
|
960
|
-
|
|
Capital
contributions
|
114
|
45
|
8
|
|
Share of profit
(i)
|
293
|
437
|
50
|
|
Capital reduction
(ii)
|
-
|
-
|
(111
)
|
|
Cumulative translation
adjustment
|
442
|
597
|
-
|
|
Dividend distributions
(iii)
|
(65
)
|
(17
)
|
(34
)
|
|
End of
the year
|
3,238
|
2,406
|
384
|
(ii)
Included in “Share of profit / (loss) of
associates and joint ventures” in the Consolidated Statements
of Income.
(jj)
During the year ended June 30, 2015, Cyrsa S.A.
distributed dividends due to capital reduction in the amount of Ps.
111.
(ii)
During the year ended June 30, 2017, Ps. 36
correspond to Manaman, Ps. 12 to NPSF, Ps. 9 to LRSA, Ps. 7 to
Cyrsa S.A. and Ps. 1 to Baicom Networks S.A. During the fiscal year
ended June 30, 2016, Ps. 7 correspond to Cyrsa S.A., Ps. 4 to NPSF
and Ps. 6 to Manaman. During the fiscal year ended June 30, 2015,
Ps. 31 corresponds to Cyrsa S.A. and Ps. 3 to NPSF.
F-67
IRSA Inversiones
y Representaciones Sociedad Anónima
The table below
lists additional information related to the Group’s
investment in joint ventures:
|
|
|
|
|
Value of
Group's interest in equity
|
Group's
interest in compehensive income
|
%
ownership interest
|
|
|
|
||||||
|
|
|
|
|
as
of June 30,
|
for the
fiscal year ended June 30,
|
as of
June 30,
|
Latest
Financial Statements issued
|
||||||||
|
Name of
the entity
|
Place of
business / Country of incorporation
|
Main
activity
|
Common
shares 1 vote
|
2017
|
2016
(recast)
|
2015
(recast)
|
2017
|
2016
(recast)
|
2015
(recast)
|
2017
|
2016
(recast)
|
2015
(recast)
|
Share
capital (nominal value)
|
Profit
for the year
|
Shareholders’
equity
|
|
Quality (1)
|
Argentina
|
Real
estate
|
81,814,342
|
482
|
360
|
204
|
119
|
155
|
29
|
50
%
|
50
%
|
50
%
|
166
|
237
|
956
|
|
La
Rural SA
|
Argentina
|
Event
organization and others
|
714,498
|
113
|
-
|
-
|
16
|
-
|
-
|
50
%
|
25
%
|
25
%
|
1
|
32
|
6
|
|
Mehadrin (2)
|
Israel
|
-
|
1,509,889
|
1,312
|
985
|
-
|
309
|
433
|
-
|
45.41
%
|
45,41
%
|
-
|
(*) 3
|
(*) 180
|
(*) 2,557
|
|
Other joint ventures
(3)
|
|
-
|
1,331
|
1,061
|
180
|
291
|
446
|
21
|
-
|
-
|
-
|
n/a
|
n/a
|
n/a
|
|
|
|
|
|
3,238
|
2,406
|
384
|
735
|
1,034
|
50
|
|
|
|
|
|
|
|
(1)
Quality is engaged in the operation of the San
Martín premises (formerly owned by Nobleza Piccardo S.A.I.C. y
F.).
(2)
Mehadrin is a company engaged in the production
and exports of citrus, fruits and vegetables..
(3)
Represents other joint ventures business that
are individually non-significant.
(*) Amounts in
millions of NIS.
F-68
IRSA Inversiones
y Representaciones Sociedad Anónima
Set out below is summarized
financial information of the joint ventures considered to be
material to the Group:
|
|
As of
June 30, 2017
|
Year
ended June 30, 2017 (ii)
|
|||||||||||||||
|
|
Current
Assets
|
Non-current
Assets
|
Current
Liabilities
|
Non-current
Liabilities
|
Net
assets
|
% of
ownership interest held
|
Interest
in joint venture
|
Goodwill
and others
|
Book
value
|
Revenues
|
Net
income / (loss)
|
Total
comprehensive income / (loss)
|
Dividend
distribution
|
Cash of
operating activities
|
Cash of
investing activities
|
Cash of
financing activities
|
Changes
in cash and cash equivalents
|
|
La
Rural
|
95
|
106
|
188
|
7
|
6
|
50
%
|
3
|
110
|
113
|
397
|
32
|
32
|
18
|
50
|
(34
)
|
-
|
16
|
|
Quality Invest
(i)
|
18
|
1,486
|
82
|
466
|
956
|
50
%
|
478
|
4
|
482
|
26
|
237
|
237
|
-
|
(11
)
|
-
|
11
|
-
|
|
Mehadrin
|
3,439
|
3,520
|
2,900
|
1,502
|
2,557
|
45.41
%
|
1,161
|
151
|
1,312
|
5,403
|
180
|
172
|
-
|
476
|
(76
)
|
(53
)
|
347
|
|
|
|
|
|
|
|
|
|
|
|
|
|
|
|
|
|
|
|
|
|
As of
June 30, 2016 (recast)
|
|
|||||||||||||||
|
|
Current
Assets
|
Non-current
Assets
|
Current
Liabilities
|
Non-current
Liabilities
|
Net
assets
|
% of
ownership interest held
|
Interest
in joint venture
|
Goodwill
and others
|
Book
value
|
Revenues
|
Net
income / (loss)
|
Total
comprehensive income / (loss)
|
Dividend
distribution
|
Cash of
operating activities
|
Cash of
investing activities
|
Cash of
financing activities
|
Changes
in cash and cash equivalents
|
|
Quality Invest
(i)
|
7
|
1,034
|
16
|
312
|
713
|
50
%
|
356
|
4
|
360
|
4
|
(15
)
|
(15
)
|
-
|
(10
)
|
-
|
10
|
-
|
|
Mehadrin
|
2,475
|
2,814
|
2,678
|
673
|
1,938
|
45.41
%
|
880
|
105
|
985
|
2,636
|
219
|
219
|
-
|
309
|
(13
)
|
206
|
502
|
|
|
|
|
|
|
|
|
|
|
|
|
|
|
|
|
|
|
|
|
|
As of
June 30, 2015 (recast)
|
|
|||||||||||||||
|
|
Current
Assets
|
Non-current
Assets
|
Current
Liabilities
|
Non-current
Liabilities
|
Net
assets
|
% of
ownership interest held
|
Interest
in joint venture
|
Goodwill
and others
|
Book
value
|
Revenues
|
Net
income / (loss)
|
Total
comprehensive income / (loss)
|
Dividend
distribution
|
Cash of
operating activities
|
Cash of
investing activities
|
Cash of
financing activities
|
Changes
in cash and cash equivalents
|
|
Quality Invest
(i)
|
4
|
540
|
6
|
138
|
400
|
50
%
|
200
|
4
|
204
|
16
|
4
|
4
|
-
|
(16
)
|
-
|
15
|
(1
)
|
(i)
In March 2011, Quality
acquired an industrial plant located in San Martín, Province
of Buenos Aires. The facilities are suitable for multiple uses. On
January 20, 2015, Quality agreed with the Municipality of San
Martin on certain re zoning and other urban planning matters
(“the Agreement”) to surrender a non-significant
portion of the land and a monetary consideration of Ps. 40 million
, payable in two installments of Ps. 20 each, the first of which
was actually paid on June 30, 2015. In July 2017, the Agreement was
amended as follows: 1) a revised zoning plan must be submitted
within 120 days as from the amendment date, and 2) the second
instalment of the monetary considerations was increased to Ps. 71
million payable in 18 equal monthly installments.
(ii)
Information under GAAP
applicable in the joint ventures´ jurisdiction.
F-69
IRSA Inversiones
y Representaciones Sociedad Anónima
9.
Investments in
associates
Evolution of the Group’s
investment in associates for the years ended June 30, 2017, 2016
and 2015 were as follows:
|
|
June 30,
2017
|
June 30,
2016 (recast)
|
June 30,
2015 (recast)
|
|
Beginning
of the year
|
14,429
|
2,568
|
2,116
|
|
Increase in equity interest
in associates
|
1,102
|
158
|
1,255
|
|
Sale of equity interest in
associates
|
-
|
(4
)
|
(34
)
|
|
Issuance of capital and
contributions
|
46
|
96
|
31
|
|
Capital
reduction
|
(32
)
|
-
|
-
|
|
Decrease for IDBD business
combination (Note 4)
|
-
|
(1,047
)
|
-
|
|
Associates incorporated by
business combination (Note 4)
|
-
|
8,308
|
-
|
|
Share of profit
(i)
|
85
|
394
|
138
|
|
Cumulative translation
adjustment
|
(210
)
|
4,553
|
106
|
|
Unrealized loss on
investments at fair value
|
-
|
79
|
(1,001
)
|
|
Dividend distributions
(ii)
|
(185
)
|
(515
)
|
(13
)
|
|
Reclassification to
financial instruments
|
-
|
-
|
(30
)
|
|
Reclassification to held
for sale (Note 4) (iv)
|
(10,709
)
|
-
|
-
|
|
Others
|
49
|
(161
)
|
-
|
|
End of
the year (iii)
|
4,575
|
14,429
|
2,568
|
(i)
As of June 30, 2017, 2016 and 2015, Ps. (108),
Ps. (8) and Ps. 138, respectively, are included in "Share of profit
/ (loss) of associates and joint ventures"; and, Ps. 193, Ps. 402
and Ps. 0, respectively, are included in "Gain / (loss) from
discontinued operations".
(ii)
During the fiscal year ended June 30, 2017 the
balance corresponds Ps. 101 to Emco, Ps. 36 to Aviareps AG, Ps. 22
to Condor, Ps. 19 to Manibil and Ps. 7 to Millenium. During the
fiscal year ended June 30, 2016 the balance corresponds Ps. 10 to
Millenium, Ps. 495 to Adama and Ps. 10 to Emco. During the fiscal
year ended June 30, 2015 the balance corresponds to
BHSA.
(iii)
Includes Ps. (72), Ps. (45) and Ps. (18)
reflecting interests in companies with negative equity as of June
30, 2017, 2016 and 2015, respectively, which are disclosed in
“Provisions” (see Note 21).
(iv)
Includes Ps. 10,435 related to Adama and Ps. 274
related to Tourism (see Note 31).
BHSA
BHSA is subject
to certain restrictions on the distribution of profits, as required
by BCRA regulations.
As of June 30,
2017, BHSA has a remainder of 36.6 million treasury stock Class C
Ps. 1 par value received in 2009 as a result of certain financial
transactions. The Annual Shareholders' Meeting decided to allocate
35.1 million of such shares to an employee compensation plan
pursuant to Section 67 of Law 26,831. The remaining 1.5 million
shares belong to third party holders of Stock Appreciation Rights,
who have failed to produce the documentation required for
redemption purposes. As of June 30, 2017, excluding the treasury
stock, the Group’s interest in BHSA amounts to 29.91% (or to
30.66%, including the treasury stock).
The Group
estimated that the value in use of its investment in BHSA as of
June 30, 2017, 2016 and 2015 amounted to Ps. 4,134, Ps. 4,399 and
Ps. 3,390, respectively. The value in use was estimated based on
the present value of future business cash flows. The main premises
used were the following:
-
The Group considered 7 years as horizon for the
projection of BHSA cash flows.
-
The “Private BADLAR” interest rate
was projected based on internal data and information gathered from
external advisors.
-
The projected exchange rate was estimated in
accordance with internal data and external information provided by
independent consultants.
-
The discount rate used to discount actual
dividend flows was 12.99% in 2017, 12.41% in 2016 and 15.97% in
2015.
F-70
IRSA Inversiones
y Representaciones Sociedad Anónima
The table below lists
additional information related to
the
Group’s investment in associates:
|
Name of the entity
|
Place of business / Country of incorporation
|
Main activity
|
Common shares 1 vote
|
Value of Group's interest in equity
|
Group's interest in comprehensive income (loss)
|
% ownership interest
|
|
|
|
||||||
|
as of June 30,
|
for the fiscal year ended June 30,
|
as of June 30,
|
Latest Financial Statements issued
|
||||||||||||
|
2017
|
2016 (recast)
|
2015 (recast)
|
2017
|
2016 (recast)
|
2015 (recast)
|
2017
|
2016 (recast)
|
2015 (recast)
|
Share capital (nominal value)
|
Profit / (Loss) for the year
|
Shareholders’ equity
|
||||
|
|
|||||||||||||||
|
|
|||||||||||||||
|
New
Lipstick (1)
|
U.S.A.
|
Real estate
|
N/A
|
(72
)
|
178
|
223
|
(201
)
|
(64
)
|
49
|
49.73
%
|
49.73
%
|
49.73
%
|
(a)
15
|
(a)
(33)
|
(a)
(167)
|
|
BHSA (2)
|
Argentina
|
Financial
|
448,689,072
|
1,693
|
1,609
|
1,356
|
83
|
259
|
143
|
29.91
%
|
29.91
%
|
29.91
%
|
(b)
1,500
|
(b)
625
|
(b)
6,681
|
|
IDBD (3)
|
Israel
|
Investment
|
N/A
|
-
|
4
|
908
|
-
|
225
|
(917
)
|
N/A
|
N/A
|
N/A
|
N/A
|
N/A
|
N/A
|
|
Condor (4)
|
U.S.A.
|
Hotel
|
3,314,453
|
634
|
(45
)
|
(18
)
|
53
|
(27
)
|
(50
)
|
28.72
%
|
25.53
%
|
25.53
%
|
N/A
|
(a) (c)
(2)
|
(a) (c)
98
|
|
Adama (5)
|
Israel
|
Agrochemical
|
N/A
|
-
|
10,847
|
-
|
-
|
4,141
|
-
|
0.00
%
|
40.00
%
|
40.00
%
|
N/A
|
N/A
|
N/A
|
|
PBEL
|
India
|
Real estate
|
450,000
|
768
|
864
|
-
|
262
|
194
|
-
|
45.40
%
|
45.40
%
|
-
|
(d)
1
|
(d)
(29)
|
(d)
(523)
|
|
Other
associates
|
|
|
|
1,552
|
972
|
99
|
(322
)
|
240
|
18
|
-
|
-
|
-
|
-
|
-
|
-
|
|
|
|
4,575
|
14,429
|
2,568
|
(125
)
|
4,968
|
(757
)
|
|
|
|
|
|
|
||
(1)
New Lipstick's equity
comprises a rental office building in New York City known as the
“Lipstick Building” with related debt.
(2)
BHSA is a full-service
commercial bank offering a wide variety of banking activities and
related financial services to individuals, small- and medium-sized
companies and large corporations. Share market value is Ps. 6.65
per share.
(3)
The Group obtained control
over IDBD on May 7, 2014. The Group has valued its interest in IDBD
at fair value through profit or loss, according to an exception of
IAS 28. See Note 4 for further information. As the Group’s
interest in IDBD was valued at fair value, financial information
and % ownership interest are not shown. Share market value was
1.957 NIS per share as of June 30, 2015. (Note 4).
(4)
Condor is a hotel-focused
real estate investment trust (REIT). See Note 4 C. Share market
value as of June 30, 2017 is Ps. 10.70 per share.
(5)
Adama is specialized in the
chemical industry, mainly, in the agrochemical industry. See Note 4
A.
(a)
Amounts in millions of US Dollars under
USGAAP.
(b) The balances correspond to
the Financial Statements of BHSA prepared in accordance with BCRA
standards. For the purpose of the valuation of the investment in
the company, necessary adjustments to adequate the Financial
Statements to IFRS have been considered.
(c)
Condor’s year-end falls on December 31, so
the Group estimates their interest with a three-month lag,
including material adjustments, if any.
(d)
Amounts in millions of NIS.
F-71
IRSA Inversiones
y Representaciones Sociedad Anónima
Information about
significant associates
Set out below are summarized
financial information of the significant Group's associates as of
June 30, 2017, 2016 and 2015:
|
|
As of
June 30, 2017
|
Year
ended June 30, 2017 (i)
|
|||||||||||||||
|
|
Current
Assets
|
Non-current
Assets
|
Current
Liabilities
|
Non-current
Liabilities
|
Net
assets
|
%
ownership interest
|
Interest
in associate
|
Goodwill
and others
|
Book
value
|
Revenues
|
Net
income / (loss)
|
Total
comprehensive income / (loss)
|
Dividend
distribution
|
Cash of
operating activities
|
Cash of
investing activities
|
Cash of
financing activities
|
Changes
in cash and cash equivalents
|
|
BHSA
|
36,762
|
18,228
|
33,675
|
15,548
|
(ii)
5,767
|
(iii)
30.66%
|
1,688
|
4
|
1,693
|
7,921
|
625
|
625
|
-
|
(954
)
|
(756
)
|
466
|
(676
)
|
|
PBEL
|
1,469
|
272
|
181
|
4,302
|
(2,742
)
|
45.40
%
|
(1,245
)
|
2,013
|
768
|
300
|
(292
)
|
(186
)
|
-
|
202
|
(37
)
|
(160
)
|
5
|
|
|
|
|
|
|
|
|
|
|
|
|
|
|
|
|
|
|
|
|
|
As of
June 30, 2016 (recast)
|
Year
ended June 30, 2016 (recast) (i)
|
|||||||||||||||
|
|
Current
Assets
|
Non-current
Assets
|
Current
Liabilities
|
Non-current
Liabilities
|
Net
assets
|
%
ownership interest
|
Interest
in associate
|
Goodwill
and others
|
Book
value
|
Revenues
|
Net
income / (loss)
|
Total
comprehensive income / (loss)
|
Dividend
distribution
|
Cash of
operating activities
|
Cash of
investing activities
|
Cash of
financing activities
|
Changes
in cash and cash equivalents
|
|
BHSA
|
20,307
|
20,544
|
28,255
|
7,244
|
(ii)
5,352
|
(iii)
30.66%
|
1,605
|
4
|
1,609
|
6,821
|
837
|
837
|
-
|
(9,462
)
|
(410
)
|
4,099
|
(2,756
)
|
|
Adama
|
41,879
|
25,470
|
23,018
|
20,336
|
23,995
|
(v)
40%
|
9,598
|
1,249
|
10,847
|
18,839
|
1,056
|
853
|
-
|
280
|
(1,085
)
|
(2,655
)
|
(3,460
)
|
|
PBEL
|
1,510
|
257
|
354
|
3,456
|
(2,043
)
|
45.40
%
|
(928
)
|
1,792
|
864
|
-
|
(97
)
|
(90
)
|
-
|
145
|
(58
)
|
(90
)
|
(3
)
|
|
|
|
|
|
|
|
|
|
|
|
|
|
|
|
|
|
|
|
|
|
As of
June 30, 2015 (recast)
|
Year
ended June 30, 2015 (recast) (i)
|
||||||||||||||||
|
|
Current
Assets
|
Non-current
Assets
|
Current
Liabilities
|
Non-current
Liabilities
|
Net
assets
|
%
ownership interest
|
|
Interest
in associate
|
Goodwill
and others
|
Book
value
|
Revenues
|
Net
income / (loss)
|
Total
comprehensive income / (loss)
|
Dividend
distribution
|
Cash of
operating activities
|
Cash of
investing activities
|
Cash of
financing activities
|
Changes
in cash and cash equivalents
|
|
BHSA
|
25,112
|
9,972
|
26,893
|
3,725
|
(ii)
4,466
|
(iii) 30.74%
|
(ii)
|
1,352
|
4
|
1,356
|
4,500
|
461
|
461
|
42
|
(3,334
)
|
(46
)
|
1,515
|
193
|
|
IDBD
|
30,344
|
64,935
|
24,209
|
61,684
|
9,386
|
(iv) N/A
|
(ii)
|
(iv)
N/A
|
(iv)
N/A
|
908
|
43,296
|
713
|
151
|
-
|
2,909
|
1,389
|
(4,505
)
|
(207
)
|
(i)
Information
under
GAAP applicable in the
associates´ jurisdiction.
(ii)
Net of non-controlling interest.
(iii)
Considering the effect of Treasury
shares.
(iv)
Book value has been computed based on the fair
value of the investment (Note 4).
(v)
See Note 4.
F-72
IRSA Inversiones
y Representaciones Sociedad Anónima
10.
Investment
properties
Changes in the Group’s
investment properties for the years ended June 30, 2017, 2016 and
2015 were as follows:
|
|
Rental
properties
|
Undeveloped
parcels of land
|
Properties
under development
|
Total
|
|
Net book
amount at July 1st, 2014 (recast)
|
13,098
|
2,311
|
387
|
15,796
|
|
Year
ended June 30, 2015
|
|
|
|
|
|
Additions
|
281
|
2
|
174
|
457
|
|
Capitalized leasing
costs
|
3
|
-
|
13
|
16
|
|
Amortization of capitalized
leasing costs (i)
|
(2
)
|
-
|
-
|
(2
)
|
|
Transfers (ii)
|
573
|
-
|
(573
)
|
-
|
|
Transfers to property,
plant and equipment
|
(1
)
|
-
|
-
|
(1
)
|
|
Transfers to trading
properties
|
(15
)
|
-
|
-
|
(15
)
|
|
Disposals
|
-
|
-
|
(2
)
|
(2
)
|
|
Disposals due to
sales
|
(985
)
|
(5
)
|
-
|
(990
)
|
|
Net gain of fair value
changes
|
2,558
|
1,399
|
1
|
3,958
|
|
Net book
amount at June 30, 2015 (recast)
|
15,510
|
3,707
|
-
|
19,217
|
|
Year
ended June 30, 2016:
|
|
|
|
|
|
Assets incorporated by
business combination (Note 4)
|
25,256
|
1,439
|
2,891
|
29,586
|
|
Additions
|
258
|
12
|
919
|
1,189
|
|
Capitalized leasing
costs
|
2
|
-
|
-
|
2
|
|
Amortization of capitalized
leasing costs (i)
|
(1
)
|
-
|
-
|
(1
)
|
|
Transfers
|
1,332
|
(229
)
|
(1,103
)
|
-
|
|
Transfers of property,
plant and equipment
|
57
|
-
|
-
|
57
|
|
Transfers to trading
properties
|
(24
)
|
(293
)
|
-
|
(317
)
|
|
Disposals due to
sales
|
(1,357
)
|
(41
)
|
-
|
(1,398
)
|
|
Disposals
|
(23
)
|
(1
)
|
-
|
(24
)
|
|
Cumulative translation
adjustment
|
14,505
|
816
|
1,512
|
16,833
|
|
Net gain / (loss) of fair
value changes
|
16,849
|
713
|
(3
)
|
17,559
|
|
Net book
amount at June 30, 2016 (recast)
|
72,364
|
6,123
|
4,216
|
82,703
|
|
Year
ended June 30, 2017:
|
|
|
|
|
|
Additions
|
1,204
|
57
|
1,390
|
2,651
|
|
Financial cost
charged
|
-
|
-
|
3
|
3
|
|
Capitalized leasing
costs
|
4
|
-
|
20
|
24
|
|
Amortization of capitalized
leasing costs (i)
|
(2
)
|
-
|
-
|
(2
)
|
|
Transfers
|
3,014
|
(6
)
|
(3,008
)
|
-
|
|
Transfers to/from property,
plant and equipment
|
156
|
-
|
-
|
156
|
|
Transfers to trading
properties
|
(14
)
|
-
|
-
|
(14
)
|
|
Transfers to assets held
for sale
|
(71
)
|
-
|
-
|
(71
)
|
|
Reclassification previous
periods (Note 2.27)
|
-
|
-
|
(224
)
|
(224
)
|
|
Disposals due to
sales
|
(220
)
|
-
|
-
|
(220
)
|
|
Cumulative translation
adjustment
|
9,480
|
495
|
519
|
10,494
|
|
Net gain of fair value
changes
|
3,386
|
978
|
89
|
4,453
|
|
Net book
amount at June 30, 2017
|
89,301
|
7,647
|
3,005
|
99,953
|
(i)
Amortization charges of capitalized leasing
costs were included in “Costs” in the Statements of
Income (Note 24).
(ii)
Includes transfers due to the opening of Alto
Comahue and Distrito Arcos Shopping Malls.
Certain
investment property assets of the Group have been mortgaged or
restricted to secure some of the Group’s borrowings and other
payables. Book amount of those properties amounts to Ps. 40,719,
Ps. 16,225 and Ps. 301 as June 30, 2017, 2016 and 2015,
respectively.
The following
amounts have been recognized in the Statements of
Income:
|
|
June 30,
2017
|
June 30,
2016 (recast)
|
June 30,
2015 (recast)
|
|
Rental and services
income
|
8,711
|
5,268
|
2,997
|
|
Direct operating
expenses
|
(2,838
)
|
(1,888
)
|
(1,077
)
|
|
Development
expenditures
|
(1,397
)
|
(11
)
|
(9
)
|
|
Net income on the change in
the fair value of realized investment property
|
128
|
908
|
645
|
|
Net income on the change in
the fair value of unrealized investment property
|
4,325
|
16,651
|
3,313
|
F-73
IRSA Inversiones
y Representaciones Sociedad Anónima
Valuation
processes
The Group’s investment
properties were valued at each reporting date by independent
professionally qualified appraisers who hold a recognized relevant
professional qualification and have experience in the locations and
segments of the investment properties appraised. For all investment
properties, their current use equates to the highest and best
use.
Each Operations center has a team
that review the appraisals performed by the independent appraisers
(the “review team”). The review team: i) verifies all
major and important assumptions relevant to the appraisal in the
valuation report from the independent appraisers; ii) assesses
property valuation movements compared to the valuation report from
the prior period; and iii) holds discussions with the independent
appraisers.
Changes in Level 2 and 3 fair
values, if any, are analyzed at each reporting date during the
valuation discussions between the review team and the independent
appraisers. In the case of the Operations Center in Argentina, the
Board of Directors ultimately approves the fair value calculation
for recording into the Financial Statements. In the case of the
Operations Center of Israel, the appraisals were examined by Israel
Management and reported to the Financial Statements
Committee.
Valuation
techniques used for the estimation of fair value of the investment
property:
A.
Operations
Center in Argentina
For Shopping Malls, with a total
carrying amount of Ps. 28,561, Ps. 26,426 and Ps. 10,277 for fiscal
years ended on June 30, 2017, 2016 and 2015, respectively, the
valuation was determined using discounted cash flow
(“DCF”) projections based on significant unobservable
assumptions. The following are the key assumptions:
●
Future rental cash inflows
based on the location, type and quality of the properties and
supported by the terms of any existing lease, and considering the
estimations of the Gross National Income (GNI) and the estimated
inflation rated given by external advisors.
●
It was considered that all
Shopping Malls will grow with the same elasticity in relation to
the evolution of the GNI and projected Inflation.
●
Cash flows from future
investments, expansions, or improvements in shopping malls were not
considered.
●
Estimated vacancy rates
taking into account current and future market conditions once the
current leases expire.
●
The projected cash flows
were discounted using the weighted average cost of capital (WACC)
as the discount rate for each valuation date.
●
Terminal value: it was
consider a perpetuity calculated from the cash flow of the last
year of useful life.
●
The cash flow for the
concessions were projected until the due date of the concession
determinate in the current agreement.
For office properties and
undeveloped land, with a total amount of Ps. 11,115, Ps. 8,986 and
Ps. 8,938 as of June 30, 2017, 2016 and 2015, respectively, the
valuation was determined using market comparable. These values are
adjusted for differences in key attributes such as location, size
of the property and quality of the interior design. The most
significant contribution to this comparable market approach is the
price per square meter.
It can sometimes be difficult to
reliably determine the fair value of the property under
development. In order to assess whether the fair value of the
property under development can be determined reliably, management
considers the following factors, among others:
F-74
IRSA Inversiones
y Representaciones Sociedad Anónima
●
The provisions of the construction
contract.
●
The stage of completion.
●
Whether the project/property is standard
(typical for the market) or non-standard.
●
The level of reliability of cash inflows after
completion.
●
The development risk specific to the
property.
●
Past experience with similar
constructions.
●
Status of construction permits.
For properties under construction,
with a carrying amount of Ps. 615 and Ps 293 as of June 30, 2017
and 2016, respectively, the valuation was based on a cost basis for
all the indicated periods. These properties under development
currently comprise works in a building office to be constructed.
There were no properties under development as of June 30,
2015.
There were no changes to the
valuation techniques during the presented fiscal year.
The following table presents
information regarding the fair value measurements of investment
properties using significant unobservable inputs (Level
3):
June 30,
2017
|
Property
type
|
Valuation
technique
|
Discount
rate
|
Growth
rate
|
|
Shopping Malls
|
Discounted cash
flows
|
9.35%
|
3%
|
For the next five years, an average
Ps./US$ exchange rate was considered, with an upward trend, from
Ps./US$ 15.45 to Ps./US$ 27.66. Over the long term, a nominal
depreciation rate of the peso of 5.5% is assumed, estimated based
on the projected rates of inflation in Argentina and USA. The
inflation considered has a downward trend, which starts at 31.0%
and stabilizes at 8% after 10 years.
June 30,
2016
|
Property
type
|
Valuation
technique
|
Discount
rate
|
Growth
rate
|
|
Shopping Malls
|
Discounted cash
flows
|
9.51
|
3%
|
For the next five years, an average
Ps./US$ exchange rate was considered, with an upward trend, from
Ps./US$ 12.03 to Ps./US$ 25.72. Over the long term, a nominal
depreciation rate of the peso of 3.1% is assumed, estimated based
on the projected rates of inflation in Argentina and USA. The
inflation considered has a downward trend, which starts at 31.8%
and stabilizes at 5.5% after 10 years.
June 30,
2015
|
Property
type
|
Valuation
technique
|
Discount
rate
|
Growth
rate
|
|
Shopping Malls
|
Discounted cash
flows
|
13.15%
|
3%
|
For the next five years, an average
Ps./US$ exchange rate was considered, with an upward trend, from
Ps./US$ 8.62 to Ps./US$ 19.66. Over the long term, a nominal
depreciation rate of the peso of 5.1% is assumed, estimated based
on the projected rates of inflation in Argentina and
USA.
F-75
IRSA Inversiones
y Representaciones Sociedad Anónima
The inflation considered has a
downward trend, which starts at 32.7% and stabilizes at 6% after 10
years.
Sensitivity of unobservable assumptions (Shopping
Malls):
|
|
Discount
rate
+
1%
|
Discount
rate
-1%
|
Growth
rate
+ 1
%
|
Growth
rate
- 1
%
|
Inflation
+ 10%
(1)
|
Inflation
- 10%
(2)
|
Devaluation rate + 10%
(3)
|
Devaluation rate - 10%
(4)
|
|
2017
|
(3,948)
|
5,445
|
2,464
|
(1,794)
|
2,684
|
(2,425)
|
(2,565)
|
3,135
|
|
2016
|
(3,638)
|
4,989
|
2,094
|
(1,536)
|
2,537
|
(2,310)
|
(2,373)
|
2,900
|
|
2015
|
(1,021)
|
976
|
143
|
(338)
|
841
|
(993)
|
(1,039)
|
1,001
|
(1) Assumes a 10% higher inflation
rate for each period, vis-a-vis projected rates.
(2) Assumes a 10% lower inflation
rate for each period, vis-a-vis projected rates.
(3) Assumes a 10% higher exchange
rate for each period, vis-a-vis projected rates.
(4) Assumes a 10% lower exchange
rate for each period, vis-a-vis projected rates.
B.
Operations
Center in Israel
For the rental properties with a
carrying amount of Ps. 54,334 and Ps. 40,871, for the fiscal years
ended June 30, 2017 and 2016, respectively, the valuation was
determined using discounted cash flow (“DCF”)
projections based on significant unobservable
assumptions.
Within these assumptions the main
are:
●
a discount rate that reflects the specific risks
incorporated in comparable flows and assets.
●
real lease agreements, where payments differ
from the proper rent, if any, are subject to adjustments to reflect
the actual payments made during the term of the lease.
●
type of lessee that occupies the property, the
future lessees that may occupy the property after leasing a vacant
property, including a general creditworthiness
assessment.
●
the allocation of responsibilities between the
Group and the lessee as regards maintenance and insurance of the
property.
●
the physical condition and remaining useful life
of the property.
●
the provisions of the construction
contract.
●
the stage of completion
●
whether the project/property is standard
(typical in the market) or non-standard.
●
the reliability of the cash inflows following
completion.
●
the development risk specific to the
property.
●
previous experience with similar
constructions.
●
status of construction permits.
Within these
assumptions for the Operations Center in Israel the key ones
are:
|
Weighted average discount
rate:
|
||||
|
|
|
|
2017
|
2016
|
|
Rental
properties in Israel'
|
Offices'
|
|
8.2%
|
8.1%
|
|
|
Commercial
use'
|
|
7.8%
|
7.8%
|
|
|
Industrial
use'
|
|
9.0%
|
8.4%
|
|
Rental
properties in U.S.A.'
|
HSBC Building
(Offices)'
|
|
5.8%
|
5.8%
|
|
|
Las Vegas
project (Offices and Commercial use)'
|
|
5.7%
|
8.75%
|
F-76
IRSA Inversiones
y Representaciones Sociedad Anónima
|
Weighted average rental value per square meter
(m2) per month, in NIS
|
|||||
|
|
|
|
2017
|
2016
|
|
|
Rental
properties in Israel
|
Offices
|
|
63 NIS/square
meters
|
62 NIS/square
meters
|
|
|
|
Commercial
use
|
|
88 NIS/square
meters
|
92 NIS/square
meters
|
|
|
|
Industrial
use
|
|
33 NIS/square
meters
|
32 NIS/square
meters
|
|
|
Rental
properties in U.S.A.
|
HSBC Building
(Offices)
|
|
337 NIS/square
meters
|
425 NIS/square
meters
|
|
|
|
Las Vegas
project (Offices and Commercial use)
|
|
114 NIS/square
meters
|
109 NIS/square
meters
|
|
For undeveloped land of the
Operations Center in Israel with a carrying amount of Ps. 2,938 and
Ps. 2,204 as of June 30, 2017 and 2016, respectively, the valuation
was determined using market comparable. These values are adjusted
for differences in key attributes such as location, size of the
property and quality of the interior design. The most significant
contribution to this comparable market approach is the price per
square meter.
For property under development in
the Operations Center of Israel with a carrying amount of Ps. 2,390
and Ps. 3,923 as of June 30, 2017 and 2016, the valuation is based
on the estimated fair value of the investment property after
completing the construction, less the present value of the
estimated construction costs expected to be incurred during
completion of construction works, considering a capitalization rate
adjusted for risks and relevant features of the
property.
Within these
assumptions for the Operations center in Israel the key ones
are:
|
Weighted
average construction cost per square meter (m2)
|
||
|
|
2017
|
2016
|
|
Properties
under development in Israel
|
5,400
NIS/square meters
|
5,230
NIS/square meters
|
|
Properties
under development in U.S.A.
|
6,537
NIS/square meters
|
8,232
NIS/square meters
|
|
|
|
|
|
Annual weighted
average discount rate
|
||
|
|
2017
|
2016
|
|
Properties
under development in Israel
|
8.1%
|
8.50%
|
|
Properties
under development in U.S.A.
|
8.75%
|
8.75%
|
There were no changes to the
valuation techniques during the presented years.
Sensitivity of
unobservable assumptions:
|
|
Discount
rate
+
1%
|
Discount
rate
-1%
|
|
2017
|
(6,607
)
|
8,794
|
|
2016
|
(4,964
)
|
6,565
|
F-77
IRSA Inversiones
y Representaciones Sociedad Anónima
11.
Property, plant and
equipment
Changes in the Group’s
property, plant and equipment for the years ended June 30, 2017,
2016 and 2015 were as follows:
|
|
Buildings
and facilities (iii) (iv)
|
Machinery
and equipment
|
Communication
networks
|
Others
(i)
|
Total
|
|
At July
1st, 2014:
|
|
|
|
|
|
|
Costs
|
463
|
97
|
-
|
18
|
578
|
|
Accumulated
depreciation
|
(267
)
|
(80
)
|
-
|
(12
)
|
(359
)
|
|
Net book
amount at July 1, 2014 (recast)
|
196
|
17
|
-
|
6
|
219
|
|
Year
ended June 30, 2015:
|
|
|
|
|
|
|
Additions
|
17
|
23
|
-
|
6
|
46
|
|
Transfers of investment
properties
|
(8
)
|
5
|
-
|
4
|
1
|
|
Depreciation charges
(ii)
|
(18
)
|
(9
)
|
-
|
(2
)
|
(29
)
|
|
Balance
at June 30, 2015 (recast)
|
187
|
36
|
-
|
14
|
237
|
|
Costs
|
472
|
125
|
-
|
28
|
625
|
|
Accumulated
depreciation
|
(285
)
|
(89
)
|
-
|
(14
)
|
(388
)
|
|
Net book
amount at June 30, 2015 (recast)
|
187
|
36
|
-
|
14
|
237
|
|
Year
ended June 30, 2016:
|
|
|
|
|
|
|
Assets incorporated by
business combination (Note 4)
|
8,224
|
1,719
|
3,536
|
1,625
|
15,104
|
|
Additions
|
379
|
291
|
310
|
193
|
1,173
|
|
Impairment
|
(23
)
|
-
|
(3
)
|
-
|
(26
)
|
|
Cumulative translation
adjustment
|
4,837
|
1,018
|
2,034
|
894
|
8,783
|
|
Transfers to investment
properties
|
(57
)
|
-
|
-
|
-
|
(57
)
|
|
Depreciation charges
(ii)
|
(274
)
|
(251
)
|
(467
)
|
(173
)
|
(1,165
)
|
|
Balance
at June 30, 2016 (recast)
|
13,273
|
2,813
|
5,410
|
2,553
|
24,049
|
|
Costs
|
13,886
|
3,203
|
5,974
|
2,776
|
25,839
|
|
Accumulated
depreciation
|
(613
)
|
(390
)
|
(564
)
|
(223
)
|
(1,790
)
|
|
Net book
amount at June 30, 2016 (recast)
|
13,273
|
2,813
|
5,410
|
2,553
|
24,049
|
|
Year
ended June 30, 2017:
|
|
|
|
|
|
|
Additions
|
737
|
634
|
711
|
669
|
2,751
|
|
Disposals
|
(4
)
|
(8
)
|
(23
)
|
(206
)
|
(241
)
|
|
Reclassification to assets
held for sale
|
(28
)
|
(16
)
|
-
|
(1,513
)
|
(1,557
)
|
|
Impairment /
recovery
|
12
|
-
|
-
|
-
|
12
|
|
Cumulative translation
adjustment
|
2,948
|
627
|
1,148
|
290
|
5,013
|
|
Transfers from / to
investment properties
|
(156
)
|
-
|
-
|
-
|
(156
)
|
|
Depreciation charges
(ii)
|
(627
)
|
(588
)
|
(1,084
)
|
(459
)
|
(2,758
)
|
|
Balance
at June 30, 2017
|
16,155
|
3,462
|
6,162
|
1,334
|
27,113
|
|
Costs
|
17,573
|
4,614
|
8,156
|
1,973
|
32,316
|
|
Accumulated
depreciation
|
(1,418
)
|
(1,152
)
|
(1,994
)
|
(639
)
|
(5,203
)
|
|
Net book
amount at June 30, 2017
|
16,155
|
3,462
|
6,162
|
1,334
|
27,113
|
(i)
Includes furniture and fixtures, vehicles and
aircrafts which have been reclassified to held for sale. (See Note
4)
(ii)
As of June 30, 2017, 2016 and 2015, depreciation
charges of property, plant and equipment were recognized: Ps.
1,522, Ps. 591 and Ps. 23 in "Costs", Ps. 251, Ps. 121 and Ps. 6 in
"General and administrative expenses" and Ps. 889, Ps. 412 and Ps.
0 in "Selling expenses", respectively in the Statements of Income,
(Note 24). In addition, a depreciation charge in the amount of Ps.
96 and Ps. 41, was recognized in "discontinued operations" as of
June 30, 2017 and 2016, respectively.
(iii)
Properties include Sheraton Libertador which has
been mortgaged to guarantee certain Group's borrowings for a total
amount of Ps. 29.5, Ps. 28.2 and Ps. 31.4 as of June 30, 2017, 2016
and 2015, respectively.
F-78
IRSA Inversiones
y Representaciones Sociedad Anónima
12.
Trading
properties
Changes in the Group’s trading
properties for the fiscal years ended June 30, 2017, 2016 and 2015
were as follows:
|
|
Completed
properties
|
Properties
under development (i)
|
Undeveloped
sites
|
Total
|
|
At July
1st, 2014 (recast)
|
6
|
119
|
11
|
136
|
|
Additions
|
-
|
1
|
-
|
1
|
|
Cumulative translation
adjustment
|
-
|
(6
)
|
-
|
(6
)
|
|
Transfers of investment
properties
|
-
|
-
|
15
|
15
|
|
Disposals
|
(2
)
|
-
|
-
|
(2
)
|
|
At June
30, 2015 (recast)
|
4
|
114
|
26
|
144
|
|
Additions
|
51
|
290
|
13
|
354
|
|
Assets incorporated by
business combination (Note 4)
|
108
|
1,724
|
824
|
2,656
|
|
Cumulative translation
adjustment
|
74
|
1,121
|
457
|
1,652
|
|
Transfer
|
-
|
142
|
(142
)
|
-
|
|
Transfers of investment
properties
|
-
|
293
|
24
|
317
|
|
Disposals
|
(1
)
|
(151
)
|
-
|
(152
)
|
|
At June
30, 2016 (recast)
|
236
|
3,533
|
1,202
|
4,971
|
|
Additions
|
2
|
1,188
|
39
|
1,229
|
|
Cumulative translation
adjustment
|
152
|
652
|
167
|
971
|
|
Transfers
|
1,101
|
(687
)
|
(414
)
|
-
|
|
Transfers of intangible
assets
|
13
|
-
|
-
|
13
|
|
Transfers of investment
properties
|
-
|
-
|
14
|
14
|
|
Disposals
|
(703
)
|
(714
)
|
-
|
(1,417
)
|
|
At June
30, 2017
|
801
|
3,972
|
1,008
|
5,781
|
|
|
June
30, 2017
|
June
30, 2016 (recast)
|
June
30, 2015 (recast)
|
|
Non-current
|
4,532
|
4,730
|
141
|
|
Current
|
1,249
|
241
|
3
|
|
Total
|
5,781
|
4,971
|
144
|
(i) Include Zetol plot of land
and Vista al Muelle, which have been mortgaged to secure Group's
borrowings. The net book value amounted to Ps. 190, Ps. 156 and Ps.
106 as of June 30, 2017, 2016 and 2015, respectively. Additionally,
the Group has contractual obligations not provisioned related to
these plot of lands committed when certain properties were acquired
or real estate projects were approved, and amounts to Ps. 120, Ps.
120 and Ps. 71, respectively. Both projects are expected to be
completed in 2029.
F-79
IRSA Inversiones
y Representaciones Sociedad Anónima
13.
Intangible
assets
Changes in the Group’s
intangible assets for the years ended June 30, 2017, 2016 and 2015
were as follows:
|
|
Goodwill
|
Trademarks
|
Licenses
|
Customer
relations
|
Information
systems and software
|
Contracts
and others (ii) (iii)
|
Total
|
|
At July
1st, 2014:
|
|
|
|
|
|
|
|
|
Costs
|
6
|
-
|
-
|
-
|
18
|
118
|
142
|
|
Accumulated
amortization
|
-
|
-
|
-
|
-
|
(17
)
|
(1
)
|
(18
)
|
|
Net book
amount at July 1st, 2014 (recast)
|
6
|
-
|
-
|
-
|
1
|
117
|
124
|
|
Year
ended June 30, 2015
|
|
|
|
|
|
|
|
|
Additions
|
-
|
-
|
-
|
-
|
-
|
5
|
5
|
|
Amortization charges
(i)
|
-
|
-
|
-
|
-
|
-
|
(2
)
|
(2
)
|
|
Balance
at June 30, 2015 (recast)
|
6
|
-
|
-
|
-
|
1
|
120
|
127
|
|
Costs
|
6
|
-
|
-
|
-
|
19
|
123
|
148
|
|
Accumulated
amortization
|
-
|
-
|
-
|
-
|
(18
)
|
(3
)
|
(21
)
|
|
Net book
amount at June 30, 2015 (recast)
|
6
|
-
|
-
|
-
|
1
|
120
|
127
|
|
Year
ended June 30, 2016
|
|
|
|
|
|
|
|
|
Additions
|
-
|
-
|
-
|
-
|
134
|
-
|
134
|
|
Assets incorporated by
business combination (Note 4)
|
1,391
|
2,131
|
515
|
2,474
|
635
|
848
|
7,994
|
|
Cumulative translation
adjustment
|
817
|
1,243
|
292
|
1,327
|
362
|
455
|
4,496
|
|
Amortization charges
(i)
|
-
|
(19
)
|
(48
)
|
(582
)
|
(184
)
|
(155
)
|
(988
)
|
|
Balance
at June 30, 2016 (recast)
|
2,214
|
3,355
|
759
|
3,219
|
948
|
1,268
|
11,763
|
|
Costs
|
2,214
|
3,378
|
817
|
3,923
|
1,189
|
1,458
|
12,979
|
|
Accumulated
amortization
|
-
|
(23
)
|
(58
)
|
(704
)
|
(241
)
|
(190
)
|
(1,216
)
|
|
Net book
amount at June 30, 2016 (recast)
|
2,214
|
3,355
|
759
|
3,219
|
948
|
1,268
|
11,763
|
|
Year
ended June 30, 2017
|
|
|
|
|
|
|
|
|
Additions
|
-
|
-
|
-
|
-
|
582
|
30
|
612
|
|
Disposals
|
-
|
-
|
-
|
-
|
-
|
(52
)
|
(52
)
|
|
Reclassification previous
periods (Note 2.27)
|
31
|
-
|
-
|
-
|
-
|
-
|
31
|
|
Transfers to assets held
for sale
|
-
|
(81
)
|
-
|
(36
)
|
(21
)
|
(44
)
|
(182
)
|
|
Transfers to trading
properties
|
-
|
-
|
-
|
-
|
-
|
(13
)
|
(13
)
|
|
Assets incorporated by
business combination (Note 4)
|
26
|
-
|
-
|
-
|
-
|
-
|
26
|
|
Cumulative translation
adjustment
|
507
|
732
|
148
|
494
|
233
|
170
|
2,284
|
|
Amortization
charges
|
-
|
(52
)
|
(115
)
|
(1,115
)
|
(453
)
|
(347
)
|
(2,082
)
|
|
Balance
at June 30, 2017
|
2,778
|
3,954
|
792
|
2,562
|
1,289
|
1,012
|
12,387
|
|
Costs
|
2,778
|
4,029
|
1,002
|
4,746
|
2,103
|
1,659
|
16,317
|
|
Accumulated
amortization
|
-
|
(75
)
|
(210
)
|
(2,184
)
|
(814
)
|
(647
)
|
(3,930
)
|
|
Net book
amount at June 30, 2017
|
2,778
|
3,954
|
792
|
2,562
|
1,289
|
1,012
|
12,387
|
(i)
Amortization
charge was recognized in the amount of Ps. 487, Ps. 191 and Ps. 2
under "Costs", in the amount of Ps. 333, Ps. 154 and Ps. 0 under
"General and administrative expenses" and Ps. 1,231, Ps. 615 and
Ps. 0 under "Selling expenses" as of June 30, 2017, 2016 and 2015,
respectively in the Statements of Income (Note 24). In addition, a
charge of Ps. 31 and Ps. 28 was recognized under "discontinued
operations" as of June 30, 2017 and 2016,
respectively.
(ii)
Includes "Rights of use". Corresponds to
Distrito Arcos.
(iii)
Includes "Right to receive future units under
barter agreements". Corresponds to receivables in kind representing
the right to receive residential apartments in the future under
barter agreements. Caballito: On June 29, 2011, the Group and TGLT
entered into a barter agreement in the amount of US$ 12.8. In 2013,
a neighborhood association secured a preliminary injunction which
suspended the works to be carried out by TGLT in the property and
started a claim against GCBA and TGLT. As a consequence of the
unfavorable rulings rendered by lower courts and appellate courts
in the cited proceeding, the Group and TGLT reached a settlement
agreement dated December 30 2016, whereby they agree to provide a
deed for the revocation of the barter agreement, after TGLT
resolves certain issues. Consequently, the Group has decided to
deregister the intangible asset related to this transaction, thus
recognizing a loss of Ps. 27.7.
F-80
IRSA Inversiones
y Representaciones Sociedad Anónima
14.
Financial instruments by
category
The note shows the financial assets
and financial liabilities by category and a reconciliation to the
corresponding line in the Consolidated Statements of Financial
Position, as appropriate. Since the line items “Trade and
other receivables” and “Trade and other payables”
contain both financial instruments and non-financial assets or
liabilities (such as prepayments, trade payables in-kind and tax
receivables and payables), the reconciliation is shown in the
columns headed “Non-financial assets” and
“Non-financial liabilities”. Financial assets and
liabilities measured at fair value are assigned based on their
different levels in the fair value hierarchy.
IFRS 9 defines the fair value of a
financial instrument as the amount for which an asset could be
exchanged, or a financial liability settled, between knowledgeable,
willing parties in an arm’s length transaction. All financial
instruments recognized at fair value are allocated to one of the
valuation hierarchy levels of IFRS 7. This valuation hierarchy
provides for three levels.
In the case of Level 1, valuation is
based on quoted prices (unadjusted) in active markets for identical
assets and liabilities that the Company can refer to at the date of
valuation. In the case of Level 2, fair value is determined by
using valuation methods based on inputs directly or indirectly
observable in the market. If the financial instrument concerned has
a fixed contract period, the inputs used for valuation must be
observable for the whole of this period. In the case of Level 3,
the Group uses valuation techniques not based on inputs observable
in the market. This is only permissible insofar as no market data
are available. The inputs used reflect the Group’s
assumptions regarding the factors which market players would
consider in their pricing.
The Group’s Finance Division
has a team in place in charge of estimating valuation of financial
assets required to be reported in the Consolidated Financial
Statements, including the fair value of Level-3 instruments. The
team directly reports to the Chief Financial Officer ("CFO"). The
CFO and the valuation team discuss the valuation methods and
results upon the acquisition of an asset and, as of the end of each
reporting period.
According to the Group’s
policy, transfers among the several categories of valuation are
recognized when occurred, or when there are changes in the
prevailing circumstances requiring the transfer.
Financial assets and financial
liabilities as of June 30, 2017 are as follows:
|
|
Financial
assets at amortized cost (i)
|
Financial
assets at fair value through profit or loss
|
Subtotal
financial assets
|
Non-financial
assets
|
Total
|
||
|
|
|
Level
1
|
Level
2
|
Level
3
|
|
|
|
|
June 30,
2017
|
|
|
|
|
|
|
|
|
Assets
as per Statement of Financial Position
|
|
|
|
|
|
|
|
|
Trade and other receivables
(excluding the allowance for doubtful accounts and other
receivables)
|
16,575
|
-
|
-
|
2,156
|
18,731
|
3,819
|
22,550
|
|
Investments in financial
assets:
|
|
|
|
|
|
|
|
|
- Public
companies’ securities
|
-
|
1,665
|
-
|
82
|
1,747
|
-
|
1,747
|
|
- Private
companies’ securities
|
-
|
16
|
-
|
964
|
980
|
-
|
980
|
|
-
Deposits
|
1,235
|
13
|
-
|
-
|
1,248
|
-
|
1,248
|
|
- Mutual
funds
|
-
|
3,855
|
-
|
-
|
3,855
|
-
|
3,855
|
|
-
Bonds
|
-
|
4,719
|
425
|
-
|
5,144
|
-
|
5,144
|
|
-
Others
|
-
|
749
|
-
|
-
|
749
|
-
|
749
|
|
Derivative financial
instruments:
|
|
|
|
|
|
|
|
|
-
Warrants
|
-
|
-
|
26
|
-
|
26
|
-
|
26
|
|
-
Foreign-currency future contracts
|
-
|
-
|
27
|
-
|
27
|
-
|
27
|
|
-
Swaps
|
-
|
-
|
29
|
-
|
29
|
-
|
29
|
|
Restricted
assets
|
954
|
-
|
-
|
-
|
954
|
-
|
954
|
|
Financial assets held for
sale:
|
|
|
|
|
|
|
|
|
-
Clal
|
-
|
8,562
|
-
|
-
|
8,562
|
-
|
8,562
|
|
Cash and cash
equivalents:
|
|
|
|
|
|
|
|
|
- Cash at bank
and on hand
|
8,529
|
-
|
-
|
-
|
8,529
|
-
|
8,529
|
|
- Short-term
investments
|
14,510
|
1,815
|
-
|
-
|
16,325
|
-
|
16,325
|
|
Total
assets
|
41,803
|
21,394
|
507
|
3,202
|
66,906
|
3,819
|
70,725
|
|
|
|
|
|
|
|
|
|
F-81
IRSA Inversiones
y Representaciones Sociedad Anónima
|
|
Financial
liabilities at amortized cost (i)
|
Financial
liabilities at fair value through profit or loss
|
Subtotal
financial liabilities
|
Non-financial
liabilities
|
Total
|
||
|
|
|
Level
1
|
Level
2
|
Level
3
|
|
|
|
|
June 30,
2017
|
|
|
|
|
|
|
|
|
Liabilities
as per Statement of Financial Position
|
|
|
|
|
|
|
|
|
Trade and other
payables
|
16,166
|
-
|
-
|
-
|
16,166
|
7,713
|
23,879
|
|
Borrowings (excluding
finance leases)
|
129,412
|
-
|
-
|
-
|
129,412
|
-
|
129,412
|
|
Derivative financial
instruments:
|
|
|
|
|
|
|
|
|
-
Foreign-currency future contracts
|
-
|
-
|
5
|
-
|
5
|
-
|
5
|
|
-
Forwards
|
-
|
5
|
152
|
10
|
167
|
-
|
167
|
|
Total
liabilities
|
145,578
|
5
|
157
|
10
|
145,750
|
7,713
|
153,463
|
(i)
The fair value of financial assets and
liabilities at their amortized cost does not differ significantly
from their book value, except for borrowings (Note
20).
Financial assets and financial
liabilities as of June 30, 2016 were as follows:
|
|
Financial
assets at amortized cost (i)
|
Financial
assets at fair value through profit or loss
|
Subtotal
financial assets
|
Non-financial
assets
|
Total
|
||
|
|
|
Level
1
|
Level
2
|
Level
3
|
|
|
|
|
June 30,
2016 (recast)
|
|
|
|
|
|
|
|
|
Assets
as per Statement of Financial Position
|
|
|
|
|
|
|
|
|
Trade and other receivables
(excluding the allowance for doubtful accounts and other
receivables)
|
12,718
|
-
|
-
|
1,931
|
14,649
|
2,374
|
17,023
|
|
Investments in financial
assets:
|
|
|
|
|
|
|
|
|
- Public
companies’ securities
|
-
|
1,369
|
-
|
499
|
1,868
|
-
|
1,868
|
|
- Private
companies’ securities
|
-
|
-
|
15
|
1,324
|
1,339
|
-
|
1,339
|
|
-
Deposits
|
1,172
|
12
|
-
|
-
|
1,184
|
-
|
1,184
|
|
- Mutual
funds
|
-
|
2,775
|
-
|
-
|
2,775
|
-
|
2,775
|
|
-
Bonds
|
121
|
4,365
|
-
|
-
|
4,486
|
-
|
4,486
|
|
- Others
|
-
|
90
|
-
|
140
|
230
|
-
|
230
|
|
Derivative financial
instruments:
|
|
|
|
|
|
|
|
|
-
Swaps
|
-
|
12
|
-
|
-
|
12
|
-
|
12
|
|
-
Others
|
-
|
-
|
15
|
-
|
15
|
-
|
15
|
|
Restricted
assets
|
618
|
-
|
-
|
-
|
618
|
-
|
618
|
|
Financial assets held for
sale
|
|
|
|
|
|
|
|
|
-
Clal
|
-
|
4,602
|
-
|
-
|
4,602
|
-
|
4,602
|
|
Cash and cash
equivalents:
|
|
|
|
|
|
|
|
|
- Cash at bank
and on hand
|
6,214
|
-
|
-
|
-
|
6,214
|
-
|
6,214
|
|
- Short-term
investments
|
-
|
7,652
|
-
|
-
|
7,652
|
-
|
7,652
|
|
Total
assets
|
20,843
|
20,877
|
30
|
3,894
|
45,644
|
2,374
|
48,018
|
|
|
Financial
liabilities at amortized cost (i)
|
Financial
liabilities at fair value through profit or loss
|
Subtotal
financial liabilities
|
Non-financial
liabilities
|
Total
|
||
|
|
|
Level
1
|
Level
2
|
Level
3
|
|
|
|
|
June 30,
2016 (recast)
|
|
|
|
|
|
|
|
|
Liabilities
as per Statement of Financial Position
|
|
|
|
|
|
|
|
|
Trade and other
payables
|
18,399
|
-
|
-
|
-
|
18,399
|
993
|
19,392
|
|
Borrowings (excluding
finance leases)
|
101,928
|
-
|
-
|
10,999
|
112,927
|
-
|
112,927
|
|
Derivative financial
instruments
|
|
|
|
|
|
|
|
|
-
Forwards
|
-
|
198
|
-
|
-
|
198
|
-
|
198
|
|
-
Foreign-currency future contracts
|
-
|
16
|
3
|
-
|
19
|
-
|
19
|
|
Total
liabilities
|
120,327
|
214
|
3
|
10,999
|
131,543
|
993
|
132,536
|
(i)
The
fair value of financial assets and liabilities at their amortized
cost does not differ significantly from their book value, except
for borrowings (Note 20).
F-82
IRSA Inversiones
y Representaciones Sociedad Anónima
Financial assets and financial
liabilities as of June 30, 2015 were as follows:
|
|
Financial
assets at amortized cost (i)
|
Financial
assets at fair value
through
profit or loss
|
Subtotal
financial assets
|
Non-financial
assets
|
Total
|
||
|
|
|
Level
1
|
Level
2
|
Level
3
|
|
|
|
|
June 30,
2015 (recast)
|
|
|
|
|
|
|
|
|
Assets
as per Statement of Financial Position
|
|
|
|
|
|
|
|
|
IDBD (ii)
|
-
|
-
|
-
|
908
|
908
|
-
|
908
|
|
Trade and other receivables
(excluding the allowance for doubtful accounts and other
receivables)
|
1,154
|
-
|
-
|
-
|
1,154
|
199
|
1,353
|
|
Investments in financial
assets:
|
|
|
|
|
|
|
|
|
- Public
companies’ securities
|
-
|
88
|
-
|
349
|
437
|
-
|
437
|
|
- Private
companies’ securities
|
-
|
-
|
-
|
102
|
102
|
-
|
102
|
|
- Mutual
funds
|
-
|
145
|
-
|
-
|
145
|
-
|
145
|
|
-
Bonds
|
210
|
104
|
-
|
-
|
314
|
-
|
314
|
|
Derivative financial
instruments
|
|
|
|
|
|
|
|
|
-
Warrants
|
-
|
228
|
-
|
7
|
235
|
-
|
235
|
|
-
Others
|
-
|
-
|
-
|
-
|
-
|
-
|
-
|
|
Restricted
assets
|
9
|
-
|
-
|
-
|
9
|
-
|
9
|
|
Cash and cash
equivalents
|
|
|
|
|
|
|
|
|
- Cash at bank
and on hand
|
373
|
-
|
-
|
-
|
373
|
-
|
373
|
|
- Short-term
investments
|
-
|
2
|
-
|
-
|
2
|
-
|
2
|
|
Total
|
1,746
|
567
|
-
|
1,366
|
3,679
|
199
|
3,878
|
|
|
Financial
liabilities at amortized cost
|
Financial
liabilities at fair value
|
Subtotal
financial liabilities
|
Non-financial
liabilities
|
Total
|
||
|
|
|
Level
1
|
Level
2
|
Level
3
|
|
|
|
|
June 30,
2015 (recast)
|
|
|
|
|
|
|
|
|
Liabilities
as per Statement of Financial Position
|
|
|
|
|
|
|
|
|
Trade and other
payables
|
461
|
-
|
-
|
-
|
461
|
690
|
1,151
|
|
Borrowings
|
4,958
|
-
|
-
|
15
|
4,973
|
-
|
4,973
|
|
Derivative financial
instruments
|
|
|
|
|
|
|
|
|
- Tender
offer
|
-
|
-
|
-
|
503
|
503
|
-
|
503
|
|
Total
|
5,419
|
-
|
-
|
518
|
5,937
|
690
|
6,627
|
(i)
The fair value of financial assets and
liabilities at their amortized cost does not differ significantly
from their book value, except for the borrowings (Note
20).
(ii)
As described in Note 4 until acquiring control
over IDBD, the Group stated its equity interest in IDBD as an
associate measured at fair value, invoking the exception under IAS
28 and the warrants to acquire IDBD’s common shares were
booked at their quoted prices. Since October 11, 2015, as result of
consolidation, the equity interest in IDBD as an associate and the
warrants were eliminated following the consolidation to add
IDBD’s assets and liabilities on a line-by-line
basis.
Liabilities carried at amortized
cost also include liabilities under finance leases where the Group
is the lessee and which therefore have to be measured in accordance
with IAS 17 “Leases”. The categories disclosed are
determined by reference to IFRS 9. Finance leases are excluded from
the scope of IFRS 7 “Financial Instruments
Disclosures”. Therefore, finance leases have been shown
separately.
The following are details of the
book value of financial instruments recognized, which were offset
in the statements of financial position:
|
|
As of June
30, 2017
|
||
|
|
Gross
amounts recognized
|
Gross amounts
offset
|
Net amount
presented
|
|
As of June 30,
2017
|
|
|
|
|
Financial assets
|
|
|
|
|
Trade and other
receivables (excluding the allowance for doubtful accounts and
other receivables) (Note 15)
|
19,602
|
(871
)
|
18,731
|
|
Financial
liabilities
|
|
|
|
|
Trade and other
payables (Note 18)
|
15,295
|
871
|
16,166
|
|
|
As of June
30, 2016 (recast)
|
||
|
|
Gross
amounts recognized
|
Gross amounts
offset
|
Net amount
presented
|
|
As of June 30,
2016
|
|
|
|
|
Financial assets
|
|
|
|
|
Trade and other
receivables (excluding the allowance for doubtful accounts and
other receivables) (Note 15)
|
15,949
|
(1,300
)
|
14,649
|
|
Financial
liabilities
|
|
|
|
|
Trade and other
payables (Note 18)
|
17,099
|
1,300
|
18,399
|
F-83
IRSA Inversiones y Representaciones Sociedad
Anónima
|
|
As of June
30, 2015 (recast)
|
||
|
|
Gross
amounts recognized
|
Gross amounts
offset
|
Net amount
presented
|
|
As of June 30,
2015
|
|
|
|
|
Financial assets
|
|
|
|
|
Trade and other
receivables (excluding the allowance for doubtful accounts and
other receivables) (Note 15)
|
1,229
|
(75
)
|
1,154
|
|
Financial
liabilities
|
|
|
|
|
Trade and other
payables (Note 18)
|
(536
)
|
75
|
(461
)
|
Income, expense, gains and losses on
financial instruments can be assigned to the following
categories:
|
|
Financial
assets / liabilities at amortized cost
|
Financial
assets / liabilities at fair value through profit or
loss
|
Total
|
|
June 30,
2017
|
|
|
|
|
Interest income
(i)
|
848
|
-
|
848
|
|
Interest expense
(i)
|
(6,474
)
|
-
|
(6,474
)
|
|
Foreign exchange (losses) /
gains, net (i)
|
(1,079
)
|
4
|
(1,075
)
|
|
Dividend income
(i)
|
33
|
35
|
68
|
|
Fair value gain on
financial assets at fair value through profit or loss
(i)
|
-
|
2,859
|
2,859
|
|
(Loss) / Gain on derivative
financial instruments, net (i)
|
(46
)
|
116
|
70
|
|
Other finance costs
(i)
|
(914
)
|
-
|
(914
)
|
|
Net
(loss) / income
|
(7,632
)
|
3,014
|
(4,618
)
|
|
|
Financial
assets / liabilities at amortized cost
|
Financial
assets / liabilities at fair value through profit or
loss
|
Total
|
|
June
30, 2016 (recast)
|
|
|
|
|
Interest income
(i)
|
651
|
-
|
651
|
|
Interest expense
(i)
|
(2,339
)
|
(23
)
|
(2,362
)
|
|
Foreign exchange (loss) /
gain, net (i)
|
(2,066
)
|
6
|
(2,060
)
|
|
Dividend income
(i)
|
-
|
72
|
72
|
|
Fair value loss on
financial assets at fair value through profit or loss
(i)
|
-
|
(1,439
)
|
(1,439
)
|
|
Gain on derivative
financial instruments, net (i)
|
-
|
921
|
921
|
|
Other finance costs
(i)
|
(567
)
|
(106
)
|
(673
)
|
|
Fair value loss on
associates (ii)
|
-
|
79
|
79
|
|
Net
loss
|
(4,321
)
|
(490
)
|
(4,811
)
|
|
|
Financial
assets / liabilities at amortized cost
|
Financial
assets / liabilities at fair value through profit or
loss
|
Total
|
|
June
30, 2015 (recast)
|
|
|
|
|
Interest income
(i)
|
61
|
5
|
66
|
|
Interest expense
(i)
|
(628
)
|
-
|
(628
)
|
|
Foreign exchange (losses) /
gains, net (i)
|
(354
)
|
-
|
(354
)
|
|
Dividend income
(i)
|
-
|
17
|
17
|
|
Fair value gain on
financial assets at fair value through profit or loss
(i)
|
-
|
53
|
53
|
|
Loss on derivative
financial instruments, net (i)
|
-
|
(16
)
|
(16
)
|
|
Other finance costs
(i)
|
(71
)
|
-
|
(71
)
|
|
Fair value loss on
associates (ii)
|
-
|
(1,001
)
|
(1,001
)
|
|
Net
loss
|
(992
)
|
(942
)
|
(1,934
)
|
(i)
Included within “Financial results,
net“ in the Statements of Income.
(ii)
Included in “Share of profit / (loss) of
joint ventures and associates” in the Statement of
Income.
F-84
IRSA Inversiones
y Representaciones Sociedad Anónima
Clal
Clal is a holding company that
mainly operates in the insurance and pension markets and in
segments of pension funds. The company holds assets and other
businesses (such as insurance agencies) and is one of the largest
insurance groups in Israel. Clal mainly develops its activities in
three operating segments: long-term savings, general insurance and
health insurance.
Given that IDBD failed to meet the
requirements set forth to have control over an insurance company,
on August 21, 2013, the Commissioner required that IDBD granted an
irrevocable power of attorney to Mr. Moshe Tery ("the Trustee") for
the 51% of the shareholding capital and vote interests in Clal,
thus transferring control over that investee. From such date, IDBD
recognized its equity interest in Clal as a financial asset held
for sale, at fair value through profit or loss.
On December 30, 2014, the
Commissioner sent an additional letter setting a term by which
IDBD’s control over and equity interests in Clal were to be
sold and giving directions as to the Trustee’s continuity in
office, among other aspects.
The sale arrangement outlined in the
letter involves IDBD’s and the Trustee’s interests in
the sale process under different options and timeframes. The
current sale arrangement involved the sale of the interest in the
stock exchange or by over-the-counter trades, as per the following
detail and by the following dates:
a.
Sell at least 5% of its equity interest in Clal,
since May 7, 2016.
b.
Sell at least an additional 5% of its equity
interest in Clal, during each of the subsequent four-month
periods.
c.
If IDBD sells more than 5% of its equity
interest in Clal in any given four-month period, the percentage in
excess of the required 5% would be offset against the percentage
required in the following period.
In case IDBD does not fulfills its
obligation in the manner described in the above paragraph the
Trustee is entitled to act upon the specified arrangement in lieu
of IDBD, pursuant to all powers that had been vested under the
representations of the trust letter. The consideration for the sale
would be transferred to IDBD, with the expenses incurred in the
sale process to be solely borne by IDBD.
During February 2016, bondholders
and minority shareholders as of that date, filed a complaint
against the Commissioner so that the order by the Administrator to
sell the shares in the market was revoked, for this would cause
irreversible damage to the company and its bondholders. As of the
date of these Consolidated Financial Statements, no decision has
been rendered on the complaint.
On April 5,
2017, the District Court of Tel Aviv-Jaffa ordered the Trustee to
sell 5% of Clal’s shares managed by him/her within a term of
30 days, pursuant to the decision and the petition filed by the
Commissioner.
The Court
considered that the Commissioner acted fairly and proportionately
in ordering such sale, that such sale should be made at the best
possible price and that, after completing it, the Commissioner
should use its discretionary power and examine the circumstances of
the case in ordering any new sales.
On May 1, 2017
IDBD agreed to sell the 5% of Clal’s shares jointly with a
swap transaction. Hence, the shares were sold on May 4 without any
type of encumbrances, at a price of NIS 59.86 each (i.e., for a
total of roughly NIS 166, equivalent to nearly Ps. 697 at the
exchange rate prevailing on that date). Such request had the
consent of the Trustee and a statement from the Commissioner
stating that such body does not object to the swap
transaction.
Concurrently
with the sale, IDBD entered into a swap transaction with a banking
institution whereby the former will charge or pay for the
difference between the sale value of the shares above described and
the value such shares will have at the time they are sold to the
third-party buyer upon the lapse of a 24-month period. IDBD cannot
repurchase such shares.
F-85
IRSA Inversiones y Representaciones Sociedad
Anónima
IDBD continues
to evaluate courses of action with regard to the District
Court’s pronouncement, including the possibility to file a
motion for appeal.
Based on the
terms and conditions of the swap contract, IDBD maintains the major
risks and benefits of all of Clal shares; as a result, as of June
30, 2017, all of Clal shares were reported as a financial asset
available for sale and a liability in the amount of Ps. 783.
Valuation of mentioned shares as of June 30, 2017 and 2016 amounts
to Ps. 8,562, and Ps. 4,602 respectively, and a gain of Ps. 2,513
has been recorded in 2017 and a loss of Ps. 1,951 has been recorded
in 2016, reflecting the increase/decrease in the market price, in
financial results, net, in "fair value gain/loss of financial
assets and liabilities at fair value through profit or loss,
net".
The Group uses a range of valuation
models for the measurement of Level 2 and Level 3 instruments,
details of which may be obtained from the following table. When no
quoted prices are available in an active market, fair values
(particularly with derivatives) are based on recognized valuation
methods.
|
Description
|
Pricing
model / method
|
Parameters
|
Fair
value hierarchy
|
Range
|
|
Trade and other receivables
-. Cellcom
|
Discounted cash
flows
|
Discount interest
rate.
|
Level 3
|
3.3
|
|
Interest rate
swaps
|
Cash flows - Theoretical
price
|
Interest rate futures
contracts and cash flows
|
Level 2
|
-
|
|
Preferred shares of
Condor
|
Binomial tree –
Theoretical price I
|
Underlying asset price
(Market price); share price volatility (historical) and market
interest rate (Libor rate curve).
|
Level 3
|
Underlying
asset price 1.8 to 2.2
Share
price volatility 58% to 78%
Market
interest-rate
1.7% to
2.1%
|
|
Promissory
note
|
Discounted cash flows -
Theoretical price
|
Market interest-rate (Libor
rate curve)
|
Level 3
|
Market
interest-rate
1.8% to
2.2%
|
|
Warrants of
Condor
|
Black-Scholes –
Theoretical price
|
Underlying asset price
(Market price); share price volatility (historical) and market
interest rate (Libor rate curve).
|
Level 2
|
Underlying
asset price 1.8 to 1.7
Share
price volatility 58% to 78%
Market
interest-rate
1.7% to
2.1%
|
|
Call option of
Arcos
|
Discounted cash
flows
|
Projected revenues and
discounting rate.
|
Level 3
|
-
|
|
Investments in financial
assets - Other private companies’ securities
|
Cash flow / NAV -
Theoretical price
|
Projected revenue
discounted at the discount rate
The value is
calculated in accordance with shares in the equity funds on the
basis of their Financial Statements, based on fair value or
investments assessments.
|
Level 3
|
1 - 3.5
|
|
Investments in financial
assets - Others
|
Discounted cash flows -
Theoretical price
|
Projected revenue
discounted at the discount rate
The value is
calculated in accordance with shares in the equity funds on the
basis of their Financial Statements, based on fair value or
investment assessments.
|
Level 3
|
1 - 3.5
|
|
Derivative financial
instruments - Forwards
|
Theoretical
price
|
Underlying asset price and
volatility
|
Level 2 and
3
|
-
|
As of June 30, 2017, there have been
no changes to the economic or business circumstances affecting the
fair value of the financial assets and liabilities of the
group.
F-86
IRSA Inversiones
y Representaciones Sociedad Anónima
The following table presents the
changes in Level 3 instruments as of June 30, 2017, 2016 and
2015:
|
|
Investments
in financial assets - Public companies’
Securities
|
Derivative
financial instruments
|
Investment
in associate IDBD
|
Derivative
financial instruments - Commitment to tender offer of shares in
IDBD
|
Derivative
financial instruments - Forwards
|
Investments
in financial assets - Private companies’
Securities
|
Investments
in financial assets - Others
|
Borrowings
- Non-recourse loan
|
Trade
and other receivables
|
Total
|
|
Balance
at July 1st, 2014 (recast)
|
211
|
-
|
-
|
(321
)
|
-
|
-
|
-
|
-
|
-
|
(110
)
|
|
Cumulative translation
adjustment
|
-
|
-
|
83
|
(45
)
|
-
|
-
|
-
|
19
|
-
|
57
|
|
Transfer to level
3
|
-
|
-
|
1,826
|
-
|
-
|
-
|
-
|
(86
)
|
-
|
1,740
|
|
Gain / (loss) for the
year
|
138
|
7
|
(1,001
)
|
(137
)
|
-
|
72
|
-
|
52
|
-
|
(869
)
|
|
Transfer from
associates
|
-
|
-
|
-
|
-
|
-
|
30
|
-
|
-
|
-
|
30
|
|
Balance
at June 30, 2015 (recast)
|
349
|
7
|
908
|
(503
)
|
-
|
102
|
-
|
(15
)
|
-
|
848
|
|
Additions and
acquisitions
|
50
|
-
|
-
|
-
|
-
|
27
|
-
|
-
|
-
|
77
|
|
Cumulative translation
adjustment
|
-
|
-
|
60
|
(18
)
|
-
|
291
|
52
|
(3,610
)
|
706
|
(2,519
)
|
|
Obtainment of control over
IDBD (Note 4)
|
-
|
-
|
(1,047
)
|
-
|
-
|
861
|
88
|
(7,336
)
|
1,187
|
(6,247
)
|
|
Write off
|
-
|
-
|
-
|
500
|
-
|
-
|
-
|
-
|
-
|
500
|
|
Gain / (loss) for the year
(i) (ii)
|
100
|
(7
)
|
79
|
21
|
-
|
43
|
-
|
(38
)
|
38
|
236
|
|
Balance
at June 30, 2016 (recast)
|
499
|
-
|
-
|
-
|
-
|
1,324
|
140
|
(10,999
)
|
1,931
|
(7,105
)
|
|
Additions and
acquisitions
|
65
|
-
|
-
|
-
|
(8
)
|
44
|
-
|
-
|
1,660
|
1,761
|
|
Cumulative translation
adjustment
|
21
|
-
|
-
|
-
|
(2
)
|
169
|
6
|
242
|
439
|
875
|
|
Reclassification to
liabilities held for sale (Note 4)
|
-
|
-
|
-
|
-
|
-
|
-
|
-
|
11,272
|
-
|
11,272
|
|
Write off
|
(702
)
|
-
|
-
|
-
|
66
|
-
|
(146
)
|
-
|
-
|
(782
)
|
|
Transfered to current
account receivables
|
-
|
-
|
-
|
-
|
-
|
-
|
-
|
-
|
(1,874
)
|
(1,874
)
|
|
Gain / (loss) for the year
(i)
|
199
|
-
|
-
|
-
|
(66
)
|
(573
)
|
-
|
(515
)
|
-
|
(955
)
|
|
Balance
at June 30, 2017
|
82
|
-
|
-
|
-
|
(10
)
|
964
|
-
|
-
|
2,156
|
3,192
|
(i)
Included within “Financial results,
net” in the Statements of income.
(ii)
As of June 30, 2016 includes Ps. (564) presented
within Share of profit / (loss) of joint ventures and associates
and within Financial results, net in the Statements of
Income.
During the year ended June 30, 2017
there were no transfers between levels of the fair value
hierarchy.
F-87
IRSA Inversiones
y Representaciones Sociedad Anónima
15.
Trade and other
receivables
Group’s trade and other
receivables as of June 30, 2017, 2016 and 2015 were as
follows:
|
|
June 30,
2017
|
June 30,
2016 (recast)
|
June 30,
2015 (recast)
|
|
Non-current
|
|
|
|
|
Sale, lease and services
receivables
|
2,258
|
2,015
|
62
|
|
Less: Allowance for
doubtful accounts
|
(4
)
|
(2
)
|
(2
)
|
|
Total
non-current trade receivables
|
2,254
|
2,013
|
60
|
|
Tax
receivables
|
86
|
29
|
25
|
|
Prepaid
expenses
|
1,669
|
1,320
|
11
|
|
Borrowings, deposits and
other debit balances
|
893
|
75
|
-
|
|
Others
|
72
|
4
|
19
|
|
Total
non-current other receivables
|
2,720
|
1,428
|
55
|
|
Total
non-current trade and other receivables
|
4,974
|
3,441
|
115
|
|
|
|
|
|
|
Current
|
|
|
|
|
Sale, lease and services
receivables
|
13,869
|
11,073
|
695
|
|
Less: Allowance for
doubtful accounts
|
(308
)
|
(171
)
|
(93
)
|
|
Total
current trade receivables
|
13,561
|
10,902
|
602
|
|
Tax
receivables
|
130
|
71
|
23
|
|
Prepaid
expenses
|
863
|
617
|
99
|
|
Borrowings, deposits and
other debit balances
|
1,485
|
1,243
|
330
|
|
Advances to
suppliers
|
825
|
231
|
49
|
|
Others
|
400
|
345
|
40
|
|
Total
current other receivables
|
3,703
|
2,507
|
541
|
|
Total
current trade and other receivables
|
17,264
|
13,409
|
1,143
|
|
Total
trade and other receivables
|
22,238
|
16,850
|
1,258
|
Book amounts of Group's trade and
other receivables in foreign currencies are detailed in Note
30.
The fair value of current
receivables approximates their respective carrying amounts because,
due to their short-term nature, the effect of discounting is not
considered significant. The present value of receivables related to
installment sales of communication devices, realized by Cellcom,
was calculated using a discount rate of 3.3%. The book value of
other non-current receivables is, or approximates, its fair value
on the balance sheet date. Fair value are based on discounted cash
flows (Level 3).
Trade accounts receivables are
generally presented in the Statements of Financial Position net of
allowances for doubtful accounts. Impairment policies and
procedures by type of receivables are discussed in detail in Note
2. Movements on the Group’s allowance for doubtful accounts
were as follows:
|
|
June 30,
2017
|
June 30,
2016
(recast)
|
June 30,
2015
(recast)
|
|
Beginning
of the year
|
173
|
95
|
82
|
|
Additions (i)
|
234
|
111
|
26
|
|
Recoveries (i)
|
(11
)
|
(41
)
|
(12
)
|
|
Cumulative translation
adjustment
|
182
|
12
|
-
|
|
Receivables written off
during the year as uncollectable
|
(266
)
|
(4
)
|
(1
)
|
|
End of
the year
|
312
|
173
|
95
|
(i)
The creation and release of the provision
for impaired receivables have been included in “Selling
expenses” in the Statements of Income (Note 24).
The Group’s trade receivables
comprise several classes. The maximum exposure to credit risk at
the reporting date is the carrying amount of each class of
receivables (See Note 5). The Group also has receivables from
related parties neither of which is due nor impaired.
F-88
IRSA Inversiones
y Representaciones Sociedad Anónima
Due to the distinct characteristics
of each type of receivables, an aging analysis of past due
unimpaired and impaired receivables is shown by type and class, as
of June 30, 2017, 2016 and 2015 (a column of non-past due
receivables is also included so that the totals can be reconciled
with the amounts appearing on the Statement of Financial
Position):
|
|
Past
due
|
|
|
|
|
|
||
|
|
Up to 3
months
|
From 3
to 6 months
|
Over 6
months
|
Non-past
due
|
Impaired
|
Total
|
% of
representation
|
Additions
/ (reversals) for doubtful accounts
|
|
Lease and
services
|
109
|
21
|
66
|
946
|
145
|
1,287
|
7.98
%
|
(40
)
|
|
Hotel services
|
1
|
-
|
-
|
61
|
1
|
63
|
0.39
%
|
-
|
|
Consumer
financing
|
-
|
-
|
-
|
-
|
16
|
16
|
0.10
%
|
-
|
|
Sale of properties and
developments
|
17
|
2
|
2
|
8
|
32
|
61
|
0.38
%
|
-
|
|
Sale of communication
equipment
|
182
|
-
|
-
|
4,617
|
71
|
4,870
|
30.20
%
|
(168
)
|
|
Telecommunication
services
|
482
|
-
|
143
|
2,848
|
15
|
3,488
|
21.63
%
|
-
|
|
Sale of products
(supermarkets)
|
38
|
-
|
-
|
6,228
|
76
|
6,342
|
39.33
%
|
-
|
|
Total as
of June 30, 2017
|
829
|
23
|
211
|
14,708
|
356
|
16,127
|
100
%
|
(208
)
|
|
|
|
|
|
|
|
|
|
|
|
Lease and
services
|
67
|
19
|
33
|
1,101
|
110
|
1,330
|
10.16
%
|
6
|
|
Hotel services
|
17
|
12
|
20
|
267
|
52
|
368
|
2.81
%
|
(2
)
|
|
Consumer
financing
|
-
|
-
|
-
|
-
|
15
|
15
|
0.11
%
|
1
|
|
Sale of properties and
developments
|
-
|
-
|
-
|
39
|
-
|
39
|
0.30
%
|
-
|
|
Sale of communication
equipment
|
2,250
|
-
|
-
|
1,714
|
66
|
4,030
|
30.79
%
|
-
|
|
Telecommunication
services
|
1,763
|
-
|
1,028
|
19
|
672
|
3,482
|
26.60
%
|
61
|
|
Sale of products
(supermarkets)
|
27
|
19
|
55
|
3,665
|
58
|
3,824
|
29.22
%
|
4
|
|
Total as
of June 30, 2016 (recast)
|
4,124
|
50
|
1,136
|
6,805
|
973
|
13,088
|
100
%
|
70
|
|
|
|
|
|
|
|
|
|
|
|
Lease and
services
|
43
|
14
|
16
|
567
|
80
|
720
|
95.11
%
|
14
|
|
Hotel services
|
1
|
-
|
-
|
16
|
-
|
17
|
2.25
%
|
-
|
|
Consumer
financing
|
-
|
-
|
-
|
5
|
15
|
20
|
2.64
%
|
-
|
|
Total as
of June 30, 2015 (recast)
|
44
|
14
|
16
|
588
|
95
|
757
|
100
%
|
14
|
16.
Cash flow
information
Following is a detailed description
of cash flows generated by the Group’s operations for the
years ended June 30, 2017, 2016 and 2015:
|
|
Note
|
June 30,
2017
|
June 30,
2016 (recast)
|
June 30,
2015 (recast)
|
|
Profit for the
year
|
|
5,220
|
10,078
|
2,130
|
|
(Loss) for the year from
discontinued operations
|
|
(3,018
)
|
(444
)
|
-
|
|
Adjustments
for
:
|
|
|
|
|
|
Income tax
|
21
|
2,915
|
6,373
|
1,581
|
|
Amortization and
depreciation
|
24
|
4,715
|
2,085
|
33
|
|
Loss / (profit) from
disposal of property, plant and equipment
|
|
35
|
(6
)
|
-
|
|
Change in fair value of
investment properties
|
|
(4,453
)
|
(17,559
)
|
(3,958
)
|
|
Share-based
payments
|
|
100
|
51
|
22
|
|
(Recovery) Charge for
impairment of property, plant and equipment
|
|
(12
)
|
26
|
-
|
|
Expenses from sales of
investment properties
|
|
-
|
32
|
27
|
|
Derecognition of intangible
assets by TGLT agreement
|
|
28
|
-
|
-
|
|
Result from business
combination
|
|
(8
)
|
-
|
-
|
|
Retirement of unused
investment properties
|
|
-
|
24
|
2
|
|
Gain from disposal of
associates
|
|
-
|
(4
)
|
(22
)
|
|
Other financial results,
net
|
|
4,575
|
5,081
|
934
|
|
Reversal of cumulative
translation adjustment
|
|
(41
)
|
(100
)
|
(219
)
|
|
Provisions and
allowances
|
|
113
|
191
|
75
|
|
Share of (profit) / loss of
joint ventures and associates
|
8 and 9
|
(185
)
|
(508
)
|
813
|
|
Changes in operating
assets and liabilities:
|
|
|
|
|
|
Increase in
inventories
|
|
(258
)
|
(190
)
|
(6
)
|
|
Decrease in trading
properties
|
|
510
|
202
|
-
|
|
Increase in trade and other
receivables
|
|
(1,779
)
|
(541
)
|
(400
)
|
|
Increase in trade and other
payables
|
|
1,316
|
195
|
233
|
|
Increase in salaries and
social security liabilities
|
|
150
|
23
|
22
|
|
Decrease in
provisions
|
|
(219
)
|
(143
)
|
(4
)
|
|
Net cash
generated by continuing operating activities before income tax
paid
|
|
9,704
|
4,866
|
1,263
|
|
Net cash
generated by discontinued operating activities before income tax
paid
|
|
322
|
80
|
-
|
|
Net cash
generated by operating activities before income tax
paid
|
|
10,026
|
4,946
|
1,263
|
F-89
IRSA Inversiones y Representaciones Sociedad
Anónima
The following table shows balances
incorporated as result of business combination / reclassification
of assets and liabilities held for sale:
|
|
June 30,
2017
|
June 30,
2016 (recast)
|
June 30,
2015 (recast)
|
|
Investment
properties
|
-
|
29,586
|
-
|
|
Property, plant and
equipment
|
1,712
|
15,104
|
-
|
|
Trading
properties
|
-
|
2,656
|
-
|
|
Intangible
assets
|
19
|
6,603
|
-
|
|
Investments in joint
ventures and associates
|
(74
)
|
9,268
|
-
|
|
Deferred income
tax
|
53
|
(4,681
)
|
-
|
|
Trade and other
receivables
|
591
|
9,713
|
-
|
|
Investments in financial
assets
|
-
|
5,824
|
-
|
|
Derivative financial
instruments
|
-
|
(54
)
|
-
|
|
Inventories
|
-
|
1,919
|
-
|
|
Restricted
assets
|
-
|
-
|
-
|
|
Income tax and MPIT
credits
|
-
|
91
|
-
|
|
Assets held for
sale
|
-
|
5,129
|
-
|
|
Trade and other
payables
|
(917
)
|
(19,749
)
|
-
|
|
Salaries and social
security liabilities
|
(148
)
|
-
|
-
|
|
Borrowings
|
(660
)
|
(60,306
)
|
-
|
|
Provisions
|
2
|
(969
)
|
-
|
|
Income tax and MPIT
liabilities
|
1
|
(267
)
|
-
|
|
Employee
benefits
|
(47
)
|
(405
)
|
-
|
|
Net
amount of non-cash assets incorporated / held for sale
|
532
|
(538
)
|
-
|
|
Cash and cash
equivalents
|
150
|
-
|
-
|
|
Non-controlling
interest
|
40
|
(8,630
)
|
-
|
|
Goodwill not yet
allocated
|
(26
)
|
1,391
|
-
|
|
Net
amount of assets incorporated / held for sale
|
696
|
(7,777
)
|
-
|
|
Interest held before
acquisition
|
67
|
-
|
-
|
|
Result from business
combination
|
-
|
-
|
-
|
|
Cash and cash equivalents
incorporated / held for sale
|
(150
)
|
9,193
|
-
|
|
Net
outflow of cash and cash equivalents / assets and liabilities held
for sale
|
613
|
1,416
|
-
|
The following table shows a detail
of significant non-cash transactions occurred in the years ended
June 30, 2017, 2016 and 2015:
|
|
June 30,
2017
|
June 30,
2016
(recast)
|
June 30,
2015 (recast)
|
|
Decrease in investments in
joint ventures and associates through a decrease in
borrowings
|
9
|
-
|
-
|
|
Dividends distribution to
non-controlling shareholders not yet paid
|
64
|
64
|
1
|
|
Increase in investments in
associates and joint ventures through a decrease in trade and other
receivables
|
49
|
-
|
-
|
|
Increase in property, plant
and equipment through an increase in trade and other
payables
|
122
|
-
|
-
|
|
Increase in intangible
assets through an increase in trade and other payables
|
111
|
-
|
-
|
|
Increase in investments in
associates and joint ventures through a decrease in investments in
financial assets
|
702
|
-
|
-
|
|
Increase in derivative
financial instruments through a decrease in investments in
financial assets
|
24
|
-
|
-
|
|
Increase in investments in
financial assets through a decrease in trade and other
receivables
|
-
|
71
|
-
|
|
Increase in investments in
financial assets through an increase in trade and other
payables
|
-
|
180
|
157
|
|
Increase in trading
properties through a decrease in investment properties
|
-
|
317
|
-
|
|
Increase in property, plant
and equipment through an increase in borrowings
|
-
|
116
|
5
|
|
Decrease in borrowings
through a decrease in investments in subsidiaries, joint ventures
and associates
|
-
|
9
|
43
|
|
Increase in investment
properties, through a decrease in property, plant and
equipment
|
-
|
57
|
137
|
|
Increase in investment
properties through an increase in borrowings
|
-
|
302
|
48
|
|
Increase in equity interest
in associates through a decrease in derivative financial
instruments
|
-
|
-
|
1
|
|
Decrease in investment
properties through an increase in intangible assets
|
-
|
-
|
2
|
|
Increase in financial
assets through a decrease in investments in joint ventures and
associates
|
-
|
-
|
1
|
|
Increase in investment
properties through a decrease in financial assets
|
-
|
-
|
30
|
|
Decrease of investment in
properties through an increase in trading properties
|
-
|
302
|
-
|
|
Increase in non-controlling
interest through a decrease in derivative financial
instruments
|
-
|
128
|
-
|
|
Decrease in trading
properties through a decrease in trade and other
payables
|
-
|
-
|
3
|
17.
Shareholders’
Equity
Share
capital and premium
The share capital of the Group is
represented by common shares with a nominal value of Ps. 1 per
share and one vote each. No other activity has been recorded for
the fiscal years ended June 30, 2017, 2016 and 2015 in the capital
accounts, other than those related to the acquisition of treasury
stock.
F-90
IRSA Inversiones y Representaciones Sociedad
Anónima
Inflation adjustment
of share capital
The Group’s Financial
Statements were previously prepared on the basis of general
price-level accounting which reflected changes in the purchase
price of the Argentine Peso in the historical Financial Statements
through February 28, 2003. The inflation adjustment related to
share capital was appropriated to an inflation adjustment reserve
that formed part of shareholders' equity. The balance of this
reserve could be applied only towards the issuance of common stock
to shareholders of the Company. CNV General Ruling 592/11 requires
that at the transition date to IFRS certain equity accounts, such
as the inflation adjustment reserve, are not adjusted and are
considered an integral part of share capital.
Additional paid-in
capital from treasury shares
Upon sale of treasury shares, the
difference between the net realizable value of the treasury shares
sold and the acquisition cost will be recognized, whether it is a
gain or a loss, under the non-capitalized contribution account and
will be known as “Treasury shares trading
premium”.
Legal
reserve
According to Law N° 19,550, 5%
of the profit of the year is destined to the constitution of legal
reserve until they reach legal capped amount (20% of total
capital). This legal reserve is not available for dividend
distribution and can only be released to absorb
losses.
Special
reserve
The CNV, through General Ruling
N° 562/9 and 576/10, has provided for the application of
Technical Resolutions N° 26 and 29 of the FACPCE, which adopt
the IFRS, as issued by the IASB, for companies subject to the
public offering regime ruled by Law 17,811, due to the listing of
their shares or corporate notes, and for entities that have applied
for authorization to be listed under the mentioned regime. The
Group has applied IFRS, as issued by the IASB, for the first time
in the year beginning July 1
st
, 2012, being its
transition date July 1
st
, 2011. Pursuant to
CNV General Ruling N° 609/12, the Company set up a special
reserve reflecting the positive difference between the balance of
retained earnings disclosed in the first Financial Statements
prepared according to IFRS and the balance of retained earnings
disclosed in the last Financial Statements prepared in accordance
with previously effective accounting standards. The reserve
recorded amounted to Ps. 395, which as of June 30, 2017 were fully
used to absorb the negative balances in the retained earnings
account. As explained in Note 2.b. to these Consolidated Financial
Statements, the Company’s Board of Directors decided to
change the accounting policy of the investment property from the
cost method to the fair value method, as allowed by IAS 40. For
this reason, as of the transition date, figures have been modified
and, hence, the special reserve as set forth by General Ruling CNV
N° 609/12 has been increased by Ps. 2,751, which may only be
reversed to be capitalized or to absorb potential negative balances
under retained earnings.
Dividends
During the years ended June 30,
2017, 2016 and 2015, there were no distributions of
dividends.
F-91
IRSA Inversiones
y Representaciones Sociedad Anónima
Group’s other reserves for the
years ended June 30, 2017, 2016 and 2015 were as
follows:
|
|
Cost of
treasury shares
|
Changes
in non-controlling interest
|
Reserve
for share-based payments
|
Reserve
for future dividends
|
Cumulative
translation adjustment reserve
|
Hedging
instruments
|
Reserve
for new developments
|
Reserve
for defined contribution plans
|
Other
reserves from subsidiaries
|
Total
other reserves
|
|
Balance at July 1st,
2014 (recast)
|
(38
)
|
(17
)
|
53
|
-
|
519
|
-
|
414
|
-
|
-
|
931
|
|
Other comprehensive loss for the
year
|
-
|
-
|
-
|
-
|
(125
)
|
-
|
-
|
-
|
-
|
(125
)
|
|
Total
comprehensive loss for the year
|
-
|
-
|
-
|
-
|
(125
)
|
-
|
-
|
-
|
-
|
(125
)
|
|
Reserve for share-based
compensation
|
-
|
-
|
22
|
-
|
-
|
-
|
-
|
-
|
-
|
22
|
|
Appropriation approved by
Shareholders’ meeting held 06.19.14
|
-
|
-
|
-
|
-
|
-
|
-
|
(414
)
|
-
|
-
|
(414
)
|
|
Reserve for share-based
payments
|
4
|
-
|
(11
)
|
-
|
-
|
-
|
-
|
-
|
-
|
(7
)
|
|
Transactions with
non-controlling interest
|
-
|
21
|
-
|
-
|
-
|
-
|
-
|
-
|
-
|
21
|
|
Balance at June 30, 2015
(recast)
|
(34
)
|
4
|
64
|
-
|
394
|
-
|
-
|
-
|
-
|
428
|
|
Other comprehensive income
/ (loss) for the year
|
-
|
-
|
-
|
-
|
118
|
(37
)
|
-
|
(10
)
|
-
|
71
|
|
Total
comprehensive income / (loss) for the year
|
-
|
-
|
-
|
-
|
118
|
(37
)
|
-
|
(10
)
|
-
|
71
|
|
Appropriation approved by
Ordinary and Extraordinary Shareholders’ meeting held
11.26.15
|
-
|
-
|
-
|
520
|
-
|
-
|
-
|
-
|
-
|
520
|
|
Reserve for share-based
compensation
|
5
|
-
|
3
|
-
|
-
|
-
|
-
|
-
|
-
|
8
|
|
Share of changes in
subsidiaries’ equity
|
-
|
-
|
-
|
-
|
-
|
-
|
-
|
-
|
37
|
37
|
|
Cumulative translation
adjustment for interest held before business
combination
|
-
|
-
|
-
|
-
|
(91
)
|
-
|
-
|
-
|
-
|
(91
)
|
|
Transactions with
non-controlling interest (Note 3)
|
-
|
17
|
-
|
-
|
-
|
-
|
-
|
-
|
-
|
17
|
|
Balance at June 30, 2016
(recast)
|
(29
)
|
21
|
67
|
520
|
421
|
(37
)
|
-
|
(10
)
|
37
|
990
|
|
Other comprehensive income
/ (loss) for the year
|
-
|
-
|
-
|
-
|
973
|
56
|
-
|
(5
)
|
-
|
1,024
|
|
Total
comprehensive income / (loss) for the year
|
-
|
-
|
-
|
-
|
973
|
56
|
-
|
(5
)
|
-
|
1,024
|
|
Reserve for share-based
compensation
|
1
|
-
|
11
|
-
|
-
|
-
|
-
|
-
|
-
|
12
|
|
Appropriation approved by
Shareholders’ meeting held 10.31.16
|
-
|
-
|
-
|
(26
)
|
-
|
-
|
-
|
-
|
-
|
(26
)
|
|
Transactions with
non-controlling interest
|
-
|
165
|
-
|
-
|
-
|
-
|
-
|
-
|
-
|
165
|
|
Balance
at June 30, 2017
|
(28
)
|
186
|
78
|
494
|
1,394
|
19
|
-
|
(15
)
|
37
|
2,165
|
F-92
IRSA Inversiones
y Representaciones Sociedad Anónima
18.
Trade and other
payables
Group’s trade and other
payables as of June 30, 2017, 2016 and 2015 were as
follows:
|
|
June 30,
2017
|
June 30,
2016
(recast)
|
June 30,
2015 (recast)
|
|
Non-current
|
|
|
|
|
Trade payables
|
2,067
|
525
|
217
|
|
Deferred
income
|
73
|
65
|
7
|
|
Construction
obligations
|
873
|
895
|
-
|
|
Total
non-current trade payables
|
3,013
|
1,485
|
224
|
|
Non-current other
payables
|
27
|
33
|
31
|
|
Total
non-current trade and other payables
|
3,040
|
1,518
|
255
|
|
|
|
|
|
|
Current
|
|
|
|
|
Trade payables
|
12,726
|
11,070
|
261
|
|
Accrued
invoices
|
633
|
450
|
119
|
|
Construction
obligations
|
353
|
1,238
|
-
|
|
Sales, rental and services
payments received in advance
|
4,339
|
3,352
|
223
|
|
Total
current trade payables
|
18,051
|
16,110
|
603
|
|
Dividends payable to
non-controlling shareholders
|
251
|
426
|
59
|
|
Tax payables
|
510
|
284
|
83
|
|
Construction
obligations
|
343
|
509
|
-
|
|
Others
|
1,684
|
545
|
151
|
|
Total
current other payables
|
2,788
|
1,764
|
293
|
|
Total
current trade and other payables
|
20,839
|
17,874
|
896
|
|
Total
trade and other payables
|
23,879
|
19,392
|
1,151
|
The fair value of payables
approximate their respective carrying amounts because, due to their
short-term nature, the effect of discounting is not considered
significant. Fair values are based on discounted cash flows (Level
3).
19.
Provisions
The Group is subject to claims,
lawsuits and other legal proceedings in the ordinary course of
business, including claims from clients where a third party seeks
reimbursement or damages. The Group’s responsibility under
such claims, lawsuits and legal proceedings cannot be estimated
with certainty. From time to time, the status of each major issue
is evaluated and its potential financial exposure is assessed. If
the potential loss involved in the claim or proceeding is deemed
probable and the amount may be reasonably estimated, a liability is
recorded. The Group estimates the amount of such liability based on
the available information and in accordance with the provisions of
the IFRS. If additional information becomes available, the Group
will make an evaluation of claims, lawsuits and other outstanding
proceeding, and will revise its estimates.
F-93
IRSA Inversiones
y Representaciones Sociedad Anónima
The following table shows the
movements in the Group's provisions categorized by
type:
|
|
Legal
claims (i)
|
Investments
in joint ventures and associates (ii)
|
Site
dismantling and remediation (iii)
|
Onerous
contracts (iv)
|
Other
provisions (v)
|
Total
|
|
As of
July 1, 2014 (recast)
|
47
|
-
|
-
|
-
|
-
|
47
|
|
Additions
|
35
|
18
|
-
|
-
|
-
|
53
|
|
Recovery
|
(15
)
|
-
|
-
|
-
|
-
|
(15
)
|
|
Used during the
year
|
(4
)
|
-
|
-
|
-
|
-
|
(4
)
|
|
As of
June 30, 2015 (recast)
|
63
|
18
|
-
|
-
|
-
|
81
|
|
Additions
|
52
|
35
|
39
|
64
|
3
|
193
|
|
Incorporated by business
combination (Note 4)
|
424
|
-
|
47
|
199
|
299
|
969
|
|
Recovery
|
(40
)
|
-
|
-
|
-
|
(6
)
|
(46
)
|
|
Used during the
year
|
(50
)
|
-
|
-
|
(80
)
|
(13
)
|
(143
)
|
|
Cumulative translation
adjustment
|
240
|
(8
)
|
28
|
113
|
144
|
517
|
|
As of
June 30, 2016 (recast)
|
689
|
45
|
114
|
296
|
427
|
1,571
|
|
Additions
|
246
|
105
|
-
|
20
|
131
|
502
|
|
Incorporated by business
combination (Note 4)
|
2
|
-
|
-
|
-
|
-
|
2
|
|
Recovery
|
(104
)
|
(80
)
|
-
|
(135
)
|
-
|
(319
)
|
|
Used during the
year
|
(151
)
|
-
|
-
|
-
|
(68
)
|
(219
)
|
|
Cumulative translation
adjustment
|
139
|
2
|
26
|
39
|
90
|
296
|
|
As of
June 30, 2017
|
821
|
72
|
140
|
220
|
580
|
1,833
|
|
|
June 30,
2017
|
June 30,
2016 (recast)
|
June 30,
2015 (recast)
|
|
Non-current
|
943
|
532
|
29
|
|
Current
|
890
|
1,039
|
52
|
|
Total
|
1,833
|
1,571
|
81
|
(i)
Additions and recoveries are included in "Other
operating results, net".
(ii)
Corresponds to the equity interest in New
Lipstick and Condor with negative equity. Additions and recoveries
are included in "Share of profit / (loss) of joint ventures and
associates".
(iii)
The Group’s companies are required to
recognize certain costs related to the dismantling assets and
remediating of sites from the places where such assets are located.
The calculation of such expenses are based on the dismantling value
for the current year, taking into consideration the best estimate
of future changes in prices, inflation, etc. and such costs are
capitalized at a risk-free interest rate. Volume projections for
retired or built assets are recast based on expected changes from
technological rulings and requirements.
(iv)
Provisions for other contractual obligation
include a series of obligation resulting from a contractual
liability or law, regarding which there is a high degree of
uncertainty as to the terms and the necessary amounts to discharge
such liability.
(v)
The balance pertains to provisions related to
investment property. Includes NIS 99 million (equivalent to
approximately Ps. 465 as of the date of these Consolidated
Financial Statements) related to a termination fee on a
pre-acquisition contractual obligation between the Company's
subsidiary, IDBD and a brokerage firm regarding advisory services
on a property. The Company is currently disputing the contractual
termination fee, therefore the final amount and timing of payment
is uncertain. In November 2009, PBC’s Audit Committee and
Board of Directors approved the agreement with Rock Real whereby
the latter would look for and propose to PBC the acquisition of
commercial properties outside Israel, in addition to assisting in
the negotiations and management of such properties. In return, Rock
Real would receive 12% of the net income generated by the acquired
property. Pursuant to amendment 16 of the Israel Commercial Act
5759-1999, the agreement must be ratified by the Audit Committee
before the third year after the effective date; otherwise, it
expires. The agreement has not been ratified by the audit committee
within such three-year term, so in January 2017 PBC issued a
statement that hinted at the expiration of the agreement and
informed that it would begin negotiations to reduce the debt . The
parties have appointed an arbitrator that should render a decision
on the dispute.
Dolphin
In September
2016, a former non-controlling shareholder of IDBD (the
"Petitioner") filed a petition with the district court of Be'er
Sheva against Dolphin Netherlands, IFISA and Mr. Eduardo Elsztain
(jointly referred to as "Dolphin"), to initiate a claim under a
collective action (the “Petition”). The Petitioner
argues that in executing the modified tender offer of IDBH (a
former controlling company of IDBD), as explained in Note 4.H.a),
the non-controlling shareholders of IDBD, which voted against the
modification of the tender offer, were forced to sell their shares
at a value that differed from the value initially agreed upon and
that, therefore, Dolphin should compensate them for an estimated
amount of NIS 158 (equivalent to Ps. 754 as of the date of these
Consolidated Financial Statements). In July 2017, Dolphin filed a
motion to dismiss the Petition. Our legal advisors consider that
the collective petition will probably be dismissed by the Court. If
not dismissed, Dolphin will have to file an answer to the Petition
within the 60 days following the Court’s decision regarding
the motion to dismiss.
F-94
IRSA Inversiones
y Representaciones Sociedad Anónima
IRSA
On February 23,
2016, a class action was filed against IRSA, Cresud and some
first-line managers and directors at the District Court of the USA
for the Central District of California. The complaint, on behalf of
people holding American Depositary Receipts of the Company between
November 3, 2014 and December 30, 2015, claims presumed violations
to the US federal securities laws. In addition, it argues that
defendants have made material misrepresentations and made some
omissions related to the Company’s investment in
IDBD.
Such complaint
was voluntarily waived on May 4, 2016 by the plaintiff and filed
again on May 9, 2016 with the US District Court for the Eastern
District of Pennsylvania.
Furthermore,
the Companies and some of its first-line managers and directors are
defendants in a class action filed on April 29, 2016 with the US
District Court for the Eastern District of Pennsylvania. The
complaint, on behalf of people holding American Depositary Receipts
of the Companies between May 13, 2015 and December 30, 2015,
presumes violations to the US federal securities laws. In addition,
it argues that defendants have made material misrepresentations and
made some omissions related to the investment of the Company's
subsidiary, IRSA, in IDBD.
Subsequently,
the Companies requested the transfer of the claim to the district
of New York, which was accepted.
On
December 8, 2016, the Court appointed the representatives of each
presumed class as primary plaintiffs and the lead legal advisor for
each of the classes. On February 13, 2017, the plaintiffs of both
classes filed a document containing certain amendments. The
companies filed a petition requesting that the class action brought
by shareholders should be dismissed. On April 12, 2017, the Court
suspended the class action filed by shareholders until the Court
decides on the petition of dismissal of such class action.
Filing information on the motion to dismiss the collective remedy
filed by shareholders of IRSA was completed on July 7, 2017. The
Court has yet to render a decision on the motion to
dismiss.
The companies
hold that such allegations are meritless and will continue making a
strong defense in both actions.
Claims against Cellcom and its subsidiaries
Most legal
proceedings involve consumer claims and actions derived from these
claims and petitions have been filed requesting that they be
admitted as class actions.
Claims against Shufersal and its subsidiaries
Most legal
actions pertain to consumer claims and petitions requesting that
such claims be admitted as class actions. There are also individual
legal actions brought by employees, subcontractors and
suppliers.
Claims against PBC
On July 4,
2017, PBC was served notice from the tax authority of Israel of
income tax official assessments based on a “better
assessment” of taxes for the years 2012-2015, and concluded
that PBC is required to pay approximately NIS 187 (including
interest) since compensation of losses is not
admitted.
In the opinion
of legal advisors to PBC, the company has sound arguments against
the Revenue Administration’s position and will file its
objection to it. As of the balance sheet date, there is no
provision in relation to this claim.
F-95
IRSA Inversiones
y Representaciones Sociedad Anónima
20.
Borrowings
The breakdown of the Group
borrowings as of June 30, 2017, 2016 and 2015 was as
follows:
|
|
June 30,
2017
|
June 30,
2016 (recast)
|
June 30,
2015 (recast)
|
|
Non-current
|
|
|
|
|
NCN
|
92,394
|
67,235
|
3,634
|
|
Bank loans
|
9,924
|
6,384
|
8
|
|
Non-recourse
loans
|
7,025
|
16,975
|
-
|
|
Other
borrowings
|
146
|
86
|
94
|
|
Total
non-current borrowings
|
109,489
|
90,680
|
3,736
|
|
|
|
|
|
|
Current
|
|
|
|
|
NCN
|
16,023
|
15,075
|
337
|
|
Bank loans
|
2,088
|
4,107
|
188
|
|
Bank
overdrafts
|
91
|
1,236
|
682
|
|
Other
borrowings
|
1,724
|
1,834
|
30
|
|
Total
current borrowings
|
19,926
|
22,252
|
1,237
|
|
Total
borrowings
|
129,415
|
112,932
|
4,973
|
Fair value of borrowings as of June
30, 2017, 2016 and 2015, was as follows:
|
|
June 30,
2017
|
June 30,
2016
(recast)
|
June 30,
2015 (recast)
|
||||
|
|
Operations
Center in Argentina
|
Operations
Center in Israel
|
Total
|
Operations
Center in Argentina
|
Operations
Center in Israel
|
Total
|
Operations
Center in Argentina
|
|
Share
capital
|
|
|
|
|
|
|
|
|
NCN
|
10,647
|
99,517
|
110,164
|
8,764
|
75,804
|
84,568
|
4,369
|
|
Bank loans
|
1,030
|
11,018
|
12,048
|
269
|
13,597
|
13,866
|
340
|
|
Bank
overdrafts
|
77
|
14
|
91
|
944
|
292
|
1,236
|
682
|
|
Non-recourse
loans
|
-
|
6,930
|
6,930
|
-
|
16,976
|
16,976
|
-
|
|
Other
borrowings
|
204
|
1,624
|
1,828
|
-
|
1,834
|
1,834
|
15
|
|
Total
borrowings
|
11,958
|
119,103
|
131,061
|
9,977
|
108,503
|
118,480
|
5,406
|
As of June 30, 2017, 2016 and 2015,
total borrowings include collateralized liabilities (seller
financing, leases and bank loans) of Ps. 11,206, Ps. 3,172 and Ps.
74, respectively. These borrowings are mainly collateralized by
investment properties and property, plant and equipment of the
Group (Notes 10 and 11). Borrowings also include liabilities under
finance leases where the Group is the lessee and which therefore
have to be measured in accordance with IAS 17 “Leases”.
Information regarding liabilities under finance leases is disclosed
in Note 22.
The maturity of the Group's
borrowings (excluding obligations under finance leases) is as
follows:
|
|
June 30,
2017
|
June 30,
2016
(recast)
|
June 30,
2015 (recast)
|
||||
|
|
Operations
Center in Argentina
|
Operations
Center in Israel
|
Total
|
Operations
Center in Argentina
|
Operations
Center in Israel
|
Total
|
Operations
Center in Argentina
|
|
Share
capital
|
|
|
|
|
|
|
|
|
Less than 1
year
|
423
|
18,249
|
18,672
|
2,573
|
18,172
|
20,745
|
1,053
|
|
Between 1 and 2
years
|
207
|
14,145
|
14,352
|
16
|
16,826
|
16,842
|
2,415
|
|
Between 2 and 3
years
|
3,598
|
11,400
|
14,998
|
1
|
19,535
|
19,536
|
2
|
|
Between 3 and 4
years
|
1,360
|
10,558
|
11,918
|
14
|
4,643
|
4,657
|
-
|
|
Between 4 and 5
years
|
217
|
10,520
|
10,737
|
1,063
|
7,092
|
8,155
|
-
|
|
Later than 5
years
|
5,878
|
51,560
|
57,438
|
5,302
|
36,169
|
41,471
|
1,316
|
|
|
11,683
|
116,432
|
128,115
|
8,969
|
102,437
|
111,406
|
4,786
|
|
Interest
|
|
|
|
|
|
|
|
|
Less than 1
year
|
250
|
1,003
|
1,253
|
240
|
1,265
|
1,505
|
182
|
|
Between 1 and 2
years
|
4
|
-
|
4
|
3
|
-
|
3
|
2
|
|
Between 2 and 3
years
|
7
|
-
|
7
|
-
|
-
|
-
|
-
|
|
Between 3 and 4
years
|
19
|
-
|
19
|
3
|
-
|
3
|
-
|
|
Between 4 and 5
years
|
5
|
-
|
5
|
-
|
-
|
-
|
-
|
|
Later than 5
years
|
8
|
-
|
8
|
10
|
-
|
10
|
-
|
|
|
293
|
1,003
|
1,296
|
256
|
1,265
|
1,521
|
184
|
|
Leases
|
4
|
-
|
4
|
5
|
-
|
5
|
3
|
|
|
11,980
|
117,435
|
129,415
|
9,230
|
103,702
|
112,932
|
4,973
|
F-96
IRSA Inversiones y Representaciones Sociedad
Anónima
The following tables shows a
breakdown of Group’s borrowing by type of fixed-rate and
floating-rate, per currency denomination and per functional
currency of the subsidiary that holds the loans for the fiscal
years ended June 30, 2017, 2016 and 2015.
|
|
June 30,
2017
|
|||
|
Rate per
currency
|
Argentine
Peso
|
Uruguayan
Peso
|
New
Israel Shekel
|
Total
|
|
Fixed
rate:
|
|
|
|
|
|
Argentine Peso
|
79
|
-
|
-
|
79
|
|
New Israeli
Shekel
|
-
|
-
|
35,867
|
35,867
|
|
US
Dollar
|
11,222
|
135
|
7,741
|
19,098
|
|
Subtotal
fixed-rate borrowings
|
11,301
|
135
|
43,608
|
55,044
|
|
Floating
rate:
|
|
|
|
|
|
Argentine Peso
|
540
|
-
|
-
|
540
|
|
New Israeli
Shekel
|
-
|
-
|
72,805
|
72,805
|
|
US
Dollar
|
-
|
-
|
1,022
|
1,022
|
|
Subtotal
floating-rate borrowings
|
540
|
-
|
73,827
|
74,367
|
|
Total
borrowings as per analysis
|
11,841
|
135
|
117,435
|
129,411
|
|
Finance leases
obligations
|
4
|
-
|
-
|
4
|
|
Total
borrowings as per Statement of Financial Position
|
11,845
|
135
|
117,435
|
129,415
|
|
|
June 30,
2016 (recast)
|
|||
|
Rate per
currency
|
Argentine
Peso
|
Uruguayan
Peso
|
New
Israel Shekel
|
Total
|
|
Fixed
rate:
|
|
|
|
|
|
Argentine Peso
|
56
|
-
|
-
|
56
|
|
New Israeli
Shekel
|
-
|
-
|
26,692
|
26,692
|
|
US
Dollar
|
7,665
|
120
|
18,809
|
26,594
|
|
Subtotal
fixed-rate borrowings
|
7,721
|
120
|
45,501
|
53,342
|
|
Floating
rate:
|
|
|
|
|
|
Argentine Peso
|
1,384
|
-
|
-
|
1,384
|
|
New Israeli
Shekel
|
-
|
-
|
56,514
|
56,514
|
|
US
Dollar
|
-
|
-
|
1,687
|
1,687
|
|
Subtotal
floating-rate borrowings
|
1,384
|
-
|
58,201
|
59,585
|
|
Total
borrowings as per analysis
|
9,105
|
120
|
103,702
|
112,927
|
|
Finance leases
obligations
|
5
|
-
|
-
|
5
|
|
Total
borrowings as per Statement of Financial Position
|
9,110
|
120
|
103,702
|
112,932
|
|
|
June 30,
2015 (recast)
|
|||
|
Rate per
currency
|
Argentine
Peso
|
Uruguayan
Peso
|
US
Dollar
|
Total
|
|
Fixed
rate:
|
|
|
|
|
|
Argentine Peso
|
209
|
-
|
-
|
209
|
|
US
Dollar
|
3,746
|
71
|
15
|
3,832
|
|
Subtotal
fixed-rate borrowings
|
3,955
|
71
|
15
|
4,041
|
|
Floating
rate:
|
|
|
|
|
|
Argentine Peso
|
929
|
-
|
-
|
929
|
|
Subtotal
floating-rate borrowings
|
929
|
-
|
-
|
929
|
|
Total
borrowings as per analysis
|
4,884
|
71
|
15
|
4,970
|
|
Finance leases
obligations
|
3
|
-
|
-
|
3
|
|
Total
borrowings as per Statement of Financial Position
|
4,887
|
71
|
15
|
4,973
|
Operations Center
in Argentina
●
On September 1, 2016, Class VII and VIII NCN
were tendered under the Program approved by the Shareholders’
Meeting for up to US$ 300. The settlement took place on September
8, 2016. The results are shown below:
-
Class VII NCN for a total amount of Ps. 384.2 to
be matured 36 months after the issuing date, which will accrue
interest at an annual floating interest rate, Badlar plus 299 basis
points, interest payable on a quarterly basis. Principal will be
amortized in only one installment due on September 9,
2019.
-
Class VIII NCN for a Nominal Value of US$ 184.5
(equivalent to Ps. 2,771 as of that date) to be matured 36 months
after the issuing date, paid in and payable in US Dollars, which
will accrue interest at an annual fixed interest rate of 7.0%,
interest payable on a quarterly basis. Principal will be amortized
in only one installment due on September 9, 2019.
F-97
IRSA Inversiones y Representaciones Sociedad
Anónima
●
On February 20, 2017, IRSA signed a loan with a
foreign banking institution for US$ 50 maturing on February 23,
2022. The loan will accrue interest at a fixed interest rate of
5.95%, interest payable on a quarterly basis. There is one grace
year for the principal which is subsequently amortized over 17
consecutive and equal installments.
Operations Center
in Israel
●
In July 2016, Shufersal repurchased Series B NCN
for a Nominal Value of NIS 511 (equivalent to Ps. 2,771 as of that
date) with an increase of the issue of Series F NCN by a ratio of
1.175 for each NIS 1 of the Series B. The Series B NCN acquired by
Shufersal were cancelled and delisted. The swap transaction does
not amount to an exchange of debt instruments because the terms are
not substantially different. All expenses related to the bond swap
have been deducted from outstanding balance of the debt and shall
be amortized over the remaining term of it.
●
On August 2, 2016, lDBD has issued a new series
of debentures in the Israeli market in an amount of NIS 325
(equivalent to Ps. 1,213 as of that date) due in 2019, at a rate of
IPC plus 4.25%. These debentures are secured by shares of Clal
subject to the approval of the Israel Commission of Capital
Markets, Savings and Insurance. On September 15, 2016, the Supreme
Court rendered an opinion on the use of Clal’s shares as
collateral and has requested the Capital Markets, Savings and
Insurance Commission to explain the reasons why it does not allow
IDBD to secure debentures with up to 5% of Clal shares. In January
2017, the Court ordered that IDBD should refrain from securing the
debentures in excess of the 5% of Clal’s shares, as they are
already partially securing a loan by in Menorah.
In accordance with the decision
rendered by the Supreme Court on the petition filed by IDBD to
pledge Clal’s shares in September, 2016, on October 13, 2016,
the Board of Directors of IDBD resolved a partial early redemption
of the debentures, which was effected on November 1, 2016 for an
approximately amount of NIS 239 at nominal value (“the
redeemed portion”) and represents a total of approximately
NIS 244 with respect to principal, interest and compensation for
early redemption. The early redemption represented 73.7% of the
outstanding principal balance of the debentures.
In addition, IDBD issued debentures
(Series L) for a total of NIS 381 (equivalent to Ps. 1,565 as of
that date). The debentures accrue interest at a rate of 6.95%. The
principal will be repaid in a single payment on November 28, 2019.
The first interest payment will be made on February 28, 2017 for
the period spanning from the issue date to the payment date. The
remaining interest payments will be made in 4 annual consecutive
quarterly installments due in February, May, August and November
each year. In order to ensure full compliance with all commitments,
IDBD pledged DIC’s shares for nearly 46.2
million.
●
On August 4, 2016, DIC issued further debentures
due 2025 in an amount of NIS 360 (equivalent to Ps. 1,344 as of
that date). The bonds were placed at an internal rate of return of
5.70%.
●
In October 2016, PBC issued debentures for NIS
102 (equivalent to Ps. 417 as of that date), at an annual effective
rate of 2.99% indexed to the CPI, and also issued debentures for
roughly NIS 497 (equal to Ps. 2,055 as of that date) at an
effective rate of 4.10% with no CPI indexation clause.
●
In January 2017, IDBG received a loan from an
Israeli financial entity in the amount of US$ 41.4. Principal will
be repaid after the lapse of two years and will accrue 7% interest.
The loan is guaranteed by IDBD and PBC (jointly and severally). In
addition, a bank loan in the amount of US$ 59 granted by a US bank
to a subsidiary of IDBG (Great Wash Park LLC), which is building a
shopping mall in Las Vegas, Nevada, has been extended to December
31, 2018.
●
On February 16, 2017, IDBD made a placement of
Series 13 Debentures in the Israeli market for NIS 1,060
(equivalent to Ps. 4,452 as of that date), maturing in November
2019, at a fixed annual interest rate of 5.40%. Such Debentures are
collateralized by the potential cash flow that could derive from
dividends or the sale of certain shares of Clal Insurance
Enterprise Holdings Ltd., held by IDBD.
F-98
IRSA Inversiones
y Representaciones Sociedad Anónima
●
In May 2012, IDBD was granted a loan from
Menorah Group which accrues interest at a rate of 6.9% plus CPI.
The loan was collateralized by a pledge over the shares of DIC and
Clal Insurance Enterprise Holdings. The total loan amounts to
nearly NIS 153 (equivalent to Ps. 643 as of that date) and was
collateralized by shares held by IDBD in DIC and Clal, which
represent, respectively, roughly 15.3% and 4% of the share capital
of such companies. In March 2017, IDBD reimbursed the loan balance
plus a penalty for advance payment in the amount of NIS 154
(equivalent to Ps. 647 as of that date). As a consequence, thereof,
the pledges held by the bank over DIC’s and Clal’s
shares were dropped.
●
During April this year, PBC made a public
offering of debentures (series I) for nearly NIS 431, for which it
raised roughly NIS 446 (equivalent to approximately Ps. 1,873 as of
the date of these Financial Statements).
●
During April this year, Gav-Yam made a public
offering of debentures (series F) for nearly NIS 303 (equivalent to
approximately Ps. 1,272 as of the date of these Financial
Statements).
●
In April 2017, DIC made a public offering to
expand its debentures (series F) for approximately NIS 444, for
which it raised roughly NIS 555 (equivalent to approximately Ps.
2,359 as of the date of these Financial Statements).
21.
Income tax
The Group’s income tax has
been calculated on the estimated taxable profit for each year at
the rates prevailing in the respective tax jurisdictions. The
subsidiaries of the Group in the jurisdictions where the Group
operates are required to calculate their income taxes on a separate
basis; thus, they are not permitted to compensate
subsidiaries’ losses against subsidiaries
income.
The details of the provision for the
Group’s income tax, is as follows:
|
|
June 30,
2017
|
June 30,
2016 (recast)
|
June 30,
2015 (recast)
|
|
Current income
tax
|
(845
)
|
(612
)
|
(653
)
|
|
Deferred income
tax
|
(2,070
)
|
(5,787
)
|
(922
)
|
|
Minimum Presumed Income tax
(MPIT)
|
-
|
26
|
(6
)
|
|
Income
tax from continuing operations
|
(2,915
)
|
(6,373
)
|
(1,581
)
|
The statutory taxes rates in the
countries where the Group operates for all of the years presented
are:
|
Tax jurisdiction
|
Income tax
rate
|
|
Argentina
|
35%
|
|
Uruguay
|
0% - 25%
|
|
U.S.A.
|
0% - 45%
|
|
Bermudas
|
0%
|
|
Israel
|
24%
|
In December 2016, the Government of
Israel modified the income tax rate thus generating a reduction
from the 25% to a 24% for calendar year 2017, and to a 23% for
calendar year 2018 onwards. The effect from the rate change is
recorded as part of deferred tax expense.
F-99
IRSA Inversiones
y Representaciones Sociedad Anónima
Below is a reconciliation between
income tax expense and the tax calculated applying the current tax
rate, applicable in the respective countries, to profit before
taxes for years ended June 30, 2017, 2016 and 2015:
|
|
June 30,
2017
|
June 30,
2016 (recast)
|
June 30,
2015 (recast)
|
|
Profit /
(loss) from continuing operations at tax rate applicable in the
respective countries
|
(2,249
)
|
(5,719
)
|
(1,766
)
|
|
Permanent
differences:
|
|
|
|
|
Share of profit / (loss) of
joint ventures and associates
|
130
|
(226
)
|
150
|
|
Unrecognized tax loss
carryforwards (1)
|
(1,209
)
|
(172
)
|
(9
)
|
|
Change of income tax
rate
|
529
|
(392
)
|
-
|
|
Non-taxable (loss) /
profit
|
(530
)
|
98
|
57
|
|
Changes in fair value of
financial instruments and sale of shares (2)
|
434
|
-
|
-
|
|
Non-deductible
expenses and others
|
(20
)
|
12
|
(7
)
|
|
Minimum Presumed Income tax
(MPIT)
|
-
|
26
|
(6
)
|
|
Income
tax from continuing operations
|
(2,915
)
|
(6,373
)
|
(1,581
)
|
(1) Corresponds primarily to holding
companies in Israel.
(2)
Corresponds
mainly to changes in fair value related to
Clal.
Deferred tax assets and liabilities
of the Group as of June 30, 2017, 2016 and 2015 will be recovered
as follows:
|
|
June 30,
2017
|
June 30,
2016 (recast)
|
June 30,
2015 (recast)
|
|
Deferred income tax asset
to be recovered after more than 12 months
|
5,577
|
4,035
|
411
|
|
Deferred income tax asset
to be recovered within 12 months
|
159
|
1,714
|
287
|
|
Deferred
income tax assets
|
5,736
|
5,749
|
698
|
|
|
|
|
|
|
|
June 30,
2017
|
June 30,
2016 (recast)
|
June 30,
2015 (recast)
|
|
Deferred income tax
liability to be recovered after more than 12 months
|
(19,027
)
|
(24,641
)
|
(6,356
)
|
|
Deferred income tax
liability to be recovered within 12 months
|
(9,448
)
|
(207
)
|
(115
)
|
|
Deferred
income tax liability
|
(28,475
)
|
(24,848
)
|
(6,471
)
|
|
Deferred
income tax assets (liabilities), net
|
(22,739
)
|
(19,099
)
|
(5,773
)
|
The movement in the deferred income
tax assets and liabilities during the years ended June 30, 2017,
2016 and 2015, without taking into consideration the offsetting of
balances within the same tax jurisdiction, is as
follows:
|
|
06.30.10 (recast)
|
Business combination and
Assets held for sale (i)
|
Cumulative translation
adjustment
|
Charged / (Credited) to the
statements of income
|
Reclassification
opening balances
|
Use of tax loss
carry-forwards
|
06.30.17
|
|
Assets
|
|
|
|
|
|
|
|
|
Trade and other
payables
|
1,774
|
-
|
281
|
(34
)
|
-
|
-
|
2,021
|
|
Tax loss
carry-forwards
|
3,251
|
-
|
488
|
(613
)
|
-
|
(171
)
|
2,955
|
|
Others
|
724
|
(47
)
|
136
|
(53
)
|
-
|
-
|
760
|
|
Subtotal
assets
|
5,749
|
(47
)
|
905
|
(700
)
|
-
|
(171
)
|
5,736
|
|
Liabilities
|
|
|
|
|
|
|
|
|
Investment properties and
Property, plant and equipment
|
(20,772
)
|
-
|
(1,888
)
|
(1,575
)
|
59
|
-
|
(24,176
)
|
|
Trading
properties
|
(120
)
|
-
|
(24
)
|
45
|
-
|
-
|
(99
)
|
|
Trade and other
receivables
|
(142
)
|
(7
)
|
-
|
(156
)
|
-
|
-
|
(305
)
|
|
Investments
|
(10
)
|
-
|
1
|
-
|
-
|
-
|
(9
)
|
|
Intangible
assets
|
(2,860
)
|
-
|
(312
)
|
490
|
-
|
-
|
(2,682
)
|
|
Others
|
(944
)
|
36
|
(122
)
|
(174
)
|
-
|
-
|
(1,204
)
|
|
Subtotal
liabilities
|
(24,848
)
|
29
|
(2,345
)
|
(1,370
)
|
59
|
-
|
(28,475
)
|
|
Assets
(Liabilities), net
|
(19,099
)
|
(18
)
|
(1,440
)
|
(2,070
)
|
59
|
(171
)
|
(22,739
)
|
(i)
Includes Ps. 6 for business combination (Note 4)
and Ps. 12 for reclassification to assets held for sale (Note
31).
F-100
IRSA Inversiones
y Representaciones Sociedad Anónima
|
|
06.30.15
(recast)
|
Business
combination
|
Cumulative
translation adjustment
|
Charged
/ (Credited) to the statements of income
|
Changes
of non-controlling interest
|
Use of
tax loss carryforwards
|
06.30.16
(recast)
|
|
Assets
|
|
|
|
|
|
|
|
|
Trade and other
payables
|
321
|
1,025
|
595
|
(167
)
|
-
|
-
|
1,774
|
|
Trading
properties
|
25
|
-
|
-
|
(25
)
|
-
|
-
|
-
|
|
Tax loss
carry-forwards
|
316
|
2,261
|
1,622
|
(520
)
|
(62
)
|
(366
)
|
3,251
|
|
Others
|
36
|
442
|
254
|
(8
)
|
-
|
-
|
724
|
|
Subtotal
assets
|
698
|
3,728
|
2,471
|
(720
)
|
(62
)
|
(366
)
|
5,749
|
|
Liabilities
|
|
|
|
|
|
|
|
|
Investment properties and
Property, plant and equipment
|
(5,775
)
|
(5,566
)
|
(3,355
)
|
(6,076
)
|
-
|
-
|
(20,772
)
|
|
Trading
properties
|
-
|
(64
)
|
(44
)
|
(12
)
|
-
|
-
|
(120
)
|
|
Trade and other
receivables
|
(683
)
|
(20
)
|
(12
)
|
573
|
-
|
-
|
(142
)
|
|
Investments
|
(10
)
|
-
|
-
|
-
|
-
|
-
|
(10
)
|
|
Intangible
assets
|
-
|
(2,031
)
|
(1,076
)
|
247
|
-
|
-
|
(2,860
)
|
|
Others
|
(3
)
|
(702
)
|
(440
)
|
201
|
-
|
-
|
(944
)
|
|
Subtotal
liabilities
|
(6,471
)
|
(8,383
)
|
(4,927
)
|
(5,067
)
|
-
|
-
|
(24,848
)
|
|
Assets
(Liabilities), net
|
(5,773
)
|
(4,655
)
|
(2,456
)
|
(5,787
)
|
(62
)
|
(366
)
|
(19,099
)
|
|
|
07.01.14
(recast)
|
Reclassification
to held for sale
|
Cumulative
translation adjustment
|
Charged
/ (Credited) to the statements of income
|
Changes
of non-controlling interest
|
Use of
tax loss carryforwards
|
06.30.15
(recast)
|
|
Assets
|
|
|
|
|
|
|
|
|
Trading
properties
|
18
|
-
|
-
|
7
|
-
|
-
|
25
|
|
Investments
|
10
|
-
|
-
|
(10
)
|
-
|
-
|
-
|
|
Trade and other
payables
|
101
|
-
|
-
|
220
|
-
|
-
|
321
|
|
Tax loss
carry-forwards
|
385
|
-
|
-
|
111
|
-
|
(180
)
|
316
|
|
Others
|
38
|
-
|
-
|
(2
)
|
-
|
-
|
36
|
|
Subtotal
assets
|
552
|
-
|
-
|
326
|
-
|
(180
)
|
698
|
|
Liabilities
|
|
|
|
|
|
|
|
|
Investment properties and
Property, plant and equipment
|
(4,980
)
|
(165
)
|
(1
)
|
(629
)
|
-
|
-
|
(5,775
)
|
|
Trade and other
receivables
|
(66
)
|
-
|
-
|
(617
)
|
-
|
-
|
(683
)
|
|
Investments
|
-
|
-
|
-
|
(10
)
|
-
|
-
|
(10
)
|
|
Others
|
(11
)
|
-
|
-
|
8
|
-
|
-
|
(3
)
|
|
Subtotal
liabilities
|
(5,057
)
|
(165
)
|
(1
)
|
(1,248
)
|
-
|
-
|
(6,471
)
|
|
Assets
(Liabilities), net
|
(4,505
)
|
(165
)
|
(1
)
|
(922
)
|
-
|
(180
)
|
(5,773
)
|
Deferred income tax assets are
recognized for tax loss carry-forwards to the extent that the
realization of the related tax benefits through future taxable
profits is probable. Tax loss carry-forwards may have expiration
dates or may be permanently available for use by the Group
depending on the tax jurisdiction where the tax loss carry-forward
is generated. Tax loss carry forwards in Argentina and Uruguay
generally expire within 5 years, while in Israel do not
expire.
As of June
30, 2017, the Group's tax loss carry forward prescribed as
follows:
|
Date
|
Total
|
|
2018
|
29
|
|
2019
|
37
|
|
2020
|
36
|
|
2021
|
75
|
|
2022
|
10
|
|
Do not expire
|
90,473
|
|
|
90,660
|
In order to fully realize the
deferred tax asset, the respective companies of the Group will need
to generate future taxable income. To this aim, a projection was
made for future years when deferred assets will be deductible. Such
projection is based on aspects such as the expected performance of
the main macroeconomic variables affecting the business, production
issues, pricing, yields and costs that make up the operational
flows derived from the regular exploitation of fields and other
assets of the group, the flows derived from the performance of
financial assets and liabilities and the income generated by the
Group’s strategy of crop rotation. Such strategy implies the
purchase and/or development
of fields in marginal areas or areas with a high
upside potential and periodical sale of such properties that are
deemed to have reached their maximum appreciation
potential.
F-101
IRSA Inversiones y Representaciones Sociedad
Anónima
Based on the estimated and aggregate
effect of all these aspects on the companies’ performance,
Management estimates that as at June 30, 2017, it is probable that
the Company will realize all of the deferred tax
assets.
The Group did not recognize deferred
income tax assets of Ps. 131,748, Pas. 74,244 and Ps. 36 as of June
30, 2017, 2016 and 2015, respectively. Although management
estimates that the business will generate sufficient income,
pursuant to IAS 12, management has determined that, as a result of
the recent loss history and the lack of verifiable and objective
evidence due to the subsidiary’s results of operations
history, there is sufficient uncertainty as to the generation of
sufficient income to be able to offset losses within a reasonable
timeframe, therefore, no deferred tax asset is recognized in
relation to these losses.
The Group did not recognize deferred
income tax liabilities of Ps. 1,792, Ps. 796 and Ps. 37 as of June
30, 2017, 2016 and 2015, respectively, related to their investments
in foreign subsidiaries, associates and joint ventures. In
addition, the withholdings and/or similar taxes paid at source may
be creditable against the Group’s potential final tax
liability.
On June 30, 2017, the Group
recognized a deferred liability in the amount of Ps. 857 related to
the potential future sale of one of its subsidiaries
shares.
IDBD and DIC assess whether it is
necessary to recognize deferred tax liabilities for the temporary
differences arising in relation to its investments in subsidiaries;
in this respect, IDBD, DIC and PBC estimate that if each of them is
required to dispose of its respective holdings in subsidiaries,
they would not be liable to income tax on the sale and, for such
reason, they did not recognize the deferred tax liabilities related
to this difference in these Consolidated Financial
Statements.
22.
Leases
The
Group as lessee
Operating
leases:
In the ordinary course of business,
the Group leases property or spaces for administrative or
commercial use both in Argentina and Israel under operating lease
arrangements. The agreements entered into include several clauses,
including but not limited, to fixed, variable or adjustable
payments. Some leases were agreed upon with related parties (Note
29).
The future minimum payments that the
Group must pay under operating leases are as follows:
|
|
June 30,
2017
|
June 30,
2016 (recast)
|
June 30,
2015 (recast)
|
|
No
later than one year
|
2,736
|
3,860
|
11
|
|
Later than one year and not
later than five years
|
7,770
|
6,708
|
16
|
|
Later than five
years
|
1,869
|
2,129
|
35
|
|
|
12,375
|
12,697
|
62
|
Finance leases:
The Group is party to several
financial lease agreements, mainly of equipment for administrative
use in the ordinary course of business. The amounts involved are
not material to any of the fiscal years under review.
F-102
IRSA Inversiones
y Representaciones Sociedad Anónima
The
Group as lessor
Operating
leases:
In the Shopping Malls segment and
Offices and others segment of the Operations Center in Argentina
and in the Real Estate segment of the Operations Center in Israel,
the Group enters into operating lease agreements typical in the
business. Given the diversity of properties and lessees, and the
various economic and regulatory jurisdictions where the Group
operates, the agreements may adopt different forms, such as fixed,
variable, adjustable leases, etc. For example, in the Operations
Center in Argentina, operating lease agreements with lessees of
shopping malls generally include step-up clauses and contingent
payments. In Israel, agreements tend to be agreed upon for fixed
amounts, although in some cases they may include adjustment
clauses. Income from leases are recorded in the Statement of Income
under rental and service income in all of the filed
periods.
Rental properties are considered to
be investment property. Book value is included in Note 10. The
future minimum proceeds under non-cancellable operating leases from
Group´s shopping malls, offices and other buildings are as
follows:
|
|
June 30,
2017
|
June 30,
2016 (recast)
|
June 30,
2015 (recast)
|
|
No
later than one year
|
4,437
|
3,137
|
982
|
|
Later than one year and not
later than five years
|
12,451
|
13,366
|
1,112
|
|
Later than five
years
|
4,632
|
4,247
|
8
|
|
|
21,520
|
20,750
|
2,102
|
Finance
leases:
The Group does not act as a lessor
in connection with finance leases.
23.
Revenues
|
|
June 30,
2017
|
June 30,
2016 (recast)
|
June 30,
2015 (recast)
|
|
Revenue from
supermarkets
|
47,277
|
18,707
|
-
|
|
Income from communications
services
|
11,958
|
4,956
|
-
|
|
Rental and services
income
|
8,711
|
5,268
|
2,997
|
|
Sale of communication
equipment
|
4,006
|
1,844
|
-
|
|
Sale of trading properties
and developments
|
1,454
|
191
|
10
|
|
Revenue from hotel
operations and tourism services
|
766
|
557
|
396
|
|
Total
Group's revenues
|
74,172
|
31,523
|
3,403
|
F-103
IRSA Inversiones
y Representaciones Sociedad Anónima
24.
Expenses by
nature
The Group disclosed expenses in the
statements of income by function as part of the line items
“Costs”, “General and administrative
expenses” and “Selling expenses”. The following
tables provide additional disclosure regarding expenses by nature
and their relationship to the function within the
Group.
For the year ended June 30,
2017:
|
|
Group
Costs
|
|
|
|
||||||
|
|
Costs of
supermarkets
|
Costs of
communication services
|
Rental
and services' costs
|
Costs of
sale of communication equipment
|
Costs of
trading properties and developments
|
Costs of
hotels and tourism services
|
Total
costs
|
General
and administrative expenses
|
Selling
expenses
|
Total
|
|
Cost of sale of goods and
services
|
33,310
|
40
|
-
|
2,716
|
1,393
|
88
|
37,547
|
4
|
-
|
37,551
|
|
Salaries, social security
costs and other personnel expenses
|
1,911
|
962
|
698
|
-
|
2
|
346
|
3,919
|
1,439
|
4,944
|
10,302
|
|
Depreciation and
amortization
|
211
|
1,744
|
22
|
-
|
-
|
34
|
2,011
|
584
|
2,120
|
4,715
|
|
Fees and payments for
services
|
-
|
1,592
|
91
|
-
|
2
|
19
|
1,704
|
667
|
1,700
|
4,071
|
|
Maintenance, security,
cleaning, repairs and others
|
-
|
-
|
1,370
|
-
|
14
|
139
|
1,523
|
86
|
690
|
2,299
|
|
Advertising and other
selling expenses
|
-
|
-
|
284
|
-
|
-
|
-
|
284
|
-
|
1,541
|
1,825
|
|
Taxes, rates and
contributions
|
-
|
-
|
226
|
-
|
5
|
1
|
232
|
23
|
740
|
995
|
|
Interconnection and roaming
expenses
|
-
|
1,711
|
-
|
-
|
-
|
-
|
1,711
|
-
|
-
|
1,711
|
|
Fees to other
operators
|
-
|
1,691
|
-
|
-
|
-
|
-
|
1,691
|
-
|
-
|
1,691
|
|
Director´s
fees
|
-
|
-
|
-
|
-
|
-
|
-
|
-
|
196
|
-
|
196
|
|
Leases and service
charges
|
-
|
-
|
78
|
-
|
3
|
1
|
82
|
18
|
5
|
105
|
|
Allowance for doubtful
accounts, net
|
-
|
-
|
-
|
-
|
-
|
-
|
-
|
4
|
204
|
208
|
|
Other expenses
|
-
|
727
|
69
|
-
|
-
|
21
|
817
|
822
|
1,497
|
3,136
|
|
Total as
of June 30, 2017
|
35,432
|
8,467
|
2,838
|
2,716
|
1,419
|
649
|
51,521
|
3,843
|
13,441
|
68,805
|
F-104
IRSA Inversiones
y Representaciones Sociedad Anónima
For the year ended June 30,
2016:
|
|
Group
Costs
|
|
|
|
||||||
|
|
Costs of
supermarkets
|
Costs of
communication services
|
Rental
and services' costs
|
Costs of
sale of communication equipment
|
Costs of
trading properties and developments
|
Costs of
hotels and tourism services
|
Total
costs
|
General
and administrative expenses
|
Selling
expenses
|
Total
|
|
Cost of sale of goods and
services
|
13,304
|
13
|
40
|
1,304
|
152
|
48
|
14,861
|
-
|
-
|
14,861
|
|
Salaries, social security
costs and other personnel expenses
|
663
|
405
|
560
|
-
|
1
|
236
|
1,865
|
626
|
1,969
|
4,460
|
|
Depreciation and
amortization
|
45
|
683
|
34
|
-
|
-
|
21
|
783
|
275
|
1,027
|
2,085
|
|
Fees and payments for
services
|
-
|
675
|
16
|
-
|
-
|
15
|
706
|
403
|
748
|
1,857
|
|
Maintenance, security,
cleaning, repairs and others
|
-
|
-
|
611
|
-
|
9
|
70
|
690
|
59
|
273
|
1,022
|
|
Advertising and other
selling expenses
|
-
|
-
|
282
|
-
|
-
|
-
|
282
|
-
|
665
|
947
|
|
Taxes, rates and
contributions
|
-
|
-
|
219
|
-
|
3
|
1
|
223
|
14
|
388
|
625
|
|
Director´s
fees
|
-
|
-
|
-
|
-
|
-
|
-
|
-
|
163
|
-
|
163
|
|
Leases and service
charges
|
-
|
-
|
47
|
-
|
1
|
2
|
50
|
(8
)
|
(3
)
|
39
|
|
Allowance for doubtful
accounts, net
|
-
|
-
|
-
|
-
|
-
|
-
|
-
|
59
|
8
|
67
|
|
Other expenses
|
6
|
1,528
|
79
|
-
|
-
|
26
|
1,639
|
248
|
629
|
2,516
|
|
Total as
of June 30, 2016 (recast)
|
14,018
|
3,304
|
1,888
|
1,304
|
166
|
419
|
21,099
|
1,839
|
5,704
|
28,642
|
F-105
IRSA Inversiones
y Representaciones Sociedad Anónima
For the year ended June 30,
2015:
|
|
Group
Costs
|
|
|
|
|||
|
|
Costs of
trading properties and developments
|
Rental
and services' costs
|
Costs
from hotel operations
|
Total
costs
|
General
and administrative expenses
|
Selling
expenses
|
Total
|
|
Cost of sale of goods and
services
|
2
|
-
|
61
|
63
|
-
|
-
|
63
|
|
Salaries, social security
costs and other personnel expenses
|
-
|
404
|
162
|
566
|
117
|
36
|
719
|
|
Depreciation and
amortization
|
-
|
15
|
12
|
27
|
6
|
-
|
33
|
|
Fees and payments for
services
|
1
|
9
|
1
|
11
|
84
|
6
|
101
|
|
Maintenance, security,
cleaning, repairs and others
|
7
|
326
|
34
|
367
|
20
|
2
|
389
|
|
Advertising and other
selling expenses
|
-
|
173
|
7
|
180
|
-
|
35
|
215
|
|
Taxes, rates and
contributions
|
3
|
108
|
-
|
111
|
12
|
93
|
216
|
|
Director´s
fees
|
-
|
-
|
-
|
-
|
99
|
-
|
99
|
|
Leases and service
charges
|
1
|
17
|
-
|
18
|
4
|
2
|
24
|
|
Allowance for doubtful
accounts, net
|
-
|
-
|
-
|
-
|
-
|
14
|
14
|
|
Other expenses
|
-
|
25
|
1
|
26
|
32
|
6
|
64
|
|
Total as
of June 30, 2015 (recast)
|
14
|
1,077
|
278
|
1,369
|
374
|
194
|
1,937
|
F-106
IRSA Inversiones
y Representaciones Sociedad Anónima
25.
Other operating results,
net
|
|
June 30,
2017
|
June 30,
2016 (recast)
|
June 30,
2015 (recast)
|
|
Donations
|
(123
)
|
(58
)
|
(40
)
|
|
Lawsuits and other
contingencies (1)
|
(22
)
|
14
|
(21
)
|
|
Reversal of cumulative
translation adjustment (2)
|
41
|
100
|
219
|
|
Expenses from transfers of
assets to IRSA CP (3)
|
-
|
-
|
(110
)
|
|
Others
|
(166
)
|
(107
)
|
(15
)
|
|
Total
other operating results, net
|
(270
)
|
(51
)
|
33
|
(1)
Includes legal costs and expenses
(2)
As of June 30, 2017, they pertain to the
reversal of exchange difference reverse created by IMadison,
settled during the fiscal year. As of June 30, 2016, Ps. 91
correspond to the reversal of cumulative translation adjustment
before the business combination with IDBD and Ps. 9 to the reversal
of the reserve of cumulative translation adjustment generated in
Rigby following the dissolution of the company. As of June 30,
2015, corresponds to the reversal of the translation reserve
generated in Rigby following the partial capital reduction of the
company.
(3)
On December 22, 2014, IRSA conveyed title on the
properties located in Bouchard 710, Suipacha 652, Torre BankBoston,
República Building, Intercontinental Plaza and the plot of
land next to the latter, to its subsidiary IRSA CP, which as from
such date will continue to operate such properties. This transfer
has had no effects whatsoever in the Consolidated Financial
Statements of the Group other than the expenses and taxes
associated to the transfer.
26.
Financial results,
net
|
|
June 30,
2017
|
June 30,
2016 (recast)
|
June 30,
2015 (recast)
|
|
Finance
income:
|
|
|
|
|
- Interest
income
|
848
|
651
|
66
|
|
- Foreign exchange
loss
|
165
|
573
|
54
|
|
- Dividends
income
|
68
|
72
|
17
|
|
Total
finance income
|
1,081
|
1,296
|
137
|
|
Finance costs:
|
|
|
|
|
- Interest
expenses
|
(6,474
)
|
(2,362
)
|
(628
)
|
|
- Foreign exchange
loss
|
(1,240
)
|
(2,633
)
|
(408
)
|
|
- Other finance
costs
|
(914
)
|
(673
)
|
(71
)
|
|
Total
finance costs
|
(8,628
)
|
(5,668
)
|
(1,107
)
|
|
Other financial
results:
|
|
|
|
|
- Fair value gain /
(loss) of financial assets and liabilities at fair value through
profit or loss, net
|
2,859
|
(1,439
)
|
53
|
|
- Gain / (loss) on
derivative financial instruments, net
|
70
|
921
|
(16
)
|
|
Total
other financial results
|
2,929
|
(518
)
|
37
|
|
Total
financial results, net
|
(4,618
)
|
(4,890
)
|
(933
)
|
27.
Earnings per
share
(a)
Basic
Basic earnings per share amounts are
calculated in accordance with IAS 33 "Earning per share" by
dividing the profit attributable to equity holders of the Group by
the weighted average number of ordinary shares outstanding during
the year.
|
|
June 30,
2017
|
June 30,
2016 (recast)
|
June 30,
2015 (recast)
|
|
Profit from continuing
operations attributable to equity holders of the parent / Weighted
average number of ordinary shares in issue
|
1,786 / 575 =
3.11
|
9,325 / 575 =
16.22
|
1,898 / 574 =
3.31
|
|
Profit from discontinued
operations per share attributable to equity holders of the parent /
Weighted average number of ordinary shares in issue
|
1,244 / 575 =
2.16
|
209 / 575 =
0.36
|
n/a
|
|
Profit for the year per
share attributable to equity holders of the parent / Weighted
average number of ordinary shares in issue
|
3,030 / 575 =
5.27
|
9,534 / 575 =
16.58
|
1,898 / 574 =
3.31
|
F-107
IRSA Inversiones
y Representaciones Sociedad Anónima
(b)
Diluted
Diluted earnings per share amounts
are calculated by adjusting the weighted average number of ordinary
shares outstanding to assume conversion of all dilutive potential
shares. The Group holds treasury shares with potentially dilutive
effect.
|
|
June 30,
2017
|
June 30,
2016 (recast)
|
June 30,
2015 (recast)
|
|
Profit from continuing
operations attributable to equity holders of the parent / Weighted
average number of ordinary shares in issue
|
1,786 / 579 =
3.08
|
9,325 / 579 =
16.11
|
1,898 / 578 =
3.28
|
|
Profit from discontinued
operations per share attributable to equity holders of the parent /
Weighted average number of ordinary shares in issue
|
1,244 / 579 =
2.15
|
209 / 579 =
0.36
|
n/a
|
|
Profit for the year per
share attributable to equity holders of the parent / Weighted
average number of ordinary shares in issue
|
3,030 / 579 =
5.23
|
9,534 / 579 =
16.47
|
1,898 / 578 =
3.28
|
28.
Employee
benefits
Incentive Plan -
Argentina
The Group has an equity incentives
plan (“Incentive Plan”), created in September 30, 2011,
which is aimed at certain employees, directors and top management
of the Company, IRSA CP and Cresud (the
“Participants”). Engagement is voluntary and by
invitation of the Board of Directors.
Under the Incentive Plan, over the
years 2011, 2012 and 2013, Participants will be entitled to receive
shares ("Contributions") of the Company and Cresud based on a
percentage of their annual bonus for the years 2011, 2012 and 2013,
providing they remain as employee of the Company for at least five
years, among other conditions required, to qualify for such
Contributions. Contributions shall be held by the Company and
Cresud, and as the conditions established by the Plan are verified,
such contributions shall be transferred to the
Participants.
As of June 30, 2017, 2016 and 2015,
a reserve has been set up under Shareholders’ equity as a
result of this Incentive Plan for Ps. 78, Ps. 67 and Ps. 64,
respectively, based on the market value of the shares to be granted
pertaining to the Group’s contributions, proportionately to
the period already elapsed for the vesting of shares in the
Incentive Plan and adjusted for the probability that any
beneficiary should leave the Group before the term and/or the
conditions required to qualify for the benefits of said plan are
met at each fiscal year-end.
For the fiscal years ended June 30,
2017, 2016 and 2015, the Group has incurred a charge related to the
Incentive Plan of Ps. 15.9, Ps. 21.3 and Ps. 29.9, respectively,
while the total cost not yet recognized (given that the vesting
period has not yet elapsed) is Ps. 6.8, Ps. 16.1 and Ps. 46.5,
respectively, for each fiscal year. This cost is expected to be
recognized over an approximately period of two years.
Movements in the number of matching
shares outstanding under the incentive plan corresponding to the
Company´s contributions are as follows:
|
|
June 30,
2017
|
June 30,
2016 (recast)
|
June 30,
2015 (recast)
|
|
At the
beginning
|
3,619,599
|
4,439,507
|
5,786,388
|
|
Additions
|
-
|
-
|
18,734
|
|
Disposals
|
(10,169
)
|
(117,367
)
|
(680,047
)
|
|
Granted
|
(101,483
)
|
(702,541
)
|
(685,568
)
|
|
At the
end
|
3,507,947
|
3,619,599
|
4,439,507
|
Defined
contribution plan - Argentina
The Group operates a defined
contribution plan (the “Plan”) which covers certain
selected managers from Argentina. The Plan was effective as from
January 1, 2006. Participants can make pre-tax contributions to the
Plan of up to 2.5% of their monthly salary (“Base
Contributions”) and up to 15% of their annual bonus
(“Extraordinary Contributions”).
F-108
IRSA Inversiones y Representaciones Sociedad
Anónima
Under
the Plan, the Group matches employee contributions to the plan at a
rate of 200% for Base Contributions and 300% for Extraordinary
Contributions.
All contributions are invested in
funds administered outside of the Group. Participants or their
assignees, as the case may be, will have access to the 100% of the
Company contributions under the following
circumstances:
(i)
ordinary retirement in accordance with
applicable labor regulations;
(ii)
total or permanent incapacity or
disability;
(iii)
death.
In case of resignation or
termination without good cause, the manager will receive the
Group’s contribution only if he or she has participated in
the Plan for at least 5 years.
Contributions made by the Group
under the Plan amount to Ps. 21, Ps. 10 and Ps. 5 for the fiscal
years ended June 30, 2017, 2016 and 2015,
respectively.
Defined contribution plan -
Israel
Benefits to hired employees include
post-employment benefits, retirement benefits, share-based plans
and other short and long-term benefits. The Group’s
liabilities in relation to severance pay and/or retirement benefits
of Israeli employees are calculated in accordance with Israeli
laws.
|
|
June 30,
2017
|
June 30,
2016 (recast)
|
|
Present value of unfunded
obligations
|
673
|
572
|
|
Present value of funded
obligations
|
1,789
|
1,070
|
|
Total present value of
defined benefits obligations (post-employment)
|
2,462
|
1,642
|
|
Fair value of plan
assets
|
(1,703
)
|
(1,101
)
|
|
Recognized
liability for defined benefits obligations
|
759
|
541
|
|
Liability for other
long-term benefits
|
4
|
148
|
|
Total
recognized liabilities
|
763
|
689
|
|
Assets designed for payment
of benefits for employees
|
-
|
(4
)
|
|
Net
position from employee benefits
|
763
|
685
|
Plans associated
to certain key members of management - Israel
IDBD, through its subsidiaries, has
granted share incentive plans to key members of management. In
April 2016, some modifications have been introduced to the plans as
regards exercise prices for each of the five tranches of options,
thus establishing a range of NIS 9.5 to NIS 12.5 per share. The
share price at the time of approval was NIS 7.73 per
share.
29.
Related party
transactions
In the normal course of business,
the Group conducts transactions with different entities or parties
related to it.
As mentioned in Note 4, on October
11, 2015, the Group obtained control over IDBD. Before takeover,
the Group had entered into certain transactions with IDBD as
associate, mainly related to the subscription of warrants and/or
capital contributions, but had not conducted commercial
transactions. See Note 4 for further information related to
investment in IDBD.
F-109
IRSA Inversiones
y Representaciones Sociedad Anónima
Remunerations of
the Board of Directors
The Business Company Act, provides
that the remuneration to the Board of Directors, where it is not
set forth in the Company’s by-laws, shall be fixed by the
Shareholders' Meetings. The maximum amount of remuneration that the
members of the Board are allowed to receive, including salary and
other performance-based remuneration of permanent
technical-administrative functions, may not exceed 25% of the
profits.
Such maximum amount is limited to 5%
where no dividends are distributed to the Shareholders, and will be
increased proportionately to the distribution, until reaching such
cap where total profits are distributed.
Some of the Group's Directors are
hired under the Employment Contract Law N° 20,744. This Act
rules on certain conditions of the work relationship, including
remuneration, salary protection, working hours, vacations, paid
leaves, minimum age requirements, workmen protection and forms of
suspension and contract termination. The remuneration of directors
for each fiscal year is based on the provisions established by the
Business Company Act, taking into consideration whether such
directors perform technical-administrative functions and depending
upon the results recorded during the fiscal year. Once such amounts
are determined, they should be approved by the Shareholders’
Meeting.
Senior Management
remuneration
The members of the Group´s
senior management are appointed and removed by the Board of
Directors, and perform functions in accordance with the
instructions delivered by the Board itself.
The Company’s Senior
Management is composed of as follows:
|
Name
|
Date of
Birth
|
Position
|
Actual position
since
|
|
Eduardo S. Elsztain
|
01/26/1960
|
General Manager
|
1991
|
|
Daniel R. Elsztain
|
12/22/1972
|
Operating Manager
|
2012
|
|
Javier E. Nahmod
|
11/10/1977
|
Real Estate Manager
|
2014
|
|
Matías I.
Gaivironsky
|
02/23/1976
|
Administrative and Financial
Manager
|
2011
|
|
Juan José
Martinucci
|
01/31/1972
|
Commercial Manager
|
2013
|
The total remuneration paid to
members of senior management for their functions consists of a fix
salary that takes account of the manager's backgrounds capacity and
experience, plus an annual bonus based on their individual
performance and the Group's results. Members of senior management
participate in define contribution and share-based incentive plans
that are described in Note 28.
Corporate Service
Agreement with Cresud and IRSA CP
In due course, given that IRSA,
Cresud and IRSA CP have operating overlapping areas, the Boards of
Directors considered precedent to share certain services and
thereby optimize operating costs, building on and enhancing the
individual efficiencies of each of the companies in the different
areas of operating management.
To such end, on June 30, 2004, a
Master Agreement for the Exchange of Corporate Services
(“Frame Agreement") was entered into between IRSA, Cresud and
IRSA CP, which was amended on August 23, 2007, August 14, 2008,
November 27, 2009, March 12, 2010, July 11, 2011, October 15, 2012,
November 12, 2013, February 24, 2014, February 18, 2015 and
November 12, 2015.
Under the current Frame Agreement
corporate services are provided in the following areas: Human
Resources, Finance, Institutional Relations, Administration and
Control, Insurance, Security, Agreements, Technical Tasks,
Infrastructure and Services, Procurement, Architecture and Design,
Development and Works, Real Estate, Hotels, Board of Directors,
Board of Directors of Real Estate Business, General Manager Office,
Board Safety, Audit Committee, Real
Estate Business Management, Human Resources of
Real Estate Business, Fraud Prevention, Internal Audit and
Agricultural Investment Management.
F-110
IRSA Inversiones y Representaciones Sociedad
Anónima
Pursuant to this agreement, the
companies hired an external consulting firm to review and evaluate
half-yearly the criteria used in the process of liquidating the
corporate services, as well as the basis for distribution and
source documentation used in the process indicated above, by means
of a half-yearly report.
The operations described above
allows IRSA, Cresud and IRSA CP to keep its strategic and
commercial decisions fully independent and confidential, with cost
and profit apportionment being allocated on the basis of operating
efficiency and equity.
Offices and
Shopping Malls spaces leases
The offices of our president are
located at 108 Bolivar, in the Autonomous City of Buenos Aires. The
property has been rented to Isaac Elsztain e Hijos S.A., a company
controlled by some family members of Eduardo Sergio Elsztain, our
president, and to Hamonet S.A., a company controlled by Fernando A.
Elsztain, one of our directors, and some of his family
members.
In addition, Tarshop, BACS, BHN
Sociedad de Inversión S.A., BHN Seguros Generales S.A. and BHN
Visa S.A. rent offices owned by IRSA CP in different
buildings.
Furthermore, we also let various
spaces in our shopping malls (stores, stands, storage space or
advertising space) to third parties and related parties such as
Tarshop S.A. and BHSA.
Lease agreements entered into with
associates included similar provisions and amounts to those
included in agreements with third parties.
Donations granted
to Fundación IRSA and Fundación Museo de los
Niños
Fundación IRSA is a non-profit
charity institution that seeks to support and generate initiatives
concerning education, the promotion of corporate social
responsibility and the entrepreneurial spirit of the youth. It
carries out corporate volunteering programs and fosters donations
by the employees. The main members of Fundación IRSA's Board
of Directors are: Eduardo S. Elsztain (President); Saul Zang (Vice
President I), Alejandro Elsztain (Vice President II) and Mariana C.
de Elsztain (secretary). It funds its activities with the donations
made by us, Cresud and IRSA CP.
Fundación Museo de los
Niños is a non-profit association, created by the same
founders of Fundación IRSA and its Management Board is formed
by the same members as Fundación IRSA’s. Fundación
Museo de los Niños acts as special vehicle for the
developments of "Museo de los Niños, Abasto" and the "Museo de
los Niños, Rosario". On October 29, 1999, our shareholders
approved the award of the agreement “Museo de los Niños,
Abasto” to Fundación Museo de los Niños. On October
31, 1997, IRSA CP entered into an agreement with Fundación
IRSA whereby it loaned 3,800 square meters of the area built in the
Abasto Shopping mall for a total term of 30 years, and on November
29, 2005, shareholders of IRSA CP approved another agreement
entered into with Fundación Museo de los Niños whereby
2,670.11 square meters built in the Alto Rosario shopping mall were
loaned for a term of 30 years. Fundación IRSA has used the
available area to house the museum called “Museo de los
Niños, Abasto” an interactive learning center for kids
and adults, which was opened to the public in April
1999.
Legal
Services
The Group hires legal services from
Estudio Zang, Bergel & Viñes, at which Saúl Zang is a
partner and sits at the Board of Directors of the Group
companies.
F-111
IRSA Inversiones y Representaciones Sociedad
Anónima
Purchase and sale
of goods and/or service hiring
In the normal course of its business
and with the aim of making resources more efficient, in certain
occasions purchases and/or hires services which later sells and/or
recovers for companies or other related parties, based upon their
actual utilization.
Sale of
advertising space in media
Our company and our related parties
frequently enter into agreements with third parties whereby we
sell/acquire rights of use to advertise in media (TV, radio
stations, newspapers, etc.) that will later be used in advertising
campaigns. Normally, these spaces are sold and/or recovered to/from
other companies or other related parties, based on their actual
use.
Purchase and sale
of financial assets
The Group usually invests excess
cash in several instruments that may include those issued by
related companies, acquired at issuance or from unrelated third
parties through secondary market deals.
Investment in
investment funds managed by BACS
The Group invests its liquid funds
in mutual funds managed by BACS among other entities.
Borrowings
In the normal course of its
activities, the Group enters into diverse loan agreements or credit
facilities between the group’s companies and/or other related
parties. These borrowings generally accrue interests at market
rates.
Financial and
service operations with BHSA
The Group works with several
financial entities in the Argentine market for operations
including, but not limited to, credit, investment, purchase and
sale of securities and financial derivatives. Such entities include
BHSA and its subsidiaries. BHSA and BACS usually act as
underwriters in Capital Market transactions. In addition, we have
entered into agreements with BHSA, who provides collection services
for our shopping malls.
Transactions with
IFISA
On February 10, 2015, Dolphin, sold
71,388,470 IDBD shares to IFISA, for an amount of US$ 25.6, US$ 4
of which were paid upon execution and the remaining balance of US$
21.6 were financed for a term of up to 360 days and priced at Libor
1M (one month) + 3%. Following subsequent amendments, the parties
agreed to increase the rate to 9% as from February 2016 and extend
the maturity to February 5, 2018.
On May 31, 2015, the Group, through
Dolphin, sold to IFISA 46 million of warrants Series 4 for a total
amount of NIS 0.46 (equivalent to US$ 0.12 at the time of the
transaction), provided IFISA agreed to exercise them fully when
Dolphin were so required by IDBD.
On July 28, 2015, Dolphin granted a
loan to IFISA for an amount of US$ 7.2, due in July 2016, which
accrued interest at Libor 1M (one month) + 3%. Following subsequent
amendments, the parties agreed to increase the rate to 9% and
extend the maturity to February 5, 2018.
On October 9, 2015, REIG granted a
loan in the amount of US$ 40 to IFISA. The original term of the
loan was one year calculated from the disbursement and accrued
interest at a rate of 3% + Libor 1M, to be determined
monthly.
F-112
IRSA Inversiones y Representaciones Sociedad
Anónima
Following subsequent amendments, the
parties agreed to increase the rate to 9% and extend the maturity
to February 5, 2018.
In February 2016, DN B.V., a
subsidiary of Dolphin, entered into an option contract with IFISA
whereby Dolphin is granted the right, but not the obligation to
acquire 92,665,925 shares of IDBD held by IFISA at a share price of
NIS 1.64 plus an annual interest of 8.5%. The exercise date for the
option extends for two years.
Purchase of
farmland "La Adela"
In July 2014, IRSA bought from
Cresud the “La Adela” farmland – an area of
approximately 1,058 hectares located in the municipality of
Luján, Province of Buenos Aires, for a total amount of Ps.
210. Given the development and proximity to Buenos Aires, there is
a high potential for urbanization of this farmland; therefore, the
purpose of the sale is to undertake a new real estate
development.
Transfer of tax
credits
During the fiscal year ended June
30, 2016 Sociedad Anónima Carnes Pampeanas S.A. (subsidiary of
Cresud) and Cresud, assigned upon IRSA CP, credits pertaining to
VAT refunds for exports originated in such companies' economic
activities.
Loan between
Dolphin and IDBD
As described in note 4.H to these
Consolidated Financial Statements Dolphin had granted a series of
subordinated loans to IDBD (“the debt”). This debt has
the following characteristics: i) it is subordinated, even in the
case of insolvency, to all current or future debts of IDBD; (ii)
will be reimbursed after payment of all the debts to their
creditors; (iii) accrues interest at a rate of 0.5%, which will be
added to the amount of the debt and will be payable only on the
date the subordinated debt is amortized; (iv) Dolphin will not have
a right to participate or vote in the meetings with IDBD creditors
with respect to the subordinated debt; (v) as from January 1, 2016,
Dolphin has the right, at its own discretion, to convert the debt
balance into IDBD shares, at that time, whether wholly or
partially, including the interest accrued over the debt until that
date; (vi) if Dolphin opt to exercise the conversion, the debt
balance will be converted so that Dolphin will receive IDBD shares
according to a share price that will be 10% less than the average
price of the last 30 days prior to the date the conversion option
is exercised. In the event there is no market price per share, this
will be determined in accordance with an average of three
valuations made by external or independent experts, who shall be
determined it by mutual consent and, in the event of a lack of
consent, they will be set by the President of the Institute of
Certified Public Accountants in Israel.
F-113
IRSA Inversiones
y Representaciones Sociedad Anónima
The following is a summary
presentation of the balances with related parties as of June 30,
2017:
|
Related party
|
|
Description of transaction
|
|
Investments in financial assets
non-current
|
|
Investments in financial assets
current
|
|
Trade and other receivables
non-current
|
|
Trade and other receivables current
|
|
Trade and other payables
non-current
|
|
Trade and other payables
current
|
|
Borrowings
non-current
|
|
Borrowings
current
|
|
BHSA
|
|
Reimbursement
of expenses
|
|
-
|
|
-
|
|
-
|
|
-
|
|
-
|
|
(1)
|
|
-
|
|
-
|
|
|
|
Borrowings
|
|
-
|
|
-
|
|
-
|
|
-
|
|
-
|
|
-
|
|
-
|
|
(2)
|
|
|
|
Leases and/or
rights of use
|
|
-
|
|
-
|
|
-
|
|
2
|
|
-
|
|
-
|
|
-
|
|
-
|
|
Lipstick
|
|
Reimbursement
of expenses
|
|
-
|
|
-
|
|
-
|
|
2
|
|
-
|
|
-
|
|
-
|
|
-
|
|
Manibil
S.A.
|
|
Contributions
to be paid
|
|
-
|
|
-
|
|
83
|
|
1
|
|
-
|
|
-
|
|
-
|
|
-
|
|
New
Lipstick
|
|
Reimbursement
of expenses
|
|
-
|
|
-
|
|
-
|
|
5
|
|
-
|
|
-
|
|
-
|
|
-
|
|
Condor
|
|
Dividends
receivables
|
|
-
|
|
-
|
|
-
|
|
8
|
|
-
|
|
-
|
|
-
|
|
-
|
|
|
|
Public
companies securities
|
|
82
|
|
|
|
|
|
|
|
|
|
|
|
|
|
|
|
LRSA
|
|
Leases and/or
rights of use
|
|
-
|
|
-
|
|
1
|
|
28
|
|
-
|
|
-
|
|
-
|
|
-
|
|
Tarshop
|
|
Leases and/or
rights of use
|
|
-
|
|
-
|
|
-
|
|
2
|
|
-
|
|
(1)
|
|
-
|
|
-
|
|
Total associates
|
|
|
|
82
|
|
-
|
|
84
|
|
48
|
|
-
|
|
(2)
|
|
-
|
|
(2)
|
|
Cyrsa
|
|
Borrowings
|
|
-
|
|
-
|
|
-
|
|
-
|
|
-
|
|
-
|
|
-
|
|
(5)
|
|
Mehadrin
|
|
Commissions
|
|
-
|
|
-
|
|
-
|
|
-
|
|
-
|
|
(5)
|
|
-
|
|
-
|
|
NPSF
|
|
Share-based
compensation plan
|
|
-
|
|
-
|
|
-
|
|
1
|
|
-
|
|
-
|
|
-
|
|
-
|
|
|
|
Borrowings
|
|
-
|
|
-
|
|
-
|
|
-
|
|
-
|
|
-
|
|
-
|
|
(4)
|
|
|
|
Advertising
spaces
|
|
-
|
|
-
|
|
-
|
|
-
|
|
-
|
|
(1)
|
|
-
|
|
-
|
|
|
|
Reimbursement
of expenses
|
|
-
|
|
-
|
|
-
|
|
1
|
|
-
|
|
-
|
|
-
|
|
-
|
|
|
|
Management
fees
|
|
-
|
|
-
|
|
-
|
|
1
|
|
-
|
|
-
|
|
-
|
|
-
|
|
Quality
|
|
Management
fees
|
|
-
|
|
-
|
|
-
|
|
5
|
|
-
|
|
-
|
|
-
|
|
-
|
|
Total joint ventures
|
|
|
|
-
|
|
-
|
|
-
|
|
8
|
|
-
|
|
(6)
|
|
-
|
|
(9)
|
|
Cresud
|
|
Reimbursement
of expenses
|
|
-
|
|
-
|
|
-
|
|
-
|
|
-
|
|
(36)
|
|
-
|
|
-
|
|
|
|
Corporate
services
|
|
-
|
|
-
|
|
-
|
|
-
|
|
-
|
|
(23)
|
|
-
|
|
-
|
|
|
|
NCN
|
|
-
|
|
242
|
|
-
|
|
-
|
|
-
|
|
-
|
|
-
|
|
-
|
|
|
|
Leases and/or
rights of use
|
|
-
|
|
-
|
|
-
|
|
4
|
|
-
|
|
-
|
|
-
|
|
-
|
|
|
|
Long-term
incentive plan
|
|
-
|
|
-
|
|
-
|
|
-
|
|
-
|
|
(1)
|
|
-
|
|
-
|
|
Total parent company
|
|
|
|
-
|
|
242
|
|
-
|
|
4
|
|
-
|
|
(60)
|
|
-
|
|
-
|
|
Carnes
Pampeanas
|
|
Other
Liabilities
|
|
-
|
|
-
|
|
-
|
|
-
|
|
-
|
|
-
|
|
-
|
|
-
|
|
Consultores
Asset Management
|
|
Reimbursement
of expenses
|
|
-
|
|
-
|
|
-
|
|
5
|
|
-
|
|
(3)
|
|
-
|
|
-
|
|
Estudio Zang,
Bergel y Viñes
|
|
Legal
services
|
|
-
|
|
-
|
|
-
|
|
-
|
|
-
|
|
(4)
|
|
-
|
|
-
|
|
IFISA
|
|
Borrowings
|
|
-
|
|
-
|
|
-
|
|
1,283
|
|
-
|
|
-
|
|
-
|
|
-
|
|
Taaman
|
|
Leases and/or
rights of use
|
|
-
|
|
-
|
|
-
|
|
-
|
|
-
|
|
(24)
|
|
-
|
|
-
|
|
Willifood
|
|
NCN
|
|
-
|
|
-
|
|
-
|
|
-
|
|
-
|
|
(29)
|
|
-
|
|
-
|
|
Museo de los
Niños
|
|
Leases and/or
rights of use
|
|
-
|
|
-
|
|
-
|
|
2
|
|
-
|
|
-
|
|
-
|
|
-
|
|
Directors
|
|
Fees
|
|
-
|
|
-
|
|
-
|
|
-
|
|
-
|
|
(44)
|
|
-
|
|
-
|
|
Total others
|
|
|
|
-
|
|
-
|
|
-
|
|
1,290
|
|
-
|
|
(104)
|
|
-
|
|
-
|
|
Total as of 06.30.17
|
|
|
|
82
|
|
242
|
|
84
|
|
1,350
|
|
-
|
|
(172)
|
|
-
|
|
(11)
|
F-114
IRSA Inversiones
y Representaciones Sociedad Anónima
The following
is a summary presentation of the balances with related parties as
of June 30, 2016:
|
Related party
|
|
Description of transaction
|
|
Investments in financial assets
non-current
|
|
Investments in financial assets
current
|
|
Trade and other receivables
non-current
|
|
Trade and other receivables current
|
|
Trade and other payables
non-current
|
|
Trade and other payables
current
|
|
Borrowings
non-current
|
|
Borrowings
current
|
|
BHSA
|
|
Reimbursement
of expenses
|
|
-
|
|
-
|
|
-
|
|
-
|
|
-
|
|
(1)
|
|
-
|
|
-
|
|
|
|
Borrowings
|
|
-
|
|
-
|
|
-
|
|
-
|
|
-
|
|
-
|
|
(2)
|
|
(10)
|
|
Condor
|
|
Public
companies securities
|
|
499
|
|
-
|
|
-
|
|
-
|
|
-
|
|
-
|
|
-
|
|
-
|
|
Lipstick
|
|
Reimbursement
of expenses
|
|
-
|
|
-
|
|
-
|
|
2
|
|
-
|
|
-
|
|
-
|
|
-
|
|
New
Lipstick
|
|
Reimbursement
of expenses
|
|
-
|
|
-
|
|
-
|
|
5
|
|
-
|
|
-
|
|
-
|
|
-
|
|
BACS
|
|
NCN
|
|
100
|
|
21
|
|
-
|
|
-
|
|
-
|
|
-
|
|
-
|
|
-
|
|
|
|
Reimbursement
of expenses
|
|
-
|
|
-
|
|
-
|
|
1
|
|
-
|
|
-
|
|
-
|
|
-
|
|
Tarshop
|
|
Reimbursement
of expenses
|
|
-
|
|
-
|
|
-
|
|
1
|
|
-
|
|
-
|
|
-
|
|
-
|
|
|
|
Leases and/or
rights of use
|
|
-
|
|
-
|
|
-
|
|
-
|
|
-
|
|
(1)
|
|
-
|
|
-
|
|
Total associates
|
|
|
|
599
|
|
21
|
|
-
|
|
9
|
|
-
|
|
(2)
|
|
(2)
|
|
(10)
|
|
Cyrsa
S.A.
|
|
Borrowings
|
|
-
|
|
-
|
|
-
|
|
-
|
|
-
|
|
-
|
|
-
|
|
(14)
|
|
|
|
Credit due to
capital reduction
|
|
-
|
|
-
|
|
-
|
|
3
|
|
-
|
|
-
|
|
-
|
|
-
|
|
NPSF
|
|
Reimbursement
of expenses
|
|
-
|
|
-
|
|
-
|
|
2
|
|
-
|
|
-
|
|
-
|
|
-
|
|
|
|
Share-based
contribution plan
|
|
-
|
|
-
|
|
-
|
|
1
|
|
-
|
|
-
|
|
-
|
|
-
|
|
|
|
Borrowings
|
|
-
|
|
-
|
|
-
|
|
-
|
|
-
|
|
-
|
|
-
|
|
(6)
|
|
|
|
Management
fees
|
|
-
|
|
-
|
|
-
|
|
4
|
|
-
|
|
-
|
|
-
|
|
-
|
|
Puerto
Retiro
|
|
Borrowings
|
|
-
|
|
-
|
|
-
|
|
3
|
|
-
|
|
-
|
|
-
|
|
-
|
|
Quality
|
|
Reimbursement
of expenses
|
|
-
|
|
-
|
|
-
|
|
1
|
|
-
|
|
-
|
|
-
|
|
-
|
|
Total joint ventures
|
|
|
|
-
|
|
-
|
|
-
|
|
14
|
|
-
|
|
-
|
|
-
|
|
(20)
|
|
Cresud
|
|
Reimbursement
of expenses
|
|
-
|
|
-
|
|
-
|
|
-
|
|
-
|
|
(30)
|
|
-
|
|
-
|
|
|
|
Corporate
services
|
|
-
|
|
-
|
|
-
|
|
-
|
|
-
|
|
(67)
|
|
-
|
|
-
|
|
|
|
NCN
|
|
-
|
|
329
|
|
-
|
|
-
|
|
-
|
|
-
|
|
-
|
|
-
|
|
|
|
Leases and/or
rights of use
|
|
-
|
|
-
|
|
-
|
|
4
|
|
-
|
|
-
|
|
-
|
|
-
|
|
|
|
Long-term
incentive plan
|
|
-
|
|
-
|
|
-
|
|
3
|
|
-
|
|
-
|
|
-
|
|
-
|
|
Total parent company
|
|
|
|
-
|
|
329
|
|
-
|
|
7
|
|
-
|
|
(97)
|
|
-
|
|
-
|
|
Carnes
Pampeanas
|
|
Transfer of tax
credits
|
|
-
|
|
-
|
|
-
|
|
-
|
|
-
|
|
(7)
|
|
-
|
|
-
|
|
Consultores
Asset Management
|
|
Reimbursement
of expenses
|
|
-
|
|
-
|
|
-
|
|
7
|
|
-
|
|
-
|
|
-
|
|
-
|
|
Avenida Compras
S.A.
|
|
Advertising
spaces
|
|
-
|
|
-
|
|
-
|
|
1
|
|
-
|
|
-
|
|
-
|
|
-
|
|
Avenida
Inc.
|
|
Advertising
spaces
|
|
-
|
|
-
|
|
-
|
|
1
|
|
-
|
|
-
|
|
-
|
|
-
|
|
BNSA
|
|
Reimbursement
of expenses
|
|
-
|
|
-
|
|
-
|
|
1
|
|
-
|
|
-
|
|
-
|
|
-
|
|
|
|
Other
payables
|
|
-
|
|
-
|
|
-
|
|
-
|
|
-
|
|
(1)
|
|
-
|
|
-
|
|
OASA
|
|
Borrowings
|
|
-
|
|
-
|
|
-
|
|
1
|
|
-
|
|
-
|
|
-
|
|
-
|
|
Estudio Zang,
Bergel y Viñes
|
|
Legal
services
|
|
-
|
|
-
|
|
-
|
|
-
|
|
-
|
|
(1)
|
|
-
|
|
-
|
|
Consultores
Venture Capital Uruguay
|
|
Management
fees
|
|
-
|
|
-
|
|
-
|
|
2
|
|
-
|
|
-
|
|
-
|
|
-
|
|
IFISA
|
|
Borrowings
|
|
-
|
|
-
|
|
-
|
|
1,074
|
|
-
|
|
-
|
|
-
|
|
-
|
|
Museo de los
Niños
|
|
Leases and/or
rights of use
|
|
-
|
|
-
|
|
-
|
|
1
|
|
-
|
|
-
|
|
-
|
|
-
|
|
Directors
|
|
Advances
|
|
-
|
|
-
|
|
-
|
|
4
|
|
-
|
|
-
|
|
-
|
|
-
|
|
|
|
Fees
|
|
-
|
|
-
|
|
-
|
|
-
|
|
-
|
|
(28)
|
|
-
|
|
-
|
|
Total others
|
|
|
|
-
|
|
-
|
|
-
|
|
1,092
|
|
-
|
|
(37)
|
|
-
|
|
-
|
|
Total as of 06.30.16 (recast)
|
|
|
|
599
|
|
350
|
|
-
|
|
1,122
|
|
-
|
|
(136)
|
|
(2)
|
|
(30)
|
F-115
IRSA Inversiones
y Representaciones Sociedad Anónima
The following
is a summary presentation of the balances with related parties as
of June 30, 2015:
|
Related party
|
|
Description of transaction
|
|
Investments in financial assets
non-current
|
|
Investments in financial assets
current
|
|
Trade and other receivables
non-current
|
|
Trade and other receivables current
|
|
Trade and other payables
non-current
|
|
Trade and other payables
current
|
|
Borrowings
non-current
|
|
Borrowings
current
|
|
BHSA
|
|
Advances
|
|
-
|
|
-
|
|
-
|
|
-
|
|
-
|
|
(1)
|
|
-
|
|
-
|
|
|
|
Borrowings
|
|
-
|
|
-
|
|
-
|
|
-
|
|
-
|
|
-
|
|
(7)
|
|
(22)
|
|
|
|
Leases and/or
rights of use
|
|
-
|
|
-
|
|
-
|
|
1
|
|
-
|
|
-
|
|
-
|
|
-
|
|
Lipstick
|
|
Reimbursement
of expenses
|
|
-
|
|
-
|
|
-
|
|
1
|
|
-
|
|
-
|
|
-
|
|
-
|
|
New
Lipstick
|
|
Reimbursement
of expenses
|
|
-
|
|
-
|
|
-
|
|
3
|
|
-
|
|
-
|
|
-
|
|
-
|
|
BACS
|
|
NCN
|
|
100
|
|
-
|
|
-
|
|
-
|
|
-
|
|
-
|
|
-
|
|
-
|
|
|
|
Reimbursement
of expenses
|
|
-
|
|
-
|
|
-
|
|
2
|
|
-
|
|
-
|
|
-
|
|
-
|
|
Tarshop
|
|
Reimbursement
of expenses
|
|
-
|
|
-
|
|
-
|
|
2
|
|
-
|
|
-
|
|
-
|
|
-
|
|
|
|
Leases and/or
rights of use
|
|
-
|
|
-
|
|
-
|
|
-
|
|
-
|
|
(1)
|
|
-
|
|
-
|
|
Condor
|
|
Borrowings
|
|
-
|
|
-
|
|
-
|
|
29
|
|
-
|
|
-
|
|
-
|
|
-
|
|
Total associates
|
|
|
|
100
|
|
-
|
|
-
|
|
38
|
|
-
|
|
(2)
|
|
(7)
|
|
(22)
|
|
Baicom Networks
S.A.
|
|
Borrowings
|
|
-
|
|
-
|
|
1
|
|
-
|
|
-
|
|
-
|
|
-
|
|
-
|
|
|
|
Reimbursement
of expenses
|
|
-
|
|
-
|
|
-
|
|
1
|
|
-
|
|
-
|
|
-
|
|
-
|
|
Cyrsa
S.A.
|
|
Borrowings
|
|
-
|
|
-
|
|
-
|
|
-
|
|
-
|
|
-
|
|
(14)
|
|
-
|
|
|
|
Credit due to
capital reduction
|
|
-
|
|
-
|
|
-
|
|
9
|
|
-
|
|
-
|
|
-
|
|
-
|
|
NPSF
|
|
Reimbursement
of expenses
|
|
-
|
|
-
|
|
-
|
|
1
|
|
-
|
|
-
|
|
-
|
|
-
|
|
|
|
Leases and/or
rights of use
|
|
-
|
|
-
|
|
-
|
|
-
|
|
-
|
|
(1)
|
|
-
|
|
-
|
|
|
|
Borrowings
|
|
-
|
|
-
|
|
-
|
|
-
|
|
-
|
|
-
|
|
-
|
|
(8)
|
|
|
|
Management
fees
|
|
-
|
|
-
|
|
-
|
|
3
|
|
-
|
|
-
|
|
-
|
|
-
|
|
Puerto
Retiro
|
|
Borrowings
|
|
-
|
|
-
|
|
-
|
|
2
|
|
-
|
|
-
|
|
-
|
|
-
|
|
Total joint ventures
|
|
|
|
-
|
|
-
|
|
1
|
|
16
|
|
-
|
|
(1)
|
|
(14)
|
|
(8)
|
|
Cresud
|
|
Reimbursement
of expenses
|
|
-
|
|
-
|
|
-
|
|
-
|
|
-
|
|
(10)
|
|
-
|
|
-
|
|
|
|
Corporate
services
|
|
-
|
|
-
|
|
-
|
|
-
|
|
-
|
|
(52)
|
|
-
|
|
-
|
|
|
|
NCN
|
|
-
|
|
30
|
|
-
|
|
-
|
|
-
|
|
-
|
|
(17)
|
|
(1)
|
|
|
|
Leases and/or
rights of use
|
|
-
|
|
-
|
|
-
|
|
1
|
|
-
|
|
-
|
|
-
|
|
-
|
|
|
|
Long-term
incentive plan
|
|
-
|
|
-
|
|
-
|
|
-
|
|
-
|
|
(25)
|
|
-
|
|
-
|
|
Total parent company
|
|
|
|
-
|
|
30
|
|
-
|
|
1
|
|
-
|
|
(87)
|
|
(17)
|
|
(1)
|
|
Helmir
|
|
NCN
|
|
-
|
|
-
|
|
-
|
|
-
|
|
-
|
|
-
|
|
(28)
|
|
(1)
|
|
Carnes
Pampeanas
|
|
Transfer of tax
credits
|
|
-
|
|
-
|
|
-
|
|
-
|
|
-
|
|
(3)
|
|
-
|
|
-
|
|
Consultores
Asset Management
|
|
Reimbursement
of expenses
|
|
-
|
|
-
|
|
-
|
|
5
|
|
-
|
|
-
|
|
-
|
|
-
|
|
Estudio Zang,
Bergel y Viñes
|
|
Legal
services
|
|
-
|
|
-
|
|
-
|
|
-
|
|
-
|
|
(1)
|
|
-
|
|
-
|
|
CVC
Uruguay
|
|
Management
fees
|
|
-
|
|
-
|
|
-
|
|
1
|
|
-
|
|
-
|
|
-
|
|
-
|
|
Ogden Argentina
S.A.
|
|
Borrowings
|
|
-
|
|
-
|
|
-
|
|
1
|
|
-
|
|
-
|
|
-
|
|
-
|
|
IFISA
|
|
Borrowings
|
|
-
|
|
-
|
|
-
|
|
265
|
|
-
|
|
-
|
|
-
|
|
-
|
|
Museo de los
Niños
|
|
Leases and/or
rights of use
|
|
-
|
|
-
|
|
-
|
|
2
|
|
-
|
|
-
|
|
-
|
|
-
|
|
Boulevard Norte
S.A.
|
|
Reimbursement
of expenses
|
|
-
|
|
-
|
|
-
|
|
1
|
|
-
|
|
-
|
|
-
|
|
-
|
|
Directors
|
|
Fees
|
|
-
|
|
-
|
|
-
|
|
-
|
|
-
|
|
(41)
|
|
-
|
|
-
|
|
Total others
|
|
|
|
-
|
|
-
|
|
-
|
|
275
|
|
-
|
|
(45)
|
|
(28)
|
|
(1)
|
|
Total as of 06.30.15 (recast)
|
|
|
|
100
|
|
30
|
|
1
|
|
330
|
|
-
|
|
(135)
|
|
(66)
|
|
(32)
|
F-116
IRSA Inversiones
y Representaciones Sociedad Anónima
The following
is a summary presentation of the transactions with related parties
for the year ended June 30, 2017:
|
Related
party
|
Leases
and/or rights of use
|
Management
fees
|
Sale of
goods
|
Corporate
services
|
Legal
services
|
Financial
operations
|
Donations
|
Fees and
salaries
|
|
BHSA
|
10
|
-
|
-
|
-
|
-
|
(2
)
|
-
|
-
|
|
BACS
|
1
|
-
|
-
|
-
|
-
|
39
|
-
|
-
|
|
Manibil
|
-
|
-
|
-
|
-
|
-
|
-
|
-
|
-
|
|
Adama
|
-
|
-
|
-
|
293
|
-
|
-
|
-
|
-
|
|
Condor
|
-
|
-
|
-
|
-
|
-
|
235
|
-
|
-
|
|
Tarshop
|
14
|
-
|
-
|
-
|
-
|
-
|
-
|
-
|
|
Total
associates
|
25
|
-
|
-
|
293
|
-
|
272
|
-
|
-
|
|
Cyrsa S.A.
|
-
|
-
|
-
|
-
|
-
|
(2
)
|
-
|
-
|
|
NPSF
|
6
|
4
|
-
|
-
|
-
|
-
|
-
|
-
|
|
Total
joint ventures
|
6
|
4
|
-
|
-
|
-
|
(2
)
|
-
|
-
|
|
Cresud
|
2
|
-
|
-
|
(177
)
|
-
|
62
|
-
|
-
|
|
Total
parent company
|
2
|
-
|
-
|
(177
)
|
-
|
62
|
-
|
-
|
|
Estudio Zang, Bergel &
Viñes
|
-
|
-
|
-
|
-
|
(4
)
|
-
|
-
|
-
|
|
Isaac Elsztain e hijos
S.C.A
|
(1
)
|
-
|
-
|
-
|
-
|
-
|
-
|
-
|
|
Consultores Assets
Management
|
1
|
-
|
-
|
-
|
-
|
-
|
-
|
-
|
|
Hamonet S.A.
|
(1
)
|
-
|
-
|
-
|
-
|
-
|
-
|
-
|
|
Fundación
IRSA
|
-
|
-
|
-
|
-
|
-
|
-
|
(9
)
|
-
|
|
BHN Sociedad de
Inversión S.A.
|
1
|
-
|
-
|
-
|
-
|
-
|
-
|
-
|
|
BACS Administradora de
Activos S.A.
|
2
|
-
|
-
|
-
|
-
|
-
|
-
|
-
|
|
BHN Seguros Generales
S.A.
|
2
|
-
|
-
|
-
|
-
|
-
|
-
|
-
|
|
BHN Vida S.A.
|
18
|
-
|
-
|
-
|
-
|
-
|
-
|
-
|
|
IFISA
|
-
|
-
|
-
|
-
|
-
|
(116
)
|
-
|
-
|
|
Directors
|
-
|
-
|
-
|
-
|
-
|
-
|
-
|
(112
)
|
|
Senior
Management
|
-
|
-
|
-
|
-
|
-
|
-
|
-
|
(1
)
|
|
Total
others
|
22
|
-
|
-
|
-
|
(4
)
|
(116
)
|
(9
)
|
(113
)
|
|
Total as
of 06.30.17
|
55
|
4
|
-
|
116
|
(4
)
|
216
|
(9
)
|
(113
)
|
The following
is a summary presentation of the transactions with related parties
for the year ended June 30, 2016:
|
Related
party
|
Leases
and/or rights of use
|
Management
fees
|
Sale of
goods
|
Corporate
services
|
Legal
services
|
Financial
operations
|
Donations
|
Fees and
salaries
|
|
BHSA
|
3
|
-
|
-
|
-
|
-
|
(4
)
|
-
|
-
|
|
BACS
|
6
|
-
|
-
|
-
|
-
|
21
|
-
|
-
|
|
Tarshop
|
12
|
-
|
-
|
-
|
-
|
-
|
-
|
-
|
|
Condor
|
-
|
-
|
-
|
-
|
-
|
122
|
-
|
-
|
|
Adama
|
-
|
-
|
16
|
-
|
-
|
-
|
-
|
-
|
|
ISPRO
|
-
|
-
|
9
|
-
|
-
|
-
|
-
|
-
|
|
Total
associates
|
21
|
-
|
25
|
-
|
-
|
139
|
-
|
-
|
|
Cyrsa S.A.
|
-
|
-
|
-
|
-
|
-
|
(3
)
|
-
|
-
|
|
NPSF
|
-
|
3
|
-
|
-
|
-
|
(2
)
|
-
|
-
|
|
Puerto Retiro
|
-
|
-
|
-
|
-
|
-
|
1
|
-
|
-
|
|
Mehadrin
|
-
|
-
|
48
|
-
|
-
|
-
|
-
|
-
|
|
Total
joint ventures
|
-
|
3
|
48
|
-
|
-
|
(4
)
|
-
|
-
|
F-117
IRSA Inversiones
y Representaciones Sociedad Anónima
|
Related
party
|
Leases
and/or rights of use
|
Management
fees
|
Sale of
goods
|
Corporate
services
|
Legal
services
|
Financial
operations
|
Donations
|
Fees and
salaries
|
|
Cresud
|
7
|
-
|
-
|
(121
)
|
-
|
74
|
-
|
-
|
|
Total
parent company
|
7
|
-
|
-
|
(121
)
|
-
|
74
|
-
|
-
|
|
Estudio Zang, Bergel &
Viñes
|
-
|
-
|
-
|
-
|
(5
)
|
-
|
-
|
-
|
|
Isaac Elsztain e Hijos
S.C.A.
|
(1
)
|
-
|
-
|
-
|
-
|
-
|
-
|
-
|
|
Fundación
IRSA
|
-
|
-
|
-
|
-
|
-
|
-
|
(8
)
|
-
|
|
IFISA
|
-
|
-
|
-
|
-
|
-
|
31
|
-
|
-
|
|
Directors
|
-
|
-
|
-
|
-
|
-
|
-
|
-
|
(137
)
|
|
Senior
Management
|
-
|
-
|
-
|
-
|
-
|
-
|
-
|
(9
)
|
|
Total
others
|
(1
)
|
-
|
-
|
-
|
(5
)
|
31
|
(8
)
|
(146
)
|
|
Total as
of 06.30.16 (recast)
|
27
|
3
|
73
|
(121
)
|
(5
)
|
240
|
(8
)
|
(146
)
|
The following
is a summary presentation of the transactions with related parties
for the year ended June 30, 2015:
|
Related
party
|
Leases
and/or rights of use
|
Management
fees
|
Sale of
goods
|
Corporate
services
|
Legal
services
|
Financial
operations
|
Donations
|
Fees and
salaries
|
|
BHSA
|
2
|
-
|
-
|
-
|
-
|
-
|
-
|
-
|
|
BACS
|
4
|
-
|
-
|
-
|
-
|
-
|
-
|
-
|
|
Condor
|
-
|
-
|
-
|
-
|
-
|
161
|
-
|
-
|
|
Tarshop
|
9
|
-
|
-
|
-
|
-
|
-
|
-
|
-
|
|
Total
associates
|
15
|
-
|
-
|
-
|
-
|
161
|
-
|
-
|
|
Cyrsa S.A.
|
-
|
-
|
-
|
-
|
-
|
(9
)
|
-
|
-
|
|
NPSF
|
(1
)
|
2
|
-
|
-
|
-
|
(1
)
|
-
|
-
|
|
Puerto Retiro
|
-
|
-
|
-
|
-
|
-
|
1
|
-
|
-
|
|
Total
joint ventures
|
(1
)
|
2
|
-
|
-
|
-
|
(9
)
|
-
|
-
|
|
Cresud
|
4
|
-
|
-
|
(96
)
|
-
|
(8
)
|
-
|
-
|
|
Total
parent company
|
4
|
-
|
-
|
(96
)
|
-
|
(8
)
|
-
|
-
|
|
Estudio Zang, Bergel &
Viñes
|
-
|
-
|
-
|
-
|
(4
)
|
-
|
-
|
-
|
|
Fundación
IRSA
|
-
|
-
|
-
|
-
|
-
|
-
|
(5
)
|
-
|
|
IFISA
|
-
|
-
|
-
|
-
|
-
|
222
|
-
|
-
|
|
Directors
|
-
|
-
|
-
|
-
|
-
|
-
|
-
|
(99
)
|
|
Senior
Management
|
-
|
-
|
-
|
-
|
-
|
-
|
-
|
(6
)
|
|
Total
others
|
-
|
-
|
-
|
-
|
(4
)
|
222
|
(5
)
|
(105
)
|
|
Total as
of 06.30.15 (recast)
|
18
|
2
|
-
|
(96
)
|
(4
)
|
366
|
(5
)
|
(105
)
|
F-118
IRSA Inversiones
y Representaciones Sociedad Anónima
30.
Foreign currency assets and
liabilities
|
|
Amount
(1)
|
Exchange
rate (2)
|
Total as
of 06.30.17
|
Amount
(1)
|
Exchange
rate (2)
|
Total as
of 06.30.16 (recast)
|
Amount
(1)
|
Exchange
rate (2)
|
Total as
of 06.30.15 (recast)
|
|
Assets
|
|
|
|
|
|
|
|
|
|
|
Trade
and other receivables
|
|
|
|
|
|
|
|
|
|
|
US
Dollar
|
35
|
16.530
|
572
|
38
|
14.940
|
563
|
11
|
8.988
|
99
|
|
Euros
|
9
|
18.848
|
172
|
12
|
16.492
|
195
|
-
|
10.005
|
-
|
|
Uruguayan
Pesos
|
-
|
0.572
|
-
|
2
|
0.489
|
1
|
1
|
0.334
|
-
|
|
New Israel
Shekel
|
-
|
-
|
-
|
-
|
-
|
-
|
15
|
2.381
|
36
|
|
Receivables
with related parties:
|
|
|
|
|
|
|
|
|
|
|
US
Dollar
|
52
|
16.530
|
855
|
41
|
15.040
|
624
|
4
|
9.088
|
37
|
|
Total
trade and other receivables
|
|
|
1,599
|
|
|
1,383
|
|
|
172
|
|
Restricted
assets
|
|
|
|
|
|
|
|
|
|
|
US
Dollar
|
2
|
16.530
|
41
|
-
|
-
|
-
|
-
|
-
|
-
|
|
Total
restricted assets
|
|
|
41
|
|
|
-
|
|
|
-
|
|
Investments
in financial assets
|
|
|
|
|
|
|
|
|
|
|
US
Dollar
|
61
|
16.530
|
1,014
|
165
|
14.940
|
2,470
|
27
|
8.988
|
239
|
|
Pounds
|
1
|
21.486
|
18
|
1
|
19.763
|
10
|
1
|
14.134
|
10
|
|
New Israel
Shekel
|
-
|
-
|
-
|
-
|
-
|
-
|
3
|
2.381
|
6
|
|
Investments
with related parties:
|
|
|
|
|
|
|
|
|
|
|
US
Dollar
|
20
|
16.530
|
324
|
55
|
15.040
|
827
|
50
|
9.088
|
459
|
|
Total
investments in financial assets
|
|
|
1,356
|
|
|
3,307
|
|
|
714
|
|
Derivative
financial instruments
|
|
|
|
|
|
|
|
|
|
|
US
Dollar
|
1
|
16.530
|
10
|
-
|
-
|
-
|
-
|
-
|
-
|
|
New Israel
Shekel
|
-
|
-
|
-
|
-
|
-
|
-
|
96
|
2.381
|
228
|
|
Derivative
financial instruments with related parties:
|
|
|
|
|
|
|
|
|
|
|
US
Dollar
|
2
|
16.630
|
26
|
-
|
-
|
-
|
-
|
-
|
-
|
|
Total
derivative financial instruments
|
|
|
36
|
|
|
-
|
|
|
228
|
|
Cash and
cash equivalents
|
|
|
|
|
|
|
|
|
|
|
US
Dollar
|
318
|
16.530
|
5,250
|
84
|
14.940
|
1,248
|
34
|
8.988
|
301
|
|
Euros
|
3
|
18.848
|
49
|
4
|
16.492
|
60
|
-
|
10.005
|
1
|
|
New Israel
Shekel
|
-
|
4.770
|
1
|
-
|
-
|
-
|
-
|
2.381
|
2
|
|
Total
cash and cash equivalents
|
|
|
5,300
|
|
|
1,308
|
|
|
304
|
|
Total
assets
|
|
|
8,332
|
|
|
5,998
|
|
|
1,418
|
|
|
|
|
|
|
|
|
|
|
|
|
Liabilities
|
|
|
|
|
|
|
|
|
|
|
Trade
and other payables
|
|
|
|
|
|
|
|
|
|
|
US
Dollar
|
57
|
16.630
|
955
|
96
|
15.040
|
1,451
|
8
|
9.088
|
76
|
|
Euros
|
1
|
19.003
|
19
|
3
|
16.640
|
54
|
-
|
-
|
-
|
|
New Israel
Shekel
|
-
|
-
|
-
|
2
|
3.892
|
7
|
-
|
-
|
-
|
|
Payables
with related parties:
|
|
|
|
|
|
|
|
|
|
|
US
Dollar
|
1
|
16.630
|
21
|
2
|
15.040
|
31
|
-
|
-
|
-
|
|
Total
trade and other payables
|
|
|
995
|
|
|
1,543
|
|
|
76
|
|
Borrowings
|
|
|
|
|
|
|
|
|
|
|
US
Dollar
|
1,123
|
16.630
|
18,683
|
1,704
|
15.040
|
25,631
|
403
|
9.088
|
3,661
|
|
Euros
|
-
|
-
|
-
|
2
|
16.640
|
39
|
-
|
-
|
-
|
|
Borrowings
with related parties:
|
|
|
|
|
|
|
|
|
|
|
US
Dollar
|
-
|
-
|
-
|
-
|
-
|
-
|
5
|
9.088
|
41
|
|
Total
borrowings
|
|
|
18,683
|
|
|
25,670
|
|
|
3,702
|
|
Derivative
financial instruments
|
|
|
|
|
|
|
|
|
|
|
New Israel
Shekel
|
-
|
-
|
-
|
-
|
-
|
-
|
208
|
2.407
|
501
|
|
Total
derivative financial instruments
|
|
|
-
|
|
|
-
|
|
|
501
|
|
Total
liabilities
|
|
|
19,678
|
|
|
27,213
|
|
|
4,279
|
(1)
Stated
in millions of units in foreign currency. Considering foreign
currencies those that differ from each Group’s functional
currency at each year-end.
(2)
Exchange rate as of June 30, of each year
according to Banco Nación Argentina records.
(3)
The Group uses derivative instruments as
complement in order to reduce its exposure to exchange rate
movements. (See Note 14).
F-119
IRSA Inversiones
y Representaciones Sociedad Anónima
31.
Groups of assets and
liabilities held for sale
As mentioned in Note 4.F., the
investment in Israir has been reclassified to "Group of assets and
liabilities held for sale". Additionally, IDB Tourism is currently
negotiating the sale of its equity interests in Open Sky Ltd., in
terms and conditions that have not been fully set yet; the assets
and liabilities related to Open Sky Ltd. operations have been also
reclassified. Furthermore, the equity interest of the Group in
Adama and the related non-recourse loan, had been reclassified to
assets and liabilities held for sale before the disposal as of
November 22, 2016 (Note 4.A.).
Pursuant to IFRS 5, assets and
liabilities held for sale have been valued at the lower between
their carrying value and fair value less cost of sale. Given some
assets’ carrying value was higher, an impairment loss of Ps.
231 has been recorded.
The following table shows the main
assets and liabilities classified as held for sale:
Group of assets held for
sale:
|
|
June 30,
2017
|
|
Property, plant and
equipment
|
1,712
|
|
Intangible
assets
|
19
|
|
Investments in
associates
|
33
|
|
Deferred income tax
assets
|
57
|
|
Employee
benefits
|
5
|
|
Income tax
credits
|
10
|
|
Trade and other
receivables
|
688
|
|
Cash and cash
equivalents
|
157
|
|
Total
|
2,681
|
Liabilities directly associated with
the group of assets held for sale:
|
|
June 30,
2017
|
|
Trade and other
payables
|
930
|
|
Salaries and social
security liabilities
|
148
|
|
Employee
benefits
|
52
|
|
Deferred income tax
liability
|
10
|
|
Borrowings
|
715
|
|
Total
|
1,855
|
F-120
IRSA Inversiones
y Representaciones Sociedad Anónima
32.
Results from discontinued
operations
The results of Israir Open Sky and
IDB Tourism operations, the share of profit of Adama and the
finance costs associated to the non-recourse loan, until its sale,
and the results from sale of the investment in Adama have been
reclassified in the Statements of Income under discontinued
operations.
|
|
June 30,
2017
|
June 30,
2016 (recast)
|
||||
|
|
Adama
|
IDB
Tourism
|
Total
|
Adama
|
IDB
Tourism
|
Total
|
|
Revenues
|
-
|
4,410
|
4,410
|
-
|
1,152
|
1,152
|
|
Costs
|
-
|
(3,795
)
|
(3,795
)
|
-
|
(1,010
)
|
(1,010
)
|
|
Gross
profit
|
-
|
615
|
615
|
-
|
142
|
142
|
|
General and administrative
expenses
|
-
|
(233
)
|
(233
)
|
-
|
(94
)
|
(94
)
|
|
Selling
expenses
|
-
|
(221
)
|
(221
)
|
-
|
(93
)
|
(93
)
|
|
Other operating results,
net (i)
|
4,216
|
(264
)
|
3,952
|
-
|
13
|
13
|
|
Profit /
(loss) from operations
|
4,216
|
(103
)
|
4,113
|
-
|
(32
)
|
(32
)
|
|
Share of profit of joint
ventures and associates
|
255
|
43
|
298
|
335
|
9
|
344
|
|
Profit /
(loss) before financial results and income tax
|
4,471
|
(60
)
|
4,411
|
335
|
(23
)
|
312
|
|
Finance income
|
-
|
4
|
4
|
373
|
3
|
376
|
|
Finance cost
|
(1,346
)
|
(60
)
|
(1,406
)
|
(238
)
|
(32
)
|
(270
)
|
|
Other financial
results
|
-
|
-
|
-
|
-
|
-
|
-
|
|
Financial
results, net
|
(1,346
)
|
(56
)
|
(1,402
)
|
135
|
(29
)
|
106
|
|
Profit /
(loss) before income tax
|
3,125
|
(116
)
|
3,009
|
470
|
(52
)
|
418
|
|
Income tax
|
-
|
9
|
9
|
-
|
26
|
26
|
|
Profit /
(loss) from discontinued operations for the year
|
3,125
|
(107
)
|
3,018
|
470
|
(26
)
|
444
|
(i)
Corresponds to the profit from the sale of
Adama.
33.
Subsequent
events
Issuance
of non-convertible notes series N
In July 2017, IDBD made a public
offering of approximately NIS 642.1 nominal value of corporate
notes (Series N), the corporate notes accrue interest at a 5%
annual rate. Taking into account the issue costs, the net
consideration reflects an effective interest rate of 5.3% per
year.
Principal will be repaid in one
bullet payment due on December 30, 2022 while interest will be
payable quarterly in four installments every year, on the thirtieth
day of March, June, September and December each year for the period
2017-2022. IDBD is entitled to redeem corporate notes, in whole or
in part, through an early redemption in accordance with the
provisions of the issue prospectus.
To secure full compliance with all
commitments, IDBD has pledged around 60.4 million of shares of DIC
with a single first lien and in guarantee by means of the lien, in
an unlimited amount, in favor of the trustee for the benefit of
corporate note-holders.
F-121
IRSA Inversiones
y Representaciones Sociedad Anónima
Tender
offer for Clal
In July 2017, IDBD received an
initial non-binding offer from an international group for the
potential acquisition of its interest in Clal. The offer provides
the execution of a transaction, which consideration will be based
on the equity value of Clal, in accordance with Clal Financial
Statement at the time of finalizing the transaction. On June 30,
2017, this value amounted to NIS 4,880 (equivalent to approximately
Ps. 23,011 as of the date of the Consolidated Financial
Statements). This transaction is contingent upon performance of a
due diligence and the execution of an agreement, as well as getting
the approvals required by law. IDBD is analyzing the offer. There
is no certainty that the offer will go forward under the terms
offered, or that the transaction will be completed.
On August 30,
2017, IDBD sold an additional 5% of its equity interest in Clal
through a swap transaction, based on the same principles that were
applied to the swap transaction mentioned in Note 14. The
consideration for the transaction amounted to around NIS 152.5
(equivalent to approximately Ps. 762 as of the transaction date).
Following completion of the transaction, IDBD’s interest in
Clal was reduced from 49.9% to 44.9% of its capital
stock.
Ispro
In August 2017, the Board of
Directors of PBC decided to start a process to examine the
potential sale of its interest in Ispro. In this respect, it has
received several offers.
IRSA CP
Non-Convertible notes Classes III and IV
On September 5, 2017, NCN Class III
and IV were tendered under the Program approved by the
Shareholders’ Meeting for up to US$ 500. The settlement will
take place on September 12, 2017. The offering of Class III bonds
was declared vacant. The results of the Class IV offer are shown
below:
●
NCN Class IV for a Nominal Value of US$ 140 to
be matured 36 months after the issuing date, paid in and payable in
US Dollars, which will accrue interest at an annual fixed interest
rate of 5.0%, interest payable on a quarterly basis. Principal will
be amortized in only one installment due on September 14,
2020.
DIC’s debt
exchange
On September 28, 2017 DIC made a
partial exchange offer to the holders of DIC’s series F
bonds, in return for DIC’s series J bonds (a new series).
DIC’s series J bonds has terms that are materially different
from the series F, so this will be treated in accordance with
international accounting rules as the repayment of the existing
original financial undertaking and the recognition of a new
financial undertaking at fair value. As a result of this exchange,
the DIC registered a loss for the difference between the
cancellation and the value of the new debt, in the approximate
amount of NIS 459 million (approximately PS. 2,228 at the date of
the exchange).
Metropolitan’s
debt refinancing
Metropolitan
885 Third Avenue Leasehold LLC ("Metropolitan"), a subsidiary of
New Lipstick, has renegotiated its debt for a total amount of US$
113.1 million non-recourse to IRSA originally maturing on August
1st, 2017, extending the maturity to April 30, 2020, obtaining a
US$ 20 million foregiveness by the lending bank and reducing the
interest rate of Libor + 4 bps to Libor + 2 bps; after canceling
US$ 40 million in cash, of which IRSA has contributed US$ 20
million. Subsequently to the renegotiation, Metropolitan’s
debt amounts to US $ 53.1 million.
Selling of IRSA CP’
ADSs
On
October 27, 2017, the Company reported that it has completed the
sale in the secondary market of 2,460,000 common shares of IRSA CP,
par value Ps.1.00 per share, represented by American Depositary
Shares (“ADSs”), each representing four common shares.
The ADSs were exclusively offered and sold outside Argentina. J.P.
Morgan served as underwriter for the offering.
F-122
IRSA Inversiones
y Representaciones Sociedad Anónima
Schedule
I
The following is a summary of the
Group’s investment properties as of June 30, 2017 prepared in
accordance with SEC Regulation S-X 12-28:
|
|
|
Initial
costs
|
Subsequent
costs
|
Costs at
end of the year
|
|
|
|
|
|
|||
|
Name
|
Encumbrances
|
Plot of
land
|
Buildings,
facilities and improvements
|
Improvements
/ Additions
|
Plot of
land
|
Buildings,
facilities and improvements
|
Total
|
Capitalized
costs, net
|
Fair
value adjustments
|
Fair
Value at the end of the year
|
Date of
construction
|
Date of
acquisition
|
|
Rental
properties
|
|
|
|
|
|
|
|
|
|
|
|
|
|
Operations
Center in Argentina
|
|
|
|
|
|
|
|
|
|
|
|
|
|
Abasto
Shopping
|
-
|
10
|
431
|
21
|
10
|
452
|
462
|
-
|
4,912
|
5,374
|
Nov-98
|
Jul-94
|
|
Alto Palermo
Shopping
|
-
|
9
|
595
|
18
|
9
|
613
|
622
|
-
|
4,350
|
4,972
|
Oct-90
|
Nov-97
|
|
Alto
Avellaneda
|
-
|
18
|
299
|
33
|
18
|
332
|
350
|
-
|
2,927
|
3,277
|
Oct-95
|
Dec-1997
|
|
Alcorta
Shopping
|
-
|
11
|
190
|
35
|
11
|
225
|
236
|
1
|
2,133
|
2,370
|
Jun-92
|
Jun-97
|
|
Alto Noa
|
-
|
-
|
68
|
13
|
-
|
81
|
81
|
-
|
597
|
678
|
Sep-94
|
Mar-95
|
|
Buenos Aires
Design
|
-
|
-
|
64
|
8
|
-
|
72
|
72
|
-
|
(47
)
|
25
|
Nov-93
|
Nov-97
|
|
Patio Bullrich
|
-
|
10
|
221
|
12
|
10
|
233
|
243
|
-
|
1,136
|
1,379
|
Sep-88
|
Oct-98
|
|
Alto Rosario
|
-
|
26
|
138
|
26
|
26
|
164
|
190
|
-
|
2,189
|
2,379
|
Nov-04
|
Nov-04
|
|
Mendoza Plaza
|
-
|
11
|
173
|
12
|
11
|
185
|
196
|
-
|
1,103
|
1,299
|
Jun-94
|
Dec-1994
|
|
Dot Baires
Shopping
|
-
|
85
|
322
|
23
|
85
|
345
|
430
|
-
|
2,857
|
3,287
|
May-09
|
Nov-06
|
|
Córdoba
Shopping
|
Antichresis
|
1
|
113
|
8
|
1
|
121
|
122
|
-
|
637
|
759
|
Mar-90
|
Dec-2006
|
|
Distrito Arcos
|
-
|
-
|
-
|
287
|
-
|
287
|
287
|
-
|
604
|
891
|
-
|
Nov-09
|
|
Alto Comahue
|
-
|
1
|
10
|
297
|
1
|
307
|
308
|
-
|
494
|
802
|
-
|
May-06
|
|
Patio Olmos
|
-
|
12
|
21
|
-
|
12
|
21
|
33
|
-
|
113
|
147
|
May-95
|
Sep-07
|
|
Soleil Premium
Outlet
|
-
|
23
|
56
|
71
|
23
|
127
|
150
|
-
|
772
|
922
|
-
|
Jul-10
|
|
Dot building
|
-
|
13
|
75
|
12
|
13
|
87
|
100
|
1
|
650
|
751
|
Sep-10
|
Nov-06
|
|
Bouchard 710
|
-
|
40
|
20
|
3
|
40
|
23
|
63
|
-
|
1,014
|
1,077
|
-
|
Jun-05
|
|
Bouchard 551
|
-
|
5
|
2
|
1
|
5
|
3
|
8
|
-
|
47
|
55
|
-
|
Mar-07
|
|
Intercontinental
Plaza
|
-
|
7
|
125
|
-
|
7
|
125
|
132
|
-
|
(52
)
|
80
|
Jun-96
|
Nov-97
|
|
BankBoston
tower
|
-
|
78
|
61
|
-
|
78
|
61
|
139
|
1
|
1,008
|
1,148
|
-
|
Aug-2007
|
|
República
building
|
-
|
111
|
86
|
-
|
111
|
86
|
197
|
-
|
1,337
|
1,534
|
-
|
Apr-2008
|
|
La
Adela
|
-
|
215
|
-
|
-
|
215
|
-
|
215
|
-
|
32
|
247
|
-
|
Jul-14
|
|
Edificio
Phillips
|
-
|
-
|
469
|
-
|
-
|
469
|
469
|
-
|
77
|
546
|
-
|
Jun-17
|
|
Others
|
-
|
23
|
30
|
3
|
23
|
33
|
56
|
-
|
912
|
968
|
n/a
|
n/a
|
F-123
IRSA Inversiones
y Representaciones Sociedad Anónima
Schedule I
(Continued)
|
|
|
Initial
costs
|
Subsequent
costs
|
Costs at
end of the year
|
|
|
|
|
|
|||
|
Name
|
Encumbrances
|
Plot of
land
|
Buildings,
facilities and improvements
|
Improvements
/ Additions
|
Plot of
land
|
Buildings,
facilities and improvements
|
Total
|
Capitalized
costs, net
|
Fair
value adjustments
|
Fair
Value at the end of the year
|
Date of
construction
|
Date of
acquisition
|
|
Operations
Center in Israel
|
|
|
|
|
|
|
|
|
|
|
|
|
|
Tivoli
|
-
|
150
|
1,881
|
2,564
|
267
|
4,328
|
4,595
|
-
|
(588
)
|
4,007
|
Apr-11
|
Oct-15
|
|
Kiryat Ono
Mall
|
-
|
392
|
731
|
1,180
|
763
|
1,540
|
2,303
|
-
|
(4
)
|
2,299
|
Nov-07
|
Oct-15
|
|
Shopping Center
Modi’in A
|
Mortgage
|
223
|
289
|
510
|
434
|
588
|
1,022
|
-
|
4
|
1,026
|
Aug-05
|
Oct-15
|
|
HSBC
|
Mortgage
|
5,753
|
2,136
|
6,587
|
11,190
|
3,286
|
14,476
|
-
|
830
|
15,306
|
1927-1984
|
Oct-15
|
|
Matam park -
Haifa
|
Mortgage
|
576
|
2,913
|
3,576
|
1,121
|
5,944
|
7,065
|
-
|
56
|
7,121
|
1979-2015
|
Oct-15
|
|
Herzeliya
North
|
-
|
944
|
1,403
|
2,524
|
1,836
|
3,035
|
4,871
|
-
|
(30
)
|
4,841
|
1996-2015
|
Oct-15
|
|
Gav-Yam Center -
Herzeliya
|
Mortgage
|
748
|
817
|
1,518
|
1,455
|
1,628
|
3,083
|
-
|
60
|
3,143
|
1997-2006
|
Oct-15
|
|
Neyar Hadera
Modi’in
|
-
|
186
|
272
|
550
|
363
|
645
|
1,008
|
-
|
(11
)
|
997
|
Jun-1905
|
Oct-15
|
|
Gav yam park - Beer
Sheva
|
Mortgage
|
34
|
402
|
455
|
67
|
824
|
891
|
-
|
30
|
921
|
Jul-1905
|
Oct-15
|
|
Haifa Bay
|
-
|
123
|
235
|
351
|
238
|
471
|
709
|
-
|
11
|
720
|
Jun-1905
|
Oct-15
|
|
Others
PBC
|
Mortgage
|
1,790
|
2,052
|
4,523
|
3,482
|
4,883
|
8,365
|
-
|
305
|
8,670
|
|
|
|
Ispro planet -BeerSheva
-Phase1
|
-
|
154
|
294
|
973
|
300
|
1,121
|
1,421
|
-
|
-
|
1,421
|
Jun-1905
|
Oct-15
|
|
SHARON
|
Mortgage
|
329
|
319
|
660
|
639
|
669
|
1,308
|
-
|
56
|
1,364
|
Jun-1905
|
Oct-15
|
|
MERKAZ
|
-
|
110
|
81
|
280
|
215
|
256
|
471
|
-
|
(4
)
|
467
|
Jan-69
|
Oct-15
|
|
ZAFON
|
-
|
12
|
10
|
76
|
24
|
74
|
98
|
-
|
26
|
124
|
|
|
|
Mizpe
Sapir
|
-
|
59
|
22
|
79
|
144
|
46
|
160
|
-
|
7
|
167
|
|
|
|
Others
Shufersal
|
-
|
172
|
498
|
951
|
334
|
1,287
|
1,621
|
-
|
119
|
1,740
|
n/a
|
Oct-15
|
|
Total
Rental properties
|
|
12,464
|
17,924
|
28,240
|
23,551
|
35,077
|
58,628
|
3
|
30,670
|
89,301
|
|
|
|
Undeveloped
parcels of land
|
|
|
|
|
|
|
|
|
|
|
|
|
|
Operations
Center in Argentina
|
|
|
|
|
|
|
|
|
|
|
|
|
|
Building annexed to
Dot
|
-
|
25
|
-
|
-
|
25
|
-
|
25
|
-
|
890
|
915
|
-
|
Nov-06
|
|
Luján plot of
land
|
-
|
42
|
-
|
-
|
42
|
-
|
42
|
-
|
125
|
167
|
-
|
May-12
|
|
Caballito –
Ferro
|
-
|
46
|
-
|
-
|
46
|
-
|
46
|
-
|
163
|
209
|
-
|
Nov-97
|
|
Santa María del
Plata
|
-
|
159
|
-
|
-
|
159
|
-
|
159
|
-
|
2,973
|
3,132
|
-
|
Jul-97
|
|
Others
|
-
|
12
|
-
|
-
|
12
|
-
|
12
|
-
|
274
|
286
|
-
|
-
|
|
Operations
Center in Israel
|
|
|
|
|
|
|
|
|
|
|
|
|
|
Tivoli
|
-
|
498
|
-
|
318
|
816
|
-
|
816
|
-
|
(320
)
|
496
|
Apr-11
|
Oct-15
|
|
Others
|
-
|
1,113
|
5
|
1,156
|
2,166
|
108
|
2,274
|
-
|
168
|
2,442
|
n/a
|
Oct-15
|
|
Total
undeveloped parcels of land
|
|
1,895
|
5
|
1,474
|
3,266
|
108
|
3,374
|
-
|
4,273
|
7,647
|
|
|
F-124
IRSA Inversiones
y Representaciones Sociedad Anónima
Schedule I
(Continued)
|
|
|
Initial
costs
|
Subsequent
costs
|
Costs at
end of the year
|
|
|
|
|
|
|||
|
Name
|
Encumbrances
|
Plot of
land
|
Buildings,
facilities and improvements
|
Improvements
/ Additions
|
Plot of
land
|
Buildings,
facilities and improvements
|
Total
|
Capitalized
costs, net
|
Fair
value adjustments
|
Fair
Value at the end of the year
|
Date of
construction
|
Date of
acquisition
|
|
Properties
under development
|
|
|
|
|
|
|
|
|
|
|
|
|
|
Operations
Center in Argentina
|
|
|
|
|
|
|
|
|
|
|
|
|
|
PH
Office Park
|
-
|
16
|
-
|
112
|
16
|
112
|
128
|
20
|
22
|
170
|
in progress
|
-
|
|
Building annexed to Alto
Palermo Shopping
|
-
|
38
|
-
|
9
|
38
|
9
|
47
|
-
|
47
|
94
|
in progress
|
-
|
|
Distrito Arcos
|
-
|
-
|
-
|
2
|
-
|
2
|
2
|
-
|
-
|
2
|
in progress
|
-
|
|
Catalinas
Norte
|
-
|
42
|
-
|
21
|
42
|
21
|
63
|
-
|
286
|
349
|
in progress
|
Dec-1999
|
|
Operations
Center in Israel
|
|
|
|
|
|
|
|
|
|
|
|
|
|
Tivoli
|
-
|
32
|
456
|
434
|
62
|
860
|
922
|
-
|
(555)
|
367
|
in progress
|
Oct-15
|
|
Ispro Planet – Beer
Sheva – Phase 1
|
-
|
42
|
44
|
113
|
81
|
118
|
199
|
-
|
11
|
210
|
in progress
|
Oct-15
|
|
Others
|
-
|
463
|
178
|
1,202
|
902
|
941
|
1,843
|
-
|
(30
)
|
1,813
|
in progress
|
Oct-15
|
|
Total
properties under development
|
|
633
|
678
|
1,893
|
1,141
|
2,063
|
3,204
|
20
|
(219
)
|
3,005
|
|
|
|
Total
|
|
14,992
|
18,607
|
31,607
|
27,958
|
37,248
|
65,206
|
23
|
34,724
|
99,953
|
|
|
F-125
TABLE OF CONTENTS
Part IItem 1. Identity Of Directors, Senior Management, Advisers and AuditorsItem 2. Offer Statistics and Expected TimetableItem 3. Key InformationItem 4. Information on The CompanyItem 4A. Unresolved Staff CommentsItem 5. Operating and Financial Review and ProspectsItem 6. Directors, Senior Management and EmployeesItem 7. Major Shareholders and Related Party TransactionsItem 8. Financial InformationItem 9. The Offer and ListingItem 10. Additional InformationItem 11. Quantitative and Qualitative Disclosures About Market RiskItem 12. Description Of Securities Other Than Equity SecuritiesPart IIItem 13. Defaults, Dividend Arrearages and DelinquenciesItem 14. Material Modifications To The Rights Of Security Holders and Use Of ProceedsItem 15. Constrols and ProceduresItem 16. ReservedItem 16. A. Audit Committee Financial ExpertItem 16. B. Code Of EthicsItem 16. C. Principal Accountant Fees and ServicesItem 16. D. Exemption From The Listing Standards For Audit CommitteesItem 16. E. Purchase Of Equity Securities By The Issuer and Its AffiliatesItem 16. F. Change in Registrant S Certifying AccountantItem 16. G. Corporate GovernancePart IIIItem 17. Financial StatementsItem 18. Financial StatementsItem 19. ExhibitsNote 1 The Group S Business and General Information F-11Note 1 The Group S Business and General InformationNote 2 Summary Of Significant Accounting Policies F-13Note 2 Summary Of Significant Accounting PoliciesNote 3 Significant Judgments, Key Assumptions and Estimates F-38Note 3 Significant Judgments, Key Assumptions and EstimatesNote 4 Acquisitions and Dispositions F-39Note 4 Acquisitions and DispositionsNote 5 Financial Risk Management and Fair Value Estimates F-45Note 5 Financial Risk Management and Fair Value EstimatesNote 6 Segment Information F-55Note 6 Segment InformationNote 7 Information About The Main Subsidiaries F-65Note 7 Information About The Main SubsidiariesNote 8 Investments in Joint Ventures F-67Note 8 Investments in Joint VenturesNote 9 Investments in Associates F-70Note 9 Investments in AssociatesNote 10 Investment Properties F-73Note 10 Investment PropertiesNote 11 Property, Plant and Equipment F-78Note 11 Property, Plant and EquipmentNote 12 Trading Properties F-79Note 12 Trading PropertiesNote 13 Intangible Assets F-80Note 13 Intangible AssetsNote 14 Financial Instruments By Category F-81Note 14 Financial Instruments By CategoryNote 15 Trade and Other Receivables F-88Note 15 Trade and Other ReceivablesNote 16 Cash Flow Information F-89Note 16 Cash Flow InformationNote 17 Shareholders Equity F-90Note 17 Shareholders EquityNote 18 Trade and Other Payables F-93Note 18 Trade and Other PayablesNote 19 Provisions F-93Note 19 ProvisionsNote 20 Borrowings F-96Note 20 BorrowingsNote 21 Taxes F-99Note 21 TaxesNote 22 Leases F-102Note 22 LeasesNote 23 Revenues F-103Note 23 RevenuesNote 24 Expenses By Nature F-102Note 24 Expenses By NatureNote 25 Other Operating Results, Net F-104Note 25 Other Operating Results, NetNote 26 Financial Results, Net F-107Note 26 Financial Results, NetNote 27 Earnings Per Share F-107Note 27 Earnings Per ShareNote 28 Employee Benefits F-107Note 28 Employee BenefitsNote 29 Related Party Transactions F-108Note 29 Related Party TransactionsNote 30 Foreign Currency Assets and Liabilities F-119Note 30 Foreign Currency Assets and LiabilitiesNote 31 Groups Of Assets and Liabilities Held For Sale F-120Note 31 Groups Of Assets and Liabilities Held For SaleNote 32 Results From Discontinued Operations F-121Note 32 Results From Discontinued OperationsNote 33 Subsequent Events F-121Note 33 Subsequent EventsNote 06. 30.17 06. 30.16 (recast) 06. 30.15 (recast)Item (3) / Currency