INTUITIVE SURGICAL INC
10-Ks and 10-Qs
|
|
|
|
|
|
|
|
|
|
|
|
|
|
|
|
|
|
|
|
|
|
|
|
|
|
|
|
|
|
|
|
|
|
|
|
|
|
|
|
|
|
|
|
|
|
|
|
|
|
|
|
|
|
|
|
|
|
|
|
|
|
UNITED STATES
SECURITIES AND EXCHANGE COMMISSION
WASHINGTON, D.C. 20549
FORM 10-K
(MARK ONE)
|
x
|
ANNUAL REPORT PURSUANT TO SECTION 13 OR 15(d) OF THE SECURITIES EXCHANGE ACT OF 1934
|
|
FOR THE FISCAL YEAR ENDED DECEMBER 31,
2013
OR
|
¨
|
TRANSITION REPORT PURSUANT TO SECTION 13 OR 15(d) OF THE SECURITIES EXCHANGE ACT OF 1934
|
|
FOR THE TRANSITION PERIOD FROM
TO
COMMISSION FILE NUMBER 000-30713
Intuitive Surgical, Inc.
(Exact name of Registrant as Specified in its Charter)
|
DELAWARE
|
|
77-0416458
|
|
(State or Other Jurisdiction of Incorporation or Organization)
|
|
(I.R.S. Employer Identification Number)
|
SUNNYVALE, CA 94086
(Address of Principal Executive Offices) (Zip Code)
(408) 523-2100
(Registrant’s Telephone Number, Including Area Code)
Securities registered pursuant to Section 12(b) of the Act:
|
Title of Each Class:
|
|
Name of Each Exchange on which Registered
|
|
Common Stock, par value $0.001 per share
|
|
The NASDAQ Global Select Market
|
Indicate by check mark if the registrant is a well-known seasoned issuer, as defined in Rule 405 of the Securities Act. Yes
x
No
¨
Indicate by check mark if the registrant is not required to file reports pursuant to Section 13 or Section 15(d) of the Act. Yes
¨
No
x
Indicate by check mark whether the registrant (1) has filed all reports required to be filed by Section 13 or 15(d) of the Securities Exchange Act of 1934 during the preceding 12 months (or for such shorter period that the registrant was required to file such reports), and (2) has been subject to such filing requirements for the past 90 days. Yes
x
No
¨
Indicate by check mark whether the registrant has submitted electronically and posted on its corporate Web site, if any, every Interactive Data File required to be submitted and posted pursuant to Rule 405 of Regulation S-T during the preceding 12 months (or for such shorter period that the registrant was required to submit and post such files). Yes
x
No
¨
Indicate by check mark if disclosure of delinquent filers pursuant to Item 405 of Regulation S-K is not contained herein, and will not be contained, to the best of registrant’s knowledge, in definitive proxy or information statements incorporated by reference in Part III of this Form 10-K or any amendment to this Form 10-K.
¨
Indicate by check mark whether the registrant is a large accelerated filer, an accelerated filer, a non-accelerated filer, or a smaller reporting company. See definition of “large accelerated filer, “accelerated filer” and “smaller reporting company” in Rule 12b-2 of the Exchange Act.
|
Large accelerated filer
|
x
|
Accelerated filer
|
¨
|
|
|
Non-accelerated filer
|
¨
|
(Do not check if a smaller reporting company)
|
Smaller reporting company
|
¨
|
Indicate by check mark whether the registrant is a shell company (as defined in Rule 12b-2 of the Exchange Act). Yes
¨
No
x
The aggregate market value of the voting and non-voting common equity held by non-affiliates on June 30,
2013
, based upon the closing price of Common Stock on such date as reported by NASDAQ Global Select Market, was approximately
$19,977,428,381
. Shares of voting stock held by each officer and director have been excluded in that such persons may be deemed to be affiliates. This assumption regarding affiliate status is not necessarily a conclusive determination for other purposes.
The number of outstanding shares of the registrant’s common stock on
January 17, 2014
was
38,171,349
.
DOCUMENTS INCORPORATED BY REFERENCE
Part III incorporates information by reference to the definitive proxy statement for the Company’s Annual Meeting of Stockholders to be held on or about April 24, 2014, to be filed within 120 days of the registrant’s fiscal year ended
December 31, 2013
.
|
Page No.
|
||
3
FORWARD LOOKING STATEMENTS
This report contains “forward-looking statements” within the meaning of Section 27A of the Securities Act of 1933 and Section 21E of the Securities Exchange Act of 1934. Forward-looking statements relate to expectations concerning matters that are not historical facts. Words such as “estimates,” “projects,” “believes,” “anticipates,” “plans,” “expects,” “intends,” “may,” “will,” “could,” “should,” “would,” “targeted” and similar words and expressions are intended to identify forward-looking statements. These forward-looking statements include, but are not limited to, statements related to our expected business, new product introductions, procedures and procedure adoption, results of operations, future financial position, our ability to increase our revenues, the mix of our revenues between product and service revenues, our financing plans and capital requirements, our costs of revenue, our expenses, our potential tax assets or liabilities, the effect of recent accounting pronouncements, our investments, cash flows and our ability to finance operations from cash flows and similar matters and include statements based on current expectations, estimates, forecasts and projections about the economies and markets in which we operate and our beliefs and assumptions regarding these economies and markets. These forward-looking statements should be considered in light of various important factors, including the following: the impact of global and regional economic and credit market conditions on health care spending; health care reform legislation in the United States and its impact on hospital spending, reimbursement and fees which will be levied on certain medical device revenues; decreases in hospital admissions and actions by payers to limit or manage surgical procedures; timing and success of product development and market acceptance of developed products; procedure counts; regulatory approvals, clearances and restrictions; guidelines and recommendations in the health care and patient communities; intellectual property positions and litigation; competition in the medical device industry and in the specific markets of surgery in which we operate; unanticipated manufacturing disruptions; the inability to meet demand for products; the results of legal proceedings to which we are or may become a party; product liability and other litigation claims; adverse publicity regarding our Company and safety of our products and the adequacy of training; our ability to expand in foreign markets; and other risk factors. Readers are cautioned not to place undue reliance on these forward-looking statements, which are based on current expectation and are subject to risks, uncertainties, and assumptions that are difficult to predict, including those risk factors described throughout this filing and particularly in Part I, “Item 1A. Risk Factors.” Our actual results may differ materially and adversely from those expressed in any forward-looking statements. We undertake no obligation to publicly update or release any revisions to these forward-looking statements, except as required by law.
|
ITEM 1.
|
BUSINESS
|
In this report, “Intuitive Surgical,” “Intuitive,” the “Company,” “we,” “us,” and “our” refer to Intuitive Surgical, Inc. and its wholly-owned subsidiaries. Intuitive
®
, Intuitive Surgical
®
,
da Vinci
®
,
da Vinci S
®
,
da Vinci
®
Si
HD Surgical System™,
da Vinci
S
HD Surgical System
®
,
da Vinci
®
Si
™,
da Vinci
®
Si-e
™,
EndoWrist
®
,
EndoWrist
®
One™
,
EndoWrist
®
Stapler 45, Single-Site™, DVSTAT,
Firefly
™,
InSite
®
and
da Vinci
®
Connect™
are trademarks of Intuitive Surgical, Inc.
Company Background
Intuitive designs, manufactures and markets
da Vinci
Surgical Systems and related instruments and accessories, which taken together, are advanced surgical systems that we consider an advanced generation of surgery. This advanced generation of surgery, which we call
da Vinci
surgery, combines the benefits of minimally invasive surgery (“MIS”) for patients with the ease of use, precision and dexterity of open surgery. A
da Vinci
Surgical System consists of a surgeon’s console, a patient-side cart and a high performance vision system. The
da Vinci
Surgical System translates a surgeon’s natural hand movements, which are performed on instrument controls at a console, into corresponding micro-movements of instruments positioned inside the patient through small incisions, or ports. The
da Vinci
Surgical System is designed to provide its operating surgeons with intuitive control, range of motion, fine tissue manipulation capability and Three Dimensional (“3-D”), High-Definition (“HD”) vision while simultaneously allowing surgeons to work through the small ports enabled by MIS procedures.
da Vinci
Surgery
da Vinci
Surgery utilizes computational, robotic and imaging technologies to enable improved patient outcomes compared to other surgical and non-surgical therapies.
da Vinci
surgery is aimed towards advancing the critical surgical ideals of entering the body less invasively, seeing anatomy more clearly, interacting with tissue more precisely and building surgical skills. The
da Vinci
Surgical System enables surgeons to avail or improve the benefits of MIS to many patients who would otherwise undergo a more invasive surgery. Surgeons using the
da Vinci
system operate while seated comfortably at a console viewing a 3-D, HD image of the surgical field. This immersive visualization connects surgeons to the surgical field and their instruments. While seated at the console, the surgeon manipulates instrument controls in a natural manner, similar to the more intuitive open surgery technique. Our multi-port technology is designed to provide surgeons with a range of motion in the surgical field analogous to the motions of a human wrist, while filtering out the tremor inherent in a surgeon’s hand. In designing our products, we focus on making our technology easy to use.
4
Our systems provide the following features and benefits to surgeons:
Immersive 3-D Visualization.
Our vision system includes a 3-D endoscope with two independent vision channels linked to two separate color monitors through sophisticated image processing electronics. The
da Vinci
Surgical System provides visualization of target anatomy with natural depth-of-field, enhanced contrast and magnification that is intended to facilitate accurate tissue identification and tissue layer differentiation. With our new
Firefly
Fluorescence Imaging upgrade, surgeons can use specialized imaging hardware in combination with an injectable fluorescent dye to visualize vasculature or biliary imaging in cholecystectomy beneath tissue surfaces in real-time.
Precise and Tremor-Free Endoscope Control.
Our imaging system also incorporates our proprietary
Navigator
camera control technology that allows the surgeon to easily change, move, zoom and rotate his or her field of vision. Surgeons can reposition the surgical camera quickly with foot controls or zoom in, out, up, down, left and right by moving their hands while maintaining a stable image.
Intuitive Instrument Movements.
Our technology is designed to transform the surgeon’s natural hand movements outside the body into corresponding micro-movements inside the patient’s body. For example, with the
da Vinci
Surgical System, a hand movement to the right outside the body causes the instrument inside the patient to be moved to the right. In contrast, conventional MIS instruments are long rigid levers that rotate around a fulcrum, or pivot point, located at the port created in the body wall. In conventional MIS, the instrument tip moves in the opposite direction from the surgeon’s hand and surgeons must adjust their hand-eye coordination to translate their hand movements in this “backward” environment.
EndoWrist Instruments.
Our technology is designed to provide surgeons with a range of motion in the surgical field analogous to the motions of a human hand and wrist. Most of our proprietary instruments, which we call
EndoWrist
instruments, incorporate “wrist” joints that enable surgeons to reach behind tissues and suture with precision, just as they can in open surgery.
Scaled, Tremor Filtered Instrument Movement.
With our technology, the surgeon can also use “motion scaling,” a feature that translates, for example, a three-millimeter hand movement outside the patient’s body into a one-millimeter instrument movement in the surgical field inside the patient’s body. Motion scaling is designed to allow precision and control for delicate tasks. In addition, our technology provides the filtering of tremor inherent in a surgeon’s hands.
Improved Surgeon Ergonomics.
The
da Vinci
Surgical System is designed to allow surgeons to operate while seated, which may be clinically advantageous because of reduced surgeon fatigue. The
da Vinci
Surgical System’s design provides natural hand-eye alignment at the surgeon’s console. Because the
da Vinci
Surgical System’s robotic arms hold the camera and instruments steady, there is less surgeon and assistant fatigue.
Multi-Specialty Surgical Platform.
The
da Vinci
Surgical System is designed to enable surgeons to perform a wide range of surgical procedures, within our targeted gynecologic, urologic, general surgery, cardiothoracic and head and neck specialties. To date, surgeons have used the
da Vinci
Surgical System to perform dozens of different types of surgical procedures. While we do not expect all of these different types of procedures to become widely adopted, they demonstrate the flexibility of the
da Vinci
Surgical System in approaching anatomy.
Advanced Training Tools.
Surgeons can efficiently train and improve their
da Vinci
Surgery skills with a group of tools unique to robotic surgery, including our
da Vinci
Skills simulator for software based skills practice and assessment, our
da Vinci
dual console for inter-operative collaboration, and our
da Vinci Connect
networking technology
for on-line proctoring.
Products:
da Vinci Surgical System
We have commercialized three generations of
da Vinci
Surgical System—the
da Vinci Si
Surgical System, the
da Vinci S
Surgical System and the standard
da Vinci
Surgical System.
da Vinci
Surgical Systems are comprised of the following components:
Surgeon’s Console
. The
da Vinci
Surgical System allows surgeons to operate while comfortably seated at an ergonomic console viewing a 3-D image of the surgical field. The surgeon’s fingers grasp instrument controls below the display with the surgeon’s hands naturally positioned relative to his or her eyes. Using electronic hardware, software, algorithms and mechanics, our technology translates the surgeon’s hand movements into precise and corresponding real-time micro movements of the
EndoWrist
instruments positioned inside the patient. On our most current system,
da Vinci Si
, a second surgeon’s console may be used in two possible ways: to provide assistance to the primary surgeon during surgery or to act as an active aid during surgeon-proctor training sessions. With the
da Vinci Si
, a surgeon sitting at a second console can view the same surgery as the primary surgeon and can be passed control of some or all of the
da Vinci
instruments during the surgery. In addition, surgeons can control 3-D virtual pointers to augment the dual surgeon experience.
Patient-Side Cart
. The patient-side cart holds electromechanical arms that manipulate the instruments inside the patient. Up to four arms attached to the cart can be positioned as appropriate, and then locked into place. At least two arms hold
5
our
EndoWrist
instruments, one representing the surgeon’s left hand and one representing the surgeon’s right hand. A third arm positions the endoscope, allowing the surgeon to easily move, zoom and rotate his or her field of vision. An optional fourth instrument arm extends surgical capabilities by enabling the surgeon to add a third
EndoWrist
instrument to perform additional tasks. The fourth instrument arm is a standard integrated feature on the
da Vinci Si
and
da Vinci S
Surgical Systems and is available as a field upgrade on three-arm standard
da Vinci
and three-arm
da Vinci S
Surgical Systems and
da Vinci Si-e
Surgical Systems.
3-D Vision System.
Our vision system includes our
InSite
3-D endoscope with two separate vision channels linked to two separate color monitors through high performance video cameras and specialized image processing hardware. The resulting 3-D image has high resolution, high contrast, low flicker and low cross fading. A digital zoom feature in the 3-D, HD vision system allows surgeons to magnify the surgical field of view without adjusting the endoscope position and thereby reduces interference between the endoscope and instruments. The 3-D, HD vision is a standard integrated feature on
da Vinci S
and
da Vinci Si
Surgical Systems.
da Vinci Skills Simulator
. The Skills Simulator is a practice tool which began shipping in early 2011 for the
da Vinci Si
Surgical System that gives a user the opportunity to practice his or her facility with the surgeon console controls. The Skills Simulator incorporates 3-D, physics-based computer simulation technology to immerse the user within a virtual environment. The user navigates through the environment and completes exercises by controlling virtual instruments from the surgeon console. Upon completion of a skills exercise, the Skills Simulator provides a quantitative assessment of user performance based on a variety of task-specific metrics. The Skills Simulator is intended to augment, not replace, existing training programs for the
da Vinci Si
Surgical System. Most
da Vinci
Skills Simulators have been sold in connection with new
da Vinci Si
Surgical System sales.
Firefly Fluorescence Imaging
. In the first quarter of 2011, we launched our
Firefly
product for use with the
da Vinci Si
Surgical System. This imaging capability combines a fluorescent dye with a specialized
da Vinci
camera head, endoscope and laser-based illuminator to allow surgeons to identify vasculature in three dimensions beneath tissue surfaces to visualize critical anatomy. Adoption of
Firefly
is progressing with use across the categories of urology, gynecology and general surgery. In September 2013, we received U.S. Food and Drug Administration (“FDA”) 510(k) clearance to market our
Firefly
fluorescence imaging product for real-time imaging of bile ducts (cystic duct, common bile duct and common hepatic duct).
Standard da Vinci System.
During 2013, we discontinued sale of the standard
da Vinci System.
We intend to continue supporting the installed base of standard
da Vinci
Systems with existing service agreements, as well as the continued supply of instruments and accessories. During 2014, we will phase out the sale of all instrument, accessory and service offerings for the standard
da Vinci
System.
Instruments and Accessories
EndoWrist Instruments
. We manufacture a variety of instruments, most of which incorporate wrist joints for natural dexterity, with tips customized for various surgical procedures.
EndoWrist
instruments are offered in a variety of sizes, of which 5mm and 8mm diameter sizes are the most commonly sold. At their tips, the various
EndoWrist
instruments include forceps, scissors, electrocautery, scalpels and other surgical tools that are familiar to the surgeon from open surgery and conventional MIS. A variety of
EndoWrist
instruments are selected and used interchangeably during a surgery. Our
EndoWrist
instruments are sterilizable and most are reusable for a defined number of procedures. A programmed memory chip inside each instrument performs several functions that help determine how the system and instruments work together. In addition, the chip will not allow the instrument to be used for more than the prescribed number of procedures so that its performance meets specifications during each procedure. We typically develop new types of
EndoWrist
instruments to support additional types of surgical procedures.
da Vinci Single-Site. da Vinci Single-Site
is a set of non-wristed instruments and accessories that allow
da Vinci Si
Surgical Systems to work through a single incision, typically in the umbilicus, rather than multiple incisions. Single incision surgery is intended to minimize trauma to patients by reducing the number of ports required to enter the body and is typically utilized for less complex surgery than multi-port surgery. Non-robotic single incision surgery today is typically performed with modified laparoscopic instruments. Early clinical adoption of this manual technique has been mostly positive; however, physicians have reported that manual single incision surgery is technically and ergonomically challenging.
da Vinci Single-Site
instruments and accessories were designed to address these issues. In February 2011, we received the CE mark for our
da Vinci Single-Site
instrument kit and began selling these new products in Europe. The majority of
da Vinci Single-Site
procedures performed in Europe to date has been cholecystectomies. In December 2011, we received FDA regulatory clearance to market our Single-Site instrumentation in the U.S. for laparoscopic cholecystectomy procedures. In February 2013, we received FDA clearance to market our
Single-Site
instruments for benign hysterectomy and salpingo oophorectomy procedures. We believe that the
da Vinci
Single-Site
has been positively received by hospitals, surgeons, and patients, with over
800
customers having purchased
da Vinci
Single-Site
kits as of December 31, 2013. However, as these are our initial
6
products targeted towards procedures already highly penetrated by manual MIS techniques, we are not able to predict the extent or pace that
da Vinci Single-Site
may be adopted.
EndoWrist One Vessel Sealer
. In December 2011, we received FDA clearance for our
EndoWrist One
Vessel Sealer. The
EndoWrist One
Vessel Sealer is a wristed, single-use instrument intended for bipolar coagulation and mechanical transection of vessels up to 7 mm in diameter and tissue bundles that fit in the jaws of the instrument. This instrument enables
da Vinci Si
surgeons to fully control vessel sealing, while providing the benefits of
da Vinci
surgery. This instrument is designed to enhance surgical efficiency and autonomy in a variety of general surgery and gynecologic procedures. Clinical response to the
EndoWrist
One
Vessel Sealer has been encouraging, with positive commentary on precision, articulation, vessel sealing quality and thermal spread. We expect applications for the
EndoWrist One
Vessel Sealer to be centered on general surgery and gynecologic oncology procedures.
EndoWrist One
Vessel Sealer utilization rates have increased steadily in 2013.
EndoWrist Stapler 45 Instrument
. In October 2012, we received FDA clearance for our
EndoWrist
Stapler 45 Instrument with Blue and Green 45 mm reloads. The
EndoWrist
Stapler 45 is a wristed, stapling instrument intended for resection, transection and/or creation of anastomoses in general, gynecologic and urologic surgery. This instrument enables operators of the
da Vinci Si
to precisely position and fire the stapler. We expect its initial surgical use to be directed towards colorectal procedures. During 2013, the
EndoWrist
Stapler was used by a limited and gradually increasing number of customers, primarily for colorectal procedures. Although our first customer experiences have been positive, we are in the early stages of selling
EndoWrist
Stapler 45 and while we expect to continue to expand to a broadening set of customers in 2014, we are not able to predict the extent to which the instrument may be adopted.
Accessory Products
. We sell various accessory products which are used in conjunction with the
da Vinci
Surgical System as surgical procedures are performed. Accessory products include sterile drapes used to ensure a sterile field during surgery, vision products such as replacement 3-D stereo endoscopes, camera heads, light guides, and other items that facilitate use of the system.
Business Strategy
Our objective is to bring the benefits of MIS to as many patients as possible through the use of computer aided robotic technologies. Our priorities to accomplish this are as follows:
|
1.
|
Patient Value.
We believe that the value of a surgical procedure to a patient can be defined as:
Patient Value = Procedure Efficacy/Invasiveness
. We define
procedure efficacy
as a measure of the success of the surgery in resolving the underlying disease and
invasiveness
is how disruptive and painful the treatment is itself. When the patient value of a
da Vinci
procedure is deemed higher than alternate treatment options, patients may seek out surgeons and hospitals that offer that specific
da Vinci
procedure, potentially resulting in a local market share shift for the specific treatment. Adoption occurs procedure by procedure, and is driven by the relative patient value of
da Vinci
procedures compared to alternative treatment options for the same disease state. We believe most patients will place higher value on procedures that are not only more efficacious, but also less invasive than alternative treatments. Our goal is to provide products to surgeons who in turn provide patients with procedure options that are both highly effective and less invasive than other surgical options.
|
|
2.
|
Surgeon Value.
We train surgeons on the use of our
da Vinci
Surgical System and assist them in building their practices by their delivery of superior patient value. We provide an ergonomic platform for surgeons to perform their procedures. We seek to provide surgeons with reliable and easy to use products.
|
|
3.
|
Hospital Value.
We assist hospitals in building value by offering patient value using
da Vinci
thereby increasing surgical revenue and reducing costs through lower complication rates and reduced length of patient stay.
da Vinci surgery
is a cost effective approach to many surgeries as compared to alternative treatment options as demonstrated in many published economic studies.
|
Given the priorities above, our strategy is to improve our candidate surgical procedures in one or more of the following ways:
|
1.
|
Convert Candidate Open Procedures to da Vinci
S
urgery.
We believe that our technology has the potential to convert a significant percentage of our targeted open procedures to
da Vinci
Surgery.
|
|
2.
|
Facilitate Difficult MIS Operations.
We believe that several surgical procedures that are seldom performed today using conventional MIS techniques can be performed more routinely using
da Vinci
Surgery. Some procedures have been adopted using MIS techniques but are extremely difficult and are currently performed by a limited number of highly skilled surgeons. We believe our
da Vinci
Surgical System will enable more surgeons at more institutions to perform such procedures.
|
|
3.
|
Offer a Less Invasive Single Port Surgical Option.
We believe that our
da Vinci
Single Site technology has the potential to convert candidate procedures typically performed via multiport laparoscopic technique to single port
da Vinci
Surgery, offering patients less invasive, improved cosmetic outcomes.
|
7
Clinical Applications
We are the beneficiaries of productive collaborations with leading surgeons in exploring and developing new techniques and applications for
da Vinci
surgery—an important part of our creative process. We primarily focus our development efforts on those procedures in which we believe our products bring the highest patient value, surgeon value and hospital value. We currently focus on five surgical specialties: urologic surgery, gynecologic surgery, general surgery, cardiothoracic surgery and head and neck surgery. Key procedures which we are focused on include
da Vinci
Prostatectomy (“dVP”),
da Vinci
Hysterectomy (“dVH”),
da Vinci
Cholecystectomy,
da Vinci
Colon and Rectal procedures,
da Vinci
Partial Nephrectomy,
da Vinci
Myomectomy,
da Vinci
Sacrocolpopexy,
da Vinci
Mitral Valve Repair,
da Vinci
Lobectomy and
da Vinci
Transoral Robotic Surgery (for cancers of the throat). In
2013
, we estimate that over 75% of the procedures performed were in the urologic and gynecologic specialties. Representative surgical applications are described below.
Urologic Surgery
Prostatectomy.
Radical prostatectomy is the removal of the prostate gland in patients diagnosed with clinically localized prostate cancer. The standard approach to removal of the prostate has been via an open surgical procedure. The conventional laparoscopic approach is an option, but is difficult and poses challenges to even the most skilled urologist. The
da Vinci
Surgical System has enabled a large number of surgeons to convert from using an open surgical technique to a minimally invasive technique.
Partial Nephrectomy.
Partial nephrectomy is the removal of a small portion of a kidney (typically, an area of the kidney containing a tumor). Partial nephrectomies are most commonly performed in patients diagnosed with clinically localized renal cancer. Excluding
da Vinci
surgery, there are three common surgical approaches to performing partial nephrectomies: open surgical technique, laparoscopy and hand assisted laparoscopy, which is a hybrid of open and laparoscopic technique. Surgeons have reported that the
da Vinci
Surgical System’s capabilities may enable a large number of these procedures to be performed through a minimally invasive technique, conferring the benefits of MIS to a broader range of partial nephrectomy patients.
Pyeloplasty.
Pyeloplasty is the surgical reconstruction or revision of the renal pelvis to drain and decompress the kidney. In nearly all cases, the goal of pyeloplasty surgery is to relieve an uretero-pelvic junction obstruction. Excluding
da Vinci
surgery, there are two common surgical approaches to performing pyeloplasty: open surgical technique and laparoscopy. Surgeons have reported that the
da Vinci
Surgical System’s capabilities may enable a large number of these procedures to be performed through a minimally invasive technique, conferring the benefits of MIS to a broader range of pyeloplasty patients.
Gynecologic Surgery
Hysterectomy.
Removal of the uterus is one of the most commonly performed surgeries in gynecology and is performed for a variety of underlying benign and malignant conditions. Hysterectomies can be performed using open surgery (laparotomy), a vaginal approach, or MIS techniques, which include both laparoscopic and robotic approaches. Despite the availability of non-robotic MIS approaches to hysterectomy, most hysterectomies performed prior to
da Vinci
surgery were open surgeries.
da Vinci
has enabled a large number of women to receive a minimally invasive treatment as an alternative to an open hysterectomy. During the first quarter of 2013,
Single-Site
instruments were FDA cleared in the U.S. for use in benign hysterectomies and salpingo oophorectomies.
Single-Site
instruments enable surgeons to perform surgery through a single port via the patient’s belly button, resulting in virtually scarless patient outcomes. During the twelve months ended December 31, 2013, we experienced lower growth rates in the category of U.S. benign gynecologic procedures than in prior years. The slower 2013 growth rate in the category of U.S. benign gynecologic procedures reflected a number of factors including, but not limited to, apparent pressure on benign gynecology hospital admissions, negative media reports about
da Vinci
surgery and a trend by payers toward encouraging conservative disease management and treatment in outpatient settings. We believe there is still a significant remaining market opportunity in benign gynecologic procedures since a large number are still done via open technique. However, as we penetrate more deeply into benign gynecologic procedures, our pace of capturing or consolidating the remaining market is progressing at a slower rate than previously.
Myomectomy.
Myomectomy, or removal of a myoma/fibroid, is a surgical procedure performed when uterine preservation is sought, typically to preserve fertility. Due to the substantial suturing required for this procedure, the standard surgical approach remains an open incision. There are some highly skilled gynecological laparoscopists who perform laparoscopic myomectomies, but laparoscopic myomectomy has remained a minority of myomectomies performed. Surgeons have reported that the
da Vinci
Surgical System’s capabilities may enable a large number of these procedures to be performed through a minimally invasive technique, conferring the benefits of MIS to a broader range of myomectomy patients.
Sacrocolpopexy.
The abdominal (open) sacrocolpopexy is one of the most successful operations for vaginal vault prolapse. Sacrocolpopexy involves suturing a synthetic mesh that connects and supports the vagina to the sacrum (tailbone). A sacrocolpopexy can be performed using conventional laparoscopic technique, however, it is generally described as difficult
8
and cumbersome to perform. Surgeons have reported that the
da Vinci
Surgical System’s capabilities may enable a large number of these procedures to be performed through a minimally invasive technique, conferring the benefits of MIS to a broader range of sacrocolpopexy patients.
Endometriosis Resection
. Endometriosis is a gynecological medical condition in which cells from the lining of the uterus (endometrium) migrate outside the uterus. Endometriosis can range from mild to severe, and in the worst cases, can infiltrate bowel, ureters, ovaries and other organs in the female pelvis. Because of the diffuse and extensive nature of severe endometriosis, it can be difficult to treat either pharmaceutically or surgically. A successful resection of endometriosis involves both seeing lesions and their careful resection. Surgeons have reported that
da Vinci
surgery may enable a larger number of women with endometriosis to receive an effective MIS approach to their endometriosis resection.
Cardiothoracic Surgery
Mitral Valve Repair.
When patients are diagnosed with mitral valve disease, there are two surgical treatment options from which they can choose: mitral valve replacement or mitral valve repair. Mitral valve repairs are generally preferred over mitral valve replacement for a number of reasons, which include longevity and durability of the repaired valve over a replacement valve and the elimination or reduction of the patient’s post-surgical pharmaceutical regimen. Since mitral valve repairs are considered to be more technically challenging than mitral valve replacements, they are only performed approximately 50% of the time. Several of our surgeon customers have reported an improvement in their mitral valve repair rates over mitral valve replacements when using the
da Vinci
Surgical System.
Thoracic Surgery.
Conventional approaches to surgical procedures in the thorax include both open and video-assisted thoracoscopic approaches. Procedures performed via these methods include pulmonary wedge resection, pulmonary lobectomy, thymectomy, mediastinal mass excision and esophagectomy. Many thoracic procedures remain open procedures. Surgeons have reported that the use of the
da Vinci
Surgery System in thoracic surgery has enabled them to offer MIS approaches to a broader range of thoracic surgery patients.
General Surgery
Cholecystectomy.
Cholecystectomy, or the surgical removal of the gall bladder, is a commonly performed general surgery procedure. Cholecystectomy is the primary method for the treatment of gallstones and other gall bladder diseases. Most cholecystectomies are performed using multi-port MIS techniques, although some surgeons choose to perform cholecystectomy using manual single-port instrumentation. With the 2011 European introduction of
da Vinci
Single-Site
instruments followed by the U.S. introduction in 2012, Single-Site robotic cholecystectomies are now being performed. Using
da Vinci
Single-Site
instruments, many of the technical challenges of manual single-port MIS are reduced as surgeons benefit from additional precision, control and improved ergonomics. Multi-port robotic cholecystectomies are also being performed.
Colorectal Surgery.
These procedures typically involve benign or cancerous conditions of the lower digestive system, in particular the rectum or colon. Common procedures in this area include hemicolectomy, sigmoidectomy, low anterior resection and abdominoperineal resection. Conventional laparoscopy is not widely employed to treat these types of diseases, due to their high degree of difficulty. Surgeons have reported that the use of the
da Vinci
Surgery System in colorectal surgery has enabled them to offer MIS approaches to a broader range of colorectal surgery patients.
Gastric Bypass.
A growing body of literature is pointing to the benefit of surgery to treat patients for morbid obesity and its secondary effects, such as diabetes. Laparoscopic roux-en-Y gastric bypass (“LRYGB”) is the most commonly performed surgical procedure for morbid obesity in the U.S. The LRYGB can be a technically challenging procedure because of the suturing, stapling and tissue (bowel) manipulation that is required. Surgeons using the
da Vinci
Surgical System have reported a reduction in a critical complication (anastomotic leaks) relative to LRYGB.
Head and Neck Surgery
Transoral Surgery.
Head and neck cancers are typically treated by either surgical resection or chemo-radiation, or a combination of both. Surgical resection performed by an open approach may require a “jaw-splitting” mandibulotomy. This procedure, while effective in treating cancer, is traumatic and disfiguring to the patient. MIS approaches via the mouth (transoral surgery) are challenged by line-of-sight limitations dictated by conventional endoscopic tools. Chemo-radiation as a primary therapy does allow patients to avoid traumatic surgical incisions; however, literature suggests that this modality diminishes patients’ ability to speak and swallow normally. Surgeons have reported that
da Vinci
Transoral Surgery allows them to treat cancers occurring in the oropharynx (e.g., tonsil and base of tongue) and larynx via the mouth and to overcome some of the line-of-sight limitations of conventional transoral surgery.
Thyroidectomy.
Thyroid cancer is most commonly treated by thyroidectomy, the removal of all or part of the thyroid gland. Complete resection of the cancer and surrounding gland is required for proper oncologic outcomes. Open surgery is an effective surgery in terms of oncologic control and has low complication rates. However, it leaves a prominent neck scar.
9
Surgeons, predominantly in Asia, are now using the
da Vinci
Surgical System to perform thyroidectomies entering the body from the axilla (armpit) in order to avoid the visible scar on the neck. At this time, the procedure is not within the indications for use for the
da Vinci
System in the U.S.
Procedure Segmentation
Our procedure business is now splitting into two segments: (1) Cancer and other highly complex procedures and (2) Less complex benign procedures. Our strategy is to provide hospitals with attractive clinical and economic solutions in each of these categories. More fully featured products targeted towards the more complex procedure segment include 4-arm, dual console, firefly enabled systems and advanced instruments including vessel sealing and stapler. Lower priced products targeted towards the less complex segment of procedures include the three-arm
da Vinci Si-e
System and lower priced
Single-Site
instruments. Our less complex segment has increased from approximately 40% to 60% of U.S. procedures between 2011 and 2013. The complex procedure segment represents the large majority of international procedures.
Clinical Summary
We believe there are numerous additional applications that can be addressed with the
da Vinci
Surgical System and we work closely with our surgeon customers to refine and explore new techniques in which
da Vinci
may bring value. As of December 31,
2013
, we had an installed base of
2,966
da Vinci
Surgical Systems, including
2,083
in the U.S.,
476
in Europe,
159
in Japan, and
248
in the rest of the world. During the year ended December 31,
2013
, we estimate that surgeons using our technology completed approximately
523,000
surgical procedures of various types in hospitals throughout the world. Of those
da Vinci
procedures performed in
2013
, we estimate that approximately
201,000
were dVH procedures and approximately
114,000
were dVP procedures.
We believe the U.S. Preventive Services Task Force recommendation against PSA screening, as well as changes in treatment patterns for low risk prostate cancer away from definitive treatment, have led to a decline in our dVP business. During 2013 U.S. dVP procedure volumes appear to have stabilized, with a gradually decreasing trend. These treatment patterns have also impacted our European dVP procedure volumes. dVP is at earlier market penetration stages in the European markets; therefore, we are unable to precisely estimate the extent to which these recommendations and treatment pattern changes may have been adopted by governments or clinicians within non-U.S. jurisdictions.
Sales and Customer Support
Sales Model
We provide our products through a direct sales organization in the U.S., most of Western Europe excluding Spain, Portugal, Italy and Greece and, beginning with our acquisition of our Korean distributor on January 11, 2012, Korea. Beginning in 2013, we also established a direct sales structure in the Czech Republic, Slovakia, and Hungary. Prior to 2013, these markets were served by a distributor. In the remainder of our world markets, we provide our products through distributors. No one customer accounted for more than 10% of revenue during the years ended December 31,
2013
,
2012
, and
2011
.
Our direct sales organization is composed of a capital sales team, responsible for selling
da Vinci
Surgical Systems, and a clinical sales team, responsible for supporting
da Vinci
Surgical System use in surgical procedures performed at our hospital accounts. The initial
da Vinci
Surgical System sale into an account is viewed as a major capital equipment purchase by our customers and typically has a lengthy sales cycle that can be affected by macroeconomic factors, capital spending prioritization and the timing of budgeting cycles. Capital sales activities include educating surgeons and hospital staff across multiple surgical specialties on the benefits of
da Vinci
Surgery and the clinical applications that our technology enables. We also train our sales organization to educate hospital management on the potential benefits of adopting our technology, including clinical benefits of
da Vinci
Surgery, reductions in complications and length of stay, and the resulting potential for increased patient satisfaction, surgeon recruitment and volume. As of December 31,
2013
, we had approximately 120 capital sales employees, compared to 92 as of December 31,
2012
.
Our clinical sales team works on site at the hospitals, interacting with surgeons, operating room staff and hospital administrators to develop and sustain successful robotics surgery programs. They assist the hospital in identifying surgeons who have an interest in robotic surgery delivering
da Vinci’s
benefits. Our clinical sales team provides the current clinical information on robotic surgery practices and new product applications to the hospital teams and has grown in relation to growth in the installed base of
da Vinci
systems and the total number of procedures performed. As of December 31,
2013
, we had 722 clinical sales employees, compared to 685 as of December 31,
2012
. This organization is expected to grow as our business expands.
Our customers place orders to replenish their supplies of instruments and accessories on a regular basis. Orders received are typically shipped within one business day. Direct customers who purchase a new
da Vinci
Surgical System typically place an initial stocking order of instruments and accessories within one month of receiving their system.
Our business is subject to seasonal fluctuations. Historically, our sales of
da Vinci
Surgical Systems have tended to be heaviest during the third month of each fiscal quarter, lighter in the first and third fiscal quarters and heavier in the fourth fiscal quarter. In addition, we have historically experienced lower procedure volume in the first and third fiscal quarters and higher procedure
10
volume in the second and fourth fiscal quarter. Procedures treating benign conditions are typically higher in the fourth quarter and lower in the first quarter. Benign procedures represented a higher percentage of our total procedures in the fourth quarter of 2013 compared to the fourth quarter of 2012. Timing of procedures and changes in procedure growth impact the timing of instrument and accessory and capital purchases.
Customer Support and Training Programs
We have a network of field service engineers across the U.S., Europe and Asia and maintain relationships with various distributors around the globe. This infrastructure of service and support specialists offer a full complement of services, including 24/7 support, installation, repair and maintenance for our customers. We generate service revenue by providing these services to our customers through comprehensive service contracts and time and material programs.
We provide basic system training that teaches the fundamental operating principles of the
da Vinci
Surgical System to surgeons, surgical assistants and operating room nurses. We have established training centers where initial system training and ongoing surgical procedural training are provided, the latter led by expert surgeons. Surgeons may also practice their robotic surgery technique using our
da Vinci
Skills Simulator. In addition, we help facilitate the proctoring of surgeons who are new to
da Vinci
Surgery by experienced
da Vinci
Surgical System users. Proctors provide training to other surgeons on how to perform certain surgical procedures with
da Vinci
Surgical Systems.
Research and Development
We focus our research and development efforts on providing our customers with new products and product improvements that enable them to perform MIS procedures with less difficulty. We employ research and development and engineering staff responsible for product design and engineering. We invested
$167.7 million
,
$170.0 million
and
$140.2 million
of research and development expenses for the years ended December 31,
2013
,
2012
and
2011
, respectively.
We establish strategic alliances with other medical device and technology based companies to complement our research and development effort. To date, these alliances have taken several forms, including cooperation in the areas of product development, training, procedure development and marketing activities. We have formed alliances with several companies, including, but not limited to, Erbe Elektromedizin GMBH, Johnson & Johnson, Olympus/Gyrus, Novadaq Technologies, Inc. and Mimic Technologies, Inc.
Manufacturing
We manufacture our
da Vinci
Surgical Systems at our facility in Sunnyvale, California. We manufacture our instruments at our Sunnyvale facility and Mexicali, Mexico facility.
We purchase both custom and off-the-shelf components from a large number of suppliers and subject them to stringent quality specifications and processes. Some of the components necessary for the assembly of our products are currently provided to us by sole-sourced suppliers (the only recognized supply source available to us) or single-sourced suppliers (the only approved supply source for us among other sources). We purchase the majority of our components and major assemblies through purchase orders rather than long-term supply agreements and generally do not maintain large volumes of finished goods.
Competition
We consider our primary competition to be existing open surgery, conventional MIS, drug therapies, radiation treatment and emerging interventional surgical approaches. Our success depends on continued clinical and technical innovation, quality and reliability as well as educating hospitals, surgeons and patients on the demonstrated results associated with
da Vinci
Surgery and its value relative to other techniques. We also face competition from several companies that are developing new approaches and products for the MIS market. We believe that many are focused on adding capability to manual MIS systems. Because many of these developments are aimed at MIS, we believe that our
da Vinci
Surgical System may prove complementary to some of these new technologies.
Moreover, as we add new robotically controlled products (e.g.,
Single-Site
, stapler, and vessel sealer) that compete with product offerings traditionally within the domains of open surgery and/or conventional MIS, we face greater competition from larger and well established companies such as Ethicon Endo-Surgery, Inc. and Covidien plc.
Furthermore, as
da Vinci
use increases, a number of companies may be compelled to enter the field of robotic surgery, including but not limited to Stryker Corporation, Covidien plc, Johnson & Johnson, and Olympus. The following companies have made explicit statements about their efforts to enter the field: MedRobotics Corp., meerecompany Inc., SOFAR S.p.A., IMRIS Inc., TransEnterix, Inc., and Titan Medical, Inc. Companies with substantial experience in industrial robotics could potentially expand into the field of surgical robotics and become a competitor. In addition, research efforts utilizing computers and robotics in surgery are underway at various companies and research institutions. Our revenues may be adversely impacted if our competitors develop and introduce products that compete in our markets.
11
Intellectual Property
We place considerable importance on obtaining and maintaining patent, copyright and trade secret protection for significant new technologies, products and processes.
We generally rely upon a combination of intellectual property laws, as well as confidentiality procedures and contractual provisions, to protect our proprietary technology. For example, we have trademarks, both registered and unregistered, that provide distinctive identification of our products in the marketplace. We also have exclusive and non-exclusive patent licenses with various third parties to supplement our own large and robust patent portfolio.
As
of December 31,
2013
, we held ownership or exclusive field-of-use licenses for more than 1,500 U.S. and foreign patents and more than 1,400 U.S. and forei
gn patent applications. We intend to continue filing new patent applications in the U.S. and foreign jurisdictions to seek protection for our technology.
Patents are granted for finite terms and eventually expire. Upon expiration, the inventions claimed in a patent enter the public domain. While our patents are an important element of our success, our business as a whole is not significantly dependent on any one patent.
Government Regulation
Our products and operations are subject to extensive and rigorous regulation by the FDA, the State of California and countries or regions in which we market our products. In addition, our products must meet the requirements of a large and growing body of international standards which govern the design, manufacture, materials content and sourcing, testing, certification, packaging, installation, use and disposal of our products. We must continually keep abreast of these standards and requirements and integrate compliance to these with the development and regulatory documentation for our products. Failure to meet these standards could limit the ability to market our products in those regions which require compliance to such standards. Examples of groups of such standards are electrical safety standards such as those of the International Electrotechnical Commission (e.g. IEC 60601-ss series of standards) and composition standards such as the Reduction of Hazardous Substances (“RoHS”) and Waste Electrical and Electronic Equipment (“WEEE”) Directives.
United States
The FDA regulates the development, testing, manufacturing, labeling, storage, recordkeeping, promotion, marketing, distribution and service of medical devices in the U.S. to ensure that medical products distributed domestically are safe and effective for their intended uses. In addition, the FDA regulates the export of medical devices manufactured in the U.S. to international markets and the importation of medical devices manufactured abroad.
Under the Federal Food, Drug, and Cosmetic Act (“FFDCA”), medical devices are classified into one of three classes—Class I, Class II or Class III—depending on the degree of risk associated with each medical device and the extent of control needed to ensure safety and effectiveness. Our current products are Class II medical devices.
Class II devices are those which are subject to general controls and most require premarket demonstration of adherence to certain performance standards or other special controls, as specified by the FDA, and clearance by the FDA. Premarket review and clearance by the FDA for these devices is accomplished through the 510(k) premarket notification process. Unless a Class II device is exempt from premarket review, the manufacturer must submit to the FDA a premarket notification submission demonstrating that the device is “substantially equivalent” in intended use and technology to a “predicate device” that is either:
|
1.
|
a device that has grandfather marketing status because it was legally marketed prior to May 28, 1976, the date upon which the Medical Device Amendments of 1976 were enacted, or
|
|
2.
|
a device that has previously been cleared through the 510(k) process.
|
If the FDA agrees that the device is substantially equivalent to a predicate device, it will grant clearance to commercially market the device in the U.S. The FDA has a statutory 90-day period to respond to a 510(k) submission or 30 days for “special” 510(k) submissions which have a more restrictive scope and generally more specific or very limited changes to a legally marketed device. As a practical matter, clearance often takes longer. The FDA may require further information, including clinical data, to make a determination regarding substantial equivalence. If the FDA determines that the device, or its intended use, is not “substantially equivalent,” the FDA may deny the request for clearance. Although unlikely for the types of products marketed by us, the FDA may classify the device, or the particular use of the device, into Class III, and the device sponsor must then fulfill more rigorous pre-marketing approval (“PMA”) requirements.
A PMA application, which is intended to demonstrate that a device is safe and effective, must be supported by extensive data, including data from preclinical studies and human clinical trials. The FDA, by statute and regulation, has 180 days to review a PMA application, though the review more often occurs over a significantly longer period of time, and can take up to several years. In approving a PMA application or clearing a 510(k) submission, the FDA may also require some form of post-market surveillance when necessary to protect the public health or to provide additional safety
12
and effectiveness data for the device. In such cases, the manufacturer might be required to follow certain patient groups for a number of years and makes periodic reports to the FDA on the clinical status of those patients.
After a device receives FDA 510(k) clearance, any modification that could significantly affect its safety or effectiveness, or that would constitute a major change in its intended use, requires a new 510(k) clearance or could require a PMA application approval. The FDA requires each manufacturer to make the determination of whether a modification requires a new 501(k) notification or PMA application in the first instance, but the FDA can review any such decision. If the FDA disagrees with a manufacturer’s decision not to seek a new 510(k) clearance or PMA approval for a particular change, the FDA may retroactively require the manufacturer to seek 510(k) clearance or PMA approval. The FDA also can require the manufacturer to cease U.S. marketing and/or recall the modified device until 510(k) clearance or PMA approval is obtained.
The FDA and the Federal Trade Commission (“FTC”) also regulate the advertising claims of our products to ensure that the claims we make are consistent with our regulatory clearances, that there is scientific data to substantiate the claims and that our advertising is neither false nor misleading. In general, we may not promote or advertise our products for uses not within the scope of our intended use statement in our clearances or make unsupported safety and effectiveness claims. Many regulatory jurisdictions outside of the U.S. have similar regulations to which we are subject. Our manufacturing processes are required to comply with the FDA’s Good Manufacturing Practice (“GMP”), requirements contained in its Quality System Regulation (“QSR”) and associated regulations and guidance. The QSR covers, among other things, the methods and documentation of the design, testing, production, processes, controls, quality assurance, labeling, packaging and shipping, installation and service of a company’s products. The QSR also requires maintenance of extensive records which demonstrate compliance with FDA regulation, the manufacturer’s own procedures, specifications and testing as well as distribution and postmarket experience. Compliance with the QSR is necessary to receive FDA clearance or approval to market new products and is necessary for a manufacturer to be able to continue to market cleared or approved product offerings in the U.S. A company’s facilities, records, and manufacturing processes are subject to periodic scheduled or unscheduled inspections by the FDA, which may issue reports known as Forms FDA 483 or Notices of Inspectional Observations which list instances where the FDA inspector believes the manufacturer has failed to comply with applicable regulations and/or procedures. If the observations are sufficiently serious or the manufacturer fails to respond appropriately, the FDA may issue Warning Letters, or Untitled Letters, which are notices of intended enforcement actions against the manufacturer. These enforcement actions could include legal actions, including fines and total shutdown of production facilities, seizure of product, prohibition on export or import and criminal prosecution. Such actions may have further indirect consequences for the manufacturer outside of the U.S., and may adversely affect the reputation of the manufacturer and the product. In the U.S., routine FDA inspections usually occur every two years, and may occur more often for cause.
A FDA inspection of the Company’s facilities occurred in April-May 2013 and the FDA issued a Form FDA 483 listing four observations relating to the reporting of field corrections, information which is to be included on reports of field corrections, written procedures for changes to certain product labeling, and design input documentation. We responded to each observation with corrective actions during the course of the inspection and provided additional evidence of corrective actions to the FDA in response to the Form FDA 483. The FDA issued a Warning Letter, dated July 16, 2013, related to two of the four Form FDA 483 observations asking for additional corrective actions and indicated their intent to perform a follow-up inspection. We have responded to the Warning Letter with plans for corrective action, and continue to provide supplemental responses with objective evidence of corrections as they are completed. In addition, the FDA collected electronic samples of all our advertising and promotional material for review, and to date has taken no action in connection therewith. However, we cannot assure that, upon re-inspection, the FDA will find that our corrective actions are acceptable or that they have been adequately implemented. We also cannot assure that the FDA will not find other observations. The FDA previously inspected our Sunnyvale, CA facilities in January 2012 and did not issue a Form FDA 483 as a result of this inspection.
To greater or lesser extent, most other countries require some form of quality system and regulatory compliance, which may include periodic inspections, inspections by third party auditors, and specialized documentation. Failure to meet all the requirements of these countries could jeopardize our ability to import, market, support and receive reimbursement for the use of our products in these countries.
In addition to the above, we may seek to conduct clinical research on products that have not yet been cleared or approved for particular indications in clinical studies or trials in the U.S. or other countries. Additional regulations govern the approval, initiation, conduct, documentation and reporting of clinical studies to regulatory agencies in the countries or regions in which they are conducted. Such use is generally also regulated by local and institutional requirements and policies which usually include review by an ethics committee or institutional review board (“IRB”). Failure to comply with all regulations governing such studies could subject the company to significant enforcement actions and sanctions, including halting of the study, seizure of investigational devices or data, sanctions against investigators, civil or criminal penalties, and other actions. Without the data from one or more clinical studies, it may not be possible for us to secure the data necessary to support certain regulatory submissions, to secure reimbursement or demonstrate other requirements. We cannot assure that access to clinical investigators, sites and subjects, documentation and data will be available on the terms and timeframes necessary.
13
Products manufactured outside the U.S. by or for us are subject to U.S. Customs and FDA inspection upon entry into the U.S. We must demonstrate compliance of such products to U.S. regulations and carefully document the eventual distribution or re-exportation of such products. Failure to comply with all applicable regulations could prevent us from having access to products or components critical to the manufacture of finished products and lead to shortages and delays.
California Regulation
The State of California requires that we obtain a license to manufacture medical devices and until 2012 conducted periodic inspection of medical device manufacturers. Our facilities and manufacturing processes were last inspected in July 2011 and were found to be in compliance. In accordance with the State of California regulations, the license to manufacture is renewed annually with any updated manufacturing information. Although the State of California has announced suspension of routine periodic inspections, there can be no assurance the State of California will not resume such inspections or conduct such inspections under specific circumstances which are not yet known.
Foreign Regulation
In order for us to market our products in other countries, we must obtain regulatory approvals and comply with extensive product and quality system regulations in other countries. These regulations, including the requirements for approvals or clearance and the time required for regulatory review, vary from country to country. Some countries have regulatory review processes which are substantially longer than U.S. processes. Failure to obtain regulatory approval in a timely manner and to meet all local requirements including language and specific safety standards in any foreign country in which we plan to market our products could prevent us from marketing products in such countries or subject us to sanctions and fines.
To be sold in Japan, most medical devices must undergo thorough safety examinations and demonstrate medical efficacy before they receive regulatory (“Shonin”) approval. In November 2009, we received Shonin approval from the Japanese Ministry of Health, Labor, and Welfare (“MHLW”) for our
da Vinci S
Surgical System in Japan. These sales were primarily made to early adopters. Since receiving the approval, we have been focusing our efforts on obtaining specific reimbursement for
da Vinci
procedures in Japan and building our own organization, Intuitive Surgical Japan. Prior to April 2012, we had partnered with the experienced regulatory team from Johnson & Johnson K.K. Medical Company (“JJKK”) in our Japanese regulatory process. In April 2012, the Marketing Authorization Application for
da Vinci
products was transferred to Intuitive Surgical Japan from JJKK, and Intuitive Surgical Japan now has primary responsibility for regulatory support of our products in Japan. We continue to partner with Adachi Co., Ltd. as our separate independent distribution partner for marketing, selling, and servicing our products in Japan. Effective April 2012, we obtained national reimbursement for dVP procedures in Japan, our only reimbursed procedure to date. In October 2012, we obtained MHLW approval for
da Vinci Si
Surgical Systems in Japan. In Japan additional procedures are considered for reimbursed status in April of even numbered years as the MHLW considers recommendations and data brought forth from Japanese surgical societies. We do not expect any additional procedures to be granted reimbursement status in the April 2014 cycle. We are supporting the Japanese surgical societies to gather the necessary data for MHLW consideration in the April 2016 cycle. If we are not successful in obtaining additional regulatory clearances, importation licenses, and adequate procedure reimbursements for future products and procedures, then the demand for our products in Japan could be limited.
Commercialization of medical devices in Europe is regulated by the European Union (“EU”). The EU presently requires that all medical products bear the Conformité Européenne (“CE”) mark, for compliance with the Medical Device Directive (93/42/EEC) as amended. The CE mark is an international symbol of adherence to certain essential principles of safety and performance mandated in applicable European medical device directives, which once affixed, enables a product to be sold in member countries of the EU and those affiliated which accept the CE mark. The CE mark is also recognized in many countries outside of the EU, such as Australia, and can assist in the clearance process. In order to affix the CE mark on products, a recognized European Notified Body must certify a manufacturer’s quality system and design dossier for compliance with international and European requirements. We have received authorization from DGM Denmark A/S, a recognized European Notified Body and part of Nemko Presafe A/S to affix the CE mark to our
da Vinci
Surgical System and
EndoWrist
instruments and accessories. To maintain authorization to apply the CE mark, we are subject to annual surveillance audits and periodic re-certification audits. As of 2012, Notified Bodies, including DGM, are also required to conduct periodic unannounced inspections.
If we modify our existing products or develop new products in the future, we may need to apply for authorization to affix the CE mark to such products. We do not know whether we will be able to obtain authorization to affix the CE mark for new or modified products or whether we will continue to meet the safety and performance standards required to maintain the authorizations we have already received. If we are unable to maintain authorizations to affix the CE mark to our products, we will no longer be able to sell our products in member countries of the EU or those whose marketing authorizations are based on the CE Mark.
Regulations in other countries, including the requirements for approvals or clearance and the time required for regulatory review, vary from country to country. These regulations typically require regulatory approvals and compliance with extensive safety and quality system regulations. Failure to obtain regulatory approval in any foreign country in which we plan to market our products, or failure to comply with any regulation in any foreign country in which we market our products, may negatively impact our ability to generate revenue and harm our business. In addition, local regulations may apply which govern the use of
14
our products and which could have an adverse effect on our product utilization if they are unfavorable. All such regulations are revised from time to time and in general are increasing in complexity, and in the scope and degree of documentation and testing required. There can be no assurance the outcomes from such documentation and testing will be acceptable to any particular regulatory agency or will continue to be acceptable over time. There are further regulations governing the importation, marketing, sale, distribution, use and service as well as the removal and disposal of medical devices. Failure to comply with any of these regulations could result in sanctions, fines and prevent us from marketing our products in these regions.
Third-Party Coverage and Reimbursement
In the U.S. and most international markets where we sell our products, the government and health insurance companies together are responsible for hospital and surgeon reimbursement for virtually all covered surgical procedures. Governments and insurance companies generally reimburse hospitals and physicians for surgery when the procedure is considered medically necessary. In the U.S., the Centers for Medicare & Medicaid Services (“CMS”), administers the Medicare and Medicaid programs
(the latter, along with applicable State governments). Many other third-party payors model their reimbursement methodologies after the Medicare program. As the single largest payor, this program has a significant impact on other payors’ payment systems.
Generally, reimbursement for professional services performed at a facility by physicians is reported under billing codes issued by the American Medical Association (“AMA”), known as Current Procedural Terminology (“CPT”) codes. Physician reimbursement under Medicare generally is based on a fee schedule and determined by the relative values of the professional service rendered. In addition, CMS and the National Center for Health Statistics (“NCHS”) are jointly responsible for overseeing changes and modifications to billing codes known as ICD-9-CM procedural codes used by hospitals to report inpatient procedures. For Medicare, CMS generally reimburses hospitals for services provided during an inpatient stay based on a prospective payment system that is determined by a classification system known as Medicare-Severity Diagnostic Related Groupings (“MS-DRGs”). MS-DRGs are assigned using a number of factors including the principal diagnosis, major procedures, discharged status, patient age and complicating secondary diagnoses among other things. Hospital outpatient services, reported by CPT codes, are assigned to clinically relevant Ambulatory Payment Classifications (“APCs”) used to determine the payment amount for services provided.
On October 1, 2008, CMS and NCHS issued a new family of ICD-9-CM procedure codes for “Robotically Assisted Procedures.” For laparoscopic procedures completed with the
da Vinci
Surgical System, U.S. hospitals are expected to report the primary surgical procedure code, along with ICD-9-CM 17.42, to describe a laparoscopic robotic assisted procedure. The purpose of the ICD-9-CM family of procedure codes, 17.4X, is to gather data on robotic assisted surgical procedures.
At this time, it does not appear that these codes will be available after October 1, 2014, when the ICD-10 code sets are implemented.
A surgical procedure, completed with or without robotic assistance, continues to be assigned to the clinically relevant MS-DRG.
Governments and insurance companies carefully review and increasingly challenge the prices charged for medical products and surgical services. Reimbursement rates from private companies vary depending on the procedure performed, the third-party payor, contract terms, and other factors. Because both hospitals and physicians may receive the same reimbursement for their respective services, with or without robotics, regardless of actual costs incurred by the hospital or physician in furnishing the care, including for the specific products used in that procedure, hospitals and physicians may decide not to use our products if reimbursement amounts are insufficient to cover any additional costs incurred when purchasing our products.
Domestic institutions typically bill for the primary surgical procedure that includes our products to various third-party payors, such as Medicare, Medicaid and other government programs and private insurance plans. Because our
da Vinci
Surgical System has been cleared for commercial distribution in the U.S. by the FDA, coverage and reimbursement by payors are generally determined by the medical necessity of the primary surgical procedure. We believe that the additional procedures we intend to pursue are established surgical procedures that are generally already reimbursable by government agencies and insurance companies for appropriately selected patients. If hospitals do not obtain sufficient reimbursement from third-party payors for procedures performed with our products, or if governmental and private payors’ policies do not cover surgical procedures performed using our products, we may not be able to generate the revenues necessary to support our business.
In countries outside the U.S., reimbursement is obtained from various sources, including governmental authorities, private health insurance plans, and labor unions. In most foreign countries, private insurance systems may also offer payments for some therapies. Additionally, health maintenance organizations are emerging in certain European countries. To effectively conduct our business, we may need to seek international reimbursement approvals, and we do not know if these required approvals will be obtained in a timely manner or at all. In April 2012, radical prostatectomy utilizing the
da Vinci
Surgical System was approved for reimbursement in Japan. We intend to seek reimbursement approvals from the Japanese government for additional procedures performed with our products. The timing of these approvals can vary significantly, and could significantly impact our ability to commercialize our products in Japan. In some countries, patients may be permitted to pay directly for surgical services; however, such “co-pay” practices are not common in most countries.
In March 2010, the U.S. President signed the Patient Protection and Affordable Care Act, as amended by the Health Care and Education Reconciliation Act (collectively, “the PPACA”), which makes changes that are expected to significantly impact healthcare providers, insurers, pharmaceutical and medical device manufacturers. One of the principal aims of the PPACA is to
15
expand health insurance coverage to approximately 32 million Americans who are currently uninsured. The consequences of these significant coverage expansions on the sales of our products are currently unknown. The PPACA contains a number of provisions designed to generate the revenues necessary to fund this coverage expansion, including, but not limited to new fees or taxes on certain health-related industries, including medical device manufacturers. Starting in 2013, medical device manufacturers are required to pay an excise tax (or sales tax) of 2.3% on certain U.S. medical device revenues. Under this provision, the Company has paid an excise tax of approximately 1% of total global revenue in 2013. The tax is included as a cost of revenue and a reduction of product gross margin.
The PPACA also has provisions to study the comparative effectiveness of health care treatments and strategies. It remains unclear how this research will influence future Medicare coverage and reimbursement decisions, as well as influence other third-party payor coverage and reimbursement policies. As Congress and state governments determine how to implement the PPACA, the full impact of the PPACA on the medical device industry and the sale of our products is currently unknown. The PPACA, as well as other federal or state health care reform measures that may be adopted in the future, could have a material adverse effect on our business. The taxes imposed by PPACA and the expansion in the government’s role in the U.S. healthcare industry may result in decreased profits, lower reimbursement from payors for procedures that use our products and/or reduced procedural volumes, all of which may adversely affect our business, financial condition and results of operations.
In addition, other legislative changes have been proposed and adopted since the PPACA was enacted. More recently, on August 2, 2011, the U.S. President signed into law the Budget Control Act of 2011, which, among other things, creates the Joint Select Committee on Deficit Reduction to recommend proposals in spending reductions to Congress. The Joint Select Committee did not achieve a targeted deficit reduction of at least $1.2 trillion for the years 2013 through 2021, triggering the legislation’s automatic reduction to several government programs. This included aggregate reductions to Medicare payments to providers of up to 2% per fiscal year,, which went into effect on April 1, 2013. On January 2, 2013, the American Taxpayer Relief Act of 2012 was signed into law, which, among other things, further reduced Medicare payments to several providers, including hospitals, imaging centers and cancer treatment centers.
Any regulatory or legislative developments in domestic or foreign markets that eliminate or reduce reimbursement rates for procedures performed with our products could harm our ability to sell our products or cause downward pressure on the prices of our products, either of which would affect our ability to generate the revenues necessary to support our business.
Employees
As of
December 31, 2013
, we had
2,792
employees, 325 of whom were engaged directly in research and development, 1,018
in manufacturing and service and 1,449 in marketing, sales, and administrative activities. None of our employees are covered by a collective bargaining agreement, and we consider our relationship with our employees to be good.
General
We make our periodic and current reports, including our Annual Reports on Form 10-K, Quarterly Reports on Form 10-Q, Current Reports on Form 8-K, our Code of Business Conduct and Ethics Policy and any amendments to those reports, available free of charge, on our website as soon as practicable after such material is electronically filed or furnished with the Securities and Exchange Commission. Our website address is
www.intuitivesurgical.com
and the reports are filed under “SEC Filings,” on the Company—Investor Relations portion of our website. Periodically, we webcast Company announcements, product launch events and executive presentations which can be viewed via our Investor Relations pages on our website. Additionally, we provide notifications of our material news including SEC filings, investor events, and press releases as part of our Investor Relations website. The contents of these websites are not intended to be incorporated by reference into this report or in any other report or document we file and any references to these websites are intended to be inactive textual references only.
We operate our business as one segment as defined by generally accepted accounting principles. Our financial results for the year ended
December 31, 2013
,
2012
, and
2011
are discussed in “Item 7. Management’s Discussion and Analysis of Financial Condition and Results of Operations” and “Item 8. Financial Statements and Supplementary Data” of this Annual Report.
Intuitive Surgical, Inc. was founded in 1995. We are a Delaware corporation with our corporate headquarters located at 1020 Kifer Road, Sunnyvale, California 94086. Our telephone number is (408) 523-2100, and our website address is
www.intuitivesurgical.com
.
|
ITEM 1A.
|
RISK FACTORS
|
RISKS RELATING TO OUR BUSINESS
IF OUR PRODUCTS DO NOT ACHIEVE MARKET ACCEPTANCE, WE WILL NOT BE ABLE TO GENERATE THE REVENUE NECESSARY TO SUPPORT OUR BUSINESS.
The
da Vinci
Surgical System and our other products represent a fundamentally new way of performing surgery. Achieving physician, patient and third-party payor acceptance of
da Vinci
Surgery as a preferred method of performing surgery will be crucial
16
to our success. If our products fail to achieve market acceptance, customers will not purchase our products and we will not be able to generate the revenue necessary to support our business. We believe that physicians and third-party payors’ acceptance of the benefits of procedures performed using our products will be essential for acceptance of our products by patients. Physicians will not recommend the use of our products unless we can demonstrate that they produce results comparable or superior to existing surgical techniques. Even if we can prove the effectiveness of our products through clinical trials, surgeons may elect not to use our products for any number of other reasons. For example, cardiologists may continue to recommend conventional heart surgery simply because such surgery is already widely accepted. In addition, surgeons may be slow to adopt our products because of the perceived liability risks arising from the use of new products and the uncertainty of reimbursement from third-party payors, particularly in light of ongoing health care reform initiatives.
We expect that there will be a learning process involved for surgical teams to become proficient in the use of our products. Broad use of our products will require training of surgical teams. Market acceptance could be delayed by the time required to complete this training. We may not be able to rapidly train surgical teams in numbers sufficient to generate adequate demand for our products.
ECONOMIC CONDITIONS COULD MATERIALLY ADVERSELY AFFECT OUR COMPANY.
During 2008 and 2009, the global economy experienced a severe downturn due to the sequential effects of the subprime lending crisis, the credit market crisis, collateral effects on the finance and banking industries, volatile currency exchange rates and energy costs, concerns about inflation, slower economic activity, decreased consumer confidence, reduced corporate profits and capital spending, adverse business conditions and liquidity concerns. More recently, credit and sovereign debt issues have destabilized certain European economies as well and thereby increased global macroeconomic uncertainties. Uncertainty about current global economic conditions continue to pose a risk as customers may postpone or reduce spending in response to restraints on credit. There could be additional effects from the credit crisis on our business, including the insolvency of key suppliers or their inability to obtain credit to finance the development and/or manufacture of our products resulting in product delays, and the inability of our customers and distributors to obtain credit to finance purchases of our products. If conditions worsen or if the improved economic conditions are slower than anticipated, our forecasted demand may not materialize to the levels we require to achieve our anticipated financial results, which could in turn have a material adverse effect on our revenue, profitability and the market price of our stock.
BECAUSE OUR MARKETS ARE HIGHLY COMPETITIVE, CUSTOMERS MAY CHOOSE TO PURCHASE OUR COMPETITORS’ PRODUCTS OR MAY NOT ACCEPT DA VINCI SURGERY, WHICH WOULD RESULT IN REDUCED REVENUE AND LOSS OF MARKET SHARE.
da Vinci
Surgery is a new technology that competes with established and emerging treatment options in both disease management and reconstructive medical procedures. These competitive treatment options include conventional MIS, open surgery, interventional approaches or pharmacological regimens. Some of these procedures are widely accepted in the medical community and in many cases have a long history of use. Technological advances could make such treatments more effective or less expensive than using our products, which could render our products obsolete or unmarketable. Studies could be published that show that other treatment options are more beneficial and/or cost-effective than
da Vinci
Surgery. We cannot be certain that physicians will use our products to replace or supplement established treatments or that our products will continue to be competitive with current or future technologies.
In addition, we may face competition from companies that develop wristed, robotic or computer-assisted surgical systems and products in the future. For example, SOFAR S.p.A, an Italian medical device company, supported by the European Commission’s Joint Research Centre, has developed a telesurgical robot system. Our revenues may be reduced or eliminated if our competitors develop and market products that are more effective or less expensive than our products. If we are unable to compete successfully, our revenues will suffer. We may not be able to maintain or improve our competitive position against current or potential competitors, especially those with greater resources.
NEW PRODUCT INTRODUCTIONS MAY ADVERSELY IMPACT OUR FINANCIAL RESULTS.
We introduce new products with enhanced features and extended capabilities from time to time. Our products are subject to various regulatory processes, and we must obtain and maintain regulatory approvals in order to sell our new products. If a potential purchaser believes that we plan to introduce a new product in the near future or if a potential purchaser is located in a country where a new product that we have introduced has not yet received regulatory approval, planned purchases may be deferred or delayed. As a result, new product introductions may adversely impact our financial results.
WE EXPERIENCE LONG AND VARIABLE CAPITAL SALES CYCLES AND SEASONALITY IN OUR BUSINESS, WHICH MAY CAUSE FLUCTUATIONS IN OUR FINANCIAL RESULTS.
Our
da Vinci
Surgical System has a lengthy sales and purchase order cycle because it is a major capital item and its purchase generally requires the approval of senior management of hospitals, their parent organizations, purchasing groups, and government bodies, as applicable. This approval process can be lengthy. In addition, hospitals may delay or accelerate system purchases in
17
conjunction with timing of their capital budget timelines. As a result, it is difficult for us to predict the length of capital sales cycles and, therefore, the exact timing of capital sales. Historically, our sales of
da Vinci
Surgical Systems have tended to be heaviest during the third month of each fiscal quarter, and lighter in the third and first fiscal quarters and heavier in the fourth fiscal quarter.
Recently, we have experienced procedure growth for a number of benign conditions, including hysterectomies for benign conditions, sacrocolpopexies, myomectomies, and certain other surgeries. Many of these types of surgeries may be postponed in the short term by patients to avoid vacation periods and for other personal scheduling reasons. Patients may also accelerate procedures to take advantage of insurance funding cut-off dates. Historically, we have experienced lower procedure counts in the first and third fiscal quarter and higher procedure counts in the fourth fiscal quarter. Timing of procedures and changes in procedure growth directly affect the timing of instrument and accessory purchases and capital purchases.
The above factors may contribute to substantial fluctuations in our quarterly operating results. Because of these fluctuations, it is possible that in some future quarters our operating results will fall below the expectations of securities analysts or investors. If that happens, the market price of our stock would likely decrease. These fluctuations, among other factors, also mean that you will not be able to rely upon our operating results in any particular period as an indication of future performance. In addition, the introduction of new products could adversely impact our sales cycle, as customers take additional time to assess the benefits and costs of such products.
INTERNATIONAL SALES OF OUR PRODUCTS ACCOUNT FOR A SIGNIFICANT PORTION OF OUR REVENUES, WHICH EXPOSES US TO RISKS INHERENT IN INTERNATIONAL OPERATIONS. OUR GROWTH MAY BE LIMITED IF WE ARE UNABLE TO SUCCESSFULLY MANAGE OUR INTERNATIONAL ACTIVITIES.
Our business currently depends in part on our activities in international markets. Revenue from markets outside of the United States accounted for approximately
28%
,
21%
, and
22%
of our revenue for the years ended
December 31, 2013
,
2012
, and
2011
, respectively. We are subject to a number of challenges that specifically relate to our international business activities. These challenges include:
|
•
|
failure to obtain the same degree of protection against infringement of our intellectual property rights as we have in the United States;
|
|
•
|
protectionist laws and business practices that favor local competitors, which could slow our growth in international markets;
|
|
•
|
local or national regulations that make it difficult or impractical to market or use our products;
|
|
•
|
inability or regulatory limitations of our ability to move goods across borders;
|
|
•
|
the risks associated with foreign currency exchange rate fluctuations;
|
|
•
|
the expense of establishing facilities and operations in new foreign markets; and
|
|
•
|
building an organization capable of supporting geographically dispersed operations.
|
A large portion of our international sales are denominated in U.S. dollars. As a result, an increase in the value of the U.S. dollar relative to foreign currencies could make our products less competitive and/or less affordable in international markets. If we are unable to meet and overcome these challenges our international operations may not be successful, which would limit the growth of our business.
WE UTILIZE DISTRIBUTORS FOR A PORTION OF OUR SALES, WHICH SUBJECTS US TO A NUMBER OF RISKS THAT COULD HARM OUR BUSINESS.
We have strategic relationships with a number of key distributors for sales and service of our products in certain foreign countries. If these strategic relationships are terminated and not replaced, our revenues and/or ability to service our products in the territories serviced by these distributors could be adversely affected. In addition, we may be named as a defendant in lawsuits against our distributors related to sales or service of our products performed by them. Please see our risk factor below titled “Unfavorable Results of Legal Proceedings Could Materially Adversely Affect Our Financial Condition.” The actions of our distributors may affect our ability to effectively market our products in certain foreign countries or regulatory jurisdictions if the distributor holds the regulatory authorization in such countries or within such regions and causes, by action or inaction, the suspension of such marketing authorization or sanctions for non-compliance. It may be difficult, expensive and time consuming for Intuitive to re-establish market access or regulatory compliance in such case.
WE MAY INCUR LOSSES ASSOCIATED WITH CURRENCY FLUCTUATIONS AND MAY NOT BE ABLE TO EFFECTIVELY HEDGE OUR EXPOSURE.
Our operating results are subject to fluctuations in foreign currency exchange rates. We attempt to mitigate a portion of these risks through foreign currency hedging, based on our judgment of the appropriate trade-offs among risk, opportunity and expense. We have established a hedging program to partially hedge our exposure to foreign currency exchange rate fluctuations primarily
18
for the Euro and the British Pound. We regularly review our hedging program and make adjustments as necessary based on our assessment of the relevant risks, opportunities and expenses. Our hedging activities may not offset more than a portion of the adverse financial impact resulting from unfavorable movement in foreign currency exchange rates, which could adversely affect our financial condition or results of operations.
IF DEFECTS ARE DISCOVERED IN OUR PRODUCTS, WE MAY INCUR ADDITIONAL UNFORESEEN COSTS, HOSPITALS MAY NOT PURCHASE OUR PRODUCTS AND OUR REPUTATION MAY SUFFER.
Our products incorporate mechanical parts, electrical components, optical components and computer software, any of which can contain errors or failures, especially when first introduced. In addition, new products or enhancements may contain undetected errors or performance problems that, despite testing, are discovered only after commercial shipment. Because our products are designed to be used to perform complex surgical procedures, we expect that our customers will have an increased sensitivity to such defects. In the past, we have voluntarily recalled certain products as a result of performance problems. We cannot assure that our products will not experience component aging, errors or performance problems in the future. If we experience flaws or performance problems, any of the following could occur:
|
•
|
delays in product shipments;
|
|
•
|
loss of revenue;
|
|
•
|
delay in market acceptance;
|
|
•
|
diversion of our resources;
|
|
•
|
damage to our reputation;
|
|
•
|
product recalls;
|
|
•
|
regulatory actions;
|
|
•
|
increased service or warranty costs; or
|
|
•
|
product liability claims.
|
WE ARE SUBJECT TO PRODUCT LIABILITY AND NEGLIGENCE CLAIMS RELATING TO THE USE OF OUR PRODUCTS THAT COULD BE EXPENSIVE, DIVERT MANAGEMENT’S ATTENTION AND HARM OUR BUSINESS.
Our business exposes us to significant risks of product liability claims, which are inherent to the medical device industry. Product liability claims may be brought by individuals or by groups seeking to represent a class. We currently are subject to product liability claims, which are described in more detail under Part I, “Item 3. Legal Proceedings,” and which have been brought by individuals alleging that they have sustained personal injuries and/or death as a result of purported product defects, the alleged failure to warn, and/or the alleged inadequate training by us of physicians regarding the use of the
da Vinci
Surgical System. The individuals who have brought the product liability claims seek recovery for the alleged personal injuries and in many cases, punitive damages. Current product liability claims have resulted in negative publicity regarding our Company, and these and any other product liability or negligence claims or product recalls also could harm our reputation. In addition, there have been articles published and papers written questioning patient safety and efficacy associated with
da Vinci
surgery, the cost of
da Vinci
surgery relative to other disease management methods, and the adequacy of surgeon training. Negative publicity, whether accurate or inaccurate, concerning our products or our Company could reduce market acceptance of our products and could result in decreased product demand and a decline in revenues. In addition, significant negative publicity could result in an increased number of product liability claims, regardless of whether these claims are meritorious. The number of claims could be further increased by plaintiffs’ law firms that use a wide variety of media to advertise their services and solicit clients for product liability cases against the Company.
The outcome of product liability litigation is inherently uncertain and difficult to quantify, and the magnitude of potential damages, if any, may not be known for a substantial period of time. Although we maintain product liability insurance, the coverage limits of these policies may not be adequate to cover current or future claims. Particularly as sales of our products increase, we may be unable to maintain product liability insurance in the future at satisfactory rates or in adequate amounts. In addition, current or future product liability claims, regardless of their merit or eventual outcome, could result in significant legal costs (including settlements, judgments, legal fees and other related defense costs). It is possible that future legal costs could have a material adverse effect on our business, financial condition, results of operations or cash flows.
UNFAVORABLE RESULTS OF LEGAL PROCEEDINGS COULD MATERIALLY ADVERSELY AFFECT OUR FINANCIAL CONDITION.
We are and may become subject to various legal proceedings and claims that arise in or outside the ordinary course of business. Certain current lawsuits and pending proceedings are described under Part I, “Item 3. Legal Proceedings.”
19
The results of these lawsuits and other legal proceedings cannot be predicted with certainty. Accordingly, we cannot determine whether our insurance coverage would be sufficient to cover the costs or potential losses, if any. Regardless of merit, litigation may be both time-consuming and disruptive to our operations and cause significant expense and diversion of management attention. If we do not prevail in the purported class action lawsuit or other legal proceedings, we may be faced with significant monetary damages or injunctive relief against us that could have a material adverse effect on our business, financial condition, results of operations or cash flows.
WE MAY ENCOUNTER MANUFACTURING PROBLEMS OR DELAYS THAT COULD RESULT IN LOST REVENUE.
Manufacturing our products is a complex process. We (or our critical suppliers) may encounter difficulties in scaling up or maintaining production of our products, including:
|
•
|
problems involving production yields;
|
|
•
|
quality control and assurance;
|
|
•
|
component supply shortages;
|
|
•
|
import or export restrictions on components, materials or technology;
|
|
•
|
shortages of qualified personnel; and
|
|
•
|
compliance with state, federal and foreign regulations.
|
If demand for our products exceeds our manufacturing capacity, we could develop a substantial backlog of customer orders. If we are unable to maintain larger-scale manufacturing capabilities, our ability to generate revenues will be limited and our reputation in the marketplace could be damaged.
OUR RELIANCE ON SOLE AND SINGLE SOURCE SUPPLIERS COULD HARM OUR ABILITY TO MEET DEMAND FOR OUR PRODUCTS IN A TIMELY MANNER OR WITHIN BUDGET.
Some of the components necessary for the assembly of our products are currently provided to us by sole-sourced suppliers or single-sourced suppliers. We generally purchase components through purchase orders rather than long-term supply agreements and generally do not maintain large volumes of inventory. While alternative suppliers exist and could be identified for sole-sourced components, the disruption or termination of the supply of components could cause a significant increase in the costs of these components, which could affect our operating results. A disruption or termination in the supply of components could also result in our inability to meet demand for our products, which could harm our ability to generate revenues, lead to customer dissatisfaction and damage our reputation. Furthermore, if we are required to change the manufacturer of a key component of our products, we may be required to verify that the new manufacturer maintains facilities and procedures that comply with quality standards and with all applicable regulations and guidelines. The delays associated with the verification of a new manufacturer could delay our ability to manufacture our products in a timely manner or within budget.
IF INSTITUTIONS OR SURGEONS ARE UNABLE TO OBTAIN COVERAGE AND REIMBURSEMENT FROM THIRD-PARTY PAYORS FOR PROCEDURES USING OUR PRODUCTS, OR IF REIMBURSEMENT IS INSUFFICIENT TO COVER THE COSTS OF PURCHASING OUR PRODUCTS, WE MAY BE UNABLE TO GENERATE SUFFICIENT SALES TO SUPPORT OUR BUSINESS.
In the United States, hospitals generally bill for the services performed with our products to various third-party payors, such as Medicare, Medicaid and other government programs and private insurance plans. If hospitals do not obtain sufficient reimbursement from third-party payors for procedures performed with our products, or if government and private payors’ policies do not cover surgical procedures performed using our products, we may not be able to generate the revenues necessary to support our business. Our success in international markets also depends upon the eligibility of our products for coverage and reimbursement through government-sponsored health care payment systems and third-party payors. Reimbursement practices vary significantly by country. Many international markets have government-managed healthcare systems that control reimbursement for new products and procedures. Other foreign markets have both private insurance systems and government-managed systems that control reimbursement for new products and procedures. Market acceptance of our products may depend on the availability and level of coverage and reimbursement in any country within a particular time. In addition, health care cost containment efforts similar to those we face in the United States are prevalent in many of the other countries in which we intend to sell our products and these efforts are expected to continue. Please see our risk factor below titled “Recently Enacted Healthcare Legislation Reforming the U.S. Healthcare System, as well as Future Reforms, May Have a Material Adverse Effect on Our Financial Condition and Results of Operations” for additional risks related to the ability of institutions or surgeons to obtain reimbursements.
IF WE LOSE OUR KEY PERSONNEL OR ARE UNABLE TO ATTRACT AND RETAIN ADDITIONAL PERSONNEL, OUR ABILITY TO COMPETE WILL BE HARMED.
We are highly dependent on the principal members of our management and scientific staff. Our product development plans depend, in part, on our ability to attract and retain engineers with experience in mechanics, electronics, software and optics.
20
Attracting and retaining qualified personnel will be critical to our success, and competition for qualified personnel is intense. We may not be able to attract and retain personnel on acceptable terms given the competition for such personnel among technology and healthcare companies and universities. The loss of any of these persons or our inability to attract and retain qualified personnel could harm our business and our ability to compete.
NATURAL OR OTHER DISASTERS COULD DISRUPT OUR BUSINESS AND RESULT IN LOSS OF REVENUE OR IN HIGHER EXPENSES.
Natural disasters, terrorist activities and other business disruptions could seriously harm our revenue and financial condition and increase our costs and expenses. For example, the March 2011 earthquake and tsunami in Japan and their aftermath created economic uncertainty and disrupted economic activities in Japan, including a reduction in hospital spending.
Our corporate headquarters and many of our operations are located in California, a seismically active region. A natural disaster in any of our major markets could have a material adverse impact on our operations, operating results and financial condition. Further, any unanticipated business disruption caused by Internet security threats, damage to global communication networks or similar events could have a material adverse impact on our operating results.
IF WE FAIL TO SUCCESSFULLY ACQUIRE OR INTEGRATE NEW BUSINESSES, PRODUCTS AND TECHNOLOGY, WE MAY NOT REALIZE EXPECTED BENEFITS OR OUR BUSINESS MAY BE HARMED.
We need to grow our businesses in response to changing technologies, customer demands and competitive pressures. In some circumstances, we may decide to grow our business through the acquisition of complementary businesses, products or technologies rather than through internal development. For example, we purchased our Korean distributor in January 2012. Identifying suitable acquisition candidates can be difficult, time-consuming and costly, and we may not be able to identify suitable candidates or successfully complete identified acquisitions. In addition, completing an acquisition can divert our management and key personnel from our business operations, which could harm our business and affect our financial results. Even if we complete an acquisition, we may not be able to successfully integrate newly acquired organizations, products, technologies or employees into our operations, or may not fully realize some of the expected synergies. An acquired company may have deficiencies in product quality or regulatory marketing authorizations which are not detected during due diligence activities or which are unasserted at the time of acquisition. It may be difficult, expensive and time consuming for us to re-establish market access, regulatory compliance or cure such deficiencies in product quality in such cases.
Integrating an acquisition can also be expensive and time-consuming, and may strain our resources. In many instances, integrating a new business will also involve implementing or improving internal controls appropriate for a public company at a business that lacks them. In addition, we may be unable to retain the employees of acquired companies, or the acquired company’s customers, suppliers, distributors or other partners for a variety of reasons, including the fact that these entities may be our competitors or may have close relationships with our competitors.
CHANGES TO FINANCIAL ACCOUNTING STANDARDS MAY AFFECT OUR REPORTED RESULTS OF OPERATIONS.
A change in accounting standards or practices can have a significant effect on our reported results and may even affect our reporting of transactions completed before the change is effective. New accounting pronouncements and varying interpretations of accounting pronouncements have occurred and may occur in the future. Changes to existing standards or the questioning of current practices may adversely affect our reported financial results or the way we conduct our business.
WE ARE SUBJECT TO SIGNIFICANT, UNINSURED LIABILITIES.
For certain risks, we do not maintain insurance coverage because of cost and/or availability. For example, we indemnify our directors and officers for third-party claims and do not insure for the underlying losses, and we do not carry earthquake insurance, among other types of coverage that we do not maintain. In addition, in the future, we may not continue to maintain certain existing insurance coverage or adequate levels of coverage. Premiums for many types of insurance have increased significantly in recent years, and depending on market conditions and our circumstances, in the future, certain types of insurance such as directors’ and officers’ insurance or products liability insurance may not be available on acceptable terms or at all. Because we retain some portion of our insurable risks, and in some cases self-insure completely, unforeseen or catastrophic losses in excess of insurance coverage could require us to pay substantial amounts, which would materially adversely affect our financial condition and operating results.
WE USE ESTIMATES, MAKE JUDGMENTS AND APPLY CERTAIN METHODS IN MEASURING THE PROGRESS OF OUR BUSINESS IN DETERMINING OUR FINANCIAL RESULTS AND IN APPLYING OUR ACCOUNTING POLICIES. AS THESE ESTIMATES, JUDGMENTS, AND METHODS CHANGE, OUR ASSESSMENT OF THE PROGRESS OF OUR BUSINESS AND OUR RESULTS OF OPERATIONS COULD VARY.
The methods, estimates, and judgments we use in applying our accounting policies have a significant impact on our results of operations. Such methods, estimates, and judgments are, by their nature, subject to substantial risks, uncertainties and
21
assumptions, and factors may arise over time may lead us to change our methods, estimates, and judgments. Changes in any of our assumptions may adversely affect our reported financial results.
In addition, we utilize methods for determining surgical market sizes and
da Vinci
procedures completed that involve estimates and judgments, which are, by their nature, subject to substantial risks, uncertainties, and assumptions. Our estimates of surgical market sizes or
da Vinci
procedures performed do not have an impact on our results of operations but are used to estimate the progress of our business. Estimates and judgments for determining surgical market sizes and
da Vinci
procedures may vary over time with changes in treatment modalities, hospital reporting behavior, increases in procedures per field employee and other factors. In addition, from time to time, we may change the method for determining market sizes and
da Vinci
procedures, causing variation in our reporting.
CHANGES IN OUR EFFECTIVE TAX RATE MAY HARM OUR RESULTS OF OPERATIONS
A number of factors may harm our future effective tax rates including:
|
•
|
the jurisdictions in which profits are determined to be earned and taxed;
|
|
•
|
the resolution of issues arising from tax audits with various tax authorities;
|
|
•
|
changes in valuation of our deferred tax assets and liabilities;
|
|
•
|
increases in expenses not deductible for tax purposes, including write-offs of acquired intangibles and impairment of goodwill in connection with acquisitions;
|
|
•
|
changes in available tax credits and deductions;
|
|
•
|
changes in share-based compensation;
|
|
•
|
changes in tax laws or the interpretation of such tax laws and changes in generally accepted accounting principles; and
|
|
•
|
the repatriation of non-U.S. earnings for which we have not previously provided for U.S. taxes.
|
Any significant increase in our future effective tax rates could harm net income for future periods.
DISRUPTION OF CRITICAL INFORMATION SYSTEMS OR MATERIAL BREACHES IN THE SECURITY OF OUR SYSTEMS COULD HARM OUR BUSINESS, CUSTOMER RELATIONS AND FINANCIAL CONDITION.
Information technology helps us operate efficiently, interface with customers, maintain financial accuracy and efficiency and accurately produce our financial statements. If we do not allocate and effectively manage the resources necessary to build and sustain the proper technology infrastructure, we could be subject to transaction errors, processing inefficiencies, the loss of customers, business disruptions or the loss of or damage to intellectual property through security breach. If our data management systems do not effectively collect, store, process and report relevant data for the operation of our business, whether due to equipment malfunction or constraints, software deficiencies or human error, our ability to effectively plan, forecast and execute our business plan and comply with applicable laws and regulations will be impaired, perhaps materially. Any such impairment could materially and adversely affect our financial condition, results of operations, cash flows and the timeliness with which we report our internal and external operating results.
Our business requires us to use and store customer, employee and business partner personally identifiable information (“PII”). This may include names, addresses, phone numbers, email addresses, contact preferences, tax identification numbers and payment account information. We require user names and passwords in order to access our information technology systems. We also use encryption and authentication technologies to secure the transmission and storage of data. These security measures may be compromised as a result of third-party security breaches, employee error, malfeasance, faulty password management or other irregularity, and result in persons obtaining unauthorized access to our data or accounts. Third parties may attempt to fraudulently induce employees or customers into disclosing user names, passwords or other sensitive information, which may in turn be used to access our information technology systems.
We devote significant resources to network security, data encryption and other security measures to protect our systems and data, but these security measures cannot provide absolute security. We may experience a breach of our systems and may be unable to protect sensitive data. The costs to us to eliminate or alleviate network security problems, bugs, viruses, worms, malicious software programs and security vulnerabilities could be significant, and our efforts to address these problems may not be successful and could result in unexpected interruptions, delays, cessation of service and may harm our business operations. Moreover, if a computer security breach affects our systems or results in the unauthorized release of PII, our reputation and brand could be materially damaged and use of the Company’s products and services could decrease. We would also be exposed to a risk of loss or litigation and potential liability, which could result in a material adverse effect on our business, results of operations and financial condition.
22
RISKS RELATING TO OUR REGULATORY ENVIRONMENT
RECENTLY ENACTED HEALTHCARE LEGISLATION REFORMING THE U.S. HEALTHCARE SYSTEM, AS WELL AS FUTURE REFORMS, MAY HAVE A MATERIAL ADVERSE EFFECT ON OUR FINANCIAL CONDITION AND RESULTS OF OPERATIONS.
In March 2010, the U.S. President signed the Patient Protection and Affordable Care Act, as amended by the Health Care and Education Reconciliation Act (collectively, “the PPACA”), which makes changes that are expected to significantly impact the pharmaceutical and medical device industries. One of the principal aims of the PPACA as currently enacted is to expand health insurance coverage to approximately 32 million Americans who are currently uninsured. The consequences of these significant coverage expansions on the sales of our products are unknown and speculative at this point.
The PPACA contains a number of provisions designed to generate the revenues necessary to fund the coverage expansions among other things. This includes new fees or taxes on certain health-related industries, including medical device manufacturers. Beginning in 2013, medical device manufacturers were required to pay an excise tax (or sales tax) of 2.3% of certain U.S. medical device revenues. Though there are some exceptions to the excise tax, this excise tax does apply to all or most of our products sold within the United States. The PPACA also establishes a new Patient-Centered Outcomes Research Institute to oversee and identify priorities in comparative clinical effectiveness research in an effort to coordinate and develop such research; implements payment system reforms including a national pilot program on payment bundling to encourage hospitals, physicians, and other providers to improve the coordination, quality, and efficiency of certain healthcare services through bundled payment models; and creates an independent payment advisory board that will submit recommendations to reduce Medicare spending if projected Medicare spending exceeds a specified growth rate.
The PPACA provisions on comparative clinical effectiveness research also extend the initiatives of the American Recovery and Reinvestment Act of 2009, known as the stimulus package, which included $1.1 billion in funding to study the comparative effectiveness of health care treatments and strategies. This stimulus funding was designated for, among other things, conducting, supporting or reviewing research that compares and evaluates the risks and benefits, clinical outcomes, effectiveness and appropriateness of products. The PPACA appropriates additional funding to comparative clinical effectiveness research. Although Congress has indicated that this funding is intended to improve the quality of health care, it remains unclear how the research will impact current Medicare coverage and reimbursement or how new information will influence other third-party payor policies. The taxes imposed by the PPACA and the expansion in the government’s role in the U.S. healthcare industry may result in decreased profits to us, lower reimbursement by payors for our products, and/or reduced medical procedure volumes, all of which may adversely affect our business, financial condition and results of operations.
In addition, other legislative changes have been proposed and adopted since the PPACA was enacted. More recently, on August 2, 2011, the U.S. President signed into law the Budget Control Act of 2011, which, among other things, creates the Joint Select Committee on Deficit Reduction to recommend proposals in spending reductions to Congress. The Joint Select Committee did not achieve a targeted deficit reduction of at least $1.2 trillion for the years 2013 through 2021, triggering the legislation’s automatic reduction to several government programs. This included aggregate reductions to Medicare payments to providers of up to 2% per fiscal year,, which went into effect on April 1, 2013. On January 2, 2013, the American Taxpayer Relief Act of 2012 was signed into law, which, among other things, further reduced Medicare payments to several providers, including hospitals, imaging centers and cancer treatment centers, and increased the statute of limitations period for the government to recover overpayments to providers from three to five years.
We expect that additional state and federal health care reform measures may be adopted in the future, any of which could have a material adverse effect on our industry generally and our ability to successfully commercialize our products or could limit or eliminate our spending on certain development projects.
The U. S. government has in the past considered, is currently considering and may in the future consider healthcare policies and proposals intended to curb rising healthcare costs, including those that could significantly affect both private and public reimbursement for healthcare services. State and local governments, as well as a number of foreign governments, are also considering or have adopted similar types of policies. Future significant changes in the healthcare systems in the United States or elsewhere, and current uncertainty about whether and how changes may be implemented, could have a negative impact on the demand for our products. We are unable to predict whether other healthcare policies, including policies stemming from legislation or regulations affecting our business may be proposed or enacted in the future; what effect such policies would have on our business; or the effect ongoing uncertainty about these matters will have on the purchasing decisions of our customers.
23
WE ARE SUBJECT TO FEDERAL, STATE AND FOREIGN LAWS GOVERNING OUR BUSINESS PRACTICES WHICH, IF VIOLATED, COULD RESULT IN SUBSTANTIAL PENALTIES. ADDITIONALLY, CHALLENGES TO OR INVESTIGATION INTO OUR PRACTICES COULD CAUSE ADVERSE PUBLICITY AND BE COSTLY TO RESPOND TO AND THUS COULD HARM OUR BUSINESS.
The Dodd-Frank Wall Street Reform and Consumer Protection Act requires us to track and disclose the source of certain metals used in manufacturing which may stem from minerals (so called “conflict minerals”) which originate in the Democratic Republic of the Congo or adjoining regions. These metals include tantalum, tin, gold and tungsten. These metals are central to the technology industry and are present in some of our products as component parts. In most cases no acceptable alternative material exists which has the necessary properties. It is not possible to determine the source of the metals by analysis but instead a good faith description of the source of the intermediate components and raw materials must be obtained. The components which incorporate those metals may originate from many sources and we purchase fabricated products from manufacturers who may have a long and difficult-to-trace supply chain. As the spot price of these materials varies, producers of the metal intermediates can be expected to change the mix of sources used, and components and assemblies which we buy may have a mix of sources as their origin. We are required to carry out a diligent effort to determine and disclose the source of these materials. There can be no assurance we can obtain this information from intermediate producers who are unwilling or unable to provide this information or further identify their sources of supply or to notify us if these sources change. These metals are subject to price fluctuations and shortages which can affect our ability to obtain the manufactured materials we rely on at favorable terms or from consistent sources. These changes could have an adverse impact on our ability to manufacture and market our devices and products.
The Medicare and Medicaid anti-kickback laws, and several similar state laws that may apply to items or services reimbursed by any third-party payor, including commercial insurers, prohibit payments or other remuneration that could be considered to induce hospitals, physicians or other potential purchasers of our products either to refer patients or to purchase, lease or order, or arrange for or recommend the purchase, lease or order of healthcare products or services for which payment may be made under federal and state healthcare programs, such as Medicare and Medicaid. Further, the recently enacted PPACA, among other things, amends the intent requirement of the federal anti-kickback and criminal health care fraud statutes. A person or entity no longer needs to have actual knowledge of this statute or specific intent to violate it. In addition, the PPACA provides that the government may assert that a claim including items or services resulting from a violation of the federal anti-kickback statute constitutes a false or fraudulent claim for purposes of the false claims statutes. These laws may affect our sales, marketing and other promotional activities by limiting the kinds of financial arrangements we may have with hospitals, physicians or other potential purchasers of our products. They particularly impact how we structure our sales offerings, including discount practices, customer support, education and training programs, physician consulting and other service arrangements. These laws are broadly written, and it is often difficult to determine precisely how these laws will be applied to specific circumstances. Violating anti-kickback laws can result in civil and criminal penalties, which can be substantial and include exclusion from government healthcare programs for noncompliance. Even an unsuccessful challenge or investigation into our practices could cause adverse publicity, and be costly to defend, and thus could harm our business and results of operations.
The PPACA also imposes new reporting and disclosure requirements on device manufacturers for any “transfer of value” made or distributed to prescribers and other healthcare providers. Such information must be made publicly available in a searchable format. In addition, device manufacturers will also be required to report and disclose any investment interests held by physicians and their immediate family members during the preceding calendar year. Failure to submit required information may result in civil monetary penalties of up to an aggregate of $150,000 per year (and up to an aggregate of $1 million per year for “knowing failures”), for all payments, transfers of value or ownership or investment interests not reported in an annual submission. Device manufacturers were required to begin collecting data on August 1, 2013 and will be required to submit reports to CMS by March 31, 2014 and the 90th day of each subsequent calendar year.
In addition, there has been a recent trend of increased federal and state regulation of payments made to physicians, including the tracking and reporting of gifts, compensation and other remuneration to physicians. Certain states mandate implementation of commercial compliance programs to ensure compliance with these laws, impose restrictions on device manufacturer marketing practices and/or require the tracking and reporting of gifts, compensation and other remuneration to physicians. The shifting commercial compliance environment and the need to build and maintain robust and expandable systems to comply with multiple jurisdictions with different compliance and/or reporting requirements increases the possibility that a healthcare company may be found out of compliance of one or more of the requirements, subjecting us to significant civil monetary penalties.
Compliance with complex foreign and U.S. laws and regulations that apply to our international operations increases our cost of doing business in international jurisdictions and could expose us or our employees to fines and penalties in the United States and/or abroad. These numerous and sometimes conflicting laws and regulations include U.S. laws such as the Foreign Corrupt Practices Act, and similar laws in foreign countries, such as the U.K. Bribery Act of 2010, which became effective on July 1, 2011. Violations of these laws and regulations could result in fines, criminal sanctions against us, our officers or our employees, prohibitions on the conduct of our business and damage to our reputation. Although we have implemented policies and procedures
24
designed to ensure compliance with these laws, there can be no assurance that our employees, contractors or agents will not violate our policies.
OUR PRODUCTS ARE SUBJECT TO A LENGTHY AND UNCERTAIN DOMESTIC REGULATORY REVIEW PROCESS. IF WE DO NOT OBTAIN AND MAINTAIN THE NECESSARY DOMESTIC REGULATORY AUTHORIZATIONS, WE WILL NOT BE ABLE TO PROVIDE OUR PRODUCTS IN THE UNITED STATES.
Our products and operations are subject to extensive regulation in the United States by the U.S. Food and Drug Administration (“FDA”). The FDA regulates the development, bench and clinical testing, manufacturing, labeling, storage, record keeping, promotion, sales, distribution and postmarket support and reporting of medical devices in the United States to ensure that medical products distributed domestically are safe and effective for their intended uses. In order for us to market certain products for use in the United States, we generally must first obtain clearance from the FDA pursuant to Section 510(k) of the Federal Food Drug and Cosmetic Act (“FFDCA”). Clearance under Section 510(k) requires demonstration that a new device is substantially equivalent to another device with 510(k) clearance or grandfathered (“pre-amendment”) status. If we significantly modify our products after they receive FDA clearance, the FDA may require us to submit a separate 510(k) or premarket approval application (“PMA”) for the modified product before we are permitted to market the products in the United States. In addition, if we develop products in the future that are not considered to be substantially equivalent to a device with 510(k) clearance or grandfathered status, we will be required to obtain FDA approval by submitting a PMA. The FDA may not act favorably or quickly in its review of our 510(k) or PMA submissions, or we may encounter significant difficulties and costs in our efforts to obtain FDA clearance or approval, all of which could delay or preclude sale of new products in the United States. Furthermore, the FDA may request additional data or require us to conduct further testing, or compile more data, including clinical data and clinical studies, in support of a 510(k) submission. Regulatory policy affecting our products can change at any time. The changes and their impact on our business cannot be accurately predicted.
For example, in 2011, the FDA announced a Plan of Action to modernize and improve the FDA’s premarket review of medical devices, and has implemented, and continues to implement, reforms intended to streamline the premarket review process. In addition, as part of the Food and Drug Administration Safety and Innovation Act of 2012, or FDASIA, Congress enacted several reforms entitled the Medical Device Regulatory Improvements and additional miscellaneous provisions which will further affect medical device regulation both pre- and post-approval.
Changes in the FDA 510(k) process could make approval more difficult to obtain, increase delay, add uncertainty and have other significant adverse effects on our ability to obtain and maintain approval for our products. The FDA may also, instead of accepting a 510(k) submission, require us to submit a PMA, which is typically a much more complex, lengthy and burdensome application than a 510(k). To support a PMA, the FDA would likely require that we conduct one or more clinical studies to demonstrate that the device is safe and effective. In some cases such studies may be requested for a 510(k) as well. We may not be able to meet the requirements to obtain 510(k) clearance or PMA approval, in which case the FDA may not grant any necessary clearances or approvals. In addition, the FDA may place significant limitations upon the intended use of our products as a condition to a 510(k) clearance or PMA approval. Product applications can also be denied or withdrawn due to failure to comply with regulatory requirements or the occurrence of unforeseen problems following clearance or approval. Any delays or failure to obtain FDA clearance or approvals of new products we develop, any limitations imposed by the FDA on new product use, or the costs of obtaining FDA clearance or approvals could have a material adverse effect on our business, financial condition and results of operations.
In order to conduct a clinical investigation involving human subjects for the purpose of demonstrating the safety and effectiveness of a medical device, a company must, among other things, apply for and obtain Institutional Review Board (“IRB”) approval of the proposed investigation. In addition, if the clinical study involves a “significant risk” (as defined by the FDA) to human health, the sponsor of the investigation must also submit and obtain FDA approval of an Investigational Device Exemption (“IDE”) application. Many of our products to date have been or would be considered significant risk devices requiring IDE approval prior to investigational use. We may not be able to obtain FDA and/or IRB approval to undertake clinical trials in the United States for any new devices we intend to market in the United States in the future. If we obtain such approvals, we may not be able to conduct studies which comply with the IDE and other regulations governing clinical investigations or the data from any such trials may not support clearance or approval of the investigational device. Failure to obtain such approvals or to comply with such regulations could have a material adverse effect on our business, financial condition and results of operations. Certainty that clinical trials will meet desired endpoints, produce meaningful or useful data and be free of unexpected adverse effects, or that the FDA will accept the validity of foreign clinical study data cannot be assured, and such uncertainty could preclude or delay market clearance or authorizations resulting in significant financial costs and reduced revenue.
In addition, some products may be regulated by the FDA as Drugs, Biologics or Combination devices which carry still greater requirements for clinical trials, regulatory submissions and approvals.
25
COMPLYING WITH FDA REGULATIONS IS A COMPLEX PROCESS, AND OUR FAILURE TO COMPLY FULLY COULD SUBJECT US TO SIGNIFICANT ENFORCEMENT ACTIONS.
Because our products, including the
da Vinci
Surgical System, are commercially distributed, numerous quality and postmarket regulatory requirements apply, including the following:
|
•
|
continued compliance to the QSR, which requires manufacturers to follow elaborate design, testing, control, documentation and other quality assurance procedures during the development and manufacturing process;
|
|
•
|
labeling regulations;
|
|
•
|
the FDA’s general prohibition against false or misleading statements in the labeling or promotion of products for unapproved or “off-label” uses;
|
|
•
|
stringent complaint reporting and Medical Device Reporting regulations, which requires that manufacturers keep detailed records of investigations or complaints against their devices and to report to the FDA if their device may have caused or contributed to a death or serious injury or malfunctioned in a way that would likely cause or contribute to a death or serious injury if it were to recur;
|
|
•
|
adequate use of the Corrective and Preventive Actions process to identify and correct or prevent significant systemic failures of products or processes or in trends which suggest same; and
|
|
•
|
the reporting of Corrections and Removals, which requires that manufacturers report to the FDA recalls and field corrective actions taken to reduce a risk to health or to remedy a violation of the FFDCA that may pose a risk to health.
|
We are subject to inspection and marketing surveillance by the FDA to determine our compliance with regulatory requirements. If the FDA finds that we have failed to comply, it can institute a wide variety of enforcement actions, ranging from inspectional observations (Form FDA 483) to a public Warning Letter to more severe civil and criminal sanctions including the seizure of our products and equipment or ban on the import or export of our products. Our failure to comply with applicable requirements could lead to an enforcement action that may have an adverse effect on our financial condition and results of operations.
Any modification or change of medical devices cleared for market requires the manufacturer to make a determination whether the change is significant enough to require new 510(k) clearance. We have created labeling, advertising and user training for the
da Vinci
Surgical System to describe specific surgical procedures that we believe are fully within the scope of our existing 510(k) indications for use stated in our 510(k) clearances. Although we have relied on expert in-house and external staff, consultants and advisors, many of whom were formerly employed by FDA and familiar with FDA requirements, we cannot assure that the FDA would agree that all such specific procedures are within the scope of the existing general clearance or that we have compiled adequate information to support the safety and efficacy of using the
da Vinci
Surgical System for all such specific procedures. We also have modified the hardware and software in the
da Vinci
Surgical System since obtaining 510(k) clearance in ways that we do not believe require new 510(k) clearance. We cannot assure that the FDA would agree in all cases with our determinations not to seek new 510(k) clearance for any of these changes. Computer Motion, which we acquired in 2003, also modified the hardware and software in its products subsequent to 510(k) clearance without seeking new clearance. The FDA could impose enforcement sanctions and/or require us to obtain 510(k) clearance for any modification to our products or Computer Motion’s products. We may be prohibited from marketing the modified device until such 510(k) clearance is granted.
A FDA inspection of the Company’s facilities occurred in April-May 2013 and the FDA issued a Form FDA 483 listing four observations relating to the reporting of field corrections, information which is to be included on reports of field corrections, written procedures for changes to certain product labeling, and design input documentation. We responded to each observation with corrective actions during the course of the inspection and provided additional evidence of corrective actions to the FDA in response to the Form FDA 483. The FDA issued a Warning Letter, dated July 16, 2013, related to two of the four Form FDA 483 observations asking for additional corrective actions and indicated their intent to perform a follow-up inspection. We have responded to the Warning Letter with plans for corrective action, and continue to provide supplemental responses with objective evidence of corrections as they are completed. In addition, the FDA collected electronic samples of all our advertising and promotional material for review, and to date have taken no action in connection therewith. However, we cannot assure that, upon re-inspection, the FDA will find that our corrective actions are acceptable or that they have been adequately implemented. We also cannot assure that the FDA will not find other observations. The FDA previously inspected our Sunnyvale, CA facilities in January 2012 and did not issue a Form FDA 483 as a result of this inspection.
The receipt of a Warning Letter places certain limits on the ability to obtain FDA issued Certificates to Foreign Government (“CFGs”) used for new and re-registration of products in certain foreign countries.
We have a wholly owned manufacturing facility located in Mexicali, Mexico which manufactures reusable and disposable surgical instruments. This facility is registered with the U.S. FDA as well as Mexican authorities. The facility is operated under U.S. and international quality system regulations including those applicable to Canada, the European Union and Japan among others. Our wholly owned manufacturing facility in Mexicali, Mexico has an FDA Establishment Registration but has not been
26
FDA inspected to date. If the FDA were to determine non-conformances in our product documentation or quality system compliance, they could hold indefinitely the importation of instruments at the border which would deprive us of the ability to sell and supply the majority of our customers until the FDA requirements have been satisfied. Similar supply disruptions could occur if key suppliers outside of U.S. were to encounter non-conformances with their documentation or quality system compliance.
OUR PRODUCTS ARE SUBJECT TO VARIOUS INTERNATIONAL REGULATORY PROCESSES AND APPROVAL REQUIREMENTS. IF WE DO NOT OBTAIN AND MAINTAIN THE NECESSARY INTERNATIONAL REGULATORY APPROVALS, WE WILL NOT BE ABLE TO PROVIDE OUR PRODUCTS IN FOREIGN COUNTRIES.
To be able to provide our products in other countries, we must obtain regulatory approvals and comply with the regulations of those countries which may differ substantially from those of the United States. These regulations, including the requirements for approvals and the time required for regulatory review, vary from country to country. Obtaining and maintaining foreign regulatory approvals is complex, and we cannot be certain that we will receive regulatory approvals in any foreign country in which we plan to market our products, or to obtain such approvals on a favorable schedule. If we fail to obtain or maintain regulatory approval in any foreign country in which we plan to market our products, our ability to generate revenue will be harmed. In particular, if the US FDA refuses to provide CFGs our ability to register products or renew such registrations may be delayed or denied.
The EU requires that manufacturers of medical products obtain the right to affix the CE mark to their products before selling them in member countries of the EU. The CE mark is an international symbol of adherence to quality assurance standards and compliance with applicable European medical device directives. In order to obtain the authorization to affix the CE mark to products, a manufacturer must obtain certification that its processes meet certain European quality standards. In January 1999, we received permission to affix the CE mark to our
da Vinci
Surgical System and
EndoWrist
instruments and have maintained this authorization continuously since that time. From time to time we seek the authorization to affix the CE mark to new or modified products. Subsequent products and accessories have received marketing authorization by our Notified Body, DGM. In September 2013 we received notice that DGM has changed their name to PreSafe following acquisition by a larger Notified Body. This is expected to have little impact on our operations other than replacement of various quality system certificates with the new name.
As we modify existing products or develop new products in the future, including new instruments, we currently plan to apply for authorization to affix the CE mark to such products. In addition, we will be subject to annual regulatory audits in order to maintain the CE mark authorizations we have already obtained including inspection of our compliance to required standards and directives to enable this path to CE marking. We cannot be certain we will be able to affix the CE mark for new or modified products or that we will continue to meet the quality and performance standards required to maintain the authorizations we have already received. If we are unable to maintain permission to affix the CE mark to our products, we will no longer be able to sell our products in member countries of the EU and many affiliated countries that accept the CE mark, which would have a material adverse effect on our results of operations. Some member states of the European Union have additional requirements for registration and notification which may add to the time and effort to obtain market access. In addition, the regulations applied to end users of our products may increase over time, forcing us to provide additional solutions to regulations which do not apply directly to us, but which apply indirectly as they may limit our customers’ ability to use our products.
In November 2009, we received Shonin approval from the Japanese Ministry of Health, Labor and Welfare (“MHLW”) for our
da Vinci S
Surgical System and in October 2012, we received approval for our
da Vinci Si
system and various associated instruments and accessories for use in certain
da Vinci
procedures. We may seek additional approvals for other products and/or procedures, however, there can be no assurance that such approvals will be granted. In addition, because only a subset of our instruments have received Shonin approval, and reimbursement is an additional process to generate market acceptance, it is possible that approved procedures will be adopted slowly or not at all. Sales of our products depend, in part, on the extent to which the costs of our products are reimbursed by governmental health administration authorities. To date, we have received reimbursement approvals in Japan for a limited set of procedures and products. If we are not successful in obtaining the necessary reimbursement approvals or obtaining approvals for future products and procedures, then the demand for our products could be limited. These limitations could eliminate a significant market opportunity for our products in Japan. In addition, in January 2012 we acquired certain assets of our distributor in Korea, Bio-Robotics. Our
da Vinci S
system was approved in Korea in April 2007 and our SI system was approved in December 2009. Since that time, we have received regulatory approvals for additional instruments and accessories from these regulatory agencies. Our products are highly regulated in Korea and we face many of the same risks and limitations on the commercialization of our products as in Japan and the United States.
27
IF OUR MANUFACTURING FACILITIES DO NOT CONTINUE TO MEET FEDERAL, STATE OR OTHER MANUFACTURING STANDARDS, WE MAY BE REQUIRED TO TEMPORARILY CEASE ALL OR PART OF OUR MANUFACTURING OPERATIONS, IMPORT/EXPORT OF OUR PRODUCTS AND/OR RECALL SOME PRODUCTS WHICH WOULD RESULT IN SIGNIFICANT PRODUCT DELIVERY DELAYS AND LOST REVENUE.
Our manufacturing facilities are subject to periodic inspection by regulatory authorities and our operations will continue to be regulated and inspected by the FDA and other regulatory agencies for compliance with Good Manufacturing Practice requirements contained in the QSR and other regulatory requirements. We are also required to comply with International Organization for Standardization (“ISO”) quality system standards as well as European Directives and norms in order to produce products for sale in the European Union. In addition, many countries such as Canada and Japan have very specific additional regulatory requirements for quality assurance and manufacturing. If we fail to continue to comply with Good Manufacturing Practice requirements, as well as ISO or other regulatory standards, we may be required to cease all or part of our operations until we comply with these regulations. Our last FDA inspection occurred in January 2012. The FDA did not issue a Form FDA 483, also known as a Notice of Inspectional Observations, and the Establishment Inspection Report, dated February 29, 2012 has been received. In 2010 the FDA issued a Form FDA 483 listing deficiencies under the QSR relating to complaint handling and manufacturing/inspection handling. We responded to each observation with proposed corrective actions which were thereafter completed and verified.
In April of 2013, the FDA conducted an inspection of our facilities which resulted in the issuance of a Form FDA 483 on May 30, 2013. The Form FDA 483 listed deficiencies in the areas of reporting of Field Actions, the documentation of our Letter to File process and specific observations about Design Inputs. On July 16, 2013, FDA issued a Warning Letter to Intuitive expanding on two of the four observations in the Form FDA 483 issued May 30, 2013. We responded to the FDA Form 483 observations and Warning Letter citations with plans for corrective action and objective evidence of corrections as they are completed. The receipt of a Warning Letter places certain limits on the ability to obtain FDA issued CFGs used for new and re-registration of products in certain foreign countries. In addition, it creates a limitation on the use of so-called “special 510(k)” regulatory submissions which have a shorter review cycle than “traditional” 510(k)'s. These limitations are expected to result in delays in the registration of some products in a small number of foreign countries and lengthen the submission cycle for simple changes which are subject to 510(k) clearance.
Although we have made the closure of the Warning Letter a top priority and have engaged additional highly qualified outside experts to thoroughly examine and assist in the remediation of the areas cited by the FDA in the Form FDA 483 and Warning Letter, there can be no guarantee of the timing to clear the Warning Letter or preclude additional FDA requirements or enforcement actions.
We continue to be subject to FDA and certain other inspections at any time. Maintaining such compliance is difficult and costly. We cannot be certain that our facilities will be found to comply with Good Manufacturing Practice requirements or ISO standards and other regulatory requirements in future inspections and audits by regulatory authorities.
Our Sunnyvale, California facility is licensed by the State of California to manufacture medical devices. We have been subject to periodic inspections by the California Department of Health Services Food and Drug Branch and, if we are unable to maintain this license following any future inspections, we will be unable to manufacture or ship some products, which would have a material adverse effect on our results of operations. In 2012 the State of California announced suspension of routine inspections but this policy could be modified or inspections could be resumed for specific circumstances. In addition, both our Sunnyvale, California and Mexicali, Mexico facilities are subject to periodic inspections by other regulatory bodies, including third party auditors on behalf of national regulatory authorities. Compliance with multiple regulatory standards is complex, difficult and costly to maintain, and material deficiencies could result in significant limitations on our ability to manufacture, transport and sell our products in one or more countries.
In January 2013, we leased additional manufacturing space in Mexicali, Mexico and we are in the process of installing manufacturing lines in this new space as well as making changes to the configurations of existing manufacturing space. Such changes require various types of regulatory notifications and approvals depending on the country where product manufactured in these buildings is shipped. The process for obtaining those approvals and providing notifications or registrations is underway but delays or limitations could adversely affect our ability to deliver products to certain countries until all required regulatory authorizations are in place. This facility will be subject to the same types of periodic inspections and compliance requirements described above.
RISKS RELATING TO OUR INTELLECTUAL PROPERTY
IF WE ARE UNABLE TO REPLACE OUR EXPIRING PATENTS, OUR ABILITY TO COMPETE IN THE MARKET WILL BE HARMED.
We believe new competitors will emerge in medical robotics. We also do not know whether we will be able to develop additional patentable proprietary technologies as older patents expire. If we fail to obtain adequate protection of our intellectual
28
property, or if any protection we obtain is reduced or eliminated, our ability to prevent others from using our intellectual property could be adversely affected, resulting in harm to our business.
IF WE ARE UNABLE TO PROTECT THE INTELLECTUAL PROPERTY CONTAINED IN OUR PRODUCTS FROM USE BY THIRD PARTIES, OUR ABILITY TO COMPETE IN THE MARKET WILL BE HARMED.
Our commercial success will depend in part on obtaining patent and other intellectual property protection for the technologies contained in our products, and on successfully defending our patents and other intellectual property against third-party challenges. We will incur substantial costs in obtaining patents and, if necessary, defending our proprietary rights. The patent positions of medical device companies, including ours, can be highly uncertain and involve complex and evolving legal and factual questions. We do not know whether we will obtain the patent protection we seek, or that the protection we do obtain will be found valid and enforceable if challenged. We also do not know whether we will be able to develop additional patentable proprietary technologies. We may also determine that it is in our best interests to voluntarily challenge a third party’s products or patents in litigation or administrative proceedings, including patent interferences or reexaminations. Furthermore, the laws of certain foreign countries do not protect intellectual property rights to the same extent as do the laws of the United States.
In addition to patents, we typically rely on a combination of trade secret, copyright and trademark laws, nondisclosure agreements and other contractual provisions and technical security measures to protect our intellectual property rights. Nevertheless, these measures may not be adequate to safeguard the technology underlying our products. If these measures do not protect our rights adequately, third parties could use our technology, and our ability to compete in the market would be reduced. In addition, employees, consultants and others who participate in developing our products may breach their agreements with us regarding our intellectual property, and we may not have adequate remedies for the breach. We also may not be able to effectively protect our intellectual property rights in some foreign countries. For a variety of reasons, we may decide not to file for patent, copyright or trademark protection outside the United States. We also realize that our trade secrets may become known through other means not currently foreseen by us. Notwithstanding our efforts to protect our intellectual property, our competitors may independently develop similar or alternative technologies or products that are equal or superior to our technology and products without infringing any of our intellectual property rights, or may design around our proprietary technologies, which would harm our ability to compete in the market.
OTHERS MAY ASSERT THAT OUR PRODUCTS INFRINGE THEIR INTELLECTUAL PROPERTY RIGHTS, WHICH MAY CAUSE US TO ENGAGE IN COSTLY DISPUTES AND, IF WE ARE NOT SUCCESSFUL IN DEFENDING OURSELVES, COULD ALSO CAUSE US TO PAY SUBSTANTIAL DAMAGES AND PROHIBIT US FROM SELLING OUR PRODUCTS.
There may be U.S. and foreign patents issued to third parties that relate to our products. Some of these patents may be broad enough to cover one or more aspects of our present or future technology. We do not know whether any of these patents, if challenged, would be held valid, enforceable and infringed. From time to time, we receive, and likely will continue to receive, letters from third parties accusing us of infringing and/or inviting us to license their patents. We may be sued by, or become involved in an administrative proceeding with, one or more of these third parties.
We cannot assure that a court or administrative body would agree with any arguments or defenses we may have concerning invalidity, unenforceability or non-infringement of any third-party patent. In addition to the issued patents of which we are aware, other parties may have filed, and in the future are likely to file, patent applications covering products that are similar or identical to ours. We cannot assure that any patents issuing from applications filed by a third party will not cover our products or will not have priority over our patent applications.
The medical device industry has been characterized by extensive litigation and administrative proceedings regarding patents and other intellectual property rights, and companies have employed such actions to gain a competitive advantage. If third parties assert infringement or other intellectual property claims against us, our technical and management personnel will experience a significant diversion of time and effort and we will incur large expenses defending our Company. If third parties in any patent action are successful, our patent portfolio may be damaged, we may have to pay substantial damages, including treble damages, and we may be required to stop selling our products or obtain a license which, if available at all, may require us to pay substantial royalties. We cannot be certain that we will have the financial resources or the substantive arguments to defend our patents from infringement or claims of invalidity or unenforceability, or to defend against allegations of infringement of third-party patents. In addition, any public announcements related to litigation or administrative proceedings initiated by us, or initiated or threatened against us, could cause our stock price to decline.
OUR PRODUCTS RELY ON LICENSES FROM THIRD PARTIES, AND IF WE LOSE ACCESS TO THESE TECHNOLOGIES, OUR REVENUES COULD DECLINE.
We rely on technology that we license from others, including technology that is integral to our products. We have entered into license agreements with several industry partners. Any of these agreements may be terminated for breach. If any of these agreements are terminated, we may be unable to reacquire the necessary license on satisfactory terms, or at all. The loss or failure
29
to maintain these licenses could prevent or delay further development or commercialization of our products, which would have a material adverse effect on our results of operations.
RISKS RELATING TO OUR TRADING MARKETS
OUR FUTURE OPERATING RESULTS MAY BE BELOW SECURITIES ANALYSTS’ OR INVESTORS’ EXPECTATIONS, WHICH COULD CAUSE OUR STOCK PRICE TO DECLINE.
Due to the nascent nature of our industry, we have limited insight into trends that may emerge in our market and affect our business. The revenue and income potential of our market are unproven, and we may be unable to continue to generate significant revenues. Our products typically have a lengthy sales cycle. In addition, our costs may be higher than we anticipated. If we fail to generate sufficient revenues or our costs are higher than we expect, our results of operations will suffer. Further, future revenue from sales of our products is difficult to forecast because the market for new surgical technologies is still evolving. Our results of operations will depend upon numerous factors, including:
|
•
|
the extent to which our products gain market acceptance;
|
|
•
|
actions relating to regulatory matters;
|
|
•
|
our timing and ability to develop our manufacturing and sales and marketing capabilities;
|
|
•
|
demand for our products;
|
|
•
|
the size and timing of particular sales and any collection delays related to those sales;
|
|
•
|
product quality and supply problems;
|
|
•
|
the progress of surgical training in the use of our products;
|
|
•
|
our ability to develop, introduce and market new or enhanced versions of our products on a timely basis;
|
|
•
|
third-party payor reimbursement policies;
|
|
•
|
our ability to protect our proprietary rights and defend against third party challenges;
|
|
•
|
our ability to license additional intellectual property rights; and
|
|
•
|
the progress and results of clinical trials.
|
Our operating results in any particular period will not be a reliable indication of our future performance. It is likely that in some future quarters, our operating results will be below the expectations of securities analysts or investors. If this occurs, the price of our common stock, and the value of your investment, will likely decline.
OUR STOCK PRICE HAS BEEN, AND WILL LIKELY CONTINUE TO BE, VOLATILE.
The market price of our common stock has experienced fluctuations and is likely to fluctuate significantly in the future. For example, during fiscal 2010, the NASDAQ closing
price of one share of our common stock reached a high of $388.01 and a low of $247.50, during fiscal 2011, it reached a high of $466.30 and a low of $267.40, during fiscal 2012, it reached a high of $588.28 and a low of $440.00, and during fiscal 2013, it reached a high of $583.67 and a low of $355.93. Our stock price can fluctuate for a number of reasons, including:
|
•
|
announcements about us or our competitors;
|
|
•
|
quarterly variations in operating results;
|
|
•
|
introduction or abandonment of new technologies or products;
|
|
•
|
regulatory approvals and enforcement actions;
|
|
•
|
changes in product pricing policies;
|
|
•
|
changes in earnings estimates by analysts or changes in accounting policies;
|
|
•
|
economic changes and overall market volatility; and
|
|
•
|
political uncertainties.
|
In addition, stock markets have experienced significant price and volume volatility in the past, especially recently. This volatility has had a substantial effect on the market prices of securities of many public companies for reasons frequently unrelated or disproportionate to the operating performance of the specific companies. In addition, the securities of many medical device companies, including us have historically been subject to extensive price and volume fluctuations that may affect the market price of their common stock. If these broad market fluctuations continue, they may adversely affect the market price of our common stock.
|
ITEM 1B.
|
UNRESOLVED STAFF COMMENTS
|
None.
30
|
ITEM 2.
|
PROPERTIES
|
As of December 31, 2013, we owned approximately 899,000 square feet of space on 55 acres of land in Sunnyvale, California, where we house our headquarters, research and development, service and support functions, and certain of our manufacturing operations. In Norcross, Georgia, we owned approximately 92,000 square feet of space on ten acres, of which 50,000 square feet of space serves as our East Coast sales and training headquarters and 41,000 square of space is currently leased to third parties and will be used for the future expansion of our East Coast sales and training campus. In Aubonne, Switzerland, we owned 15,000 square feet of space on 1.5 acres, which is used for our international headquarters. We leased approximately 5,000 square feet of space for research and development in Milford, Connecticut, approximately 17,000 square feet in Georgia for which we are currently looking for a sublease tenant and 74,000 square feet in Mexicali, Mexico where we manufacture most of our
EndoWrist
instruments. We also leased facilities for sales and operations in Tokyo, Japan, Shanghai, China, and Seoul, Korea.
|
ITEM 3.
|
LEGAL PROCEEDINGS
|
We are involved in a variety of claims, lawsuits, investigations and proceedings relating to securities laws, product liability, patent infringement, contract disputes and other matters relating to various claims that arise in the normal course of our business. Certain of these lawsuits and claims are described in further detail below. We do not know whether we will prevail in these matters nor can we assure that any remedy could be reached on commercially reasonable terms, if at all. It is not possible to predict the outcome of the pending or threatened litigation matters currently disclosed. We have therefore determined that an estimate of possible loss or range of loss cannot be determined as of December 31, 2013. Nevertheless, it is possible that future legal costs (including settlements, judgments, legal fees and other related defense costs) could have a material adverse effect on our business, financial condition, and results of operations or cash flows.
In accordance with U.S. generally accepted accounting principles, we record a liability when it is both probable that a liability has been incurred and the amount of the loss can be reasonably estimated. These provisions are reviewed at least quarterly and adjusted to reflect the impacts of negotiations, settlements, rulings, advice of legal counsel, and other information and events pertaining to a particular case.
Purported Shareholder Class Action Lawsuit filed August 6, 2010
On August 6, 2010, a purported class action lawsuit entitled
Perlmutter v. Intuitive Surgical et al.
, No. CV10-3451, was filed against seven of our current and former officers and directors in the United States District Court for the Northern District of California. The lawsuit seeks unspecified damages on behalf of a putative class of persons who purchased or otherwise acquired our common stock between February 1, 2008 and January 7, 2009. The complaint alleges that the defendants violated federal securities laws by making allegedly false and misleading statements and omitting certain material facts in our filings with the Securities and Exchange Commission. On February 15, 2011, the Police Retirement System of St. Louis was appointed lead plaintiff in the case pursuant to the Private Securities Litigation Reform Act of 1995. An amended complaint was filed on April 15, 2011, making allegations substantially similar to the allegations described above. On May 23, 2011, we filed a motion to dismiss the amended complaint. On August 10, 2011, that motion was granted and the action was dismissed; the plaintiffs were given 30 days to file an amended complaint. On September 12, 2011, plaintiffs filed their amended complaint. The allegations contained therein are substantially similar to the allegations in the prior complaint. We filed a motion to dismiss the amended complaint. A hearing occurred on February 16, 2012, and on May 22, 2012 our motion was granted. The complaint was dismissed with prejudice, and a final judgment was entered in our favor on June 1, 2012. On June 20, 2012, plaintiffs filed a notice of appeal with the United States Court of Appeals for the Ninth Circuit. The appeal is styled
Police Retirement System of St. Louis v. Intuitive Surgical, Inc. et al.
, No. 12-16430. Plaintiffs filed their opening brief on September 28, 2012. We filed an answering brief on November 13, 2012, and plaintiffs filed a reply brief on December 17, 2012. No oral argument date has been set, and the appeal remains pending. Based on currently available information, we do not believe the resolution of this matter will have a material adverse effect on our business, financial position or future results of operations.
Purported Derivative Actions
On August 19, 2010, an alleged stockholder caused a purported stockholder’s derivative lawsuit entitled
Himmel v. Smith et al
., No. 1-10-CV-180416, to be filed in the Superior Court of California for the County of Santa Clara naming us as a nominal defendant, and naming 14 of our current and former officers and directors as defendants. The lawsuit seeks to recover, for our benefit, unspecified damages purportedly sustained by us in connection with allegedly misleading statements and/or omissions made in connection with our financial reporting for the period between February 1, 2008 and January 7, 2009. It also seeks a series of changes to our corporate governance policies and an award of attorneys’ fees. On September 15, 2010, another purported stockholder filed a substantially identical lawsuit entitled
Applebaum v. Guthart et al
., No. 1-10-CV-182645, in the same court against 15 of our current and former officers and directors. On October 5, 2010, the court ordered that the two cases be consolidated for all purposes. By agreement with the plaintiffs, all activity in the case has been stayed pending the results of the appeal in the purported shareholder class action lawsuit discussed above. Based on currently available information, we do not believe the resolution of this matter will have a material adverse effect on our business, financial position or future results of operations.
31
Purported Shareholder Class Action Lawsuits filed April 26, 2013 and May 24, 2013
On April 26, 2013, a purported class action lawsuit entitled
Abrams v. Intuitive Surgical, et al.
, No. 5-13-cv-1920, was filed against several of our current and former officers and directors in the United States District Court for the Northern District of California. A substantially identical complaint, entitled
Adel v. Intuitive Surgical, et al.
, No. 5:13-cv-02365, was filed in the same court against the same defendants on May 24, 2013. The Adel case was voluntarily dismissed without prejudice on August 20, 2013.
On October 15, 2013 the plaintiffs in the Abrams matter filed an amended complaint. The case has since been re-titled
In re Intuitive Surgical Securities Litigation
. The plaintiffs seek unspecified damages on behalf of a putative class of persons who purchased or otherwise acquired our common stock between February 6, 2012 and July 18, 2013. The amended complaint alleges that the defendants violated federal securities laws by making allegedly false and misleading statements and omitting certain material facts in our filings with the Securities and Exchange Commission. On November 18, 2013 the Court appointed Employees’ Retirement System of the State of Hawaii as lead plaintiff and appointed lead counsel. We filed a motion to dismiss the amended complaint on December 16, 2013. We anticipate a hearing on our motion in May 2014. Based on currently available information, we do not believe the resolution of this matter will have a material adverse effect on our business, financial position or future results of operations.
Product Liability Litigation
We are currently named as a defendant in a
bout
76
ind
ividual product liability lawsuits filed in various state and federal courts by plaintiffs who allege that they underwent surgical procedures that utilized the
da Vinci
Surgical System and sustained a variety of personal injuries and, in some cases, death as a result of such surgery. In addition, we have been named as a defendant in a purported class action filed in Louisiana state court, and removed to federal court, seeking damages on behalf of all patients who were allegedly injured by the
da Vinci
Surgical System at a single hospital in Louisiana. The cases raise a variety of allegations including, to varying degrees, that the plaintiffs’ injuries resulted from purported defects in the
da Vinci
Surgical System and/or failure on our part to provide adequate training resources to the healthcare professionals who performed plaintiffs’ surgeries. The cases further allege that we failed to adequately disclose and/or misrepresented the potential risks and/or benefits of the
da Vinci
Surgical System. Plaintiffs also assert a variety of causes of action, including for example, strict liability based on purported design defects, negligence, fraud, breach of express and implied warranties, unjust enrichment, and loss of consortium. Plaintiffs seek recovery for alleged personal injuries and, in many cases, punitive damages. Except for a few cases, including the
Taylor
case described below, these cases generally are in the early stages of pretrial activity.
Plaintiffs’ attorneys continue to engage in well-funded national advertising campaigns soliciting clients who have undergone
da Vinci
surgery and claim to have suffered an injury. The plaintiffs’ attorneys are now alleging that we are liable for those injuries under products liability theories. We continue to receive claims as a result of these advertising efforts; however, we have not received detailed information regarding all claims. In an effort to provide an orderly process for evaluating claims before they result in costly litigation, we have entered into tolling agreements with certain plaintiffs’ counsel acting on behalf of such claimants. The tolling agreements provide that the statute of limitations for each individual will be tolled for a certain period in exchange for the individual’s agreement that, if he or she ultimately files a lawsuit, it will be filed in certain agreed upon venues. A substantial number of claims have been added to the tolling agreements, which provide the parties and their legal counsel with additional time to evaluate the claims, and to explore whether the claims have merit and whether they can be resolved through mediation without litigation. As of result of these discussions, plaintiffs’ counsel have voluntarily removed a sizable number of claims from the tolling agreements and notified the Company that they no longer intend to pursue these claims. Nonetheless, we do not currently know how many individuals will ultimately file lawsuits or how many additional individuals will decide not to pursue their claims, nor are we able at this time to reasonably estimate the financial impact of their claims or predict the final disposition of such claims. Based on currently available information, we believe that we have meritorious defenses and although we continue to explore means of resolving individual claims or aggregate groups of claims without litigation, we intend to assert such defenses vigorously in the lawsuits that are currently pending and any future lawsuits. We are not at present able to determine whether the resolution of these matters will have a material adverse effect on our business, financial position or future results of operations.
In February 2011, we were named as a defendant in a product liability action that had originally been filed in Washington State Superior Court for Kitsap County against the healthcare providers and hospital involved in the plaintiff’s decedent’s surgery (
Josette Taylor, as Personal Representative of the Estate of Fred E. Taylor, deceased; and on behalf of the Estate of Fred E. Taylor v. Intuitive Surgical, Inc
., No. 09-2-03136-5). In
Taylor
, plaintiff asserted wrongful death and product liability claims against us, generally alleging that the decedent died four years after surgery as a result of injuries purportedly suffered during the surgery, which was conducted with the use of the
da Vinci
Surgical System. The plaintiff in
Taylor
asserted that such injuries were caused, in whole or in part, by our purported failure to properly train, warn, and instruct the surgeon. The lawsuit sought unspecified damages for past medical expenses, pain and suffering, loss of consortium as well as punitive damages. A trial commenced in the action on April 15, 2013. On May 23, 2013, the jury returned a defense verdict, finding that we were not negligent. Judgment was entered in our favor on June 7, 2013.
Plaintiff has filed a notice of appeal.
32
False Claims Act Litigation
In October 2013, we were served in a case entitled
Rose v. Intuitive Surgical, Inc.
, No. 12-cv-1812, in the Middle District of Florida. Relator Bryan Rose, a former employee of Intuitive Surgical, brought the action on behalf of the United States of America, alleging violations of the False Claims Act, 31 U.S.C. § 3729
et seq.
, and the analogous false-claims statutes of twenty-one states and of the District of Columbia. Broadly, he alleges that he has first-hand knowledge of a fraudulent scheme, involving kickbacks paid in exchange for referrals and surgical procedures, and first-hand knowledge of off-label usage of our products. The complaint was filed under seal on November 27, 2012, and was provided to the Department of Justice and the twenty-one states and the District of Columbia. The United States Government declined to intervene on October 8, 2013. The twenty-one states and the District of Columbia declined to intervene on November 21, 2013. Based on currently available information, we believe that we have meritorious defenses in this action and intend to assert them vigorously. Based on currently available information, we do not believe the resolution of this matter will have a material adverse effect on our business, financial position or future results of operations.
Insurance Litigation
In October 2013, we were named as a defendant in an insurance action entitled
Illinois Union Insurance Co. v. Intuitive Surgical, Inc.
, No. 3:13-cv-04863-JST, filed in the Northern District of California. Plaintiff Illinois Union Insurance Co. seeks to rescind the Life Sciences Products-Completed Operations Liability Policy issued by Plaintiff to us, which provides coverage for products liability claims first made against us during the policy period March 1, 2013 to March 1, 2014. In December 2013, we were named as a defendant in another insurance action entitled
Navigators Specialty Insurance Co. v. Intuitive Surgical, Inc.
, No. 5:13-cv-05801-HRL, filed in the Northern District of California. Plaintiff Navigators Insurance Co. alleges that the Follow Form Excess Liability Insurance Policy issued by Plaintiff to us for products liability claims first made against us during the policy period March 1, 2013 to March 1, 2014 should be rescinded. Both Plaintiffs generally allege that we did not disclose the existence of tolling agreements and the number of claimants incorporated within those agreements, and that those agreements were material to Plaintiffs’ underwriting processes. We intend to vigorously defend these actions. Based on currently available information, we do not believe the resolution of this matter will have a material adverse effect on our business, financial position or future results of operations.
|
ITEM 4.
|
MINE SAFETY DISCLOSURES
|
Not applicable.
33
|
ITEM 5.
|
MARKET FOR REGISTRANT’S COMMON EQUITY, RELATED STOCKHOLDER MATTERS AND ISSUER PURCHASES OF EQUITY SECURITIES
|
PRICE RANGE OF COMMON STOCK
Our common stock is being traded on The NASDAQ Global Select Market under the symbol “ISRG.” The following table sets forth the high and low closing prices of our common stock for each period indicated and are as reported by NASDAQ.
|
|
2013
|
2012
|
|||||||||||||
|
Fiscal
|
High
|
Low
|
High
|
Low
|
|||||||||||
|
First Quarter
|
$
|
583.67
|
|
$
|
459.44
|
|
$
|
546.31
|
|
$
|
440.00
|
|
|||
|
Second Quarter
|
$
|
513.49
|
|
$
|
470.30
|
|
$
|
588.28
|
|
$
|
503.01
|
|
|||
|
Third Quarter
|
$
|
504.01
|
|
$
|
363.89
|
|
$
|
566.61
|
|
$
|
472.48
|
|
|||
|
Fourth Quarter
|
$
|
401.68
|
|
$
|
355.93
|
|
$
|
551.19
|
|
$
|
479.50
|
|
|||
As of
January 17, 2014
, there were 241 stockholders of record of our common stock, although we believe that there are a significantly larger number of beneficial owners of our common stock.
DIVIDENDS
We have never declared or paid any cash dividends on our common stock. We intend to retain earnings for use in the operation and expansion of our business.
SECURITIES AUTHORIZED FOR ISSUANCE UNDER EQUITY COMPENSATION PLANS
The following table contains information as of December 31,
2013
for two categories of equity compensation plans.
|
Plan Category
|
Number of
securities to be
issued upon
exercise of
outstanding
options,
warrants and
rights (a)
|
Weighted-
average
exercise price
of outstanding
options
|
Number of securities
remaining available for
future issuance under
equity compensation
plans (excluding
securities reflected in
column (a))
|
||||||
|
Equity compensation plans approved by security holders
|
4,756,443
|
|
$
|
371.06
|
|
2,099,621
|
|
||
|
Equity compensation plans not approved by security holders
|
802,746
|
|
$
|
437.87
|
|
219,860
|
|
||
|
Total
|
5,559,189
|
|
$
|
380.71
|
|
2,319,481
|
|
||
RECENT SALES OF UNREGISTERED SECURITIES
None.
ISSUER PURCHASES OF EQUITY SECURITIES
The table below summarizes our stock repurchase activity during the fiscal quarter ended December 31,
2013
(in millions, except per share amounts):
|
Fiscal Period
|
Total Number of
Shares
Repurchased
|
Average
Price Paid
Per Share
|
Total Number of
Shares Purchased As
Part of a Publicly
Announced Program
|
Approximate Dollar
Amount of Shares That
May Yet be Purchased
Under the Program
|
|||||||||
|
October 1, 2013 to October 31, 2013
|
—
|
|
$
|
—
|
|
—
|
|
$
|
1,000.0
|
|
|||
|
November 1, 2013 to November 30, 2013
|
—
|
|
$
|
—
|
|
—
|
|
$
|
1,000.0
|
|
|||
|
December 1, 2013 to December 31,2013
|
—
|
|
$
|
—
|
|
—
|
|
$
|
1,000.0
|
|
|||
|
Total during quarter ended December 31, 2013
|
—
|
|
$
|
—
|
|
—
|
|
$
|
1,000.0
|
|
|||
Since March 2009, we have had an active stock repurchase program. The most recent Board authorizations were in March 2013 and July 2013 when the Board increased the authorization for stock repurchases by $1.0 billion and $0.8 billion. During the period from March 2009 to December 2013, we repurchased a total of 6.2 million shares of our common stock at a total of $2.0 billion. As of December 31, 2013, the remaining authorized amount of stock repurchases that may be made under the Board-authorized stock repurchase program was $1.0 billion.
34
STOCK PERFORMANCE GRAPH
The graph set forth below compares the cumulative total stockholder return on our common stock between December 31,
2008
and December 31,
2013
, with the cumulative total return of (i) the S&P Healthcare Index, (ii) the Nasdaq Composite Index and (iii) the S&P 500 Index, over the same period. This graph assumes the investment of $100.00 on December 31,
2008
in our common stock, the S&P Healthcare Index, the Nasdaq Composite Index, and the S&P 500 Index and assumes the reinvestment of dividends, if any. We included the comparison with the S&P 500 Index because our Company became a component of the S&P 500 Index on June 2, 2008.
The comparisons shown in the graph below are based upon historical data. We caution that the stock price performance shown in the graph below is not necessarily indicative of, nor is it intended to forecast, the potential future performance of our common stock.
|
COMPARISON OF CUMULATIVE TOTAL RETURN AMONG INTUITIVE SURGICAL, NASDAQ
COMPOSITE, S&P HEALTH CARE INDEX, AND S&P 500 INDEX
|
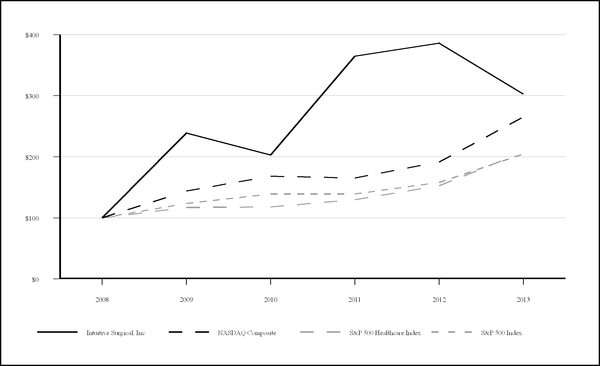
|
December 31,
|
|||||||||||||||||||||||
|
2008
|
2009
|
2010
|
2011
|
2012
|
2013
|
||||||||||||||||||
|
Intuitive Surgical, Inc.
|
$
|
100.00
|
|
$
|
238.94
|
|
$
|
202.97
|
|
$
|
364.60
|
|
$
|
386.15
|
|
$
|
302.45
|
|
|||||
|
NASDAQ Composite
|
$
|
100.00
|
|
$
|
143.89
|
|
$
|
168.22
|
|
$
|
165.19
|
|
$
|
191.47
|
|
$
|
264.84
|
|
|||||
|
S&P 500 Healthcare Index
|
$
|
100.00
|
|
$
|
117.07
|
|
$
|
117.90
|
|
$
|
129.89
|
|
$
|
152.58
|
|
$
|
207.42
|
|
|||||
|
S&P 500 Index
|
$
|
100.00
|
|
$
|
123.45
|
|
$
|
139.23
|
|
$
|
139.23
|
|
$
|
157.90
|
|
$
|
204.63
|
|
|||||
35
|
ITEM 6.
|
SELECTED FINANCIAL DATA
|
The following selected consolidated financial data should be read in conjunction with our Consolidated Financial Statements and the accompanying Notes and “Management’s Discussion and Analysis of Financial Condition and Results of Operations” included elsewhere in this report. The selected data in this section is not intended to replace the Consolidated Financial Statements.
|
|
Years Ended December 31,
|
||||||||||||||||||
|
|
2013
|
2012
|
2011
|
2010
|
2009
|
||||||||||||||
|
|
(In millions, except per share amounts and headcount)
|
||||||||||||||||||
|
Revenue
|
$
|
2,265.1
|
|
$
|
2,178.8
|
|
$
|
1,757.3
|
|
$
|
1,413.0
|
|
$
|
1,052.2
|
|
||||
|
Gross profit
|
$
|
1,594.2
|
|
$
|
1,570.3
|
|
$
|
1,273.8
|
|
$
|
1,030.0
|
|
$
|
751.1
|
|
||||
|
Net income
(1)
|
$
|
671.0
|
|
$
|
656.6
|
|
$
|
495.1
|
|
$
|
381.8
|
|
$
|
232.6
|
|
||||
|
Net income per common share:
|
|||||||||||||||||||
|
Basic
|
$
|
17.12
|
|
$
|
16.50
|
|
$
|
12.63
|
|
$
|
9.74
|
|
$
|
6.07
|
|
||||
|
Diluted
|
$
|
16.73
|
|
$
|
15.98
|
|
$
|
12.32
|
|
$
|
9.47
|
|
$
|
5.93
|
|
||||
|
Shares used in computing basic and diluted net income per share:
|
|||||||||||||||||||
|
Basic
|
$
|
39.2
|
|
$
|
39.8
|
|
$
|
39.2
|
|
$
|
39.2
|
|
$
|
38.3
|
|
||||
|
Diluted
|
$
|
40.1
|
|
$
|
41.1
|
|
$
|
40.2
|
|
$
|
40.3
|
|
$
|
39.2
|
|
||||
|
Cash, cash equivalents and investments
|
$
|
2,753.9
|
|
$
|
2,920.5
|
|
$
|
2,171.8
|
|
$
|
1,608.9
|
|
$
|
1,172.0
|
|
||||
|
Total assets
|
$
|
3,950.3
|
|
$
|
4,059.2
|
|
$
|
3,063.1
|
|
$
|
2,390.4
|
|
$
|
1,809.7
|
|
||||
|
Other long-term liabilities
|
$
|
68.0
|
|
$
|
77.5
|
|
$
|
96.9
|
|
$
|
79.2
|
|
$
|
69.6
|
|
||||
|
Stockholders’ equity
|
$
|
3,501.4
|
|
$
|
3,580.1
|
|
$
|
2,645.6
|
|
$
|
2,037.4
|
|
$
|
1,537.3
|
|
||||
|
Total headcount
|
2,792
|
|
2,362
|
|
1,924
|
|
1,660
|
|
1,263
|
|
|||||||||
|
(1)
|
Net income for the years ended December 31,
2013
,
2012
,
2011
,
2010
, and
2009
included share-based compensation expense of
$110.4 million
,
$105.8 million
,
$93.5 million
,
$78.4 million
and
$70.5 million
, respectively, net of tax, related to employee stock options and employee stock purchases. Net income for the years ended December 31,
2013
,
2012
,
2011
,
2010
, and
2009
included amortization of purchased intellectual property of
$21.3 million
,
$23.1 million
,
$17.8 million
,
$16.7 million
, and
$15.6 million
, respectively. The 2013 tax provision included discrete tax benefits of $26.7 million associated with the reversal of unrecognized tax benefits resulting from expiration of statutes of limitations in multiple jurisdictions. In addition, the 2013 tax provision included a net tax benefit of $8.2 million related to 2012 federal R&D tax credit. The 2012 tax provision includes discrete tax benefits totaling $46.5 million, which is comprised of $38.0 million associated with the third quarter reversal of unrecognized tax benefits in conjunction with the expiration of certain statutes of limitations, and $8.5 million of benefits associated with certain previously unrecognized tax benefits as a result of new IRS guidance issued in the first quarter. The 2012 tax provision excludes a federal R&D tax credit due to its expiration at the end of 2011. There were no significant discrete tax benefits for years ended December 31, 2009 through December 31, 2011.
|
36
|
ITEM 7.
|
MANAGEMENT'S DISCUSSION AND ANALYSIS OF FINANCIAL CONDITION AND RESULTS OF OPERATIONS
|
Overview
Open surgery remains the predominant form of surgery and is used in almost every area of the body. However, the large incisions required for open surgery create trauma to the patient, typically resulting in longer hospitalization and recovery times, increased hospitalization costs and additional pain and suffering relative to MIS, where MIS is available. Over the past two decades, MIS has reduced trauma to the patient by allowing selected surgeries to be performed through small ports rather than large incisions. MIS has been widely adopted for certain surgical procedures, but it has not been widely adopted for complex reconstructive surgeries.
The
da Vinci
Surgical System enables surgeons to extend the benefits of MIS to many patients who would otherwise undergo a more invasive surgery by using computational, robotic and imaging technologies to overcome many of the limitations of conventional MIS. Surgeons using the
da Vinci
system operate while seated comfortably at a console viewing a Three Dimensional (“3-D”), High Definition (“HD”) image of the surgical field. This immersive visualization connects surgeons to the surgical field and their instruments. While seated at the console, the surgeon manipulates instrument controls in a natural manner, similar to the more intuitive open surgery technique. Our multi-port technology is designed to provide surgeons with a range of motion in the surgical field analogous to the motions of a human wrist, while filtering out the tremor inherent in a surgeon’s hand. In designing our products, we focus on making our technology easy to use.
Our products fall into four broad categories -
da Vinci
Surgical Systems,
InSite
and
Firefly
Fluorescence imaging systems (“
Firefly
”), instruments and accessories (e.g.,
EndoWrist
,
EndoWrist One
Vessel Sealer,
da Vinci Single-Site
and
EndoWrist
Stapler 45) and training technologies. We have commercialized three generations of
da Vinci
Surgical Systems; the first is our standard
da Vinci
Surgical System, first commercialized in 1999, the second is our
da Vinci S
Surgical System, commercialized in 2006, and the third and most current is our
da Vinci Si
Surgical System, commercialized in 2009. Systems include a surgeon’s console (or consoles), imaging electronics, a patient-side cart and computational hardware and software.
Instruments and accessories are used with systems to allow surgeons the flexibility in choosing the types of tools needed in a particular surgery. In the fourth quarter of 2011, we introduced our Single-Site instruments in the U.S. for use in cholecystectomy procedures utilizing the
da Vinci Si
Surgical System. During the first quarter of 2013, Single-Site instruments were FDA cleared in the U.S. for use in benign hysterectomies and salpingo oophorectomies. Single-Site instruments enable surgeons to perform surgery through a single port via the patient’s belly button, resulting in virtually scarless patient outcomes. Single-Site instruments were Conformité Européenne (“CE”) marked and introduced in Europe in the first quarter of 2011. Training technologies include our recently developed
da Vinci
Connect
remote case observation and mentoring tool, our
da Vinci
Skills Simulator and our dual console for use in surgeon proctoring and collaborative surgery.
Procedures
We model patient value as equal to
procedure efficacy / invasiveness
. In this equation
procedure efficacy
is defined as a measure of the success of the surgery in resolving the underlying disease and
invasiveness
is defined as a measure of patient pain and disruption of regular activities. When the patient value of a
da Vinci
procedure is greater than that of alternative treatment options, patients may benefit from seeking out surgeons and hospitals that offer
da Vinci
surgery, which potentially could result in a local market share shift. Adoption occurs procedure by procedure, and is driven by the relative patient value of
da Vinci
procedures compared to alternative treatment options for the same disease state.
Worldwide Procedures
The adoption of
da Vinci
surgery has the potential to grow for those procedures that offer greater patient value than non
da Vinci
alternatives. We focus our organization and investments on developing, marketing and training for those products and procedures where
da Vinci
can bring significant patient value relative to alternative treatment options. In 2013,
da Vinci
was used primarily in gynecology, urology, general surgery, cardiothoracic surgery and head and neck surgery. Target procedures in gynecology include
da Vinci
Hysterectomy (“dVH”), sacrocolpopexy, myomectomy and endometriosis resection. Target procedures in urology include
da Vinci
Prostatectomy (“dVP”), partial nephrectomy and pyeloplasty. Target procedures in general surgery include Single-Site Cholecystectomy, colorectal procedures, and a broad base of other general surgery procedures. In cardiothoracic surgery, target procedures include
da Vinci
Lobectomy and
da Vinci
Mitral Valve Repair. In head and neck surgery, target procedures include
da Vinci
Trans-oral Robotic-Assisted Surgery (“TORS”) for throat and base of tongue cancers.
In
2013
, approximately
523,000
surgical procedures were performed with the
da Vinci
Surgical System, compared to approximately
450,000
and
359,000
procedures performed in
2012
and
2011
, respectively. The growth in our overall procedure volume in 2013 was driven by the growth in U.S. general surgery procedures, U.S. gynecologic procedures and urology procedures outside of the U.S.
37
U.S. Procedures
Overall U.S. procedure volume grew to approximately
422,000
in
2013
, compared to approximately
367,000
in
2012
, and
292,000
in
2011
.
Gynecology is our largest U.S. surgical specialty. Overall U.S. gynecology procedure volume grew from approximately 170,000 cases in 2011 to approximately 222,000 in 2012 and to approximately 240,000 in 2013. The growth was driven by adoption of dVH, our highest volume procedure, and other gynecologic procedures, including sacrocolpopexy and myomectomy. U.S. dVH procedure volume grew from approximately 140,000 cases in 2011 to approximately 176,000 cases in 2012 to approximately 191,000 cases in 2013, of which approximately 41,000 were for the treatment of cancer and approximately 150,000 were related to benign conditions. The lower 2013 U.S. gynecology procedure growth rate reflected a number of factors including, but not limited to, dVH for cancer approaching standard of care penetration levels, apparent pressure on benign gynecology hospital admissions, negative media reports, and a trend by payers toward encouraging conservative disease management and treatment in outpatient settings. We estimate the total annual U.S. addressable robotic hysterectomy market to consist of approximately 300,000 procedures previously performed via open surgery, of which approximately 50,000 are for cancer.
Based upon procedure run rates exiting 2013, general surgery is now our second largest and fastest growing specialty in the U.S. Overall U.S. general surgery procedure volume grew from approximately 15,000 cases in 2011 to approximately 42,000 in 2012 and to approximately 81,000 in 2013. Over
800
customers have purchased
da Vinci Single-Site
instrumentation through the end of 2013.
U.S. urology procedure volume was approximately 85,000 in 2013, compared to approximately 88,000 in 2012, and 93,000 in 2011. We consider dVP to be the standard of care for the surgical treatment of prostate cancer in the U.S. About 58,000 dVPs were performed in 2013, compared to 62,000 in 2012, and 73,000 in 2011. The approximately 15% reduction in 2012 dVP procedures in the U.S. were caused by the U.S. Preventive Services Task Force recommendation against prostate-specific antigen (“PSA”) screening, as well as changes in treatment pattern for low risk prostate cancer away from definitive treatment. U.S. dVP volumes appear to have stabilized throughout 2013.
International Procedures
Overall international procedure volume grew to approximately
101,000
in
2013
, compared to approximately
83,000
in
2012
and
68,000
in
2011
. dVP accounted for the majority of international procedures, having grown from about 40,000 in 2011, to 47,000 in 2012, and to 56,000 in 2013. Growth in international dVP was driven by higher procedure volumes in Japan, Italy, the United Kingdom and Australia.
Procedure Seasonality
The majority of
da Vinci
procedures performed are now for benign conditions, most notably benign hysterectomies. The proportion of these benign procedures is growing in relation to the total number of procedures performed. Hysterectomies for benign conditions and other short-term elective procedures tend to be more seasonal than cancer operations and surgeries for other life threatening conditions. Seasonality for these benign procedures results in higher fourth quarter procedure volume when more patients have met annual deductibles and lower first quarter procedure volume when deductibles are reset. Third quarter activity is also slower given vacation periods, particularly in Europe. As we achieve deeper penetration in certain procedures, seasonality has a more substantial impact on our business.
Business Model
We generate revenue from both the initial capital sales of
da Vinci
Surgical Systems as well as recurring revenue, derived from sales of instruments, accessories and service. The
da Vinci
Surgical System generally sells for between $1.0 million and $2.3 million, depending upon configuration and geography, and represents a significant capital equipment investment for our customers. We generate recurring revenue as our customers consume our
EndoWrist
and
Single-Site
instruments and accessory products used in performing procedures with the
da Vinci
Surgical System. Our instruments and accessories have a limited life and will either expire or wear out as they are used in surgery, at which point they are replaced. We also generate recurring revenue from ongoing system service. We typically enter into service contracts at the time systems are sold at an annual rate of approximately $100,000 to $170,000 per year, depending upon the configuration of the underlying system. These service contracts have generally been renewed at the end of the initial contractual service periods.
Recurring revenue has generally grown at a faster rate than the rate of growth of system revenue. Recurring revenue increased from
$979.5 million
, or
56%
of total revenue in
2011
to
$1,245.9 million
, or
57%
of total revenue in
2012
to
$1,430.2 million
, or
63%
of total revenue in
2013
. The increase in recurring revenue relative to system revenue reflects lower 2013 system sales and continuing adoption of procedures on a growing base of installed
da Vinci
Surgical Systems. The installed base of
da Vinci
Surgical Systems has grown to
2,966
at December 31,
2013
, compared with
2,585
at December 31,
2012
, and
2,132
at December 31,
2011
.
We provide our products through a direct sales organization in the U.S. and in Europe, excluding Spain, Italy, Greece and Eastern European countries. In January 2012, we acquired our Korean distributor and began selling directly to Korean customers.
38
Beginning in 2013, we began to provide our products through a direct sales organization in the Czech Republic, Slovakia and Hungary, whereas prior to 2013, these markets were served by a distributor. In the remainder of our world markets, we provide our products through distributors.
Regulatory Activities
We believe that we have obtained the clearances required to market our multiport products to our targeted surgical specialties within the U.S. and most of Europe. As we make additions to target procedures and introduce new products, we will continue to seek necessary clearances. In February 2013, we received FDA clearance to market our Single-Site instruments for benign hysterectomy and salpingo oophorectomy procedures. FDA clearance for Single-Site Cholecystectomy was received in December 2011.
In September 2013, we received FDA clearance to expand the indication for use for
Firefly
to include visual assessment of at least one of the major extra-hepatic bile ducts (cystic duct, common bile duct and common heptatic duct), using near infrared imaging. Fluorescence imaging of biliary ducts with the
da Vinci
Fluorescence Imaging Vision System is intended for use with standard of care white light and, when indicated, intraoperative cholangiography. The device is not intended for standalone use for biliary duct visualization. We believe that the use of
Firefly
during cholecystectomy procedures will enhance the ability of surgeons to identify key anatomical structures during the surgery.
In November 2009, we received Shonin approval from the Japanese Ministry of Health, Labor, and Welfare (“MHLW”) for our
da Vinci S
Surgical System in Japan. Until April 2012, we had partnered with the experienced regulatory team from Johnson & Johnson K.K. Medical Company (“JJKK”) to assist in navigating the Japanese regulatory process. In April 2012, the Marketing Authorization Application for
da Vinci
products was transferred to Intuitive Surgical Japan from JJKK, and Intuitive Surgical Japan now has primary responsibility for regulatory support of our products in Japan. We continue to partner with Adachi Co., Ltd as our separate independent distribution partner for marketing, selling, and servicing our products in Japan. Effective April 2012, we obtained national reimbursement for the dVP procedures in Japan, our only reimbursed procedure to date. In Japan additional procedures are considered for reimbursed status in April of even numbered years as the MHLW considers recommendations and data brought forth from Japanese surgical societies. We do not expect any additional procedures to be granted reimbursement status in the April 2014 cycle. We are supporting the Japanese surgical societies to gather the necessary data for MHLW consideration for reimbursement of additional procedures in the April 2016 cycle. In October 2012, we obtained MHLW approval for
da Vinci Si
Surgical Systems in Japan. If we are not successful in obtaining additional regulatory clearances, importation licenses, and adequate procedure reimbursements for future products and procedures, then the demand for our products in Japan could be limited.
FDA Inspection
A FDA inspection of the Company’s facilities occurred in April-May 2013 and the FDA issued a Form FDA 483 listing four observations relating to the reporting of field corrections, information which is to be included on reports of field corrections, written procedures for changes to certain product labeling, and design input documentation. We responded to each observation with corrective actions during the course of the inspection and provided additional evidence of corrective actions to the FDA in response to the Form FDA 483. The FDA issued a Warning Letter, dated July 16, 2013, related to two of the four Form FDA 483 observations asking for additional corrective actions and indicated their intent to perform a follow-up inspection. We have responded to the Warning Letter with plans for corrective action, and continue to provide supplemental responses with objective evidence of corrections as they are completed. In addition, the FDA collected electronic samples of all our advertising and promotional material for review, and to date have taken no action in connection therewith. However, we cannot assure that, upon re-inspection, the FDA will find that our corrective actions are acceptable or that they have been adequately implemented. We also cannot assure that the FDA will not find other observations. The FDA previously inspected our Sunnyvale, CA facilities in January 2012 and did not issue a Form FDA 483 as a result of this inspection.
The receipt of a Warning Letter places certain limits on the ability to obtain FDA issued Certificates to Foreign Government used for new and re-registration of products in certain foreign countries.
Medical Device Reporting
In September of 2012 we contacted the Office of Surveillance and Biometrics (“OSB”) in the FDA Center for Devices and Radiological Health (“CDRH”) regarding proposed changes to our reporting practices for non-injury malfunction Medical Device Reports (“MDRs”). In addition we discussed summary reporting for well characterized events. As a result of the proposed changes, we have increased our reports of device malfunction MDRs, the vast majority of which are related to instruments and not to systems. By definition, none of these device malfunction MDRs involve reportable injuries or deaths. These MDRs are posted on the FDA Manufacturer and User Facility Device Experience (“MAUDE”) database.
In addition, claims brought to our attention by plaintiffs’ attorneys, which contain allegations of patient injury, are required to be investigated. In those cases in which
da Vinci
was used and the system cannot yet be ruled out as a cause of the alleged injury, these cases are reported to the FDA as MDRs. This has led to increases in MDRs.
39
We will continue to work with the FDA, CDRH and OSB to establish agreement on reporting criteria and to complete any retrospective reporting that may be required as a result of new criteria. We cannot predict when this work will be completed as it is highly dependent on FDA questions and the acceptance of our responses and data.
Recalls and Corrections
Medical device companies have regulatory obligations to correct or remove medical devices in the field which have factors which could pose a risk to health. The definition of Recalls and Corrections is expansive and includes repair, replacement, inspections, re-labeling and issuance of new, added or reinforcement of instructions for use and training when such actions are taken for specific reasons of safety or compliance. These field actions require stringent documentation, reporting and monitoring worldwide. There are other actions which a medical device manufacturer may take in the field without reporting, including routine servicing, the introduction of new products, new indications for use and stock rotations.
As we determine whether a field action is reportable in any regulatory jurisdiction, we prepare and submit notifications to the appropriate regulatory agency for the particular jurisdiction. In general, upon submitting required notifications to regulators regarding a field action which is a recall or correction, we will notify customers regarding the field action, provide any additional documentation required in their national language and arrange, as required, return or replacement of the affected product or a field service visit to perform the correction. In some cases actions taken us that we believed to be routine or not reportable may be retrospectively classified by regulators as reportable, resulting in the reporting of additional field actions, which in some cases may have already been completed. In addition, regulators can require the expansion, reclassification or change in scope and language of the field action. Field actions can result in adverse effects on the business including damage to reputation, delays by customers of purchase decisions, reduction or stoppage of use of installed systems, and reduced revenue as well as increased expenses to complete field actions.
2013 Business Events and Trends
Procedures
Overall.
During the year ended December 31,
2013
, total
da Vinci
procedures grew approximately
16%
compared with 2012, driven by growth in general surgery and gynecology procedures in the U.S. and international urology procedures, partially offset by an approximately
6%
reduction in dVP procedures in the U.S.
dVP.
We believe the U.S. Preventive Services Task Force recommendation against PSA screening, as well as changes in treatment patterns for low risk prostate cancer away from definitive treatment, have led to a decline in our dVP business. During 2013, U.S. dVP procedure volumes appear to have stabilized, with a gradually decreasing trend. These treatment patterns have also impacted our European dVP procedure volumes. dVP is at earlier market penetration stages in the European markets; therefore, we are unable to precisely estimate the extent to which these recommendations and treatment pattern changes may have been adopted by governments or clinicians within non-U.S. jurisdictions.
Benign Gynecology Procedure Adoption Trends.
During the year ended December 31, 2013, we experienced lower growth rates in the category of U.S. benign gynecologic procedures than in prior years. The slower 2013 growth rate in the category of U.S. benign gynecologic procedures reflected a number of factors including, but not limited to, apparent pressure on benign gynecology hospital admissions, negative media reports, and a trend by payers toward encouraging conservative disease management and treatment in outpatient settings. We still have a significant remaining market opportunity in benign gynecologic procedures since a large number are still done via open technique. However, as we penetrate more deeply into benign gynecologic procedures, our pace of capturing or consolidating the remaining market is progressing at a slower rate than previously.
Monopolar Curved Scissors Field Action.
During early May 2013, we issued a field notice informing customers of the potential for micro-crack formations in certain of our
EndoWrist
Monopolar Curved Scissors (“MCS”). We decided to stop shipment of these versions until a replacement product was made available. However, as the risk of injury to patients from the recalled product was extremely low, customers were notified that they could continue to use the recalled product; which most did. To date, we have no confirmed evidence of patient injury attributable to this issue. The replacement MCS product began shipping on May 31, 2013. We do not believe that this field action materially impacted our 2013 procedure volume and customer returns of the recalled product have not been material.
Environment and Demand for Our Products
During the year ended December 31, 2013, there have been a number of factors that have resulted in slowing growth rates in U.S. benign gynecologic procedures as noted previously. We expect growth in benign procedures to continue at a level below 2012 and could decline further depending on changes in hospital admissions, payer behavior, the impact of the Affordable Care Act and other factors. In the future, demand for
da Vinci
systems will be impacted by factors including procedure growth rates, economic pressure and uncertainty at hospitals associated with the Affordable Care Act, evolving system utilization and point of care dynamics, likely variability in the timing of Japanese systems sales given the time until potential additional
da Vinci
procedures will be considered for reimbursement, anticipated in 2016, and changing economic and geopolitical factors. The European credit
40
and sovereign debt issues have slowed capital sales and curtailed procedure growth during 2012 and through 2013. European uncertainties could adversely impact demand for our products globally.
New Product Introductions
da Vinci Single-Site Instruments.
da Vinci Single-Site
is a set of non-wristed instruments and accessories that allow the
da Vinci Si
systems to work through a single incision, typically in the umbilicus, rather than multiple incisions. Single incision surgery is intended to minimize invasiveness to patients by reducing the number of ports required to enter the body and is typically utilized for less complex surgery than multi-port surgery. Non-robotic single incision surgery today is typically performed with modified laparoscopic instruments. Early clinical adoption of this manual technique has been mostly positive, although physicians have reported that manual single incision surgery is technically and ergonomically challenging.
da Vinci
Single-Site
instruments and accessories were designed to address these issues. In February 2011, we received the CE mark for our
da Vinci
Single-Site
instrument kit and began selling these new products in Europe. The majority of
da Vinci
Single-Site
procedures performed in Europe to date have been cholecystectomies. In December 2011, we received U.S. FDA regulatory clearance to market our Single-Site instrumentation in the U.S. for laparoscopic cholecystectomy procedures. In February 2013, we received FDA clearance to market our Single-Site instruments for benign hysterectomy and salpingo oophorectomy procedures. We are encouraged by hospital, surgeon, and patient interest in
da Vinci
Single-Site
, with over
800
U.S. customers having purchased
da Vinci
Single-Site
kits as of December 31, 2013. However, as these are our initial products targeted towards procedures already highly penetrated by manual MIS techniques, we are not able to predict the extent or pace that
da Vinci
Single-Site
may be adopted.
da Vinci Firefly Fluorescence Imaging.
In the first quarter of 2011, we launched our
Firefly
product for use with the
da Vinci Si
Surgical System. This imaging capability combines a fluorescent dye with a specialized
da Vinci
camera head, endoscope and laser-based illuminator to allow surgeons to identify vasculature in three dimensions beneath tissue surfaces to visualize critical anatomy. Adoption of
Firefly
is progressing with use across the categories of urology, gynecology and general surgery. In September 2013, we received FDA 510(k) clearance to market our
Firefly
fluorescence imaging product for real-time imaging of bile ducts (cystic duct, common bile duct and common hepatic duct). We believe that the use of
Firefly
during cholecystectomy procedures will enhance the ability of surgeons to identify key anatomical structures during the surgery.
EndoWrist One Vessel Sealer.
In December 2011, we received FDA clearance for the
EndoWrist One
Vessel Sealer. The
EndoWrist One
Vessel Sealer is a wristed, single-use instrument intended for bipolar coagulation and mechanical transection of vessels up to 7 mm in diameter and tissue bundles that fit in the jaws of the instrument. This instrument enables
da Vinci Si
surgeons to fully control vessel sealing, while providing the benefits of
da Vinci
Surgery. This instrument is designed to enhance surgical efficiency and autonomy in a variety of general surgery and gynecologic procedures. Clinical response to the
EndoWrist One
Vessel Sealer has been encouraging, with positive commentary on precision, articulation, vessel sealing quality and thermal spread. We expect applications for the
EndoWrist One
Vessel Sealer to be centered on general surgery and gynecologic oncology procedures.
EndoWrist One
Vessel Sealer utilization rates have increased steadily in 2013.
EndoWrist Stapler 45.
In October 2012, we received FDA clearance for the
EndoWrist
Stapler 45 instrument with Blue and Green 45 mm reloads. The
EndoWrist
Stapler 45 is a wristed, stapling instrument intended for resection, transection and/or creation of anastomoses in general, gynecologic and urologic surgery. This instrument enables operators of the
da Vinci Si
to precisely position and fire the stapler. We expect its initial surgical use to be directed towards colorectal procedures. During fiscal 2013, the
EndoWrist
Stapler was used by a limited and gradually increasing number of customers. We expect to continue to expand to a broadening set of customers in 2014. Although our first customer experiences have been positive, we are in the early stages of selling
EndoWrist
Stapler 45 and we are not able to predict the extent to which the instrument may be adopted.
Recent Media and Lawsuits
Prior to and during the twelve months ended December 31, 2013, various print, television, and internet media have released pieces questioning the patient safety and efficacy associated with
da Vinci
Surgery, the cost of
da Vinci
Surgery relative to other disease management methods, the adequacy of surgeon training, and the Company’s sales and marketing practices. In addition, as further described below in “Part I, Item 3. Legal Proceedings,” we are currently named as a defendant in about
76
individual product liability lawsuits. Plaintiffs’ attorneys are engaged in well-funded national advertising campaigns soliciting clients who have undergone
da Vinci
surgery and claim to have suffered an injury, and we have seen a substantial increase in these claims. We believe that
da Vinci
Surgery continues to be a safe and effective surgical method, as supported by a substantial and growing number of scientific studies and peer reviewed papers. We also believe that the training we provide to surgeons helps to ensure that they are able to operate our systems with the requisite skill and expertise. However, the recent negative media publicity likely has and may continue to delay or adversely impact procedure adoption, system sales, and our revenue growth in future periods. We are not able at this time to reasonably estimate the financial impact of this recent negative media publicity.
41
2013 Financial Highlights
|
•
|
Total revenue increased
4%
to
$2,265.1 million
during the year ended December 31,
2013
, from
$2,178.8 million
during the year ended December 31,
2012
.
|
|
•
|
Approximately
523,000
da Vinci
procedures were performed during the year ended December 31,
2013
, up approximately
16%
from the year ended December 31,
2012
.
|
|
•
|
Instruments and accessories revenue increased
14%
to
$1,032.9 million
during the year ended December 31,
2013
from
$903.3 million
during the year ended December 31,
2012
.
|
|
•
|
Recurring revenue increased
15%
to
$1,430.2 million
during the year ended December 31,
2013
, representing
63%
of total revenue, from
$1,245.9 million
during the year ended December 31,
2012
, representing
57%
of total revenue.
|
|
•
|
We sold
546
da Vinci
Surgical Systems during the year ended December 31,
2013
, compared with
620
for the year ended December 31,
2012
.
|
|
•
|
System revenue decreased
11%
to
$834.9 million
during the year ended December 31,
2013
from
$932.9 million
during the year ended December 31,
2012
.
|
|
•
|
As of December 31, 2013, we had a
da Vinci
Surgical System installed base of
2,966
systems -
2,083
in the U.S.,
476
in Europe,
159
in Japan and
248
in the rest of the world.
|
|
•
|
Operating income decreased
3%
to
$852.5 million
during the year ended December 31,
2013
compared with
$878.1 million
during the year ended December 31,
2012
. Operating income included
$168.9 million
and
$153.3 million
during the years ended December 31,
2013
and
2012
, respectively, of share-based compensation expense related to employee stock programs.
|
|
•
|
We ended fiscal
2013
with
$2,753.9 million
in cash, cash equivalents and investments. Cash, cash equivalents, and investments decreased by
$166.6 million
during
2013
driven by
$1,109.2 million
used to repurchase and retire
2.6 million
shares of common stock and $104.6 million used for capital expenditures, partially offset by cash flow from operations
and
$160.6 million
generated from employee stock programs.
|
|
•
|
We ended fiscal
2013
with
2,792
employees, compared to
2,362
at the end of fiscal
2012
. Headcount additions were made predominantly to our manufacturing, R&D organizations and field sales organizations.
|
Technology and Other Acquisitions
We continue to make strategic acquisitions of intellectual property and related technologies. Total investments in intellectual property and related technologies during the year ended December 31,
2013
were
$2.0 million
, compared with
$41.6 million
during the year ended December 31,
2012
. Amortization expense related to purchased intellectual property for the years ended December 31,
2013
and
2012
were
$21.3 million
and
$23.1 million
, respectively.
On January 11, 2012, we completed the acquisition of our Korean distributor. The total purchase consideration of the acquisition was not material, and the acquisition has not had a material impact on the results of our operations.
42
Results of Operations
The following table sets forth, for the years indicated, certain Consolidated Statements of Income information (in millions):
|
|
Years Ended December 31,
|
|||||||||||||||||||
|
|
2013
|
% of
total
revenue
|
2012
|
% of
total
revenue
|
2011
|
% of
total
revenue
|
||||||||||||||
|
Revenue:
|
||||||||||||||||||||
|
Product
|
$
|
1,867.8
|
|
82
|
%
|
$
|
1,836.2
|
|
84
|
%
|
$
|
1,478.9
|
|
84
|
%
|
|||||
|
Service
|
397.3
|
|
18
|
%
|
342.6
|
|
16
|
%
|
278.4
|
|
16
|
%
|
||||||||
|
Total revenue
|
2,265.1
|
|
100
|
%
|
2,178.8
|
|
100
|
%
|
1,757.3
|
|
100
|
%
|
||||||||
|
Cost of revenue:
|
||||||||||||||||||||
|
Product
|
543.4
|
|
24
|
%
|
495.3
|
|
23
|
%
|
382.3
|
|
22
|
%
|
||||||||
|
Service
|
127.5
|
|
6
|
%
|
113.2
|
|
5
|
%
|
101.2
|
|
6
|
%
|
||||||||
|
Total cost of revenue
|
670.9
|
|
30
|
%
|
608.5
|
|
28
|
%
|
483.5
|
|
28
|
%
|
||||||||
|
Product gross profit
|
1,324.4
|
|
58
|
%
|
1,340.9
|
|
61
|
%
|
1,096.6
|
|
62
|
%
|
||||||||
|
Service gross profit
|
269.8
|
|
12
|
%
|
229.4
|
|
11
|
%
|
177.2
|
|
10
|
%
|
||||||||
|
Gross profit
|
1,594.2
|
|
70
|
%
|
1,570.3
|
|
72
|
%
|
1,273.8
|
|
72
|
%
|
||||||||
|
Operating expenses:
|
||||||||||||||||||||
|
Selling, general and administrative
|
574.0
|
|
25
|
%
|
522.2
|
|
24
|
%
|
438.8
|
|
25
|
%
|
||||||||
|
Research and development
|
167.7
|
|
7
|
%
|
170.0
|
|
8
|
%
|
140.2
|
|
8
|
%
|
||||||||
|
Total operating expenses
|
741.7
|
|
32
|
%
|
692.2
|
|
32
|
%
|
579.0
|
|
33
|
%
|
||||||||
|
Income from operations
|
852.5
|
|
38
|
%
|
878.1
|
|
40
|
%
|
694.8
|
|
39
|
%
|
||||||||
|
Interest and other income, net
|
18.4
|
|
1
|
%
|
15.8
|
|
1
|
%
|
14.9
|
|
1
|
%
|
||||||||
|
Income before taxes
|
870.9
|
|
39
|
%
|
893.9
|
|
41
|
%
|
709.7
|
|
40
|
%
|
||||||||
|
Income tax expense
|
199.9
|
|
9
|
%
|
237.3
|
|
11
|
%
|
214.6
|
|
12
|
%
|
||||||||
|
Net income
|
$
|
671.0
|
|
30
|
%
|
$
|
656.6
|
|
30
|
%
|
$
|
495.1
|
|
28
|
%
|
|||||
Total Revenue
Total revenue increased by
4%
during the year ended December 31,
2013
from the year ended December 31,
2012
, and by
24%
during the year ended December 31,
2012
from the year ended December 31,
2011
. Total revenue increased to
$2,265.1 million
during the year ended December 31,
2013
, from
$2,178.8 million
during the year ended December 31,
2012
, and from
$1,757.3 million
during the year ended December 31,
2011
. Total revenue growth for these periods was driven by the continued adoption of
da Vinci
Surgery, resulting largely from growth in U.S. general surgery procedures, including Cholecystectomy and Colorectal procedures; U.S. gynecologic procedures, including dVH, Sacrocolpopexy and Myomectomy; and dVP in international markets, partially offset by a decline of approximately 15% in dVP procedures in the U.S in 2012 and
6%
in 2013. Our lower 2013 revenue growth rate was driven by slower growth in U.S. benign gynecology procedures, which grew at approximately 9% in 2013 compared to approximately 30% in 2012, and lower U.S.
da Vinci
system sales. The lower 2013 U.S. gynecology procedure growth rate reflected a number of factors including, but not limited to apparent pressure on benign gynecology hospital admissions, negative media reports, and a trend by payers toward encouraging conservative disease management and treatment in outpatient settings. Our lower US system sales were driven by reduced gynecology procedure growth rates and an elongation of the capital sales cycle. We believe the reduction in dVP procedures in the U.S. reflects pressures from reduced levels of PSA testing and increased use of non-surgical disease management. U.S. dVP volumes appear to have stabilized throughout 2013, with a gradually decreasing trend.
Revenue generated in the U.S. accounted for
72%
,
79%
and
78%
of total revenue during the years ended December 31,
2013
,
2012
and
2011
, respectively. We believe domestic revenue has accounted for the large majority of total revenue primarily due to the ability of patients to choose their provider and method of treatment in the U.S. Our international revenue grew in proportion to U.S. revenue in 2013, primarily due to higher system sales in the Japanese and European markets, higher international instrument and accessory sales driven by increased procedures and lower 2013 system sales in the U.S.
43
The following table summarizes our revenue and
da Vinci
Surgical System unit sales information for the years indicated (in millions, except unit sales and percentages):
|
|
Years Ended December 31,
|
||||||||||
|
|
2013
|
|
2012
|
|
2011
|
||||||
|
Revenue
|
|||||||||||
|
Instruments and accessories
|
$
|
1,032.9
|
|
$
|
903.3
|
|
$
|
701.1
|
|
||
|
Systems
|
834.9
|
|
932.9
|
|
777.8
|
|
|||||
|
Total product revenue
|
1,867.8
|
|
1,836.2
|
|
1,478.9
|
|
|||||
|
Services
|
397.3
|
|
342.6
|
|
278.4
|
|
|||||
|
Total revenue
|
$
|
2,265.1
|
|
$
|
2,178.8
|
|
$
|
1,757.3
|
|
||
|
Recurring revenue
|
$
|
1,430.2
|
|
$
|
1,245.9
|
|
$
|
979.5
|
|
||
|
% of total revenue
|
63
|
%
|
57
|
%
|
56
|
%
|
|||||
|
Domestic
|
$
|
1,625.9
|
|
$
|
1,726.9
|
|
$
|
1,378.7
|
|
||
|
International
|
639.2
|
|
451.9
|
|
378.6
|
|
|||||
|
Total revenue
|
$
|
2,265.1
|
|
$
|
2,178.8
|
|
$
|
1,757.3
|
|
||
|
% of Revenue—Domestic
|
72
|
%
|
79
|
%
|
78
|
%
|
|||||
|
% of Revenue—International
|
28
|
%
|
21
|
%
|
22
|
%
|
|||||
|
Unit Sales by Region:
|
|||||||||||
|
Domestic Unit Sales
|
342
|
|
476
|
|
400
|
|
|||||
|
International Unit Sales
|
204
|
|
144
|
|
134
|
|
|||||
|
Total Unit Sales
|
546
|
|
620
|
|
534
|
|
|||||
|
Unit Sales by Model:
|
|||||||||||
|
da Vinci Si-e—
Single console Unit Sales (3 arm)
|
30
|
|
26
|
|
16
|
|
|||||
|
da Vinci Si—
Single console Unit Sales (4 arm)
|
365
|
|
449
|
|
384
|
|
|||||
|
da Vinci Si
—Dual console Unit Sales
|
145
|
|
105
|
|
95
|
|
|||||
|
Total
da Vinci Si
Unit Sales
|
540
|
|
580
|
|
495
|
|
|||||
|
da Vinci S
Unit Sales
|
6
|
|
40
|
|
39
|
|
|||||
|
Total Unit Sales
|
546
|
|
620
|
|
534
|
|
|||||
|
Unit Sales involving System Trade-ins:
|
|||||||||||
|
Unit sales involving trade-ins of standard
da Vinci
Surgical Systems
|
28
|
|
51
|
|
65
|
|
|||||
|
Unit sales involving trade-ins of
da Vinci S
Surgical Systems
|
126
|
|
116
|
|
88
|
|
|||||
|
Total unit sales involving trade-ins
|
154
|
|
167
|
|
153
|
|
|||||
|
Unit Sales not involving trade-ins
|
392
|
|
453
|
|
381
|
|
|||||
|
Total Unit Sales
|
546
|
|
620
|
|
534
|
|
|||||
Product Revenue
Product revenue increased to
$1,867.8 million
during the year ended December 31,
2013
, from
$1,836.2 million
during the year ended December 31,
2012
.
Instruments and accessories revenue increased to
$1,032.9 million
for the year ended December 31,
2013
, up
14%
compared with
$903.3 million
for the year ended December 31,
2012
. The increase in revenue was driven by an approximate
16%
increase in procedure volume and, to a lesser extent, higher initial instrument and accessory orders associated with recently released products, including
da Vinci Single-Site
, the
EndoWrist One
Vessel Sealer, and
Firefly
Fluorescence Imaging products, partially offset by lower initial instrument and accessory stocking orders associated with lower 2013 system units sales and procedure mix.
The growth in our overall procedure volume was driven by growth in U.S. general surgery procedures, U.S. gynecologic procedures and international urology procedures, partially offset by a decline of approximately
6%
in U.S. dVP procedures.
Systems revenue decreased to
$834.9 million
during the year ended December 31,
2013
, down
11%
from
$932.9 million
during the year ended December 31,
2012
, primarily due to lower U.S.
da Vinci
Surgical System unit sales, partially offset by higher international system unit sales. During 2013,
342
systems were sold into the U.S.,
82
into Europe,
79
into Japan, and
43
into other markets, compared with
476
systems sold into the U.S.,
64
into Europe,
40
into Japan, and
40
into other markets in 2012. The demand for systems is ultimately driven by
da Vinci
surgical procedure volume and is highly sensitive to changes in procedure growth rates. The decline in U.S. system sales in 2013 was largely driven by moderating growth in the category of
44
benign gynecologic procedures (as described in the Procedures section) resulting in fewer systems sales required to be sold into the installed base to expand capacity. In addition, hospital capital spending appears to have been impacted by strategic uncertainties surrounding the Affordable Care Act, economic pressures, and negative media reports. The 2013 average selling price (“ASP”) of approximately
$1.52 million
was slightly higher than last year’s ASP of approximately
$1.49 million
driven by product and geographic mix.
Product revenue increased to
$1,836.2 million
during the year ended December 31,
2012
, from
$1,478.9 million
during the year ended December 31,
2011
.
Instruments and accessories revenue increased to
$903.3 million
for the year ended December 31,
2012
, up
29%
compared with
$701.1 million
for the year ended December 31,
2011
. The increase in revenue was driven by an approximate
25%
increase in procedure volume and, to a lesser extent, higher initial instrument and accessory stocking orders associated with recently released instrument and accessory products, including
da Vinci Single-Site
, the
EndoWrist One
Vessel Sealer, and Firefly Fluorescence Imaging products, as well as higher initial instrument and accessory stocking orders associated with higher 2012 system units sales.
The growth in our overall procedure volume was driven by growth in U.S. gynecologic procedures, U.S. general surgery procedures, and international dVP procedures, partially offset by a decline of approximately 15% in U.S. dVP procedures.
Systems revenue increased to
$932.9 million
during the year ended December 31,
2012
, up
20%
from
$777.8 million
during the year ended December 31,
2011
, primarily due to the sale of 86 more systems in 2012. 620
da Vinci
Surgical Systems were sold in 2012, compared to 534 in 2011. The 2012 ASP of approximately $1.49 million was higher than 2011’s ASP of approximately $1.44 million driven by product, geographic, and trade-in mix. A higher proportion of 2012 system sales included Firefly Fluorescence Imaging configurations, which have higher prices than standard HD vision configurations. 167 used
da Vinci
models were traded in as part of 2012 system sales transactions, compared to 153 in 2011.
Service Revenue
Service revenue, comprised primarily of system service and customer training, increased
16%
to
$397.3 million
for the year ended December 31,
2013
, from
$342.6 million
for the year ended December 31,
2012
. We typically enter into service contracts at the time systems are sold. These service contracts have been generally renewed at the end of the service period. Higher service revenue in 2013 was driven by a larger base of
da Vinci
Surgical Systems producing contract service revenue.
Service revenue, comprised primarily of system service and customer training, increased
23%
to
$342.6 million
for the year ended December 31,
2012
, from
$278.4 million
for the year ended December 31,
2011
. Higher service revenue for 2012 was driven by a larger base of
da Vinci
Surgical Systems producing contract service revenue.
Gross Profit
Product gross profit during the year ended December 31,
2013
decreased
1%
to
$1,324.4 million
, or
70.9%
of product revenue, compared with
$1,340.9 million
, or
73.0%
of product revenue, during the year ended December 31,
2012
. The lower 2013 product gross margin largely reflected the impact of the new U.S. medical device excise tax and lower gross margins earned on recently released instrument and accessory products. Product cost of revenue for the twelve months ended December 31, 2013 included $21.0 million related to the U.S. medical device excise tax, which became effective January 1, 2013. 2013 product revenue included a higher proportion of recently introduced instrument and accessory products which yield lower gross margin percentages, particularly Single-Site Instruments and the
EndoWrist One
Vessel Sealer. Margins on newly launched products will typically be lower than our mature products reflecting vendor pricing on low volumes, temporary tooling costs and other start-up costs. Over time, as volumes increase, and we refine the manufacturing processes and products, we expect to see improvement in the margins of these newer products. However, gross margins may ultimately differ for these newer products relative to our previous products based market conditions, volume, and complexity of the product. Product gross profit for the year ended December 31,
2013
, and
2012
reflected share-based compensation expense of
$17.6 million
and
$14.1 million
, respectively.
Service gross profit during the year ended December 31,
2013
, increased to
$269.8 million
, or
67.9%
of service revenue, compared with
$229.4 million
, or
67.0%
of service revenue during the year ended December 31,
2012
. The higher 2012 service gross profit was driven by higher service revenue as described above. The higher 2013 gross service profit percentage was primarily driven by lower service parts consumption rates. Service gross profit during the years ended December 31,
2013
and
2012
, reflected share-based compensation expense of
$12.7 million
and
$12.9 million
, respectively.
Product gross profit during the year ended December 31,
2012
, increased
22%
to
$1,340.9 million
, or
73.0%
of product revenue, compared with
$1,096.6 million
, or
74.1%
of product revenue, during the year ended December 31,
2011
. The higher product gross profit was driven by higher 2012 product revenue, as described above. The lower 2012 product gross profit margin primarily reflects the introduction of newly launched products possessing lower margins at their introduction point, particularly
da V
inci
Single-Site
Instruments and the
EndoWrist One
Vessel Sealer. Margins on newly launched products will typically be lower than our mature products reflecting vendor pricing on low volumes, temporary tooling costs and other start-up costs. As
45
volumes increase, and as we refine the manufacturing processes and products, we would expect to see improvement in the margins of these newer products. However, gross margins may ultimately differ for these newer products relative to our previous products based on the volume and complexity of the newer products. Product gross profit for the year ended December 31,
2012
and
2011
, reflected share-based compensation expense of
$14.1 million
and
$12.3 million
, respectively.
Service gross profit during the year ended December 31,
2012
, increased to
$229.4 million
, or
67.0%
of service revenue, compared with
$177.2 million
, or
63.7%
of service revenue during the year ended December 31,
2011
. The higher 2012 service gross profit was driven by a larger installed base. The higher 2012 gross service profit margin was primarily driven by lower service parts consumption and costs associated with field upgrades. Service gross profit during the years ended December 31,
2012
and
2011
, reflected share-based compensation expense of
$12.9 million
and
$11.0 million
, respectively.
Selling, General and Administrative Expenses
Selling, general and administrative expenses include costs for sales, marketing and administrative personnel, sales and marketing activities, tradeshow expenses, legal expenses, regulatory fees and general corporate expenses.
Selling, general and administrative expenses for the year ended December 31,
2013
increased
10%
to
$574.0 million
compared to
$522.2 million
for the year ended December 31,
2012
. The increase was primarily due to organizational growth to support our expanding business, particularly in the clinical field sales function, regulatory activity, and higher legal costs related to pending or threatened litigation, and higher non-cash share-based compensation expenses, partially offset by lower employee incentive costs. Share-based compensation expense charged to sales, general and administrative expenses during the years ended December 31,
2013
and
2012
, were
$101.4 million
and
$93.1 million
, respectively.
Selling, general and administrative expenses for the year ended December 31,
2012
, increased
19%
to
$522.2 million
compared to
$438.8 million
for the year ended December 31, 2011. The increase in absolute dollars was due to organizational growth to support our expanding business, particularly in the clinical field sales function, higher commissions related to higher revenue levels, and higher non-cash share-based compensation expenses. Share-based compensation expense charged to sales, general and administrative expenses during the years ended December 31,
2012
and
2011
were
$93.1 million
and
$84.3 million
, respectively.
Research and Development Expenses
Research and development costs are expensed as incurred. Research and development expenses include costs associated with the design, development, testing and significant enhancement of our products. These enhancements represent significant improvements to our products.
Research and development expenses during the year ended December 31,
2013
, decreased
1%
to
$167.7 million
compared to
$170.0 million
during the year ended December 31,
2012
. The decrease was due to lower 2013 incentive compensation, amortization of intangible assets, and prototype expenses, partly offset by higher share-based compensation. Share-based compensation expense charged to research and development expense during the years ended December 31,
2013
and
2012
, were
$37.2 million
and
$33.2 million
, respectively. Amortization expense related to purchased intellectual property during the years ended December 31,
2013
and
2012
, were $10.8 million and $13.8 million, respectively. We expect to continue to make substantial investments in research and development and anticipate that research and development expenses, including co-development arrangements with industry partners, is expected to increase in the future.
Research and development expenses during the year ended December 31,
2012
, increased
21%
to
$170.0 million
compared to
$140.2 million
during the year ended December 31,
2011
. The increases in absolute dollars were due to the growth in our research and development organization and higher prototype costs directed at the development of new products including our vessel sealing and stapling products, as well as our
da Vinci Single-Site
instruments, and higher share-based compensation expenses. Share-based compensation expense charged to research and development expense during the years ended December 31,
2012
and
2011
, were
$33.2 million
and
$28.8 million
, respectively. Amortization expense related to purchased intellectual property during the years ended December 31,
2012
and
2011
, were $13.8 million and $13.4 million, respectively. We expect to continue to make substantial investments in research and development and anticipate that research and development expenses, including co-development arrangements with industry partners, will continue to increase in the future.
Interest and Other Income, Net
Interest and other income, net, was
$18.4 million
during the year ended December 31,
2013
, compared to
$15.8 million
for the year ended December 31,
2012
. Higher interest and other income, net for the year ended December 31, 2013 was driven by higher 2013 interest income earned in 2013.
Interest and other income, net, was
$15.8 million
during the year ended December 31,
2012
, compared to
$14.9 million
for the year ended December 31,
2011
. Higher interest and other income, net for the year ended December 31, 2012 was driven by higher 2012 interest income earned on higher cash and investment balances.
46
Income Tax Expense
Our income tax expense was
$199.9 million
,
$237.3 million
and
$214.6 million
during the years ended December 31,
2013
,
2012
and
2011
, respectively. The effective tax rate for
2013
was approximately
23.0%
compared with
26.5%
for
2012
, and
30.2%
for
2011
. Our tax rates for all these periods differed from the U.S. federal statutory rate of 35% due primarily to income earned by certain of our overseas entities being taxed at rates lower than the federal statutory rate, partially offset by state income taxes net of federal benefit. We intend to indefinitely reinvest outside the U.S. all of our undistributed foreign earnings that were not previously subject to U.S. tax. In addition, our 2013 and 2012 tax provision reflected net tax benefits of $26.7 million and $38.0 million, respectively, associated with the reversal of unrecognized tax benefits and interests resulting from expiration of statutes of limitations in multiple jurisdictions. Our 2013 tax provision also included a net tax benefit of $8.2 million related to 2012 federal research and development (“R&D”) credit which was retroactively reinstated during the first quarter of 2013. Our 2012 tax provision reflected $8.5 million benefits related to certain previously unrecognized tax benefits and associated interest as a result of new IRS guidance issued in the first quarter of 2012.
A valuation allowance was recorded against the Company's California deferred tax assets because it is more likely than not these deferred tax assets will not be realized as a result of the computation of California taxes under the single sales factor. We will continue to monitor and reassess the need for further increases or decreases to the valuation allowance. As of December 31,
2013
and
2012
, we had valuation allowances of
$7.2 million
and
$6.0 million
, respectively, primarily on California deferred tax assets.
We file federal, state and foreign income tax returns in many jurisdictions in the United States and abroad. Generally, years before 2010 are closed for most significant jurisdictions except for California, for which years before 2008 are considered closed. Certain of our unrecognized tax benefits could reverse based on the normal expiration of various statutes of limitations, which could affect our effective tax rate in the period in which they reverse.
We are subject to the examination of our income tax returns by the Internal Revenue Service and other tax authorities. The outcome of these audits cannot be predicted with certainty. Management regularly assesses the likelihood of adverse outcomes resulting from these examinations to determine the adequacy of our provision for income taxes. If any issues addressed in our tax audits are resolved in a manner not consistent with management’s expectations, we could be required to adjust our provision for income taxes in the period such resolution occurs.
Liquidity and Capital Resources
Sources and Uses of Cash
Our principal source of liquidity is cash provided by operations and the exercise of stock options. Cash and cash equivalents plus short and long-term investments increased from
$2,171.8 million
at December 31,
2011
, to
$2,920.5 million
at December 31,
2012
, and decreased to
$2,753.9 million
at December 31,
2013
. Cash generation is one of our fundamental strengths and provides us with substantial financial flexibility in meeting our operating, investing and financing needs.
As of December 31,
2013
, $669.2 million of our cash, cash equivalents and investments were held by foreign subsidiaries. Amounts held by foreign subsidiaries are generally subject to U.S. income taxation on repatriation to the U.S. We currently have no plans to repatriate any foreign earnings back to the U.S. as we believe our cash flows provided by our U.S. operations will meet our U.S. liquidity needs.
See “Item 7A. Quantitative and Qualitative Disclosures About Market Risk” for discussion on the impact of interest rate risk and market risk on our investment portfolio.
47
Consolidated Cash Flow Data
|
|
Years Ended December 31,
|
||||||||||
|
|
2013
|
2012
|
2011
|
||||||||
|
|
(in millions)
|
||||||||||
|
Net cash provided by (used in)
|
|||||||||||
|
Operating activities
|
$
|
880.0
|
|
$
|
814.2
|
|
$
|
677.6
|
|
||
|
Investing activities
|
259.0
|
|
(845.7
|
)
|
(479.0
|
)
|
|||||
|
Financing activities
|
(910.6
|
)
|
119.2
|
|
(12.4
|
)
|
|||||
|
Effect of exchange rates on cash and cash equivalents
|
—
|
|
0.2
|
|
(0.2
|
)
|
|||||
|
Net increase in cash and cash equivalents
|
$
|
228.4
|
|
$
|
87.9
|
|
$
|
186.0
|
|
||
Operating Activities
During the year ended December 31,
2013
, cash flow from operations of
$880.0 million
exceeded our net income of
$671.0 million
for two primary reasons:
|
1.
|
Our net income included substantial non-cash charges in the form of share-based compensation, amortization of intangible assets, taxes, and depreciation. These non-cash charges totaled
$231.0 million
during the year ended December 31, 2013.
|
|
2.
|
Cash used in working capital during the year ended December 31, 2013 was approximately
$22.0 million
.
|
Working capital is comprised primarily of accounts receivable, inventory, deferred revenue and other liabilities. Accounts receivable decreased by $68.9 million, or 19%, in 2013 reflecting timing of our system sales. Inventory increased by $58.1 million, or 48%, in 2013 due to expanded product offerings and safety stocks acquired for key components. Deferred revenue, which includes deferred service revenue that is being recognized as revenue over the service contract period, increased $15.3 million, or 8%, in 2013 primarily due to the increase in the number of installed systems for which service contracts exist. Other liabilities including accounts payable, accrued compensation and employee benefits, and accrued liabilities decreased by $35.1 million in 2013 primarily due to timing of vendor, tax and employee compensation payments during 2013.
During the year ended December 31,
2012
, cash flow from operations of
$814.2 million
exceeded our net income of
$656.6 million
for two primary reasons:
|
1.
|
Our net income included substantial non-cash charges in the form of share-based compensation, amortization of intangible assets, taxes and depreciation. These non-cash charges totaled $223.1 million during the year ended December 31, 2012.
|
|
2.
|
Cash used in working capital during the year ended December 31, 2012 was approximately $65.5 million.
|
Working capital is comprised primarily of accounts receivable, inventory, deferred revenue and other liabilities. Accounts receivable increased by $68.9 million, or 24%, in 2012 reflecting timing of our system sales. Inventory increased by $7.1 million, or 8%, in 2012 due to our business growth, expanded product offerings, and safety stocks acquired for key components. Deferred revenue, which includes deferred service contract revenue that is being amortized over the service contract period, increased $30.5 million, or 20%, in 2012 primarily due to the increase in the number of installed systems for which service contracts exist. Other liabilities including accounts payable, accrued compensation and employee benefits, and accrued liabilities increased by $17.1 million in 2012 primarily due to timing of vendor, tax and employee compensation payments during 2012.
During the year ended December 31,
2011
, cash flow from operations of
$677.6 million
exceeded our net income of
$495.1 million
for two primary reasons:
|
1.
|
Our net income included substantial non-cash charges in the form of share-based compensation, amortization of intangible assets, taxes and depreciation. These non-cash charges totaled $202.4 million during the year ended December 31, 2011.
|
|
2.
|
Cash used in working capital during the year ended December 31, 2011 was approximately $19.9 million.
|
Working capital is comprised primarily of accounts receivable, inventory, deferred revenue and other liabilities. Inventory increased by $25.3 million or 29% in 2011 due to our business growth, expanded product offerings, and safety stocks acquired for key components. Deferred revenue, which includes deferred service contract revenue that is being amortized over the service contract period, increased $28.1 million or 22% in 2011 primarily due to the increase in the number of installed systems for which service contracts exist. Other liabilities including accounts payable, accrued compensation and employee benefits, and accrued liabilities increased $37.8 million or 17% in 2011, primarily due to timing of vendor, tax and employee compensation payments during 2011.
Investing Activities
Net cash provided by investing activities during the year ended December 31, 2013 consisted primarily of proceeds from the sales and maturities of investments (net of purchases of investments) of $363.6 million, less purchases of property and equipment
48
and licensing of intellectual property of $104.6 million. Net cash used in investing activities during the years ended December 31, 2012 and 2011, consisted primarily of purchases of investments (net of proceeds from sales and maturities of investments) of $703.9 million and $396.1 million, respectively, less purchases of property and equipment and licensing of intellectual property of $114.2 million and $82.9 million, respectively. We invest predominantly in high quality, fixed income securities. Our investment portfolio may at any time contain investments in U.S. Treasury and U.S. government agency securities, taxable and/or tax exempt municipal notes (some of which may have an auction reset feature), corporate notes and bonds, commercial paper, cash deposits and money market funds. We are not a capital-intensive business.
Financing Activities
Net cash used in financing activities in 2013 consisted primarily of $1,109.2 million used for the repurchase of 2.6 million shares of our common stock through open market transactions, offset by proceeds from stock option exercises and employee stock purchases of $160.6 million and excess tax benefits from share-based compensation of $38.0 million. Net cash proceeds provided by financing activities in 2012 consisted primarily of stock option exercises and employee stock purchases of $263.3 million, excess tax benefits from share-based compensation of $94.2 million, offset by $238.3 million used for the repurchase of 0.4 million shares of our common stock through open market transactions. Net cash used in financing activities in 2011 consisted primarily of $331.8 million used for the repurchase of 1.0 million shares of our common stock through open market transactions, offset by proceeds from stock option exercises and employee stock purchases of $260.6 million and excess tax benefits from share-based compensation of $58.8 million.
Our cash requirements depend on numerous factors, including market acceptance of our products, the resources we devote to developing and supporting our products and other factors. We expect to continue to devote substantial resources to expand procedure adoption and acceptance of our products investments. In 2013, we made substantial investments in our commercial operations, product development activities, facilities and intellectual property. Based upon our business model, we anticipate that we will continue to be able to fund future growth through cash provided from operations. We believe that our current cash, cash equivalents and investment balances, together with income to be derived from the sale of our products, will be sufficient to meet our liquidity requirements for the foreseeable future.
Contractual Obligations and Commercial Commitments
The following table summarizes our contractual obligations as of December 31,
2013
(in millions):
|
|
Payments due by period
|
||||||||||||||
|
|
Total
|
Less than
1 year
|
1 to 3 years
|
3 to 5 years
|
|||||||||||
|
Operating leases
|
$
|
11.1
|
|
$
|
4.9
|
|
$
|
5.2
|
|
$
|
1.0
|
|
|||
|
Purchase commitments and obligations
|
268.3
|
|
268.1
|
|
0.2
|
|
—
|
|
|||||||
|
Total contractual obligations
|
$
|
279.4
|
|
$
|
273.0
|
|
$
|
5.4
|
|
$
|
1.0
|
|
|||
Operating leases.
We lease office spaces in the U.S., Switzerland, Mexico, Japan, China, and Korea. We also lease automobiles for certain sales and field service employees. Operating lease amounts include future minimum lease payments under all our non-cancelable operating leases with an initial term in excess of one year.
Purchase commitments and obligations.
These amounts include an estimate of all open purchase orders and contractual obligations in the ordinary course of business, including commitments with contract manufacturers and suppliers, for which we have not received the goods or services and acquisition and licensing of intellectual property. A majority of these purchase obligations are due within a year. Although open purchase orders are considered enforceable and legally binding, the terms generally allow us the option to cancel, reschedule, and adjust our requirements based on our business needs prior to the delivery of goods or performance of services. In addition to the above, we have committed to make potential future milestone payments to third parties as part of licensing, collaboration and development arrangements. Payments under these agreements generally become due and payable only upon achievement of certain developmental, regulatory and/or commercial milestones. Because the achievement of these milestones is neither probable nor reasonably estimable, such contingencies have not been recorded on our Consolidated Balance Sheets and have not been included in the table above.
Other commitments.
We are unable to make a reasonably reliable estimate as to when payments may occur for our unrecognized tax benefits. Therefore, our liability for unrecognized tax benefits is not included in the table above.
Off-Balance Sheet Arrangements
As of December 31,
2013
, we did not have any significant off-balance sheet arrangements, as defined in Item 303(a)(4)(ii) of SEC Regulation S-K promulgated under the Exchange Act.
49
Critical Accounting Estimates
Our Consolidated Financial Statements are prepared in conformity with U.S. generally accepted accounting principles (“U.S. GAAP”), which requires us to make judgments, estimates and assumptions. See “Note 2. Summary of Significant Accounting Policies,” in Notes to the Consolidated Financial Statements, which is included in “Item 8. Financial Statements and Supplementary Data,” which describes our significant accounting policies and methods used in the preparation of our Consolidated Financial Statements. The methods, estimates and judgments that we use in applying our accounting policies require us to make difficult and subjective judgments, often as a result of the need to make estimates regarding matters that are inherently uncertain. Our most critical accounting estimates include:
|
•
|
the valuation and recognition of investments, which impacts our investment portfolio balance when we assess fair value, and interest and other income, net, when we record impairments;
|
|
•
|
the valuation of revenue and allowance for sales returns and doubtful accounts, which impacts revenue;
|
|
•
|
the estimation of transactions to hedge, which impacts revenue and other expense;
|
|
•
|
the valuation of inventory, which impacts gross margins;
|
|
•
|
the assessment of recoverability of intangibles and the estimated useful lives, which primarily impacts gross margin or operating expenses when we record asset impairments or accelerate their amortization;
|
|
•
|
the valuation and recognition of share-based compensation, which impacts gross margin and operating expenses; and
|
|
•
|
the recognition and measurement of current and deferred income taxes (including the measurement of uncertain tax positions), which impact our provision for taxes.
|
Investments Valuation
Fair Value
Our investment portfolio may at any time contain investments in U.S. Treasury and U.S. government agency securities, taxable and/or tax exempt municipal notes (some of which may have an auction reset feature), corporate notes and bonds, commercial paper, cash deposits and money market funds. In the current market environment, the assessment of the fair value of the investments can be difficult and subjective. U.S. GAAP establishes three levels of inputs that may be used to measure fair value. Each level of input has different levels of subjectivity and difficulty involved in determining fair value. Valuation of Level 1 and 2 instruments generally do not require significant management judgment and the estimation is not difficult. Level 3 instruments include unobservable inputs that are supported by little or no market activity and that are significant to the fair value of the assets or liabilities. The determination of fair value for Level 3 instruments requires the most management judgment and subjectivity.
All of the securities classified as Level 3 instruments are municipal bonds with an auction reset feature (“auction rate securities” or “ARS”) whose underlying assets are student loans which are substantially backed by the federal government. These ARS represent less than 1% of our total investment portfolio as of December 31, 2013. Since the auctions for these securities have continued to fail since February 2008, these investments are not currently trading and therefore do not have a readily determinable market value. Accordingly, the estimated fair value of the ARS no longer approximates par value. We have valued the ARS using a discounted cash flow model based on Level 3 assumptions, including estimates of, based on data available as of December 31, 2013, interest rates, timing and amount of cash flows, credit and liquidity premiums and expected holding periods of the ARS. Changes in associated market value have been recorded through other comprehensive income. If market conditions deteriorate further, we may be required to record additional unrealized losses in other comprehensive income or impairment charges in our income. We may not be able to liquidate these investments unless the issuer calls the security, a successful auction occurs, a buyer is found outside of the auction process, or the security matures.
Other-than-temporary impairment
After determining the fair value of our available-for-sales debt instruments, gains or losses on these securities are recorded to other comprehensive income, until either the security is sold or we determine that the decline in value is other-than-temporary. The primary differentiating factors we considered in classifying impairments as either temporary or other-than-temporary impairments are our intent and ability to retain our investment in the issuer for a period of time sufficient to allow for any anticipated recovery in market value, the length of the time and the extent to which the market value of the investment has been less than cost, the financial condition and near-term prospects of the issuer. Given the current market conditions, these judgments could prove to be wrong, and companies with relatively high credit ratings and solid financial conditions may not be able to fulfill their obligations.
No significant impairment charges were recorded during the years ended December 31,
2013
,
2012
, and
2011
. As of December 31,
2013
and
2012
, our cumulative unrealized gains related to our investments classified as available-for-sale, net of tax, was approximately
$1.7 million
and
$6.2 million
, respectively.
50
Allowance for sales returns and doubtful accounts
. We record estimated reductions in revenue for potential returns of products by customers and other allowances. As a result, management must make estimates of potential future product returns and other allowances related to current period product revenue. In making such estimates, management analyzes historical returns, current economic trends and changes in customer demand and acceptance of our products. If management were to make different judgments or utilize different estimates, material differences in the amount of reported revenue could result.
Similarly, management makes estimates of the collectibility of accounts receivable, especially analyzing the aging and nature of accounts receivable and historical bad debts, customer concentrations, customer credit-worthiness, current economic trends, and changes in customer payment terms when evaluating the adequacy of the allowance for doubtful accounts. Credit evaluations are undertaken for all major sale transactions before shipment is authorized. On a quarterly basis, we evaluate aged items in the accounts receivable aging report and provide an allowance in an amount we deem adequate for doubtful accounts. If management were to make different judgments or utilize different estimates, material differences in the amount of our reported operating expenses could result.
Inventory valuation.
Inventory is stated at the lower of cost or market, with cost determined on a first-in, first-out basis. The cost basis of the Company’s inventory is reduced for any products that are considered excessive or obsolete based upon assumptions about future demand and market conditions. If actual future demand or market conditions are less favorable than those projected by management, additional inventory write-downs may be required, which could have a material adverse effect on the results of our operations.
Intangible Assets.
Our intangible assets include identifiable intangibles and goodwill. Identifiable intangibles include developed technology, patents, and licenses. All of our identifiable intangibles have finite lives. Goodwill and intangible assets with indefinite lives are subject to an annual impairment review (or more frequent if impairment indicators arise) by applying a fair-value based test. There have been no impairments from the analysis required by U.S. GAAP.
Identifiable intangible assets with finite lives are subject to impairment testing and are reviewed for impairment when events or circumstances indicate that the carrying value of an asset is not recoverable and its carrying amount exceeds its fair value. We evaluate the recoverability of the carrying value of these identifiable intangibles based on estimated undiscounted cash flows to be generated from such assets. If the cash flow estimates or the significant operating assumptions upon which they are based change in the future, we may be required to record additional impairment charges.
We have intangible assets and goodwill. The valuation and classification of these assets and the assignment of useful lives for purposes of amortization involves judgments and the use of estimates. The evaluation of these intangibles and goodwill for impairment under established accounting guidelines is required on a recurring basis. Changes in business conditions could potentially require future adjustments to the assumptions made. When we determine that the useful lives of assets are shorter than we had originally estimated, we accelerate the rate of amortization over the assets’ new, shorter useful lives. No impairment charge or accelerated amortization was recorded for the years ended December 31,
2013
,
2012
, and
2011
. A considerable amount of judgment is required in assessing impairment, which includes financial forecasts. Should conditions be different from management’s current estimates, material write-downs of long-lived assets may be required, which would adversely affect our operating results.
Revenue recognition.
We frequently enter into revenue arrangements that contain multiple elements or deliverables such as system and services. Judgments related to how the arrangement consideration should be allocated to the multiple elements of the arrangement, including the determination of whether any undelivered elements are essential to the functionality of the delivered elements, and the timing of revenue recognition are critical in order to ensure compliance with U.S. GAAP. Changes to the elements in an arrangement and the ability to establish objective and reliable evidence of fair value for those elements could affect the timing of revenue recognition. Revenue recognition also depends on the timing of shipment, and is subject to customer acceptance. If shipments are not made on schedule, or if the products are not accepted by the customer in a timely manner, our reported revenues may differ materially from expectations.
For multiple element arrangements, we allocate revenue to all deliverables based on their relative selling prices. Because we have neither vendor-specific objective evidence (“VSOE”) nor third-party evidence of selling price (“TPE”) for our systems, the allocation of revenue to the system element is based on management's best estimate of selling prices (“ESP”). The objective of ESP is to determine the price at which we would transact a sale had the product been sold on a stand-alone basis. We determine ESP for our systems by considering multiple factors, including but not limited to, features and functionality of the system, geographies, type of customer, and market conditions. We review ESP regularly and maintain internal controls over the establishment and updates of these estimates. Significant judgment is applied in determining ESP and any material changes in the judgments made could significantly affect the allocation of revenue to the different elements of our multiple element arrangements.
Hedge Accounting for Derivatives.
We utilize foreign currency forward exchange contracts to hedge certain anticipated foreign currency sales transactions. When specific criteria required by relevant accounting standards have been met, changes in fair values of hedge contracts relating to anticipated transactions are recorded in other comprehensive income (“OCI”) rather than
51
net income until the underlying hedged transaction affects net income. By their very nature, our estimates of anticipated transactions may fluctuate over time and may ultimately vary from actual transactions. When we determine that the transactions are no longer probable within a certain time-frame, we are required to reclassify the cumulative changes in the fair values of the related hedge contracts from other comprehensive income to net income.
Accounting for stock options.
We account for share-based compensation in accordance with the fair value recognition provisions of U.S. GAAP. We use the Black-Scholes-Merton option-pricing model which requires the input of highly subjective assumptions. These assumptions include estimating the length of time employees will retain their vested stock options before exercising them, the estimated volatility of our common stock price over the expected term, and the number of options that will ultimately not complete their vesting requirements. The assumptions for expected volatility and expected term are the two assumptions that most significantly affect the grant date fair value of stock options. Changes in expected risk-free rate of return do not significantly impact the calculation of fair value, and determining this input is not highly subjective.
We use implied volatility based on freely traded options in the open market, as we believe implied volatility is more reflective of market conditions and a better indicator of expected volatility than historical volatility. In determining the appropriateness of relying on implied volatility, we considered the following:
|
•
|
the sufficiency of the trading volume of freely traded options;
|
|
•
|
the ability to reasonably match the terms, such as the date of the grant and the exercise price of the freely traded options to options granted; and
|
|
•
|
the length of the term of the freely traded options used to derive implied volatility.
|
The expected term represents the weighted-average period that our stock options are expected to be outstanding. The expected term is based on the observed and expected time to exercise. We determine expected term based on historical exercise patterns and our expectation of the time it will take for employees to exercise options still outstanding.
U.S. GAAP requires us to develop an estimate of the number of share-based awards that will be forfeited due to employee turnover. Adjustments in the estimated forfeiture rates can have a significant effect on our reported share-based compensation, as we recognize the cumulative effect of the rate adjustments for all expense amortization in the period the estimated forfeiture rates were adjusted. We estimate and adjust forfeiture rates based on a periodic review of recent forfeiture activity and expected future employee turnover. If a revised forfeiture rate is higher than previously estimated forfeiture rate, we may make an adjustment that will result in a decrease to the expense recognized in the financial statements during the period when the rate was changed. Adjustments in the estimated forfeiture rates could also cause changes in the amount of expense that we recognize in future periods.
Changes in these subjective assumptions can materially affect the estimate of fair value of stock options and, consequently, the related amount of share-based compensation expense recognized on the Consolidated Statements of Income.
Accounting for income taxes.
Significant management judgment is required in determining our provision for income taxes, deferred tax assets and liabilities and any valuation allowance recorded against net deferred tax assets in accordance with U.S. GAAP. These estimates and judgments occur in the calculation of tax credits, benefits, and deductions, and in the calculation of certain tax assets and liabilities, which arise from differences in the timing of recognition of revenue and expense for tax and financial statement purposes, as well as the interest and penalties related to uncertain tax positions. Significant changes to these estimates may result in an increase or decrease to our tax provision in the current or subsequent period.
We must assess the likelihood that we will be able to recover our deferred tax assets. If recovery is less than a 50% likelihood, we must increase our provision for taxes by recording a valuation allowance to reduce our deferred tax assets to the amount that is more likely than not to be recoverable. As of December 31,
2013
, we believe it is more likely than not that our deferred tax assets ultimately will be recovered with the exception of our California deferred tax assets. We believe that due to the computation of California taxes under the single sale factor, it is more likely than not that our California deferred tax assets will not be realized. Should there be a change in our ability to recover our deferred tax assets, our tax provision would be affected in the period in which such change takes place.
The calculation of our tax liabilities involves dealing with uncertainties in the application of complex tax regulations. We recognize liabilities for uncertain tax positions based on a two-step process. The first step is to evaluate the tax position for recognition by determining if the weight of available evidence indicates that it is more likely than not that the position will be sustained on audit, including resolution of related appeals or litigation processes, if any. If we determine that a tax position will more likely than not be sustained on audit, then the second step requires us to estimate and measure the tax benefit as the largest amount that is more than 50% likely to be realized upon ultimate settlement. It is inherently difficult and subjective to estimate such amounts, as we have to determine the probability of various possible outcomes. We re-evaluate these uncertain tax positions on a quarterly basis. This evaluation is based on factors including, but not limited to, changes in facts or circumstances, changes in tax law, effective settlement of audit issues, and new audit activity. Such a change in recognition or measurement would result in the recognition of a tax benefit or an additional charge to the tax provision.
52
RECENT ACCOUNTING PRONOUNCEMENTS
See “Note 2. Summary of Significant Accounting Policies” of the Notes to Consolidated Financial Statements in “Item 8. Financial Statements and Supplementary Data” for a full description of recent accounting pronouncements including the respective expected dates of adoption and effects on Consolidated Balance Sheets and Consolidated Statements of Income.
|
ITEM 7A.
|
QUANTITATIVE AND QUALITATIVE DISCLOSURES ABOUT MARKET RISK
|
Interest Rate and Market Risk
The primary objective of our investment activities is to preserve principal while at the same time maximizing the income we receive from our investments without significantly increasing risk. To achieve this objective, we maintain our portfolio of cash equivalents and short-term and long-term investments in a variety of high quality securities, including U.S. treasuries and government agencies, corporate debt, money market funds, commercial paper and taxable or tax exempt municipal bonds (some of which may have an auction reset feature). The securities are classified as available-for-sale and consequently are recorded at fair value with unrealized gains or losses reported as a separate component of accumulated other comprehensive income (loss). The weighted-average maturity of our investments excluding auction rate securities as of December 31,
2013
was approximately 1.3 years. If interest rates rise, the market value of our investments may decline, which could result in a realized loss if we are forced to sell an investment before its scheduled maturity. A hypothetical increase in interest rate by 25 basis points would have resulted in a decrease in the fair value of our net investment position of approximately $7.7 million as of December 31,
2013
. We do not utilize derivative financial instruments to manage our interest rate risks.
The uncertain financial markets have resulted in a tightening in the credit markets, a reduced level of liquidity in many financial markets, and extreme volatility in fixed income and credit markets. The credit ratings of the securities we have invested in could further deteriorate and may have an adverse impact on the carrying value of these investments.
As of December 31,
2013
, we held approximately
$7.4 million
of municipal bonds with an auction reset feature whose underlying assets are student loans that are substantially backed by the federal government. These ARS represent less than 1% of our total investment portfolio. In February 2008, the auction market failed and the ARS therefore continue to be illiquid. We will not be able to access these funds until a future auction of these investments is successful or a buyer is found outside of the auction process. As a result, our ability to liquidate our investment and fully recover the carrying value of our investment in the near term may be limited. If the issuers are unable to service their current obligations, raise funds in the future and/or maintain their credit ratings, we may in the future be required to record an impairment charge on these investments.
Foreign Exchange Risk
The majority of our revenue, expense, and capital purchasing activities are transacted in U.S. dollars. However, because a portion of our operations consists of sales activities outside of the U.S., we have foreign exchange exposures to non-U.S. dollar revenues, operating expenses, accounts receivable, accounts payable and currency bank balances. Our primary exposure is with the Euro.
For the year ended December 31,
2013
, sales denominated in foreign currencies were approximately 11% of total revenue. The objective of our hedging program is to mitigate the impact of changes in currency exchange rates on our net cash flow from foreign currency denominated sales. For the year ended December 31,
2013
, our revenue would have decreased by approximately $8.1 million if the U.S. dollar exchange rate would have strengthened by 10%. We also hedge the net recognized non-functional currency balance sheet exposures with foreign exchange forward contracts to reduce the risk that our earnings and cash flows will be adversely affected by changes in exchange rates. A 10% strengthening of the U.S. dollar exchange rate against all currencies to which we have exposure, after taking into account hedges and offsetting positions as of December 31,
2013
would have resulted in a $4.6 million decrease in the carrying amounts of those net assets. Actual gains and losses in the future may differ materially from the hypothetical gains and losses discussed above based on changes in the timing and amount of foreign currency exchange rate movements and our actual exposure and hedging transactions. Bank counterparties to foreign exchange forward contracts expose us to credit-related losses in the event of their nonperformance. To mitigate that risk, we only contract with counterparties that meet certain minimum requirements under our counterparty risk assessment process. We monitor ratings and potential downgrades on at least a quarterly basis. Based on our ongoing assessment of counterparty risk, we will adjust our exposure to various counterparties.
Our international operations are subject to risks typical of international operations, including, but not limited to, differing economic conditions, changes in political climate, differing tax structures, other regulations and restrictions, and foreign exchange rate volatility.
53
|
ITEM 8.
|
FINANCIAL STATEMENTS AND SUPPLEMENTARY DATA
|
Financial Statements
Index To Consolidated Financial Statements
|
Page No.
|
|
All other schedules have been omitted because they are not applicable or the required information is shown in the Consolidated Financial Statements or the Notes thereto.
54
REPORT OF INDEPENDENT REGISTERED PUBLIC ACCOUNTING FIRM
The Board of Directors and Stockholders of Intuitive Surgical, Inc.
We have audited the accompanying consolidated balance sheets of Intuitive Surgical, Inc. as of
December 31, 2013
and
2012
, and the related consolidated statements of income, comprehensive income, stockholders’ equity, and cash flows for each of the three years in the period ended
December 31, 2013
. Our audits also included the financial statement schedule listed in the index at Item 15(a). These financial statements and schedule are the responsibility of the Company’s management. Our responsibility is to express an opinion on these financial statements and schedule based on our audits.
We conducted our audits in accordance with the standards of the Public Company Accounting Oversight Board (United States). Those standards require that we plan and perform the audit to obtain reasonable assurance about whether the financial statements are free of material misstatement. An audit includes examining, on a test basis, evidence supporting the amounts and disclosures in the financial statements. An audit also includes assessing the accounting principles used and significant estimates made by management, as well as evaluating the overall financial statement presentation. We believe that our audits provide a reasonable basis for our opinion.
In our opinion, the financial statements referred to above present fairly, in all material respects, the consolidated financial position of Intuitive Surgical, Inc. at
December 31, 2013
and
2012
, and the consolidated results of its operations and its cash flows for each of the three years in the period ended
December 31, 2013
, in conformity with U.S. generally accepted accounting principles. Also, in our opinion, the related financial statement schedule, when considered in relation to the basic financial statements taken as a whole, presents fairly in all material respects, the information set forth therein.
We also have audited, in accordance with the standards of the Public Company Accounting Oversight Board (United States), Intuitive Surgical, Inc.’s internal control over financial reporting as of
December 31, 2013
, based on criteria established in
Internal Control—Integrated Framework
issued by the Committee of Sponsoring Organizations of the Treadway Commission (1992 framework) and our report dated
February 3, 2014
expressed an unqualified opinion thereon.
/
S
/ E
RNST
& Y
OUNG
LLP
San Francisco, California
February 3, 2014
55
INTUITIVE SURGICAL, INC.
(IN MILLIONS, EXCEPT PAR VALUE AMOUNTS)
|
|
December 31,
|
||||||
|
|
2013
|
2012
|
|||||
|
ASSETS
|
|||||||
|
Current assets:
|
|||||||
|
Cash and cash equivalents
|
$
|
782.1
|
|
$
|
553.7
|
|
|
|
Short-term investments
|
621.4
|
|
770.7
|
|
|||
|
Accounts receivable, net of allowances of $0.5 and $3.0 at December 31, 2013 and 2012, respectively
|
301.4
|
|
370.3
|
|
|||
|
Inventory
|
179.6
|
|
121.5
|
|
|||
|
Prepaids and other current assets
|
38.3
|
|
67.3
|
|
|||
|
Deferred tax assets
|
9.6
|
|
9.3
|
|
|||
|
Total current assets
|
1,932.4
|
|
1,892.8
|
|
|||
|
Property, plant and equipment, net
|
309.9
|
|
241.8
|
|
|||
|
Long-term investments
|
1,350.4
|
|
1,596.1
|
|
|||
|
Long-term deferred tax asset
|
126.1
|
|
87.0
|
|
|||
|
Intangible and other assets, net
|
94.1
|
|
103.4
|
|
|||
|
Goodwill
|
137.4
|
|
138.1
|
|
|||
|
Total assets
|
$
|
3,950.3
|
|
$
|
4,059.2
|
|
|
|
LIABILITIES AND STOCKHOLDERS’ EQUITY
|
|||||||
|
Current liabilities:
|
|||||||
|
Accounts payable
|
$
|
46.2
|
|
$
|
57.6
|
|
|
|
Accrued compensation and employee benefits
|
70.7
|
|
104.0
|
|
|||
|
Deferred revenue
|
200.1
|
|
185.7
|
|
|||
|
Other accrued liabilities
|
63.9
|
|
54.3
|
|
|||
|
Total current liabilities
|
380.9
|
|
401.6
|
|
|||
|
Other long-term liabilities
|
68.0
|
|
77.5
|
|
|||
|
Total liabilities
|
448.9
|
|
479.1
|
|
|||
|
Commitments and contingencies (Note 6)
|
|
|
|
|
|||
|
Stockholders’ equity:
|
|||||||
|
Preferred stock, 2.5 shares authorized, $0.001 par value, issuable in series; no shares issued and outstanding as of December 31, 2013 and December 31, 2012, respectively
|
—
|
|
—
|
|
|||
|
Common stock, 100.0 shares authorized, $0.001 par value, 38.2 shares and 40.2 shares issued and outstanding as of December 31, 2013 and December 31, 2012, respectively
|
—
|
|
—
|
|
|||
|
Additional paid-in capital
|
2,519.9
|
|
2,240.1
|
|
|||
|
Retained earnings
|
979.4
|
|
1,333.4
|
|
|||
|
Accumulated other comprehensive income
|
2.1
|
|
6.6
|
|
|||
|
Total stockholders’ equity
|
3,501.4
|
|
3,580.1
|
|
|||
|
Total liabilities and stockholders’ equity
|
$
|
3,950.3
|
|
$
|
4,059.2
|
|
|
See accompanying Notes to Consolidated Financial Statements.
56
INTUITIVE SURGICAL, INC.
(IN MILLIONS, EXCEPT PER SHARE AMOUNTS)
|
|
Years Ended December 31,
|
||||||||||
|
|
2013
|
2012
|
2011
|
||||||||
|
Revenue:
|
|||||||||||
|
Product
|
$
|
1,867.8
|
|
$
|
1,836.2
|
|
$
|
1,478.9
|
|
||
|
Service
|
397.3
|
|
342.6
|
|
278.4
|
|
|||||
|
Total revenue
|
2,265.1
|
|
2,178.8
|
|
1,757.3
|
|
|||||
|
Cost of revenue:
|
|||||||||||
|
Product
|
543.4
|
|
495.3
|
|
382.3
|
|
|||||
|
Service
|
127.5
|
|
113.2
|
|
101.2
|
|
|||||
|
Total cost of revenue
|
670.9
|
|
608.5
|
|
483.5
|
|
|||||
|
Gross profit
|
1,594.2
|
|
1,570.3
|
|
1,273.8
|
|
|||||
|
Operating expenses:
|
|||||||||||
|
Selling, general and administrative
|
574.0
|
|
522.2
|
|
438.8
|
|
|||||
|
Research and development
|
167.7
|
|
170.0
|
|
140.2
|
|
|||||
|
Total operating expenses
|
741.7
|
|
692.2
|
|
579.0
|
|
|||||
|
Income from operations
|
852.5
|
|
878.1
|
|
694.8
|
|
|||||
|
Interest and other income, net
|
18.4
|
|
15.8
|
|
14.9
|
|
|||||
|
Income before taxes
|
870.9
|
|
893.9
|
|
709.7
|
|
|||||
|
Income tax expense
|
199.9
|
|
237.3
|
|
214.6
|
|
|||||
|
Net income
|
$
|
671.0
|
|
$
|
656.6
|
|
$
|
495.1
|
|
||
|
Net income per share:
|
|||||||||||
|
Basic
|
$
|
17.12
|
|
$
|
16.50
|
|
$
|
12.63
|
|
||
|
Diluted
|
$
|
16.73
|
|
$
|
15.98
|
|
$
|
12.32
|
|
||
|
Shares used in computing net income per share:
|
|
|
|
||||||||
|
Basic
|
39.2
|
|
39.8
|
|
39.2
|
|
|||||
|
Diluted
|
40.1
|
|
41.1
|
|
40.2
|
|
|||||
See accompanying Notes to Consolidated Financial Statements.
57
INTUITIVE SURGICAL, INC.
CONSOLIDATED STATEMENTS OF COMPREHENSIVE INCOME
(IN MILLIONS)
|
|
Years Ended December 31,
|
||||||||||
|
|
2013
|
2012
|
2011
|
||||||||
|
Net income
|
$
|
671.0
|
|
$
|
656.6
|
|
$
|
495.1
|
|
||
|
Other comprehensive income (loss):
|
|||||||||||
|
Change in foreign currency translation gains (losses)
|
—
|
|
0.6
|
|
(0.3
|
)
|
|||||
|
Available-for-sale investments:
|
|||||||||||
|
Change in unrealized gains (losses), net of tax
|
(3.9
|
)
|
5.0
|
|
1.4
|
|
|||||
|
Less: Reclassification adjustment for gains (losses) on investments recognized during the year
|
(0.6
|
)
|
0.1
|
|
(1.6
|
)
|
|||||
|
Net change, net of tax effect
|
(4.5
|
)
|
5.1
|
|
(0.2
|
)
|
|||||
|
Derivative instruments:
|
|||||||||||
|
Change in unrealized gains (losses)
|
(1.8
|
)
|
(1.1
|
)
|
0.5
|
|
|||||
|
Less: Reclassification adjustment for gains (losses) on derivative instruments recognized during the year, net of tax
|
1.8
|
|
1.1
|
|
(0.7
|
)
|
|||||
|
Net change, net of tax effect
|
—
|
|
—
|
|
(0.2
|
)
|
|||||
|
Other comprehensive income (loss)
|
(4.5
|
)
|
5.7
|
|
(0.7
|
)
|
|||||
|
Total comprehensive income
|
$
|
666.5
|
|
$
|
662.3
|
|
$
|
494.4
|
|
||
See accompanying Notes to Consolidated Financial Statements.
58
INTUITIVE SURGICAL, INC.
CONSOLIDATED STATEMENT OF STOCKHOLDERS’ EQUITY
(IN MILLIONS)
|
Common Stock
|
Additional
Paid-In
Capital
|
Retained
Earnings
|
Accumulated
Other
Comprehensive
Income
|
Total
|
||||||||||||||||||
|
Shares
|
Amount
|
|||||||||||||||||||||
|
Balances at December 31, 2010
|
38.9
|
|
$
|
—
|
|
$
|
1,316.9
|
|
$
|
718.9
|
|
$
|
1.6
|
|
$
|
2,037.4
|
|
|||||
|
Issuance of common stock upon exercise of options and under stock purchase plan
|
1.4
|
|
260.6
|
|
260.6
|
|
||||||||||||||||
|
Income tax benefit from stock option exercises
|
48.6
|
|
48.6
|
|
||||||||||||||||||
|
Share-based compensation expense related to employee stock plans
|
136.4
|
|
136.4
|
|
||||||||||||||||||
|
Repurchase and retirement of common stock
|
(1.0
|
)
|
(19.7
|
)
|
(312.1
|
)
|
(331.8
|
)
|
||||||||||||||
|
Net income
|
495.1
|
|
495.1
|
|
||||||||||||||||||
|
Other comprehensive income (loss)
|
(0.7
|
)
|
(0.7
|
)
|
||||||||||||||||||
|
Balances at December 31, 2011
|
39.3
|
|
$
|
—
|
|
$
|
1,742.8
|
|
$
|
901.9
|
|
$
|
0.9
|
|
$
|
2,645.6
|
|
|||||
|
Issuance of common stock upon exercise of options and under stock purchase plan
|
1.3
|
|
263.3
|
|
263.3
|
|
||||||||||||||||
|
Income tax benefit from stock option exercises
|
93.9
|
|
93.9
|
|
||||||||||||||||||
|
Share-based compensation expense related to employee stock plans
|
153.3
|
|
153.3
|
|
||||||||||||||||||
|
Repurchase and retirement of common stock
|
(0.4
|
)
|
(13.2
|
)
|
(225.1
|
)
|
(238.3
|
)
|
||||||||||||||
|
Net income
|
656.6
|
|
656.6
|
|
||||||||||||||||||
|
Other comprehensive income (loss)
|
5.7
|
|
5.7
|
|
||||||||||||||||||
|
Balances at December 31, 2012
|
40.2
|
|
$
|
—
|
|
$
|
2,240.1
|
|
$
|
1,333.4
|
|
$
|
6.6
|
|
$
|
3,580.1
|
|
|||||
|
Issuance of common stock upon exercise of options and under stock purchase plan
|
0.6
|
|
160.6
|
|
160.6
|
|
||||||||||||||||
|
Income tax benefit from stock option exercises
|
34.5
|
|
34.5
|
|
||||||||||||||||||
|
Share-based compensation expense related to employee stock plans
|
168.9
|
|
168.9
|
|
||||||||||||||||||
|
Repurchase and retirement of common stock
|
(2.6
|
)
|
(84.2
|
)
|
(1,025.0
|
)
|
(1,109.2
|
)
|
||||||||||||||
|
Net income
|
671.0
|
|
671.0
|
|
||||||||||||||||||
|
Other comprehensive income (loss)
|
(4.5
|
)
|
(4.5
|
)
|
||||||||||||||||||
|
Balances at December 31, 2013
|
38.2
|
|
$
|
—
|
|
$
|
2,519.9
|
|
$
|
979.4
|
|
$
|
2.1
|
|
$
|
3,501.4
|
|
|||||
See accompanying Notes to Consolidated Financial Statements.
59
|
|
Years Ended December 31,
|
||||||||||
|
|
2013
|
2012
|
2011
|
||||||||
|
Operating activities:
|
|||||||||||
|
Net income
|
$
|
671.0
|
|
$
|
656.6
|
|
$
|
495.1
|
|
||
|
Adjustments to reconcile net income to net cash provided by operating activities:
|
|||||||||||
|
Depreciation
|
46.0
|
|
34.7
|
|
28.7
|
|
|||||
|
Amortization of intangible assets
|
21.3
|
|
23.1
|
|
17.8
|
|
|||||
|
Accretion of discounts and amortization of premiums on investments, net
|
36.8
|
|
33.1
|
|
22.6
|
|
|||||
|
Deferred income taxes
|
(38.5
|
)
|
(20.8
|
)
|
7.1
|
|
|||||
|
Income tax benefits from employee stock option plans
|
34.5
|
|
93.9
|
|
48.6
|
|
|||||
|
Excess tax benefit from share-based compensation
|
(38.0
|
)
|
(94.2
|
)
|
(58.8
|
)
|
|||||
|
Share-based compensation expense
|
168.9
|
|
153.3
|
|
136.4
|
|
|||||
|
Changes in operating assets and liabilities, net of effects of acquisition:
|
|||||||||||
|
Accounts receivable
|
68.9
|
|
(68.9
|
)
|
(51.1
|
)
|
|||||
|
Inventory
|
(70.0
|
)
|
(7.1
|
)
|
(25.3
|
)
|
|||||
|
Prepaids and other assets
|
(5.0
|
)
|
(37.1
|
)
|
(9.4
|
)
|
|||||
|
Accounts payable
|
(8.9
|
)
|
8.4
|
|
10.3
|
|
|||||
|
Accrued compensation and employee benefits
|
(33.3
|
)
|
21.0
|
|
19.6
|
|
|||||
|
Deferred revenue
|
15.2
|
|
30.5
|
|
28.1
|
|
|||||
|
Other accrued liabilities
|
11.1
|
|
(12.3
|
)
|
7.9
|
|
|||||
|
Net cash provided by operating activities
|
880.0
|
|
814.2
|
|
677.6
|
|
|||||
|
Investing activities:
|
|||||||||||
|
Purchase of investments
|
(1,443.7
|
)
|
(1,833.9
|
)
|
(1,532.2
|
)
|
|||||
|
Proceeds from sales of investments
|
984.9
|
|
329.8
|
|
444.3
|
|
|||||
|
Proceeds from maturities of investments
|
822.4
|
|
800.2
|
|
691.8
|
|
|||||
|
Purchase of property, plant and equipment, intellectual property and business
|
(104.6
|
)
|
(141.8
|
)
|
(82.9
|
)
|
|||||
|
Net cash provided by (used in) investing activities
|
259.0
|
|
(845.7
|
)
|
(479.0
|
)
|
|||||
|
Financing activities:
|
|||||||||||
|
Proceeds from issuance of common stock, net
|
160.6
|
|
263.3
|
|
260.6
|
|
|||||
|
Excess tax benefit from share-based compensation
|
38.0
|
|
94.2
|
|
58.8
|
|
|||||
|
Repurchase and retirement of common stock
|
(1,109.2
|
)
|
(238.3
|
)
|
(331.8
|
)
|
|||||
|
Net cash (used in) provided by financing activities
|
(910.6
|
)
|
119.2
|
|
(12.4
|
)
|
|||||
|
Effect of exchange rate changes on cash and cash equivalents
|
—
|
|
0.2
|
|
(0.2
|
)
|
|||||
|
Net increase in cash and cash equivalents
|
228.4
|
|
87.9
|
|
186.0
|
|
|||||
|
Cash and cash equivalents, beginning of year
|
553.7
|
|
465.8
|
|
279.8
|
|
|||||
|
Cash and cash equivalents, end of year
|
$
|
782.1
|
|
$
|
553.7
|
|
$
|
465.8
|
|
||
|
Supplemental cash flow information:
|
|||||||||||
|
Income taxes paid
|
$
|
194.1
|
|
$
|
226.1
|
|
$
|
152.0
|
|
||
See accompanying Notes to Consolidated Financial Statements.
60
Intuitive Surgical, Inc. designs, manufactures, and markets
da Vinci
®
Surgical Systems and related instruments and accessories, which taken together, are advanced surgical systems that the Company considers an advanced generation of surgery. This advanced generation of surgery, which the Company calls
da Vinci
surgery, combines the benefits of minimally invasive surgery (“MIS”) for patients with the ease of use, precision and dexterity of open surgery. A
da Vinci
Surgical System consists of a surgeon’s console, a patient-side cart and a high performance vision system. The
da Vinci
Surgical System translates a surgeon’s natural hand movements, which are performed on instrument controls at a console, into corresponding micro-movements of instruments positioned inside the patient through small incisions, or ports. The
da Vinci
Surgical System is designed to provide its operating surgeons with intuitive control, range of motion, fine tissue manipulation capability and Three Dimensional (“3-D”), High-Definition (“HD”) vision while simultaneously allowing surgeons to work through the small ports enabled by MIS procedures.
Basis of Presentation
The accompanying Consolidated Financial Statements have been prepared in accordance with U.S. generally accepted accounting principles (“U.S. GAAP”) and include the accounts of the Company and its wholly-owned subsidiaries. All significant inter-company balances and transactions have been eliminated in consolidation.
Use of Estimates
The preparation of financial statements in conformity with U.S. GAAP requires management to make estimates and assumptions that affect the amounts reported in the Consolidated Financial Statements and accompanying Notes to the Consolidated Financial Statements. The accounting estimates that require management’s most significant, difficult and subjective judgments include the valuation and recognition of investments, the valuation of the revenue and allowance for sales returns and doubtful accounts, the estimation of hedging transactions, the valuation of inventory, the assessment of recoverability of intangible assets and their estimated useful lives, the valuation and recognition of share-based compensation and the recognition and measurement of current and deferred income tax assets and liabilities. Actual results could differ materially from these estimates.
Concentrations of Credit Risk and Other Risks and Uncertainties
The carrying amounts for financial instruments consisting of cash and cash equivalents, accounts receivable, accounts payable and accrued liabilities approximate fair value due to their short maturities. Marketable securities and derivative instruments are stated at their estimated fair values, based on quoted market prices for the same or similar instruments. The counterparties to the agreements relating to the Company’s investment securities and derivative instruments consist of various major corporations, financial institutions, municipalities and government agencies of high credit standing.
The Company’s accounts receivable are derived from net revenue to customers and distributors located throughout the world. The Company performs credit evaluations of its customers’ financial condition and, generally, requires no collateral from its customers. The Company provides reserves for potential credit losses but has not experienced significant losses to date. As of
December 31, 2013
and
2012
,
66%
and
79%
, respectively, of accounts receivable were from domestic customers.
No
single customer represented more than 10% of net accounts receivable as of
December 31, 2013
and
2012
.
During the years ended
December 31, 2013
,
2012
, and
2011
, domestic revenue accounted for
72%
,
79%
, and
78%
, respectively, of total revenue, while international revenue accounted for
28%
,
21%
, and
22%
, respectively, of total revenue for each of the years then ended.
No
single customer represented more than 10% of total revenue for the years ended
December 31, 2013
,
2012
, and
2011
.
Cash and Cash Equivalents
The Company considers all highly liquid investments with an original maturity from date of purchase of 90 days or less to be cash equivalents.
Investments
Available-for-sale investments.
The Company’s investments consist of U.S. treasury and U.S. government agency securities, taxable and tax exempt municipal notes, some of which may have an auction reset feature (“auction rate securities” or “ARS”), corporate notes and bonds, commercial paper, cash deposits and money market funds. The Company has designated all investments as available-for-sale and therefore, such investments are reported at fair value, with unrealized gains and losses recorded in accumulated other comprehensive income. For securities sold prior to maturity, the cost of securities sold is based on the specific identification method. Realized gains and losses on the sale of investments are recorded in interest and other income, net.
61
Investments with original maturities greater than approximately three months and remaining maturities less than one year are classified as short-term investments. Investments with remaining maturities greater than one year are classified as long-term investments.
Other-than-temporary impairment.
All of the Company’s investments are subject to a periodic impairment review. The Company recognizes an impairment charge when a decline in the fair value of its investments below the cost basis is judged to be other-than-temporary. Factors considered in determining whether a loss is temporary included the extent and length of time the investment's fair value has been lower than its cost basis, the financial condition and near-term prospects of the investee, extent of the loss related to credit of the issuer, the expected cash flows from the security, the Company’s intent to sell the security, and whether or not the Company will be required to sell the security prior the expected recovery of the investment's amortized cost basis. During the years ended
December 31, 2013
,
2012
, and
2011
, the Company did not record any significant other-than-temporary impairment charges on its available-for-sale securities because the Company does not intend to sell the security and it is not more likely than not that the Company will be required to sell these securities before the recovery of their amortized cost basis.
Fair Value Measurements
The Company measures the fair value of money market funds, corporate equity securities and certain debt securities based on quoted prices in active markets for identical assets as Level 1 securities. Marketable securities, measured at fair value using Level 2 inputs, are primarily comprised of U.S. government agencies and FDIC guaranteed securities and corporate debt securities. We review trading activity and pricing for these investments as of the measurement date. When sufficient quoted pricing for identical securities is not available, we use market pricing and other observable market inputs for similar securities obtained from various third party data providers. These inputs either represent quoted prices for similar assets in active markets or have been derived from observable market data. This approach results in the Level 2 classification of these securities within the fair value hierarchy.
Where Level 1 and Level 2 inputs are not available, the Company used a discounted cash flow model based on data available, including interest rates, timing and amount of cash flows, credit and liquidity premiums and expected holding period for Level 3 securities. The only Level 3 securities consist of municipal bonds with an ARS whose underlying assets are student loans which are substantially backed by the federal government. Since the auctions for these securities have continued to fail since February 2008, these investments are not currently being actively traded and therefore do not have a readily determinable market value. The Company recognizes transfers into or out of Level 3 classification as of the actual date of the event or change in circumstances that caused the transfer.
Allowance for Sales Returns and Doubtful Accounts
The allowance for sales returns is based on the Company’s estimates of potential future product returns and other allowances related to current period product revenue. The Company analyzes historical returns, current economic trends and changes in customer demand and acceptance of our products. The allowance for doubtful accounts is based on the Company’s assessment of the collectability of customer accounts. The Company regularly reviews the allowance by considering factors such as historical experience, credit quality, the age of the accounts receivable balances, and current economic conditions that may affect a customer’s ability to pay.
Inventory
Inventory is stated at the lower of cost or market on a first-in, first-out basis. Inventory costs include direct materials, direct labor, and normal manufacturing overhead. The cost basis of the Company’s inventory is reduced for any products that are considered excessive or obsolete based upon assumptions about future demand and market conditions.
Property, Plant and Equipment
Property, plant and equipment are stated at cost, net of accumulated depreciation. Depreciation is computed on a straight-line basis over the estimated useful lives of the assets generally as follows:
|
|
Useful Lives
|
|
Building
|
Up to 30 years
|
|
Building improvements
|
Up to 15 years
|
|
Leasehold improvements
|
Lesser of useful life or term of lease
|
|
Equipment and furniture
|
5 years
|
|
Computer equipment
|
3 years
|
|
Enterprise-wide software
|
5 years
|
|
Purchased software
|
Lesser of 3 years or life of license
|
62
Depreciation expense for years ended
December 31, 2013
,
2012
, and
2011
was
$46.0 million
,
$34.7 million
, and
$28.7 million
, respectively.
Capitalized Software Costs for Internal Use
Internally developed software primarily includes enterprise-level business software that the Company customizes to meet its specific operational needs. The Company capitalized costs for enhancement of the enterprise resource planning software system and other internal use software of
$6.6 million
and
$4.1 million
during the years ended
December 31, 2013
and
2012
, respectively. Upon being placed in service, these costs are depreciated over an estimated useful life of up to
5 years
.
Goodwill and Intangible Assets
Goodwill and intangible assets with indefinite useful lives are not amortized, but are tested for impairment at least annually during the fourth fiscal quarter, or as circumstances indicate their value may no longer be recoverable. Goodwill represents the excess of the purchase price over the fair value of net tangible and identifiable intangible assets. The Company continues to operate in
one
segment, which is considered to be the sole reporting unit and therefore, goodwill was tested for impairment at the enterprise level. As of
December 31, 2013
, there has been
no
impairment of goodwill.
The Company does not have intangible assets with indefinite useful lives other than goodwill. The Company’s intangible assets are comprised of purchased intellectual property. These intangible assets are carried at cost, net of accumulated amortization. Amortization is recorded on a straight-line basis over the intangible assets' useful lives, which range from approximately
1
to
7 years
.
Impairment of Long-lived assets
The Company evaluates long-lived assets, which include amortizable intangible and tangible assets, for impairment whenever events or changes in circumstances indicate that the carrying value of long-lived assets may not be recoverable. The Company recognizes such impairment in the event the net book value of such assets exceeds the future undiscounted cash flows attributable to such assets. No material impairment losses were incurred in the periods presented.
Revenue Recognition
The Company’s revenue consists of product revenue resulting from the sales of systems, instruments and accessories, and service revenue. The Company recognizes revenue when persuasive evidence of an arrangement exists, delivery has occurred or service has been rendered, the price is fixed or determinable, and collectibility is reasonably assured. The Company generally recognizes revenue at the following points in time:
|
•
|
System sales.
For systems sold directly to end customers, revenue is recognized when acceptance occurs, which is deemed to have occurred upon the customer acknowledging delivery or installation, depending on the terms of the arrangement. For systems sold through distributors, revenue is recognized when title and risk of loss has transferred, which generally occurs at the time of shipment. Distributors do not have price protection rights and the Company’s system arrangements generally do not provide a rights of return. The
da Vinci
Surgical Systems are delivered with a software component. However, since the software and non-software elements function together to deliver the system’s essential functionality, the Company's arrangements are excluded from being accounted for under software revenue recognition guidance.
|
|
•
|
Instruments and accessories.
Revenue from sales of instruments and accessories is generally recognized at the time of shipment. The Company allows its customers in the normal course of business to return unused products for a limited period of time subsequent to initial purchase and records an allowance against revenue recognized based on historical experience.
|
|
•
|
Service.
Service revenue is recognized ratably over the term of the service period. Revenue related to services performed on a time-and-materials basis is recognized when it is earned and billable.
|
The Company offers its customers the opportunity to trade in their older systems for credit towards the purchase of a newer generation system. The Company generally does not provide specified price trade-in rights or upgrade rights at the time of system purchase. Such trade-in or upgrade transactions are separately negotiated based on the circumstances at the time of the trade-in or upgrade, based on the then fair value of the system, and are generally not based on any pre-existing rights granted by the Company. Accordingly, such trade-ins and upgrades are not considered as separate deliverables in the arrangement for a system sale.
As part of a trade-in transaction, the customer receives a new generation system in exchange for its older used system. The trade-in credit is negotiated at the time of the trade-in and is applied towards the purchase price of the new generation unit. Traded-in systems can be reconditioned and resold. The Company accounts for trade-ins consistent with the guidance in AICPA Technical Practice Aid 5100.01,
Equipment Sales Net of Trade-Ins
(“
TPA 5100.01”
). The Company applies the accounting guidance by crediting system revenue for the negotiated price of the new generation system, while the difference between (a) the trade-in
63
allowance and (b) the net realizable value of the traded-in system less a normal profit margin is treated as a sales allowance. The value of the traded-in system is determined as the amount, after reconditioning costs are added, will allow a normal profit margin on the sale of the reconditioned unit to be generated. When there is no market for the traded-in units, no value is assigned. Traded-in units are reported as a component of inventory until reconditioned and resold, or otherwise disposed.
In addition, customers may also have the opportunity to upgrade their systems, for example, by adding a fourth arm to a three-arm system, adding a second surgeon console for use with the
da Vinci Si
Surgical System or adding new vision systems to the standard
da Vinci
and
da Vinci S
Surgical Systems. Such upgrades are performed by completing component level upgrades at the customer’s site. Upgrade revenue is recognized when the component level upgrades are complete and all revenue recognition criteria are met.
For multiple-element arrangements revenue is allocated to each element based on their relative selling prices. Relative selling prices are based first on vendor specified objective evidence (“VSOE”), then on third-party evidence of selling price (“TPE”) when VSOE does not exist, and then on management's best estimate of the selling price (“ESP”) when VSOE and TPE do not exist.
Because the Company has neither VSOE nor TPE for its systems, the allocation of revenue is based on ESP for the systems sold. The objective of ESP is to determine the price at which the Company would transact a sale, had the product been sold on a stand-alone basis. The Company determines ESP for its systems by considering multiple factors, including, but not limited to, features and functionality of the system, geographies, type of customer, and market conditions. The Company regularly reviews ESP and maintains internal controls over the establishment and updates of these estimates.
Share-Based Compensation
The Company accounts for share-based employee compensation plans using the fair value recognition and measurement provisions under U.S. GAAP. The Company’s share-based compensation cost is measured at the grant date, based on the fair value of the award, and is recognized as expense over the requisite service period.
Expected Term:
The expected term represents the weighted-average period that the stock options are expected to be outstanding prior to being exercised. The Company determines expected term based on historical exercise patterns and its expectation of the time it will take for employees to exercise options still outstanding.
Expected Volatility:
The Company uses market-based implied volatility for purposes of valuing options granted. Market-based implied volatility is derived based on at least one-year traded options on the Company’s common stock. The extent to which the Company relies on market-based volatility when valuing options, depend among other things, on the availability of traded options on the Company’s stock and the term of such options. Due to sufficient volume of the traded options, the Company used
100%
market-based implied volatility to value options granted, which the Company believes is more representative of future stock price trends than historical volatility.
Risk-Free Interest Rate:
The risk-free interest rate is based on the U.S. Treasury yield curve in effect at the time of grant for the expected term of the option.
See “
Note 8. Share-Based Compensation,
” for a detailed discussion of our share-based employee compensation plans and share-based compensation expense.
Computation of Net Income per Share
Basic net income per share is computed using the weighted-average number of shares outstanding during the period. Diluted net income per share is computed using the weighted-average number of shares and dilutive potential shares outstanding during the period. Dilutive potential shares primarily consist of employee stock options.
U.S. GAAP requires that employee equity share options, non-vested shares and similar equity instruments granted by the Company be treated as potential common shares outstanding in computing diluted earnings per share. Diluted shares outstanding include the dilutive effect of in-the-money options, which is calculated based on the average share price for each fiscal period using the treasury stock method. Under the treasury stock method, the amount the employee must pay for exercising stock options, the amount of compensation cost for future service that the Company has not yet recognized, and the amount of tax benefits that would be recorded in additional-paid-in-capital (“APIC”) when the award becomes deductible are all assumed to be used to repurchase shares.
Research and Development Expenses
Research and development expenses include amortization of purchased intellectual property, costs associated with co-development R&D licensing arrangements, costs of prototypes, salaries, benefits and other headcount related costs, contract and other outside service fees, and facilities and overhead costs.
64
Foreign Currency and Other Hedging Instruments
For subsidiaries whose local currency is their functional currency, their assets and liabilities are translated into U.S. dollars at exchange rates at the balance sheet date and revenues and expenses are translated using average exchange rates in effect during the quarter. Gains and losses from foreign currency translation are included in accumulated other comprehensive income within stockholders’ equity in the Consolidated Balance Sheets. For all non-functional currency account balances, the re-measurement of such balances to the functional currency will result in either a foreign exchange gain or loss, which is recorded to interest and other income, net in the same accounting period that the re-measurement occurred.
The Company uses derivatives to partially offset its business exposure to foreign currency exchange risk. The Company enters into foreign currency forward contracts with one to seven month terms. The Company typically hedges portions of its forecasted foreign currency exposure associated with revenue. The Company may also enter into foreign currency forward contracts to offset the foreign currency exchange gains and losses generated by re-measurement of certain assets and liabilities denominated in non-functional currencies. The hedging program is not designated for trading or speculative purposes.
The Company’s accounting policies for these instruments are based on whether the instruments are designated as hedge or non-hedge instruments. The Company records all derivatives on the Consolidated Balance Sheets at fair value. The effective portions of cash flow hedges are recorded in other comprehensive income (loss) (“OCI”) until the hedged item is recognized in earnings. Derivative instruments designated as cash flow hedges are de-designated as hedges when it is probable the forecasted hedged transaction will not occur in the initially identified time period or within a subsequent two month time period. Deferred gains and losses in OCI associated with such derivative instruments are reclassified immediately into earnings through interest and other income, net. Any subsequent changes in fair value of such derivative instruments also are reflected in current earnings.
Derivatives that are not designated as hedging instruments and the ineffective portions of cash flow hedges are adjusted to fair value through earnings in interest and other income, net.
Income Taxes
Deferred tax assets and liabilities are recognized for the future tax consequences attributable to differences between the financial statement carrying amounts of existing assets and liabilities and their respective tax bases. Deferred tax assets and liabilities are measured using enacted tax rates expected to apply to taxable income in the year in which those temporary differences are expected to be recovered or settled. The effect on deferred tax assets and liabilities of a change in tax rates is recognized in income in the period that includes the enactment date. Valuation allowances are established when necessary to reduce deferred tax assets to the amounts that are expected more likely than not to be realized in the future.
The Company recognizes tax benefits from uncertain tax positions only if it is more likely than not that the tax position will be sustained on examination by the taxing authorities, based on the technical merits of the position. The tax benefits recognized in the financial statements from such positions are then measured based on the largest benefit that has a greater than
50%
likelihood of being realized upon ultimate settlement.
Segments
The Company operates in
one
segment. Management uses one measurement of profitability and does not segregate its business for internal reporting. As of
December 31, 2013
and
2012
, over
94%
and
97%
of all long-lived assets were maintained in the United States. For the years ended
December 31, 2013
,
2012
, and
2011
,
72%
,
79%
, and
78%
, respectively, of net revenue were generated in the United States.
Recent Accounting Pronouncements
In June 2013, the Financial Accounting Standards Board determined that an unrecognized tax benefit should be presented as a reduction of a deferred tax asset for a net operating loss (“NOL”) carryforward or other tax credit carryforward when settlement in this manner is available under applicable tax law. This guidance is effective for the Company’s interim and annual periods beginning January 1, 2014. The Company does not believe the adoption of this guidance will have a material impact on its consolidated financial statements.
Effective January 1, 2013, the Company adopted the accounting guidance which requires an entity to provide information about the amounts reclassified out of accumulated other comprehensive income by component. The Company elected to present the information in the notes to the Company’s consolidated financial statements.
65
Cash, Cash Equivalents and Investments
The following tables summarize the Company’s cash and available-for-sale securities’ adjusted cost, gross unrealized gains, gross unrealized losses and fair value by significant investment category recorded as cash and cash equivalents or short-term or long-term investments as of
December 31, 2013
and
2012
(in millions):
|
Amortized
Cost
|
Gross
Unrealized
Gains
|
Gross
Unrealized
Losses
|
Fair
Value
|
Cash and
Cash
Equivalents
|
Short-term
Investments
|
Long-term
Investments
|
|||||||||||||||||||||
|
December 31, 2013
|
|||||||||||||||||||||||||||
|
Cash
|
$
|
247.8
|
|
$
|
—
|
|
$
|
—
|
|
$
|
247.8
|
|
$
|
247.8
|
|
$
|
—
|
|
$
|
—
|
|
||||||
|
Level 1:
|
|||||||||||||||||||||||||||
|
Money market funds
|
516.2
|
|
—
|
|
—
|
|
516.2
|
|
516.2
|
|
—
|
|
—
|
|
|||||||||||||
|
U.S. Treasuries & corporate equity securities
|
65.4
|
|
—
|
|
(0.3
|
)
|
65.1
|
|
—
|
|
25.5
|
|
39.6
|
|
|||||||||||||
|
Subtotal
|
581.6
|
|
—
|
|
(0.3
|
)
|
581.3
|
|
516.2
|
|
25.5
|
|
39.6
|
|
|||||||||||||
|
Level 2:
|
|||||||||||||||||||||||||||
|
Commercial paper
|
100.2
|
|
—
|
|
—
|
|
100.2
|
|
18.1
|
|
82.1
|
|
—
|
|
|||||||||||||
|
Corporate securities
|
844.7
|
|
2.9
|
|
(1.9
|
)
|
845.7
|
|
—
|
|
227.7
|
|
618.0
|
|
|||||||||||||
|
U.S. government agencies
|
352.2
|
|
0.7
|
|
(0.7
|
)
|
352.2
|
|
—
|
|
84.7
|
|
267.5
|
|
|||||||||||||
|
Non-U.S. government securities
|
67.7
|
|
0.2
|
|
(0.1
|
)
|
67.8
|
|
—
|
|
41.2
|
|
26.6
|
|
|||||||||||||
|
Municipal securities
|
550.1
|
|
1.5
|
|
(0.1
|
)
|
551.5
|
|
—
|
|
160.2
|
|
391.3
|
|
|||||||||||||
|
Subtotal
|
1,914.9
|
|
5.3
|
|
(2.8
|
)
|
1,917.4
|
|
18.1
|
|
595.9
|
|
1,303.4
|
|
|||||||||||||
|
Level 3:
|
|||||||||||||||||||||||||||
|
Auction rate securities
|
8.0
|
|
—
|
|
(0.6
|
)
|
7.4
|
|
—
|
|
—
|
|
7.4
|
|
|||||||||||||
|
Subtotal
|
8.0
|
|
—
|
|
(0.6
|
)
|
7.4
|
|
—
|
|
—
|
|
7.4
|
|
|||||||||||||
|
Total assets measured at fair value
|
$
|
2,752.3
|
|
$
|
5.3
|
|
$
|
(3.7
|
)
|
$
|
2,753.9
|
|
$
|
782.1
|
|
$
|
621.4
|
|
$
|
1,350.4
|
|
||||||
|
Amortized
Cost
|
Gross
Unrealized
Gains
|
Gross
Unrealized
Losses
|
Fair
Value
|
Cash and
Cash
Equivalents
|
Short-term
Investments
|
Long-term
Investments
|
|||||||||||||||||||||
|
December 31, 2012
|
|||||||||||||||||||||||||||
|
Cash
|
$
|
89.7
|
|
$
|
—
|
|
$
|
—
|
|
$
|
89.7
|
|
$
|
89.7
|
|
$
|
—
|
|
$
|
—
|
|
||||||
|
Level 1:
|
|||||||||||||||||||||||||||
|
Money market funds
|
388.1
|
|
—
|
|
—
|
|
388.1
|
|
388.1
|
|
—
|
|
—
|
|
|||||||||||||
|
U.S. Treasuries & corporate equity securities
|
179.2
|
|
0.2
|
|
—
|
|
179.4
|
|
—
|
|
155.4
|
|
24.0
|
|
|||||||||||||
|
Subtotal
|
567.3
|
|
0.2
|
|
—
|
|
567.5
|
|
388.1
|
|
155.4
|
|
24.0
|
|
|||||||||||||
|
Level 2:
|
|||||||||||||||||||||||||||
|
Commercial paper
|
157.4
|
|
—
|
|
—
|
|
157.4
|
|
75.9
|
|
81.5
|
|
—
|
|
|||||||||||||
|
Corporate securities
|
952.1
|
|
5.8
|
|
(0.4
|
)
|
957.5
|
|
—
|
|
274.6
|
|
682.9
|
|
|||||||||||||
|
U.S. government agencies
|
636.9
|
|
2.6
|
|
—
|
|
639.5
|
|
—
|
|
133.6
|
|
505.9
|
|
|||||||||||||
|
Non-U.S. government securities
|
90.8
|
|
0.5
|
|
—
|
|
91.3
|
|
—
|
|
21.8
|
|
69.5
|
|
|||||||||||||
|
Municipal securities
|
409.3
|
|
1.1
|
|
(0.2
|
)
|
410.2
|
|
—
|
|
103.8
|
|
306.4
|
|
|||||||||||||
|
Subtotal
|
2,246.5
|
|
10.0
|
|
(0.6
|
)
|
2,255.9
|
|
75.9
|
|
615.3
|
|
1,564.7
|
|
|||||||||||||
|
Level 3:
|
|||||||||||||||||||||||||||
|
Auction rate securities
|
8.0
|
|
—
|
|
(0.6
|
)
|
7.4
|
|
—
|
|
—
|
|
7.4
|
|
|||||||||||||
|
Subtotal
|
8.0
|
|
—
|
|
(0.6
|
)
|
7.4
|
|
—
|
|
—
|
|
7.4
|
|
|||||||||||||
|
Total assets measured at fair value
|
$
|
2,911.5
|
|
$
|
10.2
|
|
$
|
(1.2
|
)
|
$
|
2,920.5
|
|
$
|
553.7
|
|
$
|
770.7
|
|
$
|
1,596.1
|
|
||||||
66
The following table summarizes the contractual maturities of the Company’s cash equivalents and available-for-sale investments, excluding corporate equity securities, at
December 31, 2013
(in millions):
|
Amortized
Cost
|
Fair
Value
|
||||||
|
Mature in less than one year
|
$
|
1,154.6
|
|
$
|
1,155.7
|
|
|
|
Mature in one to five years
|
1,341.9
|
|
1,343.0
|
|
|||
|
Mature in after five years
|
8.0
|
|
7.4
|
|
|||
|
Total
|
$
|
2,504.5
|
|
$
|
2,506.1
|
|
|
Realized gains, net of tax, recognized on the sale of investments during the year ended
December 31, 2013
was
$0.6 million
. Realized losses, net of tax, recognized on the sale of investments during the year ended December 31,
2012
was
$0.1 million
. Realized gains, net of tax, recognized on the sale of investments during the year ended December 31,
2011
was
$1.6 million
.
As of
December 31, 2013
and
2012
, unrealized gains on investments, net of tax, of
$1.7 million
and
$6.2 million
, respectively, were included in accumulated other comprehensive income in the accompanying Consolidated Balance Sheets.
The following tables present the breakdown of the available-for-sale investments with unrealized losses at
December 31, 2013
and
2012
(in millions):
|
|
Unrealized losses less
than 12 months
|
Unrealized losses 12
months or greater
|
Total
|
||||||||||||||||||||
|
December 31, 2013
|
Fair
Value
|
Unrealized
Losses
|
Fair
Value
|
Unrealized
Losses
|
Fair
Value
|
Unrealized
Losses
|
|||||||||||||||||
|
Corporate securities
|
$
|
245.3
|
|
$
|
(1.9
|
)
|
$
|
9.5
|
|
$
|
—
|
|
$
|
254.8
|
|
$
|
(1.9
|
)
|
|||||
|
U.S. government and agency securities
|
142.8
|
|
(1.0
|
)
|
—
|
|
—
|
|
142.8
|
|
(1.0
|
)
|
|||||||||||
|
Municipal securities
|
37.6
|
|
(0.1
|
)
|
—
|
|
—
|
|
37.6
|
|
(0.1
|
)
|
|||||||||||
|
Non-U.S. government securities
|
18.7
|
|
(0.1
|
)
|
—
|
|
—
|
|
18.7
|
|
(0.1
|
)
|
|||||||||||
|
Auction rate securities
|
—
|
|
—
|
|
7.4
|
|
(0.6
|
)
|
7.4
|
|
(0.6
|
)
|
|||||||||||
|
$
|
444.4
|
|
$
|
(3.1
|
)
|
$
|
16.9
|
|
$
|
(0.6
|
)
|
$
|
461.3
|
|
$
|
(3.7
|
)
|
||||||
|
December 31, 2012
|
|
|
|
|
|
|
|||||||||||||||||
|
Corporate securities
|
$
|
148.5
|
|
$
|
(0.2
|
)
|
$
|
8.4
|
|
$
|
(0.2
|
)
|
$
|
156.9
|
|
$
|
(0.4
|
)
|
|||||
|
Municipal securities
|
127.0
|
|
(0.2
|
)
|
—
|
|
—
|
|
127.0
|
|
(0.2
|
)
|
|||||||||||
|
Commercial paper
|
27.1
|
|
—
|
|
—
|
|
—
|
|
27.1
|
|
—
|
|
|||||||||||
|
Non-U.S. government securities
|
3.8
|
|
—
|
|
—
|
|
—
|
|
3.8
|
|
—
|
|
|||||||||||
|
U.S. government agencies
|
15.3
|
|
—
|
|
—
|
|
—
|
|
15.3
|
|
—
|
|
|||||||||||
|
Auction rate securities
|
—
|
|
—
|
|
7.4
|
|
(0.6
|
)
|
7.4
|
|
(0.6
|
)
|
|||||||||||
|
$
|
321.7
|
|
$
|
(0.4
|
)
|
$
|
15.8
|
|
$
|
(0.8
|
)
|
$
|
337.5
|
|
$
|
(1.2
|
)
|
||||||
The unrealized losses on the available-for-sale investments are related to ARS and corporate securities. The Company determined these unrealized losses to be temporary and recorded no other-than-temporary impairments. Factors considered in determining whether a loss is temporary included the length of time and extent to which the investments fair value has been less than the cost basis; the financial condition and near-term prospects of the investee; extent of the loss related to credit of the issuer; the expected cash flows from the security; the Company’s intent to sell the security and whether or not the Company will be required to sell the security before the recovery of its amortized cost.
67
The following table provides reconciliation for all assets measured at fair value using significant unobservable Level 3 inputs for the years ended
December 31, 2013
and
2012
(in millions):
|
|
Fair Value Measurements at
Reporting Date Using
Significant Unobservable
Inputs (Level 3)
|
||
|
|
Auction rate securities
|
||
|
Balance at January 1, 2011
|
$
|
18.6
|
|
|
Sales
|
(2.6
|
)
|
|
|
Total gains or (losses):
|
|||
|
Included in other comprehensive income (loss)
|
0.4
|
|
|
|
Included in earnings
|
—
|
|
|
|
Balance at December 31, 2011
|
$
|
16.4
|
|
|
Sales
|
(12.0
|
)
|
|
|
Total gains or (losses):
|
|||
|
Included in other comprehensive income (loss)
|
3.0
|
|
|
|
Included in earnings
|
—
|
|
|
|
Balance at December 31, 2012
|
$
|
7.4
|
|
|
Sales
|
—
|
|
|
|
Total gains or (losses):
|
|||
|
Included in other comprehensive income (loss)
|
—
|
|
|
|
Included in earnings
|
—
|
|
|
|
Balance at December 31, 2013
|
$
|
7.4
|
|
There have been no transfers between Level 1 and Level 2 measurements during the year ended
December 31, 2013
, and there were no changes in the Company’s valuation technique. Level 3 assets consist of municipal bonds with ARS whose underlying assets are student loans which are substantially backed by the federal government. Since the auctions for these securities have continued to fail since February 2008, these investments are not currently trading and therefore do not have a readily determinable market value. The Company has valued the ARS using a discounted cash flow model based on Level 3 assumptions, including estimates of, based on data available as of
December 31, 2013
, interest rates, timing and amount of cash flows, credit and liquidity premiums and expected holding periods of the ARS.
Foreign currency derivative
The objective of the Company’s hedging program is to mitigate the impact of changes in currency exchange rates on net cash flow from foreign currency denominated sales and intercompany balances and other monetary assets or liabilities denominated in currencies other than the U.S. dollar. The Company had
$3.8 million
and
$2.7 million
of derivative liabilities recorded as other accrued liabilities in the Consolidated Balance Sheets at
December 31, 2013
and
2012
. The derivative assets and liabilities are measured using Level 2 fair value inputs.
Cash Flow Hedges
The Company enters into currency forward contracts as cash flow hedges to hedge certain forecasted revenue transactions denominated in currencies other than the U.S. dollar, primarily the European Euro (“Euro or €”), the British Pound (“GBP or £”) and the Korean Won (“KRW”).
As of
December 31, 2013
, the Company had notional amounts of
€59.0 million
and KRW
4.4 billion
of outstanding currency forward contracts entered into to hedge Euro and KRW denominated sales, compared to
€20.0 million
and KRW
4.4 billion
at
December 31, 2012
. The net gains (losses) reclassified to revenue related to the hedged revenue transactions for the years ended
December 31, 2013
,
2012
, and
2011
were not significant. Other impacts of derivative instruments designated as cash flow hedges were not significant for the years ended
December 31, 2013
,
2012
, and
2011
.
Other Derivatives Not Designated as Hedging Instruments
Other derivatives not designated as hedging instruments consist primarily of forward contracts that the Company uses to hedge intercompany balances and other monetary assets or liabilities denominated in currencies other than the U.S. dollar, primarily the Euro, GBP, the Swiss Franc (“CHF”), Japanese Yen (“JPY”) and the KRW.
68
Derivative instruments used to hedge against balance sheet foreign currency exposures at the end of each period were as follows (in millions):
|
|
Years Ended December 31,
|
||||||||||
|
|
2013
|
2012
|
2011
|
||||||||
|
Recognized gains (losses) in interest and other income, net
|
$
|
(3.4
|
)
|
$
|
(0.3
|
)
|
$
|
(1.2
|
)
|
||
|
Foreign exchange gains (losses) related to re-measurement
|
$
|
3.1
|
|
$
|
0.7
|
|
$
|
0.3
|
|
||
The notional amounts for derivative instruments provide one measure of the transaction volume. Total gross notional amounts (in local currency) for derivatives (recorded at fair value) outstanding at the end of each period were as follows (in millions):
|
Years Ended December 31,
|
||||||||
|
2013
|
2012
|
2011
|
||||||
|
European Euro
|
64.0
|
|
37.6
|
|
35.0
|
|
||
|
Korean Won
|
23,000.0
|
|
4,600.0
|
|
—
|
|
||
|
British Pound
|
7.7
|
|
5.4
|
|
1.8
|
|
||
|
Swiss Franc
|
—
|
|
(1.0
|
)
|
(1.7
|
)
|
||
|
Japanese Yen
|
60.0
|
|
—
|
|
—
|
|
||
The following table provides details of the inventory balance sheet item (in millions):
|
|
December 31,
|
||||||
|
|
2013
|
|
2012
|
||||
|
Inventory:
|
|||||||
|
Raw materials
|
$
|
67.2
|
|
$
|
41.2
|
|
|
|
Work-in-process
|
12.6
|
|
4.4
|
|
|||
|
Finished goods
|
99.8
|
|
75.9
|
|
|||
|
Total inventory
|
$
|
179.6
|
|
$
|
121.5
|
|
|
The following table provides details of the property, plant and equipment, net balance sheet item (in millions):
|
|
December 31,
|
||||||
|
|
2013
|
2012
|
|||||
|
Property, plant and equipment, net:
|
|||||||
|
Land
|
$
|
84.7
|
|
$
|
83.6
|
|
|
|
Building and building/leasehold improvements
|
151.9
|
|
99.1
|
|
|||
|
Machinery and equipment
|
137.2
|
|
105.0
|
|
|||
|
Computer and office equipment
|
27.1
|
|
19.2
|
|
|||
|
Capitalized software
|
66.9
|
|
53.9
|
|
|||
|
Construction-in-process
|
16.4
|
|
15.4
|
|
|||
|
484.2
|
|
376.2
|
|
||||
|
Less: Accumulated depreciation
|
(174.3
|
)
|
(134.4
|
)
|
|||
|
Total property, plant and equipment, net
|
$
|
309.9
|
|
$
|
241.8
|
|
|
69
The following table provides details of the other accrued liabilities—short term balance sheet item (in millions):
|
|
December 31,
|
||||||
|
|
2013
|
2012
|
|||||
|
Other accrued liabilities—short term:
|
|||||||
|
Other accrued liabilities
|
$
|
52.8
|
|
$
|
44.6
|
|
|
|
Taxes payable
|
5.1
|
|
5.8
|
|
|||
|
Accrued professional fees
|
6.0
|
|
3.9
|
|
|||
|
Total other accrued liabilities—short-term
|
$
|
63.9
|
|
$
|
54.3
|
|
|
The following table provides details of the other long-term liabilities balance sheet item (in millions):
|
|
December 31,
|
||||||
|
|
2013
|
2012
|
|||||
|
Other long-term liabilities:
|
|||||||
|
Income taxes—long term
|
$
|
64.5
|
|
$
|
76.7
|
|
|
|
Other long-term liabilities
|
3.5
|
|
0.8
|
|
|||
|
Total other long-term liabilities
|
$
|
68.0
|
|
$
|
77.5
|
|
|
Goodwill
The Company’s gross carrying amount of goodwill was
$137.4 million
and
$138.1 million
as of
December 31, 2013
and
2012
, respectively. The Company acquired its Korean distributor on
January 11, 2012
. The total purchase consideration of the acquisition was not material, and the acquisition has not had a material impact on the results of our operations.
Intangibles
The gross carrying amount of total intangible assets, primarily representing purchased intellectual property, was
$179.7 million
and
$177.7 million
as of
December 31, 2013
and
2012
, respectively.
Additions made to intangibles assets, including intellectual property and asset purchase, during the years ended
December 31, 2013
and
2012
were
$2.0 million
and
$41.6 million
, respectively. The weighted average useful life was
six
years for each of the years ended
December 31, 2013
and
2012
. Amortization expense related to intangible assets was
$21.3 million
,
$23.1 million
, and
$17.8 million
for the years ended
December 31, 2013
,
2012
, and
2011
, respectively. Accumulated amortization of intangible assets was
$115.4 million
and
$94.1 million
as of
December 31, 2013
and
2012
, respectively.
The estimated future amortization expense of intangible assets as of
December 31, 2013
is as follows (in millions):
|
Fiscal Year
|
Amount
|
||
|
2014
|
$
|
18.0
|
|
|
2015
|
17.7
|
|
|
|
2016
|
14.7
|
|
|
|
2017
|
8.8
|
|
|
|
2018
|
5.1
|
|
|
|
2019 and thereafter
|
—
|
|
|
|
Total
|
$
|
64.3
|
|
OPERATING LEASES
The Company leases office space in China, Japan, Korea, Mexico, Switzerland and United States. The Company leases automobiles for certain sales and field service employees. These leases have varying terms, predominantly no longer than
three years
.
70
Future minimum lease commitments under the Company’s operating leases as of
December 31, 2013
, are as follows (in millions):
|
Years
|
Amount
|
||
|
2014
|
$
|
4.9
|
|
|
2015
|
3.4
|
|
|
|
2016
|
1.8
|
|
|
|
2017
|
0.7
|
|
|
|
2018
|
0.3
|
|
|
|
2019 and thereafter
|
—
|
|
|
|
$
|
11.1
|
|
|
Other commitments include an estimated amount of approximately
$268.3 million
of all open cancellable purchase orders and contractual obligations that occur in the ordinary course of business, including commitments with suppliers, for which we have not received the goods or services.
CONTINGENCIES
The Company is involved in a variety of claims, lawsuits, investigations and proceedings relating to securities laws, product liability, patent infringement, contract disputes and other matters relating to various claims that arise in the normal course of our business. Certain of these lawsuits and claims are described in further detail below. We do not know whether we will prevail in these matters nor can we assure that any remedy could be reached on commercially reasonable terms, if at all. It is not possible to predict the outcome of the pending or threatened litigation matters currently disclosed. We have therefore determined that an estimate of possible loss or range of loss cannot be determined as of December 31, 2013. Nevertheless, it is possible that future legal costs (including settlements, judgments, legal fees and other related defense costs) could have a material adverse effect on our business, financial condition, and results of operations or cash flows.
In accordance with U.S. generally accepted accounting principles, the Company records a liability when it is both probable that a liability has been incurred and the amount of the loss can be reasonably estimated. These provisions are reviewed at least quarterly and adjusted to reflect the impacts of negotiations, settlements, rulings, advice of legal counsel, and other information and events pertaining to a particular case.
Purported Shareholder Class Action Lawsuit filed August 6, 2010
On August 6, 2010, a purported class action lawsuit entitled
Perlmutter v. Intuitive Surgical et al.
, No. CV10-3451, was filed against
seven
of the Company’s current and former officers and directors in the United States District Court for the Northern District of California. The lawsuit seeks unspecified damages on behalf of a putative class of persons who purchased or otherwise acquired the Company’s common stock between February 1, 2008 and January 7, 2009. The complaint alleges that the defendants violated federal securities laws by making allegedly false and misleading statements and omitting certain material facts in the Company’s filings with the Securities and Exchange Commission. On February 15, 2011, the Police Retirement System of St. Louis was appointed Lead Plaintiff in the case pursuant to the Private Securities Litigation Reform Act of 1995. An amended complaint was filed on April 15, 2011, making allegations substantially similar to the allegations described above. On May 23, 2011 the Company filed a motion to dismiss the amended complaint. On August 10, 2011 that motion was granted and the action was dismissed; the plaintiffs were given
30 days
to file an amended complaint. On September 12, 2011, plaintiffs filed their amended complaint. The allegations contained therein are substantially similar to the allegations in the prior complaint. The Company filed a motion to dismiss the amended complaint. A hearing occurred on February 16, 2012, and on May 22, 2012 the Company’s motion was granted. The complaint was dismissed with prejudice, and a final judgment was entered in the Company’s favor on June 1, 2012. On June 20, 2012, plaintiffs filed a notice of appeal with the United States Court of Appeals for the Ninth Circuit. The appeal is styled
Police Retirement System of St. Louis v. Intuitive Surgical, Inc. et al.
, No. 12-16430. Plaintiffs filed their opening brief on September 28, 2012. The Company filed an answering brief on November 13, 2012, and plaintiffs filed a reply brief on December 17, 2012. No oral argument date has been set, and the appeal remains pending. Based on currently available information, the Company does not believe the resolution of this matter will have a material adverse effect on its business, financial position or future results of operations.
Purported Derivative Actions
On August 19, 2010, an alleged stockholder caused a purported stockholder’s derivative lawsuit entitled
Himmel v. Smith et al.
, No. 1-10-CV-180416, to be filed in the Superior Court of California for the County of Santa Clara naming the Company as a nominal defendant, and naming
14
of the Company’s current and former officers and directors as defendants. The lawsuit seeks to recover, for the Company’s benefit, unspecified damages purportedly sustained by the Company in connection with allegedly misleading statements and/or omissions made in connection with the Company’s financial reporting for the period between
71
February 1, 2008 and January 7, 2009. It also seeks a series of changes to the Company’s corporate governance policies and an award of attorneys’ fees. On September 15, 2010, another purported stockholder filed a substantially identical lawsuit entitled
Applebaum v. Guthart et al.
, No. 1-10-CV-182645, in the same court against
15
of the Company’s current and former officers and directors. On October 5, 2010 the court ordered that the two cases be consolidated for all purposes. By agreement with the plaintiffs, all activity in the case has been stayed pending the results of the appeal in the purported shareholder class action lawsuit discussed above. Based on currently available information, the Company does not believe the resolution of this matter will have a material adverse effect on its business, financial position or future results of operations.
Purported Shareholder Class Action Lawsuits filed April 26, 2013 and May 24, 2013
On April 26, 2013, a purported class action lawsuit entitled
Abrams v. Intuitive Surgical, et al.
, No. 5-13-cv-1920, was filed against several of the Company's current and former officers and directors in the United States District Court for the Northern District of California. A substantially identical complaint, entitled
Adel v. Intuitive Surgical, et al.
, No. 5:13-cv-02365, was filed in the same court against the same defendants on May 24, 2013. The Adel case was voluntarily dismissed without prejudice on August 20, 2013.
On October 15, 2013 the plaintiffs in the Abrams matter filed an amended complaint. The case has since been re-titled
In re Intuitive Surgical Securities Litigation
. The plaintiffs seek unspecified damages on behalf of a putative class of persons who purchased or otherwise acquired our common stock between February 6, 2012 and July 18, 2013. The amended complaint alleges that the defendants violated federal securities laws by making allegedly false and misleading statements and omitting certain material facts in the Company's filings with the Securities and Exchange Commission. On November 18, 2013 the Court appointed Employees’ Retirement System of the State of Hawaii as lead plaintiff and appointed lead counsel. The Company filed a motion to dismiss the amended complaint on December 16, 2013. The Company anticipates a hearing on the motion in May 2014. Based on currently available information, the Company does not believe the resolution of this matter will have a material adverse effect on its business, financial position or future results of operations.
Product Liability Litigation
The Company is currently named as a defendant in a
bout
76
ind
ividual product liability lawsuits filed in various state and federal courts by plaintiffs who allege that they underwent surgical procedures that utilized the
da Vinci
Surgical System and sustained a variety of personal injuries and, in some cases, death as a result of such surgery. In addition, the Company has been named as a defendant in a purported class action filed in Louisiana state court, and removed to federal court, seeking damages on behalf of all patients who were allegedly injured by the
da Vinci
Surgical System at a single hospital in Louisiana. The cases raise a variety of allegations including, to varying degrees, that the plaintiffs’ injuries resulted from purported defects in the
da Vinci
Surgical System and/or failure on the Company's part to provide adequate training resources to the healthcare professionals who performed plaintiffs’ surgeries. The cases further allege that the Company failed to adequately disclose and/or misrepresented the potential risks and/or benefits of the
da Vinci
Surgical System. Plaintiffs also assert a variety of causes of action, including for example, strict liability based on purported design defects, negligence, fraud, breach of express and implied warranties, unjust enrichment, and loss of consortium. Plaintiffs seek recovery for alleged personal injuries and, in many cases, punitive damages. Except for a few cases, including the
Taylor
case described below, these cases generally are in the early stages of pretrial activity.
Plaintiffs’ attorneys continue to engage in well-funded national advertising campaigns soliciting clients who have undergone
da Vinci
surgery and claim to have suffered an injury. The plaintiffs’ attorneys are now alleging that Intuitive Surgical is liable for those injuries under products liability theories. The Company continues to receive claims as a result of these advertising efforts; however, the Company has not received detailed information regarding all claims. In an effort to provide an orderly process for evaluating claims before they result in costly litigation, the Company has entered into tolling agreements with certain plaintiffs’ counsel acting on behalf of such claimants. The tolling agreements provide that the statute of limitations for each individual will be tolled for a certain period in exchange for the individual’s agreement that, if he or she ultimately files a lawsuit, it will be filed in certain agreed upon venues. A substantial number of claims have been added to the tolling agreements, which provide the parties and their legal counsel with additional time to evaluate the claims, and to explore whether the claims have merit and whether they can be resolved through mediation without litigation. As of result of these discussions, plaintiffs’ counsel have voluntarily removed a sizable number of claims from the tolling agreements and notified the Company that they no longer intend to pursue these claims. Nonetheless, the Company does not currently know how many individuals will ultimately file lawsuits or how many additional individuals will decide not to pursue their claims, nor is the Company able at this time to reasonably estimate the financial impact of their claims or predict the final disposition of such claims. Based on currently available information, the Company believes that it has meritorious defenses and although the Company continues to explore means of resolving individual claims or aggregate groups of claims without litigation, it intends to assert such defenses vigorously in the lawsuits that are currently pending and any future lawsuits. The Company is not at present able to determine whether the resolution of these matters will have a material adverse effect on its business, financial position or future results of operations.
In February 2011, the Company was named as a defendant in a product liability action that had originally been filed in Washington State Superior Court for Kitsap County against the healthcare providers and hospital involved in the plaintiff’s
72
decedent’s surgery (
Josette Taylor, as Personal Representative of the Estate of Fred E. Taylor, deceased; and on behalf of the Estate of Fred E. Taylor v. Intuitive Surgical, Inc
., No. 09-2-03136-5). In
Taylor
, plaintiff asserted wrongful death and product liability claims against the Company, generally alleging that the decedent died four years after surgery as a result of injuries purportedly suffered during the surgery, which was conducted with the use of the
da Vinci
Surgical System. The plaintiff in
Taylor
asserted that such injuries were caused, in whole or in part, by the Company's purported failure to properly train, warn, and instruct the surgeon. The lawsuit sought unspecified damages for past medical expenses, pain and suffering, loss of consortium as well as punitive damages. A trial commenced in the action on April 15, 2013. On May 23, 2013, the jury returned a defense verdict, finding that the Company was not negligent. Judgment was entered in favor of Intuitive Surgical, Inc. on June 7, 2013.
Plaintiff has filed a notice of appeal.
False Claims Act Litigation
In October 2013, the Company was served in a case entitled
Rose v. Intuitive Surgical, Inc.
, No. 12-cv-1812, in the Middle District of Florida. Relator Bryan Rose, a former employee of Intuitive Surgical, brought the action on behalf of the United States of America, alleging violations of the False Claims Act, 31 U.S.C. § 3729
et seq.
, and the analogous false-claims statutes of
twenty-one
states and of the District of Columbia. Broadly, he alleges that he has first-hand knowledge of a fraudulent scheme, involving kickbacks paid in exchange for referrals and surgical procedures, and first-hand knowledge of off-label usage of Intuitive Surgical’s products. The complaint was filed under seal on November 27, 2012, and was provided to the Department of Justice and the twenty-one states and the District of Columbia. The United States Government declined to intervene on October 8, 2013. The twenty-one states and the District of Columbia declined to intervene on November 21, 2013. Based on currently available information, the Company believes that it has meritorious defenses in this action and intends to assert them vigorously. Based on currently available information, the Company does not believe the resolution of this matter will have a material adverse effect on its business, financial position or future results of operations.
Insurance Litigation
In October 2013, the Company was named as a defendant in an insurance action entitled
Illinois Union Insurance Co. v. Intuitive Surgical, Inc.
, No. 3:13-cv-04863-JST, filed in the Northern District of California. Plaintiff Illinois Union Insurance Co. seeks to rescind the Life Sciences Products-Completed Operations Liability Policy issued by Plaintiff to Intuitive Surgical, which provides coverage for products liability claims first made against Intuitive Surgical during the policy period March 1, 2013 to March 1, 2014. In December 2013, the Company was named as a defendant in another insurance action entitled
Navigators Specialty Insurance Co. v. Intuitive Surgical, Inc.
, No. 5:13-cv-05801-HRL, filed in the Northern District of California. Plaintiff Navigators Insurance Co. alleges that the Follow Form Excess Liability Insurance Policy issued by Plaintiff to Intuitive Surgical for products liability claims first made against Intuitive Surgical during the policy period March 1, 2013 to March 1, 2014 should be rescinded. Both Plaintiffs generally allege that Intuitive Surgical did not disclose the existence of tolling agreements and the number of claimants incorporated within those agreements, and that those agreements were material to Plaintiffs’ underwriting processes. The Company intends to vigorously defend these actions. Based on currently available information, the Company does not believe the resolution of this matter will have a material adverse effect on its business, financial position or future results of operations.
The Company is also a party to various other legal actions that arose in the ordinary course of its business. The Company does not believe that any of these other legal actions will have a material adverse impact on its business, financial position or results of operations.
STOCK REPURCHASE PROGRAM
In February 2011 and October 2011, the Board authorized the repurchase of an additional
$400 million
and
$500 million
, respectively, under the share repurchase program originally established in March 2009. On July 25, 2013 and March 20, 2013, the Board authorized additional stock repurchases of
$779 million
and
$1.0 billion
, respectively. As of December 31, 2013, the remaining amount of share repurchases authorized by the Board was approximately
$1.0 billion
.
On July 29, 2013, in connection with the stock repurchase authorization, the Company entered into an accelerated share repurchase program (the “ASR Program”) with Goldman, Sachs & Co. (“Goldman”) to repurchase
$500 million
of the Company’s common stock. Under the ASR Program, the Company paid an initial purchase price of
$500 million
to Goldman and received an initial delivery of approximately
1.2 million
shares of its common stock. On September 11, 2013, Goldman exercised its early termination option under the ASR Program and the pricing period was closed. The settlement price was
$385.16
per share. Based on this settlement price, the final number of shares repurchased by the Company and delivered by Goldman under the ASR Program was
1.3 million
shares. The Company received the additional
0.1 million
shares from Goldman on September 16, 2013 to settle the difference between the initial share delivery and the total number of shares repurchased.
73
In addition to the ASR Program, the Company repurchased an additional
0.5 million
shares of the Company’s common stock during the year ended December 31, 2013. All of these shares were repurchased in the open market. All common stock repurchased has been retired as of December 31, 2013.
The following table provides the stock repurchase activities during the years ended
December 31, 2013
,
2012
, and
2011
(in millions, except per share amounts):
|
|
Years Ended December 31,
|
||||||||||
|
|
2013
|
2012
|
2011
|
||||||||
|
Shares repurchased
|
2.6
|
|
0.4
|
|
1.0
|
|
|||||
|
Average price per share
|
$
|
429.09
|
|
$
|
503.05
|
|
$
|
344.72
|
|
||
|
Value of shares repurchased
|
$
|
1,109.2
|
|
$
|
238.3
|
|
$
|
331.8
|
|
||
The Company uses the par value method of accounting for its stock repurchases. As a result of the share repurchases during the years ended
December 31, 2013
,
2012
, and
2011
, the Company reduced common stock and additional paid-in capital by an aggregate of
$84.2 million
,
$13.2 million
, and
$19.7 million
, respectively, and charged
$1,025.0 million
,
$225.1 million
,
$312.1 million
, respectively, to retained earnings.
ACCUMULATED OTHER COMPREHENSIVE INCOME
The components of accumulated other comprehensive income, net of tax, for the years ended
December 31, 2013
and
2012
are as follows (in millions):
|
|
Year Ended December 31, 2013
|
||||||||||||||
|
|
Gains (Losses)
on Hedge
Instruments
|
Unrealized Gains
(Losses) on
Available-for-
Sale Securities
|
Foreign
Currency
Translation
Gains (Losses)
|
Total
|
|||||||||||
|
Beginning balance
|
$
|
—
|
|
$
|
6.2
|
|
$
|
0.4
|
|
$
|
6.6
|
|
|||
|
Other comprehensive income before reclassifications
|
(1.8
|
)
|
(3.9
|
)
|
—
|
|
(5.7
|
)
|
|||||||
|
Reclassified from accumulated other comprehensive income
|
1.8
|
|
(0.6
|
)
|
—
|
|
1.2
|
|
|||||||
|
Net current-period other comprehensive income
|
—
|
|
(4.5
|
)
|
—
|
|
(4.5
|
)
|
|||||||
|
Ending balance
|
$
|
—
|
|
$
|
1.7
|
|
$
|
0.4
|
|
$
|
2.1
|
|
|||
|
|
Year Ended December 31, 2012
|
||||||||||||||
|
|
Gains (Losses)
on Hedge
Instruments
|
Unrealized Gains
(Losses) on
Available-for-
Sale Securities
|
Foreign
Currency
Translation
Gains (Losses)
|
Total
|
|||||||||||
|
Beginning balance
|
$
|
—
|
|
$
|
1.1
|
|
$
|
(0.2
|
)
|
$
|
0.9
|
|
|||
|
Other comprehensive income before reclassifications
|
(1.1
|
)
|
5.0
|
|
0.6
|
|
4.5
|
|
|||||||
|
Reclassified from accumulated other comprehensive income
|
1.1
|
|
0.1
|
|
—
|
|
1.2
|
|
|||||||
|
Net current-period other comprehensive income
|
—
|
|
5.1
|
|
0.6
|
|
5.7
|
|
|||||||
|
Ending balance
|
$
|
—
|
|
$
|
6.2
|
|
$
|
0.4
|
|
$
|
6.6
|
|
|||
STOCK OPTION PLANS
2010 Incentive Award Plan
In April 2010, the Company’s stockholders approved the 2010 Incentive Award Plan (“2010 Plan”). Under this plan, the Company issues nonqualified stock options (“NSOs”) to employees and certain consultants. The 2010 Plan generally permits NSOs to be granted at no less than the fair market value of the common stock on the date of grant, with terms of
10
years from the date of grant. The 2010 Plan expires in 2020. On April 25, 2013, the Shareholders approved an amended and restated 2010 Incentive Award Plan (“2010 Plan”) to provide for an increase in the number of shares of common stock reserved for issuance from
3,650,000
to
4,850,000
. As of
December 31, 2013
, approximately
1.6 million
shares were reserved for future issuance under the 2010 Plan.
74
2009 Employment Commencement Incentive Plan
In October 2009, the Board of Directors adopted the 2009 Employment Commencement Incentive Plan (“New Hire Plan”). The New Hire Plan provides for the shares to be used exclusively for the grant of NSOs to new employees (“New Hire Options”), who were not previously an employee or non-employee director of the Company. Options are granted at an exercise price not less than the fair market value of the stock on the date of grant and have a term not to exceed
10
years.
As of
December 31, 2013
, approximately
200,000
shares were reserved for future issuance under the New Hire Plan. In January 2013, the Board amended and restated the 2009 Employment Commencement Incentive Plan (“2009 Plan”) to provide for an increase in the number of shares of common stock authorized for issuance pursuant to awards granted under the 2009 Plan from
730,000
to
855,000
. In May 2013, the Board amended and restated the 2009 Plan to provide for an additional increase in the number of shares of common stock authorized for issuance pursuant to awards granted under the 2009 Plan from
855,000
to
1,155,000
.
2000 Equity Incentive Plan
In March 2000, the Board of Directors adopted the 2000 Equity Incentive Plan (“2000 Plan”), which took effect upon the closing of the Company’s initial public offering. Under this plan, certain employees, consultants and non-employee directors may be granted Incentive Stock Options (“ISOs”) and Nonstatutory Stock Options (“NSOs”) to purchase shares of the Company’s common stock. The 2000 Plan permitted ISOs to be granted at an exercise price not less than the fair value on the date of the grant and NSOs at an exercise price not less than
85%
of the fair value on the date of grant. Options granted under the 2000 Plan generally expire
10
years from the date of grant and become exercisable upon grant subject to repurchase rights in favor of the Company until vested. The 2000 Plan expired in March 2010. However, options granted prior to the plan’s expiration continue to vest or remain outstanding until their original expiration date.
Employee Option Vesting
Prior to 2012, stock options were granted to employees at their start date (“New Hire Options”) and on February 15 of each year or the next business day if the date is not a business day (“Annual Grant”). The Annual Grant and New Hire Options generally vest
12.5%
upon completion of 6 months service and 1/48 per month thereafter. Beginning in 2013, the Company split the annual grant into a grant on February 15 (or the next business day if the date is not a business day) and a separate grant on August 15 (or the next business day if the date is not a business day). The February 15 grants vest
12.5%
upon completion of 6 months service and 1/48 per month thereafter. The August 15 stock option awards vest 7/48 at the end of one month and 1/48 per month thereafter through a
3.5
year vesting period. Option vesting terms are determined by the Board of Directors and, in the future, may vary from past practices.
2000 Non-Employee Directors’ Stock Option Plan
In March 2000, the Board of Directors adopted the 2000 Non-Employee Directors’ Stock Option Plan (the “Directors’ Plan”). In October 2009, the automatic evergreen increase provisions were eliminated so that no further automatic increases will be made to the number of shares reserved for issuance under the Directors’ Plan. In addition, the common stock authorized for issuance under the Directors’ Plan was reduced to
150,000
. Options are granted at an exercise price not less than the fair market value of the stock on the date of grant and have a term not to exceed
10
years. Initial grants are vested over a
three
-year period with
33.3%
of the shares vesting after 1 year from the date of grant and 1/36 of the shares vesting monthly thereafter. Annual grants are vested
one year
from the date of the grant. As of
December 31, 2013
, approximately
64,000
shares were reserved for future issuance under the Directors’ Plan.
2000 Employee Stock Purchase Plan
In March 2000, the Board of Directors adopted the 2000 Employee Stock Purchase Plan (ESPP). Employees are generally eligible to participate in the ESPP if they are customarily employed by the Company for more than
20
hours per week and more than
5
months in a calendar year and are not
5%
stockholders of the Company. Under the ESPP, eligible employees may select a rate of payroll deduction up to
15%
of their eligible compensation subject to certain maximum purchase limitations. The duration for each offering period is
twenty-four months
long and is divided into
four
shorter purchase periods approximately
six months
in length. Offerings are concurrent. The purchase price of the shares under the offering is the lesser of
85%
of the fair market value of the shares on the offering date or
85%
of the fair market value of the shares on the purchase date. A
two
-year look-back feature in the ESPP causes the offering period to reset if the fair value of the Company’s common stock on the first or last day of the purchase period is less than that on the original offering date. ESPP purchases by employees are settled with newly-issued common stock from the ESPP’s previously authorized and available pool of shares.
The Company issued
0.1 million
,
0.1 million
and
0.1 million
shares under the ESPP, representing approximately
$28.8 million
,
$27.8 million
, and
$18.5 million
in employee contributions for the years ended
December 31, 2013
,
2012
, and
2011
, respectively. As of
December 31, 2013
, there were approximately
0.4 million
shares reserved for grant under the ESPP.
75
STOCK OPTION PLAN INFORMATION
Option activity during fiscal
2013
under all the stock plans was as follows (in millions, except per share amounts):
|
|
|
STOCK OPTIONS OUTSTANDING
|
|||||||
|
|
Shares
Available
for Grant
|
Number
Outstanding
|
Weighted Average
Exercise Price Per
Share
|
||||||
|
Balance at December 31, 2012 (with 2.5 options exercisable at a weighted-average exercise price of $268.31 per share and with 4.8 options vested and expected to vest at a weighted-average exercise price of $340.83 per share)
|
1.6
|
|
4.8
|
|
$
|
340.83
|
|
||
|
Options authorized
|
1.6
|
|
—
|
|
$
|
—
|
|
||
|
Options granted
|
(1.5
|
)
|
1.5
|
|
$
|
471.33
|
|
||
|
Options exercised
|
—
|
|
(0.5
|
)
|
$
|
250.17
|
|
||
|
Options forfeited/expired
|
0.2
|
|
(0.2
|
)
|
$
|
456.64
|
|
||
|
Balance at December 31, 2013
|
1.9
|
|
5.6
|
|
$
|
380.71
|
|
||
The aggregate intrinsic value of options exercised under our stock option plans determined as of the date of option exercise was
$130.2 million
,
$375.7 million
, and
$262.8 million
during the years ended
December 31, 2013
,
2012
, and
2011
respectively. Cash received from option exercises and employee stock purchase plans for the years ended
December 31, 2013
,
2012
, and
2011
was
$160.6 million
,
$263.3 million
, and
$260.6 million
, respectively.
The following table summarizes significant ranges of outstanding and exercisable options as of
December 31, 2013
(number of shares in millions):
|
|
Options Outstanding
|
Options Exercisable
|
|||||||||||||||||||||||
|
Range of
Exercise Prices
|
Number
of Shares
|
Weighted
Average
Remaining
Contractual Life
|
Weighted
Average
Exercise Price
Per Share
|
Aggregate
Intrinsic
Value (1)
|
Number
of Shares
|
Weighted
Average
Remaining
Contractual Life
|
Weighted
Average
Exercise Price
Per Share
|
Aggregate
Intrinsic
Value (1)
|
|||||||||||||||||
|
$18.50-$303.27
|
1.2
|
|
4.23
|
$
|
184.37
|
|
1.2
|
|
$
|
182.68
|
|
||||||||||||||
|
$308.96-$341.19
|
1.4
|
|
6.55
|
$
|
336.63
|
|
1.1
|
|
$
|
335.80
|
|
||||||||||||||
|
$343.83-$504.43
|
1.2
|
|
8.92
|
$
|
400.49
|
|
0.3
|
|
$
|
392.02
|
|
||||||||||||||
|
$505.23-$518.29
|
1.1
|
|
8.26
|
$
|
511.45
|
|
0.5
|
|
$
|
511.37
|
|
||||||||||||||
|
$529.51-$579.24
|
0.7
|
|
8.89
|
$
|
565.89
|
|
0.2
|
|
$
|
565.61
|
|
||||||||||||||
|
TOTAL
|
5.6
|
|
7.17
|
$
|
380.71
|
|
$
|
311.2
|
|
3.3
|
|
6.16
|
$
|
324.60
|
|
$
|
293.3
|
|
|||||||
|
(1)
|
The aggregate intrinsic value represents the total pre-tax intrinsic value, based on the Company’s closing stock price of
$384.08
as of
December 31, 2013
, which would have been received by the option holders had all in-the-money option holders exercised their options as of that date.
|
As of
December 31, 2013
, a total of
5.4 million
shares vested and expected to vest had a weighted average remaining contractual life of
7.1
years, an aggregate intrinsic value of
$310.8 million
, and the shares had a weighted average exercise price of
$378.80
.
SHARE-BASED COMPENSATION EXPENSE:
The following table summarizes share-based compensation expense (in millions):
|
|
Years Ended December 31,
|
||||||||||
|
|
2013
|
2012
|
2011
|
||||||||
|
Cost of sales—products
|
$
|
17.6
|
|
$
|
14.1
|
|
$
|
12.3
|
|
||
|
Cost of sales—services
|
12.7
|
|
12.9
|
|
11.0
|
|
|||||
|
Total cost of sales
|
30.3
|
|
27.0
|
|
23.3
|
|
|||||
|
Selling, general and administrative
|
101.4
|
|
93.1
|
|
84.3
|
|
|||||
|
Research and development
|
37.2
|
|
33.2
|
|
28.8
|
|
|||||
|
Share-based compensation expense before income taxes
|
168.9
|
|
153.3
|
|
136.4
|
|
|||||
|
Income tax effect
|
58.5
|
|
47.5
|
|
42.9
|
|
|||||
|
Share-based compensation expense after income taxes
|
$
|
110.4
|
|
$
|
105.8
|
|
$
|
93.5
|
|
||
76
The Black-Scholes option pricing model is used to estimate the fair value of stock options granted under the Company’s share-based compensation plans and rights to acquire stock granted under the Company’s employee stock purchase plan. The weighted average estimated fair values of the stock options and rights to acquire stock granted under the Company’s employee purchase plan as well as the weighted average assumptions used in calculating these values during the years ended
December 31, 2013
,
2012
, and
2011
, were based on estimates at the date of grant as follows:
|
|
Years Ended December 31,
|
||||||||||
|
STOCK OPTION PLANS
|
2013
|
2012
|
2011
|
||||||||
|
Average risk free interest rate
|
1.2
|
%
|
0.8
|
%
|
2.2
|
%
|
|||||
|
Average expected term (years)
|
4.5
|
|
4.3
|
|
4.8
|
|
|||||
|
Average volatility
|
30
|
%
|
33
|
%
|
35
|
%
|
|||||
|
Weighted average fair value at grant date
|
$
|
126.50
|
|
$
|
146.26
|
|
$
|
116.03
|
|
||
|
Total share-based compensation expense (in millions)
|
$
|
157.4
|
|
$
|
139.9
|
|
$
|
128.3
|
|
||
|
EMPLOYEE STOCK PURCHASE PLAN
|
|
|
|
||||||||
|
Average risk free interest rate
|
0.2
|
%
|
0.2
|
%
|
0.3
|
%
|
|||||
|
Average expected term (years)
|
1.3
|
|
1.3
|
|
1.3
|
|
|||||
|
Average volatility
|
34
|
%
|
32
|
%
|
33
|
%
|
|||||
|
Weighted average fair value at grant date
|
$
|
153.33
|
|
$
|
138.61
|
|
$
|
99.94
|
|
||
|
Total share-based compensation expense (in millions)
|
$
|
11.5
|
|
$
|
13.4
|
|
$
|
8.1
|
|
||
As share-based compensation expense recognized in the Consolidated Statements of Income during the years ended
December 31, 2013
,
2012
, and
2011
is based on awards ultimately expected to vest, it has been reduced for estimated forfeitures. Stock compensation accounting requires forfeitures to be estimated at the time of grant and revised, if necessary, in subsequent periods if actual forfeitures differ from those estimated.
As of
December 31, 2013
, there was
$290.5 million
and
$19.5 million
, of total unrecognized compensation expense related to non-vested stock options and employee stock purchases, respectively. The unrecognized compensation expenses are expected to be recognized over a weighted average period of
2.5
years for non-vested stock options and
1.6
years for employee stock purchases.
Excess tax benefits are realized tax deductions for exercised options in excess of the deferred tax asset attributable to stock compensation costs for such options. Excess tax benefits of
$38.0 million
,
$94.2 million
, and
$58.8 million
for the years ended
December 31, 2013
,
2012
, and
2011
, respectively, have been classified as a financing cash inflow. The total income tax benefit recognized in the consolidated statements of income for share-based compensation costs was
$58.5 million
,
$47.5 million
, and
$42.9 million
for the years ended
December 31, 2013
,
2012
, and
2011
, respectively.
Income before provision for income taxes for the years ended
December 31, 2013
,
2012
, and
2011
consisted of the following (in millions):
|
|
Years Ended December 31,
|
||||||||||
|
|
2013
|
2012
|
2011
|
||||||||
|
U.S
|
$
|
612.5
|
|
$
|
718.5
|
|
$
|
540.3
|
|
||
|
Foreign
|
258.4
|
|
175.4
|
|
169.4
|
|
|||||
|
Total income before provision for income taxes
|
$
|
870.9
|
|
$
|
893.9
|
|
$
|
709.7
|
|
||
77
The provision for income taxes for the years ended
December 31, 2013
,
2012
, and
2011
consisted of the following (in millions):
|
|
Years Ended December 31,
|
||||||||||
|
|
2013
|
2012
|
2011
|
||||||||
|
Current
|
|||||||||||
|
Federal
|
$
|
216.8
|
|
$
|
239.9
|
|
$
|
195.7
|
|
||
|
State
|
17.4
|
|
17.0
|
|
8.1
|
|
|||||
|
Foreign
|
4.3
|
|
3.4
|
|
3.7
|
|
|||||
|
$
|
238.5
|
|
$
|
260.3
|
|
$
|
207.5
|
|
|||
|
Deferred
|
|||||||||||
|
Federal
|
$
|
(36.2
|
)
|
$
|
(20.6
|
)
|
$
|
6.8
|
|
||
|
State
|
(1.9
|
)
|
(1.2
|
)
|
0.4
|
|
|||||
|
Foreign
|
(0.5
|
)
|
(1.2
|
)
|
(0.1
|
)
|
|||||
|
$
|
(38.6
|
)
|
$
|
(23.0
|
)
|
$
|
7.1
|
|
|||
|
Total income tax expense
|
$
|
199.9
|
|
$
|
237.3
|
|
$
|
214.6
|
|
||
Income tax expense differs from amounts computed by applying the statutory rate of
35%
for the years ended
December 31, 2013
,
2012
, and
2011
as a result of the following (in millions):
|
|
Years Ended December 31,
|
||||||||||
|
|
2013
|
2012
|
2011
|
||||||||
|
Federal tax at statutory rate
|
$
|
304.8
|
|
$
|
312.9
|
|
$
|
248.3
|
|
||
|
Increase (reduction) in tax resulting from:
|
|||||||||||
|
State taxes, net of federal benefits
|
15.5
|
|
15.8
|
|
8.5
|
|
|||||
|
Foreign rate differential
|
(73.6
|
)
|
(42.8
|
)
|
(47.7
|
)
|
|||||
|
Research and development credit
|
(12.2
|
)
|
—
|
|
(6.6
|
)
|
|||||
|
Share-based compensation not benefited
|
1.9
|
|
5.9
|
|
5.1
|
|
|||||
|
Domestic production activities deduction
|
(9.2
|
)
|
(8.2
|
)
|
—
|
|
|||||
|
Releases due to statute expirations and other
|
(26.7
|
)
|
(46.5
|
)
|
—
|
|
|||||
|
Other
|
(0.6
|
)
|
0.2
|
|
7.0
|
|
|||||
|
$
|
199.9
|
|
$
|
237.3
|
|
$
|
214.6
|
|
|||
Deferred income taxes reflect tax carry forwards and the net tax effects of temporary differences between the carrying amounts of assets and liabilities for financial reporting and the amounts used for income tax purposes. Significant components of the Company’s deferred tax assets are as follows (in millions):
|
|
December 31,
|
||||||
|
|
2013
|
2012
|
|||||
|
Deferred tax assets:
|
|||||||
|
Share-based compensation expense
|
$
|
123.4
|
|
$
|
85.3
|
|
|
|
Expenses deducted in later years for tax purposes
|
30.3
|
|
25.9
|
|
|||
|
Research and other credits
|
5.8
|
|
5.3
|
|
|||
|
Other
|
1.2
|
|
1.2
|
|
|||
|
Gross deferred tax assets
|
$
|
160.7
|
|
$
|
117.7
|
|
|
|
Valuation allowance
|
(7.2
|
)
|
(6.0
|
)
|
|||
|
Deferred tax assets
|
$
|
153.5
|
|
$
|
111.7
|
|
|
|
Deferred tax liabilities:
|
|||||||
|
Fixed assets
|
$
|
(16.1
|
)
|
$
|
(12.3
|
)
|
|
|
Identified intangible assets related to acquisitions
|
(1.9
|
)
|
(2.2
|
)
|
|||
|
Other
|
(2.1
|
)
|
(3.8
|
)
|
|||
|
Deferred tax liabilities
|
$
|
(20.1
|
)
|
$
|
(18.3
|
)
|
|
|
Net deferred tax assets
|
$
|
133.4
|
|
$
|
93.4
|
|
|
78
The Company has not provided U.S. income taxes and foreign withholding taxes on the undistributed earnings of its foreign subsidiaries as of
December 31, 2013
because the Company intends to indefinitely reinvest such earnings outside the U.S. If these foreign earnings were to be repatriated in the future, the related U.S. tax liability may be reduced by any foreign income taxes previously paid on these earnings. As of
December 31, 2013
, the cumulative amount of earnings upon which U.S. income taxes have not been provided is approximately
$707.9 million
. Determination of the amount of unrecognized deferred tax liability related to these earnings is not practicable at this time. The Company has a tax holiday in effect for its business operations in Switzerland which will continue until the end of year 2017 to the extent certain terms and conditions continue to be met. This tax holiday provides for a lower rate of taxation in Switzerland based on various thresholds of investment and employment in such jurisdiction. The Company has been in compliance with the terms of the holiday.
As of
December 31, 2013
and
2012
, the Company had valuation allowances of
$7.2 million
and
$6.0 million
, respectively, primarily related to California deferred tax assets generated by California R&D credit forwards which have no expiration period. The Company recorded a valuation allowance against its California deferred tax assets as it is more likely than not these deferred tax assets will not be realized as a result of the computation of California taxes under the single sales factor. We will continue to monitor and reassess the need for further increases or decreases to the valuation allowance.
The Company recorded a net decrease of its gross unrecognized tax benefits of approximately
$14.0 million
during the year ended
December 31, 2013
. The net decrease was primarily related to the reversal of gross unrecognized tax benefits of
$35.3 million
in connection with the expiration of certain statutes of limitations in multiple jurisdictions in the second half of
2013
and certain audit settlements, partially offset by increases during the year
2013
related to other uncertain tax positions. The Company had gross unrecognized tax benefits of approximately
$74.0 million
,
$88.0 million
, and
$98.1 million
as of
December 31, 2013
,
2012
, and
2011
, respectively, of which
$74.0 million
,
$83.8 million
, and
$93.8 million
, if recognized would result in a reduction of the Company’s effective tax rate during the years ended
December 31, 2013
,
2012
, and
2011
, respectively. The Company included interest expense and penalties accrued on unrecognized tax benefits as a component of its income tax expense. As of
December 31, 2013
,
2012
, and
2011
, gross interest and penalties related to unrecognized tax benefits accrued was approximately
$3.4 million
,
$3.2 million
, and
$7.9 million
, respectively, and a net increase of
$0.2 million
was included in our
2013
income tax expense as a result of the current year increases offset by the decreases associated with the above-mentioned decreases in unrecognized tax benefits. The Company classified a majority of its net unrecognized tax benefits and related interest in “Other accrued liabilities” on the Consolidated Balance Sheets.
A reconciliation of the beginning and ending amounts of gross unrecognized income tax benefits for the years ended
December 31, 2013
,
2012
, and
2011
are as follows (in millions):
|
|
Years Ended December 31,
|
||||||||||
|
|
2013
|
2012
|
2011
|
||||||||
|
Beginning balance
|
$
|
88.0
|
|
$
|
98.1
|
|
$
|
78.9
|
|
||
|
Increases related to tax positions taken during the current year
|
22.8
|
|
17.5
|
|
18.1
|
|
|||||
|
Increases related to tax positions taken during a prior year
|
—
|
|
12.9
|
|
1.1
|
|
|||||
|
Decreases related to tax positions taken during a prior year
|
(1.5
|
)
|
(8.3
|
)
|
—
|
|
|||||
|
Decreases related to settlements with tax authorities
|
(6.0
|
)
|
—
|
|
—
|
|
|||||
|
Decreases related to expiration of statute of limitations
|
(29.3
|
)
|
(32.2
|
)
|
—
|
|
|||||
|
Ending balance
|
$
|
74.0
|
|
$
|
88.0
|
|
$
|
98.1
|
|
||
The Company files federal, state and foreign income tax returns in many jurisdictions in the United States and abroad. Generally, years before 2010 are closed for most significant jurisdictions except for California, for which years before 2008 were considered closed. Certain of the Company’s unrecognized tax benefits could reverse based on the normal expiration of various statutes of limitations, which could affect the Company’s effective tax rate in the period in which they reverse.
The Company is subject to the examination of its income tax returns by the Internal Revenue Service and other tax authorities. The outcome of these audits cannot be predicted with certainty. Management regularly assesses the likelihood of adverse outcomes resulting from these examinations to determine the adequacy of the Company’s provision for income taxes. If any issues addressed in the Company’s tax audits are resolved in a manner not consistent with management’s expectations, the Company could be required to adjust its provision for income taxes in the period such resolution occurs.
79
The following table presents the computation of basic and diluted net income per share (in millions, except per share amounts):
|
|
Years Ended December 31,
|
||||||||||
|
|
2013
|
2012
|
2011
|
||||||||
|
Net income
|
$
|
671.0
|
|
$
|
656.6
|
|
$
|
495.1
|
|
||
|
Basic:
|
|||||||||||
|
Weighted-average shares outstanding
|
39.2
|
|
39.8
|
|
39.2
|
|
|||||
|
Basic net income per share
|
$
|
17.12
|
|
$
|
16.50
|
|
$
|
12.63
|
|
||
|
Diluted:
|
|||||||||||
|
Weighted-average shares outstanding used in basic calculation
|
39.2
|
|
39.8
|
|
39.2
|
|
|||||
|
Add: Dilutive potential shares
|
0.9
|
|
1.3
|
|
1.0
|
|
|||||
|
Weighted-average shares used in computing diluted net income per share
|
40.1
|
|
41.1
|
|
40.2
|
|
|||||
|
Diluted net income per share
|
$
|
16.73
|
|
$
|
15.98
|
|
$
|
12.32
|
|
||
Employee stock options to purchase approximately
2.3 million
,
0.9 million
, and
2.1 million
shares for the years ended
December 31, 2013
,
2012
, and
2011
, respectively, were outstanding, but were not included in the computation of diluted net income per share because the effect of including such shares would have been antidilutive in the periods presented.
The Company sponsors various retirement plans for its eligible U.S. and non-U.S. employees. For employees in the U.S., the Company maintains the Intuitive Surgical, Inc. 401(k) Plan (the “Plan”). As allowed under Section 401(k) of the Internal Revenue Code, the Plan provides tax-deferred salary contributions for eligible U.S. employees. The Plan allows employees to contribute up to
75%
of their annual compensation to the Plan on a pre-tax and after-tax basis. Employee contributions are limited to a maximum annual amount as set periodically by the Internal Revenue Code. Employer matching contributions are made solely at the Company’s discretion.
No
employer matching contributions were made to the Plan during the years ended
December 31, 2013
,
2012
, and
2011
.
80
|
|
2013
|
||||||||||||||
|
|
Q1
|
Q2
|
Q3
|
Q4
|
|||||||||||
|
Revenue
|
$
|
611.4
|
|
$
|
578.5
|
|
$
|
499.0
|
|
$
|
576.2
|
|
|||
|
Gross profit
|
$
|
434.3
|
|
$
|
405.2
|
|
$
|
356.7
|
|
$
|
398.0
|
|
|||
|
Net income
(1)
|
$
|
188.9
|
|
$
|
159.1
|
|
$
|
156.8
|
|
$
|
166.2
|
|
|||
|
Net income per common share
|
|||||||||||||||
|
Basic
|
$
|
4.69
|
|
$
|
3.99
|
|
$
|
4.06
|
|
$
|
4.36
|
|
|||
|
Diluted
|
$
|
4.56
|
|
$
|
3.90
|
|
$
|
3.99
|
|
$
|
4.28
|
|
|||
|
(1) Includes one-time discrete tax benefits as follows:
|
|||||||||||||||
|
Expiration of the statutes of limitations in multiple jurisdictions
|
$
|
—
|
|
$
|
—
|
|
$
|
26.2
|
|
$
|
0.5
|
|
|||
|
Reinstatement of the 2012 federal R&D tax credit
|
$
|
7.5
|
|
$
|
—
|
|
$
|
—
|
|
$
|
0.7
|
|
|||
|
|
2012
|
||||||||||||||
|
|
Q1
|
Q2
|
Q3
|
Q4
|
|||||||||||
|
Revenue
|
$
|
495.2
|
|
$
|
536.5
|
|
$
|
537.8
|
|
$
|
609.3
|
|
|||
|
Gross profit
|
$
|
355.9
|
|
$
|
386.4
|
|
$
|
390.1
|
|
$
|
437.9
|
|
|||
|
Net income
(1)
|
$
|
143.5
|
|
$
|
154.9
|
|
$
|
183.3
|
|
$
|
174.9
|
|
|||
|
Net income per common share
|
|||||||||||||||
|
Basic
|
$
|
3.63
|
|
$
|
3.88
|
|
$
|
4.59
|
|
$
|
4.37
|
|
|||
|
Diluted
|
$
|
3.50
|
|
$
|
3.75
|
|
$
|
4.46
|
|
$
|
4.25
|
|
|||
|
(1) Includes one-time discrete tax benefits as follows:
|
|||||||||||||||
|
Expiration of the statutes of limitations in multiple jurisdictions
|
$
|
—
|
|
$
|
—
|
|
$
|
38.0
|
|
$
|
—
|
|
|||
|
Benefit from new IRS guidance relating to the Section 199 Domestic Production Deduction
|
$
|
8.5
|
|
$
|
—
|
|
$
|
—
|
|
$
|
—
|
|
|||
81
SCHEDULE II
INTUITIVE SURGICAL, INC.
VALUATION AND QUALIFYING ACCOUNTS
(IN MILLIONS)
|
Balance at
Beginning of
Year
|
Additions
|
Deductions
(1)
|
Balance at
End of Year
|
||||||||||||
|
Allowance for doubtful accounts and sales returns
|
|||||||||||||||
|
Year ended December 31, 2013
|
$
|
8.0
|
|
$
|
14.1
|
|
$
|
(16.3
|
)
|
$
|
5.8
|
|
|||
|
Year ended December 31, 2012
|
$
|
5.6
|
|
$
|
15.0
|
|
$
|
(12.6
|
)
|
$
|
8.0
|
|
|||
|
Year ended December 31, 2011
|
$
|
4.8
|
|
$
|
12.3
|
|
$
|
(11.5
|
)
|
$
|
5.6
|
|
|||
|
(1)
|
Primarily represents amounts returned.
|
82
|
ITEM 9.
|
CHANGES IN AND DISAGREEMENTS WITH ACCOUNTANTS ON ACCOUNTING AND FINANCIAL DISCLOSURES
|
None.
|
ITEM 9A.
|
CONTROLS AND PROCEDURES
|
Conclusion Regarding the Effectiveness of Disclosure Controls and Procedures
We maintain disclosure controls and procedures that are designed to ensure that information required to be disclosed in our Exchange Act reports is recorded, processed, summarized and reported within the time periods specified in the Securities and Exchange Commission’s rules and forms and that such information is accumulated and communicated to our management, including our principal executive officer and principal financial officer, as appropriate, to allow for timely decisions regarding required disclosure.
As required by SEC Rule 13a-15(b), we carried out an evaluation, under the supervision and with the participation of our management, including our principal executive officer and principal financial officer, of the effectiveness of the design and operation of our disclosure controls and procedures as of the end of the period covered by this Annual Report on Form 10-K. Based on the foregoing, our principal executive officer and principal financial officer concluded that our disclosure controls and procedures were effective at the reasonable assurance level.
Inherent Limitations Over Internal Controls
Our internal control over financial reporting is designed to provide reasonable assurance regarding the reliability of financial reporting and the preparation of financial statements for external purposes in accordance with U.S. GAAP. Our internal control over financial reporting includes those policies and procedures that:
|
(i)
|
pertain to the maintenance of records that, in reasonable detail, accurately and fairly reflect the transactions and dispositions of our assets;
|
|
(ii)
|
provide reasonable assurance that transactions are recorded as necessary to permit preparation of financial statements in accordance with U.S. GAAP, and that our receipts and expenditures are being made only in accordance with authorizations of our management and directors; and
|
|
(iii)
|
provide reasonable assurance regarding prevention or timely detection of unauthorized acquisition, use, or disposition of our assets that could have a material effect on the financial statements.
|
Management, including our principal executive officer and principal financial officer, does not expect that our internal controls will prevent or detect all errors and all fraud. A control system, no matter how well designed and operated, can provide only reasonable, not absolute, assurance that the objectives of the control system are met. Further, the design of a control system must reflect the fact that there are resource constraints, and the benefits of controls must be considered relative to their costs. Because of the inherent limitations in all control systems, no evaluation of internal controls can provide absolute assurance that all control issues and instances of fraud, if any, have been detected. Also, any evaluation of the effectiveness of controls in future periods are subject to the risk that those internal controls may become inadequate because of changes in business conditions, or that the degree of compliance with the policies or procedures may deteriorate.
Management’s Report on Internal Control Over Financial Reporting
Our management is responsible for establishing and maintaining adequate internal control over financial reporting, as such term is defined in Exchange Act Rules 13a-15(f). Under the supervision and with the participation of our management, including our principal executive officer and principal financial officer, we conducted an evaluation of the effectiveness of our internal control over financial reporting based on the framework in Internal Control—1992 Integrated Framework issued by the Committee of Sponsoring Organizations of the Treadway Commission. Based on our evaluation under the 1992 framework in Internal Control—Integrated Framework, our management concluded that our internal control over financial reporting was effective as of December 31,
2013
.
The effectiveness of our internal control over financial reporting as of December 31,
2013
has been audited by an independent registered public accounting firm, as stated in their report, which is included herein.
Changes in Internal Control Over Financial Reporting
There were no changes in our internal control over financial reporting that occurred during the quarter ended December 31,
2013
that have materially affected, or are reasonably likely to materially affect, our internal control over financial statements.
83
REPORT OF INDEPENDENT REGISTERED PUBLIC ACCOUNTING FIRM
The Board of Directors and Stockholders of Intuitive Surgical, Inc.
We have audited Intuitive Surgical, Inc.’s internal control over financial reporting as of December 31,
2013
, based on criteria established in Internal Control—Integrated Framework issued by the Committee of Sponsoring Organizations of the Treadway Commission (1992 framework) (the COSO criteria). Intuitive Surgical, Inc.’s management is responsible for maintaining effective internal control over financial reporting, and for its assessment of the effectiveness of internal control over financial reporting included in the accompanying Management’s Report on Internal Control Over Financial Reporting. Our responsibility is to express an opinion on the company’s internal control over financial reporting based on our audit.
We conducted our audit in accordance with the standards of the Public Company Accounting Oversight Board (United States). Those standards require that we plan and perform the audit to obtain reasonable assurance about whether effective internal control over financial reporting was maintained in all material respects. Our audit included obtaining an understanding of internal control over financial reporting, assessing the risk that a material weakness exists, testing and evaluating the design and operating effectiveness of internal control based on the assessed risk, and performing such other procedures as we considered necessary in the circumstances. We believe that our audit provides a reasonable basis for our opinion.
A company’s internal control over financial reporting is a process designed to provide reasonable assurance regarding the reliability of financial reporting and the preparation of financial statements for external purposes in accordance with generally accepted accounting principles. A company’s internal control over financial reporting includes those policies and procedures that (1) pertain to the maintenance of records that, in reasonable detail, accurately and fairly reflect the transactions and dispositions of the assets of the company; (2) provide reasonable assurance that transactions are recorded as necessary to permit preparation of financial statements in accordance with generally accepted accounting principles, and that receipts and expenditures of the company are being made only in accordance with authorizations of management and directors of the company; and (3) provide reasonable assurance regarding prevention or timely detection of unauthorized acquisition, use or disposition of the company’s assets that could have a material effect on the financial statements.
Because of its inherent limitations, internal control over financial reporting may not prevent or detect misstatements. Also, projections of any evaluation of effectiveness to future periods are subject to the risk that controls may become inadequate because of changes in conditions, or that the degree of compliance with the policies or procedures may deteriorate.
In our opinion, Intuitive Surgical, Inc. maintained, in all material respects, effective internal control over financial reporting as of December 31,
2013
, based on the COSO criteria.
We also have audited, in accordance with the standards of the Public Company Accounting Oversight Board (United States), the consolidated balance sheets of Intuitive Surgical, Inc. as of December 31,
2013
and
2012
and the related consolidated statements of income, comprehensive income, stockholders’ equity and cash flows for each of the three years in the period ended December 31,
2013
, and the financial statement schedule listed in the index at Item 15(a) and our report dated
February 3, 2014
, expressed an unqualified opinion thereon.
/s/ E
RNST
& Y
OUNG
LLP
San Francisco, California
February 3, 2014
84
|
ITEM 9B.
|
OTHER INFORMATION
|
None.
Certain information required by Part III is omitted from this Report on Form 10-K and is incorporated herein by reference to our definitive Proxy Statement for our next Annual Meeting of Stockholders (the “Proxy Statement”), which we intend to file pursuant to Regulation 14A of the Securities Exchange Act of 1934, as amended, within 120 days after December 31,
2013
.
|
ITEM 10.
|
DIRECTORS, EXECUTIVE OFFICERS AND CORPORATE GOVERNANCE
|
The information required by this item concerning our directors and corporate governance is incorporated by reference to the information set forth in the section titled “Directors and Corporate Governance” in our Proxy Statement. Information required by this item concerning our executive officers is incorporated by reference to the information set forth in the section entitled “Executive Officers of the Company” in our Proxy Statement. Information regarding our Section 16 reporting compliance is incorporated by reference to the information set forth in the section entitled “Security Ownership of Certain Beneficial Owners and Management and Related Stockholder Matters” in our Proxy Statement.
|
ITEM 11.
|
EXECUTIVE COMPENSATION
|
The information required by this item regarding executive compensation is incorporated by reference to the information set forth in the sections titled “Executive Compensation” and “Compensation for Directors” in our Proxy Statement.
|
ITEM 12.
|
SECURITY OWNERSHIP OF CERTAIN BENEFICIAL OWNERS AND MANAGEMENT AND RELATED STOCKHOLDER MATTERS
|
The information required by this item regarding security ownership of certain beneficial owners and management is incorporated by reference to the information set forth in the section titled “Security Ownership of Certain Beneficial Owners and Management and Related Stockholder Matters” in our Proxy Statement.
|
ITEM 13.
|
CERTAIN RELATIONSHIPS AND RELATED TRANSACTIONS AND DIRECTOR INDEPENDENCE
|
The information required by this item regarding certain relationships and related transactions and director independence is incorporated by reference to the information set forth in the sections titled “Certain Relationships and Related Transactions” and “Directors and Corporate Governance” in our Proxy Statement.
|
ITEM 14.
|
PRINCIPAL ACCOUNTANT FEES AND SERVICES
|
The information required by this item regarding principal accountant fees and services is incorporated by reference to the information set forth in the section titled “Principal Accountant Fees and Services” in our Proxy Statement.
85
|
ITEM 15.
|
EXHIBITS AND FINANCIAL STATEMENT SCHEDULE
|
|
(a)
|
The following documents are filed as part of this Annual Report on Form 10-K
|
|
1)
|
Financial Statements—See Index to Consolidated Financial Statements at Item 8 of this Report on Form 10-K.
|
|
2)
|
The following financial statement schedule of Intuitive Surgical, Inc. is filed as part of this Report and should be read in conjunction with the financial statements of Intuitive Surgical:
|
Schedule II: Valuation and Qualifying Accounts.
All other schedules have been omitted because they are not applicable, not required under the instructions, or the information requested is set forth in the consolidated financial statements or related notes thereto.
|
3)
|
Exhibits
|
The exhibits filed as part of this report are listed under “Exhibits” at subsection (b) of this Item 15.
(b)
Exhibits
86
EXHIBIT INDEX
|
3.1(1)
|
Amended and Restated Certificate of Incorporation of the Company.
|
|
|
3.2(1)
|
Certificate of Amendment to Amended and Restated Certificate of Incorporation of the Company.
|
|
|
3.3(2)
|
Certificate of Amendment to Amended and Restated Certificate of Incorporation of the Company.
|
|
|
3.4(3)
|
Amended and Restated Bylaws of the Company.
|
|
|
4.1(4)
|
Specimen Stock Certificate.
|
|
|
10.1(4)
|
Form of Indemnity Agreement.
|
|
|
10.2(4)
|
2000 Equity Incentive Plan.
|
|
|
10.3(4)
|
2000 Non-Employee Directors’ Stock Option Plan.
|
|
|
10.4(4)
|
2000 Employee Stock Purchase Plan.
|
|
|
10.5(5)
|
2009 Employment Commencement Incentive Plan, as amended and restated.
|
|
|
10.6(6)
|
2010 Incentive Award Plan, as amended and restated.
|
|
|
10.7(7)
|
Severance Plan.
|
|
|
10.8(8)
|
Third Amendment effective as of July 1, 2010, to Employment Agreement between the Company and Lonnie M. Smith, dated February 28, 1997.
|
|
|
10.9(9)
|
Form of Intuitive Surgical, Inc. 2000 Equity Incentive Plan Stock Option Agreement (Incentive and Nonstatutory Stock Options).
|
|
|
21.1(5)
|
Intuitive Surgical, Inc. subsidiaries.
|
|
|
23.1(5)
|
Consent of Independent Registered Public Accounting Firm.
|
|
|
31.1(5)
|
Certification of Principal Executive Officer.
|
|
|
31.2(5)
|
Certification of Principal Financial Officer.
|
|
|
32.1(5)
|
Certification of Chief Executive Officer and Principal Financial Officer Pursuant to 18 U.S.C. Section 1350, As Adopted Pursuant to Section 906 of the Sarbanes-Oxley Act of 2002.
|
|
|
101(5)
|
The following materials from Intuitive Surgical, Inc.’s Annual Report on Form 10-K for the year ended December 31, 2013, formatted in XBRL (Extensible Business Reporting Language): (i) Consolidated Balance Sheets, (ii) Consolidated Statements of Income, (iii) Consolidated Statement of Stockholders’ Equity, (iv) Consolidated Statements of Cash Flows, and (v) Notes to Consolidated Financial Statements, tagged at Level I through IV.
|
|
|
(1)
|
Incorporated by reference to exhibits filed with the Company’s 2008 Annual Report on Form 10-K filed February 6, 2009 (File No. 000-30713).
|
|
(2)
|
Incorporated by reference to Exhibit A filed with the Company’s Definitive Proxy Statement on Schedule 14A filed March 1, 2012 (File No. 000-30713).
|
|
(3)
|
Incorporated by reference to Exhibit 3.1 filed with the Company’s Current Report on Form 8-K filed April 24, 2012 (File No. 000-30713).
|
|
(4)
|
Incorporated by reference to exhibits filed with the Company’s Registration Statement on Form S-1 filed March 22, 2000 (File No. 333-33016).
|
|
(5)
|
Filed herewith.
|
|
(6)
|
Incorporated by reference to Exhibit 4.1 filed with the Company’s Registration Statement on Form S-8 filed June 17, 2013 (File No. 333-189399).
|
|
(7)
|
Incorporated by reference to Exhibit 10.1 filed with the Company’s Current Report on Form 8-K filed December 2, 2008 (File No. 000-30713).
|
|
(8)
|
Incorporated by reference to Exhibit 10.1 filed with the Company’s Current Report on Form 8-K filed July 26, 2010 (File No. 000-30713).
|
|
(9)
|
Incorporated by reference to Exhibit 10.2 filed with the Company’s Quarterly Report on Form 10-Q filed July 23, 2009 (File No. 000-30713).
|
87
SIGNATURES
Pursuant to the requirements of Section 13 or 15(d) of the Securities Exchange Act of 1934, the registrant has duly caused this report to be signed on its behalf by the undersigned thereunto duly authorized.
|
INTUITIVE SURGICAL, INC.
|
||
|
(Registrant)
|
||
|
By:
|
/
S
/ G
ARY
S. G
UTHART
|
|
|
Gary S. Guthart, Ph.D.
President and Chief Executive Officer
|
||
Date:
February 3, 2014
Pursuant to the requirements of the Securities Exchange Act of 1934, this report has been signed below by the following persons on behalf of the Registrant and in the capacities and on the dates indicated.
|
Signature
|
Title
|
Date
|
||
|
/
S
/ G
ARY
S. G
UTHART
|
President, Chief Executive Officer and Director (Principal Executive Officer)
|
February 3, 2014
|
||
|
Gary S. Guthart, Ph.D.
|
||||
|
/
S
/ M
ARSHALL
L. M
OHR
|
Senior Vice President and Chief Financial Officer (Principal Financial Officer)
|
February 3, 2014
|
||
|
Marshall L. Mohr
|
||||
|
/S/ J
AMIE
E. S
AMATH
|
Vice President, Corporate Controller, and Principal Accounting Officer
|
February 3, 2014
|
||
|
Jamie E. Samath
|
||||
|
/
S
/ L
ONNIE
M. S
MITH
|
Chairman of the Board of Directors
|
February 3, 2014
|
||
|
Lonnie M. Smith
|
||||
|
/
S
/ C
RAIG
H. B
ARRATT
|
Director
|
February 3, 2014
|
||
|
Craig H. Barratt, Ph.D.
|
||||
|
/
S
/ A
MAL
M. J
OHNSON
|
Director
|
February 3, 2014
|
||
|
Amal M. Johnson
|
||||
|
/
S
/ E
RIC
H. H
ALVORSON
|
Director
|
February 3, 2014
|
||
|
Eric H. Halvorson
|
||||
|
/
S
/ A
LAN
J. L
EVY
|
Director
|
February 3, 2014
|
||
|
Alan J. Levy, Ph.D.
|
||||
|
/
S
/ F
LOYD
D. L
OOP
|
Director
|
February 3, 2014
|
||
|
Floyd D. Loop, M.D.
|
||||
|
/
S
/ M
ARK
J. R
UBASH
|
Director
|
February 3, 2014
|
||
|
Mark J. Rubash
|
||||
|
/
S
/ G
EORGE
S
TALK
J
R
.
|
Director
|
February 3, 2014
|
||
|
George Stalk Jr.
|
||||
88
TABLE OF CONTENTS
Part IItem 1. BusinessItem 1A. Risk FactorsItem 1B. Unresolved Staff CommentsItem 2. PropertiesItem 3. Legal ProceedingsItem 4. Mine Safety DisclosuresPart IIItem 5. Market For Registrant S Common Equity, Related Stockholder Matters and Issuer Purchases Of Equity SecuritiesItem 6. Selected Financial DataItem 7. Management's Discussion and Analysis Of Financial Condition and Results Of OperationsItem 7A. Quantitative and Qualitative Disclosures About Market RiskItem 8. Financial Statements and Supplementary DataNote 1. Description Of The BusinessNote 2. Summary Of Significant Accounting PoliciesNote 8. Share-based Compensation,Note 3. Financial InstrumentsNote 4. Balance Sheet DetailsNote 5. Goodwill and Intangible AssetsNote 6. Commitments and ContingenciesNote 7. Stockholders EquityNote 8. Share-based CompensationNote 9. Income TaxesNote 10. Net Income Per ShareNote 11. Employee Benefit PlansItem 9. Changes in and Disagreements with Accountants on Accounting and Financial DisclosuresItem 9A. Controls and ProceduresItem 9B. Other InformationPart IIIItem 10. Directors, Executive Officers and Corporate GovernanceItem 11. Executive CompensationItem 12. Security Ownership Of Certain Beneficial Owners and Management and Related Stockholder MattersItem 13. Certain Relationships and Related Transactions and Director IndependenceItem 14. Principal Accountant Fees and ServicesPart IVItem 15. Exhibits and Financial Statement Schedule