INTEGER HOLDINGS CORP
10-Ks and 10-Qs
|
|
|
|
|
|
|
|
|
|
|
|
|
|
|
|
|
|
|
|
|
|
|
|
|
|
|
|
|
|
|
|
|
|
|
|
|
|
|
|
|
|
|
|
|
|
|
|
|
|
|
|
|
UNITED STATES
SECURITIES AND EXCHANGE COMMISSION
Washington, D.C. 20549
_____________________________________
FORM 10-K
_____________________________________
ANNUAL REPORT PURSUANT TO SECTION 13 or 15(d)
OF THE SECURITIES EXCHANGE ACT OF 1934
For The Fiscal Year Ended
January 2, 2015
Commission File Number 1-16137
_____________________________________
GREATBATCH, INC.
(Exact name of Registrant as specified in its charter)
_____________________________________
|
Delaware
|
|
16-1531026
|
|
(State of
Incorporation)
|
|
(I.R.S. Employer
Identification No.)
|
2595 Dallas Parkway
Suite 310
Frisco, Texas 75034
(Address of principal executive offices)
(716) 759-5600
(Registrant’s telephone number, including area code)
Securities Registered Pursuant to Section 12(b) of the Act:
|
Title of Each Class:
|
|
Name of Each Exchange on Which Registered:
|
|
Common Stock, Par Value $0.001 Per Share
|
|
New York Stock Exchange
|
Securities Registered Pursuant to Section 12(g) of the Act: None
Indicate by check mark if the registrant is a well-known seasoned issuer, as defined in Rule 405 of the Securities Act. Yes
x
No
¨
Indicate by check mark if the registrant is not required to file reports pursuant to Section 13 or Section 15(d) of the Act. Yes
¨
No
x
Indicate by check mark whether the registrant (1) has filed all reports required to be filed by Section 13 or 15(d) of the Securities Exchange Act of 1934 during the preceding 12 months (or for such shorter period that the registrant was required to file such reports), and (2) has been subject to such filing requirements for the past 90 days. Yes
x
No
¨
Indicate by checkmark whether the registrant has submitted electronically and posted on its corporate Web site, if any, every Interactive Data File required to be submitted and posted pursuant to Rule 405 of Regulation S-T (§232.405 of this chapter) during the preceding 12 months (or for such shorter period that the registrant was required to submit and post such files). Yes
x
No
¨
Indicate by check mark if disclosure of delinquent filers pursuant to Item 405 of Regulation S-K (§229.405 of this chapter) is not contained herein, and will not be contained, to the best of registrant’s knowledge, in definitive proxy or information statements incorporated by reference in Part III of this Form 10-K or any amendment to this Form 10-K.
¨
Indicate by check mark whether the registrant is a large accelerated filer, an accelerated filer, a non-accelerated filer, or a smaller reporting company. See the definitions of “large accelerated filer,” “accelerated filer” and “smaller reporting company” in Rule 12b-2 of the Exchange Act.
|
Large accelerated filer
|
x
|
Accelerated filer
|
¨
|
|
|
Non-accelerated filer
|
¨
|
Smaller reporting company
|
¨
|
|
Indicate by check mark whether the registrant is a shell company (as defined in Rule 12b-2 of the Act). Yes
¨
No
x
The aggregate market value of common stock held by non-affiliates as of July 3, 2014 (the last business day of the registrant’s most recently completed second fiscal quarter), based on the last sale price of $49.58, as reported on the New York Stock Exchange on that date: $1,212 million. Solely for the purpose of this calculation, shares held by directors and officers and 10 percent shareholders of the registrant have been excluded. This exclusion should not be deemed a determination by or an admission that these individuals are, in fact, affiliates of the registrant.
Shares of common stock outstanding as of
March 3, 2015
: 25,354,051
DOCUMENTS INCORPORATED BY REFERENCE
Portions of the following document are specifically incorporated by reference into the indicated parts of this report:
|
Document
|
Part
|
|
|
Proxy Statement for the 2015 Annual Meeting of Stockholders
|
Part III, Item 10
“Directors, Executive Officers and Corporate Governance”
|
|
|
Part III, Item 11
“Executive Compensation”
|
||
|
Part III, Item 12
“Security Ownership of Certain Beneficial Owners and Management and Related Stockholder Matters”
|
||
|
Part III, Item 13
“Certain Relationships and Related Transactions, and Director Independence”
|
||
|
Part III, Item 14
“Principal Accountant Fees and Services”
|
||
TABLE OF CONTENTS
|
ITEM
NUMBER
|
PAGE
NUMBER
|
-
2
-
|
ITEM 1.
|
BUSINESS
|
|
OVERVIEW
Greatbatch, Inc. was founded in 1970 and is a Delaware corporation formed in 1997. When used in this report, the terms “Greatbatch,” “we,” “us,” “our” and the “Company” mean Greatbatch, Inc. and its subsidiaries. The Company conducted its initial public offering in 2000.
We operate our Company in two reportable segments: Greatbatch Medical and QiG Group (“QiG”). Greatbatch Medical designs and manufactures products where Greatbatch either owns the intellectual property or has unique manufacturing and assembly expertise. These products include medical devices and components for the cardiac, neuromodulation, orthopaedics, portable medical, vascular and energy markets among others. The Greatbatch Medical segment also offers value-added assembly and design engineering services for medical devices that utilize its component products.
QiG focuses on developing medical device systems for some of healthcare’s most pressing challenges and reflects Greatbatch’s strategic evolution of its product offerings in order to raise the growth and profitability profile of the Company. QiG utilizes a disciplined and diversified portfolio approach with three investment modes: new medical device systems commercialization, collaborative programs with OEM customers, and strategic equity positions in emerging healthcare companies.
The Company’s customers include large multi-national original equipment manufacturers (“OEMs”).
Since formation, Greatbatch has completed the following acquisitions either directly or indirectly through one of its subsidiaries:
|
Acquisition Date
|
Acquired Company
|
Business at Time of Acquisition
|
|
|
July 1997
|
Wilson Greatbatch Ltd.
|
Founded in 1970, designed and manufactured batteries for implantable medical and commercial applications.
|
|
|
August 1998
|
Hittman Materials and Medical Components, Inc.
|
Founded in 1962, designed and manufactured ceramic and glass feedthroughs and specialized porous coatings for electrodes used in implantable medical devices (“IMDs”).
|
|
|
August 2000
|
Battery Engineering, Inc.
|
Founded in 1983, designed and manufactured high-energy density batteries for industrial, commercial, military and medical applications.
|
|
|
June 2001
|
Sierra-KD Components division of Maxwell Technologies, Inc.
|
Founded in 1986, designed and manufactured ceramic electromagnetic filtering capacitors and integrated them with wire feedthroughs for use in IMDs as well as military, aerospace and commercial applications.
|
|
|
July 2002
|
Globe Tool and Manufacturing Company, Inc.
|
Founded in 1954, designed and manufactured precision enclosures used in IMDs and commercial products used in the aerospace, electronics and automotive sectors.
|
|
|
March 2004
|
NanoGram Devices Corporation
|
Founded in 1996, developed nanoscale materials for battery and medical device applications.
|
|
|
April 2007
|
BIOMEC, Inc.
|
Established in 1998, provided medical device design and component integration to early-stage and established customers.
|
|
-
3
-
|
Acquisition Date
|
Acquired Company
|
Business at Time of Acquisition
|
|
|
June 2007
|
Enpath Medical, Inc.
|
Founded in 1981, designed, developed, and manufactured venous introducers and dilators, implantable leadwires, steerable sheaths and steerable catheters.
|
|
|
October 2007
|
IntelliSensing LLC
|
Founded in 2005, designed and manufactured battery-powered wireless sensing solutions for commercial applications.
|
|
|
November 2007
|
Quan Emerteq LLC
|
Founded in 1998, designed, developed, and manufactured catheters, stimulation leadwires, microcomponents and assemblies.
|
|
|
November 2007
|
Engineered Assemblies Corporation
|
Founded in 1984, designed and integrated custom battery solutions and electronics focused on rechargeable systems for industrial, commercial, military and portable medical applications.
|
|
|
January 2008
|
P Medical Holding SA
|
Founded in 1994, designed, manufactured and supplied delivery systems, instruments and implants for the orthopaedics industry.
|
|
|
February 2008
|
DePuy Orthopaedics’ Chaumont, France manufacturing facility
|
Manufactured hip and shoulder implants for DePuy Orthopaedics.
|
|
|
December 2011
|
Micro Power Electronics, Inc. (“Micro Power”)
|
Founded in 1990, designed custom battery packs, smart chargers and power supplies for industrial, military and portable medical applications.
|
|
|
February 2012
|
NeuroNexus Technologies, Inc.
(“NeuroNexus”)
|
Founded in 2004, medical device design firm specializing in developing neural interface technology, components and systems.
|
|
|
August 2014
|
Centro de Construcción de Cardioestimuladores del Uruguay (“CCC”)
|
Founded in 1969, an active implantable neuromodulation medical device systems developer and manufacturer that produces a range of medical devices including implantable pulse generators, programmer systems, battery chargers, patient wands and leads.
|
|
FINANCIAL STATEMENT YEAR END
We utilize a fifty-two, fifty-three week fiscal year ending on the Friday nearest December 31. Fiscal years 2014, 2013 and 2012 ended on January 2, 2015, January 3, 2014, and December 28, 2012, respectively. Fiscal year 2014 and 2012 contained fifty-two weeks and fiscal year 2013 contained fifty-three weeks.
SEGMENT INFORMATION
We operate our company in two reportable segments: Greatbatch Medical and QiG. Segment information including sales from external customers, profit or loss, and assets by segment as well as sales from external customers and long-lived assets by geographic area are set forth in Note 19 “Business Segment, Geographic and Concentration Risk Information” of the Notes to Consolidated Financial Statements contained in Item 8 of this report.
Greatbatch Medical
Greatbatch Medical’s products include medical devices and components for the cardiac, neuromodulation, orthopaedics, portable medical, vascular and energy markets among others. A brief description of these products and markets follows:
Cardiac and neuromodulation
– Products include batteries, capacitors, filtered and unfiltered feedthroughs, engineered components, implantable stimulation leads and enclosures used in IMDs. Additionally, we offer value-added assembly for these IMDs. An IMD is an instrument that is surgically inserted into the body to provide diagnosis and/or therapy. One sector of the IMD market is cardiac, which is comprised of devices such as implantable pacemakers, implantable cardioverter defibrillators (“ICD”), cardiac resynchronization therapy (“CRT”) devices, and cardiac resynchronization therapy with backup defibrillation devices (“CRT-D”). Another sector of the IMD market is neuromodulation, which is comprised of pacemaker-type devices that stimulate nerves for the treatment of various conditions. Beyond established therapies for pain control, incontinence, movement disorders (Parkinson’s disease, essential tremor and dystonia) and epilepsy, nerve stimulation for the treatment of other disabilities such as sleep apnea, migraines, obesity and depression has shown promising results.
-
4
-
The following table sets forth the main categories of battery-powered IMDs and the principal illness or symptoms treated by each device:
|
Device
|
Market Size (in billions)
|
Principal Illness or Symptom
|
||
|
Pacemakers
|
$4.0
|
Abnormally slow heartbeat (Bradycardia)
|
||
|
ICDs
|
$3.7
|
Rapid and irregular heartbeat (Tachycardia)
|
||
|
CRT/CRT-Ds
|
$3.0
|
Congestive heart failure
|
||
|
Neurostimulators
|
$2.6
|
Chronic pain, movement disorders, epilepsy, obesity or depression
|
||
|
Cochlear hearing devices
|
$0.8
|
Hearing loss
|
||
IMD systems generally include an implantable pulse generator (“IPG”) and one or more stimulation leads. An IPG is a battery powered device that produces electrical pulses. The lead then carries this electrical pulse from the IPG to the heart, spinal cord or other location in the body. Our portfolio of proprietary technologies, products, and capabilities has been built to provide our cardiac and neuromodulation customers with a single source for the vast majority of the components and subassemblies required to manufacture an IPG or lead, to include complete lead systems. Our investments in research and development has generated proprietary products such as the Q
HR
®
, Q
MR
®
,
and Q
CAPS
TM
primary battery and capacitor lines, which have enabled our OEM partners to make improvements in their system offerings in terms of device reliability, size, longevity and power. Our Xcellion
TM
line of Lithium-Ion rechargeable batteries leverages decades of implantable battery research, development and manufacturing expertise. This line of cells now includes the optional CoreGuard
TM
feature, which enables batteries to discharge to zero volts without performance degradation.
We believe that the cardiac and neuromodulation markets continue to exhibit fundamentals for growth. Factors that are impacting these markets are as follows:
|
•
|
Growing patient population
– Implantable pacemakers and ICDs remain primary therapies for a number of critical clinical conditions, most of which are non-elective in nature. As the prevalence of many of these clinical conditions increase with age, underlying population demographics in developed countries will provide an engine for procedure growth.
|
|
•
|
Focus on emerging markets
– OEMs have increased their focus and investment to expand physicians’ awareness of these life changing therapies, which we believe will result in increased utilization to improve quality of life for more patients globally. These growth initiatives will drive increased utilization of existing cardiac technologies and provide an avenue for new device and technology development as device manufacturers look to develop unique products for these markets.
|
|
•
|
Trends in device features
– IMD evolution continues to favor the development of smaller, longer lasting devices with increased functionality and more physiologic shapes. Innovative battery, capacitor, enclosure, and filtering solutions such as those provided by Greatbatch Medical are critical to the realization of these market needs.
|
|
•
|
Growth within neuromodulation
– Neuromodulation applications continue to grow at a faster pace than traditional markets, and are expected to continue to expand as new therapeutic applications are identified. There continues to be growth in clinical data supporting new applications and a growing focus and excitement from clinicians looking for treatment alternatives for challenging patient conditions that have not been traditionally served by implantable stimulation devices. As many cardiac OEM companies are also OEMs in the neuromodulation market, Greatbatch is well positioned to capitalize on these drivers of market growth based on the strength of existing relationships. Additionally, early stage neuromodulation OEMs have begun to receive CE and FDA approvals for their novel device systems and therapies, further fueling incremental growth in the market and providing new potential partners for Greatbatch technology.
|
|
•
|
Innovative and disruptive technologies
– Three innovative and disruptive device technologies (sub-cutaneous ICDs, leadless pacemakers and injectable loop recorders) continued to receive significant attention from OEMs in 2014. These new device technologies will play an important role in increasing utilization of critical therapy and diagnostic tools globally. Our portfolio of technologies and next generation development efforts are vital to the advancement of these new therapy and diagnostic platforms.
|
Orthopaedics
– Products include hip and shoulder joint reconstruction implants, bone plates and spinal devices, and instruments and delivery systems used in hip and knee replacement, trauma fixation, extremity and spine surgeries. Orthopaedic implants are used in reconstructive surgeries to replace or repair hips, knees and other joints, such as shoulders, ankles and elbows that have deteriorated as a result of disease or injury. Trauma implant systems are used primarily to reattach or stabilize damaged bone or tissue while the body heals. Spinal implant systems are used by orthopaedic surgeons and neurosurgeons in the treatment of degenerative diseases, deformities and injuries in various regions of the spine.
Each implant system typically has an associated instrument set that is used in the surgical procedure to insert that specific implant system. Instruments included in a set vary by implant system. Usually, instrument sets are sterilized after each use and
-
5
-
then reused, however, recent trends are moving towards single use instrumentation. Cases are used to store, transport and arrange implant systems and other medical devices and related surgical instruments. Orthopaedic trays are generally designed to allow for sterilization and re-use after an implant or other surgical procedure is performed. The majority of cases are tailored for specific implant procedures so that the instruments, implants and other devices are arranged to match the order of use in the procedure and are securely held in clearly labeled, custom-formed pockets or brackets.
Many of the factors affecting the orthopaedics market segment are similar to the cardiac and neuromodulation markets and include:
|
•
|
Aging population in developed markets
– Conditions like osteoarthritis and spine degeneration are underlying drivers of a diverse spectrum of reconstructive therapies, and increase significantly with age. Continued growth in the 65+ population, along with an increased desire to remain active, will provide a driver for procedural growth.
|
|
•
|
Rates of obesity
– Rates of obesity globally have continued to rise, and are expected to do so for the foreseeable future. Excess weight exacerbates wear on joints and will drive the need for replacement and revision procedures.
|
|
•
|
New implant and surgical technology
– The orthopaedic market continues to see a growing focus on minimally invasive procedures across a number of sectors including joint reconstruction and spinal fusion, potentially expanding the use of these therapeutic approaches.
|
|
•
|
Growth in emerging markets
– Growing affluence in emerging markets has provided an opportunity for global growth of a number of orthopaedic procedures. Patient populations outside of developed markets continue to be underpenetrated, and investment from large device manufacturers in these markets will provide for procedural growth of established therapies.
|
We estimate that the orthopaedics market represents a $3 billion market opportunity for Greatbatch Medical.
Vascular
– Products include off-the-shelf introducers, steerable sheaths, and components for high performance specialty catheters that deliver minimally invasive therapies to treat disease states such as coronary, neurovascular and peripheral vascular disease. Our customers include market leading OEMs within the interventional radiology, interventional cardiology, electrophysiology and vascular access market. We believe that over the coming years these markets will experience strong global procedural growth driven by:
|
•
|
Growing global prevalence of vascular disease reflecting both the aging of the population in many developed markets and the continuing growth in the number of people with conditions such as diabetes, hypertension, and obesity.
|
|
•
|
Continued adoption of minimally invasive therapies in emerging markets.
|
|
•
|
Emergence of new minimally invasive therapies expanding patient pools to patients who previously would have remained either untreated or have undergone surgery.
|
Our products and capabilities seek to capitalize on the growth of the minimally invasive therapy markets by offering complementary off-the-shelf access devices such as introducers and steerable sheaths as well as design and manufacturing services for specialty catheter components that enable the delivery and administration of predominantly cardiovascular, neurovascular and endovascular therapies. Our broad portfolio of peelable, valved and non-valved introducers have gained strong adoption with OEMs in both the cardiac rhythm management (“CRM”) market, for the placement of leads, as well as the vascular access space where our introducers are used to place dialysis catheters, PICCs, CVCs and ports. We service these markets by providing OEMs with customizable sterile kits or non-sterile product for inclusion in OEMs device kits. Our steerable sheaths have gained significant traction in the electrophysiology market where market-leading OEMs utilize our steerable devices for the delivery of diagnostic and ablation devices. Our specialty catheter shaft components provide OEMs custom design, prototyping, and manufacturing of the high performance catheter assemblies required to support the most demanding minimally invasive catheter based surgical procedures.
Portable Medical, Energy, Military and Environmental
– Greatbatch Medical also provides customized battery power and management systems, charging and docking stations, and power supplies. We design customized primary (non-rechargeable) and secondary (rechargeable) battery solutions which are used in the portable medical, energy, military and environmental markets. Our primary and secondary power solutions are used where failure is not an option.
Greatbatch Medical’s primary lithium power solutions, which include high, moderate and low rate non-rechargeable cell solutions, are utilized in extreme conditions and can withstand exceptionally high and low temperatures, sterilization, and high shock and vibration. Our product designs incorporate protective circuitry, glass-to-metal hermetic seals, fuses and diodes to help ensure safe, durable and reliable power as devices are subjected to these harsh conditions. Our primary batteries are often used in remote and demanding environments, including down hole drilling tools, military communication devices, oceanographic buoys and more.
In addition to primary power solutions, Greatbatch Medical offers customized secondary or rechargeable battery packs, in a diverse range of chemistries for critical applications requiring rechargeable solutions. Rechargeable chemistries include lithium
-
6
-
ion, lithium ion polymer, nickel metal hydride, nickel cadmium, lithium iron phosphate and sealed lead acid. Greatbatch Medical’s rechargeable battery packs include advanced electronics, smart charging and battery management systems and are used in critical and life-saving applications, including automated external defibrillators, ventilators, powered surgical instruments and portable oxygen concentrators, among others.
The portable medical market trends continue to be favorable with an aging population and the shift from clinical to home settings for portable equipment to monitor and provide therapy. This market represents a strong opportunity despite cost pressure from healthcare reform. New product development in this market is vibrant as our customers continue to invest in the future to position for growth. We estimate that the portable medical market represents a $1.0 billion market opportunity for Greatbatch Medical.
The following table summarizes information about our Greatbatch Medical products:
|
Product
|
Description
|
Principal Product Attributes
|
|
|
Batteries
|
Lithium iodine (“Li Iodine”)
Lithium silver vanadium oxide (“Li SVO”)
Lithium carbon monoflouride (“Li CFx”)
Lithium ion rechargeable (“Li Ion”)
Lithium SVO/CFx (“Q
HR
” & “Q
MR
”)
|
High reliability and predictability;
Long service life;
Customized configuration;
Light weight;
High energy density, small size
|
|
|
Capacitors
|
Storage for energy generated by a battery before delivery to the heart. Used in ICDs and CRT-Ds.
|
Stores more energy per unit volume (energy density) than other existing technologies; Customized configuration
|
|
|
EMI filters
|
Filters electromagnetic interference to limit undesirable response, malfunctioning or degradation in the performance of electronic equipment
|
High reliability attenuation of EMI RF over wide frequency ranges; Customized design
|
|
|
Feedthroughs
|
Allow electrical signals to be brought from inside hermetically sealed IMD to an electrode
|
Ceramic to metal seal is substantially more durable than traditional seals; Multifunctional
|
|
|
Coated electrodes
|
Deliver electric signal from the feedthrough to a body part undergoing stimulation
|
High quality coated surface; Flexible in utilizing any combination of biocompatible coating surfaces; Customized offering of surfaces and tips
|
|
|
Precision components
|
Machined
Molded and over molded products
|
High level of manufacturing precision;
Broad manufacturing flexibility
|
|
|
Enclosures and related components
|
Titanium
Stainless steel
|
Precision manufacturing, flexibility in configurations and materials
|
|
|
Value-added assemblies
|
Combination of multiple components in a single package/unit
|
Leveraging products and capabilities to provide subassemblies and assemblies;
Provides synergies in component technology and procurement systems
|
|
-
7
-
|
Product
|
Description
|
Principal Product Attributes
|
|
|
Stimulation leads
|
Cardiac, neuromodulation and hearing restoration stimulation leads
|
Custom and unique configurations that increase therapy effectiveness, provide finished device design and manufacturing
|
|
|
Introducers
|
Conduit to deliver CRM leads or placement of dialysis catheters, CVCs, PICCs, and ports
|
Variety of sizes and configurations that facilitate reliable access in vascular access and CRM applications
|
|
|
Steerable sheaths
|
Steerable guide sheath for the delivery of diagnostic and ablation catheters
|
Configurations to enable effective delivery of diagnostic and therapeutic devices in electrophysiology procedures.
|
|
|
Specialty catheter shaft components
|
High performance catheter shafts designed to meet intended clinical performance characteristics
|
Deep catheter design expertise and state-of-the-art manufacturing services
|
|
|
Cases and trays
|
Delivery systems for cleaning and sterilizing orthopaedic instruments and implants
|
High degree of customization;
Short, predictable development and production timelines
|
|
|
Implants
|
Orthopaedic implants for large joint, spine, extremity and trauma procedures
|
Precision manufacturing, leveraging capabilities and product processes including sterile packaging and coatings
|
|
|
Instruments
|
Reusable and single use orthopaedic instruments for large joint, spine, extremity and trauma procedures
|
Designed to improve surgical techniques, reduce surgery time, and increase surgical precision
|
|
|
Primary cells
|
Low-rate
Moderate-rate
High rate (spiral) Wide Range
|
Optimized rate capability, shock and vibration resistant, high and low temperature tolerant, high energy density; Ability to operate in low and high temp applications
|
|
|
Primary and secondary battery packs
|
Highly-customized pack solutions
|
Diverse portfolio of cells in various sizes, temperature ranges and rate capabilities, custom-engineered and designed, value-add charging and battery management systems for secondary packs
|
|
A majority of the components and devices Greatbatch Medical sells incorporate proprietary technologies. These proprietary technologies provide an entry barrier for new competitors, and further limit existing competitors from duplicating our products. In addition to these proprietary technologies, our proprietary “know-how” in the manufacture of these products provides further barriers to competition.
QiG GROUP
QiG focuses on developing medical device systems for some of healthcare’s most pressing challenges and reflects Greatbatch’s strategic evolution of its product offerings in order to raise the growth and profitability profile of the Company. QiG encompasses 135 research and development professionals across the world working on a portfolio of new and innovative product opportunities. QiG has established relationships with highly specialized physicians across the U.S. and Europe that help support the design of medical device systems with unique benefits to improve clinical outcomes. QiG provides differentiated medical devices to OEM customers by accelerating the velocity of innovation while delivering optimized supply chain and cost efficiencies. We are utilizing our market research to drive our intellectual property portfolio with a goal of improved return on investment.
QiG utilizes a disciplined and diversified portfolio approach with three investment modes: new medical device systems commercialization, collaborative programs with OEM customers, and strategic equity positions in emerging healthcare companies. The development of certain new medical device systems are facilitated through the establishment of limited liability companies (“LLCs”). These LLCs do not own, but have the exclusive right to use the technology of Greatbatch in certain, specific fields of use and have an exclusive manufacturing agreement with Greatbatch Medical. QiG currently owns 89% -
-
8
-
100% of three LLCs. The minority interests in these LLCs are held by key opinion leaders, clinicians and strategic partners. Under the LLC agreement, QiG is responsible to fund 100% of the expenses incurred by the LLC. However, no distributions are made to the minority holders until QiG is reimbursed for all expenses paid. Once QiG has been fully reimbursed, all future distributions are made based upon the respective LLCs ownership percentages. One of the LLCs established by QiG is for our spinal cord stimulation system to treat chronic intractable pain of the trunk and/or limbs. This product was submitted for premarket approval (“PMA”) to the United States Food & Drug Administration (“FDA”) in December 2013 and in January 2014 documentation for European CE Mark was submitted to the notified body, TÜV SÜD America. CE Mark approval was obtained on June 17, 2014. QiG is in the early stages of development of two additional medical device systems, which are targeting approved and emerging indications. Additionally, based upon the technology acquired from NeuroNexus, QiG is developing a platform of thin-film electrodes for neuromodulation leads, sub-systems and components.
QiG revenue includes sales of neural interface technology, components, and systems to the neuroscience and clinical markets. On August 12, 2014, the Company acquired CCC, a neuromodulation medical device developer and manufacturer. As a result of this transaction, QiG revenue also includes sales of various medical device products such as implantable pulse generators, programmer systems, battery chargers, patient wands and leads to medical device companies. In the future, QiG revenue is expected to come from various sources including investment gains from the sales of LLC ownership interests, technology licensing fees, royalty revenue, and/or the sales of medical device systems.
RESEARCH AND DEVELOPMENT
Our position as a leading developer and manufacturer of medical devices and components is largely the result of our long history of technological innovation. We invest substantial resources in research, development and engineering. Our scientists, engineers and technicians focus on improving existing products, expanding the use of our products and developing new products. In addition to our internal technology and product development efforts, we also engage outside research institutions for unique technology projects. In order to facilitate the development of new and improved medical devices, in 2008, we significantly increased our investments in research and development. Net investments in medical device systems (including SG&A), which are being facilitated through QiG, totaled $23.9 million, $29.4 million and $32.7 million for 2014, 2013 and 2012, respectively. Further information regarding our research and development activities can be found in the “Product Development” section of Item 7 of this report.
PATENTS AND PROPRIETARY TECHNOLOGY
We rely on a combination of patents, licenses, trade secrets and know-how to establish and protect our proprietary rights to our technologies and products. Often, several patents covering various aspects of the design protect a single product. We believe this provides broad protection of the inventions employed.
As of January 2, 2015, we have
1,023
active patents filed. We also have
462
pending patent applications at various stages of approval. During 2014, there were 105 patent applications filed and 134 patents issued. As a result of QiG’s development of complete medical device systems, the amount of intellectual property being generated by the Company has accelerated. Of the 1,485 patents filed and pending, approximately 542 of these relate to our complete medical device systems.
We are a party to several license agreements with third parties under which we have obtained, on varying terms, exclusive or non-exclusive rights to patents held by them. An example of these agreements is the license of basic technology used in our wet tantalum capacitors, filtered feedthroughs, biomimetic coatings, safety needles and MRI compatible lead systems. We have also granted rights to our patents to others under license agreements.
It is our policy to require our management and technical employees, consultants and other parties having access to our confidential information to execute confidentiality agreements. These agreements prohibit disclosure of confidential information to third parties except in specified circumstances. In the case of employees and consultants, the agreements generally provide that all confidential information relating to our business is the exclusive property of Greatbatch.
MANUFACTURING AND QUALITY CONTROL
We leverage our strength as an innovative designer and manufacturer of finished devices and components to the medical device industry. Our manufacturing and engineering services include: design, testing, component production, and device assembly. We have integrated our proprietary technologies in our own products and those of our customers throughout the medical device industry. Our flexible, high productivity manufacturing capabilities span sites in Tijuana, Mexico, Beaverton, OR, Plymouth, MN, Minneapolis, MN, Ft. Wayne, IN, Indianapolis, IN, Alden, NY, Clarence, NY, Raynham, MA, Chaumont, France, and with the acquisition of CCC in August 2014, Montevideo, Uruguay.
Due to the highly regulated nature of the products we produce, we have implemented strong quality systems which are harmonized across the Company. The quality systems at our sites are compliant with and certified to various recognized international standards, requirements, and directives. Each site’s quality system is certified under an applicable International
-
9
-
Organization for Standardization (“ISO”) quality system standard, such as ISO 13485 or ISO 9001. This certification requires, among other things, an implemented quality system that applies (where applicable) to the design and manufacture of components, assemblies and finished medical devices, including component quality and supplier control. Maintenance of these certifications for each facility requires periodic re-examination from an independent notified body.
Along with ISO 13485, the facilities producing finished medical devices are subject to extensive and rigorous regulation by numerous government bodies, including the FDA and comparable international regulatory agencies in order to ship product worldwide. For these facilities, we maintain FDA registration and compliance to all applicable domestic and international regulations. Compliance with applicable regulatory requirements is subject to continual review and is monitored through periodic inspections by the FDA and other international regulatory bodies.
SALES AND MARKETING
We sell our products directly to our customers. In 2014, approximately
45%
of our products were sold in the U.S. Sales outside the U.S. are primarily to customers whose corporate offices are located and headquartered in the U.S. Information regarding our sales by geographic area is set forth in Note 19 “Business Segment, Geographic and Concentration Risk Information” of the Notes to Consolidated Financial Statements contained in Item 8 of this report.
Although the majority of our customers contract with us to develop custom components and assemblies to fit their product specifications, we also provide system and device solutions ready for market distribution by OEMs. As a result, we have established close working relationships between our internal program managers and our customers. We market our products and technologies at industry meetings and trade shows domestically and internationally.
Internal account executives support all activity and involve engineers and technology professionals in the sales process to address customer requests appropriately. For system and device solutions, we partner with our customers’ research, marketing, and clinical groups to jointly develop technology platforms in alignment with their product roadmaps and therapy needs.
We leverage our account executives with support from engineering to design and sell product solutions into our targeted markets. Our account executives are trained to assist our customers in selecting appropriate chemistries and configurations. We market our products and services through well-defined selling strategies and marketing campaigns that are customized for each of the industries we target.
Over the last several years we have significantly enhanced our sales and marketing capabilities. This has included moving account executives closer to our major customers, upgrading our sales force with new sales talent, enhancing our sales commission programs, and intensifying our market research. Additionally, we have placed additional emphasis on reaching long-term agreements with our OEM customers in order to secure our revenue base. At times, we have provided our customers with price concessions in exchange for entering into long-term agreements and certain volume commitments. We estimate that approximately 70 percent of our revenue is generated from long-term (three- to seven-year) agreements.
Firm backlog orders at
January 2, 2015
and
January 3, 2014
were approximately $174 million and $170 million, respectively. The majority of the orders outstanding at
January 2, 2015
are expected to be shipped within one year.
CUSTOMERS
Our Greatbatch Medical customers include large multi-national OEMs and their subsidiaries such as, in alphabetical order here and throughout this report, Biotronik, Biomet, Boston Scientific, Cyberonics, Halliburton Company, Johnson & Johnson, Medtronic, Philips Healthcare, Smith & Nephew, Sorin Group, St. Jude Medical, Stryker, Zimmer, and Zoll. During 2014, 2013, and 2012, Biotronik, Johnson & Johnson, Medtronic, and St. Jude Medical, collectively accounted for
54%
,
56%
and
52%
of our total sales, respectively. We have been successful in leveraging our diversified product line to further penetrate these customers and selling into more of their operating divisions, which cover the cardiac, neuromodulation, orthopaedic and vascular markets. QiG customers include numerous scientists, hospitals and universities throughout the world who perform research for the neuroscience and clinical markets. With the acquisition of CCC in August 2014, QiG customers also include various research companies and institutes and early stage medical device companies, with Nevro Corp. as the largest customer.
The nature and extent of our selling relationship with each OEM customer is different in terms of breadth of products purchased, selling prices, product volumes, ordering patterns and inventory management. For customers with long-term contracts, we have negotiated fixed pricing arrangements for pre-determined volume levels with pricing fixed at each level. In general, the higher the volume level, the lower the pricing. We have pricing arrangements with our customers that at times do not specify minimum order quantities. During new contract negotiations, price level decreases (concessions) for future sales may be offered to customers in exchange for volume and/or long-term commitments. Once the new contracts are signed, these prices are fixed and determinable for all future sales. We recognize revenue when it is realized or realizable and earned. This occurs when persuasive evidence of an arrangement exists, delivery has occurred, the price is fixed or determinable, the buyer is obligated to pay us (i.e. payment is not contingent on a future event), the risk of loss is transferred, there is no obligation of
-
10
-
future performance, collectability is reasonably assured and the amount of future returns can reasonably be estimated. Those criteria are met at the time of shipment when title passes.
Our visibility to customer ordering patterns is over a relatively short period of time. Our customers may have inventory management programs, vertical integration plans and/or alternate supply arrangements which we are unaware of. Additionally, the relative market share among the OEM manufacturers changes periodically. Consequently, these and other factors can significantly impact our sales in any given period. Our customers may initiate field actions with respect to market-released products. These actions may include product recalls or communications with a significant number of physicians about a product or labeling issue. The scope of such actions can range from very minor issues affecting a small number of units to more significant actions. There are a number of factors, both short-term and long-term, related to these field actions that may impact our results. In the short-term, if a product has to be replaced, or customer inventory levels have to be restored, demand will increase. Also, changing customer order patterns due to market share shifts or accelerated device replacements may also have a positive or negative impact on our sales results in the near-term. These same factors may have longer-term implications as well. Customer inventory levels may ultimately have to be rebalanced to match new demand.
SUPPLIERS AND RAW MATERIALS
We purchase certain critical raw materials from a limited number of suppliers due to the technically challenging requirements of the supplied product and/or the lengthy process required to qualify these materials both internally and with our customers. We cannot quickly establish additional or replacement suppliers for these materials because of these rigid requirements. For these critical raw materials, we maintain minimum safety stock levels and contractually partner with suppliers to help ensure the continuity of supply. Historically, we have not experienced any significant interruptions or delays in obtaining critical raw materials.
For non-critical raw material purchases, we utilize competitive pricing methods such as bulk purchases, precious metal pool buys, blanket orders, and long-term contracts to secure supply. We believe that there are alternative suppliers or substitute products available at competitive prices for all of these non-critical raw materials.
As discussed more fully in Item 1A “Risk Factors,” our business depends on a continuous supply of raw materials from a limited number of suppliers. If an unforeseen interruption of supply were to occur, we may be unable to obtain substitute sources for these raw materials on a timely basis or on terms acceptable to us, which could harm our ability to manufacture our products profitably or on time. Additionally, we may be unable to quickly establish additional or replacement suppliers for these materials as there are a limited number of worldwide suppliers.
COMPETITION
Our existing and potential competitors include our OEM customers that currently have vertically integrated operations and may expand their vertical integration capability in the future. Competitors also include independent suppliers who typically specialize in one type of component. Our known non-vertically integrated competitors include the following:
|
Product Line
|
Competitors
|
|
Medical batteries
|
Eagle-Picher
Quallion
|
|
Capacitors
|
AVX (subsidiary of Kyocera) Critical Medical Components
|
|
Feedthroughs
|
Alberox (subsidiary of The Morgan Crucible Co. PLC)
|
|
EMI filtering
|
AVX (subsidiary of Kyocera)
Eurofarad
|
|
Enclosures
|
Heraeus
Hudson
National
|
|
Machined and molded components
|
Numerous
|
|
Value added assembly
|
Numerous
|
|
Catheters
|
Creganna
Teleflex
Vention medical |
-
11
-
|
Product Line
|
Competitors
|
|
Introducers
|
Pressure Products
Theragenics (Galt)
Merit Medical
|
|
Stimulation leads
|
Oscor
|
|
Orthopaedic trays, instruments and implants
|
Accelent
Avalign Technologies
IMDS
Micropulse, Inc.
Juno
Orchid
Sandvik
Symmetry
Paragon
Tecomet
|
|
Primary Power Solutions
|
Tracer Technologies
Engineered Power
Saft
Ultralife
|
|
Secondary Power Solutions
|
Totex
Palladium
ICC/Nexergy
BMZ
Ultralife
Saft
|
With the acquisition of CCC in August 2014, our competitors also include contract manufacturers such as Cirtec Medical Systems, Stellar Technologies, Flextronics, and Vention Medical.
GOVERNMENT REGULATION
As described below, our business is subject to direct governmental regulation including the laws and regulations generally applicable to all businesses in the jurisdictions in which we operate. We are subject to federal, state and local environmental laws and regulations governing the emission, discharge, use, storage and disposal of hazardous materials and the remediation of contamination associated with the release of these materials at our facilities and at off-site disposal locations. Our manufacturing and research, development and engineering activities may involve the controlled use of small amounts of hazardous materials. Liabilities associated with hazardous material releases arise principally under the Federal Comprehensive Environmental Response, Compensation and Liability Act and analogous state laws that impose strict, joint and several liabilities on owners and operators of contaminated facilities and parties that arrange for the off-site disposal of hazardous materials. We are not aware of any material noncompliance with the environmental laws currently applicable to our business and we are not subject to any material claim for liability with respect to contamination at any of our facilities or any off-site location. We may, however, become subject to these environmental liabilities in the future as a result of our historic or current operations.
Our products are subject to regulation by numerous government agencies, including the FDA and comparable foreign agencies. For some of our component technology, we have “master files” on record with the FDA. Master files may be used to provide proprietary and confidential detailed information about technology, facilities, processes, or articles used in the manufacturing, processing, packaging and storing of one or more medical device components. These master files may be used by device manufacturers to support their PMA, investigational device exemption application (“IDE”) or premarket notification (“510(k)”).
In the U.S., our introducer and delivery catheter products are considered Class II devices. The 510(k) process requires us to demonstrate that our new medical devices are substantially equivalent to a legally marketed medical device. In order to support a substantial equivalence claim, we must submit supporting data. In Europe, these devices are considered Class IIa and Class III, respectively, under European Medical Device Directives. These Directives require companies that wish to manufacture and distribute medical devices in European Union member countries to obtain a CE Marking for those products, which indicate that the products meet minimum standards of performance, essential requirements, safety conformity assessment and quality.
The PMA process is a more rigorous process that is required to demonstrate that a new medical device is safe and effective. This is demonstrated by generating data regarding design, manufacturing processes, materials, bench testing, and animal testing, and typically human clinical data. Some of our products that we are developing are Class III medical devices that require a PMA or, in the European Union, premarket approval through submission of a Design Dossier.
-
12
-
As a manufacturer of medical devices and components that go into medical devices, we are also subject to periodic inspection by the FDA for compliance with the FDA’s Quality System Requirements and the applicable notified body in the European Union to ensure conformity to the Medical Device Directives and Active Implantable Medical Device Directives. We believe that our quality controls, development, testing, manufacturing, labeling, marketing and distribution of our medical devices conform to the requirements of all pertinent regulations.
Our sales and marketing practices are subject to regulation by the U.S. Department of Health and Human Services pursuant to federal anti-kickback laws, and are also subject to similar state laws.
We are also subject to various other environmental, transportation and labor laws as well as various other directives and regulations both in the U.S. and abroad. We believe that compliance with these laws will not have a material impact on our capital expenditures, earnings or competitive position. Given the scope and nature of these laws, however, they may have a material impact on our operational results in the future.
The Patient Protection and Affordable Care Act and the Health Care and Education Affordability Reconciliation Act (collectively “Health Care Reform”) legislated broad-based changes to the U.S. healthcare system that could significantly impact our business operations and financial results, including higher or lower revenue, as well as higher employee medical costs and taxes. Health Care Reform imposes significant new taxes on medical device OEMs, which will result in a significant increase in the tax burden on our industry and which could have a material negative impact on our financial condition, results of operations and our cash flows. Other elements of Health Care Reform such as comparative effectiveness research, an independent payment advisory board, payment system reforms including shared savings pilots and other provisions could meaningfully change the way healthcare is developed and delivered, and may materially impact numerous aspects of our business, results of operations and financial condition. Many significant parts of Health Care Reform will be phased in over the next several years and require further guidance and clarification in the form of regulations. The new medical device tax, which was effective in 2013, increased our cost of sales by
$0.7 million
and $0.5 million in 2014 and 2013, respectively.
RECRUITING AND TRAINING
We invest substantial resources in our recruiting efforts to focus on a quality workforce that will support our business objectives. Our goal is to provide our associates with growth opportunities by attempting to fill many of our open employment positions internally. We further meet our hiring needs through outside sources, as required. We have an active talent review process including development opportunities for management in order to ensure we are able to implement our strategic plan.
We provide training for our associates designed to educate them on safety, quality, business strategy, and our culture. Our safety training programs educate associates on basic industrial safety practices while emphasizing the importance of knowing emergency response procedures. Our training programs focus on the methodologies and technical competencies required to support current and future business needs with a strong focus on quality and continuous improvement.
Supporting our commitment to learning, we offer our associates tuition reimbursement and encourage them to continue their education at accredited colleges and universities. We have established a number of programs designed to challenge and motivate our associates specifically encouraging continuous improvement, supervisory and leadership skills. We believe ongoing development is necessary to ensure our associates utilize best practices, and share a common understanding of work practices and performance expectations.
EMPLOYEES
The following table provides a breakdown of our employees:
|
Manufacturing – U.S.
|
1,810
|
|
|
General and administrative – U.S.
|
134
|
|
|
Sales and marketing – U.S.
|
88
|
|
|
Research, development and engineering – U.S.
|
241
|
|
|
Chaumont, France facility
|
270
|
|
|
Switzerland facility
|
8
|
|
|
Tijuana, Mexico facility
|
969
|
|
|
Montevideo, Uruguay facility
|
170
|
|
|
Total
|
3,690
|
|
We also employ a number of temporary employees to assist us with various projects and service functions and address peaks in staff requirements. Our employees at our Chaumont, France and Tijuana, Mexico facilities are represented by a union. Nearly
-
13
-
all of the positions at our Chaumont, France, Tijuana, Mexico, and Montevideo, Uruguay facilities are manufacturing related. We believe that we have a good relationship with our employees.
EXECUTIVE OFFICERS OF THE COMPANY
Information concerning our executive officers is presented below as of
March 3, 2015
. The officers’ terms of office run from year to year until the first meeting of the Board of Directors occurring immediately following our Annual Meeting of Stockholders, and until their successors are elected and qualified, except in the case of earlier death, retirement, resignation or removal.
Mauricio Arellano
, age 48, is Executive Vice President for Global Operations and has served in that office since June 2013. From December 2010 to June 2013, he was President of Greatbatch Medical. Mr. Arellano served as Senior Vice President and Business Leader of our Cardiac and Neurology Group from October 2008 until December 2010, Senior Vice President and Business Leader of our CRM and Neuromodulation Group from January 2008 to October 2008, Senior Vice President and Business Leader of our Medical Solutions Group from November 2006 to January 2008, and as Vice President of Greatbatch Mexico from January 2005 to November 2006. Mr. Arellano joined our Company in October 2003 as the Plant Manager of our former Carson City, NV facility. Prior to joining our Company, he served in a variety of human resources and operational roles with Tyco Healthcare - Especialidades Medicas Kenmex and with Sony de Tijuana Este.
George M. Cintra
, age 53, is Executive Vice President & Chief Technology Officer, and has served in that role since June 2013. Mr. Cintra had previously served as Vice President of Research, Development & Engineering of our Electrochem Solutions business since joining Greatbatch in August 2010. Prior to joining Greatbatch, he was Section Head & Technical Manager, Research & Development with Procter & Gamble from January 2007 to July 2010. Mr. Cintra previously held positions with Gillette Co, Duracell, W.R. Grace and Alcoa.
Michael Dinkins
, age 60, is Executive Vice President & Chief Financial Officer, and has served in that office since joining our Company in May 2012. From 2008 until May 2012, he was Executive Vice President and Chief Financial Officer of USI Insurance Services, an insurance intermediary company. From 2005 until 2008, he was Executive Vice President and Chief Financial Officer of Hilb Rogal & Hobbs Co., an insurance and risk management services company. Prior to that, Mr. Dinkins held senior positions at Guidant Corporation, Access Worldwide Communications, Cadmus Communications Group and General Electric Company.
Thomas K. Hickman,
age 49, is Executive Vice President, Global Sales & Marketing - QiG Group, and has served in that office since August 2014. He joined our Company in July 2013 as Vice President for Strategy of our QiG Group. From 1998 to 2005 Mr. Hickman held leadership positions with Advanced Neuromodulation Systems, Inc. (“ANS”), marketing its neurostimulation therapies. Upon St. Jude Medical’s acquisition of ANS in 2005 until 2012, he served as its Vice President of New Products and Emerging Therapies, and Vice President of Marketing, Chronic Pain Therapies. From 2012 until joining Greatbatch, Mr. Hickman was a private consultant.
Andrew P. Holman
, age 47, is Executive Vice President, Global Sales & Marketing - Greatbatch Medical, and has served in that role since June 2013. He joined Greatbatch in April 2012 as Vice President of Sales and Marketing for Greatbatch Medical. From October 2011 until joining Greatbatch, Mr. Holman was a consultant with HarQuinn, LLC. From September 2009 to October 2011,he served as Executive Vice President, Sales & Marketing for DJO Global, Inc., and from October 2005 to June 2009, he served as President of the Americas for the Orthopaedics business unit of Smith & Nephew, Inc. Mr. Holman previously held various sales and marketing leadership positions at Johnson & Johnson, Inc., Boston Scientific Corporation and Xerox Corporation.
Thomas J. Hook
, age 52, has served as our President & Chief Executive Officer since August 2006. Prior to August 2006, he was our Chief Operating Officer, a position he assumed upon joining our Company in September 2004. From August 2002 until September 2004, Mr. Hook was employed by CTI Molecular Imaging where he had served as President, CTI Solutions Group.
Timothy G. McEvoy
, age 57, is Senior Vice President, General Counsel & Secretary, and has served in that office since joining our Company in February 2007. From 1992 until January 2007, he was employed in a variety of legal roles by Manufacturers and Traders Trust Company.
AVAILABLE INFORMATION
We make available free of charge through our Internet website our annual report on Form 10-K, quarterly reports on Form 10-Q, current reports on Form 8-K and amendments to those reports filed or furnished pursuant to Section 13(a) or 15(d) of the Securities Exchange Act of 1934 as soon as reasonably practicable after we electronically file those reports with, or furnish them to, the SEC. Our Internet address is
www.greatbatch.com
. The information contained on our website is not incorporated by reference in this annual report on Form 10-K and should not be considered a part of this report. These items may also be obtained free of charge by written request made to Christopher J. Thome, Assistant Corporate Controller – Reporting and Shared Services, Greatbatch, Inc., 10000 Wehrle Drive, Clarence, New York 14031.
-
14
-
CAUTIONARY FACTORS THAT MAY AFFECT FUTURE RESULTS
Some of the statements contained in this annual report on Form 10-K and other written and oral statements made from time to time by us and our representatives are not statements of historical or current fact. As such, they are “forward-looking statements” within the meaning of Section 27A of the Securities Act of 1933, as amended, and Section 21E of the Securities Exchange Act of 1934, as amended. We have based these forward-looking statements on our current expectations, and these statements are subject to known and unknown risks, uncertainties and assumptions. Forward-looking statements include statements relating to:
|
•
|
future sales, expenses and profitability;
|
|
•
|
future development and expected growth of our business and industry;
|
|
•
|
our ability to execute our business model and our business strategy;
|
|
•
|
our ability to identify trends within our industries and to offer products and services that meet the changing needs of those markets; and
|
|
•
|
projected capital expenditures.
|
You can identify forward-looking statements by terminology such as “may,” “will,” “should,” “could,” “expects,” “intends,” “plans,” “anticipates,” “believes,” “estimates,” “predicts,” “potential” or “continue” or “variations” or the negative of these terms or other comparable terminology. These statements are only predictions. Actual events or results may differ materially from those stated or implied by these forward-looking statements. In evaluating these statements and our prospects, you should carefully consider the factors set forth below. All forward-looking statements attributable to us or persons acting on our behalf are expressly qualified in their entirety by these cautionary factors and to others contained throughout this report. We are under no duty to update any of the forward-looking statements after the date of this report or to conform these statements to actual results.
Although it is not possible to create a comprehensive list of all factors that may cause actual results to differ from the results expressed or implied by our forward-looking statements or that may affect our future results, some of these factors include the following: our dependence upon a limited number of customers; customer ordering patterns; product obsolescence; our inability to market current or future products; pricing pressure from customers; our ability to timely and successfully implement cost reduction and plant consolidation initiatives; our reliance on third party suppliers for raw materials, products and subcomponents; fluctuating operating results; our inability to maintain high quality standards for our products; challenges to our intellectual property rights; product liability claims; product field actions or recalls; our inability to successfully consummate and integrate acquisitions and to realize synergies and to operate these acquired businesses in accordance with expectations; our unsuccessful expansion into new markets; our failure to develop new products including system and device products; the timing, progress and ultimate success of pending regulatory actions and approvals, including with respect to our Algovita spinal cord stimulation system; our inability to obtain licenses to key technology; regulatory changes, including Health Care Reform, or consolidation in the healthcare industry; global economic factors including currency exchange rates and interest rates; the resolution of various legal actions brought against the Company; and other risks and uncertainties that arise from time to time and are described in Item 1A “Risk Factors” of this report.
|
ITEM 1A.
|
RISK FACTORS
|
|
Our business faces many risks. Any of the risks discussed below, or elsewhere in this report or in our other SEC filings, could have a material impact on our business, financial condition or results of operations.
Risks Related To Our Business
We depend heavily on a limited number of customers, and if we lose any of them or they reduce their business with us, we would lose a substantial portion of our revenues.
In 2014, Biotronik, Johnson & Johnson, Medtronic, and St. Jude Medical collectively accounted for approximately
54%
of our revenues. Our supply agreements with these customers may not be renewed. Furthermore, many of our supply agreements do not contain minimum purchase level requirements and therefore there is no guaranteed source of revenue that we can depend upon under these agreements. The loss of any large customer, a reduction of business with that customer, or a delay or failure by that customer to make payments due to us would harm our business, financial condition and results of operations.
If we do not respond to changes in technology, our products may become obsolete and we may experience a loss of customers and lower revenues.
We sell our products to customers in several industries that experience rapid technological changes, new product introductions and evolving industry standards. Without the timely introduction of new products and enhancements, our products and services
-
15
-
will likely become technologically obsolete over time and we may lose a significant number of our customers. We dedicate a significant amount of resources to the development of our products and technologies. Our product development efforts may be affected by a number of factors, including our ability to anticipate customer needs, develop new products, secure intellectual property protection for our product, and manufacture products in a cost effective manner. We would be harmed if we did not meet customer requirements and expectations. Our inability, for technological or other reasons, to successfully develop and introduce new and innovative products could result in a loss of customers and lower revenues.
If we are unable to successfully market our current or future products, our business will be harmed and our revenues and operating results will be adversely affected.
The markets for our products have been growing in recent years. If the markets for our products do not grow as forecasted by industry experts, our revenues could be less than expected. In addition, it is difficult to predict the rate at which the markets for our products will grow or at which new and increased competition will result in market saturation. Slower growth in the cardiac and neuromodulation, orthopaedic, portable medical, vascular or energy markets in particular would negatively impact our revenues. In addition, we face the risk that our products will lose widespread market acceptance. Our customers may not continue to utilize the products we offer and a market may not develop for our future products.
We may at times determine that it is not technically or economically feasible for us to continue to manufacture certain products and we may not be successful in developing or marketing them. Additionally, new technologies that we develop may not be rapidly accepted because of industry-specific factors, including the need for regulatory clearance, entrenched patterns of clinical practice and uncertainty over third party reimbursement. If this occurs, our business will be harmed and our operating results will be negatively affected.
We may face competition that could harm our business and we may be unable to compete successfully against new entrants and established companies with greater resources.
Competition in connection with the manufacturing of our medical products may intensify in the future. One or more of our medical customers may undertake additional vertical integration and/or supplier diversification initiatives and begin to manufacture or dual-source some or all of their components that we currently supply them which could cause our operating results to suffer. The market for commercial power sources is competitive, fragmented and subject to rapid technological change. Many other commercial power source suppliers are larger and have greater financial, operational, economies of scale, personnel, sales, technical and marketing resources than us. These and other companies may develop products that are superior or more cost effective to ours, which could result in lower revenues and operating results.
We intend to develop new products and expand into new markets, which may not be successful and could harm our operating results.
We intend to expand into new markets and develop new and modified products based on our existing technologies and engineering capabilities, including the development of complete medical device systems. These efforts have required and will continue to require us to make substantial investments, including significant research, development and engineering expenditures and capital expenditures for new, expanded or improved manufacturing facilities. Additionally, many of the new products we are working on take longer and more resources to develop and commercialize, including obtaining regulatory approval.
Specific risks in connection with expanding into new products and markets include: longer product development cycles, the inability to transfer our quality standards and technology into new products, the failure to receive or delay in receipt of regulatory approval for new products or modifications to existing products, and the failure of our customers to accept the new or modified products.
We are subject to pricing pressures from customers, which could harm our operating results.
We have made price concessions to some of our larger customers in recent years and we expect customer pressure for price concessions will continue. Price concessions or reductions may cause our operating results to suffer.
We rely on third party suppliers for raw materials, key products and subcomponents and if we are unable to obtain these materials, products and/or subcomponents on a timely basis or on terms acceptable to us, our ability to manufacture products will suffer.
Our business depends on a continuous supply of raw materials. The principal raw materials used in our business include lithium, iodine, gold, CFx, palladium, stainless steel, aluminum, cobalt chrome, tantalum, platinum, ruthenium, gallium trichloride, vanadium oxide, iridium, titanium, and plastics. The supply and price of these raw materials are susceptible to fluctuations due to transportation, government regulations, price controls, foreign civil unrest, economic climate or other unforeseen circumstances. Increasing global demand for these raw materials has caused prices of these materials to increase
-
16
-
significantly. In addition, there are a limited number of worldwide suppliers of several raw materials needed to manufacture our products. In addition, for reasons of quality, cost effectiveness or availability, we obtain some raw materials from a sole supplier. Although we work closely with our suppliers to ensure continuity of supply, we may not be able to continue to procure raw materials critical to our business or to procure them at acceptable price levels.
In addition, we rely on third party manufacturers to supply many of our products and subcomponents. Manufacturing problems may occur with these and other outside sources, as a supplier may fail to develop and supply products and subcomponents to us on a timely basis, or may supply us with products and subcomponents that do not meet our quality, quantity and cost requirements. If any of these problems occur, we may be unable to obtain substitute sources for these products and subcomponents on a timely basis or on terms acceptable to us, which could harm our ability to manufacture our own products and components profitably or on time. In addition, to the extent the processes our suppliers use to manufacture products and subcomponents are proprietary, we may be unable to obtain comparable subcomponents from alternative suppliers.
We may never realize the full value of our intangible assets, which represent a significant portion of our total assets.
At
January 2,
2015
, we had $
440.0 million
of intangible assets, representing
46%
of our total assets. These intangible assets consist primarily of goodwill, trademarks, tradenames, customer lists and patented technology arising from our acquisitions. Goodwill and other intangible assets with indefinite lives are not amortized, but are tested annually or upon the occurrence of certain events which indicate that the assets may be impaired. Definite lived intangible assets are amortized over their estimated useful lives and are tested for impairment upon the occurrence of certain events which indicate that the assets may be impaired. We may not receive the recorded value for our intangible assets if we sell or liquidate our business or assets. In addition, the significant amount of intangible assets increases the risk of a large charge to earnings in the event that the recoverability of these intangible assets is impaired. In the event of such a charge to earnings, the market price of our common stock could be affected. In addition, intangible assets with definite lives, which represent $
65.3 million
of our net intangible assets at
January 2,
2015
, will continue to be amortized. We incurred total amortization expenses relating to these intangible assets of
$13.9 million
in
2014
. These expenses will reduce our future earnings or increase our future losses.
Quality problems with our products could harm our reputation and erode our competitive advantage.
Quality is important to us and our customers, and our products are held to high quality and performance standards. In the event our products fail to meet these standards, our reputation could be harmed, which could damage our competitive advantage, causing us to lose customers and resulting in lower revenues.
Quality problems with our products could result in warranty claims and additional costs.
We generally allow customers to return defective or damaged products for credit, replacement, or exchange. We generally warrant that our products will meet customer specifications and will be free from defects in materials and workmanship. Additionally, we carry a safety stock of inventory for our customers which may be impacted by warranty claims. We reserve for our exposure to warranty claims based upon recent historical experience and other specific information as it becomes available. However, these reserves may not be adequate to cover future warranty claims and additional warranty costs or inventory write-offs may be incurred which could harm our operating results.
Regulatory issues resulting from product complaints, or recalls, or regulatory audits could harm our ability to produce and supply products or bring new products to market.
Our products are designed, manufactured and distributed globally in compliance with applicable regulations and standards. However, a product complaint, recall or negative regulatory audit may cause products to be removed from the market and harm our operating results or financial condition. In addition, during the period in which corrective action is being taken by us to remedy a complaint, recall or negative audit, regulators may not allow new products to be cleared for marketing and sale.
If we become subject to product liability claims, our operating results and financial condition could suffer.
Our business exposes us to potential product liability claims that are inherent in the design, manufacture and sales of our products. Product failures, including those that arise from failure to meet product specifications, misuse or malfunction, or design flaws, or the use of our products with components or systems not manufactured or sold by us could result in product liability claims or a recall. Many of our products are components and function in interaction with our customers’ medical devices. For example, our batteries are produced to meet electrical performance, longevity and other specifications, but the actual performance of those products is dependent on how they are utilized as part of our customers’ devices over the lifetime of the products. Product performance and device interaction from time to time have been, and may in the future be different than expected for a number of reasons. Consequently, it is possible that customers may experience problems with their medical devices that could require device recall or other corrective action, where our batteries met the specification at delivery, and for reasons that are not related primarily or at all to any failure by our product to perform in accordance with specifications. It is possible that our customers (or end-users) may in the future assert that our products caused or contributed to device failure.
-
17
-
Even if these assertions do not lead to product liability or contract claims, they could harm our reputation and our customer relationships.
Provisions contained in our agreements with key customers attempting to limit our damages, including provisions to limit damages to liability for negligence, may not be enforceable in all instances or may otherwise fail to protect us from liability for damages. Product liability claims or product recalls, regardless of their ultimate outcome, could require us to spend significant time and money in litigation and require us to pay significant damages. The occurrence of product liability claims or product recalls could affect our operating results and financial condition.
We carry product liability insurance with coverage that is limited in scope and amount. We may not be able to maintain this insurance at a reasonable cost or on reasonable terms, or at all. This insurance may not be adequate to protect us against a product liability claim that arises in the future.
Our operating results may fluctuate, which may make it difficult to forecast our future performance and may result in volatility in our stock price.
Our operating results have fluctuated in the past and are likely to fluctuate significantly from quarter to quarter due to a variety of factors, including the following:
|
•
|
a substantial percentage of our costs are fixed in nature, which results in our operations being particularly sensitive to fluctuations in production volumes;
|
|
•
|
changes in the mix of our revenue represented by our various products and customers could result in reductions in our profits if the mix of our revenue represented by lower margin products increases;
|
|
•
|
timing of orders placed by our principal customers who account for a significant portion of our revenues; and
|
|
•
|
increased costs of raw materials or supplies.
|
If we are unable to protect our intellectual property and proprietary rights, our business could be harmed.
We rely on a combination of patents, licenses, trade secrets and know-how to establish and protect our rights to our technologies and products. As of
January 2,
2015
, we have
1,023
active patents filed. However, the steps we have taken and will take in the future to protect our rights may not be adequate to deter misappropriation of our intellectual property. In addition to seeking formal patent protection whenever possible, we attempt to protect our proprietary rights and trade secrets by entering into confidentiality and non-compete agreements with employees, consultants and third parties with which we do business. However, these agreements may be breached and, if breached, there may be no adequate remedy available to us and we may be unable to prevent the unauthorized disclosure or use of our technical knowledge, practices and/or procedures. If our trade secrets become known, we may lose our competitive advantages. Additionally, as patents and other intellectual property protection expire we may lose our competitive advantage.
If third parties infringe or misappropriate our patents or other proprietary rights, our business could be seriously harmed. We may be required to spend significant resources to monitor our intellectual property rights, or we may not be able to detect infringement of these rights and may lose our competitive advantages associated with our intellectual property rights before we do so. In addition, competitors may design around our technology or develop competing technologies that do not infringe our proprietary rights.
We may be subject to intellectual property claims, which could be costly and time consuming and could divert our management from our business operations.
In producing our products, third parties may claim that we are infringing on their intellectual property rights, and we may be found to have infringed those intellectual property rights. We may be unaware of intellectual property rights of others that may be used in our technology and products. In addition, third parties may claim that our patents have been improperly granted and may seek to invalidate our existing or future patents. If any claim for invalidation prevailed, third parties may manufacture and sell products that compete with our products and our revenues from any related license agreements would decrease accordingly. We also typically do not receive significant indemnification from parties that license technology to us against third party claims of intellectual property infringement.
Any litigation or other challenges regarding our patents or other intellectual property could be costly and time consuming and could divert our management and key personnel from our business operations. The complexity of the technology involved in producing our products, and the uncertainty of intellectual property litigation increases these risks. Claims of intellectual property infringement may also require us to enter into costly royalty or license agreements. However, we may not be able to obtain royalty or license agreements on terms acceptable to us, or at all. We also may be made subject to significant damages or injunctions against development and sale of our products.
-
18
-
Our failure to obtain licenses from third parties for new technologies or the loss of these licenses could impair our ability to design and manufacture new products and reduce our revenues.
We occasionally license technologies from third parties rather than depending exclusively on our own proprietary technology and developments. Our ability to license new technologies from third parties is and will continue to be critical to our ability to offer new and improved products. We may not be able to continue to identify new technologies developed by others and even if we are able to identify new technologies, we may not be able to negotiate licenses on favorable terms, or at all. Additionally, we could lose rights granted under licenses for reasons beyond our control.
We may not be able to attract, train and retain a sufficient number of qualified employees to maintain and grow our business.
We monitor the markets in which we compete and assess opportunities to better align expenses with revenues, while preserving our ability to make needed investments in research and development projects, capital and our people that we believe are critical to our long-term success. Our success will depend in large part upon our ability to attract, train, retain and motivate highly skilled employees. There is currently aggressive competition for employees who have experience in technology and engineering. We compete intensely with other companies to recruit and hire from this limited pool. The industries in which we compete for employees are characterized by high levels of employee attrition. Although we believe we offer competitive salaries and benefits, we may have to increase spending in order to attract, train and retain personnel.
We are dependent upon our senior management team and key personnel and the loss of any of them could significantly harm us.
Our future performance depends to a significant degree upon the continued contributions of our senior management team and key technical personnel. Our products are highly technical in nature. In general, only highly qualified and trained scientists have the necessary skills to develop our products. The loss or unavailability to us of any member of our senior management team or a key technical employee could significantly harm us. We face intense competition for these professionals from our competitors, customers and companies operating in our industry. To the extent that the services of members of our senior management team and key technical personnel would be unavailable to us for any reason, we would be required to hire other personnel to manage and operate our Company and to develop our products and technology. We may not be able to locate or employ these qualified personnel on acceptable terms.
We may not realize the expected benefits from our cost savings and consolidation initiatives or those initiatives may have unintended consequences, which may harm our business.
We have incurred significant charges related to various cost savings and consolidation initiatives. These initiatives were undertaken to improve our operational effectiveness, efficiencies and profitability. Information regarding some of these initiatives is discussed in Note 13 “Other Operating Expenses, Net” of the Notes to Consolidated Financial Statements contained in Item 8 of this report. Cost reduction efforts under these initiatives include various cost and efficiency improvement measures, such as headcount reductions, the relocation of resources and administrative and functional activities, the closure of facilities, the transfer of production lines, the sale of non-strategic assets and other efforts to streamline our business, among other actions. These measures could yield unintended consequences, such as distraction of our management and employees, business disruption, disputes with customers, attrition beyond our planned reduction in workforce and reduced employee productivity. If any of these unintended consequences were to occur, they could negatively affect our business, financial condition and results of operations. In addition, headcount reductions and customer disputes may subject us to the risk of litigation, which could result in substantial cost. Moreover, our cost reduction efforts result in charges and expenses that impact our operating results. Our cost savings and consolidation initiatives, or other expense reduction measures we take in the future, may not result in the expected cost savings.
We may make acquisitions that could subject us to a number of operational risks and we may not be successful in integrating companies we acquire into our existing operations.
We have made and expect to make in the future acquisitions that complement our core competencies in technology and manufacturing to enable us to manufacture and sell additional products to our existing customers and to expand our business into related markets. Implementation of our acquisition strategy entails a number of risks, including:
|
•
|
inaccurate assessments of potential liabilities associated with the acquired businesses;
|
|
•
|
the existence of unknown or undisclosed liabilities associated with the acquired businesses;
|
|
•
|
diversion of our management’s attention from our core businesses;
|
|
•
|
potential loss of key employees or customers of the acquired businesses;
|
|
•
|
difficulties in integrating the operations and products of an acquired business or in realizing projected revenue growth, efficiencies and cost savings; and
|
-
19
-
|
•
|
increases in indebtedness and limitation in our ability to access capital if needed.
|
Our acquisitions have increased the size and scope of our operations, and may place a strain on our managerial, operational and financial resources and systems. Any failure by us to manage this growth and successfully integrate these acquisitions could harm our business and our financial condition and results.
If we are not successful in making acquisitions to expand and develop our business, our operating results may suffer.
One facet of our growth strategy is to make acquisitions that complement our core competencies in technology and manufacturing to enable us to manufacture and sell additional products to our existing customers and to expand our business into related markets. Our continued growth may depend on our ability to identify and acquire companies that complement or enhance our business on acceptable terms. We may not be able to identify or complete future acquisitions. Some of the risks that we may encounter include expenses associated with and difficulties in identifying potential targets, the costs associated with unsuccessful acquisitions, and higher prices for acquired companies because of competition for attractive acquisition targets.
Interruptions of our manufacturing operations could delay production and affect our operations.
Our products are designed and manufactured in facilities located around the world. In most cases, the manufacturing of specific product lines is concentrated in one or a few locations. Our business involves complex manufacturing processes and hazardous materials that can be dangerous to our employees. Although we employ safety procedures in the design and operation of our facilities, there is a risk that an accident or death could occur. Any accident, such as a chemical spill or fire, could result in significant manufacturing delays or claims for damages resulting from injuries, which would harm our operations and financial condition. The potential liability resulting from any such accident or death, to the extent not covered by insurance, could harm our financial condition or operating results. Any disruption of operations at any of our facilities, and in particular our larger facilities, could harm our business.
Our international sales and operations are subject to a variety of market and financial risks and costs that could affect our profitability and operating results.
Our sales outside the U.S., which accounted for
55%
of sales for
2014
, and our operations in Mexico, Switzerland, France, and Uruguay are and will continue to be subject to a number of risks and potential costs, including:
|
•
|
changes in foreign economic conditions and/or regulatory requirements;
|
|
•
|
local product preferences and product requirements;
|
|
•
|
longer-term receivables than are typical in the U.S.;
|
|
•
|
difficulties in enforcing agreements through foreign legal systems;
|
|
•
|
less protection of intellectual property in some countries outside of the U.S.;
|
|
•
|
trade protection measures and import and export licensing requirements;
|
|
•
|
work force instability;
|
|
•
|
political and economic instability; and
|
|
•
|
complex tax and cash management issues.
|
We earn revenue and incur expenses related to our foreign sales and operations that are denominated in a foreign currency. Historically, foreign currency fluctuations have not had a material effect on our financial results. However, fluctuations in foreign currency exchange rates could have a significant negative impact on our financial results in the future.
Economic and credit market uncertainty could interrupt our access to capital markets, borrowings, or financial transactions to hedge certain risks, which could adversely affect our financial condition.
To date, we have been able to access debt and equity financing that has allowed us to make investments in growth opportunities and fund working capital requirements. In addition, we enter into financial transactions to hedge certain risks, including foreign exchange and interest rate risk. Our continued access to capital markets, the stability of our lenders and their willingness to support our needs, and the stability of the parties to our financial transactions that hedge risks are essential for us to meet our current and long-term obligations, fund operations, and fund our strategic initiatives. An interruption in our access to external financing or financial transactions to hedge risk could affect our business prospects and financial condition.
The failure of our information technology systems to perform as anticipated could disrupt our business and affect our financial condition.
The efficient operation of our business is dependent on our information technology (“IT”) systems. Accordingly, we rely upon the capacity, reliability and security of our IT hardware and software infrastructure and our ability to expand and update this infrastructure in response to our changing needs. Despite our implementation of security measures, our systems are vulnerable
-
20
-
to damages from computer viruses, natural disasters, incursions by intruders or hackers, failures in hardware or software, power fluctuations, cyber terrorists and other similar disruptions. The failure of our IT systems to perform as anticipated for any reason or any significant breach of security could disrupt our business and result in numerous consequences, including reduced effectiveness and efficiency of operations, inappropriate disclosure of confidential information, increased overhead costs and loss of important information, which could have a material effect on our business and results of operations. In addition, we may be required to incur significant costs to protect against damage caused by these disruptions or security breaches in the future.
Risks Related To Our Industries
The healthcare industry is highly regulated and subject to various political, economic and regulatory changes that could increase our compliance costs and force us to modify how we develop and price our products.
The healthcare industry is highly regulated and is influenced by changing political, economic and regulatory factors. Several of our product lines are subject to international, federal, state and local health and safety, packaging and product content regulations. In addition, medical devices are subject to regulation by the FDA and similar governmental agencies. These regulations cover a wide variety of product activities from design and development to labeling, manufacturing, promotion, sales and distribution. Compliance with these regulations may be time consuming, burdensome and expensive and could negatively affect our ability to sell products. This may result in higher than anticipated costs or lower than anticipated revenues.
Furthermore, healthcare industry regulations are complex, change frequently and have tended to become more stringent over time. Federal and state legislatures have periodically considered programs to reform or amend the U.S. healthcare system at both the federal and state levels. In addition, these regulations may contain proposals to increase governmental involvement in healthcare, lower reimbursement rates or otherwise change the environment in which healthcare industry participants operate. We may be required to incur significant expenses to comply with these regulations or remedy past violations of these regulations. Our failure to comply with applicable government regulations could also result in cessation of portions or all of our operations, impositions of fines and restrictions on our ability to carry on or expand our operations. In addition, because many of our products are sold into regulated industries, we must comply with additional regulations in marketing our products.
In response to perceived increases in healthcare costs in recent years, there have been and continue to be proposals by the Obama administration, members of Congress, state governments, regulators and third-party payors to control these costs and, more generally, to reform the U.S. healthcare system. Health Care Reform imposes significant new taxes on medical device manufacturers, which will result in a significant increase in the tax burden on our industry and which could have a material negative impact on our financial condition, results of operations and our cash flows. Other elements of Health Care Reform such as comparative effectiveness research, an independent payment advisory board, payment system reforms including shared savings pilots and other provisions could meaningfully change the way healthcare is developed and delivered, and may materially adversely impact numerous aspects of our business, results of operations and financial condition. In 2014, the medical device tax increased our cost of sales by
$0.7 million
.
Many significant parts of Health Care Reform will be phased in over time and require further guidance and clarification in the form of regulations. As a result, many of the impacts of Health Care Reform will not be known until those regulations are enacted, which we expect to occur over the next several years.
Our business is subject to environmental regulations that could be costly to comply with.
Federal, state and local regulations impose various environmental controls on the manufacturing, transportation, storage, use and disposal of batteries and hazardous chemicals and other materials used in, and hazardous waste produced by the manufacturing of our products. Conditions relating to our historical operations may require expenditures for clean-up in the future and changes in environmental laws and regulations may impose costly compliance requirements on us or otherwise subject us to future liabilities. Additional or modified regulations relating to the manufacture, transportation, storage, use and disposal of materials used to manufacture our products or restricting disposal or transportation of batteries may be imposed that may result in higher costs or lower operating results. In addition, we cannot predict the effect that additional or modified environmental regulations may have on us or our customers.
-
21
-
Our international operations expose us to legal and regulatory risks, which could have a material effect on our business.
Our profitability and international operations are, and will continue to be, subject to risks relating to changes in foreign legal and regulatory requirements. In addition, our international operations are governed by various U.S. laws and regulations, including Foreign Corrupt Practices Act (“FCPA”) and other similar laws that prohibit us and our business partners from making improper payments or offers of payment to foreign governments and their officials and political parties for the purpose of obtaining or retaining business. Any alleged or actual violations of these regulations may subject us to government scrutiny, severe criminal or civil sanctions and other liabilities and could negatively affect our business, reputation, operating results, and financial condition.
Consolidation in the healthcare industry could result in greater competition and reduce our revenues and harm our business.
Many healthcare industry companies are consolidating to create new companies with greater market power. As the healthcare industry consolidates, competition to provide products and services to industry participants will become more intense. These industry participants may try to use their market power to negotiate price concessions or reductions for our products. If we are forced to reduce our prices, our revenues would decrease and our operating results would suffer.
Our business is indirectly subject to healthcare industry cost containment measures that could result in reduced sales of our products.
Several of our customers rely on third party payors, such as government programs and private health insurance plans, to reimburse some or all of the cost of the procedures in which our products are used. The continuing efforts of government, insurance companies and other payors of healthcare costs to contain or reduce those costs could lead to patients being unable to obtain approval for payment from these third party payors. If that occurred, sales of medical devices may decline significantly and our customers may reduce or eliminate purchases of our products. The cost containment measures that healthcare payors are instituting, both in the U.S. and internationally, could reduce our revenues and harm our operating results.
Our energy market revenues are dependent on conditions in the oil and natural gas industry, which historically have been volatile.
Sales of our products into the energy market depends upon the condition of the oil and gas industry. In the past, oil and natural gas prices have been volatile and the oil and gas exploration and production industry has been cyclical, and it is likely that oil and natural gas prices will continue to fluctuate in the future. The current and anticipated prices of oil and natural gas influence the oil and gas exploration and production business and are affected by a variety of political and economic factors, including worldwide demand for oil and natural gas, worldwide and domestic supplies of oil and natural gas, the ability of the Organization of Petroleum Exporting Countries (“OPEC”) to set and maintain production levels and pricing, the level of production of non-OPEC countries, the price and availability of alternative fuels, political stability in oil producing regions and the policies of the various governments regarding exploration and development of their oil and natural gas reserves. A change in the oil and gas exploration and production industry or a reduction in the exploration and production expenditures of oil and gas companies could cause our energy market revenues to decline.
|
ITEM 1B.
|
UNRESOLVED STAFF COMMENTS
|
|
None.
-
22
-
|
ITEM 2.
|
PROPERTIES
|
|
The following table sets forth information about our principal facilities as of January 2, 2015:
|
Location
|
Sq. Ft.
|
Own/Lease
|
Principal Use
|
|||
|
Alden, NY
|
125,000
|
|
Own
|
Medical battery and capacitor manufacturing
|
||
|
Ann Arbor, MI
|
9,970
|
|
Lease
|
Office and lab space for design engineering team
|
||
|
Beaverton, OR
|
62,200
|
|
Lease
|
Commercial battery manufacturing
|
||
|
Biel, Switzerland
|
1,000
|
|
Lease
|
European corporate offices
|
||
|
Blaine, MN
|
32,400
|
|
Own
|
Medical device engineering
|
||
|
Chaumont, France
|
59,200
|
|
Own
|
Manufacturing of orthopaedic implants
|
||
|
Clarence, NY
|
117,800
|
|
Own
|
Corporate offices and RD&E
|
||
|
Clarence, NY
|
20,800
|
|
Own
|
Machining and assembly of components
|
||
|
Clarence, NY
|
18,600
|
|
Lease
|
Machining and assembly of components
|
||
|
Cleveland, OH
|
16,900
|
|
Lease
|
Office and lab space for design engineering team
|
||
|
Fort Wayne, IN
|
81,000
|
|
Own
|
Manufacturing of orthopaedic instruments
|
||
|
Frisco, TX
|
9,200
|
|
Lease
|
Global headquarters – principal executive office
|
||
|
Indianapolis, IN
|
82,600
|
|
Own
|
Manufacturing of orthopaedic cases and trays
|
||
|
Minneapolis, MN
|
72,000
|
|
Own
|
Enclosure manufacturing and engineering
|
||
|
Montevideo, Uruguay
|
21,900
|
|
Lease
|
Active implantable medical device systems assembly
|
||
|
Plymouth, MN
|
122,800
|
|
Lease
|
Introducers, catheters and leads manufacturing
|
||
|
Raynham, MA
|
81,000
|
|
Own
|
Commercial battery manufacturing and RD&E
|
||
|
Tijuana, Mexico
|
190,800
|
|
Lease
|
Feedthrough, catheters and orthopaedic instrument manufacturing and value-added assembly
|
||
|
Tijuana, Mexico
|
144,000
|
|
Lease
|
Portable medical and electronics assembly
|
||
|
Warsaw, IN
|
3,000
|
|
Lease
|
Orthopaedic rapid prototyping design center
|
||
In 2012, we completed construction of an orthopaedic manufacturing facility in Fort Wayne, IN and transferred manufacturing operations being performed at our Columbia City, IN location into this new facility. During 2012, we also transferred most major functions performed at our facilities in Orvin and Corgemont, Switzerland into our Fort Wayne, IN and Tijuana, Mexico facilities. Additionally, during 2012, we relocated our global headquarters to Frisco, TX. During 2013, our Corgemont, Switzerland facility lease was assumed by a third party in connection with our sale of certain non-core orthopaedic product lines. During 2013, we began a project to expand our Chaumont, France facility in order to enhance our capabilities and fulfill larger volume customer supply agreements. This initiative is expected to be completed over the next two years.
In 2014, we announced several initiatives to invest in capacity and capabilities and to better align our resources to meet customers' needs and drive organic growth and profitability. These included the following:
|
•
|
Functions currently performed at our facility in Plymouth, MN to manufacture catheters and introducers will transfer into our existing facility in Tijuana, Mexico by the first half of 2016.
|
|
•
|
Functions currently performed at our facilities in Beaverton, OR and Raynham, MA to manufacture products for the portable medical market will transfer to a new facility in Tijuana, Mexico by the end of 2015.
|
|
•
|
Functions currently performed at our Cleveland, OH facility were transferred to our facilities in Minnesota.
|
|
•
|
Establishing a commercial operations hub at our global headquarters in Frisco, Texas. This initiative will build upon the investment we have made in our global sales and marketing function and is expected to be completed during the first half of 2015.
|
The total capital investment expected for these initiatives is between $25.0 million and $27.0 million, of which $4.0 million has been expended to date.
-
23
-
|
ITEM 3.
|
LEGAL PROCEEDINGS
|
|
On December 21, 2012, the Company and several other unaffiliated parties were named as defendants in a personal injury and wrongful death action filed in the 113th Judicial District Court of Harris County, Texas. The complaint seeks damages alleging marketing and product defects and failure to warn, negligence and gross negligence relating to a product the Company manufactured and sold to a customer, one of the other named defendants. The Company’s customer, in turn, incorporated the Greatbatch product into its own product which it sold to a third party, another named defendant. On December 3, 2014, the District Court granted Greatbatch’s motion for summary judgment and dismissed all claims against the Company. The ruling is subject to appeal by the plaintiff.
We are indemnified by our customer against any loss in this matter, including costs of defense, which obligation is supported by its customer’s product liability insurance coverage. We also have our own product liability insurance coverage. During January 2015, Greatbatch’s customer reached a tentative, confidential settlement with the plaintiffs which, if approved by the Court, is expected to result in a release of all claims, including appeal rights, against us and our customer.
We are party to various legal actions arising in the normal course of business. A description of pending legal actions against the Company is set forth in Note 15 “Commitments and Contingencies” of the Notes to Consolidated Financial Statements contained in Item 8 of this report. We do not believe that the ultimate resolution of any pending legal actions will have a material effect on our consolidated results of operations, financial position or cash flows. However, litigation is subject to inherent uncertainties and there can be no assurance that any pending legal action, which we currently believe to be immaterial, does not become material in the future.
|
ITEM 4.
|
MINE SAFETY DISCLOSURES
|
|
Not applicable.
|
ITEM 5.
|
MARKET FOR REGISTRANT’S COMMON EQUITY, RELATED STOCKHOLDER MATTERS AND ISSUER PURCHASES OF EQUITY SECURITIES
|
|
The Company’s common stock trades on the New York Stock Exchange (“NYSE”) under the symbol “GB.” The following table sets forth information on the prices of our common stock as reported by the NYSE:
|
High
|
Low
|
Close
|
|||||||||
|
2013
|
|||||||||||
|
First Quarter
|
$
|
30.64
|
|
$
|
22.70
|
|
$
|
29.87
|
|
||
|
Second Quarter
|
34.41
|
|
27.03
|
|
32.79
|
|
|||||
|
Third Quarter
|
38.36
|
|
32.70
|
|
33.69
|
|
|||||
|
Fourth Quarter
|
45.02
|
|
33.24
|
|
43.80
|
|
|||||
|
2014
|
|||||||||||
|
First Quarter
|
$
|
47.78
|
|
$
|
40.02
|
|
$
|
44.85
|
|
||
|
Second Quarter
|
50.65
|
|
43.65
|
|
49.58
|
|
|||||
|
Third Quarter
|
51.64
|
|
42.23
|
|
43.56
|
|
|||||
|
Fourth Quarter
|
50.69
|
|
43.42
|
|
48.66
|
|
|||||
As of
March 3, 2015
, there were approximately 113 record holders of the Company’s common stock. The Company stock account within our 401(k) plan is considered one record holder for the purposes of this calculation. We have not paid cash dividends and currently intend to retain any earnings to further develop and grow our business.
-
24
-
PERFORMANCE GRAPH
The following graph compares, for the five year period ended January 2, 2015, the cumulative total stockholder return for Greatbatch, Inc., the S&P SmallCap 600 Index, and the Hemscott Peer Group Index. The Hemscott Peer Group Index includes approximately 110 comparable companies included in the Hemscott Industry Group 520
Medical Instruments & Supplies
and 521
Medical Appliances & Equipment
. The graph assumes that $100 was invested on January 1, 2010 and assumes reinvestment of dividends. The stock price performance shown on the following graph is not necessarily indicative of future price performance.
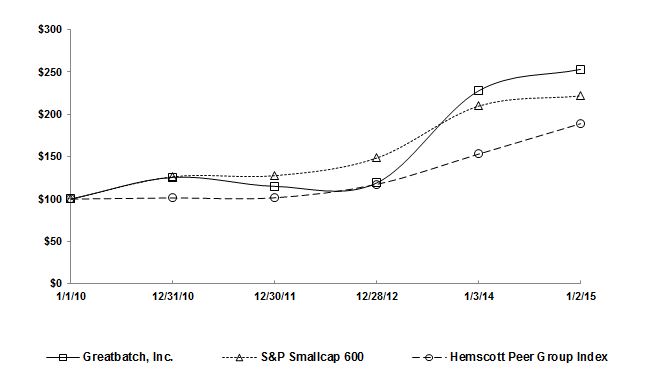
|
Company/Index
|
1/1/10
|
12/31/10
|
12/30/11
|
12/28/12
|
1/3/14
|
1/2/15
|
|
|
Greatbatch, Inc.
|
$ 100.00
|
$ 125.59
|
$ 114.92
|
$ 119.03
|
$ 227.77
|
$ 253.04
|
|
|
S&P Smallcap 600
|
100.00
|
126.31
|
127.59
|
148.42
|
209.74
|
221.81
|
|
|
Hemscott Peer Group Index
|
100.00
|
101.25
|
101.46
|
117.35
|
153.09
|
188.97
|
|
-
25
-
|
ITEM 6.
|
SELECTED FINANCIAL DATA
|
|
The following table provides selected financial data for the periods indicated. You should read this data along with Item 7, “Management’s Discussion and Analysis of Financial Condition and Results of Operations,” and Item 8, “Financial Statements and Supplementary Data” appearing elsewhere in this report. The consolidated statement of operations data and the consolidated balance sheet data for the fiscal years indicated have been derived from our consolidated financial statements and related notes (in thousands, except per share amounts):
|
|
Years Ended
|
||||||||||||||||||
|
Jan. 2
2015
(1)(2)
|
Jan. 3
2014
(1)
|
Dec. 28,
2012
(1)(2)
|
Dec. 30,
2011
(1)(2)
|
Dec. 31,
2010
(1)(3)
|
|||||||||||||||
|
Statement of Operations Data:
|
|||||||||||||||||||
|
Sales
|
$
|
687,787
|
|
$
|
663,945
|
|
$
|
646,177
|
|
$
|
568,822
|
|
$
|
533,425
|
|
||||
|
Net income (loss)
|
55,458
|
|
36,267
|
|
(4,799
|
)
|
33,122
|
|
33,138
|
|
|||||||||
|
Earnings (loss) per share
|
|||||||||||||||||||
|
Basic
|
$
|
2.23
|
|
$
|
1.51
|
|
$
|
(0.20
|
)
|
$
|
1.42
|
|
$
|
1.44
|
|
||||
|
Diluted
|
2.14
|
|
1.43
|
|
(0.20
|
)
|
1.40
|
|
1.40
|
|
|||||||||
|
Balance Sheet Data:
|
|||||||||||||||||||
|
Working capital
|
$
|
242,022
|
|
$
|
190,731
|
|
$
|
176,376
|
|
$
|
170,907
|
|
$
|
150,922
|
|
||||
|
Total assets
|
956,009
|
|
890,703
|
|
889,875
|
|
881,347
|
|
776,976
|
|
|||||||||
|
Long-term obligations
|
233,986
|
|
256,846
|
|
317,258
|
|
320,015
|
|
289,560
|
|
|||||||||
|
(1)
|
From 2010 to 2014, we recorded material charges in Other Operating Expenses, Net, primarily related to our cost savings and consolidation initiatives. Additional information is set forth in Note 13 “Other Operating Expenses, Net” of the Notes to Consolidated Financial Statements contained in Item 8 of this report.
|
|
(2)
|
On August 12, 2014, February 16, 2012, and December 15, 2011, we acquired Centro de Construcción de Cardioestimuladores del Uruguay, NeuroNexus Technologies, Inc., and Micro Power Electronics, Inc., respectively. This data includes the results of operations of these companies subsequent to their acquisition. Additional information is set forth in Note 2 “Acquisitions” of the Notes to Consolidated Financial Statements contained in Item 8 of this report. During 2014 and 2011, we sold cost method investments, which resulted in pre-tax gains of $3.2 million and $4.5 million, respectively.
|
|
(3)
|
In 2010, we recognized a $9.5 million pre-tax gain in connection with the settlement of an outstanding lawsuit.
|
-
26
-
|
ITEM 7.
|
MANAGEMENT’S DISCUSSION AND ANALYSIS OF FINANCIAL CONDITION AND RESULTS OF OPERATIONS
|
|
YOU SHOULD READ THE FOLLOWING DISCUSSION AND ANALYSIS OF OUR FINANCIAL CONDITION AND RESULTS OF OPERATIONS IN CONJUNCTION WITH OUR FINANCIAL STATEMENTS AND RELATED NOTES INCLUDED IN PART II ITEM 8 “FINANCIAL STATEMENTS AND SUPPLEMENTARY DATA” OF THIS REPORT.
Our Business
|
•
|
Our business
|
|
•
|
Our acquisitions
|
|
•
|
Our customers
|
|
•
|
Use of non-GAAP financial information
|
|
•
|
Strategic and financial overview
|
|
•
|
2015
financial guidance
|
|
•
|
Cost savings and consolidation efforts
|
|
•
|
Product development
|
|
•
|
Government regulation
|
Our Critical Accounting Estimates
|
•
|
Valuation of goodwill and other identifiable intangible assets
|
|
•
|
Stock-based compensation
|
|
•
|
Inventories
|
|
•
|
Tangible long-lived assets
|
|
•
|
Provision for income taxes
|
Our Financial Results
|
•
|
Fiscal
2014
compared with fiscal
2013
|
|
•
|
Fiscal
2013
compared with fiscal
2012
|
|
•
|
Liquidity and capital resources
|
|
•
|
Off-balance sheet arrangements
|
|
•
|
Litigation
|
|
•
|
Contractual obligations
|
|
•
|
Inflation
|
|
•
|
Impact of recently issued accounting standards
|
Our Business
We have two reportable segments: Greatbatch Medical and QiG Group (“QiG”). Greatbatch Medical designs and manufactures products where Greatbatch either owns the intellectual property or has unique manufacturing and assembly expertise. These products include medical devices and components for the cardiac, neuromodulation, orthopaedics, portable medical, vascular and energy markets among others. Our Greatbatch Medical segment also offers value-added assembly and design engineering services for medical devices that utilize its component products.
QiG focuses on developing medical device systems for some of healthcare’s most pressing challenges and reflects Greatbatch’s strategic evolution of its product offerings in order to raise the growth and profitability profile of the Company. QiG utilizes a disciplined and diversified portfolio approach with three investor modes: new medical device systems commercialization, collaborative programs with original equipment manufacturers (“OEMs”) customers, and strategic equity positions in emerging healthcare companies.
Our customers include large multi-national OEMs.
-
27
-
Our Acquisitions
On August 12, 2014 we purchased all of the outstanding common stock of Centro de Construcción de Cardioestimuladores del Uruguay (“CCC”), headquartered in Montevideo, Uruguay. CCC is an active implantable neuromodulation medical device systems developer and manufacturer that produces a range of medical devices including implantable pulse generators, programmer systems, battery chargers, patient wands and leads. This acquisition allows us to more broadly partner with medical device companies, complements our core discrete technology offerings and enhances our medical device innovation efforts. The operating results of CCC were included in our QiG segment from the date of acquisition. The aggregate purchase price of CCC was $19.8 million, which we funded with cash on hand. Total assets acquired from CCC were $26.2 million. Total liabilities assumed from CCC were $6.4 million. For 2014, CCC added approximately $5.8 million to our revenue and increased our net income by $1.2 million.
On February 16, 2012, we purchased all of the outstanding common stock of NeuroNexus Technologies, Inc. (“NeuroNexus”) headquartered in Ann Arbor, MI. NeuroNexus is an active implantable medical device design firm specializing in developing and commercializing neural interface technology, components and systems for neuroscience and clinical markets. NeuroNexus has an extensive intellectual property portfolio, core technologies and capabilities to support the development and manufacturing of innovative neural interface devices across a wide range of applications including neuromodulation, sensing, optical stimulation and targeted drug delivery applications. The operating results of NeuroNexus were included in our QiG segment from the date of acquisition. The aggregate purchase price of NeuroNexus was $13.2 million, which we funded with cash on hand and $10.0 million borrowed under our revolving credit facility. Total assets acquired from NeuroNexus were $14.6 million. Total liabilities assumed from NeuroNexus were $1.4 million. For 2012, NeuroNexus added approximately $2.5 million to our revenue and decreased our net loss by $0.2 million.
Going forward, we will continue to pursue acquisitions to enhance our top and bottom line growth trajectory, and expand our pipeline technologies. Our strategic criteria for these acquisitions is that they should drive expansion in our core markets, allow us to enter adjacent growth markets, are focused on proprietary technology, can be tightly integrated into our operating base, and will enhance our return on invested capital.
Our Customers
Our products are designed to provide reliable, long-lasting solutions that meet the evolving requirements and needs of our customers. The nature and extent of our selling relationships with each customer are different in terms of breadth of products purchased, purchased product volumes, length of contractual commitment, ordering patterns, inventory management and selling prices.
Our Greatbatch Medical customers include large multi-national OEMs, such as Biotronik, Biomet, Boston Scientific, Cyberonics, Halliburton Company, Johnson & Johnson, Medtronic, Philips Healthcare, Smith & Nephew, Sorin Group, St. Jude Medical, Stryker, Zimmer, and Zoll. During
2014
, Biotronik, Johnson & Johnson, Medtronic, and St. Jude Medical collectively accounted for
54%
of our total sales.
QiG customers include numerous scientists, hospitals and universities throughout the world who perform research for the neuroscience and clinical markets. Additionally, with the acquisition of CCC, QiG customers also include various research companies and institutes and early stage medical device companies. QiG’s largest customer is Nevro Corp., who is a customer of CCC.
Use of Non-GAAP Financial Information
We prepare our consolidated financial statements in accordance with generally accepted accounting principles in the United States of America (“GAAP”). Additionally, we consistently report and discuss in our earnings releases and investor presentations adjusted operating income and margin, adjusted net income, adjusted earnings per diluted share, and organic constant currency growth rates. These adjusted amounts, other than organic constant currency growth rates, consist of GAAP amounts excluding the following adjustments to the extent occurring during the period: (i) acquisition-related charges, (ii) facility consolidation, optimization, manufacturing transfer and system integration charges, (iii) asset write-down and disposition charges, (iv) severance charges in connection with corporate realignments or a reduction in force (v) litigation charges and gains, (vi) the impact of certain non-cash charges to interest expense, (vii) unusual or infrequently occurring items, (viii) for 2013 and 2012, DVT expenses in connection with developing our neuromodulation platform, (ix) gain/loss on the sale of investments, (x) the income tax (benefit) related to these adjustments, and (xi) certain tax charges related to the Federal R&D Tax Credit, which are outside the normal benefit received, and the consolidation of our Swiss Orthopaedic facilities in 2012. Adjusted earnings per diluted share were calculated by dividing adjusted net income by adjusted diluted weighted average shares outstanding. To calculate organic constant currency growth rates, which excludes the impact of changes in foreign currency exchange rates, as well as the impact of any acquisitions or divestitures of product lines on sales growth rates, we convert current period sales from local currency to U.S. dollars using the previous periods foreign currency exchange rates and
-
28
-
exclude the amount of sales acquired/divested during the period from the current/previous period amounts, respectively. We believe that the presentation of adjusted operating income and margin, adjusted net income, adjusted diluted earnings per share, and organic constant currency growth rates provides important supplemental information to management and investors seeking to understand the financial and business trends relating to our financial condition and results of operations. These measures are used by management to forecast and evaluate the operational performance of the Company. Additionally, incentive compensation targets for all associates of the Company is based upon adjusted operating income.
Strategic and Financial Overview
The overriding long-term strategic objectives that we have set for our Company are to average annual revenue growth of five percent and to return twice that amount to our bottom line. Our current strategy to achieve these objectives is centered around four strategic imperatives: 1) Organic Growth; 2) Margin Expansion; 3) Medical Device Systems; and 4) Targeted Acquisitions. During 2014, we made strides against each of these, resulting in meaningful returns for our investors, our customers and for the patients who benefit from our technologies worldwide.
The Company utilizes a fifty-two, fifty-three week fiscal year, which ends on the Friday nearest December 31. As a result, the results for 2013 include an additional week of operations in comparison to the same periods of 2014 and 2012. Although this additional week of operations may have impacted certain financial statement line items, management believes that when combined with the additional holiday and weather related shutdowns in 2013, this additional week did not materially impact our 2013 net operating results.
Organic Growth
– Over the last several years we have significantly enhanced our sales and marketing capabilities. This has included moving account executives closer to our major customers, upgrading our sales force with new sales talent, enhancing our sales commission programs, and intensifying our market research. These initiatives contributed to our record sales for 2014 of $687.8 million, which represented a 4% increase over 2013 sales. After adjusting for the $5.8 million of revenue added from our acquisition of CCC in August 2014, as well as the $1 million positive impact of foreign currency exchange rates, sales increased 3% in 2014 due to double digit organic constant currency growth from our orthopaedic (12%) and vascular (22%) product lines due to increased sales force productivity, marketing efforts, and market growth. Partially offsetting these increases were declines in our portable medical and cardiac/neuromodulation product lines due to our strategic shift in 2013 to refocus our portable medical product line offerings to products that have higher profitability, and the impact of several customer inventory reduction initiatives and the end of life impact of two legacy products in our cardiac product line.
Sales for 2013 increased 3% over 2012 sales despite the divestiture of $15 million of certain non-core orthopaedic product lines during the first quarter of 2013. After adjusting for the impact of these divestitures, as well as the $2 million positive impact of foreign currency exchange rates, sales increased 5% in 2013 due to strong organic constant currency growth from our cardiac/neuromodulation (6%) and orthopaedic (20%) product lines due to market share gains, customer product launches, the additional week of sales and the release of backlog stemming from our Swiss consolidation in 2012. Partially offsetting these increases were declines in our vascular and portable medical product lines due to the voluntary recall of two vascular medical devices in 2012 and our increased pricing discipline, which resulted in the loss of some low-margin portable medical business.
For 2015, we expect revenue growth of 4 - 6%, which is in line with our long-term growth goal objectives of 5% growth. Going forward, growth in our cardiac/neuromodulation product line will continue to be negatively impacted by the end of life on two legacy products, as well as continued pressure from our customer’s diversification and cost reduction initiatives. We expect we will be able to mitigate these headwinds through growth from new products, as well as current and projected product development opportunities with our cardiac/neuromodulation customers. We also expect our portable medical product line will continue to be negatively impacted by our strategic shift, discussed above, through the first half of 2015.
Margin Expansion
– We have a longstanding history of operational excellence, which is one of our core competencies. This, when combined with our medical device systems and our organic sales growth strategies, is expected to continue to drive both gross and operating margin expansion. This strategic imperative was evident in our 2014 and 2013 results as gross profit as a percentage of sales (“Gross Margin”) increased 60 basis points and 180 basis points, respectively. These increases primarily resulted from our operational leverage, due to higher sales volumes, and our various productivity initiatives, which more than offset the impact of contractual price concessions granted to our customers in exchange for long-term agreements and a higher mix of lower margin sales in 2014 compared to 2013.
Partially offsetting these increases in Gross Margin were increases in our selling, general and administrative expenses (“SG&A”), which increased 3% and 9% for 2014 and 2013, respectively. These increases were primarily due to our strategic decision near the end of 2012 to invest additional resources in sales and marketing resources in order to drive organic growth. Partially offsetting these increases were the cost savings generated as a result of our various cost savings and consolidation initiatives. See “Cost Savings and Consolidation Efforts” contained in this item for further details on these initiatives.
Research, development and engineering costs, net (“RD&E”) decreased 8% for 2014. This decrease was primarily a result of a lower level of design verification testing (“DVT”) costs in connection with the development of Algovita, our spinal cord
-
29
-
stimulation (“SCS”) system. See further discussion of our medical device systems strategy below. For 2013, RD&E costs increased 3% primarily due to lower customer cost reimbursements due to the timing of achievement of milestones on various projects.
We invest substantial resources in integrating our acquisitions and streamlining our operations in order to drive organic growth and profitability. This strategy was evident during 2014 and 2013 as we announced several initiatives to invest in capacity and capabilities, realign our operating structure, consolidate our orthopaedic footprint, and upgrade our global ERP system. As a result, other operating expenses, net totaled $15.3 million, $15.8 million and $42.3 million for 2014, 2013 and 2012, respectively. The significant other operating expenses, net for 2012 related to the consolidation of our Swiss orthopaedic facilities, which was completed in the first quarter of 2013. As we move forward, investing in our operations will continue to be critical to the success of our strategic imperative to drive margin expansion. For 2015, other operating expenses, net are expected to be higher than 2014 levels, as we continue to invest in capacity and capabilities. See “Cost Savings and Consolidation Efforts” contained in this item for further details on these initiatives.
The net result of the above is that GAAP operating income for 2014 was $75.7 million compared to $61.3 million for 2013 and $25.8 million for 2012. The lower level of operating income in 2012 was primarily due to the costs incurred in connection with our consolidation and productivity initiatives discussed above. Adjusted operating income, which excludes these items, was $91.2 million for 2014, compared to $82.9 million for 2013 and $73.9 million for 2012. Adjusted operating income as a percentage of sales (“Adjusted Operating Margin”) for 2014 was 13.3% compared to 12.5% for 2013 and 11.4% for 2012 and reflects the success the Company has had in leveraging its operating infrastructure and driving margin expansion. We expect these improvements to continue in 2015 as Adjusted Operating Margin is expected to be 13.7% - 14.0% of sales.
A reconciliation of GAAP operating income (loss) to adjusted amounts is as follows (dollars in thousands):
|
|
Greatbatch Medical
|
QiG
|
Unallocated
|
Total
|
|||||||||||||||||||||||||||
|
Jan 2,
2015 |
Jan 3,
2014 |
Jan 2,
2015 |
Jan 3,
2014 |
Jan 2,
2015 |
Jan 3,
2014 |
Jan 2,
2015 |
Jan 3,
2014 |
||||||||||||||||||||||||
|
Total sales
|
$
|
678,285
|
|
$
|
660,902
|
|
$
|
9,502
|
|
$
|
3,043
|
|
$
|
—
|
|
$
|
—
|
|
$
|
687,787
|
|
$
|
663,945
|
|
|||||||
|
Operating income (loss) as reported
|
$
|
126,312
|
|
$
|
111,805
|
|
$
|
(23,256
|
)
|
$
|
(30,484
|
)
|
$
|
(27,402
|
)
|
$
|
(19,982
|
)
|
$
|
75,654
|
|
$
|
61,339
|
|
|||||||
|
Adjustments:
|
|
|
|
|
|
|
|
|
|
|
|
|
|
|
|||||||||||||||||
|
Inventory step-up amortization (COS)
|
—
|
|
—
|
|
260
|
|
—
|
|
—
|
|
—
|
|
260
|
|
—
|
|
|||||||||||||||
|
Medical device DVT expenses (RD&E)
(a)
|
—
|
|
—
|
|
—
|
|
5,793
|
|
—
|
|
—
|
|
—
|
|
5,793
|
|
|||||||||||||||
|
Consolidation and optimization costs
|
10,051
|
|
13,388
|
|
882
|
|
86
|
|
255
|
|
1,284
|
|
11,188
|
|
14,758
|
|
|||||||||||||||
|
Acquisition and integration expenses (income)
|
196
|
|
187
|
|
(713
|
)
|
(690
|
)
|
520
|
|
1
|
|
3
|
|
(502
|
)
|
|||||||||||||||
|
Asset dispositions, severance and other
|
2,493
|
|
1,187
|
|
634
|
|
540
|
|
979
|
|
(193
|
)
|
4,106
|
|
1,534
|
|
|||||||||||||||
|
Adjusted operating income (loss)
|
$
|
139,052
|
|
$
|
126,567
|
|
$
|
(22,193
|
)
|
$
|
(24,755
|
)
|
$
|
(25,648
|
)
|
$
|
(18,890
|
)
|
$
|
91,211
|
|
$
|
82,922
|
|
|||||||
|
Adjusted operating margin
|
20.5
|
%
|
19.2
|
%
|
N/A
|
|
N/A
|
|
N/A
|
|
N/A
|
|
13.3
|
%
|
12.5
|
%
|
|||||||||||||||
|
|
Greatbatch Medical
|
QiG
|
Unallocated
|
Total
|
|||||||||||||||||||||||||||
|
Jan 3,
2014 |
Dec 28,
2012 |
Jan 3,
2014 |
Dec 28,
2012 |
Jan 3,
2014 |
Dec 28,
2012 |
Jan 3,
2014 |
Dec 28,
2012 |
||||||||||||||||||||||||
|
Total sales
|
$
|
660,902
|
|
$
|
643,722
|
|
$
|
3,043
|
|
$
|
2,455
|
|
$
|
—
|
|
$
|
—
|
|
$
|
663,945
|
|
$
|
646,177
|
|
|||||||
|
Operating income (loss) as reported
|
$
|
111,805
|
|
$
|
79,093
|
|
$
|
(30,484
|
)
|
$
|
(32,554
|
)
|
$
|
(19,982
|
)
|
$
|
(20,718
|
)
|
$
|
61,339
|
|
$
|
25,821
|
|
|||||||
|
Adjustments:
|
|
|
|
|
|
|
|
|
|
|
|
|
|||||||||||||||||||
|
Inventory step-up amortization (COS)
|
—
|
|
532
|
|
—
|
|
—
|
|
—
|
|
—
|
|
—
|
|
532
|
|
|||||||||||||||
|
Medical device DVT expenses (RD&E)
|
—
|
|
—
|
|
5,793
|
|
5,190
|
|
—
|
|
—
|
|
5,793
|
|
5,190
|
|
|||||||||||||||
|
Consolidation and optimization costs
|
13,388
|
|
34,372
|
|
86
|
|
6
|
|
1,284
|
|
4,670
|
|
14,758
|
|
39,048
|
|
|||||||||||||||
|
Acquisition and integration (income) expenses
|
187
|
|
1,287
|
|
(690
|
)
|
167
|
|
1
|
|
6
|
|
(502
|
)
|
1,460
|
|
|||||||||||||||
|
Asset dispositions, severance and other
|
1,187
|
|
1,073
|
|
540
|
|
57
|
|
(193
|
)
|
708
|
|
1,534
|
|
1,838
|
|
|||||||||||||||
|
Adjusted operating income (loss)
|
$
|
126,567
|
|
$
|
116,357
|
|
$
|
(24,755
|
)
|
$
|
(27,134
|
)
|
$
|
(18,890
|
)
|
$
|
(15,334
|
)
|
$
|
82,922
|
|
$
|
73,889
|
|
|||||||
|
Adjusted operating margin
|
19.2
|
%
|
18.1
|
%
|
N/A
|
|
NA
|
|
N/A
|
|
N/A
|
|
12.5
|
%
|
11.4
|
%
|
|||||||||||||||
-
30
-
(a) As a result of our premarket approval (“PMA”) submission to the Food and Drug Administration (“FDA”) for Algovita in December 2013, we no longer exclude DVT costs associated with this system from adjusted operating income and adjusted diluted EPS. DVT costs incurred in connection with the development of Algovita were $1.6 million for 2014.
Medical Device Systems
– In 2008, we began evolving our product offerings to include the development of complete medical device systems in order to raise the growth and profitability profile of our Company. This medical device systems strategy is being facilitated through QiG and leverages the component technology of Greatbatch Medical. More specifically, this strategy includes the development of a neuromodulation platform that can be used to support multiple devices. Our first device developed under this platform is Algovita, our SCS system to treat chronic intractable pain of the trunk and/or limbs. We made our PMA submission in December 2013 for Algovita and are on track for approval in the first half of 2015. In 2014, we submitted and received CE Mark approval from the European Notified Body TÜV SÜD America for Algovita.
Medical device costs incurred by QiG were $23.9 million for 2014 compared to $29.4 million for 2013 and $32.7 million for 2012. Medical device costs for 2014 include $1.6 million of DVT costs incurred in connection with the development of Algovita compared to $5.8 million for 2013 and $5.2 million for 2012.
A reconciliation of GAAP net income (loss) and diluted earnings (loss) per share (“EPS”) to adjusted amounts is as follows (in thousands, except per share amounts):
|
|
Year Ended
|
||||||||||||||||||||||
|
|
January 2,
2015 |
January 3,
2014 |
December 28,
2012 |
||||||||||||||||||||
|
|
Net
Income
|
Impact
Per
Diluted
Share
|
Net
Income
|
Impact
Per
Diluted
Share
|
Net
Income
(Loss)
|
Impact
Per
Diluted
Share
|
|||||||||||||||||
|
Net income (loss) as reported
|
$
|
55,458
|
|
$
|
2.14
|
|
$
|
36,267
|
|
$
|
1.43
|
|
$
|
(4,799
|
)
|
$
|
(0.20
|
)
|
|||||
|
Adjustments:
|
|||||||||||||||||||||||
|
Inventory step-up amortization (COS)
(a)
|
195
|
|
0.01
|
|
—
|
|
—
|
|
346
|
|
0.01
|
|
|||||||||||
|
Medical device DVT expenses (RD&E)
(a)
|
—
|
|
—
|
|
3,765
|
|
0.15
|
|
3,374
|
|
0.14
|
|
|||||||||||
|
Consolidation and optimization costs
(a)
|
6,567
|
|
0.25
|
|
10,602
|
|
0.42
|
|
28,934
|
|
1.21
|
|
|||||||||||
|
Acquisition and integration expenses (income)
(a)
|
61
|
|
—
|
|
(326
|
)
|
(0.01
|
)
|
949
|
|
0.04
|
|
|||||||||||
|
Asset dispositions, severance and other
(a)
|
3,463
|
|
0.13
|
|
997
|
|
0.04
|
|
1,186
|
|
0.05
|
|
|||||||||||
|
(Gain) loss on cost and equity method investments, net
(a)(b)
|
(2,841
|
)
|
(0.11
|
)
|
451
|
|
0.02
|
|
69
|
|
—
|
|
|||||||||||
|
CSN conversion option discount and deferred fee acceleration amortization
(a)(c)
|
—
|
|
—
|
|
3,007
|
|
0.12
|
|
6,234
|
|
0.26
|
|
|||||||||||
|
R&D Tax Credit
(d)
|
—
|
|
—
|
|
(1,600
|
)
|
(0.06
|
)
|
—
|
|
—
|
|
|||||||||||
|
Swiss tax impact
(e)
|
—
|
|
—
|
|
—
|
|
—
|
|
6,190
|
|
0.26
|
|
|||||||||||
|
Adjusted net income and diluted EPS
(f)
|
$
|
62,903
|
|
$
|
2.42
|
|
$
|
53,163
|
|
$
|
2.10
|
|
$
|
42,483
|
|
$
|
1.77
|
|
|||||
|
Adjusted diluted weighted average shares
(g)
|
25,975
|
|
25,323
|
|
23,947
|
|
|||||||||||||||||
|
(a)
|
Net of tax amounts computed using a 35% U.S. and France statutory tax rates for the 2014, 2013, and 2012 periods and a 0%, 0%, and 22.5% Switzerland tax rate for the 2014, 2013, and 2012 periods, respectively. For 2014, net of tax amounts computed also include a 25% Uruguay statutory tax rate.
|
|
(b)
|
Pre-tax amount is a gain of $4.4 million, loss of $0.7 million, and loss of $0.1 million for 2014, 2013, and 2012, respectively.
|
|
(c)
|
Pre-tax amount is $4.6 million and $9.6 million for 2013 and 2012, respectively.
|
|
(d)
|
The Federal R&D tax credit was enacted for 2014 during the fourth quarter of 2014. The 2013 amount relates to the 2012 portion of the R&D tax credit which was reinstated in the first quarter of 2013 retroactive to the beginning of 2012. As required, the impact of the R&D tax credit relating to 2012 was recognized in the first quarter of 2013.
|
|
(e)
|
Relates to the loss of our Swiss tax holiday due to our decision to transfer manufacturing out of Switzerland, as well as the establishment of a valuation allowance on our Swiss deferred tax assets as it is more likely than not that they will not be fully realized.
|
|
(f)
|
The per share data in this table has been rounded to the nearest $0.01 and therefore may not sum to the total.
|
|
(g)
|
Adjusted diluted weighted average shares for 2012 includes 363,000 shares of dilution related to outstanding stock incentive awards that were not dilutive for GAAP EPS purposes.
|
-
31
-
Adjusted diluted EPS increased 15% in 2014 and 19% in 2013 and reflects the benefit of our strategic imperatives. Going forward, our strategic objective of returning two times our revenue growth rate to adjusted diluted EPS remains unchanged as we are providing guidance of 5-12% adjusted diluted EPS growth for 2015.
Targeted Acquisitions
– The results for 2014, 2013 and 2012 include the impact of our acquisition of CCC in August 2014 and NeuroNexus in February 2012. Going forward, we will continue to pursue acquisitions to enhance our top and bottom line growth trajectory, and expand our pipeline technologies. Our strategic criteria for these acquisitions is that they should drive expansion in our core markets, allow us to enter adjacent growth markets, are focused on proprietary technology, can be tightly integrated into our operating base, and will enhance our return on invested capital.
We expect 2015 to be a transformative year for Greatbatch. FDA PMA approval of Algovita is on track for the first half of the year and we are leveraging our broad intellectual property portfolio to be a leading manufacturer for the neuromodulation market with complete systems and component
projects. Furthermore, we expect to enhance our competitive position as we bring on-line a new facility for our Portable Medical category and transfer other production lines to an existing facility in Mexico. We are focused on delivering our 2015 commitments but recognize that most of the benefit of these initiatives will impact 2016 and beyond.
2015
Financial Guidance
|
We are estimating the following for 2015:
|
|
|
Sales
|
$715 - $730 million
|
|
GAAP Operating Income as a % of Sales
|
10.7% - 11.0%
|
|
Adjusted Operating Income as a % of Sales
|
13.7% - 14.0%
|
|
Capital Expenditures
|
$35 - $45 million
|
|
GAAP Effective Tax Rate
|
~25%
|
|
Adjusted Effective Tax Rate
|
~26%
|
|
GAAP Diluted EPS
|
$2.02 - $2.12
|
|
Adjusted Diluted EPS
|
$2.61 - $2.71
|
|
Diluted Weighted Average Shares
|
26,500,000
|
Adjusted operating income for 2015 is expected to consist of GAAP operating income excluding items such as acquisition, consolidation, integration, and asset disposition/write-down charges totaling approximately $22 million. The after tax impact of these items is estimated to be $14 million or approximately $0.54 per diluted share. Adjusted diluted EPS also includes the benefit of the Federal R&D tax credit of approximately $0.06 per diluted share which has not yet been enacted for 2015.
We continue to evaluate commercialization options and therefore our guidance does not reflect the commercialization of Algovita. Our guidance also does not include the impact of additional acquisitions.
For the first quarter 2015, we expect our customers to continue to aggressively manage inventory and we will continue to be impacted by end of life of products. These actions coupled with continued currency pressures and our strong first quarter 2014 sales performance lead us to believe year over year sales for the first quarter 2015 will be below the first quarter 2014, in the high single digit percent range. We expect considerable momentum will be built throughout 2015 based on new product launches that offset the effect of the end of life products. We expect foreign currency translation to have a negative impact on sales of approximately 1% to 1.5%. As a result, we expect to be closer to the lower end of the above full year guidance for revenue.
-
32
-
Cost Savings and Consolidation Efforts
In 2014, 2013, and 2012, we recorded charges in Other Operating Expenses, Net related to various cost savings and consolidation initiatives. These initiatives were undertaken to improve our operational efficiencies and profitability the most significant of which are as follows (in millions):
|
Initiative
|
Expected Expense
|
Expected Capital
|
Expected Annual Cost Savings
|
Expected Completion Date
|
||||
|
2014 investments in capacity and capabilities
|
$29 - $34
|
$25 - $27
|
> $20
|
2016
|
||||
|
2013 operating unit realignment
|
$6.6
|
—
|
> $7
|
Q4 2014
|
||||
|
Orthopaedic/medical device facilities optimization
|
$45 - $50
|
$43 - $48
|
$10 - $15
|
2016
|
||||
See Note 13 “Other Operating Expenses, Net” of the Notes to Consolidated Financial Statements contained in Item 8 of this report for additional information about the timing, cash flow impact and amount of future expenditures for these initiatives. We continually evaluate our operating structure in order to maximize efficiencies and drive margin expansion. In 2015, other operating expenses, net are expected to be higher than the 2014 levels primarily due to the 2014 investments in capacity and capabilities initiatives.
Product Development
Greatbatch Medical
Our core business is well positioned because our OEM customers leverage our portfolio of intellectual property, and we continue to build a healthy pipeline of diverse medical technology opportunities. These product development opportunities, when combined with the investments we have made in our sales and marketing resources, are expected to allow us to meet our five percent revenue growth objectives. Some of the more significant product development opportunities Greatbatch Medical is pursuing are as follows:
|
Product Line
|
Product Development Opportunities
|
|
|
Cardiac/ Neuromodulation
|
Developing next generation technology programs including Gen 2 Q
HR
battery, next generation filtered feedthroughs, and high voltage capacitors.
|
|
|
Orthopaedic
|
Developing next generation reamers, hip and bone preparation instruments, as well as disposable kits, and power solutions for surgical tools.
|
|
|
Portable Medical
|
Developing power solutions for various surgical, diagnostic and other market categories where device mobility is critical, including sterilized surgical products, wireless power and battery management technologies.
|
|
|
Vascular
|
Developing introducer technologies to expand into new clinical markets, as well as expanding current introducer and catheter platforms to better serve existing clinical markets and customers.
|
|
|
Energy, Military, Environmental
|
Developing power solutions to advance performance and reliability of battery packs in critical environments.
|
|
QiG
Through QiG, we provide our Greatbatch Medical customers with complete medical device systems. This medical device strategy includes strategic equity investments in medical device technology and products developed independently, as well as in conjunction with our OEM partners. While we do not intend to discuss each of these projects individually, we will discuss significant milestones as they occur.
Algovita, our SCS to treat chronic intractable pain of the trunk and/or limbs, was designed to target unmet clinical needs with a focus on safety and product differentiation for all user groups. This product was submitted for PMA approval to the FDA in December 2013, and in January 2014 documentation for European CE Mark was submitted to the notified body, TÜV SÜD America. CE Mark approval was received in June 2014. Our Algovita project remains on track for regulatory approval in the first half of 2015 and for early commercialization planning in Europe.
QiG is in the early stages of development of two additional medical device systems, which are targeting approved and emerging indications. Based upon the technology acquired from NeuroNexus, QiG is developing a platform of thin-film electrodes for neuromodulation leads, sub-systems and components. Additionally, as a result of our acquisition of CCC, QiG is now able to more broadly partner with medical device companies, leveraging Greatbatch Medical’s core components discrete technology, which will enhance our medical device innovation efforts.
-
33
-
Government Regulation
The Patient Protection and Affordable Care Act and the Health Care and Education Affordability Reconciliation Act (collectively “Health Care Reform”) legislated broad-based changes to the U.S. healthcare system that could significantly impact our business operations and financial results, including higher or lower revenue, as well as higher employee medical costs and taxes. Health Care Reform imposes significant new taxes on medical device OEMs, which will result in a significant increase in the tax burden on our industry and which could have a material negative impact on our financial condition, results of operations and our cash flows. Other elements of Health Care Reform such as comparative effectiveness research, an independent payment advisory board, payment system reforms including shared savings pilots and other provisions could meaningfully change the way healthcare is developed and delivered, and may materially impact numerous aspects of our business, results of operations and financial condition. Many significant parts of Health Care Reform will be phased in over the next several years and require further guidance and clarification in the form of regulations. The medical device tax, which was effective in 2013, increased our cost of sales by $0.7 million for 2014 and $0.5 million in 2013.
In the first quarter of 2014, we initiated a voluntary field corrective action for all Standard Offset Cup Impactors after an internal review determined that the sterilization recommendation in the Instructions For Use for the product did not meet requirements for sterility assurance, which has the potential to result in surgical infection. We have validated two sterilization parameters that meet acceptable sterility assurance levels and provided them to affected customers. We have informed the FDA and other government agencies of this action, which impacts all Standard Offset Cup Impactors manufactured and distributed from 2004 to 2013. Greatbatch has received three complaints possibly related to this issue, however no adverse events have been reported. Future customer complaints or negative regulatory actions regarding this product or any of our products could harm our operating results or financial condition.
Our Critical Accounting Estimates
The preparation of our consolidated financial statements in accordance with GAAP requires us to make estimates and assumptions that affect reported amounts and related disclosures. The methods, estimates, and judgments we use in applying our accounting policies have a significant impact on the results we report in our consolidated financial statements. Management considers an accounting estimate to be critical if (1) it requires assumptions to be made that were uncertain at the time the estimate was made; and (2) changes in the estimate or different estimates that could have been selected could have a material impact on our consolidated results of operations, financial position or cash flows. Our most critical accounting estimates are described below. We also have other policies that we consider key accounting policies, such as our policies for revenue recognition; however, these policies do not meet the definition of critical accounting estimates, because they do not generally require us to make estimates or judgments that are difficult or subjective.
Valuation of goodwill and other identifiable intangible assets
When we acquire a company, we allocate the purchase price to the tangible and intangible assets we acquire and liabilities we assume based on their fair value at the date of acquisition. Goodwill is recorded when the purchase price paid for an acquisition exceeds the estimated fair value of the net identified tangible and intangible assets acquired. In addition to goodwill, some of our intangible assets are considered non-amortizing intangible assets as they are expected to generate cash flows indefinitely. Goodwill and indefinite-lived intangibles are not amortized but are required to be assessed for impairment on an annual basis or more frequently if certain indicators are present. Definite-lived intangible assets are amortized over their estimated useful lives and are assessed for impairment if certain indicators are present.
Assumptions/Approach Used
We base the fair value of identifiable tangible and intangible assets on detailed valuations that use information and assumptions provided by management. The fair values of intangible assets are determined using one of three valuation approaches: market, income or cost. The selection of a particular method depends on the reliability of available data and the nature of the asset. The market approach values the asset based on available market pricing for comparable assets. The income approach values the asset based on the present value of risk adjusted cash flows projected to be generated by that asset. The projected cash flows for each asset considers multiple factors from the perspective of a marketplace participant, including current revenue from existing customers, attrition trends, reasonable contract renewal assumptions, royalty rates and expected profit margins giving consideration to historical and expected margins. The cost approach values the asset by determining the current cost of replacing that asset with another of equivalent economic utility. The cost to replace the asset reflects the estimated reproduction or replacement cost, less an allowance for loss in value due to depreciation or obsolescence, with specific consideration given to economic obsolescence if indicated.
We perform an annual review on the last day of each fiscal year, or more frequently if indicators of potential impairment exist, to determine if the recorded goodwill and other indefinite-lived intangible assets are impaired. We assess goodwill for impairment by comparing the fair value of our reporting units to their carrying value to determine if there is potential impairment. When evaluating goodwill for impairment, we may first perform an assessment of qualitative factors, referred to as the “step-zero” approach, to determine if the fair value of the reporting unit is more-likely-than-not greater than its carrying
-
34
-
amount. If, based on the review of the qualitative factors, we determine it is more-likely-than-not that the fair value of the reporting unit is greater than its carrying value, the required two-step quantitative impairment test can be bypassed. If we do not perform a qualitative assessment or if the fair value of the reporting unit is more-likely-than-not less than its carrying value, we must perform the two-step quantitative impairment test, and calculate the estimated fair value of the reporting unit. If, based upon the two-step impairment test, it is determined that the fair value of a reporting unit is less than its carrying value, an impairment loss is recorded to the extent that the implied fair value of the goodwill within the reporting unit is less than its carrying value. Fair values for reporting units are determined based on the income and market approaches. Indefinite-lived intangible assets are evaluated for impairment by using the income approach. Definite-lived intangible assets are reviewed at least quarterly to determine if any conditions exist or a change in circumstances has occurred that would indicate impairment or a change in their remaining useful life.
We do not believe that the indefinite-lived intangible assets or goodwill allocated to our Greatbatch Medical or QiG segments are at risk of failing step one of future annual impairment tests unless operating conditions significantly deteriorate, given the results of our 2014 step zero qualitative analysis as well as the significant amount that our estimated fair value for these assets was in excess of their respective book values as of January 3, 2014, the date of our last step one impairment test. Examples of a significant deterioration in operating conditions for Greatbatch Medical and QiG could include the following: for Greatbatch Medical, the loss of one or more significant customers, technology obsolescence, product liability claims or significant manufacturing disruption, among others. For QiG, regulatory non-approval of new medical device systems, lack of market acceptance, discontinuation of significant development projects, technology obsolescence or failure of technology, among others.
Effect of Variation of Key Assumptions Used
The use of alternative valuation assumptions, including estimated cash flows and discount rates, and alternative estimated useful life assumptions could result in significant changes to our intangible asset fair value estimates. These changes in fair value estimates could impact the amount and timing of future intangible asset amortization expense and/or result in impairment losses.
As part of our 2014 step zero qualitative analysis, we make certain assumptions by evaluating factors including, but not limited to, macro-economic conditions, market and industry conditions, cost factors, competitive environment, share price fluctuations, results of the last impairment test, and the operational stability and the overall financial performance of the reporting units. We also make assumptions involving the projections of future revenues and expenses that impact the results of our step-zero impairment analysis. Significant changes in these estimates and assumptions could create future impairment losses to our goodwill. The assumptions used in our 2014 impairment analysis incorporate the information disclosed in “2015 Financial Guidance” of this section as well as other forward-looking statements made in this Management’s Discussion and Analysis of Financial Condition and Results of Operations section.
For the last step one impairment test for QiG, which was performed as of January 3, 2014, the fair value for our QiG reporting unit was determined primarily through the use of the income approach. The projected cash flows used to determine the fair value of the QiG reporting unit were based upon internal revenue and expense projections, discount rates and probability of success factors based upon the stage of completion of the medical device projects within QiG. Revenue projections are expected to increase for QiG as market share is garnered by each medical device. As QiG products are currently in the clinical and development stage, projected market share penetration rates were assumed to grow from low single digits in the early years up to maximum market share penetration rates that ranged between 6% and 15%. The discounted cash flow analysis for QiG included a discount rate of 20% and probability of success factors ranging between 75% to 90%. The fair value calculation for QiG was corroborated with market data such as recent acquisitions for comparable companies, analyst reports and discussions with potential commercial partners of QiG.
For our indefinite-lived intangible assets, we make estimates of royalty rates, future revenues (consistent with those disclosed in “2015 Financial Guidance” of this section), and discount rates. Significant changes in these estimates could create future impairments of these assets.
Estimation of the useful lives of indefinite- and definite-lived intangible assets is based upon the estimated cash flows of the respective intangible asset and requires significant management judgment. Events could occur that would materially affect our estimates of the useful lives. Significant changes in these estimates and assumptions could change the amount of future amortization expense or could create future impairments of these intangible assets.
The way we allocate resources and evaluate our businesses determines the reporting unit level which goodwill is tested for impairment. Significant changes to these reporting units could create future impairments of goodwill.
As of
January 2, 2015
, we have $440.0 million of intangible assets recorded on our consolidated balance sheet representing 46% of total assets. This includes $65.3 million of amortizing intangible assets, $20.3 million of indefinite-lived intangible assets and $354.4 million of goodwill. A 1% change in the amortization of our intangible assets would change 2014 net income by approximately $0.09 million, or approximately $0.003 per diluted share.
-
35
-
Stock-based compensation
We record compensation costs related to our stock-based awards which include stock options, restricted stock and restricted stock units. We measure stock-based compensation cost at the grant date based on the fair value of the award.
Compensation cost for service-based awards is recognized ratably over the applicable vesting period. Compensation cost for performance awards based on Company financial metrics is reassessed each period and recognized based upon the probability that the performance targets will be achieved. Compensation cost for performance awards based on market metrics (such as total shareholder return) is expensed each period whether the performance metrics are achieved or not. The amount of stock-based compensation expense recognized during a period is based on the portion of the awards that are ultimately expected to vest, as well as market and nonmarket performance award considerations. The total expense recognized over the vesting period will only be for those awards that ultimately vest, as well as market and nonmarket performance award considerations.
Assumptions/Approach Used
We utilize the Black-Scholes Option Pricing Model to determine the fair value of stock options. We are required to make certain assumptions with respect to selected Black-Scholes model inputs, including expected volatility, expected life, expected dividend yield and the risk-free interest rate. Expected volatility is based on the historical volatility of our stock over the most recent period commensurate with the estimated expected life of the stock options. The expected life of stock options granted, which represents the period of time that the stock options are expected to be outstanding, is based, primarily, on historical data. The expected dividend yield is based on our history and expectation of dividend payouts. The risk-free interest rate is based on the U.S. Treasury yield curve in effect at the time of grant for a period commensurate with the estimated expected life.
The fair value of time-based as well as nonmarket-based performance restricted stock and restricted stock unit awards is equal to the fair value of the Company’s stock on the date of grant. The fair value of market-based performance restricted stock unit awards is determined by utilizing a Monte Carlo simulation model, which projects the value of Greatbatch stock versus our peer group under numerous scenarios and determines the value of the award based upon the present value of these projected outcomes.
Compensation cost for nonmarket-based performance awards is reassessed each period and recognized based upon the probability that the performance targets will be achieved. That assessment is based upon actual and expected future performance.
Stock-based compensation expense is recorded for those awards that are expected to vest, as well as market and nonmarket performance award considerations. Forfeiture estimates for determining appropriate stock-based compensation expense are estimated at the time of grant based on historical experience and demographic characteristics. Revisions are made to those estimates in subsequent periods if actual forfeitures differ from estimated forfeitures.
Effect of Variation of Key Assumptions Used
Option pricing models were developed for use in estimating the value of traded options that have no vesting restrictions and are fully transferable. Because our share-based payments have characteristics significantly different from those of freely traded options, and because changes in the subjective input assumptions can materially affect our estimates of fair values, existing valuation models may not provide reliable measures of the fair values of our share-based compensation. Consequently, there is a risk that our estimates of the fair values of our share-based compensation awards may bear little resemblance to the actual values realized upon the exercise, expiration or forfeiture of those share-based payments in the future. Stock options may expire worthless or otherwise result in zero intrinsic value as compared to the fair values originally estimated on the grant date and reported in our consolidated financial statements. Alternatively, value may be realized from these instruments that are significantly in excess of the fair values originally estimated on the grant date and reported in our consolidated financial statements. There are significant differences among valuation models. This may result in a lack of comparability with other companies that use different models, methods and assumptions.
There is a high degree of subjectivity involved in selecting assumptions to be utilized to determine fair value and forfeiture assumptions. If factors change and result in different assumptions in future periods, the expense that we record for future grants may differ significantly from what we have recorded in the current period. Additionally, changes in performance of the Company and its stock price will affect the likelihood that performance-based targets are achieved and could materially impact the amount of stock-based compensation expense recognized.
A 1% change in our stock-based compensation expense would change
2014
net income by approximately $0.09 million, or approximately $0.003 per diluted share.
-
36
-
Inventories
Inventories are stated at the lower of cost, determined using the first-in, first-out method, or market.
Assumptions/Approach Used
Inventory costing requires complex calculations that include assumptions for overhead absorption, scrap, sample calculations, manufacturing yield estimates and the determination of which costs may be capitalized. The valuation of inventory requires us to estimate obsolete or excess inventory, as well as inventory that is not of saleable quality.
Effect of Variation of Key Assumptions Used
Variations in methods or assumptions could have a material impact on our results. If our demand forecast for specific products is greater than actual demand and we fail to reduce manufacturing output accordingly, we could be required to record additional inventory write-downs or expense a greater amount of overhead costs, which would have a negative impact on our net income. As of
January 2, 2015
, we have $129.2 million of inventory recorded on our consolidated balance sheet representing 14% of total assets. A 1% write-down of our inventory would change
2014
net income by approximately $0.8 million, or approximately $0.03 per diluted share.
Tangible long-lived assets
Property, plant and equipment and other tangible long-lived assets are carried at cost. The cost of property, plant and equipment is charged to depreciation expense over the estimated life of the operating assets primarily using straight-line rates. Tangible long-lived assets are subject to impairment assessment if certain indicators are present.
Assumptions/Approach Used
We assess the impairment of tangible long-lived assets when events or changes in circumstances indicate that the carrying value of the asset (asset group) may not be recoverable. Factors that we consider in deciding when to perform an impairment review include, but are not limited to: a significant decrease in the market price of the asset (asset group); a significant change in the extent or manner in which a long-lived asset (asset group) is being used or in its physical condition; a significant change in legal factors or in the business climate that could affect the value of a long-lived asset (asset group), including an action or assessment by a regulator; an accumulation of costs significantly in excess of the amount originally expected for the construction; a current-period operating or cash flow loss combined with a history of operating or cash flow losses or a projection or forecast that demonstrates continuing losses associated with the use of a long-lived asset (asset group); or a current expectation that, more likely than not, a long-lived asset (asset group) will be sold or otherwise disposed of significantly before the end of its previously estimated useful life. Recoverability potential is measured by comparing the carrying amount of the asset (asset group) to the related total future undiscounted cash flows. The projected cash flows for each asset (asset group) considers multiple factors, including current revenue from existing customers, proceeds from the sale of the asset (asset group), reasonable contract renewal assumptions, and expected profit margins giving consideration to historical and expected margins. If an asset’s (assets group’s) carrying value is not recoverable through related undiscounted cash flows, the asset (asset group) is considered to be impaired. Impairment is measured by comparing the asset’s (asset group’s) carrying amount to its fair value. When it is determined that useful lives of assets are shorter than originally estimated, and there are sufficient cash flows to support the carrying value of the assets, we accelerate the rate of depreciation in order to fully depreciate the assets over their shorter useful lives.
Effect of Variation of Key Assumptions Used
Estimation of the cash flows and useful lives of tangible assets that are long-lived requires significant management judgment. Events could occur that would materially affect our estimates and assumptions. Unforeseen changes in operations or technology could substantially alter the assumptions regarding the ability to realize the return of our investment in long-lived assets or the useful lives. Also, as we make manufacturing process conversions and other facility consolidation decisions, we must make subjective judgments regarding the remaining cash flows and useful lives of our assets, primarily manufacturing equipment and buildings. Significant changes in these estimates and assumptions could change the amount of future depreciation expense or could create future impairments of these long-lived assets (asset groups).
As of
January 2, 2015
we have $144.9 million of tangible long-lived assets recorded on our consolidated balance sheet representing 15% of total assets. A 1% write-down in our tangible long-lived assets would change
2014
net income by approximately $0.9 million, or approximately $0.04 per diluted share.
Provision for income taxes
Our consolidated financial statements have been prepared using the asset and liability approach in accounting for income taxes, which requires the recognition of deferred income taxes for the expected future tax consequences of net operating losses, credits, and temporary differences between the financial statement carrying amounts and the tax bases of assets and liabilities. A
-
37
-
valuation allowance is provided on deferred tax assets if it is determined that it is more likely than not that the asset will not be realized.
Assumptions/Approach Used
In recording the provision for income taxes, management must estimate the future tax rates applicable to the reversal of temporary differences based upon the timing of expected reversal. Also, estimates are made as to whether taxable operating income in future periods will be sufficient to fully recognize any gross deferred tax assets. If recovery is not likely, we must increase our provision for income taxes by recording a valuation allowance against the deferred tax assets that we estimate will not ultimately be recoverable. Alternatively, we may make estimates about the potential usage of deferred tax assets that decrease our valuation allowances.
The calculation of our tax liabilities involves dealing with uncertainties in the application of complex tax regulations. Significant judgment is required in evaluating our tax positions and determining our provision for income taxes. During the ordinary course of business, there are many transactions and calculations for which the ultimate tax determination is uncertain. We establish reserves for uncertain tax positions when we believe that certain tax positions do not meet the more likely than not threshold. We adjust these reserves in light of changing facts and circumstances, such as the outcome of a tax audit or the lapse of statutes of limitations. The provision for income taxes includes the impact of reserve provisions and changes to the reserves that are considered appropriate.
Effect of Variation of Key Assumptions Used
Changes could occur that would materially affect our estimates and assumptions regarding deferred taxes. Changes in current tax laws and tax rates could affect the valuation of deferred tax assets and liabilities, thereby changing the income tax provision. Also, significant declines in taxable income could materially impact the realizable value of deferred tax assets. At
January 2, 2015
, we had $31.2 million of gross deferred tax assets on our consolidated balance sheet and a valuation allowance of $10.7 million has been established for certain deferred tax assets as it is more likely than not that they will not be realized. A 1% change in the effective tax rate would impact the current year provision for income taxes by $0.8 million, and
2014
diluted earnings per share by $0.03 per diluted share.
-
38
-
Our Financial Results
We utilize a fifty-two, fifty-three week fiscal year ending on the Friday nearest December 31. Fiscal years
2014
,
2013
and
2012
ended on
January 2, 2015
,
January 3, 2014
and
December 28, 2012
, respectively. Fiscal year 2013 contained fifty-three weeks. Fiscal years 2014 and 2012 each contained fifty-two weeks.
|
|
Year Ended
|
2014 vs. 2013
|
2013 vs. 2012
|
||||||||||||||||||||||
|
January 2,
2015 |
January 3,
2014 |
December 28,
2012 |
$
Change
|
%
Change
|
$
Change
|
%
Change
|
|||||||||||||||||||
|
Dollars in thousands, except per share data
|
|||||||||||||||||||||||||
|
Greatbatch Medical Sales
|
|||||||||||||||||||||||||
|
Cardiac/Neuromodulation
|
$
|
321,419
|
|
$
|
325,412
|
|
$
|
306,669
|
|
$
|
(3,993
|
)
|
(1
|
)%
|
$
|
18,743
|
|
6
|
%
|
||||||
|
Orthopaedics
|
147,296
|
|
130,247
|
|
122,061
|
|
17,049
|
|
13
|
%
|
8,186
|
|
7
|
%
|
|||||||||||
|
Portable Medical
|
69,043
|
|
78,743
|
|
81,659
|
|
(9,700
|
)
|
(12
|
)%
|
(2,916
|
)
|
(4
|
)%
|
|||||||||||
|
Vascular
|
58,770
|
|
48,357
|
|
51,980
|
|
10,413
|
|
22
|
%
|
(3,623
|
)
|
(7
|
)%
|
|||||||||||
|
Energy, Military, Environmental
|
81,757
|
|
78,143
|
|
81,353
|
|
3,614
|
|
5
|
%
|
(3,210
|
)
|
(4
|
)%
|
|||||||||||
|
Total Greatbatch Medical
|
678,285
|
|
660,902
|
|
643,722
|
|
17,383
|
|
3
|
%
|
17,180
|
|
3
|
%
|
|||||||||||
|
QiG
|
9,502
|
|
3,043
|
|
2,455
|
|
6,459
|
|
212
|
%
|
588
|
|
24
|
%
|
|||||||||||
|
Total sales
|
687,787
|
|
663,945
|
|
646,177
|
|
23,842
|
|
4
|
%
|
17,768
|
|
3
|
%
|
|||||||||||
|
Cost of sales
|
456,389
|
|
444,632
|
|
444,528
|
|
11,757
|
|
3
|
%
|
104
|
|
—
|
%
|
|||||||||||
|
Gross profit
|
231,398
|
|
219,313
|
|
201,649
|
|
12,085
|
|
6
|
%
|
17,664
|
|
9
|
%
|
|||||||||||
|
Gross profit as a % of sales
|
33.6
|
%
|
33.0
|
%
|
31.2
|
%
|
|||||||||||||||||||
|
Selling, general and administrative expenses (SG&A)
|
90,602
|
|
88,107
|
|
80,992
|
|
2,495
|
|
3
|
%
|
7,115
|
|
9
|
%
|
|||||||||||
|
SG&A as a % of sales
|
13.2
|
%
|
13.3
|
%
|
12.5
|
%
|
|||||||||||||||||||
|
Research, development and engineering costs, net (RD&E)
|
49,845
|
|
54,077
|
|
52,490
|
|
(4,232
|
)
|
(8
|
)%
|
1,587
|
|
3
|
%
|
|||||||||||
|
RD&E as a % of sales
|
7.2
|
%
|
8.1
|
%
|
8.1
|
%
|
|||||||||||||||||||
|
Other operating expenses, net
|
15,297
|
|
15,790
|
|
42,346
|
|
(493
|
)
|
(3
|
)%
|
(26,556
|
)
|
(63
|
)%
|
|||||||||||
|
Operating income
|
75,654
|
|
61,339
|
|
25,821
|
|
14,315
|
|
23
|
%
|
35,518
|
|
138
|
%
|
|||||||||||
|
Operating margin
|
11.0
|
%
|
9.2
|
%
|
4.0
|
%
|
|||||||||||||||||||
|
Interest expense
|
4,252
|
|
11,261
|
|
18,054
|
|
(7,009
|
)
|
(62
|
)%
|
(6,793
|
)
|
(38
|
)%
|
|||||||||||
|
(Gain) loss on cost and equity method investments, net
|
(4,370
|
)
|
694
|
|
106
|
|
(5,064
|
)
|
NA
|
|
588
|
|
NA
|
|
|||||||||||
|
Other (income) expense, net
|
(807
|
)
|
546
|
|
931
|
|
(1,353
|
)
|
NA
|
(385
|
)
|
(41
|
)%
|
||||||||||||
|
Provision for income taxes
|
21,121
|
|
12,571
|
|
11,529
|
|
8,550
|
|
68
|
%
|
1,042
|
|
9
|
%
|
|||||||||||
|
Effective tax rate
|
27.6
|
%
|
25.7
|
%
|
171.3
|
%
|
|||||||||||||||||||
|
Net income (loss)
|
$
|
55,458
|
|
$
|
36,267
|
|
$
|
(4,799
|
)
|
$
|
19,191
|
|
53
|
%
|
$
|
41,066
|
|
NA
|
|||||||
|
Net margin
|
8.1
|
%
|
5.5
|
%
|
(0.7
|
)%
|
|||||||||||||||||||
|
Diluted earnings (loss) per share
|
$
|
2.14
|
|
$
|
1.43
|
|
$
|
(0.20
|
)
|
$
|
0.71
|
|
50
|
%
|
$
|
1.63
|
|
NA
|
|||||||
-
39
-
Fiscal
2014
Compared with Fiscal
2013
Sales
Changes to sales by major product lines were as follows (dollars in thousands):
|
|
Year Ended
|
2014 vs. 2013
|
||||||||||||
|
January 2, 2015
|
January 3,
2014 |
$
Change
|
%
Change
|
|||||||||||
|
Sales:
|
||||||||||||||
|
Greatbatch Medical
|
||||||||||||||
|
Cardiac/Neuromodulation
|
$
|
321,419
|
|
$
|
325,412
|
|
$
|
(3,993
|
)
|
(1
|
)%
|
|||
|
Orthopaedics
|
147,296
|
|
130,247
|
|
17,049
|
|
13
|
%
|
||||||
|
Portable Medical
|
69,043
|
|
78,743
|
|
(9,700
|
)
|
(12
|
)%
|
||||||
|
Vascular
|
58,770
|
|
48,357
|
|
10,413
|
|
22
|
%
|
||||||
|
Energy, Military, Environmental
|
81,757
|
|
78,143
|
|
3,614
|
|
5
|
%
|
||||||
|
Total Greatbatch Medical
|
678,285
|
|
660,902
|
|
17,383
|
|
3
|
%
|
||||||
|
QiG
|
9,502
|
|
3,043
|
|
6,459
|
|
212
|
%
|
||||||
|
Total sales
|
$
|
687,787
|
|
|
$
|
663,945
|
|
|
$
|
23,842
|
|
|
4
|
%
|
Greatbatch Medical –
Total 2014 sales for Greatbatch Medical increased 3% to $678.3 million. The most significant drivers of this increase were as follows:
For 2014, our cardiac/neuromodulation sales decreased 1%. Beginning in the second quarter of 2014, our cardiac/neuromodulation revenue began to be negatively impacted by the end of life for two legacy products and pricing pressure from our larger OEM customers. Additionally, fourth quarter 2014 cardiac/neuromodulation sales were impacted by inventory adjustments by several of our larger OEM customers. Going forward, growth in our cardiac/neuromodulation product line will continue to be negatively impacted by the end of life on these two legacy products, as well as continued pressure from our customer’s diversification, vertical integration and price reduction initiatives. These two end of life products contributed approximately $22 million to sales in 2014 and are expected to be phased out over the next few years. We expect we will be able to mitigate these headwinds through growth from new products, as well as current and projected product development opportunities with our cardiac/neuromodulation customers.
Orthopaedic product line sales for 2014 increased 13% compared to the same period of 2013. Foreign currency exchange rate fluctuations increased our 2014 orthopaedic sales by approximately $1 million in comparison to the prior year. Excluding the impact of foreign currency fluctuations, orthopaedic product line sales increased 12% in comparison to the prior year. Going forward, foreign currency exchange rate fluctuations are expected to be a headwind for the first half of 2015 due to the strengthening dollar versus the euro. The 2014 organic constant currency growth was primarily in orthopaedic implants and instruments and was driven by our increased sales and marketing efforts and market growth. Additionally, our bone cutting and preparation instruments have a strong position in the market place. For 2015, we are looking for another double digit growth year and continue to innovate in the space with silicone handles, new instrumentation and higher level assemblies.
During 2014, portable medical sales decreased 12% in comparison to 2013. During the second half of 2013, we began refocusing our product line offerings in the portable medical space to products that have higher profitability. Correspondingly, we have discontinued or reduced volumes in certain of our lower margin products, which is expected to continue to negatively impact our sales through the first half of 2015. As part of our investment in capacity and capabilities and to better align our resources, during the second quarter of 2014, we announced plans to transfer our portable medical operations into a new facility located in Tijuana, Mexico. We remain optimistic about this product line and continue to see our pipeline of customer opportunities grow as we invest in new technologies to meet our customers’ needs and to expand our overall market opportunity.
For 2014, our vascular product line sales increased 22% in comparison to the prior year and reflects the continued adoption of our products and the relaunch of a vascular medical device near the end of 2013, which, as previously communicated, was voluntarily recalled in the fourth quarter of 2012.
Energy, Military and Environmental product line sales for 2014 increased 5% compared to the same period of 2013. This increase was mainly driven by new product introductions, our deepening relationship with our OEM customers, as well as the timing of customer orders.
QiG
–
QiG sales for 2014 increased 212% to $9.5 million and includes $5.8 million of sales from CCC, which we acquired on August 12, 2014. CCC is an active implantable medical device systems developer and manufacturer that designs and produces a
-
40
-
range of devices for some of the world’s top medical device companies, including implantable pulse generators, programmer systems, battery chargers, patient wands and leads. Excluding the revenue acquired from CCC, QiG revenue increased 21% in comparison to the prior year, due to increased adoption of our thin film electrode technology and new product launches.
Gross Profit
Changes to gross profit as a percentage of sales were primarily due to the following:
|
|
2014-2013
% Point Change |
|
|
Performance-based compensation
(a)
|
0.1
|
%
|
|
Production efficiencies, volume and mix
(b)
|
1.9
|
%
|
|
Impact of acquisition
(c)
|
0.1
|
%
|
|
Price
(d)
|
(1.2
|
)%
|
|
Other
|
(0.3
|
)%
|
|
Total percentage point change to gross profit as a percentage of sales
|
0.6
|
%
|
(a) Amount represents the change in performance-based compensation versus the prior year period and is recorded based upon the actual results achieved.
|
(b)
|
Our gross profit percentage benefited from production efficiencies gained at our manufacturing facilities as a result of our various lean and supply chain initiatives, as well as higher production volumes due to increased sales. Partially offsetting these production efficiencies was an increase in mix of lower margin sales in comparison to the prior year (i.e. higher mix of orthopaedic sales and lower mix of cardiac/neuromodulation sales).
|
|
(c)
|
Amounts represent the impact to our gross profit percentage related to the acquisition of CCC in August 2014.
|
|
(d)
|
Our gross profit percentage was negatively impacted by contractual price concessions to our larger OEM customers, which were given in exchange for long-term contracts and volume commitments.
|
Over the long-term, we expect to see gross margin improvements as we leverage our organic growth across our manufacturing footprint and realize the benefit of the various productivity improvement initiatives that are being implemented (see “Cost Savings and Consolidation Efforts” section of this Item). Additionally, we expect our gross margin to improve as more system and device level products are introduced, which typically earn a higher margin.
SG&A Expenses
Changes to SG&A expenses were primarily due to the following (in thousands):
|
|
2014-2013
$ Change
|
||
|
Selling and marketing
(a)
|
$
|
3,408
|
|
|
Performance-based compensation
(b)
|
(991
|
)
|
|
|
Legal fees
(c)
|
2,555
|
|
|
|
G&A personnel costs
(d)
|
(3,096
|
)
|
|
|
Impact of acquisition
(e)
|
911
|
|
|
|
Other
|
(292
|
)
|
|
|
Net increase in SG&A
|
$
|
2,495
|
|
|
(a)
|
Amount represents the incremental costs related to our strategic initiative to increase selling and marketing resources to drive 5% core business growth and sustain a pipeline of revenue generating opportunities.
|
|
(b)
|
Amount represents the change in performance-based compensation versus the prior year and is recorded based upon the actual results achieved.
|
|
(c)
|
Amount represents the increase in legal costs compared to the prior year and includes higher intellectual property related costs, as well as other corporate initiatives.
|
|
(d)
|
Amount represents lower G&A personnel costs in comparison to the prior year and is primarily the result of our various consolidation initiatives including our operating unit realignment that occurred during the second half of 2013.
|
|
(e)
|
Amount represents the incremental SG&A expenses related to the acquisition of CCC in August 2014.
|
-
41
-
RD&E Expenses, Net
Net RD&E costs were as follows (in thousands):
|
|
Year Ended
|
|
|||||||||
|
January 2,
2015 |
January 3,
2014 |
Change
|
|||||||||
|
Research, development and engineering costs
|
$
|
58,974
|
|
$
|
62,652
|
|
$
|
(3,678
|
)
|
||
|
Less: cost reimbursements
|
(9,129
|
)
|
(8,575
|
)
|
(554
|
)
|
|||||
|
Total RD&E, net
|
$
|
49,845
|
|
$
|
54,077
|
|
$
|
(4,232
|
)
|
||
Net RD&E for 2014 decreased $4.2 million to $49.8 million. Medical device costs incurred by QiG were $23.9 million for 2014 compared to $29.4 million for 2013. Medical device costs for 2014 include $4.2 million less DVT costs in comparison to 2013 as most of the testing was completed by the end of 2013. The decrease in DVT costs was partially offset by higher costs incurred in connection with the development of our next generation cardiac products (i.e. batteries, capacitors, filtered feedthroughs), higher performance-based compensation, which was accrued based upon the achievement of certain Algovita milestones, and a higher rate of spend on other QiG medical device projects.
The increase in customer cost reimbursements in 2014 primarily relates to the timing of the achievement of milestones on various customer cost reimbursement projects, partially offset by the expiration of certain government grants acquired from our acquisition of NeuroNexus in 2012.
QiG’s medical device technology investment is primarily focused on successfully commercializing Algovita, which continues to progress as planned, with PMA approval on track for the first half of 2015.
Other Operating Expenses, Net
Other operating expenses, net were comprised of the following (in thousands):
|
|
Year Ended
|
|
|||||||||
|
January 2,
2015 |
January 3,
2014 |
Change
|
|||||||||
|
2014 investments in capacity and capabilities
(a)
|
$
|
8,925
|
|
$
|
—
|
|
$
|
8,925
|
|
||
|
2013 operating unit realignment
(a)
|
1,017
|
|
5,625
|
|
(4,608
|
)
|
|||||
|
Orthopaedic facilities optimization
(a)
|
1,317
|
|
8,038
|
|
(6,721
|
)
|
|||||
|
Medical device facility optimization
(a)
|
11
|
|
312
|
|
(301
|
)
|
|||||
|
ERP system upgrade (income) costs
(a)
|
(82
|
)
|
783
|
|
(865
|
)
|
|||||
|
Acquisition and integration (income) costs
(b)
|
3
|
|
(502
|
)
|
505
|
|
|||||
|
Asset dispositions, severance and other
(c)
|
4,106
|
|
1,534
|
|
2,572
|
|
|||||
|
Total other operating expenses, net
|
$
|
15,297
|
|
$
|
15,790
|
|
$
|
(493
|
)
|
||
|
(a)
|
Refer to “Cost Savings and Consolidation Efforts” section of this Item and Note 13 “Other Operating Expenses, Net” of the Notes to Consolidated Financial Statements contained in Item 8 of this report for disclosures related to the timing and level of remaining expenditures for these initiatives.
|
|
(b)
|
During 2014 and 2013, we recognized costs (income) related to the integration of Micro Power Electronics, Inc., NeuroNexus, and CCC. These expenses (income) were primarily for retention bonuses, travel costs in connection with integration efforts, training, severance, and the change in fair value of the contingent consideration recorded in connection with the NeuroNexus acquisition. Refer to Note 18 “Fair Value Measurements” of the Notes to Consolidated Financial Statements contained in Item 8 of this report for disclosures related to the change in fair value of the contingent consideration.
|
|
(c)
|
During 2014 and 2013, we recorded losses in connection with various asset disposals and write-downs. During 2014, we incurred $0.9 million of expense related to the separation of our Senior Vice President, Human Resources. Additionally, during 2014, Greatbatch Medical recorded charges in connection with its business reorganization to align its contract manufacturing operations. Costs incurred primarily related to consulting and IT development. During 2013, Greatbatch Medical recorded a $0.9 million write-off related to its wireless sensing product line and QiG recorded a $0.5 million write-off of NeuroNexus’s in-process research and development “IPR&D”.
|
-
42
-
We continually evaluate our operating structure in order to maximize efficiencies and drive margin expansion. For 2015, other operating expenses, net are expected to be approximately $22 million, as we continue to invest in our capacity and capabilities. See “Cost Savings and Consolidation Efforts” contained in this Item for further details on these initiatives.
Interest Expense
Interest expense for 2014 decreased $7.0 million over 2013 primarily due to the repayment of $198 million of convertible subordinated notes during the first quarter of 2013, which had an effective interest rate of 8.5%. The current weighted average interest rate on our long-term debt is 1.79%. Additionally, interest expense was lower in 2014 due to lower outstanding Credit Facility balances. During 2014 and 2013, we made net repayments of $10 million and $33.3 million on long-term debt, respectively. See Note 9 “Debt” of the Notes to Consolidated Financial Statements contained in Item 8 of this report.
(Gain) Loss on Cost and Equity Method Investments
During 2014, we sold one of our cost method investments, which resulted in a pre-tax gain of $3.2 million and contributed to the overall gain on cost and equity method investments for the year. During 2013, we incurred losses on our cost and equity method investments. These investments are in start-up research and development companies whose fair value is highly subjective in nature and subject to future fluctuations, which could be significant. Our recorded investment in cost and equity method investments was
$14.5 million
at
January 2, 2015
. During
2014
, we recognized a $1.2 million gain and loss of $0.2 million in
2013
related to our equity method investments.
Other (Income) Expense, Net
Other (income) expense, net primarily includes the impact of foreign currency exchange rate fluctuations on transactions denominated in foreign currencies. In 2014, we recognized $1.3 million of foreign currency exchange gains, compared to a loss of $0.1 million for 2013, primarily due to the strengthening of the U.S. dollar relative to the Euro. We generally do not expect foreign currency exchange rate fluctuations to have a material impact on our results of operations.
Provision for Income Taxes
The effective tax rate for 2014 was 27.6% versus 25.7% for
2013
. The stand-alone U.S. component of the effective tax rate for 2014 was 32.6% versus 30.0% for
2013
. The year over year increase is primarily attributable to a decrease in federal tax credits recorded in 2014. $3.7 million of federal tax credits were recorded in 2013 as a result of the retroactive reinstatement of the U.S. R&D tax credit versus $1.6 million in 2014. On January 2, 2013, the President signed into law the American Taxpayer Relief Act of 2012 (the “Act”), which included a retroactive extension of the R&D tax credit that had expired on December 31, 2011. Under the Act, the R&D credit was extended for two years retroactively from January 1, 2012 through December 31, 2013. As the Act was signed into law on January 2, 2013, the effects of the change in the tax law were recognized in 2013. As such, a benefit for the R&D credits earned both in 2012 and 2013 were recorded through the fiscal 2013 effective tax rate. The 2014 effective tax rate appropriately reflects only the 2014 tax credits.
The increase in rate from the reduction in recognized tax credits was partially offset by the impact of an increase in foreign source income recognized in 2014. The foreign source income carries a lower overall effective tax rate than U.S. income.
The provision for income taxes for
2014
differs from the U.S. statutory rate due to the following (dollars in thousands):
|
|
U.S.
|
International
|
Combined
|
|||||||||||||||||
|
|
$
|
%
|
$
|
%
|
$
|
%
|
||||||||||||||
|
Income before provision for income taxes
|
$
|
56,801
|
|
$
|
19,778
|
|
$
|
76,579
|
|
|||||||||||
|
Provision at statutory rate
|
$
|
19,881
|
|
35.0
|
%
|
$
|
6,922
|
|
35.0
|
%
|
$
|
26,803
|
|
35.0
|
%
|
|||||
|
Federal tax credits
|
(1,600
|
)
|
(2.8
|
)
|
—
|
|
—
|
|
(1,600
|
)
|
(2.1
|
)
|
||||||||
|
Foreign rate differential
(a)
|
—
|
|
—
|
|
(3,276
|
)
|
(16.6
|
)
|
(3,276
|
)
|
(4.3
|
)
|
||||||||
|
Uncertain tax positions
|
412
|
|
0.7
|
|
—
|
|
—
|
|
412
|
|
0.6
|
|
||||||||
|
State taxes, net of federal benefit
|
507
|
|
0.9
|
|
—
|
|
—
|
|
507
|
|
0.7
|
|
||||||||
|
Change in foreign tax rates
(b)
|
—
|
|
—
|
|
(446
|
)
|
(2.3
|
)
|
(446
|
)
|
(0.6
|
)
|
||||||||
|
Valuation allowance
|
135
|
|
0.2
|
|
(434
|
)
|
(2.2
|
)
|
(299
|
)
|
(0.4
|
)
|
||||||||
|
Other
|
(842
|
)
|
(1.5
|
)
|
(138
|
)
|
(0.7
|
)
|
(980
|
)
|
(1.3
|
)
|
||||||||
|
Provision for income taxes/effective tax rate
|
$
|
18,493
|
|
32.6
|
%
|
$
|
2,628
|
|
13.3
|
%
|
$
|
21,121
|
|
27.6
|
%
|
|||||
-
43
-
|
(a)
|
The tax rate reflects the impact of an increase in foreign source income, which carries a lower overall effective tax rate than U.S. income.
|
(b) Amounts relate to the tax benefit resulting from a favorable Swiss tax ruling received in 2014. During 2014, our Swiss subsidiary filed for a tax ruling requesting a reduced income tax rate in Switzerland. We received an approved ruling in December 2014 effectively reducing the Swiss tax rate from 9.3% to approximately 6.5% depending on the jurisdictional mix of revenues and expenditures. As such, the carrying value of the deferred taxes, which reflected a net deferred tax liability position as of the date of enactment, have been adjusted to reflect the rate reduction. The adjusted carrying value resulted in a reduction to the deferred tax liability and a corresponding deferred tax benefit.
There is a prospective potential for volatility of the effective tax rate due to several factors, including changes in the mix of pre-tax income and the jurisdictions to which it relates, business acquisitions, settlements with taxing authorities and foreign currency exchange rate fluctuations. In addition, we continue to explore tax planning opportunities that may have a material impact on our effective tax rate. For 2015, we expect our GAAP and adjusted effective tax rate to be approximately 25% and 26%, respectively.
We believe it is reasonably possible that a reduction of up to $1.0 million of the balance of our unrecognized tax benefits may occur within the next twelve months as a result of the expiration of applicable statutes of limitation and/or potential audit settlements, which would positively impact the effective tax rate in the period of reduction.
-
44
-
Fiscal
2013
Compared with Fiscal
2012
Sales
Changes to sales by major product lines were as follows (dollars in thousands):
|
|
Year Ended
|
2013 vs. 2012
|
||||||||||||
|
January 3,
2014 |
December 28,
2012 |
$
Change
|
%
Change
|
|||||||||||
|
Sales:
|
||||||||||||||
|
Greatbatch Medical
|
||||||||||||||
|
Cardiac/Neuromodulation
|
$
|
325,412
|
|
$
|
306,669
|
|
$
|
18,743
|
|
6
|
%
|
|||
|
Orthopaedics
|
130,247
|
|
122,061
|
|
8,186
|
|
7
|
%
|
||||||
|
Portable Medical
|
78,743
|
|
81,659
|
|
(2,916
|
)
|
(4
|
)%
|
||||||
|
Vascular
|
48,357
|
|
51,980
|
|
(3,623
|
)
|
(7
|
)%
|
||||||
|
Energy, Military, Environmental
|
78,143
|
|
81,353
|
|
(3,210
|
)
|
(4
|
)%
|
||||||
|
Total Greatbatch Medical
|
660,902
|
|
643,722
|
|
17,180
|
|
3
|
%
|
||||||
|
QiG
|
3,043
|
|
2,455
|
|
588
|
|
24
|
%
|
||||||
|
Total sales
|
$
|
663,945
|
|
|
$
|
646,177
|
|
|
$
|
17,768
|
|
3
|
%
|
|
Greatbatch Medical
–
Total 2013 sales for Greatbatch Medical increased 3% to $660.9 million. The most significant drivers of this increase were as follows:
For 2013, our cardiac/neuromodulation sales increased 6% to $325.4 million, which exceeded our expectations. During 2013, cardiac and neuromodulation sales benefited from stronger market performance and continued deepening relationships with our OEM partners. More specifically, we experienced strong growth in batteries, capacitors, leads, and assembly revenue.
Orthopaedic product line sales for 2013 increased 7% compared to the same period of 2012. During the first quarter of 2013, the Company divested certain non-core orthopaedic product lines, which reduced 2013 orthopaedic revenue by approximately $15 million in comparison to the prior year. Additionally, foreign currency exchange rate fluctuations benefited orthopaedic revenue by approximately $2 million in comparison to the prior year. On an organic constant currency basis, orthopaedic product line sales increased 20% in comparison to 2012. This organic constant currency improvement was across all orthopaedic products and was above market growth rates primarily due to our increased sales and marketing efforts, customer market share gains, customer product launches, as well as the release of backlog built up as a result of our Swiss orthopaedic facilities consolidation near the end of 2012.
During 2013 portable medical sales decreased $2.9 million or 4% compared to 2012. During the second half of 2013 we began refocusing our product line offerings in the portable medical space to products that have higher profitability. Correspondingly, we have discontinued or reduced volumes in certain of our lower margin products, which resulted in the loss of two lower margin portable medical programs accounting for approximately $9 million of revenues in 2013.
For 2013, our vascular product line sales decreased $3.6 million or 7% as a result of the previously communicated voluntary recall of two vascular medical devices in the fourth quarter of 2012. We began reshipping one of these products in the fourth quarter of 2013.
QiG
–
QiG revenue includes sales of neural interface technology, components and systems to the neuroscience and clinical markets. The 24% revenue growth for 2013 in comparison to 2012 was primarily due to having a full year of sales from NeuroNexus, which was acquired in February 2012, as well as the higher growth characteristics of the neuroscience and clinical markets.
-
45
-
Gross Profit
Changes to gross profit as a percentage of sales were primarily due to the following:
|
|
2013-2012
% Point Change
|
|
|
Impact of Swiss consolidation
(a)
|
0.4
|
%
|
|
Performance-based compensation
(b)
|
(0.5
|
)%
|
|
Cost savings and production efficiencies
(c)
|
2.0
|
%
|
|
Other
|
(0.1
|
)%
|
|
Total percentage point change to gross profit as a percentage of sales
|
1.8
|
%
|
(a) Our Gross Margin benefited approximately $2.8 million from the consolidation of our Swiss orthopaedic facilities into other existing Greatbatch facilities in the first quarter of 2013. The 2012 gross profit percentage includes the negative impact of production inefficiencies at those facilities.
|
(b)
|
Amount represents higher performance-based compensation versus the prior year of approximately $3.4 million and is recorded based upon actual results achieved.
|
|
(c)
|
Our Gross Margin percentage benefited from production efficiencies gained at our manufacturing facilities as a result of our various lean and supply chain initiatives, as well as higher production volumes due to increased sales and inventory levels.
|
SG&A Expenses
Changes to SG&A expenses were primarily due to the following (in thousands):
|
|
2013-2012
$ Change
|
||
|
Selling and marketing
(a)
|
$
|
3,848
|
|
|
Performance-based compensation
(b)
|
2,680
|
|
|
|
Swiss consolidation
(c)
|
(1,359
|
)
|
|
|
Other
(d)
|
1,946
|
|
|
|
Net increase in SG&A
|
$
|
7,115
|
|
|
(a)
|
Amount represents the incremental costs related to our decision near the end of 2012 to increase selling and marketing resources to drive 5% core business growth and sustain a pipeline of revenue generating opportunities.
|
|
(b)
|
Amount represents the change in performance-based compensation versus the prior year period and is recorded based upon the actual results achieved.
|
|
(c)
|
Amount represents the estimated impact to SG&A costs as a result of the consolidation of our Swiss orthopaedic facilities into other existing Greatbatch facilities, which was completed in the first quarter of 2013.
|
|
(d)
|
Amount represents various cost increases in SG&A expenses that occurred during 2013 including an additional week of operations in comparison to 2012 as the Company utilizes a fifty-two, fifty-three week fiscal year, which ends on the Friday nearest December 31.
|
RD&E Expenses, Net
Net RD&E costs were as follows (in thousands):
|
|
Year Ended
|
|
|||||||||
|
January 3,
2014 |
December 28,
2012 |
Change
|
|||||||||
|
Research, development, and engineering costs
|
$
|
62,652
|
|
$
|
62,848
|
|
$
|
(196
|
)
|
||
|
Less cost reimbursements
|
(8,575
|
)
|
(10,358
|
)
|
1,783
|
|
|||||
|
Total RD&E, net
|
$
|
54,077
|
|
$
|
52,490
|
|
$
|
1,587
|
|
||
Net RD&E for 2013 increased $1.6 million to $54.1 million. This increase was attributable to a decrease of $1.8 million in customer cost reimbursements compared to the prior year due to the timing of achievement of milestones on various projects. During the second half of 2012, we began to implement an initiative to optimize our RD&E investment. This included the reallocation of RD&E resources to higher priority projects, the postponement of some RD&E projects, as well as the decision to
-
46
-
pursue various alternatives to monetize some of our existing intellectual property that are outside our core business. Additionally, our Swiss orthopaedic facilities consolidation contributed to a reduction in RD&E expenses of $3.1 million. The benefit that was realized in 2013 from these initiatives was offset by an increase in performance-based compensation ($1.4 million), a higher level of DVT costs ($0.6 million), as well as the additional week of payroll expense incurred during 2013.
Medical device costs incurred by QiG were $29.4 million for 2013 and $32.7 million for 2012. 2013 QiG results include $5.8 million of DVT costs incurred in connection with our development of a neuromodulation platform compared to $5.2 million for 2012.
Other Operating Expenses, Net
Other operating expenses, net were comprised of the following (in thousands):
|
|
Year Ended
|
|
|||||||||
|
January 3,
2014 |
December 28,
2012 |
Change
|
|||||||||
|
2013 operating unit realignment
(a)
|
$
|
5,625
|
|
$
|
—
|
|
$
|
5,625
|
|
||
|
Orthopaedic facilities optimization
(a)
|
8,038
|
|
32,482
|
|
(24,444
|
)
|
|||||
|
Medical device facility optimization
(a)
|
312
|
|
1,525
|
|
(1,213
|
)
|
|||||
|
ERP system upgrade (income) costs
(a)
|
783
|
|
5,041
|
|
(4,258
|
)
|
|||||
|
Acquisition and integration (income) costs
(b)
|
(502
|
)
|
1,460
|
|
(1,962
|
)
|
|||||
|
Asset dispositions, severance and other
(c)
|
1,534
|
|
1,838
|
|
(304
|
)
|
|||||
|
Total other operating expenses, net
|
$
|
15,790
|
|
$
|
42,346
|
|
$
|
(26,556
|
)
|
||
|
(a)
|
Refer to “Cost Savings and Consolidation Efforts” section of this Item and Note 13 “Other Operating Expenses, Net” of the Notes to Consolidated Financial Statements contained in Item 8 of this report for disclosures related to the timing and level of remaining expenditures for these initiatives.
|
|
(b)
|
During 2013 and 2012, we incurred costs (income) related to the integration of Micro Power and NeuroNexus. These expenses were primarily for retention bonuses, travel costs in connection with integration efforts, training, severance and the change in fair value of the contingent consideration recorded in connection with these acquisitions. Refer to Note 18 “Fair Value Measurements” of the Notes to Consolidated Financial Statements contained in Item 8 of this report for disclosures related to the change in fair value of the contingent consideration.
|
|
(c)
|
During 2013 and 2012, we recorded losses in connection with various asset disposals and/or write-downs. Additionally, during 2013, Greatbatch Medical recorded a $0.9 million write-off related to its wireless sensing product line and QiG recorded a $0.5 million write-off of NeuroNexus IPR&D. During 2012, we incurred $1.2 million of costs related to the relocation of our global headquarters to Frisco, Texas.
|
-
47
-
Interest Expense
Interest expense for 2013 decreased $6.8 million over 2012 primarily due to the repayment of $198 million of convertible subordinated notes during the first quarter of 2013, which had an effective interest rate of 8.5%. Additionally, interest expense decreased due to lower outstanding debt balances, and lower interest rates paid on outstanding debt. During 2013, we made net repayments of $33.3 million on long-term debt. See Note 9 “Debt” of the Notes to Consolidated Financial Statements contained in Item 8 of this report.
(Gain) Loss on Cost and Equity Method Investments
During 2013 and 2012, we incurred losses on our cost and equity method investments. These investments are in start-up research and development companies whose fair value is highly subjective in nature and subject to future fluctuations, which could be significant.
Other Expense, Net
Other expense, net primarily includes the impact of foreign currency exchange rate fluctuations on transactions denominated in foreign currencies. We generally do not expect foreign currency exchange rate fluctuations to have a material impact on our results of operations.
Provision for Income Taxes
The effective tax rate for 2013 was 25.7%, versus 171.3% for 2012. The stand-alone U.S. component of the effective tax rate for 2013 was 30.0% versus 33.1% for 2012. This decrease was primarily attributable to $6.2 million of tax charges recorded in 2012 relating to our Swiss Orthopaedic consolidation. These charges related to the loss of our Swiss tax holiday, due to our decision in 2012 to discontinue manufacturing in Switzerland and the valuation allowance established on our Swiss deferred tax assets, as it was more likely than not that they will not be fully realized. The reinstatement of the R&D tax credit in 2013, as well as higher income in lower tax rate jurisdictions also contributed to the more favorable tax rate in 2013. The provision for income taxes for 2013 differs from the U.S. statutory rate due to the following (dollars in thousands):
|
|
U.S.
|
International
|
Combined
|
|||||||||||||||||
|
|
$
|
%
|
$
|
%
|
$
|
%
|
||||||||||||||
|
Income before provision for income taxes
|
$
|
42,392
|
|
$
|
6,446
|
|
$
|
48,838
|
|
|||||||||||
|
Provision at statutory rate
|
$
|
14,837
|
|
35.0
|
%
|
$
|
2,256
|
|
35.0
|
%
|
$
|
17,093
|
|
35.0
|
%
|
|||||
|
Federal tax credits
(a)
|
(3,651
|
)
|
(8.6
|
)
|
—
|
|
—
|
|
(3,651
|
)
|
(7.5
|
)
|
||||||||
|
Foreign rate differential
|
—
|
|
—
|
|
(348
|
)
|
(5.4
|
)
|
(348
|
)
|
(0.7
|
)
|
||||||||
|
Uncertain tax positions
|
831
|
|
2.0
|
|
—
|
|
—
|
|
831
|
|
1.7
|
|
||||||||
|
State taxes, net of federal benefit
|
1,147
|
|
2.7
|
|
—
|
|
—
|
|
1,147
|
|
2.3
|
|
||||||||
|
Change in foreign tax rates
(b)
|
—
|
|
—
|
|
(1,807
|
)
|
(28.0
|
)
|
(1,807
|
)
|
(3.7
|
)
|
||||||||
|
Valuation allowance
|
176
|
|
0.4
|
|
10
|
|
0.2
|
|
186
|
|
0.4
|
|
||||||||
|
Other
|
(634
|
)
|
(1.5
|
)
|
(246
|
)
|
(3.8
|
)
|
(880
|
)
|
(1.8
|
)
|
||||||||
|
Provision for income taxes/effective tax rate
|
$
|
12,706
|
|
30.0
|
%
|
$
|
(135
|
)
|
(2.0
|
)%
|
$
|
12,571
|
|
25.7
|
%
|
|||||
|
(a)
|
Amounts relate to the retroactive reinstatement of the U.S. R&D tax credit. On January 2, 2013, the President signed into law the Act, which included a retroactive extension of the R&D tax credit that had expired on December 31, 2011. Under the Act, the R&D credit is extended for two years retroactively from January 1, 2012 through December 31, 2013. As the Act was signed into law on January 2, 2013, the effects of the change in the tax law were recognized as a financial statement event in the financial statement period that includes the date of enactment. As such, we recorded a benefit for the R&D credits earned in 2012 and 2013 through the fiscal 2013 effective tax rate.
|
(b) Amounts relate to the tax benefit recorded in 2013 relating to Mexican Tax Reform Package and a favorable Swiss tax ruling. On December 12, 2013, the 2014 Mexican Tax Reform Package took effect. This tax reform repealed the previous Mexican income tax law, including the flat tax regime and tax consolidation. The Mexican corporate income tax rate of 30% will be maintained. As such, for U.S. GAAP purposes, the deferred tax items, historically carried at the 17% flat tax rate, were adjusted to reflect a carrying value of 30%. Since our Mexican subsidiary was in an overall deferred tax asset position as of the enactment date, the adjustment to 30% resulted in an overall deferred tax benefit which was recorded in 2013. In addition, during 2013, our Swiss subsidiary filed for a tax ruling requesting a reduced income tax rate in Switzerland. We
-
48
-
received an approved ruling in December 2013 effectively reducing the Swiss tax rate from 22.6% to approximately 9.3% depending on jurisdictional mix of revenues and expenditures. As such, the carrying value of the deferred taxes, which reflected a net deferred tax liability position as of the date of enactment, have been adjusted to reflect the rate reduction. The adjusted carrying value resulted in a reduction to the deferred tax liability and a corresponding deferred tax benefit.
Liquidity and Capital Resources
|
|
At
|
||||||
|
(Dollars in thousands)
|
January 2, 2015
|
January 3, 2014
|
|||||
|
Cash and cash equivalents
|
$
|
76,824
|
|
$
|
35,465
|
|
|
|
Working capital
|
$
|
242,022
|
|
$
|
190,731
|
|
|
|
Current ratio
|
3.23
|
|
3.08
|
|
|||
The increase in cash and cash equivalents and working capital from January 3, 2014 is due primarily to our operating income, which generated $81.3 million in net cash provided by operating activities partially offset by the $16.0 million net cash paid for the CCC acquisition and $24.8 million of capital expenditures. Additionally, working capital balances increased from the end of 2013, primarily cash, accounts receivable and inventory, due to our growth in sales and expected sales as well as our acquisition of CCC, which added $4.6 million of working capital. Of the $76.8 million of cash on hand as of
January 2, 2015
, $12.6 million is being held at our foreign subsidiaries and is considered permanently reinvested.
Revolving Line of Credit
– We have a credit facility (the “Credit Facility”), which consists of a $300 million revolving line of credit (the “Revolving Credit Facility”), a $200 million term loan (the “Term Loan”), a $15 million letter of credit subfacility, and a $15 million swingline subfacility. The Credit Facility can be increased by $200 million upon our request and approval by the lenders. The Revolving Credit Facility has a maturity date of September 20, 2018, which may be extended to September 20, 2019 upon notice by us and subject to certain conditions. The principal of the Term Loan is payable in quarterly installments as specified in the Credit Facility until its maturity date of September 20, 2019, when the unpaid balance is due in full.
The Credit Facility is supported by a consortium of fifteen banks with no bank controlling more than 18% of the facility. As of
January 2, 2015
, the banks supporting 98% of the Credit Facility each had an S&P credit rating of at least BBB or better, which is considered investment grade. The bank which supports the remaining 2% of the Credit Facility is not currently being rated.
The Credit Facility requires us to maintain a rolling four quarter ratio of adjusted EBITDA to interest expense of at least 3.0 to 1.0. For the twelve month period ended
January 2, 2015
, our ratio of adjusted EBITDA to interest expense, calculated in accordance with our credit agreement, was 34.7 to 1.00, well above the required limit. The Credit Facility also requires us to maintain a total leverage ratio of not greater than 4.5 to 1.0 decreasing to not greater than 4.25 to 1.0 after January 2, 2016. As of
January 2, 2015
, our total leverage ratio, calculated in accordance with our credit agreement, was 1.29 to 1.00, well below the required limit.
See Note 9 “Debt” of the Notes to Consolidated Financial Statements contained in Item 8 of this report for a more detailed description of the Credit Facility.
As of
January 2, 2015
, we had $300 million of borrowing capacity available under the Credit Facility. This amount may vary from period to period based upon our debt and EBITDA levels, which impacts the covenant calculations discussed above. We believe that our cash flow from operations and available borrowing capacity under the Credit Facility provide adequate liquidity to meet our short- and long-term funding needs.
Operating Activities –
Cash flows from operating activities for 2014 of $81.3 million were $24.5 million above 2013. During 2013, the Company made estimated tax payments of $28.8 million in connection with the retirement of our convertible subordinated notes. Excluding these payments, cash flows from operating activities for 2014 were slightly below 2013 as the increased level of cash operating income was more than offset by an increase in working capital levels primarily due to the timing of receivable collections.
Cash flows from operating activities for 2013 were $56.8 million compared to $64.8 million for 2012. Excluding the $28.8 million of tax payments related to our convertible debt, cash flows from operations were $85.5 million for 2013. This increase in 2013 cash flows from operations over 2012, after adjusting for the 2013 tax payments, is a result of a higher level of cash operating income partially offset by higher working capital levels in anticipation of higher sales and critical raw material purchases. During 2013, we reduced our receivable balances by $7.2 million due to the timing of receivable collections.
Investing Activities
– Net cash used in investing activities for 2014 of $35.9 million were $17.6 million above 2013. 2014 investing activities include $16.0 million of net cash used for the acquisition of CCC as well as $24.8 million of cash used for the purchase of property, plant and equipment. These transactions were partially offset by a $2.7 million contingent payment
-
49
-
received in 2014 in connection with the sale of certain non-core Swiss orthopaedic product lines, which closed during the first quarter of 2013, as well as $2.2 million of net proceeds received from the sale of a cost method investment.
Net cash used in investing activities for 2013 was $18.3 million compared to $59.8 million for 2012 and was net of $4.7 million of proceeds received from the sale of our non-core Swiss orthopaedic product lines. The decrease in cash used in investing activities from 2012 primarily relates to a decline in capital expenditures of $22.5 million from 2012 due to the completion of various consolidation and optimization initiatives discussed in the “Cost Savings and Consolidation Efforts” section of this Item (primarily the construction of our Fort Wayne facility, which was completed in 2012). Additionally, we made $17.2 million of cash payments in 2012 related to our acquisitions.
Our current expectation is that capital spending for 2015 will be in the range of $35 million to $45 million, of which approximately half is discretionary in nature. We anticipate that cash on hand, cash flows from operations and available borrowing capacity under our Credit Facility will be sufficient to fund these capital expenditures. As part of our growth strategy, we have and will continue to consider targeted and opportunistic acquisitions.
Financing Activities –
Net cash used in financing activities for 2014 of $2.4 million was $21.0 million below 2013. This cash outflow is the result of $10.0 million of principal payments on long-term debt partially offset by $8.3 million of cash received from the exercise of stock options during 2014.
Net cash used in financing activities for 2013 was $23.4 million compared to $21.5 million for the prior year period. During 2013, we made $33.3 million of net long-term debt repayments as compared to $22.0 million in 2012 as cash flows from operations was significantly higher than our cash used in investing activities. These net repayments were partially offset by $12.8 million of cash received from the exercise of stock options versus $1.3 million in 2012 due to our higher stock price in 2013.
Capital Structure –
As of
January 2, 2015
, our capital structure consisted of $187.5 million of debt outstanding on our Term Loan and 25.1 million shares of common stock outstanding. Additionally, we had $76.8 million in cash and cash equivalents, which we believe is sufficient to meet our short-term operating cash needs. If necessary, we currently have access to $300 million under our Revolving Credit Facility and are authorized to issue 100 million shares of common stock and 100 million shares of preferred stock. We believe that, if needed, we can access public markets to raise additional capital. We believe that our capital structure provides adequate funding to meet our growth objectives. We continuously evaluate our capital structure, including our Credit Facility, as it relates to our anticipated long-term funding needs. Changes to our capital structure may occur as a result of this analysis or changes in market conditions.
Off-Balance Sheet Arrangements
We have no off-balance sheet arrangements within the meaning of Item 303(a)(4) of Regulation S-K.
Litigation
We are party to various legal actions arising in the normal course of business. A description of pending legal actions against the Company is set forth in Note 15 “Commitments and Contingencies” of the Notes to Consolidated Financial Statements contained at Item 8 of this report. We do not believe that the ultimate resolution of any individual pending legal action will have a material effect on our consolidated results of operations, financial position or cash flows. However, litigation is subject to inherent uncertainties and there can be no assurance that any pending legal action, which we currently believe to be immaterial, does not become material in the future.
-
50
-
Contractual Obligations
The following table summarizes our contractual obligations at
January 2, 2015
:
|
|
Payments due by period
|
||||||||||||||||||
|
CONTRACTUAL OBLIGATIONS
|
Total
|
Less than 1
year
|
1-3 years
|
3-5 years
|
More than 5
years
|
||||||||||||||
|
Debt obligations
(a)
|
$
|
205,998
|
|
$
|
15,898
|
|
$
|
44,745
|
|
$
|
145,355
|
|
$
|
—
|
|
||||
|
Operating lease obligations
(b)
|
36,502
|
|
5,797
|
|
9,860
|
|
6,907
|
|
13,938
|
|
|||||||||
|
Purchase obligations
(b)
|
36,412
|
|
35,117
|
|
1,175
|
|
100
|
|
20
|
|
|||||||||
|
Foreign currency contracts
(b)
|
16,880
|
|
16,880
|
|
—
|
|
—
|
|
—
|
|
|||||||||
|
Defined benefit plan obligations
(c)
|
1,394
|
|
47
|
|
191
|
|
290
|
|
866
|
|
|||||||||
|
Total contractual obligations
|
$
|
297,186
|
|
$
|
73,739
|
|
$
|
55,971
|
|
$
|
152,652
|
|
$
|
14,824
|
|
||||
|
(a)
|
Includes the annual interest expense on the $187.5 million outstanding on our Term Loan based upon the period end weighted average interest rate of 1.79%, which includes the impact of our interest rate swap agreement. Also includes $5.0 million of deferred federal and state taxes on our convertible subordinated notes that will be due between 2015 and 2018. See Note 9 “Debt” of the Notes to Consolidated Financial Statements contained in Item 8 of this report.
|
|
(b)
|
See Note 15 “Commitments and Contingencies” of the Notes to Consolidated Financial Statements contained in Item 8 of this report for additional information about our operating leases, purchase obligations and foreign currency contracts.
|
|
(c)
|
See Note 10 “Benefit Plans” of the Notes to Consolidated Financial Statements contained in Item 8 of this report for additional information about our defined benefit plan obligations.
|
This table does not reflect
$2.4 million
of unrecognized tax benefits, as we are uncertain if or when such amounts may be settled. Refer to Note 14 “Income Taxes” of the Notes to Consolidated Financial Statements in Item 8 of this report for additional information about these unrecognized tax benefits.
We self-fund the medical insurance coverage provided to our U.S. based employees. We limit our risk through the use of stop loss insurance. As of
January 2, 2015
, we had
$1.8 million
accrued related to our self-insurance obligations under our medical plan. This accrual is recorded in Accrued Expenses in the Consolidated Balance Sheet and is primarily based upon claim history. For
2015
, we have specific stop loss coverage per associate for claims in the year exceeding $250 thousand per associate with no annual maximum aggregate stop loss coverage. This table does not reflect any potential future payments for self-insured medical claims.
We were a member of a group self-insurance trust that provided workers’ compensation benefits to our employees in Western New York (the “Trust”). During 2011, we were notified by the Trust of its intentions to cease operations and were assessed a pro-rata share of future costs related to the Trust. Based on actual experience, we could receive a refund or be assessed additional contributions for workers’ compensation claims insured by the Trust, which are not reflected in the table above. Since 2011, we have utilized a traditional insurance provider for workers’ compensation coverage.
Inflation
We utilize certain critical raw materials (including precious metals) in our products that we obtain from a limited number of suppliers due to the technically challenging requirements of the supplied product and/or the lengthy process required to qualify these materials with our customers. We cannot quickly establish additional or replacement suppliers for these materials because of these requirements. Our results may be negatively impacted by an increase in the price of these critical raw materials. This risk is partially mitigated as many of the supply agreements with our customers allow us to partially adjust prices for the impact of any raw material price increases and the supply agreements with our vendors have final one-time buy clauses to meet a long-term need. Historically, raw material price increases have not materially impacted our results of operations.
Impact of Recently Issued Accounting Standards
In the normal course of business, we evaluate all new accounting pronouncements issued by the Financial Accounting Standards Board (“FASB”), Securities and Exchange Commission (“SEC”), Emerging Issues Task Force (“EITF”) or other authoritative accounting bodies to determine the potential impact they may have on our Consolidated Financial Statements. See Note 1 “Summary of Significant Accounting Policies” of the Notes to Consolidated Financial Statements contained in Item 8 of this report for additional information about these recently issued accounting standards and their potential impact on our financial condition or results of operations.
-
51
-
|
ITEM 7A.
|
QUANTITATIVE AND QUALITATIVE DISCLOSURES ABOUT MARKET RISK
|
|
Foreign Currency –
We have foreign operations in France, Mexico, Switzerland and Uruguay, which expose the Company to foreign currency exchange rate fluctuations due to transactions denominated in Euros, Mexican pesos, Swiss francs, and Uruguayan pesos, respectively. We continuously evaluate our foreign currency risk and will take action from time to time in order to best mitigate these risks, which includes the use of various derivative instruments such as forward currency exchange rate contracts. A hypothetical 10% change in the value of the U.S. dollar in relation to our most significant foreign currency exposures would have had an impact of approximately $7 million on our annual sales. This amount is not indicative of the hypothetical net earnings impact due to partially offsetting impacts on cost of sales and operating expenses in those currencies. We estimate that foreign currency exchange rate fluctuations during 2014 increased sales in comparison to 2013 by approximately $1 million.
In 2013, we entered into two forward contracts to purchase 8.4 million and 7.0 million Mexican pesos per month beginning in January 2014 through December 2014 at an exchange rate of $0.0767 and $0.0752 per peso, respectively. These contracts were entered into in order to hedge the risk of peso-denominated payments associated with a portion of the operations at our Tijuana, Mexico facility for 2014 and are being accounted for as cash flow hedges. The amount recorded as a reduction of Cost of Sales during 2014 related to these forward contracts was $0.2 million. No portion of the change in fair value of our foreign currency exchange rate contracts during 2014 was considered ineffective.
In 2014, we entered into a forward contract to purchase 19.2 million Mexican pesos per month beginning in January 2015 through December 2015 at an exchange rate of $0.0734 per peso. This contract was entered into in order to hedge the risk of peso-denominated payments associated with a portion of the operations at our Tijuana, Mexico facility for 2015 and is being accounted for as a cash flow hedge. As of January 2, 2015, this contract has a negative fair value of $1.6 million.
We translate all assets and liabilities of our foreign operations, where the U.S. dollar is not the functional currency, at the period-end exchange rate and translate sales and expenses at the average exchange rates in effect during the period. The net effect of these translation adjustments is recorded in the Consolidated Financial Statements as Comprehensive Income (Loss). The translation adjustment for 2014 was a $3.5 million loss. Translation adjustments are not adjusted for income taxes as they relate to permanent investments in our foreign subsidiaries. Net foreign currency transaction gains and losses included in Other (Income) Expense, Net amounted to a gain of $1.3 million for 2014. A hypothetical 10% change in the value of the U.S. dollar in relation to our most significant foreign currency net assets would have had an impact of approximately $2 million on our foreign net assets as of January 2, 2015.
Interest Rates –
Interest rates on our Credit Facility reset, at our option, based upon the prime rate or LIBOR rate, thus subjecting us to interest rate risk. To help offset this risk, from time to time, we enter into receive floating-pay fixed interest rate swaps indexed to the same applicable index rate as the debt it is hedging.
In 2012, we entered into a three-year $150 million interest rate swap, which amortizes $50 million per year beginning in 2014 and became effective during the first quarter of 2013. Under terms of the contract, we receive a floating interest rate indexed to the one-month LIBOR rate and pay a fixed interest rate of 0.573%. In 2014, we entered into an additional interest rate swap in order to hedge against potential changes in cash flows on the outstanding borrowings on our Credit Facility. The first $45 million of notional amount of the swap is effective February 20, 2015 and the second $45 million of notional amount is effective February 22, 2016. The notional amount of the swap amortizes $10 million per year beginning on February 21, 2017 with the remaining settled on the termination date of the swap agreement on September 20, 2019. Under the terms of the swap agreement, we will pay a fixed interest rate of 1.921% and receive a floating interest rate equal to the one-month LIBOR rate.
These swaps were entered into in order to hedge against potential changes in cash flows on our outstanding variable-rate debt, which is also indexed to the one-month LIBOR rate. The receive variable leg of the interest rate swaps and the variable rate paid on the debt is expected to have the same rate of interest, excluding the credit spread, and reset and pay interest on the same dates. These swaps are accounted for as cash flow hedges. As of January 2, 2015, these swaps had a negative fair value of $1.0 million.
As of January 2, 2015, we had $187.5 million outstanding under the Term Loan, of which $100 million is currently being hedged. See Note 9 “Debt” of the Notes to the Consolidated Financial Statements in Item 8 of this report for additional information about our outstanding debt. A hypothetical one percentage point (100 basis points) change in the LIBOR rate on the $187.5 million of unhedged floating rate debt outstanding at January 2, 2015 would have an impact of approximately $0.9 million on our interest expense.
-
52
-
|
ITEM 8.
|
FINANCIAL STATEMENTS AND SUPPLEMENTARY DATA
|
|
The following are set forth below:
-
53
-
MANAGEMENT’S REPORT ON INTERNAL CONTROL OVER FINANCIAL REPORTING
The Company’s certifying officers are responsible for establishing and maintaining adequate internal control over financial reporting. The Company’s internal control over financial reporting is designed and maintained under the supervision of its certifying officers to provide reasonable assurance regarding the reliability of financial reporting and the preparation of the Company’s consolidated financial statements for external reporting purposes in accordance with accounting principles generally accepted in the United States of America.
As of
January 2, 2015
, management conducted an assessment of the effectiveness of the Company’s internal control over financial reporting based on the framework established in
Internal Control – Integrated Framework (2013)
issued by the Committee of Sponsoring Organizations of the Treadway Commission. Based on this assessment, management has determined that the Company’s internal control over financial reporting as of
January 2, 2015
is effective.
In conducting the evaluation of the effectiveness of internal control over financial reporting as of
January 2, 2015
, as permitted by the guidance issued by the Office of the Chief Accountant of the Securities and Exchange Commission, management excluded the following subsidiary acquired in 2014:
|
•
|
Centro de Construcción de Cardioestimuladores del Uruguay
|
This subsidiary represented approximately 3% and 2% of net and total assets, respectively, 1% of revenues, and 2% of net income of the consolidated financial statement amounts as of and for the year ended
January 2, 2015
. See Note 2 – “Acquisitions” for a discussion of this acquisition and its impact on the Company’s Consolidated Financial Statements.
The effectiveness of internal control over financial reporting as of
January 2, 2015
has been audited by Deloitte & Touche LLP, the Company’s independent registered public accounting firm.
Dated:
March 3, 2015
|
/s/ Thomas J. Hook
|
|
/s/ Michael Dinkins
|
|
Thomas J. Hook
|
|
Michael Dinkins
|
|
President & Chief Executive Officer
|
|
Executive Vice President & Chief Financial Officer
|
-
54
-
REPORT OF INDEPENDENT REGISTERED PUBLIC ACCOUNTING FIRM
To the Board of Directors and Stockholders of
Greatbatch, Inc.
Frisco, Texas
We have audited the internal control over financial reporting of Greatbatch, Inc. and subsidiary (the “Company”) as of January 2, 2015, based on criteria established in
Internal Control
–
Integrated Framework (2013)
issued by the Committee of Sponsoring Organizations of the Treadway Commission. As described in Management’s Report on Internal Control Over Financial Reporting, management excluded from its assessment the internal control over financial reporting, Centro de Construcción de Cardioestimuladores del Uruguay (“CCC”), which was acquired on August 12, 2014 and whose financial statements constitute 3% and 2% of net and total assets, respectively, 1% of revenues, and 2% of net income of the consolidated financial statement amounts as of and for the year ended January 2, 2015. Accordingly, our audit did not include the internal control over financial reporting at CCC. The Company’s management is responsible for maintaining effective internal control over financial reporting and for its assessment of the effectiveness of internal control over financial reporting, included in the accompanying Management’s Report on Internal Control Over Financial Reporting. Our responsibility is to express an opinion on the Company’s internal control over financial reporting based on our audit.
We conducted our audit in accordance with the standards of the Public Company Accounting Oversight Board (United States). Those standards require that we plan and perform the audit to obtain reasonable assurance about whether effective internal control over financial reporting was maintained in all material respects. Our audit included obtaining an understanding of internal control over financial reporting, assessing the risk that a material weakness exists, testing and evaluating the design and operating effectiveness of internal control based on the assessed risk, and performing such other procedures as we considered necessary in the circumstances. We believe that our audit provides a reasonable basis for our opinion.
A company’s internal control over financial reporting is a process designed by, or under the supervision of, the company’s principal executive and principal financial officers, or persons performing similar functions, and effected by the company’s board of directors, management, and other personnel to provide reasonable assurance regarding the reliability of financial reporting and the preparation of financial statements for external purposes in accordance with generally accepted accounting principles. A company’s internal control over financial reporting includes those policies and procedures that (1) pertain to the maintenance of records that, in reasonable detail, accurately and fairly reflect the transactions and dispositions of the assets of the company; (2) provide reasonable assurance that transactions are recorded as necessary to permit preparation of financial statements in accordance with generally accepted accounting principles, and that receipts and expenditures of the company are being made only in accordance with authorizations of management and directors of the company; and (3) provide reasonable assurance regarding prevention or timely detection of unauthorized acquisition, use, or disposition of the company’s assets that could have a material effect on the financial statements.
Because of the inherent limitations of internal control over financial reporting, including the possibility of collusion or improper management override of controls, material misstatements due to error or fraud may not be prevented or detected on a timely basis. Also, projections of any evaluation of the effectiveness of the internal control over financial reporting to future periods are subject to the risk that the controls may become inadequate because of changes in conditions, or that the degree of compliance with the policies or procedures may deteriorate.
In our opinion, the Company maintained, in all material respects, effective internal control over financial reporting as of January 2, 2015, based on the criteria established in
Internal Control
–
Integrated Framework (2013)
issued by the Committee of Sponsoring Organizations of the Treadway Commission.
We have also audited, in accordance with the standards of the Public Company Accounting Oversight Board (United States), the consolidated financial statements and consolidated financial statement schedule as of and for the year ended January 2, 2015 of the Company and our report dated
March 3, 2015
expressed an unqualified opinion on those consolidated financial statements and consolidated financial statement schedule.
/s/ Deloitte & Touche LLP
Williamsville, New York
March 3, 2015
-
55
-
REPORT OF INDEPENDENT REGISTERED PUBLIC ACCOUNTING FIRM
To the Board of Directors and Stockholders of
Greatbatch, Inc.
Frisco, Texas
We have audited the accompanying consolidated balance sheets of Greatbatch, Inc. and subsidiary (the “Company”) as of January 2, 2015 and January 3, 2014, and the related consolidated statements of operations and comprehensive income (loss), cash flows, and stockholders’ equity for each of the three years in the period ended January 2, 2015. Our audits also included the financial statement schedule listed in the Index at Item 15. These consolidated financial statements and consolidated financial statement schedule are the responsibility of the Company’s management. Our responsibility is to express an opinion on the consolidated financial statements and consolidated financial statement schedule based on our audits.
We conducted our audits in accordance with the standards of the Public Company Accounting Oversight Board (United States). Those standards require that we plan and perform the audits to obtain reasonable assurance about whether the consolidated financial statements are free of material misstatement. An audit includes examining, on a test basis, evidence supporting the amounts and disclosures in the financial statements. An audit also includes assessing the accounting principles used and significant estimates made by management, as well as evaluating the overall financial statement presentation. We believe that our audits provide a reasonable basis for our opinion.
In our opinion, such consolidated financial statements present fairly, in all material respects, the financial position of the Company as of January 2, 2015 and January 3, 2014, and the results of its operations and its cash flows for each of the three years in the period ended January 2, 2015, in conformity with accounting principles generally accepted in the United States of America. Also, in our opinion, such consolidated financial statement schedule, when considered in relation to the basic consolidated financial statements taken as a whole, presents fairly, in all material respects, the information set forth therein.
We have also audited, in accordance with the standards of the Public Company Accounting Oversight Board (United States), the Company’s internal control over financial reporting as of January 2, 2015, based on the criteria established in
Internal Control
–
Integrated Framework (2013)
issued by the Committee of Sponsoring Organizations of the Treadway Commission and our report dated
March 3, 2015
expressed an unqualified opinion on the Company’s internal control over financial reporting.
/s/ Deloitte & Touche LLP
Williamsville, New York
March 3, 2015
-
56
-
GREATBATCH, INC.
|
|
At
|
||||||
|
(in thousands except share and per share data)
|
January 2,
2015 |
January 3,
2014 |
|||||
|
ASSETS
|
|||||||
|
Current assets:
|
|||||||
|
Cash and cash equivalents
|
$
|
76,824
|
|
$
|
35,465
|
|
|
|
Accounts receivable, net of allowance for doubtful accounts of $1.4 million in 2014 and $2.0 million in 2013
|
124,953
|
|
113,679
|
|
|||
|
Inventories
|
129,242
|
|
118,358
|
|
|||
|
Refundable income taxes
|
1,716
|
|
2,306
|
|
|||
|
Deferred income taxes
|
6,168
|
|
6,008
|
|
|||
|
Prepaid expenses and other current assets
|
11,780
|
|
6,717
|
|
|||
|
Total current assets
|
350,683
|
|
282,533
|
|
|||
|
Property, plant and equipment, net
|
144,925
|
|
145,773
|
|
|||
|
Amortizing intangible assets, net
|
65,337
|
|
76,122
|
|
|||
|
Indefinite-lived intangible assets
|
20,288
|
|
20,288
|
|
|||
|
Goodwill
|
354,393
|
|
346,656
|
|
|||
|
Deferred income taxes
|
2,626
|
|
2,933
|
|
|||
|
Other assets
|
17,757
|
|
16,398
|
|
|||
|
Total assets
|
$
|
956,009
|
|
$
|
890,703
|
|
|
|
LIABILITIES AND STOCKHOLDERS’ EQUITY
|
|||||||
|
Current liabilities:
|
|||||||
|
Current portion of long-term debt
|
$
|
11,250
|
|
$
|
—
|
|
|
|
Accounts payable
|
46,436
|
|
46,508
|
|
|||
|
Income taxes payable
|
2,003
|
|
—
|
|
|||
|
Deferred income taxes
|
588
|
|
613
|
|
|||
|
Accrued expenses
|
48,384
|
|
44,681
|
|
|||
|
Total current liabilities
|
108,661
|
|
91,802
|
|
|||
|
Long-term debt
|
176,250
|
|
197,500
|
|
|||
|
Deferred income taxes
|
53,195
|
|
52,012
|
|
|||
|
Other long-term liabilities
|
4,541
|
|
7,334
|
|
|||
|
Total liabilities
|
342,647
|
|
348,648
|
|
|||
|
Commitments and contingencies (Note 15)
|
|
|
|||||
|
Stockholders’ equity:
|
|||||||
|
Preferred stock, $0.001 par value, authorized 100,000,000 shares; no shares issued or outstanding in 2014 or 2013
|
—
|
|
—
|
|
|||
|
Common stock, $0.001 par value, authorized 100,000,000 shares; 25,099,293 shares issued and 25,070,931 shares outstanding in 2014; 24,459,153 shares issued and 24,422,555 shares outstanding in 2013
|
25
|
|
24
|
|
|||
|
Additional paid-in capital
|
366,073
|
|
344,915
|
|
|||
|
Treasury stock, at cost, 28,362 shares in 2014 and 36,598 shares in 2013
|
(1,307
|
)
|
(1,232
|
)
|
|||
|
Retained earnings
|
239,448
|
|
183,990
|
|
|||
|
Accumulated other comprehensive income
|
9,123
|
|
14,358
|
|
|||
|
Total stockholders’ equity
|
613,362
|
|
542,055
|
|
|||
|
Total liabilities and stockholders’ equity
|
$
|
956,009
|
|
$
|
890,703
|
|
|
The accompanying notes are an integral part of these consolidated financial statements.
-
57
-
GREATBATCH, INC.
AND COMPREHENSIVE INCOME (LOSS)
|
|
Year Ended
|
||||||||||
|
(in thousands except per share data)
|
January 2,
2015 |
January 3,
2014 |
December 28,
2012 |
||||||||
|
Sales
|
$
|
687,787
|
|
$
|
663,945
|
|
$
|
646,177
|
|
||
|
Cost of sales
|
456,389
|
|
444,632
|
|
444,528
|
|
|||||
|
Gross profit
|
231,398
|
|
219,313
|
|
201,649
|
|
|||||
|
Operating expenses:
|
|||||||||||
|
Selling, general and administrative expenses
|
90,602
|
|
88,107
|
|
80,992
|
|
|||||
|
Research, development and engineering costs, net
|
49,845
|
|
54,077
|
|
52,490
|
|
|||||
|
Other operating expenses, net
|
15,297
|
|
15,790
|
|
42,346
|
|
|||||
|
Total operating expenses
|
155,744
|
|
157,974
|
|
175,828
|
|
|||||
|
Operating income
|
75,654
|
|
61,339
|
|
25,821
|
|
|||||
|
Interest expense
|
4,252
|
|
11,261
|
|
18,054
|
|
|||||
|
(Gain) loss on cost and equity method investments, net
|
(4,370
|
)
|
694
|
|
106
|
|
|||||
|
Other (income) expense, net
|
(807
|
)
|
546
|
|
931
|
|
|||||
|
Income before provision for income taxes
|
76,579
|
|
48,838
|
|
6,730
|
|
|||||
|
Provision for income taxes
|
21,121
|
|
12,571
|
|
11,529
|
|
|||||
|
Net income (loss)
|
$
|
55,458
|
|
$
|
36,267
|
|
$
|
(4,799
|
)
|
||
|
Earnings (loss) per share:
|
|||||||||||
|
Basic
|
$
|
2.23
|
|
$
|
1.51
|
|
$
|
(0.20
|
)
|
||
|
Diluted
|
$
|
2.14
|
|
$
|
1.43
|
|
$
|
(0.20
|
)
|
||
|
Weighted average shares outstanding:
|
|||||||||||
|
Basic
|
24,825
|
|
23,991
|
|
23,584
|
|
|||||
|
Diluted
|
25,975
|
|
25,323
|
|
23,584
|
|
|||||
|
Comprehensive Income (Loss)
|
|||||||||||
|
Net income (loss)
|
$
|
55,458
|
|
$
|
36,267
|
|
$
|
(4,799
|
)
|
||
|
Other comprehensive income (loss):
|
|||||||||||
|
Foreign currency translation gain (loss)
|
(3,502
|
)
|
1,521
|
|
1,905
|
|
|||||
|
Net change in cash flow hedges, net of tax
|
(1,359
|
)
|
(382
|
)
|
428
|
|
|||||
|
Defined benefit plan liability adjustment, net of tax
|
(374
|
)
|
272
|
|
1,685
|
|
|||||
|
Other comprehensive income (loss)
|
(5,235
|
)
|
1,411
|
|
4,018
|
|
|||||
|
Comprehensive income (loss)
|
$
|
50,223
|
|
$
|
37,678
|
|
$
|
(781
|
)
|
||
The accompanying notes are an integral part of these consolidated financial statements.
-
58
-
GREATBATCH, INC.
|
|
Year Ended
|
||||||||||
|
(in thousands)
|
January 2, 2015
|
January 3, 2014
|
December 28, 2012
|
||||||||
|
Cash flows from operating activities:
|
|||||||||||
|
Net income (loss)
|
$
|
55,458
|
|
$
|
36,267
|
|
$
|
(4,799
|
)
|
||
|
Adjustments to reconcile net income (loss) to net cash provided by operating activities:
|
|||||||||||
|
Depreciation and amortization
|
37,457
|
|
35,966
|
|
46,368
|
|
|||||
|
Debt related amortization included in interest expense
|
773
|
|
6,366
|
|
12,557
|
|
|||||
|
Stock-based compensation
|
13,186
|
|
14,101
|
|
10,904
|
|
|||||
|
(Gain) loss on cost and equity method investments, net
|
(4,370
|
)
|
694
|
|
106
|
|
|||||
|
Other non-cash (gains) losses, net
|
(3,214
|
)
|
255
|
|
10,788
|
|
|||||
|
Deferred income taxes
|
531
|
|
(29,856
|
)
|
5,733
|
|
|||||
|
Changes in operating assets and liabilities, net of acquisitions:
|
|||||||||||
|
Accounts receivable
|
(11,731
|
)
|
7,379
|
|
(18,834
|
)
|
|||||
|
Inventories
|
(6,726
|
)
|
(11,508
|
)
|
(7,481
|
)
|
|||||
|
Prepaid expenses and other assets
|
(3,281
|
)
|
(353
|
)
|
1,253
|
|
|||||
|
Accounts payable
|
(970
|
)
|
1,307
|
|
5,757
|
|
|||||
|
Accrued expenses
|
1,214
|
|
(1,176
|
)
|
1,459
|
|
|||||
|
Income taxes payable
|
2,949
|
|
(2,687
|
)
|
1,020
|
|
|||||
|
Net cash provided by operating activities
|
81,276
|
|
56,755
|
|
64,831
|
|
|||||
|
Cash flows from investing activities:
|
|||||||||||
|
Proceeds from sale of orthopaedic product lines
|
2,655
|
|
4,746
|
|
—
|
|
|||||
|
Acquisition of property, plant and equipment
|
(24,823
|
)
|
(18,558
|
)
|
(41,069
|
)
|
|||||
|
Proceeds from sale (purchase) of cost and equity method investments, net
|
2,248
|
|
(3,732
|
)
|
(1,887
|
)
|
|||||
|
Acquisitions, net of cash acquired
|
(16,002
|
)
|
—
|
|
(17,224
|
)
|
|||||
|
Other investing activities, net
|
—
|
|
(740
|
)
|
393
|
|
|||||
|
Net cash used in investing activities
|
(35,922
|
)
|
(18,284
|
)
|
(59,787
|
)
|
|||||
|
Cash flows from financing activities:
|
|||||||||||
|
Principal payments of long-term debt
|
(10,000
|
)
|
(458,282
|
)
|
(32,000
|
)
|
|||||
|
Proceeds from issuance of long-term debt
|
—
|
|
425,000
|
|
10,000
|
|
|||||
|
Issuance of common stock
|
8,278
|
|
12,807
|
|
1,263
|
|
|||||
|
Payment of debt issuance costs
|
—
|
|
(2,802
|
)
|
—
|
|
|||||
|
Other financing activities, net
|
(655
|
)
|
(81
|
)
|
(717
|
)
|
|||||
|
Net cash used in financing activities
|
(2,377
|
)
|
(23,358
|
)
|
(21,454
|
)
|
|||||
|
Effect of foreign currency exchange rates on cash and cash equivalents
|
(1,618
|
)
|
68
|
|
186
|
|
|||||
|
Net increase (decrease) in cash and cash equivalents
|
41,359
|
|
15,181
|
|
(16,224
|
)
|
|||||
|
Cash and cash equivalents, beginning of year
|
35,465
|
|
20,284
|
|
36,508
|
|
|||||
|
Cash and cash equivalents, end of year
|
$
|
76,824
|
|
$
|
35,465
|
|
$
|
20,284
|
|
||
The accompanying notes are an integral part of these consolidated financial statements.
-
59
-
GREATBATCH, INC.
CONSOLIDATED STATEMENTS OF STOCKHOLDERS’ EQUITY
|
|
Common Stock
|
Additional
Paid-In
Capital
|
Treasury
Stock
|
Retained
Earnings
|
Accumulated
Other Comprehensive
Income (Loss)
|
Total
Stockholders’
Equity
|
|||||||||||||||||||||||
|
(in thousands)
|
Shares
|
Amount
|
Shares
|
Amount
|
|||||||||||||||||||||||||
|
At December 30, 2011
|
23,466
|
|
$
|
23
|
|
$
|
307,196
|
|
(60
|
)
|
$
|
(1,387
|
)
|
$
|
152,522
|
|
$
|
8,929
|
|
$
|
467,283
|
|
|||||||
|
Stock-based compensation
|
—
|
|
—
|
|
9,019
|
|
—
|
|
—
|
|
—
|
|
—
|
|
9,019
|
|
|||||||||||||
|
Net shares issued under stock incentive plans
|
103
|
|
—
|
|
663
|
|
1
|
|
24
|
|
—
|
|
—
|
|
687
|
|
|||||||||||||
|
Income tax liability from stock options, restricted stock and restricted stock units
|
—
|
|
—
|
|
(141
|
)
|
—
|
|
—
|
|
—
|
|
—
|
|
(141
|
)
|
|||||||||||||
|
Shares contributed to 401(k) Plan
|
163
|
|
1
|
|
3,881
|
|
39
|
|
911
|
|
—
|
|
4,793
|
|
|||||||||||||||
|
Net loss
|
—
|
|
—
|
|
—
|
|
—
|
|
—
|
|
(4,799
|
)
|
—
|
|
(4,799
|
)
|
|||||||||||||
|
Total other comprehensive income, net
|
—
|
|
—
|
|
—
|
|
—
|
|
—
|
|
—
|
|
4,018
|
|
4,018
|
|
|||||||||||||
|
At December 28, 2012
|
23,732
|
|
24
|
|
320,618
|
|
(20
|
)
|
(452
|
)
|
147,723
|
|
12,947
|
|
480,860
|
|
|||||||||||||
|
Stock-based compensation
|
—
|
|
—
|
|
9,333
|
|
—
|
|
—
|
|
—
|
|
—
|
|
9,333
|
|
|||||||||||||
|
Net shares issued (acquired) under stock incentive plans
|
636
|
|
—
|
|
12,245
|
|
(17
|
)
|
(780
|
)
|
—
|
|
—
|
|
11,465
|
|
|||||||||||||
|
Income tax benefit from stock options, restricted stock and restricted stock units
|
—
|
|
—
|
|
242
|
|
—
|
|
—
|
|
—
|
|
—
|
|
242
|
|
|||||||||||||
|
Shares contributed to 401(k) Plan
|
91
|
|
—
|
|
2,477
|
|
—
|
|
—
|
|
—
|
|
—
|
|
2,477
|
|
|||||||||||||
|
Net income
|
—
|
|
—
|
|
—
|
|
—
|
|
—
|
|
36,267
|
|
—
|
|
36,267
|
|
|||||||||||||
|
Total other comprehensive income, net
|
—
|
|
—
|
|
—
|
|
—
|
|
—
|
|
—
|
|
1,411
|
|
1,411
|
|
|||||||||||||
|
At January 3, 2014
|
24,459
|
|
24
|
|
344,915
|
|
(37
|
)
|
(1,232
|
)
|
183,990
|
|
14,358
|
|
542,055
|
|
|||||||||||||
|
Stock-based compensation
|
—
|
|
—
|
|
8,921
|
|
—
|
|
—
|
|
—
|
|
—
|
|
8,921
|
|
|||||||||||||
|
Net shares issued (acquired) under stock incentive plans
|
640
|
|
1
|
|
7,754
|
|
(86
|
)
|
(4,290
|
)
|
—
|
|
—
|
|
3,465
|
|
|||||||||||||
|
Income tax benefit from stock options, restricted stock and restricted stock units
|
—
|
|
—
|
|
4,357
|
|
—
|
|
—
|
|
—
|
|
—
|
|
4,357
|
|
|||||||||||||
|
Shares contributed to 401(k) Plan
|
—
|
|
—
|
|
126
|
|
95
|
|
4,215
|
|
—
|
|
—
|
|
4,341
|
|
|||||||||||||
|
Net income
|
—
|
|
—
|
|
—
|
|
—
|
|
—
|
|
55,458
|
|
—
|
|
55,458
|
|
|||||||||||||
|
Total other comprehensive loss, net
|
—
|
|
—
|
|
—
|
|
—
|
|
—
|
|
—
|
|
(5,235
|
)
|
(5,235
|
)
|
|||||||||||||
|
At January 2, 2015
|
25,099
|
|
$
|
25
|
|
$
|
366,073
|
|
(28
|
)
|
$
|
(1,307
|
)
|
$
|
239,448
|
|
$
|
9,123
|
|
$
|
613,362
|
|
|||||||
The accompanying notes are an integral part of these consolidated financial statements.
-
60
-
GREATBATCH, INC.
NOTES TO CONSOLIDATED FINANCIAL STATEMENTS
|
1.
|
SUMMARY OF SIGNIFICANT ACCOUNTING POLICIES
|
|
Principles of Consolidation
– The consolidated financial statements include the accounts of Greatbatch, Inc. and its wholly owned subsidiary Greatbatch Ltd. (collectively, the “Company” or “Greatbatch”). All intercompany balances and transactions have been eliminated in consolidation.
Nature of Operations
– The Company has
two
reportable segments: Greatbatch Medical and QiG Group (“QiG”). Greatbatch Medical designs and manufactures products where Greatbatch either owns the intellectual property or has unique manufacturing and assembly expertise. These products include medical devices and components for the cardiac, neuromodulation, orthopaedics, portable medical, vascular and energy markets among others. The Greatbatch Medical segment also offers value-added assembly and design engineering services for medical devices that utilize its component products.
QiG focuses on developing medical device systems for some of healthcare’s most pressing challenges and reflects Greatbatch’s strategic evolution of its product offerings in order to raise the growth and profitability profile of the Company. QiG utilizes a disciplined and diversified portfolio approach with three investor modes: new medical device systems commercialization, collaborative programs with original equipment manufacturers (“OEMs”) customers, and strategic equity positions in emerging healthcare companies.
The Company’s customers include large multi-national OEMs and their affiliated subsidiaries.
Fiscal Year End
– The Company utilizes a
fifty-two
,
fifty-three
week fiscal year ending on the Friday nearest December 31. Fiscal years
2014
,
2013
and
2012
ended on
January 2, 2015
,
January 3, 2014
and
December 28, 2012
. Fiscal years 2014 and 2012 each contained fifty-two weeks, while fiscal year 2013 contained fifty-three weeks.
Fair Value Measurements
– Fair value is defined as the price that would be received to sell an asset or paid to transfer a liability (i.e
.
the “exit price”) in an orderly transaction between market participants at the measurement date. Accounting Standards Codification (“ASC”) establishes a hierarchy for inputs used in measuring fair value that maximizes the use of observable inputs and minimizes the use of unobservable inputs by requiring that the most observable inputs be used when available. Observable inputs are inputs that market participants would use in pricing the asset or liability developed based on market data obtained from sources independent of the Company. Unobservable inputs are inputs that reflect the Company’s assumptions about the assumptions market participants would use in pricing the asset or liability developed based on the best information available in the circumstances. The hierarchy is broken down into three levels based on the reliability of inputs as follows:
Level 1
– Valuation is based on quoted prices in active markets for identical assets or liabilities that the Company has the ability to access. Level 1 valuations do not entail a significant degree of judgment.
Level 2
– Valuation is determined from quoted prices for similar assets or liabilities in active markets, quoted prices for identical instruments in markets that are not active or by model-based techniques in which all significant inputs are observable in the market.
Level 3
– Valuation is based on unobservable inputs that are significant to the overall fair value measurement. The degree of judgment in determining fair value is greatest for Level 3 valuations.
The availability of observable inputs can vary and is affected by a wide variety of factors, including, the type of asset/liability, whether the asset/liability is established in the marketplace, and other characteristics particular to the valuation. To the extent that a valuation is based on models or inputs that are less observable or unobservable in the market, the determination of fair value requires more judgment. In certain cases, the inputs used to measure fair value may fall into different levels of the fair value hierarchy. In such cases, for disclosure purposes the level in the fair value hierarchy within which the fair value measurement in its entirety falls is determined based on the lowest level input that is significant to the fair value measurement in its entirety.
Fair value is a market-based measure considered from the perspective of a market participant rather than an entity-specific measure. Therefore, even when market assumptions are not readily available, assumptions are required to reflect those that market participants would use in pricing the asset or liability at the measurement date. Note 18 “Fair Value Measurements” contains additional information on assets and liabilities recorded at fair value in the consolidated financial statements.
-
61
-
GREATBATCH, INC.
NOTES TO CONSOLIDATED FINANCIAL STATEMENTS
Cash and Cash Equivalents
– Cash and cash equivalents consist of cash and highly liquid, short-term investments with maturities at the time of purchase of three months or less. The carrying amount of cash and cash equivalents approximated their fair value as of
January 2, 2015
and
January 3, 2014
based upon the short-term nature of these instruments.
Concentration of Credit Risk
– Financial instruments that potentially subject the Company to concentration of credit risk consist principally of accounts receivable. A significant portion of the Company’s sales and/or accounts receivable are to
four
customers, all in the medical device industry, and, as such, the Company is directly affected by the condition of those customers and that industry. However, the credit risk associated with trade receivables is partially mitigated due to the stability of those customers. The Company performs on-going credit evaluations of its customers. Note 19 “Business Segment, Geographic and Concentration Risk Information” contains information on sales and accounts receivable for these customers. The Company maintains cash deposits with major banks, which from time to time may exceed insured limits. The Company performs on-going credit evaluations of its banks.
Allowance for Doubtful Accounts
– The Company provides credit, in the normal course of business, to its customers in the form of trade receivables. Credit is extended based on evaluation of a customer’s financial condition and collateral is not required. The Company maintains an allowance for those customer receivables that it does not expect to collect. The Company accrues its estimated losses from uncollectable accounts receivable to the allowance based upon recent historical experience, the length of time the receivable has been outstanding and other specific information as it becomes available. Provisions to the allowance for doubtful accounts are charged to current operating expenses. Actual losses are charged against this allowance when incurred. The carrying amount of trade receivables approximated their fair value as of
January 2, 2015
based upon the short-term nature of these assets.
Inventories
– Inventories are stated at the lower of cost, determined using the first-in first-out method, or market. Write-downs for excess, obsolete or expired inventory are based primarily on how long the inventory has been held as well as estimates of forecasted net sales of that product. A significant change in the timing or level of demand for products may result in recording additional write-downs for excess, obsolete or expired inventory in the future. Note 4 “Inventories” contains additional information on the Company’s inventory.
Property, Plant and Equipment (“PP&E”)
– PP&E is carried at cost less accumulated depreciation. Depreciation is computed by the straight-line method over the estimated useful lives of the assets, as follows: buildings and building improvements
7
-
40
years; machinery and equipment
3
-
8
years; office equipment
3
-
10
years; and leasehold improvements over the remaining lives of the improvements or the lease term, if less. The cost of repairs and maintenance are expensed as incurred; renewals and betterments are capitalized. Upon retirement or sale of an asset, its cost and related accumulated depreciation or amortization is removed from the accounts and any gain or loss is recorded in operating income or expense. Note 6 “Property, Plant and Equipment, Net” contains additional information on the Company’s PP&E.
Business Combinations
– The Company records its business combinations under the acquisition method of accounting. Under the acquisition method of accounting, the Company allocates the purchase price of each acquisition to the tangible and identifiable intangible assets acquired and liabilities assumed based on their respective fair values at the date of acquisition. The fair value of identifiable intangible assets is based upon detailed valuations that use various assumptions made by management. Any excess of the purchase price over the fair value of net tangible and identifiable intangible assets acquired is allocated to goodwill. All direct acquisition-related costs are expensed as incurred.
In circumstances where an acquisition involves a contingent consideration arrangement, the Company recognizes a liability equal to the fair value of the contingent payments it expects to make as of the acquisition date. The Company re-measures this liability each reporting period and records changes in the fair value through Other Operating Expenses, Net. Increases or decreases in the fair value of the contingent consideration liability can result from changes in discount periods and rates, as well as changes in the timing, amount of, or the likelihood of achieving the applicable contingent consideration. See Note 18 “Fair Value Measurements” and Note 2 “Acquisitions” for additional information on the Company’s contingent consideration and acquisitions, respectively.
Amortizing Intangible Assets
– Amortizing intangible assets consists primarily of purchased technology, patents and customer lists. The Company amortizes its definite-lived intangible assets over their estimated useful lives utilizing an accelerated or straight-line method of amortization, which approximates the projected cash flows used to fair value those intangible assets at the time of acquisition. When the straight-line method of amortization is utilized, the estimated useful life of the intangible asset is shortened to assure that recognition of amortization expense corresponds with the expected cash flows. The amortization period for the Company’s amortizing intangible assets are as follows: purchased technology and patents
5
-
15
years; customer lists
7
-
20
years and other intangible assets
1
-
10
years. See Note 7 “Intangible Assets” for additional information on the Company’s amortizing intangible assets.
-
62
-
GREATBATCH, INC.
NOTES TO CONSOLIDATED FINANCIAL STATEMENTS
Impairment of Long-Lived Assets
– The Company assesses the impairment of definite-lived long-lived assets or asset groups when events or changes in circumstances indicate that the carrying value may not be recoverable. Factors that are considered in deciding when to perform an impairment review include: a significant decrease in the market price of the asset or asset group; a significant change in the extent or manner in which a long-lived asset or asset group is being used or in its physical condition; a significant change in legal factors or in the business climate that could affect the value of a long-lived asset or asset group, including an action or assessment by a regulator; an accumulation of costs significantly in excess of the amount originally expected for the acquisition or construction; a current-period operating or cash flow loss combined with a history of operating or cash flow losses or a projection or forecast that demonstrates continuing losses associated with the use of a long-lived asset or asset group; or a current expectation that, more likely than not, a long-lived asset or asset group will be sold or otherwise disposed of significantly before the end of its previously estimated useful life. The term more likely than not refers to a level of likelihood that is more than
50 percent
.
Potential recoverability is measured by comparing the carrying amount of the asset or asset group to its related total future undiscounted cash flows. If the carrying value is not recoverable, the asset or asset group is considered to be impaired. Impairment is measured by comparing the asset or asset group’s carrying amount to its fair value. When it is determined that useful lives of assets are shorter than originally estimated, and no impairment is present, the rate of depreciation is accelerated in order to fully depreciate the assets over their new shorter useful lives.
Goodwill and other indefinite lived intangible assets recorded are not amortized but are periodically tested for impairment. The Company assesses goodwill for impairment on the last day of each fiscal year, or more frequently if certain events occur as described above. Goodwill is evaluated for impairment through the comparison of the fair value of the reporting units to their carrying values. When evaluating goodwill for impairment, the Company may first perform an assessment of qualitative factors to determine if the fair value of the reporting unit is more-likely-than-not greater than its carrying amount. This qualitative assessment is referred to as a “step zero
”
approach. If, based on the review of the qualitative factors, the Company determines it is more-likely-than-not that the fair value of the reporting unit is greater than its carrying value, the required two-step impairment test can be bypassed. If the Company does not perform a step zero assessment or if the fair value of the reporting unit is more-likely-than-not less than its carrying value, the Company must perform a two-step impairment test, and calculate the estimated fair value of the reporting unit. If, based upon the two-step impairment test, it is determined that the fair value of a reporting unit is less than its carrying value, an impairment loss is recorded to the extent that the implied fair value of the goodwill within the reporting unit is less than its carrying value. Under the two-step approach, fair values for reporting units are determined based on discounted cash flows and market multiples.
The Company completed its annual goodwill impairment assessment for 2014 by performing a step zero qualitative analysis. As part of this analysis, the Company evaluated factors including, but not limited to, macro-economic conditions, market and industry conditions, cost factors, competitive environment, share price fluctuations, results of the last impairment test, and the operational stability and the overall financial performance of the reporting units. After completing the analysis, the Company determined that it was more likely than not that its reporting units fair values are greater than the reporting units carrying values and the two-step impairment test is not necessary.
Other indefinite lived intangible assets are assessed for impairment on the last day of each fiscal year, or more frequently if certain events occur as described above, by comparing the fair value of the intangible asset to its carrying value. The fair value is determined by using the income approach. Note 7 “Intangible Assets” contains additional information on the Company’s long-lived intangible assets.
Other Long-Term Assets
– Other long-term assets includes deferred financing fees incurred in connection with the Company’s issuance of its long-term debt. The fees relating to the Company’s Term Loan are amortized to Interest Expense using the effective interest method over the period from the date of issuance to the put option date (if applicable) or the maturity date, whichever is earlier. Fees relating to the Company’s Revolving Credit Facility are amortized to Interest Expense on a straight-line basis over the contractual term of the credit facility. The amortization of deferred fees is included in Debt Related Amortization Included in Interest Expense in the Consolidated Statements of Cash Flows. Note 9 “Debt” contains additional information on the Company’s deferred financing fees.
Other long-term assets also include investments in equity securities of entities that are not publicly traded and which do not have readily determinable fair values. The Company accounts for investments in these entities under the cost or equity method depending on the type of ownership interest, as well as the Company’s ability to exercise influence over these entities. Equity method investments are initially recorded at cost, and are subsequently adjusted to reflect the Company’s share of earnings or losses of the investee. Cost method investments are recorded at cost. Each reporting period, management evaluates these cost and equity method investments to determine if there are any events or circumstances that are likely to have a significant effect on the fair value of the investment. Examples of such impairment indicators include, but are not limited to: a recent sale or offering of similar shares of the investment at a price below the Company’s
-
63
-
GREATBATCH, INC.
NOTES TO CONSOLIDATED FINANCIAL STATEMENTS
cost basis; a significant deterioration in earnings performance; a significant change in the regulatory, economic or technological environment of the investee; or a significant doubt about an investee’s ability to continue as a going concern. If an impairment indicator is identified, management will estimate the fair value of the investment and compare it to its carrying value. The estimation of fair value considers all available financial information related to the investee, including, but not limited to, valuations based on recent third-party equity investments in the investee. If the fair value of the investment is less than its carrying value, the investment is impaired and a determination as to whether the impairment is other-than-temporary is made. Impairment is deemed to be other-than-temporary unless the Company has the ability and intent to hold the investment for a period sufficient for a market recovery up to the carrying value of the investment. Further, evidence must indicate that the carrying value of the investment is recoverable within a reasonable period. For other-than-temporary impairments, an impairment loss is recognized equal to the difference between the investment’s carrying value and its fair value. The Company has determined that these investments are not considered variable interest entities. The Company’s exposure related to these entities is limited to its recorded investment. These investments are in start-up research and development companies whose fair value is highly subjective in nature and subject to future fluctuations, which could be significant.
Income Taxes
– The consolidated financial statements of the Company have been prepared using the asset and liability approach in accounting for income taxes, which requires the recognition of deferred income taxes for the expected future tax consequences of net operating losses, credits, and temporary differences between the financial statement carrying amounts and the tax bases of assets and liabilities. A valuation allowance is provided on deferred tax assets if it is determined that it is more likely than not that the asset will not be realized.
The Company accounts for uncertain tax positions using a more likely than not recognition threshold. The evaluation of uncertain tax positions is based on factors including, but not limited to, changes in tax law, the measurement of tax positions taken or expected to be taken in tax returns, the effective settlement of matters subject to audit, new audit activity and changes in facts or circumstances related to a tax position. These tax positions are evaluated on a quarterly basis. The Company recognizes interest expense related to uncertain tax positions as Provision for Income Taxes. Penalties, if incurred, are recognized as a component of Selling, General and Administrative Expenses (“SG&A”).
The Company and its subsidiary file a consolidated U.S. federal income tax return. State tax returns are filed on a combined or separate basis depending on the applicable laws in the jurisdictions where tax returns are filed. The Company also files foreign tax returns on a separate company basis in the countries in which it operates. See Note 14 “Income Taxes” for additional information.
Convertible Subordinated Notes (“CSN”)
– For convertible debt instruments that may be settled in cash upon conversion, the Company accounts for the liability and equity components of those instruments in a manner that will reflect the entity’s nonconvertible debt borrowing rate when interest cost is recognized in subsequent periods.
Upon issuance, the Company determined the carrying amount of the liability component of CSN by measuring the fair value of a similar liability that does not have the associated conversion option. The carrying amount of the conversion option was then determined by deducting the fair value of the liability component from the initial proceeds received from the issuance of CSN. The carrying amount of the conversion option was recorded in Additional Paid-In Capital with an offset to Long-Term Debt and was amortized using the effective interest method over the period from the date of issuance to the maturity date. The amortization of discount related to the Company’s convertible debt instruments is included in Debt Related Amortization Included in Interest Expense in the Consolidated Statements of Cash Flows. See Note 9 “Debt” for additional information.
Derivative Financial Instruments
– The Company recognizes all derivative financial instruments in its consolidated financial statements at fair value
.
Changes in the fair value of derivative instruments are recorded in earnings unless hedge accounting criteria are met. The Company designates its interest rate swaps (See Note 9 “Debt”) and foreign currency contracts (See Note 15 “Commitments and Contingencies”) entered into as cash flow hedges. The effective portion of the changes in fair value of these cash flow hedges is recorded each period, net of tax, in Accumulated Other Comprehensive Income until the related hedged transaction occurs. Any ineffective portion of the changes in fair value of these cash flow hedges is recorded in earnings. In the event the hedged cash flow for forecasted transactions does not occur, or it becomes probable that they will not occur, the Company would reclassify the amount of any gain or loss on the related cash flow hedge to income (expense) at that time. Cash flows related to these derivative financial instruments are included in cash flows from operating activities.
Revenue Recognition
– The Company recognizes revenue when it is realized or realizable and earned. This occurs when persuasive evidence of an arrangement exists, delivery has occurred, the price is fixed or determinable (including any price concessions under long-term agreements), the buyer is obligated to pay us (i.e., not contingent on a future event), the risk of loss is transferred, there is no obligation of future performance, collectability is reasonably assured and the amount of future returns can reasonably be estimated. With regards to the Company’s customers (including distributors), those
-
64
-
GREATBATCH, INC.
NOTES TO CONSOLIDATED FINANCIAL STATEMENTS
criteria are met at the time of shipment when title passes. Currently, the revenue recognition policy is the same for both Greatbatch Medical and QiG. In general, for customers with long-term contracts, we have negotiated fixed pricing arrangements. During new contract negotiations, price level decreases (concessions) for future sales may be offered to customers in exchange for volume and/or long-term commitments. Once the new contracts are signed, these prices are fixed and determinable for all future sales. The Company includes shipping and handling fees billed to customers in Sales. Shipping and handling costs associated with inbound and outbound freight are recorded in Cost of Sales. In certain instances the Company obtains component parts for sub-assemblies from its customers that are included in the final product sold back to the same customer. These amounts are excluded from Sales and Cost of Sales recognized by the Company. The cost of these customer supplied component parts amounted to
$48.1 million
,
$45.3 million
and $
32.6 million
in
2014
,
2013
and
2012
, respectively.
Product Warranties
– The Company allows customers to return defective or damaged products for credit, replacement, or exchange. The Company warrants that its products will meet customer specifications and will be free from defects in materials and workmanship
.
The Company accrues its estimated exposure to warranty claims, through Cost of Sales, based upon recent historical experience and other specific information as it becomes available. Note 15 “Commitments and Contingencies” contains additional information on the Company’s product warranties.
Research, Development and Engineering Costs, Net (“RD&E”)
– RD&E costs are expensed as incurred. The primary costs are salary and benefits for personnel, material costs used in development projects and subcontracting costs. Cost reimbursements for engineering services from customers for whom the Company designs products are recorded as an offset to engineering costs upon achieving development milestones specified in the contracts. These reimbursements do not cover the complete cost of the development projects. Additionally, the technology developed under these cost reimbursement projects is owned by the Company and is utilized for future products developed for other customers.
In-process research and development (“IPR&D”) represents research projects acquired in a business combination which are expected to generate cash flows but have not yet reached technological feasibility. The primary basis for determining the technological feasibility of these projects is whether or not regulatory approval has been obtained. The Company classifies IPR&D acquired in a business combination as an indefinite-lived intangible asset until the completion or abandonment of the associated projects. Upon completion, the Company would determine the useful life of the IPR&D and begin amortizing the assets to reflect their use over their remaining lives. Upon permanent abandonment, the remaining carrying amount of the associated IPR&D would be written-off. The Company tests the IPR&D acquired for impairment at least annually, and more frequently if events or changes in circumstances indicate that the assets may be impaired. The impairment test consists of a comparison of the fair value of the intangible assets with their carrying amount. If the carrying amount exceeds its fair value, the Company would record an impairment loss in an amount equal to the excess.
Stock-Based Compensation
–
The Company records compensation costs related to stock-based awards granted to employees based upon their estimated fair value on the grant date. Compensation cost for service-based awards is recognized ratably over the applicable vesting period. Compensation cost for nonmarket-based performance awards is reassessed each period and recognized based upon the probability that the performance targets will be achieved. Compensation cost for market-based performance awards is expensed ratably over the applicable vesting period and is recognized each period whether the performance metrics are achieved or not.
The Company utilizes the Black-Scholes option pricing model to estimate the fair value of stock options granted. For service-based and nonmarket-based performance restricted stock and restricted stock unit awards, the fair market value of the award is determined based upon the closing value of the Company’s stock price on the grant date. For market-based performance restricted stock unit awards, the fair market value of the award is determined utilizing a Monte Carlo simulation model, which projects the value of the Company’s stock under numerous scenarios and determines the value of the award based upon the present value of those projected outcomes.
The amount of stock-based compensation expense recognized is based on the portion of the awards that are ultimately expected to vest. The Company estimates pre-vesting forfeitures at the time of grant by analyzing historical data and revises those estimates in subsequent periods if actual forfeitures differ from those estimates. The total expense recognized over the vesting period will only be for those awards that ultimately vest, excluding market and nonmarket performance award considerations. Note 11 “Stock-Based Compensation” contains additional information on the Company’s stock-based compensation.
-
65
-
GREATBATCH, INC.
NOTES TO CONSOLIDATED FINANCIAL STATEMENTS
Foreign Currency Translation
– The Company translates all assets and liabilities of its foreign subsidiaries, where the U.S. dollar is not the functional currency, at the period-end exchange rate and translates income and expenses at the average exchange rates in effect during the period. The net effect of this translation is recorded in the consolidated financial statements as Accumulated Other Comprehensive Income. Translation adjustments are not adjusted for income taxes as they relate to permanent investments in the Company’s foreign subsidiaries.
Net foreign currency transaction gains and losses are included in Other (Income) Expense, Net and amounted to a gain of
$1.3 million
for
2014
, a loss of
$0.1 million
for
2013
and a loss of
$0.3 million
for
2012
.
Defined Benefit Plans
– The Company recognizes in its balance sheet as an asset or liability the overfunded or underfunded status of its defined benefit plans provided to its employees located in Mexico, Switzerland and France. This asset or liability is measured as the difference between the fair value of plan assets and the benefit obligation of those plans. For these plans, the benefit obligation is the projected benefit obligation, which is calculated based on actuarial computations of current and future benefits for employees. Actuarial gains or losses and prior service costs or credits that arise during the period, but are not included as components of net periodic benefit expense, are recognized as a component of Accumulated Other Comprehensive Income. Defined benefit expenses are charged to Cost of Sales, SG&A and RD&E expenses as applicable. Note 10 “Benefit Plans” contains additional information on these costs.
Earnings (Loss) Per Share (“EPS”)
– Basic EPS is calculated by dividing Net Income (Loss) by the weighted average number of shares outstanding during the period. Diluted EPS is calculated by adjusting the weighted average number of shares outstanding for potential common shares, which consist of stock options, unvested restricted stock and restricted stock units and, if applicable, contingently convertible instruments such as convertible debt. Note 16 “Earnings (Loss) Per Share” contains additional information on the computation of the Company’s EPS.
Comprehensive Income (Loss)
– The Company’s comprehensive income (loss) as reported in the Consolidated Statements of Operations and Comprehensive Income (Loss) includes net income (loss), foreign currency translation adjustments, the net change in cash flow hedges, and defined benefit plan liability adjustments. The Consolidated Statements of Operations and Comprehensive Income (Loss) and Note 17 “Accumulated Other Comprehensive Income” contains additional information on the computation of the Company’s comprehensive income (loss).
Use of Estimates
– The preparation of financial statements in conformity with accounting principles generally accepted in the United States of America requires management to make estimates and assumptions that affect the reported amounts of assets and liabilities and disclosure of contingent assets and liabilities at the date of the financial statements and reported amounts of sales and expenses during the reporting period. Actual results could differ materially from those estimates.
Recently Issued Accounting Pronouncements
– In the normal course of business, management evaluates all new accounting pronouncements issued by the Financial Accounting Standards Board (“FASB”), Securities and Exchange Commission (“SEC”), Emerging Issues Task Force (“EITF”), or other authoritative accounting bodies to determine the potential impact they may have on the Company’s Consolidated Financial Statements. Based upon this review, except as noted below, management does not expect any of the recently issued accounting pronouncements, which have not already been adopted, to have a material impact on the Company’s Consolidated Financial Statements.
In November 2014, the FASB issued Accounting Standards Update (“ASU”) No. 2014-17, “Business Combinations (Topic 805): Pushdown Accounting (a Consensus of the FASB Emerging Issues Task Force).” The amendments in this ASU provide an acquired entity with an option to apply pushdown accounting in its separate financial statements upon occurrence of an event in which an acquirer obtains control of the acquired entity. An acquired entity may elect the option to apply pushdown accounting in the reporting period in which the change-in-control event occurs. The amendments in this ASU are effective on November 18, 2014. After the effective date, an acquired entity can make an election to apply the guidance to future change-in-control events or to its most recent change-in-control event. This ASU did not impact the Company’s Consolidated Financial Statements.
-
66
-
GREATBATCH, INC.
NOTES TO CONSOLIDATED FINANCIAL STATEMENTS
In May 2014, the FASB issued ASU No. 2014-09, “Revenue from Contracts with Customers.” The core principle behind ASU 2014-09 is that an entity should recognize revenue in an amount that reflects the consideration to which the entity expects to be entitled in exchange for delivering goods and services. This model involves a five-step process that includes identifying the contract with the customer, identifying the performance obligations in the contract, determining the transaction price, allocating the transaction price to the performance obligations in the contract and recognizing revenue when the entity satisfies the performance obligations. This ASU supersedes existing revenue recognition guidance and is effective for annual reporting periods beginning after December 15, 2016 with early application not permitted. This ASU allows two methods of adoption; a full retrospective approach where three years of financial information are presented in accordance with the new standard, and a modified retrospective approach where this ASU is applied to the most current period presented in the financial statements. The Company is currently assessing the financial impact of adopting the new standard and the methods of adoption; however, given the scope of the new standard, the Company is currently unable to provide a reasonable estimate regarding the financial impact or which method of adoption will be elected.
In April 2014, the FASB issued ASU No. 2014-08, “Reporting Discontinued Operations and Disclosures of Disposals of Components of an Entity,” which amends the definition of a discontinued operation and requires entities to provide additional disclosures about disposal transactions that do not meet the discontinued operations criteria. The revised guidance changes how entities identify and disclose information about disposal transactions under U.S. GAAP. This ASU is effective prospectively for all disposals (except disposals classified as held for sale before the adoption date) or components initially classified as held for sale in periods beginning on or after December 15, 2014, with early adoption permitted. This ASU will be applicable for disposal transactions, if any, that the Company enters into after the adoption date.
In July 2013, the FASB issued ASU No. 2013-11, “Income Taxes (Topic 740): Presentation of an Unrecognized Tax Benefit When a Net Operating Loss Carryforward, a Similar Tax Loss, or a Tax Credit Carryforward Exists.” This ASU requires that entities present an unrecognized tax benefit, or portion of an unrecognized tax benefit, as a reduction to a deferred tax asset in the financial statements for a net operating loss carryforward, a similar tax loss, or a tax credit carryforward, with certain exceptions. This ASU was adopted during the first quarter of 2014 and did not impact the Company’s Consolidated Financial Statements as the Company does not have any net operating loss carryforward deferred tax assets that are eligible to be reduced by an unrecognized tax benefit as required by the ASU.
|
2.
|
ACQUISITIONS
|
|
Centro de Construcción de Cardioestimuladores del Uruguay
On
August 12, 2014
the Company purchased all of the outstanding common stock of
Centro de Construcción de Cardioestimuladores del Uruguay (“CCC”)
, headquartered in Montevideo, Uruguay.
CCC is an active implantable neuromodulation medical device systems developer and manufacturer that produces a range of medical devices including implantable pulse generators, programmer systems, battery chargers, patient wands and leads.
This acquisition allows the Company to more broadly partner with medical device companies, complements the Company’s core discrete technology offerings and enhances the Company’s medical device innovation efforts.
This transaction was accounted for under the acquisition method of accounting. Accordingly, the operating results of CCC have been included in the Company’s QiG segment from the date of acquisition. For 2014, CCC added approximately $
5.8 million
to the Company’s revenue and increased the Company’s net income by
$1.2 million
. The aggregate purchase price of
$19.8 million
was funded with cash on hand.
The cost of the acquisition was preliminarily allocated to the assets acquired and liabilities assumed from CCC based on their fair values as of the closing date of the acquisition, with the amount exceeding the fair value of the net assets acquired being recorded as goodwill. The value assigned to certain assets and liabilities are preliminary and are subject to adjustment as additional information is obtained, including, but not limited to, the finalization of pre-acquisition tax positions. The valuation is expected to be finalized in 2015. When the valuation is finalized, any changes to the preliminary valuation of assets acquired or liabilities assumed may result in material adjustments to the fair value of the intangible assets acquired, as well as goodwill.
-
67
-
GREATBATCH, INC.
NOTES TO CONSOLIDATED FINANCIAL STATEMENTS
The following table summarizes the preliminary allocation of the CCC purchase price to the assets acquired and liabilities assumed as of the acquisition date (in thousands):
|
Assets acquired
|
|||
|
Current assets
|
$
|
10,670
|
|
|
Property, plant and equipment
|
1,131
|
|
|
|
Amortizing intangible assets
|
6,100
|
|
|
|
Goodwill
|
8,296
|
|
|
|
Total assets acquired
|
26,197
|
|
|
|
Liabilities assumed
|
|||
|
Current liabilities
|
4,842
|
|
|
|
Deferred income taxes
|
1,590
|
|
|
|
Total liabilities assumed
|
6,432
|
|
|
|
Net assets acquired
|
$
|
19,765
|
|
The preliminary fair values of the assets acquired were determined using one of three valuation approaches: market, income or cost. The selection of a particular method for a given asset depended on the reliability of available data and the nature of the asset, among other considerations.
The market approach estimates the value for a subject asset based on available market pricing for comparable assets. The income approach estimates the value for a subject asset based on the present value of cash flows projected to be generated by the asset. The projected cash flows were discounted at a required rate of return that reflects the relative risk of the asset and the time value of money. The projected cash flows for each asset considered multiple factors from the perspective of a marketplace participant including revenue projections from existing customers, attrition trends, technology life-cycle assumptions, marginal tax rates and expected profit margins giving consideration to historical and expected margins. The cost approach estimates the value for a subject asset based on the cost to replace the asset and reflects the estimated reproduction or replacement cost for the asset, less an allowance for loss in value due to depreciation or obsolescence, with specific consideration given to economic obsolescence if indicated. These fair value measurement approaches are based on significant unobservable inputs, including management estimates and assumptions.
Current assets and liabilities
– The fair value of current assets and liabilities, excluding inventory, was assumed to approximate their carrying value as of the acquisition date due to the short-term nature of these assets and liabilities.
The fair value of in-process and finished goods inventory acquired was estimated by applying a version of the market approach called the comparable sales method. This approach estimates the fair value of the assets by calculating the potential revenue generated from selling the inventory and subtracting from it the costs related to the completion and sale of that inventory and a reasonable profit allowance. Based upon this methodology, the Company recorded the inventory acquired at fair value resulting in an increase in inventory of
$0.3 million
.
Intangible assets
– The purchase price was allocated to intangible assets as follows (dollars in thousands):
|
Amortizing Intangible Assets
|
Fair
Value
Assigned
|
Weighted
Average
Amortization
Period (Years)
|
Weighted
Average
Discount
Rate
|
|||||
|
Technology
|
$
|
1,400
|
|
10
|
18%
|
|||
|
Customer lists
|
4,600
|
|
10
|
18%
|
||||
|
Trademarks and tradenames
|
100
|
|
2
|
18%
|
||||
|
$
|
6,100
|
|
10
|
18%
|
||||
-
68
-
GREATBATCH, INC.
NOTES TO CONSOLIDATED FINANCIAL STATEMENTS
Technology
– Technology consists of technical processes, unpatented technology, manufacturing know-how, trade secrets and the understanding with respect to products or processes that have been developed by CCC and that will be leveraged in current and future products. The fair value of technology acquired was determined utilizing the relief from royalty method, a form of the income approach, with a royalty rate of
3%
. The weighted average amortization period of the technology is based upon management’s estimate of the product life cycle associated with technology before they will be replaced by new technologies.
Customer lists
– Customer lists represent the estimated fair value of non-contractual customer relationships CCC has as of the acquisition date. The primary customers of CCC include medical device companies in various geographic locations around the world. These relationships were valued separately from goodwill at the amount that an independent third party would be willing to pay for these relationships. The fair value of customer lists was determined using the multi-period excess-earnings method, a form of the income approach. The weighted average amortization period of the existing customer base was based upon the historical customer annual attrition rate of
15%
, as well as management’s understanding of the industry and product life cycles.
Trademarks and tradenames
– Trademarks and tradenames represent the estimated fair value of corporate and product names acquired from CCC. These tradenames were valued separately from goodwill at the amount that an independent third party would be willing to pay for use of these names. The fair value of the trademarks and tradenames was determined by utilizing the relief from royalty method, a form of the income approach, with a
0.5%
royalty rate.
Goodwill
– The excess of the purchase price over the fair value of net tangible and intangible assets acquired and liabilities assumed was allocated to goodwill. Various factors contributed to the establishment of goodwill, including: the value of CCC’s highly trained assembled work force and management team; the incremental value that CCC’s technology will bring to QiG’s medical devices; and the expected revenue growth over time that is attributable to increased market penetration from future products and customers. The goodwill acquired in connection with the CCC acquisition was allocated to the QiG business segment and is not deductible for tax purposes.
NeuroNexus Technologies, Inc.
On
February 16, 2012
, the Company purchased all of the outstanding common stock of
NeuroNexus Technologies, Inc.
(“NeuroNexus”) headquartered in Ann Arbor, MI.
NeuroNexus is an active implantable medical device design firm specializing in developing and commercializing neural interface technology, components and systems for neuroscience and clinical markets.
NeuroNexus has an extensive intellectual property portfolio, core technologies and capabilities to support the development and manufacturing of neural interface devices across a wide range of applications including neuromodulation, sensing, optical stimulation and targeted drug delivery.
This transaction was accounted for under the acquisition method of accounting. Accordingly, the operating results of NeuroNexus have been included in the Company’s QiG segment from the date of acquisition. For 2012, NeuroNexus added approximately
$2.5 million
to the Company’s revenue and decreased the Company’s net loss by
$0.2 million
. The purchase price of NeuroNexus consisted of cash payments of
$11.7 million
and potential future payments of up to an additional
$2 million
. These future payments were contingent upon the achievement of certain financial and development-based milestones and had an estimated fair value of
$1.5 million
as of the acquisition date.
The cost of the acquisition was allocated to the assets acquired and liabilities assumed from NeuroNexus based on their fair values as of the close of the acquisition, with the amount exceeding the fair value of the net assets acquired being recorded as goodwill. The valuation of the assets acquired and liabilities assumed from NeuroNexus was finalized during 2013 and did not result in a material adjustment to the original valuation of net assets acquired, including goodwill and therefore was not reflected as a retrospective adjustment of the historical financial statements.
-
69
-
GREATBATCH, INC.
NOTES TO CONSOLIDATED FINANCIAL STATEMENTS
The following table summarizes the allocation of the NeuroNexus purchase price to the assets acquired and liabilities assumed as of the acquisition date (in thousands):
|
Assets acquired
|
|||
|
Current assets
|
$
|
618
|
|
|
Property, plant and equipment
|
35
|
|
|
|
Amortizing intangible assets
|
2,927
|
|
|
|
Indefinite-lived intangible assets
|
540
|
|
|
|
Goodwill
|
8,924
|
|
|
|
Other assets
|
1,576
|
|
|
|
Total assets acquired
|
14,620
|
|
|
|
Liabilities assumed
|
|||
|
Current liabilities
|
420
|
|
|
|
Deferred income taxes
|
989
|
|
|
|
Total liabilities assumed
|
1,409
|
|
|
|
Net assets acquired
|
$
|
13,211
|
|
The fair values of the assets acquired were determined using one of three valuation approaches: market, income and cost. The selection of a particular method for a given asset depended on the reliability of available data and the nature of the asset, among other considerations.
Current assets and liabilities
– The fair value of current assets and liabilities was assumed to approximate their carrying value as of the acquisition date due to the short-term nature of these assets and liabilities.
Intangible assets
– The purchase price was allocated to identifiable intangible assets as follows (dollars in thousands):
|
Fair
Value
Assigned
|
Weighted
Average
Amortization
Period (Years)
|
Estimated
Useful
Life (Years)
|
Weighted
Average
Discount
Rate
|
|||||||
|
Amortizing Intangible Assets
|
||||||||||
|
Technology and patents
|
$
|
1,058
|
|
6
|
10
|
14
|
%
|
|||
|
Customer lists
|
1,869
|
|
7
|
15
|
13
|
%
|
||||
|
$
|
2,927
|
|
7
|
13
|
13
|
%
|
||||
|
Indefinite-lived Intangible Assets
|
||||||||||
|
In-process research and development
|
$
|
540
|
|
N/A
|
12
|
26
|
%
|
|||
The weighted average amortization period is less than the estimated useful life due to the Company using an accelerated amortization method, which approximates the projected cash flows used to determine the fair value of those intangible assets.
Technology and patents
– Technology and patents consists of technical processes, patented and unpatented technology, manufacturing know-how, trade secrets and the understanding with respect to products or processes that have been developed by NeuroNexus and that will be leveraged in current and future products. The fair value of technology and patents acquired was determined utilizing the relief from royalty method, a form of the income approach, with royalty rates that ranged from
2%
to
6%
. The estimated useful life of the technology and patents is based upon management’s estimate of the product life cycle associated with technology and patents before they will be replaced by new technologies.
Customer lists
– Customer lists represent the estimated fair value of non-contractual customer relationships NeuroNexus has as of the acquisition date. The primary customers of NeuroNexus include numerous scientists and researchers from various geographic locations around the world. These relationships were valued separately from goodwill at the amount which an independent third party would be willing to pay for these relationships. The fair value of customer lists was determined using the multi-period excess-earnings method, a form of the income approach. The estimated useful life of the existing customer list was based upon historical customer attrition as well as management’s understanding of the industry and product life cycles.
-
70
-
GREATBATCH, INC.
NOTES TO CONSOLIDATED FINANCIAL STATEMENTS
IPR&D
– IPR&D represents research projects which are expected to generate cash flows but have not yet reached technological feasibility. The Company used the income approach to determine the fair value of the IPR&D acquired. In arriving at the value of the IPR&D, management considered, among other factors: the projects’ stage of completion; the complexity of the work to be completed as of the acquisition date; the projected costs to complete the projects; the contribution of other acquired assets; and the estimated useful life of the technology. The Company applied a market-participant risk-adjusted discount rate to arrive at a present value as of the date of acquisition. The value assigned to IPR&D related to the development of micro-electrodes for deep brain mapping and electrocorticography. For purposes of valuing the IPR&D, the Company estimated total costs to complete the projects to be approximately
$1.5 million
.
Goodwill
– The excess of the purchase price over the fair value of net tangible and intangible assets acquired and liabilities assumed was allocated to goodwill. Various factors contributed to the establishment of goodwill, including: the value of NeuroNexus’s highly trained assembled work force and management team; the incremental value that NeuroNexus’s technology will bring to the Company’s neuromodulation platform currently in development; and the expected revenue growth over time that is attributable to increased market penetration from future products and customers. The goodwill acquired in connection with the NeuroNexus acquisition was allocated to the QiG business segment and is not deductible for tax purposes.
Pro Forma Results (Unaudited)
– The following unaudited pro forma information presents the consolidated results of operations of the Company, CCC, and NeuroNexus as if those acquisitions occurred as of the beginning of fiscal years 2013 (CCC) and 2011 (NeuroNexus) (in thousands, except per share amounts):
|
|
Year Ended
|
||||||||||
|
January 2,
2015 |
January 3,
2014 |
December 28,
2012 |
|||||||||
|
Sales
|
$
|
696,357
|
|
$
|
677,657
|
|
$
|
646,617
|
|
||
|
Net income (loss)
|
56,453
|
|
37,612
|
|
(4,973
|
)
|
|||||
|
Earnings (loss) per share:
|
|||||||||||
|
Basic
|
$
|
2.27
|
|
$
|
1.57
|
|
$
|
(0.21
|
)
|
||
|
Diluted
|
$
|
2.17
|
|
$
|
1.49
|
|
$
|
(0.21
|
)
|
||
The unaudited pro forma information presents the combined operating results of Greatbatch, CCC, and NeuroNexus, with the results prior to the acquisition date adjusted to include the pro forma impact of the amortization of acquired intangible assets, the adjustment to interest expense reflecting the amount borrowed in connection with the acquisitions at Greatbatch’s interest rate, and the impact of income taxes on the pro forma adjustments utilizing the applicable statutory tax rate. The unaudited pro forma consolidated basic and diluted earnings (loss) per share calculations are based on the consolidated basic and diluted weighted average shares of Greatbatch. The unaudited pro forma results are presented for illustrative purposes only and do not reflect the realization of potential cost savings, and any related integration costs. Certain costs savings may result from the acquisition; however, there can be no assurance that these cost savings will be achieved. These pro forma results do not purport to be indicative of the results that would have been obtained, or to be a projection of results that may be obtained in the future.
-
71
-
GREATBATCH, INC.
NOTES TO CONSOLIDATED FINANCIAL STATEMENTS
|
3.
|
SUPPLEMENTAL CASH FLOW INFORMATION
|
|
|
|
Year Ended
|
||||||||||
|
|
January 2,
2015 |
January 3,
2014 |
December 28,
2012 |
||||||||
|
(in thousands)
|
|||||||||||
|
Noncash investing and financing activities:
|
|||||||||||
|
Common stock contributed to 401(k) Plan
|
$
|
4,341
|
|
$
|
2,477
|
|
$
|
4,793
|
|
||
|
Property, plant and equipment purchases included in accounts payable
|
2,926
|
|
2,103
|
|
2,522
|
|
|||||
|
Cash paid during the year for:
|
|||||||||||
|
Interest
|
3,521
|
|
4,989
|
|
6,230
|
|
|||||
|
Income taxes
|
13,565
|
|
44,165
|
|
4,909
|
|
|||||
|
Acquisition of noncash assets
|
22,434
|
|
—
|
|
14,396
|
|
|||||
|
Liabilities assumed
|
6,432
|
|
—
|
|
1,244
|
|
|||||
|
4.
|
INVENTORIES
|
|
Inventories are comprised of the following (in thousands):
|
|
At
|
||||||
|
January 2,
2015 |
January 3,
2014 |
||||||
|
Raw materials
|
$
|
73,354
|
|
$
|
67,939
|
|
|
|
Work-in-process
|
38,930
|
|
36,670
|
|
|||
|
Finished goods
|
16,958
|
|
13,749
|
|
|||
|
Total
|
$
|
129,242
|
|
$
|
118,358
|
|
|
|
5.
|
ASSETS HELD FOR SALE
|
|
Assets held for sale included in Prepaid Expenses and Other Current Assets, is comprised of the following (in thousands):
|
|
|
At
|
||||||||
|
Asset
|
Business
Segment
|
January 2,
2015 |
January 3,
2014 |
|||||||
|
Building and building improvements
|
Greatbatch Medical
|
$
|
1,635
|
|
$
|
—
|
|
|||
During 2014, the Company transferred
$2.1 million
of assets relating to the Company’s Orvin, Switzerland property to held for sale and recognized a
$0.4 million
impairment charge that was recorded in Other Operating Expenses, Net. See Note 13 “Other Operating Expenses, Net,” for additional information regarding this transaction and Note 18 “Fair Value Measurements,” for information regarding the fair value of the assets.
-
72
-
GREATBATCH, INC.
NOTES TO CONSOLIDATED FINANCIAL STATEMENTS
|
6.
|
PROPERTY, PLANT AND EQUIPMENT, NET
|
|
Property, plant and equipment are comprised of the following (in thousands):
|
|
At
|
||||||
|
January 2,
2015 |
January 3,
2014 |
||||||
|
Manufacturing machinery and equipment
|
$
|
167,173
|
|
$
|
159,542
|
|
|
|
Buildings and building improvements
|
89,258
|
|
87,359
|
|
|||
|
Information technology hardware and software
|
31,725
|
|
28,010
|
|
|||
|
Leasehold improvements
|
31,170
|
|
31,522
|
|
|||
|
Furniture and fixtures
|
14,045
|
|
13,889
|
|
|||
|
Land and land improvements
|
10,816
|
|
13,016
|
|
|||
|
Construction work in process
|
14,129
|
|
7,886
|
|
|||
|
Other
|
629
|
|
633
|
|
|||
|
358,945
|
|
341,857
|
|
||||
|
Accumulated depreciation
|
(214,020
|
)
|
(196,084
|
)
|
|||
|
Total
|
$
|
144,925
|
|
$
|
145,773
|
|
|
Depreciation expense for property, plant and equipment was as follows (in thousands):
|
|
Year Ended
|
||||||||||
|
January 2,
2015 |
January 3,
2014 |
December 28,
2012 |
|||||||||
|
Depreciation expense
|
$
|
23,320
|
|
$
|
22,799
|
|
$
|
31,575
|
|
||
Construction work in process at
January 2, 2015
primarily relates to the Company’s 2014 investment in capacity and capabilities initiative. See Note 13 “Other Operating Expenses, Net” for a description of the Company’s significant capital investment projects. Construction work in process at
January 3, 2014
primarily relates to routine purchases of machinery, equipment, and information technology assets to support normal recurring operations.
-
73
-
GREATBATCH, INC.
NOTES TO CONSOLIDATED FINANCIAL STATEMENTS
|
7.
|
INTANGIBLE ASSETS
|
|
Amortizing intangible assets, net are comprised of the following (in thousands):
|
Gross
Carrying
Amount
|
Accumulated
Amortization
|
Foreign
Currency
Translation
|
Net
Carrying
Amount
|
||||||||||||
|
At January 2, 2015
|
|||||||||||||||
|
Purchased technology and patents
|
$
|
95,776
|
|
$
|
(75,894
|
)
|
$
|
1,966
|
|
$
|
21,848
|
|
|||
|
Customer lists
|
72,857
|
|
(31,460
|
)
|
1,374
|
|
42,771
|
|
|||||||
|
Other
|
4,534
|
|
(4,619
|
)
|
803
|
|
718
|
|
|||||||
|
Total amortizing intangible assets
|
$
|
173,167
|
|
$
|
(111,973
|
)
|
$
|
4,143
|
|
$
|
65,337
|
|
|||
|
At January 3, 2014
|
|||||||||||||||
|
Purchased technology and patents
|
$
|
97,376
|
|
$
|
(69,026
|
)
|
$
|
1,980
|
|
$
|
30,330
|
|
|||
|
Customer lists
|
68,257
|
|
(24,671
|
)
|
1,367
|
|
44,953
|
|
|||||||
|
Other
|
4,434
|
|
(4,399
|
)
|
804
|
|
839
|
|
|||||||
|
Total amortizing intangible assets
|
$
|
170,067
|
|
$
|
(98,096
|
)
|
$
|
4,151
|
|
$
|
76,122
|
|
|||
Aggregate intangible asset amortization expense is comprised of the following (in thousands):
|
|
Year Ended
|
||||||||||
|
January 2,
2015 |
January 3,
2014 |
December 28,
2012 |
|||||||||
|
Cost of sales
|
$
|
6,201
|
|
$
|
6,822
|
|
$
|
7,489
|
|
||
|
SG&A
|
7,009
|
|
5,800
|
|
6,227
|
|
|||||
|
RD&E
|
667
|
|
545
|
|
545
|
|
|||||
|
Total intangible asset amortization expense
|
$
|
13,877
|
|
$
|
13,167
|
|
$
|
14,261
|
|
||
Estimated future intangible asset amortization expense based upon the current carrying value is as follows (in thousands):
|
|
Estimated
Amortization
Expense
|
||
|
2015
|
$
|
12,988
|
|
|
2016
|
10,676
|
|
|
|
2017
|
9,520
|
|
|
|
2018
|
7,232
|
|
|
|
2019
|
5,431
|
|
|
|
Thereafter
|
19,490
|
|
|
|
Total estimated amortization expense
|
$
|
65,337
|
|
As of January 3, 2014, the Company had recorded in Other Long-Term Liabilities
$4.0 million
of contingent liabilities incurred in connection with technology purchases made in previous years. During 2014, the Company reversed
$3.0 million
of these contingent liabilities as a result of certain performance targets not being achieved, which reduced the technology asset recorded at the time of the asset purchase.
-
74
-
GREATBATCH, INC.
NOTES TO CONSOLIDATED FINANCIAL STATEMENTS
The change in indefinite-lived assets during
2014
is as follows (in thousands)
|
Trademarks
and
Tradenames
|
|||
|
At January 3, 2014
|
$
|
20,288
|
|
|
At January 2, 2015
|
$
|
20,288
|
|
The change in goodwill during
2014
is as follows (in thousands):
|
Greatbatch
Medical
|
QiG
|
Total
|
|||||||||
|
At January 3, 2014
|
$
|
304,856
|
|
$
|
41,800
|
|
$
|
346,656
|
|
||
|
Goodwill acquired (Note 2)
|
—
|
|
8,296
|
|
8,296
|
|
|||||
|
Foreign currency translation
|
(559
|
)
|
—
|
|
(559
|
)
|
|||||
|
At January 2, 2015
|
$
|
304,297
|
|
$
|
50,096
|
|
$
|
354,393
|
|
||
As of
January 2, 2015
,
no
accumulated impairment loss has been recognized for the goodwill allocated to the Company’s Greatbatch Medical or QiG segments.
|
8.
|
ACCRUED EXPENSES
|
|
Accrued expenses are comprised of the following (in thousands):
|
|
At
|
||||||
|
January 2,
2015 |
January 3,
2014 |
||||||
|
Salaries and benefits
|
$
|
20,770
|
|
$
|
16,311
|
|
|
|
Profit sharing and bonuses
|
18,524
|
|
19,808
|
|
|||
|
Warranty
|
660
|
|
1,819
|
|
|||
|
Other
|
8,430
|
|
6,743
|
|
|||
|
Total
|
$
|
48,384
|
|
$
|
44,681
|
|
|
|
9.
|
DEBT
|
|
Long-term debt is comprised of the following (in thousands):
|
|
At
|
||||||
|
|
January 2,
2015 |
January 3, 2014
|
|||||
|
Variable rate term loan
|
$
|
187,500
|
|
$
|
197,500
|
|
|
|
Revolving line of credit
|
—
|
|
—
|
|
|||
|
Total debt
|
187,500
|
|
197,500
|
|
|||
|
Less current portion of long-term debt
|
11,250
|
|
—
|
|
|||
|
Total long-term debt
|
$
|
176,250
|
|
$
|
197,500
|
|
|
Credit Facility
– In
September 2013
, the Company amended and extended its credit facility (the “Credit Facility”). The Credit Facility provides a
$300 million
revolving credit facility (the “Revolving Credit Facility”), a
$200 million
term loan (the “Term Loan”), a
$15 million
letter of credit subfacility, and a
$15 million
swingline subfacility. The Revolving Credit Facility can be increased by
$200 million
upon the Company’s request and approval by the lenders. The Revolving Credit Facility has a maturity date of
September 20, 2018
, which may be extended to
September 20, 2019
upon notice by the Company and subject to certain conditions. The principal of the Term Loan is payable in quarterly installments as specified in the Credit Facility until its maturity date of
September 20, 2019
when the unpaid balance is due in full.
The Credit Facility is secured by the Company’s non-realty assets including cash, accounts receivable and inventories. Interest rates on the Revolving Credit Facility and Term Loan are, at the Company’s option either at: (i) the prime rate plus the applicable margin, which ranges between
0.0%
and
0.75%
, based on the Company’s total leverage ratio or (ii) the applicable LIBOR rate plus the applicable margin, which ranges between
1.375%
and
2.75%
, based on the Company’s
-
75
-
GREATBATCH, INC.
NOTES TO CONSOLIDATED FINANCIAL STATEMENTS
total leverage ratio. Loans under the swingline subfacility will bear interest at the prime rate plus the applicable margin, which ranges between
0.0%
and
0.75%
, based on the Company’s total leverage ratio. The Company is also required to pay a commitment fee, which varies between
0.175%
and
0.25%
depending on the Company’s total leverage ratio.
The Credit Facility contains limitations on the incurrence of indebtedness, liens and licensing of intellectual property, investments and certain payments. The Credit Facility permits the Company to engage in the following activities up to an aggregate amount of
$300 million
: 1) permitted acquisitions in the aggregate not to exceed
$250 million
; 2) other investments in the aggregate not to exceed
$100 million
; 3) stock repurchases and dividends not to exceed
$150 million
in the aggregate; and 4) investments in foreign subsidiaries not to exceed
$20 million
in the aggregate. At any time that the total leverage ratio of the Company for the two most recently ended fiscal quarters is less than
2.75
to 1.0, the Company may make an election to reset each of the amounts specified above. Additionally, these limitations can be waived upon the Company’s request and approval of a majority of the lenders. As of
January 2, 2015
, the Company had available to it
100%
of the above limits except for the aggregate limit, acquisitions limit, and other investments limit which are now
$277 million
,
$230 million
, and
$97 million
, respectively.
The Credit Facility requires the Company to maintain a rolling four quarter ratio of adjusted EBITDA to interest expense of at least
3.0
to 1.0, and a total leverage ratio of not greater than
4.5
to 1.0 decreasing to not greater than
4.25
to 1.0 after
January 2, 2016
. The calculation of adjusted EBITDA and total leverage ratio excludes non-cash charges, extraordinary, unusual, or non-recurring expenses or losses, non-cash stock-based compensation, and non-recurring expenses or charges incurred in connection with permitted acquisitions. As of
January 2, 2015
, the Company was in compliance with all covenants under the Credit Facility.
The Credit Facility contains customary events of default. Upon the occurrence and during the continuance of an event of default, a majority of the lenders may declare the outstanding advances and all other obligations under the Credit Facility immediately due and payable.
As of
January 2, 2015
, the weighted average interest rate on borrowings under the Credit Facility, which does not take into account the impact of the Company’s interest rate swap, was
1.57%
. As of
January 2, 2015
, the Company had
$300 million
of borrowing capacity available under the Credit Facility. This borrowing capacity may vary from period to period based upon the debt and EBITDA levels of the Company, which impacts the covenant calculations described above.
Interest Rate Swaps
– From time to time, the Company enters into interest rate swap agreements in order to hedge against potential changes in cash flows on the outstanding borrowings on the Credit Facility. The variable rate received on the interest rate swaps and the variable rate paid on the debt have the same rate of interest, excluding the credit spread, indexed to the one-month LIBOR rate and reset and pay interest on the same date. During 2012, the Company entered into a
three
-year
$150 million
interest rate swap, which amortizes
$50 million
per year. During 2014, the Company entered into an additional interest rate swap. The first
$45 million
of notional amount of the swap is effective
February 20, 2015
and the second
$45 million
of notional amount is effective
February 22, 2016
. The notional amount of the swap amortizes
$10 million
per year beginning on
February 21, 2017
with the remaining settled on the termination date of the swap agreement on
September 20, 2019
. These swaps are being accounted for as cash flow hedges.
Information regarding the Company’s outstanding interest rate swaps as of
January 2, 2015
is as follows (dollars in thousands):
|
Instrument
|
Type of
Hedge
|
Notional
Amount
|
Start
Date
|
End
Date
|
Pay
Fixed
Rate
|
Current
Receive
Floating
Rate
|
Fair
Value
January 2, 2015
|
Balance
Sheet Location
|
||||||||||||||
|
Interest rate swap
|
Cash flow
|
$
|
100,000
|
|
Feb-13
|
Feb-16
|
0.573
|
%
|
0.155
|
%
|
$
|
(125
|
)
|
Other Long-Term Liabilities
|
||||||||
|
Interest rate swap
|
Cash flow
|
$
|
90,000
|
|
Feb-15
|
Sept-19
|
1.921
|
%
|
N/A
|
$
|
(865
|
)
|
Other Long-Term Liabilities
|
|||||||||
The estimated fair value of the interest rate swap agreements represents the amount the Company expects to receive (pay) to terminate the contract.
No
portion of the change in fair value of the Company’s interest rate swaps during
2014
,
2013
, or
2012
was considered ineffective. The amount recorded as Interest Expense during
2014
,
2013
, and
2012
related to the Company’s interest rate swaps was
$0.5 million
,
$0.5 million
and
$0.0 million
, respectively.
-
76
-
GREATBATCH, INC.
NOTES TO CONSOLIDATED FINANCIAL STATEMENTS
The expected future minimum principal payments under the Credit Facility as of
January 2, 2015
are as follows (in thousands):
|
2015
|
$
|
11,250
|
|
|
2016
|
16,250
|
|
|
|
2017
|
20,000
|
|
|
|
2018
|
20,000
|
|
|
|
2019
|
120,000
|
|
|
|
Total
|
187,500
|
|
|
Convertible Subordinated Notes –
In March 2007, the Company issued
$197.8 million
of CSN at a
5%
discount. CSN accrued interest at
2.25%
per annum. The effective interest rate of CSN, which took into consideration the amortization of the discount and deferred fees related to the issuance of these notes, was
8.5%
. On
February 20, 2013
, the Company redeemed all outstanding CSN. The contractual interest and discount amortization for CSN were as follows (in thousands):
|
|
Year Ended
|
||||||||||
|
January 2,
2015 |
January 3,
2014 |
December 28,
2012 |
|||||||||
|
Contractual interest
|
$
|
—
|
|
$
|
634
|
|
$
|
4,450
|
|
||
|
Discount amortization
|
—
|
|
5,368
|
|
11,464
|
|
|||||
Deferred Financing Fees
- The change in deferred financing fees is as follows (in thousands):
|
At December 28, 2012
|
$
|
2,056
|
|
|
Financing costs deferred
|
2,802
|
|
|
|
Write-off during the period
|
(156
|
)
|
|
|
Amortization during the period
|
(842
|
)
|
|
|
At January 3, 2014
|
3,860
|
|
|
|
Amortization during the period
|
(773
|
)
|
|
|
At January 2, 2015
|
$
|
3,087
|
|
|
10.
|
BENEFIT PLANS
|
|
Savings Plan
– The Company sponsors a defined contribution 401(k) plan, for its U.S. based employees. The plan provides for the deferral of employee compensation under Section 401(k) and a discretionary Company match. In
2014
,
2013
, and
2012
, this match was
35%
per dollar of participant deferral, up to
6%
of the total compensation for each participant. Net costs related to this defined contribution plan were
$2.2 million
in
2014
and
$2.0 million
in
2013
and
2012
.
In addition to the above, under the terms of the 401(k) plan document there is an annual discretionary defined contribution of up to
4%
of each employee’s eligible compensation based upon the achievement of certain performance targets. This amount is contributed to the 401(k) plan in the form of Company stock. Compensation cost recognized related to the defined contribution plan was
$4.2 million
,
$4.8 million
,
$1.9 million
in
2014
,
2013
, and
2012
, respectively. As of
January 2, 2015
, the 401(k) Plan held
602,604
shares of Company stock.
Education Assistance Program
– The Company reimburses tuition, textbooks and laboratory fees for college or other job related programs for all of its U.S. based employees. The Company also reimburses college tuition for the dependent children of certain full-time U.S. based employees hired prior to 2012, which vests on a straight-line basis over
ten
years, up to the applicable local state university tuition rate. For certain employees and executives, the dependent children benefit is not limited. Minimum academic achievement is required in order to receive reimbursement under both programs. Aggregate expenses under the programs were
$1.9 million
,
$2.0 million
, and
$2.2 million
in
2014
,
2013
and
2012
, respectively.
-
77
-
GREATBATCH, INC.
NOTES TO CONSOLIDATED FINANCIAL STATEMENTS
Defined Benefit Plans
– The Company is required to provide its employees located in Switzerland, Mexico, and France certain statutorily mandated defined benefits. Under these plans, benefits accrue to employees based upon years of service, position, age and compensation. The defined benefit pension plan provided to the Company’s employees located in Switzerland is a funded contributory plan, while the plans that provide benefits to the Company’s employees located in Mexico and France are unfunded and noncontributory. The liability and corresponding expense related to these benefit plans is based on actuarial computations of current and future benefits for employees.
During 2012, the Company transferred most major functions performed at its facilities in Switzerland into other existing facilities. As a result, the Company curtailed its defined benefit plan provided to employees at those Swiss facilities during 2012. In accordance with ASC 715, this gain was recognized in Other Operating Expenses, Net as the related employees were terminated. Since Swiss plan assets were sufficient to cover all plan liabilities, during 2012 the plan assets were transferred into cash. During 2013, the plan assets that remained after settlement payments were made were transferred to an AA- rated insurance carrier who bears the pension risk and longevity risk, and will be used to cover the pension liability for the remaining retirees of the Swiss plan, as well as the remaining employees at that location.
Information relating to the funding position of the Company’s defined benefit plans as of the plans measurement date of
January 2, 2015
and
January 3, 2014
were as follows (in thousands):
|
|
Year Ended
|
||||||
|
January 2,
2015 |
January 3,
2014 |
||||||
|
Change in projected benefit obligation:
|
|||||||
|
Projected benefit obligation at beginning of year
|
$
|
2,422
|
|
$
|
16,215
|
|
|
|
Service cost
|
203
|
|
236
|
|
|||
|
Interest cost
|
75
|
|
138
|
|
|||
|
Prior service cost and plan amendments
|
—
|
|
(45
|
)
|
|||
|
Plan participants’ contribution
|
36
|
|
134
|
|
|||
|
Actuarial (gain) loss
|
630
|
|
(2
|
)
|
|||
|
Benefits transferred in, net
|
155
|
|
434
|
|
|||
|
Settlement/curtailment gain
|
(337
|
)
|
(14,539
|
)
|
|||
|
Foreign currency translation
|
(341
|
)
|
(149
|
)
|
|||
|
Projected benefit obligation at end of year
|
2,843
|
|
2,422
|
|
|||
|
Change in fair value of plan assets:
|
|||||||
|
Fair value of plan assets at beginning of year
|
731
|
|
12,269
|
|
|||
|
Employer contributions (refund)
|
(39
|
)
|
150
|
|
|||
|
Plan participants’ contributions
|
36
|
|
134
|
|
|||
|
Actual loss on plan assets
|
(101
|
)
|
(26
|
)
|
|||
|
Benefits transferred in, net
|
198
|
|
138
|
|
|||
|
Settlements
|
(337
|
)
|
(11,780
|
)
|
|||
|
Foreign currency translation
|
(51
|
)
|
(154
|
)
|
|||
|
Fair value of plan assets at end of year
|
437
|
|
731
|
|
|||
|
Projected benefit obligation in excess of plan assets at end of year
|
$
|
2,406
|
|
$
|
1,691
|
|
|
|
Defined benefit liability classified as other current liabilities
|
$
|
25
|
|
$
|
25
|
|
|
|
Defined benefit liability classified as long-term liabilities
|
$
|
2,381
|
|
$
|
1,666
|
|
|
|
Accumulated benefit obligation at end of year
|
$
|
1,938
|
|
$
|
1,684
|
|
|
-
78
-
GREATBATCH, INC.
NOTES TO CONSOLIDATED FINANCIAL STATEMENTS
Amounts recognized in Accumulated Other Comprehensive Income are as follows (in thousands):
|
|
Year Ended
|
||||||
|
January 2,
2015 |
January 3,
2014 |
||||||
|
Net loss occurring during the year
|
$
|
736
|
|
$
|
25
|
|
|
|
Amortization of losses
|
(138
|
)
|
(722
|
)
|
|||
|
Prior service cost
|
(2
|
)
|
150
|
|
|||
|
Amortization of prior service cost
|
(11
|
)
|
33
|
|
|||
|
Foreign currency translation
|
(76
|
)
|
224
|
|
|||
|
Pre-tax adjustment
|
509
|
|
(290
|
)
|
|||
|
Taxes
|
(135
|
)
|
18
|
|
|||
|
Net (gain) loss
|
$
|
374
|
|
$
|
(272
|
)
|
|
The amortization of amounts in Accumulated Other Comprehensive Income expected to be recognized as components of net periodic benefit expense during
2015
are as follows (in thousands):
|
Amortization of net prior service cost
|
$
|
11
|
|
|
Amortization of net loss
|
45
|
|
|
Net pension cost (income) is comprised of the following (in thousands):
|
|
Year Ended
|
||||||
|
January 2, 2015
|
January 3, 2014
|
||||||
|
Service cost
|
$
|
203
|
|
$
|
236
|
|
|
|
Interest cost
|
75
|
|
138
|
|
|||
|
Settlements loss
|
105
|
|
—
|
|
|||
|
Expected return on assets
|
(3
|
)
|
—
|
|
|||
|
Recognized net actuarial loss (gain)
|
45
|
|
(1,929
|
)
|
|||
|
Net pension cost (income)
|
$
|
425
|
|
$
|
(1,555
|
)
|
|
The weighted-average rates used in the actuarial valuations were as follows:
|
|
Projected Benefit Obligation
|
Net Pension Cost
|
||||||||||||
|
January 2,
2015 |
January 3,
2014 |
2014
|
2013
|
2012
|
||||||||||
|
Discount rate
|
2.3
|
%
|
3.4
|
%
|
3.4
|
%
|
2.1
|
%
|
2.5
|
%
|
||||
|
Salary growth
|
3.0
|
%
|
3.1
|
%
|
3.1
|
%
|
2.4
|
%
|
2.3
|
%
|
||||
|
Expected rate of return on assets
|
2.3
|
%
|
2.5
|
%
|
2.5
|
%
|
—
|
%
|
3.5
|
%
|
||||
The discount rate used is based on the yields of AA bonds with a duration matching the duration of the liabilities plus approximately
50
basis points to reflect the risk of investing in corporate bonds. The expected rate of return on plan assets reflects earnings expectations on existing plan assets.
-
79
-
GREATBATCH, INC.
NOTES TO CONSOLIDATED FINANCIAL STATEMENTS
Plan assets were comprised of the following (in thousands):
|
|
|
Fair Value Measurements Using
|
|||||||||||||
|
January 2, 2015
|
Quoted
Prices in
Active
Markets for
Identical
Assets
(Level 1)
|
Significant
Other
Observable
Inputs
(Level 2)
|
Significant
Unobservable
Inputs
(Level 3)
|
||||||||||||
|
Insurance contract
|
$
|
437
|
|
$
|
—
|
|
$
|
437
|
|
$
|
—
|
|
|||
|
Total
|
$
|
437
|
|
$
|
—
|
|
$
|
437
|
|
$
|
—
|
|
|||
|
|
|
Fair Value Measurements Using
|
|||||||||||||
|
January 3,
2014 |
Quoted
Prices in
Active
Markets for
Identical
Assets
(Level 1)
|
Significant
Other
Observable
Inputs
(Level 2)
|
Significant
Unobservable
Inputs
(Level 3)
|
||||||||||||
|
Insurance contract
|
$
|
731
|
|
$
|
—
|
|
$
|
731
|
|
$
|
—
|
|
|||
|
Total
|
$
|
731
|
|
$
|
—
|
|
$
|
731
|
|
$
|
—
|
|
|||
The fair value of Level 2 plan assets are obtained from quoted market prices in inactive markets or valuation models with observable market data inputs to estimate fair value. These observable market data inputs include benchmark yields, reported trades, broker/dealer quotes, issuer spreads, benchmark securities, bids, offers and reference data.
Estimated benefit payments over the next ten years are as follows (in thousands):
|
2015
|
$
|
47
|
|
|
2016
|
67
|
|
|
|
2017
|
124
|
|
|
|
2018
|
113
|
|
|
|
2019
|
177
|
|
|
|
2020-2024
|
866
|
|
|
-
80
-
GREATBATCH, INC.
NOTES TO CONSOLIDATED FINANCIAL STATEMENTS
|
11.
|
STOCK-BASED COMPENSATION
|
|
The components and classification of stock-based compensation expense were as follows (in thousands):
|
|
Year Ended
|
||||||||||
|
January 2,
2015 |
January 3,
2014 |
December 28,
2012 |
|||||||||
|
Stock options
|
$
|
2,523
|
|
$
|
3,490
|
|
$
|
2,786
|
|
||
|
Restricted stock and units
|
6,417
|
|
5,843
|
|
6,233
|
|
|||||
|
401(k) stock contribution
|
4,246
|
|
4,768
|
|
1,885
|
|
|||||
|
Total stock-based compensation expense
|
$
|
13,186
|
|
$
|
14,101
|
|
$
|
10,904
|
|
||
|
Cost of sales
|
$
|
3,530
|
|
$
|
3,864
|
|
$
|
2,620
|
|
||
|
Selling, general and administrative expenses
|
7,923
|
|
7,907
|
|
7,684
|
|
|||||
|
Research, development and engineering costs, net
|
1,440
|
|
1,194
|
|
600
|
|
|||||
|
Other operating expenses, net (Note 13)
|
293
|
|
1,136
|
|
—
|
|
|||||
|
Total stock-based compensation expense
|
$
|
13,186
|
|
$
|
14,101
|
|
$
|
10,904
|
|
||
During 2014 and 2013, the Company recorded within Other Operating Expenses, Net stock modification expense related to employee separation costs incurred during 2014 and 2013 in connection with realignment initiatives, which are discussed in Note 13 “Other Operating Expenses, Net.”
Summary of Plans
The Company’s 1998 Stock Option Plan and Non-Employee Directors Stock Plan have been frozen to any new award issuances. Stock options remain outstanding under these plans.
The Company’s 2005 Stock Incentive Plan (“2005 Plan”), as amended, authorizes the issuance of up to
2,450,000
shares of equity incentive awards including nonqualified and incentive stock options, restricted stock, restricted stock units, stock bonuses and stock appreciation rights subject to the terms of the 2005 Plan. The 2005 Plan limits the amount of restricted stock, restricted stock units and stock bonuses that may be awarded in the aggregate to
850,000
shares of the
2,450,000
shares authorized by the 2005 Plan.
The Company’s 2009 Stock Incentive Plan (“2009 Plan”) authorizes the issuance of up to
1,350,000
shares of equity incentive awards including nonqualified and incentive stock options, restricted stock, restricted stock units, stock bonuses and stock appreciation rights subject to the terms of the 2009 Plan. The 2009 Plan limits the amount of restricted stock, restricted stock units and stock bonuses that may be awarded in the aggregate to
200,000
shares of the
1,350,000
shares authorized.
The Company’s 2011 Stock Incentive Plan (“2011 Plan”), as amended, authorizes the issuance of up to
1,350,000
shares of equity incentive awards including nonqualified and incentive stock options, restricted stock, restricted stock units, stock bonuses and stock appreciation rights, subject to the terms of the 2011 Plan. The 2011 Plan does not limit the amount of restricted stock, restricted stock units or stock bonuses that may be awarded.
As of
January 2, 2015
, there were
575,451
,
316,695
, and
16,799
shares available for future grants under the 2011 Plan, 2009 Plan and 2005 Plan, respectively. Due to plan sub-limits, of the shares available for grant, only
26,594
shares and
3,625
shares may be awarded under the 2009 Plan and the 2005 Plan, respectively, in the form of restricted stock, restricted stock units or stock bonuses.
Stock Options
Stock options granted generally vest over a
three
year period, expire
10
years from the date of grant, and are granted at exercise prices equal to or greater than the fair value of the Company’s common stock on the date of grant. Performance-based stock options have not been granted since 2010.
The Company utilizes the Black-Scholes option pricing model to determine the fair value of stock options. Management is required to make certain assumptions with respect to selected model inputs. Expected volatility is based on the historical volatility of the Company’s stock over the most recent period commensurate with the estimated expected life of the stock options. The expected life of stock options, which represents the period of time that the stock options are expected to be outstanding, is based on historical data. The expected dividend yield is based on the Company’s history and expectation of future dividend payouts. The risk-free interest rate is based on the U.S. Treasury yield curve in effect
-
81
-
GREATBATCH, INC.
NOTES TO CONSOLIDATED FINANCIAL STATEMENTS
at the time of grant for a period commensurate with the estimated expected life. If factors change and result in different assumptions, the stock option expense that the Company records for future grants may differ significantly from what the Company recorded in the current period. Stock-based compensation expense is only recorded for those awards that are expected to vest. Pre-vesting forfeiture estimates for determining appropriate stock-based compensation expense are estimated at the time of grant based on historical experience. Revisions are made to those estimates in subsequent periods if actual forfeitures differ from estimated forfeitures.
The weighted-average fair value and assumptions used are as follows:
|
|
Year Ended
|
||||||||||
|
January 2,
2015 |
January 3,
2014 |
December 28,
2012 |
|||||||||
|
Weighted average grant date fair value
|
$
|
16.43
|
|
$
|
8.38
|
|
$
|
8.20
|
|
||
|
Risk-free interest rate
|
1.73
|
%
|
0.73
|
%
|
0.83
|
%
|
|||||
|
Expected volatility
|
39
|
%
|
39
|
%
|
40
|
%
|
|||||
|
Expected life (in years)
|
5.3
|
|
5.3
|
|
5.3
|
|
|||||
|
Expected dividend yield
|
0
|
%
|
0
|
%
|
0
|
%
|
|||||
|
Annual prevesting forfeiture rate
|
9
|
%
|
9
|
%
|
9
|
%
|
|||||
The following table summarizes time-vested stock option activity:
|
Number of
Time-Vested
Stock
Options
|
Weighted
Average
Exercise
Price
|
Weighted
Average
Remaining
Contractual
Life
(In Years)
|
Aggregate
Intrinsic
Value
(In Millions)
|
|||||||||
|
Outstanding at December 30, 2011
|
1,558,771
|
|
$
|
23.42
|
|
|||||||
|
Granted
|
395,978
|
|
22.19
|
|
||||||||
|
Exercised
|
(52,683
|
)
|
20.77
|
|
||||||||
|
Forfeited or expired
|
(126,219
|
)
|
24.21
|
|
||||||||
|
Outstanding at December 28, 2012
|
1,775,847
|
|
23.17
|
|
||||||||
|
Granted
|
372,676
|
|
23.33
|
|
||||||||
|
Exercised
|
(443,428
|
)
|
23.24
|
|
||||||||
|
Forfeited or expired
|
(88,686
|
)
|
28.05
|
|
||||||||
|
Outstanding at January 3, 2014
|
1,616,409
|
|
22.92
|
|
||||||||
|
Granted
|
183,571
|
|
43.84
|
|
||||||||
|
Exercised
|
(295,203
|
)
|
23.42
|
|
||||||||
|
Forfeited or expired
|
(33,279
|
)
|
27.82
|
|
||||||||
|
Outstanding at January 2, 2015
|
1,471,498
|
|
$
|
25.32
|
|
6.1
|
$
|
34.3
|
|
|||
|
Expected to vest at January 2, 2015
|
1,447,519
|
|
$
|
25.10
|
|
6.1
|
$
|
34.1
|
|
|||
|
Exercisable at January 2, 2015
|
1,278,765
|
|
$
|
23.88
|
|
5.8
|
$
|
31.7
|
|
|||
-
82
-
GREATBATCH, INC.
NOTES TO CONSOLIDATED FINANCIAL STATEMENTS
The following table summarizes performance-vested stock option activity:
|
Number of
Performance-
Vested Stock
Options
|
Weighted
Average
Exercise
Price
|
Weighted
Average
Remaining
Contractual
Life
(In Years)
|
Aggregate
Intrinsic
Value
(In Millions)
|
|||||||||
|
Outstanding at December 30, 2011
|
478,364
|
|
$
|
24.44
|
|
|||||||
|
Exercised
|
(7,657
|
)
|
22.04
|
|
||||||||
|
Forfeited or expired
|
(185,782
|
)
|
26.35
|
|
||||||||
|
Outstanding at December 28, 2012
|
284,925
|
|
23.26
|
|
||||||||
|
Exercised
|
(107,664
|
)
|
23.23
|
|
||||||||
|
Forfeited or expired
|
—
|
|
—
|
|
||||||||
|
Outstanding at January 3, 2014
|
177,261
|
|
23.27
|
|
||||||||
|
Exercised
|
(58,422
|
)
|
23.35
|
|
||||||||
|
Forfeited or expired
|
—
|
|
—
|
|
||||||||
|
Outstanding at January 2, 2015
|
118,839
|
|
$
|
23.24
|
|
3.0
|
$
|
3.0
|
|
|||
|
Expected to vest at January 2, 2015
|
118,839
|
|
$
|
23.24
|
|
3.0
|
$
|
3.0
|
|
|||
|
Exercisable at January 2, 2015
|
118,839
|
|
$
|
23.24
|
|
3.0
|
$
|
3.0
|
|
|||
Intrinsic value is calculated for in-the-money options (exercise price less than market price) as the difference between the market price of the Company’s common shares as of
January 2, 2015
(
$48.66
) and the weighted average exercise price of the underlying stock options, multiplied by the number of options outstanding and/or exercisable. As of
January 2, 2015
,
$2.1 million
of unrecognized compensation cost related to non-vested stock options is expected to be recognized over a weighted-average period of approximately
2
years. Shares are distributed from the Company’s authorized but unissued reserve upon the exercise of stock options or treasury stock if available. The Company does not intend to purchase treasury shares to fund the future exercises of stock options.
Proceeds from the exercise of stock options are credited to common stock at par value and the excess is credited to additional paid-in capital. A portion of the options outstanding qualify as incentive stock options (“ISO”) for income tax purposes. As such, a tax benefit is not recorded at the time the compensation cost related to the stock options is recorded for book purposes due to the fact that an ISO does not ordinarily result in a tax benefit unless there is a disqualifying disposition. Stock option grants of non-qualified stock options result in the creation of a deferred tax asset, which is a temporary difference, until the time that the option is exercised.
The following table provides certain information relating to the exercise of stock options (in thousands):
|
|
Year Ended
|
||||||||||
|
January 2,
2015 |
January 3,
2014 |
December 28,
2012 |
|||||||||
|
Intrinsic value
|
$
|
7,997
|
|
$
|
6,807
|
|
$
|
148
|
|
||
|
Cash received
|
8,278
|
|
12,807
|
|
1,263
|
|
|||||
|
Tax benefit (expense) realized
|
1,704
|
|
727
|
|
(132
|
)
|
|||||
-
83
-
GREATBATCH, INC.
NOTES TO CONSOLIDATED FINANCIAL STATEMENTS
Restricted Stock and Restricted Stock Units
Time-vested restricted stock and restricted stock unit awards granted typically vest in equal annual installments over a
three
or
four
year period. The fair value of time-based as well as nonmarket-based performance restricted stock and restricted stock unit awards is equal to the fair value of the Company’s stock on the date of grant. The following table summarizes time-vested restricted stock and unit activity:
|
Time-Vested
Activity
|
Weighted
Average
Fair Value
|
|||||
|
Nonvested at December 30, 2011
|
69,942
|
|
$
|
22.69
|
|
|
|
Granted
|
92,265
|
|
23.49
|
|
||
|
Vested
|
(74,901
|
)
|
22.83
|
|
||
|
Forfeited
|
(7,037
|
)
|
22.56
|
|
||
|
Nonvested at December 28, 2012
|
80,269
|
|
23.48
|
|
||
|
Granted
|
67,230
|
|
26.76
|
|
||
|
Vested
|
(74,062
|
)
|
23.93
|
|
||
|
Forfeited
|
(5,862
|
)
|
22.26
|
|
||
|
Nonvested at January 3, 2014
|
67,575
|
|
26.37
|
|
||
|
Granted
|
63,817
|
|
44.78
|
|
||
|
Vested
|
(53,568
|
)
|
34.16
|
|
||
|
Forfeited
|
(9,992
|
)
|
35.30
|
|
||
|
Nonvested at January 2, 2015
|
67,832
|
|
$
|
36.22
|
|
|
Performance-based restricted stock units granted only vest if certain market-based performance metrics are achieved. The amount of shares that ultimately vest range from
0
shares to
716,163
shares based upon the total shareholder return of the Company relative to the Company’s compensation peer group over a
three
year performance period beginning in the year of grant. The fair value of the restricted stock units was determined by utilizing a Monte Carlo simulation model, which projects the value of Greatbatch stock versus the peer group under numerous scenarios and determines the value of the award based upon the present value of these projected outcomes. The following table summarizes performance-vested restricted stock and stock unit activity related to the Company’s plans:
|
Performance-
Vested
Activity
|
Weighted
Average
Fair Value
|
|||||
|
Nonvested at December 30, 2011
|
529,743
|
|
$
|
16.68
|
|
|
|
Granted
|
332,918
|
|
15.30
|
|
||
|
Vested
|
(15,500
|
)
|
24.64
|
|
||
|
Forfeited
|
(64,715
|
)
|
15.72
|
|
||
|
Nonvested at December 28, 2012
|
782,446
|
|
16.02
|
|
||
|
Granted
|
318,169
|
|
15.86
|
|
||
|
Vested
|
(49,139
|
)
|
14.68
|
|
||
|
Forfeited
|
(271,798
|
)
|
14.94
|
|
||
|
Nonvested at January 3, 2014
|
779,678
|
|
16.41
|
|
||
|
Granted
|
186,825
|
|
31.33
|
|
||
|
Vested
|
(221,470
|
)
|
18.51
|
|
||
|
Forfeited
|
(28,870
|
)
|
18.42
|
|
||
|
Nonvested at January 2, 2015
|
716,163
|
|
$
|
19.57
|
|
|
The realized tax benefit (expense) from the vesting of restricted stock and restricted stock units was
$2.3 million
,
$(0.4) million
and
$(0.02) million
for
2014
,
2013
,
2012
, respectively. As of
January 2, 2015
, there was
$7.7 million
of total unrecognized compensation cost related to the restricted stock and restricted stock unit awards. That cost is expected to be recognized over a weighted-average period of approximately
2
years. The fair value of shares vested in
2014
,
2013
,
2012
was
$12.5 million
,
$4.0 million
and
$1.5 million
, respectively.
-
84
-
|
12.
|
RESEARCH, DEVELOPMENT AND ENGINEERING COSTS, NET
|
|
Research, Development and Engineering Costs, Net are comprised of the following (in thousands):
|
|
Year Ended
|
||||||||||
|
January 2,
2015 |
January 3,
2014 |
December 28,
2012 |
|||||||||
|
Research, development and engineering costs
|
$
|
58,974
|
|
$
|
62,652
|
|
$
|
62,848
|
|
||
|
Less: cost reimbursements
|
(9,129
|
)
|
(8,575
|
)
|
(10,358
|
)
|
|||||
|
Total research, development and engineering costs, net
|
$
|
49,845
|
|
$
|
54,077
|
|
$
|
52,490
|
|
||
|
13.
|
OTHER OPERATING EXPENSES, NET
|
|
Other Operating Expenses, Net is comprised of the following (in thousands):
|
|
Year Ended
|
||||||||||
|
January 2,
2015 |
January 3,
2014 |
December 28,
2012 |
|||||||||
|
2014 investments in capacity and capabilities
|
$
|
8,925
|
|
$
|
—
|
|
$
|
—
|
|
||
|
2013 operating unit realignment
|
1,017
|
|
5,625
|
|
—
|
|
|||||
|
Orthopaedic facilities optimization
|
1,317
|
|
8,038
|
|
32,482
|
|
|||||
|
Medical device facility optimization
|
11
|
|
312
|
|
1,525
|
|
|||||
|
ERP system upgrade (income) costs
|
(82
|
)
|
783
|
|
5,041
|
|
|||||
|
Acquisition and integration (income) costs
|
3
|
|
(502
|
)
|
1,460
|
|
|||||
|
Asset dispositions, severance and other
|
4,106
|
|
1,534
|
|
1,838
|
|
|||||
|
Total other operating expenses, net
|
$
|
15,297
|
|
$
|
15,790
|
|
$
|
42,346
|
|
||
2014 investments in capacity and capabilities.
In
2014
, the Company announced several initiatives to invest in capacity and capabilities and to better align its resources to meet its customers’ needs and drive organic growth and profitability. These included the following:
|
•
|
Functions currently performed at the Company’s facility in Plymouth, MN to manufacture catheters and introducers will transfer into the Company’s existing facility in Tijuana, Mexico by the first half of 2016.
|
|
•
|
Functions currently performed at the Company’s facilities in Beaverton, OR and Raynham, MA to manufacture products for the portable medical market will transfer to a new facility in Tijuana, Mexico by the end of 2015. Products currently manufactured at the Beaverton facility, which do not serve the portable medical market, are planned to transfer to the Company’s Raynham facility.
|
|
•
|
Establishing a R&D hub in the Minneapolis/St. Paul, MN area for the Company’s Global R&D QiG - Medical Device Systems team, which will serve as the technical center of expertise for active implantable medical device development, implantable leads design, system level design verification testing, and continuation engineering. As part of this initiative, the design engineering responsibilities previously performed at the Company’s Cleveland, OH facility was transferred to the new R&D hub in 2014.
|
|
•
|
Establishing a commercial operations hub at the Company’s global headquarters in Frisco, Texas. This initiative will build upon the investment the Company has made in its global sales and marketing function and is expected to be completed during the first half of 2015.
|
The total capital investment expected for these initiatives is between
$25.0 million
and
$27.0 million
, of which
$4.0 million
has been expended to date. Total restructuring charges expected to be incurred in connection with this realignment are between
$29.0 million
and
$34.0 million
, of which
$8.9 million
has been incurred to date. Expenses related to this initiative are recorded within the applicable segment and corporate cost centers that the expenditures relate to and include the following:
|
•
|
Severance and retention:
$7.0 million
-
$9.0 million
;
|
|
•
|
Accelerated depreciation and asset write-offs:
$2.0 million
-
$3.0 million
; and
|
|
•
|
Other:
$20.0 million
-
$22.0 million
|
-
85
-
GREATBATCH, INC.
NOTES TO CONSOLIDATED FINANCIAL STATEMENTS
Other costs primarily consist of costs to relocate certain equipment and other personnel, duplicate personnel costs, disposal and travel expenditures. All expenses are cash expenditures, except accelerated depreciation and asset write-offs.
The change in accrued liabilities related to the 2014 investments in capacity and capabilities is as follows (in thousands):
|
Severance and Retention
|
Accelerated
Depreciation/
Asset Write-offs
|
Other
|
Total
|
||||||||||||
|
At January 3, 2014
|
$
|
—
|
|
$
|
—
|
|
$
|
—
|
|
$
|
—
|
|
|||
|
Restructuring charges
|
2,209
|
|
33
|
|
6,683
|
|
8,925
|
|
|||||||
|
Write-offs
|
—
|
|
(33
|
)
|
—
|
|
(33
|
)
|
|||||||
|
Cash payments
|
(1,046
|
)
|
—
|
|
(5,617
|
)
|
(6,663
|
)
|
|||||||
|
At January 2, 2015
|
$
|
1,163
|
|
$
|
—
|
|
$
|
1,066
|
|
$
|
2,229
|
|
|||
2013 operating unit realignment.
In
2013
, the Company initiated a plan to realign its operating structure in order to optimize its continued focus on profitable growth. As part of this initiative, the sales and marketing and operations groups of its former Implantable Medical and Electrochem reportable segments were combined into one sales and marketing and one operations group serving the entire Company. This initiative was completed during 2014. Total restructuring charges incurred in connection with this realignment were
$6.6 million
. Expenses related to this initiative were recorded within the applicable segment that the expenditures relate to and included the following:
|
•
|
Severance and retention:
$5.0 million
; and
|
|
•
|
Other:
$1.6 million
.
|
Other costs primarily consist of relocation, recruitment and travel expenditures. The change in accrued liabilities related to the 2013 operating unit realignment is as follows (in thousands):
|
Severance and Retention
|
Other
|
Total
|
|||||||||
|
At January 3, 2014
|
$
|
465
|
|
$
|
746
|
|
$
|
1,211
|
|
||
|
Restructuring charges
|
849
|
|
168
|
|
1,017
|
|
|||||
|
Cash payments
|
(1,314
|
)
|
(914
|
)
|
(2,228
|
)
|
|||||
|
At January 2, 2015
|
$
|
—
|
|
$
|
—
|
|
$
|
—
|
|
||
Orthopaedic facilities optimization.
In
2010
, the Company began updating its Indianapolis, IN facility to streamline operations, consolidate
two
buildings, increase capacity, further expand capabilities and reduce dependence on outside suppliers. This initiative was completed in 2011.
In 2011, the Company began construction of an orthopaedic manufacturing facility in Fort Wayne, IN and transferred manufacturing operations being performed at its Columbia City, IN location into this new facility. This initiative was completed in 2012.
During 2012, the Company transferred manufacturing and development operations performed at its facilities in Orvin and Corgemont, Switzerland into existing facilities in Fort Wayne, IN and Tijuana, Mexico. In connection with this consolidation, the Company curtailed its defined benefit plan provided to its Swiss employees and recognized a
$1.9 million
pension gain in 2013. See Note 10 “Benefit Plans” for additional information. Also in connection with this consolidation, in 2012, the Company entered into an agreement to sell assets related to certain non-core Swiss orthopaedic product lines to an independent third party. In connection with the transfer of these orthopaedic product lines to held for sale, the Company recognized a
$3.6 million
impairment charge in 2012 based upon the contractual sales price to the third party. This transaction closed during 2013 upon which the Company received payments totaling
$4.7 million
and the third party assumed
$2.4 million
of severance liabilities. The purchase agreement provided the Company with an earn out payment based upon the amount of inventory consumed by the purchaser within one year after the close of the transaction. As a result of this earn out, a gain of
$2.7 million
was recorded in Other Operating Expenses, Net during 2014. During 2014, the Company transferred
$2.1 million
of assets relating to the Company’s Orvin, Switzerland property to held for sale and recognized a
$0.4 million
impairment charge. See Note 5 “Assets Held For Sale” for additional information.
During 2013, the Company began a project to expand its Chaumont, France facility in order to enhance its capabilities and fulfill larger volume customer supply agreements. This initiative is expected to be completed over the next two years.
-
86
-
GREATBATCH, INC.
NOTES TO CONSOLIDATED FINANCIAL STATEMENTS
The total capital investment expected to be incurred for these initiatives is between
$30 million
and
$35 million
, of which
$24.8 million
has been expended to date. Total expense expected to be incurred for these initiatives is between
$43 million
and
$48 million
, of which
$42.5 million
has been incurred to date. All expenses have been and will be recorded within the Greatbatch Medical segment and are expected to include the following:
•
Severance and retention:
$11 million
;
•
Accelerated depreciation and asset write-offs:
$13 million
;
•
Other:
$19 million
-
$24 million
.
Other costs include production inefficiencies, moving, revalidation, personnel, training and travel costs associated with these consolidation projects. All expenses are cash expenditures, except accelerated depreciation and asset write-offs. The change in accrued liabilities related to the orthopaedic facilities optimizations is as follows (in thousands):
|
Severance
and
Retention
|
Accelerated
Depreciation/
Asset Write-offs
|
Other
|
Total
|
||||||||||||
|
At January 3, 2014
|
$
|
—
|
|
$
|
—
|
|
$
|
857
|
|
$
|
857
|
|
|||
|
Restructuring charges (income), net
|
—
|
|
(2,255
|
)
|
3,572
|
|
1,317
|
|
|||||||
|
Write-offs
|
—
|
|
(400
|
)
|
—
|
|
(400
|
)
|
|||||||
|
Cash receipts (payments)
|
—
|
|
2,655
|
|
(4,142
|
)
|
(1,487
|
)
|
|||||||
|
At January 2, 2015
|
$
|
—
|
|
$
|
—
|
|
$
|
287
|
|
$
|
287
|
|
|||
Medical device facility optimization.
Near the end of
2011
, the Company initiated plans to upgrade and expand its manufacturing infrastructure in order to support its medical device strategy. This includes the transfer of certain product lines to create additional capacity for the manufacture of medical devices, expansion of
two
existing facilities, as well as the purchase of equipment to enable the production of medical devices. These initiatives were completed in 2014. Total capital investment under these initiatives was
$12.5 million
. Total expenses incurred on these projects was
$1.8 million
. All expenses were recorded within the Greatbatch Medical segment and included the following:
•
Production inefficiencies, moving and revalidation:
$0.7 million
;
•
Personnel:
$0.6 million
; and
•
Other: approximately
$0.5 million
.
The change in accrued liabilities related to the medical device facility optimization is as follows (in thousands):
|
Production
Inefficiencies,
Moving and
Revalidation
|
Personnel
|
Other
|
Total
|
||||||||||||
|
At January 3, 2014
|
$
|
—
|
|
$
|
—
|
|
$
|
—
|
|
$
|
—
|
|
|||
|
Restructuring charges
|
—
|
|
1
|
|
10
|
|
11
|
|
|||||||
|
Cash payments
|
—
|
|
(1
|
)
|
(10
|
)
|
(11
|
)
|
|||||||
|
At January 2, 2015
|
$
|
—
|
|
$
|
—
|
|
$
|
—
|
|
$
|
—
|
|
|||
ERP system upgrade (income) costs.
In
2011
, the Company initiated plans to upgrade its existing global ERP system. This initiative was completed in 2014. Total capital investment expended under this initiative was
$4.0 million
. Total expenses incurred on this initiative were
$5.7 million
. Expenses related to this initiative were recorded within the applicable segment and corporate cost centers that the expenditures related to and included the following:
•
Training and consulting costs:
$3.2 million
; and
•
Accelerated depreciation and asset write-offs:
$2.5 million
.
-
87
-
GREATBATCH, INC.
NOTES TO CONSOLIDATED FINANCIAL STATEMENTS
The change in accrued liabilities related to the ERP system upgrade is as follows (in thousands):
|
Training &
Consulting
Costs
|
Accelerated
Depreciation/
Asset Write-offs
|
Total
|
|||||||||
|
At January 3, 2014
|
$
|
—
|
|
$
|
—
|
|
$
|
—
|
|
||
|
Restructuring income
|
(82
|
)
|
—
|
|
(82
|
)
|
|||||
|
Cash receipts
|
82
|
|
—
|
|
82
|
|
|||||
|
At January 2, 2015
|
$
|
—
|
|
$
|
—
|
|
$
|
—
|
|
||
Acquisition and integration (income) costs.
During 2014, 2013, and 2012, the Company incurred costs (income) related to the integration of CCC, NeuroNexus, and Micro Power Electronics, Inc. These expenses were primarily for retention bonuses, travel cost in connection with integration efforts, training, severance, and the change in fair value of the contingent consideration recorded in connection with these acquisitions. See Note 18 “Fair Value Measurements” for additional information on the Company’s contingent consideration, which resulted in a gain of
$0.8 million
and
$0.7 million
in
2014
, and
2013
, respectively.
Asset dispositions, severance and other.
During
2014
,
2013
, and
2012
, the Company recorded losses in connection with various asset disposals and/or write-downs. During 2014, the Company incurred
$0.9 million
of expense related to the separation of the Company’s Senior Vice President, Human Resources. Additionally, during 2014, the Company recorded charges in connection with its business reorganization to align its contract manufacturing operations. Costs incurred primarily related to consulting and IT development and were completed in 2014.
During 2013, Greatbatch Medical recorded a
$0.9 million
write-off related to its wireless sensing product line and QiG recorded a
$0.5 million
write-off of IPR&D. See Note 18, “Fair Value Measurements” for additional information.
During 2012, the Company incurred
$1.2 million
of costs related to the relocation of its global headquarters to Frisco, Texas.
-
88
-
GREATBATCH, INC.
NOTES TO CONSOLIDATED FINANCIAL STATEMENTS
|
14.
|
INCOME TAXES
|
|
The U.S. and international components of income before provision for income taxes were as follows (in thousands):
|
|
Year Ended
|
||||||||||
|
January 2,
2015 |
January 3,
2014 |
December 28,
2012 |
|||||||||
|
U.S.
|
$
|
56,801
|
|
$
|
42,392
|
|
$
|
36,057
|
|
||
|
International
|
19,778
|
|
6,446
|
|
(29,327
|
)
|
|||||
|
Total income before provision for income taxes
|
$
|
76,579
|
|
$
|
48,838
|
|
$
|
6,730
|
|
||
The provision for income taxes was comprised of the following (in thousands):
|
|
Year Ended
|
||||||||||
|
January 2,
2015 |
January 3,
2014 |
December 28,
2012 |
|||||||||
|
Current:
|
|||||||||||
|
Federal
|
$
|
16,293
|
|
$
|
39,353
|
|
$
|
4,747
|
|
||
|
State
|
1,299
|
|
1,604
|
|
381
|
|
|||||
|
International
|
2,998
|
|
1,470
|
|
668
|
|
|||||
|
20,590
|
|
42,427
|
|
5,796
|
|
||||||
|
Deferred:
|
|||||||||||
|
Federal
|
1,211
|
|
(28,678
|
)
|
6,615
|
|
|||||
|
State
|
(310
|
)
|
427
|
|
175
|
|
|||||
|
International
|
(370
|
)
|
(1,605
|
)
|
(1,057
|
)
|
|||||
|
531
|
|
(29,856
|
)
|
5,733
|
|
||||||
|
Total provision for income taxes
|
$
|
21,121
|
|
$
|
12,571
|
|
$
|
11,529
|
|
||
The provision for income taxes differs from the U.S. statutory rate due to the following:
|
|
Year Ended
|
|||||||
|
January 2,
2015 |
January 3,
2014 |
December 28,
2012 |
||||||
|
Statutory rate
|
35.0
|
%
|
35.0
|
%
|
35.0
|
%
|
||
|
Federal tax credits
|
(2.1
|
)
|
(7.5
|
)
|
—
|
|
||
|
Foreign rate differential
|
(4.3
|
)
|
(0.7
|
)
|
50.7
|
|
||
|
Uncertain tax positions
|
0.6
|
|
1.7
|
|
(10.1
|
)
|
||
|
State taxes, net of federal benefit
|
0.7
|
|
2.3
|
|
4.9
|
|
||
|
Change in tax rate - loss of Swiss tax holiday
|
—
|
|
—
|
|
25.6
|
|
||
|
Change in foreign tax rates
|
(0.6
|
)
|
(3.7
|
)
|
—
|
|
||
|
Valuation allowance
|
(0.4
|
)
|
0.4
|
|
67.6
|
|
||
|
Other
|
(1.3
|
)
|
(1.8
|
)
|
(2.4
|
)
|
||
|
Effective tax rate
|
27.6
|
%
|
25.7
|
%
|
171.3
|
%
|
||
-
89
-
GREATBATCH, INC.
NOTES TO CONSOLIDATED FINANCIAL STATEMENTS
Deferred tax assets (liabilities) consist of the following (in thousands):
|
|
At
|
||||||
|
January 2,
2015 |
January 3,
2014 |
||||||
|
Tax credits
|
$
|
5,828
|
|
$
|
6,624
|
|
|
|
Net operating loss carryforwards
|
6,721
|
|
9,161
|
|
|||
|
Inventories
|
3,335
|
|
4,202
|
|
|||
|
Accrued expenses
|
4,338
|
|
4,303
|
|
|||
|
Stock-based compensation
|
9,341
|
|
9,194
|
|
|||
|
Other
|
1,659
|
|
573
|
|
|||
|
Gross deferred tax assets
|
31,222
|
|
34,057
|
|
|||
|
Less valuation allowance
|
(10,709
|
)
|
(11,661
|
)
|
|||
|
Net deferred tax assets
|
20,513
|
|
22,396
|
|
|||
|
Property, plant and equipment
|
(2,646
|
)
|
(2,254
|
)
|
|||
|
Intangible assets
|
(57,850
|
)
|
(57,648
|
)
|
|||
|
Convertible subordinated notes
|
(5,006
|
)
|
(6,178
|
)
|
|||
|
Gross deferred tax liabilities
|
(65,502
|
)
|
(66,080
|
)
|
|||
|
Net deferred tax liability
|
$
|
(44,989
|
)
|
$
|
(43,684
|
)
|
|
|
Presented as follows:
|
|||||||
|
Current deferred tax asset
|
$
|
6,168
|
|
$
|
6,008
|
|
|
|
Current deferred tax liability
|
(588
|
)
|
(613
|
)
|
|||
|
Noncurrent deferred tax asset
|
2,626
|
|
2,933
|
|
|||
|
Noncurrent deferred tax liability
|
(53,195
|
)
|
(52,012
|
)
|
|||
|
Net deferred tax liability
|
$
|
(44,989
|
)
|
$
|
(43,684
|
)
|
|
As of
January 2, 2015
, the Company has the following carryforwards available:
|
Jurisdiction
|
Tax
Attribute
|
Amount
(in millions)
|
|
Begin to
Expire
|
|||
|
International
|
Net Operating Loss
|
48.0
|
|
(1)
|
2015
|
||
|
State
|
Net Operating Loss
|
37.6
|
|
(1)
|
Various
|
||
|
U.S. and State
|
R&D Tax Credit
|
0.7
|
|
(1)
|
Various
|
||
|
State
|
Investment Tax Credit
|
5.3
|
|
|
Various
|
||
(1) The utilization of certain net operating losses and credits is subject to an annual limitation under Internal Revenue Code Section 382.
Certain federal tax credits reported on filed income tax returns included uncertain tax positions taken in prior years. Due to the application of the accounting for uncertain tax positions, the actual tax attributes are larger than the tax credits for which a deferred tax asset is recognized for financial statement purposes.
In assessing the realizability of deferred tax assets, management considers, within each taxing jurisdiction, whether it is more likely than not that some portion or all of the deferred tax assets will not be realized. Management considers the scheduled reversal of deferred tax liabilities, projected future taxable income and tax planning strategies in making this assessment. Based on the consideration of the weight of both positive and negative evidence, management has determined that a portion of the deferred tax assets as of
January 2, 2015
and
January 3, 2014
related to certain state investment tax credits and net operating losses will not be realized.
The Company files annual income tax returns in the U.S., various state and local jurisdictions, and in various foreign jurisdictions. A number of years may elapse before an uncertain tax position, for which the Company has unrecognized tax benefits, is examined and finally settled. While it is often difficult to predict the final outcome or the timing of resolution of any particular uncertain tax position, the Company believes that its unrecognized tax benefits reflect the most probable outcome. The Company adjusts these unrecognized tax benefits, as well as the related interest, in light of
-
90
-
GREATBATCH, INC.
NOTES TO CONSOLIDATED FINANCIAL STATEMENTS
changing facts and circumstances. The resolution of a matter could be recognized as an adjustment to the Provision for Income Taxes and the effective tax rate in the period of resolution.
Below is a summary of changes to the unrecognized tax benefit (in thousands):
|
|
Year Ended
|
||||||||||
|
January 2,
2015 |
January 3,
2014 |
December 28,
2012 |
|||||||||
|
Balance, beginning of year
|
$
|
1,858
|
|
$
|
970
|
|
$
|
1,580
|
|
||
|
Additions based upon tax positions related to the current year
|
268
|
|
325
|
|
—
|
|
|||||
|
Additions related to prior period tax positions
|
510
|
|
651
|
|
210
|
|
|||||
|
Reductions relating to settlements with tax authorities
|
(225
|
)
|
(88
|
)
|
(522
|
)
|
|||||
|
Reductions as a result of a lapse of applicable statute of limitations
|
—
|
|
—
|
|
(298
|
)
|
|||||
|
Balance, end of year
|
$
|
2,411
|
|
$
|
1,858
|
|
$
|
970
|
|
||
The tax years that remain open and subject to tax audits varies depending on the tax jurisdiction. An audit of the consolidated federal 2012 and 2013 tax returns were completed in the first quarter of 2015. It is reasonably possible that a reduction of approximately
$1.0 million
of the balance of unrecognized tax benefits may occur within the next
twelve
months as a result of the lapse of the statute of limitations and/or audit settlements. As of
January 2, 2015
, approximately
$2.1 million
of unrecognized tax benefits would favorably impact the effective tax rate (net of federal impact on state issues), if recognized.
|
15.
|
COMMITMENTS AND CONTINGENCIES
|
|
Litigation
–
On
December 21, 2012
, the Company and several other unaffiliated parties were named as defendants in a personal injury and wrongful death action filed in the 113th Judicial District Court of Harris County, Texas. The complaint seeks damages alleging marketing and product defects and failure to warn, negligence and gross negligence relating to a product the Company manufactured and sold to a customer, one of the other named defendants. The Company’s customer, in turn, incorporated the Greatbatch product into its own product which it sold to a third party, another named defendant. On
December 3, 2014
, the District Court granted the Company’s motion for summary judgment and dismissed all claims against the Company. The ruling is subject to appeal by the plaintiffs.
The Company is indemnified by its customer against any loss in this matter, including costs of defense, which obligation is supported by its customer’s product liability insurance coverage in the amount of
$5 million
. The Company also has its own product liability insurance coverage, subject to a
$10 million
retention. In
January 2015
, Greatbatch’s customer reached a tentative, confidential settlement with the plaintiffs which, if approved by the Court, is expected to result in a release of all claims, including appeal rights, against the Company and its customer.
The Company has not recorded a reserve in connection with this matter since any potential loss is not probable.
The Company is a party to various other legal actions arising in the normal course of business. While the Company does not expect that the ultimate resolution of any of these pending actions will have a material effect on its consolidated results of operations, financial position, or cash flows, litigation is subject to inherent uncertainties. As such, there can be no assurance that any pending legal action, which the Company currently believes to be immaterial, does not become material in the future.
License agreements
–
The Company is a party to various license agreements for technology that is utilized in certain of its products. The most significant of these agreements are the licenses for basic technology used in the production of wet tantalum capacitors, filtered feedthroughs and MRI compatible lead systems. Expenses related to license agreements were
$3.3 million
,
$3.5 million
and
$3.1 million
, for
2014
,
2013
and
2012
, respectively, and are included in Cost of Sales.
-
91
-
GREATBATCH, INC.
NOTES TO CONSOLIDATED FINANCIAL STATEMENTS
Product Warranties
– The Company generally warrants that its products will meet customer specifications and will be free from defects in materials and workmanship. The change in product warranty liability was comprised of the following (in thousands):
|
|
Year Ended
|
||||||
|
January 2,
2015 |
January 3,
2014 |
||||||
|
Beginning balance
|
$
|
1,819
|
|
$
|
2,626
|
|
|
|
Additions to warranty reserve
|
953
|
|
1,624
|
|
|||
|
Warranty claims paid
|
(2,112
|
)
|
(2,431
|
)
|
|||
|
Ending balance
|
$
|
660
|
|
$
|
1,819
|
|
|
Operating Leases
–
The Company is a party to various operating lease agreements for buildings, machinery, equipment and software. The Company primarily leases buildings, which accounts for the majority of the future lease payments. Lease expense includes the effect of escalation clauses and leasehold improvement incentives which are accounted for ratably over the lease term. Operating lease expense was as follows (in thousands):
|
|
Year Ended
|
||||||||||
|
January 2,
2015 |
January 3,
2014 |
December 28,
2012 |
|||||||||
|
Operating lease expense
|
$
|
4,281
|
|
$
|
4,379
|
|
$
|
4,024
|
|
||
Minimum future estimated annual operating lease expenses are as follows (in thousands):
|
2015
|
$
|
5,797
|
|
|
2016
|
5,952
|
|
|
|
2017
|
3,908
|
|
|
|
2018
|
3,489
|
|
|
|
2019
|
3,418
|
|
|
|
Thereafter
|
13,938
|
|
|
|
Total estimated operating lease expense
|
$
|
36,502
|
|
Self-Insured Medical Plan
–
The Company self-funds the medical insurance coverage provided to its U.S. based employees. The Company had specific stop loss coverage per associate for claims incurred during 2014 exceeding
$225 thousand
per associate with no annual maximum aggregate stop loss coverage. As of
January 2, 2015
and
January 3, 2014
, the Company had
$1.8 million
and
$1.6 million
accrued related to the self-insurance of its medical plan, respectively. This accrual is recorded in Accrued Expenses in the Consolidated Balance Sheet, and is primarily based upon claim history.
Purchase Commitments
– Contractual obligations for purchase of goods or services are defined as agreements that are enforceable and legally binding on the Company and that specify all significant terms, including: fixed or minimum quantities to be purchased; fixed, minimum or variable price provisions; and the approximate timing of the transaction. The Company’s purchase orders are normally based on its current manufacturing needs and are fulfilled by its vendors within short time horizons. The Company enters into blanket orders with vendors that have preferred pricing and terms, however these orders are normally cancelable by us without penalty. As of
January 2, 2015
, the total contractual obligation related to such expenditures is approximately
$36.4 million
and will primarily be financed by existing cash and cash equivalents, cash generated from operations, or the Credit Facility. The Company also enters into contracts for outsourced services; however, the obligations under these contracts were not significant and the contracts generally contain clauses allowing for cancellation without significant penalty.
Foreign Currency Contracts
– The Company has entered into forward contracts to purchase Mexican pesos in order to hedge the risk of peso-denominated payments associated with the operations at its Tijuana, Mexico facility. The impact to the Company’s results of operations from these forward contracts was as follows (in thousands):
|
|
Year Ended
|
||||||||||
|
January 2,
2015 |
January 3,
2014 |
December 28,
2012 |
|||||||||
|
Reduction in Cost of Sales
|
$
|
(168
|
)
|
$
|
(1,154
|
)
|
$
|
(79
|
)
|
||
|
Ineffective portion of change in fair value
|
—
|
|
—
|
|
—
|
|
|||||
-
92
-
GREATBATCH, INC.
NOTES TO CONSOLIDATED FINANCIAL STATEMENTS
Information regarding outstanding foreign currency contracts as of
January 2, 2015
is as follows (dollars in thousands):
|
Instrument
|
Type of
Hedge
|
Aggregate
Notional
Amount
|
Start
Date
|
End
Date
|
$/Peso
|
Fair
Value
|
Balance Sheet
Location
|
|||||||||||
|
FX Contract
|
Cash flow
|
$
|
16,880
|
|
Jan-15
|
Dec-15
|
0.0734
|
|
$
|
(1,568
|
)
|
Accrued Expenses
|
||||||
Workers’ Compensation Trust
–
The Company was a member of a group self-insurance trust that provided workers’ compensation benefits to employees of the Company in Western New York (the “Trust”). Under the Trust agreement, each participating organization has joint and several liability for Trust obligations if the assets of the Trust are not sufficient to cover those obligations. During 2011, the Company was notified by the Trust of its intentions to cease operations at the end of 2011 and was assessed a pro-rata share of future costs related to the Trust. Based on actual experience, the Company could receive a refund or be assessed additional contributions for workers’ compensation claims insured by the Trust. Since 2011, the Company has utilized a traditional insurance provider for workers’ compensation coverage.
|
16.
|
EARNINGS (LOSS) PER SHARE
|
|
The following table illustrates the calculation of Basic and Diluted EPS (in thousands, except per share amounts):
|
|
Year Ended
|
||||||||||
|
January 2,
2015 |
January 3,
2014 |
December 28,
2012 |
|||||||||
|
Numerator for basic EPS:
|
|||||||||||
|
Net income (loss)
|
$
|
55,458
|
|
$
|
36,267
|
|
$
|
(4,799
|
)
|
||
|
Denominator for basic EPS:
|
|||||||||||
|
Weighted average shares outstanding
|
24,825
|
|
23,991
|
|
23,584
|
|
|||||
|
Effect of dilutive securities:
|
|||||||||||
|
Stock options, restricted stock and restricted stock units
|
1,150
|
|
1,332
|
|
—
|
|
|||||
|
Denominator for diluted EPS
|
25,975
|
|
25,323
|
|
23,584
|
|
|||||
|
Basic EPS
|
$
|
2.23
|
|
$
|
1.51
|
|
$
|
(0.20
|
)
|
||
|
Diluted EPS
|
$
|
2.14
|
|
$
|
1.43
|
|
$
|
(0.20
|
)
|
||
The diluted weighted average share calculations do not include the following securities, which are not dilutive to the EPS calculations or the performance criteria have not been met:
|
|
Year Ended
|
|||||||
|
January 2,
2015 |
January 3,
2014 |
December 28,
2012 |
||||||
|
Time-vested stock options, restricted stock and restricted stock units
|
175,549
|
|
18,480
|
|
2,142,000
|
|
||
|
Performance-vested stock options and restricted stock units
|
—
|
|
—
|
|
781,000
|
|
||
For the 2013 and 2012 periods, no shares related to CSN were included in the diluted EPS calculations as the average share price of the Company’s common stock for those periods did not exceed CSN’s conversion price per share.
-
93
-
|
17.
|
ACCUMULATED OTHER COMPREHENSIVE INCOME
|
|
Accumulated Other Comprehensive Income is comprised of the following (in thousands):
|
Defined
Benefit
Plan
Liability
|
Cash
Flow
Hedges
|
Foreign
Currency
Translation
Adjustment
|
Total
Pre-Tax
Amount
|
Tax
|
Net-of-Tax
Amount
|
||||||||||||||||||
|
At January 3, 2014
|
$
|
(672
|
)
|
$
|
(468
|
)
|
$
|
14,952
|
|
$
|
13,812
|
|
$
|
546
|
|
$
|
14,358
|
|
|||||
|
Unrealized loss on cash flow hedges
|
—
|
|
(2,372
|
)
|
—
|
|
(2,372
|
)
|
829
|
|
(1,543
|
)
|
|||||||||||
|
Realized gain on foreign currency hedges
|
—
|
|
(168
|
)
|
—
|
|
(168
|
)
|
59
|
|
(109
|
)
|
|||||||||||
|
Realized loss on interest rate swap hedges
|
—
|
|
450
|
|
—
|
|
450
|
|
(157
|
)
|
293
|
|
|||||||||||
|
Net defined benefit plan liability adjustments
|
(509
|
)
|
—
|
|
—
|
|
(509
|
)
|
135
|
|
(374
|
)
|
|||||||||||
|
Foreign currency translation loss
|
—
|
|
—
|
|
(3,502
|
)
|
(3,502
|
)
|
—
|
|
(3,502
|
)
|
|||||||||||
|
At January 2, 2015
|
$
|
(1,181
|
)
|
$
|
(2,558
|
)
|
$
|
11,450
|
|
$
|
7,711
|
|
$
|
1,412
|
|
$
|
9,123
|
|
|||||
|
Defined
Benefit
Plan
Liability
|
Cash
Flow
Hedges
|
Foreign
Currency
Translation
Adjustment
|
Total
Pre-Tax
Amount
|
Tax
|
Net-of-Tax
Amount
|
||||||||||||||||||
|
At December 28, 2012
|
$
|
(962
|
)
|
$
|
120
|
|
$
|
13,431
|
|
$
|
12,589
|
|
$
|
358
|
|
$
|
12,947
|
|
|||||
|
Unrealized gain on cash flow hedges
|
—
|
|
58
|
|
—
|
|
58
|
|
(20
|
)
|
38
|
|
|||||||||||
|
Realized gain on foreign currency hedges
|
—
|
|
(1,154
|
)
|
—
|
|
(1,154
|
)
|
404
|
|
(750
|
)
|
|||||||||||
|
Realized loss on interest rate swap hedges
|
—
|
|
508
|
|
—
|
|
508
|
|
(178
|
)
|
330
|
|
|||||||||||
|
Net defined benefit plan liability adjustments
|
290
|
|
—
|
|
—
|
|
290
|
|
(18
|
)
|
272
|
|
|||||||||||
|
Foreign currency translation gain
|
—
|
|
—
|
|
1,521
|
|
1,521
|
|
—
|
|
1,521
|
|
|||||||||||
|
At January 3, 2014
|
$
|
(672
|
)
|
$
|
(468
|
)
|
$
|
14,952
|
|
$
|
13,812
|
|
$
|
546
|
|
$
|
14,358
|
|
|||||
The realized (gain) loss relating to the Company’s foreign currency and interest rate swap hedges were reclassified from Accumulated Other Comprehensive Income and included in Cost of Sales and Interest Expense, respectively, in the Consolidated Statements of Operations. See Note 10 “Benefit Plans” for details on the change in defined benefit plan liability adjustments.
|
18.
|
FAIR VALUE MEASUREMENTS
|
|
Assets and Liabilities Measured at Fair Value on a Recurring Basis
Fair value measurement standards apply to certain financial assets and liabilities that are measured at fair value on a recurring basis (each reporting period). For the Company, these financial assets and liabilities include its derivative instruments and accrued contingent consideration. The Company does not have any nonfinancial assets or liabilities that are measured at fair value on a recurring basis.
Foreign currency contracts
– The fair value of foreign currency contracts are determined through the use of cash flow models that utilize observable market data inputs to estimate fair value. These observable market data inputs include foreign exchange rate and credit spread curves. In addition to the above, the Company received fair value estimates from the foreign currency contract counterparty to verify the reasonableness of the Company’s estimates. The Company’s foreign currency contracts are categorized in Level 2 of the fair value hierarchy. The fair value of the Company’s foreign currency contracts will be realized as Cost of Sales as the inventory, which the contracts are hedging the cash flows to produce, is sold, of which approximately
$1.6 million
is expected to be realized within the next twelve months.
-
94
-
GREATBATCH, INC.
NOTES TO CONSOLIDATED FINANCIAL STATEMENTS
Interest rate swaps
– The fair value of the Company’s interest rate swaps outstanding at
January 2, 2015
was determined through the use of a cash flow model that utilizes observable market data inputs. These observable market data inputs include LIBOR, swap rates, and credit spread curves. In addition to the above, the Company received a fair value estimate from the interest rate swap counterparty to verify the reasonableness of the Company’s estimate. This fair value calculation was categorized in Level 2 of the fair value hierarchy.
Accrued contingent consideration
– The fair value of accrued contingent consideration recorded by the Company represents the estimated fair value of the contingent consideration the Company expects to pay to the former shareholders of NeuroNexus based upon the achievement of certain financial and development-based milestones. The fair value of the contingent consideration liability was estimated by discounting to present value, the probability weighted contingent payments expected to be made utilizing a risk adjusted discount rate. During the first quarter of 2014, the financial milestone expired unachieved and as a result, was determined to have a fair value of
zero
. During the fourth quarter of 2014, the Company determined that the development milestone will expire unachieved, and as a result, was determined to have a fair value of
zero
. Changes in the fair value of accrued contingent consideration were recorded in Other Operating Expenses, Net. The Company’s accrued contingent consideration is categorized in Level 3 of the fair value hierarchy. Changes in accrued contingent consideration were as follows (in thousands):
|
At December 28, 2012
|
$
|
1,530
|
|
|
Fair value adjustments
|
(690
|
)
|
|
|
At January 3, 2014
|
840
|
|
|
|
Fair value adjustments
|
(840
|
)
|
|
|
At January 2, 2015
|
$
|
—
|
|
The following tables provide information regarding assets and liabilities recorded at fair value on a recurring basis (in thousands):
|
|
Fair Value Measurements Using
|
||||||||||||||
|
Description
|
At January 2, 2015
|
Quoted
Prices in
Active Markets
for Identical
Assets
(Level 1)
|
Significant
Other
Observable
Inputs
(Level 2)
|
Significant
Unobservable
Inputs
(Level 3)
|
|||||||||||
|
Liabilities
|
|||||||||||||||
|
Foreign currency contracts (Note 15)
|
$
|
1,568
|
|
$
|
—
|
|
$
|
1,568
|
|
$
|
—
|
|
|||
|
Interest rate swaps (Note 9)
|
990
|
|
—
|
|
990
|
|
—
|
|
|||||||
|
|
Fair Value Measurements Using
|
||||||||||||||
|
Description
|
At January 3,
2014 |
Quoted
Prices in Active Markets for Identical Assets (Level 1) |
Significant
Other Observable Inputs (Level 2) |
Significant
Unobservable Inputs (Level 3) |
|||||||||||
|
Liabilities
|
|||||||||||||||
|
Foreign currency contracts
|
$
|
140
|
|
$
|
—
|
|
$
|
140
|
|
$
|
—
|
|
|||
|
Accrued contingent consideration
|
840
|
|
—
|
|
—
|
|
840
|
|
|||||||
|
Interest rate swap
|
328
|
|
—
|
|
328
|
|
—
|
|
|||||||
Assets and Liabilities Measured at Fair Value on a Nonrecurring Basis
Fair value standards also apply to certain assets and liabilities that are measured at fair value on a nonrecurring basis. The carrying amounts of cash, accounts receivable, accounts payable, accrued expenses and current portion of long-term debt approximate fair value because of the short-term nature of these items. As of
January 2, 2015
, the fair value of the Company’s variable rate long-term debt approximates its carrying value and is categorized in Level 2 of the fair value hierarchy.
A summary of the valuation methodologies for assets and liabilities measured on a nonrecurring basis is as follows:
-
95
-
GREATBATCH, INC.
NOTES TO CONSOLIDATED FINANCIAL STATEMENTS
Cost and equity method investments
– The Company holds investments in equity and other securities that are accounted for as either cost or equity method investments, which are classified as Other Assets. The total carrying value of these investments is reviewed quarterly for changes in circumstance or the occurrence of events that suggest the Company’s investment may not be recoverable. The fair value of cost or equity method investments is not adjusted if there are no identified events or changes in circumstances that may have a material effect on the fair value of the investments. Gains and losses realized on cost and equity method investments are recorded in Other (Income) Expense, Net, unless separately stated. The aggregate recorded amount of cost and equity method investments at
January 2, 2015
and
January 3, 2014
was
$14.5 million
and
$12.3 million
, respectively. The Company’s equity method investment is in a Chinese venture capital fund focused on investing in life sciences companies. This fund accounts for its investments at fair value with the unrealized change in fair value of these investments recorded as income or loss to the fund in the period of change. As of
January 2, 2015
, the Company owned
7.4%
of this fund.
During
2014
,
2013
and
2012
, the Company recognized impairment charges related to its cost method investments of
$0.0 million
,
$0.5 million
and
$0.1 million
, respectively. The fair value of these investments was determined by reference to recent sales data of similar shares to independent parties in an inactive market. This fair value calculation was categorized in Level 2 of the fair value hierarchy. During 2014, the Company sold one of its cost method investments, which resulted in a pre-tax gain of
$3.2 million
. During
2014
,
2013
, and
2012
, the Company recognized a net gain (loss) on equity method investments of
$1.2 million
,
$(0.2) million
, and
$(0.3) million
, respectively.
Long-lived assets
– The Company reviews the carrying amount of its long-lived assets to be held and used for potential impairment whenever certain indicators are present as described in Note 1 “Summary of Significant Accounting Policies.” During 2014, the Company recorded a
$0.4 million
impairment charge related to its Orvin, Switzerland property held for sale. The fair value of these assets were determined based upon recent sales data of similar assets and discussions with potential buyers, and was categorized in Level 2 of the fair value hierarchy. During 2013, the Company wrote off
$0.5 million
of IPR&D allocated to its QiG segment as these projects were discontinued prior to reaching technological feasibility. Additionally, during 2013, the Company wrote off
$0.9 million
of inventory and technology related to Greatbatch Medical’s wireless sensing product line held for sale, as an agreement could not be reached with potential buyers. During 2012, the Company recognized a
$3.6 million
impairment charge in connection with the sale of certain non-core Swiss orthopaedic product lines to an independent third party. The above impairment charges were recorded in Other Operating Expenses, Net. See Note 13 “Other Operating Expenses, Net” for further discussion.
The following table provides information regarding assets and liabilities recorded at fair value on a nonrecurring basis as of January 2, 2015. There were
no
such assets or liabilities as of January 3, 2014 (in thousands):
|
|
Fair Value Measurements Using
|
||||||||||||||
|
Description
|
At January 2, 2015
|
Quoted
Prices in Active Markets for Identical Assets (Level 1) |
Significant
Other Observable Inputs (Level 2) |
Significant
Unobservable Inputs (Level 3) |
|||||||||||
|
Assets
|
|||||||||||||||
|
Assets Held for Sale (Note 5)
|
$
|
1,635
|
|
$
|
—
|
|
$
|
1,635
|
|
$
|
—
|
|
|||
Fair Value of Other Financial Instruments
Pension plan assets
– The fair value of the Company’s pension plan assets disclosed in Note 10 “Benefit Plans” are determined based upon quoted market prices in inactive markets or valuation models with observable market data inputs to estimate fair value. These observable market data inputs include benchmark yields, reported trades, broker/dealer quotes, issuer spreads, benchmark securities, bids, offers and reference data. The Company’s pension plan assets are categorized Level 2 of the fair value hierarchy.
|
19.
|
BUSINESS SEGMENT, GEOGRAPHIC AND CONCENTRATION RISK INFORMATION
|
|
The Company has
two
reportable segments: Greatbatch Medical and QiG. Greatbatch Medical designs and manufactures medical devices and components where Greatbatch either owns the intellectual property or has unique manufacturing and assembly expertise. Greatbatch Medical provides medical devices and components to the following markets:
|
•
|
Cardiac/Neuromodulation:
Products include batteries, capacitors, filtered and unfiltered feed-throughs, engineered components, implantable stimulation leads, and enclosures used in implantable medical devices.
|
-
96
-
GREATBATCH, INC.
NOTES TO CONSOLIDATED FINANCIAL STATEMENTS
|
•
|
Orthopaedics:
Products include implants, instruments and delivery systems for large joint, spine, extremity and trauma procedures.
|
|
•
|
Portable Medical:
Products include life-saving and life-enhancing applications comprising automated external defibrillators, portable oxygen concentrators, ventilators, and powered surgical tools.
|
|
•
|
Vascular:
Products include introducers, steerable sheaths, and catheters that deliver therapies for various markets such as coronary and neurovascular disease, peripheral vascular disease, interventional radiology, vascular access, atrial fibrillation, and interventional cardiology, plus products for medical imaging and pharmaceutical delivery.
|
|
•
|
Energy, Military, Environmental:
Products include primary and rechargeable batteries and battery packs for demanding applications such as down hole drilling tools.
|
Greatbatch Medical also offers value-added assembly and design engineering services for medical devices that utilize its component products.
QiG focuses on developing medical device systems for some of healthcare’s most pressing challenges and reflects Greatbatch’s strategic evolution of its product offerings in order to raise the growth and profitability profile of the Company. QiG utilizes a disciplined and diversified portfolio approach with three investment modes: new medical device systems commercialization, collaborative programs with OEM customers, and strategic equity positions in emerging healthcare companies. The development of certain new medical device systems are facilitated through the establishment of limited liability companies (“LLCs”). These LLCs do not own, but have the exclusive right to use the technology of Greatbatch in certain, specific fields of use and have an exclusive manufacturing agreement with Greatbatch Medical. QiG currently owns
89%
-
100%
of
three
LLCs. Minority interest in these LLCs are held by key opinion leaders, clinicians and strategic partners. Under the agreements governing these LLCs, QiG is responsible to fund
100%
of the expenses incurred by the LLC. However, no distributions are made to the minority holders until QiG is reimbursed for all expenses paid. Once QiG has been fully reimbursed, all future distributions are made based upon the respective LLCs ownership percentages. One of the LLCs established by QiG is for the Company’s Algovita spinal cord stimulator to treat chronic intractable pain of the trunk and/or limbs. This product was submitted for premarket approval (“PMA”) to the United States Food & Drug Administration (“FDA”) in December 2013 and in January 2014 documentation for European CE Mark was submitted to the notified body, TÜV SÜD America. CE Mark approval was obtained on
June 17, 2014
.
QiG revenue includes sales of neural interface technology, components and systems to the neuroscience and clinical markets. As further discussed in Note 2 “Acquisitions,” during 2014, the Company acquired CCC, a neuromodulation medical device developer and manufacturer. As a result of this transaction, QiG revenue also includes sales of various medical device products such as implantable pulse generators, programmer systems, battery chargers, patient wands and leads to medical device companies. Future income of QiG is expected to come from various sources including investment gains from the sales of its LLC ownership interests, technology licensing fees, royalty revenue, and/or the sales of medical device systems.
An analysis and reconciliation of the Company’s business segment, product line and geographic information to the respective information in the Consolidated Financial Statements follows. Intersegment sales between Greatbatch Medical and QiG were not material for 2014, 2013 or 2012. Sales by geographic area are presented by allocating sales from external customers based on where the products are shipped to (in thousands):
|
|
Year Ended
|
||||||||||
|
Sales:
|
January 2,
2015 |
January 3,
2014 |
December 28,
2012 |
||||||||
|
Greatbatch Medical
|
|||||||||||
|
Cardiac/Neuromodulation
|
$
|
321,419
|
|
$
|
325,412
|
|
$
|
306,669
|
|
||
|
Orthopaedics
|
147,296
|
|
130,247
|
|
122,061
|
|
|||||
|
Portable Medical
|
69,043
|
|
78,743
|
|
81,659
|
|
|||||
|
Vascular
|
58,770
|
|
48,357
|
|
51,980
|
|
|||||
|
Energy, Military, Environmental
|
81,757
|
|
78,143
|
|
81,353
|
|
|||||
|
Total Greatbatch Medical
|
678,285
|
|
660,902
|
|
643,722
|
|
|||||
|
QiG
|
9,502
|
|
3,043
|
|
2,455
|
|
|||||
|
Total sales
|
$
|
687,787
|
|
$
|
663,945
|
|
$
|
646,177
|
|
||
-
97
-
GREATBATCH, INC.
NOTES TO CONSOLIDATED FINANCIAL STATEMENTS
|
|
Year Ended
|
||||||||||
|
January 2,
2015 |
January 3,
2014 |
December 28,
2012 |
|||||||||
|
Segment income (loss) from operations:
|
|||||||||||
|
Greatbatch Medical
|
$
|
126,312
|
|
$
|
111,805
|
|
$
|
79,093
|
|
||
|
QiG
|
(23,256
|
)
|
(30,484
|
)
|
(32,554
|
)
|
|||||
|
Total segment income from operations
|
103,056
|
|
81,321
|
|
46,539
|
|
|||||
|
Unallocated operating expenses
|
(27,402
|
)
|
(19,982
|
)
|
(20,718
|
)
|
|||||
|
Operating income as reported
|
75,654
|
|
61,339
|
|
25,821
|
|
|||||
|
Unallocated other income (expense), net
|
925
|
|
(12,501
|
)
|
(19,091
|
)
|
|||||
|
Income before provision for income taxes as reported
|
$
|
76,579
|
|
$
|
48,838
|
|
$
|
6,730
|
|
||
|
|
Year Ended
|
||||||||||
|
|
January 2,
2015 |
January 3,
2014 |
December 28,
2012 |
||||||||
|
Depreciation and Amortization:
|
|||||||||||
|
Greatbatch Medical
|
$
|
31,906
|
|
$
|
31,112
|
|
$
|
39,820
|
|
||
|
QiG
|
2,101
|
|
1,539
|
|
630
|
|
|||||
|
Total depreciation and amortization included in segment income from operations
|
34,007
|
|
32,651
|
|
40,450
|
|
|||||
|
Unallocated depreciation and amortization
|
4,223
|
|
9,681
|
|
18,475
|
|
|||||
|
Total depreciation and amortization
|
$
|
38,230
|
|
$
|
42,332
|
|
$
|
58,925
|
|
||
|
|
Year Ended
|
||||||||||
|
|
January 2,
2015 |
January 3,
2014 |
December 28,
2012 |
||||||||
|
Expenditures for tangible long-lived assets, excluding acquisitions:
|
|||||||||||
|
Greatbatch Medical
|
$
|
19,006
|
|
$
|
13,242
|
|
$
|
33,249
|
|
||
|
QiG
|
1,453
|
|
2,134
|
|
3,208
|
|
|||||
|
Total reportable segments
|
20,459
|
|
15,376
|
|
36,457
|
|
|||||
|
Unallocated long-lived tangible assets
|
5,187
|
|
2,798
|
|
4,709
|
|
|||||
|
Total expenditures
|
$
|
25,646
|
|
$
|
18,174
|
|
$
|
41,166
|
|
||
|
|
At
|
||||||||||
|
January 2,
2015 |
January 3,
2014 |
December 28,
2012 |
|||||||||
|
Identifiable assets:
|
|||||||||||
|
Greatbatch Medical
|
$
|
761,225
|
|
$
|
758,369
|
|
$
|
779,890
|
|
||
|
QiG
|
76,529
|
|
56,245
|
|
57,750
|
|
|||||
|
Total reportable segments
|
837,754
|
|
814,614
|
|
837,640
|
|
|||||
|
Unallocated assets
|
118,255
|
|
76,089
|
|
52,235
|
|
|||||
|
Total assets
|
$
|
956,009
|
|
$
|
890,703
|
|
$
|
889,875
|
|
||
-
98
-
GREATBATCH, INC.
NOTES TO CONSOLIDATED FINANCIAL STATEMENTS
|
|
Year Ended
|
||||||||||
|
January 2,
2015 |
January 3,
2014 |
December 28,
2012 |
|||||||||
|
Sales by geographic area:
|
|||||||||||
|
United States
|
$
|
312,539
|
|
$
|
325,090
|
|
$
|
330,537
|
|
||
|
Non-Domestic locations:
|
|||||||||||
|
Puerto Rico
|
127,702
|
|
117,961
|
|
105,731
|
|
|||||
|
Belgium
|
65,308
|
|
67,155
|
|
58,043
|
|
|||||
|
Rest of world
|
182,238
|
|
153,739
|
|
151,866
|
|
|||||
|
Total sales
|
$
|
687,787
|
|
$
|
663,945
|
|
$
|
646,177
|
|
||
|
|
At
|
||||||||||
|
January 2,
2015 |
January 3,
2014 |
December 28,
2012 |
|||||||||
|
Long-lived tangible assets:
|
|||||||||||
|
United States
|
$
|
113,851
|
|
$
|
116,484
|
|
$
|
123,104
|
|
||
|
Rest of world
|
31,074
|
|
29,289
|
|
27,789
|
|
|||||
|
Total
|
$
|
144,925
|
|
$
|
145,773
|
|
$
|
150,893
|
|
||
A significant portion of the Company’s sales and accounts receivable were to four customers as follows:
|
|
Sales
|
Accounts Receivable
|
||||||||||||
|
|
Year Ended
|
At
|
||||||||||||
|
January 2,
2015 |
January 3,
2014 |
December 28,
2012 |
January 2,
2015 |
January 3,
2014 |
||||||||||
|
Customer A
|
18
|
%
|
20
|
%
|
19
|
%
|
4
|
%
|
8
|
%
|
||||
|
Customer B
|
18
|
%
|
16
|
%
|
16
|
%
|
23
|
%
|
19
|
%
|
||||
|
Customer C
|
12
|
%
|
13
|
%
|
11
|
%
|
8
|
%
|
8
|
%
|
||||
|
Customer D
|
6
|
%
|
7
|
%
|
6
|
%
|
12
|
%
|
11
|
%
|
||||
|
54
|
%
|
56
|
%
|
52
|
%
|
47
|
%
|
46
|
%
|
|||||
|
20.
|
QUARTERLY SALES AND EARNINGS DATA—UNAUDITED
|
|
|
4th Qtr.
|
3rd Qtr.
|
2nd Qtr.
|
1st Qtr.
|
||||||||||||
|
|
(in thousands, except per share data)
|
||||||||||||||
|
2014
|
|||||||||||||||
|
Sales
|
$
|
169,726
|
|
$
|
171,699
|
|
$
|
172,081
|
|
$
|
174,281
|
|
|||
|
Gross profit
|
57,214
|
|
58,118
|
|
58,470
|
|
57,596
|
|
|||||||
|
Net income
|
14,176
|
|
14,012
|
|
12,348
|
|
14,922
|
|
|||||||
|
EPS—basic
|
0.57
|
|
0.56
|
|
0.50
|
|
0.61
|
|
|||||||
|
EPS—diluted
|
0.54
|
|
0.54
|
|
0.48
|
|
0.58
|
|
|||||||
|
2013
|
|||||||||||||||
|
Sales
|
$
|
176,619
|
|
$
|
167,730
|
|
$
|
171,331
|
|
$
|
148,265
|
|
|||
|
Gross profit
|
57,385
|
|
55,877
|
|
57,302
|
|
48,749
|
|
|||||||
|
Net income
|
9,781
|
|
11,071
|
|
9,752
|
|
5,663
|
|
|||||||
|
EPS—basic
|
0.40
|
|
0.46
|
|
0.41
|
|
0.24
|
|
|||||||
|
EPS—diluted
|
0.38
|
|
0.44
|
|
0.39
|
|
0.23
|
|
|||||||
-
99
-
GREATBATCH, INC.
NOTES TO CONSOLIDATED FINANCIAL STATEMENTS
Fourth quarter results for 2013 includes an additional week of operations in comparison to the same period of 2014 as the Company utilizes a fifty-two, fifty-three week fiscal year, which ends on the Friday nearest December 31st. Although this additional week of operations may have impacted certain financial statement line items, management believes that, when combined with the additional holiday and weather related shutdowns, this additional week did not materially impact the Company’s net operating results.
|
ITEM 9.
|
CHANGES IN AND DISAGREEMENTS WITH ACCOUNTANTS ON ACCOUNTING AND FINANCIAL DISCLOSURE
|
|
None.
|
ITEM 9A.
|
CONTROLS AND PROCEDURES
|
|
Management’s Report on Internal Control Over Financial Reporting appears in Part II, Item 8, “Financial Statements and Supplementary Data” of this report and is incorporated into this Item 9A by reference.
|
a.
|
Evaluation of Disclosure Controls and Procedures
.
|
Our management, including the principal executive officer and principal financial officer, evaluated our disclosure controls and procedures (as defined in Rules 13a-15(e) and 15d-15(e) under the Securities Exchange Act of 1934) related to the recording, processing, summarization and reporting of information in our reports that we file with the Securities and Exchange Commission as of
January 2, 2015
. These disclosure controls and procedures have been designed to provide reasonable assurance that material information relating to us, including our subsidiaries, is made known to our management, including these officers, by our employees, and that this information is recorded, processed, summarized, evaluated and reported, as applicable, within the time periods specified in the Securities and Exchange Commission’s rules and forms. Based on their evaluation, as of
January 2, 2015
, our principal executive officer and principal financial officer have concluded that our disclosure controls and procedures are effective.
b.
Changes in Internal Control Over Financial Reporting
.
We acquired the following subsidiary during 2014:
Centro de Construcción de Cardioestimuladores del Uruguay
We believe that the internal controls and procedures of the above mentioned subsidiary are reasonably likely to materially affect our internal control over financial reporting. We are currently in the process of incorporating the internal controls and procedures of this subsidiary into our internal controls over financial reporting.
The Company has begun to extend its Section 404 compliance program under the Sarbanes-Oxley Act of 2002 (the “Act”) and the applicable rules and regulations under such Act to include this subsidiary. However, the Company has excluded this subsidiary from management’s assessment of the effectiveness of internal control over financial reporting as of
January 2, 2015
, as permitted by the guidance issued by the Office of the Chief Accountant of the Securities and Exchange Commission. This subsidiary represented approximately 3% and 2% of net and total assets, respectively, 1% of revenues, and 2% of net income of the consolidated financial statement amounts as of and for the year ended
January 2, 2015
. The Company will report on its assessment of the internal controls of its combined operations within the time period provided by the Act and the applicable Securities and Exchange Commission rules and regulations concerning business combinations.
Other than as described above, there were no changes in the registrant’s internal control over financial reporting during our last fiscal quarter to which this Annual Report on Form 10-K relates that have materially affected, or are reasonably likely to materially affect, internal control over financial reporting.
-
100
-
|
ITEM 9B.
|
OTHER INFORMATION
|
|
None.
|
ITEM 10.
|
DIRECTORS, EXECUTIVE OFFICERS AND CORPORATE GOVERNANCE
|
|
Information regarding the Company’s directors appearing under the caption “Election of Directors” in the Company’s Proxy Statement for its
2015
Annual Meeting of Stockholders is incorporated herein by reference.
Information regarding the Company’s executive officers is presented under the caption “Executive Officers of the Company” in Part I of this Annual Report on Form 10-K.
The other information required by Item 10 is incorporated herein by reference from the Company’s Proxy Statement for its
2015
Annual Meeting of Stockholders.
|
ITEM 11.
|
EXECUTIVE COMPENSATION
|
|
Information regarding executive compensation in the Company’s Proxy Statement for the
2015
Annual Meeting of Stockholders is incorporated herein by reference.
|
ITEM 12.
|
SECURITY OWNERSHIP OF CERTAIN BENEFICIAL OWNERS AND MANAGEMENT AND RELATED STOCKHOLDER MATTERS
|
|
Information regarding security ownership of certain beneficial owners and management and related stockholder matters, including the table titled “Equity Compensation Plan Information,” in the Company’s Proxy Statement for the
2015
Annual Meeting of Stockholders is incorporated herein by reference.
|
ITEM 13.
|
CERTAIN RELATIONSHIPS AND RELATED TRANSACTIONS, AND DIRECTOR INDEPENDENCE
|
|
Information regarding certain relationships and related transactions, and director independence in the Company’s Proxy Statement for the
2015
Annual Meeting of Stockholders is incorporated herein by reference.
|
ITEM 14.
|
PRINCIPAL ACCOUNTING FEES AND SERVICES
|
|
Information regarding the fees paid to and services provided by Deloitte & Touche LLP, the Company’s independent registered public accounting firm, in the Company’s Proxy Statement for the
2015
Annual Meeting of Stockholders is incorporated herein by reference.
-
101
-
|
ITEM 15.
|
EXHIBITS, FINANCIAL STATEMENT SCHEDULES
|
|
|
(a)
|
LIST OF DOCUMENTS FILED AS PART OF THIS REPORT
|
|
1.
|
Financial statements and financial statement schedules filed as part of this Annual Report on Form 10-K. See Part II, Item 8. “Financial Statements and Supplementary Data.”
|
|
2.
|
The following financial statement schedule is included in this Annual Report on Form 10-K (in thousands):
|
Schedule II—Valuation and Qualifying Accounts
|
|
|
Col. C—Additions
|
|
|
|
|
||||||||||||||||
|
Col. A
Description
|
Col. B Balance at Beginning
of Period
|
Charged to Costs &
Expenses
|
Charged to Other Accounts- Describe
|
|
Col. D Deductions
- Describe
|
|
Col. E Balance at End of
Period
|
|||||||||||||||
|
January 2, 2015
|
||||||||||||||||||||||
|
Allowance for doubtful accounts
|
$
|
2,001
|
|
$
|
98
|
|
$
|
14
|
|
(3)(4)
|
$
|
(702
|
)
|
(2)
|
$
|
1,411
|
|
|||||
|
Valuation allowance for deferred income tax assets
|
$
|
11,661
|
|
$
|
(729
|
)
|
(1)
|
$
|
—
|
|
(4)
|
$
|
(223
|
)
|
(1)(5)
|
$
|
10,709
|
|
||||
|
January 3, 2014
|
||||||||||||||||||||||
|
Allowance for doubtful accounts
|
$
|
2,372
|
|
$
|
(93
|
)
|
$
|
(15
|
)
|
(4)
|
$
|
(263
|
)
|
(2)
|
$
|
2,001
|
|
|||||
|
Valuation allowance for deferred income tax assets
|
$
|
12,768
|
|
$
|
(1,263
|
)
|
(1)
|
$
|
32
|
|
(4)
|
$
|
124
|
|
(1)
|
$
|
11,661
|
|
||||
|
December 28, 2012
|
||||||||||||||||||||||
|
Allowance for doubtful accounts
|
$
|
1,930
|
|
$
|
484
|
|
$
|
71
|
|
(3)(4)
|
$
|
(113
|
)
|
(2)
|
$
|
2,372
|
|
|||||
|
Valuation allowance for deferred income tax assets
|
$
|
7,775
|
|
$
|
5,145
|
|
(1)
|
$
|
124
|
|
(4)
|
$
|
(276
|
)
|
(5)
|
$
|
12,768
|
|
||||
|
(1)
|
Valuation allowance recorded in the provision for income taxes for certain net operating losses and tax credits. The net decrease in allowance in 2014 and 2013 primarily relates to the use of net operating loss carryforwards.
|
|
(2)
|
Accounts written off.
|
|
(3)
|
Balance recorded as a part of our 2014 acquisition of Centro de Construcción de Cardioestimuladores del Uruguay and our 2012 acquisition of NeuroNexus Technologies, Inc.
|
|
(4)
|
Includes foreign currency translation effect.
|
|
(5)
|
Primarily relates to return to provision adjustments for prior years.
|
Schedules not listed above have been omitted because the information required to be set forth therein is not applicable or is shown in the financial statements or notes thereto.
|
3.
|
Exhibits required by Item 601 of Regulation S-K. The exhibits listed on the Exhibit Index of this Annual Report on Form 10-K have been previously filed, are filed herewith or are incorporated herein by reference to other filings.
|
-
102
-
SIGNATURES
Pursuant to the requirements of Sections 13 or 15(d) of the Securities Exchange Act of 1934, the registrant has duly caused this report to be signed on its behalf by the undersigned, thereunto duly authorized.
|
Dated:
|
March 3, 2015
|
By
|
/s/ Thomas J. Hook
|
|
Thomas J. Hook (Principal Executive Officer)
|
|||
|
President and Chief Executive Officer
|
|||
Pursuant to the requirements of the Securities Exchange Act of 1934, this report has been signed below by the following persons on behalf of the registrant and in the capacities and on the date indicated.
|
Signature
|
Title
|
Date
|
||
|
/s/ Thomas J. Hook
|
President, Chief Executive
Officer and Director
(Principal Executive Officer)
|
March 3, 2015
|
||
|
Thomas J. Hook
|
||||
|
/s/ Michael Dinkins
|
Executive Vice President and Chief Financial Officer (Principal Financial Officer)
|
March 3, 2015
|
||
|
Michael Dinkins
|
||||
|
/s/ Thomas J. Mazza
|
Vice President and Corporate Controller (Principal Accounting Officer)
|
March 3, 2015
|
||
|
Thomas J. Mazza
|
||||
|
/s/ Bill R. Sanford
|
Chairman
|
March 3, 2015
|
||
|
Bill R. Sanford
|
||||
|
/s/ Pamela G. Bailey
|
Director
|
March 3, 2015
|
||
|
Pamela G. Bailey
|
||||
|
/s/ Anthony P. Bihl III
|
Director
|
March 3, 2015
|
||
|
Anthony P. Bihl III
|
||||
|
/s/ Joseph W. Dziedzic
|
Director
|
March 3, 2015
|
||
|
Joseph W. Dziedzic
|
||||
|
/s/ Dr. Joseph A. Miller, Jr.
|
Director
|
March 3, 2015
|
||
|
Dr. Joseph A. Miller, Jr.
|
||||
|
/s/ Peter H. Soderberg
|
Director
|
March 3, 2015
|
||
|
Peter H. Soderberg
|
||||
|
/s/ William B. Summers, Jr.
|
Director
|
March 3, 2015
|
||
|
William B. Summers, Jr.
|
||||
-
103
-
EXHIBIT INDEX
|
EXHIBIT
NUMBER
|
DESCRIPTION
|
|
|
3.1
|
Amended and Restated Certificate of Incorporation, as amended (incorporated by reference to Exhibit 3.1 to our Quarterly Report on Form 10-Q for the period ended June 27, 2008).
|
|
|
3.2
|
Amended and Restated Bylaws (incorporated by reference to Exhibit 3.2 to our Annual Report on Form 10-K for the year ended January 1, 2010).
|
|
|
10.1#
|
1998 Stock Option Plan (including form of “standard” option agreement, form of “special” option agreement and form of “non-standard” option agreement) (incorporated by reference to Exhibit 10.2 to our Registration Statement on Form S-1 filed on May 22, 2000 (File No. 333-37554)).
|
|
|
10.2#
|
Amendment to Greatbatch, Inc. 1998 Stock Option Plan (incorporated by reference to Exhibit 10.2 to our Annual Report on Form 10-K for the period ended January 3, 2014).
|
|
|
10.3#
|
Non-Employee Director Stock Incentive Plan (incorporated by reference to Exhibit A to our Definitive Proxy Statement on Schedule 14-A filed on April 22, 2002).
|
|
|
10.4#
|
Greatbatch, Inc. Executive Short Term Incentive Compensation Plan (incorporated by reference to Exhibit A to our Definitive Proxy Statement on Schedule 14-A filed on April 20, 2012).
|
|
|
10.5
|
License Agreement dated August 8, 1996, between Greatbatch Ltd. and Evans Capacitor Company (incorporated by reference to Exhibit 10.23 to our Registration Statement on Form S-1 filed on May 22, 2000 (File No. 333-37554)).
|
|
|
10.6+
|
Amendment No. 2 dated December 6, 2002, between Greatbatch Technologies, Ltd. and Evans Capacitor Company (incorporated by reference to Exhibit 10.18 to our Annual Report on Form 10-K for the year ended January 3, 2003).
|
|
|
10.7#
|
Form of Change of Control Agreement between Greatbatch, Inc. and its executive officers (Thomas J. Hook, Mauricio Arellano, and Timothy G. McEvoy) (incorporated by reference to Exhibit 10.1 to our Quarterly Report on Form 10-Q for the period ended July 1, 2011).
|
|
|
10.8#
|
Form of Change of Control Agreement between Greatbatch, Inc. and its executive officers (Michael Dinkins, Andrew P. Holman, George M. Cintra, and Thomas K. Hickman) (incorporated by reference to Exhibit 10.8 to our Annual Report on Form 10-K for the year ended December 28, 2012).
|
|
|
10.9
|
Second Amended and Restated Credit Agreement dated September 20, 2013 by and among Greatbatch Ltd., the lenders party thereto and Manufacturers and Traders Trust Company, as administrative agent, Bank of America, N.A., as syndication agent and RBS Citizens, N.A. and Wells Fargo Bank, National Association, as co-documentation agents (incorporated by reference to Exhibit 10.1 to our Current Report on Form 8-K filed on September 23, 2013).
|
|
|
10.10#
|
Employment Agreement dated August 5, 2013 between Greatbatch, Inc. and Thomas J. Hook (incorporated by reference to Exhibit 10.1 to our Current Report on Form 8-K filed on August 9, 2013).
|
|
|
10.11#
|
2005 Stock Incentive Plan (incorporated by reference to Exhibit B to our Definitive Proxy Statement on Schedule 14A filed on April 20, 2007).
|
|
|
10.12#
|
2009 Stock Incentive Plan (incorporated by reference to Exhibit A to our Definitive Proxy Statement on Schedule 14A filed on April 13, 2009).
|
|
|
10.13#
|
2011 Stock Incentive Plan (incorporated by reference to Exhibit A to our Definitive Proxy Statement on Schedule 14A filed on April 14, 2014).
|
|
|
10.14#
|
Amendment to Greatbatch, Inc. 2011 Stock Incentive Plan, Greatbatch, Inc. 2009 Stock Incentive Plan, Greatbatch, Inc. 2005 Stock Incentive Plan (incorporated by reference to Exhibit 10.14 to our Annual Report on Form 10-K for the year ended January 3, 2014).
|
|
-
104
-
|
EXHIBIT
NUMBER
|
DESCRIPTION
|
|
|
10.15#
|
Form of Restricted Stock Award Letter (incorporated by reference to Exhibit 10.15 to our Annual Report on Form 10-K for the year ended January 3, 2014).
|
|
|
10.16#
|
Form of Performance-Based Restricted Stock Units Award Letter (incorporated by reference to Exhibit 10.16 to our Annual Report on Form 10-K for the year ended January 3, 2014).
|
|
|
10.17#
|
Form of Nonqualified Option Award Letter (incorporated by reference to Exhibit 10.17 to our Annual Report on Form 10-K for the year ended January 3, 2014).
|
|
|
10.18#
|
Form of Time-Based Restricted Stock Units Award Letter (incorporated by reference to Exhibit 10.18 to our Annual Report on Form 10-K for the year ended January 3, 2014).
|
|
|
10.19#
|
Separation Agreement and Acknowledgment effective January 3, 2015 between Greatbatch, Inc. and Michelle Graham (incorporated by reference to Exhibit 10.1 to our Quarterly Report on Form 10-Q for the period ended October 3, 2014).
|
|
|
12.1*
|
Ratio of Earnings to Fixed Charges (Unaudited)
|
|
|
21.1*
|
Subsidiaries of Greatbatch, Inc.
|
|
|
23.1*
|
Consent of Independent Registered Public Accounting Firm
|
|
|
31.1*
|
Certification of Chief Executive Officer pursuant to Rule 13a-14(a) of the Securities Exchange Act.
|
|
|
31.2*
|
Certification of Chief Financial Officer pursuant to Rule 13a-14(a) of the Securities Exchange Act.
|
|
|
32.1**
|
Certification of Chief Executive Officer and Chief Financial Officer pursuant to 18 U.S.C. Section 1350 as adopted pursuant to Section 906 of the Sarbanes-Oxley Act of 2002.
|
|
|
101.INS*
|
XBRL Instance Document
|
|
|
101.SCH*
|
XRBL Taxonomy Extension Schema Document
|
|
|
101.CAL*
|
XBRL Taxonomy Extension Calculation Linkbase Document
|
|
|
101.LAB*
|
XBRL Taxonomy Extension Labels Linkbase Document
|
|
|
101.PRE*
|
XBRL Taxonomy Extension Presentation Linkbase Document
|
|
|
101.DEF*
|
XBRL Taxonomy Extension Definition Linkbase Document
|
|
Portions of those exhibits marked “+” have been omitted and filed separately with the Securities and Exchange Commission pursuant to a request for confidential treatment.
|
* -
|
Filed herewith.
|
|
** -
|
Furnished herewith.
|
|
# -
|
Indicates exhibits that are management contracts or compensation plans or arrangements required to be filed pursuant to Item 15(b) of Form 10-K.
|
-
105
-
TABLE OF CONTENTS
Part IItem 1. BusinessItem 1A. Risk FactorsItem 1B. Unresolved Staff CommentsItem 2. PropertiesItem 3. Legal ProceedingsItem 4. Mine Safety DisclosuresPart IIItem 5. Market For Registrant S Common Equity, Related Stockholder Matters and Issuer Purchases Of Equity SecuritiesItem 6. Selected Financial DataItem 7. Management S Discussion and Analysis Of Financial Condition and Results Of OperationsItem 7A. Quantitative and Qualitative Disclosures About Market RiskItem 8. Financial Statements and Supplementary DataNote 12 Research, Development and Engineering Costs, Net Contains Additional Information on The Company S Rd&e ActivitiesItem 9. Changes in and Disagreements with Accountants on Accounting and Financial DisclosureItem 9A. Controls and ProceduresItem 9B. Other InformationPart IIIItem 10. Directors, Executive Officers and Corporate GovernanceItem 11. Executive CompensationItem 12. Security Ownership Of Certain Beneficial Owners and Management and Related Stockholder MattersItem 13. Certain Relationships and Related Transactions, and Director IndependenceItem 14. Principal Accounting Fees and ServicesPart IVItem 15. Exhibits, Financial Statement Schedules