|
|
|
|
|
|
|
|
|
|
|
|
|
|
|
|
|
|
|
|
|
|
|
|
|
|
|
|
|
|
|
|
|
|
|
|
|
|
|
|
|
|
|
|
|
|
|
|
|
|
|
|
|
|
|
|
Table of Contents
UNITED STATES
SECURITIES AND EXCHANGE COMMISSION
Washington, D.C. 20549
FORM 10-K
| x |
ANNUAL REPORT PURSUANT TO SECTION 13 OR 15(d) OF THE SECURITIES EXCHANGE ACT OF 1934 |
For the fiscal year ended December 31, 2010
OR
| ¨ |
TRANSITION REPORT PURSUANT TO SECTION 13 OR 15(d) OF THE SECURITIES EXCHANGE ACT OF 1934 |
For the transition period from to
Commission file number 000-22418
ITRON, INC.
(Exact name of registrant as specified in its charter)
| Washington | 91-1011792 | |
| (State of Incorporation) | (I.R.S. Employer Identification Number) |
2111 N Molter Road, Liberty Lake, Washington 99019
(509) 924-9900
(Address and telephone number of registrant’s principal executive offices)
Securities registered pursuant to Section 12(b) of the Act:
|
Title of each class |
Name of each exchange on which registered |
|
| Common stock, no par value | NASDAQ Global Select Market | |
| Preferred share purchase rights | NASDAQ Global Select Market |
Securities registered pursuant to Section 12(g) of the Act: None
Indicate by check mark if the registrant is a well-known seasoned issuer, as defined in Rule 405 of the Securities Act. Yes x No ¨
Indicate by check mark if the registrant is not required to file reports pursuant to Section 13 or Section 15(d) of the Act. Yes ¨ No x
Indicate by check mark whether the registrant (1) has filed all reports required to be filed by Section 13 or 15(d) of the Securities Exchange Act of 1934 during the preceding 12 months (or for such shorter period that the registrant was required to file such reports), and (2) has been subject to such filing requirements for the past 90 days. Yes x No ¨
Indicate by check mark whether the registrant has submitted electronically and posted on its corporate Web site, if any, every Interactive Data File required to be submitted and posted pursuant to Rule 405 of Regulation S-T (§ 232.405 of this chapter) during the preceding 12 months (or for such shorter period that the registrant was required to submit and post such files). Yes x No ¨
Indicate by check mark if disclosure of delinquent filers pursuant to Item 405 of Regulation S-K (§ 229.405 of this chapter) is not contained herein, and will not be contained, to the best of registrant’s knowledge, in definitive proxy or information statements incorporated by reference in Part III of this Form 10-K or any amendment to this Form 10-K. x
Indicate by check mark whether the registrant is a large accelerated filer, an accelerated filer, a non-accelerated filer, or a smaller reporting company. See the definitions of “large accelerated filer,” “accelerated filer” and “smaller reporting company” in Rule 12b-2 of the Exchange Act.
|
Large accelerated filer x |
Accelerated filer ¨ | |
|
Non-accelerated filer ¨ (Do not check if a smaller reporting company) |
Smaller reporting company ¨ |
Indicate by check mark whether the registrant is a shell company (as defined in Rule 12b-2 of the Act). Yes ¨ No x
As of June 30, 2010 (the last business day of the registrant’s most recently completed second fiscal quarter), the aggregate market value of the shares of common stock held by non-affiliates of the registrant (based on the closing price for the common stock on the NASDAQ Global Select Market) was $2,495,975,576.
As of January 31, 2011, there were outstanding 40,509,260 shares of the registrant’s common stock, no par value, which is the only class of common stock of the registrant.
DOCUMENTS INCORPORATED BY REFERENCE
The information called for by Part III is incorporated by reference to the definitive Proxy Statement for the Annual Meeting of Shareholders of the Company to be held on May 3, 2011.
Table of Contents
Itron, Inc.
| Page | ||||||
|
PART I |
||||||
| 1 | ||||||
| 5 | ||||||
| 13 | ||||||
| 13 | ||||||
| 13 | ||||||
| 13 | ||||||
|
PART II |
||||||
| 14 | ||||||
| 16 | ||||||
|
ITEM 7: MANAGEMENT’S DISCUSSION AND ANALYSIS OF FINANCIAL CONDITION AND RESULTS OF OPERATIONS |
17 | |||||
|
ITEM 7A: QUANTITATIVE AND QUALITATIVE DISCLOSURES ABOUT MARKET RISK |
30 | |||||
| 32 | ||||||
| 34 | ||||||
| 35 | ||||||
| 36 | ||||||
| 37 | ||||||
| 38 | ||||||
|
ITEM 9: CHANGES IN AND DISAGREEMENTS WITH ACCOUNTANTS ON ACCOUNTING AND FINANCIAL DISCLOSURE |
81 | |||||
| 81 | ||||||
| 82 | ||||||
|
PART III |
||||||
|
ITEM 10: DIRECTORS, EXECUTIVE OFFICERS AND CORPORATE GOVERNANCE |
83 | |||||
| 83 | ||||||
| 83 | ||||||
|
ITEM 13: CERTAIN RELATIONSHIPS AND RELATED TRANSACTIONS AND DIRECTOR INDEPENDENCE |
83 | |||||
| 83 | ||||||
|
PART IV |
||||||
| 84 | ||||||
| 87 | ||||||
| 88 | ||||||
Table of Contents
In this Annual Report on Form 10-K, the terms “we,” “us,” “our,” “Itron” and the “Company” refer to Itron, Inc.
Certain Forward-Looking Statements
This document contains forward-looking statements concerning our operations, financial performance, revenues, earnings growth, liquidity, and other items. This document reflects our current plans and expectations and is based on information currently available as of the date of this Annual Report on Form 10-K. When we use the words “expect,” “intend,” “anticipate,” “believe,” “plan,” “project,” “estimate,” “future,” “objective,” “may,” “will,” “will continue,” and similar expressions, they are intended to identify forward-looking statements. Forward-looking statements rely on a number of assumptions and estimates. These assumptions and estimates could be inaccurate and cause our actual results to vary materially from expected results. Risks and uncertainties include 1) the rate and timing of customer demand for our products, 2) rescheduling or cancellations of current customer orders and commitments, 3) competition, 4) changes in estimated liabilities for product warranties and/or litigation, 5) our dependence on customers’ acceptance of new products and their performance, 6) changes in domestic and international laws and regulations, 7) future business combinations, 8) changes in estimates for stock-based compensation and pension costs, 9) changes in foreign currency exchange rates and interest rates, 10) international business risks, 11) our own and our customers’ or suppliers’ access to and cost of capital, and 12) other factors. You should not solely rely on these forward-looking statements as they are only valid as of the date of this Annual Report on Form 10-K. We do not have any obligation to publicly update or revise any forward-looking statement in this document. For a more complete description of these and other risks, refer to Item 1A: “Risk Factors” included in this Annual Report on Form 10-K.
Available Information
Documents we provide to the Securities and Exchange Commission (SEC) are available free of charge under the Investors section of our website at www.itron.com as soon as practicable after they are filed with or furnished to the SEC. In addition, these documents are available at the SEC’s website (http:// www.sec.gov ) and at the SEC’s Headquarters at 100 F Street, NE, Washington, DC 20549, or by calling 1-800-SEC-0330.
General
Itron is a technology company dedicated to delivering end-to-end smart metering solutions to electric, natural gas, and water utilities around the world. Our smart metering solutions, meter data management software, and knowledge application solutions bring additional value to a utility’s metering and grid systems. Our professional services help our customers project-manage, install, implement, operate, and maintain their systems.
We were incorporated in 1977. In 2004, we entered the electricity meter manufacturing business with the acquisition of Schlumberger Electricity Metering. In 2007, we expanded our presence in global meter manufacturing and systems with the acquisition of Actaris Metering Systems SA (Actaris).
The following is a discussion of our major products, our markets, and our operating segments. Refer to Item 7: “Management’s Discussion and Analysis of Financial Condition and Results of Operations” included in this Annual Report on Form 10-K for specific segment results.
Our Business
Our offerings include electricity, natural gas, and water metering systems, software, and services. We classify metering systems into three categories: standard metering, advanced metering systems and technology, and smart metering systems and technology. These categories are described in more detail below:
Standard Metering
A standard meter measures electricity, natural gas, or water by mechanical, electromechanical, or electronic means, with no built-in remote-reading communication capability. Standard meters require manual reading, which is typically performed by a utility representative or meter reading service provider. Worldwide, we produce standard residential, commercial and industrial (C&I), and transmission and distribution (T&D) electricity, natural gas, and water meters.
1
Table of Contents
Advanced Metering Systems and Technology
Advanced metering uses a communication module embedded in the meter to collect and store detailed meter data, which is transmitted to handheld computers, mobile units, and/or fixed networks, allowing utilities to collect the data for billing systems and analyze the meter data for more efficient resource management and streamlined operations. Worldwide, we produce electricity, natural gas, and water advanced metering systems and technology. Depending on the country, communication technologies include telephone, RF (radio frequency), GSM (Global System for Mobile communications), PLC (power line carrier), and Ethernet devices.
Smart Metering Systems and Technology
Smart meters initiate and respond to two-way communications with the utility to automatically collect and transmit meter data frequently to support various applications beyond monthly billings. Our smart metering solutions also have substantially more features and functions than our advanced metering systems and technology. Smart meters are able to send and receive detailed data, collect and store interval data, and interface with other devices, such as in-home displays, smart thermostats and appliances, home area networks, advanced control systems, and more.
Bookings and Backlog of Orders
Bookings for a reported period represent customer contracts and purchase orders received during the period that have met certain regulatory and/or contractual conditions. Total backlog represents committed but undelivered contracts and purchase orders at period-end. Twelve-month backlog represents the portion of total backlog that we estimate will be recognized as revenue over the next 12 months. Backlog is not a complete measure of our future business as we have significant book-and-ship orders. Bookings and backlog may fluctuate significantly due to the timing of large project awards. In addition, annual or multi-year contracts are subject to rescheduling and cancellation by customers due to the long-term nature of the contracts. Beginning total backlog, plus bookings, minus revenues, will not equal ending total backlog due to miscellaneous contract adjustments, foreign currency fluctuations, and other factors. Information on bookings and backlog is summarized as follows:
|
Year Ended |
Annual Bookings | Total Backlog | 12-Month Backlog | |||||||||
| (in millions) | ||||||||||||
|
December 31, 2010 |
$ | 2,396 | $ | 1,620 | $ | 913 | ||||||
|
December 31, 2009 |
$ | 1,849 | $ | 1,488 | $ | 807 | ||||||
|
December 31, 2008 |
$ | 2,543 | $ | 1,309 | $ | 418 | ||||||
Our Operating Segments
We operate under the Itron brand worldwide. Our operating segments as of December 31, 2010 are Itron North America and Itron International. Itron North America generates the majority of its revenues in the United States and Canada. Itron International generates the majority of its revenues in Europe, and the balance primarily in South America and Asia/Pacific.
Sales and Distribution
We use a combination of direct and indirect sales channels in both Itron North America and Itron International. A direct sales force is utilized for the largest electric, natural gas, and water utilities, with which we have long-established relationships. For smaller utilities, we typically use an indirect sales force that consists of distributors, representative agencies, partners, and meter manufacturer representatives.
One customer, Southern California Edison, of our Itron North America operating segment, represented 11% of total Company revenues for the year ended December 31, 2010. No single customer represented more than 10% of total revenues for each of the two years ended December 31, 2009 and 2008. Our 10 largest customers in each of the years ended December 31, 2010, 2009, and 2008 accounted for approximately 34%, 17%, and 15%, of total revenues, respectively.
Raw Materials
Our products require a wide variety of components and materials. Although we have multiple sources of supply for most of our material requirements, certain components and raw materials are supplied by sole-source vendors, and our ability to perform certain contracts depends on the availability of these materials. Refer to Item 1A: “Risk Factors”, included in this Annual Report on Form 10-K, for further discussion related to risks.
2
Table of Contents
Product Development
Our product development is focused on both improving existing technology and developing next-generation technology for electricity, natural gas, water, and heat meters, data collection software, communications technologies, data warehousing, and knowledge application solutions. We spent approximately $140 million, $122 million, and $121 million on product development in 2010, 2009, and 2008, which represented 6%, 7%, and 6% of total revenues in those respective years.
Workforce
As of December 31, 2010, we had approximately 9,500 people in our workforce, including permanent and temporary employees and contractors. We have not experienced any work stoppages and consider our employee relations to be good.
Competition
We provide a broad portfolio of products, systems, and services to customers in the utility industry and have a large number of competitors who offer similar products, systems, and services. We believe that our competitive advantage is based on our ability to provide complete end-to-end integrated solutions, our established customer relationships, and our track record of delivering reliable, accurate, and long-lived products and services. Refer to Item 1A: “Risk Factors” included in this Annual Report on Form 10-K for a discussion of the competitive pressures we face.
Our primary competitors include the following:
|
Badger Meter, Inc. |
Emerson Electric Co. | OSIsoft, LLC | ||
|
Cooper Industries plc |
eMeter Corporation | Pietro Fiorentini S.p.A. | ||
|
Datamatic, Ltd. |
ESCO Technologies Inc. | Roper Industries, Inc. | ||
|
Diehl Group |
General Electric Company | Sensus | ||
|
Dresser, Inc. |
Jiangxi Sanchuan Water Meter Co Ltd. | Silver Spring Networks | ||
|
Echelon Corporation |
Landis+Gyr AG | SmartSynch, Inc. | ||
|
Ecologic Analytics, LLC |
Master Meter, Inc. | Telvent GIT, S.A. | ||
|
El Sewedy Electric Company |
Ningbo Water Meter Co., Ltd. | Trilliant Incorporated | ||
|
Elster Group S.E. |
Oracle Corporation |
Strategic Alliances
We pursue strategic alliances with other companies in areas where collaboration can produce product advancement and acceleration of entry into new markets. The objectives and goals of a strategic alliance can include one or more of the following: technology exchange, product development, joint sales and marketing, or access to new geographic markets. Refer to Item 1A: “Risk Factors” included in this Annual Report on Form 10-K for a discussion of risks associated with strategic alliances.
Intellectual Property
Our patents and patent applications cover a range of technologies, which relate to standard metering, advanced metering systems and technology, smart metering systems and technology, meter data management software, and knowledge application solutions. We also rely on a combination of copyrights and trade secrets to protect our products and technologies. We have registered trademarks for most of our major product lines in the United States and many international countries.
Disputes over the ownership, registration, and enforcement of intellectual property rights arise in the ordinary course of our business. While we believe patents and trademarks are important to our operations and in the aggregate constitute valuable assets, no single patent or trademark, or group of patents or trademarks, is critical to the success of our business. We license some of our technology to other companies, some of which are our competitors.
Environmental Regulations
In the ordinary course of our business we use metals, solvents, and similar materials that are stored on-site. We believe we are in compliance with environmental laws, rules, and regulations applicable to the operation of our business.
3
Table of Contents
MANAGEMENT
Set forth below are the names, ages, and titles of our executive officers as of February 16, 2011.
|
Name |
Age |
Position |
||
|
Malcolm Unsworth |
61 | President and Chief Executive Officer | ||
|
Steven M. Helmbrecht |
48 | Sr. Vice President and Chief Financial Officer | ||
|
John W. Holleran |
56 | Sr. Vice President, General Counsel and Corporate Secretary | ||
|
Philip C. Mezey |
51 | Sr. Vice President and Chief Operating Officer - Itron North America | ||
|
Marcel Regnier |
54 | Sr. Vice President and Chief Operating Officer - Itron International | ||
|
Jared P. Serff |
43 | Vice President, Competitive Resources | ||
Malcolm Unsworth is President and Chief Executive Officer, and a member of our Board of Directors. Mr. Unsworth joined Itron in July 2004 as Sr. Vice President, Hardware Solutions, upon our acquisition of Schlumberger’s electricity metering business. In 2007, following our acquisition of Actaris (now known as Itron International), he was promoted to Sr. Vice President and Chief Operating Officer – Itron International. Mr. Unsworth was appointed President and Chief Operating Officer of Itron in April 2008, and promoted to President and Chief Executive Officer effective March 2009. Mr. Unsworth was elected to the Board of Directors in December 2008.
Steve Helmbrecht is Sr. Vice President and Chief Financial Officer. Mr. Helmbrecht joined Itron in 2002 as Vice President and General Manager, International, and was named Sr. Vice President and Chief Financial Officer in 2005. Previously, Mr. Helmbrecht was Chief Financial Officer of LineSoft Corporation, acquired by Itron in 2002.
John Holleran is Sr. Vice President, General Counsel, and Corporate Secretary. Mr. Holleran joined Itron in January 2007. In 2006, Mr. Holleran was associated with Holleran Law Offices PLLC, and in 2005 was Executive Vice President, Administration, and Chief Legal Officer for Boise Cascade, LLC, the paper and forest products company resulting from the reorganization of Boise Cascade Corporation, in 2004. While with Boise Cascade Corporation, Mr. Holleran most recently served as Sr. Vice President, Human Resources, and General Counsel.
Philip Mezey is Sr. Vice President and Chief Operating Officer - Itron North America. Mr. Mezey joined Itron in March 2003 as Managing Director of Software Development for Itron’s Energy Management Solutions Group with Itron’s acquisition of Silicon Energy Corp. Mr. Mezey was promoted to Group Vice President and Manager of Software Solutions in 2004. In 2005, Mr. Mezey became Sr. Vice President Software Solutions and was promoted to his current position in 2007.
Marcel Regnier is Sr. Vice President and Chief Operating Officer - Itron International. Mr. Regnier joined Itron in April 2007 as part of our acquisition of Actaris. Mr. Regnier served as Actaris’ Managing Director of its water and heat business unit from 2001, when Actaris was created as a result of the reorganization of Schlumberger’s operations, until April 2008, when he was promoted to his current position.
Jared Serff is Vice President, Competitive Resources. Mr. Serff joined Itron in July 2004 upon our acquisition of Schlumberger’s electricity metering business. Mr. Serff spent six years with Schlumberger, the last four of which were as Director of Human Resources with Schlumberger’s electricity metering business where he was in charge of personnel for all locations in Canada, Mexico, France, Taiwan, and the United States.
4
Table of Contents
We are dependent on the utility industry, which has experienced volatility in capital spending.
We derive the majority of our revenues from sales of products and services to utilities. Purchases of our products may be deferred as a result of many factors including economic downturns, slowdowns in new residential and commercial construction, customers’ access to capital at acceptable terms, utility specific financial circumstances, mergers and acquisitions, regulatory decisions, weather conditions, and rising interest rates. We have experienced, and may in the future experience, variability in operating results on an annual and a quarterly basis as a result of these factors.
Utility industry sales cycles can be lengthy and unpredictable.
The utility industry is subject to substantial government regulation. Regulations have often influenced the frequency of meter replacements. Sales cycles for standalone meter products have typically been based on annual or bi-annual bid-based agreements. Utilities place purchase orders against these agreements as their inventories decline, which can create fluctuations in our sales volumes.
Sales cycles for advanced and smart metering systems are generally long and unpredictable due to several factors, including budgeting, purchasing, and regulatory approval processes that can take several years to complete. Our utility customers typically issue requests for quotes and proposals, establish evaluation committees, review different technical options with vendors, analyze performance and cost/benefit justifications, and perform a regulatory review, in addition to applying the normal budget approval process within a utility. Today, governments around the world are implementing new laws and regulations to promote increased energy efficiency, slow or reverse growth in the consumption of scarce resources, reduce carbon dioxide emissions, and protect the environment. Many of the legislative and regulatory initiatives encourage utilities to develop a smart grid infrastructure, and some of these initiatives provide for government subsidies, grants, or other incentives to utilities and other participants in their industry to promote transition to smart grid technologies.
Section 1252 of the U.S. Energy Policy Act of 2005 requires electric utilities to consider offering their customers time-based rates. The Act also directs these utilities and state utility commissions to study and evaluate methods for implementing demand response, to shift consumption away from peak hours, and to improve power generation.
The European Union has issued the EU Energy Package, which includes directives and regulations intended to strengthen consumer rights and protection in the EU energy market. The EU’s 20-20-20 goals include a 20% increase in energy efficiency, a 20% reduction of carbon dioxide emissions compared with 1990 levels, and producing 20% of its energy from renewable sources by 2020. The package requires EU Member States to ensure the implementation of smart metering systems and outlines deployment by 2022, with 80% of electric consumers equipped with smart metering systems by 2020.
While we believe these initiatives will provide opportunities for sales of our products, the pace at which these markets will grow is unknown due to the timing of legislation, regulatory approvals related to the deployment of new technology, capital budgets of the utilities, and purchasing decisions by our customers. If government regulations regarding the smart grid and smart metering are delayed, revised to permit lower or different investment levels in metering infrastructure, or terminated altogether, this could have a material adverse effect on our results of operation, cash flow, and financial condition.
We are subject to international business uncertainties, obstacles to the repatriation of earnings, and foreign currency fluctuations.
A substantial portion of our revenues is derived from operations conducted outside the United States. International sales and operations may be subjected to risks such as the imposition of government controls, government expropriation of facilities, lack of a well-established system of laws and enforcement of those laws, access to a legal system free of undue influence or corruption, political instability, terrorist activities, restrictions on the import or export of critical technology, currency exchange rate fluctuations, adverse tax burdens, availability of qualified third-party financing, generally longer receivable collection periods than those commonly practiced in the United States, trade restrictions, changes in tariffs, labor disruptions, difficulties in staffing and managing international operations, difficulties in imposing and enforcing operational and financial controls at international locations potential insolvency of international distributors, burdens of complying with different permitting standards and a wide variety of foreign laws, and obstacles to the repatriation of earnings and cash. Fluctuations in the value of international currencies may impact our operating results due to the translation to the U.S. dollar as well as our ability to compete in international markets. International expansion and market acceptance depend on our ability to modify our technology to take into account such factors as the applicable regulatory and business environment, labor costs, and other economic conditions. In addition, the laws of certain countries do not protect our products or technologies in the same manner as the laws of the United States. There can be no assurance that these factors will not
5
Table of Contents
have a material adverse effect on our future international sales and, consequently, on our business, financial condition, and results of operations.
We depend on our ability to develop new competitive products.
Our future success will depend, in part, on our ability to continue to design and manufacture new competitive products and to enhance and sustain our existing products, keep pace with technological advances and changing customer requirements, gain international market acceptance, and manage other factors in the markets in which we sell our products. Product development will require continued investment in order to maintain our market position. We may not have the necessary capital, or access to capital at acceptable terms, to make these investments. We have made, and expect to continue to make, substantial investments in technology development. However, we may experience unforeseen problems in the development or performance of our technologies or products. In addition, we may not meet our product development schedules. New products often require certifications or regulatory approvals before the products can be used and we cannot be certain that our new products will be approved in a timely manner. Finally, we may not achieve market acceptance of our new products and services.
We may face product-failure exposure.
We provide product warranties for varying lengths of time and establish allowances in anticipation of warranty expenses. In addition, we record contingent liabilities for additional product-failure related costs. These warranty and related product-failure allowances may be inadequate due to undetected product defects, unanticipated component failures, as well as changes in various estimates for material, labor, and other costs we may incur to replace projected product failures. As a result, we may incur additional warranty and related expenses in the future with respect to new or established products. Systems that we sell could fail to perform as intended, resulting in potentially substantial claims against us that could materially and adversely affect our financial position. We sell vending and pre-payment systems with security features that if compromised, may lead to claims against us, which could materially and adversely affect our financial position.
Business interruptions could adversely affect our business.
Our worldwide operations could be subject to hurricanes, tornados, earthquakes, floods, fires, extreme weather conditions, medical epidemics or pandemics, or other natural or manmade disasters or business interruptions. The occurrence of any of these business disruptions could seriously harm our business, financial condition, and results of operations.
Our key manufacturing facilities are concentrated and in the event of a significant interruption in production at any of our manufacturing facilities, considerable expense, time, and effort could be required to establish alternative production lines to meet contractual obligations, which would have a material adverse effect on our business, financial condition, and results of operations.
We are facing increasing competition.
We face competitive pressures from a variety of companies in each of the markets we serve. Some of our present and potential future competitors have, or may have, substantially greater financial, marketing, technical, or manufacturing resources and, in some cases, have greater name recognition and experience. Some competitors may enter markets we serve and sell products at lower prices in order to grow market share. Our competitors may be able to respond more quickly to new or emerging technologies and changes in customer requirements. They may also be able to devote greater resources to the development, promotion, and sale of their products and services than we can. Some competitors have made, and others may make, strategic acquisitions or establish cooperative relationships among themselves or with third parties that enhance their ability to address the needs of our prospective customers. It is possible that new competitors or alliances among current and new competitors may emerge and rapidly gain significant market share. Other companies may also drive technological innovation and develop products that are equal in quality and performance or superior to our products, which could put pressure on our market position, reduce our overall sales, and require us to invest additional funds in new technology development. In addition, there is a risk that low-cost providers will enter, or form alliances or cooperative relationships with our competitors, thereby contributing to future price erosion. Some of our products and services may become commoditized and we may have to adjust the prices of some of our products to stay competitive. Should we fail to compete successfully with current or future competitors, we could experience material adverse effects on our business, financial condition, results of operations, and cash flows.
6
Table of Contents
We are affected by the availability and regulation of radio spectrum and interference with the radio spectrum that we use.
A significant number of our products use radio spectrum, which are subject to regulation by the Federal Communications Commission (FCC) in the United States. The FCC may adopt changes to the rules for our licensed and unlicensed frequency bands that are incompatible with our business. In the past, the FCC has adopted changes to the requirements for equipment using radio spectrum, and it is possible that the FCC or the U.S. Congress will adopt additional changes.
Although radio licenses are generally required for radio stations, Part 15 of the FCC’s rules permits certain low-power radio devices (Part 15 devices) to operate on an unlicensed basis. Part 15 devices are designed for use on frequencies used by others. These other users may include licensed users, which have priority over Part 15 users. Part 15 devices cannot cause harmful interference to licensed users and must be designed to accept interference from licensed radio devices. In the United States, our advanced and smart metering systems are typically Part 15 devices that transmit information to (and receive information from, if applicable) handheld, mobile, or fixed network systems pursuant to these rules.
The FCC has initiated a rulemaking proceeding in which it is considering adopting “spectrum etiquette” requirements for unlicensed Part 15 devices operating in the 902-928 MHz band, which many of our advanced and smart metering systems utilize. The outcome of the proceeding may require us to make material changes to our equipment.
The FCC has also adopted service rules governing the use of the 1427-1432 MHz band. We use this band with various devices in our network solutions. Among other things, the rules reserve parts of the band for general telemetry, including utility telemetry, and provide that nonexclusive licenses will be issued in accordance with Part 90 rules and the recommendations of frequency coordinators. Telemetry licensees must comply with power limits and out-of-band emission requirements that are designed to avoid interference with other users of the band. The FCC issues licenses on a nonexclusive basis and it is possible that the demand for spectrum will exceed supply,
Our radio-based products primarily employ unlicensed radio frequencies. We depend upon sufficient radio spectrum to be allocated by the FCC for our intended uses. As to the licensed frequencies, there is some risk that there may be insufficient available frequencies in some markets to sustain our planned operations. The unlicensed frequencies are available for a wide variety of uses and may not be entitled to protection from interference by other users who operate in accordance with FCC rules. The unlicensed frequencies are also often the subject of proposals to the FCC requesting a change in the rules under which such frequencies may be used. If the unlicensed frequencies become crowded to unacceptable levels, restrictive, or subject to changed rules governing their use, our business could be materially adversely affected.
We have committed, and will continue to commit, significant resources to the development of products that use particular radio frequencies. Action by the FCC could require modifications to our products. The inability to modify our products to meet such requirements, the possible delays in completing such modifications, and the cost of such modifications all could have a material adverse effect on our future business, financial condition, and results of operations.
Outside of the United States, certain of our products require the use of RF and are subject to regulations in those jurisdictions where we have deployed such equipment. In some jurisdictions, radio station licensees are generally required to operate a radio transmitter and such licenses may be granted for a fixed term and must be periodically renewed. In other jurisdictions, the rules permit certain low power devices to operate on an unlicensed basis. Our advanced and smart metering systems typically transmit to (and receive information from, if applicable) handheld, mobile, or fixed network reading devices in unlicensed bands pursuant to rules regulating such use. Generally, we use the unlicensed Industrial, Scientific, and Medical (ISM) bands with the various reading devices in our solutions. In Europe, we generally use the 433 MHz and 868 MHz bands. In the rest of the world, we primarily use the 433 MHz and 2.4000-2.4835 GHz bands, as well as other local unlicensed bands. To the extent we introduce new products designed for use in the United States or another country into a new market, such products may require significant modification or redesign in order to meet frequency requirements and other regulatory specifications. In some countries, limitations on frequency availability or the cost of making necessary modifications may preclude us from selling our products in those countries. In addition, new consumer products may create interference with the performance of our products, which could lead to claims against us.
We may face liability associated with alleged adverse health effects from the use of our product.
We may be subject to claims that there are adverse health effects from the radio frequencies utilized in connection with our products. If these claims succeed, our customers could suspend implementation or purchase substitute products, which could cause a loss of sales.
7
Table of Contents
We may be unable to adequately protect our intellectual property.
While we believe that our patents and other intellectual property have significant value, it is uncertain that this intellectual property or any intellectual property acquired or developed by us in the future will provide meaningful competitive advantages. There can be no assurance that our patents or pending applications will not be challenged, invalidated, or circumvented by competitors or that rights granted thereunder will provide meaningful proprietary protection. Moreover, competitors may infringe our patents or successfully avoid them through design innovation. To combat infringement or unauthorized use, we may need to commence litigation, which can be expensive and time-consuming. In addition, in an infringement proceeding a court may decide that a patent or other intellectual property right of ours is not valid or is unenforceable, or may refuse to stop the other party from using the technology or other intellectual property right at issue on the grounds that it is non-infringing or the legal requirements for an injunction have not been met. Policing unauthorized use of our intellectual property is difficult and expensive, and we cannot provide assurance that we will be able to, or have the resources to, prevent misappropriation of our proprietary rights, particularly in countries that do not protect such rights in the same manner as they do in the United States.
A significant portion of our revenue is generated with a limited number of customers.
Historically, our revenues have been concentrated with a limited number of customers, which change over time. The 10 largest customers accounted for 34%, 17%, and 15% of revenues for 2010, 2009, and 2008, respectively. One customer represented 11% of total revenues for the year ended December 31, 2010. No single customer represented more than 10% of total Company revenues for each of the two years ended December 31, 2009 and 2008. We are often a party to large, multi-year contracts that are subject to cancellation or rescheduling by our customers due to many factors, such as extreme, unexpected weather conditions that cause our customers to redeploy resources, convenience, regulatory issues, or possible acts of terrorism. Cancellation or postponement of one or more of these significant contracts could have a material adverse effect on our financial and operating results. In addition, if a large customer contract is not replaced upon its expiration with new business of similar magnitude, our financial and operating results would be adversely affected.
As we enter into agreements related to the deployment of smart metering systems and technology, the value of these contracts is substantially larger than contracts we have had with our customers in the past. These deployments last several years and may exceed the length of prior deployment agreements. The terms and conditions of these smart metering system agreements related to testing, contractual liabilities, warranties, performance, and indemnities can be substantially different than the terms and conditions associated with our previous contracts.
We may face liability associated with the use of products for which patent ownership or other intellectual property rights are claimed.
We may be subject to claims or inquiries regarding alleged unauthorized use of third party’s intellectual property. An adverse outcome in any intellectual property litigation or negotiation could subject us to significant liabilities to third parties, require us to license technology or other intellectual property rights from others, require us to comply with injunctions to cease marketing or the use of certain products or brands, or require us to redesign, re-engineer, or rebrand certain products or packaging, any of which could affect our business, financial condition, and results of operations. If we are required to seek licenses under patents or other intellectual property rights of others, we may not be able to acquire these licenses at acceptable terms, if at all. In addition, the cost of responding to an intellectual property infringement claim, in terms of legal fees, expenses, and the diversion of management resources, whether or not the claim is valid, could have a material adverse effect on our business, financial condition, and results of operations.
If our products potentially infringe the intellectual property rights of others, we may be required to indemnify our customers for any damages they suffer. We generally indemnify our customers with respect to infringement by our products of the proprietary rights of third parties. Third parties may assert infringement claims against our customers. These claims may require us to initiate or defend protracted and costly litigation on behalf of our customers, regardless of the merits of these claims. If any of these claims succeed, we may be forced to pay damages on behalf of our customers or may be required to obtain licenses for the products they use. If we cannot obtain all necessary licenses on commercially reasonable terms, our customers may be forced to stop using our products.
We depend on certain key vendors and components.
Certain of our products, subassemblies, and system components are procured from limited sources. Our reliance on such limited sources involves certain risks, including the possibility of shortages and reduced control over delivery schedules, quality and costs, and our vendors’ access to capital at acceptable terms. Any adverse change in the supply, or price, of these
8
Table of Contents
components could adversely affect our business, financial condition, and results of operations. In addition, we depend on a small number of contract manufacturing vendors for a large portion of our low-volume manufacturing business and all of our repair services for our domestic handheld meter reading units. Should any of these vendors become unable to perform up to their responsibilities, our operations could be materially disrupted.
A number of key personnel are critical to the success of our business.
Our success depends in large part on the efforts of our highly qualified technical and management personnel in all disciplines. The loss of one or more of these employees and the inability to attract and retain qualified replacements could have a material adverse effect on our business.
We may not realize the expected benefits from strategic alliances.
We have several strategic alliances with large and complex organizations and other companies with which we work to offer complementary products and services. There can be no assurance we will realize the expected benefits from these strategic alliances. If successful, these relationships may be mutually beneficial and result in shared growth. However, alliances carry an element of risk because, in most cases, we must both compete and collaborate with the same company from one market to the next. Should our strategic partnerships fail to perform, Itron could experience delays in product development or experience other operational difficulties.
Our acquisitions of and investments in third parties have risks.
We may complete additional acquisitions or make investments in the future, both within and outside of the United States. In order to finance future acquisitions, we may need to raise additional funds through public or private financings, and there are no assurances that such financing would be available at acceptable terms. Acquisitions and investments involve numerous risks such as the diversion of senior management’s attention, unsuccessful integration of the acquired entity’s personnel, operations, technologies, and products, lack of market acceptance of new services and technologies, or difficulties in operating businesses in foreign legal jurisdictions. We may experience difficulties that could affect our internal control over financial reporting, which could create a significant deficiency or material weakness in our overall internal controls under Section 404 of the Sarbanes-Oxley Act of 2002. Failure to properly or adequately address these issues could result in the diversion of management’s attention and resources and materially and adversely impact our ability to manage our business. Impairment of an investment, goodwill, or an intangible asset may also result if these risks were to materialize. For investments in entities that are not wholly owned by Itron, such as joint ventures, a loss of control as defined by U.S. generally accepted accounting principles (GAAP) could result in a significant change in accounting treatment and a change in the carrying value of the entity. There can be no assurances that an acquired business will perform as expected, accomplish our strategic objective, or generate significant revenues, profits, or cash flows. During prior years, we have incurred impairments of noncontrolling interest investments. In addition, acquisitions and investments in third parties may involve the assumption of obligations, significant write-offs, or other charges associated with the acquisition.
Impairment of our intangible assets, long-lived assets, goodwill, or deferred tax assets could result in significant charges that would adversely impact our future operating results.
We have significant intangible assets, long-lived assets, goodwill, and deferred tax assets that are susceptible to valuation adjustments as a result of changes in various factors or conditions.
We assess impairment of amortizable intangible and long-lived assets whenever events or changes in circumstances indicate that the carrying value may not be recoverable. Factors that could trigger an impairment of such assets include the following:
| • |
underperformance relative to projected future operating results; |
| • |
changes in the manner or use of the acquired assets or the strategy for our overall business; |
| • |
negative industry or economic trends; |
| • |
decline in our stock price for a sustained period or decline in our market capitalization below net book value; and |
| • |
changes in our organization or management reporting structure, which could result in additional reporting units, requiring greater aggregation or disaggregation in our analysis by reporting unit and potentially alternative methods/assumptions of estimating fair values. |
We assess the potential impairment of goodwill each year as of October 1. We also assess the potential impairment of goodwill whenever events or changes in circumstances indicate that the carrying value may not be recoverable. Adverse
9
Table of Contents
changes in economic conditions or our operations could affect the assumptions we use to calculate the fair value, which in turn could result in an impairment charge in future periods that would impact our results of operations and financial position in that period. Refer to Item 1: “Management’s Discussion and Analysis of Financial Condition and Results of Operations, Critical Accounting Estimates ” included in this Annual Report on Form 10-K for additional information regarding the results of our October 1, 2010 goodwill impairment assessment.
The realization of our deferred tax assets is supported in part by projections of future taxable income. We provide a valuation allowance based on estimates of future taxable income in the respective taxing jurisdiction and the amount of deferred taxes that are expected to be realizable. If future taxable income is different from that expected, we may not be able to realize some or all of the tax benefit, which could have a material adverse effect on our financial results and cash flows.
We are subject to regulatory compliance.
We are subject to various governmental regulations in all of the jurisdictions in which we conduct business. Failure to comply with current or future regulations could result in the imposition of substantial fines, suspension of production, alteration of our production processes, cessation of operations, or other actions, which could materially and adversely affect our business, financial condition, and results of operations.
Changes in environmental regulations, violations of the regulations, or future environmental liabilities could cause us to incur significant costs and adversely affect our operations.
Our business and our facilities are subject to a number of laws, regulations, and ordinances governing, among other things, the storage, discharge, handling, emission, generation, manufacture, disposal, remediation of, and exposure to toxic or other hazardous substances, and certain waste products. Many of these environmental laws and regulations subject current or previous owners or operators of land to liability for the costs of investigation, removal, or remediation of hazardous materials. In addition, these laws and regulations typically impose liability regardless of whether the owner or operator knew of, or was responsible for, the presence of any hazardous materials and regardless of whether the actions that led to the presence were conducted in compliance with the law. In the ordinary course of our business, we use metals, solvents, and similar materials, which are stored on-site. The waste created by the use of these materials is transported off-site on a regular basis by unaffiliated waste haulers. Many environmental laws and regulations require generators of waste to take remedial actions at, or in relation to, the off-site disposal location even if the disposal was conducted in compliance with the law. The requirements of these laws and regulations are complex, change frequently, and could become more stringent in the future. Failure to comply with current or future environmental regulations could result in the imposition of substantial fines, suspension of production, alteration of our production processes, cessation of operations, or other actions, which could materially and adversely affect our business, financial condition, and results of operations. There can be no assurance that a claim, investigation, or liability will not arise with respect to these activities, or that the cost of complying with governmental regulations in the future will not have a material adverse effect on us.
Our credit facility and the indenture related to our convertible senior subordinated notes limit our ability and the ability of most of our subsidiaries to take certain actions.
Our credit facility and convertible notes place restrictions on our ability and the ability of most of our subsidiaries to, among other things:
|
• incur more debt; |
• pay dividends and make distributions; |
|
|
• make certain investments; |
• incur capital expenditures above a set limit; |
|
|
• redeem or repurchase capital stock; |
• create liens; |
|
|
• enter into transactions with affiliates; |
• enter into sale lease-back transactions; |
|
|
• merge or consolidate; |
• transfer or sell assets. |
Our credit facility contains other customary covenants, including the requirement to meet specified financial ratios. Our ability to borrow under our credit facility will depend on the satisfaction of these covenants. Events beyond our control can affect our ability to meet those covenants. Our failure to comply with obligations under our borrowing arrangements may result in declaration of an event of default. An event of default, if not cured or waived, may permit acceleration of required payments against such indebtedness. We cannot be certain we will be able to remedy any such defaults. If our required payments are accelerated, we cannot be certain that we will have sufficient funds available to pay the indebtedness or that we will have the ability to raise sufficient capital to replace the indebtedness on terms favorable to us or at all. In addition, in the case of an event of default under our secured indebtedness such as our credit facility, the lenders may be permitted to foreclose on our assets securing that indebtedness.
10
Table of Contents
Our credit facility is sensitive to interest rate and foreign currency exchange rate risks that could impact our financial position and results of operations.
Our ability to service our indebtedness is dependent on our ability to generate cash, which is influenced by many factors beyond our control.
Our ability to make payments on or refinance our indebtedness, fund planned capital expenditures, and continue research and development will depend on our ability to generate cash in the future. This is subject to general economic, financial, competitive, legislative, regulatory, and other factors that are beyond our control, including counterparty risks with banks and other financial institutions. We may need to refinance all or a portion of our indebtedness on or before maturity. We cannot provide assurance that we will be able to refinance any of our indebtedness on commercially reasonable terms or at all.
We are exposed to counterparty default risks with our financial institutions and insurance providers.
The financial strength of some depository institutions has diminished as a result of the recent financial crisis, and this trend may continue. If one or more of the depository institutions in which we maintain significant cash balances were to fail, our ability to access these funds might be temporarily or permanently limited, and we could face material liquidity problems and financial losses.
At December 31, 2010, we had outstanding standby letters of credit (LOC’s) of $43.5 million issued under our credit facility’s $240 million multicurrency revolver, resulting in $196.5 million being available for additional borrowings. The lenders of our credit facility consist of several participating financial institutions. Our revolving line of credit allows us to provide LOC’s in support of our obligations for customer contracts and provides additional liquidity, including an option for refinancing our convertible senior subordinated notes. Our convertible notes are classified as current due to the combination of put, call, and conversion options that are part of the terms, including the option of the holder to convert the notes between July 1, 2011 and August 1, 2011. If our lenders are not able to honor their line of credit commitments due to the loss of a participating financial institution or other circumstance, we would need to seek alternative financing, which may not be under acceptable terms, and therefore could adversely impact our ability to successfully bid on future sales contracts and adversely impact our liquidity and ability to fund some of our internal initiatives or future acquisitions.
As of December 31, 2010, approximately 93% of our outstanding term loans were at fixed London Interbank Offered Rate (LIBOR) rates as a result of interest rate swaps. These interest rate swaps protect us against the risk of adverse fluctuations in the borrowing’s denominated LIBOR. Currently, our exposure to default risk on our interest rate swap agreements is minimal as we are in a liability position on all interest rate swaps. However, if the LIBOR rates were to significantly increase, there is a risk that one or more counterparties may be unable to meet its obligations under the swap agreement.
If we fail to maintain an effective system of internal controls, we may not be able to accurately report our financial results or prevent fraud.
Effective internal controls are necessary for us to provide reliable and accurate financial reports and effectively prevent fraud. We have devoted significant resources and time to comply with the internal control over financial reporting requirements of the Sarbanes-Oxley Act of 2002. In addition, Section 404 under the Sarbanes-Oxley Act of 2002 requires that our auditors attest to the design and operating effectiveness of our controls over financial reporting. Our compliance with the annual internal control report requirement for each fiscal year will depend on the effectiveness of our financial reporting, data systems, and controls across our operating subsidiaries. Furthermore, an important part of our growth strategy has been, and will likely continue to be, the acquisition of complementary businesses, and we expect these systems and controls to become increasingly complex to the extent that we integrate acquisitions and our business grows. Likewise, the complexity of our transactions, systems, and controls may become more difficult to manage. We cannot be certain that these measures will ensure that we design, implement, and maintain adequate controls over our financial processes and reporting in the future, especially for acquisition targets that may not have been required to be in compliance with Section 404 of the Sarbanes-Oxley Act of 2002 at the date of acquisition. Any failure to implement required new or improved controls, difficulties encountered in their implementation or operation, or difficulties in the assimilation of acquired businesses into our control system could harm our operating results or cause it to fail to meet our financial reporting obligations. Inadequate internal controls could also cause investors to lose confidence in our reported financial information, which could have a negative effect on the trading price of our stock and our access to capital.
11
Table of Contents
We rely on information technology systems.
We are dependent on information technology systems, including, but not limited to, networks, applications, and outsourced services. We continually enhance and implement new systems and processes throughout our global operations. During 2011, we are upgrading our primary enterprise resource planning (ERP) systems to more compatible ERP systems that allow greater depth and breadth of functionality. System conversions are expensive and time consuming undertakings that impact all areas of the Company. While a successful implementation will provide many benefits to us, an unsuccessful or delayed implementation may cost us significant time and resources, as well as expense. The failure of these systems to operate effectively, problems with transitioning to upgraded or replacement systems, or a breach in security of these systems could materially and adversely affect our business, financial condition, and results of operations by harming our ability to accurately forecast sales demand, manage our supply chain and production facilities, achieve accuracy in the conversion of electronic data and records, and to report financial and management information on a timely and accurate basis. In addition, due to the systemic internal control features within ERP systems, we may experience difficulties that could affect our internal control over financial reporting, which could create a significant deficiency or material weakness in our overall internal controls under Section 404 of the Sarbanes-Oxley Act of 2002.
Changes in tax laws and unanticipated tax liabilities could adversely affect our effective income tax rate and profitability.
We are subject to income taxes in the United States and numerous foreign jurisdictions. Our effective income tax rate in the future could be adversely affected by a number of factors, including: changes in the mix of earnings in countries with differing statutory tax rates, changes in the realization of deferred tax assets, changes in tax laws, the outcome of income tax audits in various jurisdictions around the world, and any repatriation of non-U.S. earnings for which we have not previously provided for U.S. taxes. We regularly assess all of these matters to determine the adequacy of our tax provision, which is subject to significant discretion.
Our quarterly results may fluctuate substantially due to several additional factors.
We have experienced variability in quarterly results, including losses, and believe our quarterly results will continue to fluctuate as a result of many factors, including those risks and events previously mentioned. Additional factors that may cause the price of our common stock to decline include:
| • |
a higher proportion of products sold with fewer features and functionality, resulting in lower revenues and gross margins; |
| • |
a shift in sales channel mix, which could impact the revenue received and commissions paid; |
| • |
a change in accounting standards or practices that may impact us to a greater degree than other companies due to our product mix, which would impact revenue recognition, or our borrowing structure, including our convertible notes; and |
| • |
a change in existing taxation rules or practices due to our specific operating structure that may not be comparable to other companies. |
12
Table of Contents
None.
The following table lists the number of factories and offices by region.
| Factories | Offices | |||||||||||||||
| Owned | Leased | Owned | Leased | |||||||||||||
|
North America |
4 | 11 | 1 | 14 | ||||||||||||
|
Europe |
14 | 6 | - | 22 | ||||||||||||
|
Asia/Pacific |
2 | 6 | - | 17 | ||||||||||||
|
Other (rest of world) |
4 | 8 | - | 11 | ||||||||||||
|
Total |
24 | 31 | 1 | 64 | ||||||||||||
Our major manufacturing facilities are owned, while smaller factories and sales offices may be leased. Our factory locations typically consist of manufacturing, assembly, service, and/or distribution, and may also include research and development and administrative functions. Our office locations consist primarily of sales and administration functions, and may also include research and development functions. Itron North America facilities are located primarily in the United States while Itron International’s facilities are in Europe, Asia/Pacific, and throughout the rest of the world. We own our headquarters facility, which is located in Liberty Lake, Washington. Our other principal properties are owned and in good condition, and we believe our current facilities will be sufficient to support our operations for the foreseeable future.
Our U.S. operations for advanced metering communication modules are located in Waseca, Minnesota and our electricity meter operations are located in Oconee, South Carolina. Our international operations are more diversified. If any of our facilities are disrupted, our production capacity could be reduced, though most significantly in the United States.
There are no material pending legal proceedings, as defined by Item 103 of Regulation S-K, at December 31, 2010.
No matters were submitted to a vote of shareholders of Itron, Inc. during the fourth quarter of 2010.
13
Table of Contents
Market Information for Common Stock
Our common stock is traded on the NASDAQ Global Select Market. The following table reflects the range of high and low common stock sales prices for the four quarters of 2010 and 2009 as reported by the NASDAQ Global Select Market.
| 2010 | 2009 | |||||||||||||||
| High | Low | High | Low | |||||||||||||
|
First Quarter |
$ | 75.96 | $ | 59.12 | $ | 66.66 | $ | 40.10 | ||||||||
|
Second Quarter |
$ | 81.95 | $ | 61.60 | $ | 62.19 | $ | 42.77 | ||||||||
|
Third Quarter |
$ | 66.87 | $ | 52.05 | $ | 67.89 | $ | 50.15 | ||||||||
|
Fourth Quarter |
$ | 67.58 | $ | 52.03 | $ | 69.49 | $ | 54.92 | ||||||||
Performance Graph
The following graph compares the five-year cumulative total return to shareholders on our common stock with the five-year cumulative total return of the NASDAQ Composite Index, our peer group of companies used for the year ended December 31, 2010, and our previous peer group of companies used for the year ended December 31, 2009.
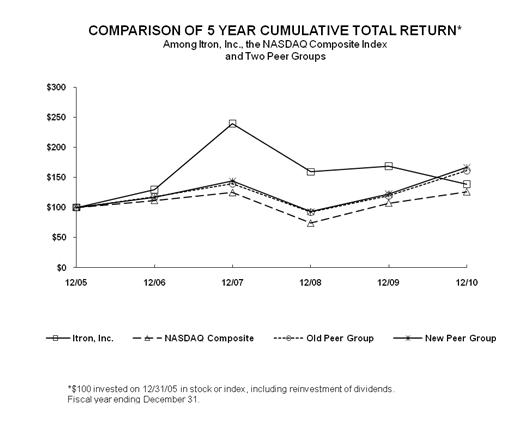
The above presentation assumes $100 invested on December 31, 2005 in the common stock of Itron, Inc., the NASDAQ Composite Index, and the peer groups, with all dividends reinvested. With respect to companies in the peer groups, the returns of each such corporation have been weighted to reflect relative stock market capitalization at the beginning of each annual period plotted. The stock prices shown above for our common stock are historical and not necessarily indicative of future price performance.
14
Table of Contents
In 2010, we reassessed our peer group to identify global companies that are either direct competitors or have similar industry and business operating characteristics. Our new peer group includes the following publicly traded companies: Badger Meter, Inc., Cooper Industries, Ltd., Echelon Corporation, ESCO Technologies Inc., National Instruments Corporation, and Roper Industries, Inc. Our previous peer group included the following publicly traded companies: Badger Meter, Inc., Cooper Industries, Ltd., ESCO Technologies Inc., Mueller Water Products, LLC, National Instruments Corporation, and Roper Industries, Inc.
Holders
At January 31, 2011, there were 303 holders of record of our common stock.
Dividends
Since the inception of the Company, we have not declared or paid cash dividends. In addition, our credit facility dated April 18, 2007 prohibits the declaration or payment of a cash dividend as long as this facility is in place. Upon repayment of our borrowings, we intend to retain future earnings for the development of our business and do not anticipate paying cash dividends in the foreseeable future.
15
Table of Contents
The selected consolidated financial data below is derived from our consolidated financial statements, which have been audited by independent registered public accounting firms. This selected consolidated financial and other data represents portions of our financial statements. You should read this information together with Item 7: “Management’s Discussion and Analysis of Financial Condition and Results of Operations” and Item 8: “Financial Statements and Supplementary Data” included in this Annual Report on Form 10-K. Historical results are not necessarily indicative of future performance.
| Year Ended December 31, | ||||||||||||||||||||
| 2010 | 2009 | 2008 | 2007 (2) | 2006 (3) | ||||||||||||||||
| (in thousands, except per share data) | ||||||||||||||||||||
|
Consolidated Statements of Operations Data |
||||||||||||||||||||
|
Revenues |
$ | 2,259,271 | $ | 1,687,447 | $ | 1,909,613 | $ | 1,464,048 | $ | 644,042 | ||||||||||
|
Cost of revenues |
1,561,032 | 1,149,991 | 1,262,756 | 976,761 | 376,600 | |||||||||||||||
|
Gross profit |
698,239 | 537,456 | 646,857 | 487,287 | 267,442 | |||||||||||||||
|
Operating income |
184,197 | 45,027 | 109,822 | 46,473 | 61,743 | |||||||||||||||
|
Net income (loss) |
104,770 | (2,249) | 19,811 | (22,851) | 33,759 | |||||||||||||||
|
Earnings (loss) per common share-Basic |
$ | 2.60 | $ | (0.06) | $ | 0.60 | $ | (0.77) | $ | 1.33 | ||||||||||
|
Earnings (loss) per common share-Diluted |
$ | 2.56 | $ | (0.06) | $ | 0.57 | $ | (0.77) | $ | 1.28 | ||||||||||
|
Weighted average common shares outstanding-Basic |
40,337 | 38,539 | 33,096 | 29,584 | 25,414 | |||||||||||||||
|
Weighted average common shares outstanding-Diluted |
40,947 | 38,539 | 34,951 | 29,584 | 26,283 | |||||||||||||||
|
Consolidated Balance Sheet Data |
||||||||||||||||||||
|
Working capital (1) |
$ | 178,483 | $ | 282,532 | $ | 293,296 | $ | 249,579 | $ | 492,861 | ||||||||||
|
Total assets |
2,745,797 | 2,854,621 | 2,856,348 | 3,030,457 | 988,522 | |||||||||||||||
|
Total debt |
610,941 | 781,764 | 1,151,767 | 1,538,799 | 469,324 | |||||||||||||||
|
Shareholders’ equity |
1,428,295 | 1,400,514 | 1,058,776 | 790,435 | 390,982 | |||||||||||||||
|
Other Financial Data |
||||||||||||||||||||
|
Cash provided by operating activities |
$ | 254,591 | $ | 140,787 | $ | 193,146 | $ | 133,327 | $ | 94,773 | ||||||||||
|
Cash used in investing activities |
(56,274) | (53,994) | (67,075) | (1,714,416) | (85,499) | |||||||||||||||
|
Cash (used in) provided by financing activities |
(148,637) | (114,121) | (63,376) | 1,310,360 | 318,493 | |||||||||||||||
|
Capital expenditures |
(62,822) | (52,906) | (63,430) | (40,602) | (31,739) | |||||||||||||||
| (1) |
Working capital represents current assets less current liabilities. |
| (2) |
On April 18, 2007, we completed the acquisition of Actaris Metering Systems SA (Actaris). The Consolidated Statement of Operations for the year ended December 31, 2007 includes the operating activities of the Actaris acquisition from April 18, 2007 through December 31, 2007. |
| (3) |
On January 1, 2009, we adopted Financial Accounting Standards Board (FASB) Staff Position (FSP) APB 14-1, Accounting for Convertible Debt Instruments That May Be Settled in Cash upon Conversion (Including Partial Cash Settlement) (FSP 14-1) relating to our convertible senior subordinate notes issued in August 2006. (The guidance in FSP 14-1 is now embedded within Accounting Standards Codification TM (ASC) 470-20). We used the SEC staff’s Alternative A transition election for presenting prior financial information, and therefore the financial information as of and for the year ended December 31, 2006 has not been adjusted and is not comparable to the financial information as of and for the years ended December 31, 2010, 2009, 2008, and 2007. |
16
Table of Contents
| ITEM 7: | MANAGEMENT’S DISCUSSION AND ANALYSIS OF FINANCIAL CONDITION AND RESULTS OF OPERATIONS |
The following discussion and analysis should be read in conjunction with Item 8: “Financial Statements and Supplementary Data.”
Overview
We are a technology company, offering end-to-end smart metering solutions to electric, natural gas, and water utilities around the world. Our smart metering solutions, meter data management software, and knowledge application solutions bring additional value to a utility’s metering and grid systems. Our professional services help our customers project-manage, install, implement, operate, and maintain their systems.
Revenues for 2010 increased 34%, compared with 2009, primarily due to the deployment of our smart metering contracts in Itron North America. Total backlog increased 9% and twelve month backlog increased 13% in 2010, compared with 2009.
Total company gross margin decreased one percentage point in 2010, compared with 2009, due to several additional costs in 2010, the most significant including increased warranty expense of $14.4 million for arbitration claims in Sweden, which were settled in the third quarter of 2010.
Diluted earnings per share were $2.56 in 2010, compared with a diluted loss per share of $0.06 in 2009.
Total debt repayments in 2010 were $155.2 million, bringing the total debt outstanding to $610.9 million at December 31, 2010.
Total Company
| Year Ended December 31, | ||||||||||||||||
| 2010 | % Change | 2009 | % Change | 2008 | ||||||||||||
| (in thousands) | (in thousands) | (in thousands) | ||||||||||||||
|
Revenues |
$ | 2,259,271 | 34% | $ | 1,687,447 | (12%) | $ | 1,909,613 | ||||||||
|
Gross Profit |
698,239 | 30% | 537,456 | (17%) | 646,857 | |||||||||||
|
Gross Margin |
30.9% | 31.9% | 33.9% | |||||||||||||
| Year Ended December 31, | ||||||||||||
| 2010 | 2009 | 2008 | ||||||||||
| (in thousands) | ||||||||||||
|
Revenues by region (origin) |
||||||||||||
|
United States and Canada |
$ | 1,168,523 | $ | 606,472 | $ | 647,966 | ||||||
|
Europe |
756,013 | 806,540 | 916,288 | |||||||||
|
Other |
334,735 | 274,435 | 345,359 | |||||||||
|
Total revenues |
$ | 2,259,271 | $ | 1,687,447 | $ | 1,909,613 | ||||||
Revenues
Revenues increased 34%, or $571.8 million in 2010, compared with 2009. Consolidated foreign currency fluctuations were minor in 2010, compared with 2009. Revenues decreased 12%, or $222.2 million, in 2009, compared with 2008. A strengthening U.S. dollar against most foreign currencies accounted for 46% of the decrease in 2009 revenues. A more detailed analysis of these fluctuations is provided in Operating Segment Results .
One customer, Southern California Edison of our Itron North America operating segment, represented 11% of total Company revenues for the year ended December 31, 2010. No single customer represented more than 10% of total revenues for the years ended December 31, 2009 and 2008. Our 10 largest customers accounted for approximately 34%, 17%, and 15% of total revenues in 2010, 2009, and 2008.
Gross Margins
Gross margin was 30.9% in 2010, compared with 31.9% in 2009. While gross margins decreased for both operating segments in 2010, the growth in Itron North America’s revenues, which are at higher average margins compared with Itron
17
Table of Contents
International, moderated the decline in the consolidated margin. Approximately two-thirds of the two percentage point decline in gross margin in 2009, compared with 2008, was due to our North America operations and one-third was attributable to our International operations. A more detailed analysis of these fluctuations is provided in Operating Segment Results.
Meter and Module Summary
Meters can be broken down into three categories:
| • |
Standard metering – no built-in remote reading communication capability |
| • |
Advanced metering – one-way communication of meter data |
| • |
Smart metering – two-way communication including remote meter configuration and upgrade (consisting primarily of our OpenWay ® technology) |
In addition, advanced and smart meter communication modules can be sold separately from the meter. Depending on customers’ preferences, we also incorporate other vendors’ technology in our meters. A summary of our meter and communication module shipments is as follows:
| Year Ended December 31, | ||||||||||||
| 2010 | 2009 | 2008 | ||||||||||
| (units in thousands) | ||||||||||||
|
Total meters (standard, advanced, and smart) |
||||||||||||
|
Itron North America |
||||||||||||
|
Electricity |
6,940 | 3,480 | 4,800 | |||||||||
|
Gas |
510 | 350 | 390 | |||||||||
|
Itron International |
||||||||||||
|
Electricity |
7,870 | 7,790 | 7,840 | |||||||||
|
Gas |
4,020 | 4,980 | 5,400 | |||||||||
|
Water |
9,110 | 8,430 | 9,170 | |||||||||
|
Total meters |
28,450 | 25,030 | 27,600 | |||||||||
|
Additional meter information (Total Company) |
||||||||||||
|
Advanced meters |
3,980 | 3,110 | 4,690 | |||||||||
|
Smart meters |
4,460 | 710 | 20 | |||||||||
|
Standalone advanced and smart communication modules |
5,960 | 3,830 | 4,890 | |||||||||
|
Advanced and smart meters and communication modules |
14,400 | 7,650 | 9,600 | |||||||||
|
Meters with other vendors’ advanced or smart communication modules |
510 | 630 | 840 | |||||||||
18
Table of Contents
Operating Segment Results
For a description of our operating segments, refer to Item 8: “Financial Statements and Supplementary Data, Note 15: Segment Information” in this Annual Report on Form 10-K. The following tables and discussion highlight significant changes in trends or components of each operating segment.
| Year Ended December 31, | ||||||||||||||||
| 2010 | % Change | 2009 | % Change | 2008 | ||||||||||||
| (in thousands) | (in thousands) | (in thousands) | ||||||||||||||
|
Segment Revenues |
||||||||||||||||
|
Itron North America |
$ | 1,177,391 | 91% | $ | 615,731 | (12%) | $ | 696,688 | ||||||||
|
Itron International |
1,081,880 | 1% | 1,071,716 | (12%) | 1,212,925 | |||||||||||
|
Total revenues |
$ | 2,259,271 | 34% | $ | 1,687,447 | (12%) | $ | 1,909,613 | ||||||||
| Year Ended December 31, | ||||||||||||||||||||||||
| 2010 | 2009 | 2008 | ||||||||||||||||||||||
| Gross Profit | Gross Margin | Gross Profit | Gross Margin | Gross Profit | Gross Margin | |||||||||||||||||||
|
Segment Gross Profit and Margin |
(in thousands) | (in thousands) | (in thousands) | |||||||||||||||||||||
|
Itron North America |
$ | 394,247 | 33.5% | $ | 211,682 | 34.4% | $ | 263,645 | 37.8% | |||||||||||||||
|
Itron International |
303,992 | 28.1% | 325,774 | 30.4% | 383,212 | 31.6% | ||||||||||||||||||
|
Total gross profit and margin |
$ | 698,239 | 30.9% | $ | 537,456 | 31.9% | $ | 646,857 | 33.9% | |||||||||||||||
| Year Ended December 31, | ||||||||||||||||||||||||
| 2010 | 2009 | 2008 | ||||||||||||||||||||||
| Segment Operating Income (Loss) |
Operating
Income (Loss) |
Operating
Margin |
Operating
Income (Loss) |
Operating
Margin |
Operating
Income (Loss) |
Operating
Margin |
||||||||||||||||||
|
and Operating Margin |
(in thousands) | (in thousands) | (in thousands) | |||||||||||||||||||||
|
Itron North America |
$ | 201,410 | 17% | $ | 36,931 | 6% | $ | 78,046 | 11% | |||||||||||||||
|
Itron International |
26,363 | 2% | 37,614 | 4% | 69,458 | 6% | ||||||||||||||||||
|
Corporate unallocated |
(43,576) | (29,518) | (37,682) | |||||||||||||||||||||
|
Total Company |
$ | 184,197 | 8% | $ | 45,027 | 3% | $ | 109,822 | 6% | |||||||||||||||
Itron North America
2010 vs. 2009 Revenues: Revenues increased $561.7 million, or 91% in 2010, compared with 2009, primarily due to the deployment of our smart metering contracts in 2010. Our smart metering contracts accounted for 49% of operating segment revenues for 2010, compared with 17% in 2009. Revenues for standard and advanced meters, software, and services increased 18% in 2010, compared with 2009.
2009 vs. 2008 Revenues: Revenues decreased $81.0 million, or 12%, in 2009, compared with 2008. Revenues in 2008 included standard electricity meter and advanced communication module shipments in support of a number of advanced metering and technology contracts that were substantially completed in 2008. During 2009, these revenues were lower as utilities delayed orders due to the spending environment and the uncertainty surrounding the announcement and disbursement of stimulus funds. Smart metering systems and technology revenues began increasing in the fourth quarter of 2009 and totaled $104.4 million for the year.
2010 vs. 2009 Gross Margin: Gross margin decreased nearly one percentage point in 2010, compared with 2009, due to a higher mix of smart metering systems and technology, which currently have lower margins than advanced metering systems and technology. Gross margins on smart metering systems have improved during 2010, compared with 2009, as a result of newer generations.
2009 vs. 2008 Gross Margin: Gross margin decreased 3.4 percentage points in 2009, compared with 2008, primarily due to shipments of our first generation smart meter systems, which currently have higher costs, fewer advanced meter and communication module shipments, and reduced overhead absorption resulting from lower overall production levels.
Three customers each represented more than 10% of Itron North America operating segment revenues in 2010. No customer represented more than 10% of Itron North America operating segment revenues in 2009 and 2008.
2010 vs. 2009 Operating Expenses: Itron North America operating expenses increased $18.1 million, or 10%, in 2010, compared with 2009, primarily due to increased compensation expense from the reinstatement of our of bonus, profit sharing, and employee savings plan match, as well as increased product development costs for new and enhanced products. These
19
Table of Contents
increased expenses were partially offset by a scheduled decrease in amortization of intangible assets. As a result of higher revenues, operating expenses as a percentage of revenues decreased to 16% in 2010, compared with 28% in 2009.
2009 vs. 2008 Operating Expenses: Itron North America operating expenses decreased $10.8 million, or 6%, in 2009, compared with 2008, primarily due to lower sales expense and reduced compensation associated with our 2009 suspension of bonus, profit sharing, and employee savings plan match. Operating expenses as a percentage of revenues increased to 28% in 2009, compared with 27% in 2008, as a result of lower revenues in 2009.
Itron International
2010 vs. 2009 Revenues: Revenues increased $10.2 million, or 1%, in 2010, net of a decrease of $10.7 million as a result of a strengthening U.S. dollar against the euro, as compared with 2009. Itron International experiences variability in revenues as a result of the diverse economies in which it operates and sells its products. For this reason, during 2010 we experienced revenue growth for certain products in certain countries, but declines in others. For example, the revenues from our European-based entities experienced a decrease in export sales to the Middle East, while sales to Indonesia and India recognized significant growth. Revenue growth was also impacted by economic factors in parts of Europe and some delays in orders as customers evaluate advanced and smart metering systems and technology.
2009 vs. 2008 Revenues: Revenues decreased $141.3 million, or 12% in 2009, compared 2008. A strengthening U.S. dollar against most foreign currencies, as compared with 2008, resulted in a revenue decline of $96.5 million. The remaining decrease in revenues was the result of the completion of a smart metering project in 2008 and softening demand in some markets, such as Spain and the United Kingdom, which was due to those countries’ financial and economic conditions.
Business line revenues for Itron International were as follows:
| Year Ended December 31, | ||||||
| 2010 | 2009 | 2008 | ||||
|
Electricity |
39% | 40% | 40% | |||
|
Gas |
29% | 30% | 30% | |||
|
Water |
32% | 30% | 30% | |||
No single customer represented more than 10% of Itron International operating segment revenues in 2010, 2009, or 2008.
2010 vs. 2009 Gross Margin: Gross margin decreased over two percentage points in 2010, compared with 2009. During 2010, we incurred warranty expense of $14.4 million for arbitration claims in Sweden, which were settled in the third quarter of 2010. Gross margin in 2010 was also lower due to higher material costs, such as copper and brass.
2009 vs. 2008 Gross Margin: Gross margin decreased just over one percentage point in 2009, compared with 2008, primarily as a result of expenses for discontinuing certain product lines and streamlining our service operations in Brazil.
2010 vs. 2009 Operating Expenses: Operating expenses were $277.6 million, or 26% of revenues, for 2010, compared with $288.2 million or 27% or revenues, for 2009. The $10.5 million decrease was the result of a scheduled reduction in amortization of intangible assets of $20 million and a $6.0 million decrease due to a stronger U.S. dollar against the euro, which was partially offset by increased sales and marketing and product development.
2009 vs. 2008 Operating Expenses: Operating expenses were $288.2 million, or 27% of revenues, for 2009, compared with $313.8 million, or 26% of revenues, in 2008. In 2009, decreased operating expense consisted of lower amortization expense of $18.0 million and a $16.5 million decrease due to a stronger U.S. dollar, which was partially offset by an increase in product development and administrative expense.
Corporate Unallocated
Operating expenses not directly associated with an operating segment are classified as “Corporate unallocated.” Corporate unallocated expenses increased $14.1 million in 2010, compared with 2009, primarily due to increased compensation expense from the reinstatement of our bonus and profit sharing plans. Corporate unallocated expenses decreased $8.2 million in 2009, compared with 2008, due primarily from reduced compensation expense associated with our 2009 suspension of bonus and profit sharing and reduced consulting fees primarily for Sarbanes-Oxley Act of 2002 compliance. Corporate unallocated expenses, as a percentage of total Company revenues, have remained constant at 2% for 2010, 2009, and 2008.
20
Table of Contents
Total Company
Operating Expenses
The following table details our total operating expenses in dollars and as a percentage of revenues:
| Year Ended December 31, | ||||||||||||||||||
| 2010 |
% of
Revenue |
2009 |
% of
Revenue |
2008 |
% of
Revenue |
|||||||||||||
| (in thousands) | (in thousands) | (in thousands) | ||||||||||||||||
|
Sales and marketing |
$ | 171,676 | 8% | $ | 152,405 | 9% | $ | 167,457 | 9% | |||||||||
|
Product development |
140,229 | 6% | 122,314 | 7% | 120,699 | 6% | ||||||||||||
|
General and administrative |
133,086 | 6% | 119,137 | 7% | 128,515 | 7% | ||||||||||||
|
Amortization of intangible assets |
69,051 | 3% | 98,573 | 6% | 120,364 | 6% | ||||||||||||
|
Total operating expenses |
$ | 514,042 | 23% | $ | 492,429 | 29% | $ | 537,035 | 28% | |||||||||
2010 vs. 2009: Operating expenses increased $21.6 million, or 4%, in 2010, compared with 2009, primarily as a result of increased compensation expense, which was partially offset by lower amortization of intangible assets of $29.5 million and foreign exchange fluctuations of $2.9 million.
2009 vs. 2008: Operating expenses decreased $44.6 million, or 8%, in 2009, compared with 2008, as a result of lower amortization of intangible assets of $21.7 million and foreign exchange rate fluctuations of $17.0 million, with the remaining decrease primarily due to cost containment measures.
Other Income (Expense)
The following table shows the components of other income (expense):
| Year Ended December 31, | ||||||||||||
| 2010 | 2009 | 2008 | ||||||||||
| (in thousands) | ||||||||||||
|
Interest income |
$ | 592 | $ | 1,186 | $ | 5,970 | ||||||
|
Interest expense |
(49,412) | (62,053) | (85,260) | |||||||||
|
Amortization of debt placement fees |
(5,492) | (8,258) | (8,917) | |||||||||
|
Loss on extinguishment of debt, net |
- | (12,800) | - | |||||||||
|
Other income (expense), net |
(9,141) | (9,176) | (3,033) | |||||||||
|
Total other income (expense) |
$ | (63,453) | $ | (91,101) | $ | (91,240) | ||||||
Interest income : Interest income is generated from our cash and cash equivalents. We hold no investments. Interest rates have continued to decline from 2008 through 2010.
Interest expense : Interest expense continues to decrease year-over-year as a result of our declining principal balance of debt outstanding. Total debt was $610.9 million, $781.8 million and $1.2 billion at December 31, 2010, 2009 and 2008, respectively. Inclusive of our interest rate swaps, our fixed rate borrowings were 93%, 85%, and 83% at December 31, 2010, 2009, and 2008.
Amortization of prepaid debt fees : During 2010 and 2009, we incurred prepaid debt fees associated with our multicurrency revolving line of credit. Amortization of prepaid debt fees fluctuate each year as debt is repaid early, the related portion of unamortized prepaid debt fees is written-off.
Loss on extinguishment of debt : During the second quarter of 2009, we paid the remaining $109.2 million outstanding balance of our senior subordinated notes and recognized a loss on extinguishment of $2.5 million.
During the first quarter of 2009, we entered into exchange agreements with certain holders of our convertible notes to issue, in the aggregate, approximately 2.3 million shares of common stock, valued at $132.9 million, in exchange for, in the aggregate, $121.0 million principal amount of the convertible notes, representing 35% of the aggregate principal outstanding at the date of the exchanges. As a result, we recognized a net loss on extinguishment of debt of $10.3 million, calculated as
21
Table of Contents
the inducement loss, plus an allocation of advisory fees less the revaluation gain. For a description of the redemption of our subordinated notes and the induced conversion of a portion of our convertible notes, refer to Item 8: “Financial Statements and Supplementary Data, Note 6: Debt” included in this Annual Report on Form 10-K.
Other income (expense ) , net : Other income (expense) consists primarily of realized and unrealized foreign currency gains and losses due to balances denominated in a currency other than the reporting entity’s functional currency and other non-operating income (expenses). Expenses associated with foreign currency losses decreased to $3.1 million during 2010, while the balance of $6.0 million was due to other non-operating expenses. In 2009 and 2008 other income (expense) consisted primarily of foreign currency fluctuations.
Income Tax Provision (Benefit)
Our tax provision (benefit) as a percentage of income (loss) before tax typically differs from the U.S. federal statutory rate of 35%. Changes in our actual tax rate are subject to several factors, including fluctuations in operating results, new or revised tax legislation and accounting pronouncements, changes in the level of business in domestic and foreign jurisdictions, tax credits (including research and development and foreign tax), state income taxes, adjustments to valuation allowances, and interest expense and penalties related to uncertain tax positions, among other items. Changes in tax laws and unanticipated tax liabilities could significantly impact our tax rate.
Our tax expense as a percentage of income before tax was 13.2% for 2010. Our actual tax rate was lower than the 35% U.S. Federal statutory tax rate primarily due to: (1) earnings of our subsidiaries outside of the United States in jurisdictions where our effective tax rate is lower than in the United States; and (2) the de-recognition of a reserve for uncertain tax positions due to a change in the method of depreciation for certain foreign subsidiaries.
Our tax benefit as a percentage of loss before tax was 95.1% for 2009. Our actual tax benefit for 2009 was higher than the U.S. federal statutory rate due to a variety of factors, including: (1) lower effective tax rates on certain international earnings due to an election made under Internal Revenue Code Section 338 with respect to the Actaris acquisition in 2007; (2) benefit of foreign interest expense deductions; (3) tax planning and tax elections regarding the repatriation of foreign earnings and the associated foreign tax credits; (4) a decrease in pretax income in high tax jurisdictions for the year; and (5) a refund of taxes previously paid in foreign tax audits.
Our tax benefit as a percentage of income before tax was 6.6% for 2008. Our actual tax rate for 2008 was lower than the U.S. federal statutory rate due to a variety of factors, including lower effective tax rates on certain international earnings due to an election made under Internal Revenue Code Section 338 with respect to the Actaris acquisition in 2007. Additionally, our reduced foreign tax liability reflects the benefit of foreign interest expense deductions.
Our net deferred tax assets consist primarily of accumulated net operating loss carryforwards and tax credits that can be carried forward.
Our deferred tax assets at December 31, 2010 do not include the tax effect on $55.5 million of tax benefits from employee stock plan exercises. Common stock will be increased by $20.9 million when such excess tax benefits reduce cash taxes payable.
Our cash income tax payments for 2010, 2009, and 2008 were as follows:
| Years Ended December 31, | ||||||||||||
| 2010 | 2009 | 2008 | ||||||||||
| (in thousands) | ||||||||||||
|
U.S. federal taxes paid |
$ | 4,060 | $ | - | $ | - | ||||||
|
State income taxes paid |
505 | 559 | 77 | |||||||||
|
Foreign and local income taxes paid |
25,577 | 31,161 | 26,300 | |||||||||
|
Total income taxes paid |
$ | 30,142 | $ | 31,720 | $ | 26,377 | ||||||
For 2009 and 2008, we had operating losses for U.S. federal income tax purposes and did not pay significant cash taxes. Based on current projections, we expect to pay, net of refunds, minimal U.S. federal taxes and approximately $2.5 million in state taxes and $17.6 million in foreign and local income taxes in 2011. Recent U.S. legislation related to depreciation could have a material impact on future cash taxes and cash flow planning.
22
Table of Contents
Refer to Item 8: “Financial Statements and Supplementary Data, Note 11: Income Taxes” included in this Annual Report on Form 10-K for a discussion of our tax provision (benefit) and unrecognized tax benefits.
Financial Condition
Cash Flow Information:
| Year Ended December 31, | ||||||||||||
| 2010 | 2009 | 2008 | ||||||||||
| (in thousands) | ||||||||||||
|
Operating activities |
$ | 254,591 | $ | 140,787 | $ | 193,146 | ||||||
|
Investing activities |
(56,274) | (53,994) | (67,075) | |||||||||
|
Financing activities |
(148,637) | (114,121) | (63,376) | |||||||||
|
Effect of exchange rates on cash and cash equivalents |
(2,096) | 4,831 | (10,293) | |||||||||
|
Increase (decrease) in cash and cash equivalents |
$ | 47,584 | $ | (22,497) | $ | 52,402 | ||||||
Cash and cash equivalents was $169.5 million at December 31, 2010, compared with $121.9 million at December 31, 2009. The increase was primarily due to improved operating results, partially offset by increased debt repayments. Cash and cash equivalents was $121.9 million at December 31, 2009, compared with $144.4 million at December 31, 2008. The decrease was primarily due to lower earnings and higher repayments of borrowings in excess of net proceeds from public offerings of common stock.
Operating activities:
The $113.8 million increase in cash provided by operating activities for 2010 directly corresponds with the increase in our 2010 net income, compared with 2009. Cash provided by operating activities for 2009 was $52.4 million lower, compared with 2008, primarily due to lower earnings.
Investing activities:
Net cash used in investing activities consists primarily of purchases of machinery and equipment. The 19% increase in acquisitions of property, plant, and equipment in 2010, compared with 2009, was the result of the timing of payments between the two years. The 17% decrease of cash used for property, plant, and equipment purchases in 2009, compared with 2008, was also related to the timing of payments. Contingent consideration of $4.3 million was paid during 2009 to shareholders of three pre-2009 acquisitions for the achievement of certain earn-out thresholds.
Financing activities:
During 2010, we repaid $155.2 million in borrowings, which utilized cash provided from operations. During 2009, we repaid $275.8 million in borrowings, which included utilizing $160.4 million in net proceeds from a public offering of approximately 3.2 million shares of common stock. In 2008, we repaid $388.4 million in borrowings, which included $310.9 million in net proceeds from a public offering of approximately 3.4 million shares of common stock.
Effect of exchange rates on cash and cash equivalents:
Our primary foreign currency exposure relates to non-U.S. dollar denominated transactions in our international subsidiary operations, the most significant of which is the euro. The effect of exchange rates on cash balances held in foreign currency denominations was $2.1 million, $4.8 million, and $10.3 million in 2010, 2009, and 2008, respectively.
Non-cash transactions:
During 2009, we completed exchanges with certain holders of our convertible notes in which we issued, in the aggregate, approximately 2.3 million shares of common stock recorded at $123.4 million, in exchange for $107.8 million net carrying amount of the convertible notes and the reversal of deferred taxes of $5.8 million. Refer to Item 8: “Financial Statements and Supplemental Data, Note 6: Debt” included in this Annual Report on Form 10-K for a further discussion associated with the exchange agreements and the derecognition requirement for induced conversions.
23
Table of Contents
Off-balance sheet arrangements:
We have no off-balance sheet financing agreements or guarantees as defined by Item 303 of Regulation S-K at December 31, 2010 and 2009 that we believe are reasonably likely to have a current or future effect on our financial condition, results of operations, or cash flows.
Disclosures about contractual obligations and commitments:
The following table summarizes our known obligations to make future payments pursuant to certain contracts as of December 31, 2010, as well as an estimate of the timing in which these obligations are expected to be satisfied.
| Total |
Less
than
1 year |
1-3
years |
3-5
years |
Beyond
5 years |
||||||||||||||||
| (in thousands) | ||||||||||||||||||||
|
Credit facility (1) |
||||||||||||||||||||
|
USD denominated term loan |
$ | 249,818 | $ | 15,051 | $ | 31,137 | $ | 203,630 | $ | - | ||||||||||
|
EUR denominated term loan |
202,771 | 12,818 | 26,379 | 163,574 | - | |||||||||||||||
|
Convertible senior subordinated notes (1) (2) |
226,865 | 226,865 | - | - | - | |||||||||||||||
|
Operating lease obligations (3) |
22,555 | 8,617 | 9,501 | 3,154 | 1,283 | |||||||||||||||
|
Purchase and service commitments (4) |
247,519 | 245,614 | 1,905 | - | - | |||||||||||||||
|
Other long-term liabilities reflected on the balance sheet under generally accepted accounting principles (5) |
111,219 | - | 63,458 | 13,080 | 34,681 | |||||||||||||||
|
Total |
$ | 1,060,747 | $ | 508,965 | $ | 132,380 | $ | 383,438 | $ | 35,964 | ||||||||||
| (1) |
Borrowings are disclosed within Item 8: “Financial Statements and Supplementary Data, Note 6: Debt” included in this Annual Report on Form 10-K, with the addition of estimated interest expense, not including the amortization of prepaid debt fees and debt discount. |
| (2 ) |
Our convertible notes have a stated due date of August 2026. We reflected the principal repayment in 2011 due to the combination of put, call, and conversion options that are part of the terms of the convertible note agreement. |
| ( 3 ) |
Operating lease obligations are disclosed in Item 8: “Financial Statements and Supplementary Data, Note 12: Commitments and Contingencies” included in this Annual Report on Form 10-K and do not include common area maintenance charges, real estate taxes, and insurance charges for which we are obligated. |
| ( 4 ) |
We enter into standard purchase orders in the ordinary course of business that typically obligate us to purchase materials and other items. Purchase orders can vary in terms, which include open-ended agreements that provide for estimated quantities over an extended shipment period, typically up to one year at an established unit cost. Our long-term executory purchase agreements that contain termination clauses have been classified as less than one year, as the commitments are the estimated amounts we would be required to pay at December 31, 2010 if the commitments were canceled. |
| ( 5 ) |
Other long-term liabilities consist of warranty obligations, estimated pension benefit payments, and other obligations. Estimated pension benefit payments include amounts through 2020. Noncurrent unrecognized tax benefits totaling $42.3 million recorded in other long-term liabilities, which include interest and penalties, are not included in the above contractual obligations and commitments table as we cannot reliably estimate the period of cash settlement with the respective taxing authorities. |
24
Table of Contents
Liquidity, Sources and Uses of Capital:
Our principal sources of liquidity are cash flows from operations, borrowings, and sales of common stock. Cash flows may fluctuate and are sensitive to many factors including changes in working capital and the timing and magnitude of capital expenditures and payments on debt.
On January 20, 2011, we increased our $240 million multicurrency revolving line of credit to $315 million as approved by the participating lenders, the issuing agents, the swingline lender, and the administrative agent and as permitted by section 2.19 of Amendment No. 1 of our Credit Facility dated April 24, 2009. There were no other changes to the credit facility. The expanded multicurrency revolving line of credit will provide us with increased flexibility and liquidity for general corporate purposes. At December 31, 2010, there were no borrowings outstanding under the revolver, and $43.5 million was utilized by outstanding standby letters of credit.
Between July 1, 2011 and August 1, 2011, our convertible notes may be converted at the option of the holder at a conversion rate of 15.3478 shares of our common stock for each $1,000 principal amount of the convertible notes, regardless if the closing sale price per share of our common stock exceeds $78.19. In addition, the convertible notes contain purchase options, at the option of the holders, which if exercised would require us to repurchase all or a portion of the convertible notes on August 1, 2011 at 100% of the principal amount, plus accrued and unpaid interest. If the closing sale price per share of our common stock is below the conversion price of $65.16, we anticipate some or all of the investors will exercise this option, requiring us to purchase the $223.6 million convertible notes. With the expansion of our revolving line of credit from $240 million to $315 million on January 20, 2011, we believe we will have sufficient liquidity to purchase the convertible notes if required.
If we are required to purchase all of the outstanding $223.6 million convertible notes as detailed above, we expect our cash taxes to increase by approximately $22 million in 2011.
For a description of our credit facility and convertible senior subordinated notes, refer to Item 8: “Financial Statements and Supplementary Data, Note 6: Debt” included in this Annual Report on Form 10-K.
For a description of our letters of credit and performance bonds, refer to Item 8: “Financial Statements and Supplementary Data, Note 12: Commitments and Contingencies” included in this Annual Report on Form 10-K.
For a description of our funded and unfunded non-U.S. defined benefit pension plans and our expected 2011 contributions, refer to Item 8: “Financial Statements and Supplementary Data, Note 8: Defined Benefit Pension Plans” included in this Annual Report on Form 10-K.
Working capital, which represents current assets less current liabilities, was $178.5 million at December 31, 2010, compared with $282.5 million at December 31, 2009.
At December 31, 2010, we have accrued $45 million of bonus and profit sharing plans expense for the achievement of annual financial and nonfinancial targets. These awards will be paid in cash during the first quarter of 2011.
We expect to continue to expand our operations and grow our business through a combination of internal new product development, licensing technology from and to others, distribution agreements, partnership arrangements, and acquisitions of technology or other companies. We expect these activities to be funded with existing cash, cash flow from operations, borrowings, and the sale of common stock or other securities. We believe existing sources of liquidity will be sufficient to fund our existing operations and obligations for the next 12 months and into the foreseeable future, but offer no assurances. Our liquidity could be affected by the stability of the energy and water industries, competitive pressures, international risks, intellectual property claims, capital market fluctuations, and other factors described under Item 1A: “Risk Factors” included in this Annual Report on Form 10-K.
Contingencies
Refer to Item 8: “Financial Statements and Supplementary Data, Note 12: Commitments and Contingencies” included in this Annual Report on Form 10-K.
25
Table of Contents
Critical Accounting Estimates
Revenue Recognition
The majority of our revenue arrangements involve multiple deliverables, which require us to determine the fair value of each deliverable and then allocate the total arrangement consideration among the separate deliverables based on the relative fair value percentages. Revenues for each deliverable are then recognized based on the type of deliverable, such as 1) when the products are shipped, 2) services are delivered, 3) percentage-of-completion when implementation services are essential to other deliverables in the arrangements, 4) upon receipt of customer acceptance, or 5) transfer of title. A majority of our revenue is recognized when products are shipped to or received by a customer or when services are provided.
Fair value represents the estimated price charged if an item were sold separately. If the fair value of any undelivered deliverable included in a multiple deliverable arrangement cannot be objectively determined, revenue is deferred until all deliverables are delivered and services have been performed, or until the fair value can be objectively determined for any remaining undelivered deliverables. We review our fair values on an annual basis or more frequently if a significant trend is noted.
If implementation services are essential to a software arrangement, revenue is recognized using either the percentage-of-completion methodology if project costs can be estimated or the completed contract methodology if project costs cannot be reliably estimated. The estimation of costs through completion of a project is subject to many variables such as the length of time to complete, changes in wages, subcontractor performance, supplier information, and business volume assumptions. Changes in underlying assumptions/estimates may adversely or positively affect financial performance.
Certain of our revenue arrangements include an extended or noncustomary warranty provision which covers all or a portion of a customer’s replacement or repair costs beyond the standard or customary warranty period. Whether or not the extended warranty is separately priced in the arrangement, a portion of the arrangement’s total consideration is allocated to this extended warranty deliverable. This revenue is deferred and recognized over the extended warranty coverage period. Extended/noncustomary warranties do not represent a significant portion of our revenue.
On January 1, 2010, we adopted Financial Accounting Standards Board (FASB) Accounting Standards Update (ASU) No. 2009-13, Revenue Recognition (Topic 605) – Multiple-Deliverable Revenue Arrangements (a consensus of the FASB Emerging Issues Tax Force ) (ASU 2009-13) and ASU No. 2009-14, Software (Topic 985), Certain Revenue Arrangements That Include Software Elements (a consensus of the FASB Emerging Issues Task Force) (ASU 2009-14) on a prospective basis for new arrangements and arrangements that are materially modified. This new guidance did not have a material impact on our financial statements for the year ended December 31, 2010, as we already had the ability to divide the deliverables within our revenue arrangements into separate units of accounting. Further, there would have been no change to the amount of revenue recognized in the year ended December 31, 2009 if arrangements prior to the adoption of ASU 2009-13 and ASU 2009-14 had been subject to the measurement requirements of this new guidance.
We allocate consideration to each deliverable in an arrangement based on its relative selling price. We determine selling price using vendor specific objective evidence (VSOE), if it exists, otherwise third-party evidence (TPE). If neither VSOE nor TPE of selling price exists for a unit of accounting, we use estimated selling price (ESP).
VSOE is generally limited to the price charged when the same or similar product is sold separately or, if applicable, the stated renewal rate in the agreement. If a product or service is seldom sold separately, it is unlikely that we can determine VSOE for the product or service. We define VSOE as a median price of recent standalone transactions that are priced within a narrow range. TPE is determined based on the prices charged by our competitors for a similar deliverable when sold separately.
For arrangements entered into or materially modified after January 1, 2010, if we are unable to establish selling price using VSOE or TPE, we use ESP in the allocation of arrangement consideration. The objective of ESP is to determine the price at which we would transact if the product or service were sold by us on a standalone basis. Our determination of ESP involves a weighting of several factors based on the specific facts and circumstances of the arrangement. Specifically, we consider the cost to produce the deliverable, the anticipated margin on that deliverable, the selling price and profit margin for similar parts, our ongoing pricing strategy and policies (as evident in the price list established and updated by management on a regular basis), the value of any enhancements that have been built into the deliverable, and the characteristics of the varying markets in which the deliverable is sold. We analyze the selling prices used in our allocation of arrangement consideration on an annual basis. Selling prices are analyzed on a more frequent basis if a significant change in our business necessitates a more timely analysis or if we experience significant variances in our selling prices.
26
Table of Contents
Warranty
We offer standard warranties on our hardware products and large application software products. We accrue the estimated cost of warranty claims based on historical and projected product performance trends and costs. Testing of new products in the development stage helps identify and correct potential warranty issues prior to manufacturing. Continuing quality control efforts during manufacturing reduce our exposure to warranty claims. If our quality control efforts fail to detect a fault in one of our products, we could experience an increase in warranty claims. We track warranty claims to identify potential warranty trends. If an unusual trend is noted, an additional warranty accrual may be assessed and recorded when a failure event is probable and the cost can be reasonably estimated. When new products are introduced, our process relies on historical averages until sufficient data are available. As actual experience becomes available, it is used to modify the historical averages to ensure the expected warranty costs are within a range of likely outcomes. Management continually evaluates the sufficiency of the warranty provisions and makes adjustments when necessary. The warranty allowances may fluctuate due to changes in estimates for material, labor, and other costs we may incur to repair or replace projected product failures, and we may incur additional warranty and related expenses in the future with respect to new or established products, which could adversely affect our gross margin. The long-term warranty balance includes estimated warranty claims beyond one year.
Income Taxes
We estimate income taxes in each of the taxing jurisdictions in which we operate. Changes in our actual tax rate are subject to several factors, including fluctuations in operating results, new or revised tax legislation and accounting pronouncements, changes in the level of business in domestic and foreign jurisdictions, tax credits (including research and development and foreign tax), state income taxes, adjustments to valuation allowances, and interest expense and penalties related to uncertain tax positions, among other items. Changes in tax laws and unanticipated tax liabilities could significantly impact our tax rate.
We record valuation allowances to reduce deferred tax assets to the extent we believe it is more likely than not that a portion of such assets will not be realized. In making such determinations, we consider all available positive and negative evidence, including scheduled reversals of deferred tax liabilities, projected future taxable income, tax planning strategies, and our ability to carry back losses to prior years. We are required to make assumptions and judgments about potential outcomes that lie outside management’s control. Our most sensitive and critical factors are the projection, source, and character of future taxable income. Although realization is not assured, management believes it is more likely than not that deferred tax assets will be realized. The amount of deferred tax assets considered realizable, however, could be reduced in the near term if estimates of future taxable income during the carryforward periods are reduced or current tax planning strategies are not implemented.
We are subject to audit in multiple taxing jurisdictions in which we operate. These audits may involve complex issues, which may require an extended period of time to resolve. We believe we have recorded adequate income tax provisions and reserves for uncertain tax positions.
In evaluating uncertain tax positions, we consider the relative risks and merits of positions taken in tax returns filed and to be filed, considering statutory, judicial, and regulatory guidance applicable to those positions. We make assumptions and judgments about potential outcomes that lie outside management’s control. To the extent the tax authorities disagree with our conclusions and depending on the final resolution of those disagreements, our actual tax rate may be materially affected in the period of final settlement with the tax authorities.
Inventories
Items are removed from inventory using the first-in, first-out method. Inventories include raw materials, sub-assemblies, and finished goods. Inventory amounts include the cost to manufacture the item, such as the cost of raw materials, labor, and other applied direct and indirect costs. We also review idle facility expense, freight, handling costs, and wasted materials to determine if abnormal amounts should be recognized as current-period charges. We review our inventory for obsolescence and marketability. If the estimated market value, which is based upon assumptions about future demand and market conditions, falls below the original cost, the inventory value is reduced to the market value. If technology rapidly changes or actual market conditions are less favorable than those projected by management, inventory write-downs may be required. Our inventory levels may vary period to period as a result of our factory scheduling and timing of contract fulfillments.
Goodwill and Intangible Assets
Goodwill and intangible assets result from our acquisitions. We use estimates, including estimates of useful lives of intangible assets, the amount and timing of related future cash flows, and fair values of the related operations, in determining the value assigned to goodwill and intangible assets. Our intangible assets have a finite life and are amortized over their estimated useful lives based on estimated discounted cash flows. Intangible assets are tested for impairment when events or changes in circumstances indicate the carrying value may not be recoverable.
27
Table of Contents
We test goodwill for impairment each year as of October 1, or more frequently should a significant impairment indicator occur. Our Itron North America operating segment represents one reporting unit, while our Itron International operating segment has three reporting units.
Determining the fair value of a reporting unit is judgmental in nature and involves the use of significant estimates and assumptions. We forecast discounted future cash flows at the reporting unit level using risk-adjusted discount rates and estimated future revenues and operating costs, which take into consideration factors such as existing backlog, expected future orders, supplier contracts, and expectations of competitive and economic environments. We also identify similar publicly traded companies and develop a correlation, referred to as a multiple, to apply to the operating results of the reporting units. Our 2010 annual goodwill impairment analysis did not result in an impairment charge as the fair value of each reporting unit exceeded its carrying value. The percentage by which the fair value of each reporting unit exceeded its carrying value and the amount of goodwill allocated to each reporting unit at October 1, 2010 was as follows:
| October 1, 2010 | ||||||||
| Goodwill |
Fair Value
Exceeded Carrying Value |
|||||||
| (in thousands) | ||||||||
|
Itron North America |
$ | 197,645 | 229% | |||||
|
Itron International - Electricity |
347,299 | 14% | ||||||
|
Itron International - Water |
383,194 | 29% | ||||||
|
Itron International - Gas |
308,445 | 55% | ||||||
| $ | 1,236,583 | |||||||
Changes in market demand and the economies in which we operate across local markets, the volatility and decline in the worldwide equity markets, and the decline in our market capitalization could negatively impact our annual goodwill impairment test, which could have a significant effect on our current and future results of operations and financial condition.
Derivative Instruments
All derivative instruments, whether designated in hedging relationships or not, are recorded on the Consolidated Balance Sheets at fair value as either assets or liabilities. The components and fair values of our derivative instruments, which are primarily interest rate swaps, are determined using the fair value measurements of significant other observable inputs (also known as “Level 2”), as defined by FASB Accounting Standards Codification (ASC) 820-10-20, Fair Value Measurements . We include the effect of our counterparty credit risk based on current published credit default swap rates when the net fair value of our derivative instruments is in a net asset position and the effect of our own nonperformance risk when the net fair value of our derivative instruments is in a net liability position. Level 2 inputs consist of quoted prices for similar assets and liabilities in active markets; quoted prices for identical or similar assets and liabilities in non-active markets; and model-derived valuations in which significant inputs are corroborated by observable market data either directly or indirectly through correlation or other means (inputs may include yield curves, volatility, credit risks, and default rates). Derivatives are not used for trading or speculative purposes. Our derivatives are with major international financial institutions, with whom we have master netting agreements; however, our derivative positions are not disclosed on a net basis. There are no credit-risk-related contingent features within our derivative instruments.
Convertible Debt
Our convertible notes are separated into their liability and equity components in a manner that reflects our non-convertible debt borrowing rate, which we determined to be 7.38% at the time of the convertible notes issuance in August 2006. Upon derecognition of the convertible notes, we are required to remeasure the fair value of the liability and equity components using a borrowing rate for similar non-convertible debt that would be applicable to Itron at the date of the derecognition. Any increase or decrease in borrowing rates from the inception of the debt to the date of derecognition could result in a gain or loss, respectively, on extinguishment. Based on market conditions and our credit rating at the date of derecognition, the borrowing rate could be materially different from the rate determined at the inception of the convertible debt. At December 31, 2010, we classified the convertible notes as current due to the combination of put, call, and conversion options commencing on July 1, 2011.
Defined Benefit Pension Plans
We sponsor both funded and unfunded non-U.S. defined benefit pension plans. We recognize a liability for the projected benefit obligation in excess of plan assets or an asset for plan assets in excess of the projected benefit obligation. We also
28
Table of Contents
recognize the funded status of our defined benefit pension plans on our Consolidated Balance Sheets and recognize as a component of other comprehensive income (OCI), net of tax, the actuarial gains or losses and prior service costs or credits, if any, that arise during the period but are not recognized as components of net periodic benefit cost.
Several economic assumptions and actuarial data are used in calculating the expense and obligations related to these plans. The assumptions are updated annually at December 31 and include the discount rate, the expected remaining service life, the expected rate of return on plan assets, and rate of future compensation increase. The discount rate is a significant assumption used to value our pension benefit obligation. We determine a discount rate for our plans based on the estimated duration of each plan’s liabilities. For our euro denominated defined benefit pension plans, which represent 94% of our benefit obligation, we use two discount rates, (separated between shorter and longer duration plans), using a hypothetical yield curve developed from euro-denominated AA-rated corporate bond issues, partially weighted for market value, with minimum amounts outstanding of €250 million for bonds with less than 10 years to maturity and €50 million for bonds with 10 or more years to maturity, and excluding 10% of the highest and lowest yielding bonds within each maturity group. The discount rates derived for our shorter duration euro denominated plans (less than 10 years) and longer duration plans (greater than 10 years) were 4.50% and 5.25%, respectively. The weighted average discount rate used to measure the projected benefit obligation for all of the plans at December 31, 2010 was 5.35%. A change of 25 basis points in the discount rate would change our pension benefit obligation by approximately $2.5 million. The financial and actuarial assumptions used at December 31, 2010 may differ materially from actual results due to changing market and economic conditions and other factors. These differences could result in a significant change in the amount of pension expense recorded in future periods. Gains and losses resulting from changes in actuarial assumptions, including the discount rate, are recognized in OCI in the period in which they occur.
Our general funding policy for these qualified pension plans is to contribute amounts at least sufficient to satisfy funding standards of the respective countries for each plan. Refer to Item 8: “Financial Statements and Supplementary Data, Note 8: Defined Benefit Pension Plans” for our expected contributions for 2011.
Stock-Based Compensation
We measure and recognize compensation expense for all stock-based awards made to employees and directors, including awards of stock options, stock sold pursuant to our Employee Stock Purchase Plan (ESPP), and the issuance of restricted and unrestricted stock awards and units, based on estimated fair values. The fair values of stock options and ESPP awards are estimated at the date of grant using the Black-Scholes option-pricing model, which includes assumptions for the dividend yield, expected volatility, risk-free interest rate, and expected life. In valuing our stock-based awards, significant judgment is required in determining the expected volatility of our common stock and the expected life that individuals will hold their stock-based awards prior to exercising. Expected volatility is based on the historical and implied volatility of our own common stock. The expected life of stock option grants is derived from the historical actual term of option grants and an estimate of future exercises during the remaining contractual period of the option. While volatility and estimated life are assumptions that do not bear the risk of change subsequent to the grant date of stock-based awards, these assumptions may be difficult to measure as they represent future expectations based on historical experience. Further, our expected volatility and expected life may change in the future, which could substantially change the grant-date fair value of future awards of stock options and ultimately the expense we record. For restricted and unrestricted stock awards and units, the fair value is the market close price of our common stock on the date of grant. We consider many factors when estimating expected forfeitures, including types of awards, employee class, and historical experience. Actual results and future estimates may differ substantially from our current estimates. We expense stock-based compensation, adjusted for estimated forfeitures, using primarily the straight-line method over the required vesting period. For awards with a performance and service condition, we expense stock-based compensation, adjusted for estimated forfeitures, using graded vesting. Our excess tax benefit cannot be credited to common stock until the deduction reduces cash taxes payable. When we have tax deductions in excess of the compensation cost, they are classified as financing cash inflows in the Consolidated Statements of Cash Flows.
New Accounting Pronouncements
Refer to Item 8: “Financial Statements and Supplementary Data, Note 1: Summary of Significant Accounting Policies” included in this Annual Report on Form 10-K.
29
Table of Contents
| Item 7A: | Quantitative and Qualitative Disclosures about Market Risk |
In the normal course of business, we are exposed to interest rate and foreign currency exchange rate risks that could impact our financial position and results of operations. As part of our risk management strategy, we use derivative financial instruments to hedge certain foreign currency and interest rate exposures. Our objective is to offset gains and losses resulting from these exposures with losses and gains on the derivative contracts used to hedge them, therefore reducing the impact of volatility on earnings or protecting the fair values of assets and liabilities. We use derivative contracts only to manage existing underlying exposures. Accordingly, we do not use derivative contracts for trading or speculative purposes.
Interest Rate Risk
The table below provides information about our financial instruments that are sensitive to changes in interest rates and the scheduled minimum repayment of principal and estimated cash interest payments over the remaining lives of our debt at December 31, 2010. Including the effect of our interest rate swaps at December 31, 2010, 93% of our borrowings are at fixed rates. Weighted average variable rates in the table are based on implied forward rates in the Bloomberg U.S. dollar yield curve as of December 31, 2010, our estimated leverage ratio, which determines our additional interest rate margin, and a static foreign exchange rate at December 31, 2010.
| 2011 | 2012 | 2013 | 2014 | Total | ||||||||||||||||
| (in thousands) | ||||||||||||||||||||
|
Fixed Rate Debt |
||||||||||||||||||||
|
Principal: Convertible notes (1) |
$ | 223,604 | $ | - | $ | - | $ | - | $ | 223,604 | ||||||||||
|
Interest rate |
2.50% | |||||||||||||||||||
|
Variable Rate Debt |
||||||||||||||||||||
|
Principal: U.S. dollar term loan |
$ | 6,051 | $ | 6,051 | $ | 6,051 | $ | 200,489 | $ | 218,642 | ||||||||||
|
Average interest rate |
4.12% | 4.29% | 4.76% | 5.23% | ||||||||||||||||
|
Principal: Euro term loan |
$ | 4,402 | $ | 4,402 | $ | 4,402 | $ | 160,825 | $ | 174,031 | ||||||||||
|
Average interest rate |
4.83% | 5.06% | 5.39% | 5.70% | ||||||||||||||||
|
Interest rate swaps on U.S. dollar term loan (2) |
||||||||||||||||||||
|
Average interest rate (Pay) |
2.13% | |||||||||||||||||||
|
Average interest rate (Receive) |
0.43% | |||||||||||||||||||
|
Net/Spread |
(1.70%) | |||||||||||||||||||
|
Interest rate swap on euro term loan (3) |
||||||||||||||||||||
|
Average interest rate (Pay) |
6.59% | 6.59% | ||||||||||||||||||
|
Average interest rate (Receive) |
3.28% | 3.56% | ||||||||||||||||||
|
Net/Spread |
(3.31%) | (3.03%) | ||||||||||||||||||
| (1) |
The face value of our convertible notes is $223.6 million, while the carrying value is $218.3 million. (Refer to Item 8: “Financial Statements and Supplementary Data, Note 6: Debt” for a summary of our convertible note terms and a reconciliation between the face and carrying values). Our convertible notes mature in August 2026. We are amortizing the remaining $5.3 million discount on the liability component of the convertible notes to interest expense over the next six months and have reflected the principal repayment in 2011 due to the combination of put, call, and conversion options. |
| (2) |
The one-year interest rate swaps are used to convert $200 million of our $218.6 million U.S. dollar denominated variable rate term loan from a floating London Interbank Offered Rate interest rate, plus the applicable margin, to a fixed interest rate, plus the applicable margin (refer to Item 8: “Financial Statements and Supplementary Data, Note 7: Derivative Financial Instruments and Hedging Activities”). |
| (3) |
The amortizing euro denominated interest rate swap is used to convert $147.7 million (€112.4 million) of our $174.0 million (€132.4 million) euro denominated variable rate term loan from a floating Euro Interbank Offered Rate (EURIBOR), plus the applicable margin, to a fixed interest rate of 6.59%, through December 31, 2012, plus or minus the variance in the applicable margin from 2%. As a result of the amortization schedule, the interest rate swap |
30
Table of Contents
|
will terminate before the stated maturity of the term loan (Refer to Item 8: “Financial Statements and Supplementary Data, Note 7: Derivative Financial Instruments and Hedging Activities”). |
Based on a sensitivity analysis as of December 31, 2010, we estimate that if market interest rates average one percentage point higher in 2011 than in the table above, our earnings in 2011 would not be materially impacted due to our interest rate swaps in place at December 31, 2010.
We continually monitor and assess our interest rate risk and may institute additional interest rate swaps or other derivative instruments to manage such risk in the future.
Foreign Currency Exchange Rate Risk
We conduct business in a number of countries. As a result, the majority of our revenues and operating expenses are denominated in foreign currencies, which expose our account balances to movements in foreign currency exchange rates that could have a material effect on our financial results. Our primary foreign currency exposure relates to non-U.S. dollar denominated transactions in our international subsidiary operations, the most significant of which is the euro. Revenues denominated in functional currencies other than the U.S. dollar were 50% of total revenues for the year ended December 31, 2010, compared with 64% and 66% for years ended December 31, 2009 and 2008.
In conjunction with our acquisition of Actaris Metering Systems SA, we entered into a euro denominated term loan in 2007 that exposes us to fluctuations in the euro foreign exchange rate. We have designated this foreign currency denominated term loan as a hedge of our net investment in international operations. The non-functional currency term loan is revalued into U.S. dollar at each balance sheet date, and the changes in value associated with currency fluctuations are recorded as adjustments to long-term debt with offsetting gains and losses recorded in other comprehensive income. We had no hedge ineffectiveness (refer to Item 8: “Financial Statements and Supplementary Data, Note 7: Derivative Financial Instruments and Hedging Activities”).
We are also exposed to foreign exchange risk when we enter into non-functional currency transactions, both intercompany and third-party. At each period-end, foreign currency monetary assets and liabilities are revalued with the change recorded to other income and expense. We enter into monthly foreign exchange forward contracts (a total of 164 contracts were entered into during the year ended December 31, 2010), not designated for hedge accounting, with the intent to reduce earnings volatility associated with certain of these balances. The notional amounts of the contracts ranged from $200,000 to $48 million, offsetting our exposures from the euro, British pound, Canadian dollar, Czech koruna, Hungarian forint, and various other currencies.
In future periods, we may use additional derivative contracts to protect against foreign currency exchange rate risks.
31
Table of Contents
| ITEM 8: | FINANCIAL STATEMENTS AND SUPPLEMENTARY DATA |
REPORT OF MANAGEMENT
To the Board of Directors and Shareholders of Itron, Inc.
Management is responsible for the preparation of our consolidated financial statements and related information appearing in this Annual Report on Form 10-K. Management believes that the consolidated financial statements fairly reflect the form and substance of transactions and that the financial statements reasonably present our financial position, results of operations, and cash flows in conformity with U.S. generally accepted accounting principles. Management has included in our financial statements amounts based on estimates and judgments that it believes are reasonable under the circumstances.
Management’s explanation and interpretation of our overall operating results and financial position, with the basic financial statements presented, should be read in conjunction with the entire report. The notes to the consolidated financial statements, an integral part of the basic financial statements, provide additional detailed financial information. Our Board of Directors has an Audit and Finance Committee composed of independent directors. The Committee meets regularly with financial management and Ernst & Young LLP to review internal control, auditing, and financial reporting matters.
|
Malcolm Unsworth |
Steven M. Helmbrecht |
|
|
President and Chief Executive Officer |
Sr. Vice President and Chief Financial Officer |
32
Table of Contents
REPORT OF INDEPENDENT REGISTERED PUBLIC ACCOUNTING FIRM
The Board of Directors and Shareholders of Itron, Inc.
We have audited the accompanying consolidated balance sheets of Itron, Inc. as of December 31, 2010 and 2009, and the related consolidated statements of operations, shareholders’ equity, and cash flows for each of the three years in the period ended December 31, 2010. Our audits also included the financial statement schedule listed in the Index at Item 15(a)(2). These financial statements and schedule are the responsibility of the Company’s management. Our responsibility is to express an opinion on these financial statements and schedule based on our audits.
We conducted our audits in accordance with the standards of the Public Company Accounting Oversight Board (United States). Those standards require that we plan and perform the audit to obtain reasonable assurance about whether the financial statements are free of material misstatement. An audit includes examining, on a test basis, evidence supporting the amounts and disclosures in the financial statements. An audit also includes assessing the accounting principles used and significant estimates made by management, as well as evaluating the overall financial statement presentation. We believe that our audits provide a reasonable basis for our opinion.
In our opinion, the financial statements referred to above present fairly, in all material respects, the consolidated financial position of Itron, Inc. at December 31, 2010 and 2009, and the consolidated results of its operations and its cash flows for each of the three years in the period ended December 31, 2010, in conformity with U.S. generally accepted accounting principles. Also, in our opinion, the related financial statement schedule, when considered in relation to the basic financial statements taken as a whole, presents fairly, in all material respects, the information set forth therein.
We also have audited, in accordance with the standards of the Public Company Accounting Oversight Board (United States), Itron, Inc.’s internal control over financial reporting as of December 31, 2010, based on criteria established in Internal Control-Integrated Framework issued by the Committee of Sponsoring Organizations of the Treadway Commission and our report dated February 24, 2011 expressed an unqualified opinion thereon.
/s/ ERNST & YOUNG LLP
Seattle, Washington
February 24, 2011
33
Table of Contents
| Year Ended December 31, | ||||||||||||
| 2010 | 2009 | 2008 | ||||||||||
| (in thousands, except per share data) | ||||||||||||
|
Revenues |
$ | 2,259,271 | $ | 1,687,447 | $ | 1,909,613 | ||||||
|
Cost of revenues |
1,561,032 | 1,149,991 | 1,262,756 | |||||||||
|
Gross profit |
698,239 | 537,456 | 646,857 | |||||||||
|
Operating expenses |
||||||||||||
|
Sales and marketing |
171,676 | 152,405 | 167,457 | |||||||||
|
Product development |
140,229 | 122,314 | 120,699 | |||||||||
|
General and administrative |
133,086 | 119,137 | 128,515 | |||||||||
|
Amortization of intangible assets |
69,051 | 98,573 | 120,364 | |||||||||
|
Total operating expenses |
514,042 | 492,429 | 537,035 | |||||||||
|
Operating income |
184,197 | 45,027 | 109,822 | |||||||||
|
Other income (expense) |
||||||||||||
|
Interest income |
592 | 1,186 | 5,970 | |||||||||
|
Interest expense |
(54,904) | (70,311) | (94,177) | |||||||||
|
Loss on extinguishment of debt, net |
- | (12,800) | - | |||||||||
|
Other income (expense), net |
(9,141) | (9,176) | (3,033) | |||||||||
|
Total other income (expense) |
(63,453) | (91,101) | (91,240) | |||||||||
|
Income (loss) before income taxes |
120,744 | (46,074) | 18,582 | |||||||||
|
Income tax (provision) benefit |
(15,974) | 43,825 | 1,229 | |||||||||
|
Net income (loss) |
$ | 104,770 | $ | (2,249) | $ | 19,811 | ||||||
|
Earnings (loss) per common share-Basic |
$ | 2.60 | $ | (0.06) | $ | 0.60 | ||||||
|
Earnings (loss) per common share-Diluted |
$ | 2.56 | $ | (0.06) | $ | 0.57 | ||||||
|
Weighted average common shares outstanding-Basic |
40,337 | 38,539 | 33,096 | |||||||||
|
Weighted average common shares outstanding-Diluted |
40,947 | 38,539 | 34,951 | |||||||||
The accompanying notes are an integral part of these consolidated financial statements.
34
Table of Contents
| December 31 | ||||||||
| 2010 | 2009 | |||||||
| (in thousands) | ||||||||
| ASSETS | ||||||||
|
Current assets |
||||||||
|
Cash and cash equivalents |
$ | 169,477 | $ | 121,893 | ||||
|
Accounts receivable, net |
371,662 | 337,948 | ||||||
|
Inventories |
208,157 | 170,084 | ||||||
|
Deferred tax assets current, net |
55,351 | 20,762 | ||||||
|
Other current assets |
77,570 | 75,229 | ||||||
|
Total current assets |
882,217 | 725,916 | ||||||
|
Property, plant, and equipment, net |
299,242 | 318,217 | ||||||
|
Prepaid debt fees |
4,483 | 8,628 | ||||||
|
Deferred tax assets noncurrent, net |
35,050 | 89,932 | ||||||
|
Other noncurrent assets |
23,759 | 18,117 | ||||||
|
Intangible assets, net |
291,670 | 388,212 | ||||||
|
Goodwill |
1,209,376 | 1,305,599 | ||||||
|
Total assets |
$ | 2,745,797 | $ | 2,854,621 | ||||
| LIABILITIES AND SHAREHOLDERS’ EQUITY | ||||||||
|
Current liabilities |
||||||||
|
Accounts payable |
$ | 241,949 | $ | 219,255 | ||||
|
Other current liabilities |
49,243 | 64,583 | ||||||
|
Wages and benefits payable |
110,479 | 71,592 | ||||||
|
Taxes payable |
19,725 | 14,377 | ||||||
|
Current portion of debt |
228,721 | 10,871 | ||||||
|
Current portion of warranty |
24,912 | 20,941 | ||||||
|
Unearned revenue |
28,258 | 40,140 | ||||||
|
Deferred tax liabilities current, net |
447 | 1,625 | ||||||
|
Total current liabilities |
703,734 | 443,384 | ||||||
|
Long-term debt |
382,220 | 770,893 | ||||||
|
Long-term warranty |
26,371 | 12,932 | ||||||
|
Pension plan benefit liability |
61,450 | 63,040 | ||||||
|
Deferred tax liabilities noncurrent, net |
54,412 | 80,695 | ||||||
|
Other long-term obligations |
89,315 | 83,163 | ||||||
|
Total liabilities |
1,317,502 | 1,454,107 | ||||||
|
Commitments and contingencies |
||||||||
|
Shareholders’ equity |
||||||||
|
Preferred stock, no par value, 10 million shares authorized, no shares issued or outstanding |
- | - | ||||||
|
Common stock, no par value, 75 million shares authorized, 40,431 and 40,143 shares issued and outstanding |
1,328,249 | 1,299,134 | ||||||
|
Accumulated other comprehensive income (loss), net |
(34,974) | 71,130 | ||||||
|
Retained earnings |
135,020 | 30,250 | ||||||
|
Total shareholders’ equity |
1,428,295 | 1,400,514 | ||||||
|
Total liabilities and shareholders’ equity |
$ | 2,745,797 | $ | 2,854,621 | ||||
The accompanying notes are an integral part of these consolidated financial statements.
35
Table of Contents
CONSOLIDATED STATEMENTS OF SHAREHOLDERS’ EQUITY
(in thousands)
| Shares | Amount |
Accumulated
Other Comprehensive Income |
Retained
Earnings |
Total | ||||||||||||||||
|
Balances at December 31, 2007 |
30,636 | $ | 651,079 | $ | 126,668 | $ | 12,688 | $ | 790,435 | |||||||||||
|
Net income |
19,811 | 19,811 | ||||||||||||||||||
|
Foreign currency translation adjustment, net of income tax benefit of $10,740 |
(92,069) | (92,069) | ||||||||||||||||||
|
Net unrealized loss on derivative instruments, designated as cash flow hedges, net of income tax benefit of $5,736 |
(9,239) | (9,239) | ||||||||||||||||||
|
Net unrealized gain on non derivative hedging instrument, net of income tax provision of $3,875 |
6,485 | 6,485 | ||||||||||||||||||
|
Net hedging gain reclassified into net income, net of income tax benefit of $296 |
(477) | (477) | ||||||||||||||||||
|
Pension plan benefit liability adjustment, net of income tax provision of $1,164 |
2,725 | 2,725 | ||||||||||||||||||
|
Total comprehensive loss |
(72,764) | |||||||||||||||||||
|
Stock issues: |
||||||||||||||||||||
|
Options exercised |
415 | 10,822 | 10,822 | |||||||||||||||||
|
Issuance of stock-based compensation awards |
4 | 269 | 269 | |||||||||||||||||
|
Employee stock purchase plan |
32 | 2,629 | 2,629 | |||||||||||||||||
|
Stock-based compensation expense |
16,313 | 16,313 | ||||||||||||||||||
|
Issuance of common stock |
3,399 | 311,072 | 311,072 | |||||||||||||||||
|
Balances at December 31, 2008 |
34,486 | $ | 992,184 | $ | 34,093 | $ | 32,499 | $ | 1,058,776 | |||||||||||
|
Net loss |
(2,249) | (2,249) | ||||||||||||||||||
|
Foreign currency translation adjustment, net of income tax provision of $6,714 |
40,992 | 40,992 | ||||||||||||||||||
|
Net unrealized loss on derivative instruments, designated as cash flow hedges, net of income tax benefit of $4,247 |
(6,776) | (6,776) | ||||||||||||||||||
|
Net unrealized loss on nonderivative hedging instrument, net of income tax benefit of $1,502 |
(2,364) | (2,364) | ||||||||||||||||||
|
Net hedging loss reclassified into net loss, net of income tax provision of $5,363 |
8,612 | 8,612 | ||||||||||||||||||
|
Pension plan benefit liability adjustment, net of income tax benefit of $1,106 |
(3,427) | (3,427) | ||||||||||||||||||
|
Total comprehensive income |
34,788 | |||||||||||||||||||
|
Stock issues: |
||||||||||||||||||||
|
Options exercised |
146 | 3,168 | 3,168 | |||||||||||||||||
|
Restricted stock awards released |
30 | - | - | |||||||||||||||||
|
Issuance of stock-based compensation awards |
4 | 254 | 254 | |||||||||||||||||
|
Employee stock purchase plan |
62 | 2,934 | 2,934 | |||||||||||||||||
|
Stock-based compensation expense |
16,728 | 16,728 | ||||||||||||||||||
|
Exchange of debt for common stock |
2,252 | 123,442 | 123,442 | |||||||||||||||||
|
Issuance of common stock |
3,163 | 160,424 | 160,424 | |||||||||||||||||
|
Balances at December 31, 2009 |
40,143 | $ | 1,299,134 | $ | 71,130 | $ | 30,250 | $ | 1,400,514 | |||||||||||
|
Net income |
104,770 | 104,770 | ||||||||||||||||||
|
Foreign currency translation adjustment, net of income tax provision of $3,160 |
(124,191) | (124,191) | ||||||||||||||||||
|
Net unrealized loss on derivative instruments, designated as cash flow hedges, net of income tax benefit of $1,611 |
(2,930) | (2,930) | ||||||||||||||||||
|
Net unrealized loss on nonderivative hedging instrument, net of income tax provision of $9,935 |
15,825 | 15,825 | ||||||||||||||||||
|
Net hedging loss reclassified into net income, net of income tax provision of $4,458 |
7,371 | 7,371 | ||||||||||||||||||
|
Pension plan benefit liability adjustment, net of income tax benefit of $895 |
(2,179) | (2,179) | ||||||||||||||||||
|
Total comprehensive loss |
(1,334) | |||||||||||||||||||
|
Stock issues: |
||||||||||||||||||||
|
Options exercised |
148 | 5,933 | 5,933 | |||||||||||||||||
|
Restricted stock awards released |
84 | - | - | |||||||||||||||||
|
Issuance of stock-based compensation awards |
5 | 364 | 364 | |||||||||||||||||
|
Employee stock purchase plan |
51 | 2,843 | 2,843 | |||||||||||||||||
|
Stock-based compensation expense |
18,743 | 18,743 | ||||||||||||||||||
|
Employee stock plans income tax benefits |
1,232 | 1,232 | ||||||||||||||||||
|
Balances at December 31, 2010 |
40,431 | $ | 1,328,249 | $ | (34,974) | $ | 135,020 | $ | 1,428,295 | |||||||||||
The accompanying notes are an integral part of these consolidated financial statements.
36
Table of Contents
| Year Ended December 31, | ||||||||||||
| 2010 | 2009 | 2008 | ||||||||||
| (in thousands) | ||||||||||||
|
Operating activities |
||||||||||||
|
Net income (loss) |
$ | 104,770 | $ | (2,249) | $ | 19,811 | ||||||
|
Adjustments to reconcile net income (loss) to net cash provided by operating activities: |
||||||||||||
|
Depreciation and amortization |
131,205 | 155,737 | 173,673 | |||||||||
|
Stock-based compensation |
19,107 | 16,982 | 16,582 | |||||||||
|
Excess tax benefits from stock-based compensation |
(1,232) | - | - | |||||||||
|
Amortization of prepaid debt fees |
5,492 | 8,258 | 8,917 | |||||||||
|
Amortization of convertible debt discount |
10,099 | 9,673 | 13,442 | |||||||||
|
Loss on extinguishment of debt, net |
- | 9,960 | - | |||||||||
|
Deferred taxes, net |
(17,992) | (64,216) | (43,317) | |||||||||
|
Other adjustments, net |
6,797 | 3,102 | (2,177) | |||||||||
|
Changes in operating assets and liabilities, net of acquisitions: |
||||||||||||
|
Accounts receivable |
(45,612) | (2,962) | 19,864 | |||||||||
|
Inventories |
(41,417) | 3,535 | 4,914 | |||||||||
|
Accounts payables, other current liabilities, and taxes payable |
40,884 | 9,873 | (6,549) | |||||||||
|
Wages and benefits payable |
42,245 | (8,261) | 7,708 | |||||||||
|
Unearned revenue |
(2,356) | 14,836 | 3,936 | |||||||||
|
Warranty |
14,656 | (5,273) | (2,242) | |||||||||
|
Other operating, net |
(12,055) | (8,208) | (21,416) | |||||||||
|
Net cash provided by operating activities |
254,591 | 140,787 | 193,146 | |||||||||
|
Investing activities |
||||||||||||
|
Acquisitions of property, plant, and equipment |
(62,822) | (52,906) | (63,430) | |||||||||
|
Business acquisitions & contingent consideration, net of cash equivalents acquired |
- | (4,317) | (6,897) | |||||||||
|
Other investing, net |
6,548 | 3,229 | 3,252 | |||||||||
|
Net cash used in investing activities |
(56,274) | (53,994) | (67,075) | |||||||||
|
Financing activities |
||||||||||||
|
Payments on debt |
(155,163) | (275,796) | (388,371) | |||||||||
|
Issuance of common stock |
8,776 | 166,372 | 324,494 | |||||||||
|
Prepaid debt fees |
(1,347) | (3,936) | (214) | |||||||||
|
Excess tax benefits from stock-based compensation |
1,232 | - | - | |||||||||
|
Other financing, net |
(2,135) | (761) | 715 | |||||||||
|
Net cash used in financing activities |
(148,637) | (114,121) | (63,376) | |||||||||
|
Effect of foreign exchange rate changes on cash and cash equivalents |
(2,096) | 4,831 | (10,293) | |||||||||
|
Increase (decrease) in cash and cash equivalents |
47,584 | (22,497) | 52,402 | |||||||||
|
Cash and cash equivalents at beginning of period |
121,893 | 144,390 | 91,988 | |||||||||
|
Cash and cash equivalents at end of period |
$ | 169,477 | $ | 121,893 | $ | 144,390 | ||||||
|
Non-cash transactions: |
||||||||||||
|
Property, plant, and equipment purchased but not yet paid, net |
$ | (5,921) | $ | 3,719 | $ | 2,796 | ||||||
|
Exchange of debt (face value) for common stock (see Note 6) |
- | 120,984 | 29 | |||||||||
|
Contingent consideration payable for previous acquisitions |
- | - | 1,295 | |||||||||
|
Supplemental disclosure of cash flow information: |
||||||||||||
|
Cash paid during the period for: |
||||||||||||
|
Income taxes |
$ | 30,142 | $ | 31,720 | $ | 26,377 | ||||||
|
Interest, net of amounts capitalized |
39,315 | 54,503 | 72,304 | |||||||||
The accompanying notes are an integral part of these consolidated financial statements.
.
37
Table of Contents
NOTES TO CONSOLIDATED FINANCIAL STATEMENTS
DECEMBER 31, 2010
In this Annual Report on Form 10-K, the terms “we,” “us,” “our,” “Itron,” and the “Company” refer to Itron, Inc.
We were incorporated in the state of Washington in 1977. We provide a portfolio of products and services to utilities for the energy and water markets throughout the world.
Financial Statement Preparation
The consolidated financial statements presented in this Annual Report on Form 10-K include the Consolidated Statements of Operations, Shareholders’ Equity, and Cash Flows for the years ended December 31, 2010, 2009, and 2008 and the Consolidated Balance Sheets as of December 31, 2010 and 2009 of Itron, Inc. and its subsidiaries.
Basis of Consolidation
We consolidate all entities in which we have a greater than 50% ownership interest or in which we exercise control over the operations. We use the equity method of accounting for entities in which we have a 50% or less investment and exercise significant influence. Entities in which we have less than a 20% investment and where we do not exercise significant influence are accounted for under the cost method. We consider for consolidation any variable interest entity of which we are the primary beneficiary. At December 31, 2010, our investments in variable interest entities and noncontrolling interests were not material. Intercompany transactions and balances have been eliminated upon consolidation.
Cash and Cash Equivalents
We consider all highly liquid instruments with remaining maturities of three months or less at the date of acquisition to be cash equivalents.
Accounts Receivable and Allowance for Doubtful Accounts
Accounts receivable are recorded for invoices issued to customers in accordance with our contractual arrangements. Interest and late payment fees are minimal. Unbilled receivables are recorded when revenues are recognized upon product shipment or service delivery and invoicing occurs at a later date. The allowance for doubtful accounts is based on our historical experience of bad debts and our specific review of outstanding receivables at period-end. Accounts receivable are written-off against the allowance when we believe an account, or a portion thereof, is no longer collectible.
Inventories
Inventories are stated at the lower of cost or market using the first-in, first-out method. Cost includes raw materials and labor, plus applied direct and indirect costs.
Derivative Instruments
All derivative instruments, whether designated in hedging relationships or not, are recorded on the Consolidated Balance Sheets at fair value as either assets or liabilities. The components and fair values of our derivative instruments, which are primarily interest rate swaps, are determined using the fair value measurements of significant other observable inputs (Level 2), as defined by generally accepted accounting principles (GAAP). The net fair value of our derivative instruments may switch between a net asset and a net liability depending on market circumstances at the end of the period. We include the effect of our counterparty credit risk based on current published credit default swap rates when the net fair value of our derivative instruments are in a net asset position and the effect of our own nonperformance risk when the net fair value of our derivative instruments are in a net liability position.
For any derivative designated as a fair value hedge, the changes in the fair value of the derivative and of the hedged item attributable to the hedged risk are recognized in earnings. For any derivative designated as a cash flow hedge, the effective portions of changes in the fair value of the derivative are recorded as a component of other comprehensive income (OCI) and are recognized in earnings when the hedged item affects earnings. For our hedge of a net investment, the effective portion of any unrealized gain or loss from the foreign currency revaluation of the hedging instrument is reported in OCI as a net unrealized gain or loss on derivative instruments. Ineffective portions of fair value changes or the changes in fair value of derivative instruments that do not qualify for hedging activities are recognized in other income (expense) in the Consolidated Statements of Operations. We classify cash flows from our derivative programs as cash flows from operating activities in the Consolidated Statements of Cash Flows.
38
Table of Contents
Derivatives are not used for trading or speculative purposes. Our derivatives are with major international financial institutions, with whom we have master netting agreements; however, our derivative positions are not disclosed on a net basis. There are no credit-risk-related contingent features within our derivative instruments. Refer to Note 7 for further disclosures of our derivative instruments and their impact on OCI.
Property, Plant, and Equipment
Property, plant, and equipment are stated at cost less accumulated depreciation. Depreciation is computed using the straight-line method over the estimated useful lives of the assets, generally thirty years for buildings and improvements and three to five years for machinery and equipment, computers and purchased software, and furniture. Leasehold improvements are capitalized and amortized over the term of the applicable lease, including renewable periods if reasonably assured, or over the useful lives, whichever is shorter. Construction in process represents capital expenditures incurred for assets not yet placed in service. Costs related to internally developed software and software purchased for internal uses are capitalized and are amortized over the estimated useful lives of the assets. Repair and maintenance costs are expensed as incurred. We have no major planned maintenance activities.
We review long-lived assets for impairment whenever events or circumstances indicate the carrying amount of an asset or asset group may not be recoverable. We have had no significant impairments of long-lived assets. Assets held for sale are classified within other current assets in the Consolidated Balance Sheets, are reported at the lower of the carrying amount or fair value less costs to sell, and are no longer depreciated. We had no assets held for sale at December 31, 2010 or 2009.
Prepaid Debt Fees
Prepaid debt fees represent the capitalized direct costs incurred related to the issuance of debt and are recorded as noncurrent assets. These costs are amortized to interest expense over the lives of the respective borrowings, including contingent maturity or call features, using the effective interest method, or straight-line method when associated with a revolving credit facility. When debt is repaid early, the related portion of unamortized prepaid debt fees is written-off and included in interest expense.
Business Combinations
On the date of acquisition, the assets acquired, liabilities assumed, and any noncontrolling interests in the acquiree are recorded at their fair values. The acquiree results of operations are also included as of the date of acquisition in the consolidated results. Intangible assets that arise from contractual/legal rights, or are capable of being separated, as well as in-process research and development, are measured and recorded at fair value, and amortized over the estimated useful life. If practicable, assets acquired and liabilities assumed arising from contingencies are measured and recorded at fair value. If not practicable, such assets and liabilities are measured and recorded when it is probable that a gain or loss has occurred and the amount can be reasonably estimated. The residual balance of the purchase price, after fair value allocations to all identified assets and liabilities, represents goodwill. Acquisition-related costs are expensed as incurred. Restructuring costs are generally expensed in periods subsequent to the acquisition date, and changes in deferred tax asset valuation allowances and acquired income tax uncertainties, including penalties and interest, after the measurement period are recognized as a component of provision for income taxes.
Goodwill and Intangible Assets
Goodwill and intangible assets have resulted from our acquisitions. We use estimates in determining and assigning the fair value of goodwill and intangible assets at acquisition, including estimates of useful lives of intangible assets, the amount and timing of related future cash flows, and fair values of the related operations. Our intangible assets have finite lives, are amortized over their estimated useful lives based on estimated discounted cash flows, and are tested for impairment when events or changes in circumstances indicate the carrying value may not be recoverable.
Goodwill is assigned to our reporting units based on the expected benefit from the synergies arising from each business combination, determined by using certain financial metrics, including the forecasted discounted cash flows associated with each reporting unit. Goodwill is tested for impairment as of October 1 of each year, or more frequently if a significant impairment indicator occurs. Determining the fair value of a reporting unit is judgmental in nature and involves the use of significant estimates and assumptions. We forecast discounted future cash flows at the reporting unit level using risk-adjusted discount rates and estimated future revenues and operating costs, which take into consideration factors such as existing backlog, expected future orders, supplier contracts, and expectations of competitive and economic environments. We also identify similar publicly traded companies and develop a correlation, referred to as a multiple, to apply to the operating results of our reporting units.
39
Table of Contents
Contingencies
A loss contingency is recorded if it is probable that an asset has been impaired or a liability has been incurred and the amount of the loss can be reasonably estimated. We evaluate, among other factors, the degree of probability of an unfavorable outcome and our ability to make a reasonable estimate of the amount of the ultimate loss. Loss contingencies that we determine to be reasonably possible, but not probable, are disclosed. Changes in these factors and related estimates could materially affect our financial position and results of operations.
Bonus and Profit Sharing
We have various employee bonus and profit sharing plans, which provide award amounts for the achievement of annual financial and nonfinancial targets. If management determines it is probable that the targets will be achieved, and the amounts can be reasonably estimated, a compensation accrual is recorded based on the proportional achievement of the financial and nonfinancial targets. Although we monitor and accrue expenses quarterly based on our progress toward the achievement of the annual targets, the actual results at the end of the year may require awards that are significantly greater or less than the estimates made in earlier quarters.
Warranty
We offer standard warranties on our hardware products and large application software products. We accrue the estimated cost of warranty claims based on historical and projected product performance trends and costs. Testing of new products in the development stage helps identify and correct potential warranty issues prior to manufacturing. Continuing quality control efforts during manufacturing reduce our exposure to warranty claims. If our quality control efforts fail to detect a fault in one of our products, we could experience an increase in warranty claims. We track warranty claims to identify potential warranty trends. If an unusual trend is noted, an additional warranty accrual may be assessed and recorded when a failure event is probable and the cost can be reasonably estimated. Management continually evaluates the sufficiency of the warranty provisions and makes adjustments when necessary. The warranty allowances may fluctuate due to changes in estimates for material, labor, and other costs we may incur to repair or replace projected product failures, and we may incur additional warranty and related expenses in the future with respect to new or established products, which could adversely affect our financial position and results of operations. The long-term warranty balance includes estimated warranty claims beyond one year. Warranty expense is classified within cost of revenues.
Defined Benefit Pension Plans
We sponsor both funded and unfunded non-U.S. defined benefit pension plans. We recognize a liability for the projected benefit obligation in excess of plan assets or an asset for plan assets in excess of the projected benefit obligation. We also recognize the funded status of our defined benefit pension plans on our Consolidated Balance Sheets and recognize as a component of OCI, net of tax, the actuarial gains or losses and prior service costs or credits, if any, that arise during the period but that are not recognized as components of net periodic benefit cost.
Revenue Recognition
Revenues consist primarily of hardware sales, software license fees, software implementation, project management services, installation, consulting, and post-sale maintenance support. Revenues are recognized when (1) persuasive evidence of an arrangement exists, (2) delivery has occurred or services have been rendered, (3) the sales price is fixed or determinable, and (4) collectability is reasonably assured.
The majority of our revenue arrangements involve multiple deliverables, which combine two or more of the following: hardware, meter reading system software, installation, and project management services. Revenue arrangements with multiple deliverables are divided into separate units of accounting if the delivered item(s) has value to the customer on a standalone basis and delivery/performance of the undelivered item(s) is probable. The total arrangement consideration is allocated among the separate units of accounting based on their relative fair values and the applicable revenue recognition criteria considered for each unit of accounting. The amount allocable to a delivered item is limited to the amount that we are entitled to collect and that is not contingent upon the delivery/performance of additional items. Revenues for each deliverable are then recognized based on the type of deliverable, such as 1) when the products are shipped, 2) services are delivered, 3) percentage-of-completion when implementation services are essential to other deliverables in the arrangements, 4) upon receipt of customer acceptance, or 5) transfer of title. The majority of our revenue is recognized when products are shipped to or received by a customer or when services are provided.
We primarily enter into two types of multiple deliverable arrangements, which include a combination of hardware and associated software and services:
| • |
Arrangements that do not include the deployment of our smart metering systems and technology are recognized as follows: |
40
Table of Contents
| • |
Hardware revenues are recognized at the time of shipment, receipt by customer, or, if applicable, upon completion of customer acceptance provisions. |
| • |
If implementation services are essential to the functionality of the associated software, software and implementation revenues are recognized using either the percentage-of-completion methodology of contract accounting if project costs can be estimated, or the completed contract methodology if project costs cannot be reliably estimated. |
| • |
Arrangements to deploy our smart metering systems and technology are recognized as follows: |
| • |
Hardware revenues are recognized at the time of shipment, receipt by customer, or, if applicable, upon completion of customer acceptance provisions. |
| • |
Revenue from associated software and services is recognized using the units-of-delivery method of contract accounting, as the software is essential to the functionality of the related hardware. This methodology often results in the deferral of costs and revenues as professional services and software implementation typically commence prior to deployment of hardware. |
We also enter into multiple deliverable software arrangements that do not include hardware. For this type of arrangement, revenue recognition is dependent upon the availability of vendor specific objective evidence (VSOE) for fair value for each of the deliverables. The lack of VSOE, or the existence of extended payment terms or other inherent risks, may affect the timing of revenue recognition for software arrangements.
Certain of our revenue arrangements include an extended or noncustomary warranty provision which covers all or a portion of a customer’s replacement or repair costs beyond the standard or customary warranty period. Whether or not the extended warranty is separately priced in the arrangement, a portion of the arrangement’s total consideration is allocated to this extended warranty deliverable. This revenue is deferred and recognized over the extended warranty coverage period. Extended/noncustomary warranties do not represent a significant portion of our revenue.
On January 1, 2010, we adopted Financial Accounting Standards Board (FASB) Accounting Standards Update (ASU) 2009-13, Revenue Recognition (Topic 605) – Multiple-Deliverable Revenue Arrangements (a consensus of the FASB Emerging Issues Tax Force) and ASU 2009-14, Software (Topic 985), Certain Revenue Arrangements That Include Software Elements (a consensus of the FASB Emerging Issues Task Force) on a prospective basis for new arrangements and arrangements that are materially modified. This new guidance did not have a material impact on our financial statements for the year ended December 31, 2010, as we already had the ability to divide the deliverables within our revenue arrangements into separate units of accounting. Further, there would have been no change to the amount of revenue recognized in the years ended December 31, 2009 or 2008 if arrangements prior to the adoption of ASU 2009-13 and ASU 2009-14 had been subject to the measurement requirements of this new guidance.
We allocate consideration to each deliverable in an arrangement based on its relative selling price. We determine selling price using VSOE, if it exists, otherwise we use third-party evidence (TPE). If neither VSOE nor TPE of selling price exists for a unit of accounting, we use estimated selling price (ESP).
VSOE is generally limited to the price charged when the same or similar product is sold separately or, if applicable, the stated renewal rate in the agreement. If a product or service is seldom sold separately, it is unlikely that we can determine VSOE for the product or service. We define VSOE as a median price of recent standalone transactions that are priced within a narrow range. TPE is determined based on the prices charged by our competitors for a similar deliverable when sold separately.
For arrangements entered into or materially modified after January 1, 2010, if we are unable to establish selling price using VSOE or TPE, we use ESP in the allocation of arrangement consideration. The objective of ESP is to determine the price at which we would transact if the product or service were sold by us on a standalone basis. Our determination of ESP involves a weighting of several factors based on the specific facts and circumstances of the arrangement. Specifically, we consider the cost to produce the deliverable, the anticipated margin on that deliverable, the selling price and profit margin for similar parts, our ongoing pricing strategy and policies (as evident in the price list established and updated by management on a regular basis), the value of any enhancements that have been built into the deliverable, and the characteristics of the varying markets in which the deliverable is sold. We analyze the selling prices used in our allocation of arrangement consideration on
41
Table of Contents
an annual basis. Selling prices are analyzed on a more frequent basis if a significant change in our business necessitates a more timely analysis or if we experience significant variances in our selling prices.
Unearned revenue is recorded when a customer pays for products or services, but the criteria for revenue recognition have not been met as of the balance sheet date. Unearned revenues of $42.8 million and $45.4 million at December 31, 2010 and 2009 related primarily to professional services and software associated with our smart metering contracts, extended warranty, and prepaid post-contract support. Deferred cost is recorded for products or services for which ownership (typically defined as title and risk of loss) has transferred to the customer, but the criteria for revenue recognition have not been met as of the balance sheet date. Deferred costs were $10.0 million and $19.7 million at December 31, 2010 and 2009 and are recorded within other assets in the Consolidated Balance Sheets.
In all cases, hardware and software post-sale maintenance support fees are recognized ratably over the life of the related service contract. Shipping and handling costs and incidental expenses billed to customers are recorded as revenue, with the associated cost charged to cost of revenues. We record sales, use, and value added taxes billed to our customers on a net basis.
Product and Software Development Costs
Product and software development costs primarily include employee compensation and third party contracting fees. For software we develop to be marketed or sold, we capitalize development costs after technological feasibility is established. Due to the relatively short period of time between technological feasibility and the completion of product and software development, and the immaterial nature of these costs, we generally do not capitalize product and software development expenses.
Stock-Based Compensation
We measure and recognize compensation expense for all stock-based awards made to employees and directors, including stock options, stock sold pursuant to our Employee Stock Purchase Plan (ESPP), and the issuance of restricted and unrestricted stock awards and units, based on estimated fair values. The fair values of stock options and ESPP awards are estimated at the date of grant using the Black-Scholes option-pricing model, which includes assumptions for the dividend yield, expected volatility, risk-free interest rate, and expected life. For restricted and unrestricted stock awards and units, the fair value is the market close price of our common stock on the date of grant. We expense stock-based compensation, adjusted for estimated forfeitures, using the straight-line method over the required vesting period. Excess tax benefits are credited to common stock when the deduction reduces cash taxes payable. When we have tax deductions in excess of the compensation cost, they are classified as financing cash inflows in the Consolidated Statements of Cash Flows.
Loss on Extinguishment of Debt, Net
Upon partial or full redemption of our borrowings, we recognize a gain or loss for the difference between the cash paid and the net carrying amount of the debt redeemed. Included in the net carrying amount is any unamortized premium or discount from the original issuance of the debt. Due to the particular characteristics of our convertible notes, we recognize a gain or loss upon conversion or derecognition for the difference between the net carrying amount of the liability component (including any unamortized discount and debt issuance costs) and the fair value of the consideration transferred to the holder that is allocated to the liability component, which is equal to the fair value of the liability component immediately prior to extinguishment. In the case of an induced conversion, a loss is recognized for the amount of the fair value of the securities or other consideration transferred to the holder in excess of fair value of the consideration issuable in accordance with the original conversion terms of the debt.
Income Taxes
We account for income taxes using the asset and liability method of accounting. Deferred tax assets and liabilities are recognized based upon anticipated future tax consequences, in each of the jurisdictions that we operate, attributable to: (1) the differences between the financial statement carrying amounts of existing assets and liabilities and their respective income tax bases; and (2) operating loss and tax credit carryforwards. Deferred tax assets and liabilities are measured using enacted tax rates expected to apply to taxable income in the years in which those temporary differences are expected to be recovered or settled. The calculation of our tax liabilities involves applying complex tax regulations in different tax jurisdictions to our tax positions. The effect on deferred tax assets and liabilities of a change in tax rates is recognized in the period that includes the enactment date. A valuation allowance is recorded to reduce the carrying amounts of deferred tax assets if it is not more likely than not that such assets will be realized. We do not record tax liabilities on undistributed earnings of international subsidiaries that are permanently reinvested.
42
Table of Contents
Foreign Exchange
Our consolidated financial statements are reported in U.S. dollars. Assets and liabilities of international subsidiaries with a non-U.S. dollar functional currency are translated to U.S. dollars at the exchange rates in effect on the balance sheet date, or the last business day of the period, if applicable. Revenues and expenses for these subsidiaries are translated to U.S. dollars using a weighted average rate for the relevant reporting period. Translation adjustments resulting from this process are included, net of tax, in OCI. Gains and losses that arise from exchange rate fluctuations for monetary asset and liability balances that are not denominated in an entity’s functional currency are included within other income (expense), net in the Consolidated Statements of Operations. Currency gains and losses of intercompany balances deemed to be long-term in nature or designated as a hedge of the net investment in international subsidiaries are included, net of tax, in OCI.
Fair Value Measurements
For assets and liabilities measured at fair value, the GAAP fair value hierarchy prioritizes the inputs used in different valuation methodologies, assigning the highest priority to unadjusted quoted prices for identical assets and liabilities in actively traded markets (Level 1) and the lowest priority to unobservable inputs (Level 3). Level 2 inputs consist of quoted prices for similar assets and liabilities in active markets; quoted prices for identical or similar assets and liabilities in non-active markets; and model-derived valuations in which significant inputs are corroborated by observable market data either directly or indirectly through correlation or other means (inputs may include yield curves, volatility, credit risks, and default rates). We hold no assets or liabilities measured using Level 1 fair value inputs.
Use of Estimates
The preparation of financial statements in conformity with GAAP requires management to make estimates and assumptions. These estimates and assumptions affect the reported amounts of assets and liabilities at the date of the financial statements and the reported amounts of revenues and expenses during the reporting period. Due to various factors affecting future costs and operations, actual results could differ materially from these estimates.
New Accounting Pronouncements
In April 2010, the FASB issued ASU 2010-13, Effect of Denominating the Exercise Price of a Share-Based Payment Award in the Currency of the Market in Which the Underlying Equity Security Primarily Trades , to eliminate disparity in practice. ASU 2010-13 clarifies that differences between currencies of the underlying equity securities of the share-based payment award and the functional currency of the employer entity or the employee’s payroll currency should not be considered to contain a condition that is not a market, performance, or service condition. Therefore, an entity would not classify such an award as a liability if it otherwise qualifies as equity. This pronouncement will be effective on January 1, 2011 and will not have an impact on our consolidated financial statements as we treat this type of share-based payment award as equity.
43
Table of Contents
The following table sets forth the computation of basic and diluted earnings per share (EPS):
| Year Ended December 31, | ||||||||||||
| 2010 | 2009 | 2008 | ||||||||||
| (in thousands, except per share data) | ||||||||||||
|
Net income (loss) available to common shareholders |
$ | 104,770 | $ | (2,249) | $ | 19,811 | ||||||
|
Weighted average common shares outstanding-Basic |
40,337 | 38,539 | 33,096 | |||||||||
|
Dilutive effect of convertible notes |
103 | - | 1,198 | |||||||||
|
Dilutive effect of stock-based awards |
507 | - | 657 | |||||||||
|
Weighted average common shares outstanding-Diluted |
40,947 | 38,539 | 34,951 | |||||||||
|
Earnings (loss) per common share-Basic |
$ | 2.60 | $ | (0.06) | $ | 0.60 | ||||||
|
Earnings (loss) per common share-Diluted |
$ | 2.56 | $ | (0.06) | $ | 0.57 | ||||||
Convertible Notes
We are required, pursuant to the indenture for the convertible notes, to settle the principal amount of the convertible notes in cash and may elect to settle the remaining conversion obligation (stock price in excess of conversion price) in cash, shares, or a combination. We include in the EPS calculation the amount of shares it would take to satisfy the conversion obligation, assuming that all of the convertible notes are converted. The average quarterly closing prices of our common stock were used as the basis for determining the dilutive effect on EPS. During two fiscal quarters in the year ended December 31, 2010 and three fiscal quarters in the year ended December 31, 2008, the average prices of our common stock exceeded the conversion price of $65.16 and, therefore, 103,000 and 1.2 million shares have been included in the diluted EPS calculation for those years. For the year ended December 31, 2009, there was no effect on diluted shares outstanding as a result of our net loss for the year. In addition, for the year ended December 31, 2009, the quarterly average closing prices of our common stock did not exceed the conversion price of $65.16.
Stock-based Awards
For stock-based awards, the dilutive effect is calculated using the treasury stock method. Under this method, the dilutive effect is computed as if the awards were exercised at the beginning of the period (or at time of issuance, if later) and assumes the related proceeds were used to repurchase common stock at the average market price during the period. Related proceeds include the amount the employee must pay upon exercise, future compensation cost associated with the stock award, and the amount of excess tax benefits, if any. As a result of our net loss for 2009, there was no dilutive effect to the weighted average common shares outstanding. Approximately 456,000, 1.0 million, and 283,000 stock-based awards were excluded from the calculation of diluted EPS for the years ended December 31, 2010, 2009, and 2008 because they were anti-dilutive. These stock-based awards could be dilutive in future periods.
Preferred Stock
We have authorized the issuance of 10 million shares of preferred stock with no par value. In the event of a liquidation, dissolution, or winding up of the affairs of the corporation, whether voluntary or involuntary, the holders of any outstanding preferred stock will be entitled to be paid a preferential amount per share to be determined by the Board of Directors prior to any payment to holders of common stock. Shares of preferred stock may be converted into common stock based on terms, conditions, and rates as defined in the Rights Agreement, which may be adjusted by the Board of Directors. There was no preferred stock sold or outstanding at December 31, 2010, 2009, and 2008.
44
Table of Contents
Accounts receivable, net
| At December 31, | ||||||||
| 2010 | 2009 | |||||||
| (in thousands) | ||||||||
|
Trade receivables (net of allowance of $9,045 and $6,339) |
$ | 328,811 | $ | 319,237 | ||||
|
Unbilled revenue |
42,851 | 18,711 | ||||||
|
Total accounts receivable, net |
$ | 371,662 | $ | 337,948 | ||||
At December 31, 2010, $12.5 million was billed but not yet paid by customers in accordance with long-term contract retainage provisions. These retainage amounts are expected to be collected within the next 12 months.
A summary of the allowance for doubtful accounts activity is as follows:
| Year Ended December 31, | ||||||||
| 2010 | 2009 | |||||||
| (in thousands) | ||||||||
|
Beginning balance |
$ | 6,339 | $ | 5,954 | ||||
|
Provision for doubtful accounts, net |
3,357 | 1,188 | ||||||
|
Accounts written off |
(456) | (1,025) | ||||||
|
Effects of change in exchange rates |
(195) | 222 | ||||||
|
Ending balance |
$ | 9,045 | $ | 6,339 | ||||
Inventories
| At December 31, | ||||||||
| 2010 | 2009 | |||||||
| (in thousands) | ||||||||
|
Materials |
$ | 106,021 | $ | 85,358 | ||||
|
Work in process |
18,389 | 17,668 | ||||||
|
Finished goods |
83,747 | 67,058 | ||||||
|
Total inventories |
$ | 208,157 | $ | 170,084 | ||||
Our inventory levels may vary period to period as a result of our factory scheduling and timing of contract fulfillments.
Consigned inventory is held at third-party locations; however, we retain title to the inventory until purchased by the third-party. Consigned inventory, consisting of raw materials and finished goods, was $17.6 million and $10.6 million at December 31, 2010 and 2009, respectively.
Property, plant, and equipment, net
| At December 31, | ||||||||
| 2010 | 2009 | |||||||
| (in thousands) | ||||||||
|
Machinery and equipment |
$ | 265,113 | $ | 243,652 | ||||
|
Computers and purchased software |
63,077 | 66,787 | ||||||
|
Buildings, furniture, and improvements |
146,661 | 144,639 | ||||||
|
Land |
35,968 | 37,738 | ||||||
|
Construction in progress, including purchased equipment |
20,531 | 22,009 | ||||||
|
Total cost |
531,350 | 514,825 | ||||||
|
Accumulated depreciation |
(232,108) | (196,608) | ||||||
|
Property, plant, and equipment, net |
$ | 299,242 | $ | 318,217 | ||||
Depreciation expense and capitalized interest were as follows:
| Year Ended December 31, | ||||||||||||
| 2010 | 2009 | 2008 | ||||||||||
| (in thousands) | ||||||||||||
|
Depreciation expense |
$ | 62,154 | $ | 57,164 | $ | 53,309 | ||||||
|
Capitalized interest |
- | 293 | 187 | |||||||||
45
Table of Contents
The gross carrying amount and accumulated amortization of our intangible assets, other than goodwill, are as follows:
| At December 31, 2010 | At December 31, 2009 | |||||||||||||||||||||||
| Gross Assets |
Accumulated
Amortization |
Net | Gross Assets |
Accumulated
Amortization |
Net | |||||||||||||||||||
| (in thousands) | ||||||||||||||||||||||||
|
Core-developed technology |
$ | 378,705 | $ | (274,198) | $ | 104,507 | $ | 398,043 | $ | (244,545) | $ | 153,498 | ||||||||||||
|
Customer contracts and relationships |
282,997 | (110,539) | 172,458 | 306,061 | (92,187) | 213,874 | ||||||||||||||||||
|
Trademarks and trade names |
73,194 | (59,235) | 13,959 | 77,439 | (57,957) | 19,482 | ||||||||||||||||||
|
Other |
24,256 | (23,510) | 746 | 24,713 | (23,355) | 1,358 | ||||||||||||||||||
|
Total intangible assets |
$ | 759,152 | $ | (467,482) | $ | 291,670 | $ | 806,256 | $ | (418,044) | $ | 388,212 | ||||||||||||
A summary of the intangible asset account activity is as follows:
| Year Ended December 31 | ||||||||
| 2010 | 2009 | |||||||
| (in thousands) | ||||||||
|
Beginning balance, intangible assets, gross |
$ | 806,256 | $ | 796,236 | ||||
|
Effect of change in exchange rates |
(47,104) | 10,020 | ||||||
|
Ending balance, intangible assets, gross |
$ | 759,152 | $ | 806,256 | ||||
Intangible assets of our international subsidiaries are recorded in their respective functional currency; therefore, the carrying amounts of intangible assets increase or decrease, with a corresponding change in accumulated OCI, due to changes in foreign currency exchange rates.
Intangible asset amortization expense is as follows:
| Year Ended December 31, | ||||||||||||
| 2010 | 2009 | 2008 | ||||||||||
| (in thousands) | ||||||||||||
|
Amortization of intangible assets |
$ | 69,051 | $ | 98,573 | $ | 120,364 | ||||||
Estimated future annual amortization expense is as follows:
|
Years ending December 31, |
Estimated Annual
Amortization |
|||
| (in thousands) | ||||
|
2011 |
$ | 58,688 | ||
|
2012 |
45,122 | |||
|
2013 |
36,471 | |||
|
2014 |
29,927 | |||
|
2015 |
24,472 | |||
|
Beyond 2015 |
96,990 | |||
|
Total intangible assets, net |
$ | 291,670 | ||
46
Table of Contents
The following table reflects goodwill allocated to each reporting segment at December 31, 2010 and 2009:
|
Itron North
America |
Itron
International |
Total Company | ||||||||||
| (in thousands) | ||||||||||||
|
Goodwill balance at January 1, 2009 |
$ | 193,598 | $ | 1,092,255 | $ | 1,285,853 | ||||||
|
Adjustment of previous acquisitions |
2,100 | - | 2,100 | |||||||||
|
Effect of change in exchange rates |
1,817 | 15,829 | 17,646 | |||||||||
|
Goodwill balance at December 31, 2009 |
$ | 197,515 | $ | 1,108,084 | $ | 1,305,599 | ||||||
|
Effect of change in exchange rates |
533 | (96,756) | (96,223) | |||||||||
|
Goodwill balance at December 31, 2010 |
$ | 198,048 | $ | 1,011,328 | $ | 1,209,376 | ||||||
Due to continued refinements of our management and geographic reporting structures, minor amounts of goodwill have been reallocated between our reporting segments. Historical segment information has been revised to conform to our current segment reporting structure.
Adjustment of previous acquisitions in 2009 represents contingent consideration that became payable associated with two acquisitions completed in 2006 .
The components of our borrowings are as follows:
| At December 31, | ||||||||
| 2010 | 2009 | |||||||
| (in thousands) | ||||||||
|
Term loans |
||||||||
|
USD denominated term loan |
$ | 218,642 | $ | 284,693 | ||||
|
EUR denominated term loan |
174,031 | 288,902 | ||||||
|
Convertible senior subordinated notes |
218,268 | 208,169 | ||||||
|
Total debt |
610,941 | 781,764 | ||||||
|
Current portion of long-term debt |
(228,721) | (10,871) | ||||||
|
Long-term debt |
$ | 382,220 | $ | 770,893 | ||||
Credit Facility
Our credit facility is dated April 18, 2007 and includes two amendments dated April 24, 2009 and February 10, 2010. The principal balance of our euro denominated term loan at December 31, 2010 and December 31, 2009 was €132.4 million and €200.8 million, respectively. Interest rates on the credit facility are based on the respective borrowing’s denominated London Interbank Offered Rate (LIBOR) or the Wells Fargo Bank, National Association’s prime rate, plus an additional margin subject to our consolidated leverage ratio. The additional interest rate margin was 3.50% at December 31, 2010. Our interest rates were 3.76% for the U.S. dollar denominated and 4.38% for the euro denominated term loans at December 31, 2010. Scheduled amortization of principal payments is 1% per year (0.25% quarterly) with an excess cash flow provision for additional annual principal repayment requirements. The amount of the excess cash flow provision payment varies according to our consolidated leverage ratio. We repaid $155.2 million, $166.5 million, and $372.7 million of the term loans during the years ended December 31, 2010, 2009, and 2008, respectively, resulting in no excess cash flow provision payment requirement for those respective years. Maturities of the term loans and the multicurrency revolving line of credit are in April 2014 and 2013, respectively. The credit facility is secured by substantially all of the assets of Itron, Inc. and our U.S. domestic operating subsidiaries and includes covenants, which contain certain financial ratios and place restrictions on the incurrence of debt, the payment of dividends, certain investments, incurrence of capital expenditures above a set limit, and mergers. We were in compliance with the debt covenants under the credit facility at December 31, 2010.
47
Table of Contents
The credit facility includes a multicurrency revolving line of credit of $240 million. At December 31, 2010, there were no borrowings outstanding under the revolving line of credit, and $43.5 million was utilized by outstanding standby letters of credit, resulting in $196.5 million being available for additional borrowings.
Convertible Senior Subordinated Notes
On August 4, 2006, we issued $345 million of 2.50% convertible notes due August 2026. Fixed interest payments are required every six months, in February and August of each year. For each six month period beginning August 2011, contingent interest payments of approximately 0.19% of the average trading price of the convertible notes will be made if certain thresholds are met or events occur, as outlined in the indenture. The convertible notes are registered with the SEC and are generally transferable. Our convertible notes are not considered conventional convertible debt as the number of shares, or cash, to be received by the holders was not fixed at the inception of the obligation. We have concluded that the conversion feature of our convertible notes does not need to be bifurcated from the host contract and accounted for as a freestanding derivative, as the conversion feature is indexed to our own stock and would be classified within stockholders’ equity if it were a freestanding instrument.
The convertible notes may be converted at the option of the holder at a conversion rate of 15.3478 shares of our common stock for each $1,000 principal amount of the convertible notes, under the following circumstances, as defined in the indenture:
| • |
if the closing sale price per share of our common stock exceeds $78.19, which is 120% of the conversion price of $65.16, for at least 20 trading days in the 30 consecutive trading day period ending on the last trading day of the preceding fiscal quarter; |
| • |
between July 1, 2011 and August 1, 2011, and any time after August 1, 2024; |
| • |
during the five business days after any five consecutive trading day period in which the trading price of the convertible notes for each day was less than 98% of the average conversion value of the convertible notes; |
| • |
if the convertible notes are called for redemption; |
| • |
if a fundamental change occurs; or |
| • |
upon the occurrence of defined corporate events. |
The amount payable upon conversion is the result of a formula based on the closing prices of our common stock for 20 consecutive trading days following the date of the conversion notice. Based on the conversion ratio of 15.3478 shares per $1,000 principal amount of the convertible notes, if our stock price is lower than the conversion price of $65.16, the amount payable will be less than the $1,000 principal amount and will be settled in cash. Our closing stock price at December 31, 2010 was $55.45 per share.
Upon conversion, the principal amount of the convertible notes will be settled in cash and, at our option, the remaining conversion obligation (stock price in excess of conversion price) may be settled in cash, shares, or a combination. The conversion rate for the convertible notes is subject to adjustment upon the occurrence of certain corporate events, as defined in the indenture, to ensure that the economic rights of the convertible note holders are preserved.
The convertible notes also contain purchase options, at the option of the holders, which if exercised would require us to repurchase all or a portion of the convertible notes on August 1, 2011, August 1, 2016, and August 1, 2021 at 100% of the principal amount, plus accrued and unpaid interest.
On or after August 1, 2011, we have the option to redeem all or a portion of the convertible notes at a redemption price equal to 100% of the principal amount plus accrued and unpaid interest.
The convertible notes are unsecured, subordinated to our credit facility (senior secured borrowings), and are guaranteed by one U.S. subsidiary, which is 100% owned. The convertible notes contain covenants, which place restrictions on the incurrence of debt and certain mergers. We were in compliance with these debt covenants at December 31, 2010.
At December 31, 2010, the convertible notes are classified as current on the Consolidated Balance Sheet due to the combination of put, call, and conversion options occurring in 2011.
Our convertible notes are separated between the liability and equity components using our estimated non-convertible debt borrowing rate at the time our convertible notes were issued, which was determined to be 7.38%. This rate also reflects the effective interest rate on the liability component. The carrying amounts of the debt and equity components are as follows:
48
Table of Contents
| At December 31, | ||||||||
| 2010 | 2009 | |||||||
| (in thousands) | ||||||||
|
Face value of convertible notes |
$ | 223,604 | $ | 223,604 | ||||
|
Unamortized discount |
(5,336) | (15,435) | ||||||
|
Net carrying amount of debt component |
$ | 218,268 | $ | 208,169 | ||||
|
Carrying amount of equity component |
$ | 31,831 | $ | 31,831 | ||||
The interest expense relating to both the contractual interest coupon and amortization of the discount on the liability component are as follows:
| Year Ended December 31, | ||||||||
| 2010 | 2009 | |||||||
| (in thousands) | ||||||||
|
Contractual interest coupon |
$ | 5,590 | $ | 5,839 | ||||
|
Amortization of the discount on the liability component |
10,099 | 9,673 | ||||||
|
Total interest expense on convertible notes |
$ | 15,689 | $ | 15,512 | ||||
Due to the combination of put, call, and conversion options that are part of the terms of the convertible note agreement, as of December 31, 2010 the remaining discount on the liability component will be amortized over the next six months.
During the first quarter of 2009, we entered into exchange agreements with certain holders of our convertible notes to issue, in the aggregate, approximately 2.3 million shares of common stock, valued at $132.9 million, in exchange for, in the aggregate, $121.0 million principal amount of the convertible notes, representing 35% of the aggregate principal outstanding at the date of the exchanges. All of the convertible notes we acquired pursuant to the exchange agreements were retired upon the closing of the exchanges.
The exchange agreements were treated as induced conversions as the holders received a greater number of shares of common stock than would have been issued under the original conversion terms of the convertible notes. At the time of the exchange agreements, none of the conversion contingencies were met. Under the original terms of the convertible notes, the amount payable on conversion was to be paid in cash, and the remaining conversion obligation (stock price in excess of conversion price) was payable in cash or shares of common stock, at our option. Under the terms of the exchange agreements, all of the settlement was paid in shares. The difference in the value of the shares of common stock issued under the exchange agreement and the value of the shares of common stock used to derive the amount payable under the original conversion agreement resulted in a loss on extinguishment of debt of $23.3 million (the inducement loss). Upon derecognition of the convertible notes, we remeasured the fair value of the liability and equity components using a borrowing rate for similar non-convertible debt that would be applicable to us at the date of the exchange agreements. Because borrowing rates increased, the remeasurement of the components of the convertible notes resulted in a gain on extinguishment of $13.4 million (the revaluation gain). As a result, we recognized a net loss on extinguishment of debt of $10.3 million, calculated as the inducement loss, plus an allocation of advisory fees, less the revaluation gain. The remaining settlement consideration of $9.5 million, including an allocation of advisory fees, was recorded as a reduction of common stock.
Senior Subordinated Notes
On July 17, 2009, we paid the remaining $109.2 million outstanding balance on our 7.75% senior subordinated notes and recognized a loss on extinguishment of $2.5 million, which included the remaining unamortized debt discount of $336,000. Unamortized prepaid debt fees of $2.0 million were recorded to interest expense.
49
Table of Contents
Minimum Payments on Debt
| Minimum Payments | ||||
| (in thousands) | ||||
|
2011 |
$ | 234,057 | ||
|
2012 |
10,453 | |||
|
2013 |
10,453 | |||
|
2014 |
361,314 | |||
|
Total minimum payments on debt |
616,277 | |||
|
Convertible notes unamortized discount |
(5,336) | |||
|
Total debt |
$ | 610,941 | ||
As part of our risk management strategy, we use derivative instruments to hedge certain foreign currency and interest rate exposures. Refer to Note 1, Note 13, and Note 14 for additional disclosures on our derivative instruments.
The fair values of our derivative instruments are determined using the income approach and significant other observable inputs (also known as “Level 2”), as defined by Accounting Standards Codification (ASC) 820-10-20, Fair Value Measurements . We have used observable market inputs based on the type of derivative and the nature of the underlying instrument. The key inputs used at December 31, 2010 included interest rate yield curves (swap rates and futures) and foreign exchange spot and forward rates, all of which are available in an active market. We have utilized the mid-market pricing convention for these inputs at December 31, 2010. We include the effect of our counterparty credit risk based on current published credit default swap rates when the net fair value of our derivative instruments is in a net asset position. We consider our own nonperformance risk when the net fair value of our derivative instruments is in a net liability position by discounting our derivative liabilities to reflect the potential credit risk to our counterparty through applying a current market indicative credit spread to all cash flows.
The fair values of our derivative instruments determined using the fair value measurement of significant other observable inputs (Level 2) at December 31, 2010 and 2009 are as follows:
| Fair Value at December 31, | ||||||||||
|
Balance Sheet Location |
2010 | 2009 | ||||||||
|
Asset Derivatives |
(in thousands) | |||||||||
|
Derivatives not designated as hedging instruments under ASC 815-20 |
||||||||||
|
Foreign exchange forward contracts |
Other current assets | $ | 63 | $ | 3,986 | |||||
|
Liability Derivatives |
||||||||||
|
Derivatives designated as hedging instruments under ASC 815-20 |
||||||||||
|
Interest rate swap contracts |
Other current liabilities | $ | (5,845 | ) | $ | (11,478 | ) | |||
|
Interest rate swap contracts |
Other long-term obligations | (975 | ) | (3,676 | ) | |||||
|
Euro denominated term loan * |
Current portion of debt | (4,402 | ) | (4,820 | ) | |||||
|
Euro denominated term loan * |
Long-term debt | (169,629 | ) | (284,082 | ) | |||||
|
Total derivatives designated as hedging instruments under ASC 815-20 |
$ | (180,851 | ) | $ | (304,056 | ) | ||||
|
Derivatives not designated as hedging instruments under ASC 815-20 |
||||||||||
|
Foreign exchange forward contracts |
Other current liabilities | $ | (457 | ) | $ | (2,442 | ) | |||
|
Total liability derivatives |
$ | (181,308 | ) | $ | (306,498 | ) | ||||
* The euro denominated term loan is a nonderivative financial instrument designated as a hedge of our net investment in international operations. It is recorded at its carrying value in the Consolidated Balance Sheets and is not recorded at fair value.
50
Table of Contents
Other comprehensive income (loss) during the reporting period for our derivative and nonderivative instruments designated as hedging instruments (collectively, hedging instruments), net of tax, was as follows:
| 2010 | 2009 | |||||||
| (in thousands) | ||||||||
|
Net unrealized loss on hedging instruments at January 1, |
$ | (30,300) | $ | (29,772) | ||||
|
Unrealized gain (loss) on derivative instruments |
(2,930) | (6,776) | ||||||
|
Unrealized gain (loss) on a nonderivative net investment hedging instrument |
15,825 | (2,364) | ||||||
|
Realized (gains) losses reclassified into net income (loss) |
7,371 | 8,612 | ||||||
|
Net unrealized loss on hedging instruments at December 31, |
$ | (10,034) | $ | (30,300) | ||||
Cash Flow Hedges
We are exposed to interest rate risk through our credit facility. We enter into swaps to achieve a fixed rate of interest on the hedged portion of debt in order to increase our ability to forecast interest expense. The objective of these swaps is to protect us from increases in the LIBOR base borrowing rates on our floating rate credit facility. The swaps do not protect us from changes to the applicable margin under our credit facility.
We have entered into one-year pay-fixed receive one-month LIBOR interest rate swaps to convert $200 million of our U.S. dollar term loan from a floating LIBOR interest rate to a fixed interest rate. Our outstanding swaps are as follows:
|
Transaction Date |
Effective Date of Swap |
Notional amount | Fixed Interest Rate | |||||
| (in thousands) | ||||||||
|
July 1, 2009 |
June 30, 2010 - June 30, 2011 | $ | 100,000 | 2.15% | ||||
|
July 1, 2009 |
June 30, 2010 - June 30, 2011 | $ | 100,000 | 2.11% | ||||
At December 31, 2010 and 2009, our U.S. dollar term loan had a balance of $218.6 million and $284.7 million, respectively. The cash flow hedges have been and are expected to be highly effective in achieving offsetting cash flows attributable to the hedged risk through the term of the hedge. Consequently, effective changes in the fair value of the interest rate swap are recorded as a component of OCI and are recognized in earnings when the hedged item affects earnings. The amounts paid or received on the hedge are recognized as adjustments to interest expense. The amount of net losses expected to be reclassified into earnings in the next 12 months is approximately $1.8 million, which was based on the Bloomberg U.S. dollar swap yield curve as of December 31, 2010.
In 2007, we entered into a pay fixed 6.59% receive three-month Euro Interbank Offered Rate (EURIBOR), plus 2%, amortizing interest rate swap to convert a significant portion of our euro denominated variable-rate term loan to fixed-rate debt, plus or minus the variance in the applicable margin from 2%, through December 31, 2012. The cash flow hedge is currently, and is expected to be, highly effective in achieving offsetting cash flows attributable to the hedged risk through the term of the hedge. Consequently, effective changes in the fair value of the interest rate swap are recorded as a component of OCI and are recognized in earnings when the hedged item affects earnings. The amounts paid or received on the hedge are recognized as adjustments to interest expense. The notional amount of the swap is reduced each quarter and was $147.7 million (€112.4 million) and $252.9 million (€175.8 million) as of December 31, 2010 and 2009, respectively. The amount of net losses expected to be reclassified into earnings in the next 12 months is approximately $3.9 million (€3.0 million), which was based on the Bloomberg euro swap yield curve as of December 31, 2010.
We will continue to monitor and assess our interest rate risk and may institute additional interest rate swaps or other derivative instruments to manage such risk in the future.
The before tax effect of our cash flow derivative instruments on the Consolidated Balance Sheets and the Consolidated Statements of Operations for the years ended December 31 are as follows:
|
Derivatives in ASC 815-20 Cash Flow Hedging Relationships |
Amount of Gain (Loss) Recognized
in OCI on Derivative (Effective Portion) |
Gain (Loss) Reclassified from Accumulated
OCI into Income (Effective Portion) |
Gain (Loss) Recognized in Income on
Derivative (Ineffective Portion) |
|||||||||||||||||||||||||||||||||||||||||
| Location | Amount | Location | Amount | |||||||||||||||||||||||||||||||||||||||||
| 2010 | 2009 | 2008 | 2010 | 2009 | 2008 | 2010 | 2009 | 2008 | ||||||||||||||||||||||||||||||||||||
| (in thousands) | ||||||||||||||||||||||||||||||||||||||||||||
|
Interest rate swap contracts |
$ | (4,542) | $ | (11,023) | $ | (14,945) |
|
Interest
expense |
|
$ | (11,829) | $ | (13,975) | $ | 804 |
|
Interest
expense |
|
$ | (100) | $ | (302) | $ | - | ||||||||||||||||||||
51
Table of Contents
Net Investment Hedges
We are exposed to foreign exchange risk through our international subsidiaries. As a result of our acquisition of an international company in 2007, we entered into a euro denominated term loan, which exposes us to fluctuations in the euro foreign exchange rate. Therefore, we have designated this foreign currency denominated term loan as a hedge of our net investment in international operations. The non-functional currency term loan is revalued into U.S. dollars at each balance sheet date, and the changes in value associated with currency fluctuations are recorded as adjustments to long-term debt with offsetting gains and losses recorded in OCI. The notional amount of the term loan declines each quarter due to repayments and was $174.0 million (€132.4 million) and $288.9 million (€200.8 million) as of December 31, 2010 and 2009, respectively. We had no hedge ineffectiveness.
The before tax and net of tax effect of our net investment hedge nonderivative financial instrument on OCI for the years ended December 31 are as follows:
|
Nonderivative Financial Instruments in ASC 815-20 Net Investment Hedging Relationships |
Euro Denominated Term Loan Designated as a Hedge of
Our Net Investment in International Operations |
|||||||||||
| 2010 | 2009 | 2008 | ||||||||||
| (in thousands) | ||||||||||||
|
Gain (loss) recognized in OCI on derivative (Effective Portion) |
||||||||||||
|
Before tax |
$ | 25,760 | $ | (3,866 | ) | $ | 10,360 | |||||
|
Net of tax |
$ | 15,825 | $ | (2,364 | ) | $ | 6,485 | |||||
Derivatives Not Designated as Hedging Relationships
We are also exposed to foreign exchange risk when we enter into non-functional currency transactions, both intercompany and third-party. At each period-end, foreign currency monetary assets and liabilities are revalued with the change recorded to other income and expense. We enter into monthly foreign exchange forward contracts (a total of 164 contracts were entered into during the year ended December 31, 2010), not designated for hedge accounting, with the intent to reduce earnings volatility associated with certain of these balances. The notional amounts of the contracts ranged from $200,000 to $48 million, offsetting our exposures from the euro, British pound, Canadian dollar, Czech koruna, Hungarian forint, and various other currencies.
The effect of our foreign exchange option and forward derivative instruments on the Consolidated Statements of Operations for the years ended December 31 is as follows:
|
Derivatives Not Designated as Hedging Instrument under ASC 815-20 |
Gain (Loss) Recognized on Derivatives in Other
Income (Expense) |
|||||||||||
| 2010 | 2009 | 2008 | ||||||||||
| (in thousands) | ||||||||||||
|
Foreign exchange forward contracts |
$ | 665 | $ | (1,656) | $ | 98 | ||||||
|
Cross currency interest rate swap |
- | - | (1,709) | |||||||||
| $ | 665 | $ | (1,656) | $ | (1,611) | |||||||
We sponsor both funded and unfunded defined benefit pension plans for our employees in Germany, France, Spain, Italy, Belgium, Chile, Hungary, and Indonesia offering death and disability, retirement, and special termination benefits. The defined benefit obligation is calculated annually by using the projected unit credit method. The measurement date for the pension plans was December 31, 2010.
Our general funding policy for these qualified pension plans is to contribute amounts sufficient to satisfy regulatory funding standards of the respective countries for each plan. We contributed $519,000 and $397,000 to the defined benefit pension plans for the years ended December 31, 2010 and 2009, respectively. Assuming that actual plan asset returns are consistent with our expected rate of return in 2011 and beyond, and that interest rates remain constant, we expect to contribute approximately $500,000 in 2011 to our defined benefit pension plans.
52
Table of Contents
The following tables summarize the benefit obligation, plan assets, and funded status of the defined benefit plans, amounts recognized in accumulated other comprehensive income, and amounts recognized in the Consolidated Balance Sheets at December 31, 2010 and 2009.
| Year Ended December 31, | ||||||||
| 2010 | 2009 | |||||||
| (in thousands) | ||||||||
|
Change in benefit obligation: |
||||||||
|
Benefit obligation at January 1, |
$ | 73,262 | $ | 66,823 | ||||
|
Service cost |
1,980 | 1,753 | ||||||
|
Interest cost |
3,490 | 3,450 | ||||||
|
Amendments |
1,209 | - | ||||||
|
Actuarial loss |
1,710 | 3,830 | ||||||
|
Benefits paid |
(4,403) | (4,400) | ||||||
|
Other – foreign currency exchange rate changes |
(5,860) | 1,806 | ||||||
|
Benefit obligation at December 31, |
$ | 71,388 | $ | 73,262 | ||||
|
Change in plan assets: |
||||||||
|
Fair value of plan assets at January 1, |
$ | 7,860 | $ | 7,449 | ||||
|
Actual return on plan assets |
210 | 65 | ||||||
|
Company contributions |
519 | 397 | ||||||
|
Benefits paid |
(283) | (259) | ||||||
|
Other – foreign currency exchange rate changes |
(612) | 208 | ||||||
|
Fair value of plan assets at December 31, |
7,694 | 7,860 | ||||||
|
Ending balance at fair value (net pension plan benefit liability) |
$ | 63,694 | $ | 65,402 | ||||
Amounts recognized on the Consolidated Balance Sheets consist of:
| At December 31, | ||||||||
| 2010 | 2009 | |||||||
| (in thousands) | ||||||||
|
Current portion of pension plan liability in wages and benefits payable |
$ | 2,656 | $ | 2,975 | ||||
|
Long-term portion of pension plan liability |
61,450 | 63,040 | ||||||
|
Plan assets in other long term assets |
(412) | (613) | ||||||
|
Net pension plan benefit liability |
$ | 63,694 | $ | 65,402 | ||||
Amounts in accumulated other comprehensive income (pre-tax) that have not yet been recognized as components of net periodic benefit costs consist of:
| At December 31, | ||||||||
| 2010 | 2009 | |||||||
| (in thousands) | ||||||||
|
Net actuarial gain |
$ | (3,108) | $ | (4,976) | ||||
|
Net prior service cost |
1,206 | - | ||||||
|
Amount included in accumulated other comprehensive income |
$ | (1,902) | $ | (4,976) | ||||
The total accumulated benefit obligation for our defined benefit pension plans was $65.9 million and $68.9 million at December 31, 2010 and 2009, respectively.
53
Table of Contents
Amounts recognized in other comprehensive income (pre-tax) are as follows:
| Year Ended December 31, | ||||||||||||
| 2010 | 2009 | 2008 | ||||||||||
| (in thousands) | ||||||||||||
|
Net actuarial (gain) loss |
$ | 1,710 | $ | 4,049 | $ | (4,048) | ||||||
|
Settlement gain |
80 | - | - | |||||||||
|
Plan asset loss |
85 | - | - | |||||||||
|
Prior service cost |
1,209 | - | 83 | |||||||||
|
Amortization of net actuarial gain (loss) |
(26) | 509 | 132 | |||||||||
|
Amortization of prior service cost |
(3) | (25) | (56) | |||||||||
|
Other |
19 | - | - | |||||||||
|
Other comprehensive (income) loss |
$ | 3,074 | $ | 4,533 | $ | (3,889) | ||||||
The estimated net actuarial gain and prior service cost that will be amortized from accumulated other comprehensive income into net periodic benefit cost during 2011 is $124,000.
Net periodic pension benefit costs for our plans include the following components:
| Year Ended December 31, | ||||||||||||
| 2010 | 2009 | 2008 | ||||||||||
| (in thousands) | ||||||||||||
|
Service cost |
$ | 1,980 | $ | 1,753 | $ | 2,009 | ||||||
|
Interest cost |
3,490 | 3,450 | 3,697 | |||||||||
|
Expected return on plan assets |
(295) | (282) | (306) | |||||||||
|
Settlements and curtailments |
(80) | - | - | |||||||||
|
Amortization of actuarial net (gain) loss |
26 | (509) | (132) | |||||||||
|
Amortization of unrecognized prior service costs |
3 | 25 | 56 | |||||||||
|
Net periodic benefit cost |
$ | 5,124 | $ | 4,437 | $ | 5,324 | ||||||
The significant actuarial weighted average assumptions used in determining the benefit obligations and net periodic benefit cost for our benefit plans are as follows:
| At December 31, | ||||||||||||
| 2010 | 2009 | 2008 | ||||||||||
|
Actuarial assumptions used to determine benefit obligations at end of period: |
||||||||||||
|
Discount rate |
5.35% | 5.60% | 6.12% | |||||||||
|
Expected annual rate of compensation increase |
3.35% | 3.24% | 3.18% | |||||||||
|
Actuarial assumptions used to determine net periodic benefit cost for the period: |
||||||||||||
|
Discount rate |
5.60% | 6.12% | 5.41% | |||||||||
|
Expected rate of return on plan assets |
3.96% | 4.06% | 4.10% | |||||||||
|
Expected annual rate of compensation increase |
3.24% | 3.18% | 3.04% | |||||||||
We determine a discount rate for our plans based on the estimated duration of each plan’s liabilities. For our euro denominated defined benefit pension plans, which represent 94% of our benefit obligation, we use two discount rates, (separated between shorter and longer duration plans), using a hypothetical yield curve developed from euro-denominated AA-rated corporate bond issues, partially weighted for market value, with minimum amounts outstanding of €250 million for bonds with less than 10 years to maturity and €50 million for bonds with 10 or more years to maturity, and excluding 10% of the highest and lowest yielding bonds within each maturity group. The discount rates derived for our shorter duration euro denominated plans (less than 10 years) and longer duration plans (greater than 10 years) were 4.50% and 5.25%, respectively.
Our expected rate of return on plan assets is derived from a study of actual historic returns achieved and anticipated future long-term performance of plan assets. While the study primarily gives consideration to recent insurers’ performance and historical returns, the assumption represents a long-term prospective return.
54
Table of Contents
We have one plan in which the fair value of plan assets exceeds the projected benefit obligation and the accumulated benefit obligation. Therefore, for the pension plans in which the accumulated benefit obligations exceeds the fair value of plan assets, our total obligation and the fair value of plan assets are as follows:
| At December 31, | ||||||||
| 2010 | 2009 | |||||||
| (in thousands) | ||||||||
|
Projected benefit obligation |
$ | 69,966 | $ | 71,799 | ||||
|
Accumulated benefit obligation |
64,671 | 67,576 | ||||||
|
Fair value of plan assets |
5,860 | 5,798 | ||||||
Our asset investment strategy focuses on maintaining a portfolio using primarily insurance funds, which are accounted for as investments and measured at fair value, in order to achieve our long-term investment objectives on a risk adjusted basis. Strategic pension plan asset allocations are determined by the objective to achieve an investment return, which together with the contributions paid, is sufficient to maintain reasonable control over the various funding risks of the plans.
The fair values of our plan investments by asset category as of December 31, 2010 are as follows:
| Total |
Quoted Prices in Active
Markets for Identical Assets (Level 1) |
Significant
Unobservable Inputs (Level 3) |
||||||||||
| (in thousands) | ||||||||||||
|
Cash |
$ | 814 | $ | 814 | $ | - | ||||||
|
Insurance funds |
6,880 | - | 6,880 | |||||||||
|
Total fair value of plan assets |
$ | 7,694 | $ | 814 | $ | 6,880 | ||||||
As the plan assets are not significant to our total company assets, no further breakdown is provided.
Annual benefit payments, including amounts to be paid from our assets for unfunded plans, and reflecting expected future service, as appropriate, are expected to be paid as follows:
|
Year Ending December 31, |
Estimated
Annual Benefit Payments |
|||
| (in thousands) | ||||
|
2011 |
$ | 3,406 | ||
|
2012 |
3,147 | |||
|
2013 |
4,114 | |||
|
2014 |
3,781 | |||
|
2015 |
4,398 | |||
|
2016 - 2020 |
22,383 | |||
55
Table of Contents
We record stock-based compensation expense for awards of stock options, stock sold pursuant to our ESPP, and the issuance of restricted and unrestricted stock awards and units. We expense stock-based compensation using the straight-line method over the vesting requirement period. For the years ended December 31, stock-based compensation expense and the related tax benefit were as follows:
| 2010 | 2009 | 2008 | ||||||||||
| (in thousands) | ||||||||||||
|
Stock options |
$ | 3,994 | $ | 6,903 | $ | 8,839 | ||||||
|
Restricted stock awards and units |
14,230 | 9,306 | 6,885 | |||||||||
|
Unrestricted stock awards |
364 | 254 | 269 | |||||||||
|
ESPP |
519 | 519 | 589 | |||||||||
|
Total stock-based compensation |
$ | 19,107 | $ | 16,982 | $ | 16,582 | ||||||
|
Related tax benefit |
$ | 5,402 | $ | 4,329 | $ | 3,519 | ||||||
We issue new shares of common stock upon the exercise of stock options or when vesting conditions on restricted awards are fully satisfied.
The fair value of stock options and ESPP awards issued were estimated at the date of grant using the Black-Scholes option-pricing model with the following weighted average assumptions:
| Employee Stock Options | ESPP | |||||||||||||||||||||||
| Year Ended December 31, | Year Ended December 31, | |||||||||||||||||||||||
| 2010 | 2009 | 2008 | 2010 | 2009 | 2008 | |||||||||||||||||||
|
Dividend yield |
- | - | - | - | - | - | ||||||||||||||||||
|
Expected volatility |
48.7% | 50.2% | 44.8% | 33.1% | 64.1% | 48.5% | ||||||||||||||||||
|
Risk-free interest rate |
2.3% | 1.8% | 3.0% | 0.1% | 0.3% | 1.8% | ||||||||||||||||||
|
Expected life (years) |
4.6 | 4.9 | 4.5 | 0.25 | 0.25 | 0.25 | ||||||||||||||||||
Expected volatility is based on a combination of historical volatility of our common stock and the implied volatility of our traded options for the related expected life period. We believe this combined approach is reflective of current and historical market conditions and an appropriate indicator of expected volatility. The risk-free interest rate is the rate available as of the award date on zero-coupon U.S. government issues with a term equal to the expected life of the award. The expected life is the weighted average expected life of an award based on the period of time between the date the award is granted and the date an estimate of the award is fully exercised. Factors considered in estimating the expected life include historical experience of similar awards, contractual terms, vesting schedules, and expectations of future employee behavior. We have not paid dividends in the past and do not plan to pay dividends in the foreseeable future.
Subject to stock splits, dividends, and other similar events, 3,500,000 shares of common stock are reserved and authorized for issuance under our 2010 Stock Incentive Plan (Stock Incentive Plan). Awards consist of stock options, restricted stock units, restricted stock awards, and unrestricted stock awards. At December 31, 2010, 2,812,078 shares were available for issuance under the Stock Incentive Plan.
Stock Options
Options to purchase our common stock are granted to employees and the Board of Directors with an exercise price equal to the market close price of the stock on the date the Board of Directors approves the grant. Options generally become exercisable in three equal annual installments beginning one year from the date of grant and generally expire 10 years from the date of grant. Compensation expense is recognized only for those options expected to vest, with forfeitures estimated based on our historical experience and future expectations.
56
Table of Contents
A summary of our stock option activity for the years ended December 31, 2010, 2009, and 2008 is as follows:
| Shares |
Weighted
Average Exercise Price per Share |
Weighted Average
Remaining Contractual Life |
Aggregate
Intrinsic Value (1) |
Weighted
Average Grant Date Fair Value |
||||||||||||||||
| (in thousands) | (years) | (in thousands) | ||||||||||||||||||
|
Outstanding, January 1, 2008 |
1,561 | $ | 37.81 | 6.98 | $ | 90,769 | ||||||||||||||
|
Granted |
247 | 95.79 | $ | 39.07 | ||||||||||||||||
|
Exercised |
(415) | 26.42 | $ | 28,543 | ||||||||||||||||
|
Forfeited |
(18) | 47.70 | ||||||||||||||||||
|
Expired |
(1) | 21.30 | ||||||||||||||||||
|
Outstanding, December 31, 2008 |
1,374 | $ | 51.53 | 6.99 | $ | 25,809 | ||||||||||||||
|
Exercisable and expected to vest, December 31, 2008 |
1,325 | $ | 50.50 | 6.92 | $ | 25,673 | ||||||||||||||
|
Exercisable, December 31, 2008 |
805 | $ | 35.71 | 5.89 | $ | 23,253 | ||||||||||||||
|
Granted |
50 | $ | 57.96 | $ | 25.94 | |||||||||||||||
|
Exercised |
(146) | 21.68 | $ | 4,889 | ||||||||||||||||
|
Forfeited |
(92) | 84.33 | ||||||||||||||||||
|
Expired |
(7) | 57.23 | ||||||||||||||||||
|
Outstanding, December 31, 2009 |
1,179 | $ | 52.93 | 5.90 | $ | 22,863 | ||||||||||||||
|
Exercisable and expected to vest, December 31, 2009 |
1,168 | $ | 52.67 | 5.88 | $ | 22,826 | ||||||||||||||
|
Exercisable, December 31, 2009 |
972 | $ | 47.39 | 5.40 | $ | 22,343 | ||||||||||||||
|
Granted |
71 | $ | 61.97 | $ | 27.18 | |||||||||||||||
|
Exercised |
(148) | 40.51 | $ | 4,532 | ||||||||||||||||
|
Forfeited |
- | - | ||||||||||||||||||
|
Expired |
- | - | ||||||||||||||||||
|
Outstanding, December 31, 2010 |
1,102 | $ | 55.21 | 5.58 | $ | 10,883 | ||||||||||||||
|
Exercisable and expected to vest, December 31, 2010 |
1,096 | $ | 55.15 | 5.57 | $ | 10,883 | ||||||||||||||
|
Exercisable, December 31, 2010 |
958 | $ | 52.63 | 5.18 | $ | 10,883 | ||||||||||||||
| (1) |
The aggregate intrinsic value represents amounts that would have been received by the optionees had all options been exercised on that date. Specifically, it is the amount by which the market value of Itron’s stock exceeded the exercise price of the outstanding options before applicable income taxes, based on our closing stock price on the last business day of the period. |
As of December 31, 2010, total unrecognized stock-based compensation expense related to nonvested stock options was approximately $2.1 million, which is expected to be recognized over a weighted average period of approximately 17 months.
Restricted Stock Awards
Certain employees and senior management receive restricted stock units or restricted stock awards (collectively, restricted awards) as a component of their total compensation. The fair value of a restricted award is the market close price of our common stock on the date of grant. Restricted awards generally vest over a three year period. Compensation expense, net of forfeitures, is recognized over the vesting period.
Subsequent to vesting, the restricted awards are converted into shares of our common stock on a one-for-one basis and issued to employees. We are entitled to an income tax deduction in an amount equal to the taxable income reported by the employees upon vesting of the restricted awards.
The restricted awards issued under the Long Term Performance Restricted Stock Unit Award Agreement (Performance Award Agreement) are determined based on the attainment of annual performance goals after the end of the calendar year performance period. During the year, if management determines that it is probable that the targets will be achieved, compensation expense, net of forfeitures, is recognized on a straight-line basis over the annual performance and subsequent vesting period. Performance Awards typically vest and are released in three equal installments at the beginning of each year
57
Table of Contents
following attainment of the performance goals. For U.S. participants who retire during the performance period, a pro-rated number of restricted awards (based on the number of days of employment during the performance period) immediately vest based on the attainment of the performance goals as assessed after the end of the performance period. During the vesting period, unvested restricted awards immediately vest at the date of retirement for U.S. participants who retire during that period. For U.S. participants who are or will become retirement eligible during either the annual performance or vesting period, compensation expense is accelerated and recognized over the greater of the performance period (one year) or the participant’s retirement eligible date. For the 2010 Performance Awards, the maximum awards that became eligible for vesting is 132,980 with a grant date fair value of $61.49.
The following tables summarize restricted award activity for the years ended December 31, 2010, 2009, and 2008:
|
Number of
Restricted Awards |
Weighted
Average Grant Date Fair Value |
Aggregate
Intrinsic Value (1) |
||||||||||
| (in thousands) | (in thousands) | |||||||||||
|
Outstanding, January 1, 2008 |
111 | |||||||||||
|
Granted |
215 | $ | 84.26 | |||||||||
|
Released |
(1) | $ | 84 | |||||||||
|
Forfeited |
(12) | |||||||||||
|
Outstanding, December 31, 2008 |
313 | |||||||||||
|
Granted |
60 | $ | 69.39 | |||||||||
|
Released |
(30) | $ | 1,956 | |||||||||
|
Forfeited |
(17) | |||||||||||
|
Outstanding, December 31, 2009 |
326 | |||||||||||
|
Granted (2) |
360 | $ | 62.45 | |||||||||
|
Released |
(84) | $ | 5,733 | |||||||||
|
Forfeited |
(14) | |||||||||||
|
Outstanding, December 31, 2010 |
588 | |||||||||||
|
Vested, December 31, 2010 |
2 | $ | 88 | |||||||||
|
Expected to vest, December 31, 2010 |
515 | $ | 28,544 | |||||||||
| (1) |
The aggregate intrinsic value is the market value of the stock released, vested, or expected to vest, before applicable income taxes, based on the closing price on the stock release dates or at the end of the period for stock vested but not released. |
| (2) |
These restricted awards include 132,980 shares for the 2010 awards under the Performance Award Agreement, which are eligible for vesting at December 31, 2010. |
At December 31, 2010, unrecognized compensation expense was $15.8 million, which is expected to be recognized over a weighted average period of approximately 26 months.
Unrestricted Stock Awards
We issue unrestricted stock awards to our Board of Directors as part of their compensation. Awards are fully vested and expensed when issued. The fair value of unrestricted stock awards is the market close price of our common stock on the date of grant.
The following table summarizes unrestricted stock award activity for the years ended December 31:
| 2010 | 2009 | 2008 | ||||||||||
|
Shares of unrestricted stock issued |
5,662 | 4,284 | 2,744 | |||||||||
|
Weighted average grant date fair value |
$ | 64.35 | $ | 59.40 | $ | 97.94 | ||||||
58
Table of Contents
Employee Stock Purchase Plan
Under the terms of the ESPP, eligible employees can elect to deduct up to 10% of their regular cash compensation to purchase our common stock at a discounted price. The purchase price of the common stock is 85% of the fair market value of the stock at the end of each fiscal quarter. The sale of the stock occurs at the beginning of the subsequent quarter.
The following table summarizes ESPP activity for the years ended December 31:
| 2010 | 2009 | 2008 | ||||||||||
|
Shares of stock sold to employees (1) |
51,210 | 61,407 | 33,149 | |||||||||
|
Weighted average fair value per ESPP award (2) |
$ | 9.27 | $ | 8.54 | $ | 15.36 | ||||||
| (1) |
Stock sold to employees during each fiscal quarter under the ESPP is associated with the offering period ending on the last day of the previous fiscal quarter. |
| (2) |
Relating to awards associated with the offering periods during the years ended December 31. |
The fair value of ESPP awards is estimated using the Black-Scholes option-pricing model. At December 31, 2010, all compensation cost associated with the ESPP had been recognized. There were approximately 196,000 shares of common stock available for future issuance under the ESPP at December 31, 2010.
Defined Contribution Plans
In the United States, United Kingdom, Brazil, and certain other countries, we make contributions to defined contribution plans. For our U.S. employee savings plan, which represents a majority of our contribution expense, we provide a 50% match on the first 6% of the employee salary deferral, subject to statutory limitations. In 2009, we temporarily suspended the U.S. employee savings plan match from April 1 through December 31. For our international defined contribution plans, we provide various levels of contributions, based on salary, subject to stipulated or statutory limitations. The expense for our defined contribution plans was as follows:
| Year Ended December 31, | ||||||||||||
| 2010 | 2009 | 2008 | ||||||||||
| (in thousands) | ||||||||||||
|
Defined contribution plans expense |
$ | 6,217 | $ | 3,380 | $ | 5,204 | ||||||
Bonus and Profit Sharing Plans
We have employee bonus and profit sharing plans in which many of our employees participate. These plans provide award amounts for the achievement of annual performance and financial targets. Actual award amounts are determined at the end of the year if the performance and financial targets are met. As the bonuses are being earned during the year, we estimate a compensation accrual each quarter based on the progress towards achieving the goals, the estimated financial forecast for the year, and the probability of achieving results. Bonus and profit sharing plans expense was as follows:
| Year Ended December 31, | ||||||||||||
| 2010 | 2009 | 2008 | ||||||||||
| (in thousands) | ||||||||||||
|
Bonus and profit sharing plans expense |
$ | 46,782 | $ | 13,316 | $ | 15,201 | ||||||
59
Table of Contents
The following table summarizes the provision (benefit) for U.S. federal, state, and foreign taxes on income from continuing operations:
| Year Ended December 31, | ||||||||||||
| 2010 | 2009 | 2008 | ||||||||||
| (in thousands) | ||||||||||||
|
Current: |
||||||||||||
|
Federal |
$ | 10,486 | $ | - | $ | - | ||||||
|
State and local |
765 | - | (82) | |||||||||
|
Foreign |
22,715 | 20,392 | 42,120 | |||||||||
|
Total current |
33,966 | 20,392 | 42,038 | |||||||||
|
Deferred: |
||||||||||||
|
Federal |
7,216 | (39,311) | (8,081) | |||||||||
|
State and local |
3,340 | (3,341) | (1,807) | |||||||||
|
Foreign |
(31,743) | (28,118) | (33,429) | |||||||||
|
Total deferred |
(21,187) | (70,770) | (43,317) | |||||||||
|
Change in valuation allowance |
3,195 | 6,553 | 50 | |||||||||
|
Total provision (benefit) for income taxes |
$ | 15,974 | $ | (43,825) | $ | (1,229) | ||||||
A reconciliation of income taxes at the U.S. federal statutory rate of 35% to the consolidated actual tax rate is as follows:
| Year Ended December 31, | ||||||||||||
| 2010 | 2009 | 2008 | ||||||||||
| (in thousands) | ||||||||||||
|
Income (loss) before income taxes |
||||||||||||
|
Domestic |
$ | 173,032 | $ | 34,946 | $ | 68,968 | ||||||
|
Foreign |
(52,288) | (81,020) | (50,386) | |||||||||
|
Total income (loss) before income taxes |
$ | 120,744 | $ | (46,074) | $ | 18,582 | ||||||
|
Expected federal income tax provision (benefit) |
$ | 42,260 | $ | (16,126) | $ | 6,504 | ||||||
|
Tax credits |
(9,746) | (23,224) | (4,341) | |||||||||
|
State income tax provision (benefit), net of federal effect |
1,968 | (3,193) | (1,391) | |||||||||
|
Change in valuation allowance |
3,195 | 6,553 | 50 | |||||||||
|
Uncertain tax positions, including interest and penalties |
(10,242) | 12,053 | 5,555 | |||||||||
|
Change in tax rates |
(1,428) | 482 | (1,222) | |||||||||
|
Stock-based compensation |
1,541 | 1,648 | 1,212 | |||||||||
|
Foreign earnings |
(14,986) | (18,224) | (24,822) | |||||||||
|
U.S. tax provision on foreign earnings |
279 | 7,932 | 15,470 | |||||||||
|
U.S. tax provision (benefit) of foreign branch income (loss) |
333 | (6,262) | - | |||||||||
|
Other, net |
2,800 | (5,464) | 1,756 | |||||||||
|
Total provision (benefit) for income taxes |
$ | 15,974 | $ | (43,825) | $ | (1,229) | ||||||
Our tax provision for 2010 and tax benefits for 2009 and 2008 reflect benefits associated with lower statutory tax rates on foreign earnings as compared with our U.S. federal statutory rate, and the benefit of foreign interest expense deductions. We made an election under Internal Revenue Code Section 338 with respect to the Actaris acquisition, which resulted in a reduced global effective tax rate. During 2009, we recorded deferred tax assets for foreign tax credit carryforwards resulting from the election to claim foreign taxes as a credit instead of a deduction on our 2007 and 2008 U.S. tax returns. Furthermore, during 2010 we de-recognized a reserve for uncertain tax positions due to a change in the method of depreciation for certain foreign subsidiaries.
60
Table of Contents
Deferred tax assets and liabilities consist of the following:
| At December 31, | ||||||||
| 2010 | 2009 | |||||||
| (in thousands) | ||||||||
|
Deferred tax assets |
||||||||
|
Loss carryforwards (1) |
$ | 53,213 | $ | 70,897 | ||||
|
Tax credits (2) |
46,801 | 51,835 | ||||||
|
Accrued expenses |
30,798 | 19,346 | ||||||
|
Equity compensation |
11,206 | 8,979 | ||||||
|
Depreciation and amortization |
10,916 | 12,638 | ||||||
|
Warranty reserves |
10,332 | 9,222 | ||||||
|
Pension plan benefits expense |
6,897 | 6,372 | ||||||
|
Inventory valuation |
5,254 | 3,714 | ||||||
|
Derivatives |
1,135 | 12,728 | ||||||
|
Other deferred tax assets, net |
3,027 | 2,740 | ||||||
|
Total deferred tax assets |
179,579 | 198,471 | ||||||
|
Valuation allowance |
(24,600) | (22,425) | ||||||
|
Total deferred tax assets, net of valuation allowance |
154,979 | 176,046 | ||||||
|
Deferred tax liabilities |
||||||||
|
Depreciation and amortization |
(89,166) | (119,246) | ||||||
|
Convertible debt |
(19,844) | (18,524) | ||||||
|
Tax effect of accumulated translation |
(2,782) | (1,676) | ||||||
|
Other deferred tax liabilities, net |
(7,645) | (8,226) | ||||||
|
Total deferred tax liabilities |
(119,437) | (147,672) | ||||||
|
Net deferred tax assets |
$ | 35,542 | $ | 28,374 | ||||
| (1) |
For tax return purposes at December 31, 2010, we had U.S. federal loss carryforwards of $33.8 million that expire during the years 2020 through 2029. The remaining portion of the loss carryforwards are composed primarily of losses in various foreign jurisdictions. The majority of these losses can be carried forward indefinitely. At December 31, 2010, there was a valuation allowance of $24.6 million primarily associated with foreign loss carryforwards. |
| (2) |
For tax return purposes at December 31, 2010, we had: (1) federal research and development tax credits of $28.0 million, which begin to expire in 2019; (2) alternative minimum tax credits of $3.6 million that are carried forward indefinitely; and (3) foreign tax credits of $27.9 million, which begin to expire in 2017; and (4) an investment tax credit of $5.2 million, which expires in 2019. |
We record valuation allowances to reduce deferred tax assets to the extent we believe it is more likely than not that a portion of such assets will not be realized. In making such determinations, we consider all available positive and negative evidence, including scheduled reversals of deferred tax liabilities, projected future taxable income, tax planning strategies, and our ability to carry back losses to prior years. We are required to make assumptions and judgments about potential outcomes that lie outside management’s control. Our most sensitive and critical factors are the projection, source, and character of future taxable income. Although realization is not assured, management believes it is more likely than not that deferred tax assets, net of valuation allowance, will be realized. The amount of deferred tax assets considered realizable, however, could be reduced in the near term if estimates of future taxable income during the carryforward periods are reduced or current tax planning strategies are not implemented.
Our deferred tax assets at December 31, 2010 do not include the tax effect on $55.5 million of excess tax benefits from employee stock plan exercises. Common stock will be increased by $20.9 million when such excess tax benefits reduce cash taxes payable.
We do not provide U.S. deferred taxes on temporary differences related to our foreign investments that are considered permanent in duration. These temporary differences consist primarily of undistributed foreign earnings of $21.3 million and
61
Table of Contents
$53.1 million at December 31, 2010 and 2009, respectively. Foreign taxes have been provided on these undistributed foreign earnings. Determination of the amount of deferred taxes on these temporary differences is not practicable due to foreign tax credits and exclusions.
We are subject to income tax in the United States and numerous foreign jurisdictions. Significant judgment is required in evaluating our tax positions and determining our provision for income taxes. During the ordinary course of business, there are many transactions and calculations for which the ultimate tax determination is uncertain. We establish reserves for tax-related uncertainties based on estimates of whether, and the extent to which, additional taxes will be due. These reserves are established when we believe that certain positions might be challenged despite our belief that our tax return positions are fully supportable. We adjust these reserves in light of changing facts and circumstances, such as the outcome of tax audits. The provision for income taxes includes the impact of reserve positions and changes to reserves that are considered appropriate.
A reconciliation of the beginning and ending amount of unrecognized tax benefits is as follows (in thousands):
|
Unrecognized tax benefits at January 1, 2008 |
$ | 34,779 | ||
|
Gross increase to positions in prior years |
2,037 | |||
|
Gross decrease to positions in prior years |
(798) | |||
|
Gross increases to current period tax positions |
3,267 | |||
|
Audit settlements |
(391) | |||
|
Effect of change in exchange rates |
(1,250) | |||
|
Unrecognized tax benefits at December 31, 2008 |
$ | 37,644 | ||
|
Gross increase to positions in prior years |
8,958 | |||
|
Gross decrease to positions in prior years |
(4,360) | |||
|
Gross increases to current period tax positions |
5,471 | |||
|
Audit settlements |
(2,032) | |||
|
Effect of change in exchange rates |
525 | |||
|
Unrecognized tax benefits at December 31, 2009 |
$ | 46,206 | ||
|
Gross increase to positions in prior years |
2,037 | |||
|
Gross decrease to positions in prior years |
(11,700) | |||
|
Gross increases to current period tax positions |
13,743 | |||
|
Audit settlements |
(2,049) | |||
|
Decrease related to lapsing of statute of limitations |
(4,002) | |||
|
Effect of change in exchange rates |
(2,060) | |||
|
Unrecognized tax benefits at December 31, 2010 |
$ | 42,175 | ||
| At December 31, | ||||||||||||
| 2010 | 2009 | 2008 | ||||||||||
| (in thousands) | ||||||||||||
|
The amount of unrecognized tax benefits that, if recognized, would affect our effective tax rate |
$ | 30,832 | $ | 46,206 | $ | 37,644 | ||||||
62
Table of Contents
We classify interest expense and penalties related to unrecognized tax liabilities and interest income on tax overpayments as components of income tax expense. Interest and penalties recognized, and accrued interest and penalties recorded, are as follows:
| Year Ended December 31, | ||||||||||||
| 2010 | 2009 | 2008 | ||||||||||
| (in thousands) | ||||||||||||
|
Net interest and penalties expense |
$ | 498 | $ | 1,476 | $ | 1,332 | ||||||
| At December 31, | ||||||||||||
| 2010 | 2009 | |||||||||||
| (in thousands) | ||||||||||||
|
Accrued interest |
$ | 4,403 | $ | 4,134 | ||||||||
|
Accrued penalties |
3,233 | 3,385 | ||||||||||
At December 31, 2010, we expect to pay $1.1 million in income taxes, interest, and penalties related to uncertain tax positions over the next twelve months. We are not able to reasonably estimate the timing of future cash flows relating to the remaining balance.
We believe it reasonably possible that our unrecognized tax benefits may decrease by approximately $20.1 million within the next twelve months due to a change in the method of accounting for uncertain expense accruals, expiration of statute of limitations, and a final ruling related to an audit.
We file income tax returns in the U.S. federal jurisdiction and various states and foreign jurisdictions. We are subject to income tax examination by tax authorities in our major tax jurisdictions as follows:
|
Tax Jurisdiction |
Years Subject to Audit | |
|
U.S. federal |
Subsequent to 1998 | |
|
France |
Subsequent to 2007 | |
|
Germany |
Subsequent to 2004 | |
|
Spain |
Subsequent to 2005 | |
|
United Kingdom |
Subsequent to 2004 |
Commitments
Operating lease rental expense for factories, office facilities, and equipment was as follows:
| Year Ended December 31, | ||||||||||||
| 2010 | 2009 | 2008 | ||||||||||
| (in thousands) | ||||||||||||
|
Rental expense |
$ | 15,530 | $ | 15,882 | $ | 15,646 | ||||||
63
Table of Contents
Future minimum lease payments at December 31, 2010, under noncancelable operating leases with initial or remaining terms in excess of one year are as follows:
| Minimum Payments | ||||
| (in thousands) | ||||
|
2011 |
$ | 8,617 | ||
|
2012 |
5,901 | |||
|
2013 |
3,600 | |||
|
2014 |
2,214 | |||
|
2015 |
940 | |||
|
Beyond 2015 |
1,283 | |||
|
Future minimum lease payments |
$ | 22,555 | ||
Rent expense is recognized straight-line over the lease term, including renewal periods if reasonably assured. We lease most of our sales and administration offices. Our leases typically contain renewal options similar to the original terms with lease payments that increase based on the consumer price index.
Guarantees and Indemnifications
We are often required to obtain standby letters of credit (LOC’s) or bonds in support of our obligations for customer contracts. These standby LOC’s or bonds typically provide a guarantee to the customer for future performance, which usually covers the installation phase of a contract and may on occasion cover the operations and maintenance phase of outsourcing contracts.
Our available lines of credit, outstanding standby LOC’s, and bonds are as follows:
| At December 31, | ||||||||
| 2010 | 2009 | |||||||
| (in thousands) | ||||||||
|
Credit facility (1) |
||||||||
|
Multicurrency revolving line of credit |
$ | 240,000 | $ | 115,000 | ||||
|
Standby LOC’s issued and outstanding |
(43,540) | (39,907) | ||||||
|
Net available for additional borrowings and LOC’s |
$ | 196,460 | $ | 75,093 | ||||
|
Unsecured multicurrency revolving lines of credit with various financial institutions |
||||||||
|
Total lines of credit |
$ | 49,122 | $ | 38,704 | ||||
|
Standby LOC’s issued and outstanding |
(21,784) | (10,878) | ||||||
|
Short-term borrowings (2) |
(66) | (2,106) | ||||||
|
Net available for additional borrowings and LOC’s |
$ | 27,272 | $ | 25,720 | ||||
|
Unsecured surety bonds in force |
$ | 120,109 | $ | 71,362 | ||||
| (1) |
See Note 6 for details regarding our credit facility, which is secured. |
| (2) |
Short-term borrowings are included in “other current liabilities” on the Consolidated Balance Sheets. |
In the event any such standby LOC or bond is called, we would be obligated to reimburse the issuer of the standby LOC or bond; however, we do not believe that any currently outstanding LOC or bond will be called.
We generally provide an indemnification related to the infringement of any patent, copyright, trademark, or other intellectual property right on software or equipment within our sales contracts, which indemnifies the customer from and pays the resulting costs, damages, and attorney’s fees awarded against a customer with respect to such a claim provided that (a) the customer promptly notifies us in writing of the claim and (b) we have the sole control of the defense and all related settlement negotiations. We also provide an indemnification to our customers for third party claims resulting from damages caused by the negligence or willful misconduct of our employees/agents in connection with the performance of certain contracts. The terms of our indemnifications generally do not limit the maximum potential payments. It is not possible to predict the maximum potential amount of future payments under these or similar agreements.
64
Table of Contents
Legal Matters
We are subject to various legal proceedings and claims of which the outcomes are subject to significant uncertainty. Our policy is to assess the likelihood of any adverse judgments or outcomes related to legal matters, as well as ranges of probable losses. A determination of the amount of the liability required, if any, for these contingencies is made after an analysis of each known issue. A liability is recorded and charged to operating expense when we determine that a loss is probable and the amount can be reasonably estimated. Additionally, we disclose contingencies for which a material loss is reasonably possible, but not probable. Liabilities recorded for legal contingencies at December 31, 2010 were not material to our financial condition or results of operations.
In April 2010, Acoustic Technologies Incorporated (Acoustic) filed a complaint in the U.S. District Court for the District of Massachusetts against Itron alleging infringement of two patents owned by Acoustic related to the use of concentrator meters to relay information between meters and a collection point. The complaint seeks unspecified damages as well as injunctive relief. Itron has denied all of the allegations. We believe these claims are without merit and we intend to vigorously defend our interests. We do not believe this matter will have a material adverse effect on our business or financial condition, although an unfavorable outcome could have a material adverse effect on our results of operations for the period in which such a loss is recognized.
In October, 2010, Transdata Incorporated (Transdata) filed a complaint in the U.S. District Court for the Eastern District of Texas against CenterPoint Energy, one of our customers, and several other utilities alleging infringement of three patents owned by Transdata related to the use of an antenna in a meter. Pursuant to its contract with CenterPoint, we agreed to indemnify and defend CenterPoint in this lawsuit. The complaint seeks unspecified damages as well as injunctive relief. CenterPoint has denied all of the allegations. We believe these claims are without merit and we intend to vigorously defend our interests. We do not believe this matter will have a material adverse effect on our business or financial condition, although an unfavorable outcome could have a material adverse effect on our results of operations for the period in which such a loss is recognized.
In November, 2010, we received notice from Dialight BLP Limited (Dialight), that it had been awarded a patent by the U.S. Patent and Trademark Office and that a feature contained in one of our products could be infringing upon their patents rights. We are engaged in discussions with Dialight and believe that this issue will be resolved. We do not believe this matter will have a material adverse effect on our business or financial condition, although an unfavorable outcome could have a material adverse effect on our results of operations for the period in which the claim is resolved.
On February 23, 2011, a class action lawsuit was filed in U.S. Federal Court for the Eastern District of Washington alleging a violation of federal securities laws relating to a restatement of our financial results for the quarters ended March 31, June 30, and September 30, 2010. These revisions were made primarily to defer revenue that had been incorrectly recognized on one contract due to a misinterpretation of an extended warranty obligation. The effect was to reduce revenue and earnings in each of the first three quarters of the year. For the first nine months of 2010, total revenue was reduced by $6.1 million and diluted EPS was reduced by 11 cents. We intend to vigorously defend our interests.
Standard Warranty
A summary of the warranty accrual account activity is as follows:
| Year Ended December 31, | ||||||||
| 2010 | 2009 | |||||||
| (in thousands) | ||||||||
|
Beginning balance, January 1 |
$ | 33,873 | $ | 38,255 | ||||
|
New product warranties |
12,981 | 7,437 | ||||||
|
Other changes/adjustments to warranties |
25,598 | 7,612 | ||||||
|
Reclassification from other current liabilities |
2,878 | - | ||||||
|
Claims activity |
(24,040) | (20,222) | ||||||
|
Effect of change in exchange rates |
(7) | 791 | ||||||
|
Ending balance, December 31 |
51,283 | 33,873 | ||||||
|
Less: current portion of warranty |
24,912 | 20,941 | ||||||
|
Long-term warranty |
$ | 26,371 | $ | 12,932 | ||||
Total warranty expense, which is classified within cost of revenues and consists of new product warranties issued and other changes and adjustments to warranties, is as follows:
| Year Ended December 31, | ||||||||||||
| 2010 | 2009 | 2008 | ||||||||||
| (in thousands) | ||||||||||||
|
Warranty expense |
$ | 38,579 | $ | 15,049 | $ | 14,150 | ||||||
Warranty expense associated with our segments was as follows:
| Year Ended December 31, | ||||||||||||
| 2010 | 2009 | 2008 | ||||||||||
|
Itron North America |
46% | 81% | 91% | |||||||||
|
Itron International |
54% | 19% | 9% | |||||||||
The increase in Itron International’s warranty expense in 2010 was primarily the result of $14.4 million recorded for arbitration claims in Sweden, which were settled in the third quarter of 2010.
65
Table of Contents
Extended Warranty
A summary of changes to unearned revenue for extended warranty contracts is as follows:
| Year Ended December 31, | ||||||||
| 2010 | 2009 | |||||||
| (in thousands) | ||||||||
|
Beginning balance, January 1 |
$ | 5,870 | $ | 5,986 | ||||
|
Unearned revenue for new extended warranties |
10,308 | 1,251 | ||||||
|
Unearned revenue recognized |
(1,541) | (1,367) | ||||||
|
Ending balance, December 31 |
14,637 | 5,870 | ||||||
|
Less: current portion of unearned revenue for extended warranty |
1,130 | 1,488 | ||||||
|
Long-term unearned revenue for extended warranty |
$ | 13,507 | $ | 4,382 | ||||
Health Benefits
We are self insured for a substantial portion of the cost of our U.S. employee group health insurance. We purchase insurance from a third party, which provides individual and aggregate stop loss protection for these costs. Each reporting period, we expense the costs of our health insurance plan including paid claims, the change in the estimate of incurred but not reported (IBNR) claims, taxes, and administrative fees (collectively, the plan costs). Plan costs and the IBNR accrual, which is included in wages and benefits payable, are as follows:
| Year Ended December 31, | ||||||||||||
| 2010 | 2009 | 2008 | ||||||||||
| (in thousands) | ||||||||||||
|
Plan costs |
$ | 20,548 | $ | 19,802 | $ | 20,001 | ||||||
| At December 31, | ||||||||||||
| 2010 | 2009 | |||||||||||
| (in thousands) | ||||||||||||
|
IBNR accrual |
$ | 2,056 | $ | 3,343 | ||||||||
Our IBNR accrual and expenses may fluctuate due to the number of plan participants, claims activity, and deductible limits. Due to a change in our medical plan administrator, we have reduced our claims processing time. Therefore, the IBNR accrual is lower at December 31, 2010 compared with December 31, 2009. For our employees located outside of the United States, health benefits are provided primarily through governmental social plans, which are funded through employee and employer tax withholdings.
Shareholder Rights Plan
On November 4, 2002, the Board of Directors authorized the implementation of a Shareholder Rights Plan and declared a dividend of one preferred share purchase right (Right) for each outstanding share of common stock, without par value. The Rights will separate from the common stock and become exercisable following the earlier of (i) the close of business on the tenth business day after a public announcement that a person or group (including any affiliate or associate of such person or group) has acquired beneficial ownership of 15% or more of the outstanding common shares and (ii) the close of business on such date, if any, as may be designated by the Board of Directors following the commencement of, or first public disclosure of an intent to commence, a tender or exchange offer for outstanding common shares, which could result in the offeror becoming the beneficial owner of 15% or more of the outstanding common shares (the earlier of such dates being the distribution date). After the distribution date, each Right will entitle the holder to purchase, for $160, one one-hundredth (1/100) of a share of Series R Cumulative Participating Preferred Stock of the Company (a Preferred Share) with economic terms similar to that of one common share.
In the event a person or group becomes an acquiring person, the Rights will entitle each holder of a Right to purchase, for the purchase price, that number of common shares equivalent to the number of common shares, which at the time of the transaction would have a market value of twice the purchase price. Any Rights that are at any time beneficially owned by an acquiring person will be null and void and nontransferable and any holder of any such Right will be unable to exercise or
66
Table of Contents
transfer any such Right. If, at any time after any person or group becomes an acquiring person, we are acquired in a merger or other business combination with another entity, or if 50% or more of its assets or assets accounting for 50% or more of its net income or revenues are transferred, each Right will entitle its holder to purchase, for the purchase price, that number of shares of common stock of the person or group engaging in the transaction having a then current market value of twice the purchase price. At any time after any person or group becomes an acquiring person, but before a person or group becomes the beneficial owner of more than 50% of the common shares, the Board of Directors may elect to exchange each Right for consideration per Right consisting of one-half of the number of common shares that would be issuable at such time on the exercise of one Right and without payment of the purchase price. At any time prior to any person or group becoming an acquiring person, the Board of Directors may redeem the Rights in whole, but not in part, at a price of $0.01 per Right, subject to adjustment as provided in the Rights Agreement. The Rights are not exercisable until the distribution date and will expire on December 11, 2012, unless earlier redeemed or exchanged by us.
The terms of the Rights and the Rights Agreement may be amended without the approval of any holder of the Rights, at any time prior to the distribution date. Until a Right is exercised, the holder thereof will have no rights as a shareholder of the Company, including, without limitation, the right to vote or receive dividends. In order to preserve the actual or potential economic value of the Rights, the number of Preferred Shares or other securities issuable upon exercise of the Right, the purchase price, the redemption price, and the number of Rights associated with each outstanding common share are all subject to adjustment by the Board of Directors pursuant to certain customary antidilution provisions. The Rights distribution should not be taxable for federal income tax purposes. Following an event that renders the Rights exercisable or upon redemption of the Rights, shareholders may recognize taxable income.
Other Comprehensive Income
Other comprehensive income is reflected as a net increase to shareholders’ equity and is not reflected in our results of operations. Accumulated balances within other comprehensive income, net of tax, were as follows:
| At December 31, | ||||||||
| 2010 | 2009 | |||||||
| (in thousands) | ||||||||
|
Foreign currency translation adjustment |
$ | (26,026) | $ | 98,165 | ||||
|
Net unrealized gain (loss) on derivative instruments |
(20,007) | (17,077) | ||||||
|
Net unrealized gain (loss) on nonderivative hedging instrument |
(5,514) | (21,339) | ||||||
|
Net hedging (gains) losses reclassified into net income (loss) |
15,487 | 8,116 | ||||||
|
Pension plan benefits liability adjustment |
1,086 | 3,265 | ||||||
|
Total accumulated other comprehensive income (loss) |
$ | (34,974) | $ | 71,130 | ||||
The fair values at December 31, 2010 and 2009 do not reflect subsequent changes in the economy, interest rates, tax rates, and other variables that may affect the determination of fair value.
| At December 31, 2010 | At December 31, 2009 | |||||||||||||||
|
Carrying
Amount |
Fair
Value |
Carrying
Amount |
Fair
Value |
|||||||||||||
| (in thousands) | ||||||||||||||||
|
Assets |
||||||||||||||||
|
Cash and cash equivalents |
$ | 169,477 | $ | 169,477 | $ | 121,893 | $ | 121,893 | ||||||||
|
Foreign exchange forwards |
63 | 63 | 3,986 | 3,986 | ||||||||||||
|
Liabilities |
||||||||||||||||
|
Term loans |
||||||||||||||||
|
USD denominated term loan |
$ | 218,642 | $ | 219,462 | $ | 284,693 | $ | 284,693 | ||||||||
|
EUR denominated term loan |
174,031 | 174,684 | 288,902 | 288,902 | ||||||||||||
|
Convertible senior subordinated notes |
218,268 | 236,461 | 208,169 | 282,859 | ||||||||||||
|
Interest rate swaps |
6,820 | 6,820 | 15,154 | 15,154 | ||||||||||||
|
Foreign exchange forwards |
457 | 457 | 2,442 | 2,442 | ||||||||||||
67
Table of Contents
The following methods and assumptions were used in estimating fair values:
Cash and cash equivalents: Due to the liquid nature of these instruments, the carrying value approximates fair value.
Term loans: The term loans are not registered with the SEC but are generally transferable through banks that hold the debt and make a market. The fair value is based on quoted prices from recent trades of the term loans.
Convertible senior subordinated notes: The convertible notes are registered with the SEC and are generally transferable. The fair value is based on quoted prices from recent broker trades of the convertible notes. The carrying value is lower than the face value of the convertible notes as a result of separating the liability and equity components. The face value of the convertible notes was $223.6 million at December 31, 2010 and 2009. See Note 6 for further discussion.
Derivatives: See Note 7 for a description of our methods and assumptions in determining the fair value of our derivatives, which were determined using fair value measurements of significant other observable inputs (Level 2).
We have two operating segments: Itron North America and Itron International. Itron North America generates the majority of its revenues in the United States and Canada, while Itron International generates the majority of its revenues in Europe, and the balance primarily in Africa, South America, and Asia/Pacific. Due to the continued refinement of our management and geographic reporting structures, as of January 1, 2010, Itron International includes our Taiwan operations, which were previously part of Itron North America. Historical segment information has been revised to conform to our current segment reporting structure.
We have three measures of segment performance: revenue, gross profit (margin), and operating income (margin). Intersegment revenues were minimal. Corporate operating expenses, interest income, interest expense, gain (loss) on extinguishment of debt, other income (expense), and income tax provision (benefit) are not allocated to the segments, nor included in the measure of segment profit or loss.
Segment Products
|
Itron North America |
Standard electricity (electronic), gas, and water meters; advanced and smart electricity and water meters and communication modules; advanced and smart gas communication modules; advanced systems including handheld, mobile, and fixed network collection technologies; smart network technologies; meter data management software; knowledge application solutions; professional services including implementation, installation, consulting, and analysis. |
|
|
Itron International |
Standard electricity (electromechanical and electronic), gas, and water meters; advanced electricity, gas, and water meters; advanced water communication modules; smart electricity meters and communication modules; prepayment systems, including smart key, keypad, and smart card communication technologies; advanced systems including handheld, mobile, and fixed network collection technologies; smart network technologies; meter data management software; knowledge application solutions; professional services including implementation, installation and system management. |
|
68
Table of Contents
| Year Ended December 31, | ||||||||||||
| 2010 | 2009 | 2008 | ||||||||||
| (in thousands) | ||||||||||||
|
Revenues |
||||||||||||
|
Itron North America |
$ | 1,177,391 | $ | 615,731 | $ | 696,688 | ||||||
|
Itron International |
1,081,880 | 1,071,716 | 1,212,925 | |||||||||
|
Total Company |
$ | 2,259,271 | $ | 1,687,447 | $ | 1,909,613 | ||||||
|
Gross profit |
||||||||||||
|
Itron North America |
$ | 394,247 | $ | 211,682 | $ | 263,645 | ||||||
|
Itron International |
303,992 | 325,774 | 383,212 | |||||||||
|
Total Company |
$ | 698,239 | $ | 537,456 | $ | 646,857 | ||||||
|
Operating income (loss) |
||||||||||||
|
Itron North America |
$ | 201,410 | $ | 36,931 | $ | 78,046 | ||||||
|
Itron International |
26,363 | 37,614 | 69,458 | |||||||||
|
Corporate unallocated |
(43,576) | (29,518) | (37,682) | |||||||||
|
Total Company |
184,197 | 45,027 | 109,822 | |||||||||
|
Total other income (expense) |
(63,453) | (91,101) | (91,240) | |||||||||
|
Income (loss) before income taxes |
$ | 120,744 | $ | (46,074) | $ | 18,582 | ||||||
For the year ended December 31, 2010, one Itron North America customer represented 11% of total Company revenues. Three customers each accounted for more than 10% of Itron North America revenues during 2010. No single customer represented more than 10% of Itron International revenues in 2010.
No single customer represented more than 10% of total Company or operating segment revenues for the years ended December 31, 2009, and 2008.
Total assets by operating segment were as follows:
| At December 31, | ||||||||||||
| 2010 | 2009 | 2008 | ||||||||||
| (in thousands) | ||||||||||||
|
Itron North America/Corporate (1) |
$ | 754,974 | $ | 752,008 | $ | 843,260 | ||||||
|
Itron International |
2,002,944 | 2,139,137 | 2,027,094 | |||||||||
|
Eliminations |
(12,121) | (36,524) | (14,006) | |||||||||
|
Total assets |
$ | 2,745,797 | $ | 2,854,621 | $ | 2,856,348 | ||||||
| (1) |
We do not allocate assets between the Itron North America operating segment and Corporate. |
Revenues by region were as follows:
| Year Ended December 31, | ||||||||||||
| 2010 | 2009 | 2008 | ||||||||||
| (in thousands) | ||||||||||||
|
United States and Canada |
$ | 1,168,523 | $ | 606,472 | $ | 647,966 | ||||||
|
Europe |
756,013 | 806,540 | 916,288 | |||||||||
|
Other |
334,735 | 274,435 | 345,359 | |||||||||
|
Total revenues |
$ | 2,259,271 | $ | 1,687,447 | $ | 1,909,613 | ||||||
69
Table of Contents
Property, plant, and equipment, net, by geographic area were as follows:
| At December 31, | ||||||||||||
| 2010 | 2009 | 2008 | ||||||||||
| (in thousands) | ||||||||||||
|
United States |
$ | 115,499 | $ | 116,081 | $ | 96,952 | ||||||
|
Outside United States |
183,743 | 202,136 | 210,765 | |||||||||
|
Total property, plant, and equipment, net |
$ | 299,242 | $ | 318,217 | $ | 307,717 | ||||||
Depreciation and amortization expense associated with our segments was as follows:
| Year ended December 31, | ||||||||||||
| 2010 | 2009 | 2008 | ||||||||||
| (in thousands) | ||||||||||||
|
Itron North America |
$ | 45,960 | $ | 48,215 | $ | 43,552 | ||||||
|
Itron International |
85,243 | 107,513 | 130,105 | |||||||||
|
Corporate Unallocated |
2 | 9 | 16 | |||||||||
|
Total Company |
$ | 131,205 | $ | 155,737 | $ | 173,673 | ||||||
70
Table of Contents
Our convertible notes, issued by Itron, Inc., are guaranteed by one U.S. subsidiary, which is 100% owned. Our senior subordinated notes issued in May 2004, which were redeemed in 2009, were guaranteed by multiple U.S. operating subsidiaries. We have not restated the comparative prior period results to reflect the change in certain U.S. subsidiaries from guarantors to non-guarantors as they are not material.
The guaranty by our U.S. subsidiary is joint and several, full, complete, and unconditional. There are currently no restrictions on the ability of the subsidiary guarantor to transfer funds to the parent company.
Consolidating Statement of Operations
Year Ended December 31, 2010
| Parent |
Guarantor
Subsidiary |
Combined
Non-guarantor Subsidiaries |
Eliminations | Consolidated | ||||||||||||||||
| (in thousands) | ||||||||||||||||||||
|
Revenues |
$ | 1,170,615 | $ | - | $ | 1,141,789 | $ | (53,133) | $ | 2,259,271 | ||||||||||
|
Cost of revenues |
786,330 | - | 827,835 | (53,133) | 1,561,032 | |||||||||||||||
|
Gross profit |
384,285 | - | 313,954 | - | 698,239 | |||||||||||||||
|
Operating expenses |
||||||||||||||||||||
|
Sales and marketing |
65,044 | - | 106,632 | - | 171,676 | |||||||||||||||
|
Product development |
90,209 | - | 50,020 | - | 140,229 | |||||||||||||||
|
General and administrative |
54,685 | - | 78,401 | - | 133,086 | |||||||||||||||
|
Amortization of intangible assets |
16,341 | - | 52,710 | - | 69,051 | |||||||||||||||
|
Total operating expenses |
226,279 | - | 287,763 | - | 514,042 | |||||||||||||||
|
Operating income |
158,006 | - | 26,191 | - | 184,197 | |||||||||||||||
|
Other income (expense) |
- | |||||||||||||||||||
|
Interest income |
70,351 | 3,248 | 482 | (73,489) | 592 | |||||||||||||||
|
Interest expense |
(58,063) | - | (70,330) | 73,489 | (54,904) | |||||||||||||||
|
Other income (expense), net |
(585) | - | (8,556) | - | (9,141) | |||||||||||||||
|
Total other income (expense) |
11,703 | 3,248 | (78,404) | - | (63,453) | |||||||||||||||
|
Income (loss) before income taxes |
169,709 | 3,248 | (52,213) | - | 120,744 | |||||||||||||||
|
Income tax (provision) benefit |
(24,221) | - | 8,247 | - | (15,974) | |||||||||||||||
|
Equity in earnings (losses) of guarantor and non-guarantor subsidiaries, net |
(40,718) | - | - | 40,718 | - | |||||||||||||||
|
Net income (loss) |
$ | 104,770 | $ | 3,248 | $ | (43,966) | $ | 40,718 | $ | 104,770 | ||||||||||
71
Table of Contents
Consolidating Statement of Operations
Year Ended December 31, 2009
| Parent |
Combined
Guarantor Subsidiaries |
Combined
Non-guarantor Subsidiaries |
Eliminations | Consolidated | ||||||||||||||||
| (in thousands) | ||||||||||||||||||||
|
Revenues |
$ | 603,426 | $ | 4,095 | $ | 1,124,562 | $ | (44,636) | $ | 1,687,447 | ||||||||||
|
Cost of revenues |
399,179 | 3,994 | 791,454 | (44,636) | 1,149,991 | |||||||||||||||
|
Gross profit |
204,247 | 101 | 333,108 | - | 537,456 | |||||||||||||||
|
Operating expenses |
||||||||||||||||||||
|
Sales and marketing |
55,552 | - | 96,853 | - | 152,405 | |||||||||||||||
|
Product development |
76,957 | - | 45,357 | - | 122,314 | |||||||||||||||
|
General and administrative |
41,821 | - | 77,316 | - | 119,137 | |||||||||||||||
|
Amortization of intangible assets |
23,506 | - | 75,067 | - | 98,573 | |||||||||||||||
|
Total operating expenses |
197,836 | - | 294,593 | - | 492,429 | |||||||||||||||
|
Operating income |
6,411 | 101 | 38,515 | - | 45,027 | |||||||||||||||
|
Other income (expense) |
||||||||||||||||||||
|
Interest income |
113,850 | 3,659 | 725 | (117,048) | 1,186 | |||||||||||||||
|
Interest expense |
(73,441) | - | (114,137) | 117,267 | (70,311) | |||||||||||||||
|
Loss on extinguishment of debt, net |
(12,800) | - | - | - | (12,800) | |||||||||||||||
|
Other income (expense), net |
(2,799) | (30) | (6,128) | (219) | (9,176) | |||||||||||||||
|
Total other income (expense) |
24,810 | 3,629 | (119,540 | ) | - | (91,101 | ) | |||||||||||||
|
Income (loss) before income taxes |
31,221 | 3,730 | (81,025) | - | (46,074) | |||||||||||||||
|
Income tax benefit (provision) |
42,907 | (32) | 950 | - | 43,825 | |||||||||||||||
|
Equity in losses of guarantor and non-guarantor subsidiaries, net |
(76,377) | (19,363) | - | 95,740 | - | |||||||||||||||
|
Net loss |
$ | (2,249) | $ | (15,665) | $ | (80,075) | $ | 95,740 | $ | (2,249) | ||||||||||
Consolidating Statement of Operations
Year Ended December 31, 2008
| Parent |
Combined
Guarantor Subsidiaries |
Combined
Non-guarantor Subsidiaries |
Eliminations | Consolidated | ||||||||||||||||
| (in thousands) | ||||||||||||||||||||
|
Revenues |
$ | 606,741 | $ | 77,828 | $ | 1,264,845 | $ | (39,801) | $ | 1,909,613 | ||||||||||
|
Cost of revenues |
368,275 | 61,170 | 873,052 | (39,741) | 1,262,756 | |||||||||||||||
|
Gross profit |
238,466 | 16,658 | 391,793 | (60) | 646,857 | |||||||||||||||
|
Operating expenses |
||||||||||||||||||||
|
Sales and marketing |
54,180 | 8,853 | 104,424 | - | 167,457 | |||||||||||||||
|
Product development |
73,572 | 3,513 | 43,674 | (60) | 120,699 | |||||||||||||||
|
General and administrative |
49,797 | 2,826 | 75,892 | - | 128,515 | |||||||||||||||
|
Amortization of intangible assets |
22,648 | - | 97,716 | - | 120,364 | |||||||||||||||
|
Total operating expenses |
200,197 | 15,192 | 321,706 | (60 | ) | 537,035 | ||||||||||||||
|
Operating income |
38,269 | 1,466 | 70,087 | - | 109,822 | |||||||||||||||
|
Other income (expense) |
||||||||||||||||||||
|
Interest income |
121,864 | (11) | 4,766 | (120,649) | 5,970 | |||||||||||||||
|
Interest expense |
(93,706) | (183) | (120,937) | 120,649 | (94,177) | |||||||||||||||
|
Other income (expense), net |
2,023 | (808) | (4,248) | - | (3,033) | |||||||||||||||
|
Total other income (expense) |
30,181 | (1,002 | ) | (120,419 | ) | - | (91,240 | ) | ||||||||||||
|
Income (loss) before income taxes |
68,450 | 464 | (50,332) | - | 18,582 | |||||||||||||||
|
Income tax benefit (provision) |
7,779 | (131) | (6,419) | - | 1,229 | |||||||||||||||
|
Equity in losses of guarantor and non-guarantor subsidiaries, net |
(56,418) | (876) | - | 57,294 | - | |||||||||||||||
|
Net income (loss) |
$ | 19,811 | $ | (543) | $ | (56,751) | $ | 57,294 | $ | 19,811 | ||||||||||
72
Table of Contents
Consolidating Balance Sheet
December 31, 2010
| Parent |
Guarantor
Subsidiary |
Combined
Non-guarantor Subsidiaries |
Eliminations | Consolidated | ||||||||||||||||
| (in thousands) | ||||||||||||||||||||
| ASSETS | ||||||||||||||||||||
|
Current assets |
||||||||||||||||||||
|
Cash and cash equivalents |
$ | 19,146 | $ | - | $ | 150,331 | $ | - | $ | 169,477 | ||||||||||
|
Accounts receivable, net |
163,758 | - | 207,904 | - | 371,662 | |||||||||||||||
|
Intercompany accounts receivable |
10,106 | - | 3,675 | (13,781) | - | |||||||||||||||
|
Inventories |
99,846 | - | 109,208 | (897) | 208,157 | |||||||||||||||
|
Deferred tax assets current, net |
40,344 | - | 15,007 | - | 55,351 | |||||||||||||||
|
Other current assets |
23,962 | - | 53,608 | - | 77,570 | |||||||||||||||
|
Intercompany other |
1,997 | - | - | (1,997) | - | |||||||||||||||
|
Total current assets |
359,159 | - | 539,733 | (16,675 | ) | 882,217 | ||||||||||||||
|
Property, plant, and equipment, net |
115,499 | - | 183,743 | - | 299,242 | |||||||||||||||
|
Prepaid debt fees |
4,483 | - | - | - | 4,483 | |||||||||||||||
|
Deferred tax assets noncurrent, net |
7,684 | - | 27,366 | - | 35,050 | |||||||||||||||
|
Other noncurrent assets |
9,651 | - | 14,108 | - | 23,759 | |||||||||||||||
|
Intangible assets, net |
41,828 | - | 249,842 | - | 291,670 | |||||||||||||||
|
Goodwill |
184,750 | - | 1,024,626 | - | 1,209,376 | |||||||||||||||
|
Investment in subsidiaries |
324,104 | - | - | (324,104) | - | |||||||||||||||
|
Intercompany notes receivable |
1,283,139 | 101,418 | - | (1,384,557) | - | |||||||||||||||
|
Total assets |
$ | 2,330,297 | $ | 101,418 | $ | 2,039,418 | $ | (1,725,336 | ) | $ | 2,745,797 | |||||||||
| LIABILITIES AND SHAREHOLDERS’ EQUITY | ||||||||||||||||||||
|
Current liabilities |
||||||||||||||||||||
|
Accounts payable |
$ | 75,027 | $ | - | $ | 166,922 | $ | - | $ | 241,949 | ||||||||||
|
Other current liabilities |
12,644 | - | 36,599 | - | 49,243 | |||||||||||||||
|
Intercompany accounts payable |
3,675 | - | 10,106 | (13,781) | - | |||||||||||||||
|
Wages and benefits payable |
54,804 | - | 55,675 | - | 110,479 | |||||||||||||||
|
Taxes payable |
3,368 | - | 16,357 | - | 19,725 | |||||||||||||||
|
Current portion of debt |
228,721 | - | - | - | 228,721 | |||||||||||||||
|
Current portion of warranty |
8,813 | - | 16,099 | - | 24,912 | |||||||||||||||
|
Unearned revenue |
21,926 | - | 6,332 | - | 28,258 | |||||||||||||||
|
Deferred tax liabilities current, net |
(421) | - | 868 | - | 447 | |||||||||||||||
|
Short-term intercompany advances |
- | - | 1,997 | (1,997) | - | |||||||||||||||
|
Total current liabilities |
408,557 | - | 310,955 | (15,778 | ) | 703,734 | ||||||||||||||
|
Long-term debt |
382,220 | - | - | - | 382,220 | |||||||||||||||
|
Long-term warranty |
13,721 | - | 12,650 | - | 26,371 | |||||||||||||||
|
Pension plan benefit liability |
- | - | 61,450 | - | 61,450 | |||||||||||||||
|
Intercompany notes payable |
101,418 | - | 1,283,139 | (1,384,557) | - | |||||||||||||||
|
Deferred tax liabilities noncurrent, net |
(38,400) | - | 92,812 | - | 54,412 | |||||||||||||||
|
Other long-term obligations |
34,486 | - | 54,829 | - | 89,315 | |||||||||||||||
|
Total liabilities |
902,002 | - | 1,815,835 | (1,400,335 | ) | 1,317,502 | ||||||||||||||
|
Shareholders’ equity |
||||||||||||||||||||
|
Preferred stock |
- | - | - | - | - | |||||||||||||||
|
Common stock |
1,328,249 | 97,377 | 136,441 | (233,818) | 1,328,249 | |||||||||||||||
|
Accumulated other comprehensive income (loss), net |
(34,974) | (7,786) | 41,778 | (33,992) | (34,974) | |||||||||||||||
|
Retained earnings |
135,020 | 11,827 | 45,364 | (57,191) | 135,020 | |||||||||||||||
|
Total shareholders’ equity |
1,428,295 | 101,418 | 223,583 | (325,001 | ) | 1,428,295 | ||||||||||||||
|
Total liabilities and shareholders’ equity |
$ | 2,330,297 | $ | 101,418 | $ | 2,039,418 | $ | (1,725,336 | ) | $ | 2,745,797 | |||||||||
73
Table of Contents
Consolidating Balance Sheet
December 31, 2009
| Parent |
Combined
Guarantor Subsidiaries |
Combined
Non-guarantor Subsidiaries |
Eliminations | Consolidated | ||||||||||||||||
| (in thousands) | ||||||||||||||||||||
| ASSETS | ||||||||||||||||||||
|
Current assets |
||||||||||||||||||||
|
Cash and cash equivalents |
$ | 16,385 | $ | 379 | $ | 105,129 | $ | - | $ | 121,893 | ||||||||||
|
Accounts receivable, net |
117,104 | 2,316 | 218,528 | - | 337,948 | |||||||||||||||
|
Intercompany accounts receivable |
9,524 | 52 | 1,572 | (11,148) | - | |||||||||||||||
|
Inventories |
71,581 | - | 98,881 | (378) | 170,084 | |||||||||||||||
|
Deferred tax assets current, net |
13,085 | (44) | 7,721 | - | 20,762 | |||||||||||||||
|
Other current assets |
32,349 | 108 | 42,772 | - | 75,229 | |||||||||||||||
|
Intercompany other |
32,456 | 3,658 | 4,999 | (41,113) | - | |||||||||||||||
|
Total current assets |
292,484 | 6,469 | 479,602 | (52,639 | ) | 725,916 | ||||||||||||||
|
Property, plant, and equipment, net |
116,081 | - | 202,136 | - | 318,217 | |||||||||||||||
|
Prepaid debt fees |
8,628 | - | - | - | 8,628 | |||||||||||||||
|
Deferred tax assets noncurrent, net |
67,195 | - | 22,737 | - | 89,932 | |||||||||||||||
|
Other noncurrent assets |
5,625 | - | 12,492 | - | 18,117 | |||||||||||||||
|
Intangible assets, net |
58,168 | - | 330,044 | - | 388,212 | |||||||||||||||
|
Goodwill |
174,781 | - | 1,130,818 | - | 1,305,599 | |||||||||||||||
|
Investment in subsidiaries |
(9,081) | (12,444) | - | 21,525 | - | |||||||||||||||
|
Intercompany notes receivable |
1,723,587 | 94,511 | - | (1,818,098) | - | |||||||||||||||
|
Total assets |
$ | 2,437,468 | $ | 88,536 | $ | 2,177,829 | $ | (1,849,212 | ) | $ | 2,854,621 | |||||||||
| LIABILITIES AND SHAREHOLDERS’ EQUITY | ||||||||||||||||||||
|
Current liabilities |
||||||||||||||||||||
|
Accounts payable |
$ | 67,480 | $ | 66 | $ | 151,709 | $ | - | $ | 219,255 | ||||||||||
|
Other current liabilities |
21,147 | - | 43,436 | - | 64,583 | |||||||||||||||
|
Intercompany accounts payable |
1,674 | 184 | 9,290 | (11,148) | - | |||||||||||||||
|
Wages and benefits payable |
20,621 | 102 | 50,869 | - | 71,592 | |||||||||||||||
|
Taxes payable |
1,776 | (43) | 12,644 | - | 14,377 | |||||||||||||||
|
Current portion of debt |
10,871 | - | - | - | 10,871 | |||||||||||||||
|
Current portion of warranty |
8,418 | - | 12,523 | - | 20,941 | |||||||||||||||
|
Unearned revenue |
36,421 | - | 3,719 | - | 40,140 | |||||||||||||||
|
Deferred tax liabilities current, net |
(1,550) | - | 3,175 | - | 1,625 | |||||||||||||||
|
Short-term intercompany advances |
8,661 | 2,450 | 30,002 | (41,113) | - | |||||||||||||||
|
Total current liabilities |
175,519 | 2,759 | 317,367 | (52,261 | ) | 443,384 | ||||||||||||||
|
Long-term debt |
770,893 | - | - | - | 770,893 | |||||||||||||||
|
Long-term warranty |
9,919 | - | 3,013 | - | 12,932 | |||||||||||||||
|
Pension plan benefit liability |
- | - | 63,040 | - | 63,040 | |||||||||||||||
|
Intercompany notes payable |
94,512 | - | 1,723,586 | (1,818,098) | - | |||||||||||||||
|
Deferred tax liabilities noncurrent, net |
(37,176) | - | 117,871 | - | 80,695 | |||||||||||||||
|
Other long-term obligations |
23,287 | - | 59,876 | - | 83,163 | |||||||||||||||
|
Total liabilities |
1,036,954 | 2,759 | 2,284,753 | (1,870,359 | ) | 1,454,107 | ||||||||||||||
|
Shareholders’ equity |
||||||||||||||||||||
|
Preferred stock |
- | - | - | - | - | |||||||||||||||
|
Common stock |
1,299,134 | 107,165 | 80,723 | (187,888) | 1,299,134 | |||||||||||||||
|
Accumulated other comprehensive income (loss), net |
71,130 | (9,200) | 19,689 | (10,489) | 71,130 | |||||||||||||||
|
Retained earnings (accumulated deficit) |
30,250 | (12,188) | (207,336) | 219,524 | 30,250 | |||||||||||||||
|
Total shareholders’ equity |
1,400,514 | 85,777 | (106,924 | ) | 21,147 | 1,400,514 | ||||||||||||||
|
Total liabilities and shareholders’ equity |
$ | 2,437,468 | $ | 88,536 | $ | 2,177,829 | $ | (1,849,212 | ) | $ | 2,854,621 | |||||||||
74
Table of Contents
Consolidating Statement of Cash Flows
Year Ended December 31, 2010
| Parent |
Guarantor
Subsidiary |
Combined
Non-guarantor Subsidiaries |
Eliminations | Consolidated | ||||||||||||||||
| (in thousands) | ||||||||||||||||||||
|
Operating activities |
||||||||||||||||||||
|
Net income (loss) |
$ | 104,770 | $ | 3,248 | $ | (43,966) | $ | 40,718 | $ | 104,770 | ||||||||||
|
Adjustments to reconcile net income (loss) to net cash provided by operating activities: |
||||||||||||||||||||
|
Depreciation and amortization |
45,775 | - | 85,430 | - | 131,205 | |||||||||||||||
|
Stock-based compensation |
19,107 | - | - | - | 19,107 | |||||||||||||||
|
Excess tax benefits from stock-based compensation |
(1,232) | - | - | - | (1,232) | |||||||||||||||
|
Amortization of prepaid debt fees |
5,492 | - | - | - | 5,492 | |||||||||||||||
|
Amortization of convertible debt discount |
10,099 | - | - | - | 10,099 | |||||||||||||||
|
Deferred taxes, net |
11,162 | - | (29,154) | - | (17,992) | |||||||||||||||
|
Equity in losses of guarantor and non-guarantor subsidiaries, net |
40,718 | - | - | (40,718) | - | |||||||||||||||
|
Other adjustments, net |
1,841 | - | 4,956 | - | 6,797 | |||||||||||||||
|
Changes in operating assets and liabilities, net of acquisitions: |
||||||||||||||||||||
|
Accounts receivable |
(46,654) | - | 1,042 | - | (45,612) | |||||||||||||||
|
Inventories |
(27,746) | - | (13,671) | - | (41,417) | |||||||||||||||
|
Accounts payables, other current liabilities, and taxes payable |
19,347 | - | 21,537 | - | 40,884 | |||||||||||||||
|
Wages and benefits payable |
34,183 | - | 8,062 | - | 42,245 | |||||||||||||||
|
Unearned revenue |
(5,250) | - | 2,894 | - | (2,356) | |||||||||||||||
|
Warranty |
4,197 | - | 10,459 | - | 14,656 | |||||||||||||||
|
Intercompany transactions, net |
1,419 | - | (1,419) | - | - | |||||||||||||||
|
Other operating, net |
5,621 | (1) | (17,675) | - | (12,055) | |||||||||||||||
|
Net cash provided by operating activities |
222,849 | 3,247 | 28,495 | - | 254,591 | |||||||||||||||
|
Investing activities |
||||||||||||||||||||
|
Acquisitions of property, plant, and equipment |
(33,139) | - | (29,683) | - | (62,822) | |||||||||||||||
|
Current intercompany notes, net |
28,541 | (3,247) | 4,999 | (30,293) | - | |||||||||||||||
|
Other investing, net |
(67,236) | - | 73,784 | - | 6,548 | |||||||||||||||
|
Net cash provided by (used in) investing activities |
(71,834) | (3,247) | 49,100 | (30,293) | (56,274) | |||||||||||||||
|
Financing activities |
||||||||||||||||||||
|
Payments on debt |
(155,163) | - | - | - | (155,163) | |||||||||||||||
|
Issuance of common stock |
8,776 | - | - | - | 8,776 | |||||||||||||||
|
Prepaid debt fees |
(1,347) | - | - | - | (1,347) | |||||||||||||||
|
Excess tax benefits from stock-based compensation |
1,232 | - | - | - | 1,232 | |||||||||||||||
|
Current intercompany notes, net |
(1,752) | - | (28,541) | 30,293 | - | |||||||||||||||
|
Other financing, net |
- | - | (2,135) | - | (2,135) | |||||||||||||||
|
Net cash used in financing activities |
(148,254) | - | (30,676) | 30,293 | (148,637) | |||||||||||||||
|
Effect of foreign exchange rate changes on cash and cash equivalents |
- | - | (2,096) | - | (2,096) | |||||||||||||||
|
Increase in cash and cash equivalents |
2,761 | - | 44,823 | - | 47,584 | |||||||||||||||
|
Cash and cash equivalents at beginning of period |
16,385 | - | 105,508 | - | 121,893 | |||||||||||||||
|
Cash and cash equivalents at end of period |
$ | 19,146 | $ | - | $ | 150,331 | $ | - | $ | 169,477 | ||||||||||
|
Non-cash transactions: |
||||||||||||||||||||
|
Property, plant, and equipment purchased but not yet paid, net |
$ | (3,184) | $ | - | $ | (2,737) | $ | - | $ | (5,921) | ||||||||||
|
Supplemental disclosure of cash flow information: |
||||||||||||||||||||
|
Cash paid during the period for: |
||||||||||||||||||||
|
Income taxes |
$ | 4,565 | $ | - | $ | 25,577 | $ | - | $ | 30,142 | ||||||||||
|
Interest, net of amounts capitalized |
39,225 | - | 90 | - | 39,315 | |||||||||||||||
75
Table of Contents
Consolidating Statement of Cash Flows
Year Ended December 31, 2009
| Parent |
Combined
Guarantor Subsidiaries |
Combined
Non-guarantor Subsidiaries |
Eliminations | Consolidated | ||||||||||||||||
| (in thousands) | ||||||||||||||||||||
|
Operating activities |
||||||||||||||||||||
|
Net loss |
$ | (2,249) | $ | (15,665) | $ | (80,075) | $ | 95,740 | $ | (2,249) | ||||||||||
|
Adjustments to reconcile net loss to net cash provided by operating activities: |
||||||||||||||||||||
|
Depreciation and amortization |
48,089 | - | 107,648 | - | 155,737 | |||||||||||||||
|
Stock-based compensation |
16,982 | - | - | - | 16,982 | |||||||||||||||
|
Amortization of prepaid debt fees |
8,258 | - | - | - | 8,258 | |||||||||||||||
|
Amortization of convertible debt discount |
9,673 | - | - | - | 9,673 | |||||||||||||||
|
Loss on extinguishment of debt, net |
9,960 | - | - | - | 9,960 | |||||||||||||||
|
Deferred income taxes, net |
(48,503) | 32 | (15,745) | - | (64,216) | |||||||||||||||
|
Equity in losses of guarantor and non-guarantor subsidiaries, net |
76,377 | 19,363 | - | (95,740) | - | |||||||||||||||
|
Other adjustments, net |
(1,424) | - | 4,526 | - | 3,102 | |||||||||||||||
|
Changes in operating assets and liabilities, net of acquisitions: |
||||||||||||||||||||
|
Accounts receivable |
(21,190) | (904) | 19,132 | - | (2,962) | |||||||||||||||
|
Inventories |
(12,273) | - | 15,808 | - | 3,535 | |||||||||||||||
|
Accounts payables, other current liabilities, and taxes payable |
18,904 | (299) | (8,732) | - | 9,873 | |||||||||||||||
|
Wages and benefits payable |
(6,449) | (71) | (1,741) | - | (8,261) | |||||||||||||||
|
Unearned revenue |
18,704 | - | (3,868) | - | 14,836 | |||||||||||||||
|
Warranty |
(1,953) | - | (3,320) | - | (5,273) | |||||||||||||||
|
Intercompany transactions, net |
(2,081) | 1,227 | 854 | - | - | |||||||||||||||
|
Other operating, net |
(7,370) | 115 | (953) | - | (8,208) | |||||||||||||||
|
Net cash provided by operating activities |
103,455 | 3,798 | 33,534 | - | 140,787 | |||||||||||||||
|
Investing activities |
||||||||||||||||||||
|
Acquisitions of property, plant, and equipment |
(21,679) | - | (31,227) | - | (52,906) | |||||||||||||||
|
Business acquisitions & contingent consideration, net of cash equivalents acquired |
(4,317) | - | - | - | (4,317) | |||||||||||||||
|
Current intercompany notes, net |
(19,837) | (3,658) | 1,217 | 22,278 | - | |||||||||||||||
|
Long-term intercompany notes receivable, net |
4,765 | (975) | 1,135 | (4,925) | - | |||||||||||||||
|
Other investing, net |
(792) | 974 | 3,047 | - | 3,229 | |||||||||||||||
|
Net cash used in investing activities |
(41,860) | (3,659) | (25,828) | 17,353 | (53,994) | |||||||||||||||
|
Financing activities |
||||||||||||||||||||
|
Payments on debt |
(275,796) | - | - | - | (275,796) | |||||||||||||||
|
Issuance of common stock |
166,372 | - | - | - | 166,372 | |||||||||||||||
|
Prepaid debt fees |
(3,936) | - | - | - | (3,936) | |||||||||||||||
|
Current intercompany notes, net |
2,441 | - | 19,837 | (22,278) | - | |||||||||||||||
|
Long-term intercompany notes payable, net |
(4,635) | - | (290) | 4,925 | - | |||||||||||||||
|
Other financing, net |
- | - | (761) | - | (761) | |||||||||||||||
|
Net cash provided by (used in) financing activities |
(115,554) | - | 18,786 | (17,353) | (114,121) | |||||||||||||||
|
Effect of foreign exchange rate changes on cash and cash equivalents |
- | - | 4,831 | - | 4,831 | |||||||||||||||
|
Increase (decrease) in cash and cash equivalents |
(53,959) | 139 | 31,323 | - | (22,497) | |||||||||||||||
|
Cash and cash equivalents at beginning of period |
67,404 | 3,180 | 73,806 | - | 144,390 | |||||||||||||||
|
Cash transferred from guarantor to parent |
2,940 | (2,940) | - | - | - | |||||||||||||||
|
Cash and cash equivalents at end of period |
$ | 16,385 | $ | 379 | $ | 105,129 | $ | - | $ | 121,893 | ||||||||||
|
Non-cash transactions: |
||||||||||||||||||||
|
Property, plant, and equipment purchased but not yet paid, net |
$ | 4,287 | $ | - | $ | (568) | $ | - | $ | 3,719 | ||||||||||
|
Exchange of debt for common stock |
120,984 | - | - | - | 120,984 | |||||||||||||||
|
Supplemental disclosure of cash flow information: |
||||||||||||||||||||
|
Cash paid during the period for: |
||||||||||||||||||||
|
Income taxes |
$ | 559 | $ | - | $ | 31,161 | $ | - | $ | 31,720 | ||||||||||
|
Interest, net of amounts capitalized |
54,157 | 115 | 231 | - | 54,503 | |||||||||||||||
76
Table of Contents
Consolidating Statement of Cash Flows
Year Ended December 31, 2008
| Parent |
Combined
Guarantor Subsidiaries |
Combined
Non-guarantor Subsidiaries |
Eliminations | Consolidated | ||||||||||||||||
| (in thousands) | ||||||||||||||||||||
|
Operating activities |
||||||||||||||||||||
|
Net income (loss) |
$ | 19,811 | $ | (543) | $ | (56,751) | $ | 57,294 | $ | 19,811 | ||||||||||
|
Adjustments to reconcile net income (loss) to net cash provided by operating activities: |
||||||||||||||||||||
|
Depreciation and amortization |
41,276 | 2,181 | 130,216 | - | 173,673 | |||||||||||||||
|
Stock-based compensation |
16,582 | - | - | - | 16,582 | |||||||||||||||
|
Amortization of prepaid debt fees |
8,917 | - | - | - | 8,917 | |||||||||||||||
|
Amortization of convertible debt discount |
13,442 | - | - | 13,442 | ||||||||||||||||
|
Deferred income taxes, net |
(140) | 7,949 | (51,126) | - | (43,317) | |||||||||||||||
|
Equity in losses of guarantor and non-guarantor subsidiaries, net |
56,418 | 876 | - | (57,294) | - | |||||||||||||||
|
Other adjustments, net |
(131) | 113 | (2,159) | - | (2,177) | |||||||||||||||
|
Changes in operating assets and liabilities, net of acquisitions: |
||||||||||||||||||||
|
Accounts receivable |
6,450 | (717) | 14,131 | - | 19,864 | |||||||||||||||
|
Inventories |
(2,804) | (692) | 8,410 | - | 4,914 | |||||||||||||||
|
Accounts payables, other current liabilities, and taxes payable |
7,407 | 3,810 | (17,766) | - | (6,549) | |||||||||||||||
|
Wages and benefits payable |
7,852 | 222 | (366) | - | 7,708 | |||||||||||||||
|
Unearned revenue |
2,723 | 2 | 1,211 | - | 3,936 | |||||||||||||||
|
Warranty |
1,194 | 330 | (3,766) | - | (2,242) | |||||||||||||||
|
Intercompany transactions, net |
(225) | 2,645 | (2,420) | - | - | |||||||||||||||
|
Other operating, net |
(6,220) | (44,659) | 29,463 | - | (21,416) | |||||||||||||||
|
Net cash provided by (used in) operating activities |
172,552 | (28,483) | 49,077 | - | 193,146 | |||||||||||||||
|
Investing activities |
||||||||||||||||||||
|
Acquisitions of property, plant, and equipment |
(31,625) | (5,763) | (26,042) | - | (63,430) | |||||||||||||||
|
Business acquisitions & contingent consideration, net of cash equivalents acquired |
(6,897) | - | - | - | (6,897) | |||||||||||||||
|
Cash transferred to parent |
- | 7,806 | - | (7,806) | - | |||||||||||||||
|
Cash transferred to guarantor subsidiaries |
1,938 | - | 7,806 | (9,744) | - | |||||||||||||||
|
Cash transferred to non-guarantor subsidiaries |
908 | - | - | (908) | - | |||||||||||||||
|
Current intercompany notes, net |
(5,352) | 3,282 | 6,302 | (4,232) | - | |||||||||||||||
|
Other investing, net |
(21,159) | 36,936 | (12,525) | - | 3,252 | |||||||||||||||
|
Net cash provided by (used in) investing activities |
(62,187) | 42,261 | (24,459) | (22,690) | (67,075) | |||||||||||||||
|
Financing activities |
||||||||||||||||||||
|
Payments on debt |
(388,371) | - | - | - | (388,371) | |||||||||||||||
|
Issuance of common stock |
324,494 | - | - | - | 324,494 | |||||||||||||||
|
Prepaid debt fees |
(214) | - | - | - | (214) | |||||||||||||||
|
Cash received from parent |
- | (1,938) | (908) | 2,846 | - | |||||||||||||||
|
Cash received from guarantor subsidiaries |
(7,806) | - | - | 7,806 | - | |||||||||||||||
|
Cash received from non-guarantor subsidiaries |
- | (7,806) | - | 7,806 | - | |||||||||||||||
|
Intercompany notes payable |
284 | (2,518) | (1,998) | 4,232 | - | |||||||||||||||
|
Other financing, net |
715 | - | - | - | 715 | |||||||||||||||
|
Net cash used in financing activities |
(70,898) | (12,262) | (2,906) | 22,690 | (63,376) | |||||||||||||||
|
Effect of foreign exchange rate changes on cash and cash equivalents |
- | - | (10,293) | - | (10,293) | |||||||||||||||
|
Increase in cash and cash equivalents |
39,467 | 1,516 | 11,419 | - | 52,402 | |||||||||||||||
|
Cash and cash equivalents at beginning of period |
27,937 | 1,664 | 62,387 | - | 91,988 | |||||||||||||||
|
Cash and cash equivalents at end of period |
$ | 67,404 | $ | 3,180 | $ | 73,806 | $ | - | $ | 144,390 | ||||||||||
|
Non-cash transactions: |
||||||||||||||||||||
|
Property, plant, and equipment purchased but not yet paid, net |
$ | 19 | $ | - | $ | 2,777 | $ | - | $ | 2,796 | ||||||||||
|
Exchange of debt for common stock |
29 | - | - | - | 29 | |||||||||||||||
|
Contingent consideration payable for previous acquisitions |
1,295 | - | - | - | 1,295 | |||||||||||||||
|
Supplemental disclosure of cash flow information: |
||||||||||||||||||||
|
Cash paid during the period for: |
||||||||||||||||||||
|
Income taxes |
$ | 77 | $ | - | $ | 26,300 | $ | - | $ | 26,377 | ||||||||||
|
Interest, net of amounts capitalized |
71,842 | 3 | 459 | - | 72,304 | |||||||||||||||
77
Table of Contents
| First | Second | Third | Fourth | Total | ||||||||||||||||
| Quarter (1) | Quarter (1) | Quarter (1) | Quarter | Year | ||||||||||||||||
| (in thousands, except per common share and stock price data) | ||||||||||||||||||||
|
2010 |
||||||||||||||||||||
|
Statement of operations data: |
||||||||||||||||||||
|
Revenues |
$ | 497,623 | $ | 567,339 | $ | 573,651 | $ | 620,658 | $ | 2,259,271 | ||||||||||
|
Gross profit |
157,064 | 174,056 | 181,763 | 185,356 | 698,239 | |||||||||||||||
|
Net income |
25,250 | 25,311 | 27,639 | 26,570 | 104,770 | |||||||||||||||
|
Basic earnings per common share |
$ | 0.63 | $ | 0.63 | $ | 0.68 | $ | 0.66 | $ | 2.60 | ||||||||||
|
Diluted earnings per common share |
$ | 0.62 | $ | 0.61 | $ | 0.68 | $ | 0.65 | $ | 2.56 | ||||||||||
|
Stock Price: |
||||||||||||||||||||
|
High |
$ | 75.96 | $ | 81.95 | $ | 66.87 | $ | 67.58 | $ | 81.95 | ||||||||||
|
Low |
$ | 59.12 | $ | 61.60 | $ | 52.05 | $ | 52.03 | $ | 52.03 | ||||||||||
|
2009 |
||||||||||||||||||||
|
Statement of operations data: |
||||||||||||||||||||
|
Revenues |
$ | 388,518 | $ | 413,748 | $ | 408,358 | $ | 476,823 | $ | 1,687,447 | ||||||||||
|
Gross profit |
129,584 | 133,109 | 129,479 | 145,284 | 537,456 | |||||||||||||||
|
Net income (loss) |
(19,729) | 15,289 | (2,962) | 5,153 | (2,249) | |||||||||||||||
|
Basic earnings per common share |
$ | (0.55) | $ | 0.40 | $ | (0.07) | $ | 0.13 | $ | (0.06) | ||||||||||
|
Diluted earnings per common share |
$ | (0.55) | $ | 0.40 | $ | (0.07) | $ | 0.13 | $ | (0.06) | ||||||||||
|
Stock Price: |
||||||||||||||||||||
|
High |
$ | 66.66 | $ | 62.19 | $ | 67.89 | $ | 69.49 | $ | 69.49 | ||||||||||
|
Low |
$ | 40.10 | $ | 42.77 | $ | 50.15 | $ | 54.92 | $ | 40.10 | ||||||||||
| (1) |
The financial information for the first three quarters of 2010 have been restated from that previously reported on our Quarterly Reports on Form 10-Q. |
See below for restatement and correction information.
Restatement and correction
The unaudited quarterly financial information for the first three quarters of 2010 has been restated. The restatement was made primarily to defer revenue previously recognized on one contract due to a misinterpretation of an extended warranty provision. While the restatement was not deemed material to the first three quarters of 2010, we concluded that the aggregate correction of such amounts would be material to the fourth quarter of 2010.
78
Table of Contents
Accordingly, the restatement impacted the consolidated financial statements in the previously filed Quarterly Reports on Form 10-Q for each of the first three quarters of 2010. While certain captions within cash provided by operating activities in the consolidated statements of cash flows were impacted by the correction, total cash provided by operating activities did not change from amounts previously reported. The consolidated statements of operations and consolidated balance sheets have been restated, as follows:
Consolidated statements of operations restatement
|
Three
Months Ended |
Three
Months Ended |
Six
Months Ended |
Three
Months Ended |
Nine
Months Ended |
||||||||||||||||
| March 31, 2010 | June 30, 2010 | September 30, 2010 | ||||||||||||||||||
| (in thousands, except per common share data) | ||||||||||||||||||||
|
Revenues |
||||||||||||||||||||
|
As previously reported |
$ | 499,280 | $ | 569,460 | $ | 1,068,740 | $ | 575,968 | $ | 1,644,708 | ||||||||||
|
As restated |
497,623 | 567,339 | 1,064,962 | 573,651 | 1,638,613 | |||||||||||||||
|
Restatement effect |
$ | (1,657) | $ | (2,121) | $ | (3,778) | $ | (2,317) | $ | (6,095) | ||||||||||
|
Cost of revenue |
||||||||||||||||||||
|
As previously reported |
$ | 340,385 | $ | 393,136 | $ | 733,521 | $ | 391,761 | $ | 1,125,282 | ||||||||||
|
As restated |
340,559 | 393,283 | 733,842 | 391,888 | 1,125,730 | |||||||||||||||
|
Restatement effect |
$ | 174 | $ | 147 | $ | 321 | $ | 127 | $ | 448 | ||||||||||
|
Gross Profit |
||||||||||||||||||||
|
As previously reported |
$ | 158,895 | $ | 176,324 | $ | 335,219 | $ | 184,207 | $ | 519,426 | ||||||||||
|
As restated |
157,064 | 174,056 | 331,120 | 181,763 | 512,883 | |||||||||||||||
|
Restatement effect |
$ | (1,831) | $ | (2,268) | $ | (4,099) | $ | (2,444) | $ | (6,543) | ||||||||||
|
Operating income |
||||||||||||||||||||
|
As previously reported |
$ | 33,450 | $ | 52,277 | $ | 85,727 | $ | 61,380 | $ | 147,107 | ||||||||||
|
As restated |
31,619 | 50,009 | 81,628 | 58,936 | 140,564 | |||||||||||||||
|
Restatement effect |
$ | (1,831) | $ | (2,268) | $ | (4,099) | $ | (2,444) | $ | (6,543) | ||||||||||
|
Income before income taxes |
||||||||||||||||||||
|
As previously reported |
$ | 18,102 | $ | 37,998 | $ | 56,100 | $ | 43,795 | $ | 99,895 | ||||||||||
|
As restated |
16,271 | 35,730 | 52,001 | 41,351 | 93,352 | |||||||||||||||
|
Restatement effect |
$ | (1,831) | $ | (2,268) | $ | (4,099) | $ | (2,444) | $ | (6,543) | ||||||||||
|
Income tax benefit (provision) |
||||||||||||||||||||
|
As previously reported |
$ | 8,685 | $ | (11,098) | $ | (2,413) | $ | (14,687) | $ | (17,100) | ||||||||||
|
As restated |
8,979 | (10,419) | (1,440) | (13,712) | (15,152) | |||||||||||||||
|
Restatement effect |
$ | 294 | $ | 679 | $ | 973 | $ | 975 | $ | 1,948 | ||||||||||
|
Net income |
||||||||||||||||||||
|
As previously reported |
$ | 26,787 | $ | 26,900 | $ | 53,687 | $ | 29,108 | $ | 82,795 | ||||||||||
|
As restated |
25,250 | 25,311 | 50,561 | 27,639 | 78,200 | |||||||||||||||
|
Restatement effect |
$ | (1,537) | $ | (1,589) | $ | (3,126) | $ | (1,469) | $ | (4,595) | ||||||||||
|
Earnings per common share-Basic |
||||||||||||||||||||
|
As previously reported |
$ | 0.67 | $ | 0.67 | $ | 1.33 | $ | 0.72 | $ | 2.05 | ||||||||||
|
As restated |
$ | 0.63 | $ | 0.63 | $ | 1.26 | $ | 0.68 | $ | 1.94 | ||||||||||
|
Restatement effect |
$ | (0.04) | $ | (0.04) | $ | (0.07) | $ | (0.04) | $ | (0.11) | ||||||||||
|
Earnings per common share-Diluted |
||||||||||||||||||||
|
As previously reported |
$ | 0.66 | $ | 0.65 | $ | 1.31 | $ | 0.71 | $ | 2.02 | ||||||||||
|
As restated |
$ | 0.62 | $ | 0.61 | $ | 1.23 | $ | 0.68 | $ | 1.91 | ||||||||||
|
Restatement effect |
$ | (0.04) | $ | (0.04) | $ | (0.08) | $ | (0.03) | $ | (0.11) | ||||||||||
79
Table of Contents
Consolidated balance sheets restatement
| March 31, 2010 | June 30, 2010 | September 30, 2010 | ||||||||||
| (in thousands) | ||||||||||||
|
Accounts receivable, net |
||||||||||||
|
As previously reported |
$ | 333,141 | $ | 366,476 | $ | 383,814 | ||||||
|
As restated |
333,030 | 366,240 | 383,431 | |||||||||
|
Restatement effect |
$ | (111) | $ | (236) | $ | (383) | ||||||
|
Deferred tax assets noncurrent, net |
||||||||||||
|
As previously reported |
$ | 86,728 | $ | 67,684 | $ | 49,612 | ||||||
|
As restated |
87,022 | 68,657 | 51,560 | |||||||||
|
Restatement effect |
$ | 294 | $ | 973 | $ | 1,948 | ||||||
|
Long-term warranty |
||||||||||||
|
As previously reported |
$ | 12,389 | $ | 22,953 | $ | 24,993 | ||||||
|
As restated |
12,563 | 23,274 | 25,441 | |||||||||
|
Restatement effect |
$ | 174 | $ | 321 | $ | 448 | ||||||
|
Other long-term obligations |
||||||||||||
|
As previously reported |
$ | 71,904 | $ | 67,908 | $ | 68,417 | ||||||
|
As restated |
73,462 | 71,478 | 74,167 | |||||||||
|
Restatement effect |
$ | 1,558 | $ | 3,570 | $ | 5,750 | ||||||
|
Accumulated other comprehensive loss, net |
||||||||||||
|
As previously reported |
$ | (15,283) | $ | (116,019) | $ | (1,688) | ||||||
|
As restated |
(15,295) | (116,047) | (1,726) | |||||||||
|
Restatement effect |
$ | (12) | $ | (28) | $ | (38) | ||||||
|
Retained earnings |
||||||||||||
|
As previously reported |
$ | 57,037 | $ | 83,937 | $ | 113,045 | ||||||
|
As restated |
55,500 | 80,811 | 108,450 | |||||||||
|
Restatement effect |
$ | (1,537) | $ | (3,126) | $ | (4,595) | ||||||
On January 20, 2011, we increased our $240 million multicurrency revolving line of credit to $315 million as approved by the participating lenders, the issuing agents, the swingline lender, and the administrative agent and as permitted by section 2.19 of Amendment No. 1 of our Credit Facility dated April 24, 2009. There were no other changes to the credit facility. The expanded multicurrency revolving line of credit will provide us with increased flexibility and liquidity for general corporate purposes.
On February 23, 2011, a class action lawsuit was filed in U.S. Federal Court for the Eastern District of Washington alleging a violation of federal securities laws relating to a restatement of our financial results for the quarters ended March 31, June 30, and September 30, 2010. These revisions were made primarily to defer revenue that had been incorrectly recognized on one contract due to a misinterpretation of an extended warranty obligation. The effect was to reduce revenue and earnings in each of the first three quarters of the year. For the first nine months of 2010, total revenue was reduced by $6.1 million and diluted EPS was reduced by 11 cents. We intend to vigorously defend our interests.
80
Table of Contents
| ITEM 9: | CHANGES IN AND DISAGREEMENTS WITH ACCOUNTANTS ON ACCOUNTING AND FINANCIAL DISCLOSURE |
There were no disagreements with our independent accountants on accounting and financial disclosure matters within the three year period ended December 31, 2010, or in any period subsequent to such date, through the date of this report.
| ITEM 9A: | CONTROLS AND PROCEDURES |
| (i) |
Evaluation of disclosure controls and procedures. |
An evaluation was performed under the supervision and with the participation of our Company’s management, including the Chief Executive Officer and Chief Financial Officer, of the effectiveness of the design and operation of the Company’s disclosure controls and procedures (as such term is defined in Rules 13a-15(e) and 15d-15(e)) under the Securities Exchange Act of 1934 as amended. Based on that evaluation, the Company’s management, including the Chief Executive Officer and Chief Financial Officer, concluded that as of December 31, 2010, the Company’s disclosure controls and procedures were effective to ensure the information required to be disclosed by an issuer in the reports that it files or submits under the Securities Exchange Act of 1934 is accumulated and communicated to our management, including our principal executive and principal financial officers, or persons performing similar functions, as appropriate to allow timely decisions regarding required disclosure. There are inherent limitations to the effectiveness of any system of disclosure controls and procedures, including the possibility of human error and the circumvention or overriding of the controls and procedures. Accordingly, even effective disclosure controls and procedures can only provide reasonable assurance of achieving their control objectives.
| (ii) |
Internal Control Over Financial Reporting. |
| (a) |
Management’s Annual Report on Internal Control Over Financial Reporting . Our management is responsible for establishing and maintaining adequate internal control over financial reporting, as such term is defined in Exchange Act Rules 13a-15(f). Under the supervision and with the participation of our management, including our Chief Executive Officer and Chief Financial Officer, we conducted an evaluation of the effectiveness of our internal control over financial reporting based on the framework in Internal Control— Integrated Framework issued by the Committee of Sponsoring Organizations of the Treadway Commission. Based on our evaluation under the framework in Internal Control—Integrated Framework , our management concluded that our internal control over financial reporting was effective as of December 31, 2010. |
The effectiveness of our internal control over financial reporting as of December 31, 2010 has been audited by Ernst & Young LLP, an independent registered public accounting firm, as stated in their report that is included in this Annual Report on Form 10-K.
| (b) |
Changes in internal control over financial reporting . The Company’s disclosure controls, including the Company’s internal controls, are designed to provide a reasonable level of assurance that the stated objectives are met. We concluded, as stated in (a) above, that the Company’s internal control over financial reporting was effective in providing this reasonable level of assurance as of December 31, 2010. The Company’s management, including the Chief Executive Officer and Chief Financial Officer, does not expect that the Company’s disclosure controls or internal controls will prevent all errors and all fraud. A control system, no matter how well conceived and operated, can provide only reasonable, not absolute, assurance that the objectives of the control system are met. Because of the inherent limitations in all control systems, no evaluation of controls can provide absolute assurance that all control issues and instances of fraud, if any, within the Company have been prevented or detected. These inherent limitations include the fact that judgments in decision-making can be faulty. Additionally, controls can be circumvented by the individual acts of some persons, by collusion of two or more people, or by management override of the control. Because of the inherent limitations in a control system, misstatements due to error or fraud may occur and not be prevented or detected. |
There have been no changes in internal control over financial reporting during the quarter ended December 31, 2010 that have materially affected, or are reasonably likely to materially affect, our internal controls over financial reporting.
81
Table of Contents
| (c) |
Report of Independent Registered Public Accounting Firm. |
REPORT OF INDEPENDENT REGISTERED PUBLIC ACCOUNTING FIRM
The Board of Directors and Shareholders of Itron, Inc.
We have audited Itron, Inc.’s internal control over financial reporting as of December 31, 2010, based on criteria established in Internal Control—Integrated Framework issued by the Committee of Sponsoring Organizations of the Treadway Commission (the COSO criteria). Itron, Inc.’s management is responsible for maintaining effective internal control over financial reporting, and for its assessment of the effectiveness of internal control over financial reporting included in the accompanying Management’s Annual Report on Internal Control over Financial Reporting. Our responsibility is to express an opinion on the Company’s internal control over financial reporting based on our audit.
We conducted our audit in accordance with the standards of the Public Company Accounting Oversight Board (United States). Those standards require that we plan and perform the audit to obtain reasonable assurance about whether effective internal control over financial reporting was maintained in all material respects. Our audit included obtaining an understanding of internal control over financial reporting, assessing the risk that a material weakness exists, testing and evaluating the design and operating effectiveness of internal control based on the assessed risk, and performing such other procedures as we considered necessary in the circumstances. We believe that our audit provides a reasonable basis for our opinion.
A company’s internal control over financial reporting is a process designed to provide reasonable assurance regarding the reliability of financial reporting and the preparation of financial statements for external purposes in accordance with generally accepted accounting principles. A company’s internal control over financial reporting includes those policies and procedures that (1) pertain to the maintenance of records that, in reasonable detail, accurately and fairly reflect the transactions and dispositions of the assets of the company; (2) provide reasonable assurance that transactions are recorded as necessary to permit preparation of financial statements in accordance with generally accepted accounting principles, and that receipts and expenditures of the company are being made only in accordance with authorizations of management and directors of the company; and (3) provide reasonable assurance regarding prevention or timely detection of unauthorized acquisition, use, or disposition of the company’s assets that could have a material effect on the financial statements.
Because of its inherent limitations, internal control over financial reporting may not prevent or detect misstatements. Also, projections of any evaluation of effectiveness to future periods are subject to the risk that controls may become inadequate because of changes in conditions, or that the degree of compliance with the policies or procedures may deteriorate.
In our opinion, Itron, Inc. maintained, in all material respects, effective internal control over financial reporting as of December 31, 2010, based on the COSO criteria.
We have also audited, in accordance with the standards of the Public Company Accounting Oversight Board (United States), the consolidated balance sheets of Itron, Inc. as of December 31, 2010 and 2009, and the related consolidated statements of operations, shareholders’ equity, and cash flows for each of the three years in the period ended December 31, 2010 and our report dated February 24, 2011 expressed an unqualified opinion thereon.
/s/ ERNST & YOUNG LLP
Seattle, Washington
February 24, 2011
| ITEM 9B: | OTHER INFORMATION |
No information was required to be disclosed in a report on Form 8-K during the fourth quarter of 2010 that was not reported.
82
Table of Contents
| ITEM 10: | DIRECTORS, EXECUTIVE OFFICERS AND CORPORATE GOVERNANCE |
The section entitled “Proposal 1 – Election of Directors” appearing in our Proxy Statement for the Annual Meeting of Shareholders to be held on May 3, 2011 (the 2011 Proxy Statement) sets forth certain information with regard to our directors as required by Item 401 of Regulation S-K and is incorporated herein by reference.
Certain information with respect to persons who are or may be deemed to be executive officers of Itron, Inc. as required by Item 401 of Regulation S-K is set forth under the caption “Management” in Part I of this Annual Report on Form 10-K.
The section entitled “Section 16(a) Beneficial Ownership Reporting Compliance” appearing in the 2011 Proxy Statement sets forth certain information as required by Item 405 of Regulation S-K and is incorporated herein by reference.
The section entitled “Corporate Governance” appearing in the 2011 Proxy Statement sets forth certain information with respect to the Registrant’s code of conduct and ethics as required by Item 406 of Regulation S-K and is incorporate herein by reference. Our code of ethics can be accessed on our website, at www.itron.com under the investor relations section.
There were no material changes to the procedures by which security holders may recommend nominees to the registrant’s board of directors during 2011, as set forth by Item 407(c)(3) of Regulation S-K.
The section entitled “Corporate Governance” appearing in the 2011 Proxy Statement sets forth certain information regarding the Audit/Finance Committee, including the members of the Committee and the Audit/Finance Committee financial experts, as set forth by Item 407(d)(4) and (d)(5) of Regulation S-K and is incorporate herein by reference.
| ITEM 11: | EXECUTIVE COMPENSATION |
The sections entitled “Compensation of Directors” and “Executive Compensation” appearing in the 2011 Proxy Statement set forth certain information with respect to the compensation of directors and management of Itron as required by Item 402 of Regulation S-K and are incorporated herein by reference.
The section entitled “Corporate Governance” appearing in the 2011 Proxy Statement sets forth certain information regarding members of the Compensation Committee required by Item 407(e)(4) of Regulation S-K and is incorporated herein by reference.
The section entitled “Compensation Committee Report” appearing in the 2011 Proxy Statement sets forth certain information required by Item 407(e)(5) of Regulation S-K and is incorporated herein by reference.
| ITEM 12: | SECURITY OWNERSHIP OF CERTAIN BENEFICIAL OWNERS AND MANAGEMENT AND RELATED STOCKHOLDER MATTERS |
The section entitled “Equity Compensation Plan Information” appearing in the 2011 Proxy Statement sets forth certain information required by Item 201(d) of Regulation S-K and is incorporated herein by reference.
The section entitled “Security Ownership of Certain Beneficial Owners and Management” appearing in the 2011 Proxy Statement sets forth certain information with respect to the ownership of our common stock as required by Item 403 of Regulation S-K and is incorporated herein by reference.
| ITEM 13: | CERTAIN RELATIONSHIPS AND RELATED TRANSACTIONS AND DIRECTOR INDEPENDENCE |
The section entitled “Corporate Governance” appearing in the 2011 Proxy Statement sets forth certain information required by Item 404 of Regulation S-K and is incorporate herein by reference.
The section entitled “Corporate Governance” appearing in the 2011 Proxy Statement sets forth certain information with respect to director independence as required by Item 407(a) of Regulation S-K and is incorporated herein by reference.
| ITEM 14: | PRINCIPAL ACCOUNTING FEES AND SERVICES |
The section entitled “Independent Registered Public Accounting Firm’s Audit Fees and Services” appearing in the 2011 Proxy Statement sets forth certain information with respect to the principal accounting fees and services and the Audit/Finance Committee’s policy on pre-approval of audit and permissible non-audit services performed by our independent auditors as required by Item 9(e) of Schedule 14A and is incorporated herein by reference.
83
Table of Contents
| ITEM 15: | EXHIBITS, FINANCIAL STATEMENT SCHEDULE |
(a) (1) Financial Statement:
The financial statements required by this item are submitted in Item 8 of this Annual Report on Form 10-K.
(a) (2) Financial Statement Schedule:
Schedule II: Valuation and Qualifying Accounts
(a) (3) Exhibits:
|
Exhibit
|
Description of Exhibits |
|
|
2.1 |
Stock purchase agreement between the stockholders of Actaris Metering Systems SA, LBO France Gestion SAS and Itron, Inc. (Filed as Exhibit 2.1 to Itron, Inc.’s Current Report on Form 8-K, filed on April 24, 2007 - File No. 0-22418) | |
|
2.2 |
Amendment No. 1 to Stock Purchase Agreement between the stockholders of Actaris Metering Systems SA, LBO France Gestion SAS and Itron, Inc. (Filed as Exhibit 2.2 to Itron, Inc.’s Current Report on Form 8-K, filed on April 24, 2007 - File No. 0-22418) | |
|
3.1 |
Amended and Restated Articles of Incorporation of Itron, Inc. (Filed as Exhibit 3.1 to Itron, Inc.’s Annual Report on Form 10-K, filed on March 27, 2003 - File No. 0-22418) | |
|
3.2 |
Amended and Restated Bylaws of Itron, Inc. (Filed as Exhibit 3.2 to Itron, Inc.’s Annual Report on Form 10-K, filed on February 26, 2008 - File No. 0-22418) | |
|
4.1 |
Rights Agreement between Itron, Inc. and Mellon Investor Services LLC, as Rights Agent, dated December 11, 2002. (Filed as Exhibit 4.1 to Itron, Inc.’s Registration of Securities on Form 8-A, filed on December 16, 2002 - File No. 0-22418) | |
|
4.2 |
Amendment To Rights Agreement (originally dated December 11, 2002) between Itron, Inc. and Mellon Investor Services LLC, as Rights Agent, dated September 22, 2010 (Filed as Exhibit 4.1 to Itron, Inc.’s Current Report on Form 8-K, filed on September 22, 2010 - File No. 0-22418) | |
|
4.3 |
Indenture relating to Itron, Inc.’s 2.50% convertible senior subordinated notes due 2026, dated August 4, 2006. (Filed as Exhibit 4.16 to Itron, Inc.’s Quarterly Report on Form 10-Q, filed on November 6, 2006 - File No. 0-22418) | |
|
4.4 |
Credit Agreement dated April 18, 2007, among Itron, Inc. and the subsidiary guarantors and UBS Securities LLC, Wells Fargo Bank, National Association and Mizuho Corporate Bank, Ltd. (Filed as Exhibit 4.1 to Itron, Inc.’s Current Report on Form 8-K, filed on April 24, 2007 - File No. 0-22418) | |
|
4.5 |
Security Agreement dated April 18, 2007, among Itron, Inc. and the subsidiary guarantors and Wells Fargo Bank, National Association as Collateral Agent. (Filed as Exhibit 4.2 to Itron, Inc.’s Current Report on Form 8-K, filed on April 24, 2007 - File No. 0-22418) | |
|
4.6 |
Amendment No. 1 dated April 24, 2009 to the Credit Agreement dated April 18, 2007 among Itron, Inc. and the subsidiary guarantors, the lenders, and issuing banks, and Wells Fargo Bank, National Association (Filed as Exhibit 4.1 to Itron, Inc.’s Current Report on Form 8-K, filed on April 27, 2009 - File No. 0-22418) | |
|
4.7 |
Amendment No. 2 dated February 12, 2010 to the Credit Agreement dated April 18, 2007 among Itron, Inc. and the subsidiary guarantors, and the lenders. (Filed as Exhibit 4.6 to Itron, Inc.’s Annual Report on Form 10-K, filed on February 25, 2010 - File No. 0-22418) | |
|
10.1 |
Form of Change in Control Severance Agreement for Executive Officers. * (Filed as Exhibit 10.7 to Itron, Inc.’s Current Report on Form 8-K, filed on February 18, 2010 - File No. 0-22418) | |
|
10.2 |
Schedule of certain executive officers who are parties to Change in Control Severance Agreements with Itron, Inc. * (attached hereto) | |
84
Table of Contents
|
Exhibit
|
Description of Exhibits |
|
|
10.3 |
First Amendment to Change in Control Agreement between Itron, Inc. and Marcel Regnier.* (Filed as Exhibit 10.2 to Itron, Inc.’s Current Report on Form 8-K, filed on December 17, 2008 - File No. 0-22418) | |
|
10.4 |
Employee Agreement between Actaris Management Services S.A. and Marcel Regnier.* (Filed as Exhibit 10.1 to Itron, Inc.’s Current Report on Form 8-K, filed on December 17, 2008 - File No. 0-22418) | |
|
10.5 |
Form of Indemnification Agreements between Itron, Inc. and certain directors and officers.* (Filed as Exhibit 10.9 to Itron, Inc.’s Annual Report on Form 10-K, filed on March 30, 2000 - File No. 0-22418) | |
|
10.6 |
Schedule of directors and executive officers who are parties to Indemnification Agreements with Itron, Inc. * (attached hereto) | |
|
10.7 |
Amended and Restated 2000 Stock Incentive Plan. (Filed as Appendix A to Itron, Inc.’s Proxy Statement for the 2007 Annual Meeting of Shareholders, filed on March 26, 2007 - File No. 0-22418) | |
|
10.8 |
2010 Stock Incentive Plan. (Filed as Appendix A to Itron, Inc.’s Proxy Statement for the 2010 Annual Meeting of Shareholders, filed on March 17, 2010 - File No. 0-22418) | |
|
10.9 |
Executive Management Incentive Plan.* (Filed as Appendix B to Itron, Inc.’s Proxy Statement for the 2010 Annual Meeting of Shareholders, filed on March 17, 2010 - File No. 0-22418) | |
|
10.10 |
Terms of the Amended and Restated Equity Grant Program for Nonemployee Directors under the Itron, Inc. Amended and Restated 2000 Stock Incentive Plan. (Filed as Exhibit 10.4 to Itron, Inc.’s Annual Report on Form 10-K, filed on February 26, 2008 - File No. 0-22418) | |
|
10.11 |
Form of Non-Qualified Stock Option Grant Notice and Agreement for Nonemployee Directors under the Itron, Inc. Amended and Restated 2000 Stock Incentive Plan. (Filed as Exhibit 10.9 to Itron, Inc.’s Annual Report on Form 10-K, filed on February 26, 2009 - File No. 0-22418) | |
|
10.12 |
Form of Stock Option Grant Notice and Agreement for use in connection with both incentive and non-qualified stock options granted under the Company’s Amended and Restated 2000 Stock Incentive Plan.* (Filed as Exhibit 10.6 to Itron, Inc.’s Current Report on Form 8-K, filed on February 18, 2010 - File No. 0-22418) | |
|
10.13 |
Form of Restricted Stock Unit Award Notice and Agreement for U.S. Participants for use in connection with the Company’s Long-Term Performance Plan (LTPP) and issued under the Company’s Amended and Restated 2000 Stock Incentive Plan.* (Filed as Exhibit 10.1 to Itron, Inc.’s Current Report on Form 8-K, filed on February 18, 2010 - File No. 0-22418) | |
|
10.14 |
Form of Restricted Stock Unit Award Notice and Agreement for International Participants (excluding France) for use in connection with the Company’s LTPP and issued under the Company’s Amended and Restated 2000 Stock Incentive Plan.* (Filed as Exhibit 10.2 to Itron, Inc.’s Current Report on Form 8-K, filed on February 18, 2010 - File No. 0-22418) | |
|
10.15 |
Form of Restricted Stock Unit Award Notice and Agreement for Participants in France for use in connection with the Company’s LTPP and issued under the Company’s Amended and Restated 2000 Stock Incentive Plan.* (Filed as Exhibit 10.3 to Itron, Inc.’s Current Report on Form 8-K, filed on February 18, 2010 - File No. 0-22418) | |
|
10.16 |
Form of Restricted Stock Unit Award Notice and Agreement for all Participants (excluding France) for use in connection with the Company’s Amended and Restated 2000 Stock Incentive Plan.* (Filed as Exhibit 10.4 to Itron, Inc.’s Current Report on Form 8-K, filed on February 18, 2010 - File No. 0-22418) | |
|
10.17 |
Form of Restricted Stock Unit Award Notice and Agreement for Participants in France for use in connection with the Company’s Amended and Restated 2000 Stock Incentive Plan.* (Filed as Exhibit 10.5 to Itron, Inc.’s Current Report on Form 8-K, filed on February 18, 2010 - File No. 0-22418) | |
|
10.18 |
Form of Long Term Performance Restricted Stock Unit (RSU) Award Notice and Agreement for U.S. Participants for use in connection with the Company’s 2010 Stock Incentive Plan.* (attached hereto) | |
|
10.19 |
Form of Long Term Performance RSU Award Notice and Agreement for International Participants (excluding France) for use in connection with the Company’s 2010 Stock Incentive Plan.* (attached hereto) | |
85
Table of Contents
|
Exhibit
|
Description of Exhibits |
|
|
10.20 |
Form of Long Term Performance RSU Award Notice and Agreement for Participants in France for use in connection with the Company’s 2010 Stock Incentive Plan.* (attached hereto) | |
|
10.21 |
Form of RSU Award Notice and Agreement for all Participants (excluding France) for use in connection with the Company’s 2010 Stock Incentive Plan.* (attached hereto) | |
|
10.22 |
Form of RSU Award Notice and Agreement for Participants in France for use in connection with the Company’s 2010 Stock Incentive Plan.* (attached hereto) | |
|
10.23 |
Form of Stock Option Grant Notice and Agreement for use in connection with both incentive and non-qualified stock options granted under the Company’s 2010 Stock Incentive Plan.* (Filed as Exhibit 10.6 to Itron, Inc.’s Quarterly Report on Form 10-Q, filed on May 5, 2010 - File No. 0-22418) | |
|
10.24 |
Executive Deferred Compensation Plan.* (Filed as Exhibit 10.19 to Itron, Inc.’s Annual Report on form 10-K, Filed on February 26, 2009 - File No. 0-22418) | |
|
10.25 |
Amended and Restated 2002 Employee Stock Purchase Plan. (Filed as Exhibit 10.20 to Itron’s Annual Report on Form 10-K, filed on February 26, 2009 - File No. 0-22418) | |
|
10.26 |
Stock Option Plan for Nonemployee Directors. (Filed as Exhibit 10.11 to Itron, Inc.’s Registration Statement on Form S-1 dated July 22, 1992) | |
|
12.1 |
Statement re Computation of Ratios. (attached hereto) | |
|
21.1 |
Subsidiaries of Itron, Inc. (attached hereto) | |
|
23.1 |
Consent of Ernst & Young LLP Independent Registered Public Accounting Firm. (attached hereto) | |
|
31.1 |
Certification Pursuant to Section 302 of the Sarbanes-Oxley Act of 2002. (attached hereto) | |
|
31.2 |
Certification Pursuant to Section 302 of the Sarbanes-Oxley Act of 2002. (attached hereto) | |
|
32.1 |
Certification Pursuant to Section 906 of the Sarbanes-Oxley Act of 2002. (attached hereto) | |
|
101.INS** |
XBRL Instance Document. (attached hereto) | |
|
101.SCH** |
XBRL Taxonomy Extension Schema. (attached hereto) | |
|
101.CAL** |
XBRL Taxonomy Extension Calculation Linkbase. (attached hereto) | |
|
101.LAB** |
XBRL Taxonomy Extension Label Linkbase. (attached hereto) | |
|
101.PRE** |
XBRL Taxonomy Extension Presentation Linkbase. (attached hereto) | |
| * |
Management contract or compensatory plan or arrangement. |
| ** |
Pursuant to applicable securities laws and regulations, we are deemed to have complied with the reporting obligation relating to the submission of interactive data files in such exhibits and are not subject to liability under any anti-fraud provisions of the federal securities laws as long as we have made a good faith attempt to comply with the submission requirements and promptly amend the interactive data files after becoming aware that the interactive data files fail to comply with the submission requirements. Users of this data are advised that, pursuant to Rule 406T, these interactive data files are deemed not filed and otherwise are not subject to liability. |
86
Table of Contents
Pursuant to the requirements of Section 13 or 15(d) of the Securities Exchange Act of 1934, the Registrant has duly caused this report to be signed on its behalf by the undersigned, thereunto duly authorized, in the City of Liberty Lake, State of Washington, on the 24th day of February, 2011.
| ITRON, INC. | ||
| By: | /s/ STEVEN M. HELMBRECHT | |
| Steven M. Helmbrecht | ||
| Sr. Vice President and Chief Financial Officer | ||
Pursuant to the requirements of the Securities Exchange Act of 1934, this report has been signed below by the following persons on behalf of the Registrant and in the capacities indicated on the 24th day of February, 2011.
|
Signature |
Title |
|
|
/s/ M ALCOLM U NSWORTH Malcolm Unsworth |
President and Chief Executive Officer (Principal Executive Officer), Director |
|
|
/s/ S TEVEN M. H ELMBRECHT Steven M. Helmbrecht |
Sr. Vice President and Chief Financial Officer (Principal Financial and Accounting Officer) |
|
|
/s/ M ICHAEL B. B RACY Michael B. Bracy |
Director |
|
|
/s/ K IRBY A. D YESS Kirby A. Dyess |
Director |
|
|
/s/ J ON E. E LIASSEN Jon E. Eliassen |
Chairman of the Board |
|
|
/s/ C HARLES H. G AYLORD , J R . Charles H. Gaylord, Jr. |
Director |
|
|
/s/ T HOMAS S. G LANVILLE Thomas S. Glanville |
Director |
|
|
/s/ S HARON L. N ELSON Sharon L. Nelson |
Director |
|
|
/s/ G ARY E. P RUITT Gary E. Pruitt |
Director |
|
|
/s/ G RAHAM M. W ILSON Graham M. Wilson |
Director |
|
87
Table of Contents
SCHEDULE II: VALUATION AND QUALIFYING ACCOUNTS
|
Description |
Balance at
beginning of period |
Other
adjustments |
Additions
charged to costs and expenses |
Balance at
end of period Noncurrent |
||||||||||||
| (in thousands) | ||||||||||||||||
|
Year ended December 31, 2010: |
||||||||||||||||
|
Deferred tax assets valuation allowance |
$ | 22,425 | $ | (1,020 | ) | $ | 3,195 | $ | 24,600 | |||||||
|
Year ended December 31, 2009: |
||||||||||||||||
|
Deferred tax assets valuation allowance |
$ | 16,219 | $ | (347 | ) | $ | 6,553 | $ | 22,425 | |||||||
88