ILLINOIS TOOL WORKS INC
10-Ks and 10-Qs
|
|
|
|
|
|
|
|
|
|
|
|
|
|
|
|
|
|
|
|
|
|
|
|
|
|
|
|
|
|
|
|
|
|
|
|
|
|
|
|
|
|
|
|
|
|
|
|
|
|
|
|
|
|
|
|
UNITED STATES SECURITIES AND EXCHANGE COMMISSION
WASHINGTON, D.C. 20549
FORM 10-K
|
x
|
ANNUAL REPORT PURSUANT TO SECTION 13 OR 15(d) OF THE SECURITIES EXCHANGE ACT OF 1934
|
For the fiscal year ended
December 31, 2016
OR
|
o
|
TRANSITION REPORT PURSUANT TO SECTION 13 OR 15(d) OF THE SECURITIES EXCHANGE ACT OF 1934
|
For the transition period from
to
Commission file number 1-4797
ILLINOIS TOOL WORKS INC.
(Exact Name of Registrant as Specified in its Charter)
|
Delaware
|
36-1258310
|
|
|
(State or Other Jurisdiction of
Incorporation or Organization)
|
(I.R.S. Employer
Identification No.)
|
|
|
155 Harlem Avenue, Glenview, Illinois
|
60025
|
|
|
(Address of Principal Executive Offices)
|
(Zip Code)
|
|
Registrant’s telephone number, including area code:
(847) 724-7500
Securities registered pursuant to Section 12(b) of the Act:
|
Title of Each Class
|
Name of Each Exchange on Which Registered
|
|
|
Common Stock
|
New York Stock Exchange
|
|
|
1.75% Euro Notes due 2022
|
New York Stock Exchange
|
|
|
1.25% Euro Notes due 2023
|
New York Stock Exchange
|
|
|
2.125% Euro Notes due 2030
|
New York Stock Exchange
|
|
|
3.00% Euro Notes due 2034
|
New York Stock Exchange
|
|
Securities registered pursuant to Section 12(g) of the Act: None
Indicate by check mark if the registrant is a well-known seasoned issuer, as defined in Rule 405 of the Securities Act.
Yes
x
No
o
Indicate by check mark if the registrant is not required to file reports pursuant to Section 13 or Section 15(d) of the Act.
Yes
o
No
x
Indicate by check mark whether the registrant (1) has filed all reports required to be filed by Section 13 or 15(d) of the Securities Exchange Act of 1934 during the preceding 12 months (or for such shorter period that the registrant was required to file such reports), and (2) has been subject to such filing requirements for the past 90 days.
Yes
x
No
o
Indicate by check mark whether the registrant has submitted electronically and posted on its corporate Web site, if any, every Interactive Data File required to be submitted and posted pursuant to Rule 405 of Regulation S-T during the preceding 12 months (or for such shorter period that the registrant was required to submit and post such files).
Yes
x
No
o
Indicate by check mark if disclosure of delinquent filers pursuant to Item 405 of Regulation S-K is not contained herein, and will not be contained, to the best of registrant’s knowledge, in definitive proxy or information statements incorporated by reference in Part III of this Form 10-K or any amendment to this Form 10-K.
o
Indicate by check mark whether the registrant is a large accelerated filer, an accelerated filer, a non-accelerated filer or a smaller reporting company. See the definitions of "large accelerated filer," "accelerated filer" and "smaller reporting company" in Rule 12b-2 of the Exchange Act. (Check one):
|
Large accelerated filer
|
x
|
Accelerated filer
|
o
|
|
Non-accelerated filer
|
o
(Do not check if a smaller reporting company)
|
Smaller reporting company
|
o
|
Indicate by check mark whether the registrant is a shell company (as defined in Rule 12b-2 of the Exchange Act).
Yes
o
No
x
The aggregate market value of the voting stock held by non-affiliates of the registrant as of
June 30, 2016
was approximately
$30.4 billion
based on the New York Stock Exchange closing sales price as of
June 30, 2016
.
Shares of Common Stock outstanding at
January 31, 2017
:
346,550,685
.
Documents Incorporated by Reference
|
Portions of the 2017 Proxy Statement for Annual Meeting of Stockholders to be held on May 5, 2017.
|
Part III
|
|
|
Table of Contents
|
||
|
PART I
|
||
|
Item 1.
|
||
|
Item 1A.
|
||
|
Item 1B.
|
||
|
Item 2.
|
||
|
Item 3.
|
||
|
Item 4.
|
||
|
PART II
|
||
|
Item 5.
|
||
|
Item 6.
|
||
|
Item 7.
|
||
|
Item 7A.
|
||
|
Item 8.
|
||
|
Item 9.
|
||
|
Item 9A.
|
||
|
Item 9B.
|
||
|
PART III
|
||
|
Item 10.
|
||
|
Item 11.
|
||
|
Item 12.
|
||
|
Item 13.
|
||
|
Item 14.
|
||
|
PART IV
|
||
|
Item 15.
|
||
ITEM 1.
Business
General
Illinois Tool Works Inc. (the "Company" or "ITW") was founded in 1912 and incorporated in 1915. The Company's ticker symbol is ITW. The Company is a global manufacturer of a diversified range of industrial products and equipment with
85
divisions in
57
countries. As of
December 31, 2016
, the Company employed approximately
50,000
persons.
The Company's operations are organized and managed based on similar product offerings and end markets, and are reported to senior management as the following seven segments: Automotive OEM; Food Equipment; Test & Measurement and Electronics; Welding; Polymers & Fluids; Construction Products; and Specialty Products. The following is a description of the Company's seven segments:
Automotive OEM
—
This segment is a global, niche supplier to top tier OEMs, providing unique innovation to address pain points for sophisticated customers with complex problems. Businesses in this segment produce components and fasteners for automotive-related applications. This segment primarily serves the automotive original equipment manufacturers and tiers market. Products in this segment include:
|
•
|
plastic and metal components, fasteners and assemblies for automobiles, light trucks and other industrial uses.
|
Food Equipment
—
This segment is a highly focused and branded industry-leader in commercial food equipment differentiated by innovation and integrated service offerings. This segment primarily serves the food institutional/restaurant, food service and food retail markets. Products in this segment include:
|
•
|
warewashing equipment;
|
|
•
|
cooking equipment, including ovens, ranges and broilers;
|
|
•
|
refrigeration equipment, including refrigerators, freezers and prep tables;
|
|
•
|
food processing equipment, including slicers, mixers and scales;
|
|
•
|
kitchen exhaust, ventilation and pollution control systems; and
|
|
•
|
food equipment service, maintenance and repair.
|
Test & Measurement and Electronics
—
This segment is a branded and innovative producer of test and measurement and electronic manufacturing and maintenance, repair, and operations, or "MRO" solutions that improve efficiency and quality for customers in diverse end markets. Businesses in this segment produce equipment, consumables, and related software for testing and measuring physical properties of materials and structures, as well as equipment and consumables used in the production of electronic subassemblies and microelectronics. This segment primarily serves the electronics, general industrial, industrial capital goods, automotive original equipment manufacturers and tiers, and consumer durables markets. Products in this segment include:
|
•
|
equipment, consumables, and related software for testing and measuring of materials, structures, gases and fluids;
|
|
•
|
electronic assembly equipment and related consumable solder materials;
|
|
•
|
electronic components and component packaging;
|
|
•
|
static control equipment and consumables used for contamination control in clean room environments; and
|
|
•
|
pressure sensitive adhesives and components for telecommunications, electronics, medical and transportation applications.
|
Welding
—
This segment is a branded value-added equipment and specialty consumable manufacturer with innovative and leading technology. Businesses in this segment produce arc welding equipment, consumables and accessories for a wide array of industrial and commercial applications. This segment primarily serves the general industrial market, which includes fabrication, shipbuilding and other general industrial markets, and energy, construction, MRO, and industrial capital goods markets. Products in this segment include:
|
•
|
arc welding equipment;
|
|
•
|
metal arc welding consumables and related accessories; and
|
|
•
|
metal jacketing and other insulation products.
|
3
Polymers & Fluids
—
This segment is a highly branded supplier to niche markets that require value-added, differentiated products. Businesses in this segment produce adhesives, sealants, lubrication and cutting fluids, and fluids and polymers for auto aftermarket maintenance and appearance. This segment primarily serves the automotive aftermarket, MRO, general industrial, and construction markets. Products in this segment include:
|
•
|
adhesives for industrial, construction and consumer purposes;
|
|
•
|
chemical fluids which clean or add lubrication to machines;
|
|
•
|
epoxy and resin-based coating products for industrial applications;
|
|
•
|
hand wipes and cleaners for industrial applications;
|
|
•
|
fluids, polymers and other supplies for auto aftermarket maintenance and appearance;
|
|
•
|
fillers and putties for auto body repair; and
|
|
•
|
polyester coatings and patch and repair products for the marine industry.
|
Construction Products
—
This segment is a branded supplier of innovative engineered fastening systems and solutions. This segment primarily serves the residential/remodel construction and commercial construction markets. Products in this segment include:
|
•
|
fasteners and related fastening tools for wood and metal applications;
|
|
•
|
anchors, fasteners and related tools for concrete applications;
|
|
•
|
metal plate truss components and related equipment and software; and
|
|
•
|
packaged hardware, fasteners, anchors and other products for retail.
|
Specialty Products
—
This segment is focused on diversified niche market opportunities with substantial patent protection producing beverage packaging equipment and consumables, product coding and marking equipment and consumables, and appliance components and fasteners. This segment primarily serves the food and beverage, general industrial, consumer durables, printing and publishing and industrial capital goods markets. Products in this segment include:
|
•
|
line integration, conveyor systems and line automation for the food and beverage industries;
|
|
•
|
plastic consumables that multi-pack cans and bottles and related equipment;
|
|
•
|
foil, film and related equipment used to decorate consumer products;
|
|
•
|
product coding and marking equipment and related consumables;
|
|
•
|
plastic and metal fasteners and components for appliances;
|
|
•
|
airport ground support equipment; and
|
|
•
|
components for medical devices.
|
The information set forth below is applicable to all segments of the Company unless otherwise noted.
The ITW Business Model
The powerful and highly differentiated ITW Business Model is the Company’s core source of value creation. This business model is the Company’s competitive advantage and defines how ITW creates value for its shareholders and comprises three unique elements:
|
•
|
ITW’s
80/20 management process
is the operating system that is applied in every ITW business. Initially introduced as a manufacturing efficiency tool in the 1980’s, ITW has continually refined, improved and expanded 80/20 into a proprietary, holistic business management process that generates significant value for the Company and its customers. Through the application of data-driven insights generated by 80/20 practice, ITW focuses on its largest and best opportunities (the “80”) and eliminates cost, complexity and distractions associated with the less profitable opportunities (the “20”). 80/20 enables ITW businesses to consistently achieve world-class operational excellence in product availability, quality, and innovation, while generating superior financial performance;
|
|
•
|
Customer-back innovation
has fueled decades of profitable growth at ITW. The Company’s unique innovation approach is built on insight gathered from the 80/20 management process. Working from the customer back, ITW businesses position themselves as the go-to problem solver for their “80” customers. ITW’s innovation efforts are focused on understanding customer needs, particularly those in “80” markets with solid long-term growth fundamentals, and subsequently creating unique solutions to address those needs. These customer insights and learnings drive innovation at ITW and have contributed to a portfolio of more than 17,000 granted and pending patents;
|
4
|
•
|
ITW’s
decentralized, entrepreneurial culture
allows ITW businesses to be fast, focused, and responsive. ITW businesses have significant flexibility within the framework of the ITW Business Model to customize their approach in order to best serve their specific customers' needs. ITW colleagues recognize their unique responsibilities to execute the Company's strategy and values. As a result, the Company maintains a focused and simple organizational structure that, combined with outstanding execution, delivers best-in-class services adapted to each business' customers and end markets.
|
Enterprise Strategy
In late 2012, ITW began the process of transitioning the Company onto its current strategic path to fully leverage the compelling performance potential of the ITW Business Model. Since then, ITW has made considerable progress, as evidenced by the Company’s strong financial performance over the past four years.
The roots of ITW’s Enterprise Strategy began in late 2011 / early 2012, when the Company undertook a complete review of its performance. Focusing on its businesses delivering consistent above-market growth with best-in-class margins and returns, ITW developed a strategy to replicate that performance across its operations.
Based on this rigorous evaluation, ITW determined that solid and consistent above-market organic growth must be the core growth engine to deliver world-class financial performance and compelling long-term returns for its shareholders. To shift its primary growth engine to organic, the Company began executing a multi-step approach.
|
•
|
The first step was to narrow the focus and improve the quality of ITW’s business portfolio. As part of the
Portfolio Management
initiative, ITW exited businesses that were operating in commoditized market spaces and prioritized sustainable differentiation as a must-have requirement for all ITW businesses. This process included both divesting entire businesses and exiting commoditized product lines and customers inside otherwise highly differentiated ITW divisions.
|
As a result of this work, ITW’s business portfolio now has significantly higher organic growth potential. ITW segments and divisions now possess attractive and differentiated product lines and end markets as they continue to improve operating margins and generate price/cost increases. The Company achieved this through product line simplification, or eliminating the complexity and overhead costs associated with smaller product lines and customers, while supporting and growing the businesses’ largest / most profitable customers and product lines. With the initiative nearly complete and ITW businesses demonstrating notably improved financial performance, the Company believes that the significant product line simplification work is essentially finalized and will return to more normalized levels in 2017 and beyond.
|
•
|
Step two,
Business Structure Simplification
, was implemented to simplify and scale-up ITW’s operating structure to support increased engineering, marketing, and sales resources, and, at the same time, improve global reach and competitiveness, all of which were critical to driving accelerated organic growth. ITW now has
85
scaled-up divisions with significantly enhanced focus on growth investments, core customers and products, and customer-back innovation.
|
|
•
|
The
Strategic Sourcing
initiative was established as a core capability to better leverage ITW’s scale and improve global competitiveness. Sourcing is now a core strategic and operational capability at ITW. The Company’s 80/20-enabled sourcing organization has delivered an average of one percent reduction in spend each year from 2013 through 2016 and is on track to do the same in 2017 and 2018.
|
|
•
|
With the portfolio realignment and scale-up work largely complete, the Company was able to
shift its focus to preparing for and accelerating, organic growth
. As a preparatory step, ITW is in the process of reapplying 80/20 to optimize its newly scaled-up divisions for growth, first, to build a foundation of operational excellence, and second, to identify the best opportunities to drive organic growth.
|
Once the business has achieved operational excellence and identified the right growth opportunities, the final step is to accelerate organic growth. The process of preparing for accelerated organic growth generally takes 18 to 24 months.
Based on the financial performance of the divisions that are further along in this process, the Company believes that its organic growth framework is capable of delivering above-market organic growth across all segments. Divisions
5
are at various phases in preparation for growth and many are either ready to grow or already growing above their respective markets. ITW management is fully aligned with this plan and very focused on executing it. With the close of 2016, approximately 85 percent of the divisions are ready to grow.
Path to Full Potential
While the Company has made considerable progress and ITW’s performance is nearing best-in-class levels, the Company has significant opportunity for further improvement before it achieves full operating potential. In order to do so, ITW is focused on two key areas of opportunity, including: additional structural margin improvement and sustained above-market organic growth with strong incremental profitability.
Additional Structural Margin Improvement
To deliver on the additional structural margin improvement, the Company is implementing the following two levers: (1) further leveraging the 80/20 management process and (2) strategic sourcing.
|
•
|
The first lever, better leveraging the full power of the ITW Business Model, will be accomplished through a much more consistent and focused approach to 80/20 best practice implementation across the Company. The 80/20 management system has continuously been refined, improved and expanded into a unique holistic business management process of interconnected tools, which improves all aspects of the business and, when applied consistently and executed more effectively, will lead to additional margin improvement. ITW has clearly demonstrated superior 80/20 management, resulting in meaningful incremental improvement in margins and returns as evidenced by the Company’s operating margin and after-tax return on invested capital. These 80/20 initiatives can also result in restructuring initiatives that reduce costs and improve profitability and returns.
|
|
•
|
The second lever, strategic sourcing, is a core element of ITW’s ongoing operational strategy and a sustainable enterprise-wide capability. Through the continued execution of this initiative, the Company expects to deliver additional margin improvement with the goal of a one percent reduction in spend in 2017 and 2018.
|
Sustained Above-Market Organic Growth with Strong Incremental Profitability
ITW has done extensive work on its portfolio and operating structure to position the Company to deliver sustainable above-market organic growth. The Company has narrowed the focus and significantly improved the growth potential of ITW’s business portfolio. With approximately 85% of its divisions ready to grow as of the end of 2016, ITW is well positioned for accelerated growth in 2017 and beyond. To deliver on this accelerated growth, the divisions have been implementing the organic growth framework, which includes continued investment in customer-back innovation and a strengthened focus on market penetration. ITW continues to focus on growing its share of "80" products with existing customers with whom the Company has a resonant value proposition as well as target potential new customers with similar pain points to existing customers. ITW has made strong progress on the Company’s pivot to organic growth and is well positioned to deliver on sustained above-market organic growth over the long-term.
Divestiture Activity
Divestiture of Majority Interest in Former Decorative Surfaces Segment
—
On October 31, 2012, the Company divested a 51% majority interest in the Decorative Surfaces segment. Accordingly, the Company ceased consolidating the results of the Decorative Surfaces segment as of October 31, 2012 and now reports its 49% ownership interest using the equity method of accounting. Due to the Company's continuing involvement through its 49% interest, the historical operating results of Decorative Surfaces are presented in continuing operations. Effective November 1, 2012, Decorative Surfaces was no longer a reportable segment of the Company.
Divestiture of the Industrial Packaging Segment
— In February 2013, the Company announced that it was initiating a review process to explore strategic alternatives for the Industrial Packaging segment. In September 2013, the Company’s Board of Directors authorized a plan to commence a sale process for the Industrial Packaging segment. The Company classified the Industrial Packaging segment as held for sale beginning in the third quarter of 2013 and no longer presented this segment as part of its continuing operations.
On February 6, 2014, the Company announced that it had signed a definitive agreement to sell the Industrial Packaging business to The Carlyle Group for $3.2 billion. The transaction was completed on May 1, 2014, resulting in a pre-tax gain of $1.7 billion ($1.1 billion after-tax) in the second quarter of 2014 which was included in Income from discontinued operations.
6
See Note 2. Discontinued Operations in Item 8. Financial Statements and Supplementary Data for further discussion of this transaction.
Current Year Developments
Refer to Item 7. Management's Discussion and Analysis of Financial Condition and Results of Operations.
Financial Information about Segments
Segment information is included in Item 7. Management's Discussion and Analysis of Financial Condition and Results of Operations and Note 14. Segment Information in Item 8. Financial Statements and Supplementary Data.
Distribution Methods
The Company’s businesses primarily distribute their products directly to industrial manufacturers and through independent distributors.
Backlog
Backlog generally is not considered a significant factor in the Company’s businesses as relatively short delivery periods and rapid inventory turnover are characteristic of most of their products. Backlog by segment as of
December 31, 2016
and
2015
was as follows:
|
In millions
|
2016
|
2015
|
|||||
|
Automotive OEM
|
$
|
452
|
|
$
|
403
|
|
|
|
Food Equipment
|
188
|
|
203
|
|
|||
|
Test & Measurement and Electronics
|
298
|
|
289
|
|
|||
|
Welding
|
67
|
|
68
|
|
|||
|
Polymers & Fluids
|
62
|
|
53
|
|
|||
|
Construction Products
|
29
|
|
34
|
|
|||
|
Specialty Products
|
217
|
|
237
|
|
|||
|
Total
|
$
|
1,313
|
|
$
|
1,287
|
|
|
Backlog orders scheduled for shipment beyond calendar year 2017 were not material as of
December 31, 2016
.
Competition
With operations in
57
countries, the Company offers a wide range of products in a myriad of markets, many of which are fragmented, and the Company encounters a variety of competitors that vary by product line, end market and geographic area. The Company's competitors include many regional or specialized companies, as well as large U.S. and non-U.S. companies or divisions of large companies. Each of the Company's segments generally has several main competitors and numerous smaller ones in most of their end markets and geographic areas. In addition to numerous smaller regional competitors, the Welding segment competes globally with Lincoln Electric and ESAB.
In virtually all segments, the Company differentiates its businesses from its competitors based on product innovation, product quality, brand preference and service delivery. Technical capability is also a competitive factor in most segments. The Company believes that each segment's primary competitive advantages derive from the Company's business model and decentralized operating structure, which creates a strong focus on end markets and customers at the local level, enabling its businesses to respond rapidly to market dynamics. This structure enables the Company's businesses to drive operational excellence utilizing the Company's 80/20 management process and leveraging its product innovation capabilities. The Company also believes that its global footprint is a competitive advantage in many of its markets, especially in its Automotive OEM segment.
7
Raw Materials
The Company uses raw materials of various types, primarily steel, resins and chemicals, that are available from numerous commercial sources. The availability of materials and energy has not resulted in any significant business interruptions or other major problems, and no such problems are currently anticipated.
Research and Development
Developing new and improved products, broadening the application of established products, and continuing efforts to improve and develop new methods, processes and equipment all contribute to the Company's organic growth. Many new products are designed to reduce customers' costs by eliminating steps in their manufacturing processes, reducing the number of parts in an assembly or improving the quality of customers' assembled products. Typically, the development of such products is accomplished by working closely with customers on specific applications. Research and development expenses were $223 million in
2016
, $218 million in
2015
and $227 million in
2014
.
Intellectual Property
The Company owns approximately 3,500 unexpired U.S. patents and 7,400 foreign patents covering articles, methods and machines. In addition, the Company has approximately 1,500 applications for patents pending in the U.S. Patent Office and 4,800 applications pending in foreign patent offices. There is no assurance that any of these patents will be issued. The Company maintains a patent group for the administration of patents and processing of patent applications.
The Company believes that many of its patents are valuable and important; however, the expiration of any one of the Company's patents would not have a material effect on the Company's results of operations or financial position. The Company also credits its success in the markets it serves to engineering capability; manufacturing techniques; skills and efficiency; marketing and sales promotion; and service and delivery of quality products to its customers.
In addition to patents, many of the Company's products and services are sold under various owned or licensed trademarks, which are important to the Company in the aggregate. Some of the Company's more significant trademarks include ITW, which is also used in conjunction with the trademarks of many of the Company's businesses; Deltar and Shakeproof in the Automotive OEM segment; Hobart in the Food Equipment segment; Instron in the Test & Measurement and Electronics segment; Miller in the Welding segment; Rain-X and Permatex in the Polymers & Fluids segment; Paslode in the Construction Products segment; and Hi-Cone in the Specialty Products segment.
Environmental
The Company believes that its manufacturing plants and equipment are in substantial compliance with all applicable environmental regulations. Additional measures to maintain compliance are not expected to materially affect the Company’s capital expenditures, competitive position, financial position or results of operations.
Various legislative and administrative regulations concerning environmental issues have become effective or are under consideration in many parts of the world relating to manufacturing processes and the sale or use of certain products. To date, such developments have not had a substantial adverse impact on the Company's revenues, earnings or cash flows.
Employees
The Company employed approximately
50,000
persons as of
December 31, 2016
and considers its employee relations to be excellent.
International
The Company's international operations include subsidiaries and joint ventures in
56
foreign countries on six continents. These operations serve such end markets as automotive OEM/tiers, automotive aftermarket, general industrial, commercial food equipment, construction, and others on a worldwide basis. The Company's revenues from sales to customers outside the U.S. were approximately 55% of revenues in
2016
, 54% of revenues in
2015
, and 57% of revenues in
2014
.
Refer to Item 7. Management's Discussion and Analysis of Financial Condition and Results of Operations and Note 14. Segment Information in Item 8. Financial Statements and Supplementary Data for additional information on international activities. International operations are subject to certain potential risks inherent in conducting business in foreign countries,
8
including price controls, exchange controls, limitations on participation in local enterprises, nationalization, expropriation and other governmental action, and fluctuations in currency exchange rates. Additional risks of the Company's international operations are described under Item 1A. Risk Factors.
Executive Officers
Executive Officers of the Company as of
February 10, 2017
were as follows:
|
Name
|
Office
|
Age
|
|
|
E. Scott Santi
|
Chairman & Chief Executive Officer
|
55
|
|
|
Norman D. Finch Jr.
|
Senior Vice President, General Counsel & Secretary
|
52
|
|
|
John R. Hartnett
|
Executive Vice President
|
56
|
|
|
Michael M. Larsen
|
Senior Vice President & Chief Financial Officer
|
48
|
|
|
Mary K. Lawler
|
Senior Vice President & Chief Human Resources Officer
|
51
|
|
|
Roland M. Martel
|
Executive Vice President
|
62
|
|
|
Steven L. Martindale
|
Executive Vice President
|
60
|
|
|
Sundaram Nagarajan
|
Executive Vice President
|
54
|
|
|
Christopher O’Herlihy
|
Vice Chairman
|
53
|
|
|
David C. Parry
|
Vice Chairman
|
63
|
|
|
Randall J. Scheuneman
|
Vice President & Chief Accounting Officer
|
49
|
|
|
Lei Schlitz
|
Executive Vice President
|
50
|
|
|
Juan Valls
|
Executive Vice President
|
55
|
|
|
Michael R. Zimmerman
|
Executive Vice President
|
56
|
|
The executive officers of the Company serve at the discretion of the Board of Directors. Set forth below is information regarding the principal occupations and employment and business experience over the past five years for each executive officer. Unless otherwise stated, employment is by the Company.
Mr. Santi is the Chairman of the Board and Chief Executive Officer of the Company. He was elected Chairman of the Board in 2015 after having served as President and Chief Executive Officer, as well as a director, since November 2012. In October 2012, he was elected President and Chief Operating Officer. Mr. Santi served as Vice Chairman from 2008 to October 2012.
Mr. Finch joined the Company in January 2017 and was elected Senior Vice President, General Counsel and Secretary in February 2017. From 2013 to January 2017 he served as Vice President, General Counsel and Secretary of Sealed Air Corporation, a global manufacturer of products related to food safety and security, facility hygiene and product protection. Prior thereto, he served as Vice President, Associate General Counsel and Chief Compliance Officer of Zimmer Holdings, Inc. (now Zimmer Biomet Holdings), a global medical device company.
Mr. Hartnett was elected Executive Vice President in 2012. Prior to that, he held various management positions of increasing responsibility. Most recently, he served as Group President of the automotive aftermarket businesses.
Mr. Larsen joined the Company and was elected Senior Vice President and Chief Financial Officer in September 2013. From October 2010 to August 2013, he served as Vice President and Chief Financial Officer of Gardner Denver, Inc., a global manufacturer of highly engineered compressors, blowers, pumps and other fluid transfer equipment. In addition, he served as interim CEO of Gardner Denver from July 2012 to November 2012, and as President, Chief Executive Officer and a director of that company from November 2012 to July 2013.
Ms. Lawler joined the Company and was elected Senior Vice President and Chief Human Resources Officer in October 2014. From June 2013 to October 2014, she served as Executive Vice President, Human Resources, at GATX Corporation, a rail car leasing company. Prior to that, she served as Senior Vice President, Human Resources, at GATX Corporation, from May 2008 to May 2013.
Mr. Martel has served in his present position since 2006.
9
Mr. Martindale has served in his present position since 2008.
Mr. Nagarajan has served in his present position since 2010.
Mr. O’Herlihy was elected Vice Chairman in 2015. Prior to that, he served as Executive Vice President from 2010 to 2015.
Mr. Parry has served in his present position since 2010.
Mr. Scheuneman has served in his present position since 2009.
Ms. Schlitz was elected Executive Vice President in 2015. Prior to that, she held various management positions of increasing responsibility. Most recently, she served as Group President of the food equipment businesses since 2011.
Mr. Valls has served in his present position since 2007.
Mr. Zimmerman was elected Executive Vice President in 2015. Prior to that, he held various management positions of increasing responsibility. Most recently, he served as Group President of the welding businesses since 2010.
Available Information
The Company electronically files reports with the Securities and Exchange Commission ("SEC"). The public may read and copy any materials the Company has filed with the SEC at the SEC's Public Reference Room at 100 F Street, N.E., Washington, D.C. 20549. The public may obtain information on the operation of the Public Reference Room by calling the SEC at 1-800-SEC-0330. In addition, the SEC maintains a website (
www.sec.gov
) that contains reports, proxy and information statements, and other information regarding issuers that file electronically with the SEC. Copies of the Company's Annual Report on Form 10-K, Quarterly Reports on Form 10-Q and Current Reports on Form 8-K and amendments to those reports filed or furnished pursuant to Section 13(a) or 15(d) of the Securities Exchange Act of 1934 are also available free of charge through the Company's website (
www.itw.com
), as soon as reasonably practicable after electronically filing with or otherwise furnishing such information to the SEC, and are available in print to any shareholder who requests them. The Company will furnish any exhibit not contained herein upon the payment of a fee representing the reasonable cost to the Company of furnishing the exhibit. Requests for exhibits may be sent to Illinois Tool Works Inc., 155 Harlem Avenue, Glenview, IL 60025, Attention: Secretary. Also posted on the Company’s website are the following:
|
•
|
Statement of Principles of Conduct;
|
|
•
|
Code of Ethics for CEO and key financial and accounting personnel;
|
|
•
|
Charters of the Audit, Corporate Governance and Nominating, and Compensation Committees of the Board of Directors;
|
|
•
|
Corporate Governance Guidelines;
|
|
•
|
Global Anti-Corruption Policy;
|
|
•
|
Corporate Citizenship Statement;
|
|
•
|
Conflict Minerals Policy Statement; and
|
|
•
|
Government Affairs Information.
|
ITEM 1A.
Risk Factors
The Company's business, financial condition, results of operations and cash flows are subject to various risks, including, but not limited to, those set forth below, which could cause actual results to vary materially from recent results or from anticipated future results. These risk factors should be considered together with information included elsewhere in this Annual Report on Form 10-K.
The Company's results are impacted by global economic conditions. Downturns in the markets served by the Company could adversely affect its businesses, results of operations or financial condition.
The Company's businesses are impacted by economic conditions around the globe, including the uncertainty created by the United Kingdom’s June 2016 vote to leave the European Union. Slower economic growth, financial market instability, high unemployment, government deficit reduction, sequestration and other austerity measures impacting the markets the Company serves can adversely affect the Company’s businesses by reducing demand for the Company's products and services, limiting financing available to the Company's customers, increasing order cancellations and the difficulty in collecting accounts
10
receivable, increasing price competition, or increasing the risk that counterparties to the Company's contractual arrangements will become insolvent or otherwise unable to fulfill their obligations.
The global nature of the Company's operations subjects it to political and economic risks that could adversely affect its business, results of operations or financial condition.
The Company currently operates in
57
countries. The risks inherent in the Company's global operations include:
|
•
|
fluctuation in currency exchange rates;
|
|
•
|
limitations on ownership or participation in local enterprises;
|
|
•
|
price controls, exchange controls and limitations on repatriation of earnings;
|
|
•
|
transportation delays and interruptions;
|
|
•
|
political, social and economic instability and disruptions;
|
|
•
|
acts of terrorism;
|
|
•
|
government embargoes or foreign trade restrictions;
|
|
•
|
the imposition of duties and tariffs and other trade barriers;
|
|
•
|
import and export controls;
|
|
•
|
labor unrest and current and changing regulatory environments;
|
|
•
|
the potential for expropriation or nationalization of enterprises;
|
|
•
|
difficulties in staffing and managing multi-national operations;
|
|
•
|
limitations on its ability to enforce legal rights and remedies; and
|
|
•
|
potentially adverse tax consequences.
|
The United Kingdom's vote in June 2016 to leave the European Union may increase certain of the risks and uncertainties described above. The United Kingdom represented approximately 5% of the Company's total consolidated operating revenue for the year ended December 31, 2016. If the Company is unable to successfully manage these and other risks associated with managing and expanding its international businesses, the risks could have a material adverse effect on the Company's business, results of operations or financial condition.
The benefits from the Company’s Enterprise Strategy may not be as expected and the Company's financial results could be adversely impacted.
As the Company has substantially completed its Enterprise Strategy initiatives of portfolio management and business structure simplification, its focus has pivoted to organic revenue growth and continued margin improvement. Product line and customer base simplification activities, which are core elements of the Company’s 80/20 management process, continue to be applied to the Company’s scaled up operating divisions and remain active elements of the Enterprise Strategy. Although these activities are expected to improve future operating margins and organic revenue growth, they are also expected to have a negative impact on the Company’s overall organic revenue growth in the short term. If the Company is unable to realize the expected benefits from its Enterprise Strategy initiatives, the Company's financial results could be adversely impacted.
The timing and amount of the Company’s share repurchases are subject to a number of uncertainties.
Share repurchases constitute a significant component of the Company’s capital allocation strategy. The Company funds its share repurchases with free cash flow and short-term borrowings. The amount and timing of share repurchases will be based on a variety of factors. Important factors that could cause the Company to limit, suspend or delay its share repurchases include unfavorable trading market conditions, the price of the Company's common stock, the nature of other investment opportunities presented to us from time to time, the ability to obtain financing at attractive rates and the availability of U.S. cash.
The Company may incur fines or penalties, damage to its reputation or other adverse consequences if its employees, agents or business partners violate anti-bribery, competition, export and import, environmental or other laws.
The Company has a decentralized operating structure under which its individual businesses are allowed significant decision-making autonomy within the Company’s strategic framework and internal financial and compliance controls. The Company cannot ensure that its internal controls will always protect against reckless or criminal acts committed by its employees, agents or business partners that might violate U.S. and/or non-U.S. laws, including anti-bribery, competition, export and import, and environmental laws. Any such improper actions could subject the Company to civil or criminal investigations, could lead to substantial civil or criminal monetary and non-monetary penalties against the Company or its subsidiaries, or could damage its reputation.
11
A significant fluctuation between the U.S. Dollar and other currencies could adversely impact the Company's operating income.
Although the Company's financial results are reported in U.S. Dollars, a significant portion of its sales and operating costs are realized in other currencies, with the largest concentration of foreign sales occurring in Europe. The Company's profitability is affected by movements of the U.S. Dollar against the Euro and other foreign currencies in which it generates revenues and incurs expenses. Significant long-term fluctuations in relative currency values, and in particular, an increase in the value of the U.S. Dollar against foreign currencies, has had and could have an adverse effect on profitability and financial condition.
If the Company is unable to successfully introduce new products or adequately protect its intellectual property, its future growth may be adversely affected.
The Company's ability to develop new products based on innovation can affect its competitive position and sometimes requires the investment of significant time and resources. Difficulties or delays in research, development, production or commercialization of new products and services may reduce future revenues and adversely affect the Company's competitive position. If the Company is unable to create sustainable product differentiation, its organic growth may be adversely affected.
Protecting the Company's intellectual property is critical to its innovation efforts. The Company owns patents, trade secrets, copyrights, trademarks and/or other intellectual property rights related to many of its products, and also has exclusive and non-exclusive license rights under intellectual property owned by others. The Company's intellectual property rights may be challenged or infringed upon by third parties, particularly in countries where property rights are not highly developed or protected, or the Company may be unable to maintain, renew or enter into new license agreements with third-party owners of intellectual property on reasonable terms. Unauthorized use of the Company's intellectual property rights or inability to preserve existing intellectual property rights could adversely impact the Company's competitive position and results of operations.
The Company's acquisition of businesses could negatively impact its profitability and returns.
Acquisitions, including the Company’s acquisition of the Engineered Fasteners and Components business on July 1, 2016 from ZF TRW, involve a number of risks and financial, accounting, managerial and operational challenges, including the following, any of which could adversely affect the Company's profitability and returns:
|
•
|
The acquired business could under-perform relative to the Company’s expectations and the price paid for it, or not perform in accordance with the Company’s anticipated timetable.
|
|
•
|
The acquired business could cause the Company's financial results to differ from expectations in any given fiscal period, or over the long term.
|
|
•
|
Acquisition-related earnings charges could adversely impact operating results.
|
|
•
|
The acquired business could place unanticipated demands on the Company's management, operational resources and financial and internal control systems.
|
|
•
|
The Company may assume unknown liabilities, known contingent liabilities that become realized or known liabilities that prove greater than anticipated, internal control deficiencies or exposure to regulatory sanctions resulting from the acquired business’s activities. The realization of any of these liabilities or deficiencies may increase the Company's expenses, adversely affect its financial position or cause noncompliance with its financial reporting obligations.
|
|
•
|
As a result of acquisitions, the Company has in the past recorded significant goodwill and other identifiable intangible assets on its balance sheet. If the Company is not able to realize the value of these assets, it may recognize charges relating to the impairment of these assets.
|
Recent divestitures pose the risk of retained liabilities that could adversely affect the Company's financial results.
The Company's divestiture activity increased in 2012, 2013 and 2014 in accordance with its portfolio management initiative. Though the divestiture element of its portfolio management initiative is essentially complete, the Company has retained certain liabilities directly or through indemnifications made to the buyer against known and unknown contingent liabilities such as lawsuits, tax liabilities, product liability claims and environmental matters.
12
The Company has significant goodwill and other intangible assets, and future impairment of these assets could have a material adverse impact on our financial results.
The Company has recorded significant goodwill and other identifiable intangible assets on its balance sheet as a result of acquisitions. A number of factors may result in impairments to goodwill and other intangible assets, including significant negative industry or economic trends, disruptions to our business, increased competition and significant changes in the use of the assets. Impairment charges could result that adversely affect the Company's financial condition or results of operations in the periods recognized.
Disruptions or volatility in global financial markets or changes in our credit ratings could increase our funding costs or reduce the availability of credit.
Global economic conditions may cause volatility and disruptions in the financial markets. The Company’s continued ability to meet its cash requirements requires substantial liquidity and access to the financial markets. In addition, the Company’s borrowing costs can be affected by short and long-term ratings assigned by independent rating agencies. If conditions in the financial markets decline or the Company’s credit ratings are negatively impacted, its funding costs could be increased or the availability of credit could be diminished.
Raw material price increases and supply shortages could adversely affect results.
The supply of raw materials to the Company and to its component parts suppliers could be interrupted for a variety of reasons, including availability and pricing. Prices for raw materials necessary for production have fluctuated significantly in the past and significant increases could adversely affect the Company's results of operations and profit margins. Due to pricing pressure or other factors, the Company may not be able to pass along increased raw material and components parts prices to its customers in the form of price increases or its ability to do so could be delayed. Consequently, its results of operations and financial condition may be adversely affected.
Unfavorable tax law changes and tax authority rulings may adversely affect results.
The Company is subject to income taxes in the U.S. and in various foreign jurisdictions. Domestic and international tax liabilities are based on the income and expenses in various tax jurisdictions. The Company's effective tax rate could be adversely affected by changes in the mix of earnings among countries with differing statutory tax rates, changes in the valuation allowance of deferred tax assets or changes in tax laws. The amount of income taxes and other taxes are subject to ongoing audits by U.S. federal, state and local tax authorities and by non-U.S. authorities. If these audits result in assessments different from amounts recorded, future financial results may include unfavorable tax adjustments.
The Company's defined benefit pension plans are subject to financial market risks that could adversely affect its results of operations and cash flows.
The performance of financial markets and interest rates impact the Company's funding obligations under its defined benefit pension plans. Significant changes in market interest rates, decreases in the fair value of plan assets and investment losses on plan assets may increase the Company's funding obligations and adversely impact its results of operations and cash flows.
Potential adverse outcomes in legal proceedings may adversely affect results.
The Company's businesses expose it to potential toxic tort and other types of product liability claims that are inherent in the design, manufacture and sale of its products and the products of third-party vendors. The Company currently maintains insurance programs consisting of self-insurance up to certain limits and excess insurance coverage for claims over established limits. There can be no assurance that the Company will be able to obtain insurance on acceptable terms or that its insurance programs will provide adequate protection against actual losses. In addition, the Company is subject to the risk that one or more of its insurers may become insolvent and become unable to pay claims that may be made in the future. Even if it maintains adequate insurance programs, claims could have a material adverse effect on the Company's financial condition, liquidity and results of operations and on its ability to obtain suitable, adequate or cost-effective insurance in the future.
13
If the Company is unable to protect its information technology infrastructure against service interruptions, data corruption, cyber-based attacks or network security breaches, there could be a negative impact on operating results or the Company may suffer financial or reputational damage.
The Company relies on information technology networks and systems, including the Internet, to process, transmit and store electronic information, and to manage or support a variety of business processes and activities, including procurement, manufacturing, distribution, invoicing and collection. These technology networks and systems may be susceptible to damage, disruptions or shutdowns due to failures during the process of upgrading or replacing software, databases or components; power outages; hardware failures; attacks by computer hackers; computer viruses; employee error or malfeasance. In addition, security breaches could result in unauthorized disclosure of confidential information or personal data belonging to our employees, partners, customers or suppliers. If these information technology systems suffer severe damage, disruption, or shutdown, and business continuity plans do not effectively resolve the issues in a timely manner, there could be a negative impact on operating results or the Company may suffer financial or reputational damage.
Forward-Looking Statements
This Annual Report on Form 10-K contains forward-looking statements within the meaning of the Private Securities Litigation Reform Act of 1995. Forward-looking statements may be identified by the use of words such as "believe," "expect," "plans," "intends," "may," "strategy," "prospects," "estimate," "project," "target," "anticipate," "guidance," "forecast," and other similar words, including, without limitation, statements regarding the expected performance of acquired businesses and impact of divested businesses, economic conditions in various geographic regions, the timing and amount of share repurchases, the timing and amount of benefits from the Company's Enterprise Strategy, the adequacy of internally generated funds and credit facilities to service debt and finance the Company's capital allocation priorities, the sufficiency of U.S. generated cash to fund cash requirements in the U.S., the cost and availability of additional financing, the Company's portion of future benefit payments related to pension and postretirement benefits, the expected impact of a change in the method of calculating the service and interest cost components of net periodic pension and other postretirement benefit costs to a specific spot rate approach, the availability of raw materials and energy, the expiration of any one of the Company's patents, the cost of compliance with environmental regulations, the likelihood of future goodwill or intangible asset impairment charges, the impact of failure of the Company's employees to comply with applicable laws and regulations, the impact of foreign currency fluctuations, the outcome of outstanding legal proceedings, the impact of adopting new accounting pronouncements, and the estimated timing and amount related to the resolution of tax matters. These statements are subject to certain risks, uncertainties, and other factors, which could cause actual results to differ materially from those anticipated. Important risks that may influence future results include those risks described above. These risks are not all inclusive and given these and other possible risks and uncertainties, investors should not place undue reliance on forward-looking statements as a prediction of actual results.
Any forward-looking statements made by ITW speak only as of the date on which they are made. ITW is under no obligation to, and expressly disclaims any obligation to, update or alter its forward-looking statements, whether as a result of new information, subsequent events or otherwise.
ITW practices fair disclosure for all interested parties. Investors should be aware that while ITW regularly communicates with securities analysts and other investment professionals, it is against ITW's policy to disclose to them any material non-public information or other confidential commercial information. Investors should not assume that ITW agrees with any statement or report issued by any analyst irrespective of the content of the statement or report.
ITEM 1B.
Unresolved Staff Comments
None.
14
ITEM 2.
Properties
Due to the Company’s decentralized operating structure, the Company operates out of a number of facilities worldwide, none of which are individually significant to the Company or its segments. As of
December 31, 2016
, the Company operated the following plants and office facilities, excluding regional sales offices and warehouse facilities:
|
|
Number Of Properties
|
||||||||
|
|
Owned
|
Leased
|
Total
|
||||||
|
Automotive OEM
|
59
|
|
38
|
|
97
|
|
|||
|
Food Equipment
|
24
|
|
17
|
|
41
|
|
|||
|
Test & Measurement and Electronics
|
29
|
|
63
|
|
92
|
|
|||
|
Welding
|
26
|
|
18
|
|
44
|
|
|||
|
Polymers & Fluids
|
37
|
|
32
|
|
69
|
|
|||
|
Construction Products
|
28
|
|
28
|
|
56
|
|
|||
|
Specialty Products
|
47
|
|
42
|
|
89
|
|
|||
|
Corporate
|
1
|
|
12
|
|
13
|
|
|||
|
Total
|
251
|
|
250
|
|
501
|
|
|||
The Company’s properties are highly suitable for the purposes for which they were designed and are maintained in good operating condition. Production capacity, in general, currently exceeds operating levels. Capacity levels are somewhat flexible based on the number of shifts operated and on the number of overtime hours worked. The Company adds production capacity from time to time as required by increased demand. Additions to capacity can be made within a reasonable period of time due to the nature of the Company’s businesses.
The Company operated 307 plants and office facilities outside of the U.S. Principal countries include China, Germany, France and the United Kingdom.
ITEM 3.
Legal Proceedings
None.
ITEM 4.
Mine Safety Disclosures
None.
15
ITEM 5.
Market For Registrant’s Common Equity, Related Stockholder Matters and Issuer Purchases of Equity Securities
Common Stock Price and Dividend Data
— The Company's common stock is listed on the New York Stock Exchange. Quarterly market price and dividend data for
2016
and
2015
were as shown below:
|
|
Market Price Per Share
|
Dividends
Declared
Per Share
|
|||||||||
|
|
High
|
Low
|
|||||||||
|
2016:
|
|||||||||||
|
Fourth quarter
|
$
|
127.99
|
|
$
|
111.50
|
|
$
|
0.65
|
|
||
|
Third quarter
|
123.50
|
|
103.08
|
|
0.65
|
|
|||||
|
Second quarter
|
109.54
|
|
98.32
|
|
0.55
|
|
|||||
|
First quarter
|
102.98
|
|
79.15
|
|
0.55
|
|
|||||
|
2015:
|
|||||||||||
|
Fourth quarter
|
$
|
95.00
|
|
$
|
80.16
|
|
$
|
0.55
|
|
||
|
Third quarter
|
94.33
|
|
78.79
|
|
0.55
|
|
|||||
|
Second quarter
|
99.92
|
|
91.41
|
|
0.485
|
|
|||||
|
First quarter
|
100.14
|
|
90.43
|
|
0.485
|
|
|||||
There were approximately 6,433
holders of record of common stock as of
January 31, 2017
. This number does not include beneficial owners of the Company's securities held in the name of nominees.
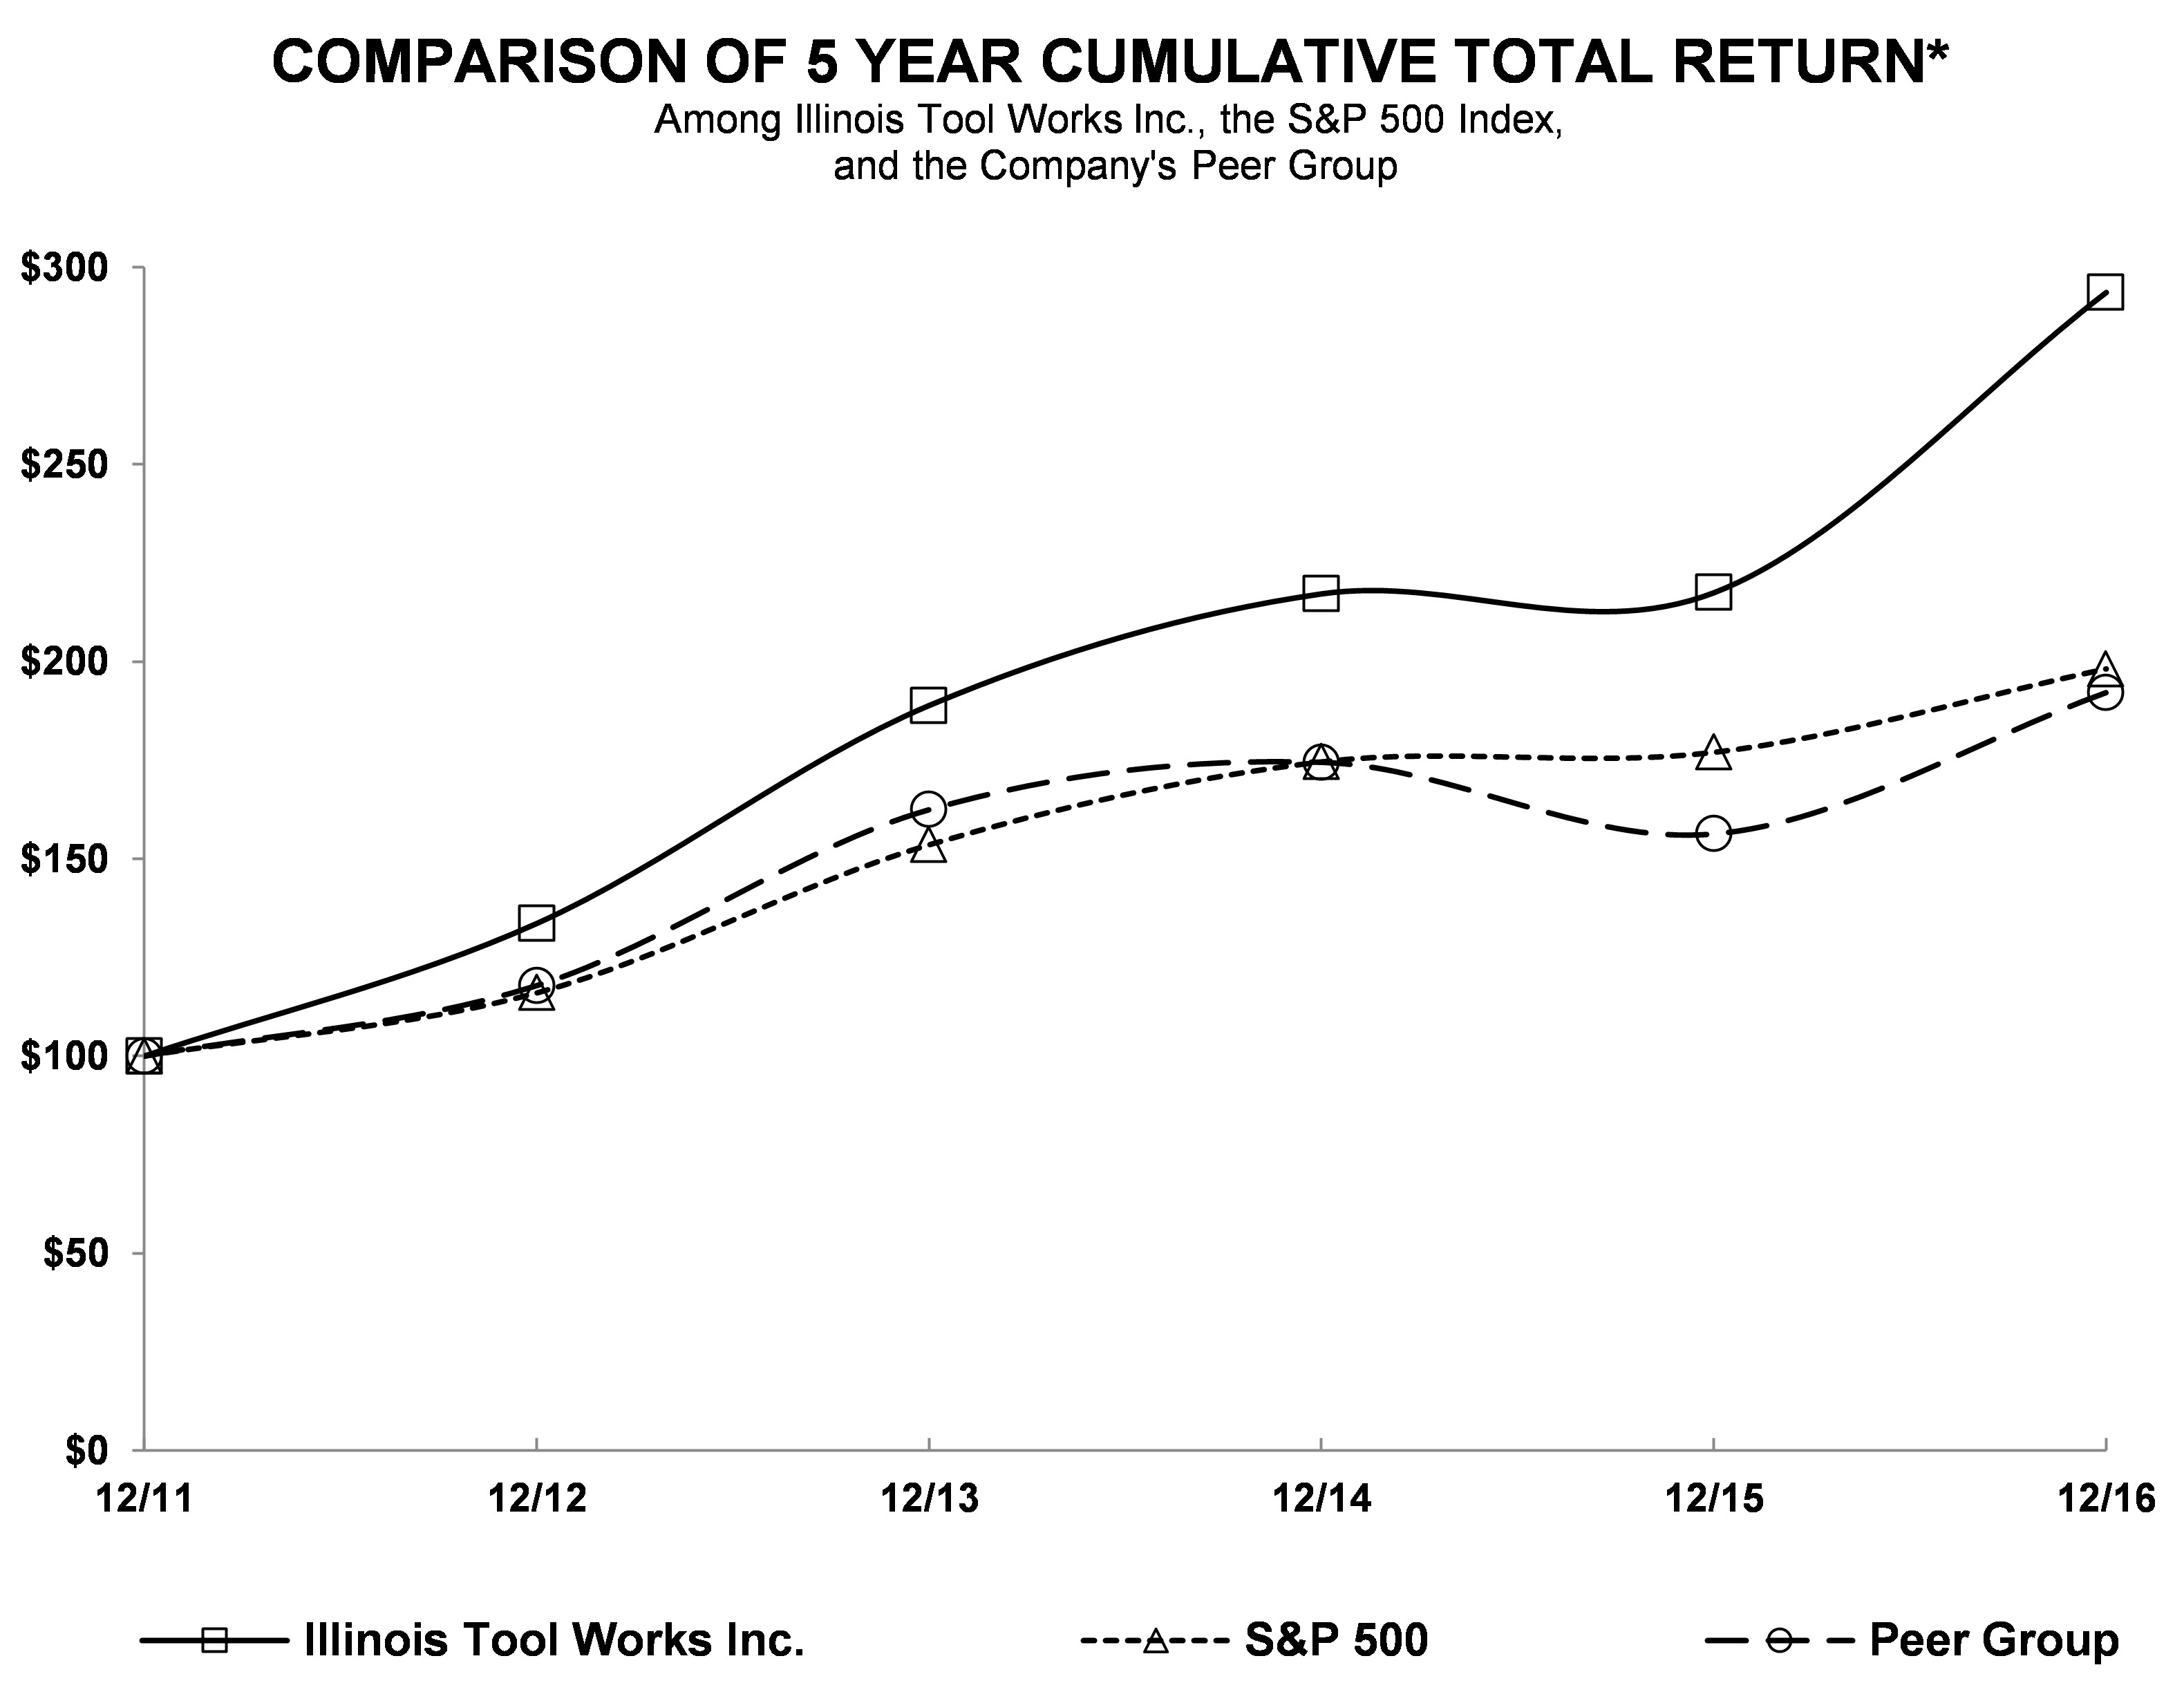
*Assumes $100 invested on 12/31/11 in stock or index, including reinvestment of dividends. Fiscal years ended December 31.
Copyright© 2017 S&P, a division of McGraw Hill Financial. All rights reserved.
16
The 2016 peer group consists of the following 18 public companies, consistent with the peer group included in the Company's Proxy statement:
|
3M Company
|
E.I. du Pont de Nemours and Company
|
Masco Corporation
|
|
BorgWarner Inc.
|
Eaton Corporation plc
|
Parker-Hannifin Corporation
|
|
Caterpillar Inc.
|
Emerson Electric Co.
|
PPG Industries, Inc.
|
|
Cummins Inc.
|
Honeywell International Inc.
|
Pentair plc
|
|
Deere & Company
|
Ingersoll-Rand plc
|
Stanley Black & Decker, Inc.
|
|
Dover Corporation
|
Johnson Controls, Inc.
|
Textron Inc.
|
Danaher Corporation was removed from the Company's peer group in 2016 due to the spin-off of Fortive Corporation.
Repurchases of Common Stock
— On February 13, 2015, the Company’s Board of Directors authorized a stock repurchase program which provides for the repurchase of up to
$6.0 billion
of the Company’s common stock over an open-ended period of time (the "2015 Program"). As of
December 31, 2016
, there were approximately $
3.4 billion
of authorized repurchases remaining under the 2015 Program. Share repurchase activity under the Company's share repurchase program for the fourth quarter of 2016 was as follows:
|
In millions except per share amounts
|
|||||||||||||
|
Period
|
Total Number of Shares Purchased
|
Average Price Paid Per Share
|
Total Number of Shares Purchased as Part of Publicly Announced Program
|
Maximum Value of Shares That May Yet Be Purchased Under Program
|
|||||||||
|
October 2016
|
2.8
|
|
$
|
114.89
|
|
2.8
|
|
$
|
3,622
|
|
|||
|
November 2016
|
1.1
|
|
$
|
120.25
|
|
1.1
|
|
$
|
3,498
|
|
|||
|
December 2016
|
0.4
|
|
$
|
126.26
|
|
0.4
|
|
$
|
3,446
|
|
|||
|
Total
|
4.3
|
|
4.3
|
|
|||||||||
ITEM 6.
Selected Financial Data
|
In millions except per share amounts
|
2016
|
2015
|
2014
|
2013
|
2012
|
||||||||||||||
|
Operating revenue
|
$
|
13,599
|
|
$
|
13,405
|
|
$
|
14,484
|
|
$
|
14,135
|
|
$
|
14,791
|
|
||||
|
Income from continuing operations
|
2,035
|
|
1,899
|
|
1,890
|
|
1,630
|
|
2,233
|
|
|||||||||
|
Income per share from continuing operations:
|
|||||||||||||||||||
|
Basic
|
5.73
|
|
5.16
|
|
4.70
|
|
3.65
|
|
4.75
|
|
|||||||||
|
Diluted
|
5.70
|
|
5.13
|
|
4.67
|
|
3.63
|
|
4.72
|
|
|||||||||
|
Total assets at year-end
|
15,201
|
|
15,729
|
|
17,465
|
|
19,599
|
|
19,138
|
|
|||||||||
|
Long-term debt at year-end
|
7,177
|
|
6,896
|
|
5,943
|
|
2,771
|
|
4,564
|
|
|||||||||
|
Cash dividends declared per common share
|
2.40
|
|
2.07
|
|
1.81
|
|
1.60
|
|
1.48
|
|
|||||||||
Certain reclassifications of prior year data have been made to conform to current year reporting, including discontinued operations and adoption of new accounting guidance as discussed below.
On October 31, 2012, the Company divested a 51% majority interest in its Decorative Surfaces segment. Accordingly, the Company ceased consolidating the results of the Decorative Surfaces segment as of October 31, 2012 and now reports its 49% ownership interest using the equity method of accounting. Due to the Company's continuing involvement through its 49% interest, the historical operating results of Decorative Surfaces are presented in continuing operations. Effective November 1, 2012, Decorative Surfaces was no longer a reportable segment of the Company.
17
In April 2014, the Financial Accounting Standards Board ("FASB") issued authoritative guidance to change the criteria for reporting discontinued operations. Under the new guidance, only disposals representing a strategic shift in a company's operations and financial results should be reported as discontinued operations. The Company adopted this new guidance effective January 1, 2015. The new guidance applies prospectively to new disposals and new classifications of disposal groups held for sale after such date. There were no discontinued operations during 2016 or 2015 under this new accounting guidance. For businesses reported as discontinued operations in the statement of income prior to adoption, all related prior period income statement information has been restated. Income from discontinued operations was $
1.1 billion
, $
49 million
, and $
637 million
in the years
2014
,
2013
, and
2012
, respectively. Refer to Note 2. Discontinued Operations in Item 8. Financial Statements and Supplementary Data for discussion of the Company's discontinued operations.
In April 2015, the FASB issued authoritative guidance to simplify the balance sheet presentation of long-term debt issuance costs. Under the new guidance, long-term debt issuance costs are presented as a reduction of the carrying amount of the related long-term debt. The Company early adopted this guidance in the fourth quarter of 2015 and restated $38 million, $22 million, and $26 million of deferred long-term debt issuance costs from Other assets to Long-term debt in the years
2014
,
2013
, and
2012
, respectively.
In November 2015, the FASB issued authoritative guidance to simplify the presentation of deferred taxes. Under the new guidance, all deferred tax assets and liabilities are presented as noncurrent in the statement of financial position. Early adoption of this guidance in the fourth quarter of 2015 decreased total assets by
$175 million
,
$345 million
, and
$145 million
in the years
2014
,
2013
, and
2012
, respectively.
Additional information on the comparability of results is included in Item 7. Management's Discussion and Analysis of Financial Condition and Results of Operations.
18
ITEM 7.
Management's Discussion and Analysis of Financial Condition and Results of Operations
INTRODUCTION
Illinois Tool Works Inc. (the "Company" or "ITW") is a global manufacturer of a diversified range of industrial products and equipment with
85
divisions in
57
countries. As of
December 31, 2016
, the Company employed approximately
50,000
persons.
The Company's operations are organized and managed based on similar product offerings and end markets, and are reported to senior management as the following seven segments: Automotive OEM; Food Equipment; Test & Measurement and Electronics; Welding; Polymers & Fluids; Construction Products; and Specialty Products.
Due to the large number of diverse businesses and the Company's decentralized operating structure, the Company does not require its businesses to provide detailed information on operating results. Instead, the Company's corporate management collects data on several key measurements: operating revenue, operating income, operating margin, overhead costs, number of months on hand in inventory, days sales outstanding in accounts receivable, past due receivables and return on invested capital. These key measures are monitored by management and significant changes in operating results versus current trends in end markets and variances from forecasts are discussed with operating unit management.
THE ITW BUSINESS MODEL
The powerful and highly differentiated ITW Business Model is the Company’s core source of value creation. This business model is the Company’s competitive advantage and defines how ITW creates value for its shareholders and comprises three unique elements:
|
•
|
ITW’s
80/20 management process
is the operating system that is applied in every ITW business. Initially introduced as a manufacturing efficiency tool in the 1980’s, ITW has continually refined, improved and expanded 80/20 into a proprietary, holistic business management process that generates significant value for the Company and its customers. Through the application of data-driven insights generated by 80/20 practice, ITW focuses on its largest and best opportunities (the “80”) and eliminates cost, complexity and distractions associated with the less profitable opportunities (the “20”). 80/20 enables ITW businesses to consistently achieve world-class operational excellence in product availability, quality, and innovation, while generating superior financial performance;
|
|
•
|
Customer-back innovation
has fueled decades of profitable growth at ITW. The Company’s unique innovation approach is built on insight gathered from the 80/20 management process. Working from the customer back, ITW businesses position themselves as the go-to problem solver for their “80” customers. ITW’s innovation efforts are focused on understanding customer needs, particularly those in “80” markets with solid long-term growth fundamentals, and subsequently creating unique solutions to address those needs. These customer insights and learnings drive innovation at ITW and have contributed to a portfolio of more than 17,000 granted and pending patents;
|
|
•
|
ITW’s
decentralized, entrepreneurial culture
allows ITW businesses to be fast, focused, and responsive. ITW businesses have significant flexibility within the framework of the ITW Business Model to customize their approach in order to best serve their specific customers' needs. ITW colleagues recognize their unique responsibilities to execute the Company's strategy and values. As a result, the Company maintains a focused and simple organizational structure that, combined with outstanding execution, delivers best-in-class services adapted to each business' customers and end markets.
|
ENTERPRISE STRATEGY
In late 2012, ITW began the process of transitioning the Company onto its current strategic path to fully leverage the compelling performance potential of the ITW Business Model. Since then, ITW has made considerable progress, as evidenced by the Company’s strong financial performance over the past four years.
The roots of ITW’s Enterprise Strategy began in late 2011 / early 2012, when the Company undertook a complete review of its performance. Focusing on its businesses delivering consistent above-market growth with best-in-class margins and returns, ITW developed a strategy to replicate that performance across its operations.
19
Based on this rigorous evaluation, ITW determined that solid and consistent above-market organic growth must be the core growth engine to deliver world-class financial performance and compelling long-term returns for its shareholders. To shift its primary growth engine to organic, the Company began executing a multi-step approach.
|
•
|
The first step was to narrow the focus and improve the quality of ITW’s business portfolio. As part of the
Portfolio Management
initiative, ITW exited businesses that were operating in commoditized market spaces and prioritized sustainable differentiation as a must-have requirement for all ITW businesses. This process included both divesting entire businesses and exiting commoditized product lines and customers inside otherwise highly differentiated ITW divisions.
|
As a result of this work, ITW’s business portfolio now has significantly higher organic growth potential. ITW segments and divisions now possess attractive and differentiated product lines and end markets as they continue to improve operating margins and generate price/cost increases. The Company achieved this through product line simplification, or eliminating the complexity and overhead costs associated with smaller product lines and customers, while supporting and growing the businesses’ largest / most profitable customers and product lines. With the initiative nearly complete and ITW businesses demonstrating notably improved financial performance, the Company believes that the significant product line simplification work is essentially finalized and will return to more normalized levels in 2017 and beyond.
|
•
|
Step two,
Business Structure Simplification
, was implemented to simplify and scale-up ITW’s operating structure to support increased engineering, marketing, and sales resources, and, at the same time, improve global reach and competitiveness, all of which were critical to driving accelerated organic growth. ITW now has
85
scaled-up divisions with significantly enhanced focus on growth investments, core customers and products, and customer-back innovation.
|
|
•
|
The
Strategic Sourcing
initiative was established as a core capability to better leverage ITW’s scale and improve global competitiveness. Sourcing is now a core strategic and operational capability at ITW. The Company’s 80/20-enabled sourcing organization has delivered an average of one percent reduction in spend each year from 2013 through 2016 and is on track to do the same in 2017 and 2018.
|
|
•
|
With the portfolio realignment and scale-up work largely complete, the Company was able to
shift its focus to preparing for and accelerating, organic growth
. As a preparatory step, ITW is in the process of reapplying 80/20 to optimize its newly scaled-up divisions for growth, first, to build a foundation of operational excellence, and second, to identify the best opportunities to drive organic growth.
|
Once the business has achieved operational excellence and identified the right growth opportunities, the final step is to accelerate organic growth. The process of preparing for accelerated organic growth generally takes 18 to 24 months.
Based on the financial performance of the divisions that are further along in this process, the Company believes that its organic growth framework is capable of delivering above-market organic growth across all segments. Divisions are at various phases in preparation for growth and many are either ready to grow or already growing above their respective markets. ITW management is fully aligned with this plan and very focused on executing it. With the close of 2016, approximately 85 percent of the divisions are ready to grow.
PATH TO FULL POTENTIAL
While the Company has made considerable progress and ITW’s performance is nearing best-in-class levels, the Company has significant opportunity for further improvement before it achieves full operating potential. In order to do so, ITW is focused on two key areas of opportunity, including: additional structural margin improvement and sustained above-market organic growth with strong incremental profitability.
Additional Structural Margin Improvement
To deliver on the additional structural margin improvement, the Company is implementing the following two levers: (1) further leveraging the 80/20 management process and (2) strategic sourcing.
|
•
|
The first lever, better leveraging the full power of the ITW Business Model, will be accomplished through a much more consistent and focused approach to 80/20 best practice implementation across the Company. The 80/20
|
20
management system has continuously been refined, improved and expanded into a unique holistic business management process of interconnected tools, which improves all aspects of the business and, when applied consistently and executed more effectively, will lead to additional margin improvement. ITW has clearly demonstrated superior 80/20 management, resulting in meaningful incremental improvement in margins and returns as evidenced by the Company’s operating margin and after-tax return on invested capital. These 80/20 initiatives can also result in restructuring initiatives that reduce costs and improve profitability and returns.
|
•
|
The second lever, strategic sourcing, is a core element of ITW’s ongoing operational strategy and a sustainable enterprise-wide capability. Through the continued execution of this initiative, the Company expects to deliver additional margin improvement with the goal of a one percent reduction in spend in 2017 and 2018.
|
Sustained Above-Market Organic Growth with Strong Incremental Profitability
ITW has done extensive work on its portfolio and operating structure to position the Company to deliver sustainable above-market organic growth. The Company has narrowed the focus and significantly improved the growth potential of ITW’s business portfolio. With approximately 85% of its divisions ready to grow as of the end of 2016, ITW is well positioned for accelerated growth in 2017 and beyond. To deliver on this accelerated growth, the divisions have been implementing the organic growth framework, which includes continued investment in customer-back innovation and a strengthened focus on market penetration. ITW continues to focus on growing its share of "80" products with existing customers with whom the Company has a resonant value proposition as well as target potential new customers with similar pain points to existing customers. ITW has made strong progress on the Company’s pivot to organic growth and is well positioned to deliver on sustained above-market organic growth over the long-term.
TERMS USED BY ITW
Management uses the following terms to describe the financial results of operations of the Company:
|
•
|
Organic business
- acquired businesses that have been included in the Company's results of operations for more than 12 months on a constant currency basis.
|
|
•
|
Operating leverage
- the estimated effect of the organic revenue volume changes on organic operating income, assuming variable margins remain the same as the prior period.
|
|
•
|
Price/cost
-
represents the estimated net impact of increases or decreases in the cost of materials used in the Company's products versus changes in the selling price to the Company's customers.
|
|
•
|
Product line simplification (PLS)
- focuses businesses on eliminating the complexity and overhead costs associated with smaller product lines and customers, and focuses businesses on supporting and growing their largest customers and product lines; in the short-term, PLS may result in a decrease in revenue and overhead costs while improving operating margin. In the long-term, PLS is expected to result in growth in revenue, profitability, and returns.
|
Unless otherwise stated, the changes in financial results in the consolidated results of operations and the results of operations by segment represent the current year period versus the comparable period in the prior year.
CONSOLIDATED RESULTS OF OPERATIONS
Leveraging ITW's highly differentiated and proprietary business model, the Company delivered strong financial results in 2016 despite a challenging global macro environment and foreign currency translation headwinds. With the solid execution of the Company's Enterprise Strategy initiatives, six of seven segments achieved worldwide organic revenue growth and five of seven segments had operating margin expansion.
On July 1, 2016, the Company completed the acquisition of the Engineered Fasteners and Components business ("EF&C") from ZF TRW for a purchase price of approximately
$450 million
. EF&C had operating revenue of $245 million for the six months ended December 31, 2016. EF&C diluted the Company's operating margin in 2016 by 30 basis points due to lower operating margin and acquisition related expenses. The Company expects EF&C to be slightly accretive to earnings in the first twelve months, but expects improved earnings and operating margin performance in later years through the application of the Company's 80/20 business management process. The operating results of EF&C are reported within the Company's Automotive OEM segment. The acquisition of EF&C did not materially affect the Company's results of operations or financial position for any period presented. Refer to Note 3. Acquisitions in Item 8. Financial Statements and Supplementary Data for further information.
21
The Company’s consolidated results of operations for
2016
,
2015
and
2014
are summarized as follows:
2016 compared to 2015
|
For the Years Ended
|
|||||||||||||||||||||
|
Dollars in millions
|
December 31,
|
Components of Increase (Decrease)
|
|||||||||||||||||||
|
2016
|
2015
|
Inc (Dec)
|
Organic
|
Acquisition/Divestiture
|
Restructuring
|
Foreign Currency
|
Total
|
||||||||||||||
|
Operating revenue
|
$
|
13,599
|
|
$
|
13,405
|
|
1.4
|
%
|
1.2
|
%
|
1.7
|
%
|
—
|
%
|
(1.5
|
)%
|
1.4
|
%
|
|||
|
Operating income
|
3,064
|
|
2,867
|
|
6.9
|
%
|
8.1
|
%
|
0.6
|
%
|
0.1
|
%
|
(1.9
|
)%
|
6.9
|
%
|
|||||
|
Operating margin %
|
22.5
|
%
|
21.4
|
%
|
110 bps
|
|
140 bps
|
|
(30) bps
|
|
10 bps
|
|
(10) bps
|
|
110 bps
|
|
|||||
|
•
|
Operating revenue increased due to growth in organic and acquisition revenues, partially offset by the unfavorable effect of foreign currency translation.
|
|
•
|
Organic revenue grew 1.2% as six of seven segments had worldwide organic revenue growth primarily due to penetration gains, higher end market demand and product innovation. Organic revenue declined in the Welding segment primarily due to lower capital spending in the industrial end markets and sluggish demand in the oil and gas end market.
|
|
◦
|
PLS activities associated with the portfolio management component of the Company's Enterprise Strategy reduced organic revenue growth by approximately one percentage point.
|
|
◦
|
North American organic revenue increased 0.7% and European organic revenue increased 2.3% as growth in six segments for both regions was partially offset by a decline in the Welding segment.
|
|
◦
|
Asia Pacific organic revenue increased 2.7% primarily due to growth in the Automotive OEM, Specialty Products, Construction Products, Food Equipment, and Test & Measurement and Electronics segments, partially offset by a decline in the Welding and Polymers & Fluids segments.
|
|
•
|
Operating margin of 22.5% increased 110 basis points. The primary driver of the operating margin improvement was 130 basis points from the benefit of the Company's enterprise initiatives. Positive operating leverage of 30 basis points and favorable price/cost of 10 basis points were partially offset by the dilutive impact of 30 basis points from the EF&C acquisition and additional investment in the business.
|
|
•
|
In 2016, the Company received a
$167 million
cash dividend distribution from Wilsonart which exceeded the Company’s equity investment balance and resulted in a
$54 million
pre-tax gain, partially offset by $30 million of pre-tax losses related to the disposals of businesses and the disposal of a partnership investment. Refer to Note 4. Other Income (Expense) in Item 8. Financial Statements and Supplementary Data for further information on the Wilsonart equity investment.
|
|
•
|
Diluted earnings per share (EPS) of $5.70 increased 11.1%.
|
|
•
|
Free cash flow was $2.0 billion in 2016. Refer to the Cash Flow section of Liquidity and Capital Resources for a reconciliation of this non-GAAP measure.
|
|
•
|
The Company repurchased approximately 18.7 million shares of its common stock in 2016 for approximately $2.0 billion.
|
|
•
|
Total cash dividends of $821 million were paid in 2016.
|
|
•
|
Adjusted after-tax return on average invested capital was 22.1%, an increase of 170 basis points. Refer to the Adjusted After-Tax Return on Average Invested Capital section of Liquidity and Capital Resources for a reconciliation of this non-GAAP measure.
|
2015 compared to 2014
|
For the Years Ended
|
|||||||||||||||||||||
|
Dollars in millions
|
December 31,
|
Components of Increase (Decrease)
|
|||||||||||||||||||
|
2015
|
2014
|
Inc (Dec)
|
Organic
|
Acquisition/Divestiture
|
Restructuring
|
Foreign Currency
|
Total
|
||||||||||||||
|
Operating revenue
|
$
|
13,405
|
|
$
|
14,484
|
|
(7.4
|
)%
|
(0.4
|
)%
|
(0.2
|
)%
|
—
|
%
|
(6.8
|
)%
|
(7.4
|
)%
|
|||
|
Operating income
|
$
|
2,867
|
|
$
|
2,888
|
|
(0.7
|
)%
|
5.8
|
%
|
(0.3
|
)%
|
1.2
|
%
|
(7.4
|
)%
|
(0.7
|
)%
|
|||
|
Operating margin %
|
21.4
|
%
|
19.9
|
%
|
150 bps
|
|
130 bps
|
|
—
|
|
20 bps
|
|
—
|
|
150 bps
|
|
|||||
22
|
•
|
Operating revenue decreased 7.4% primarily due to the unfavorable effect of foreign currency translation as the U.S. Dollar strengthened against most major currencies.
|
|
•
|
Organic revenue decreased 0.4% in 2015 as compared to the prior year.
|
|
◦
|
Automotive OEM, Food Equipment and Construction Products had solid organic revenue growth primarily due to penetration gains, higher market demand and product innovation. Organic revenue declined in the Welding and Test & Measurement and Electronics segments primarily due to lower demand in the oil and gas end markets and a challenging capital spending environment.
|
|
◦
|
PLS activities reduced organic revenue growth by approximately one percentage point.
|
|
◦
|
North American organic revenue decreased 0.5% as a decline in the Welding and Test & Measurement and Electronics segments was partially offset by growth in the Automotive OEM, Food Equipment and Construction Products segments.
|
|
◦
|
European organic revenue increased 1.2%. Double-digit growth in the Automotive OEM segment was partially offset by a decline in the Polymers & Fluids, Test & Measurement and Electronics and Welding segments.
|
|
◦
|
Asia Pacific organic revenue decreased 1.4% primarily due to a decline in the Welding and Test & Measurement and Electronics segments, partially offset by growth in the Construction Products segment.
|
|
•
|
Operating income of $2.9 billion decreased 0.7%. Excluding the negative impact from foreign currency translation of 7.4%, operating income would have increased 6.7%.
|
|
•
|
Operating margin of 21.4% increased 150 basis points primarily due to the benefit of the Company's enterprise initiatives related to business structure simplification and strategic sourcing that contributed 110 basis points. Lower restructuring expenses and favorable price/cost each contributed 20 basis points of operating margin expansion.
|
|
•
|
Diluted earnings per share (EPS) from continuing operations of $5.13 increased 9.9%. Excluding the negative impact from foreign currency of approximately $0.41 per diluted share, EPS would have increased 18.6%.
|
|
•
|
Free cash flow was $2.0 billion in 2015. Refer to the Cash Flow section of Liquidity and Capital Resources for a reconciliation of this non-GAAP measure.
|
|
•
|
The Company repurchased approximately 21.0 million shares of its common stock in 2015 for approximately $2.0 billion.
|
|
•
|
Total cash dividends of $742 million were paid in 2015.
|
|
•
|
Adjusted after-tax return on average invested capital was 20.4%, an increase of 140 basis points. Refer to the Adjusted After-Tax Return on Average Invested Capital section of Liquidity and Capital Resources for a reconciliation of this non-GAAP measure.
|
RESULTS OF OPERATIONS BY SEGMENT
The reconciliation of segment operating revenue and operating income to total operating revenue and operating income is as follows:
|
Operating Revenue
|
|||||||||||
|
In millions
|
2016
|
2015
|
2014
|
||||||||
|
Automotive OEM
|
$
|
2,864
|
|
$
|
2,529
|
|
$
|
2,590
|
|
||
|
Food Equipment
|
2,110
|
|
2,096
|
|
2,177
|
|
|||||
|
Test & Measurement and Electronics
|
1,974
|
|
1,969
|
|
2,204
|
|
|||||
|
Welding
|
1,486
|
|
1,650
|
|
1,850
|
|
|||||
|
Polymers & Fluids
|
1,691
|
|
1,712
|
|
1,927
|
|
|||||
|
Construction Products
|
1,609
|
|
1,587
|
|
1,707
|
|
|||||
|
Specialty Products
|
1,885
|
|
1,885
|
|
2,055
|
|
|||||
|
Intersegment revenue
|
(20
|
)
|
(23
|
)
|
(26
|
)
|
|||||
|
Total
|
$
|
13,599
|
|
$
|
13,405
|
|
$
|
14,484
|
|
||
23
|
Operating Income
|
|||||||||||
|
In millions
|
2016
|
2015
|
2014
|
||||||||
|
Automotive OEM
|
$
|
690
|
|
$
|
613
|
|
$
|
600
|
|
||
|
Food Equipment
|
537
|
|
498
|
|
453
|
|
|||||
|
Test & Measurement and Electronics
|
372
|
|
322
|
|
340
|
|
|||||
|
Welding
|
370
|
|
415
|
|
479
|
|
|||||
|
Polymers & Fluids
|
343
|
|
335
|
|
357
|
|
|||||
|
Construction Products
|
361
|
|
316
|
|
289
|
|
|||||
|
Specialty Products
|
482
|
|
439
|
|
440
|
|
|||||
|
Total Segments
|
3,155
|
|
2,938
|
|
2,958
|
|
|||||
|
Unallocated
|
(91
|
)
|
(71
|
)
|
(70
|
)
|
|||||
|
Total
|
$
|
3,064
|
|
$
|
2,867
|
|
$
|
2,888
|
|
||
Segments are allocated a fixed overhead charge based on the segment's revenue. Expenses not charged to the segments are reported separately as Unallocated. Because the Unallocated category includes a variety of items, it is subject to fluctuations on a quarterly and annual basis.
AUTOMOTIVE OEM
This segment is a global, niche supplier to top tier OEMs, providing unique innovation to address pain points for sophisticated customers with complex problems. Businesses in this segment produce components and fasteners for automotive-related applications. This segment primarily serves the automotive original equipment manufacturers and tiers market. Products in this segment include:
|
•
|
plastic and metal components, fasteners and assemblies for automobiles, light trucks and other industrial uses.
|
The results of operations for the Automotive OEM segment for
2016
,
2015
and
2014
were as follows:
2016 compared to 2015
|
For the Years Ended
|
|||||||||||||||||||||
|
Dollars in millions
|
December 31,
|
Components of Increase (Decrease)
|
|||||||||||||||||||
|
2016
|
2015
|
Inc (Dec)
|
Organic
|
Acquisition/Divestiture
|
Restructuring
|
Foreign Currency
|
Total
|
||||||||||||||
|
Operating revenue
|
$
|
2,864
|
|
$
|
2,529
|
|
13.3
|
%
|
5.1
|
%
|
9.7
|
%
|
—
|
%
|
(1.5
|
)%
|
13.3
|
%
|
|||
|
Operating income
|
$
|
690
|
|
$
|
613
|
|
12.6
|
%
|
10.7
|
%
|
2.6
|
%
|
0.7
|
%
|
(1.4
|
)%
|
12.6
|
%
|
|||
|
Operating margin %
|
24.1
|
%
|
24.2
|
%
|
(10) bps
|
|
130 bps
|
|
(160) bps
|
|
20 bps
|
|
—
|
|
(10) bps
|
|
|||||
|
•
|
Operating revenue increased due to the EF&C acquisition and higher organic revenue, partially offset by the unfavorable effect of foreign currency translation.
|
|
•
|
Organic revenue grew 5.1%.
|
|
◦
|
North American organic revenue grew 3.4% versus total North American auto build growth of 2%. Auto build growth for the Detroit 3, where the Company has higher content, declined 1%.
|
|
◦
|
European organic revenue growth of 6.0% exceeded European auto builds which grew 3%.
|
|
◦
|
Asia Pacific organic revenue increased 10.9% driven by product penetration gains in China due to new product launches in 2016. China organic revenue growth of 22.7% exceeded Chinese auto build growth of 14%. Auto builds of foreign automotive manufacturers in China, where the Company has higher content, grew 11%.
|
|
•
|
On July 1, 2016, the Company completed the acquisition of the EF&C business from ZF TRW. EF&C had operating revenue of $245 million for the six months ended December 31, 2016, and increased Automotive OEM operating revenue by 9.7%.
|
|
•
|
Operating margin of 24.1% decreased 10 basis points due to the dilutive impact of 160 basis points from the EF&C acquisition and unfavorable price/cost of 40 basis points, partially offset by positive operating leverage of 80 basis
|
24
points, the net benefits from the Company's enterprise initiatives and cost management of 90 basis points and lower restructuring expenses.
2015 compared to 2014
|
For the Years Ended
|
|||||||||||||||||||||
|
Dollars in millions
|
December 31,
|
Components of Increase (Decrease)
|
|||||||||||||||||||
|
2015
|
2014
|
Inc (Dec)
|
Organic
|
Acquisition/Divestiture
|
Restructuring
|
Foreign Currency
|
Total
|
||||||||||||||
|
Operating revenue
|
$
|
2,529
|
|
$
|
2,590
|
|
(2.4
|
)%
|
5.8
|
%
|
(0.2
|
)%
|
—
|
%
|
(8.0
|
)%
|
(2.4
|
)%
|
|||
|
Operating income
|
$
|
613
|
|
$
|
600
|
|
2.1
|
%
|
10.4
|
%
|
(0.1
|
)%
|
(0.3
|
)%
|
(7.9
|
)%
|
2.1
|
%
|
|||
|
Operating margin %
|
24.2
|
%
|
23.2
|
%
|
100 bps
|
|
100 bps
|
|
10 bps
|
|
(10) bps
|
|
—
|
|
100 bps
|
|
|||||
|
•
|
Operating revenue decreased primarily due to the unfavorable effect of foreign currency translation, partially offset by organic revenue growth.
|
|
•
|
Organic revenue grew 5.8% as a result of product innovation and penetration gains, exceeding worldwide auto build growth of 1%.
|
|
◦
|
European organic revenue growth of 11.1% exceeded auto builds which grew 4%.
|
|
◦
|
North American organic revenue growth of 4.2% exceeded auto build growth of 3%.
|
|
◦
|
Asia Pacific organic revenue increased 0.5%. China organic revenue grew 7.9%, as Chinese auto builds increased 4%. Auto builds of foreign automotive manufacturers in China, where the Company has higher content, were flat for 2015.
|
|
•
|
Operating income of $613 million increased 2.1%. Excluding the negative impact of foreign currency translation of 7.9%, operating income would have increased 10.0%.
|
|
•
|
Operating margin was 24.2%. The increase of 100 basis points was primarily driven by 80 basis points of operating leverage, the net benefits from the Company's enterprise initiatives and favorable price/cost of 10 basis points.
|
FOOD EQUIPMENT
This segment is a highly focused and branded industry-leader in commercial food equipment differentiated by innovation and integrated service offerings. This segment primarily serves the food institutional/restaurant, food service and food retail markets. Products in this segment include:
|
•
|
warewashing equipment;
|
|
•
|
cooking equipment, including ovens, ranges and broilers;
|
|
•
|
refrigeration equipment, including refrigerators, freezers and prep tables;
|
|
•
|
food processing equipment, including slicers, mixers and scales;
|
|
•
|
kitchen exhaust, ventilation and pollution control systems; and
|
|
•
|
food equipment service, maintenance and repair.
|
The results of operations for the Food Equipment segment for
2016
,
2015
and
2014
were as follows:
2016 compared to 2015
|
For the Years Ended
|
|||||||||||||||||||||
|
Dollars in millions
|
December 31,
|
Components of Increase (Decrease)
|
|||||||||||||||||||
|
2016
|
2015
|
Inc (Dec)
|
Organic
|
Acquisition/Divestiture
|
Restructuring
|
Foreign Currency
|
Total
|
||||||||||||||
|
Operating revenue
|
$
|
2,110
|
|
$
|
2,096
|
|
0.7
|
%
|
2.8
|
%
|
—
|
%
|
—
|
%
|
(2.1
|
)%
|
0.7
|
%
|
|||
|
Operating income
|
$
|
537
|
|
$
|
498
|
|
7.8
|
%
|
8.7
|
%
|
—
|
%
|
1.1
|
%
|
(2.0
|
)%
|
7.8
|
%
|
|||
|
Operating margin %
|
25.4
|
%
|
23.7
|
%
|
170 bps
|
|
140 bps
|
|
—
|
|
30 bps
|
|
—
|
|
170 bps
|
|
|||||
|
•
|
Operating revenue increased due to organic revenue growth, partially offset by the unfavorable effect of foreign currency translation.
|
|
•
|
Organic revenue increased 2.8% as equipment and service organic revenue grew 3.9% and 0.8%, respectively.
|
25
|
◦
|
North American organic revenue increased 4.3%. North American equipment revenue increased 6.6% primarily due to strong end market demand in the retail, refrigeration, warewash and cooking businesses. Service revenue in North America increased 0.8%.
|
|
◦
|
International organic revenue grew 0.8%. International equipment organic revenue increased 0.8% primarily due to growth in Europe and Asia. International service organic revenue grew 0.9%.
|
|
•
|
Operating margin of 25.4% increased 170 basis points driven by positive operating leverage of 60 basis points, the net benefits of the Company's enterprise initiatives and cost management of 40 basis points, favorable price/cost of 40 basis points and lower restructuring expenses.
|
2015 compared to 2014
|
For the Years Ended
|
|||||||||||||||||||||
|
Dollars in millions
|
December 31,
|
Components of Increase (Decrease)
|
|||||||||||||||||||
|
2015
|
2014
|
Inc (Dec)
|
Organic
|
Acquisition/Divestiture
|
Restructuring
|
Foreign Currency
|
Total
|
||||||||||||||
|
Operating revenue
|
$
|
2,096
|
|
$
|
2,177
|
|
(3.7
|
)%
|
3.4
|
%
|
—
|
%
|
—
|
%
|
(7.1
|
)%
|
(3.7
|
)%
|
|||
|
Operating income
|
$
|
498
|
|
$
|
453
|
|
9.8
|
%
|
17.7
|
%
|
—
|
%
|
(0.3
|
)%
|
(7.6
|
)%
|
9.8
|
%
|
|||
|
Operating margin %
|
23.7
|
%
|
20.8
|
%
|
290 bps
|
|
290 bps
|
|
—
|
|
—
|
|
—
|
|
290 bps
|
|
|||||
|
•
|
Operating revenue decreased 3.7% due to the unfavorable effect of foreign currency translation, partially offset by organic revenue growth.
|
|
•
|
Organic revenue increased 3.4% in 2015.
|
|
◦
|
North American organic revenue increased 5.6%. North American equipment revenue increased 6.6% primarily due to product innovation and improved market penetration in the warewash and refrigeration businesses. Service revenue in North America increased 4.1%.
|
|
◦
|
International organic revenue increased 1.0%. International equipment organic revenue increased 0.9% primarily due to growth in the refrigeration business, partially offset by difficult year-over-year comparisons in the cooking and retail businesses. International service organic revenue increased 1.3%.
|
|
•
|
Operating margin was 23.7%. The 290 basis point improvement was primarily driven by the benefits of the Company's enterprise initiatives, partially offset by additional investment in the business that contributed 160 basis points, positive operating leverage of 80 basis points and favorable price/cost of 30 basis points.
|
TEST & MEASUREMENT AND ELECTRONICS
This segment is a branded and innovative producer of test and measurement and electronic manufacturing and maintenance, repair, and operations, or "MRO" solutions that improve efficiency and quality for customers in diverse end markets. Businesses in this segment produce equipment, consumables, and related software for testing and measuring physical properties of materials and structures, as well as equipment and consumables used in the production of electronic subassemblies and microelectronics. This segment primarily serves the electronics, general industrial, industrial capital goods, automotive original equipment manufacturers and tiers, and consumer durables markets. Products in this segment include:
|
•
|
equipment, consumables, and related software for testing and measuring of materials, structures, gases and fluids;
|
|
•
|
electronic assembly equipment and related consumable solder materials;
|
|
•
|
electronic components and component packaging;
|
|
•
|
static control equipment and consumables used for contamination control in clean room environments; and
|
|
•
|
pressure sensitive adhesives and components for telecommunications, electronics, medical and transportation applications.
|
26
The results of operations for the Test & Measurement and Electronics segment for
2016
,
2015
and
2014
were as follows:
2016 compared to 2015
|
For the Years Ended
|
|||||||||||||||||||||||
|
Dollars in millions
|
December 31,
|
Components of Increase (Decrease)
|
|||||||||||||||||||||
|
2016
|
2015
|
Inc (Dec)
|
Organic
|
Acq/Div
|
Restructuring
|
Impairment
|
Foreign Currency
|
Total
|
|||||||||||||||
|
Operating revenue
|
$
|
1,974
|
|
$
|
1,969
|
|
0.3
|
%
|
1.8
|
%
|
—
|
%
|
—
|
%
|
—
|
%
|
(1.5
|
)%
|
0.3
|
%
|
|||
|
Operating income
|
$
|
372
|
|
$
|
322
|
|
15.6
|
%
|
17.4
|
%
|
—
|
%
|
0.4
|
%
|
—
|
%
|
(2.2
|
)%
|
15.6
|
%
|
|||
|
Operating margin %
|
18.9
|
%
|
16.3
|
%
|
260 bps
|
|
250 bps
|
|
—
|
|
10 bps
|
|
—
|
|
—
|
|
260 bps
|
|
|||||
|
•
|
Operating revenue increased due to organic revenue growth, partially offset by the unfavorable effect of foreign currency translation.
|
|
•
|
Organic revenue increased 1.8%.
|
|
◦
|
Electronics organic revenue increased 4.9%. Organic revenue grew 11.6% in the electronics assembly businesses primarily driven by higher demand from electronics equipment manufacturers and by the solar and semi-conductor end markets. Other electronics businesses grew 0.5% primarily due to strength in Europe, partially offset by PLS activities in Asia Pacific.
|
|
◦
|
Organic revenue for the test and measurement businesses decreased 0.9% primarily due to the impact of a weak capital spending environment in North America and Europe and continued softness in the oil and gas related end markets.
|
|
•
|
Operating margin of 18.9% increased 260 basis points primarily driven by the net benefits resulting from the Company's enterprise initiatives and cost management of 170 basis points, positive operating leverage of 60 basis points and favorable price/cost of 20 basis points.
|
2015 compared to 2014
|
For the Years Ended
|
|||||||||||||||||||||||
|
Dollars in millions
|
December 31,
|
Components of Increase (Decrease)
|
|||||||||||||||||||||
|
2015
|
2014
|
Inc (Dec)
|
Organic
|
Acq/Div
|
Restructuring
|
Impairment
|
Foreign Currency
|
Total
|
|||||||||||||||
|
Operating revenue
|
$
|
1,969
|
|
$
|
2,204
|
|
(10.7
|
)%
|
(5.2
|
)%
|
—
|
%
|
—
|
%
|
—
|
%
|
(5.5
|
)%
|
(10.7
|
)%
|
|||
|
Operating income
|
$
|
322
|
|
$
|
340
|
|
(5.1
|
)%
|
(2.5
|
)%
|
—
|
%
|
3.1
|
%
|
0.5
|
%
|
(6.2
|
)%
|
(5.1
|
)%
|
|||
|
Operating margin %
|
16.3
|
%
|
15.4
|
%
|
90 bps
|
|
40 bps
|
|
—
|
|
40 bps
|
|
10 bps
|
|
—
|
|
90 bps
|
|
|||||
|
•
|
Operating revenue decreased 10.7% due to the unfavorable effect of foreign currency translation and the decrease in organic revenue.
|
|
•
|
Organic revenue decreased 5.2% in 2015.
|
|
◦
|
Organic revenue for the test and measurement businesses decreased 5.9% primarily due to the impact of a weak capital spending environment in North America and Europe.
|
|
◦
|
Electronics organic revenue declined 4.3% primarily due to the decrease in the electronics assembly businesses across all major regions. Organic revenue for the other electronics businesses increased 0.3% primarily driven by the contamination and static control businesses.
|
|
•
|
Operating income of $322 million decreased 5.1%. Excluding the negative impact of foreign currency translation of 6.2%, operating income would have increased 1.1%.
|
|
•
|
Operating margin was 16.3%. The increase of 90 basis points was primarily driven by the net benefits resulting from the Company's enterprise initiatives and cost management of 190 basis points, lower restructuring expenses, and favorable price/cost of 20 basis points, partially offset by negative operating leverage of 170 basis points.
|
WELDING
This segment is a branded value-added equipment and specialty consumable manufacturer with innovative and leading technology. Businesses in this segment produce arc welding equipment, consumables and accessories for a wide array of industrial and commercial applications. This segment primarily serves the general industrial market, which includes fabrication, shipbuilding and
27
other general industrial markets, and energy, construction, MRO, and industrial capital goods markets. Products in this segment include:
|
•
|
arc welding equipment;
|
|
•
|
metal arc welding consumables and related accessories; and
|
|
•
|
metal jacketing and other insulation products.
|
The results of operations for the Welding segment for
2016
,
2015
and
2014
were as follows:
2016 compared to 2015
|
For the Years Ended
|
|||||||||||||||||||||
|
Dollars in millions
|
December 31,
|
Components of Increase (Decrease)
|
|||||||||||||||||||
|
2016
|
2015
|
Inc (Dec)
|
Organic
|
Restructuring
|
Impairment
|
Foreign Currency
|
Total
|
||||||||||||||
|
Operating revenue
|
$
|
1,486
|
|
$
|
1,650
|
|
(10.0
|
)%
|
(9.1
|
)%
|
—
|
%
|
—
|
%
|
(0.9
|
)%
|
(10.0
|
)%
|
|||
|
Operating income
|
$
|
370
|
|
$
|
415
|
|
(10.8
|
)%
|
(8.0
|
)%
|
(1.4
|
)%
|
(0.7
|
)%
|
(0.7
|
)%
|
(10.8
|
)%
|
|||
|
Operating margin %
|
24.9
|
%
|
25.2
|
%
|
(30) bps
|
|
20 bps
|
|
(30) bps
|
|
(20) bps
|
|
—
|
|
(30) bps
|
|
|||||
|
•
|
Operating revenue decreased due to the decline in organic revenue and the unfavorable effect of foreign currency translation.
|
|
•
|
Organic revenue decreased 9.1% due to lower demand in the oil and gas and industrial end markets and the impact of a soft capital spending environment. Organic revenue declined 10% and 8% for equipment and consumables, respectively.
|
|
◦
|
North American organic revenue declined 8.0% driven by decreases across the oil and gas end markets and industrial end markets primarily related to heavy equipment for agriculture, infrastructure and mining.
|
|
◦
|
International organic revenue decreased 12.9% primarily due to weak oil and gas end markets in Europe and Asia Pacific.
|
|
•
|
Operating margin of 24.9% declined 30 basis points due to negative operating leverage of 190 basis points, higher restructuring expenses, the unfavorable impact of intangible asset impairment, partially offset by the net benefits of the Company's enterprise initiatives and cost management of 180 basis points and favorable price/cost of 30 basis points.
|
2015 compared to 2014
|
For the Years Ended
|
|||||||||||||||||||||
|
Dollars in millions
|
December 31,
|
Components of Increase (Decrease)
|
|||||||||||||||||||
|
2015
|
2014
|
Inc (Dec)
|
Organic
|
Acquisition/Divestiture
|
Restructuring
|
Foreign Currency
|
Total
|
||||||||||||||
|
Operating revenue
|
$
|
1,650
|
|
$
|
1,850
|
|
(10.8
|
)%
|
(7.6
|
)%
|
(0.1
|
)%
|
—
|
%
|
(3.1
|
)%
|
(10.8
|
)%
|
|||
|
Operating income
|
$
|
415
|
|
$
|
479
|
|
(13.4
|
)%
|
(12.1
|
)%
|
—
|
%
|
0.3
|
%
|
(1.6
|
)%
|
(13.4
|
)%
|
|||
|
Operating margin %
|
25.2
|
%
|
25.9
|
%
|
(70) bps
|
|
(130) bps
|
|
—
|
|
10 bps
|
|
50 bps
|
|
(70) bps
|
|
|||||
|
•
|
Operating revenue decreased primarily due to the decrease in organic revenue and the unfavorable effect of foreign currency translation.
|
|
•
|
Organic revenue decreased 7.6% due to lower demand in the oil and gas end markets, the impact of a soft capital spending environment and continued PLS activities.
|
|
◦
|
North American organic revenue declined 5.1% primarily due to decreases across the oil and gas and industrial end markets.
|
|
◦
|
International organic revenue decreased 14.5% primarily due to weak oil and gas end markets across all regions.
|
|
•
|
Operating margin was 25.2%. The decline of 70 basis points was primarily due to negative operating leverage of 130 basis points and lower variable margins due to product mix from lower sales of higher margin equipment, partially offset by favorable price/cost of 50 basis points and the net benefits of the Company's enterprise initiatives.
|
28
POLYMERS & FLUIDS
This segment is a highly branded supplier to niche markets that require value-added, differentiated products. Businesses in this segment produce adhesives, sealants, lubrication and cutting fluids, and fluids and polymers for auto aftermarket maintenance and appearance. This segment primarily serves the automotive aftermarket, MRO, general industrial, and construction markets. Products in this segment include:
|
•
|
adhesives for industrial, construction and consumer purposes;
|
|
•
|
chemical fluids which clean or add lubrication to machines;
|
|
•
|
epoxy and resin-based coating products for industrial applications;
|
|
•
|
hand wipes and cleaners for industrial applications;
|
|
•
|
fluids, polymers and other supplies for auto aftermarket maintenance and appearance;
|
|
•
|
fillers and putties for auto body repair; and
|
|
•
|
polyester coatings and patch and repair products for the marine industry.
|
The results of operations for the Polymers & Fluids segment for
2016
,
2015
and
2014
were as follows:
2016 compared to 2015
|
For the Years Ended
|
|||||||||||||||||||||||
|
Dollars in millions
|
December 31,
|
Components of Increase (Decrease)
|
|||||||||||||||||||||
|
2016
|
2015
|
Inc (Dec)
|
Organic
|
Acq/Div
|
Restructuring
|
Impairment
|
Foreign Currency
|
Total
|
|||||||||||||||
|
Operating revenue
|
$
|
1,691
|
|
$
|
1,712
|
|
(1.2
|
)%
|
1.3
|
%
|
(0.2
|
)%
|
—
|
%
|
—
|
%
|
(2.3
|
)%
|
(1.2
|
)%
|
|||
|
Operating income
|
$
|
343
|
|
$
|
335
|
|
2.5
|
%
|
4.9
|
%
|
(0.3
|
)%
|
(0.1
|
)%
|
0.7
|
%
|
(2.7
|
)%
|
2.5
|
%
|
|||
|
Operating margin %
|
20.3
|
%
|
19.6
|
%
|
70 bps
|
|
70 bps
|
|
—
|
|
(10) bps
|
|
20 bps
|
|
(10) bps
|
|
70 bps
|
|
|||||
|
•
|
Operating revenue decreased primarily due to the unfavorable effect of foreign currency translation, partially offset by organic revenue growth.
|
|
•
|
Organic revenue increased 1.3% primarily due to stronger demand in the automotive aftermarket and polymers businesses.
|
|
◦
|
Organic revenue for the automotive aftermarket businesses increased 2.1% primarily driven by an increase in car care and tire repair in North America. Organic revenue for the polymers businesses increased 1.4% primarily driven by an increase in South America and a modest increase in the European wind energy business, partially offset by a decline in North America. Organic revenue for the fluids businesses was flat as growth in South America was offset by a decline in the industrial maintenance, repair, and operations end markets in North America.
|
|
•
|
Operating margin of 20.3% increased 70 basis points primarily driven by the net benefits of the Company's enterprise initiatives and cost management of 60 basis points and favorable operating leverage of 30 basis points, partially offset by unfavorable price/cost of 20 basis points.
|
2015 compared to 2014
|
For the Years Ended
|
|||||||||||||||||||||||
|
Dollars in millions
|
December 31,
|
Components of Increase (Decrease)
|
|||||||||||||||||||||
|
2015
|
2014
|
Inc (Dec)
|
Organic
|
Acq/Div
|
Restructuring
|
Impairment
|
Foreign Currency
|
Total
|
|||||||||||||||
|
Operating revenue
|
$
|
1,712
|
|
$
|
1,927
|
|
(11.2
|
)%
|
(2.0
|
)%
|
(1.0
|
)%
|
—
|
%
|
—
|
%
|
(8.2
|
)%
|
(11.2
|
)%
|
|||
|
Operating income
|
$
|
335
|
|
$
|
357
|
|
(6.3
|
)%
|
1.8
|
%
|
(2.3
|
)%
|
1.7
|
%
|
(0.4
|
)%
|
(7.1
|
)%
|
(6.3
|
)%
|
|||
|
Operating margin %
|
19.6
|
%
|
18.5
|
%
|
110 bps
|
|
80 bps
|
|
(20) bps
|
|
30 bps
|
|
(10) bps
|
|
30 bps
|
|
110 bps
|
|
|||||
|
•
|
Operating revenue decreased primarily due to the unfavorable effect of foreign currency translation and the decrease in organic revenue.
|
|
•
|
Organic revenue declined 2.0% primarily due to lower demand in Europe and North America.
|
29
|
◦
|
Organic revenue for the fluids businesses decreased 3.8% primarily driven by a decline in the industrial maintenance, repair and operations end markets in Europe and North America. Polymers businesses decreased 2.6% primarily due to the organic revenue decline in the European wind energy business, partially offset by growth in China and South America. Organic revenue for the automotive aftermarket businesses was essentially flat as a decline in North America was offset by growth in South America.
|
|
•
|
Operating income of $335 million decreased 6.3%. Excluding the negative impact of foreign currency translation of 7.1%, operating income would have increased 0.8%.
|
|
•
|
Operating margin was 19.6%. The 110 basis point improvement was primarily driven by the net benefits of the Company's enterprise initiatives and cost management of 150 basis points and lower restructuring expenses, partially offset by lower variable margins due to product mix and negative operating leverage of 40 basis points.
|
CONSTRUCTION PRODUCTS
This segment is a branded supplier of innovative engineered fastening systems and solutions. This segment primarily serves the residential/remodel construction and commercial construction markets. Products in this segment include:
|
•
|
fasteners and related fastening tools for wood and metal applications;
|
|
•
|
anchors, fasteners and related tools for concrete applications;
|
|
•
|
metal plate truss components and related equipment and software; and
|
|
•
|
packaged hardware, fasteners, anchors and other products for retail.
|
The results of operations for the Construction Products segment for
2016
,
2015
and
2014
were as follows:
2016 compared to 2015
|
For the Years Ended
|
|||||||||||||||||||||
|
Dollars in millions
|
December 31,
|
Components of Increase (Decrease)
|
|||||||||||||||||||
|
2016
|
2015
|
Inc (Dec)
|
Organic
|
Acquisition/Divestiture
|
Restructuring
|
Foreign Currency
|
Total
|
||||||||||||||
|
Operating revenue
|
$
|
1,609
|
|
$
|
1,587
|
|
1.4
|
%
|
3.0
|
%
|
(0.2
|
)%
|
—
|
%
|
(1.4
|
)%
|
1.4
|
%
|
|||
|
Operating income
|
$
|
361
|
|
$
|
316
|
|
14.1
|
%
|
16.2
|
%
|
(0.3
|
)%
|
(0.3
|
)%
|
(1.5
|
)%
|
14.1
|
%
|
|||
|
Operating margin %
|
22.4
|
%
|
19.9
|
%
|
250 bps
|
|
260 bps
|
|
—
|
|
(10) bps
|
|
—
|
|
250 bps
|
|
|||||
|
•
|
Operating revenue increased primarily due to organic revenue growth, partially offset by the unfavorable effect of foreign currency translation.
|
|
•
|
Organic revenue increased 3.0%.
|
|
◦
|
North American organic revenue grew 3.3% driven by growth in residential/remodel and commercial end markets.
|
|
◦
|
International organic revenue increased 2.8%. Asia Pacific organic revenue increased 2.9% primarily due to growth in Australia and New Zealand. European organic revenue increased 2.8% primarily due to growth in the United Kingdom.
|
|
•
|
Operating margin of 22.4% increased 250 basis points primarily driven by the net benefits of the Company's enterprise initiatives and cost management of 130 basis points, positive operating leverage of 80 basis points and favorable price/cost of 50 basis points.
|
2015 compared to 2014
|
For the Years Ended
|
|||||||||||||||||||||
|
Dollars in millions
|
December 31,
|
Components of Increase (Decrease)
|
|||||||||||||||||||
|
2015
|
2014
|
Inc (Dec)
|
Organic
|
Acquisition/Divestiture
|
Restructuring
|
Foreign Currency
|
Total
|
||||||||||||||
|
Operating revenue
|
$
|
1,587
|
|
$
|
1,707
|
|
(7.0
|
)%
|
3.7
|
%
|
(0.5
|
)%
|
—
|
%
|
(10.2
|
)%
|
(7.0
|
)%
|
|||
|
Operating income
|
$
|
316
|
|
$
|
289
|
|
8.8
|
%
|
17.0
|
%
|
(0.2
|
)%
|
3.8
|
%
|
(11.8
|
)%
|
8.8
|
%
|
|||
|
Operating margin %
|
19.9
|
%
|
17.0
|
%
|
290 bps
|
|
220 bps
|
|
10 bps
|
|
60 bps
|
|
—
|
|
290 bps
|
|
|||||
30
|
•
|
Operating revenue decreased primarily due to the unfavorable effect of foreign currency translation, partially offset by organic revenue growth.
|
|
•
|
Organic revenue increased 3.7%.
|
|
◦
|
North American organic revenue increased 7.1% primarily due to an increase in demand in the residential/remodel end markets.
|
|
◦
|
International organic revenue increased 1.8%. Asia Pacific organic revenue increased 4.0% primarily due to growth in Australia and New Zealand. European organic revenue decreased 0.3% primarily due to ongoing PLS activities.
|
|
•
|
Operating income of $316 million increased 8.8%. Excluding the negative impact of foreign currency translation of 11.8%, operating income would have increased 20.6%.
|
|
•
|
Operating margin improved 290 basis points to 19.9% primarily due to the net benefits of the Company's enterprise initiatives and cost management of 150 basis points, positive operating leverage of 100 basis points and lower restructuring expenses.
|
SPECIALTY PRODUCTS
This segment is focused on diversified niche market opportunities with substantial patent protection producing beverage packaging equipment and consumables, product coding and marking equipment and consumables, and appliance components and fasteners. This segment primarily serves the food and beverage, general industrial, consumer durables, printing and publishing and industrial capital goods markets. Products in this segment include:
|
•
|
line integration, conveyor systems and line automation for the food and beverage industries;
|
|
•
|
plastic consumables that multi-pack cans and bottles and related equipment;
|
|
•
|
foil, film and related equipment used to decorate consumer products;
|
|
•
|
product coding and marking equipment and related consumables;
|
|
•
|
plastic and metal fasteners and components for appliances;
|
|
•
|
airport ground support equipment; and
|
|
•
|
components for medical devices.
|
The results of operations for the Specialty Products segment for
2016
,
2015
and
2014
were as follows:
2016 compared to 2015
|
For the Years Ended
|
|||||||||||||||||||||
|
Dollars in millions
|
December 31,
|
Components of Increase (Decrease)
|
|||||||||||||||||||
|
2016
|
2015
|
Inc (Dec)
|
Organic
|
Acquisition/Divestiture
|
Restructuring
|
Foreign Currency
|
Total
|
||||||||||||||
|
Operating revenue
|
$
|
1,885
|
|
$
|
1,885
|
|
—
|
%
|
1.2
|
%
|
(0.1
|
)%
|
—
|
%
|
(1.1
|
)%
|
—
|
%
|
|||
|
Operating income
|
$
|
482
|
|
$
|
439
|
|
9.7
|
%
|
11.2
|
%
|
0.1
|
%
|
(0.1
|
)%
|
(1.5
|
)%
|
9.7
|
%
|
|||
|
Operating margin %
|
25.6
|
%
|
23.3
|
%
|
230 bps
|
|
230 bps
|
|
10 bps
|
|
(10) bps
|
|
—
|
|
230 bps
|
|
|||||
|
•
|
Operating revenue was flat as an increase in organic revenue was offset primarily by the unfavorable effect of foreign currency translation.
|
|
•
|
Organic revenue increased 1.2% primarily driven by growth in the consumer packaging, ground support equipment and sports branding businesses.
|
|
◦
|
International organic revenue increased 2.3% driven by growth in the appliance, foils, and gluing system businesses in Asia Pacific.
|
|
◦
|
North American organic revenue increased 0.6% driven by growth in the consumer packaging and medical businesses, partially offset by a decline in the brand identification businesses.
|
|
•
|
Operating margin of 25.6% increased 230 basis points primarily driven by the net benefits of the Company's enterprise initiatives and cost management of 220 basis points and positive operating leverage of 30 basis points, partially offset by unfavorable price/cost of 20 basis points.
|
31
2015 compared to 2014
|
For the Years Ended
|
|||||||||||||||||||||
|
Dollars in millions
|
December 31,
|
Components of Increase (Decrease)
|
|||||||||||||||||||
|
2015
|
2014
|
Inc (Dec)
|
Organic
|
Acquisition/Divestiture
|
Restructuring
|
Foreign Currency
|
Total
|
||||||||||||||
|
Operating revenue
|
$
|
1,885
|
|
$
|
2,055
|
|
(8.3
|
)%
|
(2.3
|
)%
|
—
|
%
|
—
|
%
|
(6.0
|
)%
|
(8.3
|
)%
|
|||
|
Operating income
|
$
|
439
|
|
$
|
440
|
|
(0.4
|
)%
|
4.2
|
%
|
—
|
%
|
1.8
|
%
|
(6.4
|
)%
|
(0.4
|
)%
|
|||
|
Operating margin %
|
23.3
|
%
|
21.4
|
%
|
190 bps
|
|
150 bps
|
|
—
|
|
40 bps
|
|
—
|
|
190 bps
|
|
|||||
|
•
|
Operating revenue decreased due to the unfavorable effect of foreign currency translation and the decrease in organic revenue.
|
|
•
|
Organic revenue declined 2.3%.
|
|
◦
|
Growth in the consumer packaging businesses, driven by strong food and beverage end market demand, and in the brand identification businesses, due to increased medical, credit card, and automotive end market demand, was more than offset by the impact of a challenging capital spending environment and ongoing PLS activities.
|
|
◦
|
North American organic revenue decreased 3.2% as growth in the consumer packaging and brand identification businesses was more than offset by a decline in the ground support equipment and the appliance businesses. International organic revenue decreased 0.9% primarily due to a decline in the ground support equipment businesses, partially offset by growth in the consumer packaging businesses.
|
|
•
|
Operating income of $439 million decreased 0.4%. Excluding the negative impact of foreign currency translation of 6.4%, operating income would have increased 6.0%.
|
|
•
|
Operating margin improved 190 basis points to 23.3% primarily due to the net benefits of the Company's enterprise initiatives and cost management of 150 basis points, favorable price/cost of 50 basis points and lower restructuring expenses, partially offset by negative operating leverage of 50 basis points.
|
OTHER FINANCIAL HIGHLIGHTS
|
•
|
Interest expense was
$237 million
in
2016
, an increase from
$226 million
in
2015
, primarily due to debt issuances in 2016. Interest expense was lower in 2015 compared to 2014 ($250 million in 2014) due to debt issuances in 2014 and 2015 at lower rates compared to prior debt obligations.
|
|
•
|
Other income (expense) was income of
$81 million
in
2016
,
$78 million
in
2015
and
$61 million
in
2014
. The income in 2016 included a $54 million pre-tax gain resulting from a $167 million dividend distribution from Wilsonart that exceeded the equity investment balance, partially offset by $30 million of pre-tax losses in 2016 related to the disposals of businesses and the disposal of a partnership investment. The increase in income in 2015 versus 2014 was primarily due to a $15 million gain on the sale of a business in the first quarter of 2015.
|
|
•
|
The effective tax rate was
30.0%
in
2016
,
30.1%
in
2015
, and
30.0%
in
2014
.
|
|
•
|
The impact of the Euro and other foreign currencies against the U.S. Dollar decreased operating revenue by approximately $210 million in
2016
versus
2015
and $995 million in
2015
versus
2014
. Additionally, the impact of foreign currencies against the U.S. Dollar decreased income from continuing operations by approximately $41 million in
2016
versus
2015
and $153 million in
2015
versus
2014
.
|
DISCONTINUED OPERATIONS
In February 2013, the Company announced that it was initiating a review process to explore strategic alternatives for the Industrial Packaging segment. In September 2013, the Company’s Board of Directors authorized a plan to commence a sale process for the Industrial Packaging segment. The Company classified the Industrial Packaging segment as held for sale beginning in the third quarter of 2013 and no longer presented this segment as part of its continuing operations.
On February 6, 2014, the Company announced that it had signed a definitive agreement to sell the Industrial Packaging business to The Carlyle Group for
$3.2 billion
. The transaction was completed on May 1, 2014, resulting in a pre-tax gain of $
1.7 billion
($
1.1 billion
after-tax) in the second quarter of 2014 which was included in Income from discontinued operations.
The operating results of the former Industrial Packaging segment as well as two Construction Products businesses are reported as discontinued operations in the statement of income for 2014. As of the second quarter of 2014, the Company had completed the divestiture of all of the businesses previously classified as discontinued operations. Refer to Note 2.
32
Discontinued Operations in Item 8. Financial Statements and Supplementary Data for discussion of the Company's discontinued operations.
NEW ACCOUNTING PRONOUNCEMENTS
In May 2014, the Financial Accounting Standards Board (the "FASB") issued authoritative guidance to change the criteria for revenue recognition. The core principle of the new standard is that revenue should be recognized to depict the transfer of promised goods or services to customers in an amount that reflects the consideration to which the entity expects to be entitled in exchange for those goods or services. In addition, several new revenue recognition disclosures will be required. This guidance is effective for the Company beginning January 1, 2018, with early adoption permitted. The Company expects to adopt the new revenue accounting guidance effective January 1, 2018 and is in the process of completing its analysis of the impact this guidance will have on the consolidated financial statements and related disclosures.
In February 2016, the FASB issued authoritative guidance to change the criteria for recognizing leasing transactions. Under the new guidance, a lessee will be required to recognize a lease liability and lease asset for all leases, including operating leases, with a lease term greater than twelve months in the statement of financial position. Subsequent measurement, including presentation of expenses and cash flows, will depend on the classification of the lease as either a financing or operating lease. In addition, several new disclosures will be required. This guidance is effective for the Company beginning January 1, 2019, with early adoption permitted. While the Company has not yet completed its evaluation of the impact the new lease accounting guidance will have on the consolidated financial statements and related disclosures, the Company expects to recognize right of use assets and liabilities for its operating leases in the statement of financial position upon adoption.
In March 2016, the FASB issued authoritative guidance that includes several changes to simplify the accounting for stock-based compensation, including the accounting for income taxes, forfeitures, statutory tax withholding requirements and classification of tax benefits in the statement of cash flows. Among the more significant changes, the new guidance requires that the income tax effects associated with the settlement of stock-based awards after adoption of the guidance be recognized through income tax expense rather than directly in equity. Additionally, the income tax effects related to excess tax benefits will be presented as an operating cash flow in the statement of cash flows rather than a financing activity for all current and prior periods presented. The Company adopted this guidance effective January 1, 2017. For the twelve months ended December 31, 2016 and 2015, the Company had classified $29 million and $20 million, respectively, of excess tax benefits as a financing activity in the statement of cash flows which will be presented as an operating cash flow under the new guidance. The expected effect on income tax expense or net cash provided from operating activities related to stock-based awards settled after adoption of the new guidance will depend on inputs such as the stock price at the time of settlement and the number of awards settled in the period presented.
In October 2016, the FASB issued authoritative guidance requiring the recognition of the income tax consequences of an intra-entity transfer of an asset, other than inventory, when the transfer occurs rather than when transferred to a third party as required under the current guidance. The new guidance is effective for the Company beginning January 1, 2018, with early adoption permitted. The Company is currently assessing the potential impact the guidance will have upon adoption.
In January 2017, the FASB issued authoritative guidance that simplifies the assessment of goodwill for impairment when the estimated fair value of a reporting unit is less than its carrying value by eliminating the requirement to determine the fair value of goodwill. Under the new guidance, the amount of goodwill impairment will be determined by the amount the carrying value of the reporting unit exceeds its fair value. The new guidance is effective for the Company beginning January 1, 2020, with early adoption permitted. The Company performs its annual goodwill impairment assessment process in the third quarter, or more frequently if triggering events occur. Adoption of this new guidance is not expected to have a material impact on the Company's operating results, financial position or cash flows.
LIQUIDITY AND CAPITAL RESOURCES
The Company’s primary sources of liquidity are free cash flow and short-term credit facilities. In addition, the Company had
$2.5 billion
of cash on hand at
December 31, 2016
and also maintains strong access to public debt markets. Management believes that these sources are sufficient to service debt and to finance the Company's capital allocation priorities, which include:
|
•
|
internal investments to support organic growth and sustain core businesses;
|
|
•
|
payment of an attractive dividend to shareholders; and
|
33
|
•
|
external investments in selective strategic acquisitions that support the Company's organic growth focus and an active share repurchase program.
|
In September 2013, the Company’s Board of Directors authorized a plan to commence a sale process for the Industrial Packaging business. The Company classified the Industrial Packaging segment as held for sale beginning in the third quarter of 2013 and no longer presented this segment as part of its continuing operations. As to the impact of this divestiture on the Company’s income per share from continuing operations and capital structure going forward, the Company also indicated that it intended to repurchase approximately 50 million shares through a program utilizing its existing share repurchase authorization to offset the full amount of divestiture-related dilution of income per share from continuing operations through a combination of sale proceeds, free cash flow and additional leverage. The Company completed this program in the second quarter of 2014. Under this program, the Company repurchased approximately 14.0 million shares of its common stock in the fourth quarter of 2013 and approximately 35.7 million shares of its common stock in the first half of 2014.
On February 6, 2014, the Company announced that it had signed a definitive agreement to sell the Industrial Packaging business to The Carlyle Group for
$3.2 billion
. The transaction was completed on May 1, 2014, resulting in a pre-tax gain of $
1.7 billion
($
1.1 billion
after-tax) in the second quarter of 2014 which was included in Income from discontinued operations. A portion of the proceeds was used to fund share repurchases under the program noted above.
The Company believes that, based on its operating revenue, operating margin, free cash flow, and credit ratings, it could readily obtain additional financing if necessary.
Cash Flow
The Company uses free cash flow to measure cash flow generated by operations that is available for dividends, share repurchases, acquisitions and debt repayment. The Company believes this non-GAAP financial measure is useful to investors in evaluating the Company’s financial performance and measures the Company's ability to generate cash internally to fund Company initiatives. Free cash flow represents net cash provided by operating activities less additions to plant and equipment. Free cash flow is a measurement that is not the same as net cash flow from operating activities per the statement of cash flows and may not be consistent with similarly titled measures used by other companies.
Summarized cash flow information for the years ended December 31,
2016
,
2015
and
2014
was as follows:
|
In millions
|
2016
|
2015
|
2014
|
|||||||||
|
Net cash provided by operating activities
|
$
|
2,302
|
|
|
$
|
2,299
|
|
$
|
1,616
|
|
||
|
Additions to plant and equipment
|
(273
|
)
|
|
(284
|
)
|
(361
|
)
|
|||||
|
Free cash flow
|
$
|
2,029
|
|
$
|
2,015
|
|
$
|
1,255
|
|
|||
|
Cash dividends paid
|
$
|
(821
|
)
|
$
|
(742
|
)
|
$
|
(711
|
)
|
|||
|
Repurchases of common stock
|
(2,000
|
)
|
(2,002
|
)
|
(4,346
|
)
|
||||||
|
Acquisition of businesses (excluding cash and equivalents) and additional interest in affiliates
|
(453
|
)
|
(6
|
)
|
(45
|
)
|
||||||
|
Dividend distribution from equity investment in Wilsonart
|
167
|
|
—
|
|
—
|
|
||||||
|
Net proceeds from sale of discontinued operations
|
—
|
|
—
|
|
3,191
|
|
||||||
|
Net proceeds from (repayment of) debt
|
465
|
|
151
|
|
1,339
|
|
||||||
|
Other
|
128
|
|
147
|
|
224
|
|
||||||
|
Effect of exchange rate changes on cash and equivalents
|
(133
|
)
|
(463
|
)
|
(535
|
)
|
||||||
|
Net increase (decrease) in cash and equivalents
|
$
|
(618
|
)
|
$
|
(900
|
)
|
$
|
372
|
|
|||
The 2014 net cash provided by operating activities included $724 million of tax payments related to the disposition of the Industrial Packaging business.
Stock Repurchase Programs
On August 2, 2013, the Company’s Board of Directors authorized a stock repurchase program, which provided for the buyback of up to
$6.0 billion
of the Company’s common stock over an open-ended period of time (the "2013 Program"). Under the 2013 Program, the Company repurchased approximately
3.3 million
shares of its common stock at an average
34
price of
$81.62
per share during 2013, approximately
50.4 million
shares of its common stock at an average price of
$84.92
per share during 2014, and approximately
14.9 million
shares of its common stock at an average price of
$96.84
during 2015. As of
December 31, 2015
, there were
no
authorized repurchases remaining under the 2013 Program.
On February 13, 2015, the Company's Board of Directors authorized a new stock repurchase program, which provided for the buyback of up to an additional
$6.0 billion
of the Company’s common stock over an open-ended period of time (the "2015 Program"). Under the 2015 Program, the Company repurchased approximately
6.1 million
shares of its common stock at an average price of
$91.78
per share during 2015 and approximately
18.7 million
shares of its common stock at an average price of
$107.17
per share during 2016. As of
December 31, 2016
, there were approximately
$3.4 billion
of authorized repurchases remaining under the 2015 Program.
Adjusted After-Tax Return on Average Invested Capital
The Company uses adjusted after-tax return on average invested capital ("ROIC") to measure the effectiveness of its operations’ use of invested capital to generate profits. ROIC is a non-GAAP financial measure that the Company believes is a meaningful metric to investors in evaluating the Company’s financial performance and may be different than the method used by other companies to calculate ROIC. Adjusted average invested capital represents the net assets of the Company, excluding cash and equivalents and outstanding debt, which are excluded as they do not represent capital investment in the Company's operations, as well as the Company's net investment in the former Industrial Packaging segment and the equity investment in the Wilsonart business (formerly the Decorative Surfaces segment). Average invested capital is calculated using balances at the start of the period and at the end of each quarter.
ROIC for the years ended December 31,
2016
,
2015
, and
2014
was as follows:
|
Dollars in millions
|
2016
|
2015
|
2014
|
|||||||||
|
Operating income
|
$
|
3,064
|
|
$
|
2,867
|
|
$
|
2,888
|
|
|||
|
Tax rate
|
30.0
|
%
|
30.1
|
%
|
30.0
|
%
|
||||||
|
Income taxes
|
(919
|
)
|
(864
|
)
|
(866
|
)
|
||||||
|
Operating income after taxes
|
$
|
2,145
|
|
$
|
2,003
|
|
$
|
2,022
|
|
|||
|
Invested capital:
|
||||||||||||
|
Trade receivables
|
$
|
2,357
|
|
$
|
2,203
|
|
$
|
2,293
|
|
|||
|
Inventories
|
1,076
|
|
1,086
|
|
1,180
|
|
||||||
|
Net plant and equipment
|
1,652
|
|
1,577
|
|
1,686
|
|
||||||
|
Goodwill and intangible assets
|
6,021
|
|
5,999
|
|
6,466
|
|
||||||
|
Accounts payable and accrued expenses
|
(1,713
|
)
|
(1,585
|
)
|
(1,799
|
)
|
||||||
|
Other, net
|
223
|
|
280
|
|
427
|
|
||||||
|
Total invested capital
|
$
|
9,616
|
|
$
|
9,560
|
|
$
|
10,253
|
|
|||
|
Average invested capital
|
$
|
9,780
|
|
$
|
9,943
|
|
$
|
11,215
|
|
|||
|
Adjustment for Wilsonart (formerly the Decorative Surfaces segment)
|
(91
|
)
|
(123
|
)
|
(154
|
)
|
||||||
|
Adjustment for Industrial Packaging
|
—
|
|
—
|
|
(424
|
)
|
||||||
|
Adjusted average invested capital
|
$
|
9,689
|
|
$
|
9,820
|
|
$
|
10,637
|
|
|||
|
Adjusted return on average invested capital
|
22.1
|
%
|
20.4
|
%
|
19.0
|
%
|
||||||
ROIC increased 170 basis points in
2016
versus
2015
as a result of a 7.1% improvement in after-tax operating income and a 1.3% decrease in adjusted average invested capital. ROIC increased 140 basis points in
2015
versus
2014
primarily as a result of a decrease in adjusted average invested capital of 7.7%.
35
Working Capital
Management uses working capital as a measurement of the short-term liquidity of the Company. Net working capital at December 31,
2016
and
2015
is summarized as follows:
|
Dollars in millions
|
2016
|
2015
|
Increase
(Decrease)
|
|||||||||
|
Current Assets:
|
||||||||||||
|
Cash and equivalents
|
$
|
2,472
|
|
$
|
3,090
|
|
$
|
(618
|
)
|
|||
|
Trade receivables
|
2,357
|
|
2,203
|
|
154
|
|
||||||
|
Inventories
|
1,076
|
|
1,086
|
|
(10
|
)
|
||||||
|
Other
|
218
|
|
341
|
|
(123
|
)
|
||||||
|
6,123
|
|
6,720
|
|
(597
|
)
|
|||||||
|
Current Liabilities:
|
||||||||||||
|
Short-term debt
|
652
|
|
526
|
|
126
|
|
||||||
|
Accounts payable and accrued expenses
|
1,713
|
|
1,585
|
|
128
|
|
||||||
|
Other
|
395
|
|
257
|
|
138
|
|
||||||
|
2,760
|
|
2,368
|
|
392
|
|
|||||||
|
Net Working Capital
|
$
|
3,363
|
|
$
|
4,352
|
|
$
|
(989
|
)
|
|||
The decrease in net working capital at
December 31, 2016
was primarily driven by lower cash and equivalents.
Cash and equivalents totaled approximately $2.5 billion as of
December 31, 2016
and $3.1 billion as of
December 31, 2015
, primarily all of which was held by international subsidiaries. Cash and equivalents held internationally may be subject to U.S. income taxes and foreign withholding taxes if repatriated to the U.S. Cash and equivalents balances held internationally are typically used for international operating needs, reinvested to fund expansion of existing international businesses, used to fund new international acquisitions, or used to repay debt held internationally. In the U.S., the Company utilizes cash flows from domestic operations to fund domestic cash needs, which primarily consist of dividend payments, share repurchases, acquisitions, servicing of domestic debt obligations and general corporate needs. The Company also uses its commercial paper program, which is backed by long-term credit facilities, for short-term liquidity needs. The Company believes cash generated domestically and liquidity provided by the Company's commercial paper program will continue to be sufficient to fund cash requirements in the U.S.
Debt
Total debt at December 31,
2016
and
2015
was as follows:
|
In millions
|
2016
|
2015
|
Increase
(Decrease)
|
|||||||||
|
Short-term debt
|
$
|
652
|
|
$
|
526
|
|
$
|
126
|
|
|||
|
Long-term debt
|
7,177
|
|
6,896
|
|
281
|
|
||||||
|
Total debt
|
$
|
7,829
|
|
$
|
7,422
|
|
$
|
407
|
|
|||
In 2016, the Company reclassified
$650 million
related to the
0.90%
notes due February 25, 2017 from Long-term debt to Short-term debt. There was no commercial paper outstanding as of
December 31, 2016
. As of
December 31, 2015
, Short-term debt included commercial paper of
$498 million
.
The Company may issue commercial paper to fund general corporate needs, share repurchases, and small and medium-sized acquisitions. During the second quarter of 2016, the Company entered into a
$2.5 billion
, five-year line of credit agreement with a termination date of May 9, 2021 to support the potential issuances of commercial paper. This agreement replaced the previously existing
$1.5 billion
line of credit agreement with a termination date of June 8, 2017 and the
$1.0 billion
line of credit agreement with a termination date of August 15, 2018. No amounts were outstanding under the new line of credit agreement at
December 31, 2016
. The maximum outstanding commercial paper balance during
2016
was $1.3 billion, while
36
the average daily balance was $266 million. As of
December 31, 2016
, the Company's foreign operations had authorized credit facilities with unused capacity of
$286 million
.
In May 2015, the Company issued
€500 million
of
1.25%
Euro notes due May 22, 2023 at
99.239%
of face value and
€500 million
of
2.125%
Euro notes due May 22, 2030 at
99.303%
of face value. Net proceeds from the May 2015 debt issuances were used to repay commercial paper and for general corporate purposes.
In November 2016, the Company issued
$1.0 billion
of
2.65%
notes due November 15, 2026 at
99.685%
of face value. Net proceeds from the November 2016 debt issuance were used to repay commercial paper and for general corporate purposes.
Total Debt to EBITDA
The Company uses the ratio of total debt to EBITDA to measure its ability to repay its outstanding debt obligations. The Company believes that total debt to EBITDA is a meaningful metric to investors in evaluating the Company's long term financial liquidity and may be different than the method used by other companies to calculate total debt to EBITDA. EBITDA and the ratio of total debt to EBITDA are non-GAAP financial measures. The ratio of total debt to EBITDA represents total debt divided by income from continuing operations before interest expense, other income (expense), income taxes, depreciation, and amortization and impairment of goodwill and other intangible assets on a trailing twelve month basis. Total debt to EBITDA for the years ended December 31,
2016
,
2015
and
2014
was as follows:
|
Dollars in millions
|
2016
|
2015
|
2014
|
||||||||
|
Total debt
|
$
|
7,829
|
|
$
|
7,422
|
|
$
|
7,419
|
|
||
|
Income from continuing operations
|
$
|
2,035
|
|
$
|
1,899
|
|
$
|
1,890
|
|
||
|
Add:
|
|||||||||||
|
Interest expense
|
237
|
|
226
|
|
250
|
|
|||||
|
Other income
|
(81
|
)
|
(78
|
)
|
(61
|
)
|
|||||
|
Income taxes
|
873
|
|
820
|
|
809
|
|
|||||
|
Depreciation
|
246
|
|
244
|
|
262
|
|
|||||
|
Amortization and impairment of intangible assets
|
224
|
|
233
|
|
245
|
|
|||||
|
EBITDA
|
$
|
3,534
|
|
$
|
3,344
|
|
$
|
3,395
|
|
||
|
Total debt to EBITDA ratio
|
2.2
|
|
2.2
|
|
2.2
|
|
|||||
Stockholders’ Equity
The changes to stockholders’ equity during
2016
and
2015
were as follows:
|
In millions
|
2016
|
2015
|
||||||
|
Beginning balance
|
$
|
5,228
|
|
$
|
6,824
|
|
||
|
Net income
|
2,035
|
|
1,899
|
|
||||
|
Cash dividends declared
|
(846
|
)
|
(756
|
)
|
||||
|
Repurchases of common stock
|
(2,000
|
)
|
(2,002
|
)
|
||||
|
Currency translation adjustments
|
(277
|
)
|
(860
|
)
|
||||
|
Other
|
119
|
|
123
|
|
||||
|
Ending balance
|
$
|
4,259
|
|
$
|
5,228
|
|
||
37
CONTRACTUAL OBLIGATIONS AND OFF-BALANCE SHEET ARRANGEMENTS
The Company's significant contractual obligations as of
December 31, 2016
were as follows:
|
In millions
|
2017
|
2018
|
2019
|
2020
|
2021
|
2022 and
Future Years
|
||||||||||||||||||
|
Principal payments on notes
|
$
|
650
|
|
$
|
—
|
|
$
|
1,350
|
|
$
|
4
|
|
$
|
350
|
|
$
|
5,554
|
|
||||||
|
Interest payments on notes
|
240
|
|
237
|
|
209
|
|
180
|
|
180
|
|
2,053
|
|
||||||||||||
|
Minimum lease payments
|
104
|
|
75
|
|
53
|
|
37
|
|
26
|
|
43
|
|
||||||||||||
|
$
|
994
|
|
$
|
312
|
|
$
|
1,612
|
|
$
|
221
|
|
$
|
556
|
|
$
|
7,650
|
|
|||||||
As of
December 31, 2016
, the Company had recorded noncurrent liabilities for unrecognized tax benefits of $97 million. The Company is not able to reasonably estimate the timing of payments related to the liabilities for unrecognized tax benefits. The Company did not have any significant off-balance sheet commitments at
December 31, 2016
.
CRITICAL ACCOUNTING POLICIES AND ESTIMATES
The Company has six accounting policies that it believes are most important to the Company’s financial condition and results of operations, and which require the Company to make estimates about matters that are inherently uncertain. Management bases its estimates on historical experience, and in some cases on observable market information. Various assumptions are also used that are believed to be reasonable under the circumstances and form the basis for making judgments about the carrying values of assets and liabilities that are not readily apparent from other sources. Actual results may differ from these estimates.
The Company's critical accounting policies are as follows:
Realizability of Inventories
—
Inventories are stated at the lower of cost or net realizable value. Generally, the Company’s businesses perform an analysis of the historical sales usage of the individual inventory items on hand and a reserve is recorded to adjust inventory cost to net realizable value based on the following usage criteria:
|
Usage Classification
|
Criteria
|
Reserve %
|
|||
|
Active
|
Quantity on hand is less than prior 6 months of usage
|
0
|
%
|
||
|
Slow-moving
|
Some usage in last 12 months, but quantity on hand exceeds prior 6 months of usage
|
50
|
%
|
||
|
Obsolete
|
No usage in the last 12 months
|
90
|
%
|
||
In addition, for approximately
22%
of total inventories, the Company has elected to use the last-in, first-out ("LIFO") method of inventory costing. Generally, this method results in a lower inventory value than the first-in, first-out ("FIFO") method due to the effects of inflation.
Collectibility of Accounts Receivable
—
The Company estimates the allowance for uncollectible accounts based on the greater of a specific reserve or a reserve calculated based on the historical write-off percentage over the last two years. In addition, reserves for customer credits and cash discounts are estimated based on past experience.
Depreciation of Plant and Equipment
—
The Company’s U.S. businesses primarily compute depreciation on an accelerated basis, as follows:
|
Buildings and improvements
|
150% declining balance
|
|
Machinery and equipment
|
200% declining balance
|
The majority of the Company's international businesses compute depreciation on a straight-line basis.
Income Taxes
—
The Company provides deferred income tax assets and liabilities based on the estimated future tax effects of differences between the financial and tax bases of assets and liabilities based on currently enacted tax laws. The Company’s deferred and other tax balances are based on management’s interpretation of the tax regulations and rulings in numerous
38
taxing jurisdictions. Income tax expense, assets and liabilities recognized by the Company also reflect its best estimates and assumptions regarding, among other things, the level of future taxable income, the effect of the Company’s various tax planning strategies and uncertain tax positions. Future tax authority rulings and changes in tax laws, changes in projected levels of taxable income and future tax planning strategies could affect the actual effective tax rate and tax balances recorded by the Company.
Goodwill and Intangible Assets
—
The Company’s business acquisitions typically result in recording goodwill and other intangible assets, which are a significant portion of the Company’s total assets and affect the amount of amortization expense and impairment charges that the Company could incur in future periods. The Company follows the guidance prescribed in the accounting standards to test goodwill and intangible assets for impairment. On an annual basis, or more frequently if triggering events occur, the Company compares the estimated fair value of its reporting units to the carrying value of each reporting unit to determine if a potential goodwill impairment exists. If the fair value of a reporting unit is less than its carrying value, an impairment loss, if any, is recorded for the difference between the implied fair value and the carrying value of the reporting unit’s goodwill. In calculating the fair value of the reporting units or specific intangible assets, management relies on a number of factors, including business plans, economic projections, anticipated future cash flows, comparable transactions and other market data. There are inherent uncertainties related to these factors and management’s judgment in applying them in the impairment tests of goodwill and other intangible assets.
As of
December 31, 2016
, the Company had total goodwill and intangible assets of approximately $
6.0 billion
allocated to its reporting units. Although there can be no assurance that the Company will not incur additional impairment charges related to its goodwill and other intangible assets, the Company generally believes the risk of significant impairment charges is lessened by the number of diversified businesses and end markets represented by its reporting units that have goodwill and other intangible assets. In addition, the individual businesses in many of the reporting units have been acquired over a long period of time, and in many cases have been able to improve their performance, primarily as a result of the application of the Company’s 80/20 management process. The amount of goodwill and other intangible assets allocated to individual reporting units ranges from approximately $208 million to $1.4 billion, with the average amount equal to $601 million. Fair value determinations require considerable judgment and are sensitive to changes in the factors described above. Due to the inherent uncertainties associated with these factors and economic conditions in the Company’s global end markets, impairment charges related to one or more reporting units could occur in future periods.
Pension and Other Postretirement Benefits
—
The Company has various company-sponsored defined benefit retirement plans covering a number of U.S. employees and many employees outside the U.S. Pension and other postretirement benefit expense and obligations are determined based on actuarial valuations. Pension benefit obligations are generally based on each participant’s years of service, future compensation, and age at retirement or termination. Important assumptions in determining pension and postretirement expense and obligations are the discount rate, the expected long-term return on plan assets, life expectancy, and health care cost trend rates. Future changes in any of these assumptions could materially affect the amounts recorded related to the Company's pension and other postretirement benefit plans. See Note 9. Pension and Other Postretirement Benefits in Item 8. Financial Statements and Supplementary Data for additional discussion of actuarial assumptions used in determining pension and postretirement health care liabilities and expenses.
The Company determines the discount rate used to measure plan liabilities as of the year-end measurement date for the U.S. primary pension plan. The discount rate reflects the current rate at which the associated liabilities could theoretically be effectively settled at the end of the year. In estimating this rate, the Company looks at rates of return on high-quality fixed income investments, with similar duration to the liabilities in the plan. A 25 basis point decrease in the discount rate would increase the present value of the U.S. primary pension plan obligation by approximately $39 million.
The expected long-term return on plan assets is based on historical and expected long-term returns for similar investment allocations among asset classes. For the U.S. primary pension plan, a 25 basis point decrease in the expected return on plan assets would increase the annual pension expense by approximately $4 million.
Beginning in 2017, the Company changed the method used to estimate the service and interest cost components of net periodic pension and other postretirement benefit costs. The new method will provide a more precise measure of the service and interest cost components of net periodic benefit cost by applying specific spot rates along the yield curve to the projected cash flows rather than a single weighted-average rate. The change is not expected to have a material impact on the 2017 net periodic pension and other postretirement benefit costs as the decrease in service and interest costs is largely offset by the impact of lower discount rates and expected returns on plan assets. Total estimated 2017 pension and other postretirement benefit costs are expected to be consistent with 2016. See Note 9. Pension and Other Postretirement Benefits in Item 8.
39
Financial Statements and Supplementary Data for information on the Company's pension and other postretirement benefit plans and related assumptions.
ITEM 7A.
Quantitative and Qualitative Disclosures About Market Risk
MARKET RISK
The Company is exposed to certain market risks that exist as part of its ongoing business operations, including fluctuations in currency exchange rates, price volatility for certain commodities and changes in interest rates. The Company does not engage in speculative or leveraged transactions and does not hold or issue financial instruments for trading purposes.
Interest Rate Risk
The Company’s exposure to market risk for changes in interest rates relates primarily to the fair value of the Company’s fixed rate debt. The following table presents the Company’s fixed rate debt for which the fair value is subject to changing market interest rates:
|
0.90%
Notes Due
|
1.95%
Notes Due
|
6.25%
Notes Due
|
4.88%
Notes Due
thru
|
3.375%
Notes Due
|
1.75%
Euro Notes Due
|
1.25% Euro
Notes Due
|
3.50%
Notes Due
|
2.65%
Notes Due
|
2.125% Euro
Notes Due
|
3.00% Euro
Notes Due
|
4.875%
Notes Due
|
3.9%
Notes Due
|
|||||||||||||||||||||||||||||||||||||||
|
In millions
|
Feb 25,
2017
|
Mar 1,
2019
|
Apr 1,
2019
|
Dec 31,
2020
|
Sep 15,
2021
|
May 20,
2022
|
May 22,
2023
|
Mar 1,
2024
|
Nov 15,
2026
|
May 22,
2030
|
May 19,
2034
|
Sep 15,
2041
|
Sep 1,
2042
|
||||||||||||||||||||||||||||||||||||||
|
As of December 31, 2016:
|
|||||||||||||||||||||||||||||||||||||||||||||||||||
|
Estimated cash outflow by year of principal maturity
|
|||||||||||||||||||||||||||||||||||||||||||||||||||
|
2017
|
$
|
650
|
|
$
|
—
|
|
$
|
—
|
|
$
|
—
|
|
$
|
—
|
|
$
|
—
|
|
$
|
—
|
|
$
|
—
|
|
$
|
—
|
|
$
|
—
|
|
$
|
—
|
|
$
|
—
|
|
$
|
—
|
|
||||||||||||
|
2018
|
—
|
|
—
|
|
—
|
|
—
|
|
—
|
|
—
|
|
—
|
|
—
|
|
—
|
|
—
|
|
—
|
|
—
|
|
—
|
|
|||||||||||||||||||||||||
|
2019
|
—
|
|
650
|
|
700
|
|
—
|
|
—
|
|
—
|
|
—
|
|
—
|
|
—
|
|
—
|
|
—
|
|
—
|
|
—
|
|
|||||||||||||||||||||||||
|
2020
|
—
|
|
—
|
|
—
|
|
4
|
|
—
|
|
—
|
|
—
|
|
—
|
|
—
|
|
—
|
|
—
|
|
—
|
|
—
|
|
|||||||||||||||||||||||||
|
2021
|
—
|
|
—
|
|
—
|
|
—
|
|
350
|
|
—
|
|
—
|
|
—
|
|
—
|
|
—
|
|
—
|
|
—
|
|
—
|
|
|||||||||||||||||||||||||
|
2022 and thereafter
|
—
|
|
—
|
|
—
|
|
—
|
|
526
|
|
526
|
|
700
|
|
1,000
|
|
526
|
|
526
|
|
650
|
|
1,100
|
|
|||||||||||||||||||||||||||
|
Estimated fair value
|
650
|
|
656
|
|
768
|
|
4
|
|
365
|
|
565
|
|
549
|
|
728
|
|
959
|
|
565
|
|
618
|
|
734
|
|
1,114
|
|
|||||||||||||||||||||||||
|
Carrying value
|
650
|
|
648
|
|
698
|
|
4
|
|
348
|
|
520
|
|
520
|
|
695
|
|
991
|
|
519
|
|
512
|
|
636
|
|
1,080
|
|
|||||||||||||||||||||||||
|
As of December 31, 2015:
|
|||||||||||||||||||||||||||||||||||||||||||||||||||
|
Estimated total cash outflow
|
$
|
650
|
|
$
|
650
|
|
$
|
700
|
|
$
|
4
|
|
$
|
350
|
|
$
|
543
|
|
$
|
543
|
|
$
|
700
|
|
$
|
—
|
|
$
|
543
|
|
$
|
543
|
|
$
|
650
|
|
$
|
1,100
|
|
||||||||||||
|
Estimated fair value
|
649
|
|
655
|
|
790
|
|
4
|
|
362
|
|
564
|
|
538
|
|
727
|
|
—
|
|
530
|
|
569
|
|
708
|
|
1,051
|
|
|||||||||||||||||||||||||
|
Carrying value
|
649
|
|
647
|
|
698
|
|
4
|
|
347
|
|
536
|
|
536
|
|
695
|
|
—
|
|
536
|
|
528
|
|
635
|
|
1,080
|
|
|||||||||||||||||||||||||
Foreign Currency Risk
The Company operates in the U.S. and
56
foreign countries. The funding for the foreign manufacturing operations is provided primarily through the permanent investment of equity capital. The Company’s products are typically manufactured and sold within the same country. Therefore, the Company's manufacturing operations generally do not have significant assets or liabilities denominated in currencies other than their functional currencies.
The Company designated €
1.0 billion
of Euro notes issued in May 2014 and €
1.0 billion
of Euro notes issued in May 2015 as hedges of a portion of its net investment in Euro-denominated foreign operations to reduce foreign currency risk associated with the investment in these operations. Changes in the value of this debt resulting from fluctuations in the Euro to U.S. Dollar exchange rate have been recorded as foreign currency translation adjustments within Accumulated other
40
comprehensive income (loss). The cumulative unrealized gain recorded in Accumulated other comprehensive income (loss) related to the net investment hedge was
$375 million
and
$308 million
as of
December 31, 2016
and
December 31, 2015
, respectively.
41
ITEM 8.
Financial Statements and Supplementary Data
MANAGEMENT REPORT ON INTERNAL CONTROL OVER FINANCIAL REPORTING
The management of Illinois Tool Works Inc. (the "Company" or "ITW") is responsible for establishing and maintaining adequate internal control over financial reporting, as such term is defined in Exchange Act Rule 13a-15(f). ITW’s internal control system was designed to provide reasonable assurance to the Company’s management and Board of Directors regarding the preparation and fair presentation of published financial statements.
All internal control systems, no matter how well designed, have inherent limitations. Therefore, even those systems determined to be effective can provide only reasonable assurance with respect to financial statement preparation and presentation.
ITW management assessed the effectiveness of the Company’s internal control over financial reporting as of
December 31, 2016
. In making this assessment, it used the criteria set forth by the Committee of Sponsoring Organizations of the Treadway Commission (COSO) in Internal Control—Integrated Framework (2013). Based on our assessment we believe that, as of
December 31, 2016
, the Company’s internal control over financial reporting is effective based on those criteria.
The effectiveness of the Company’s internal control over financial reporting as of
December 31, 2016
has been audited by Deloitte & Touche LLP, an independent registered public accounting firm, as stated in their report herein.
|
/s/ E. Scott Santi
E. Scott Santi
Chairman & Chief Executive Officer
February 10, 2017
|
/s/ Michael M. Larsen
Michael M. Larsen Senior Vice President & Chief Financial Officer
February 10, 2017
|
|
42
REPORT OF INDEPENDENT REGISTERED PUBLIC ACCOUNTING FIRM
To the Board of Directors and Stockholders of Illinois Tool Works Inc.
Glenview, Illinois
We have audited the accompanying consolidated statements of financial position of Illinois Tool Works Inc. and subsidiaries (the “Company”) as of December 31, 2016 and 2015, and the related consolidated statements of income, comprehensive income, changes in stockholders’ equity, and cash flows for each of the three years in the period ended December 31, 2016. We also have audited the Company’s internal control over financial reporting as of December 31, 2016, based on criteria established in
Internal Control-Integrated Framework
(2013) issued by the Committee of Sponsoring Organizations of the Treadway Commission. The Company’s management is responsible for these financial statements, for maintaining effective internal control over financial reporting, and for its assessment of the effectiveness of internal control over financial reporting, included in the accompanying Management Report on Internal Control over Financial Reporting. Our responsibility is to express an opinion on these financial statements and an opinion on the Company’s internal control over financial reporting based on our audits.
We conducted our audits in accordance with the standards of the Public Company Accounting Oversight Board (United States). Those standards require that we plan and perform the audit to obtain reasonable assurance about whether the financial statements are free of material misstatement and whether effective internal control over financial reporting was maintained in all material respects. Our audits of the financial statements included examining, on a test basis, evidence supporting the amounts and disclosures in the financial statements, assessing the accounting principles used and significant estimates made by management, and evaluating the overall financial statement presentation. Our audit of internal control over financial reporting included obtaining an understanding of internal control over financial reporting, assessing the risk that a material weakness exists, and testing and evaluating the design and operating effectiveness of internal control based on the assessed risk. Our audits also included performing such other procedures as we considered necessary in the circumstances. We believe that our audits provide a reasonable basis for our opinions.
A company’s internal control over financial reporting is a process designed by, or under the supervision of, the company’s principal executive and principal financial officers, or persons performing similar functions, and effected by the company’s board of directors, management, and other personnel to provide reasonable assurance regarding the reliability of financial reporting and the preparation of financial statements for external purposes in accordance with generally accepted accounting principles. A company’s internal control over financial reporting includes those policies and procedures that (1) pertain to the maintenance of records that, in reasonable detail, accurately and fairly reflect the transactions and dispositions of the assets of the company; (2) provide reasonable assurance that transactions are recorded as necessary to permit preparation of financial statements in accordance with generally accepted accounting principles, and that receipts and expenditures of the company are being made only in accordance with authorizations of management and directors of the company; and (3) provide reasonable assurance regarding prevention or timely detection of unauthorized acquisition, use, or disposition of the company’s assets that could have a material effect on the financial statements.
Because of the inherent limitations of internal control over financial reporting, including the possibility of collusion or improper management override of controls, material misstatements due to error or fraud may not be prevented or detected on a timely basis. Also, projections of any evaluation of the effectiveness of the internal control over financial reporting to future periods are subject to the risk that the controls may become inadequate because of changes in conditions, or that the degree of compliance with the policies or procedures may deteriorate.
In our opinion, the consolidated financial statements referred to above present fairly, in all material respects, the financial position of Illinois Tool Works Inc. and subsidiaries as of December 31, 2016 and 2015 and the results of their operations and their cash flows for each of the three years in the period ended December 31, 2016, in conformity with accounting principles generally accepted in the United States of America. Also, in our opinion, the Company maintained, in all material respects, effective internal control over financial reporting as of December 31, 2016, based on the criteria established in
Internal Control-Integrated Framework
(2013) issued by the Committee of Sponsoring Organizations of the Treadway Commission.
/s/ DELOITTE & TOUCHE LLP
Deloitte & Touche LLP
Chicago, Illinois
February 10, 2017
43
Illinois Tool Works Inc. and Subsidiaries
|
|
For the Years Ended December 31
|
||||||||||
|
In millions except per share amounts
|
2016
|
2015
|
2014
|
||||||||
|
Operating Revenue
|
$
|
13,599
|
|
$
|
13,405
|
|
$
|
14,484
|
|
||
|
Cost of revenue
|
7,896
|
|
7,888
|
|
8,673
|
|
|||||
|
Selling, administrative, and research and development expenses
|
2,415
|
|
2,417
|
|
2,678
|
|
|||||
|
Amortization and impairment of intangible assets
|
224
|
|
233
|
|
245
|
|
|||||
|
Operating Income
|
3,064
|
|
2,867
|
|
2,888
|
|
|||||
|
Interest expense
|
(237
|
)
|
(226
|
)
|
(250
|
)
|
|||||
|
Other income (expense)
|
81
|
|
78
|
|
61
|
|
|||||
|
Income from Continuing Operations Before Income Taxes
|
2,908
|
|
2,719
|
|
2,699
|
|
|||||
|
Income taxes
|
873
|
|
820
|
|
809
|
|
|||||
|
Income from Continuing Operations
|
2,035
|
|
1,899
|
|
1,890
|
|
|||||
|
Income from Discontinued Operations
|
—
|
|
—
|
|
1,056
|
|
|||||
|
Net Income
|
$
|
2,035
|
|
$
|
1,899
|
|
$
|
2,946
|
|
||
|
Income Per Share from Continuing Operations:
|
|||||||||||
|
Basic
|
$
|
5.73
|
|
$
|
5.16
|
|
$
|
4.70
|
|
||
|
Diluted
|
$
|
5.70
|
|
$
|
5.13
|
|
$
|
4.67
|
|
||
|
Income Per Share from Discontinued Operations:
|
|||||||||||
|
Basic
|
$
|
—
|
|
$
|
—
|
|
$
|
2.63
|
|
||
|
Diluted
|
$
|
—
|
|
$
|
—
|
|
$
|
2.61
|
|
||
|
Net Income Per Share:
|
|||||||||||
|
Basic
|
$
|
5.73
|
|
$
|
5.16
|
|
$
|
7.33
|
|
||
|
Diluted
|
$
|
5.70
|
|
$
|
5.13
|
|
$
|
7.28
|
|
||
The Notes to Financial Statements are an integral part of this statement.
44
Statement of Comprehensive Income
Illinois Tool Works Inc. and Subsidiaries
|
|
For the Years Ended December 31
|
||||||||||
|
In millions
|
2016
|
2015
|
2014
|
||||||||
|
Net Income
|
$
|
2,035
|
|
$
|
1,899
|
|
$
|
2,946
|
|
||
|
Other Comprehensive Income (Loss):
|
|||||||||||
|
Foreign currency translation adjustments, net of tax
|
(277
|
)
|
(860
|
)
|
(939
|
)
|
|||||
|
Pension and other postretirement benefit adjustments, net of tax
|
(26
|
)
|
14
|
|
(103
|
)
|
|||||
|
Comprehensive Income
|
$
|
1,732
|
|
$
|
1,053
|
|
$
|
1,904
|
|
||
The Notes to Financial Statements are an integral part of this statement.
45
Statement of Financial Position
Illinois Tool Works Inc. and Subsidiaries
|
|
December 31
|
||||||
|
In millions except per share amounts
|
2016
|
2015
|
|||||
|
Assets
|
|||||||
|
Current Assets:
|
|||||||
|
Cash and equivalents
|
$
|
2,472
|
|
$
|
3,090
|
|
|
|
Trade receivables
|
2,357
|
|
2,203
|
|
|||
|
Inventories
|
1,076
|
|
1,086
|
|
|||
|
Prepaid expenses and other current assets
|
218
|
|
341
|
|
|||
|
Total current assets
|
6,123
|
|
6,720
|
|
|||
|
Net plant and equipment
|
1,652
|
|
1,577
|
|
|||
|
Goodwill
|
4,558
|
|
4,439
|
|
|||
|
Intangible assets
|
1,463
|
|
1,560
|
|
|||
|
Deferred income taxes
|
449
|
|
346
|
|
|||
|
Other assets
|
956
|
|
1,087
|
|
|||
|
$
|
15,201
|
|
$
|
15,729
|
|
||
|
Liabilities and Stockholders’ Equity
|
|||||||
|
Current Liabilities:
|
|||||||
|
Short-term debt
|
$
|
652
|
|
$
|
526
|
|
|
|
Accounts payable
|
511
|
|
449
|
|
|||
|
Accrued expenses
|
1,202
|
|
1,136
|
|
|||
|
Cash dividends payable
|
226
|
|
200
|
|
|||
|
Income taxes payable
|
169
|
|
57
|
|
|||
|
Total current liabilities
|
2,760
|
|
2,368
|
|
|||
|
Noncurrent Liabilities:
|
|||||||
|
Long-term debt
|
7,177
|
|
6,896
|
|
|||
|
Deferred income taxes
|
134
|
|
256
|
|
|||
|
Other liabilities
|
871
|
|
981
|
|
|||
|
Total noncurrent liabilities
|
8,182
|
|
8,133
|
|
|||
|
Stockholders’ Equity:
|
|||||||
|
Common stock (par value of $0.01 per share):
|
|||||||
|
Issued- 550.0 shares in 2016 and 2015
Outstanding- 346.9 shares in 2016 and 363.7 shares in 2015
|
6
|
|
6
|
|
|||
|
Additional paid-in-capital
|
1,188
|
|
1,135
|
|
|||
|
Retained earnings
|
19,505
|
|
18,316
|
|
|||
|
Common stock held in treasury
|
(14,638
|
)
|
(12,729
|
)
|
|||
|
Accumulated other comprehensive income (loss)
|
(1,807
|
)
|
(1,504
|
)
|
|||
|
Noncontrolling interest
|
5
|
|
4
|
|
|||
|
Total stockholders’ equity
|
4,259
|
|
5,228
|
|
|||
|
$
|
15,201
|
|
$
|
15,729
|
|
||
The Notes to Financial Statements are an integral part of this statement.
46
Statement of Changes in Stockholders' Equity
Illinois Tool Works Inc. and Subsidiaries
|
In millions except per share amounts
|
Common Stock
|
Additional Paid-in Capital
|
Retained Earnings
|
Common Stock Held in Treasury
|
Accumulated Other Comprehensive Income (Loss)
|
Noncontrolling Interest
|
Total
|
||||||||||||||
|
Balance at December 31, 2013
|
$
|
6
|
|
$
|
1,046
|
|
$
|
14,943
|
|
$
|
(6,676
|
)
|
$
|
384
|
|
$
|
6
|
|
$
|
9,709
|
|
|
Net income
|
—
|
|
—
|
|
2,946
|
|
—
|
|
—
|
|
—
|
|
2,946
|
|
|||||||
|
Common stock issued for share-based awards
|
—
|
|
(26
|
)
|
—
|
|
160
|
|
—
|
|
—
|
|
134
|
|
|||||||
|
Stock-based compensation expense
|
—
|
|
39
|
|
—
|
|
—
|
|
—
|
|
—
|
|
39
|
|
|||||||
|
Tax benefits related to stock options
|
—
|
|
33
|
|
—
|
|
—
|
|
—
|
|
—
|
|
33
|
|
|||||||
|
Tax benefits related to defined contribution plans
|
—
|
|
4
|
|
—
|
|
1
|
|
—
|
|
—
|
|
5
|
|
|||||||
|
Repurchases of common stock
|
—
|
|
—
|
|
—
|
|
(4,283
|
)
|
—
|
|
—
|
|
(4,283
|
)
|
|||||||
|
Dividends declared ($1.81 per share)
|
—
|
|
—
|
|
(716
|
)
|
—
|
|
—
|
|
—
|
|
(716
|
)
|
|||||||
|
Pension and other postretirement benefit adjustments
|
—
|
|
—
|
|
—
|
|
—
|
|
(103
|
)
|
—
|
|
(103
|
)
|
|||||||
|
Currency translation adjustment
|
—
|
|
—
|
|
—
|
|
—
|
|
(939
|
)
|
—
|
|
(939
|
)
|
|||||||
|
Noncontrolling interest
|
—
|
|
—
|
|
—
|
|
—
|
|
—
|
|
(1
|
)
|
(1
|
)
|
|||||||
|
Balance at December 31, 2014
|
6
|
|
1,096
|
|
17,173
|
|
(10,798
|
)
|
(658
|
)
|
5
|
|
6,824
|
|
|||||||
|
Net income
|
—
|
|
—
|
|
1,899
|
|
—
|
|
—
|
|
—
|
|
1,899
|
|
|||||||
|
Common stock issued for share-based awards
|
—
|
|
(21
|
)
|
—
|
|
69
|
|
—
|
|
—
|
|
48
|
|
|||||||
|
Stock-based compensation expense
|
—
|
|
39
|
|
—
|
|
2
|
|
—
|
|
—
|
|
41
|
|
|||||||
|
Tax benefits related to stock options
|
—
|
|
20
|
|
—
|
|
—
|
|
—
|
|
—
|
|
20
|
|
|||||||
|
Tax benefits related to defined contribution plans
|
—
|
|
3
|
|
—
|
|
—
|
|
—
|
|
—
|
|
3
|
|
|||||||
|
Repurchases of common stock
|
—
|
|
—
|
|
—
|
|
(2,002
|
)
|
—
|
|
—
|
|
(2,002
|
)
|
|||||||
|
Dividends declared ($2.07 per share)
|
—
|
|
—
|
|
(756
|
)
|
—
|
|
—
|
|
—
|
|
(756
|
)
|
|||||||
|
Pension and other postretirement benefit adjustments
|
—
|
|
—
|
|
—
|
|
—
|
|
14
|
|
—
|
|
14
|
|
|||||||
|
Currency translation adjustment
|
—
|
|
—
|
|
—
|
|
—
|
|
(860
|
)
|
—
|
|
(860
|
)
|
|||||||
|
Noncontrolling interest
|
—
|
|
(2
|
)
|
—
|
|
—
|
|
—
|
|
(1
|
)
|
(3
|
)
|
|||||||
|
Balance at December 31, 2015
|
6
|
|
1,135
|
|
18,316
|
|
(12,729
|
)
|
(1,504
|
)
|
4
|
|
5,228
|
|
|||||||
|
Net income
|
—
|
|
—
|
|
2,035
|
|
—
|
|
—
|
|
—
|
|
2,035
|
|
|||||||
|
Common stock issued for share-based awards
|
—
|
|
(18
|
)
|
—
|
|
91
|
|
—
|
|
—
|
|
73
|
|
|||||||
|
Stock-based compensation expense
|
—
|
|
39
|
|
—
|
|
—
|
|
—
|
|
—
|
|
39
|
|
|||||||
|
Tax benefits related to stock options
|
—
|
|
29
|
|
—
|
|
—
|
|
—
|
|
—
|
|
29
|
|
|||||||
|
Tax benefits related to defined contribution plans
|
—
|
|
3
|
|
—
|
|
—
|
|
—
|
|
—
|
|
3
|
|
|||||||
|
Repurchases of common stock
|
—
|
|
—
|
|
—
|
|
(2,000
|
)
|
—
|
|
—
|
|
(2,000
|
)
|
|||||||
|
Dividends declared ($2.40 per share)
|
—
|
|
—
|
|
(846
|
)
|
—
|
|
—
|
|
—
|
|
(846
|
)
|
|||||||
|
Pension and other postretirement benefit adjustments
|
—
|
|
—
|
|
—
|
|
—
|
|
(26
|
)
|
—
|
|
(26
|
)
|
|||||||
|
Currency translation adjustment
|
—
|
|
—
|
|
—
|
|
—
|
|
(277
|
)
|
—
|
|
(277
|
)
|
|||||||
|
Noncontrolling interest
|
—
|
|
—
|
|
—
|
|
—
|
|
—
|
|
1
|
|
1
|
|
|||||||
|
Balance at December 31, 2016
|
$
|
6
|
|
$
|
1,188
|
|
$
|
19,505
|
|
$
|
(14,638
|
)
|
$
|
(1,807
|
)
|
$
|
5
|
|
$
|
4,259
|
|
The Notes to Financial Statements are an integral part of this statement.
47
Illinois Tool Works Inc. and Subsidiaries
|
|
For the Years Ended December 31
|
||||||||||
|
In millions
|
2016
|
2015
|
2014
|
||||||||
|
Cash Provided by (Used for) Operating Activities:
|
|||||||||||
|
Net income
|
$
|
2,035
|
|
$
|
1,899
|
|
$
|
2,946
|
|
||
|
Adjustments to reconcile net income to cash provided by operating activities:
|
|||||||||||
|
Depreciation
|
246
|
|
244
|
|
262
|
|
|||||
|
Amortization and impairment of intangible assets
|
224
|
|
233
|
|
245
|
|
|||||
|
Change in deferred income taxes
|
(263
|
)
|
(11
|
)
|
55
|
|
|||||
|
Provision for uncollectible accounts
|
7
|
|
7
|
|
7
|
|
|||||
|
(Income) loss from investments
|
13
|
|
(4
|
)
|
(8
|
)
|
|||||
|
(Gain) loss on sale of plant and equipment
|
1
|
|
1
|
|
2
|
|
|||||
|
(Gain) loss on discontinued operations
|
—
|
|
—
|
|
(1,718
|
)
|
|||||
|
(Gain) loss on sale of operations and affiliates
|
12
|
|
(16
|
)
|
6
|
|
|||||
|
Stock-based compensation expense
|
39
|
|
41
|
|
39
|
|
|||||
|
Gain on dividend distribution from equity investment in Wilsonart
|
(54
|
)
|
—
|
|
—
|
|
|||||
|
Other non-cash items, net
|
5
|
|
12
|
|
11
|
|
|||||
|
Change in assets and liabilities, net of acquisitions and divestitures:
|
|||||||||||
|
(Increase) decrease in—
|
|||||||||||
|
Trade receivables
|
(132
|
)
|
(42
|
)
|
(70
|
)
|
|||||
|
Inventories
|
9
|
|
25
|
|
(10
|
)
|
|||||
|
Prepaid expenses and other assets
|
(63
|
)
|
24
|
|
(98
|
)
|
|||||
|
Increase (decrease) in—
|
|||||||||||
|
Accounts payable
|
(3
|
)
|
(30
|
)
|
(20
|
)
|
|||||
|
Accrued expenses and other liabilities
|
40
|
|
(56
|
)
|
5
|
|
|||||
|
Income taxes
|
187
|
|
(27
|
)
|
33
|
|
|||||
|
Other, net
|
(1
|
)
|
(1
|
)
|
(71
|
)
|
|||||
|
Net cash provided by operating activities
|
2,302
|
|
2,299
|
|
1,616
|
|
|||||
|
Cash Provided by (Used for) Investing Activities:
|
|||||||||||
|
Acquisition of businesses (excluding cash and equivalents) and additional interest in affiliates
|
(453
|
)
|
(6
|
)
|
(45
|
)
|
|||||
|
Additions to plant and equipment
|
(273
|
)
|
(284
|
)
|
(361
|
)
|
|||||
|
Proceeds from investments
|
21
|
|
22
|
|
28
|
|
|||||
|
Dividend distribution from equity investment in Wilsonart
|
167
|
|
—
|
|
—
|
|
|||||
|
Proceeds from sale of plant and equipment
|
16
|
|
30
|
|
28
|
|
|||||
|
Net proceeds from sale of discontinued operations
|
—
|
|
—
|
|
3,191
|
|
|||||
|
Proceeds from sale of operations and affiliates
|
3
|
|
29
|
|
18
|
|
|||||
|
Other, net
|
(13
|
)
|
(1
|
)
|
(17
|
)
|
|||||
|
Net cash provided by (used for) investing activities
|
(532
|
)
|
(210
|
)
|
2,842
|
|
|||||
|
Cash Provided by (Used for) Financing Activities:
|
|||||||||||
|
Cash dividends paid
|
(821
|
)
|
(742
|
)
|
(711
|
)
|
|||||
|
Issuance of common stock
|
84
|
|
59
|
|
148
|
|
|||||
|
Repurchases of common stock
|
(2,000
|
)
|
(2,002
|
)
|
(4,346
|
)
|
|||||
|
Net proceeds from (repayments of) debt with original maturities of three months or less
|
(526
|
)
|
(946
|
)
|
(239
|
)
|
|||||
|
Proceeds from debt with original maturities of more than three months
|
992
|
|
1,099
|
|
3,329
|
|
|||||
|
Repayments of debt with original maturities of more than three months
|
(1
|
)
|
(2
|
)
|
(1,751
|
)
|
|||||
|
Excess tax benefits from stock-based compensation
|
29
|
|
20
|
|
33
|
|
|||||
|
Other, net
|
(12
|
)
|
(12
|
)
|
(14
|
)
|
|||||
|
Net cash provided by (used for) financing activities
|
(2,255
|
)
|
(2,526
|
)
|
(3,551
|
)
|
|||||
|
Effect of Exchange Rate Changes on Cash and Equivalents
|
(133
|
)
|
(463
|
)
|
(535
|
)
|
|||||
|
Cash and Equivalents:
|
|||||||||||
|
Increase (decrease) during the year
|
(618
|
)
|
(900
|
)
|
372
|
|
|||||
|
Beginning of year
|
3,090
|
|
3,990
|
|
3,618
|
|
|||||
|
End of year
|
$
|
2,472
|
|
$
|
3,090
|
|
$
|
3,990
|
|
||
|
Supplementary Cash Flow Information:
|
|||||||||||
|
Cash Paid During the Year for Interest
|
$
|
212
|
|
$
|
200
|
|
$
|
236
|
|
||
|
Cash Paid During the Year for Income Taxes, Net of Refunds
|
$
|
920
|
|
$
|
775
|
|
$
|
1,502
|
|
||
|
Liabilities Assumed from Acquisitions
|
$
|
150
|
|
$
|
1
|
|
$
|
4
|
|
||
The Notes to Financial Statements are an integral part of this statement.
48
Notes to Financial Statements
(1) Description of Business and Summary of Significant Accounting Policies
Description of business
— Illinois Tool Works Inc. (the "Company" or "ITW") is a global manufacturer of a diversified range of industrial products and equipment with approximately
85
divisions in
57
countries.
The Company primarily serves the automotive OEM/tiers, commercial food equipment, construction, general industrial, and automotive aftermarket end markets.
Consolidation and translation
— The financial statements include the Company and its majority-owned subsidiaries. The Company follows the equity method of accounting for investments where the Company has a significant influence but not a controlling interest. Intercompany transactions are eliminated from the financial statements. Foreign subsidiaries’ assets and liabilities are translated to U.S. dollars at end-of-period exchange rates. Revenues and expenses are translated at average rates for the period. Translation adjustments are reported as a component of accumulated other comprehensive income (loss) in stockholders’ equity.
Reclassifications
— Certain reclassifications of prior year data have been made to conform to current year reporting.
Use of estimates
— The preparation of the Company’s financial statements in conformity with generally accepted accounting principles requires management to make estimates and assumptions that affect the amounts reported in the financial statements and the notes to financial statements. Actual results could differ from those estimates.
Acquisitions
— The Company accounts for acquisitions under the acquisition method, in which assets acquired and liabilities assumed are recorded at fair value as of the date of acquisition. The operating results of the acquired companies are included in the Company’s consolidated financial statements from the date of acquisition.
Operating revenue
— Operating revenue is recognized when persuasive evidence of an arrangement exists, product has shipped and the risks and rewards of ownership have transferred or services have been rendered, the price to the customer is fixed or determinable, and collectibility is reasonably assured, which is generally at the time of product shipment. Typical sales arrangements are for standard products and provide for transfer of ownership and risk of loss at the time of shipment. In limited circumstances where significant obligations to the customer are unfulfilled at the time of shipment, typically involving installation and customer acceptance, revenue recognition is deferred until such obligations have been completed. Customer allowances and rebates, consisting primarily of volume discounts and other short-term incentive programs, are estimated at the time of sale based on historical experience and known trends and are recorded as a reduction in reported revenues.
Research and development expenses
— Research and development expenses are recorded as expense in the year incurred. These costs were
$223 million
in
2016
,
$218 million
in
2015
and
$227 million
in
2014
.
Advertising expenses
— Advertising expenses are recorded as expense in the year incurred. These costs were
$58 million
in
2016
,
$58
million in
2015
and
$66
million in
2014
.
Income taxes
— The Company utilizes the asset and liability method of accounting for income taxes. Deferred income taxes are determined based on the estimated future tax effects of differences between the financial and tax bases of assets and liabilities given the provisions of the enacted tax laws. Valuation allowances are established when it is estimated that it is more likely than not that the tax benefit of the deferred tax asset will not be realized.
Cash and equivalents
— Cash and equivalents include cash on hand and instruments having original maturities of three months or less. Cash and equivalents are stated at cost, which approximates fair value.
49
Trade receivables
— Trade receivables are net of allowances for doubtful accounts which includes reserves for uncollectible accounts, customer credits and cash discounts. The Company estimates the allowance for uncollectible accounts based on the greater of a specific reserve or a reserve calculated based on the historical write-off percentage over the last two years. In addition, reserves for customer credits and cash discounts are estimated based on past experience. The changes in the allowance for doubtful accounts during
2016
,
2015
and
2014
were as follows:
|
In millions
|
2016
|
2015
|
2014
|
|||||||||
|
Beginning balance
|
$
|
42
|
|
$
|
43
|
|
$
|
46
|
|
|||
|
Provision charged to expense
|
7
|
|
7
|
|
7
|
|
||||||
|
Write-offs, net of recoveries
|
(6
|
)
|
(5
|
)
|
(7
|
)
|
||||||
|
Acquisitions and divestitures
|
1
|
|
—
|
|
—
|
|
||||||
|
Foreign currency translation
|
(1
|
)
|
(3
|
)
|
(3
|
)
|
||||||
|
Ending balance
|
$
|
43
|
|
$
|
42
|
|
$
|
43
|
|
|||
Inventories
— Inventories are stated at the lower of cost or net realizable value and include material, labor and factory overhead. The last-in, first-out ("LIFO") method is used to determine the cost of inventories at certain U.S. businesses. The first-in, first-out ("FIFO") method, which approximates current cost, is used for all other inventories. Inventories priced at LIFO were approximately
22%
of total inventories as of both December 31,
2016
and
2015
. If the FIFO method was used for all inventories, total inventories would have been approximately
$86 million
and
$81 million
higher than reported at December 31,
2016
and
2015
, respectively. The major classes of inventory at December 31,
2016
and
2015
were as follows:
|
In millions
|
2016
|
2015
|
||||||
|
Raw material
|
$
|
407
|
|
$
|
415
|
|
||
|
Work-in-process
|
126
|
|
130
|
|
||||
|
Finished goods
|
629
|
|
622
|
|
||||
|
LIFO reserve
|
(86
|
)
|
(81
|
)
|
||||
|
Total inventories
|
$
|
1,076
|
|
$
|
1,086
|
|
||
Net plant and equipment
— Net plant and equipment are stated at cost, less accumulated depreciation. Renewals and improvements that increase the useful life of plant and equipment are capitalized. Maintenance and repairs are charged to expense as incurred. Net plant and equipment consisted of the following at December 31,
2016
and
2015
:
|
In millions
|
2016
|
2015
|
||||||
|
Land
|
$
|
186
|
|
$
|
179
|
|
||
|
Buildings and improvements
|
1,297
|
|
1,272
|
|
||||
|
Machinery and equipment
|
3,036
|
|
2,972
|
|
||||
|
Equipment leased to others
|
160
|
|
156
|
|
||||
|
Construction in progress
|
104
|
|
76
|
|
||||
|
Gross plant and equipment
|
4,783
|
|
4,655
|
|
||||
|
Accumulated depreciation
|
(3,131
|
)
|
(3,078
|
)
|
||||
|
Net plant and equipment
|
$
|
1,652
|
|
$
|
1,577
|
|
||
The Company’s U.S. businesses primarily compute depreciation on an accelerated basis. The majority of the Company's international businesses compute depreciation on a straight-line basis. The ranges of useful lives used to depreciate plant and equipment are as follows:
|
Buildings and improvements
|
5—50 years
|
|
Machinery and equipment
|
3—12 years
|
|
Equipment leased to others
|
Term of lease
|
50
Depreciation was
$246
million in
2016
,
$244
million in
2015
and
$262
million in
2014
. There was
no
depreciation included in Income from discontinued operations in
2014
.
Goodwill and intangible assets
— Goodwill represents the excess cost over fair value of the net assets of acquired businesses. The Company does not amortize goodwill and intangible assets that have indefinite lives. Amortizable intangible assets are being amortized on a straight-line basis over their estimated useful lives of
3
to
20
years.
The Company performs an impairment assessment of goodwill and intangible assets with indefinite lives annually, or more frequently if triggering events occur, based on the estimated fair value of the related reporting unit or intangible asset. Fair value is defined as the price that would be received to sell an asset or paid to transfer a liability in an orderly transaction between market participants.
When performing its annual impairment assessment, the Company evaluates the goodwill assigned to each of its reporting units for potential impairment by comparing the estimated fair value of the relevant reporting unit to the carrying value. The Company uses various Level 2 and Level 3 valuation techniques to determine the fair value of its reporting units, including discounting estimated future cash flows based on a detailed cash flow forecast prepared by the relevant reporting unit and market multiples of relevant public companies. If the fair value of a reporting unit is less than its carrying value, an impairment loss, if any, is recorded for the difference between the implied fair value and the carrying value of the reporting unit's goodwill.
The Company's indefinite-lived intangible assets consist of trademarks and brands. The estimated fair values of these intangible assets are determined based on a Level 3 valuation method using a relief-of-royalty income approach derived from internally forecasted revenues of the related products. If the fair value of the trademark or brand is less than its carrying value, an impairment loss is recorded for the difference between the estimated fair value and carrying value of the intangible asset.
Accrued warranties
— The Company accrues for product warranties based on historical experience. The changes in accrued warranties during
2016
,
2015
and
2014
were as follows:
|
In millions
|
2016
|
2015
|
2014
|
|||||||||
|
Beginning balance
|
$
|
46
|
|
$
|
49
|
|
$
|
50
|
|
|||
|
Charges
|
(41
|
)
|
(37
|
)
|
(41
|
)
|
||||||
|
Provision charged to expense
|
42
|
|
36
|
|
43
|
|
||||||
|
Acquisitions and divestitures
|
1
|
|
—
|
|
—
|
|
||||||
|
Foreign currency translation
|
(3
|
)
|
(2
|
)
|
(3
|
)
|
||||||
|
Ending balance
|
$
|
45
|
|
$
|
46
|
|
$
|
49
|
|
|||
New Accounting Pronouncements
In May 2014, the Financial Accounting Standards Board (the "FASB") issued authoritative guidance to change the criteria for revenue recognition. The core principle of the new standard is that revenue should be recognized to depict the transfer of promised goods or services to customers in an amount that reflects the consideration to which the entity expects to be entitled in exchange for those goods or services. In addition, several new revenue recognition disclosures will be required. This guidance is effective for the Company beginning January 1, 2018, with early adoption permitted. The Company expects to adopt the new revenue accounting guidance effective January 1, 2018 and is in the process of completing its analysis of the impact this guidance will have on the consolidated financial statements and related disclosures.
In February 2016, the FASB issued authoritative guidance to change the criteria for recognizing leasing transactions. Under the new guidance, a lessee will be required to recognize a lease liability and lease asset for all leases, including operating leases, with a lease term greater than twelve months in the statement of financial position. Subsequent measurement, including presentation of expenses and cash flows, will depend on the classification of the lease as either a financing or operating lease. In addition, several new disclosures will be required. This guidance is effective for the Company beginning January 1, 2019, with early adoption permitted. While the Company has not yet completed its evaluation of the impact the new lease accounting guidance will have on the consolidated financial statements and related disclosures, the Company expects to recognize right of use assets and liabilities for its operating leases in the statement of financial position upon adoption.
51
In March 2016, the FASB issued authoritative guidance that includes several changes to simplify the accounting for stock-based compensation, including the accounting for income taxes, forfeitures, statutory tax withholding requirements and classification of tax benefits in the statement of cash flows. Among the more significant changes, the new guidance requires that the income tax effects associated with the settlement of stock-based awards after adoption of the guidance be recognized through income tax expense rather than directly in equity. Additionally, the income tax effects related to excess tax benefits will be presented as an operating cash flow in the statement of cash flows rather than a financing activity for all current and prior periods presented. The Company adopted this guidance effective January 1, 2017. For the twelve months ended December 31, 2016 and 2015, the Company had classified
$29 million
and
$20 million
, respectively, of excess tax benefits as a financing activity in the statement of cash flows which will be presented as an operating cash flow under the new guidance. The expected effect on income tax expense or net cash provided from operating activities related to stock-based awards settled after adoption of the new guidance will depend on inputs such as the stock price at the time of settlement and the number of awards settled in the period presented.
In October 2016, the FASB issued authoritative guidance requiring the recognition of the income tax consequences of an intra-entity transfer of an asset, other than inventory, when the transfer occurs rather than when transferred to a third party as required under the current guidance. The new guidance is effective for the Company beginning January 1, 2018, with early adoption permitted. The Company is currently assessing the potential impact the guidance will have upon adoption.
In January 2017, the FASB issued authoritative guidance that simplifies the assessment of goodwill for impairment when the estimated fair value of a reporting unit is less than its carrying value by eliminating the requirement to determine the fair value of goodwill. Under the new guidance, the amount of goodwill impairment will be determined by the amount the carrying value of the reporting unit exceeds its fair value. The new guidance is effective for the Company beginning January 1, 2020, with early adoption permitted. The Company performs its annual goodwill impairment assessment process in the third quarter, or more frequently if triggering events occur. Adoption of this new guidance is not expected to have a material impact on the Company's operating results, financial position or cash flows.
(2) Discontinued Operations
In April 2014, the Financial Accounting Standards Board ("FASB") issued authoritative guidance to change the criteria for reporting discontinued operations. Under the new guidance, only disposals representing a strategic shift in a company's operations and financial results should be reported as discontinued operations. In addition, disclosure of the pre-tax income attributable to a disposal of a significant part of an organization that does not qualify as a discontinued operation is required. The Company adopted this new guidance effective January 1, 2015. The new guidance applies prospectively to new disposals and new classifications of disposal groups held for sale after such date. There were no discontinued operations during 2015 and 2016 under this new accounting guidance.
Third Quarter 2013 Discontinued Operations
— In February 2013, the Company announced that it was initiating a review process to explore strategic alternatives for its Industrial Packaging segment. In September 2013, the Company’s Board of Directors authorized a plan to commence a sale process for the Industrial Packaging segment. The Company classified the Industrial Packaging segment as held for sale beginning in the third quarter of 2013 and no longer presented this segment as part of its continuing operations.
On February 6, 2014, the Company announced that it had signed a definitive agreement to sell its Industrial Packaging business to The Carlyle Group for
$3.2 billion
. The transaction was completed on May 1, 2014, resulting in a pre-tax gain of $
1.7 billion
($
1.1 billion
after-tax) in the second quarter of 2014 which was included in Income from discontinued operations.
In the third quarter of 2013, the Company also committed to plans for the divestiture of a construction distribution business previously included in the Construction Products segment. This business was classified as held for sale beginning in the third quarter of 2013 and was sold in the second quarter of 2014.
First Quarter 2013 Discontinued Operations
— In the first quarter of 2013, the Company committed to a plan for the divestiture of a construction distribution business previously included in the Construction Products segment. This business was classified as held for sale beginning in the first quarter of 2013 and was sold in the second quarter of 2014.
52
The operating results of the businesses discussed above are reported as discontinued operations in the statement of income for the applicable periods presented. Results of the discontinued operations for the year ended December 31,
2014
were as follows:
|
In millions
|
2014
|
|||
|
Operating revenue
|
$
|
798
|
|
|
|
Income before income taxes
|
$
|
1,805
|
|
|
|
Income tax expense
|
(749
|
)
|
||
|
Income from discontinued operations
|
$
|
1,056
|
|
|
Included in income before income taxes from discontinued operations for 2014 are net gains on disposal of
$1.7 billion
(
$1.1 billion
after-tax) primarily related to the sale of the Industrial Packaging business. Income tax expense from discontinued operations for 2014 included
$175 million
of U.S. income tax expense related to the repatriation of approximately
$1.3 billion
of international proceeds from the sale of the Industrial Packaging business.
(3) Acquisitions
Net cash paid for acquisitions during 2016, 2015, and 2014 was
$453 million
,
$6 million
, and
$45 million
, respectively. Acquisitions, individually and in the aggregate, did not materially affect the Company's results of operations or financial position for any period presented.
The net cash paid for acquisitions in 2016 primarily related to the acquisition of the Engineered Fasteners and Components ("EF&C") business from ZF TRW on July 1, 2016 for a purchase price of approximately
$450 million
. EF&C had operating revenue of
$245 million
for the six months ended December 31, 2016 which was reported within the Company’s Automotive OEM segment. As a result of the EF&C transaction, the Company recorded
$187 million
of goodwill and
$135 million
of amortizable intangible assets primarily related to customer relationships and technology. The Company expects goodwill of
$104 million
related to the transaction will be tax deductible. The fair values of the intangible assets were estimated based on discounted cash flow and market-based valuation models using Level 2 and Level 3 inputs and assumptions. The intangible assets are expected to be amortized on a straight-line basis over their estimated useful lives ranging from
4
to
17 years
, with a weighted average amortization period of
16 years
. Subsequent purchase accounting adjustments may change the initial amounts recorded, including goodwill and intangible assets, primarily due to the completion of valuations. The allocation of purchase price will be completed as soon as practicable, but no later than one year from the acquisition date.
(4) Other Income (Expense)
Other income (expense) consisted of the following:
|
In millions
|
2016
|
2015
|
2014
|
|||||||||
|
Interest income
|
$
|
38
|
|
$
|
52
|
|
$
|
65
|
|
|||
|
Gain (loss) on disposal of operations and affiliates
|
(12
|
)
|
16
|
|
(6
|
)
|
||||||
|
Gain (loss) on foreign currency transactions, net
|
9
|
|
5
|
|
8
|
|
||||||
|
Income (loss) from investments
|
(13
|
)
|
4
|
|
8
|
|
||||||
|
Equity income (loss) in Wilsonart
|
61
|
|
(4
|
)
|
(9
|
)
|
||||||
|
Other, net
|
(2
|
)
|
5
|
|
(5
|
)
|
||||||
|
Total other income (expense)
|
$
|
81
|
|
$
|
78
|
|
$
|
61
|
|
|||
In the fourth quarter of 2012, the Company divested a
51%
majority interest in its former Decorative Surfaces segment to certain funds managed by Clayton, Dubilier & Rice, LLC ("CD&R"). As a result of the transaction, the Company owns common units (the "Common Units") of Wilsonart International Holdings LLC ("Wilsonart") initially representing approximately
49%
(on an as-converted basis) of the total outstanding equity. CD&R owns cumulative convertible participating preferred units (the "Preferred Units") of Wilsonart representing approximately
51%
(on an as-converted basis) of the total outstanding equity. The Preferred Units rank senior to the Common Units as to dividends and liquidation preference, and accrue dividends at a rate of
10%
per annum. Due to the Company's continuing involvement through its
49%
ownership interest in Wilsonart, the former Decorative Surfaces segment was not presented as discontinued operations. The
53
ownership interest in Wilsonart is reported using the equity method of accounting. The Company's proportionate share in income (loss) of Wilsonart is reported in Other income (expense) in the consolidated statement of income. As the Company's investment in Wilsonart is structured as a partnership for U.S. tax purposes, U.S. taxes are recorded separately from the equity investment.
Equity income (loss) in Wilsonart includes a
$54 million
pre-tax gain in 2016 resulting from a
$167 million
cash dividend distribution from Wilsonart which exceeded the Company's equity investment balance. Subsequent to the dividend distribution, the equity investment balance in Wilsonart was reduced to
zero
and future equity investment income will not be recognized until the gain is recaptured.
(5) Income Taxes
Provision for income taxes
— The components of the provision for income taxes were as follows:
|
In millions
|
2016
|
2015
|
2014
|
|||||||||
|
U.S. federal income taxes:
|
||||||||||||
|
Current
|
$
|
756
|
|
$
|
503
|
|
$
|
413
|
|
|||
|
Deferred
|
(224
|
)
|
8
|
|
121
|
|
||||||
|
Total U.S. federal income taxes
|
532
|
|
511
|
|
534
|
|
||||||
|
Foreign income taxes:
|
||||||||||||
|
Current
|
290
|
|
310
|
|
163
|
|
||||||
|
Deferred
|
(5
|
)
|
(11
|
)
|
66
|
|
||||||
|
Benefit of net operating loss carryforwards
|
—
|
|
(48
|
)
|
(13
|
)
|
||||||
|
Total foreign income taxes
|
285
|
|
251
|
|
216
|
|
||||||
|
State income taxes:
|
||||||||||||
|
Current
|
90
|
|
66
|
|
50
|
|
||||||
|
Deferred
|
(34
|
)
|
(8
|
)
|
9
|
|
||||||
|
Total state income taxes
|
56
|
|
58
|
|
59
|
|
||||||
|
Total provision for income taxes
|
$
|
873
|
|
$
|
820
|
|
$
|
809
|
|
|||
Income from continuing operations before income taxes for domestic and foreign operations was as follows:
|
In millions
|
2016
|
2015
|
2014
|
|||||||||
|
Domestic
|
$
|
1,653
|
|
$
|
1,660
|
|
$
|
1,669
|
|
|||
|
Foreign
|
1,255
|
|
1,059
|
|
1,030
|
|
||||||
|
Total income from continuing operations before income taxes
|
$
|
2,908
|
|
$
|
2,719
|
|
$
|
2,699
|
|
|||
The reconciliation between the U.S. federal statutory tax rate and the effective tax rate was as follows:
|
2016
|
2015
|
2014
|
|||||||
|
U.S. federal statutory tax rate
|
35.0
|
%
|
35.0
|
%
|
35.0
|
%
|
|||
|
State income taxes, net of U.S. federal tax benefit
|
1.3
|
|
1.4
|
|
1.6
|
|
|||
|
Differences between U.S. federal statutory and foreign tax rates
|
(3.6
|
)
|
(3.1
|
)
|
(3.5
|
)
|
|||
|
Nontaxable foreign interest income
|
(2.1
|
)
|
(3.3
|
)
|
(3.6
|
)
|
|||
|
Tax effect of foreign dividends
|
1.5
|
|
2.8
|
|
2.1
|
|
|||
|
Tax relief for U.S. manufacturers
|
(1.4
|
)
|
(1.6
|
)
|
(1.5
|
)
|
|||
|
Other, net
|
(0.7
|
)
|
(1.1
|
)
|
(0.1
|
)
|
|||
|
Effective tax rate
|
30.0
|
%
|
30.1
|
%
|
30.0
|
%
|
|||
Deferred U.S. federal income taxes and foreign withholding taxes have not been provided on the remaining undistributed earnings of certain international subsidiaries as these earnings are considered permanently invested. Undistributed earnings of
54
these subsidiaries were approximately
$8.8 billion
and
$8.7 billion
as of December 31,
2016
and
2015
, respectively. Upon repatriation of these earnings to the U.S. in the form of dividends or other distribution of earnings, the Company may be subject to U.S. income taxes and foreign withholding taxes. The actual U.S. tax cost would depend on income tax laws and circumstances at the time of distribution. Determination of the related tax liability is not practicable because of the complexities associated with the hypothetical calculation.
Deferred tax assets and liabilities
— The components of deferred income tax assets and liabilities at December 31,
2016
and
2015
were as follows:
|
|
2016
|
2015
|
||||||||||||||
|
In millions
|
Asset
|
Liability
|
Asset
|
Liability
|
||||||||||||
|
Goodwill and intangible assets
|
$
|
240
|
|
$
|
(716
|
)
|
$
|
282
|
|
$
|
(734
|
)
|
||||
|
Inventory reserves, capitalized tax cost and LIFO inventory
|
40
|
|
(5
|
)
|
42
|
|
(5
|
)
|
||||||||
|
Investments
|
23
|
|
(206
|
)
|
25
|
|
(298
|
)
|
||||||||
|
Plant and equipment
|
23
|
|
(79
|
)
|
28
|
|
(84
|
)
|
||||||||
|
Accrued expenses and reserves
|
76
|
|
—
|
|
79
|
|
—
|
|
||||||||
|
Employee benefit accruals
|
306
|
|
—
|
|
314
|
|
—
|
|
||||||||
|
Foreign tax credit carryforwards
|
6
|
|
—
|
|
216
|
|
—
|
|
||||||||
|
Net operating loss carryforwards
|
610
|
|
—
|
|
643
|
|
—
|
|
||||||||
|
Capital loss carryforwards
|
42
|
|
—
|
|
39
|
|
—
|
|
||||||||
|
Allowances for uncollectible accounts
|
13
|
|
—
|
|
13
|
|
—
|
|
||||||||
|
Pension liabilities
|
25
|
|
—
|
|
13
|
|
—
|
|
||||||||
|
Deferred intercompany deductions
|
430
|
|
—
|
|
—
|
|
—
|
|
||||||||
|
Unrealized loss (gain) on foreign debt instruments
|
—
|
|
(140
|
)
|
—
|
|
(115
|
)
|
||||||||
|
Other
|
97
|
|
(16
|
)
|
109
|
|
(10
|
)
|
||||||||
|
Gross deferred income tax assets (liabilities)
|
1,931
|
|
(1,162
|
)
|
1,803
|
|
(1,246
|
)
|
||||||||
|
Valuation allowances
|
(454
|
)
|
—
|
|
(467
|
)
|
—
|
|
||||||||
|
Total deferred income tax assets (liabilities)
|
$
|
1,477
|
|
$
|
(1,162
|
)
|
$
|
1,336
|
|
$
|
(1,246
|
)
|
||||
The valuation allowances recorded at December 31,
2016
and
2015
related primarily to certain net operating loss carryforwards, capital loss carryforwards and foreign tax credit carryforwards. As of
December 31, 2016
, the Company has utilized all realizable foreign tax credit carryforwards.
At
December 31, 2016
, the Company had net operating loss carryforwards available to offset future taxable income in the U.S. and certain foreign jurisdictions, which expire as follows:
|
Gross Carryforwards Related
|
|||
|
In millions
|
to Net Operating Losses
|
||
|
2017
|
$
|
9
|
|
|
2018
|
7
|
|
|
|
2019
|
8
|
|
|
|
2020
|
75
|
|
|
|
2021
|
80
|
|
|
|
2022
|
21
|
|
|
|
2023
|
18
|
|
|
|
2024-2036
|
31
|
|
|
|
Do not expire
|
1,956
|
|
|
|
Total gross carryforwards related to net operating losses
|
$
|
2,205
|
|
55
Unrecognized tax benefit
s— The changes in the amount of unrecognized tax benefits during
2016
,
2015
and
2014
were as follows:
|
In millions
|
2016
|
2015
|
2014
|
|||||||||
|
Beginning balance
|
$
|
259
|
|
$
|
218
|
|
$
|
268
|
|
|||
|
Additions based on tax positions related to the current year
|
19
|
|
39
|
|
23
|
|
||||||
|
Additions for tax positions of prior years
|
126
|
|
54
|
|
12
|
|
||||||
|
Reductions for tax positions of prior years
|
(97
|
)
|
(41
|
)
|
(59
|
)
|
||||||
|
Settlements
|
(96
|
)
|
(6
|
)
|
(18
|
)
|
||||||
|
Foreign currency translation
|
(1
|
)
|
(5
|
)
|
(8
|
)
|
||||||
|
Ending balance
|
$
|
210
|
|
$
|
259
|
|
$
|
218
|
|
|||
Included in the balance at December 31,
2016
were approximately
$176
million of unrecognized tax benefits that, if recognized, would impact the Company’s effective tax rate.
During the fourth quarter of 2016, the Company effectively settled with the Internal Revenue Service on issues identified during its 2012-2013 audit, which primarily related to deferred gain recognition and foreign tax credits. Based on this agreement, the Company decreased its unrecognized tax benefits by approximately
$96 million
.
The Company and its subsidiaries file tax returns in the U.S. and various state, local and foreign jurisdictions. These tax returns are routinely audited by the tax authorities in these jurisdictions including the Internal Revenue Service, Her Majesty's Revenue and Customs, German Fiscal Authority, French Fiscal Authority, and Australian Tax Office, and a number of these audits are currently ongoing, which may increase the amount of the unrecognized tax benefits in future periods. Due to the ongoing audits, the Company believes it is reasonably possible that within the next twelve months the amount of the Company's unrecognized tax benefits may be decreased by approximately
$57 million
related predominantly to various intercompany transactions. The Company has recorded its best estimate of the potential exposure for these issues. The following table summarizes the open tax years for the Company’s major jurisdictions:
|
Jurisdiction
|
Open Tax Years
|
|
|
United States – Federal
|
2012-2016
|
|
|
United Kingdom
|
2013-2016
|
|
|
Germany
|
2009-2016
|
|
|
France
|
2013-2016
|
|
|
Australia
|
2012-2016
|
|
The Company recognizes interest and penalties related to income tax matters in income tax expense. The accrual for interest and penalties as of December 31,
2016
and
2015
was
$28
million and
$32
million, respectively.
On February 18, 2014, the Company received a Notice of Deficiency ("NOD") from the IRS asserting that a non-taxable return of capital received from a subsidiary was a taxable dividend distribution. The NOD assesses additional taxes of
$70 million
for the 2006 tax year, plus interest and penalties. In May 2014, the Company petitioned the United States Tax Court to challenge the NOD. The Company's petition was subsequently denied and the case proceeded to court with the trial taking place in the third quarter of 2016. Final decision by the tax court is expected in 2017. Although the court's final decision cannot be predicted with certainty, the Company believes its position continues to be supportable. Accordingly,
no
reserve has been recorded related to this matter.
56
(6) Income Per Share from Continuing Operations
Income per share from continuing operations is computed by dividing income from continuing operations by the weighted-average number of shares outstanding for the period. Income from continuing operations per diluted share is computed by dividing income from continuing operations by the weighted-average number of shares assuming dilution for stock options and restricted stock units. Dilutive shares reflect the potential additional shares that would be outstanding if the dilutive stock options outstanding were exercised and the unvested restricted stock units vested during the period. The computation of income per share from continuing operations was as follows:
|
In millions except per share amounts
|
2016
|
2015
|
2014
|
|||||||||
|
Income from continuing operations
|
$
|
2,035
|
|
$
|
1,899
|
|
$
|
1,890
|
|
|||
|
Income per share from continuing operations—Basic:
|
||||||||||||
|
Weighted-average common shares
|
355.0
|
|
367.9
|
|
401.7
|
|
||||||
|
Income per share from continuing operations—Basic
|
$
|
5.73
|
|
$
|
5.16
|
|
$
|
4.70
|
|
|||
|
Income per share from continuing operations—Diluted:
|
||||||||||||
|
Weighted-average common shares
|
355.0
|
|
367.9
|
|
401.7
|
|
||||||
|
Effect of dilutive stock options and restricted stock units
|
2.1
|
|
2.2
|
|
2.9
|
|
||||||
|
Weighted-average common shares assuming dilution
|
357.1
|
|
370.1
|
|
404.6
|
|
||||||
|
Income per share from continuing operations—Diluted
|
$
|
5.70
|
|
$
|
5.13
|
|
$
|
4.67
|
|
|||
Options that were considered antidilutive were not included in the computation of diluted income per share from continuing operations. There were
no
antidilutive options outstanding as of
December 31, 2016
,
0.6
million antidilutive options outstanding as of
December 31, 2015
and
no
antidilutive options outstanding as of
December 31, 2014
.
(7) Goodwill and Intangible Assets
The changes in the carrying amount of goodwill for the years ended
December 31, 2016
and
2015
were as follows:
|
In millions
|
Automotive OEM
|
Test & Measurement and Electronics
|
Food Equipment
|
Polymers & Fluids
|
Welding
|
Construction Products
|
Specialty Products
|
Total
|
|||||||||||||||||||||||
|
Balance, December 31, 2014
|
$
|
294
|
|
$
|
1,390
|
|
$
|
276
|
|
$
|
964
|
|
$
|
277
|
|
$
|
542
|
|
$
|
924
|
|
$
|
4,667
|
|
|||||||
|
2015 activity:
|
|||||||||||||||||||||||||||||||
|
Acquisitions & divestitures
|
—
|
|
—
|
|
—
|
|
(6
|
)
|
1
|
|
—
|
|
—
|
|
(5
|
)
|
|||||||||||||||
|
Impairment charges
|
—
|
|
—
|
|
—
|
|
—
|
|
—
|
|
—
|
|
—
|
|
—
|
|
|||||||||||||||
|
Foreign currency translation
|
(17
|
)
|
(35
|
)
|
(17
|
)
|
(64
|
)
|
(17
|
)
|
(26
|
)
|
(47
|
)
|
(223
|
)
|
|||||||||||||||
|
Balance, December 31, 2015
|
277
|
|
1,355
|
|
259
|
|
894
|
|
261
|
|
516
|
|
877
|
|
4,439
|
|
|||||||||||||||
|
2016 activity:
|
|||||||||||||||||||||||||||||||
|
Acquisitions & divestitures
|
187
|
|
1
|
|
—
|
|
(2
|
)
|
—
|
|
(1
|
)
|
1
|
|
186
|
|
|||||||||||||||
|
Impairment charges
|
—
|
|
—
|
|
—
|
|
—
|
|
—
|
|
—
|
|
—
|
|
—
|
|
|||||||||||||||
|
Foreign currency translation
|
(8
|
)
|
(20
|
)
|
(10
|
)
|
(3
|
)
|
(1
|
)
|
(7
|
)
|
(18
|
)
|
(67
|
)
|
|||||||||||||||
|
Balance, December 31, 2016
|
$
|
456
|
|
$
|
1,336
|
|
|
$
|
249
|
|
$
|
889
|
|
$
|
260
|
|
$
|
508
|
|
$
|
860
|
|
$
|
4,558
|
|
||||||
|
Cumulative goodwill impairment charges, December 31, 2016
|
$
|
24
|
|
$
|
83
|
|
$
|
60
|
|
$
|
15
|
|
$
|
5
|
|
$
|
7
|
|
$
|
46
|
|
$
|
240
|
|
|||||||
57
Intangible assets as of
December 31, 2016
and
2015
were as follows:
|
|
2016
|
2015
|
||||||||||||||||||||||
|
In millions
|
Cost
|
Accumulated
Amortization
|
Net
|
Cost
|
Accumulated
Amortization
|
Net
|
||||||||||||||||||
|
Amortizable intangible assets:
|
||||||||||||||||||||||||
|
Customer lists and relationships
|
$
|
1,744
|
|
$
|
(1,060
|
)
|
$
|
684
|
|
$
|
1,630
|
|
$
|
(943
|
)
|
$
|
687
|
|
||||||
|
Trademarks and brands
|
733
|
|
(344
|
)
|
389
|
|
724
|
|
(298
|
)
|
426
|
|
||||||||||||
|
Patents and proprietary technology
|
620
|
|
(432
|
)
|
188
|
|
618
|
|
(397
|
)
|
221
|
|
||||||||||||
|
Other
|
461
|
|
(444
|
)
|
17
|
|
475
|
|
(446
|
)
|
29
|
|
||||||||||||
|
Total amortizable intangible assets
|
3,558
|
|
(2,280
|
)
|
1,278
|
|
3,447
|
|
(2,084
|
)
|
1,363
|
|
||||||||||||
|
Indefinite-lived intangible assets:
|
||||||||||||||||||||||||
|
Trademarks and brands
|
185
|
|
—
|
|
185
|
|
197
|
|
—
|
|
197
|
|
||||||||||||
|
Total intangible assets
|
$
|
3,743
|
|
$
|
(2,280
|
)
|
$
|
1,463
|
|
$
|
3,644
|
|
$
|
(2,084
|
)
|
$
|
1,560
|
|
||||||
The Company performed its annual impairment assessment of goodwill and indefinite-lived intangible assets in the third quarter of 2016, 2015 and 2014. The 2016 assessment resulted in
no
impairment charges. In 2015, the Company recorded a
$2 million
indefinite-lived intangible asset impairment charge related to a brand in the Polymers & Fluids segment which had a fair value of
$24 million
and a carrying value of
$26 million
. In 2014, the Company recorded a
$3 million
indefinite-lived intangible asset impairment charge related to certain brands in the Polymers & Fluids and Test & Measurement and Electronics segments which had a total fair value of
$8 million
and a carrying value of
$11 million
. The 2015 and 2014 impairments were included in Amortization and impairment of intangible assets in the statement of income.
For the years ended
December 31, 2016
,
2015
and
2014
, amortization expense and impairment of intangible assets was
$224 million
,
$233 million
, and
$245 million
, respectively.
The estimated amortization expense of intangible assets for the future years ending December 31 is as follows:
|
In millions
|
|
||
|
2017
|
$
|
203
|
|
|
2018
|
184
|
|
|
|
2019
|
162
|
|
|
|
2020
|
141
|
|
|
|
2021
|
123
|
|
|
(8) Debt
|
In millions
|
2016
|
2015
|
||||||
|
Commercial paper
|
$
|
—
|
|
$
|
498
|
|
||
|
Bank overdrafts
|
—
|
|
25
|
|
||||
|
Current maturities of long-term debt
|
650
|
|
1
|
|
||||
|
Other borrowings
|
2
|
|
2
|
|
||||
|
Total short-term debt
|
$
|
652
|
|
$
|
526
|
|
||
In 2016, the Company reclassified
$650 million
related to the
0.90%
notes due February 25, 2017 from Long-term debt to Short-term debt.
The Company may issue commercial paper to fund general corporate needs, share repurchases, and small and medium-sized acquisitions. During the second quarter of 2016, the Company entered into a
$2.5 billion
,
five
-year line of credit
58
agreement with a termination date of May 9, 2021 to support the potential issuances of commercial paper. This agreement replaced the previously existing
$1.5 billion
line of credit agreement with a termination date of June 8, 2017 and the
$1.0 billion
line of credit agreement with a termination date of August 15, 2018.
No
amounts were outstanding under the new line of credit agreement at
December 31, 2016
. As of
December 31, 2016
, the Company was in compliance with the financial covenants of the line of credit agreement, which includes a minimum interest coverage ratio. The weighted-average interest rate on commercial paper was
0.4%
and
0.1%
at December 31,
2016
and
2015
, respectively.
As of December 31,
2016
, the Company had unused capacity of approximately $
286
million under international debt facilities.
Long-term debt
— Long-term debt represents obligations with a maturity date greater than one year, and excludes current maturities that have been reclassified to short-term debt. Long-term debt at carrying value and fair value as of December 31,
2016
and
2015
consisted of the following:
|
2016
|
2015
|
|||||||||||||||||
|
In millions
|
Effective Interest Rate
|
Carrying Value
|
Fair Value
|
Carrying Value
|
Fair Value
|
|||||||||||||
|
0.90% notes due February 25, 2017
|
0.95%
|
$
|
650
|
|
$
|
650
|
|
$
|
649
|
|
$
|
649
|
|
|||||
|
1.95% notes due March 1, 2019
|
1.98%
|
648
|
|
656
|
|
647
|
|
655
|
|
|||||||||
|
6.25% notes due April 1, 2019
|
6.25%
|
698
|
|
768
|
|
698
|
|
790
|
|
|||||||||
|
4.88% notes due thru December 31, 2020
|
4.96%
|
4
|
|
4
|
|
4
|
|
4
|
|
|||||||||
|
3.375% notes due September 15, 2021
|
3.43%
|
348
|
|
365
|
|
347
|
|
362
|
|
|||||||||
|
1.75% Euro notes due May 20, 2022
|
1.86%
|
520
|
|
565
|
|
536
|
|
564
|
|
|||||||||
|
1.25% Euro notes due May 22, 2023
|
1.35%
|
520
|
|
549
|
|
536
|
|
538
|
|
|||||||||
|
3.50% notes due March 1, 2024
|
3.54%
|
695
|
|
728
|
|
695
|
|
727
|
|
|||||||||
|
2.65% notes due November 15, 2026
|
2.69%
|
991
|
|
959
|
|
—
|
|
—
|
|
|||||||||
|
2.125% Euro notes due May 22, 2030
|
2.18%
|
519
|
|
565
|
|
536
|
|
530
|
|
|||||||||
|
3.0% Euro notes due May 19, 2034
|
3.13%
|
512
|
|
618
|
|
528
|
|
569
|
|
|||||||||
|
4.875% notes due September 15, 2041
|
4.97%
|
636
|
|
734
|
|
635
|
|
708
|
|
|||||||||
|
3.9% notes due September 1, 2042
|
3.96%
|
1,080
|
|
1,114
|
|
1,080
|
|
1,051
|
|
|||||||||
|
Other borrowings
|
6
|
|
6
|
|
6
|
|
6
|
|
||||||||||
|
Total
|
$
|
7,827
|
|
$
|
8,281
|
|
$
|
6,897
|
|
$
|
7,153
|
|
||||||
|
Less: Current maturities of long-term debt
|
(650
|
)
|
|
(1
|
)
|
|
|
|||||||||||
|
Total long-term debt
|
$
|
7,177
|
|
|
$
|
6,896
|
|
|
|
|||||||||
The approximate fair values of the Company’s long-term debt, including current maturities, were based on a valuation model, using Level 2 observable inputs which included market rates for comparable instruments for the respective periods.
In 2005, the Company issued
$54
million of
4.88%
notes due through December 31, 2020 at
100%
of face value.
In 2009, the Company issued
$700 million
of
6.25%
redeemable notes due April 1, 2019 at
99.98%
of face value.
In 2011, the Company issued
$350
million of
3.375%
notes due September 15, 2021 at
99.552%
of face value and
$650
million of
4.875%
notes due September 15, 2041 at
98.539%
of face value.
In 2012, the Company issued
$1.1
billion of
3.9%
notes due September 1, 2042 at
99.038%
of face value.
In February 2014, the Company issued $
650 million
of
0.9%
notes due February 25, 2017 at
99.861%
of face value, $
650 million
of
1.95%
notes due March 1, 2019 at
99.871%
of face value, and $
700 million
of
3.5%
notes due March 1, 2024 at
99.648%
of face value. Net proceeds from the February 2014 debt issuances were used to repay commercial paper.
In May 2014, the Company issued €
500 million
of
1.75%
Euro notes due May 20, 2022 at
99.16%
of face value and €
500 million
of
3.0%
Euro notes due May 19, 2034 at
98.089%
of face value. Net proceeds from the May 2014 debt issuances were used for general corporate purposes.
59
In May 2015, the Company issued
€500 million
of
1.25%
Euro notes due May 22, 2023 at
99.239%
of face value and
€500 million
of
2.125%
Euro notes due May 22, 2030 at
99.303%
of face value. Net proceeds from the May 2015 debt issuances were used to repay commercial paper and for general corporate purposes.
In November 2016, the Company issued
$1.0 billion
of
2.65%
notes due November 15, 2026 at
99.685%
of face value. Net proceeds from the November 2016 debt issuance were used to repay commercial paper and for general corporate purposes.
The Company designated the €
1.0 billion
of Euro notes issued in May 2014 and the €
1.0 billion
of Euro notes issued in May 2015 as hedges of a portion of its net investment in Euro-denominated foreign operations to reduce foreign currency risk associated with the investment in these operations. Refer to Note 11. Stockholders' Equity for additional information regarding the net investment hedge.
All of the Company's notes listed above represent senior unsecured obligations ranking equal in right of payment. Scheduled maturities of long-term debt, including current maturities of long-term debt, for the future years ending December 31 are as follows:
|
In millions
|
|||
|
2017
|
$
|
650
|
|
|
2018
|
—
|
|
|
|
2019
|
1,346
|
|
|
|
2020
|
4
|
|
|
|
2021
|
348
|
|
|
|
2022 and future years
|
5,479
|
|
|
|
Total
|
$
|
7,827
|
|
(9) Pension and Other Postretirement Benefits
The Company has both funded and unfunded defined benefit pension and other postretirement benefit plans, predominately in the U.S. The U.S. primary pension plan provides benefits based on years of service and final average salary. The U.S. primary postretirement health care plan is contributory with the participants’ contributions adjusted annually. The U.S. primary postretirement life insurance plan is noncontributory. Beginning January 1, 2007, the U.S. primary pension and other postretirement benefit plans were closed to new participants. Newly hired employees and employees from acquired businesses that are not participating in these plans are eligible for additional Company contributions under the existing U.S. primary defined contribution retirement plans. The Company’s expense related to defined contribution plans was
$77 million
in
2016
,
$77 million
in
2015
, and $
78
million in
2014
. In addition to the U.S. plans, the Company also has defined benefit pension plans in certain other countries, mainly the United Kingdom, Canada, Germany and Switzerland.
Summarized information regarding the Company’s significant defined benefit pension and other postretirement benefit plans related to both continuing and discontinued operations is as follows:
|
|
Pension
|
Other Postretirement Benefits
|
||||||||||||||||||||||
|
In millions
|
2016
|
2015
|
2014
|
2016
|
2015
|
2014
|
||||||||||||||||||
|
Components of net periodic benefit cost:
|
||||||||||||||||||||||||
|
Service cost
|
$
|
62
|
|
$
|
70
|
|
$
|
80
|
|
$
|
9
|
|
$
|
11
|
|
$
|
10
|
|
||||||
|
Interest cost
|
92
|
|
92
|
|
103
|
|
24
|
|
24
|
|
24
|
|
||||||||||||
|
Expected return on plan assets
|
(144
|
)
|
(151
|
)
|
(159
|
)
|
(23
|
)
|
(25
|
)
|
(25
|
)
|
||||||||||||
|
Amortization of actuarial (gain) loss
|
44
|
|
60
|
|
48
|
|
—
|
|
(1
|
)
|
(4
|
)
|
||||||||||||
|
Amortization of prior service cost
|
—
|
|
1
|
|
1
|
|
(1
|
)
|
1
|
|
1
|
|
||||||||||||
|
Settlement/curtailment (gain) loss
|
—
|
|
—
|
|
1
|
|
—
|
|
—
|
|
(9
|
)
|
||||||||||||
|
Total net periodic benefit cost
|
$
|
54
|
|
$
|
72
|
|
$
|
74
|
|
$
|
9
|
|
$
|
10
|
|
$
|
(3
|
)
|
||||||
60
Net periodic benefit cost was included in the statement of income as follows:
|
Pension
|
Other Postretirement Benefits
|
|||||||||||||||||||||||
|
In millions
|
2016
|
2015
|
2014
|
2016
|
2015
|
2014
|
||||||||||||||||||
|
Income from continuing operations
|
$
|
54
|
|
$
|
72
|
|
$
|
69
|
|
$
|
9
|
|
$
|
10
|
|
$
|
6
|
|
||||||
|
Income from discontinued operations
|
—
|
|
—
|
|
5
|
|
—
|
|
—
|
|
(9
|
)
|
||||||||||||
|
Total net periodic benefit cost
|
$
|
54
|
|
$
|
72
|
|
$
|
74
|
|
$
|
9
|
|
$
|
10
|
|
$
|
(3
|
)
|
||||||
The Company recognized a
$9 million
curtailment gain on the U.S. primary postretirement plan in the second quarter of 2014 related to the Company's sale of the Industrial Packaging business, which was included in Income from discontinued operations.
During 2014, the Society of Actuaries released a new mortality table, referred to as RP-2014, which is believed to better reflect mortality improvements. The Company used the RP-2014 mortality table to measure its U.S. pension and other postretirement benefit obligations as of
December 31, 2014
which resulted in additional actuarial losses of
$76 million
for pension and
$46 million
for other postretirement benefits. The Company used the updated mortality improvement scales, MP-2015 and MP-2016, to measure its U.S. pension and other postretirement obligations as of December 31,
2015
and
2016
, respectively, which did not have a significant impact in either period.
The following tables provide a rollforward of the plan benefit obligations, plan assets and a reconciliation of funded status for the years ended December 31,
2016
and
2015
:
|
Pension
|
Other Postretirement Benefits
|
|||||||||||||||
|
In millions
|
2016
|
2015
|
2016
|
2015
|
||||||||||||
|
Change in benefit obligation:
|
||||||||||||||||
|
Benefit obligation at January 1
|
$
|
2,462
|
|
$
|
2,607
|
|
$
|
552
|
|
$
|
591
|
|
||||
|
Service cost
|
62
|
|
70
|
|
9
|
|
11
|
|
||||||||
|
Interest cost
|
92
|
|
92
|
|
24
|
|
24
|
|
||||||||
|
Plan participants’ contributions
|
2
|
|
3
|
|
12
|
|
13
|
|
||||||||
|
Amendments
|
—
|
|
1
|
|
—
|
|
—
|
|
||||||||
|
Actuarial (gain) loss
|
216
|
|
(82
|
)
|
(5
|
)
|
(43
|
)
|
||||||||
|
Acquisitions and divestitures
|
7
|
|
—
|
|
—
|
|
—
|
|
||||||||
|
Benefits paid
|
(150
|
)
|
(169
|
)
|
(43
|
)
|
(46
|
)
|
||||||||
|
Medicare subsidy received
|
—
|
|
—
|
|
2
|
|
2
|
|
||||||||
|
Foreign currency translation
|
(129
|
)
|
(60
|
)
|
—
|
|
—
|
|
||||||||
|
Benefit obligation at December 31
|
$
|
2,562
|
|
$
|
2,462
|
|
$
|
551
|
|
$
|
552
|
|
||||
61
|
Pension
|
Other Postretirement Benefits
|
|||||||||||||||
|
In millions
|
2016
|
2015
|
2016
|
2015
|
||||||||||||
|
Change in plan assets:
|
||||||||||||||||
|
Fair value of plan assets at January 1
|
$
|
2,441
|
|
$
|
2,557
|
|
$
|
342
|
|
$
|
372
|
|
||||
|
Actual return on plan assets
|
274
|
|
16
|
|
36
|
|
(3
|
)
|
||||||||
|
Company contributions
|
70
|
|
97
|
|
4
|
|
6
|
|
||||||||
|
Plan participants’ contributions
|
2
|
|
3
|
|
12
|
|
13
|
|
||||||||
|
Benefits paid
|
(150
|
)
|
(169
|
)
|
(43
|
)
|
(46
|
)
|
||||||||
|
Foreign currency translation
|
(150
|
)
|
(63
|
)
|
—
|
|
—
|
|
||||||||
|
Fair value of plan assets at December 31
|
$
|
2,487
|
|
$
|
2,441
|
|
$
|
351
|
|
$
|
342
|
|
||||
|
Funded status
|
$
|
(75
|
)
|
$
|
(21
|
)
|
$
|
(200
|
)
|
$
|
(210
|
)
|
||||
|
Other immaterial plans
|
(58
|
)
|
(50
|
)
|
(5
|
)
|
(5
|
)
|
||||||||
|
Net liability at December 31
|
$
|
(133
|
)
|
$
|
(71
|
)
|
$
|
(205
|
)
|
$
|
(215
|
)
|
||||
|
The amounts recognized in the statement of financial position as of December 31 consist of:
|
||||||||||||||||
|
Other assets
|
$
|
131
|
|
$
|
191
|
|
$
|
—
|
|
$
|
—
|
|
||||
|
Accrued expenses
|
(12
|
)
|
(11
|
)
|
(4
|
)
|
(4
|
)
|
||||||||
|
Other noncurrent liabilities
|
(252
|
)
|
(251
|
)
|
(201
|
)
|
(211
|
)
|
||||||||
|
Net liability at end of year
|
$
|
(133
|
)
|
$
|
(71
|
)
|
$
|
(205
|
)
|
$
|
(215
|
)
|
||||
|
The pre-tax amounts recognized in accumulated other comprehensive income consist of:
|
||||||||||||||||
|
Net actuarial (gain) loss
|
$
|
673
|
|
$
|
631
|
|
$
|
(38
|
)
|
$
|
(20
|
)
|
||||
|
Prior service cost
|
—
|
|
—
|
|
—
|
|
(1
|
)
|
||||||||
|
$
|
673
|
|
$
|
631
|
|
$
|
(38
|
)
|
$
|
(21
|
)
|
|||||
|
Accumulated benefit obligation
|
$
|
2,207
|
|
$
|
2,297
|
|
||||||||||
|
Plans with accumulated benefit obligation in excess of plan assets as of December 31:
|
||||||||||||||||
|
Projected benefit obligation
|
$
|
183
|
|
$
|
164
|
|
||||||||||
|
Accumulated benefit obligation
|
$
|
167
|
|
$
|
152
|
|
||||||||||
|
Fair value of plan assets
|
$
|
25
|
|
$
|
25
|
|
||||||||||
Assumptions
— The weighted-average assumptions used in the valuations of pension and other postretirement benefits were as follows:
|
|
Pension
|
Other Postretirement Benefits
|
|||||||||||||||
|
|
2016
|
2015
|
2014
|
2016
|
2015
|
2014
|
|||||||||||
|
Assumptions used to determine benefit obligations at December 31:
|
|||||||||||||||||
|
Discount rate
|
3.41
|
%
|
3.95
|
%
|
3.70
|
%
|
4.30
|
%
|
4.55
|
%
|
4.15
|
%
|
|||||
|
Rate of compensation increases
|
3.77
|
%
|
3.72
|
%
|
3.72
|
%
|
—
|
%
|
—
|
%
|
—
|
%
|
|||||
|
Assumptions used to determine net periodic benefit cost for years ended December 31:
|
|||||||||||||||||
|
Discount rate
|
3.95
|
%
|
3.70
|
%
|
4.32
|
%
|
4.55
|
%
|
4.15
|
%
|
4.95
|
%
|
|||||
|
Expected return on plan assets
|
6.22
|
%
|
6.54
|
%
|
7.02
|
%
|
7.00
|
%
|
7.00
|
%
|
7.00
|
%
|
|||||
|
Rate of compensation increases
|
3.72
|
%
|
3.72
|
%
|
3.72
|
%
|
—
|
%
|
—
|
%
|
—
|
%
|
|||||
The expected long-term rates of return for pension and other postretirement benefit plans were developed using historical asset class returns while factoring in current market conditions such as inflation, interest rates and asset class performance.
The discount rate reflects the current rate at which the associated liabilities could theoretically be effectively settled at the end of the year. In estimating this rate, the Company looks at rates of return on high-quality fixed income investments, with similar duration to the liabilities in the plan. Beginning in 2017, the Company changed the method used to estimate the service and
62
interest cost components of net periodic pension and other postretirement benefit costs. The new method will provide a more precise measure of the service and interest cost components of net periodic benefit cost by applying specific spot rates along the yield curve to the projected cash flows rather than a single weighted-average rate.
Assumed health care cost trend rates have an effect on the amounts reported for the postretirement health care benefit plans. The assumed health care cost trend rates used to determine the postretirement benefit obligation at December 31 were as follows:
|
2016
|
2015
|
2014
|
||||||
|
Health care cost trend rate assumed for the next year
|
6.00
|
%
|
6.00
|
%
|
8.00
|
%
|
||
|
Ultimate trend rate
|
4.50
|
%
|
4.50
|
%
|
4.50
|
%
|
||
|
Year the rate reaches the ultimate trend rate
|
2023
|
|
2021
|
|
2022
|
|
||
A one percentage-point change in assumed health care cost trend rates would have the following impact:
|
In millions
|
1 Percentage-Point Increase
|
1 Percentage-Point Decrease
|
||||||
|
Change in service cost and interest cost for 2016
|
$
|
—
|
|
$
|
(1
|
)
|
||
|
Change in postretirement benefit obligation at December 31, 2016
|
$
|
6
|
|
$
|
(14
|
)
|
||
Plan assets
— The Company’s overall investment strategy for the assets in the pension funds is to achieve a balance between the goals of growing plan assets and keeping risk at a reasonable level over a long-term investment horizon. In order to reduce unnecessary risk, the pension funds are diversified across several asset classes, securities and investment managers. The target allocations for plan assets are
30%
to
45%
equity securities,
50%
to
65%
fixed income securities and
0%
to
10%
in other types of investments. The Company does not use derivatives for the purpose of speculation, leverage, circumventing investment guidelines or taking risks that are inconsistent with specified guidelines.
The assets in the Company’s postretirement health care plan are primarily invested in life insurance policies. The Company’s overall investment strategy for the assets in the postretirement health care fund is to invest in assets that provide a reasonable tax exempt rate of return while preserving capital.
The following tables present the fair value of the Company’s pension and other postretirement benefit plan assets at December 31,
2016
and
2015
, by asset category and valuation methodology. Level 1 assets are valued using unadjusted quoted prices for identical assets in active markets. Level 2 assets are valued using quoted prices or other observable inputs for similar assets. Level 3 assets are valued using unobservable inputs, but reflect the assumptions market participants would be expected to use in pricing the assets. Each financial instrument’s categorization is based on the lowest level of input that is significant to the fair value measurement.
63
|
2016
|
||||||||||||||||
|
In millions
|
Total
|
Level 1
|
Level 2
|
Level 3
|
||||||||||||
|
Pension Plan Assets:
|
||||||||||||||||
|
Cash and equivalents
|
$
|
82
|
|
$
|
55
|
|
$
|
27
|
|
$
|
—
|
|
||||
|
Equity securities:
|
||||||||||||||||
|
Domestic
|
1
|
|
1
|
|
—
|
|
—
|
|
||||||||
|
Fixed income securities:
|
||||||||||||||||
|
Government securities
|
307
|
|
—
|
|
307
|
|
—
|
|
||||||||
|
Corporate debt securities
|
541
|
|
—
|
|
541
|
|
—
|
|
||||||||
|
Mortgage-backed securities
|
19
|
|
—
|
|
19
|
|
—
|
|
||||||||
|
Investment contracts with insurance companies
|
1
|
|
—
|
|
—
|
|
1
|
|
||||||||
|
Commingled funds:
|
||||||||||||||||
|
Collective trust funds
|
1,478
|
|
|
|
|
|
|
|
||||||||
|
Partnerships/private equity interests
|
54
|
|
|
|
|
|
|
|
||||||||
|
Other
|
4
|
|
|
|
|
|
|
|
||||||||
|
Total fair value of pension plan assets
|
$
|
2,487
|
|
$
|
56
|
|
$
|
894
|
|
$
|
1
|
|
||||
|
Other Postretirement Benefit Plan Assets:
|
||||||||||||||||
|
Cash and equivalents
|
$
|
1
|
|
$
|
1
|
|
$
|
—
|
|
$
|
—
|
|
||||
|
Life insurance policies
|
350
|
|
|
|
|
|
|
|
||||||||
|
Total fair value of other postretirement benefit plan assets
|
$
|
351
|
|
$
|
1
|
|
$
|
—
|
|
$
|
—
|
|
||||
|
2015
|
||||||||||||||||
|
In millions
|
Total
|
Level 1
|
Level 2
|
Level 3
|
||||||||||||
|
Pension Plan Assets:
|
||||||||||||||||
|
Cash and equivalents
|
$
|
53
|
|
$
|
53
|
|
$
|
—
|
|
$
|
—
|
|
||||
|
Equity securities:
|
||||||||||||||||
|
Domestic
|
1
|
|
1
|
|
—
|
|
—
|
|
||||||||
|
Foreign
|
62
|
|
62
|
|
—
|
|
—
|
|
||||||||
|
Fixed income securities:
|
||||||||||||||||
|
Government securities
|
285
|
|
—
|
|
285
|
|
—
|
|
||||||||
|
Corporate debt securities
|
483
|
|
—
|
|
483
|
|
—
|
|
||||||||
|
Investment contracts with insurance companies
|
1
|
|
—
|
|
—
|
|
1
|
|
||||||||
|
Commingled funds:
|
||||||||||||||||
|
Mutual funds
|
145
|
|
145
|
|
—
|
|
—
|
|
||||||||
|
Collective trust funds
|
1,347
|
|
|
|
|
|
|
|
||||||||
|
Partnerships/private equity interests
|
66
|
|
|
|
|
|
|
|
||||||||
|
Other
|
(2
|
)
|
—
|
|
(2
|
)
|
—
|
|
||||||||
|
Total fair value of pension plan assets
|
$
|
2,441
|
|
$
|
261
|
|
$
|
766
|
|
$
|
1
|
|
||||
|
Other Postretirement Benefit Plan Assets:
|
||||||||||||||||
|
Cash and equivalents
|
$
|
8
|
|
$
|
8
|
|
$
|
—
|
|
$
|
—
|
|
||||
|
Life insurance policies
|
334
|
|
|
|
|
|
|
|
||||||||
|
Total fair value of other postretirement benefit plan assets
|
$
|
342
|
|
$
|
8
|
|
$
|
—
|
|
$
|
—
|
|
||||
Cash and equivalents include cash on hand and instruments with original maturities of
three months or less
and are valued at cost, which approximates fair value. Equity securities primarily include common and preferred equity securities covering a
64
wide range of industries and geographies that are traded in active markets and are valued based on quoted prices. Fixed income securities primarily consist of U.S. and foreign government bills, notes and bonds, corporate debt securities, asset-backed securities and investment contracts. The majority of the assets in this category are valued by evaluating bid prices provided by independent financial data services. For securities where market data is not readily available, unobservable market data is used to value the security. Mutual funds are traded in active markets and are valued based on quoted prices. The underlying investments include small-cap equity, international equity and long- and short-term fixed income instruments. Other primarily includes derivative instruments such as interest rate swaps used by fixed income investment managers to offset interest rate sensitivity.
Pension assets measured at net asset value include collective trust funds, partnerships/private equity interests and life insurance policies. Collective trust funds are private funds that are valued based on the value of the underlying investments which can be redeemed on a daily basis. The underlying investments include both passively and actively managed U.S. and foreign large- and mid-cap equity funds and short-term investment funds. Partnerships/private equity interests are investments in partnerships where the benefit plan is a limited partner. The investments are valued by the investment managers on a periodic basis using pricing models that use market, income and cost valuation methods. Distributions are received from these funds on a periodic basis through the liquidation of the underlying assets of the fund. Life insurance policies are used to fund other postretirement benefits in order to obtain favorable tax treatment and are valued based on the cash surrender value of the underlying policies. The Company has selected the funds in which these assets are invested and may elect to withdraw funds with proper notice to the insurance company or maintain the policies and receive death benefits as determined by the contracts.
Cash flows
— The Company generally funds its pension and other postretirement benefit plans as required by law or to the extent such contributions are tax deductible. The Company expects to contribute approximately $
64
million to its pension plans and $
5
million to its other postretirement benefit plans in
2017
. The Company’s portion of the benefit payments that are expected to be paid during the years ending December 31 is as follows:
|
In millions
|
Pension
|
Other Postretirement Benefits
|
||||||
|
2017
|
$
|
182
|
|
$
|
35
|
|
||
|
2018
|
181
|
|
36
|
|
||||
|
2019
|
183
|
|
37
|
|
||||
|
2020
|
185
|
|
38
|
|
||||
|
2021
|
184
|
|
38
|
|
||||
|
Years 2022-2026
|
882
|
|
193
|
|
||||
(10) Commitments and Contingencies
Litigation
—
The Company is subject to various legal proceedings and claims that arise in the ordinary course of business, including those involving environmental, product liability (including toxic tort) and general liability claims. The Company accrues for such liabilities when it is probable that future costs will be incurred and such costs can be reasonably estimated. Such accruals are based on developments to date, the Company’s estimates of the outcomes of these matters and its experience in contesting, litigating and settling other similar matters. The Company believes resolution of these matters, individually and in the aggregate, will not have a material adverse effect on the Company’s financial position, liquidity or future operations.
Lease Commitments
—
Rental expense was
$121
million in
2016
,
$117
million in
2015
and
$130
million in
2014
. Future minimum lease payments under non-cancelable leases for the years ending December 31 are as follows:
|
In millions
|
|||
|
2017
|
$
|
104
|
|
|
2018
|
75
|
|
|
|
2019
|
53
|
|
|
|
2020
|
37
|
|
|
|
2021
|
26
|
|
|
|
2022 and future years
|
43
|
|
|
|
Total future minimum lease payments
|
$
|
338
|
|
65
(11) Stockholders' Equity
Preferred Stock
— Preferred Stock, without par value, of which
0.3
million shares are authorized and unissued, is issuable in series. The Board of Directors is authorized to fix by resolution the designation and characteristics of each series of preferred stock. The Company has
no
present commitment to issue its preferred stock.
Share Repurchases
— On August 2, 2013, the Company’s Board of Directors authorized a stock repurchase program, which provided for the repurchase of up to
$6.0 billion
of the Company’s common stock over an open-ended period of time (the "2013 Program"). Under the 2013 Program, the Company repurchased approximately
3.3 million
shares of its common stock at an average price of
$81.62
per share during 2013, approximately
50.4 million
shares of its common stock at an average price of
$84.92
per share during 2014, and approximately
14.9 million
shares of its common stock at an average price of
$96.84
during 2015. As of
December 31, 2015
, there were
no
authorized repurchases remaining under the 2013 Program.
On February 13, 2015, the Company's Board of Directors authorized a new stock repurchase program, which provided for the repurchase of up to an additional
$6.0 billion
of the Company’s common stock over an open-ended period of time (the "2015 Program"). Under the 2015 Program, the Company repurchased approximately
6.1 million
shares of its common stock at an average price of
$91.78
per share during 2015 and approximately
18.7 million
shares of its common stock at an average price of
$107.17
per share during 2016. As of
December 31, 2016
, there were approximately
$3.4 billion
of authorized repurchases remaining under the 2015 Program.
Cash Dividends
— Cash dividends declared were
$2.40
per share in
2016
,
$2.07
per share in
2015
and
$1.81
per share in
2014
. Cash dividends paid were
$2.30
per share in
2016
,
$2.005
per share in
2015
and
$1.745
per share in
2014
.
Accumulated Other Comprehensive Income (Loss)
— The changes in accumulated other comprehensive income (loss) during
2016
,
2015
and
2014
were as follows:
|
In millions
|
2016
|
2015
|
2014
|
|||||||||
|
Beginning balance
|
$
|
(1,504
|
)
|
$
|
(658
|
)
|
$
|
384
|
|
|||
|
Foreign currency translation adjustments during the period
|
(251
|
)
|
(800
|
)
|
(806
|
)
|
||||||
|
Foreign currency translation adjustments reclassified to income
|
(1
|
)
|
—
|
|
(133
|
)
|
||||||
|
Income taxes
|
(25
|
)
|
(60
|
)
|
—
|
|
||||||
|
Total foreign currency translation adjustments, net of tax
|
(277
|
)
|
(860
|
)
|
(939
|
)
|
||||||
|
Pension and other postretirement benefit adjustments during the period
|
(67
|
)
|
(41
|
)
|
(224
|
)
|
||||||
|
Pension and other postretirement benefit adjustments reclassified to income
|
43
|
|
61
|
|
54
|
|
||||||
|
Income taxes
|
(2
|
)
|
(6
|
)
|
67
|
|
||||||
|
Total pension and other postretirement benefit adjustments, net of tax
|
(26
|
)
|
14
|
|
(103
|
)
|
||||||
|
Ending balance
|
$
|
(1,807
|
)
|
$
|
(1,504
|
)
|
$
|
(658
|
)
|
|||
Foreign currency translation adjustments reclassified to income are primarily related to the disposal of certain discontinued operations and were included in the related gain or loss upon disposal. Refer to Note 2. Discontinued Operations for additional information regarding the sale of the Company's discontinued operations.
Pension and other postretirement benefit adjustments reclassified to income represent the amortization of actuarial losses and prior service cost, and settlement and curtailment charges recognized in net periodic benefit cost. Refer to Note 9. Pension and Other Postretirement Benefits for the amounts included in net periodic benefit cost. Pension and other postretirement benefit adjustments reclassified to income also include the reclassification of deferred losses of
$6 million
for the year ended December 31,
2014
related to the disposal of certain discontinued operations. Refer to Note 2. Discontinued Operations for additional information regarding the sale of the Company's discontinued operations.
The Company designated €
1.0 billion
of Euro notes issued in May 2014 and €
1.0 billion
of Euro notes issued in May 2015 as hedges of a portion of its net investment in Euro-denominated foreign operations to reduce foreign currency risk associated with the investment in these operations. Changes in the value of this debt resulting from fluctuations in the Euro to U.S. Dollar exchange rate have been recorded as foreign currency translation adjustments within Accumulated other comprehensive
66
income (loss). The cumulative unrealized gain recorded in Accumulated other comprehensive income (loss) related to the net investment hedge was
$375 million
and
$308 million
as of
December 31, 2016
and
December 31, 2015
, respectively.
As of December 31,
2016
and
2015
, the ending balance of Accumulated other comprehensive income (loss) consisted of cumulative translation adjustment losses of
$1.4 billion
and
$1.1 billion
, respectively, and unrecognized pension and other postretirement benefits costs of
$405 million
and
$379 million
, respectively. The estimated unrecognized benefit cost that will be amortized from Accumulated other comprehensive income (loss) into net periodic benefit cost in
2017
is $
55 million
for pension and other postretirement benefits.
(12) Stock-Based Compensation
On May 8, 2015 (the "Effective Date"), the 2015 Long-Term Incentive Plan (the "2015 Plan") was approved by shareholders. As of the Effective Date, no additional awards will be granted to employees under the 2011 Long-Term Incentive Plan (the "2011 Plan"). The significant terms of stock options and restricted stock units ("RSUs") were not changed under the 2015 Plan. Stock options and RSUs have been issued to officers and other management employees under these plans. Stock options generally vest over a
four
-year period and have an expiration of
ten
years from the issuance date. RSUs generally "cliff" vest after a
three
-year period and include units with and without performance criteria. RSUs with performance criteria provide for full "cliff" vesting after
three
years if the Compensation Committee certifies that the performance goals have been met. Upon vesting, the holder will receive
one
share of common stock of the Company for each vested RSU.
Prior to February 2013, the Company generally issued new shares from its authorized but unissued share pool to cover the exercised options and vested RSUs. Commencing in February 2013, the Company began issuing shares from treasury stock. As of December 31,
2016
, approximately
15 million
shares of ITW common stock were reserved for issuance under these plans.
The Company records compensation expense for the grant date fair value of stock awards over the remaining service periods of those awards. The following table summarizes the Company’s stock-based compensation expense:
|
In millions
|
2016
|
2015
|
2014
|
|||||||||
|
Pre-tax compensation expense
|
$
|
39
|
|
$
|
35
|
|
$
|
34
|
|
|||
|
Tax benefit
|
(13
|
)
|
(12
|
)
|
(12
|
)
|
||||||
|
Total stock-based compensation expense, net of tax
|
$
|
26
|
|
$
|
23
|
|
$
|
22
|
|
|||
There was
no
pre-tax stock-based compensation expense included in income from discontinued operations in
2016
or
2015
. Pre-tax stock-based compensation expense included in Income from discontinued operations was
$5 million
in
2014
.
The following table summarizes activity related to non-vested RSUs during
2016
:
|
Shares in millions
|
Number of
Shares
|
Weighted-Average
Grant-Date Fair Value
|
|||
|
Unvested, January 1, 2016
|
0.8
|
|
$73.58
|
||
|
Granted
|
0.3
|
|
85.61
|
||
|
Vested
|
(0.3
|
)
|
61.14
|
||
|
Canceled
|
(0.1
|
)
|
83.12
|
||
|
Unvested, December 31, 2016
|
0.7
|
|
83.39
|
||
67
The following table summarizes stock option activity for the year ended December 31,
2016
:
|
In millions except exercise price and contractual terms
|
Number of Shares
|
Weighted-Average
Exercise Price
|
Weighted-Average
Remaining
Contractual Term
|
Aggregate Intrinsic
Value
|
|||||
|
Under option, January 1, 2016
|
6.4
|
|
$61.44
|
||||||
|
Granted
|
0.6
|
|
91.88
|
||||||
|
Exercised
|
(1.6
|
)
|
50.66
|
||||||
|
Canceled or expired
|
(0.1
|
)
|
87.15
|
||||||
|
Under option, December 31, 2016
|
5.3
|
|
68.05
|
5.9
|
$290
|
||||
|
Exercisable, December 31, 2016
|
3.7
|
|
59.72
|
4.9
|
$232
|
||||
The fair value of RSUs is determined by reducing the closing market price on the date of the grant by the present value of projected dividends over the vesting period. Stock option exercise prices are equal to the common stock fair market value on the date of grant. The Company uses a binomial option pricing model to estimate the fair value of the stock options granted. The following summarizes the assumptions used in the models:
|
2016
|
2015
|
2014
|
||||
|
Risk-free interest rate
|
0.56-1.86%
|
0.23-2.25%
|
0.16-2.83%
|
|||
|
Weighted-average volatility
|
24.0%
|
23.0%
|
22.9%
|
|||
|
Dividend yield
|
2.12%
|
2.11%
|
2.46%
|
|||
|
Expected years until exercise
|
6.9-7.7
|
6.9-8.0
|
6.7-7.9
|
|||
Lattice-based option valuation models, such as the binomial option pricing model, incorporate ranges of assumptions for inputs. The risk-free rate of interest for periods within the contractual life of the option is based on a zero-coupon U.S. government instrument over the contractual term of the equity instrument. Expected volatility is based on implied volatility from traded options on the Company’s stock and historical volatility of the Company’s stock. The Company uses historical data to estimate option exercise timing and employee termination rates within the valuation model. The weighted-average dividend yield is based on historical information. The expected term of options granted is derived from the output of the option valuation model and represents the period of time that options granted are expected to be outstanding. The ranges presented result from separate groups of employees assumed to exhibit different behavior.
The weighted-average grant-date fair value of stock options granted during
2016
,
2015
and
2014
was $
20.02
,
$20.58
and
$15.14
per share, respectively. The aggregate intrinsic value of stock options exercised during the years ended December 31,
2016
,
2015
and
2014
was $
89
million,
$55 million
and
$115 million
, respectively. As of December 31,
2016
, there was $
7
million of total unrecognized compensation cost related to unvested stock options. That cost is expected to be recognized over a weighted-average period of
1.9
years. Exercise of stock options during the years ended December 31,
2016
,
2015
and
2014
resulted in cash receipts of $
84
million, $
59 million
and
$148 million
, respectively. The total fair value of vested stock option awards during the years ended December 31,
2016
,
2015
and
2014
was $
12
million,
$13 million
and
$16 million
, respectively.
As of December 31,
2016
, there was $
16 million
of total unrecognized compensation cost related to unvested RSUs. That cost is expected to be recognized over a weighted-average remaining contractual life of
1.6
years. The total fair value of vested RSU awards during the years ended December 31,
2016
,
2015
and
2014
was $
21
million,
$20 million
and
$27 million
, respectively.
68
Other balance sheet information at December 31,
2016
and
2015
was as follows:
|
In millions
|
2016
|
2015
|
||||||
|
Prepaid expenses and other current assets:
|
||||||||
|
Value-added-tax receivables
|
$
|
55
|
|
$
|
48
|
|
||
|
Income tax refunds receivable
|
21
|
|
147
|
|
||||
|
Vendor advances
|
20
|
|
22
|
|
||||
|
Other
|
122
|
|
124
|
|
||||
|
Total prepaid expenses and other current assets
|
$
|
218
|
|
|
$
|
341
|
|
|
|
Other assets:
|
||||||||
|
Cash surrender value of life insurance policies
|
$
|
442
|
|
$
|
428
|
|
||
|
Customer tooling
|
146
|
|
88
|
|
||||
|
Prepaid pension assets
|
131
|
|
191
|
|
||||
|
Investments
|
73
|
|
99
|
|
||||
|
Equity investment in Wilsonart (See Note 4)
|
—
|
|
113
|
|
||||
|
Other
|
164
|
|
168
|
|
||||
|
Total other assets
|
$
|
956
|
|
$
|
1,087
|
|
||
|
Accrued expenses:
|
||||||||
|
Compensation and employee benefits
|
$
|
379
|
|
$
|
363
|
|
||
|
Deferred revenue and customer deposits
|
180
|
|
169
|
|
||||
|
Rebates
|
144
|
|
125
|
|
||||
|
Warranties
|
45
|
|
46
|
|
||||
|
Current portion of pension and other postretirement benefit obligations
|
16
|
|
15
|
|
||||
|
Other
|
438
|
|
418
|
|
||||
|
Total accrued expenses
|
$
|
1,202
|
|
$
|
1,136
|
|
||
|
Other liabilities:
|
||||||||
|
Pension benefit obligation
|
$
|
252
|
|
$
|
251
|
|
||
|
Postretirement benefit obligation
|
201
|
|
211
|
|
||||
|
Other
|
418
|
|
519
|
|
||||
|
Total other liabilities
|
$
|
871
|
|
$
|
981
|
|
||
69
(14) Segment Information
The Company's operations are organized and managed based on similar product offerings and end markets, and are reported to senior management as the following
seven
segments: Automotive OEM; Food Equipment; Test & Measurement and Electronics; Welding; Polymers & Fluids; Construction Products; and Specialty Products. The following is a description of the Company's
seven
segments:
Automotive OEM
— This segment is a global, niche supplier to top tier OEMs, providing unique innovation to address pain points for sophisticated customers with complex problems. Businesses in this segment produce components and fasteners for automotive-related applications.
Food Equipment
— This segment is a highly focused and branded industry-leader in commercial food equipment differentiated by innovation and integrated service offerings.
Test & Measurement and Electronics
— This segment is a branded and innovative producer of test and measurement and electronic manufacturing and MRO solutions that improve efficiency and quality for customers in diverse end markets. Businesses in this segment produce equipment and related accessories, consumables, and software for testing and measuring physical properties of materials and structures, as well as equipment and consumables used in the production of electronic subassemblies and microelectronics.
Welding
— This segment is a branded value-added equipment and specialty consumable manufacturer with innovative and leading technology. Businesses in this segment produce arc welding equipment, consumables and accessories for a wide array of industrial and commercial applications.
Polymers & Fluids
— This segment is a highly branded supplier to niche markets that require value-added, differentiated products. Businesses in this segment produce adhesives, sealants, lubrication and cutting fluids, and fluids and polymers for auto aftermarket maintenance and appearance.
Construction Products
— This segment is a branded supplier of innovative engineered fastening systems and solutions.
Specialty Products
— This segment is focused on diversified niche market opportunities with substantial patent protection producing beverage packaging equipment and consumables, product coding and marking equipment and consumables, and appliance components and fasteners.
Segments are allocated a fixed overhead charge based on the segment's revenue. Expenses not charged to the segments are reported separately as Unallocated. Because the Unallocated category includes a variety of items, it is subject to fluctuations on a quarterly and annual basis.
70
Segment information for
2016
,
2015
and
2014
was as follows:
|
In millions
|
2016
|
2015
|
2014
|
|||||||||
|
Operating revenue:
|
||||||||||||
|
Automotive OEM
|
$
|
2,864
|
|
$
|
2,529
|
|
$
|
2,590
|
|
|||
|
Food Equipment
|
2,110
|
|
2,096
|
|
2,177
|
|
||||||
|
Test & Measurement and Electronics
|
1,974
|
|
1,969
|
|
2,204
|
|
||||||
|
Welding
|
1,486
|
|
1,650
|
|
1,850
|
|
||||||
|
Polymers & Fluids
|
1,691
|
|
1,712
|
|
1,927
|
|
||||||
|
Construction Products
|
1,609
|
|
1,587
|
|
1,707
|
|
||||||
|
Specialty Products
|
1,885
|
|
1,885
|
|
2,055
|
|
||||||
|
Intersegment revenue
|
(20
|
)
|
(23
|
)
|
(26
|
)
|
||||||
|
Total
|
$
|
13,599
|
|
$
|
13,405
|
|
$
|
14,484
|
|
|||
|
Operating income:
|
||||||||||||
|
Automotive OEM
|
$
|
690
|
|
$
|
613
|
|
$
|
600
|
|
|||
|
Food Equipment
|
537
|
|
498
|
|
453
|
|
||||||
|
Test & Measurement and Electronics
|
372
|
|
322
|
|
340
|
|
||||||
|
Welding
|
370
|
|
415
|
|
479
|
|
||||||
|
Polymers & Fluids
|
343
|
|
335
|
|
357
|
|
||||||
|
Construction Products
|
361
|
|
316
|
|
289
|
|
||||||
|
Specialty Products
|
482
|
|
439
|
|
440
|
|
||||||
|
Total Segments
|
3,155
|
|
2,938
|
|
2,958
|
|
||||||
|
Unallocated
|
(91
|
)
|
(71
|
)
|
(70
|
)
|
||||||
|
Total
|
$
|
3,064
|
|
$
|
2,867
|
|
$
|
2,888
|
|
|||
|
Depreciation and amortization and impairment of intangible assets:
|
||||||||||||
|
Automotive OEM
|
$
|
90
|
|
$
|
76
|
|
$
|
79
|
|
|||
|
Food Equipment
|
45
|
|
48
|
|
52
|
|
||||||
|
Test & Measurement and Electronics
|
104
|
|
110
|
|
115
|
|
||||||
|
Welding
|
36
|
|
37
|
|
38
|
|
||||||
|
Polymers & Fluids
|
92
|
|
95
|
|
99
|
|
||||||
|
Construction Products
|
34
|
|
36
|
|
43
|
|
||||||
|
Specialty Products
|
69
|
|
75
|
|
81
|
|
||||||
|
Total
|
$
|
470
|
|
$
|
477
|
|
$
|
507
|
|
|||
|
Plant and equipment additions:
|
||||||||||||
|
Automotive OEM
|
$
|
116
|
|
$
|
106
|
|
$
|
96
|
|
|||
|
Food Equipment
|
31
|
|
37
|
|
47
|
|
||||||
|
Test & Measurement and Electronics
|
25
|
|
32
|
|
56
|
|
||||||
|
Welding
|
16
|
|
23
|
|
36
|
|
||||||
|
Polymers & Fluids
|
18
|
|
20
|
|
28
|
|
||||||
|
Construction Products
|
20
|
|
26
|
|
41
|
|
||||||
|
Specialty Products
|
47
|
|
40
|
|
54
|
|
||||||
|
Total Segments
|
273
|
|
284
|
|
358
|
|
||||||
|
Discontinued Operations
|
—
|
|
—
|
|
3
|
|
||||||
|
Total
|
$
|
273
|
|
$
|
284
|
|
$
|
361
|
|
|||
|
Identifiable assets:
|
||||||||||||
|
Automotive OEM
|
$
|
2,051
|
|
$
|
1,419
|
|
$
|
1,454
|
|
|||
|
Food Equipment
|
1,013
|
|
1,054
|
|
1,123
|
|
||||||
|
Test & Measurement and Electronics
|
2,362
|
|
2,448
|
|
2,615
|
|
||||||
|
Welding
|
701
|
|
747
|
|
879
|
|
||||||
|
Polymers & Fluids
|
2,019
|
|
2,034
|
|
2,257
|
|
||||||
|
Construction Products
|
1,099
|
|
1,129
|
|
1,249
|
|
||||||
|
Specialty Products
|
1,599
|
|
1,659
|
|
1,798
|
|
||||||
|
Total Segments
|
10,844
|
|
10,490
|
|
11,375
|
|
||||||
|
Corporate
|
4,357
|
|
5,239
|
|
6,090
|
|
||||||
|
Total
|
$
|
15,201
|
|
$
|
15,729
|
|
$
|
17,465
|
|
|||
Identifiable assets by segment are those assets that are specifically used in that segment. Corporate assets are principally cash and equivalents, investments and other general corporate assets.
71
Enterprise-wide information for
2016
,
2015
and
2014
was as follows:
|
In millions
|
2016
|
2015
|
2014
|
|||||||||
|
Operating Revenue by Geographic Region:
|
||||||||||||
|
United States
|
$
|
6,176
|
|
$
|
6,167
|
|
$
|
6,191
|
|
|||
|
Canada/Mexico
|
923
|
|
928
|
|
993
|
|
||||||
|
Total North America
|
7,099
|
|
7,095
|
|
7,184
|
|
||||||
|
Europe, Middle East and Africa
|
3,787
|
|
3,725
|
|
4,319
|
|
||||||
|
Asia Pacific
|
2,361
|
|
2,197
|
|
2,427
|
|
||||||
|
South America
|
352
|
|
388
|
|
554
|
|
||||||
|
Total Operating Revenue
|
$
|
13,599
|
|
$
|
13,405
|
|
$
|
14,484
|
|
|||
Operating revenue by geographic region is based on the customers' locations. Long-lived assets in any single country outside of the U.S. did not exceed 10% of the Company's total long-lived assets. No single customer accounted for more than
5%
of consolidated revenues in
2016
,
2015
or
2014
. Additionally, the Company has thousands of product lines within its businesses; therefore, providing operating revenue by product line is not practicable.
SELECTED QUARTERLY FINANCIAL DATA (UNAUDITED)
The unaudited quarterly financial data included as supplementary data reflects all adjustments that are, in the opinion of management, necessary for a fair statement of the results for the interim periods presented.
|
Three Months Ended
|
||||||||||||||||||||||||||||||||
|
March 31
|
June 30
|
September 30
|
December 31
|
|||||||||||||||||||||||||||||
|
In millions except per share amounts
|
2016
|
2015
|
2016
|
2015
|
2016
|
2015
|
2016
|
2015
|
||||||||||||||||||||||||
|
Operating revenue
|
$
|
3,274
|
|
$
|
3,342
|
|
$
|
3,431
|
|
$
|
3,434
|
|
$
|
3,495
|
|
$
|
3,354
|
|
$
|
3,399
|
|
$
|
3,275
|
|
||||||||
|
Cost of revenue
|
1,896
|
|
1,970
|
|
1,967
|
|
2,024
|
|
2,027
|
|
1,953
|
|
2,006
|
|
1,941
|
|
||||||||||||||||
|
Operating income
|
722
|
|
697
|
|
792
|
|
730
|
|
808
|
|
761
|
|
742
|
|
679
|
|
||||||||||||||||
|
Net income
|
468
|
|
458
|
|
525
|
|
480
|
|
535
|
|
511
|
|
507
|
|
450
|
|
||||||||||||||||
|
Net income per share:
|
||||||||||||||||||||||||||||||||
|
Basic
|
1.29
|
|
1.22
|
|
1.47
|
|
1.31
|
|
1.51
|
|
1.40
|
|
1.46
|
|
1.24
|
|
||||||||||||||||
|
Diluted
|
1.29
|
|
1.21
|
|
1.46
|
|
1.30
|
|
1.50
|
|
1.39
|
|
1.45
|
|
1.23
|
|
||||||||||||||||
72
ITEM 9.
Changes in and Disagreements With Accountants on Accounting and Financial Disclosure
None.
ITEM 9A.
Controls and Procedures
Controls and Procedures
The Company’s management, with the participation of the Company’s Chairman & Chief Executive Officer and Senior Vice President & Chief Financial Officer, has evaluated the effectiveness of the Company’s disclosure controls and procedures (as defined in Exchange Act Rule 13a-15(e)) as of
December 31, 2016
. Based on such evaluation, the Company’s Chairman & Chief Executive Officer and Senior Vice President & Chief Financial Officer have concluded that, as of
December 31, 2016
, the Company’s disclosure controls and procedures were effective.
Management Report on Internal Control over Financial Reporting
The Management Report on Internal Control over Financial Reporting and the Report of Independent Registered Public Accounting Firm are found in Item 8. Financial Statements and Supplementary Data.
In connection with the evaluation by management, including the Company’s Chairman & Chief Executive Officer and Senior Vice President & Chief Financial Officer, no changes in the Company’s internal control over financial reporting (as defined in Exchange Act Rule 13a-15(f)) during the quarter ended
December 31, 2016
were identified that have materially affected or are reasonably likely to materially affect the Company’s internal control over financial reporting.
ITEM 9B.
Other Information
None.
73
ITEM 10.
Directors, Executive Officers and Corporate Governance
Information regarding the Directors of the Company is incorporated by reference from the information under the captions "Proposal 1 - Election of Directors" in the Company’s Proxy Statement for the
2017
Annual Meeting of Stockholders.
Information regarding the Audit Committee and its Financial Experts is incorporated by reference from the information under the captions "Proposal 1 - Election of Directors - Board of Directors and Its Committees" and "Audit Committee Report" in the Company’s Proxy Statement for the
2017
Annual Meeting of Stockholders.
Information regarding the Executive Officers of the Company can be found in Part I of this Annual Report on Form 10-K under the caption "Executive Officers."
Information regarding compliance with Section 16(a) of the Exchange Act is incorporated by reference from the information under the caption "Proposal 1 - Election of Directors - Section 16(a) Beneficial Ownership Reporting Compliance" in the Company’s Proxy Statement for the
2017
Annual Meeting of Stockholders.
Information regarding the Company’s code of ethics that applies to the Company’s Chairman & Chief Executive Officer, Senior Vice President & Chief Financial Officer, and key financial and accounting personnel is incorporated by reference from the information under the caption "Proposal 1 - Election of Directors - Corporate Governance Policies and Practices" in the Company’s Proxy Statement for the
2017
Annual Meeting of Stockholders.
ITEM 11.
Executive Compensation
This information is incorporated by reference from the information under the captions "NEO Compensation," "Proposal 1 - Election of Directors - Director Compensation," and "Compensation Discussion and Analysis" in the Company’s Proxy Statement for the
2017
Annual Meeting of Stockholders.
ITEM 12.
Security Ownership of Certain Beneficial Owners and Management and Related Stockholder Matters
This information is incorporated by reference from the information under the captions "Proposal 1 - Election of Directors - Ownership of ITW Stock" and "NEO Compensation - Equity Compensation Plan Information" in the Company’s Proxy Statement for the
2017
Annual Meeting of Stockholders.
ITEM 13.
Certain Relationships and Related Transactions, and Director Independence
Information regarding certain relationships and related transactions is incorporated by reference from the information under the captions "Proposal 1 - Election of Directors - Ownership of ITW Stock," "Certain Relationships and Related Party Transactions" and "Proposal 1 - Election of Directors - Corporate Governance Policies and Practices" in the Company’s Proxy Statement for the
2017
Annual Meeting of Stockholders.
Information regarding director independence is incorporated by reference from the information under the captions "Proposal 1 - Election of Directors - Corporate Governance Policies and Practices" and "Appendix A - Categorical Standards for Director Independence" in the Company’s Proxy Statement for the
2017
Annual Meeting of Stockholders.
ITEM 14.
Principal Accounting Fees and Services
This information is incorporated by reference from the information under the caption "Proposal 2 - Ratification of the Appointment of Independent Registered Public Accounting Firm" in the Company’s Proxy Statement for the
2017
Annual Meeting of Stockholders.
74
ITEM 15.
Exhibits and Financial Statement Schedules
(a)(1) Financial Statements
The following information is included as part of Item 8. Financial Statements and Supplementary Data:
Management Report on Internal Control over Financial Reporting
Report of Independent Registered Public Accounting Firm
Statement of Income
Statement of Comprehensive Income
Statement of Financial Position
Statement of Changes in Stockholders' Equity
Statement of Cash Flows
Notes to Financial Statements
(2) Financial Statement Schedules
None.
(3) Exhibits
(i) See the Exhibit Index within this Annual Report on Form 10-K.
(ii) Pursuant to Regulation S-K, Item 601(b)(4)(iii), the Company has not filed with Exhibit 4 any debt instruments for which the total amount of securities authorized thereunder is less than 10% of the total assets of the Company and its subsidiaries on a consolidated basis as of
December 31, 2016
, with the exception of the Officers' Certificates related to the 0.90% Notes due 2017, the 1.95% Notes due 2019, the 6.25% Notes due 2019, the 3.375% Notes due 2021, the 1.75% Euro Notes due 2022, the 1.25% Euro Notes due 2023, the 3.50% Notes due 2024, the 2.65% Notes due 2026, the 2.125% Euro Notes due 2030, the 3.00% Euro Notes due 2034, the 4.875% Notes due 2041, and the 3.90% Notes due 2042, which are described as Exhibit numbers 4(a) through (i) in the Exhibit Index. The Company agrees to furnish a copy of the agreement related to the debt instruments which have not been filed with Exhibit 4 to the Securities and Exchange Commission upon request.
75
SIGNATURES
Pursuant to the requirements of Section 13 or 15(d) of the Securities Exchange Act of 1934, the registrant has duly caused this report to be signed on its behalf by the undersigned, thereunto duly authorized on this 10th day of February 2017.
|
ILLINOIS TOOL WORKS INC.
|
||
|
By:
|
/s/ E. SCOTT SANTI
|
|
|
E. Scott Santi
|
||
|
Chairman & Chief Executive Officer
|
||
Pursuant to the requirements of the Securities Exchange Act of 1934, this report has been signed by the following persons on behalf of the registrant and in the capacities indicated on this 10th day of February 2017.
|
Signatures
|
Title
|
|
|
/s/ E. SCOTT SANTI
|
Chairman & Chief Executive Officer, Director
|
|
|
E. Scott Santi
|
(Principal Executive Officer)
|
|
|
/s/ MICHAEL M. LARSEN
|
Senior Vice President & Chief Financial Officer
|
|
|
Michael M. Larsen
|
(Principal Financial Officer)
|
|
|
/s/ RANDALL J. SCHEUNEMAN
|
Vice President & Chief Accounting Officer
|
|
|
Randall J. Scheuneman
|
(Principal Accounting Officer)
|
|
|
DANIEL J. BRUTTO
|
Director
|
|
|
SUSAN CROWN
|
Director
|
|
|
JAMES W. GRIFFITH
|
Director
|
|
|
JAY L. HENDERSON
|
Director
|
|
|
RICHARD H. LENNY
|
Director
|
|
|
ROBERT S. MORRISON
|
Director
|
|
|
JAMES A. SKINNER
|
Director
|
|
|
DAVID B. SMITH, JR.
|
Director
|
|
|
PAMELA B. STROBEL
|
Director
|
|
|
KEVIN M. WARREN
|
Director
|
|
|
ANRÉ D. WILLIAMS
|
Director
|
|
|
By: /s/ E. SCOTT SANTI
|
||
|
(E. Scott Santi,
as Attorney-in-Fact)
|
||
Original powers of attorney authorizing E. Scott Santi to sign the Company’s Annual Report on Form 10-K and amendments thereto on behalf of the above-named directors of the registrant have been filed with the Securities and Exchange Commission as part of this Annual Report on Form 10-K (Exhibit 24).
76
Exhibit Index
Annual Report on Form 10-K
2016
|
Exhibit
Number
|
Description
|
|
|
2.1(a)
|
Investment Agreement, dated as of August 15, 2012, among CD&R Wimbledon Holdings III, L.P., a Cayman Islands limited partnership; Illinois Tool Works Inc.; ITW DS Investments Inc., a Delaware corporation; and Wilsonart International Holdings LLC, a Delaware limited liability company, filed as Exhibit 2.1 to the Company's Current Report on Form 8-K filed on August 17, 2012 (Commission File No. 1-4797) and incorporated herein by reference. (Certain of the schedules and similar attachments have been omitted pursuant to Item 601(b)(2) of Regulation S-K, but the Company undertakes to furnish a copy of the schedules or similar attachments to the Securities and Exchange Committee upon request.)
|
|
|
2.1(b)
|
Stock Purchase Agreement, dated as of February 6, 2014, between Illinois Tool Works Inc. and certain of its subsidiaries and Vault Bermuda Holding Co. Ltd., filed as Exhibit 2.1 to the Company’s Current Report on Form 8-K filed on February 12, 2014. (Commission File No. 1-4797) and incorporated herein by reference. (Certain of the schedules and similar attachments have been omitted pursuant to Item 601(b)(2) of Regulation S-K, but the Company undertakes to furnish a copy of the schedules or similar attachments to the Securities and Exchange Commission upon request).
|
|
|
3(a)(i)
|
Amended and Restated Certificate of Incorporation of Illinois Tool Works Inc., filed as Exhibit 3.1 to the Company’s Quarterly Report on Form 10-Q for the quarterly period ended June 30, 2014 (Commission File No. 1-4797) and incorporated herein by reference.
|
|
|
3(a)(ii)
|
Certificate of Amendment to Amended and Restated Certificate of Incorporation of Illinois Tool Works Inc., filed as Exhibit 3(a)(ii) to the Company’s Form 8-K filed on May 12, 2016 (Commission File No. 1-4797) and incorporated herein by reference.
|
|
|
3(b)
|
By-laws of Illinois Tool Works Inc., as amended and restated as of May 6, 2016, filed as Exhibit 3(b)(i) to the Company’s Form 8-K filed on May 12, 2016 (Commission File No. 1-4797) and incorporated herein by reference.
|
|
|
4(a)
|
Indenture between Illinois Tool Works Inc. and The First National Bank of Chicago, as Trustee, dated as of November 1, 1986, filed as Exhibit 4.1 to the Company’s Registration Statement on Form S-3 filed on January 15, 1999 (Commission File No. 333-70691) and incorporated herein by reference.
|
|
|
4(b)
|
First Supplemental Indenture between Illinois Tool Works Inc. and Harris Trust and Savings Bank, as Trustee, dated as of May 1, 1990, filed as Exhibit 4.2 to the Company’s Registration Statement on Form S-3 filed on January 15, 1999 (Commission File No. 333-70691) and incorporated herein by reference.
|
|
|
4(c)
|
Officers’ Certificate dated March 26, 2009 establishing the terms, and setting forth the forms, of the 5.15% Notes due 2014 and the 6.25% Notes due 2019, filed as Exhibit 4.3 to the Company’s Current Report on Form 8-K filed on March 27, 2009 (Commission File No. 1-4797) and incorporated herein by reference.
|
|
|
4(d)
|
Officers’ Certificate dated August 31, 2011, establishing the terms, and setting forth the forms, of the 3.375% Notes due 2021 and the 4.875% Notes due 2041, filed as Exhibit 4.3 to the Company’s Form 8-K filed on September 1, 2011 (Commission File No. 001-04797) and incorporated herein by reference.
|
|
|
4(e)
|
Officers' Certificate dated August 28, 2012, establishing the terms, and setting forth the forms, of the 3.9% Notes due 2042, filed as Exhibit 4.1 to the Company's Current Report on Form 8-K filed on August 28, 2012 (Commission File No. 001-4797) and incorporated herein by reference.
|
|
|
4(f)
|
Officers’ Certificate dated February 25, 2014, establishing the terms, and setting forth the forms, of the 0.9% Notes due 2017, the 1.95% Notes due 2019, and the 3.5% Notes due 2024, filed as Exhibit 4.1 to the Company’s Form 8-K filed on February 26, 2014 (Commission File No. 001-04797) and incorporated herein by reference.
|
|
|
4(g)
|
Officers’ Certificate dated May 20, 2014, establishing the terms, and setting forth the forms, of the 1.75% Euro Notes due 2022 and the 3.0% Euro Notes due 2034, filed as Exhibit 4.1 to the Company’s Form 8-K filed on May 22, 2014 (Commission File No. 001-04797) and incorporated herein by reference.
|
|
|
4(h)
|
Officers’ Certificate dated May 19, 2015, establishing the terms, and setting forth the forms, of the 1.25% Euro Notes due 2023 and the 2.125% Euro Notes due 2030, filed as Exhibit 4.1 to the Company’s Form 8-K filed on May 22, 2015 (Commission File No. 001-04797) and incorporated herein by reference.
|
|
|
4(i)
|
Officer’s Certificate dated November 7, 2016, establishing the terms, and setting forth the forms, of the 2.65% Notes due 2026, filed as Exhibit 4.1 to the Company’s Form 8-K filed on November 1, 2016 (Commission File No. 001-04797) and incorporated herein by reference.
|
|
77
|
Exhibit
Number
|
Description
|
|
|
10(a)*
|
Illinois Tool Works Inc. 2006 Stock Incentive Plan dated February 10, 2006, as amended on May 5, 2006, filed as Exhibit 10(a) to the Company’s Quarterly Report on Form 10-Q for the quarterly period ended March 31, 2006 (Commission File No. 1-4797) and incorporated herein by reference.
|
|
|
10(b)*
|
Amendment to Illinois Tool Works Inc. 2006 Stock Incentive Plan dated February 8, 2008, filed as Exhibit 10(q) to the Company’s Annual Report on Form 10-K for the fiscal year ended December 31, 2007 (Commission File No. 1-4797) and incorporated herein by reference.
|
|
|
10(c)*
|
Second Amendment to Illinois Tool Works Inc. 2006 Stock Incentive Plan dated February 13, 2009, filed as Exhibit 10(d) to the Company’s Annual Report on Form 10-K for the fiscal year ended December 31, 2008 (Commission File No. 1-4797) and incorporated herein by reference.
|
|
|
10(d)*
|
Illinois Tool Works Inc. 2011 Long-Term Incentive Plan, filed as Exhibit 99.2 to the Company’s Current Report on Form 8-K filed on December 16, 2010 (Commission File No. 1-4797) and incorporated herein by reference.
|
|
|
10(e)*
|
Illinois Tool Works Inc. 2015 Long-Term Incentive Plan effective May 8, 2015, filed as Exhibit 10.1 to the Company's Quarterly Report on Form 10-Q for the quarterly period ended March 31, 2015 (Commission File No. 1-4797) and incorporated herein by reference.
|
|
|
10(f)*
|
Form of stock option terms filed as Exhibit 99.1 to the Company’s Current Report on Form 8-K filed on February 5, 2009 (Commission File No. 1-4797) and incorporated herein by reference.
|
|
|
10(g)*
|
Form of stock option terms filed as Exhibit 99.1 to the Company’s Current Report on Form 8-K filed on February 9, 2011 (Commission File No. 1-4797) and incorporated herein by reference.
|
|
|
10(h)*
|
Form of stock option terms filed as Exhibit 99.1 to the Company’s Current Report on Form 8-K filed on February 7, 2012 (Commission File No. 1-4797) and incorporated herein by reference.
|
|
|
10(i)*
|
Form of stock option terms filed as Exhibit 99.1 to the Company’s Current Report on Form 8-K filed on February 13, 2014 (Commission File No. 1-4797) and incorporated herein by reference.
|
|
|
10(j)*
|
Form of restricted stock unit terms filed as Exhibit 99.2 to the Company’s Current Report on Form 8-K filed on February 13, 2014 (Commission File No. 1-4797) and incorporated herein by reference.
|
|
|
10(k)*
|
Form of performance restricted stock unit terms filed as Exhibit 99.3 to the Company’s Current Report on Form 8-K filed on February 13, 2014 (Commission File No. 1-4797) and incorporated herein by reference.
|
|
|
10(l)*
|
Form of Long-Term Incentive Cash Grant filed as Exhibit 99.4 to the Company’s Current Report on Form 8-K filed on February 13, 2014 (Commission File No. 1-4797) and incorporated herein by reference.
|
|
|
10(m)*
|
Form of stock option terms filed as Exhibit 99.1 to the Company's Current Report on Form 8-K filed on February 9, 2016 (Commission File No. 1-4797) and incorporated herein by reference.
|
|
|
10(n)*
|
Form of restricted stock unit terms filed as Exhibit 99.2 to the Company's Current Report on Form 8-K filed on February 9, 2016 (Commission File No. 1-4797) and incorporated herein by reference.
|
|
|
10(o)*
|
Form of performance restricted stock unit terms filed as Exhibit 99.3 to the Company's Current Report on Form 8-K filed on February 9, 2016 (Commission File No. 1-4797) and incorporated herein by reference.
|
|
|
10(p)*
|
Form of Long-Term Incentive Cash Grant filed as Exhibit 99.4 to the Company's Current Report on Form 8-K filed on February 9, 2016 (Commission File No. 1-4797) and incorporated herein by reference.
|
|
|
10(q)*
|
Form of stock option terms filed as Exhibit 99.1 to the Company's Current Report on Form 8-K filed on February 9, 2017 (Commission File No. 1-4797) and incorporated herein by reference.
|
|
|
10(r)*
|
Form of restricted stock unit terms filed as Exhibit 99.2 to the Company's Current Report on Form 8-K filed on February 9, 2017 (Commission File No. 1-4797) and incorporated herein by reference.
|
|
|
10(s)*
|
Form of performance share unit terms filed as Exhibit 99.3 to the Company's Current Report on Form 8-K filed on February 9, 2017 (Commission File No. 1-4797) and incorporated herein by reference.
|
|
|
10(t)*
|
Form of Performance Cash Grant filed as Exhibit 99.4 to the Company's Current Report on Form 8-K filed on February 9, 2017 (Commission File No. 1-4797) and incorporated herein by reference.
|
|
|
10(u)*
|
Illinois Tool Works Inc. 2011 Executive Incentive Plan, filed as Exhibit 99.1 to the Company’s Current Report on Form 8-K filed on December 16, 2010 (Commission File No. 1-4797) and incorporated herein by reference.
|
|
|
10(v)*
|
Illinois Tool Works Inc. Executive Contributory Retirement Income Plan as amended and restated, effective January 1, 2010, filed as exhibit 10 to the Company’s Current Report on Form 8-K filed on November 5, 2009 (Commission File No. 1-4797) and incorporated herein by reference.
|
|
78
|
Exhibit
Number
|
Description
|
|
|
10(w)*
|
Illinois Tool Works Inc. Nonqualified Pension Plan, effective January 1, 2008, as amended and approved by the Board of Directors on December 22, 2008, filed as Exhibit 10(p) to the Company’s Annual Report on Form 10-K for the fiscal year ended December 31, 2008 (Commission File No. 1-4797) and incorporated herein by reference.
|
|
|
10(x)*
|
Illinois Tool Works Inc. 2011 Change-in-Control Severance Compensation Policy, filed as Exhibit 99.3 to the Company’s Current Report on Form 8-K filed on December 16, 2010 (Commission File No. 1-4797) and incorporated herein by reference.
|
|
|
10(y)*
|
Illinois Tool Works Inc. Amended and Restated Directors’ Deferred Fee Plan effective May 2, 2014, filed as Exhibit 10.1 to the Company’s Quarterly Report on Form 10-Q for the quarterly period ended June 30, 2014 (Commission File No. 1-4797) and incorporated herein by reference.
|
|
|
10(z)*
|
Illinois Tool Works Inc. 2011 Cash Incentive Plan, filed as Exhibit 99.1 to the Company’s Form 8-K filed on May 12, 2011 (Commission File No. 1-4797) and incorporated herein by reference.
|
|
|
10(aa)*
|
First Amendment to the ITW Contributory Retirement Income Plan dated February 15, 2013, filed as Exhibit 10.2 to the Company’s Current Form 10-Q filed on May 3, 2013 (Commission File No. 1-4797) and incorporated herein by reference.
|
|
|
10(bb)
|
Five Year Credit Agreement dated as of May 9, 2016 among Illinois Tool Works Inc., the Lenders, JPMorgan Chase Bank, National Association, as Administrative Agent, and Citibank, N.A., as Syndication Agent filed as Exhibit 10(a) to the Company’s Form 8-K filed on May 12, 2016 (Commission File No. 1-4797) and incorporated herein by reference.
|
|
|
21
|
Subsidiaries and Affiliates of the Company.
|
|
|
23
|
Consent of Independent Registered Public Accounting Firm.
|
|
|
24
|
Powers of Attorney.
|
|
|
31
|
Rule 13a-14(a) Certifications.
|
|
|
32
|
Section 1350 Certification.
|
|
|
99(a)
|
A description of the capital stock of Illinois Tool Works Inc. is included under Item 8.01 Other Events in the Company's Report on Form 8-K filed on February 9, 2017 (Commission File No. 1-4797) and incorporated herein by reference.
|
|
|
101.INS
|
XBRL Instance Document**
|
|
|
101.SCH
|
XBRL Taxonomy Extension Schema**
|
|
|
101.CAL
|
XBRL Taxonomy Extension Calculation Linkbase**
|
|
|
101.DEF
|
XBRL Taxonomy Extension Definition Linkbase**
|
|
|
101.LAB
|
XBRL Taxonomy Extension Label Linkbase**
|
|
|
101.PRE
|
XBRL Taxonomy Extension Presentation Linkbase**
|
|
|
*
|
Management contract or compensatory plan or arrangement.
|
|
**
|
The following financial information from Illinois Tool Works Inc.'s Annual Report on Form 10-K for the year ended December 31, 2016, formatted in XBRL (Extensible Business Reporting Language): (i) Statement of Income, (ii) Statement of Comprehensive Income, (iii) Statement of Income Reinvested in the Business (iv) Statement of Financial Position, (v) Statement of Cash Flows and (vi) related Notes to Financial Statements.
|
79
TABLE OF CONTENTS
Part IItem 1. BusinessItem 1A. Risk FactorsItem 1B. Unresolved Staff CommentsItem 2. PropertiesItem 3. Legal ProceedingsItem 4. Mine Safety DisclosuresPart IIItem 5. Market For Registrant S Common Equity, Related Stockholder Matters and Issuer Purchases Of Equity SecuritiesItem 6. Selected Financial DataItem 7. Management's Discussion and Analysis Of Financial Condition and Results Of OperationsItem 7A. Quantitative and Qualitative Disclosures About Market RiskItem 8. Financial Statements and Supplementary DataItem 9. Changes in and Disagreements with Accountants on Accounting and Financial DisclosureItem 9A. Controls and ProceduresItem 9B. Other InformationPart IIIItem 10. Directors, Executive Officers and Corporate GovernanceItem 11. Executive CompensationItem 12. Security Ownership Of Certain Beneficial Owners and Management and Related Stockholder MattersItem 13. Certain Relationships and Related Transactions, and Director IndependenceItem 14. Principal Accounting Fees and ServicesPart IVItem 15. Exhibits and Financial Statement Schedules