INVESCO MORTGAGE CAPITAL INC.
10-Ks and 10-Qs
|
|
|
|
|
|
|
|
|
|
|
|
|
|
|
|
|
|
|
|
|
|
|
|
|
|
|
|
|
|
|
|
|
|
|
|
|
|
|
|
|
|
|
|
|
|
|
|
|
|
|
|
|
|
|
|
|
|
|
UNITED STATES
SECURITIES AND EXCHANGE COMMISSION
WASHINGTON, D.C. 20549
FORM 10-K
(Mark One)
|
ý
|
ANNUAL REPORT PURSUANT TO SECTION 13 OR 15(d) OF THE SECURITIES EXCHANGE ACT OF 1934
|
For the fiscal year ended
December 31, 2015
or
|
¨
|
TRANSITION REPORT PURSUANT TO SECTION 13 OR 15(d) OF THE SECURITIES EXCHANGE ACT OF 1934
|
For the Transition Period from
to
Commission file number 001-34385

(Exact name of registrant as specified in its charter)
|
Maryland
|
26-2749336
|
|
|
(State or other jurisdiction of
incorporation or organization)
|
(I.R.S. Employer
Identification No.)
|
|
|
1555 Peachtree Street, N.E., Suite 1800
Atlanta, Georgia
|
30309
|
|
|
(Address of principal executive offices)
|
(Zip Code)
|
|
(404) 892-0896
(Registrant’s telephone number, including area code)
Securities registered pursuant to Section 12(b) of the Securities Exchange Act of 1934:
|
Title of Each Class
|
Name of Each Exchange on Which Registered
|
|
|
Common Stock, par value $0.01 per share
|
New York Stock Exchange
|
|
|
7.75% Series A Cumulative Redeemable Preferred Stock
|
New York Stock Exchange
|
|
|
7.75% Fixed-to-Floating Series B Cumulative Redeemable Preferred Stock
|
New York Stock Exchange
|
|
Securities registered pursuant to Section 12(g) of the Securities Exchange Act of 1934: None
________________________________________________
Indicate by check mark if the registrant is a well-known seasoned issuer, as defined in Rule 405 of the Securities Act. Yes
ý
No
¨
Indicate by check mark if the registrant is not required to file reports pursuant to Section 13 or 15(d) of the Act. Yes
¨
No
ý
Indicate by check mark whether the registrant: (1) has filed all reports required to be filed by Section 13 or 15(d) of the Securities Exchange Act of 1934 during the preceding 12 months (or for such shorter period that the registrant was required to file such reports), and (2) has been subject to such filing requirements for the past 90 days. Yes
ý
No
¨
Indicate by check mark whether the registrant has submitted electronically and posted on its corporate Website, if any, every Interactive Data File required to be submitted and posted pursuant to Rule 405 of Regulation S-T (§232.405 of this chapter) during the preceding 12 months (or for such shorter period that the registrant was required to submit and post such files). Yes
ý
No
¨
Indicate by check mark if disclosure of delinquent filers pursuant to Item 405 of Regulation S-K (§229.405 of this chapter) is not contained herein, and will not be contained, to the best of the registrant’s knowledge, in definitive proxy or information statements incorporated by reference in Part III of this Form 10-K or any amendment to this Form 10-K.
ý
Indicate by check mark whether the registrant is a large accelerated filer, an accelerated filer, a non-accelerated filer or a smaller reporting company. See the definitions of “large accelerated filer,” “accelerated filer,” and “smaller reporting company” in Rule 12b-2 of the Exchange Act (check one):
|
Large accelerated filer
|
|
ý
|
Accelerated filer
|
|
¨
|
|
Non-accelerated filer
|
|
¨
(Do not check if a smaller reporting company)
|
Smaller reporting company
|
|
¨
|
Indicate by check mark whether the registrant is a shell company (as defined in Rule 12b-2 of the Act). Yes
¨
No
ý
The aggregate market value of the registrant’s common stock held by non-affiliates was
$1,762,296,542
based on the closing sales price on the New York Stock Exchange on
June 30, 2015
. As of
February 16, 2016
, there were
113,621,371
outstanding shares of common stock of Invesco Mortgage Capital Inc.
Documents Incorporated by Reference
Part III of this Form 10-K incorporates by reference certain information (solely to the extent explicitly indicated) from the registrant’s proxy statement for the
2016
Annual Meeting of Stockholders to be filed pursuant to Regulation 14A.
Invesco Mortgage Capital Inc.
TABLE OF CONTENTS
|
Item 1.
|
||
|
Item 1A.
|
||
|
Item 1B.
|
||
|
Item 2.
|
||
|
Item 3.
|
||
|
Item 4.
|
||
|
Item 5.
|
||
|
Item 6.
|
||
|
Item 7.
|
||
|
Item 7A.
|
||
|
Item 8.
|
||
|
Item 9.
|
||
|
Item 9A.
|
||
|
Item 9B.
|
||
|
Item 10.
|
||
|
Item 11.
|
||
|
Item 12.
|
||
|
Item 13.
|
||
|
Item 14.
|
||
|
Item 15.
|
||
Forward-Looking Statements
We make forward-looking statements in this Report on Form 10-K ("Report") and other filings we make with the SEC within the meaning of Section 27A of the Securities Act of 1933, as amended, and Section 21E of the Securities Exchange Act of 1934, as amended (the “Exchange Act”), and such statements are intended to be covered by the safe harbor provided by the same. Forward-looking statements are subject to substantial risks and uncertainties, many of which are difficult to predict and are generally beyond our control. These forward-looking statements include information about possible or assumed future results of our business, investment strategies, financial condition, liquidity, results of operations, plans and objectives. When we use the words “believe,” “expect,” “anticipate,” “estimate,” “plan,” “continue,” “intend,” “should,” “may” or similar expressions and future or conditional verbs such as “will,” “may,” “could,” “should,” and “would,” and any other statement that necessarily depends on future events, we intend to identify forward-looking statements. Factors that could cause actual results to differ from those expressed in our forward-looking statements include, but are not limited to:
|
•
|
our business and investment strategy;
|
|
•
|
our investment portfolio;
|
|
•
|
our projected operating results;
|
|
•
|
general volatility of financial markets and effects of governmental responses, including actions and initiatives of the U.S. governmental agencies and changes to U.S. government policies, including the Dodd-Frank Wall Street Reform and Consumer Protection Act (the “Dodd-Frank Act”), mortgage loan modification programs, actions and initiatives of foreign governmental agencies and central banks, monetary policy actions of the Federal Reserve, including actions relating to its agency mortgage-backed securities portfolio and the continuation of re-investment of principal payments, and our ability to respond to and comply with such actions, initiatives and changes;
|
|
•
|
the availability of financing sources, including our ability to obtain additional financing arrangements and the terms of such arrangements;
|
|
•
|
financing and advance rates for our target assets;
|
|
•
|
changes to our expected leverage;
|
|
•
|
our expected investments;
|
|
•
|
our expected book value per share of common stock;
|
|
•
|
interest rate mismatches between our target assets and our borrowings used to fund such investments;
|
|
•
|
the adequacy of our cash flow from operations and borrowings to meet our short-term liquidity needs;
|
|
•
|
our ability to maintain sufficient liquidity to meet any margin calls;
|
|
•
|
changes in the credit rating of the U.S. government;
|
|
•
|
changes in interest rates and interest rate spreads and the market value of our target assets;
|
|
•
|
changes in prepayment rates on our target assets;
|
|
•
|
the impact of any deficiencies in foreclosure practices of third parties and related uncertainty in the timing of collateral disposition;
|
|
•
|
our reliance on third parties in connection with services related to our target assets;
|
|
•
|
effects of hedging instruments on our target assets;
|
|
•
|
rates of default or decreased recovery rates on our target assets;
|
|
•
|
modifications to whole loans or loans underlying securities;
|
|
•
|
the degree to which our hedging strategies may or may not protect us from interest rate and foreign currency exchange rate volatility;
|
|
•
|
the degree to which derivative contracts expose us to contingent liabilities;
|
|
•
|
counterparty defaults;
|
|
•
|
compliance with financial covenants in our financing arrangements;
|
|
•
|
changes in governmental regulations, tax law and rates, and similar matters and our ability to respond to such changes;
|
|
•
|
our ability to maintain our qualification as a real estate investment trust for U.S. federal income tax purposes;
|
|
1
|
||
|
•
|
our ability to maintain our exception from the definition of “investment company” under the Investment Company Act of 1940, as amended (the “1940 Act”);
|
|
•
|
availability of investment opportunities in mortgage-related, real estate-related and other securities;
|
|
•
|
availability of U.S. Government Agency guarantees with regard to payments of principal and interest on securities;
|
|
•
|
the market price and trading volume of our capital stock;
|
|
•
|
availability of qualified personnel of our Manager;
|
|
•
|
the relationship with our Manager;
|
|
•
|
estimates relating to taxable income and our ability to continue to make distributions to our stockholders in the future;
|
|
•
|
estimates relating to fair value of our target assets and loan loss reserves;
|
|
•
|
our understanding of our competition;
|
|
•
|
changes to generally accepted accounting principles in the United States of America (“U.S. GAAP”);
|
|
•
|
the impact of the restatement of our consolidated financial statements as of and for the years ended December 31, 2013 and December 31, 2014 and all interim periods commencing with the quarter ended March 31, 2013 through the quarter ended March 31, 2015, as described in Controls and Procedures included in Part II, Item 9A of this Report;
|
|
•
|
the adequacy of our disclosure controls and procedures and internal controls over financial reporting; and market trends in our industry, interest rates, real estate values, the debt securities markets or the general economy.
|
The forward-looking statements are based on our beliefs, assumptions and expectations of our future performance, taking into account all information currently available to us. You should not place undue reliance on these forward-looking statements. These beliefs, assumptions and expectations can change as a result of many possible events or factors, not all of which are known to us. Some of these factors are described under the headings “Business”,“Risk Factors” and “Management’s Discussion and Analysis of Financial Condition and Results of Operations”. If a change occurs, our business, financial condition, liquidity and results of operations may vary materially from those expressed in our forward-looking statements. Any forward-looking statement speaks only as of the date on which it is made. New risks and uncertainties arise over time, and it is not possible for us to predict those events or how they may affect us. Except as required by law, we are not obligated to, and do not intend to, update or revise any forward-looking statements, whether as a result of new information, future events or otherwise.
|
2
|
||
Our Company
We are a Maryland corporation primarily focused on investing in, financing and managing residential and commercial mortgage-backed securities ("MBS") and mortgage loans. Our objective is to provide attractive risk-adjusted returns to our investors, primarily through dividends and secondarily through capital appreciation. To achieve this objective, we primarily invest in the following:
|
•
|
Residential mortgage-backed securities (“RMBS”) that are guaranteed by a U.S. government agency such as the Government National Mortgage Association ("Ginnie Mae") or a federally chartered corporation such as the Federal National Mortgage Association (“Fannie Mae”) or the Federal Home Loan Mortgage Corporation (“Freddie Mac”) (collectively "Agency RMBS");
|
|
•
|
RMBS that are not guaranteed by a U.S. government agency ("non-Agency RMBS");
|
|
•
|
Credit risk transfer securities that are unsecured obligations issued by government-sponsored enterprises ("GSE CRT");
|
|
•
|
Commercial mortgage-backed securities (“CMBS”);
|
|
•
|
Residential and commercial mortgage loans; and
|
|
•
|
Other real estate-related financing arrangements.
|
We are externally managed and advised by Invesco Advisers, Inc., our Manager, which is an indirect, wholly-owned subsidiary of Invesco Ltd. ("Invesco"). We elected to be taxed as a real estate investment trust (“REIT”) for U.S. federal income tax purposes under the provisions of the Internal Revenue Code of 1986, as amended (“Code”), commencing with our taxable year ended December 31, 2009. To maintain our REIT qualification, we are generally required to distribute at least 90% of our REIT taxable income to our stockholders annually. We operate our business in a manner that permits our exclusion from the definition of “Investment Company” under the 1940 Act, as amended.
We generally finance our investments through short- and long-term borrowings structured as repurchase agreements and secured loans. We have historically financed our residential loans held-for-investment through asset-backed securities ("ABS") issued by consolidated securitization trusts. We have also financed investments through the issuances of debt and equity and may utilize other forms of financing in the future.
Capital Activities
During the three months ended
December 31, 2015
, we repurchased
5,843,883
shares of our common stock at an average repurchase price of
$12.94
per share for a net cost of
$75.6 million
, including acquisition expenses. During the year ended
December 31, 2015
, we repurchased
9,539,251
shares of our common stock at an average repurchase price of
$13.17
per share for a net cost of
$125.6 million
, including acquisition expenses. As of
December 31, 2015
, we had authority to purchase
5,302,533
shares of our common stock through our share repurchase program.
Our Manager
We are externally managed and advised by Invesco Advisers, Inc. Our Manager provides us with our management team, including our officers, and appropriate support personnel. Each of our officers is an employee of our Manager or one of its affiliates. We do not have any employees. Our Manager is not obligated to dedicate any of its employees exclusively to us, and our Manager and its employees are not obligated to dedicate any specific portion of time to our business. Our Manager is at all times subject to the supervision and oversight of our Board of Directors and has only such functions and authority as we delegate to it.
|
3
|
||
Our Competitive Advantages
We believe that our competitive advantages include the following:
Significant Experience of Our Manager and Our Senior Management
Our senior management and structured investments team has a long track record and broad experience in managing residential and commercial mortgage-related assets through a variety of credit and interest rate environments and has demonstrated the ability to generate attractive risk-adjusted returns under different market conditions and cycles. In addition, through our Manager, we benefit from the insight and capabilities of Invesco’s real estate team, through which we have access to broad and deep teams of experienced investment professionals in real estate and distressed investing. Through these teams, we have real time access to research and data on the mortgage and real estate industries. We believe having in-house access to these resources and expertise provides us with a competitive advantage over other companies investing in our target assets who have less internal resources and expertise.
Extensive Strategic Relationships and Experience of our Manager and its Affiliates
Our Manager maintains extensive long-term relationships with other financial intermediaries, including primary dealers, leading investment banks, brokerage firms, leading mortgage originators and commercial banks. We believe these relationships enhance our ability to source, finance and hedge investment opportunities and, thus, will enable us to grow in various credit and interest rate environments.
Disciplined Investment Approach
We seek to maximize our risk-adjusted returns through our disciplined investment approach, which relies on rigorous quantitative and qualitative analysis. Our Manager monitors our overall portfolio risk and evaluates the characteristics of our investments in our target assets including, but not limited to, asset type, interest rate, interest rate type, loan balance distribution, geographic concentration, property type, occupancy, loan-to-value ratio and credit score. In addition, with respect to any particular target asset, our Manager’s investment team evaluates, among other things, relative valuation, supply and demand trends, shape of yield curves, prepayment rates, loan delinquencies, default rates and loss severity rates. We believe this strategy and our commitment to capital preservation provide us with a competitive advantage when operating in a variety of market conditions.
Access to Our Manager’s Sophisticated Analytical Tools, Infrastructure and Expertise
Our Manager has created and maintains analytical and portfolio management capabilities to aid in asset selection and risk management. We capitalize on the market knowledge and ready access to data across our target markets that our Manager and its affiliates obtain through their established platform. We focus on in-depth analysis of the numerous factors that influence our target assets, including: (1) fundamental market and sector review; (2) rigorous cash flow analysis; (3) disciplined asset selection; (4) controlled risk exposure; and (5) prudent balance sheet management. Through the use of these tools, we analyze factors that affect the rate at which mortgage prepayments occur, including changes in the level of interest rates, trends in residential and commercial real estate prices, general economic conditions, the locations of the properties securing the mortgage loans and other social and demographic conditions in order to acquire our target assets.
We also benefit from our Manager’s and its affiliates’ comprehensive financial and administrative infrastructure, including its risk management, financial reporting, business development, legal and compliance teams.
Investment Strategy
We invest in a diversified pool of mortgage assets that generate attractive risk-adjusted returns. Our target assets generally include Agency RMBS, non-Agency RMBS, GSE CRT, CMBS, residential and commercial mortgage loans and other real estate-related financing arrangements. In addition to direct purchases of our target assets, we also invest in ventures managed by an affiliate of our Manager, which, in turn, invest in our target assets.
Agency RMBS
Agency RMBS are residential mortgage-backed securities issued by a U.S. government agency such as Ginnie Mae, or a federally chartered corporation such as Fannie Mae or Freddie Mac that are secured by a collection of mortgages. Payments of principal and interest on Agency RMBS, not the market value of the securities themselves, are guaranteed by the issuer. Agency RMBS differ from other forms of traditional debt securities, which normally provide for periodic payments of interest in fixed amounts with principal payments at maturity or on specified call dates. Instead, Agency RMBS provide for monthly payments of both principal and interest. In effect, these payments are a “pass-through” of scheduled and unscheduled principal payments
|
4
|
||
and the monthly interest payments made by the individual borrowers on the mortgage loans, net of any fees paid to the servicers, guarantors or other related parties of the securities.
The principal may be prepaid at any time due to prepayments or defaults on the underlying mortgage loans. These differences can result in significantly greater price and yield volatility than is the case with other fixed-income securities.
Various factors affect the rate at which mortgage prepayments occur, including changes in the level and directional trends in housing prices, interest rates, general economic conditions, the age of the mortgage loan, the location of the property, social and demographic conditions, government initiated refinance programs, legislative regulations, and industry capacity. Generally, prepayments on Agency RMBS increase during periods of falling mortgage interest rates and decrease during periods of rising mortgage interest rates. However, this may not always be the case. We may reinvest principal repayments at a yield that is higher or lower than the yield on the repaid investment, thus affecting our net interest income by altering the average yield on our assets.
In addition, when interest rates are declining, the value of Agency RMBS with prepayment options may not increase as much as other fixed income securities. The rate of prepayments on underlying mortgages will affect the price and volatility of Agency RMBS and may have the effect of shortening or extending the duration of the security beyond what was anticipated at the time of purchase. When interest rates rise, our holdings of Agency RMBS may experience reduced returns if the owners of the underlying mortgages pay off their mortgages slower than previously anticipated. This is generally referred to as extension risk.
Mortgage pass-through certificates, collateralized mortgage obligations ("CMOs"), Freddie Mac Gold Certificates, Fannie Mae Certificates and Ginnie Mae Certificates are types of Agency RMBS that are collateralized by either fixed-rate mortgage loans (“FRMs”), adjustable-rate mortgage loans (“ARMs”), or hybrid ARMs. FRMs have an interest rate that is fixed for the term of the loan and do not adjust. The interest rates on ARMs generally adjust annually (although some may adjust more frequently) to an increment over a specified interest rate index. Hybrid ARMs have interest rates that are fixed for a specified period of time (typically three, five, seven or ten years) and, thereafter, adjust to an increment over a specified interest rate index. ARMs and hybrid ARMs generally have periodic and lifetime constraints on how much the loan interest rate can change on any predetermined interest rate reset date. Our allocation of our Agency RMBS collateralized by FRMs, ARMs or hybrid ARMs will depend on various factors including, but not limited to, relative value, expected future prepayment trends, supply and demand, costs of hedging, costs of financing, expected future interest rate volatility and the overall shape of the U.S. Treasury and interest rate swap yield curves. We take these factors into account when we make investments.
Non-Agency RMBS
Non-Agency RMBS are residential mortgage-backed securities that are not issued or guaranteed by a U.S. government agency. Like Agency RMBS, non-Agency RMBS represent interests in “pools” of mortgage loans secured by residential real property. The mortgage loan collateral for non-Agency RMBS generally consists of residential mortgage loans that do not conform to the U.S. government agency underwriting guidelines due to certain factors including mortgage balance in excess of such guidelines, borrower characteristics, loan characteristics and level of documentation.
We also invest in non-Agency RMBS structured as re-securitizations of a real estate mortgage investment conduit (“Re-REMIC”). A Re-REMIC is a transaction in which an existing security or securities is transferred to a special purpose entity that has formed a securitization vehicle that has issued multiple classes of securities secured by and payable from cash flows on the underlying securities.
Government-Sponsored Enterprises Credit Risk Transfer Securities
GSE CRTs are unsecured general obligations of Fannie Mae and Freddie Mac that are structured to provide credit protection to the issuer with respect to defaults and other credit events within pools of residential mortgage loans that collateralize MBS issued and guaranteed by the GSEs. This credit protection is achieved by allowing the GSEs to reduce the outstanding class principal balance of the securities as designated credit events on the loans arise. The GSEs make monthly payments of accrued interest and periodic payments of principal to the holders of the securities. To date, all GSE CRTs have paid a floating interest rate benchmarked to one-month LIBOR.
|
5
|
||
CMBS
CMBS are securities backed by obligations (including certificates of participation in obligations) that are principally secured by commercial mortgages on real property or interests therein having a multifamily or commercial use, such as regional malls, retail space, office buildings, industrial or warehouse properties, hotels, apartments, nursing homes and senior living facilities.
CMBS are typically issued in multiple tranches whereby the more senior classes are entitled to priority distributions to make specified interest and principal payments on such tranches. Losses and other shortfalls from expected amounts to be received on the mortgage pool are borne by the most subordinate classes, which receive payments only after the more senior classes have received all principal and/or interest to which they are entitled. The credit quality of CMBS depends on the credit quality of the underlying mortgage loans, which is a function of factors such as the principal amount of loans relative to the value of the related properties, the mortgage loan terms, such as amortization, market assessment and geographic location, construction quality of the property, and the creditworthiness of the borrowers.
Residential Mortgage Loans
Residential mortgage loans are loans secured by residential real properties. We generally focus our residential mortgage loan acquisition efforts on the purchase of loan portfolios that are first lien, single-family FRMs, ARMs and Hybrid ARMs with original terms to maturity of not more than 30 years and that are either fully amortizing or are interest-only for up to ten years, and fully amortizing thereafter.
Prime and Jumbo Prime Mortgage Loans
Prime mortgage loans are mortgage loans that generally require borrower credit histories, debt-to-income ratios and loan-to-value ratios similar to those dictated by GSE underwriting guidelines, though in certain cases they may not meet the same income documentation or other requirements. Jumbo prime mortgage loans are mortgage loans with requirements similar to prime mortgage loans except that the mortgage balance exceeds the maximum amount permitted by GSE underwriting guidelines.
Alt-A Mortgage Loans
Alt-A mortgage loans are mortgage loans made to borrowers whose qualifying mortgage characteristics do not conform to GSE underwriting guidelines, but whose borrower characteristics may. Generally, Alt-A mortgage loans allow homeowners to qualify for a mortgage loan with reduced or alternative forms of documentation. The credit quality of Alt-A borrowers generally exceeds the credit quality of subprime borrowers.
Subprime Mortgage Loans
Subprime mortgage loans are loans that do not conform to GSE underwriting guidelines. Subprime borrowers generally have imperfect or impaired credit histories and low credit scores.
Reperforming Mortgage Loans
Reperforming mortgage loans are residential mortgage loans that have a history of delinquency and generally have been restructured since origination. Reperforming mortgage loans may or may not have originally conformed to GSE underwriting guidelines. Due to past delinquencies, borrowers generally have impaired credit histories and low credit scores, and may have a greater than normal risk of future delinquencies and defaults.
Commercial Mortgage Loans
Commercial mortgage loans are mortgage loans secured by first or second liens on commercial properties such as regional malls, retail space, office buildings, industrial or warehouse properties, hotels, apartments, nursing homes and senior living facilities. These loans, which tend to range in term from two to ten years, can carry either fixed or floating interest rates. They generally permit pre-payments before final maturity but may require the payment to the lender of yield maintenance pre-payment penalties. First lien loans represent the senior lien on a property while second lien loans or second mortgages represent a subordinate or second lien on a property.
Mezzanine Loans
Mezzanine loans are generally structured to represent a senior position in the borrower’s equity in, and subordinate to a first mortgage loan, on a property. These loans are generally secured by pledges of ownership interests, in whole or in part, in entities that directly or indirectly own the real property. At times, mezzanine loans may be secured by additional collateral,
|
6
|
||
including letters of credit, personal guarantees, or collateral unrelated to the property. Mezzanine loans may be structured to carry either fixed or floating interest rates as well as carry a right to participate in a percentage of gross revenues and a percentage of the increase in the fair market value of the property securing the loan. Mezzanine loans may also contain prepayment lockouts, penalties, minimum profit hurdles and other mechanisms to protect and enhance returns to the lender. Mezzanine loans usually have maturities that match the maturity of the related mortgage loan but may have shorter or longer terms.
Unconsolidated Ventures
The Company has investments in unconsolidated ventures. In circumstances where the Company has a non-controlling interest but is deemed to be able to exert significant influence over the affairs of the enterprise, the Company utilizes the equity method of accounting. Under the equity method of accounting, the initial investment is increased each period for additional capital contributions and a proportionate share of the entity’s earnings and decreased for cash distributions and a proportionate share of the entity’s losses.
Financing Strategy
We generally finance our investments through short- and long-term borrowings structured as repurchase agreements and secured loans. We have historically financed our residential loans held-for-investment through asset-backed securities issued by consolidated securitization trusts. We have also financed investments through the issuances of debt and equity.
Repurchase Agreements
Repurchase agreements are financings pursuant to which we sell our target assets to the repurchase agreement counterparty, the buyer, for an agreed upon price with the obligation to repurchase these assets from the buyer at a future date and at a price higher than the original purchase price. The amount of financing we receive under a repurchase agreement is limited to a specified percentage of the estimated market value of the assets we sell to the buyer. The difference between the sale price and repurchase price is the cost, or interest expense, of financing under a repurchase agreement. Under repurchase agreement financing arrangements, certain buyers require us to provide additional cash collateral in the event the market value of the asset declines to maintain the ratio of value of the collateral to the amount of borrowing.
Secured Loans
Our wholly-owned subsidiary, IAS Services LLC, is a member of the Federal Home Loan Bank of Indianapolis ("FHLBI"). As a member of the FHLBI, IAS Services LLC may borrow funds from the FHLBI in the form of secured advances. FHLBI advances are treated as secured financing transactions and are carried at their contractual amounts.
Leverage
We use leverage on our target assets to achieve our return objectives, which are adjusted as our investment and financing opportunities change. The amount of leverage we apply to a given asset depends primarily on the expected price volatility and liquidity of the asset we use as collateral, the type of financing, the advance rate against our collateral, and the cost of financing. Shorter duration and higher quality liquid assets generally merit higher leverage due to lower price volatility, higher advance rates, and more attractive financing rates. Assets that are less liquid or exhibit higher price volatility tend to be held unlevered or with lower leverage applied.
We include a table that shows the allocation of our equity to our target assets and our repurchase agreement debt-to-equity ratio, a non-GAAP financial measure of leverage in Item 7, "Management's Discussion and Analysis of Operations" of this Report.
Risk Management Strategy
Market Risk Management
Risk management is an integral component of our strategy to deliver returns to our stockholders. Because we invest in MBS, investment losses from prepayment, interest rate volatility or other risks can meaningfully impact our earnings and our distributions to stockholders. In addition, because we employ financial leverage in funding our investment portfolio, mismatches in the maturities of our assets and liabilities can create the need to continually renew or otherwise refinance our liabilities. Our results are dependent upon a positive spread between the returns on our asset portfolio and our overall cost of funding. To minimize the risks to our portfolio, we actively employ portfolio-wide and security-specific risk measurement and management processes in our daily operations. Our Manager’s risk management tools include software and services licensed or purchased from third parties, in addition to proprietary software and analytical methods developed by Invesco.
|
7
|
||
Interest Rate Risk
We engage in a variety of interest rate management techniques that seek to mitigate the influence of interest rate changes on the costs of liabilities and help us achieve our risk management objective. Specifically, we seek to hedge our exposure to potential interest rate mismatches between the interest we earn on our investments and our borrowing costs caused by fluctuations in short-term interest rates. In utilizing leverage and interest rate hedges, we seek to improve risk-adjusted returns and, where possible, to lock in, on a long-term basis, a favorable spread between the yield on our assets and the cost of our financing. We may utilize various derivative financial instruments including puts and calls on securities or indices of securities, futures, interest rate swaps and swaptions, interest rate caps, exchange-traded derivatives, U.S. Treasury securities and options on U.S. Treasury securities and interest rate floors to hedge all or a portion of the interest rate risk associated with the financing of our investment portfolio.
Credit Risk
We believe that our investment strategy will generally keep our credit losses and financing costs low. However, we retain the risk of potential credit losses on all of our residential and commercial mortgage investments. We seek to manage this risk in part through our pre-acquisition due diligence process. In addition, we re-evaluate the credit risk inherent in our investments on a regular basis pursuant to fundamental considerations such as gross domestic product ("GDP"), unemployment, interest rates, retail sales, store closings/openings, corporate earnings, housing inventory, affordability and regional home price trends. We also review key loan credit metrics including, but not limited to, payment status, current loan-to-value ratios, current borrower credit scores and debt yields. These characteristics assist in determining the likelihood and severity of loan loss as well as prepayment and extension expectations. We then perform structural analysis under multiple scenarios to establish likely cash flow profiles and credit enhancement levels relative to collateral performance projections. This analysis allows us to quantify our opinions of credit quality and fundamental value, which are key drivers of portfolio management decisions.
Foreign Exchange Rate Risk
We have an investment in a commercial loan denominated in foreign currency and an investment in an unconsolidated joint venture whose net assets and results of operations are exposed to foreign currency translation risk when translated in U.S. dollars upon consolidation. We seek to hedge our foreign currency exposures by purchasing currency forward contracts.
Investment Guidelines
Our board of directors has adopted the following investment guidelines:
|
•
|
no investment shall be made that would cause us to fail to qualify as a REIT for federal income tax purposes;
|
|
•
|
no investment shall be made that would cause us to be regulated as an investment company under the 1940 Act;
|
|
•
|
our assets will be invested within our target assets; and
|
|
•
|
until appropriate investments can be identified, our Manager may pay off short-term debt, or invest the proceeds of any offering in interest-bearing, short-term investments, including funds that are consistent with maintaining our REIT qualification.
|
These investment guidelines may be changed from time to time by our board of directors without the approval of our stockholders.
Investment Committee
Our investment committee is comprised of certain of our officers and certain of our Manager’s investment professionals. The investment committee periodically reviews our investment portfolio for risk characteristics, investment performance, liquidity, portfolio composition, leverage and other applicable items. It also reviews its compliance with our investment policies and procedures, including our investment guidelines, and our Manager provides our board of directors an investment report at the end of each quarter in conjunction with its review of our quarterly results.
|
8
|
||
Investment Process
Our Manager’s investment team has a strong focus on asset selection and on the relative value of various sectors within the mortgage market. Our Manager utilizes this expertise to build a diversified portfolio. Our Manager incorporates its views on the economic environment and the outlook for the mortgage market, including relative valuation, supply and demand trends, the level of interest rates, the shape of the yield curve, prepayment rates, financing and liquidity, housing prices, delinquencies, default rates and loss severity rates of various collateral types.
Our investment process includes sourcing and screening investment opportunities, assessing investment suitability, conducting interest rate and prepayment analysis, evaluating cash flow and collateral performance, reviewing legal structure and servicer and originator information and investment structuring, as appropriate, to ensure an attractive return commensurate with the risk we are bearing. Upon identification of an investment opportunity, the investment will be screened and monitored by our Manager to determine its impact on maintaining our REIT qualification and our exemption from registration under the 1940 Act. We make investments in sectors where our Manager has strong core competencies and where we believe market risk and expected performance can be reasonably quantified.
Our Manager evaluates each of our investment opportunities based on its expected risk-adjusted return relative to the returns available from other, comparable investments. In addition, we evaluate new opportunities based on their relative expected returns compared to assets held in our portfolio. The terms of any leverage available to us for use in funding an investment purchase are also taken into consideration, as are any risks posed by illiquidity or correlations with other assets in the portfolio. Our Manager also develops a macro outlook with respect to each target asset class by examining factors in the broader economy such as gross domestic product, interest rates, unemployment rates and availability of credit, among other factors. Our Manager analyzes fundamental trends in the relevant target asset class sector to adjust or maintain its outlook for that particular target asset class. These macro decisions guide our Manager’s assumptions regarding model inputs and portfolio allocations among target assets. Additionally, our Manager conducts extensive diligence with respect to each target asset class by, among other things, examining and monitoring the capabilities and financial wherewithal of the parties responsible for the origination, administration and servicing of relevant target assets.
Competition
Our net income depends, in large part, on our ability to acquire assets at favorable spreads over our borrowing costs. In acquiring our investments, we compete with other REITs, specialty finance companies, mortgage bankers, insurance companies, mutual funds, institutional investors, investment banking firms, financial institutions, governmental bodies and other entities. Refer to “Management’s Discussion and Analysis of Financial Condition and Results of Operations — Market Conditions.” In addition, there are numerous REITs with similar asset acquisition objectives. These other REITs increase competition for the available supply of mortgage assets suitable for purchase. Many of our competitors are significantly larger than we are, have access to greater capital and other resources and may have other advantages over us. In addition, some of our competitors may have higher risk tolerances or different risk assessments, which could allow them to consider a wider variety of investments and establish more relationships than we can. Market conditions may attract more competitors, which may increase the competition for sources of financing. An increase in the competition for sources of financing could adversely affect the availability and cost of financing.
We have access to our Manager’s professionals and their industry expertise, which we believe provides us with a competitive advantage. These professionals help us assess investment risks and determine appropriate pricing for certain potential investments. These relationships enable us to compete more effectively for attractive investment opportunities. Despite certain competitive advantages, we may not be able to achieve our business goals or expectations due to the competitive risks that we face. For additional information concerning these competitive risks, refer to “Risk Factors — Risks Related to Our Investments — We operate in a highly competitive market for investment opportunities and competition may limit our ability to acquire desirable investments in our target assets and could also affect the pricing of these securities.”
Staffing
We are externally managed and advised by Invesco Advisers, Inc. Our Manager provides us with our management team, including our officers, and appropriate support personnel. Each of our officers is an employee of our Manager or one of its affiliates. We do not have any employees. Refer to “Certain Relationships and Related Transactions, and Director Independence” for a discussion of our management fee and our relationship with our Manager.
|
9
|
||
Our Corporate Information
Our principal executive offices are located at 1555 Peachtree Street, N.E., Suite 1800, Atlanta, Georgia 30309. Our telephone number is (404) 892-0896. Our website is www.invescomortgagecapital.com. We make available free of charge, through our corporate website, our annual report on Form 10-K, quarterly reports on Form 10-Q, current reports on Form 8-K, and amendments to those reports filed or furnished pursuant to Section 13(a) or 15(d) of the Exchange Act as soon as reasonably practicable after we electronically file such material with, or furnish it to, the SEC. The information on our website is not intended to form a part of or be incorporated by reference into this Report.
Set forth below are the material risks and uncertainties that, if they were to occur, could materially and adversely affect our business, financial condition, results of operations and the trading price of our securities. Additional risks not presently known, or that we currently deem immaterial, also may have a material adverse effect on our business, financial condition and results of operation.
Risks Related to Our Investments
Difficult conditions in the mortgage, residential and commercial real estate markets may cause us to experience market losses related to our investments.
Our results of operations are materially affected by conditions in the mortgage market, the residential and commercial real estate markets, the financial markets and the economy generally. Ongoing concerns about the mortgage market and real estate market, as well as inflation, energy costs, geopolitical issues and the availability and cost of credit, continue to contribute to market volatility. There is a strong correlation between home price growth rates and mortgage loan delinquencies. Any deterioration of the real estate market may cause us to experience losses related to our assets and to sell assets at a loss.
Declines in the market values of our investments may adversely affect our results of operations and credit availability, which may reduce earnings and, in turn, cash available for distribution to our stockholders. In addition, a substantial portion of our investments are classified for accounting purposes as “available-for-sale.” Changes in the market values of those assets will be directly charged or credited to stockholders' equity. As a result, a decline in values may reduce our book value.
Because assets we acquire may experience periods of illiquidity, we may lose profits or be prevented from earning capital gains if we cannot sell mortgage-related assets at an opportune time.
We bear the risk of being unable to dispose of our target assets at advantageous times or in a timely manner because mortgage-related assets generally experience periods of illiquidity. The lack of liquidity may result from the absence of a willing buyer or an established market for these assets, as well as legal or contractual restrictions on resale or the unavailability of financing for these assets. As a result, our ability to vary our portfolio in response to changes in economic and other conditions may be relatively limited, which may cause us to incur losses.
In addition, some of the assets that comprise our investment portfolio and that we acquire are not publicly traded. These securities may be less liquid than publicly-traded securities. The illiquidity of our investments may make it difficult for us to sell such investments if the need or desire arises. In addition, if we are required to liquidate all or a portion of our portfolio quickly, we may realize significantly less than the value at which we have previously recorded our investments. As a result, our ability to vary our portfolio in response to changes in economic and other conditions may be relatively limited, which could adversely affect our results of operations and financial condition.
Our investments may be concentrated and will be subject to risk of default.
While we diversify and intend to continue to diversify our portfolio of investments, we are not required to observe specific diversification criteria, except as may be set forth in the investment guidelines adopted by our board of directors. Therefore, our investments in our target assets may at times be concentrated in certain property types that are subject to higher risk of foreclosure, or secured by properties concentrated in a limited number of geographic locations. For example, as of
December 31, 2015
, a significant percentage of our non-Agency RMBS, GSE CRTs and CMBS was secured by property located in California, as well as New York with respect to our CMBS. Refer to “Management’s Discussion and Analysis of Financial Condition and Results of Operations - Investment Activities - Portfolio Characteristics” for additional information. To the extent that our portfolio is concentrated in any one region or type of security, downturns relating generally to such region or type of security may result in defaults on a number of our investments within a short time period, which may reduce our net income and the value of our capital stock and accordingly reduce our ability to pay dividends to our stockholders.
|
10
|
||
We operate in a highly competitive market for investment opportunities and competition may limit our ability to acquire desirable investments in our target assets and could also affect the pricing of these securities.
We operate in a highly competitive market for investment opportunities. Our profitability depends, in large part, on our ability to acquire our target assets at attractive prices. In acquiring our target assets, we compete with a variety of institutional investors, including other REITs, specialty finance companies, public and private funds (including other funds managed by Invesco), commercial and investment banks, commercial finance and insurance companies and other financial institutions. Many of our competitors are substantially larger and have considerably greater financial, technical, marketing and other resources than we do. Some competitors may have a lower cost of funds and access to funding sources that may not be available to us, such as funding from the U.S. government, if we are not eligible to participate in programs established by the U.S. government. Many of our competitors are not subject to the operating constraints associated with REIT tax compliance or maintenance of an exemption from the 1940 Act. In addition, some of our competitors may have higher risk tolerances or different risk assessments, which could allow them to consider a wider variety of investments and establish more relationships. Furthermore, competition for investments in our target assets may lead to the price of such assets increasing, which may further limit our ability to generate desired returns. We cannot assure you that the competitive pressures we face will not have a material adverse effect on our business, financial condition and results of operations. Also, as a result of this competition, desirable investments in our target assets may be limited in the future and we may not be able to take advantage of attractive investment opportunities from time to time, as we can provide no assurance that we will be able to identify and make investments that are consistent with our investment objectives.
We may invest in investments with which our stockholders may not agree.
Our stockholders will be unable to evaluate the manner in which we invest or the economic merit of our expected investments and, as a result, we may invest in investments with which our stockholders may not agree. The failure of our management to find investments that meet our investment criteria could cause a material adverse effect on our business, financial condition, liquidity, results of operations and ability to make distributions to our stockholders, and could cause the value of our capital stock to decline.
We acquire mortgage-backed and credit risk transfer securities and loans that are subject to defaults, foreclosure timeline extension, fraud and residential and commercial price depreciation, and unfavorable modification of loan principal amount, interest rate and amortization of principal, which could result in losses to us.
Mortgage-backed securities are secured by mortgage loans (primarily single family residential properties for RMBS and single commercial mortgage loans or a pool of commercial mortgage loans for CMBS). GSE CRTs are unsecured obligations of Fannie Mae and Freddie Mac. Coupon payments on GSE CRTs are based on LIBOR, and principal payments and losses are based on prepayments and defined credit events in a reference pool of mortgage loans that collateralize Agency RMBS. Accordingly, our MBS and GSE CRT investments are subject to all the risks of the respective underlying mortgage loans, including risks of defaults, foreclosure timeline extension, fraud, price depreciation and unfavorable modification of loan principal amount, interest rate and amortization of principal.
The ability of a borrower to repay a mortgage loan secured by a residential property is dependent in part upon the income and assets of the borrower. A number of factors over which we have no control may impair a borrower’s ability to repay their loans.
Commercial mortgage loans are secured by multifamily or commercial property and are subject to risks of delinquency and foreclosure, and risks of loss that may be greater than similar risks associated with loans made on the security of single-family residential property. The ability of a borrower to repay a loan secured by an income-producing property typically is dependent primarily upon the successful operation of such property rather than upon the existence of independent income or assets of the borrower. If the net operating income of the property is reduced, the borrower’s ability to repay the loan may be impaired. Net operating income of an income-producing property can be affected by a number of factors over which we have no control.
In the event of any default under a mortgage loan held directly by us, we bear a risk of loss of principal to the extent of any deficiency between the value of the collateral and the principal and accrued interest of the mortgage loan, which could have a material adverse effect on our cash flow from operations. In the event of defaults on the mortgage loans that underlie our investments and the exhaustion of any underlying or any additional credit support, we may not realize our anticipated return on our investments and we may incur a loss on these investments.
Our investments include non-Agency RMBS collateralized by Alt-A and subprime mortgage loans, which are subject to increased risks.
Our investments include non-Agency RMBS backed by collateral pools of mortgage loans known as “Alt-A mortgage loans,” or “subprime mortgage loans.” These loans have been originated using underwriting standards that are less restrictive
|
11
|
||
than those used in underwriting “prime mortgage loans.” These lower standards include mortgage loans made to borrowers having imperfect or impaired credit histories, mortgage loans where the amount of the loan at origination is 80% or more of the value of the mortgage property, mortgage loans made to borrowers who have other debt that represents a large portion of their income and mortgage loans made to borrowers whose income is not required to be disclosed or verified. Due to economic conditions, a decline in home prices, and aggressive lending practices, many Alt-A and subprime mortgage loans have experienced increased rates of delinquency, foreclosure, bankruptcy and loss, and they are likely to continue to experience delinquency, foreclosure, bankruptcy and loss rates that are higher, and that may be substantially higher, than those experienced by mortgage loans underwritten in a more traditional manner. Thus, because of the higher delinquency rates and losses associated with many Alt-A and subprime mortgage loans, the performance of non-Agency RMBS backed by Alt-A and subprime mortgage loans that we may acquire could be correspondingly adversely affected, which could adversely impact our results of operations, financial condition and business.
Our subordinated MBS assets may be in the “first loss” position, subjecting us to greater risks of loss.
We invest in certain tranches of MBS that are only entitled to a portion of the principal and interest payments made on mortgage loans underlying the securities issued by the trust. In general, losses on a mortgage loan included in a RMBS trust will be borne first by the equity holder of the issuing trust if any, and then by the “first loss” subordinated security holder and then by the “second loss” subordinate holder and so on. For CMBS assets, losses on a mortgaged property securing a mortgage loan included in a securitization will be borne first by the equity holder of the property, then by a cash reserve fund or letter of credit, if any, then by the holder of a mezzanine loan or B-Note, if any, then by the “first loss” subordinated security holder (generally, the “B-Piece” buyer) and then by the holder of a higher-rated security.
We may acquire securities at every level of such a trust, from the equity position to the most senior tranche. In the event of default and the exhaustion of any classes of securities junior to those which we acquire, our securities will suffer losses as well. In addition, if we overvalue the underlying mortgage portfolio, or if the values subsequently decline and, as a result, less collateral is available to satisfy interest and principal payments due on the related MBS, the securities which we acquire may effectively become the “first loss” position ahead of the more senior securities, which may result in significant losses. The prices of lower credit quality securities are generally less sensitive to interest rate changes than more highly rated securities, but more sensitive to adverse economic downturns or individual issuer developments. A projection of an economic downturn could cause a decline in the value of lower credit quality securities because the ability of obligors of mortgages underlying MBS to make principal and interest payments may be impaired. In such event, existing credit support in the securitization structure may be insufficient to protect us against loss of our principal on these securities.
Fluctuations in interest rates could adversely affect the value of our investments and cause our interest expense to increase, which could result in reduced earnings, affect our profitability and dividends as well as the cash available for distribution to our stockholders.
Interest rates are highly sensitive to many factors, including governmental monetary and tax policies, domestic and international economic and political considerations and other factors beyond our control. Interest rate fluctuations present a variety of risks, including the risk of a narrowing of the difference between asset yields and borrowing rates, flattening or inversion of the yield curve and fluctuating prepayment rates, and may adversely affect our income and the value of our assets and capital stock.
We invest in Agency RMBS, non-Agency RMBS, GSE CRTs, CMBS and mortgage loans that are subject to risks related to interest rate fluctuations. In a normal yield curve environment, short-term interest rates are lower than long-term interest rates. Fluctuations in short- or long-term interest rates could have adverse effects on our operations and financial condition, which may negatively affect cash available for distribution to our stockholders. Fluctuations in interest rates could impact us as follows:
|
•
|
If long-term rates increased significantly, the market value of investments in our target assets would decline, and the duration and weighted average life of the investments may increase. We could realize a loss if the securities were sold. Further, declines in market value may reduce book value and ultimately reduce earnings or result in losses to us.
|
|
•
|
An increase in short-term interest rates would increase the amount of interest owed on the repurchase agreements we enter into to finance the purchase of our investments.
|
|
•
|
If short-term interest rates rise disproportionately relative to longer-term interest rates (a flattening of the yield curve), our borrowing costs may increase more rapidly than the interest income earned on our assets. Because we expect our investments, on average, generally will bear interest based on longer-term rates than our borrowings, a flattening of the yield curve would tend to decrease our net income. Additionally, to the extent cash flows from investments that return scheduled and unscheduled principal are reinvested, the spread between the yields on the new investments and available borrowing rates may decline, which would likely decrease our net income.
|
|
12
|
||
|
•
|
If short-term interest rates exceed longer-term interest rates (a yield curve inversion), our borrowing costs may exceed our interest income and we could incur operating losses.
|
|
•
|
If interest rates fall, we may recognize losses on our swap positions that are not offset by gains on our assets, which may adversely affect our liquidity and financial position.
|
In a period of rising interest rates, our operating results will depend in large part on the difference between the income from our assets and financing costs. We anticipate that, in most cases, the income from such assets will respond more slowly to interest rate fluctuations than the cost of our borrowings. Consequently, changes in interest rates, particularly short-term interest rates, may significantly influence our net income. Increases in these rates will tend to decrease our net income and the market value of our assets and may negatively affect cash available for distribution to our stockholders.
In addition, market values of our investments may decline without any general increase in interest rates for a number of reasons, such as increases or expected increases in defaults, or increases or expected increases in voluntary prepayments for those investments that are subject to prepayment risk or widening of credit spreads, which may negatively affect cash available for distribution to our stockholders.
An increase in interest rates may cause a decrease in the volume of certain of our target assets which could adversely affect our ability to acquire target assets that satisfy our investment objectives and to generate income and pay dividends.
Rising interest rates generally reduce the demand for mortgage loans due to the higher cost of borrowing. A reduction in the volume of mortgage loans originated may affect the volume of target assets available to us, which could adversely affect our ability to acquire assets that satisfy our investment objectives. Rising interest rates may also cause our target assets that were issued prior to an interest rate increase to provide yields that are below prevailing market interest rates. If rising interest rates cause us to be unable to acquire a sufficient volume of our target assets with a yield that is above our borrowing cost, our ability to satisfy our investment objectives and to generate income and pay dividends may be materially and adversely affected.
We may not control the special servicing of the mortgage loans included in the MBS in which we invest and, in such cases, the special servicer may take actions that could adversely affect our interests.
With respect to each series of MBS in which we invest, overall control over the special servicing of the related underlying mortgage loans is held by a “directing certificate holder” or a “controlling class representative,” which is appointed by the holders of the most subordinate class of MBS in such series. Depending on the class of MBS in which we invest, we may not have the right to appoint the directing certificate holder. In connection with the servicing of the specially serviced mortgage loans, the related special servicer may, at the direction of the directing certificate holder, take actions with respect to the specially serviced mortgage loans that could adversely affect our interests.
We and our third party loan originators and servicers’ due diligence of potential assets may not reveal all of the liabilities associated with such assets and may not reveal other weaknesses in such assets, which could lead to losses.
Before making an asset acquisition, we will assess the strengths and weaknesses of the originator or issuer of the asset as well as other factors and characteristics that are material to the performance of the asset. In making the assessment and otherwise conducting customary due diligence, we will rely on resources available to us, including our third party loan originators and servicers. This process is particularly important with respect to newly formed originators or issuers because there may be little or no information publicly available about these entities and assets. There can be no assurance that our due diligence process will uncover all relevant facts or that any asset acquisition will be successful, which could lead to losses in the value of our portfolio.
We depend on third-party service providers, including mortgage servicers, for a variety of services related to our RMBS. We are, therefore, subject to the risks associated with third-party service providers.
We depend on a variety of services provided by third-party service providers related to our RMBS. We rely on the mortgage servicers who service the mortgage loans backing our RMBS to, among other things, collect principal and interest payments and administer escrow accounts on the underlying mortgages and perform loss mitigation services. At times, mortgage servicers and other service providers to our RMBS, such as trustees, bond insurance providers and custodians, may not perform in a manner that promotes our interests.
For example, recent legislation intended to reduce or prevent foreclosures through, among other things, loan modifications, short sales and other foreclosure alternatives, may reduce the value of mortgage loans underlying our RMBS. Mortgage servicers may be incentivized to pursue such loan modifications, as well as forbearance plans and other actions intended to prevent foreclosure, even if such loan modifications and other actions are not in the best interests of the beneficial owners of the mortgage loans. Similarly, legislation at both the federal and state level delaying the initiation or completion of foreclosure proceedings on specified types of residential mortgage loans or otherwise limiting the ability of mortgage servicers to take actions that may be essential to preserve the value of the mortgage loans may also reduce the value of mortgage loans
|
13
|
||
underlying our RMBS. Any such limitations are likely to cause delayed or reduced collections from mortgagors and generally increase servicing costs and potential foreclosure-related litigation. As a consequence of the foregoing matters, our business, financial condition and results of operations may be adversely affected.
In addition, federal and state governmental and regulatory bodies have pursued settlement agreements with a number of mortgage servicers to address alleged servicing and foreclosure deficiencies related to foreclosure practices, staffing levels and/ or documentation. These agreements may result in the temporary delay of foreclosure proceedings while certain third party servicers modify their foreclosure practices. The extension of foreclosure timelines may increase the backlog of foreclosures and the inventory of distressed homes on the market and create greater uncertainty about housing prices. Prior to making investments in non-Agency RMBS, we carefully consider many factors, including housing prices and foreclosure timelines, and formulate loss assumptions. The concerns about deficiencies in foreclosure practices of servicers may impact our loss assumptions and affect the values of, and our returns on, our investments in non-Agency RMBS.
Our commercial loans held-for investment include investments that involve greater risks of loss than senior loan assets secured by income-producing properties.
We may acquire mezzanine loans, which take the form of subordinated loans secured by second mortgages on the underlying property or loans secured by a pledge of the ownership interests of either the entity owning the property or the entity that owns the interest in the entity owning the property. These types of assets involve a higher degree of risk than long-term senior mortgage lending secured by income-producing real property, because the loan may become unsecured as a result of foreclosure by the senior lender. In the event of a bankruptcy of the entity providing the pledge of its ownership interests as security, we may not have full recourse to the assets of such entity, or the assets of the entity may not be sufficient to satisfy our mezzanine loan. If a borrower defaults on our mezzanine loan or debt senior to our loan, or in the event of a borrower bankruptcy, our mezzanine loan will be satisfied only after the senior debt. As a result, we may not recover some or all of our initial expenditure. In addition, mezzanine loans may have higher loan-to-value ratios than conventional mortgage loans, resulting in less equity in the property and increasing the risk of loss of principal.
In addition, we make commercial loans structured as preferred equity investments. These investments involve a higher degree of risk than conventional debt financing due to a variety of factors, including their non-collateralized nature and subordinated ranking to other loans and liabilities of the entity in which such preferred equity is held. Accordingly, if the issuer defaults on our investment, we would only be able to proceed against such entity in accordance with the terms of the preferred security, and not against any property owned by such entity. Furthermore, in the event of bankruptcy or foreclosure, we would only be able to recoup our investment after all lenders to, and other creditors of, such entity are paid in full. As a result, we may lose all or a significant part of our investment, which could result in significant losses.
We may acquire B-Notes, mortgage loans typically (i) secured by a first mortgage on a single large commercial property or group of related properties, and (ii) subordinated to an A-Note secured by the same first mortgage on the same collateral. As a result, if a borrower defaults, there may not be sufficient funds remaining for B-Note holders after payment to the A-Note holders. However, because each transaction is privately negotiated, B-Notes can vary in their structural characteristics and risks. For example, the rights of holders of B-Notes to control the process following a borrower default may vary from transaction to transaction. Further, B-Notes typically are secured by a single property and reflect the risks associated with significant concentration.
Significant losses related to our commercial loans held for investment would result in operating losses for us and may limit our ability to make distributions to our stockholders.
If we foreclose on an asset, we may come to own and operate the property securing the loan, which would expose us to the risks inherent in that activity.
When we foreclose on an asset, we may take title to the property securing that asset, and if we do not or cannot sell the property, we would then come to own and operate it as “real estate owned.” Owning and operating real property involves risks that are different (and in many ways more significant) than the risks faced in owning an asset secured by that property. In addition, we may end up owning a property that we would not otherwise have decided to acquire directly at the price of our original investment or at all. We may not manage these properties as well as they might be managed by another owner, and our returns to investors could suffer. If we foreclose on and come to own property, our financial performance and returns to stockholders could suffer.
Liability relating to environmental matters may impact the value of properties that we may acquire or foreclose on.
If we acquire or foreclose on properties with respect to which we have extended mortgage loans, we may be subject to environmental liabilities arising from such foreclosed properties. Under various U.S. federal, state and local laws, an owner or operator of real property may become liable for the costs of removal of certain hazardous substances released on its property.
|
14
|
||
These laws often impose liability without regard to whether the owner or operator knew of, or was responsible for, the release of such hazardous substances.
The presence of hazardous substances may adversely affect an owner’s ability to sell real estate or borrow using real estate as collateral. To the extent that an owner of a property underlying one of our debt investments becomes liable for removal costs, the ability of the owner to make payments to us may be reduced, which in turn may adversely affect the value of the relevant mortgage asset held by us and our ability to make distributions to our stockholders. If we acquire any properties, the presence of hazardous substances on a property may adversely affect our ability to sell the property and we may incur substantial remediation costs, thus harming our financial condition. The discovery of material environmental liabilities attached to such properties could have a material adverse effect on our results of operations and financial condition and our ability to make distributions to our stockholders.
We may experience a decline in the market value of our mortgage-backed and credit risk transfer securities.
A decline in the market value of our mortgage-backed and credit risk transfer securities may require us to recognize an “other-than-temporary” impairment against such assets under U.S. GAAP if we were to determine that, with respect to any assets in unrealized loss positions, we do not have the ability and intent to hold such assets to maturity or for a period of time sufficient to allow for recovery to the amortized cost of such assets. If such a determination were to be made, we would recognize unrealized losses through earnings and write down the amortized cost of such assets to a new cost basis, based on the fair market value of such assets on the date they are considered to be other-than-temporarily impaired. Such impairment charges reflect non-cash losses at the time of recognition; subsequent disposition or sale of such assets could further affect our future losses or gains, as they are based on the difference between the sale price received and adjusted amortized cost of such assets at the time of sale.
If our Manager underestimates the collateral loss on our investments, we may experience losses.
Our Manager values our potential investments based on loss-adjusted yields, taking into account estimated future losses on the mortgage loans that collateralize the investments, and the estimated impact of these losses on expected future cash flows. Our Manager’s loss estimates may not prove accurate, as actual results may vary from estimates. In the event that our Manager underestimates the pool level losses relative to the price we pay for a particular investment, we may experience losses with respect to such investment.
Our mortgage-backed and credit risk transfer securities are recorded at estimated fair value and, as a result, there is uncertainty as to the value of these investments.
Some of our mortgage-backed and credit risk transfer securities are in the form of securities that are not publicly or actively traded. The fair value of mortgage-backed and credit risk transfer securities that are not publicly or actively traded may not be readily determinable. We value these investments quarterly at fair value, which may include unobservable inputs. Because such valuations are subjective, the fair value of certain of our assets may fluctuate over short periods of time and our determinations of fair value may differ materially from the values that would have been used if a ready market for these securities existed. The value of our capital stock could be adversely affected if our determinations regarding the fair value of these investments were materially higher than the values that we ultimately realize upon their disposal.
Prepayment rates may adversely affect the value of our investment portfolio.
Pools of residential mortgage loans underlie the RMBS that we acquire. In the case of residential mortgage loans, there are seldom any restrictions on borrowers’ abilities to prepay their loans. We generally receive prepayments of principal that are made on these underlying mortgage loans. When borrowers prepay their mortgage loans faster than expected, the prepayments on the RMBS are also faster than expected. Faster than expected prepayments could adversely affect our profitability, including in the following ways:
|
•
|
We may purchase RMBS that have a higher interest rate than the market interest rate at the time. In exchange for this higher interest rate, we may pay a premium over the par value to acquire the security. In accordance with U.S. GAAP, we may amortize this premium over the estimated term of the RMBS. If the RMBS is prepaid in whole or in part prior to its maturity date, however, we may be required to expense the premium that was prepaid at the time of the prepayment.
|
|
•
|
A substantial portion of our adjustable-rate RMBS may bear interest rates that are lower than their fully indexed rates, which are equivalent to the applicable index rate plus a margin. If an adjustable-rate RMBS is prepaid prior to or soon after the time of adjustment to a fully-indexed rate, we will have held that RMBS while it was least profitable and lost the opportunity to receive interest at the fully indexed rate over the remainder of its expected life.
|
|
•
|
If we are unable to acquire new RMBS similar to the prepaid RMBS, our financial condition, results of operation and cash flow would suffer. Prepayment rates generally increase when interest rates fall and decrease when interest rates
|
|
15
|
||
rise, but changes in prepayment rates are difficult to predict. Prepayment rates also may be affected by conditions in the housing and financial markets, general economic conditions and the relative interest rates on FRMs and ARMs.
While we seek to minimize prepayment risk to the extent practical, in selecting investments we must balance prepayment risk against other risks and the potential returns of each investment. No strategy can completely insulate us from prepayment risk.
Ongoing market conditions may upset the historical relationship between interest rate changes and prepayment trends, which would make it more difficult for us to analyze our investment portfolio.
Our success depends on our ability to analyze the relationship of changing interest rates on prepayments of the mortgage loans that underlie our RMBS and mortgage loans we acquire. Changes in interest rates and prepayments affect the market price of the target assets. As part of our overall portfolio risk management, we analyze interest rate changes and prepayment trends separately and collectively to assess their effects on our investment portfolio. In conducting our analysis, we depend on certain assumptions based upon historical trends with respect to the relationship between interest rates and prepayments under normal market conditions. If dislocations in the mortgage market or other developments change the way that prepayment trends have historically responded to interest rate changes, our ability to (1) assess the market value of our investment portfolio, (2) implement our hedging strategies, and (3) implement techniques to reduce our prepayment rate volatility would be significantly affected, which could materially adversely affect our financial position and results of operations.
Risks Related to Financing and Hedging
We use leverage in executing our business strategy, which may adversely affect the return on our assets and may reduce cash available for distribution to our stockholders, as well as increase losses when economic conditions are unfavorable.
We use leverage to finance our assets through borrowings from repurchase agreements and other secured and unsecured forms of borrowing (including Federal Home Loan Bank advances), and we contribute capital to equity investments. The amount of leverage we may deploy for particular assets will depend upon our Manager’s assessment of the credit and other risks of those assets and is limited by our debt covenants.
Our access to financing depends upon a number of factors over which we have little or no control, including:
•
general market conditions;
•
the lender’s view of the quality of our assets, valuation of our assets and our liquidity;
•
the lender’s perception of our growth potential;
•
regulatory requirements of the Federal Housing Finance Authority or Federal Home Loan Bank;
•
our current and potential future earnings and cash distributions; and
•
the market price of the shares of our capital stock.
Any weakness or volatility in the financial markets, the residential and commercial mortgage markets or the economy generally could adversely affect the factors listed above. In addition, such weakness or volatility could adversely affect one or more of our potential lenders and could cause one or more of our potential lenders to be unwilling or unable to provide us with financing or to increase the costs of that financing. Some of our target assets may be more difficult to finance than others and the market for such financing can change based on many factors over which we have little or no control.
The return on our assets and cash available for distribution to our stockholders may be reduced to the extent that market conditions prevent us from leveraging our assets or cause the cost of our financing to increase relative to the income that can be derived from the assets acquired. Our financing costs will reduce cash available for distributions to stockholders. We may not be able to meet our financing obligations and, to the extent that we cannot, we risk the loss of some or all of our assets to liquidation or sale to satisfy the obligations.
As a result of ongoing market conditions and a significantly expanded regulatory environment it may be more difficult for us to secure financing.
Our results of operations are materially affected by conditions in the financial markets and the economy generally. Continuing concerns over the expansion of consumer protection rules and regulations, regulatory enforcement actions and their impact on underwriting standards and the overall availability of consumer credit, as well as inflation, energy price volatility, geopolitical issues, unemployment, the cost of credit, the mortgage market and the real estate market contribute to market volatility.
In recent years, dramatic declines in the residential and commercial real estate markets, decreased home prices and increased foreclosures and unemployment resulted in significant asset writedowns by financial institutions, which caused many financial institutions to seek additional capital, to merge with other institutions and, in some cases, to fail. We rely significantly
|
16
|
||
on the availability of repurchase agreement financing to acquire many of our target assets. Institutions from which we seek to obtain financing may have owned or financed distressed, non-performing or sub-performing residential or commercial mortgage loans, real estate-related securities and real estate loans which have declined in value and caused losses. Many lenders and institutional investors have reduced and, in some cases, ceased to provide funding to borrowers, including other financial institutions. As a result of ongoing market conditions and regulatory actions, it may be more difficult and more costly for us to secure financing as there are fewer institutional lenders and those remaining lenders have tightened their lending standards. Our profitability may be adversely affected by this significantly expanded regulatory environment and aggressive enforcement climate in addition to the prospect of liquidity challenges if we are unable to secure financing for our assets.
We depend on repurchase agreement financing to acquire our target assets and our inability to access this funding on acceptable terms could have a material adverse effect on our results of operations, financial condition and business.
We use repurchase agreement financing as a strategy to increase the return on our assets. However, we may not be able to achieve our desired leverage ratio for a number of reasons, including if the following events occur:
•
our lenders do not make repurchase agreement financing available to us at acceptable rates;
•
certain of our lenders exit the repurchase market;
•
our lenders require that we pledge additional collateral to cover our borrowings, which we may be unable to do; or
•
we determine that the leverage would expose us to excessive risk.
Our ability to fund our target assets may be impacted by our ability to secure repurchase agreement financing on acceptable terms. We can provide no assurance that lenders will be willing or able to provide us with sufficient financing. In addition, because repurchase agreements are short-term commitments of capital, lenders may respond to market conditions making it more difficult for us to secure continued financing. During certain periods of the credit cycle, lenders may curtail their willingness to provide financing. For example, in response to market conditions lenders have in the past and may in the future increase financing rates and decrease advance rates. Repurchase agreement counterparties have taken these steps in order to compensate themselves for a perceived increased risk due to the illiquidity of the underlying collateral. In some cases, margin calls have forced borrowers to liquidate collateral in order to meet the capital requirements of these margin calls, resulting in losses. In addition, if major market participants were to exit the repurchase agreement financing business, the value of our portfolio could be negatively impacted, thus reducing net stockholder equity, or book value. Furthermore, if many of our current or potential lenders are unwilling or unable to provide us with repurchase agreement financing, we could be forced to sell our assets at an inopportune time when prices are depressed. In addition, if the regulatory capital requirements imposed on our lenders change, they may be required to significantly increase the cost of the financing that they provide to us. Our lenders also may revise their eligibility requirements for the types of assets they are willing to finance or the terms of such financings, based on, among other factors, the regulatory environment and their management of perceived risk, particularly with respect to assignee liability.
If a counterparty to our repurchase transactions defaults on its obligation to resell the underlying security back to us at the end of the transaction term, if the value of the underlying security has declined as of the end of that term, or if we default on our obligations under the repurchase agreement, we may incur a loss on our repurchase transactions.
When we engage in repurchase transactions, we generally sell securities to lenders (repurchase agreement counterparties) and receive cash from these lenders. The lenders are obligated to resell the same or similar securities back to us at the end of the term of the transaction. Because the cash we receive from the lender when we initially sell the securities to the lender is less than the value of those securities (this difference is the haircut), if the lender defaults on its obligation to resell the same securities back to us we may incur a loss on the transaction equal to the amount of the haircut (assuming there was no change in the value of the securities). As of
December 31, 2015
,
three
counterparties held collateral that exceeded the amounts borrowed under the related repurchase agreements by more than
$113.3 million
, or 5% of our stockholders’ equity. Refer to Note 7 - "Borrowings" of our consolidated financial statements included in Part IV, Item 15 of this Report, for additional detail. We may incur a loss on a repurchase transaction if the value of the underlying securities has declined as of the end of the transaction term, as we would have to repurchase the securities for their initial value but would receive securities worth less than that amount. Further, if we default on one of our obligations under a repurchase transaction, the lender can terminate the transaction and cease entering into any other repurchase transactions with us. Some of our repurchase agreements contain cross-default provisions, so that if a default occurs under any one agreement, the lenders under our other agreements could also declare a default. Any losses we incur on our repurchase transactions could adversely affect our earnings and thus our cash available for distribution to our stockholders.
The repurchase agreements, secured loans and other financing arrangements that we use to finance our investments may require us to provide additional collateral and may restrict us from leveraging our assets as fully as desired.
The amount of financing we receive, or may in the future receive, under our repurchase agreements, secured loans and other financing arrangements, is directly related to the lenders’ valuation of the assets that secure the outstanding borrowings.
|
17
|
||
Lenders under our repurchase agreements and secured loans typically have the absolute right to reevaluate the market value of the assets that secure outstanding borrowings at any time. If a lender determines in its sole discretion that the value of the assets has decreased, it has the right to initiate a margin call or increase collateral requirements. A margin call or increased collateral requirements would require us to transfer additional assets to such lender without any advance of funds from the lender for such transfer or to repay a portion of the outstanding borrowings. Any such margin call or increased collateral requirements could have a material adverse effect on our results of operations, financial condition, business, liquidity and ability to make distributions to our stockholders, and could cause the value of our capital stock to decline. We may be forced to sell assets at significantly depressed prices to meet such margin calls and to maintain adequate liquidity, which could cause us to incur losses. Moreover, to the extent we are forced to sell assets at such time, given market conditions, we may be selling at the same time as others facing similar pressures, which could exacerbate a difficult market environment and which could result in our incurring significantly greater losses on our sale of such assets. In an extreme case of market duress, a market may not even be present for certain of our assets at any price. Such a situation would likely result in a rapid deterioration of our financial condition and possibly necessitate a filing for bankruptcy protection.
Further, financial institutions providing the repurchase facilities may require us to maintain a certain amount of cash uninvested or to set aside non-levered assets sufficient to maintain a specified liquidity position which would allow us to satisfy our collateral obligations. In addition, the FHLBI could increase our collateral requirements. As a result, we may not be able to leverage our assets as fully as desired, which could reduce our return on equity. If we are unable to meet these collateral obligations, our financial condition could deteriorate rapidly.
A failure to comply with covenants in our repurchase agreements, secured loans and other financing arrangements would have a material adverse effect on us, and any future financings may require us to provide additional collateral or pay down debt.
We are subject to various covenants contained in our existing financing arrangements and may become subject to additional covenants in connection with future financings. Many of our master repurchase agreements, as well as our FHLB financing arrangements and swap agreements, require us to maintain compliance with various financial covenants, including a minimum tangible net worth, specified financial ratios, such as total debt to total assets and financial information delivery obligations. These covenants may limit our flexibility to pursue certain investments or incur additional debt. If we fail to meet or satisfy any of these covenants, we would be in default under these agreements, and our lenders could elect to declare outstanding amounts due and payable, terminate their commitments, require the posting of additional collateral and/or enforce their interests against existing collateral. We may also be subject to cross-default and acceleration rights and, with respect to collateralized debt, the posting of additional collateral and foreclosure rights upon default. Further, this could also make it difficult for us to satisfy the distribution requirements necessary to maintain our status as a REIT for U.S. federal income tax purposes.
Our use or future use of repurchase agreements to finance our target assets may give our lenders greater rights in the event that either we or a lender files for bankruptcy.
Our borrowings or future borrowings under repurchase agreements for our target assets may qualify for special treatment under the U.S. Bankruptcy Code, giving our lenders the ability to avoid the automatic stay provisions of the U.S. Bankruptcy Code and to take possession of and liquidate the assets that we have pledged under their repurchase agreements without delay in the event that we file for bankruptcy. Furthermore, the special treatment of repurchase agreements under the U.S. Bankruptcy Code may make it difficult for us to recover our pledged assets in the event that a lender party to such agreement files for bankruptcy. Therefore, our use of repurchase agreements to finance our investments exposes our pledged assets to risk in the event of a bankruptcy filing by either a lender or us.
We enter into hedging transactions that could expose us to contingent liabilities in the future.
Part of our investment strategy involves entering into hedging transactions that could require us to fund cash payments in certain circumstances (such as the early termination of the hedging instrument caused by an event of default or other early termination event, or the decision by a counterparty to request margin securities it is contractually owed under the terms of the hedging instrument). The amount due would be equal to the unrealized loss of the open swap positions with the respective counterparty and could also include other fees and charges. Such economic losses would be reflected in our results of operations, and our ability to fund these obligations would depend on the liquidity of our assets and access to capital at the time, and the need to fund these obligations could adversely impact our financial condition.
Hedging may adversely affect our earnings, which could reduce our cash available for distribution to our stockholders.
We pursue various hedging strategies to seek to reduce our exposure to adverse changes in interest rates and currency exchange rates. Our hedging activity varies in scope based on the level and volatility of interest rates, currency exchange rates,
|
18
|
||
the type of assets held and other changing market conditions. Hedging may fail to protect or could adversely affect us because, among other things:
|
•
|
interest rate and/or currency hedging can be expensive, particularly during periods of rising and volatile interest rates;
|
|
•
|
available interest rate hedges may not correspond directly with the interest rate risk for which protection is sought;
|
|
•
|
due to a credit loss, the duration of the hedge may not match the duration of the related liability;
|
|
•
|
the amount of income that a REIT may earn from hedging transactions (other than hedging transactions that satisfy certain requirements of the Internal Revenue Code or that are done through a taxable REIT subsidiary (“TRS”)) to offset interest rate losses is limited by U.S. federal tax provisions governing REITs;
|
|
•
|
the credit quality of the hedging counterparty owing money on the hedge may be downgraded to such an extent that it impairs our ability to sell or assign our side of the hedging transaction; and
|
•
the hedging counterparty owing money in the hedging transaction may default on its obligation to pay.
Our hedging transactions, which are intended to limit losses, may actually adversely affect our earnings, which could reduce our cash available for distribution to our stockholders.
In addition, the enforceability of agreements underlying hedging transactions may depend on compliance with applicable statutory and commodity and other regulatory requirements and, depending on the identity of the counterparty, applicable international requirements. Any actions taken by regulators could constrain our investment strategy and could increase our costs, either of which could materially and adversely impact our results of operations.
The business failure of a hedging counterparty with whom we enter into a hedging transaction will most likely result in its default. Default by a party with whom we enter into a hedging transaction may result in the loss of unrealized profits and force us to cover our commitments, if any, at the then current market price. Although generally we seek to reserve the right to terminate our hedging positions, it may not always be possible to dispose of or close out a hedging position without the consent of the hedging counterparty and we may not be able to enter into an offsetting contract in order to cover our risk. We cannot assure you that a liquid secondary market will exist for hedging instruments purchased or sold, and we may be required to maintain a position until exercise or expiration, which could result in losses.
We may enter into derivative contracts that expose us to contingent liabilities and those contingent liabilities may not appear on our balance sheet. We may invest in synthetic securities, credit default swaps, and other credit derivatives, which expose us to additional risks.
We have entered, and may again in the future, enter into derivative contracts that could require us to make cash payments in certain circumstances. Potential payment obligations would be contingent liabilities and may not appear on our balance sheet. Our ability to satisfy these contingent liabilities depends on the liquidity of our assets and our access to capital and cash. The need to fund these contingent liabilities could adversely impact our financial condition.
We may invest in synthetic securities, credit default swaps, and other credit derivatives that reference other real estate securities or indices. These investments may present risks in excess of those resulting from the referenced security or index. These investments are typically a contractual relationship with counterparties and not an acquisition of a referenced security or other asset. In these types of investments, we have no right to directly enforce compliance with the terms of the referenced security or other assets and we have no voting or other consensual rights of ownership with respect to the referenced security or other assets. In the event of insolvency of a counterparty, we will be treated as a general creditor of the counterparty and will have no claim of title with respect to the referenced security.
The markets for these types of investments may not be liquid. Many of these investments incorporate “pay as you go” credit events which have been introduced into the market fairly recently. For example, the terms of credit default swaps are still evolving and may change significantly, which could make it more difficult to assign such an instrument or determine the “loss” pursuant to the underlying agreement. In a credit default swap, the party wishing to “buy” protection will pay a premium. When interest rates change, the spreads change, or the prevailing credit premiums on credit default swaps change, the amount of the termination payment due could change by a substantial amount. In an illiquid market, the determination of this change could be difficult to ascertain and, as a result, we may not achieve the desired benefit of entering into this contractual relationship. To date, we have entered into a limited number of these agreements. We may over time increase our exposure to these types of investments as the market for them grows and during times when acquiring other real estate loans and securities may be difficult. We may find credit default swaps and other forms of synthetic securities to be a more efficient method of providing credit-enhancement on specific pools of real estate loans. Our efforts to manage the risk associated with these investments, including counterparty risks may prove to be insufficient in enabling us to generate the returns anticipated.
|
19
|
||
Risks Related to Our Company
Maintaining 1940 Act exclusions for our subsidiaries imposes limits on our operations. Failure to maintain an exclusion could have a material negative impact on our operations.
We conduct our operations so that neither we, nor our operating partnership, IAS Operating Partnership LP (the “Operating Partnership”) nor the subsidiaries of the Operating Partnership are required to register as an investment company under the 1940 Act.
Section 3(a)(1)(A) of the 1940 Act defines an investment company as any issuer that is or holds itself out as being engaged primarily in the business of investing, reinvesting or trading in securities. We believe neither we nor our Operating Partnership will be considered an investment company under Section 3(a)(1)(A) of the 1940 Act because neither we nor our Operating Partnership will engage primarily or hold ourselves out as being engaged primarily in the business of investing, reinvesting or trading in securities. Rather, through our Operating Partnership’s wholly-owned or majority-owned subsidiaries, we and our Operating Partnership will be primarily engaged in the non-investment company businesses of these subsidiaries, namely the business of purchasing or otherwise acquiring real property, mortgages and other interests in real estate.
Section 3(a)(1)(C) of the 1940 Act defines an investment company as any issuer that is engaged or proposes to engage in the business of investing, reinvesting, owning, holding or trading in securities and owns or proposes to acquire investment securities having a value exceeding 40% of the value of the issuer’s total assets (exclusive of U.S. government securities and cash items) on an unconsolidated basis, which we refer to as the 40% test. Excluded from the term “investment securities,” among other things, are U.S. government securities and securities issued by majority-owned subsidiaries that are not themselves investment companies and are not relying on the exception from the definition of investment company set forth in Section 3(c)(1) or Section 3(c)(7) of the 1940 Act.
We are a holding company that conducts its businesses through the Operating Partnership and the Operating Partnership’s wholly-owned or majority-owned subsidiaries. Both we and the Operating Partnership conduct our operations so that we comply with the 40% test. Accordingly, the securities issued by these subsidiaries that are excepted from the definition of "investment company" under Section 3(c)(1) or Section 3(c)(7) of the 1940 Act, together with any other investment securities the Operating Partnership may own, may not have a value in excess of 40% of the value of the Operating Partnership's total assets (exclusive of U.S. government securities and cash items) on an unconsolidated basis. Compliance with the 40% test limits the types of businesses in which we are permitted to engage through our subsidiaries. Furthermore, IAS Asset I LLC and certain of the Operating Partnership’s other subsidiaries that we may form in the future intend to rely upon an exception from the definition of investment company under Section 3(c)(5)(C) of the 1940 Act, which is available for entities “primarily engaged in the business of purchasing or otherwise acquiring mortgages and other liens on and interests in real estate.” This exception generally requires that at least 55% of a subsidiary’s portfolio must be comprised of qualifying assets and at least 80% of its portfolio must be comprised of qualifying assets and real estate-related assets (and no more than 20% comprised of miscellaneous assets). In analyzing a subsidiary's compliance with Section 3(c)(5)(C) of the 1940 Act, we classify investments based in large measure on SEC staff guidance, including no-action letters, and, in the absence of SEC guidance, on our view of what constitutes a qualifying real estate asset and a real estate-related asset.
Qualification for exception from the definition of investment company under the 1940 Act limits our ability to make certain investments. Therefore, IAS Asset I LLC and the Operating Partnership’s other subsidiaries may need to adjust their respective assets and strategy from time-to-time in order to continue to rely on the exception from the definition of investment company under Section 3(c)(5)(C) of the 1940 Act. Any such adjustment in assets or strategy is not expected to have a material adverse effect on our business or strategy. There can be no assurance that we will be able to maintain this exception from the definition of investment company for IAS Asset I LLC and the Operating Partnership’s other subsidiaries intending to rely on Section 3(c)(5)(C) of the 1940 Act.
We may in the future organize one or more subsidiaries that seek to rely on other exceptions from being deemed an investment company under the 1940 Act, such as the exception provided to certain structured financing vehicles by Rule 3a-7. Any such subsidiary would need to be structured to comply with any guidance that may be issued by the SEC staff on the restrictions contained in Rule 3a-7 or any other exception on which we seek to rely.
There can be no assurance that the laws and regulations governing the 1940 Act status of REITs will not change in a manner that adversely affects our operations or inhibits our ability to pursue our strategies. Any issuance of more specific or different guidance relating to the relevant exemptions and exceptions from the definition of an investment company under the 1940 Act could similarly affect or inhibit our operations. If we, the Operating Partnership or its subsidiaries fail to maintain an exception or exemption from the 1940 Act, we could, among other things, be required to (a) change the investments that we hold or the manner in which we conduct our operations to avoid being required to register as an investment company, (b) effect sales of our assets in a manner that, or at a time when, we would not otherwise choose to do so, or (c) register as an investment company. Any of these events could cause us to incur losses and negatively affect the value of our capital stock, the
|
20
|
||
sustainability of our business model, and our ability to make distributions, which could have an adverse effect on our business and the market price for our shares of capital stock. In addition, if it were established that we were an unregistered investment company, there would be a risk that we would be subject to monetary penalties or injunctive relief imposed by the SEC.
We may be adversely affected by the current and future economic, regulatory and other actions of government bodies and their agencies.
The U.S. government, Federal Reserve, U.S. Treasury, Securities and Exchange Commission and other governmental and regulatory bodies have taken a number of economic actions and regulatory initiatives designed to stabilize and stimulate the economy and the financial markets, and additional actions and initiatives may occur in the future.
In addition, foreign financial markets have experienced significant volatility related to events such as the European debt crisis, declining currencies in certain emerging markets and governments’ and central banks' responses. Such responses have included the implementation of various financial reforms including but not limited to development of the Basel III standards by the Basel Committee on Banking Supervision.
There can be no assurance that, in the long term, actions the government and regulatory bodies or central banks have taken in the past or may take in the future will improve the efficiency and stability of mortgage or financial markets. To the extent the financial markets do not respond favorably to any of these actions or such actions do not function as intended, our business may be harmed. In addition, because the programs are designed, in part, to improve the markets for certain of our target assets, the establishment of these programs may result in increased competition for attractive opportunities in our target assets or, in the case of government-backed refinancing and modification programs, may have the effect of reducing the revenues associated with certain of our target assets. We cannot predict whether or when additional actions or initiatives to stabilize and stimulate the economy and the financial markets may occur, and such actions could have an adverse effect on our business, results of operations and financial condition.
We may change any of our strategies, policies or procedures without stockholder consent.
We may change any of our strategies, policies or procedures with respect to investments, acquisitions, growth, operations, indebtedness, capitalization and distributions at any time without the consent of our stockholders, which could result in an investment portfolio with a different risk profile. A change in our investment strategy may increase our exposure to interest rate risk, default risk and real estate market fluctuations. Furthermore, a change in our asset allocation could result in our making investments in asset categories different from those described in this Report. These changes could adversely affect our business, financial condition, results of operations, the market price of our capital stock and our ability to make distributions to our stockholders.
We are highly dependent on information systems and systems failures could significantly disrupt our business, which may, in turn, negatively affect the market price of our capital stock and our ability to pay dividends.
Our business is highly dependent on third parties’ information systems, including our Manager and other service providers. Any failure or interruption of such systems or cyber-attacks or security breaches could cause delays or other problems in our securities trading activities and financial, accounting and other data processing activities, which could have a material adverse effect on our operating results and negatively affect the market price of our capital stock and our ability to pay dividends to our stockholders. In addition, we also face the risk of operational failure, termination or capacity constraints of any of the third parties with which we do business or that facilitate our business activities, including clearing agents or other financial intermediaries we use to facilitate our securities transactions.
Computer malware, viruses and computer hacking and phishing attacks have become more prevalent in our industry and may occur on our Manager's and other service providers' systems in the future. We rely heavily on our and our third party providers’ financial, accounting and other data processing systems. It is difficult to determine what, if any, negative impact may directly result from any specific interruption or cyber-attacks or security breaches of such networks or systems or any failure to maintain the performance, reliability and security of our technical infrastructure. As a result, any computer malware, viruses and computer hacking and phishing attacks may negatively affect our operations.
|
21
|
||
We may repurchase shares of our common stock or other securities from time to time. Share repurchases may negatively impact our compliance with covenants in our financing agreements and regulatory requirements (including maintaining exclusions from the requirements of the 1940 Act and qualification as a REIT). Any compliance failures associated with share repurchases could have a material negative impact on our business, financial condition and results of operations. Share repurchases also may negatively impact our ability to invest in our target assets in the future.
As of December 31, 2015,
5,302,533
shares of common stock were available under our Board authorized share repurchase program. We may engage in share repurchases from time-to-time through open market purchases, including block purchases or privately negotiated transactions, or pursuant to any trading plan that may adopted in accordance with Rules 10b5-1 and 10b-18 of the Exchange Act. Certain of our financing agreements have financial covenants, including covenants related to maintaining a certain level of stockholders equity, that may be impacted by our share repurchases. In addition, we generally fund share repurchases with interest income or income from the sale of our assets. The sale of assets to fund share repurchases could impact the allocation of our portfolio for purposes of maintaining an exclusion from the requirements of the 1940 Act and could impact our ability to comply with income and asset tests required to qualify as a REIT. The failure to comply with covenants in our financing agreements, to maintain our exemption from the 1940 Act or to qualify as a REIT could have a material negative impact on our business, financial condition and results of operations. In addition, our decision to repurchase shares of our common stock or other securities and reduce our stockholders equity could negatively impact our competitive position with peer mortgage REIT companies and other competitors and could negatively impact our ability in the future to invest in assets that have a greater potential return than the repurchase of our common stock.
Risks Related to Accounting
The preparation of our financial statements involves use of estimates, judgments and assumptions, and our financial statements may be materially affected if our estimates prove to be inaccurate.
Financial statements prepared in accordance with U.S. GAAP require the use of estimates, judgments and assumptions that affect the reported amounts. Different estimates, judgments and assumptions reasonably could be used that would have a material effect on the financial statements, and changes in these estimates, judgments and assumptions are likely to occur from period to period in the future. Significant areas of accounting requiring the application of management’s judgment include, but are not limited to, determining the fair value of investment securities and reserves for loan losses. These estimates, judgments and assumptions are inherently uncertain, and, if they prove to be wrong, then we face the risk that charges to income will be required. Any such charges could significantly harm our business, financial condition, results of operations and the price of our securities. Refer to “Management’s Discussion and Analysis of Financial Condition and Results of Operations - Critical Accounting Policies” for a discussion of the accounting estimates, judgments and assumptions that we believe are the most critical to an understanding of our business, financial condition and results of operations.
We have discontinued hedge accounting for interest rate swap agreements which may result in volatility in our U.S. GAAP earnings.
We enter into derivative transactions to reduce the impact that changes in interest rates will have on our net interest margin. Effective December 31, 2013, we discontinued hedge accounting for our interest rate swap agreements by de-designating the interest rate swaps as cash flow hedges. All of our interest rate swaps had previously been accounted for as cash flow hedges. As a result of discontinuing hedge accounting, beginning January 1, 2014, changes in the fair value of interest rate swap agreements are now recorded in the Company's consolidated statement of operations as "gain (loss) on derivative instruments, net" and may result in volatility in our U.S. GAAP earnings. The total changes in fair value may exceed our consolidated net income in any period or for a full year. Volatility in our net income may adversely affect the price of our capital stock.
Our reported U.S. GAAP financial results differ from our REIT taxable income that impact our dividend distribution requirements and, therefore, our U.S. GAAP results may not be an accurate indicator of future taxable income and dividend distributions.
Generally, the cumulative net income we report over the life of an asset will be the same for U.S. GAAP and tax purposes, although the timing of this income recognition over the life of the asset could be materially different. Differences exist in the accounting for U.S. GAAP net income and REIT taxable income which can lead to significant variances in the amount and timing of when income and losses are recognized under these two measures. Due to these differences, our reported U.S. GAAP financial results could materially differ from our determination of taxable income, which impacts our dividend distribution requirements. Therefore, our U.S. GAAP results may not be an accurate indicator of future REIT taxable income and dividend distributions. Capital gains and losses in a period may impact REIT taxable income and impact the dividend paid in future periods.
|
22
|
||
We have restated our prior consolidated financial statements, which may lead to additional risks and uncertainties, including loss of investor confidence and negative impacts on our stock price.
As discussed in Controls and Procedures included in Part II, Item 9A of this Report, we restated our audited consolidated financial statements as of and for the years ended December 31, 2013 and 2014 and our unaudited consolidated financial statements for all interim periods commencing with the quarter ended March 31, 2013 through the quarter ended March 31, 2015 (the “Restated Periods”). The determination to restate the financial statements for the Restated Periods was made by our Audit Committee upon management’s recommendation following the identification of errors related to the accounting treatment of our investment in GSE CRTs and Agency MBS IOs. Due to the errors, our Audit Committee concluded that our previously issued financial statements for the Restated Periods should no longer be relied upon. Our Annual Report on Form 10-K for the year ended December 31, 2014 and our Quarterly Report on Form 10-Q for the quarter ended March 31, 2015 have been amended to reflect the restatement of our financial statements for the Restated Periods (the “Restatement”).
As a result of these events, we incurred a number of additional costs, including unanticipated costs for accounting and legal fees related to the Restatement and the remediation of our ineffective disclosure controls and procedures and material weakness in internal control over financial reporting. We could be subject to additional stockholder, governmental, or other actions in connection with the Restatement. Any such proceedings will, regardless of the outcome, consume a significant amount of management’s time and attention and may result in additional legal, accounting, insurance and other costs. If we do not prevail in any such proceedings, we could be required to pay substantial damages or settlement costs. Each of these occurrences could have a material adverse effect on our business, results of operations, financial condition and stock price which could, among other items, result in a default under the Company’s financing agreements.
Risks Related to Our Relationship with Our Manager
We are dependent on our Manager and its key personnel for our success.
We have no separate facilities and are completely reliant on our Manager. We do not have any employees. Our executive officers are employees of our Manager or one of its affiliates. Our Manager has significant discretion as to the implementation of our investment and operating policies and strategies. Accordingly, we believe that our success depends to a significant extent upon the efforts, experience, diligence, skill and network of business contacts of the executive officers and key personnel of our Manager. The executive officers and key personnel of our Manager evaluate, negotiate, close and monitor our investments; therefore, our success depends on their continued service. The departure of any of the executive officers or key personnel of our Manager who provide management services to us could have a material adverse effect on our performance. In addition, we offer no assurance that our Manager will remain our investment manager or that we will continue to have access to our Manager’s principals and professionals. The initial term of our management agreement with our Manager expired on July 1, 2011. The agreement automatically renews for successive one-year terms, and the management agreement is currently in a renewal term. If the management agreement is terminated and no suitable replacement is found to manage us, we may not be able to execute our business plan. Moreover, our Manager is not obligated to dedicate certain of its personnel exclusively to us nor is it obligated to dedicate any specific portion of its time to our business.
There are conflicts of interest in our relationship with our Manager and Invesco, which could result in decisions that are not in the best interests of our stockholders.
We are subject to conflicts of interest arising out of our relationship with Invesco and our Manager. Specifically, each of our officers and certain members of our board of directors are employees of our Manager or one of its affiliates. Our Manager and our executive officers may have conflicts between their duties to us and their duties to, and interests in, Invesco. We compete for investment opportunities directly with other clients of our Manager or Invesco and its subsidiaries. A substantial number of separate accounts managed by our Manager have limited exposure to our target assets. In addition, in the future our Manager may have additional clients that compete directly with us for investment opportunities. Our Manager has investment allocation policies in place intended to enable us to share equitably with the other clients of our Manager or Invesco and its subsidiaries. There is no assurance that our Manager’s allocation policies that address some of the conflicts relating to our access to investment and financing sources will be adequate to address all of the conflicts that may arise. Therefore, we may compete for investment or financing opportunities sourced by our Manager and, as a result, we may either not be presented with the opportunity or have to compete with other clients of our Manager or clients of Invesco and its subsidiaries to acquire these investments or have access to these sources of financing. Our Manager and our executive officers may choose to allocate favorable investments to other clients of Invesco instead of to us. Further, when there are turbulent conditions in the mortgage markets, distress in the credit markets or other times when we will need focused support and assistance from our Manager, Invesco or entities for which our Manager also acts as an investment manager will likewise require greater focus and attention, placing our Manager’s resources in high demand. In such situations, we may not receive the level of support and assistance that we may receive if we were internally managed or if our Manager did not act as a manager for other entities.
|
23
|
||
We pay our Manager substantial management fees regardless of the performance of our portfolio. Our Manager’s entitlement to a management fee, which is not based upon performance metrics or goals, might reduce its incentive to devote its time and effort to seeking investments that provide attractive risk-adjusted returns for our portfolio. This in turn could hurt both our ability to make distributions to our stockholders and the market price of our capital stock.
Our Manager would have a conflict in recommending our participation in any equity investment it manages.
Our Manager has a conflict of interest in recommending our participation in any equity investment it manages because the fees payable to it may be greater than the fees payable by us under the management agreement. With respect to equity investments we have made in partnerships managed by an affiliate of our Manager, our Manager has agreed to waive fees at the equity investment level to avoid duplication. To address any potential conflict of interest, we require the terms of any equity investment managed by our Manager to be approved by our audit committee consisting of our independent directors. However, there can be no assurance that all conflicts of interest will be eliminated.
The management agreement with our Manager was not negotiated on an arm’s-length basis and may not be as favorable to us as if it had been negotiated with an unaffiliated third party and may be costly and difficult to terminate.
Our executive officers and certain members of our board of directors are employees of our Manager or one of its affiliates. Our management agreement with our Manager was negotiated between related parties and its terms, including fees payable, may not be as favorable to us as if it had been negotiated with an unaffiliated third party.
Termination of the management agreement with our Manager without cause is difficult and costly. Our independent directors review our Manager’s performance and the management fees annually and the management agreement may be terminated annually upon the affirmative vote of at least two-thirds of our independent directors based upon: (1) our Manager’s unsatisfactory performance that is materially detrimental to us, or (2) a determination that the management fees payable to our Manager are not fair, subject to our Manager’s right to prevent termination based on unfair fees by accepting a reduction of management fees agreed to by at least two-thirds of our independent directors. Our Manager will be provided 180 days prior notice of any such termination. Additionally, upon such a termination, the management agreement provides that we will pay our Manager a termination fee equal to three times the sum of the average annual management fee received by our Manager during the prior 24-month period before such termination, calculated as of the end of the most recently completed fiscal quarter. These provisions may increase the cost of terminating the management agreement and adversely affect our ability to terminate our Manager without cause. If the management agreement is terminated and no suitable replacement is found to manage us, we may not be able to execute our business plan.
Pursuant to the management agreement, our Manager does not assume any responsibility other than to render the services called for thereunder and is not responsible for any action of our board of directors in following or declining to follow its advice or recommendations. Our Manager maintains a contractual, as opposed to a fiduciary, relationship with us. Under the terms of the management agreement, our Manager, its officers, stockholders, members, managers, partners, directors and personnel, any person controlling or controlled by our Manager and any person providing sub-advisory services to our Manager will not be liable to us, any subsidiary of ours, our directors, our stockholders or any subsidiary’s stockholders or partners for acts or omissions performed in accordance with and pursuant to the management agreement, except because of acts constituting bad faith, willful misconduct, gross negligence, or reckless disregard of their duties under the management agreement, as determined by a final non-appealable order of a court of competent jurisdiction. We have agreed to indemnify our Manager, its officers, stockholders, members, managers, directors and personnel, any person controlling or controlled by our Manager and any person providing sub-advisory services to our Manager with respect to all expenses, losses, damages, liabilities, demands, charges and claims arising from acts of our Manager not constituting bad faith, willful misconduct, gross negligence, or reckless disregard of duties, performed in good faith in accordance with and pursuant to the management agreement.
Our board of directors approved very broad investment guidelines for our Manager and does not approve each investment and financing decision made by our Manager.
Our Manager is authorized to follow very broad investment guidelines. Our board of directors will periodically review our investment guidelines and our investment portfolio but does not, and is not required to, review all of our proposed investments, except that an investment in a security structured or issued by an entity managed by Invesco must be approved by a majority of our independent directors prior to such investment. In addition, in conducting periodic reviews, our board of directors may rely primarily on information provided to them by our Manager. Furthermore, our Manager may use complex strategies, and transactions entered into by our Manager may be costly, difficult or impossible to unwind by the time they are reviewed by our board of directors. Our Manager has great latitude within the broad parameters of our investment guidelines in determining the types and amounts of Agency RMBS, non-Agency RMBS, GSE CRT, CMBS, mortgage loans and mortgage and real-estate financing arrangements (including mezzanine debt and private equity interests) it may decide are attractive investments for us, which could result in investment returns that are substantially below expectations or that result in losses, which would materially and adversely affect our business operations and results.
|
24
|
||
Risks Related to Our Capital Stock
The market price and trading volume of our capital stock may be volatile.
The market price of our capital stock may be highly volatile and be subject to wide fluctuations. In addition, the trading volume in our capital stock may fluctuate and cause significant price variations to occur. If the market price of our capital stock declines significantly, our stockholders may be unable to resell their shares at or above the price our stockholders paid for their shares. We cannot assure you that the market price of our capital stock will not fluctuate or decline significantly in the future. Some of the factors that could negatively affect our share price or result in fluctuations in the price or trading volume of our capital stock include:
•
actual or anticipated variations in our quarterly operating results or distributions;
|
•
|
changes in our earnings estimates or publication of research reports about us or the real estate or specialty finance industry;
|
|
•
|
decreases in the market valuations of our target assets;
|
|
•
|
increased difficulty in maintaining or obtaining financing on attractive terms, or at all;
|
|
•
|
increases in market interest rates that lead our stockholders to demand a higher yield;
|
|
•
|
changes in market valuations of similar companies;
|
|
•
|
adverse market reaction to any increased indebtedness we incur in the future;
|
|
•
|
additions or departures of key management personnel;
|
|
•
|
actions by institutional stockholders;
|
|
•
|
speculation in the press or investment community;
|
|
•
|
general market and economic conditions; and
|
|
•
|
changes to U.S. federal income tax laws or regulations governing REITs or the administrative interpretation of those laws.
|
Common stock eligible for future sale may have adverse effects on our share price.
We cannot predict the effect, if any, of future sales of our common stock, or the availability of shares for future sales, on the market price of our common stock. Sales of substantial amounts of common stock or the perception that such sales could occur may adversely affect the prevailing market price for our common stock. Also, we may issue additional shares in public offerings or private placements to make new investments or for other purposes. We are not required to offer any such shares to existing stockholders on a preemptive basis. Therefore, it may not be possible for existing stockholders to participate in such future share issuances, which may dilute existing stockholders’ interests in us.
We have not established a minimum distribution payment level, and we cannot assure our stockholders of our ability to pay distributions in the future.
We pay quarterly distributions and make other distributions to our stockholders in an amount such that we distribute all or substantially all of our REIT taxable income in each year, subject to certain adjustments. We have not established a minimum distribution payment level and our ability to pay distributions may be adversely affected by a number of factors, including the risk factors described in this Report. All distributions will be made at the discretion of our board of directors and will depend on our earnings, our financial condition, debt covenants, maintenance of our REIT qualification, applicable provisions of Maryland law and other factors as our board of directors may deem relevant from time to time. We believe that a change in any one of the following factors could adversely affect our results of operations and impair our ability to pay distributions to our stockholders:
•
our ability to make profitable investments;
•
margin calls or other expenses that reduce our cash flow;
•
defaults in our asset portfolio or decreases in the value of our portfolio; and
•
the fact that anticipated operating expense levels may not prove accurate, as actual results may vary from estimates.
We cannot assure our stockholders that we will achieve investment results that will allow us to make a specified level of cash distributions or year-to-year increases in cash distributions in the future. In addition, some of our distributions may include a return in capital.
|
25
|
||
Investing in our capital stock may involve a high degree of risk.
The investments we make in accordance with our investment objectives may result in a high amount of risk when compared to alternative investment options and volatility or loss of principal. Our investments may be highly speculative and aggressive, and therefore an investment in our capital stock may not be suitable for someone with lower risk tolerance.
A change in market interest rates may cause a material decrease in the market price of our capital stock.
One of the factors that investors may consider in deciding whether to buy or sell shares of our capital stock is our distribution rate as a percentage of our share price relative to market interest rates. If the market price of our capital stock is based primarily on the earnings and return that we derive from our investments and income with respect to our investments and our related distributions to stockholders, and not from the market value of the investments themselves, then interest rate fluctuations and capital market conditions are likely to adversely affect the market price of our capital stock. For instance, if market rates rise without an increase in our distribution rate, the market price of our capital stock could decrease as potential investors may require a higher distribution yield or seek other securities paying higher distributions or interest.
Future offerings of debt or equity securities, which would rank senior to our common stock, may adversely affect the market price of our common stock.
We have issued Series A Preferred Stock, Series B Preferred Stock and 5.00% Exchangeable Senior Notes due 2018. If we decide to issue debt or equity securities in the future, which would rank senior to our common stock, it is likely that they will be governed by an indenture or other instrument containing covenants restricting our operating flexibility. Any convertible or exchangeable securities that we issue in the future may have rights, preferences and privileges more favorable than those of our common stock and may result in dilution to owners of our common stock. For example, preferred shares and debt have a preference on liquidating distributions or a preference on dividend or interest payments that could limit our ability to make a distribution to the holders of our common stock. We and, indirectly, our stockholders, will bear the cost of issuing and servicing such securities. Because our decision to issue debt or equity securities in any future offering will depend on market conditions and other factors beyond our control, we cannot predict or estimate the amount, timing or nature of our future offerings.
Holders of our common stock are not entitled to preemptive rights or other protections against dilution. Thus holders of our common stock will bear the risk of our future offerings reducing the market price of our common stock and diluting the value of their stock holdings in us. Holders of our common stock also bear the risk of holders of our exchangeable notes making an election to exchange their notes for common stock, which could result in significant dilution to our existing stockholders. In addition, future issuances and sales of preferred stock on parity to our Series A Preferred Stock or the Series B Preferred Stock, or the perception that such issuances and sales could occur, may also cause prevailing market prices for the Series A Preferred Stock, Series B Preferred Stock and our common stock to decline and may adversely affect our ability to raise additional capital in the financial markets at times and prices favorable to us.
Risks Related to Our Organization and Structure
Certain provisions of Maryland law could inhibit changes in control.
Certain provisions of the Maryland General Corporation Law (the “MGCL”), may have the effect of deterring a third party from making a proposal to acquire us or of impeding a change in control under circumstances that otherwise could provide the holders of our common stock with the opportunity to realize a premium over the then-prevailing market price of our common stock. Under the MGCL, certain “business combinations” (including a merger, consolidation, share exchange, or, in circumstances specified in the statute, an asset transfer or issuance or reclassification of equity securities) between us and an “interested stockholder” (defined generally as any person who beneficially owns 10% or more of our then outstanding voting capital stock or an affiliate or associate of ours who, at any time within the two-year period prior to the date in question, was the beneficial owner of 10% or more of our then outstanding voting capital stock) or an affiliate thereof are prohibited for five years after the most recent date on which the stockholder becomes an interested stockholder. After the five-year prohibition, any business combination between us and an interested stockholder generally must be recommended by our board of directors and approved by the affirmative vote of at least (1) 80% of the votes entitled to be cast by holders of outstanding shares of our voting capital stock; and (2) two-thirds of the votes entitled to be cast by holders of voting capital stock of the corporation other than shares held by the interested stockholder with whom or with whose affiliate the business combination is to be effected or held by an affiliate or associate of the interested stockholder. These super-majority vote requirements do not apply if our common stockholders receive a minimum price, as defined under Maryland law, for their shares in the form of cash or other consideration in the same form as previously paid by the interested stockholder for its shares. These provisions of the MGCL also do not apply to business combinations that are approved or exempted by a board of directors prior to the time that the interested stockholder becomes an interested stockholder. Pursuant to the statute, our board of directors has by resolution exempted business combinations between us and any other person, provided that such business combination is first approved by our board of directors (including a majority of our directors who are not affiliates or associates of such person).
|
26
|
||
The “control share” provisions of the MGCL provide that “control shares” of a Maryland corporation (defined as shares which, when aggregated with other shares controlled by the stockholder (except solely by virtue of a revocable proxy), entitle the stockholder to exercise one of three increasing ranges of voting power in electing directors) acquired in a “control share acquisition” (defined as the direct or indirect acquisition of ownership or control of “control shares”) have no voting rights except to the extent approved by our stockholders by the affirmative vote of at least two-thirds of all the votes entitled to be cast on the matter, excluding votes entitled to be cast by the acquiror of control shares, our officers and our employees who are also our directors. Our bylaws contain a provision exempting from the control share acquisition statute any and all acquisitions by any person of shares of our stock. There can be no assurance that this provision will not be amended or eliminated at any time in the future.
The “unsolicited takeover” provisions of the MGCL permit our board of directors, without stockholder approval and regardless of what is currently provided in our charter or bylaws, to implement takeover defenses, some of which (for example, a classified board) we do not yet have. These provisions may have the effect of inhibiting a third party from making an acquisition proposal for us or of delaying, deferring or preventing a change in control of us under circumstances that otherwise could provide the holders of shares of common stock with the opportunity to realize a premium over the then current market price. Our charter contains a provision whereby we have elected to be subject to the provisions of Title 3, Subtitle 8 of the MGCL relating to the filling of vacancies on our board of directors.
Ownership limitations may restrict change of control of business combination opportunities in which our stockholders might receive a premium for their shares.
In order for us to qualify as a REIT, no more than 50% in value of our outstanding capital stock may be owned, directly or indirectly, by five or fewer individuals during the last half of any calendar year. “Individuals” for this purpose include natural persons, private foundations, some employee benefit plans and trusts, and some charitable trusts. To preserve our REIT qualification, among other purposes, our charter generally prohibits any person from directly or indirectly owning more than 9.8% in value or in number of shares, whichever is more restrictive, of the outstanding shares of our capital stock or more than 9.8% in value or in number of shares, whichever is more restrictive, of the outstanding shares of our common stock. This ownership limitation could have the effect of discouraging a takeover or other transaction in which holders of our common stock might receive a premium for their shares over the then prevailing market price or which holders might believe to be otherwise in their best interests.
Our authorized but unissued shares of capital stock may prevent a change in our control.
Our charter authorizes us to issue additional authorized but unissued shares of common or preferred stock. In addition, our board of directors may, without stockholder approval, amend our charter to increase the aggregate number of our shares of stock or the number of shares of stock of any class or series that we have authority to issue and classify or reclassify any unissued shares of common or preferred stock and set the preferences, rights and other terms of the classified or reclassified shares. As a result, our board of directors may establish a series of shares of common or preferred stock that could delay or prevent a transaction or a change in control that might involve a premium price for our shares of common stock or otherwise be in the best interest of our stockholders.
The change of control conversion feature of our Series A Preferred Stock, Series B Preferred Stock and our Exchangeable Senior Notes may make it more difficult for a party to acquire us or discourage a party from acquiring us.
The change of control conversion feature of our Series A Preferred Stock, Series B Preferred Stock and our Exchangeable Senior Notes may have the effect of discouraging a third party from making an acquisition proposal for us or of delaying, deferring or preventing certain of our change of control transactions under circumstances that otherwise could provide the holders of our common stock, Series A Preferred Stock and Series B Preferred Stock with the opportunity to realize a premium over the then-current market price of such stock or that stockholders may otherwise believe is in their best interests.
We are the sole general partner of our Operating Partnership and could become liable for the debts and other obligations of our Operating Partnership beyond the amount of our initial expenditure.
We are the sole general partner of our Operating Partnership and directly or indirectly conduct all of our business activities through the Operating Partnership and its subsidiaries. As the sole general partner, we are liable for our Operating Partnership’s debts and other obligations. Therefore, if our Operating Partnership is unable to pay its debts and other obligations, we will be liable for such debts and other obligations beyond the amount of our expenditure for ownership interests in our Operating Partnership. These obligations could include unforeseen contingent liabilities and could materially adversely affect our financial condition, operating results and ability to make distributions to our stockholders.
|
27
|
||
Our Exchangeable Senior Notes are recourse obligations to us.
In 2013, our Operating Partnership issued $400,000,000 in aggregate principal amount of 5.00% Exchangeable Senior Notes due
March 15, 2018
(the “Notes”). Because the Company is the sole general partner of the Operating Partnership, these amounts are full recourse obligations of the Company. If we are not able to extend, refinance or repurchase the Notes, we may not have the ability to repay these amounts when they come due. Our inability to repay the Notes could cause the acceleration of our other borrowings, which would have a material adverse effect on our business.
The indenture governing the Notes contains cross-default provisions whereby a default or acceleration of borrowings under other agreements could result in a default under the indenture. If a cross-default occurred, we may not be able to pay our liabilities or access capital from external sources in order to refinance our borrowings. If some or all of our borrowings default and it causes a default under other borrowings, our business, financial condition and results of operations could be materially and adversely affected.
Tax Risks
Investment in our capital stock has various U.S. federal income tax risks.
This summary of certain tax risks is limited to the U.S. federal tax risks addressed below. Additional risks or issues may exist that are not addressed in this Report and that could affect the U.S. federal income tax treatment of us or our stockholders.
In December 2015, President Obama signed into law the Protecting Americans From Tax Hikes Act of 2015 (the “Act”). The Act includes a number of provisions affecting taxation of REITs and REIT stockholders, some of which include a change to the percentage of assets that may be represented by securities of a Taxable REIT Subsidiary (“TRS”), favorable changes related to prohibited transaction safe harbors, elimination of applicability of preferential dividend rules to ‘publicly offered REITs’, changes related to debt instruments issued by publicly offered REITs and certain secured debt obligations for purposes of the REIT qualification asset tests and certain changes related to the treatment of hedging income.
We strongly urge you to seek advice based on your particular circumstances from an independent tax advisor concerning the effects of U.S. federal, state and local income tax law on an investment in our capital stock and on your individual tax situation.
Our failure to qualify as a REIT would subject us to U.S. federal income tax and potentially increased state and local taxes, which would reduce the amount of cash available for distribution to our stockholders.
We believe that we have been organized and operated, and we intend to continue to operate, in a manner that enables us to qualify as a REIT for U.S. federal income tax purposes. However, qualification as a REIT involves the application of highly technical and complex Internal Revenue Code provisions for which only a limited number of judicial and administrative interpretations exist. Even an inadvertent or technical mistake could jeopardize our REIT status. Our continued qualification as a REIT will depend on our satisfaction of certain asset, income, organizational, distribution, stockholder ownership and other requirements on a continuing basis.
Moreover, new legislation, court decisions or administrative guidance, in each case possibly with retroactive effect, may make it more difficult or impossible for us to qualify as a REIT. Thus, while we intend to operate so that we will qualify as a REIT, given the highly complex nature of the rules governing REITs, the ongoing importance of factual determinations, and the possibility of future changes in our circumstances, no assurance can be given that we will so qualify for any particular year.
If we fail to qualify as a REIT in any taxable year, and we do not qualify for certain statutory relief provisions, we would be required to pay U.S. federal income tax on our taxable income, and distributions to our stockholders would not be deductible by us in determining our taxable income. In such a case, we might need to borrow money or sell assets in order to pay our taxes. Our payment of income tax would decrease the amount of our income available for distribution to our stockholders. Furthermore, if we fail to maintain our qualification as a REIT, we no longer would be required to distribute substantially all of our taxable income to our stockholders. In addition, unless we were eligible for certain statutory relief provisions, we could not re-elect to qualify as a REIT until the fifth calendar year following the year in which we failed to qualify.
|
28
|
||
Complying with REIT requirements may cause us to forego otherwise attractive investment opportunities or financing or hedging strategies.
To qualify as a REIT for U.S. federal income tax purposes, we must continually satisfy various tests regarding the sources of our income, the nature and diversification of our assets, and the amounts we distribute to our stockholders. To meet these tests, we may be required to forego investments we might otherwise make or financing or hedging strategies we might otherwise employ. We may be required to make distributions to stockholders at disadvantageous times or when we do not have funds readily available for distribution. Thus, compliance with the REIT requirements may hinder our investment performance.
Complying with REIT requirements may force us to liquidate otherwise attractive investments.
To qualify as a REIT, we generally must ensure that at the end of each calendar quarter at least 75% of the value of our total assets consists of cash, cash items, government securities and qualifying real estate assets, including certain mortgage loans and MBS and GSE CRT. The remainder of our investment in securities (other than government securities, securities of our TRSs and qualifying real estate assets) generally cannot include more than 10% of the outstanding voting securities of any one issuer or more than 10% of the total value of the outstanding securities of any one issuer. In addition, in general, no more than 5% of the value of our assets can consist of the securities of any one issuer (other than government securities, securities of our TRSs and qualifying real estate assets), and no more than 25% (20% after 2017) of the value of our total securities can be represented by securities of one or more TRSs. If we fail to comply with these requirements at the end of any quarter, we must correct the failure within 30 days after the end of such calendar quarter or qualify for certain statutory relief provisions to avoid losing our REIT qualification and suffering adverse tax consequences. As a result, we may be required to liquidate from our portfolio otherwise attractive investments. These actions could have the effect of reducing our income and amounts available for distribution to our stockholders.
REIT distribution requirements could adversely affect our ability to execute our business plan and may require us to incur debt, sell assets or take other actions to make such distributions.
To qualify as a REIT, we must distribute at least 90% of our REIT taxable income (including certain items of non-cash income) to our stockholders each calendar year, determined without regard to the deduction for dividends paid and excluding net capital gains. To the extent that we satisfy the 90% distribution requirement, but distribute less than 100% of our taxable income, we will be subject to U.S. federal corporate income tax on our undistributed taxable income. In addition, we will incur a 4% nondeductible excise tax on the amount, if any, by which our distributions in any calendar year are less than a minimum amount specified under U.S. federal income tax laws. We intend to make sufficient distributions to our stockholders to satisfy the 90% distribution requirement and to avoid both corporate income tax and the 4% nondeductible excise tax.
Our taxable income may be substantially different from our net income as determined by U.S. GAAP. For example, realized capital losses are deducted in determining our U.S. GAAP net income, but may not be deductible in computing our taxable income. In addition, differences in timing between the recognition of taxable income and the actual receipt of cash may occur. For example, we may invest in debt instruments requiring us to accrue original issue discount (“OID”) or recognize market discount income that generate taxable income in excess of economic income or in advance of the corresponding cash flow. We may also acquire distressed debt investments that are subsequently modified by agreement with the borrower. If amendments to the outstanding debt are “significant modifications” under applicable Treasury Regulations, the modified debt may be considered to have been reissued to us in a debt-for-debt exchange with the borrower, with gain recognized by us to the extent that the principal amount of the modified debt exceeds our cost of purchasing it prior to modification. Finally, we may be required under the terms of the indebtedness that we incur, whether to private lenders or pursuant to government programs, to use cash received from interest payments to make principal payment on that indebtedness, with the effect that we will recognize income but will not have a corresponding amount of cash available for distribution to our stockholders.
As a result of the foregoing, we may find it difficult or impossible to meet the REIT distribution requirements in certain circumstances. In such circumstances, we may be required to (1) sell assets in adverse market conditions, (2) borrow on unfavorable terms, (3) distribute amounts that would otherwise be invested or used to repay debt, or (4) make a taxable distribution of our shares of common stock as part of a distribution in which stockholders may elect to receive shares of common stock or (subject to a limit measured as a percentage of the total distribution) cash, in order to comply with the REIT distribution requirements. Thus, compliance with the REIT distribution requirements may hinder our ability to grow, which could adversely affect the value of our common stock.
|
29
|
||
We may choose to pay dividends in our own stock, in which case our stockholders may be required to pay income taxes in excess of the cash dividends received.
We may distribute taxable dividends that are payable in cash and in shares of our common stock at the election of each stockholder. Taxable stockholders receiving such dividends will be required to include the full amount of the dividend in income to the extent of our current and accumulated earnings and profits for federal income tax purposes. As a result, a U.S. stockholder may be required to pay income taxes with respect to such dividends in excess of the cash dividends received. If a U.S. stockholder sells the stock it receives as a dividend in order to pay this tax, the sales proceeds may be less than the amount included in income with respect to the dividend, depending on the market price of our stock at the time of the sale. Furthermore, with respect to non-U.S. stockholders, we may be required to withhold U.S. tax with respect to such dividends, including in respect of all or a portion of such dividend that is payable in stock. In addition, if a significant number of our stockholders determine to sell shares of our common stock in order to pay taxes owed on dividends, it may put downward pressure on the trading price of our common stock.
Our ownership of and relationship with any TRS that we may form or acquire is subject to limitations, and a failure to comply with the limits would jeopardize our REIT qualification and may result in the application of a 100% excise tax.
A REIT may own up to 100% of the stock of one or more TRSs. A TRS may earn income that would not be qualifying income if earned directly by the parent REIT. Both the subsidiary and the REIT must jointly elect to treat the subsidiary as a TRS. Overall, no more than 25% (20% after 2017) of the value of a REIT’s assets may consist of stock or securities of one or more TRSs at the end of any calendar quarter. A TRS will pay federal, state and local income tax at regular corporate rates on any income that it earns. In addition, the TRS rules impose a 100% excise tax on certain transactions between a TRS and its parent REIT that are not conducted on an arm’s length basis. There can be no assurance that we will be able to comply with the TRS limitations or to avoid application of the 100% excise tax discussed above.
Our domestic TRSs would pay U.S. federal, state and local income tax on their taxable income, and their after-tax net income would be available for distribution to us but would not be required to be distributed to us. If we were to organize a TRS as a non-U.S. corporation (or non-U.S. entity treated as a corporation for U.S. federal income tax purposes), we may generate income inclusions relating to the earnings of the non-U.S. TRS, the treatment of which under the REIT gross income tests is not clear.
Liquidation of our assets to repay obligations to our lenders may jeopardize our REIT qualification.
To qualify as a REIT, we must comply with requirements regarding our assets and our sources of income. If we are compelled to liquidate our investments to repay obligations to our lenders, we may be unable to comply with these requirements, ultimately jeopardizing our qualification as a REIT.
Characterization of the repurchase agreements we enter into to finance our investments as sales for tax purposes rather than as secured borrowing transactions, or the failure of a mezzanine loan to qualify as a real estate asset, could adversely affect our ability to qualify as a REIT.
We may enter into repurchase agreements with a variety of counterparties to finance assets in which we invest. When we enter into a repurchase agreement, we generally sell assets to our counterparty to the agreement and receive cash from the counterparty. The counterparty is obligated to resell the assets back to us at the end of the term of the transaction. We believe that, for U.S. federal income tax purposes, we will be treated as the owner of the assets that are the subject of repurchase agreements and that the repurchase agreements will be treated as secured borrowing transactions notwithstanding that such agreements may transfer record ownership of the assets to the counterparty during the term of the agreement. It is possible, however, that the IRS could successfully assert that we did not own these assets during the term of the repurchase agreements, in which case we could fail to qualify as a REIT.
In addition, we may acquire mezzanine loans, which are loans secured by equity interests in a partnership or limited liability company that directly or indirectly owns real property. In Revenue Procedure 2003-65, the IRS provided a safe harbor pursuant to which a mezzanine loan, if it meets each of the requirements contained in the Revenue Procedure, will be treated by the IRS as a real estate asset for purposes of the REIT asset tests, and interest derived from the mezzanine loan will be treated as qualifying mortgage interest for purposes of the 75% gross income test. Although the Revenue Procedure provides a safe harbor on which taxpayers may rely, it does not prescribe rules of substantive tax law. We acquire or originate mezzanine loans that do not meet all of the requirements for reliance on this safe harbor. The IRS could challenge treatment of such loans as real estate assets for purposes of the REIT asset and income tests, and if such a challenge were sustained, we could fail to qualify as a REIT.
|
30
|
||
The “taxable mortgage pool” rules may limit our financing options.
Certain securitizations and other financing structures could result in the creation of taxable mortgage pools for federal income tax purposes. A taxable mortgage pool owned by our Operating Partnership would be treated as a corporation for U.S. federal income tax purposes and may cause us to fail the REIT asset tests. Accordingly, if we were to consider a securitization that would create a taxable mortgage pool, we would have to undertake such securitization through a TRS or a subsidiary that qualified as a REIT. These rules may limit our financing options.
The tax on prohibited transactions will limit our ability to engage in transactions, including certain methods of securitizing mortgage loans, which would be treated as sales for federal income tax purposes.
A REIT’s net income from prohibited transactions is subject to a 100% tax. In general, prohibited transactions are sales or other dispositions of property, other than foreclosure property, but including mortgage loans, held primarily for sale to customers in the ordinary course of business. We might be subject to this tax if we were to dispose of or securitize loans in a manner that was treated as a sale of the loans for federal income tax purposes. Therefore, in order to avoid the prohibited transactions tax, we may choose not to engage in certain sales of loans at the REIT level and may limit the structures we utilize for our securitization transactions, even though the sales or such structures might otherwise be beneficial to us.
Complying with REIT requirements may limit our ability to hedge effectively.
The REIT provisions of the Internal Revenue Code limit our ability to enter into hedging transactions. In order to qualify as a REIT, we must satisfy two gross income tests annually. For these purposes, income with respect to certain hedges of our liabilities or foreign currency risks will be disregarded. Income from other hedges will be non-qualifying income for purposes of both gross income tests. As a result, we might have to limit our use of advantageous hedging techniques or implement those hedges through a TRS. This could increase the cost of our hedging activities or expose us to greater risks associated with changes in interest rates than we would otherwise want to bear.
Purchases of mortgages at a discount may affect our ability to satisfy the REIT asset and gross income tests.
Whether our loan holdings are treated as real estate assets and interest income thereon is treated as qualifying income for purposes of the 75% gross income test depends on whether the loans are adequately secured by real property. Treasury regulations, as interpreted in Revenue Procedure 2014-51, provide that if a mortgage loan is secured by both real property and personal property and the value of the real property at the time the REIT commits to make or acquire the loan is less than the highest principal amount (i.e., the face amount) of the loan during the year, interest on the loan will be treated as qualifying income only in proportion to the ratio of the value of the real property at the time the REIT commits to make or acquire the loan to the highest principal amount of the loan during the year. Similarly, the IRS issued guidance for determining the extent to which an interest in an “eligible REMIC” (relating to the HARP program) is treated as a real estate asset and generates qualifying income for purposes of the 75% gross income test. Failure to accurately apply these rules and manage our income and assets could cause us to fail to qualify as a REIT.
Our qualification as a REIT could be jeopardized as a result of our interest in joint ventures or investment funds.
We currently own, and may continue to acquire, interests in partnerships or limited liability companies that are joint ventures or investment funds. We may not have timely access to information from such partnerships and limited liability companies related to monitoring and managing our REIT qualification. If a partnership or limited liability company in which we own an interest but do not control takes or expects to take actions that could jeopardize our REIT qualification or require us to pay tax, we may be forced to dispose of our interest in such entity. It is possible that a partnership or limited liability company could take an action which could cause us to fail a REIT gross income or asset test and that we would not become aware of such action in time to dispose of our interest in the partnership or limited liability company or take other corrective action on a timely basis. In that case, we could fail to qualify as a REIT unless we are able to qualify for a statutory REIT “savings” provision, which may require us to pay a significant penalty tax to maintain our REIT qualification.
We may be required to report taxable income for certain investments in excess of the economic income we ultimately realize from them.
We acquire debt instruments in the secondary market for less than their face amount. The discount at which such debt instruments are acquired may reflect doubts about their ultimate collectibility rather than current market interest rates. The amount of such discount will nevertheless generally be treated as “market discount” for federal income tax purposes. Accrued market discount is reported as income when, and to the extent that, any payment of principal of the debt instrument is made. If we collect less on the debt instrument than our purchase price plus the market discount we had previously reported as income, we may not be able to benefit from any offsetting loss deductions.
|
31
|
||
Some of the debt instruments that we acquire may have been issued with original issue discount. We will be required to report such original issue discount based on a constant yield method and will be taxed based on the assumption that all future projected payments due on such debt instruments will be made. If such debt instruments or MBS and GSE CRT turn out not to be fully collectible, an offsetting loss deduction will become available only in the later year that uncollectibility is provable.
In addition, we may acquire debt instruments that are subsequently modified by agreement with the borrower. If the amendments to the outstanding instrument are "significant modifications" under the applicable Treasury regulations, the modified instrument will be considered to have been reissued to us in a debt-for-debt exchange with the borrower. In that event, we may be required to recognize taxable gain to the extent the principal amount of the modified instrument exceeds our adjusted tax basis in the unmodified instrument, even if the value of the instrument or the payment expectations have not changed. Following such a taxable modification, we would hold the modified loan with a cost basis equal to its principal amount for federal tax purposes.
Finally, in the event that any debt instruments acquired by us are delinquent as to mandatory principal and interest payments, or in the event payments with respect to a particular instrument are not made when due, we may nonetheless be required to continue to recognize the unpaid interest as taxable income as it accrues, despite doubt as to its ultimate collectibility. Similarly, we may be required to accrue interest income with respect to debt instruments at its stated rate regardless of whether corresponding cash payments are received or are ultimately collectible. In each case, while we would in general ultimately have an offsetting loss deduction available to us when such interest was determined to be uncollectible, the utility of that deduction could depend on our having taxable income in that later year or thereafter.
Even if we qualify as a REIT, we may face tax liabilities that reduce our cash flow.
Even if we qualify as a REIT, we may be subject to certain U.S. federal, state and local taxes on our income and assets, including taxes on any undistributed income, tax on income from some activities conducted as a result of a foreclosure, and state or local income, franchise, property and transfer taxes, including mortgage-related taxes.
We may be subject to adverse legislative or regulatory tax changes that could reduce the market price of our capital stock.
At any time, the U.S. federal income tax laws or regulations governing REITs or the administrative interpretations of those laws or regulations may be amended. We cannot predict when or if any new U.S. federal income tax law, regulation or administrative interpretation, or any amendment to any existing federal income tax law, regulation or administrative interpretation, will be adopted, promulgated or become effective. Any such law, regulation or interpretation may take effect retroactively. We and our stockholders could be adversely affected by any such change in, or any new, federal income tax law, regulation or administrative interpretation.
Dividends paid by REITs do not qualify for the reduced tax rates that apply to other corporate dividends.
The maximum tax rate for “qualified dividends” paid by corporations to individuals is currently 20%. Dividends paid by REITs, however, generally are not “qualified dividends” and generally are taxed at the normal ordinary income rates, currently subject to a maximum rate of 39.6% in the case of non-corporate taxpayers. The more favorable rates applicable to qualified dividends could cause potential investors who are individuals to perceive investments in REITs to be relatively less attractive than investments in the stocks of non-REIT corporations that pay qualified dividends, which could adversely affect the value of the stock of REITs, including our capital stock.
Dividends paid by REITs may be subject to Unearned Income Medicare tax.
High-income U.S. individuals, estates, and trusts will be subject to an additional 3.8% tax on net investment income. For these purposes, net investment income includes dividends and gains from sales of stock. In the case of an individual, the tax will be 3.8% of the lesser of the individuals’ net investment income or the excess of the individuals’ modified adjusted gross income over $250,000 in the case of a married individual filing a joint return or a surviving spouse, $125,000 in the case of a married individual filing a separate return, or $200,000 in the case of a single individual.
Tax-exempt stockholders may realize unrelated business taxable income if we generate excess inclusion income.
If we acquire REMIC residual interests or equity interests in taxable mortgage pools (in a manner consistent with our REIT qualification) and generate “excess inclusion income,” a portion of our dividends received by a tax-exempt stockholder will be treated as unrelated business taxable income.
Changing the nature of our assets may complicate our ability to satisfy the REIT gross income and asset tests.
We have large holdings of RMBS that are qualifying assets for purposes of the REIT asset tests and generate interest income that is qualifying income for purposes of the REIT gross income tests. The REIT asset tests do not require that all assets be qualifying assets, nor do the REIT gross income tests require that all income be qualifying income. Our substantial RMBS
|
32
|
||
holdings have given us room to make investments that may not qualify, all or in part, as real estate assets or that may generate income that may not qualify, all or in part, under one or both of the gross income tests. Reductions in our RMBS holdings would reduce our room for non-qualifying assets and income. In addition, the market value or income potential of real estate-related investments declines as a result of increased interest rates, prepayment rates or other factors, we may need to increase our real estate investments and income and/or liquidate our non-qualifying assets in order to maintain our REIT qualification or exemption from the Investment Company Act. If the decline in real estate asset values and/or income occurs quickly, this may be especially difficult to accomplish. This difficulty may be exacerbated by the illiquid nature of any non-real estate assets that we may own. We may have to make investment decisions that we otherwise would not make absent the REIT and Investment Company Act considerations. Furthermore, we may make investments in which the proper application of the REIT gross income and assets tests may not be clear. Mistakes in classifying assets or income for REIT purposes or in projecting the amount of qualifying and non-qualifying income could cause us to fail to qualify as a REIT.
Our qualification as a REIT may depend upon the accuracy of legal opinions or advice rendered or given or statements by the issuers of assets we acquire.
When purchasing securities, we may rely on opinions or advice of counsel for the issuer of such securities, or statements made in related offering documents, for purposes of determining, among other things, whether such securities represent debt or equity securities for U.S. federal income tax purposes, the value of such securities, and also to what extent those securities constitute qualified real estate assets for purposes of the REIT asset tests and produce qualified income for purposes of the 75% gross income test. The inaccuracy of any such opinions, advice or statements may adversely affect our ability to qualify as a REIT and result in significant corporate-level tax.
None.
Our principal executive office is located at 1555 Peachtree Street, NE, Suite 1800, Atlanta, Georgia 30309. As part of our management agreement, our Manager is responsible for providing office space and office services required in rendering services to us.
From time to time, we may be involved in various claims and legal actions arising in the ordinary course of business. As of
December 31, 2015
, we were not involved in any such legal proceedings.
Not applicable.
|
33
|
||
Market Information
Our common stock is traded on the NYSE under the symbol “IVR.” The following table sets forth, for the periods indicated, the high and low sale price of our common stock as reported on the NYSE.
|
High
|
Low
|
||||||
|
2015
|
|||||||
|
Fourth quarter
|
$
|
13.50
|
|
$
|
11.92
|
|
|
|
Third quarter
|
$
|
15.14
|
|
$
|
12.02
|
|
|
|
Second quarter
|
$
|
16.13
|
|
$
|
14.32
|
|
|
|
First quarter
|
$
|
16.21
|
|
$
|
15.10
|
|
|
|
2014
|
|||||||
|
Fourth quarter
|
$
|
16.66
|
|
$
|
15.19
|
|
|
|
Third quarter
|
$
|
17.64
|
|
$
|
15.72
|
|
|
|
Second quarter
|
$
|
18.00
|
|
$
|
16.36
|
|
|
|
First quarter
|
$
|
17.46
|
|
$
|
14.64
|
|
|
Holders
As of
February 16, 2016
, there were
112
stockholders of record.
Dividends
U.S. federal income tax law generally requires that a REIT distribute annually at least 90% of its REIT taxable income, determined without regard to the deduction for dividends paid and excluding net capital gains, and that it pay tax at regular corporate rates on its undistributed taxable income. We intend to continue to pay regular quarterly dividends to our stockholders. Before we pay any dividend, whether for U.S. federal income tax purposes or otherwise, we must first meet both our operating requirements and debt service obligations. If our cash available for distribution is less than our taxable income, we could be required to sell assets or borrow funds to make cash distributions, or we may make a portion of the required distribution in the form of a taxable stock distribution or distribution of debt securities.
The following table sets forth the dividends declared per share of our common stock for the periods indicated.
|
Date Declared
|
Dividends Declared Per Share
|
||||
|
|
Amount
|
Date Paid
|
|||
|
2015
|
|||||
|
December 15, 2015
|
$
|
0.40
|
|
January 26, 2016
|
|
|
September 15, 2015
|
$
|
0.40
|
|
October 27, 2015
|
|
|
June 15, 2015
|
$
|
0.45
|
|
July 28, 2015
|
|
|
March 17, 2015
|
$
|
0.45
|
|
April 28, 2015
|
|
|
2014
|
|||||
|
December 16, 2014
|
$
|
0.45
|
|
January 27, 2015
|
|
|
September 15, 2014
|
$
|
0.50
|
|
October 28, 2014
|
|
|
June 16, 2014
|
$
|
0.50
|
|
July 28, 2014
|
|
|
March 18, 2014
|
$
|
0.50
|
|
April 28, 2014
|
|
|
34
|
||
The following table sets forth the dividends declared per share of our common stock and the related tax characterization for the fiscal tax years ended
December 31, 2015
and
2014
.
|
Tax Characterization of Dividends
|
||||||||||||
|
Fiscal Tax Year
|
Dividends Declared
|
Ordinary Dividends
|
Capital Gain Distribution
|
Carry Forward
|
||||||||
|
Common Stock Dividends
|
||||||||||||
|
Fiscal tax year 2015
(1)
|
1.700000
|
|
1.615469
|
|
—
|
|
0.257840
|
|
||||
|
Fiscal tax year 2014
|
1.950000
|
|
1.776691
|
|
—
|
|
0.173309
|
|
||||
|
(1)
|
Ordinary dividends include $0.173309 of undistributed taxable income carried-forward from fiscal tax year 2014.
|
Performance Graph
The following graph matches the cumulative 5-year total return of holders of Invesco Mortgage Capital Inc.'s common stock with the cumulative total returns of the S&P 500 index and the FTSE NAREIT Mortgage REITs index. The graph assumes that the value of the investment in our common stock and in each of the indices (including reinvestment of dividends) was $100 on
December 31, 2010
and tracks it through
December 31, 2015
.
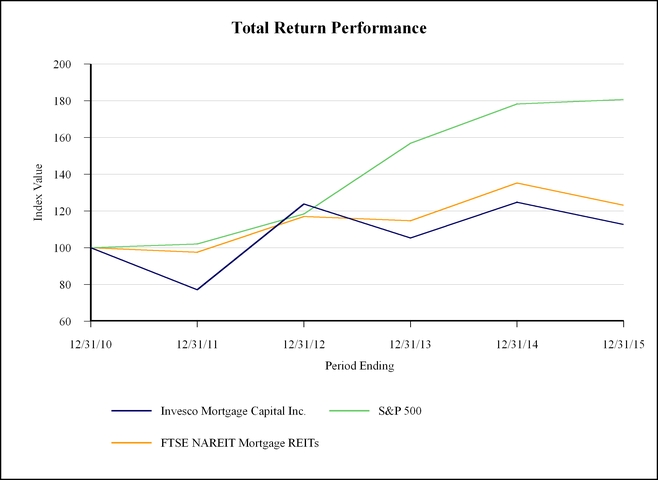
|
Index
|
12/31/2010
|
12/31/2011
|
12/31/2012
|
12/31/2013
|
12/31/2014
|
12/31/2015
|
|
Invesco Mortgage Capital Inc.
|
100.00
|
77.13
|
123.78
|
105.31
|
124.82
|
112.62
|
|
S&P 500
|
100.00
|
102.11
|
118.45
|
156.82
|
178.28
|
180.75
|
|
FTSE NAREIT Mortgage REITs
|
100.00
|
97.58
|
116.99
|
114.70
|
135.21
|
123.21
|
The stock price performance included in this graph is not necessarily indicative of future stock price performance.
|
35
|
||
Use of Proceeds
We used all of the net proceeds from our common and preferred stock offerings to acquire our target assets in accordance with our objectives and strategies described in Item 1, Business - Investment Strategy. We focus on purchasing our target assets, subject to our investment guidelines and to the extent consistent with maintaining our REIT qualification and exclusion from the requirements of the 1940 Act. Our Manager determines the percentage of our equity that will be invested in each of our target assets.
Repurchases of Equity Securities
The following table shows common share repurchase activity during the quarter ended
December 31, 2015
:
|
Month
|
Total Number of Shares Purchased
|
Average Price Paid Per Share
|
Total Number of Shares Purchased
as Part of
Publicly Announced Plans or Programs
(1)
|
Maximum Number of Shares
that May Yet Be Purchased
Under the Plans
or Programs at end of period
(1)
|
|||||||
|
October 1 - 31, 2015
|
—
|
|
—
|
|
—
|
|
11,146,416
|
|
|||
|
November 1 - 30, 2015
|
3,987,504
|
|
13.03
|
|
3,987,504
|
|
7,158,912
|
|
|||
|
December 1 - 31, 2015
|
1,856,379
|
|
12.74
|
|
1,856,379
|
|
5,302,533
|
|
|||
|
|
5,843,883
|
|
12.94
|
|
5,843,883
|
|
|||||
|
(1)
|
In December 2011, our board of directors approved a share repurchase program to purchase up to 7,000,000 shares of our common shares with no stated expiration date. In December 2013, our board of directors approved an additional share repurchase of up to 20,000,000 of our common shares with no expiration date. The shares may be repurchased from time to time through privately negotiated transactions or open market transactions, including pursuant to a trading plan in accordance with Rules 10b5-1 and 10b-18 under Exchange Act or by any combination of such methods. The manner, price, number and timing of share repurchases are subject to a variety of factors, including market conditions and applicable SEC rules.
|
|
36
|
||
The selected historical financial information as of and for the years ended
December 31, 2015
,
2014
,
2013
,
2012
and
2011
presented in the tables below have been derived from our audited financial statements. The information presented below is not necessarily indicative of the trends in our performance.
The information presented below is only a summary and does not provide all of the information contained in our historical financial statements, including the related notes. You should read the information below in conjunction with “Management’s Discussion and Analysis of Financial Condition and Results of Operations” and our historical financial statements, including the related notes, included elsewhere in this Report.
|
|
As of December 31,
|
|||||||||||||
|
$ in thousands
|
2015
|
2014
|
2013
|
2012
|
2011
|
|||||||||
|
Mortgage-backed and credit risk transfer securities, at fair value
|
16,065,935
|
|
17,248,895
|
|
17,348,657
|
|
18,470,563
|
|
14,214,149
|
|
||||
|
Residential loans, held-for-investment
(1)
|
—
|
|
3,365,003
|
|
1,810,262
|
|
—
|
|
—
|
|
||||
|
Commercial loans, held-for-investment
|
209,062
|
|
145,756
|
|
64,599
|
|
—
|
|
—
|
|
||||
|
Total assets
(1)
|
16,772,736
|
|
21,231,017
|
|
20,350,979
|
|
18,914,760
|
|
14,772,167
|
|
||||
|
Repurchase agreements
|
12,126,048
|
|
13,622,677
|
|
15,451,675
|
|
15,720,460
|
|
12,253,038
|
|
||||
|
Secured loans
|
1,650,000
|
|
1,250,000
|
|
—
|
|
—
|
|
—
|
|
||||
|
Asset-backed securities issued by securitization trusts
(1)
|
—
|
|
2,929,820
|
|
1,643,741
|
|
—
|
|
—
|
|
||||
|
Exchangeable senior notes
|
400,000
|
|
400,000
|
|
400,000
|
|
—
|
|
—
|
|
||||
|
Total stockholders’ equity
|
2,241,035
|
|
2,610,315
|
|
2,376,115
|
|
2,558,098
|
|
1,892,338
|
|
||||
|
Non-controlling interest
|
25,873
|
|
28,535
|
|
27,120
|
|
31,422
|
|
25,075
|
|
||||
|
Total equity
|
2,266,908
|
|
2,638,850
|
|
2,403,235
|
|
2,589,520
|
|
1,917,413
|
|
||||
|
(1)
|
As of December 31, 2014 and December 31, 2013, our consolidated balance sheets included assets and liabilities of consolidated variable interest entities (“VIEs”). The Company deconsolidated these VIEs in 2015.
As of
December 31, 2014
and
December 31, 2013
, total assets of the consolidated VIEs were
$3,380,597
and
$1,819,295
, respectively, and total liabilities of the consolidated VIEs were
$2,938,512
and
$1,648,400
, respectively
. Refer to Note 3 - "Variable Interest Entities"
of our consolidated financial statements fo
r further discussion.
|
|
37
|
||
|
|
For the Years ended December 31,
|
|||||||||||||
|
$ in thousands, except share amounts
|
2015
|
2014
|
2013
|
2012
|
2011
|
|||||||||
|
Interest income
|
644,495
|
|
676,643
|
|
682,360
|
|
566,830
|
|
453,352
|
|
||||
|
Interest expense
|
277,973
|
|
281,895
|
|
332,252
|
|
237,405
|
|
155,241
|
|
||||
|
Net interest income
|
366,522
|
|
394,748
|
|
350,108
|
|
329,425
|
|
298,111
|
|
||||
|
(Reduction in) provision for loan losses
|
(213
|
)
|
(142
|
)
|
884
|
|
—
|
|
—
|
|
||||
|
Net interest income after provision for loan losses
|
366,735
|
|
394,890
|
|
349,224
|
|
329,425
|
|
298,111
|
|
||||
|
Other income (loss)
|
(206,904
|
)
|
(572,762
|
)
|
(136,258
|
)
|
53,041
|
|
11,044
|
|
||||
|
Expenses
|
54,620
|
|
52,866
|
|
53,144
|
|
39,684
|
|
30,118
|
|
||||
|
Net income (loss)
|
105,211
|
|
(230,738
|
)
|
159,822
|
|
342,782
|
|
279,037
|
|
||||
|
Net income (loss) attributable to non-controlling interest
|
1,241
|
|
(2,632
|
)
|
1,667
|
|
4,108
|
|
4,788
|
|
||||
|
Net income (loss) attributable to Invesco Mortgage Capital Inc.
|
103,970
|
|
(228,106
|
)
|
158,155
|
|
338,674
|
|
274,249
|
|
||||
|
Dividends to preferred stockholders
|
22,864
|
|
17,378
|
|
10,851
|
|
5,395
|
|
—
|
|
||||
|
Net income (loss) attributable to common stockholders
|
81,106
|
|
(245,484
|
)
|
147,304
|
|
333,279
|
|
274,249
|
|
||||
|
Earnings per share:
|
||||||||||||||
|
Net income (loss) attributable to common stockholders
|
||||||||||||||
|
Basic
|
0.67
|
|
(1.99
|
)
|
1.11
|
|
2.88
|
|
3.18
|
|
||||
|
Diluted
|
0.67
|
|
(1.99
|
)
|
1.11
|
|
2.88
|
|
3.18
|
|
||||
|
Dividends declared per common share
|
1.70
|
|
1.95
|
|
2.30
|
|
2.60
|
|
3.42
|
|
||||
|
Weighted average number of shares of common stock:
|
||||||||||||||
|
Basic
|
121,377,585
|
|
123,104,934
|
|
132,714,012
|
|
115,558,668
|
|
86,364,506
|
|
||||
|
Diluted
|
122,843,838
|
|
124,529,934
|
|
134,173,691
|
|
117,012,500
|
|
87,804,292
|
|
||||
The following discussion should be read in conjunction with our consolidated financial statements and the accompanying notes to our consolidated financial statements, which are included in Part IV, Item 15 of this Report.
Overview
We are a Maryland corporation primarily focused on investing in, financing and managing residential and commercial mortgage-backed securities ("MBS") and mortgage loans. Our objective is to provide attractive risk-adjusted returns to our investors, primarily through dividends and secondarily through capital appreciation. To achieve this objective, we primarily invest in the following:
|
•
|
Residential mortgage-backed securities (“RMBS”) that are guaranteed by a U.S. government agency such as the Government National Mortgage Association or a federally chartered corporation such as the Federal National Mortgage Association (“Fannie Mae”) or the Federal Home Loan Mortgage Corporation (“Freddie Mac”) (collectively "Agency RMBS");
|
|
•
|
RMBS that are not guaranteed by a U.S. government agency ("non-Agency RMBS");
|
|
•
|
Credit risk transfer securities that are unsecured obligations issued by government-sponsored enterprises ("GSE CRT");
|
|
•
|
Commercial mortgage-backed securities (“CMBS”);
|
|
•
|
Residential and commercial mortgage loans; and
|
|
38
|
||
|
•
|
Other real estate-related financing arrangements.
|
We are externally managed and advised by Invesco Advisers, Inc., our Manager, which is an indirect, wholly-owned subsidiary of Invesco Ltd. We elected to be taxed as a real estate investment trust (“REIT”) for U.S. federal income tax purposes under the provisions of the Internal Revenue Code of 1986, as amended (“Code”), commencing with our taxable year ended December 31, 2009. To maintain our REIT qualification, we are generally required to distribute at least 90% of our REIT taxable income to our stockholders annually. We operate our business in a manner that permits our exclusion from the definition of “Investment Company” under the 1940 Act, as amended.
We generally finance our investments through short- and long-term borrowings structured as repurchase agreements and secured loans. We have historically financed our residential loans held-for-investment through asset-backed securities ("ABS") issued by consolidated securitization trusts. We have also financed investments through the issuance of debt and equity and may utilize other forms of financing in the future.
Capital Activities
On
December 15, 2015
, we declared the following dividends:
|
•
|
a dividend of
$0.40
per share of common stock to be paid on
January 26, 2016
to stockholders of record as of the close of business on
December 28, 2015
;
|
|
•
|
a dividend of
$0.4844
per share of Series A Preferred Stock to be paid on
January 25, 2016
to stockholders of record as of the close of business on
January 1, 2016
; and
|
|
•
|
a dividend of
$0.4844
per share of Series B Preferred Stock to be paid on
March 28, 2016
to stockholders of record as of the close of business on
March 5, 2016
.
|
During the three months ended
December 31, 2015
, we repurchased
5,843,883
shares of our common stock at an average repurchase price of
$12.94
per share for a net cost of
$75.6 million
, including acquisition expenses. During the year ended
December 31, 2015
, we repurchased
9,539,251
shares of our common stock at an average repurchase price of
$13.17
per share for a net cost of
$125.6 million
, including acquisition expenses.
|
39
|
||
Factors Impacting Our Operating Results
Our operating results can be affected by a number of factors and primarily depend on the level of our net interest income and the market value of our assets. The market value of our assets can be impacted by asset spreads and the supply of, and demand for, target assets in which we invest. Our net interest income, which includes the amortization of purchase premiums and accretion of purchase discounts, varies primarily as a result of changes in market interest rates and prepayment speeds, as measured by the constant prepayment rate (“CPR”) on our target assets. Interest rates and prepayment speeds vary according to the type of investment, conditions in the financial markets, competition and other factors, none of which can be predicted with any certainty.
Market Conditions
Macroeconomic factors that affect our business include credit spread premiums, market interest rates, Federal Reserve policy initiatives, residential and commercial real estate prices, credit availability, personal income, corporate earnings, employment conditions, financial conditions and inflation. Global equity markets improved in the fourth quarter after a weak third quarter, even as the Federal Reserve raised short-term interest rate policy targets for the first time since 2006. The move by the Federal Reserve was widely anticipated, and interest rate volatility decreased modestly in its wake. The biggest concerns for investors broadly in the fourth quarter were similar to the concerns which drove equities and interest rates down in the third quarter, namely a sharp decline in oil prices and global economic weakness owing to slowing growth in China and the impact on emerging market economies from lower commodity prices. Still, domestic employment continued to look healthy with stronger payroll data, and intermediate and long term interest rates increased only modestly. Structured credit spread premiums widened, and financial conditions generally tightened in the U.S., but prices of U.S. real estate, both residential and commercial, continued to appreciate in the fourth quarter and for all of
2015
. Roughly 5% appreciation along with relatively tight underwriting of residential loans has created strong fundamentals and attractive lending conditions. Commercial real estate property prices appreciated more, by nearly 13% year over year through December
2015
. Commercial real estate lending standards have eased and higher property valuations make commercial lending more competitive and worthy of conservatism and caution in new loan underwriting.
Consensus forecasts for U.S. domestic economic activity were reduced during
2015
. At the beginning of the year, economists expected real GDP growth of 3% for
2015
, and they now expect growth will be 2.1% and 2.2% for the years 2016 and 2017, respectively. Similarly, at the beginning of
2015
the consensus for core personal consumption expenditures deflator was 1.7%, and now the consensus is 1.5% for 2016 growing to 1.8% for 2017. Economists have over-estimated core inflation in each of the past three years. Monthly increases in payroll employment, which averaged just 192,000 jobs for the third quarter, increased to an average of 279,000 additional jobs in the fourth quarter. The consensus of economists expects monthly payrolls to increase by 184,000 jobs per month in 2016, even as some forecasters are increasing the likelihood of a recession. Fourth quarter financial conditions improved early in the quarter but weakened in December as evidenced by wider credit spreads and lower equity prices. Looking forward, the low interest rate environment, coupled with the sharp decline in energy prices should be supportive of U.S. consumer spending. Countering that positive influence on the economy is weak capital investment, tepid wage and consumer debt growth, and the stronger dollar. Households are once again increasing their debt levels, albeit at a modest rate, but household debt is still declining as a percent of disposable personal income and as a percent of U.S. GDP. All in all it appears that we should expect another year of moderate economic growth in the U.S., accompanied by core inflation that is below the federal reserve’s policy objective of 2%.
The interest rate environment has been broadly supportive for Agency RMBS, and we believe it will most likely continue to be. Range-bound interest rates create a good environment for MBS investors, as the prepayment option embedded in Agency RMBS is less onerous if interest rates are likely to neither fall nor rise dramatically. Further, continued tight residential mortgage loan underwriting standards restrict the ability of many homeowners to refinance, which is normally to the detriment of MBS investors. We believe global uncertainty will support demand for Agency RMBS due to the relatively attractive yield and the implicit U.S. government guarantee. Further, the Federal Reserve is likely to continue Agency RMBS purchases to reinvest prepayments on their portfolio throughout 2016. Agency fixed-rate MBS outperformed equal duration U.S. Treasury notes and, to a somewhat lesser degree, interest rate swaps during the fourth quarter, but Agency Hybrids underperformed. Non-agency CMBS and GSE CRT securities underperformed in the fourth quarter and for the full year reflecting generally tighter financial conditions, and wider spreads in other fixed income sectors such as investment grade corporate bonds, high yield corporate bonds, and emerging market bonds. A challenge during
2015
was the behavior of U.S. interest rate swaps which we use to hedge the impact that rising interest rates would have on our earnings and book value. Generally thought likely to widen in times of weakening financial conditions, interest rate swap spreads actually tightened markedly in the second half of
2015
. Ten year swap yields, which normally are higher relative to U.S. Treasury notes, were notably lower than U.S. Treasury yields by the end of the year. Another challenge was increasing repurchase agreement financing rates. The borrowing rate on one-month Agency MBS increased from approximately 0.4% early in the quarter to about 0.7%, late in the fourth quarter due in large part to the December rate increase by the Federal Reserve and year-end pressures.
|
40
|
||
The impact of regulatory initiatives on the economy may also affect our business and our financial results. The Dodd-Frank Act, enacted in July 2010, with various effective dates thereafter, contains numerous provisions affecting the financial and mortgage industries, many of which may affect our cost of doing business, may limit our investment opportunities and may affect the competitive balance within our industry and markets in which we invest. For example, the Ability-to-Repay (“ATR”) rule requires lenders to make a reasonable, good-faith determination that residential borrowers have a reasonable ability to repay a mortgage loan. In addition to the ATR rule, the Consumer Financial Protection Bureau adopted a Qualified Mortgage framework that provides certain legal protections to residential mortgage loan lenders, which include restrictions on loan features, points and fees and borrower debt-to-income ratios. While we are not directly subject to compliance with the implementation of rules regarding the origination of residential mortgage loans, the impact of these regulations and others such as the Qualified Residential Mortgage and Risk Retention rules adopted by the Joint Interagency Federal Regulators, could affect our ability to securitize or invest in newly originated loans in the future.
In addition, the regulatory landscape for our repurchase agreement counterparties continues to evolve following the adoption of new capital rules which generally affects the manner in which banks lend. Regulators are also focused on liquidity requirements which will likely impact how banks fund themselves. While we are not directly subject to compliance with the implementation of rules regarding financial institutions, the effect of these regulations and others could affect our ability to finance our assets in the future.
On September 2, 2014, the Federal Housing Finance Agency ("FHFA"), proposed to revise its regulations governing Federal Home Loan Bank membership (the “FHFA Rule”) to, among other things, exclude captive insurance companies. The FHFA Rule was effective on February 19, 2016. The FHFA Rule permits existing captive insurers, such as our captive insurance company subsidiary, IAS Services LLC, to remain members for a period of five years following the effective date of the final FHFA Rule. In addition, the Federal Home Loan Bank of Indianapolis ("FHLBI") would be permitted to honor the contractual terms of maturity of outstanding advances to IAS Services LLC that were made prior to the effective date of the final FHFA Rule. Therefore, we do not expect there to be any impact to our existing FHLBI borrowings under the FHFA Rule, and we do not expect that the FHFA Rule will have a material effect on our sources or costs of funding or our results of operations.
Investment Activities
In
2015
, our investment portfolio remained positioned to take advantage of opportunities in both mortgage-backed and credit risk transfer securities and newly originated loans against a backdrop of improving housing and commercial real estate markets. For the first nine months of 2015, we maintained a relatively balanced allocation of our equity among residential credit, commercial credit and Agency RMBS. During the fourth quarter of 2015, our equity allocation to Agency RMBS increased to 37%, due to the impact of the deconsolidation of residential loan securitizations, wider credit asset spreads and limited opportunities in the residential credit investment market.
We continue to invest in GSE CRT transactions issued by both Fannie Mae and Freddie Mac and hold securities with a fair value of
$658.2 million
as of
December 31, 2015
. Since the inception of our commercial real estate lending program in 2013, we have invested in a first mortgage loan and ten subordinated interests. Our first mortgage loan and four subordinated interests have paid off as of
December 31, 2015
.
|
41
|
||
The table below shows the allocation of our equity as of
December 31, 2015
and
2014
:
|
As of December 31,
|
|||||
|
|
2015
|
2014
|
|||
|
Agency RMBS
|
37.0
|
%
|
32.0
|
%
|
|
|
Commercial Credit
(1)
|
33.0
|
%
|
34.0
|
%
|
|
|
Residential Credit
(2)
|
30.0
|
%
|
34.0
|
%
|
|
|
Total
|
100.0
|
%
|
100.0
|
%
|
|
|
(1)
|
CMBS, Commercial Loans and Investments in unconsolidated ventures of
$38.4 million
(which are included in Other Investments), are considered commercial credit.
|
|
(2)
|
Non-Agency RMBS, GSE CRT and Residential Loans are considered residential credit.
|
The table below shows the breakdown of our investment portfolio as of
December 31, 2015
and
2014
:
|
$ in thousands
|
As of December 31,
|
||||
|
2015
|
2014
|
||||
|
Agency RMBS:
|
|||||
|
30 year fixed-rate, at fair value
|
4,063,957
|
|
4,790,293
|
|
|
|
15 year fixed-rate, at fair value
|
1,610,930
|
|
1,327,101
|
|
|
|
Hybrid ARM, at fair value
|
3,309,525
|
|
2,976,918
|
|
|
|
ARM, at fair value
|
426,025
|
|
546,782
|
|
|
|
Agency CMO, at fair value
|
388,819
|
|
450,895
|
|
|
|
Non-Agency RMBS, at fair value
|
2,692,487
|
|
3,061,647
|
|
|
|
GSE CRT, at fair value
|
658,228
|
|
625,424
|
|
|
|
CMBS, at fair value
|
2,915,964
|
|
3,469,835
|
|
|
|
Residential loans, at amortized cost
|
—
|
|
3,365,003
|
|
|
|
Commercial loans, at amortized cost
|
209,062
|
|
145,756
|
|
|
|
Total Investment portfolio
|
16,274,997
|
|
20,759,654
|
|
|
During
2015
, we reinvested cash flows from our 30 year fixed-rate Agency RMBS portfolio into 15 year fixed-rate Agency RMBS and Hybrid ARM Agency RMBS. We have continued to hold certain 30 year fixed-rate Agency RMBS securities that have relatively short durations because they are collateralized by higher coupons. We expect these securities to prepay more favorably than their applicable cohorts based on their seasoning and collateral attributes. The average coupon of our 30 year fixed-rate Agency RMBS declined to
4.24%
at
December 31, 2015
, compared to
4.29%
at
December 31, 2014
. Additionally, we hold 15 year fixed-rate Agency RMBS, Hybrid ARM Agency RMBS and ARM Agency RMBS that we believe have lower durations and better cash flow certainty relative to current coupon 30 year fixed-rate Agency RMBS. Further, we own Agency collateralized mortgage obligations ("CMOs"), some of which are interest-only securities ("IOs"), to hedge the risk of higher interest rates.
Our portfolio of investments that have credit exposure include non-Agency RMBS
,
GSE CRTs, CMBS and commercial
estate loans. We use our proprietary models to perform a detailed review of each investment which often includes loan level analysis of expected performance. We do not place any reliance on ratings by various agencies as we believe our models more accurately evaluate the performance based on our assumptions about market conditions.
With respect to our non-Agency RMBS portfolio, we primarily invest in RMBS collateralized by prime and Alt-A loans. In addition, we have invested in re-securitizations of real estate mortgage investment conduit ("Re-REMIC") RMBS and reperforming mortgage loans that we believe provide attractive risk adjusted returns. We also invest in GSE CRTs, which have the added benefit of paying a floating rate coupon and reduces our need to hedge interest rate risk. Based on our view of the improving housing market and relative value opportunities, we increased holdings in GSE CRTs as paydowns from principal repayments and dispositions reduced our non-Agency RMBS holdings during
2015
.
During the period from the first quarter of 2013 through the first quarter of 2015, we purchased subordinate interests in eleven residential loan securitizations ("Residential Securitizations") that we consolidated in our financial statements. On December 9, 2015, we completed the sale of certain beneficial interests in the Residential Securitizations and deconsolidated the Residential Securitizations. The securities sold included the most subordinated classes of asset-backed securities issued by
|
42
|
||
the Residential Securitizations. We sold these securities in order to further our efforts to increase shareholder value by allocating capital away from lower return investments. In addition, we expect to benefit from reduced accounting and auditing expenses associated with consolidating the Residential Securitizations and increased transparency into the our results of operations and financial position. Our debt-to-equity ratio decreased as a result of deconsolidating the Residential Securitizations.
Our CMBS portfolio generally consists of assets originated before 2007, assets originated after 2010 (“CMBS 2.0”) and multi-family CMBS issued by Freddie Mac under their “K” program. Over the past twelve months we have primarily invested in CMBS 2.0. The allocation of our CMBS holdings in our MBS and GSE CRT portfolio is approximately
18.1%
as of
December 31, 2015
.
During
2015
, we purchased or originated four new commercial real estate loans. As of
December 31, 2015
, our commercial real estate loan portfolio includes
six
mezzanine loans that we purchased or originated. For further details on the loan portfolio, refer to Note 5 - "Commercial Loans Held-for-Investment" of our consolidated financial statements in Part IV, Item 15 of this Report.
Portfolio Characteristics
The table below represents the vintage distribution of our MBS and GSE CRT portfolio as of
December 31, 2015
as a percentage of the fair value:
|
2003
|
2004
|
2005
|
2006
|
2007
|
2008
|
2009
|
2010
|
2011
|
2012
|
2013
|
2014
|
2015
|
Total
|
||||||||||||||||||||||||||||
|
Prime
|
0.4
|
%
|
1.4
|
%
|
4.0
|
%
|
3.5
|
%
|
7.1
|
%
|
1.9
|
%
|
—
|
%
|
—
|
%
|
—
|
%
|
—
|
%
|
11.3
|
%
|
9.5
|
%
|
1.1
|
%
|
40.2
|
%
|
|||||||||||||
|
Re-REMIC
(1)
|
—
|
%
|
—
|
%
|
—
|
%
|
—
|
%
|
0.4
|
%
|
—
|
%
|
0.8
|
%
|
4.0
|
%
|
14.6
|
%
|
4.4
|
%
|
0.5
|
%
|
—
|
%
|
—
|
%
|
24.7
|
%
|
|||||||||||||
|
Alt-A
|
—
|
%
|
0.6
|
%
|
6.9
|
%
|
5.8
|
%
|
6.9
|
%
|
—
|
%
|
—
|
%
|
—
|
%
|
—
|
%
|
—
|
%
|
—
|
%
|
—
|
%
|
—
|
%
|
20.2
|
%
|
|||||||||||||
|
Subprime/reperforming
|
—
|
%
|
—
|
%
|
—
|
%
|
—
|
%
|
0.3
|
%
|
—
|
%
|
—
|
%
|
—
|
%
|
—
|
%
|
—
|
%
|
1.9
|
%
|
11.3
|
%
|
1.4
|
%
|
14.9
|
%
|
|||||||||||||
|
Total Non-Agency
|
0.4
|
%
|
2.0
|
%
|
10.9
|
%
|
9.3
|
%
|
14.7
|
%
|
1.9
|
%
|
0.8
|
%
|
4.0
|
%
|
14.6
|
%
|
4.4
|
%
|
13.7
|
%
|
20.8
|
%
|
2.5
|
%
|
100.0
|
%
|
|||||||||||||
|
GSE CRT
|
—
|
%
|
—
|
%
|
—
|
%
|
—
|
%
|
—
|
%
|
—
|
%
|
—
|
%
|
—
|
%
|
—
|
%
|
—
|
%
|
37.7
|
%
|
51.6
|
%
|
10.7
|
%
|
100.0
|
%
|
|||||||||||||
|
CMBS
|
—
|
%
|
—
|
%
|
0.4
|
%
|
9.5
|
%
|
—
|
%
|
—
|
%
|
—
|
%
|
7.4
|
%
|
22.2
|
%
|
12.9
|
%
|
13.9
|
%
|
28.9
|
%
|
4.8
|
%
|
100.0
|
%
|
|||||||||||||
|
(1)
|
For Re-REMICs, the table reflects the year in which the resecuritizations were issued. The vintage distribution of the securities that collateralize our Re-REMIC investments is
10.4%
for 2005,
29.5%
for 2006 and
60.1%
for 2007.
|
The tables below represent the geographic concentration of the underlying collateral for our non-Agency RMBS, GSE CRT and CMBS portfolio as of
December 31, 2015
:
|
Non-Agency RMBS
State
|
Percentage
|
GSE CRT
State
|
Percentage
|
CMBS
State
|
Percentage
|
||||||||
|
California
|
42.7
|
%
|
California
|
21.9
|
%
|
California
|
16.3
|
%
|
|||||
|
New York
|
7.0
|
%
|
Texas
|
5.6
|
%
|
New York
|
13.2
|
%
|
|||||
|
Florida
|
6.2
|
%
|
Virginia
|
4.5
|
%
|
Texas
|
9.3
|
%
|
|||||
|
Virginia
|
3.6
|
%
|
New York
|
4.2
|
%
|
Florida
|
5.9
|
%
|
|||||
|
Maryland
|
3.5
|
%
|
Illinois
|
3.9
|
%
|
Pennsylvania
|
4.2
|
%
|
|||||
|
New Jersey
|
3.4
|
%
|
Florida
|
3.6
|
%
|
Illinois
|
4.2
|
%
|
|||||
|
Massachusets
|
2.8
|
%
|
Massachusets
|
3.6
|
%
|
New Jersey
|
3.5
|
%
|
|||||
|
Illinois
|
2.8
|
%
|
Washington
|
3.3
|
%
|
Virginia
|
3.0
|
%
|
|||||
|
Washington
|
2.7
|
%
|
Colorado
|
3.2
|
%
|
Ohio
|
2.9
|
%
|
|||||
|
Arizona
|
2.1
|
%
|
New Jersey
|
3.2
|
%
|
Michigan
|
2.6
|
%
|
|||||
|
Other
|
23.2
|
%
|
Other
|
43.0
|
%
|
Other
|
34.9
|
%
|
|||||
|
Total
|
100.0
|
%
|
100.0
|
%
|
Total
|
100.0
|
%
|
||||||
|
43
|
||
Financing and Other Liabilities.
We enter into repurchase agreements to finance the majority of our target assets. These agreements are secured by our Agency RMBS, non-Agency RMBS, GSE CRTs and CMBS. In addition, these agreements are generally settled on a short-term basis, usually ranging from one to twelve months, and bear interest at rates that have historically moved in close relationship to LIBOR. At each settlement date, we refinance each repurchase agreement at the market interest rate at that time. As of
December 31, 2015
, we had entered into repurchase agreements totaling
$12.1 billion
(
2014
:
$13.6 billion
). The decrease in our repurchase agreement balance was primarily due to refinancing of $400.0 million of our repurchase borrowings with secured loans, as discussed below; using proceeds from repayments of principal, interest and sales of securities to repurchase common stock rather than reinvest in new securities; and the decline in value of pledged assets.
Our wholly-owned subsidiary, IAS Services LLC, is a member of the FHLBI. As a member of the FHLBI, IAS Services LLC has borrowed funds from the FHLBI in the form of secured advances. As of
December 31, 2015
, IAS Services LLC had
$1.65 billion
in outstanding secured advances. For the year ended
December 31, 2015
, IAS Services LLC had weighted average borrowings of
$1.6 billion
with a weighted average borrowing rate of
0.41%
and a weighted average maturity of
8.05
years. On January 12, 2016, new FHFA rules were adopted that exclude captive insurance companies from Federal Home Loan Bank membership. Under the new rules, IAS Services LLC is permitted to remain a member of the Federal Home Loan Bank for a period of five years, and the FHLBI is permitted to honor the contractual maturity of our existing advances. Accordingly, we do not expect there to be any impact to our existing FHLBI borrowings under the FHFA Rule.
We have also committed to invest up to
$121.8 million
in unconsolidated ventures that are sponsored by an affiliate of our Manager. As of
December 31, 2015
,
$100.7 million
of our commitment to these unconsolidated ventures has been called. We are committed to fund an additional
$21.1 million
in capital to cover future expenses should they occur.
We record a liability for mortgage-backed and credit risk transfer securities purchased, for which settlement has not taken place, as an investment related payable. As of
December 31, 2015
and
2014
, we had investment related payables of
$167,000
and
$17.0 million
, respectively. None of these investment related payables were outstanding more than thirty days. The change in balance was primarily due to a decrease in unsettled MBS purchases and unsettled repurchase borrowings as of
December 31, 2015
. We record a receivable for mortgage-backed and credit risk transfer securities sold for which settlement has not taken place as an investment related receivable. As of
December 31, 2015
and
2014
, we had investment related receivables of
$154.6 million
and
$38.7 million
, respectively. None of these investment related receivables were outstanding more than thirty days. The change in balance was primarily due to an increase in unsettled sales of securities as of
December 31, 2015
.
Hedging Instruments.
We generally hedge as much of our interest rate and foreign exchange risk as we deem prudent in light of market conditions. No assurance can be given that our hedging activities will have the desired beneficial impact on our results of operations or financial condition. Our investment policies do not contain specific requirements as to the percentages or amount of risk that we are required to hedge.
Hedging may fail to protect or could adversely affect us because, among other things:
|
•
|
available interest rate hedging may not correspond directly with the interest rate risk for which protection is sought;
|
|
•
|
the duration of the hedge may not match the duration of the related liability;
|
|
•
|
the party owing money in the hedging transaction may default on its obligation to pay;
|
|
•
|
the credit quality of the party owing money on the hedge may be downgraded to such an extent that it impairs our ability to sell or assign our side of the hedging transaction; and
|
|
•
|
the value of derivatives used for hedging may be adjusted from time-to-time in accordance with accounting rules to reflect changes in fair value. Downward adjustments or mark-to-market losses would reduce our stockholders’ equity.
|
On December 31, 2013, we discontinued hedge accounting for our interest rate swap agreements by de-designating the interest rate swaps as cash flow hedges. No interest rate swaps were terminated in conjunction with this action, and our risk management and hedging practices were not impacted. However, our accounting for these transactions changed prospectively. All of our interest rate swaps had previously been accounted for as cash flow hedges under the applicable guidance. As a result of discontinuing hedge accounting, beginning January 1, 2014, changes in the fair value of the interest rate swap agreements are recorded in gain (loss) on derivative instruments, net in our consolidated statements of operations, rather than in AOCI. Also, net interest paid or received under the interest rate swaps, which up through December 31, 2013 was recognized in interest expense, repurchase agreements is recognized in gain (loss) on derivatives, net in our consolidated statements of operations. Refer to Note 8 - "Derivatives and Hedging Activities" of our consolidated financial statements for further information.
|
44
|
||
As of
December 31, 2015
, we have entered into interest rate swap agreements designed to mitigate the effects of increases in interest rates under a portion of our borrowings. These swap agreements provide for fixed interest rates indexed off of one-month and three-month LIBOR and effectively fix the floating interest rates on
$11.5 billion
(
2014
:
$10.6 billion
) of borrowings. As of
December 31, 2015
, included in this amount are forward starting swaps with a total notional amount of
$1.6 billion
, with starting dates ranging from
February 5, 2016
to
June 24, 2016
. The change in the amount of interest rate swaps was due to our view of interest rate risk and the expected duration of our investment portfolio and liabilities.
As of
December 31, 2015
, we have no outstanding fixed pay interest rate swaptions. As of
December 31, 2014
, we held
$1.1 billion
in notional amount of fixed pay interest rate swaptions as an asset with a fair value of
$322,000
. The swaptions that we held at
December 31, 2014
expired unexercised, and the Company realized a loss of
$10.3 million
on these contracts. As of
December 31, 2015
, we held
$300.0 million
in notional amount of fixed receive interest rate swaptions as an asset with a fair value of
$0
. We did not have any outstanding fixed receive interest rate swaptions as of
December 31, 2014
. We purchase interest rate swaptions to reduce the impact that interest rate volatility has on our portfolio. The change in the notional amount of swaptions held was due to our views on the potential for change in volatility.
As of
December 31, 2015
, we have no outstanding futures contracts. As of
December 31, 2014
, we held
$127.4 million
in notional amount of short U.S. Treasury futures as an asset with fair value of
$89,000
. During the year ended
December 31, 2015
, we sold U.S. Treasury futures contracts of
$248.3 million
(
2014
:
$1.3 billion
) in notional amount and realized a net loss of
$943,000
(
2014
:
$11.5 million
). We periodically invest in U.S. Treasury futures to help mitigate the potential impact of changes in interest rates on the performance of our portfolio.
As of
December 31, 2015
, we have no outstanding to-be-announced securities ("TBA"). As of
December 31, 2014
, we held
$198.0 million
in notional amount of to-be-announced securities ("TBA") as a liability with a fair value of
$558,000
. During the year ended
December 31, 2015
,
$446.0 million
(
2014
:
$3.1 billion
) notional TBA were settled with realized net loss of
$2.3 million
(
2014
:
$10.8 million
). TBAs are contracts for which we agree to purchase or deliver in the future Agency RMBS with certain principal and interest terms. We periodically purchase or sell certain TBAs to help mitigate the potential impact of changes in interest rates on the performance of our portfolio.
As of
December 31, 2015
, we held
$76.3 million
(
2014
:
$35.7 million
) in notional amount of currency forward contracts as an asset with a fair value of
$1.9 million
(
2014
:
$599,000
) and a liability with a fair value of
$103,000
(
2014
: $0). During the year ended
December 31, 2015
, we settled currency forward contracts of
$131.0 million
(
2014
:
$67.7 million
) in notional amount and realized a net gain of
$1.2 million
(
2014
:
$2.2 million
). We use currency forward contracts to help mitigate the potential impact of changes in foreign currency exchange rates on our investments denominated in foreign currencies.
Book Value per Share
Our book value per diluted common share was
$17.14
,
$18.82
and
$17.97
as of
December 31, 2015
,
2014
and
2013
, respectively. Book value per diluted common share is calculated as total equity less the liquidation preference of our Series A Preferred Stock (
$140.0 million
) and Series B Preferred Stock (
$155.0 million
); divided by total common shares outstanding plus Operating Partnership Units convertible into shares of common stock (
1,425,000
shares).
The change in our book value in
2015
was primarily due to the change in valuation of our investment portfolio that is recorded in accumulated other comprehensive income on our consolidated balance sheets. Refer to Note 4 – “Mortgage-Backed and Credit Risk Transfer Securities” of our consolidated financial statements for the impact of changes in accumulated other comprehensive income on our investment portfolio. The values of our assets and liabilities change daily based on market conditions. Refer to Item 7A. “Quantitative and Qualitative Disclosures About Market Risk” for interest rate risk and its impact on fair value.
Critical Accounting Policies
Our consolidated financial statements are prepared in accordance with U.S. GAAP, which requires the use of estimates that involve the exercise of judgment and use of assumptions as to future uncertainties. Accounting estimates and assumptions discussed in this section are those that we consider to be the most critical to an understanding of our financial statements because they involve significant judgments and uncertainties. All of these estimates reflect our best judgment about current, and for some estimates, future economic and market conditions and their effects based on information available as of the date of these financial statements. If conditions change from those expected, it is possible that the judgments and estimates described below could change, which may result in a change in valuation of our investment portfolio, future impairments of our MBS and GSE CRTs, change in our interest income recognition, allowance for loan losses, and a change in our tax liability among other effects.
Mortgage-Backed and Credit Risk Transfer Securities.
We record our MBS except RMBS IOs as available-for-sale and report them at fair value. RMBS IOs and GSE CRTs are hybrid financial instruments reported at fair value. Fair value is determined by obtaining valuations from an independent source. If the fair value of a security is not available from a third-party
|
45
|
||
pricing service, we may estimate the fair value of the security using a variety of methods including other pricing services, discounted cash flow analysis, matrix pricing, option adjusted spread models and other fundamental analysis of observable market factors. It is possible that changes in these inputs could change the valuation estimate and lead to impairment of our MBS and GSE CRT portfolio. Further information is provided in Note 2 - "Summary of Significant Accounting Policies" and Note 4 - “Mortgage-Backed and Credit Risk Transfer Securities."
Other-than-temporary Impairment.
We regularly review our available-for-sale portfolio for other-than-temporary impairment. This determination involves both qualitative and quantitative data. It is possible that estimates may be incorrect, economic conditions may change or we may be forced to sell the investment before recovery of our amortized cost. Further information is provided in Note 2 - "Summary of Significant Accounting Policies" and Note 4 - “Mortgage-Backed and Credit Risk Transfer Securities."
Residential and Commercial Loans.
Residential loans held-for-investment were carried at unpaid principal balance net of any premiums and an allowance for loan losses. An allowance for loan losses is established based on credit losses inherent in the portfolio. These estimates require consideration of various inputs including, but not limited to, historical loss experience, delinquency status, borrower credit scores, geographic concentrations and loan-to-value ratios. In addition, since we had not incurred any direct losses on our portfolio, we utilized national historical credit performance information from a third party to assist in our analysis.
Commercial loans held-for-investment are carried at amortized cost, net of any allowance for loan losses. We generally consider various factors in evaluating whether a commercial loan is impaired. These factors include, but are not limited to, the loan-to-value ratios, the most recent financial information available for each loan and associated properties, economic trends and the loan sponsor or the borrowing entity's ability to ensure that properties associated with the loan are managed and operating sufficiently.
Changes in our estimates can significantly impact the allowance for loan losses and provision expense. It is also possible that we will experience credit losses that are different from our current estimates or that the timing of those losses may differ from our estimates. Further information on the allowance for loan losses is provided in Note 2 - “Summary of Significant Accounting Policies.”
Interest Income Recognition.
Interest income on MBS is accrued based on the outstanding principal balance of the securities and their contractual terms. Premiums or discounts are amortized or accreted into interest income over the life of the investment using the effective interest method. Interest income on our non-Agency RMBS (and other prepayable mortgage-backed securities where we may not recover substantially all of our initial investment) is based on estimated cash flows. We estimate, at the time of purchase, the future expected cash flows and determine the effective interest rate based on these estimated cash flows and our purchase price. Over the life of the investments, these estimated cash flows are updated and a revised yield is computed based on the current amortized cost of the investment. In estimating these cash flows, there are a number of assumptions that are subject to uncertainties and contingencies, including the rate and timing of principal payments (prepayments, repurchases, defaults and liquidations), the pass through or coupon rate and interest rate fluctuations. These uncertainties and contingencies are difficult to predict and are subject to future events that may impact our estimates and interest income.
Interest income recognition on our Agency RMBS that cannot be prepaid in such a way that we would not recover substantially all of our initial investment is based on contractual cash flows. We do not estimate prepayments in applying the effective interest method.
Interest income on credit risk transfer securities is accrued based on the coupon rate of the debt host contract which reflects the credit risk of GSE unsecured senior debt with a similar maturity. Premiums or discounts associated with the purchase of credit risk transfer securities are amortized or accreted into interest income over the life of the debt host contract using the effective interest method.
Interest income from our residential loans was recognized on an accrual basis with the related premiums amortized into interest income using the effective interest method over the weighted average life of these loans. As needed, these estimated cash flows were updated and a revised yield was computed based on the current amortized cost of the investment. Interest income from our commercial loans was recognized when earned and deemed collectible or until a loan becomes past due based on the terms of the loan agreement.
Accounting for Derivative Financial Instruments.
We use derivatives to manage interest rate and currency exchange risk. We record all derivatives on our consolidated balance sheets at fair value. Effective December 31, 2013, we voluntarily discontinued hedge accounting for our interest rate swap agreements by de-designating the interest rate swaps as cash flow hedges. As a result of discontinuing hedge accounting, changes in the fair value of the interest rate swaps are recorded in gain (loss) on derivative instruments, net in our consolidated statement of operations, rather than in accumulated other comprehensive income (loss). Further information is provided in Note 8 - “Derivatives and Hedging Activities.”
|
46
|
||
Income Taxes.
We have elected to be taxed as a REIT. Accordingly, we generally will not be subject to U.S. federal and applicable state and local corporate income tax to the extent that we make qualifying distributions and provided we satisfy on a continuing basis, through actual investment and operating results, the REIT requirements including certain asset, income, distribution and stock ownership tests. The REIT qualifications rules are complex and failure to apply them correctly could subject us to U.S. federal, state and local income taxes.
Expected Impact of New Authoritative Guidance on Future Financial Information
In February 2015, the FASB issued modifications to existing consolidation guidance for reporting organizations that are required to evaluate whether they should consolidate certain legal entities. The guidance is effective for fiscal years and interim periods within those years beginning after December 15, 2015, and requires either a retrospective or a modified retrospective approach to adoption. Early adoption is permitted. The new guidance is not expected to have a material impact on our consolidated financial statements.
In April 2015, the FASB issued guidance to amend the presentation of debt issuance cost related to a recognized debt liability. Under the new guidance, debt issuance costs will be presented in the balance sheet as a direct deduction from the carrying amount of the recognized debt liability, consistent with debt discounts. The recognition and measurement guidance for debt issuance costs are not affected under the new guidance. We will implement the new guidance in the first quarter of 2016 on a retrospective basis. Upon adoption, we will comply with the applicable disclosures for a change in an accounting principle. These disclosures include the nature of and reason for the change in accounting principle, the transition method, a description of the prior-period information that has been retrospectively adjusted, and the effect of the change on the balance sheet line items. The new guidance will not have a material impact on our consolidated financial statements.
In January 2016, the FASB issued guidance to improve certain aspects of recognition, measurement, presentation, and disclosure of financial instruments. The Company is required to adopt the new guidance in the first quarter of 2018. Early adoption is permitted for public companies. The Company should apply the guidance by means of a cumulative-effect adjustment to the balance sheet as of the beginning of the fiscal year of adoption. The guidance related to equity securities without readily determinable fair values should be applied prospectively to equity investments that exist at the date of adoption. We are currently evaluating the potential impact of the new guidance on our consolidated financial statements.
|
47
|
||
Results of Operations
The table below presents certain information from our consolidated statements of operations for the years ended
December 31, 2015
,
2014
and
2013
.
|
|
Years Ended December 31,
|
|||||||
|
In thousands except share amounts
|
2015
|
2014
|
2013
|
|||||
|
Interest Income
|
||||||||
|
Mortgage-backed and credit risk transfer securities
|
518,256
|
|
579,062
|
|
646,787
|
|
||
|
Residential loans
(1)
|
110,908
|
|
88,073
|
|
34,122
|
|
||
|
Commercial loans
|
15,331
|
|
9,508
|
|
1,451
|
|
||
|
Total interest income
|
644,495
|
|
676,643
|
|
682,360
|
|
||
|
Interest Expense
|
||||||||
|
Repurchase agreements
|
166,892
|
|
188,699
|
|
287,547
|
|
||
|
Secured loans
|
6,579
|
|
2,576
|
|
—
|
|
||
|
Exchangeable senior notes
|
22,461
|
|
22,461
|
|
18,023
|
|
||
|
Asset-backed securities
(1)
|
82,041
|
|
68,159
|
|
26,682
|
|
||
|
Total interest expense
|
277,973
|
|
281,895
|
|
332,252
|
|
||
|
Net interest income
|
366,522
|
|
394,748
|
|
350,108
|
|
||
|
(Reduction in) provision for loan losses
|
(213
|
)
|
(142
|
)
|
884
|
|
||
|
Net interest income after (reduction in) provision for loan losses
|
366,735
|
|
394,890
|
|
349,224
|
|
||
|
Other income (loss)
|
||||||||
|
Gain (loss) on investments, net
|
(21,212
|
)
|
(87,168
|
)
|
(182,733
|
)
|
||
|
Equity in earnings of unconsolidated ventures
|
12,630
|
|
6,786
|
|
5,345
|
|
||
|
Gain (loss) on derivative instruments, net
|
(219,048
|
)
|
(487,469
|
)
|
40,003
|
|
||
|
Realized and unrealized credit derivative income (loss), net
|
19,782
|
|
(2,866
|
)
|
1,127
|
|
||
|
Other investment income (loss), net
|
944
|
|
(2,045
|
)
|
—
|
|
||
|
Total other income (loss)
|
(206,904
|
)
|
(572,762
|
)
|
(136,258
|
)
|
||
|
Expenses
|
||||||||
|
Management fee — related party
|
38,632
|
|
37,599
|
|
42,639
|
|
||
|
General and administrative
|
7,769
|
|
9,191
|
|
8,368
|
|
||
|
Consolidated securitization trusts
(1)
|
8,219
|
|
6,076
|
|
2,137
|
|
||
|
Total expenses
|
54,620
|
|
52,866
|
|
53,144
|
|
||
|
Net income (loss)
|
105,211
|
|
(230,738
|
)
|
159,822
|
|
||
|
Net income (loss) attributable to non-controlling interest
|
1,241
|
|
(2,632
|
)
|
1,667
|
|
||
|
Net income (loss) attributable to Invesco Mortgage Capital Inc.
|
103,970
|
|
(228,106
|
)
|
158,155
|
|
||
|
Dividends to preferred stockholders
|
22,864
|
|
17,378
|
|
10,851
|
|
||
|
Net income (loss) attributable to common stockholders
|
81,106
|
|
(245,484
|
)
|
147,304
|
|
||
|
Earnings per share:
|
||||||||
|
Net income (loss) attributable to common stockholders
|
||||||||
|
Basic
|
0.67
|
|
(1.99
|
)
|
1.11
|
|
||
|
Diluted
|
0.67
|
|
(1.99
|
)
|
1.11
|
|
||
|
Weighted average number of shares of common stock:
|
||||||||
|
Basic
|
121,377,585
|
|
123,104,934
|
|
132,714,012
|
|
||
|
Diluted
|
122,843,838
|
|
124,529,934
|
|
134,173,691
|
|
||
|
(1)
|
The consolidated statements of operations include income and expenses of consolidated VIEs. The Company deconsolidated these VIEs in 2015. Refer to Note 3 - “Variable Interest Entities” of our consolidated financial statements for further discussion.
|
|
48
|
||
Net Income Summary
For the year ended
December 31, 2015
, our net income attributable to common stockholders was
$81.1 million
(
2014
:
$245.5 million
net loss;
2013
:
$147.3 million
net income), or
$0.67
(
2014
:
$1.99
loss per share;
2013
:
$1.11
income per share) basic and diluted net income per average share available to common stockholders.
The change in net income attributable to common stockholders for the year ended
December 31, 2015
versus net loss attributable to common stockholders for the year ended
December 31, 2014
is primarily attributable to lower realized and unrealized losses on derivative instruments and lower losses on sales of investments in
2015
.
On December 9, 2015, we completed the sale of certain beneficial interests in our Residential Securitizations for $
69.0 million
(the "Transaction"). The securities sold included the most subordinated classes of asset-backed securities issued by the Residential Securitizations. As a result of the Transaction, we no longer have the power to direct the activities of the Residential Securitizations through default oversight rights and are therefore no longer the primary beneficiary of the Residential Securitizations. We deconsolidated the assets and liabilities of the Residential Securitizations as of the date of the Transaction.
The change in net loss attributable to common stockholders for the year ended
December 31, 2014
versus net income attributable to common stockholders for the year ended
December 31, 2013
is primarily attributable to the de-designation of interest rate swaps and realized and unrealized losses on derivative instruments.
As a result of discontinuing hedge accounting, beginning January 1, 2014, changes in the fair value of the interest rate swap agreements are recorded in gain (loss) on derivative instruments, net in our consolidated statements of operations, rather than in AOCI. For the year ended
December 31, 2015
, we recognized unrealized losses for the change in fair value of our interest rates swaps of
$554,000
(
2014
:
$223.9 million
). In addition, during the year ended
December 31, 2015
, we recognized reclassification of amortization of net deferred losses on de-designated interest rate swaps to repurchase agreements interest expense, previously recognized in other comprehensive income of
$66.8 million
(
2014
:
$85.2 million
).
Non-GAAP Financial Measures
We are presenting the following non-GAAP financial measures: core earnings (and by calculation, core earnings per common share), effective interest income (and by calculation, effective yield), effective interest expense (and by calculation, effective cost of funds), effective net interest income (and by calculation, effective interest rate margin), and repurchase agreement debt-to-equity ratio. Our management uses these non-GAAP financial measures in our internal analysis of results and believes these measures are useful to investors for the reasons explained below. The most directly comparable U.S. GAAP measures are net income attributable to common stockholders (and by calculation, basic earnings (loss) per common share), total interest income (and by calculation, yield), total interest expense (and by calculation, cost of funds), net interest income (and by calculation, net interest rate margin) and debt-to-equity ratio.
These non-GAAP financial measures should not be considered as substitutes for any measures derived in accordance with U.S. GAAP and may not be comparable to other similarly titled measures of other companies. An analysis of any non-GAAP financial measure should be made in conjunction with results presented in accordance with U.S. GAAP. Additional reconciling items may be added in the future to these non-GAAP measures if deemed appropriate.
Core Earnings
We calculate core earnings as U.S. GAAP net income (loss) attributable to common stockholders adjusted for (gain) loss on investments, net; realized (gain) loss on derivative instruments, net (excluding contractual net interest on interest rate swaps); unrealized (gain) loss on derivative instruments, net; realized and unrealized change in fair value of GSE CRT embedded derivatives, net; (gain) loss on foreign currency transactions, net; reclassification of amortization of net deferred losses on de-designated interest rate swaps to repurchase agreement expense; and an adjustment attributable to non-controlling interest. We record changes in the valuation of our mortgage-backed securities and the valuation assigned to the debt host contract associated with our GSE CRTs in other comprehensive income on our consolidated balance sheets. We believe the presentation of core earnings provides a consistent measure of operating performance by excluding the impact of gains and losses described above from operating results.
We believe that providing transparency into core earnings enables our investors to consistently measure, evaluate and compare our operating performance to that of our peers over multiple reporting periods. However, we caution that core earnings should not be considered as an alternative to net income (determined in accordance with U.S. GAAP), or as an indication of our cash flow from operating activities (determined in accordance with U.S. GAAP), a measure of our liquidity, or as an indication of amounts available to fund our cash needs, including our ability to make cash distributions.
|
49
|
||
The table below provides a reconciliation of U.S. GAAP net income (loss) attributable to common stockholders to core earnings for the following periods:
|
|
Years Ended December 31,
|
|||||||
|
$ in thousands, except per share data
|
2015
|
2014
|
2013
|
|||||
|
Net income (loss) attributable to common stockholders
|
81,106
|
|
(245,484
|
)
|
147,304
|
|
||
|
Adjustments:
|
||||||||
|
(Gain) loss on investments, net
|
21,212
|
|
87,168
|
|
182,733
|
|
||
|
Realized (gain) loss on derivative instruments, net (excluding contractual net interest on interest rate swaps of $184,373, $199,783, and $0, respectively)
|
44,272
|
|
72,187
|
|
(53,926
|
)
|
||
|
Unrealized (gain) loss on derivative instruments, net
|
(9,597
|
)
|
215,499
|
|
13,923
|
|
||
|
Realized and unrealized change in fair value of GSE CRT embedded derivatives, net
|
6,411
|
|
21,495
|
|
—
|
|
||
|
(Gain) loss on foreign currency transactions, net
|
1,875
|
|
2,746
|
|
—
|
|
||
|
Reclassification of amortization of net deferred losses on de-designated interest rate swaps to repurchase agreements interest expense
|
66,757
|
|
85,176
|
|
—
|
|
||
|
Subtotal
|
130,930
|
|
484,271
|
|
142,730
|
|
||
|
Adjustment attributable to non-controlling interest
|
(1,500
|
)
|
(5,532
|
)
|
(1,559
|
)
|
||
|
Core earnings
|
210,536
|
|
233,255
|
|
288,475
|
|
||
|
Basic earnings (loss) per common share
|
0.67
|
|
(1.99
|
)
|
1.11
|
|
||
|
Core earnings per share attributable to common stockholders
|
1.73
|
|
1.89
|
|
2.17
|
|
||
Effective Interest Income / Effective Yield/ Effective Interest Expense / Effective Cost of Funds / Effective Net Interest Income / Effective Interest Rate Margin
We calculate effective interest income (and by calculation, effective yield) as U.S. GAAP total interest income adjusted for GSE CRT embedded derivative coupon interest that is recorded in realized and unrealized credit derivative income (loss), net. We add back GSE CRT embedded derivative coupon interest to our total interest income because we consider GSE CRT embedded derivative coupon interest a current component of our total interest income.
We calculate effective interest expense (and by calculation, effective cost of funds) as U.S. GAAP total interest expense adjusted for net interest paid on our interest rate swaps that is recorded in gain (loss) on derivative instruments and the reclassification of amortization of net deferred losses on de-designated interest rate swaps to repurchase agreements interest expense. We view our interest rate swaps as an economic hedge against increases in future market interest rates on our floating rate borrowings. We add back the net payments we make on our interest rate swap agreements to our total U.S. GAAP interest expense because we use interest rate swaps to add stability to interest expense. We subtract amortization of net deferred losses on de-designated interest rate swaps to repurchase agreements interest expense because we do not consider the amortization a current component of our borrowing costs.
We calculate effective net interest income (and by calculation, effective interest rate margin) as U.S. GAAP net interest income adjusted for net interest paid on our interest rate swaps that is recorded in gain (loss) on derivative instruments, the amortization of net deferred losses on de-designated interest rate swaps to repurchase agreement interest expense and GSE CRT embedded derivative coupon interest that is recorded in realized and unrealized credit derivative income (loss), net.
We believe the presentation of effective interest income, effective yield, effective interest expense, effective cost of funds, effective net interest income and effective interest rate margin measures, when considered together with U.S. GAAP financial measures, provide information that is useful to investors in understanding our borrowing costs and operating performance.
|
50
|
||
The following table reconciles total interest income to effective interest income and yield to effective yield for the following periods:
|
Years Ended December 31,
|
|||||||||||||||||
|
|
2015
|
2014
|
2013
|
||||||||||||||
|
$ in thousands
|
Reconciliation
|
Yield/Effective Yield
|
Reconciliation
|
Yield/Effective Yield
|
Reconciliation
|
Yield/Effective Yield
|
|||||||||||
|
Total interest income
|
644,495
|
|
3.22
|
%
|
676,643
|
|
3.41
|
%
|
682,360
|
|
3.32
|
%
|
|||||
|
Add: GSE CRT embedded derivative coupon interest recorded as realized and unrealized credit derivative income (loss), net
|
24,822
|
|
0.12
|
%
|
17,536
|
|
0.09
|
%
|
—
|
|
—
|
%
|
|||||
|
Effective interest income
|
669,317
|
|
3.34
|
%
|
694,179
|
|
3.50
|
%
|
682,360
|
|
3.32
|
%
|
|||||
The following table reconciles total interest expense to effective interest expense and cost of funds to effective cost of funds for the following periods:
|
Years Ended December 31,
|
|||||||||||||||||
|
|
2015
|
2014
|
2013
|
||||||||||||||
|
$ in thousands
|
Reconciliation
|
Cost of Funds / Effective Cost of Funds
|
Reconciliation
|
Cost of Funds / Effective Cost of Funds
|
Reconciliation
|
Cost of Funds / Effective Cost of Funds
|
|||||||||||
|
Total interest expense
|
277,973
|
|
1.56
|
%
|
281,895
|
|
1.61
|
%
|
332,252
|
|
1.84
|
%
|
|||||
|
Less: Reclassification of amortization of net deferred losses on de-designated interest rate swaps to repurchase agreements interest expense
|
(66,757
|
)
|
(0.37
|
)%
|
(85,176
|
)
|
(0.48
|
)%
|
—
|
|
—
|
%
|
|||||
|
Add: Net interest paid - interest rate swaps
|
184,373
|
|
1.03
|
%
|
199,783
|
|
1.14
|
%
|
—
|
|
—
|
%
|
|||||
|
Effective interest expense
|
395,589
|
|
2.22
|
%
|
396,502
|
|
2.27
|
%
|
332,252
|
|
1.84
|
%
|
|||||
The following table reconciles net interest income to effective net interest income and net interest rate margin to effective interest rate margin for the following periods:
|
Years Ended December 31,
|
|||||||||||||||||
|
|
2015
|
2014
|
2013
|
||||||||||||||
|
$ in thousands
|
Reconciliation
|
Net Interest Rate Margin / Effective Interest Rate Margin
|
Reconciliation
|
Net Interest Rate Margin / Effective Interest Rate Margin
|
Reconciliation
|
Net Interest Rate Margin / Effective Interest Rate Margin
|
|||||||||||
|
Net interest income
|
366,522
|
|
1.66
|
%
|
394,748
|
|
1.80
|
%
|
350,108
|
|
1.48
|
%
|
|||||
|
Add: Reclassification of amortization of net deferred losses on de-designated interest rate swaps to repurchase agreements interest expense
|
66,757
|
|
0.37
|
%
|
85,176
|
|
0.48
|
%
|
—
|
|
—
|
%
|
|||||
|
Add: GSE CRT embedded derivative coupon interest recorded as realized and unrealized credit derivative income (loss), net
|
24,822
|
|
0.12
|
%
|
17,536
|
|
0.09
|
%
|
—
|
|
—
|
%
|
|||||
|
Less: Net interest paid - interest rate swaps
|
(184,373
|
)
|
(1.03
|
)%
|
(199,783
|
)
|
(1.14
|
)%
|
—
|
|
—
|
%
|
|||||
|
Effective net interest income
|
273,728
|
|
1.12
|
%
|
297,677
|
|
1.23
|
%
|
350,108
|
|
1.48
|
%
|
|||||
|
51
|
||
The tables below show the allocation of our equity to our targeted assets, our debt-to-equity ratio, and our repurchase agreement debt-to-equity ratio as of
December 31, 2015
and
December 31, 2014
. We present a repurchase agreement debt-to-equity ratio because the mortgage REIT industry primarily uses repurchase agreements, which typically mature within one year, to finance investments. We believe that presenting our repurchase agreement debt-to-equity ratio, a non-GAAP financial measure of leverage, when considered together with our U.S. GAAP financial measure, provides information that is useful to investors in understanding our refinancing risks, and gives investors a comparable statistic to those other mortgage REITs who almost exclusively borrow using short-term repurchase agreements that are subject to refinancing risk.
December 31, 2015
|
$ in thousands
|
Agency RMBS
|
Residential Credit
(4)
|
Commercial Credit
(5)
|
Exchangeable Senior Notes
|
Total
|
|||||
|
Investments
|
9,799,257
|
|
3,350,714
|
|
3,163,439
|
|
—
|
|
16,313,410
|
|
|
Cash and cash equivalents
(1)
|
23,484
|
|
16,586
|
|
13,129
|
|
—
|
|
53,199
|
|
|
Derivative assets, at fair value
(2)
|
6,795
|
|
—
|
|
1,864
|
|
—
|
|
8,659
|
|
|
Other assets
|
316,072
|
|
9,780
|
|
71,616
|
|
—
|
|
397,468
|
|
|
Total assets
|
10,145,608
|
|
3,377,080
|
|
3,250,048
|
|
—
|
|
16,772,736
|
|
|
Repurchase agreements
|
8,389,643
|
|
2,565,515
|
|
1,170,890
|
|
—
|
|
12,126,048
|
|
|
Secured loans
(3)
|
472,983
|
|
—
|
|
1,177,017
|
|
—
|
|
1,650,000
|
|
|
Exchangeable senior notes
|
—
|
|
—
|
|
—
|
|
400,000
|
|
400,000
|
|
|
Derivative liabilities, at fair value
|
238,045
|
|
—
|
|
103
|
|
—
|
|
238,148
|
|
|
Other liabilities
|
46,165
|
|
22,540
|
|
22,927
|
|
—
|
|
91,632
|
|
|
Total liabilities
|
9,146,836
|
|
2,588,055
|
|
2,370,937
|
|
400,000
|
|
14,505,828
|
|
|
Total equity (allocated)
|
998,772
|
|
789,025
|
|
879,111
|
|
(400,000
|
)
|
2,266,908
|
|
|
Adjustments to calculate repurchase agreement debt-to-equity:
|
||||||||||
|
Net equity in unsecured assets and exchangeable senior notes
(6)
|
—
|
|
—
|
|
(250,060
|
)
|
400,000
|
|
149,940
|
|
|
Collateral pledged against Secured loans
|
(558,894
|
)
|
—
|
|
(1,390,805
|
)
|
—
|
|
(1,949,699
|
)
|
|
Secured loans
|
472,983
|
|
—
|
|
1,177,017
|
|
—
|
|
1,650,000
|
|
|
Equity related to repurchase agreement debt
|
912,861
|
|
789,025
|
|
415,263
|
|
—
|
|
2,117,149
|
|
|
Debt-to-equity ratio
(7)
|
8.9
|
|
3.3
|
|
2.7
|
|
NA
|
|
6.3
|
|
|
Repurchase agreement debt-to-equity ratio
(8)
|
9.2
|
|
3.3
|
|
2.8
|
|
NA
|
|
5.7
|
|
|
(1)
|
Cash and cash equivalents is allocated based on a percentage of equity for Agency RMBS, Residential Credit and Commercial Credit.
|
|
(2)
|
Derivative assets are allocated based on the hedging strategy for each asset class.
|
|
(3)
|
Secured loans are allocated based on amount of collateral pledged.
|
|
(4)
|
Non-Agency RMBS and GSE CRT are considered residential credit.
|
|
(5)
|
CMBS, Commercial Loans and Investments in unconsolidated ventures are considered commercial credit.
|
|
(6)
|
Net equity in unsecured assets and exchangeable senior notes includes commercial loans, investments in unconsolidated ventures and exchangeable senior notes.
|
|
(7)
|
Debt-to-equity ratio is calculated as the ratio of total debt (sum of repurchase agreements, secured loans and exchangeable senior notes) to total equity.
|
|
(8)
|
Repurchase agreement debt-to-equity ratio is calculated as the ratio of repurchase agreements to equity related to repurchase agreement debt.
|
|
52
|
||
December 31, 2014
|
$ in thousands
|
Agency RMBS
|
Residential Credit
(4)
|
Commercial Credit
(5)
|
Exchangeable Senior Notes
|
Total
|
|||||
|
Investments
|
10,091,989
|
|
7,052,074
|
|
3,659,589
|
|
—
|
|
20,803,652
|
|
|
Cash and cash equivalents
(1)
|
64,603
|
|
51,732
|
|
47,809
|
|
—
|
|
164,144
|
|
|
Derivative assets, at fair value
(2)
|
23,183
|
|
396
|
|
599
|
|
—
|
|
24,178
|
|
|
Other assets
|
111,817
|
|
43,099
|
|
84,127
|
|
—
|
|
239,043
|
|
|
Total assets
|
10,291,592
|
|
7,147,301
|
|
3,792,124
|
|
—
|
|
21,231,017
|
|
|
Repurchase agreements
|
9,018,818
|
|
3,145,408
|
|
1,458,451
|
|
—
|
|
13,622,677
|
|
|
Secured loans
(3)
|
—
|
|
—
|
|
1,250,000
|
|
—
|
|
1,250,000
|
|
|
Asset-backed securities issued by securitization trusts (ABS)
|
—
|
|
2,929,820
|
|
—
|
|
—
|
|
2,929,820
|
|
|
Exchangeable senior notes
|
—
|
|
—
|
|
—
|
|
400,000
|
|
400,000
|
|
|
Derivative liabilities, at fair value
|
254,026
|
|
—
|
|
—
|
|
—
|
|
254,026
|
|
|
Other liabilities
|
56,894
|
|
35,274
|
|
43,476
|
|
—
|
|
135,644
|
|
|
Total liabilities
|
9,329,738
|
|
6,110,502
|
|
2,751,927
|
|
400,000
|
|
18,592,167
|
|
|
Total equity (allocated)
|
961,854
|
|
1,036,799
|
|
1,040,197
|
|
(400,000
|
)
|
2,638,850
|
|
|
Adjustments to calculate repurchase agreement debt-to-equity:
|
||||||||||
|
Net equity in unsecured assets and exchangeable senior notes
(6)
|
—
|
|
(7,677
|
)
|
(193,384
|
)
|
400,000
|
|
198,939
|
|
|
Collateral pledged against Secured loans
|
—
|
|
—
|
|
(1,550,270
|
)
|
—
|
|
(1,550,270
|
)
|
|
Secured loans
|
—
|
|
—
|
|
1,250,000
|
|
—
|
|
1,250,000
|
|
|
Equity related to repurchase agreement debt
|
961,854
|
|
1,029,122
|
|
546,543
|
|
—
|
|
2,537,519
|
|
|
Debt-to-equity ratio
(7)
|
9.4
|
|
5.9
|
|
2.6
|
|
NA
|
|
6.9
|
|
|
Repurchase agreement debt-to-equity ratio
(8)
|
9.4
|
|
3.1
|
|
2.7
|
|
NA
|
|
5.4
|
|
|
(1)
|
Cash and cash equivalents is allocated based on a percentage of equity for Agency RMBS, Residential Credit and Commercial Credit.
|
|
(2)
|
Derivative assets are allocated based on the hedging strategy for each asset class.
|
|
(3)
|
Secured loans are allocated based on amount of collateral pledged.
|
|
(4)
|
Non-Agency RMBS and GSE CRT are considered residential credit.
|
|
(5)
|
CMBS, Commercial Loans and Investments in unconsolidated ventures are considered commercial credit.
|
|
(6)
|
Net equity in unsecured assets and exchangeable senior notes includes commercial loans, investments in unconsolidated ventures and exchangeable senior notes.
|
|
(7)
|
Debt-to-equity ratio is calculated as the ratio of total debt (sum of repurchase agreements, secured loans and exchangeable senior notes) to total equity.
|
|
(8)
|
Repurchase agreement debt-to-equity ratio is calculated as the ratio of repurchase agreements to equity related to repurchase agreement debt.
|
|
53
|
||
Interest Income and Average Earning Asset Yield
The table below presents certain information for our portfolio as of and for the years ended
December 31, 2015
,
2014
and
2013
.
|
|
As of and for the Years Ended
|
|||||||
|
|
December 31,
|
|||||||
|
$ in thousands
|
2015
|
2014
|
2013
|
|||||
|
Average Balances*:
|
||||||||
|
Agency RMBS:
|
||||||||
|
15 year fixed-rate, at amortized cost
|
1,698,573
|
|
1,450,316
|
|
1,897,780
|
|
||
|
30 year fixed-rate, at amortized cost
|
4,368,662
|
|
5,723,270
|
|
10,217,822
|
|
||
|
ARM, at amortized cost
|
446,714
|
|
475,401
|
|
122,225
|
|
||
|
Hybrid ARM, at amortized cost
|
3,219,463
|
|
2,452,062
|
|
758,625
|
|
||
|
MBS-CMO, at amortized cost
|
423,409
|
|
476,636
|
|
496,607
|
|
||
|
Non-Agency RMBS, at amortized cost
|
2,680,493
|
|
3,245,701
|
|
3,593,337
|
|
||
|
GSE CRT, at amortized cost
|
665,471
|
|
478,929
|
|
9,435
|
|
||
|
CMBS, at amortized cost
|
3,173,737
|
|
2,947,733
|
|
2,412,694
|
|
||
|
Residential loans, at amortized cost
|
3,198,666
|
|
2,473,258
|
|
1,006,374
|
|
||
|
Commercial loans, at amortized cost
|
166,150
|
|
109,551
|
|
14,858
|
|
||
|
Average Investment portfolio
|
20,041,338
|
|
19,832,857
|
|
20,529,757
|
|
||
|
Average Portfolio Yields
(1)
:
|
||||||||
|
Agency RMBS:
|
||||||||
|
15 year fixed-rate
|
2.23
|
%
|
2.66
|
%
|
2.32
|
%
|
||
|
30 year fixed-rate
|
2.80
|
%
|
3.05
|
%
|
2.88
|
%
|
||
|
ARM
|
2.30
|
%
|
2.30
|
%
|
2.35
|
%
|
||
|
Hybrid ARM
|
2.13
|
%
|
2.28
|
%
|
2.18
|
%
|
||
|
MBS - CMO
|
3.16
|
%
|
3.56
|
%
|
2.26
|
%
|
||
|
Non-Agency RMBS
|
4.61
|
%
|
4.54
|
%
|
4.59
|
%
|
||
|
GSE CRT
(2)
|
0.54
|
%
|
0.50
|
%
|
5.80
|
%
|
||
|
CMBS
|
4.37
|
%
|
4.47
|
%
|
4.64
|
%
|
||
|
Residential loans
|
3.47
|
%
|
3.57
|
%
|
3.30
|
%
|
||
|
Commercial loans
|
8.36
|
%
|
8.56
|
%
|
9.77
|
%
|
||
|
Average Investment portfolio
|
3.22
|
%
|
3.41
|
%
|
3.32
|
%
|
||
|
*
|
Average amounts for each period are based on weighted month-end balances.
|
|
(1)
|
Average portfolio yield for the period was calculated by dividing interest income, including amortization of premiums and discounts, by our average of the amortized cost of the investments. All yields are annualized.
|
|
(2)
|
GSE CRT average portfolio yield for the year ended December 31,
2015
and
2014
excludes embedded derivative coupon interest recorded as realized and unrealized credit derivative income (loss), net.
|
Our primary source of income is interest earned on our investment portfolio. We had average earning assets of approximately
$20.0 billion
(
2014
:
$19.8 billion
;
2013
:
$20.5 billion
) and earned interest income of
$644.5 million
(
2014
:
$676.6 million
;
2013
:
$682.4 million
) during
2015
. The yield on our average investment portfolio was
3.22%
(
2014
:
3.41%
;
2013
:
3.32%
).
The change in our average assets for
2015
versus
2014
was primarily due to using proceeds from repayments of principal, interest, and sales of securities to repurchase common stock rather than reinvest in new securities. The change in our portfolio yield for
2015
versus
2014
was primarily attributable to portfolio reallocation to lower duration Agency RMBS. The change in our average assets and the portfolio yield for
2014
versus
2013
was primarily attributable to the change in our portfolio reallocation to lower leveraged assets. We continue to evaluate our investment portfolio and make adjustments based on our views of the market opportunities.
|
54
|
||
We compute our effective interest income (non-GAAP measure) and effective yield (non-GAAP measure) by adding GSE CRT embedded derivative coupon interest to our interest income. Effective interest income (non-GAAP measure) was
$669.3 million
(
2014
:
$694.2 million
;
2013
:
$682.4 million
) for the year ended
December 31, 2015
.
For the year ended
December 31, 2015
, our effective yield (non-GAAP measure) was
3.34%
(
2014
:
3.50%
;
2013
:
3.32%
) Our effective yield
declined
in
2015
versus the
2014
period primarily due to decline in the yield on our average investment portfolio.
Our interest income is subject to interest rate risk. Refer to Item 7A. “Quantitative and Qualitative Disclosures about Market Risk” for more information relating to interest rate risk and its impact on our operating results.
The constant prepayment rate ("CPR") of our portfolio impacts the amount of premium and discount on the purchase of securities that is recognized into income. The table below shows the three month CPR for our RMBS and GSE CRT compared to bonds with similar characteristics (“Cohorts”):
|
|
December 31, 2015
|
September 30, 2015
|
|||||||||
|
|
Company
|
Cohort
|
Company
|
Cohort
|
|||||||
|
15 year Agency RMBS
|
10.7
|
|
12.6
|
|
13.1
|
|
14.7
|
|
|||
|
30 year Agency RMBS
|
12.5
|
|
14.0
|
|
14.8
|
|
16.7
|
|
|||
|
Agency Hybrid ARM RMBS
|
13.9
|
|
NA
|
|
15.2
|
|
NA
|
|
|||
|
Non-Agency RMBS
|
12.5
|
|
NA
|
|
15.3
|
|
NA
|
|
|||
|
GSE CRT
|
10.5
|
|
NA
|
|
12.6
|
|
NA
|
|
|||
|
Weighted average CPR
|
12.6
|
|
NA
|
|
14.7
|
|
NA
|
|
|||
Interest Expense and the Cost of Funds
The table below presents certain information related to our financing as of and for the years ended
December 31, 2015
,
2014
and
2013
.
|
|
As of and for the Years Ended
|
|||||||
|
|
December 31,
|
|||||||
|
$ in thousands
|
2015
|
2014
|
2013
|
|||||
|
Average Borrowings*:
|
||||||||
|
Agency RMBS
(1)
|
9,118,307
|
|
9,444,028
|
|
12,107,119
|
|
||
|
Non-Agency RMBS
|
2,439,849
|
|
2,821,132
|
|
2,847,536
|
|
||
|
GSE CRT
|
484,414
|
|
351,900
|
|
6,887
|
|
||
|
CMBS
(1)
|
2,632,338
|
|
2,305,970
|
|
1,900,365
|
|
||
|
Exchangeable senior notes
|
400,000
|
|
400,000
|
|
321,111
|
|
||
|
Asset-backed securities issued by securitization trusts
|
2,779,268
|
|
2,178,362
|
|
916,786
|
|
||
|
Total borrowed funds
|
17,854,176
|
|
17,501,392
|
|
18,099,804
|
|
||
|
Maximum borrowings during the period
(2)
|
18,416,608
|
|
18,202,497
|
|
19,710,901
|
|
||
|
Average Cost of Funds
(3)
:
|
||||||||
|
Agency RMBS
(1)
|
0.39
|
%
|
0.34
|
%
|
0.40
|
%
|
||
|
Non-Agency RMBS
|
1.58
|
%
|
1.54
|
%
|
1.60
|
%
|
||
|
GSE CRT
|
1.73
|
%
|
1.52
|
%
|
1.50
|
%
|
||
|
CMBS
(1)
|
0.93
|
%
|
1.11
|
%
|
1.45
|
%
|
||
|
Exchangeable senior notes
|
5.62
|
%
|
5.62
|
%
|
5.61
|
%
|
||
|
Asset-backed securities issued by securitization trusts
|
2.95
|
%
|
3.13
|
%
|
2.91
|
%
|
||
|
Unhedged cost of funds
(4)
|
1.19
|
%
|
1.13
|
%
|
0.92
|
%
|
||
|
Hedged / Effective cost of funds (non-GAAP measure)
|
2.22
|
%
|
2.27
|
%
|
1.84
|
%
|
||
|
*
|
Average amounts for each period are based on weighted month-end balances.
|
|
(1)
|
Agency RMBS and CMBS average borrowing and cost of funds include borrowings under repurchase agreements and secured loans.
|
|
(2)
|
Amount represents the maximum borrowings at month-end during each of the respective periods.
|
|
55
|
||
|
(3)
|
Average cost of funds is calculated by dividing annualized interest expense by our average borrowings.
|
|
(4)
|
Excludes reclassification of amortization of net deferred losses on de-designated interest rate swaps to repurchase agreement interest expense.
|
Through December 31, 2013, interest expense includes borrowing costs under repurchase agreements, exchangeable senior notes, and asset-backed securities issued by securitization trusts, as well as any hedging costs. Beginning January 1, 2014, we de-designated our interest rate swaps as cash flow hedges. As a result of de-designation, net interest paid or received under our interest rate swaps previously recorded in interest expense on our consolidated statements of operations is now included in gain (loss) on derivative instruments, net. In addition, unrealized swap losses previously included in other comprehensive income are prospectively amortized into interest expense over the remaining term of the interest rate swap, as long as the forecasted transactions that were being hedged are still expected to occur. No reclassifications or adjustments were made to interest expense for the year ended December 31, 2013 as a result of the de-designation.
Our largest expense is interest expense on borrowed funds. For
2015
, we had average borrowed funds of
$17.9 billion
(
2014
:
$17.5 billion
;
2013
:
$18.1 billion
) and total interest expense of
$278.0 million
(
2014
:
$281.9 million
;
2013
:
$332.3 million
). We compute our effective interest expense (non-GAAP measure) and effective cost of funds (non-GAAP measure) by including the net interest component related to our interest rate swaps and excluding the amortization of net deferred losses on de-designated interest rate swaps from our interest expense. Effective interest expense (non-GAAP measure) was
$395.6 million
(
2014
:
$396.5 million
;
2013
:
$332.3 million
) for
2015
.
The change in average borrowed funds and interest expense for
2015
versus
2014
was primarily the result of a decrease in our average repurchase agreement borrowings for Agency RMBS offset by an increase in average borrowings in the form of asset-backed securities issued by securitization trusts.
The change in average borrowed funds and interest expense for
2014
versus
2013
was primarily the result of a decrease in our average repurchase agreement borrowings for Agency RMBS offset by an increase in average borrowings for asset-backed securities. We financed our residential loans-held-for-investment through asset-backed securities issued by consolidated securitization trusts. The number of consolidated securitization trusts increased from five at
December 31, 2013
to ten at
December 31, 2014
.
For the year ended
December 31, 2015
, our cost of funds was
1.56%
(
2014
:
1.61%
;
2013
:
1.84%
). For the year ended
December 31, 2015
, our effective cost of funds (non-GAAP measure) was
2.22%
(
2014
:
2.27%
;
2013
:
1.84%
). The decrease in our cost of funds and effective cost of funds (non-GAAP measure) was primarily due to shifting some of our financing for CMBS from repurchase agreement borrowing to secured loans in
2015
versus
2014
. The increase in effective cost of funds (non-GAAP measure) for
2014
versus
2013
was the result of de-designation of our interest rate swaps.
Net Interest Income
Our net interest income, which equals interest income less interest expense, for the year ended
December 31, 2015
, totaled
$366.5 million
(
2014
:
$394.7 million
;
2013
:
$350.1 million
). Our net interest rate margin for the year ended
December 31, 2015
, which equals the yield on our average assets for the period less the average cost of funds for the period, was
1.66%
(
2014
:
1.80%
;
2013
:
1.48%
). The decrease in net interest income was primarily due to the decline in average investment portfolio yield in
2015
compared to
2014
. The decline in net interest margin was primarily the result of increased average borrowings in the form of asset-backed securities issued by securitization trusts in
2015
versus
2014
.
Our effective net interest income (non-GAAP measure), which equals effective interest income less effective interest expense (non-GAAP measure), for the year ended
December 31, 2015
, totaled
$273.7 million
(
2014
:
$297.7 million
;
2013
:
$350.1 million
). Our effective interest rate margin (non-GAAP measure) for the year ended
December 31, 2015
was
1.12%
(
2014
:
1.23%
;
2013
:
1.48%
). The decrease in effective interest rate margin was primarily due to a decrease in net interest rate margin driven by lower net interest income as discussed above.
The increase in net interest income and net interest margin for
2014
versus
2013
was primarily the result of increasing the size of our investment portfolio and decreasing average borrowed funds in
2014
versus
2013
. The decrease in effective interest rate margin in
2014
versus
2013
was primarily due to de-designation of our interest rate swaps.
Refer to the table in the “Interest Income and Average Earning Asset Yield” section above for changes in average portfolio balance and yields.
Provision for Loan Losses
We established and maintained an allowance for loan losses on residential loans held by consolidated Residential Securitizations based on our estimate of credit losses. We recorded a decrease in our provision for loan losses of
$213,000
for the year ended
December 31, 2015
(
2014
:
$142,000
decrease;
2013
:
$884,000
increase). Our provision for loan losses as of
|
56
|
||
December 31, 2014 was solely for residential loans held-for-investment by consolidated Residential Securitizations. We did not have a provision for loan losses as of December 31, 2015 because we deconsolidated our Residential Securitizations in December 2015.
We evaluate the collectibility of our commercial loans held-for-investment using the factors described in Note 2 - "Summary of Significant Accounting Policies". We determined that no provision for loan losses was required as of
December 31, 2015
and
2014
.
Gain (Loss) on Investments, net
Gain (loss) on investments, net includes (i) gains and losses on sales of our investment portfolio; (ii) the change in fair value of RMBS IOs; (iii) the change in the fair value of GSE CRTs accounted for under the fair value option; and (iv) gain (loss) on deconsolidation of VIEs.
As part of our investment process, all of our mortgage-backed and credit risk transfer securities are continuously reviewed to determine if they continue to meet our risk and return targets. This process involves looking at changing market assumptions and the impact those assumptions will have on the individual securities. We sold securities and recognized a net loss of
$1.0 million
for the year ended
December 31, 2015
(
2014
:
$79.4 million
net loss;
2013
:
$199.4 million
net loss).
We account for RMBS IOs as hybrid financial instruments in their entirety at fair value with changes in fair value recognized in income in the Company's consolidated statement of operations. We recognized a
$558,000
net loss on RMBS IOs for the year ended
December 31, 2015
(
2014
:
$7.7 million
net loss;
2013
:
$16.7 million
net gain).
We have elected the fair value option for GSE CRTs purchased on or after August 24, 2015. We recorded a
$56,000
net loss for the year ended
December 31, 2015
for the changes in fair value of GSE CRTs accounted for under the fair value option.
We recorded a loss of
$19.6 million
in our consolidated statement of operations related to the deconsolidation of our Residential Securitizations in December 2015. The deconsolidation of the Residential Securitizations did not qualify for presentation and disclosure as discontinued operations. The following table presents the components of the loss on deconsolidation.
|
$ in thousands
|
As of December 9, 2015
|
|
|
Gain (loss) related to derecognition of Residential Securitizations, net
|
(13,260
|
)
|
|
Gain (loss) related to remeasurement of retained interest, net
|
3,068
|
|
|
Gain (loss) on sale of the securities, net
|
(9,431
|
)
|
|
Total gain (loss) on deconsolidation of VIEs, net
|
(19,623
|
)
|
Loss on Other-Than-Temporary Impaired Securities
For the years ended
December 31, 2015
,
2014
and
2013
, we did
no
t recognize any losses on other-than-temporarily impaired securities in the consolidated statements of operations. Refer to Note 4 – “Mortgage-Backed and Credit Risk Transfer Securities” of our consolidated financial statements for the assessment of other-than-temporary impairment on our investment securities.
Equity in Earnings of Unconsolidated Ventures
For the year ended
December 31, 2015
, we recorded equity in earnings of unconsolidated ventures of $
12.6 million
(
2014
: $
6.8 million
;
2013
: $
5.4 million
). Equity in earnings of unconsolidated ventures
increased
$
5.8 million
in
2015
compared to
2014
primarily due to higher realized and unrealized gains on underlying portfolio investments than in the 2014 period.
Equity in earnings of unconsolidated ventures increased $
1.4 million
in 2014 compared to 2013 primarily due to higher realized gains on sales of underlying portfolio investments than in the 2013 period.
Gain (Loss) on Derivative Instruments, net
Our objectives in using interest rate derivatives are to add stability to interest expense and to manage our exposure to interest rate movements on our repurchase agreements and secured loans. To accomplish these objectives, we primarily use interest rate derivative instruments, including interest rate swaps, interest rate swaptions, U.S. Treasury futures contracts and TBAs as part of our interest rate risk management strategy. Interest rate swaps involve the receipt of variable-rate amounts from a counterparty in exchange for us making fixed-rate payments over the life of the agreements without exchange of the underlying notional amount. An interest rate swaption provides us the option to enter into an interest rate swap agreement for a
|
57
|
||
predetermined notional amount, stated term and pay and receive interest rates in the future. The premium paid for interest rate swaptions is reported as an asset in our consolidated balance sheets. The premium is valued at an amount equal to the fair value of the swaption that would have the effect of closing the position adjusted for nonperformance risk, if any. TBAs are reported on the balance sheet as an asset or liability at its fair value.
We also use currency forward contracts to help mitigate the potential impact of changes in foreign currency exchange rates on our investments denominated in foreign currencies.
Effective December 31, 2013, we elected to discontinue hedge accounting for our interest rate swap agreements by de-designating the swaps as cash flow hedges. As a result of the de-designation, the accounting treatment for interest rate swap agreements changed prospectively. Refer to Note 8 - "Derivatives and Hedging Activities" of our consolidated financial statements for further information.
The tables below summarize our realized and unrealized gain (loss) on derivative instruments, net for the following periods:
|
$ in thousands
|
Year ended December 31, 2015
|
||||||||||
|
Derivative
not designated as
hedging instrument
|
Realized gain (loss) on settlement, termination, expiration or
exercise, net
|
Contractual
interest expense
|
Unrealized
gain (loss), net
|
Gain (loss) on derivative instruments, net
|
|||||||
|
Interest Rate Swaps
|
(31,881
|
)
|
(184,373
|
)
|
(554
|
)
|
(216,808
|
)
|
|||
|
Interest Rate Swaptions
|
(10,328
|
)
|
—
|
|
8,521
|
|
(1,807
|
)
|
|||
|
TBAs
|
(2,292
|
)
|
—
|
|
558
|
|
(1,734
|
)
|
|||
|
Futures Contracts
|
(943
|
)
|
—
|
|
(90
|
)
|
(1,033
|
)
|
|||
|
Currency Forward Contracts
|
1,172
|
|
—
|
|
1,162
|
|
2,334
|
|
|||
|
Total
|
(44,272
|
)
|
(184,373
|
)
|
9,597
|
|
(219,048
|
)
|
|||
|
$ in thousands
|
Year ended December 31, 2014
|
||||||||||
|
Derivative
not designated as
hedging instrument
|
Realized gain (loss) on settlement, termination, expiration or
exercise, net
|
Contractual
interest expense
|
Unrealized
gain (loss), net
|
Gain (loss) on derivative instruments, net
|
|||||||
|
Interest Rate Swaps
|
(28,758
|
)
|
(199,783
|
)
|
(223,944
|
)
|
(452,485
|
)
|
|||
|
Interest Rate Swaptions
|
(23,275
|
)
|
—
|
|
10,906
|
|
(12,369
|
)
|
|||
|
TBAs
|
(10,843
|
)
|
—
|
|
(558
|
)
|
(11,401
|
)
|
|||
|
Futures Contracts
|
(11,489
|
)
|
—
|
|
(2,502
|
)
|
(13,991
|
)
|
|||
|
Currency Forward Contracts
|
2,178
|
|
—
|
|
599
|
|
2,777
|
|
|||
|
Total
|
(72,187
|
)
|
(199,783
|
)
|
(215,499
|
)
|
(487,469
|
)
|
|||
|
$ in thousands
|
Year ended December 31, 2013
|
||||||||||
|
Derivative instrument
|
Realized gain (loss) on settlement, termination, expiration or
exercise, net
|
Contractual
interest expense
|
Unrealized
gain (loss), net
|
Gain (loss) on derivative instruments, net
|
|||||||
|
Interest Rate Swaps Ineffectiveness
|
—
|
|
—
|
|
535
|
|
535
|
|
|||
|
Interest Rate Swaptions
|
56,279
|
|
—
|
|
(17,048
|
)
|
39,231
|
|
|||
|
Futures Contracts
|
(2,353
|
)
|
—
|
|
2,590
|
|
237
|
|
|||
|
Total
|
53,926
|
|
—
|
|
(13,923
|
)
|
40,003
|
|
|||
|
58
|
||
As of
December 31, 2015
and
2014
, we held the following interest rate swaps whereby we receive interest at a one-month and three-month LIBOR rate:
|
$ in thousands
|
December 31, 2015
|
December 31, 2014
|
|||||||||||||||||||
|
Derivative instrument
|
Notional Amounts
(1)
|
Average Fixed Pay Rate
|
Average Receive Rate
|
Average Maturity (Years)
|
Notional Amounts
(2)
|
Average Fixed Pay Rate
|
Average Receive Rate
|
Average Maturity (Years)
|
|||||||||||||
|
Interest Rate Swaps
|
9,850,000
|
|
2.07
|
%
|
0.36
|
%
|
3.65
|
9,400,000
|
|
2.08
|
%
|
0.16
|
%
|
3.76
|
|||||||
|
(1)
|
Excluding notional amounts for interest rate swaps with forward start date of February 2016, May 2016 and June 2016.
|
|
(2)
|
Excluding notional amounts for interest rate swaps with forward start date of February 2015 and February 2016
|
Realized and Unrealized Credit Derivative Income (Loss), net
The table below summarizes the components of realized and unrealized credit derivative income (loss) for the years ended
December 31, 2015
,
2014
and
2013
.
|
|
Years Ended December 31,
|
|||||||
|
$ in thousands
|
2015
|
2014
|
2013
|
|||||
|
CDS premium income
|
723
|
|
1,351
|
|
1,992
|
|
||
|
Realized gain (loss) on settlement of CDS
|
1,044
|
|
—
|
|
—
|
|
||
|
Change in fair value of CDS
|
(396
|
)
|
(258
|
)
|
(865
|
)
|
||
|
GSE CRT embedded derivative coupon interest
|
24,822
|
|
17,536
|
|
—
|
|
||
|
Realized gain (loss) on settlement of GSE CRT embedded derivatives
|
(2,184
|
)
|
—
|
|
—
|
|
||
|
Change in fair value of GSE CRT embedded derivatives
|
(4,227
|
)
|
(21,495
|
)
|
—
|
|
||
|
Total
|
19,782
|
|
(2,866
|
)
|
1,127
|
|
||
Other Investment Income (Loss), net
Other investment income (loss), net primarily consists of quarterly dividends from FHLBI stock and foreign exchange rate gains and losses related to commercial loan investments denominated in a foreign currency.
Expenses
For the year ended
December 31, 2015
, we incurred management fees of
$38.6 million
(
2014
:
$37.6 million
;
2013
:
$42.6 million
), which are payable to our Manager under our management agreement. The increase in 2015 management fees of $1.0 million is primarily due to the full year impact of our 2014 Series B Preferred Stock offering and the impact of the July 2015 change in our fee calculation, which was partially offset by distributions in excess of earnings and the repurchase of 9.5 million shares of common stock in the second half of 2015. Refer to Note 11 – “Related Party Transactions” of our consolidated financial statements for a discussion of our relationship with our Manager and a description of how our fees are calculated.
Management fees decreased from
$42.6 million
in
2013
to
$37.6 million
in
2014
primarily due to a decrease in retained earnings and stock repurchases of
$21.1 million
during the three months ended March 31, 2014 and
$160.5 million
during the three months ended
December 31, 2013
.
For the year ended
December 31, 2015
, our general and administrative expenses not covered under our management agreement amounted to
$7.8 million
(
2014
:
$9.2 million
;
2013
:
$8.4 million
). General and administrative expenses not covered under our management agreement primarily consist of directors and officers insurance, legal costs, accounting, auditing and tax services, filing fees, organization expenses associated with our consolidated securitization trusts and miscellaneous general and administrative costs. During
2015
, the Company incurred restatement-related expenses for third party consulting, accounting, auditing and legal fees of approximately $950,000. During
2014
, the Company incurred approximately $1.0 million of offering costs related to the Company's consolidated Residential Securitizations. Excluding restatement-related expenses in
2015
and Residential Securitization offering costs in
2014
, general and administrative expenses decreased approximately $1.4 million in
2015
primarily due to lower legal and transaction costs associated with new commercial loans in
2015
and higher income tax expense associated with our taxable REIT subsidiary in
2014
. The increase in
2014
general and administrative costs vs. 2013 was primarily attributable to increased costs for audit, tax, and accounting services due to the change in our portfolio composition.
|
59
|
||
For the year ended
December 31, 2015
, consolidated securitization trust expenses totaled
$8.2 million
(
2014
:
$6.1 million
;
2013
:
$2.1 million
). Consolidated securitization trust expenses consist of direct operating expenses incurred by consolidated Residential Securitizations. The Company deconsolidated its Residential Securitizations in December 2015. Prior to the deconsolidation, the Company consolidated eleven Residential Securitizations in 2015; ten Residential Securitizations as of December 31, 2014; and five Residential Securitizations as of December 31, 2013. The increase in securitization trust expenses for the year ended
December 31, 2015
is primarily due to the full year impact of Residential Securitizations consolidated in 2014. The increase in securitization trust expenses for the year ended
December 31, 2014
was primarily due to the increase in the number of consolidated Residential Securitizations in 2014 versus 2013, as well as the full-year impact of Residential Securitizations consolidated in 2013.
Net Income (Loss) after Preferred Dividends and Return on Average Equity
For the year ended
December 31, 2015
, our net income after preferred dividends was
$82.3 million
(
2014
:
$248.1 million
net loss;
2013
:
$149.0 million
net income) and our annualized income on average equity was
3.53%
(
2014
:
10.27%
loss;
2013
:
5.78%
income). The change in net income (loss) after preferred dividends and return on average equity was primarily attributable to realized and unrealized losses on derivatives instruments of
$219.0 million
in the
2015
period versus
$487.5 million
in the
2014
period. The change in net income (loss) after preferred dividends and return on average equity in the 2014 period versus 2013 period was primarily the result of the de-designation of interest rate swaps and realized losses on expired unexercised interest rate swaptions. As a result of the de-designation of our interest rate swaps, beginning January 1, 2014 the changes in the fair value of our interest rate swaps are included in net income as opposed to other comprehensive income. For the year ended
December 31, 2015
, we recognized unrealized losses for the change in fair value of our interest rates swaps of
$554,000
(
2014
:
$223.9 million
). In addition, during the year ended
December 31, 2015
, we recognized amortization of net deferred losses on de-designated interest rate swaps previously recognized in other comprehensive income of
$66.8 million
(
2014
:
$85.2 million
).
Liquidity and Capital Resources
Liquidity is a measurement of our ability to meet potential cash requirements, including ongoing commitments to pay dividends, fund investments, repayment of borrowings and other general business needs. Our primary sources of funds for liquidity consist of the net proceeds from our common and preferred equity offerings, net cash provided by operating activities, proceeds from repurchase agreements and other financing arrangements and future issuances of equity and/or debt securities.
We currently believe that we have sufficient liquidity and capital resources available for the acquisition of additional investments, repayments on borrowings, margin requirements and the payment of cash dividends as required for continued qualification as a REIT. We generally maintain liquidity to pay down borrowings under repurchase arrangements to reduce borrowing costs and otherwise efficiently manage our long-term investment capital. Because the level of these borrowings can be adjusted on a daily basis, the level of cash and cash equivalents carried on our consolidated balance sheets is significantly less important than our potential liquidity available under borrowing arrangements. However, there can be no assurance that we will maintain sufficient levels of liquidity to meet any margin calls.
We held cash and cash equivalents of
$53.2 million
at
December 31, 2015
(
2014
:
$164.1 million
). Our cash and cash equivalents decreased due to normal fluctuations in cash balances related to the timing of principal and interest payments, repayments of debt, and asset purchases and sales.
Our operating activities provided net cash of approximately
$358.6 million
for the year ended
December 31, 2015
(
2014
:
$379.7 million
;
2013
:
$490.4 million
). Cash provided by operating activities decreased due to the decline in our average assets during the year ended
December 31, 2015
as compared to the year ended
December 31, 2014
. During the year ended
December 31, 2014
as compared to the year ended
December 31, 2013
, the cash provided by operating activities also decreased due to the decline in our average assets, as well as slower prepayment speeds on our MBS and GSE CRT portfolio.
Our investing activities provided net cash of
$1.2 billion
for the year ended
December 31, 2015
(
2014
: used net cash of
$912.4 million
;
2013
: used net cash of
$2.3 billion
). During the year ended
December 31, 2015
we utilized cash to purchase
$2.4 billion
of MBS and GSE CRT securities and
$372.3 million
of residential loans. In addition, during the year ended
December 31, 2015
we originated or purchased commercial loans of
$158.0 million
. Cash used to fund these purchases was more than offset by proceeds from MBS and GSE CRT sales of
$907.2 million
, principal payments from MBS and GSE CRT securities of
$2.6 billion
, principal payments from residential loans held-for-investment of
$549.6 million
and principal repayments from commercial loans held-for investment of
$92.8 million
.
During the year ended
December 31, 2014
we utilized cash to purchase
$4.3 billion
of MBS and GSE CRT securities and
$1.8 billion
of residential loans. In addition, during the year ended
December 31, 2014
, we originated or purchased commercial loans of
$83.5 million
. Cash used to fund these purchases was partially offset by proceeds from MBS and GSE
|
60
|
||
CRT sales of
$3.3 billion
, principal payments from MBS and GSE CRT securities of
$1.9 billion
and principal payments from residential loans held-for-investment of
$255.7 million
.
During the year ended
December 31, 2013
we utilized cash to purchase
$8.3 billion
of MBS and GSE CRT securities and
$1.9 billion
of residential loans. In addition, we originated commercial loans of $63.7 million. Cash used to fund these purchases was partially offset by proceeds from MBS sales of
$5.0 billion
, principal payments from MBS of
$2.8 billion
and principal payments from residential loans held-for-investment of
$44.0 million
.
Our financing activities for the year ended
December 31, 2015
primarily consisted of net principal repayments on our repurchase agreements of
$1.5 billion
and net principal repayments of ABS issued by securitization trusts of
$182.1 million
, offset by net proceeds from our secured FHLBI advances of
$400.0 million
. In addition, we paid dividends and distributions of
$239.4 million
and repurchased
9.5 million
shares of common stock for
$125.6 million
. We also raised approximately
$191,000
in equity from our dividend reinvestment and share purchase plan (“DRSPP”).
Our financing activities for the year ended
December 31, 2014
primarily consisted of net principal repayments on our repurchase agreements of
$1.8 billion
, offset by net proceeds from our secured FHLBI advances of
$1.25 billion
, net proceeds from ABS issued by securitization trusts of
$1.3 billion
, and net proceeds of
$149.9 million
million from our Series B Preferred Stock offering. In addition, we paid dividends and distributions of
$264.5 million
and repurchased
1.4 million
shares of common stock for
$21.1 million
. We also raised approximately
$256,000
in equity from our dividend reinvestment and share purchase plan DRSPP.
Our financing activities for the year ended
December 31, 2013
primarily consisted of net proceeds from ABS issued by securitization trusts of
$1.6 billion
; net proceeds from the issuance of exchangeable senior notes of
$400.0 million
; and proceeds from our common stock offering and our DRSPP totaling
$396.5 million
in equity, partially offset by net principal repayments on our repurchase agreements of
$240.9 million
. In addition, we paid dividends and distributions of
$332.8 million
and repurchased
10.7 million
shares of common stock for
$160.5 million
.
As of
December 31, 2015
, our wholly-owned subsidiary, IAS Services LLC, had
$1.65 billion
in outstanding secured advances from the FHLBI. As of
December 31, 2015
, the FHLBI advances were collateralized by CMBS and Agency RMBS with a fair value of
$1.4 billion
and
$558.9 million
, respectively.
As of
December 31, 2015
, the average margin requirement (weighted by borrowing amount), or the percentage amount by which the collateral value must exceed the loan amount (also refer to as the “haircut”) under our repurchase agreements was
4.5%
for Agency RMBS,
19.9%
for non-Agency RMBS,
25.7%
for GSE CRT, and
18.7%
for CMBS. Across our repurchase agreement facilities, the haircuts range from a low of
3%
to a high of
20%
for Agency RMBS, a low of
10%
to a high of
50%
for non-Agency RMBS, a low of
25%
to a high of
30%
for GSE CRT, and a low of
10%
to a high of
25%
for CMBS. Our effective cost of funds (non-GAAP measure) was
2.22%
and
2.27%
as of
December 31, 2015
and
2014
, respectively. Declines in the value of our securities portfolio can trigger margin calls by our lenders under our repurchase agreements. An event of default or termination event would give some of our counterparties the option to terminate all repurchase transactions existing with us and require any amount due by us to the counterparties to be payable immediately.
Our total debt-to-equity
ratio, which
includes longer term financing, was
6.3
x
as of
December 31, 2015
(
2014
:
6.9
x)
. The decrease in our total debt-to-equity ratio from 2014 to 2015 was primarily due to the deconsolidation of our Residential Securitizations in December 2015. Our leverage was also impacted by the repayment of repurchase agreements as we used cash from principal repayments and maturities to repurchase common stock rather than reinvest in unencumbered assets. Improving our balance sheet by diversifying our liabilities away from repurchase agreements has been a focus of management over the past two years. Since we began using other longer-term means of financing our investments, such as our exchangeable senior notes and secured loans, we have reduced our reliance on repurchase agreements. Our weighted average remaining maturity on borrowings has increased from 60 days as of December 31, 2013 to
389
days as of
December 31, 2015
.
In December 2011, our board of directors approved a share repurchase program to purchase up to
7,000,000
shares of our common shares with no stated expiration date. In December 2013, our board of directors approved an additional share repurchase of up to
20,000,000
of our common shares with no expiration date. Shares of the our common stock may be purchased in the open market, including through block purchases, or through privately negotiated transactions, or pursuant to any trading plan that may be adopted in accordance with Rules 10b5-1 and 10b-18 of the Securities Exchange Act of 1934, as amended. The timing, manner, price and amount of any repurchases will be determined at our discretion and the program may be suspended, terminated or modified at any time for any reason. The program does not obligate us to acquire any specific number of shares, and all repurchases will be made in accordance with Rule 10b-18, which sets certain restrictions on the method, timing, price and volume of stock repurchases. On February 18, 2016, our board of directors authorized an additional 15,000,000 shares of common stock for the existing share repurchase program with no stated expiration date.
During the twelve months ended
December 31, 2015
, we repurchased
9,539,251
(
2014
:
1,438,213
) shares of our common stock at an average repurchase price of
$13.17
(
2014
:
$14.69
) per share for a net cost of
$125.6 million
(
2014
:
$21.1 million
),
|
61
|
||
including acquisition expenses. As of
December 31, 2015
, we had authority to purchase
5,302,533
shares of our common stock through our share repurchase program.
In 2011, we implemented the DRSPP. We have registered and reserved for issuance
15,000,000
shares of our common stock under the DRSPP. Under the terms of the DRSPP, stockholders who participate in the DRSPP may purchase shares of our common stock directly from us, in cash investments up to
$10,000
, or greater than
$10,000
if we grant a request for waiver. At our sole discretion, we may accept optional cash investments in excess of
$10,000
per month, which may qualify for a discount from the market price of 0% to 3%. The DRSPP participants may also automatically reinvest all or a portion of their dividends for additional shares of our stock. During the year ended
December 31, 2015
, we issued
12,945
(
2014
:
15,505
) shares of common stock at an average price of
$14.75
(
2014
:
$16.52
) under the DRSPP. We received total proceeds of approximately
$191,000
(
2014
:
$256,000
) from the issuance of these shares.
Effects of Margin Requirements, Leverage and Credit Spreads
Our securities have values that fluctuate according to market conditions and, as discussed above, the market value of our securities will decrease as prevailing interest rates or credit spreads increase. When the value of the securities pledged to secure a repurchase loan decreases to the point where the positive difference between the collateral value and the loan amount is less than the haircut, our lenders may issue a “margin call,” which means that the lender will require us to pay the margin call in cash or pledge additional collateral to meet that margin call. Under our repurchase facilities, our lenders have full discretion to determine the value of the securities we pledge to them. Most of our lenders will value securities based on recent trades in the market. Lenders also issue margin calls as the published current principal balance factors change on the pool of mortgages underlying the securities pledged as collateral when scheduled and unscheduled paydowns are announced monthly.
We experience margin calls in the ordinary course of our business. In seeking to effectively manage the margin requirements established by our lenders, we maintain a position of cash and unpledged securities. We refer to this position as our liquidity. The level of liquidity we have available to meet margin calls is directly affected by our leverage levels, our haircuts and the price changes on our securities. If interest rates increase as a result of a yield curve shift or for another reason or if credit spreads widen, then the prices of our collateral (and our unpledged assets that constitute our liquidity) will decline, we will experience margin calls, and we will use our liquidity to meet the margin calls. There can be no assurance that we will maintain sufficient levels of liquidity to meet any margin calls. If our haircuts increase, our liquidity will proportionately decrease. In addition, if we increase our borrowings, our liquidity will decrease by the amount of additional haircut on the increased level of indebtedness.
We intend to maintain a level of liquidity in relation to our assets that enables us to meet reasonably anticipated margin calls but that also allows us to be substantially invested in securities. We may misjudge the appropriate amount of our liquidity by maintaining excessive liquidity, which would lower our investment returns, or by maintaining insufficient liquidity, which would force us to liquidate assets into unfavorable market conditions and harm our results of operations and financial condition.
We are subject to financial covenants in connection with our lending, derivatives and other agreements we enter into in the normal course of our business. We intend to continue to operate in a manner which complies with all of our financial covenants. Our lending and derivative agreements provide that we may be declared in default of our obligations if our leverage ratio exceeds certain thresholds and we fail to maintain stockholders’ equity or market value above certain thresholds over specified time periods.
Forward-Looking Statements Regarding Liquidity
Based upon our current portfolio, leverage rate and available borrowing arrangements, we believe that cash flow from operations and available borrowing capacity will be sufficient to enable us to meet anticipated short-term (one year or less) liquidity requirements to fund our investment activities, pay fees under our management agreement, fund our distributions to stockholders and for other general corporate expenses.
Our ability to meet our long-term (greater than one year) liquidity and capital resource requirements will be subject to obtaining additional debt financing. We may increase our capital resources by obtaining long-term credit facilities or through public or private offerings of equity or debt securities, possibly including classes of preferred stock, common stock, and senior or subordinated notes. Such financing will depend on market conditions for capital raises and our ability to invest such offering proceeds. If we are unable to renew, replace or expand our sources of financing on substantially similar terms, it may have an adverse effect on our business and results of operations.
|
62
|
||
Contractual Obligations
We have entered into an agreement with our Manager pursuant to which our Manager is entitled to receive a management fee and the reimbursement of certain expenses. The management fee is calculated and payable quarterly in arrears in an amount equal to 1.50% of our stockholders’ equity, per annum. Our Manager uses the proceeds from its management fee in part to pay compensation to its officers and personnel who, notwithstanding that certain of those individuals are also our officers, receive no cash compensation directly from us. We are required to reimburse our Manager for operating expenses related to us incurred by our Manager, including certain salary expenses and other expenses relating to legal, accounting, due diligence and other services. Expense reimbursements to our Manager are made in cash on a monthly basis following the end of each month. Our reimbursement obligation is not subject to any dollar limitation. Refer to Note 11 – “Related Party Transactions” of our consolidated financial statements for details of our reimbursements to our Manager.
Contractual Commitments
As of
December 31, 2015
, we had the following contractual commitments and commercial obligations:
|
|
Payments Due by Period
|
|||||||||||||
|
$ in thousands
|
Total
|
Less than 1
year
|
1-3 years
|
3-5 years
|
After 5
years
|
|||||||||
|
Repurchase agreements
|
12,126,048
|
|
12,126,048
|
|
—
|
|
—
|
|
—
|
|
||||
|
Secured loans
|
1,650,000
|
|
100,000
|
|
—
|
|
300,000
|
|
1,250,000
|
|
||||
|
Unfunded investments in unconsolidated ventures
|
21,079
|
|
4,809
|
|
16,270
|
|
—
|
|
—
|
|
||||
|
Exchangeable senior notes
|
400,000
|
|
—
|
|
400,000
|
|
—
|
|
—
|
|
||||
|
Participation interest
|
150
|
|
150
|
|
—
|
|
—
|
|
—
|
|
||||
|
Commercial loans
|
2,128
|
|
—
|
|
2,128
|
|
—
|
|
—
|
|
||||
|
Total
(1)
|
14,199,405
|
|
12,231,007
|
|
418,398
|
|
300,000
|
|
1,250,000
|
|
||||
|
(1)
|
Excluded from total contractual obligations are the amounts due to our Manager under our management agreement, as those obligations do not have fixed and determinable payments. Refer to "Contractual Obligations" above for further details.
|
As of
December 31, 2015
, we have approximately
$16.4 million
,
$50.7 million
and
$77.2 million
in contractual interest payments related to our repurchase agreements, exchangeable senior notes and secured loans, respectively.
Off-Balance Sheet Arrangements
We have committed to invest up to
$121.8 million
in unconsolidated ventures sponsored by an affiliate of our Manager. The unconsolidated ventures are structured as partnerships, and we invest in the partnerships as a limited partner. As of
December 31, 2015
,
$100.7 million
of our commitment has been called. We are committed to fund
$21.1 million
in additional capital to fund future investments and cover future expenses should they occur.
We also utilize credit derivatives, such as credit default swaps, to provide credit event protection based on financial indices or specific security in exchange for receiving a fixed-rate fee or premium over the term of the contract. These instruments enable us to synthetically assume the credit risk of a reference security, portfolio of securities or index of securities. The counterparty pays a premium to us and we agree to make a payment to compensate the counterparty for losses upon the occurrence of a specified credit event. Although contract specific, credit events generally include bankruptcy, failure to pay, restructuring, obligation acceleration, obligation default, or repudiation/moratorium. Upon the occurrence of a defined credit event, the difference between the value of the reference securities and the CDS’s notional amount is recorded as realized loss in the consolidated statements of operations.
As of
December 31, 2015
, we have unfunded commitments on commercial loans of
$2.1 million
(
2014
:
$5.0 million
)
Stockholders’ Equity
During the year ended
December 31, 2015
, we issued
12,945
(
2014
:
15,505
) shares of common stock at an average price of
$14.75
(
2014
:
$16.52
) under the DRSPP. We received total proceeds of approximately
$191,000
(
2014
:
$256,000
).
During the twelve months ended
December 31, 2015
, we repurchased
9,539,251
(
2014
:
1,438,213
) shares of our common stock at an average repurchase price of
$13.17
(
2014
:
$14.69
) per share for a net cost of
$125.6 million
(
2014
:
$21.1 million
), including acquisition expenses. As of
December 31, 2015
, we had authority to purchase
5,302,533
shares of our common stock through this program.
|
63
|
||
Share-Based Compensation
We established the 2009 Equity Incentive Plan for grants of common stock and other equity based awards to our non-executive directors and the executive officers and employees of our Manager and its affiliates (the “Incentive Plan”). Under the Incentive Plan, a total of
1,000,000
shares of common stock are currently reserved for issuance. Unless terminated earlier, the Incentive Plan will terminate in
2019
, but will continue to govern the unexpired awards.
We recognized compensation expense of approximately
$340,000
(
2014
:
$282,000
;
2013
:
$165,000
) related our non-executive directors for the year ended
December 31, 2015
. During the year ended
December 31, 2015
, we issued
23,776
shares (
2014
:
14,632
shares;
2013
:
8,946
shares) of common stock pursuant to the Incentive Plan to our non-executive directors. The fair market value of the shares granted was determined by the closing stock market price on the date of the grant.
We recognized compensation expense of approximately
$219,000
(
2014
:
$290,000
;
2013
:
$197,000
) for the year ended
December 31, 2015
related to awards to employees of our Manager and its affiliates which is reimbursed by our Manager under the terms of our management agreement.
The following table summarizes the activity related to restricted stock units to employees of the Manager and its affiliates for the year ended
December 31, 2015
.
|
Year Ended December 31,
|
||||||
|
2015
|
||||||
|
|
Restricted Stock Units
|
Weighted Average Grant Date Fair Value
(1)
|
||||
|
Unvested at the beginning of the year
|
45,545
|
|
$
|
18.67
|
|
|
|
Shares granted during the year
|
17,652
|
|
15.97
|
|
||
|
Shares forfeited during the year
|
(4,600
|
)
|
(17.26
|
)
|
||
|
Shares vested during the year
|
(17,783
|
)
|
(19.53
|
)
|
||
|
Unvested at the end of the year
|
40,814
|
|
$
|
17.29
|
|
|
|
(1)
|
The grant date fair value of restricted stock awards is based on the closing market price of our common stock at the grant date.
|
Dividends
We intend to continue to make regular quarterly distributions to holders of our common stock and preferred stock. U.S. federal income tax law generally requires that a REIT distribute at least 90% of its REIT taxable income annually, determined without regard to the deduction for dividends paid and excluding net capital gains, and that it pay tax at regular corporate rates to the extent that it annually distributes less than 100% of its taxable income. Before we pay any dividend, whether for U.S. federal income tax purposes or otherwise, we must first meet both our operating requirements and debt service on our repurchase agreements and other debt payable. If our cash available for distribution is less than our taxable income, we could be required to sell assets or borrow funds to make cash distributions, or we may make a portion of the required distribution in the form of a taxable stock distribution or distribution of debt securities.
Inflation
Virtually all of our assets and liabilities are sensitive to interest rates. As a result, interest rates and other factors influence our performance far more than inflation. Changes in interest rates do not necessarily correlate with inflation rates or changes in inflation rates.
Unrelated Business Taxable Income
We have not engaged in transactions that would result in a portion of our income being treated as unrelated business taxable income.
|
64
|
||
Other Matters
We believe that we satisfied each of the asset tests in Section 856(c)(4) of the Internal Revenue Code of 1986, as amended (the "Code") at the end of each calendar quarter in 2015. We also believe that our revenue qualifies for the 75% source of income test and for the 95% source of income test rules for the period ended
December 31, 2015
. Consequently, we believe we met the REIT income and asset test as of
December 31, 2015
. We also met all REIT requirements regarding the ownership of our common stock and the distribution of dividends of our net income as of
December 31, 2015
. Therefore, as of
December 31, 2015
, we believe that we qualified as a REIT under the Code.
At all times, we intend to conduct our business so that neither we nor our Operating Partnership nor the subsidiaries of our Operating Partnership are required to register as an investment company under the 1940 Act. If we were required to register as an investment company, then our use of leverage would be substantially reduced. Because we are a holding company that conducts our business through our Operating Partnership and the Operating Partnership’s wholly-owned or majority-owned subsidiaries, the securities issued by these subsidiaries that are excepted from the definition of “investment company” under Section 3(c)(1) or Section 3(c)(7) of the 1940 Act, together with any other investment securities the Operating Partnership may own, may not have a combined value in excess of 40% of the value of the Operating Partnership’s total assets (exclusive of U.S. government securities and cash items) on an unconsolidated basis. This requirement limits the types of businesses in which we are permitted to engage in through our subsidiaries. In addition, we believe neither we nor the Operating Partnership are considered an investment company under Section 3(a)(1)(A) of the 1940 Act because they do not engage primarily or hold themselves out as being engaged primarily in the business of investing, reinvesting or trading in securities. Rather, through the Operating Partnership’s wholly-owned or majority-owned subsidiaries, we and the Operating Partnership are primarily engaged in the non-investment company businesses of these subsidiaries. IAS Asset I LLC and certain of the Operating Partnership’s other subsidiaries that we may form in the future rely upon the exclusion from the definition of “investment company” under the 1940 Act provided by Section 3(c)(5)(C) of the 1940 Act, which is available for entities “primarily engaged in the business of purchasing or otherwise acquiring mortgages and other liens on and interests in real estate.” This exclusion generally requires that at least 55% of each subsidiary’s portfolio be comprised of qualifying assets and at least 80% be comprised of qualifying assets and real estate-related assets (and no more than 20% comprised of miscellaneous assets). We calculate that as of
December 31, 2015
, we conducted our business so as not to be regulated as an investment company under the 1940 Act.
The primary components of our market risk are related to interest rate, principal prepayment and market value. While we do not seek to avoid risk completely, we believe the risk can be quantified from historical experience and we seek to actively manage that risk, to earn sufficient compensation to justify taking those risks and to maintain capital levels consistent with the risks we undertake.
Interest Rate Risk
Interest rate risk is highly sensitive to many factors, including governmental, monetary and tax policies, domestic and international economic and political considerations, and other factors beyond our control. We are subject to interest rate risk in connection with our investments and our repurchase agreements. Our repurchase agreements are typically of limited duration and will be periodically refinanced at current market rates. We mitigate this risk through utilization of derivative contracts, primarily interest rate swap agreements, TBAs and futures contracts.
Interest Rate Effect on Net Interest Income
Our operating results depend in large part upon differences between the yields earned on our investments and our cost of borrowing and interest rate hedging activities. Most of our repurchase agreements provide financing based on a floating rate of interest calculated on a fixed spread over LIBOR. The fixed spread will vary depending on the type of underlying asset which collateralizes the financing. Accordingly, the portion of our portfolio which consists of floating interest rate assets are match-funded utilizing our expected sources of short-term financing, while our fixed interest rate assets are not match-funded. During periods of rising interest rates, the borrowing costs associated with our investments tend to increase while the income earned on our fixed interest rate investments may remain substantially unchanged. This increase in borrowing costs results in the narrowing of the net interest spread between the related assets and borrowings and may even result in losses. Further, during this portion of the interest rate and credit cycles, defaults could increase and result in credit losses to us, which could adversely affect our liquidity and operating results. Such delinquencies or defaults could also have an adverse effect on the spread between interest-earning assets and interest-bearing liabilities.
Hedging techniques are partly based on assumed levels of prepayments of our RMBS. If prepayments are slower or faster than assumed, the life of the RMBS will be longer or shorter, which would reduce the effectiveness of any hedging strategies
|
65
|
||
we may use and may cause losses on such transactions. Hedging strategies involving the use of derivative securities are highly complex and may produce volatile returns.
Interest Rate Effects on Fair Value
Another component of interest rate risk is the effect that changes in interest rates will have on the market value of the assets that we acquire. We face the risk that the market value of our assets will increase or decrease at different rates than those of our liabilities, including our hedging instruments.
We primarily assess our interest rate risk by estimating the duration of our assets and the duration of our liabilities. Duration measures the market price volatility of financial instruments as interest rates change. We generally calculate duration using various financial models and empirical data. Different models and methodologies can produce different duration numbers for the same securities.
The impact of changing interest rates on fair value can change significantly when interest rates change materially. Therefore, the volatility in the fair value of our assets could increase significantly in the event interest rates change materially. In addition, other factors impact the fair value of our interest rate-sensitive investments and hedging instruments, such as the shape of the yield curve, market expectations as to future interest rate changes and other market conditions. Accordingly, changes in actual interest rates may have a material adverse effect on us.
Prepayment Risk
As we receive prepayments of principal on our investments, premiums paid on these investments are amortized against interest income. In general, an increase in prepayment rates will accelerate the amortization of purchase premiums, thereby reducing the interest income earned on the investments. Conversely, discounts on such investments are accreted into interest income. In general, an increase in prepayment rates will accelerate the accretion of purchase discounts, thereby increasing the interest income earned on the investments.
Extension Risk
We compute the projected weighted-average life of our investments based upon assumptions regarding the rate at which the borrowers will prepay the underlying mortgages. In general, when a fixed-rate or hybrid adjustable-rate security is acquired with borrowings, we may, but are not required to, enter into an interest rate swap agreement or other hedging instrument that effectively fixes our borrowing costs for a period close to the anticipated average life of the fixed-rate portion of the related assets. This strategy is designed to protect us from rising interest rates, because the borrowing costs are fixed for the duration of the fixed-rate portion of the related target asset.
However, if prepayment rates decrease in a rising interest rate environment, then the life of the fixed-rate portion of the related assets could extend beyond the term of the swap agreement or other hedging instrument. This could have a negative impact on our results from operations, as borrowing costs would no longer be fixed after the end of the hedging instrument, while the income earned on the hybrid adjustable-rate assets would remain fixed. This situation may also cause the market value of our hybrid adjustable-rate assets to decline, with little or no offsetting gain from the related hedging transactions. In extreme situations, we may be forced to sell assets to maintain adequate liquidity, which could cause us to incur losses.
Market Risk
Market Value Risk
Our available-for-sale securities are reflected at their estimated fair value with unrealized gains and losses excluded from earnings and reported in other comprehensive income pursuant to ASC Topic 320. The estimated fair value of these securities fluctuates primarily due to changes in interest rates and other factors. Generally, in a rising interest rate environment, the estimated fair value of these securities would be expected to decrease; conversely, in a decreasing interest rate environment, the estimated fair value of these securities would be expected to increase.
The sensitivity analysis table presented below shows the estimated impact of an instantaneous parallel shift in the yield curve, up and down 50 and 100 basis points, on the market value of our interest rate-sensitive investments and net interest income, including net interest paid or received under interest rate swaps, at
December 31, 2015
, assuming a static portfolio. When evaluating the impact of changes in interest rates, prepayment assumptions and principal reinvestment rates are adjusted based on our Manager’s expectations. The analysis presented utilized assumptions, models and estimates of our Manager based on our Manager’s judgment and experience.
|
66
|
||
|
Change in Interest Rates
|
Percentage Change
in Projected
Net Interest Income
|
Percentage
Change in
Projected
Portfolio Value
|
||||
|
+1.00%
|
(12.30
|
)%
|
(0.88
|
)%
|
||
|
+0.50%
|
(2.31
|
)%
|
(0.30
|
)%
|
||
|
-0.50%
|
(7.99
|
)%
|
0.20
|
%
|
||
|
-1.00%
|
(25.14
|
)%
|
0.02
|
%
|
||
Certain assumptions have been made in connection with the calculation of the information set forth in the foregoing interest rate sensitivity table and, as such, there can be no assurance that assumed events will occur or that other events will not occur that would affect the outcomes. The base interest rate scenario assumes interest rates at December 31, 2014. The analysis utilizes assumptions and estimates based on management’s judgment and experience. Furthermore, while we generally expect to retain such assets and the associated interest rate risk to maturity, future purchases and sales of assets could materially change our interest rate risk profile.
Given the low interest rates at
December 31, 2015
, we applied a floor of 0% for all anticipated interest rates included in our assumptions. Because of this floor, we anticipate that any hypothetical interest rate shock decrease would have a limited positive impact on our funding costs; however, because prepayment speeds are unaffected by this floor, we expect that any increase in our prepayment speeds (occurring as a result of any interest rate decrease or otherwise) could result in an acceleration of our premium amortization on Agency and interest-only securities purchased at a premium, and accretion of discount on our non-Agency RMBS purchased at a discount. As a result, because this floor limits the positive impact of any interest rate decrease on our funding costs, hypothetical interest rate decreases could cause the fair value of our financial instruments and our net interest income to decline.
The information set forth in the interest rate sensitivity table above and all related disclosures constitutes forward-looking statements within the meaning of Section 27A of the Securities Act and Section 21E of the Exchange Act. Actual results could differ significantly from those estimated in the foregoing interest rate sensitivity table.
Real Estate Risk
Residential and commercial property values are subject to volatility and may be adversely affected by a number of factors, including, but not limited to: national, regional and local economic conditions (which may be adversely affected by industry slowdowns and other factors); local real estate conditions (such as the supply of housing stock); changes or continued weakness in specific industry segments; construction quality, age and design; demographic factors; and retroactive changes to building or similar codes. In addition, decreases in property values reduce the value of the collateral and the potential proceeds available to a borrower to repay our loans, which could also cause us to suffer losses.
Credit Risk
We believe that our investment strategy will generally keep our credit losses and financing costs low. However, we retain the risk of potential credit losses on all of our residential and commercial mortgage investments. We seek to manage this risk through our pre-acquisition due diligence process. In addition, we re-evaluate the credit risk inherent in our investments on a regular basis pursuant to fundamental considerations such as GDP, unemployment, interest rates, retail sales, store closings/openings, corporate earnings, housing inventory, affordability and regional home price trends. We also review key loan credit metrics including, but not limited to, payment status, current loan-to-value ratios, current borrower credit scores and debt yields. These characteristics assist in determining the likelihood and severity of loan loss as well as prepayment and extension expectations. We then perform structural analysis under multiple scenarios to establish likely cash flow profiles and credit enhancement levels relative to collateral performance projections. This analysis allows us to quantify our opinions of credit quality and fundamental value, which are key drivers of portfolio management decisions.
|
67
|
||
Foreign Exchange Rate Risk
We have an investment in a commercial loan denominated in foreign currency and an investment in an unconsolidated joint venture whose net assets and results of operations are exposed to foreign currency translation risk when translated in U.S. dollars upon consolidation. We seek to hedge our foreign currency exposures by purchasing currency forward contracts.
Risk Management
To the extent consistent with maintaining our REIT qualification, we seek to manage risk exposure to protect our investment portfolio against the effects of major interest rate changes. We generally seek to manage this risk by:
|
•
|
monitoring and adjusting, if necessary, the reset index and interest rate related to our target assets and our financings;
|
|
•
|
attempting to structure our financing agreements to have a range of different maturities, terms, amortizations and interest rate adjustment periods;
|
|
•
|
using hedging instruments, primarily interest rate swap agreements but also financial futures, options, interest rate cap agreements, floors and forward sales to adjust the interest rate sensitivity of our target assets and our borrowings; and
|
|
•
|
actively managing, on an aggregate basis, the interest rate indices, interest rate adjustment periods, and gross reset margins of our target assets and the interest rate indices and adjustment periods of our financings.
|
The financial statements and supplementary data are included under Item 15 of this Report.
None.
Disclosure Controls and Procedures
Our management is responsible for establishing and maintaining disclosure controls and procedures (as defined in Rules 13a-15(e) and 15d-15(e) of the Exchange Act) that are designed to ensure that information we are required to disclose in the reports that we file or submit under the Exchange Act is recorded, processed, summarized and reported, within the time periods specified in the SEC’s rules and forms. Disclosure controls and procedures include controls and procedures designed to ensure that the required information is accumulated and communicated to our management, including our principal executive and principal financial officers, as appropriate, to allow timely decisions regarding required disclosure.
We have evaluated, with the participation of our principal executive officer and principal financial officer, the effectiveness of our disclosure controls and procedures as of
December 31, 2015
. Based upon our evaluation, our principal executive officer and principal financial officer concluded that our disclosure controls and procedures were effective to provide reasonable assurance that information required to be disclosed by us in the reports that we file or submit under the Exchange Act is recorded, processed, summarized and reported, within the time periods specified in the applicable rules and forms, and that it is accumulated and communicated to our management, including our principal executive officer and principal financial officer, as appropriate to allow timely decisions regarding required disclosure.
There are inherent limitations to the effectiveness of any system of disclosure controls and procedures, including the possibility of human error and the circumvention or overriding of the controls and procedures. Accordingly, even effective disclosure controls and procedures can only provide reasonable assurance of achieving their control objectives.
Management’s Annual Report on Internal Control over Financial Reporting
Our management is responsible for establishing and maintaining adequate internal control over financial reporting, as defined in the Exchange Act, Rules 13a-15(f) and 15d-15(f). Our internal control over financial reporting is a process designed to provide reasonable assurance regarding the reliability of financial reporting and the preparation of financial statements for external purposes in accordance with generally accepted accounting principles. Because of its inherent limitations, internal control over financial reporting may not prevent or detect misstatements. Also, projections of any evaluation of effectiveness to future periods are subject to the risk that controls may become inadequate because of changes in conditions, or that the degree of compliance with the policies or procedures may deteriorate.
Under the supervision and with the participation of the principal executive officer and principal financial officer, management assessed the effectiveness of our internal control over financial reporting as of
December 31, 2015
. In making this assessment, management used the criteria set forth by the Committee of Sponsoring Organizations of the Treadway Commission (COSO) in Internal Control - Integrated Framework (2013). Based on this assessment, management concluded that our internal control over financial reporting was effective as of
December 31, 2015
.
|
68
|
||
Our independent registered public accounting firm, Grant Thornton LLP, audited our internal control over financial reporting as of
December 31, 2015
. Their report dated
February 22, 2016
, which is included herein, expressed an unqualified opinion on our internal control over financial reporting.
Changes in Internal Control over Financial Reporting
Except as noted below, there has been no change in our internal control over financial reporting (as defined in Rules 13a-15(f) and 15d-15(f) of the Exchange Act) during the quarter ended
December 31, 2015
that has materially affected, or is reasonably likely to materially affect, our internal control over financial reporting.
Remedial Action
As previously reported, in connection with the preparation of our consolidated financial statements for the fiscal quarter ended June 30, 2015, we determined that we had been improperly accounting for GSE CRTs and Agency MBS IOs as investment securities under ASC 320 -
Investments - Debt and Equity Securities
instead of accounting for them as hybrid instruments and assessing them for embedded derivative features that may require bifurcation and separate accounting under ASC 815 -
Derivatives and Hedging
. Our controls over the analysis and review of the appropriate accounting treatment for our mortgage-backed and credit risk transfer securities were not appropriately designed to prevent a material error resulting from the misapplication of GAAP. Our management concluded that this deficiency constitutes a “material weakness” in our internal control over financial reporting. To remediate the material weakness in
2015
, we have implemented certain changes in our internal controls. Specifically, we engaged an internationally recognized accounting firm to assist us in reviewing our accounting treatment for mortgage-backed and credit risk transfer securities. In addition, we have formalized our technical accounting review and documentation procedures related to new investments. As of December 31, 2015, the material weakness described above has been remediated.
None.
We will provide information that is responsive to certain portions of this Item 10 in our definitive proxy statement or in an amendment to this Report not later than 120 days after the end of the fiscal year covered by this Report, in either case under the captions “Information about Director Nominees,” “Information about the Executive Officers of the Company,” “Corporate Governance,” “Information about the Board and its Committees,” “Section 16(a) Beneficial Ownership Reporting Compliance,” and possibly elsewhere therein. That information is incorporated into this Item 10 by reference.
Each year, the chief executive officer of each company listed on the New York Stock Exchange (“NYSE”) must certify to the NYSE that he or she is not aware of any violation by us of NYSE corporate governance listing standards as of the date of certification, qualifying the certification to the extent necessary. Our chief executive officer submitted our first required certification to the NYSE in August of 2010, and will submit a similar certification within 30 days of our
2015
annual stockholders’ meeting. In addition, we have filed, as exhibits to this Report, the certifications of our chief executive officer and chief financial officer required under Section 302 and 906 of the Sarbanes-Oxley Act of 2002.
We will provide information that is responsive to this Item 11 in our definitive proxy statement or in an amendment to this Report not later than 120 days after the end of the fiscal year covered by this Report, in either case under the captions “Director Compensation,” “Executive Compensation,” “Compensation Committee Interlocks and Insider Participation,” and possibly elsewhere therein. That information is incorporated into this Item 11 by reference.
We will provide information that is responsive to this Item 12 in our definitive proxy statement or in an amendment to this Report not later than 120 days after the end of the fiscal year covered by this Report, in either case under the caption “Security Ownership of Principal Stockholders,” “Security Ownership of Management,” and possibly elsewhere therein. That information is incorporated into this Item 12 by reference.
We will provide information that is responsive to this Item 13 in our definitive proxy statement or in an amendment to this Report not later than 120 days after the end of the fiscal year covered by this Report, in either case under the captions
|
69
|
||
“Corporate Governance,” “Certain Relationships and Related Transactions,” “Related Person Transaction Policy,” and possibly elsewhere therein. That information is incorporated into this Item 13 by reference.
We will provide information that is responsive to this Item 14 in our definitive proxy statement or in an amendment to this Report not later than 120 days after the end of the fiscal year covered by this Report, in either case under the captions “Fees Paid to Independent Registered Public Accounting Firm,” “Pre-Approval Process and Policy,” and possibly elsewhere therein. That information is incorporated into this Item 14 by reference.
(a)(1)
Financial Statements:
The financial statements contained herein are set forth on pages 76-120 of this Report.
(a)(2)
Financial Statement Schedules:
Refer to Index to Financial Statement Schedules contained herein on page 73 of this Report.
(a)(3)
Exhibits:
Refer to Exhibit Index starting on page 71 of this Report.
|
70
|
||
Exhibit Index
|
Exhibit
No.
|
Description
|
|
|
3.1
|
Articles of Amendment and Restatement of Invesco Mortgage Capital Inc., incorporated by reference to Exhibit 3.1 to our Quarterly Report on Form 10-Q, filed with the SEC on August 12, 2009.
|
|
|
3.2
|
Articles Supplementary of 7.75% Series A Cumulative Redeemable Preferred Stock, incorporated by reference to Exhibit 3.3 to our Registration Statement on Form 8-A, filed with the SEC on July 23, 2012.
|
|
|
3.3
|
Articles Supplementary of 7.75% Fixed-to-Floating Series B Cumulative Redeemable Preferred Stock (incorporated by reference to Exhibit 3.3 to the Registrant’s Registration Statement on Form 8-A, filed with the SEC on September 8, 2014).
|
|
|
3.4
|
Amended and Restated Bylaws of Invesco Mortgage Capital Inc., incorporated by reference to Exhibit 3.2 to Amendment No. 8 to our Registration Statement on Form S-11 (No. 333-151665), filed with the SEC on June 18, 2009 (“Pre-Effective Amendment No. 8”).
|
|
|
4.1
|
Specimen Common Stock Certificate of Invesco Mortgage Capital Inc., incorporated by reference to Exhibit 4.1 to Pre-Effective Amendment No. 8.
|
|
|
4.2
|
Specimen 7.75% Series A Cumulative Redeemable Preferred Stock Certificate, incorporated by reference to Exhibit 4.1 to our Registration Statement on Form 8-A, filed with the SEC on July 23, 2012.
|
|
|
4.3
|
Specimen 7.75% Series B Fixed-to-Floating Cumulative Redeemable Preferred Stock Certificate (incorporated by reference to Exhibit 4.1 to the Registrant’s Registration Statement on Form 8-A, filed with the SEC on September 8, 2014).
|
|
|
4.4
|
Indenture, dated March 12, 2013, by and among IAS Operating Partnership LP, as issuer, Invesco Mortgage Capital Inc., as guarantor, and The Bank of New York Mellon Trust Company, N.A., as trustee, including the form of 5.00% Exchangeable Senior Notes due 2018 and the related guarantee, incorporated by reference to Exhibit 4.1 to our Current Report on Form 8-K, filed with the SEC on March 15, 2013.
|
|
|
10.1
|
Registration Rights Agreement, dated as of July 1, 2009, among Invesco Mortgage Capital Inc. (formally known as Invesco Agency Securities Inc.), Invesco Advisers, Inc. (formally known as Invesco Institutional (N.A.), Inc.) and Invesco Investments (Bermuda) Ltd., incorporated by reference to Exhibit 10.1 to our Quarterly Report on Form 10-Q, filed with the SEC on August 12, 2009.
|
|
|
10.2
|
Registration Rights Agreement, dated March 12, 2013, among IAS Operating Partnership LP, Invesco Mortgage Capital Inc., Credit Suisse Securities (USA) LLC, Citigroup Global Markets Inc. and Merrill Lynch, Pierce, Fenner & Smith Incorporated, incorporated by reference to Exhibit 4.1 to our Current Report on Form 8-K, filed with the SEC on March 15, 2013.
|
|
|
10.3
|
Management Agreement, dated as of July 1, 2009, among Invesco Advisers, Inc. (formally known as Invesco Institutional (N.A.), Inc.), Invesco Mortgage Capital Inc. and IAS Operating Partnership LP., incorporated by reference to Exhibit 10.2 to our Quarterly Report on Form 10-Q, filed with the SEC on August 12, 2009.
|
|
|
10.4
|
Amendment to Management Agreement, dated as of May 24, 2011, by and among Invesco Advisers, Inc. (formally known as Invesco Institutional (N.A.), Inc.), Invesco Mortgage Capital Inc., IAS Operating Partnership LP., and IAS Asset I LLC, incorporated by reference to Exhibit 10.1 to our Quarterly Report on Form 10-Q, filed with the SEC on August 9, 2011.
|
|
|
10.5
|
Second Amendment to Management Agreement, dated as of July 1, 2015, by and among Invesco Advisers, Inc., Invesco Mortgage Capital Inc., and IAS Operating Partnership LP. (incorporated by reference to Exhibit 10.1 to our Quarterly Report on Form 10-Q, filed with the SEC on August 17, 2015).
|
|
|
10.6
|
First Amended and Restated Agreement of Limited Partnership, dated as of July 1, 2009, of IAS Operating Partnership LP., incorporated by reference to Exhibit 10.3 to our Quarterly Report on Form 10-Q, filed with the SEC on August 12, 2009.
|
|
|
10.7
|
First Amendment to First Amended and Restated Agreement of Limited Partnership of IAS Operating Partnership LP, dated as of July 23, 2012, incorporated by reference to Exhibit 10.5 to our Annual Report on Form 10-K, filed with the SEC on March 1, 2013.
|
|
|
10.8
|
Second Amendment to First Amended and Restated Agreement of Limited Partnership of IAS Operating Partnership LP, dated September 8, 2014.
|
|
|
10.9
|
Invesco Mortgage Capital Inc. Amended and Restated 2009 Equity Incentive Plan, incorporated by reference to Exhibit 10.1 to our Current Report on Form 8-K, filed with the SEC on February 19, 2016.
|
|
|
71
|
||
|
10.10
|
Amendment No. 1 to Invesco Mortgage Capital Inc. 2009 Equity Incentive Plan, incorporated by reference to Exhibit 10.1 to our Quarterly Report on Form 10-Q, filed with the SEC on August 13, 2010.
|
|
|
10.11
|
Form of Restricted Common Stock Award Agreement, incorporated by reference to Exhibit 4.1 to Pre-Effective Amendment No. 8.
|
|
|
10.12
|
Form of Restricted Stock Unit Award Agreement, incorporated by reference to Exhibit 10.7 to our Annual Report on Form 10-K, filed with the SEC on March 24, 2010.
|
|
|
21.1
|
Subsidiaries of the Registrant.
|
|
|
23.1
|
Consent of Grant Thornton LLP.
|
|
|
31.1
|
Certification of Richard J. King pursuant to Rule 13a-14(a), as adopted pursuant to Section 302 of the Sarbanes-Oxley Act of 2002.
|
|
|
31.2
|
Certification of Richard Lee Phegley, Jr. pursuant to Rule 13a-14(a), as adopted pursuant to Section 302 of the Sarbanes-Oxley Act of 2002.
|
|
|
32.1
|
Certification of Richard J. King pursuant to Rule 13a-14(b) and 18 U.S.C. Section 1350, as adopted pursuant to Section 906 of the Sarbanes-Oxley Act of 2002.
|
|
|
32.2
|
Certification of Richard Lee Phegley, Jr. pursuant to Rule 13a-14(b) and 18 U.S.C. Section 1350, as adopted pursuant to Section 906 of the Sarbanes-Oxley Act of 2002.
|
|
|
101
|
The following series of audited XBRL-formatted documents are collectively included herewith as Exhibit 101. The financial information is extracted from Invesco Mortgage Capital Inc.’s audited consolidated financial statements and notes that are included in this Form 10-K/A Report.
|
|
|
101.INS XBRL Instance Document
|
||
|
101.SCH XBRL Taxonomy Extension Schema Document
|
||
|
101.CAL XBRL Taxonomy Calculation Linkbase Document
|
||
|
101.LAB XBRL Taxonomy Label Linkbase Document
|
||
|
101.PRE XBRL Taxonomy Presentation Linkbase Document
|
||
|
101.DEF XBRL Taxonomy Definition Linkbase Document
|
||
§ Management contract or compensatory plan or arrangement.
(b)
Exhibits
: Refer to (a)(3) above.
(c)
Financial Statement Schedules
: Refer to (a)(2) above.
|
72
|
||
INDEX TO FINANCIAL STATEMENTS
|
|
Page
|
INDEX TO FINANCIAL STATEMENT SCHEDULES
Schedules other than the one listed above are omitted because they are not applicable or deemed not material.
|
73
|
||
REPORT OF INDEPENDENT REGISTERED PUBLIC ACCOUNTING FIRM
Board of Directors and Stockholders
Invesco Mortgage Capital Inc.
We have audited the accompanying consolidated balance sheets of Invesco Mortgage Capital Inc. (a Maryland corporation) and subsidiaries (the “Company”) as of
December 31, 2015
and
2014
, and the related consolidated statements of operations, comprehensive income (loss), equity, and cash flows for each of the three years in the period ended
December 31, 2015
. Our audits of the basic consolidated financial statements included the financial statement schedule listed in the index appearing under Item 15(a)(2). These financial statements and financial statement schedule are the responsibility of the Company’s management. Our responsibility is to express an opinion on these financial statements and financial statement schedule based on our audits.
We conducted our audits in accordance with the standards of the Public Company Accounting Oversight Board (United States). Those standards require that we plan and perform the audit to obtain reasonable assurance about whether the financial statements are free of material misstatement. An audit includes examining, on a test basis, evidence supporting the amounts and disclosures in the financial statements. An audit also includes assessing the accounting principles used and significant estimates made by management, as well as evaluating the overall financial statement presentation. We believe that our audits provide a reasonable basis for our opinion.
In our opinion, the consolidated financial statements referred to above present fairly, in all material respects, the financial position of Invesco Mortgage Capital Inc. and subsidiaries as of
December 31, 2015
and
2014
, and the results of their operations and their cash flows for each of the three years in the period ended
December 31, 2015
, in conformity with accounting principles generally accepted in the United States of America. Also in our opinion, the related financial statement schedule, when considered in relation to the basic consolidated financial statements taken as a whole, presents fairly, in all material respects, the information set forth therein.
We also have audited, in accordance with the standards of the Public Company Accounting Oversight Board (United States), the Company’s internal control over financial reporting as of
December 31, 2015
, based on criteria established in the 2013
Internal Control
-
Integrated Framework
issued by the Committee of Sponsoring Organizations of the Treadway Commission (COSO), and our report dated
February 22, 2016
, expressed an unqualified opinion.
/s/ GRANT THORNTON LLP
Iselin, New Jersey
February 22, 2016
|
74
|
||
REPORT OF INDEPENDENT REGISTERED PUBLIC ACCOUNTING FIRM
Board of Directors and Stockholders
Invesco Mortgage Capital Inc.
We have audited the internal control over financial reporting of Invesco Mortgage Capital Inc. (a Maryland Corporation) and subsidiaries (the "Company") as of
December 31, 2015
, based on criteria established in the 2013
Internal Control-Integrated Framework
issued by the Committee of Sponsoring Organizations of the Treadway Commission (COSO). The Company’s management is responsible for maintaining effective internal control over financial reporting and for its assessment of the effectiveness of internal control over financial reporting, included in the accompanying Management’s Annual Report on Internal Control over Financial Reporting. Our responsibility is to express an opinion on the Company’s internal control over financial reporting based on our audit.
We conducted our audit in accordance with the standards of the Public Company Accounting Oversight Board (United States). Those standards require that we plan and perform the audit to obtain reasonable assurance about whether effective internal control over financial reporting was maintained in all material respects. Our audit included obtaining an understanding of internal control over financial reporting, assessing the risk that a material weakness exists, testing and evaluating the design and operating effectiveness of internal control based on the assessed risk, and performing such other procedures as we considered necessary in the circumstances. We believe that our audit provides a reasonable basis for our opinion.
A company’s internal control over financial reporting is a process designed to provide reasonable assurance regarding the reliability of financial reporting and the preparation of financial statements for external purposes in accordance with generally accepted accounting principles. A company’s internal control over financial reporting includes those policies and procedures that (1) pertain to the maintenance of records that, in reasonable detail, accurately and fairly reflect the transactions and dispositions of the assets of the company; (2) provide reasonable assurance that transactions are recorded as necessary to permit preparation of financial statements in accordance with generally accepted accounting principles, and that receipts and expenditures of the company are being made only in accordance with authorizations of management and directors of the company; and (3) provide reasonable assurance regarding prevention or timely detection of unauthorized acquisition, use, or disposition of the company’s assets that could have a material effect on the financial statements.
Because of its inherent limitations, internal control over financial reporting may not prevent or detect misstatements. Also, projections of any evaluation of effectiveness to future periods are subject to the risk that controls may become inadequate because of changes in conditions, or that the degree of compliance with the policies or procedures may deteriorate.
In our opinion, the Company maintained, in all material respects, effective internal control over financial reporting as of
December 31, 2015
, based on criteria established in the 2013
Internal Control-Integrated Framework
issued by COSO.
We also have audited, in accordance with the standards of the Public Company Accounting Oversight Board (United States), the consolidated financial statements of the Company as of and for the year ended
December 31, 2015
, and our report dated
February 22, 2016
, expressed an unqualified opinion on those financial statements.
/s/ GRANT THORNTON LLP
Iselin, New Jersey
February 22, 2016
|
75
|
||
INVESCO MORTGAGE CAPITAL INC. AND SUBSIDIARIES
CONSOLIDATED BALANCE SHEETS
|
As of
|
|||||
|
|
December 31, 2015
|
December 31, 2014
|
|||
|
In thousands except share amounts
|
|||||
|
ASSETS
|
|||||
|
Mortgage-backed and credit risk transfer securities, at fair value
|
16,065,935
|
|
17,248,895
|
|
|
|
Residential loans, held-for-investment
(1)
|
—
|
|
3,365,003
|
|
|
|
Commercial loans, held-for-investment
|
209,062
|
|
145,756
|
|
|
|
Cash and cash equivalents
|
53,199
|
|
164,144
|
|
|
|
Due from counterparties
|
110,009
|
|
57,604
|
|
|
|
Investment related receivable
|
154,594
|
|
38,717
|
|
|
|
Accrued interest receivable
|
50,779
|
|
66,044
|
|
|
|
Derivative assets, at fair value
|
8,659
|
|
24,178
|
|
|
|
Deferred securitization and financing costs
|
5,587
|
|
13,080
|
|
|
|
Other investments
|
113,788
|
|
106,498
|
|
|
|
Other assets
|
1,124
|
|
1,098
|
|
|
|
Total assets
(1)
|
16,772,736
|
|
21,231,017
|
|
|
|
LIABILITIES AND EQUITY
|
|||||
|
Liabilities:
|
|||||
|
Repurchase agreements
|
12,126,048
|
|
13,622,677
|
|
|
|
Secured loans
|
1,650,000
|
|
1,250,000
|
|
|
|
Asset-backed securities issued by securitization trusts
(1)
|
—
|
|
2,929,820
|
|
|
|
Exchangeable senior notes
|
400,000
|
|
400,000
|
|
|
|
Derivative liabilities, at fair value
|
238,148
|
|
254,026
|
|
|
|
Dividends and distributions payable
|
51,734
|
|
61,757
|
|
|
|
Investment related payable
|
167
|
|
17,008
|
|
|
|
Accrued interest payable
|
21,604
|
|
29,670
|
|
|
|
Collateral held payable
|
4,900
|
|
14,890
|
|
|
|
Accounts payable and accrued expenses
|
2,376
|
|
2,439
|
|
|
|
Due to affiliate
|
10,851
|
|
9,880
|
|
|
|
Total liabilities
(1)
|
14,505,828
|
|
18,592,167
|
|
|
|
Equity:
|
|||||
|
Preferred Stock, par value $0.01 per share; 50,000,000 shares authorized:
|
|||||
|
7.75% Series A Cumulative Redeemable Preferred Stock: 5,600,000 shares issued and outstanding ($140,000 aggregate liquidation preference)
|
135,356
|
|
135,356
|
|
|
|
7.75% Fixed-to-Floating Series B Cumulative Redeemable Preferred Stock: 6,200,000 shares issued and outstanding ($155,000 aggregate liquidation preference)
|
149,860
|
|
149,860
|
|
|
|
Common Stock, par value $0.01 per share; 450,000,000 shares authorized; 113,619,471 and 123,110,454 shares issued and outstanding, respectively
|
1,136
|
|
1,231
|
|
|
|
Additional paid in capital
|
2,407,372
|
|
2,532,130
|
|
|
|
Accumulated other comprehensive income (loss)
|
303,110
|
|
424,592
|
|
|
|
Retained earnings (distributions in excess of earnings)
|
(755,799
|
)
|
(632,854
|
)
|
|
|
Total stockholders’ equity
|
2,241,035
|
|
2,610,315
|
|
|
|
Non-controlling interest
|
25,873
|
|
28,535
|
|
|
|
Total equity
|
2,266,908
|
|
2,638,850
|
|
|
|
Total liabilities and equity
|
16,772,736
|
|
21,231,017
|
|
|
|
(1)
|
As of December 31, 2014, the consolidated balance sheet included assets and liabilities of consolidated variable interest entities (“VIEs”) totaling
$3,380,597
and
$2,938,512
, respectively. The Company deconsolidated these VIEs in 2015. Refer to Note 3 - "Variable Interest Entities" for further discussion.
|
The accompanying notes are an integral part of these consolidated financial statements.
|
76
|
||
INVESCO MORTGAGE CAPITAL INC. AND SUBSIDIARIES
CONSOLIDATED STATEMENTS OF OPERATIONS
|
|
Years Ended December 31,
|
|||||||
|
2015
|
2014
|
2013
|
||||||
|
In thousands except share amounts
|
||||||||
|
Interest Income
|
||||||||
|
Mortgage-backed and credit risk transfer securities
|
518,256
|
|
579,062
|
|
646,787
|
|
||
|
Residential loans
(1)
|
110,908
|
|
88,073
|
|
34,122
|
|
||
|
Commercial loans
|
15,331
|
|
9,508
|
|
1,451
|
|
||
|
Total interest income
|
644,495
|
|
676,643
|
|
682,360
|
|
||
|
Interest Expense
|
||||||||
|
Repurchase agreements
|
166,892
|
|
188,699
|
|
287,547
|
|
||
|
Secured loans
|
6,579
|
|
2,576
|
|
—
|
|
||
|
Exchangeable senior notes
|
22,461
|
|
22,461
|
|
18,023
|
|
||
|
Asset-backed securities
(1)
|
82,041
|
|
68,159
|
|
26,682
|
|
||
|
Total interest expense
|
277,973
|
|
281,895
|
|
332,252
|
|
||
|
Net interest income
|
366,522
|
|
394,748
|
|
350,108
|
|
||
|
(Reduction in) provision for loan losses
|
(213
|
)
|
(142
|
)
|
884
|
|
||
|
Net interest income after (reduction in) provision for loan losses
|
366,735
|
|
394,890
|
|
349,224
|
|
||
|
Other income (loss)
|
||||||||
|
Gain (loss) on investments, net
|
(21,212
|
)
|
(87,168
|
)
|
(182,733
|
)
|
||
|
Equity in earnings of unconsolidated ventures
|
12,630
|
|
6,786
|
|
5,345
|
|
||
|
Gain (loss) on derivative instruments, net
|
(219,048
|
)
|
(487,469
|
)
|
40,003
|
|
||
|
Realized and unrealized credit derivative income (loss), net
|
19,782
|
|
(2,866
|
)
|
1,127
|
|
||
|
Other investment income (loss), net
|
944
|
|
(2,045
|
)
|
—
|
|
||
|
Total other income (loss)
|
(206,904
|
)
|
(572,762
|
)
|
(136,258
|
)
|
||
|
Expenses
|
||||||||
|
Management fee — related party
|
38,632
|
|
37,599
|
|
42,639
|
|
||
|
General and administrative
|
7,769
|
|
9,191
|
|
8,368
|
|
||
|
Consolidated securitization trusts
(1)
|
8,219
|
|
6,076
|
|
2,137
|
|
||
|
Total expenses
|
54,620
|
|
52,866
|
|
53,144
|
|
||
|
Net income (loss)
|
105,211
|
|
(230,738
|
)
|
159,822
|
|
||
|
Net income (loss) attributable to non-controlling interest
|
1,241
|
|
(2,632
|
)
|
1,667
|
|
||
|
Net income (loss) attributable to Invesco Mortgage Capital Inc.
|
103,970
|
|
(228,106
|
)
|
158,155
|
|
||
|
Dividends to preferred stockholders
|
22,864
|
|
17,378
|
|
10,851
|
|
||
|
Net income (loss) attributable to common stockholders
|
81,106
|
|
(245,484
|
)
|
147,304
|
|
||
|
Earnings per share:
|
||||||||
|
Net income (loss) attributable to common stockholders
|
||||||||
|
Basic
|
0.67
|
|
(1.99
|
)
|
1.11
|
|
||
|
Diluted
|
0.67
|
|
(1.99
|
)
|
1.11
|
|
||
|
Weighted average number of shares of common stock:
|
||||||||
|
Basic
|
121,377,585
|
|
123,104,934
|
|
132,714,012
|
|
||
|
Diluted
|
122,843,838
|
|
124,529,934
|
|
134,173,691
|
|
||
|
(1)
|
The consolidated statements of operations includes income and expenses of consolidated VIEs. The Company deconsolidated these VIEs in 2015. Refer to Note 3 - “Variable Interest Entities” for further discussion.
|
The accompanying notes are an integral part of these consolidated financial statements.
|
77
|
||
INVESCO MORTGAGE CAPITAL INC. AND SUBSIDIARIES
CONSOLIDATED STATEMENTS OF COMPREHENSIVE INCOME (LOSS)
|
|
Years Ended December 31,
|
|||||||
|
2015
|
2014
|
2013
|
||||||
|
In thousands
|
||||||||
|
Net income (loss)
|
105,211
|
|
(230,738
|
)
|
159,822
|
|
||
|
Other comprehensive income (loss):
|
||||||||
|
Unrealized gain (loss) on mortgage-backed and credit risk transfer securities, net
|
(185,416
|
)
|
431,198
|
|
(891,261
|
)
|
||
|
Reclassification of unrealized (gain) loss on sale of mortgage-backed and credit risk transfer securities to gain (loss) on investments, net
|
(4,277
|
)
|
80,659
|
|
199,449
|
|
||
|
Unrealized gain (loss) on derivative instruments
|
—
|
|
—
|
|
263,135
|
|
||
|
Reclassification of unrealized loss on derivative instruments to gain (loss) on derivatives, net
|
—
|
|
—
|
|
166,016
|
|
||
|
Reclassification of amortization of net deferred losses on de-designated interest rate swaps to repurchase agreements interest expense
|
66,757
|
|
85,176
|
|
—
|
|
||
|
Currency translation adjustments on investment in unconsolidated venture
|
(32
|
)
|
—
|
|
—
|
|
||
|
Total other comprehensive income (loss)
|
(122,968
|
)
|
597,033
|
|
(262,661
|
)
|
||
|
Comprehensive income (loss)
|
(17,757
|
)
|
366,295
|
|
(102,839
|
)
|
||
|
Less: Comprehensive (income) loss attributable to non-controlling interest
|
245
|
|
(4,188
|
)
|
1,029
|
|
||
|
Less: Dividends to preferred stockholders
|
(22,864
|
)
|
(17,378
|
)
|
(10,851
|
)
|
||
|
Comprehensive income (loss) attributable to common stockholders
|
(40,376
|
)
|
344,729
|
|
(112,661
|
)
|
||
The accompanying notes are an integral part of these consolidated financial statements.
|
78
|
||
INVESCO MORTGAGE CAPITAL INC. AND SUBSIDIARIES
CONSOLIDATED STATEMENTS OF EQUITY
|
|
|
|
|
|
Attributable to Common Stockholders
|
|
|
||||||||||||||||||||||||||||
|
In thousands except share amounts
|
Series A
Preferred Stock
|
Series B
Preferred Stock
|
Common Stock
|
Additional
Paid in
Capital
|
Accumulated
Other
Comprehensive
Income (loss)
|
Retained
Earnings
(Distributions
in excess
of earnings)
|
Total
Stockholders’
Equity
|
Non-
Controlling
Interest
|
Total
Equity
|
||||||||||||||||||||||||||
|
Shares
|
Amount
|
Shares
|
Amount
|
Shares
|
Amount
|
||||||||||||||||||||||||||||||
|
Balance at December 31, 2012
|
5,600,000
|
|
135,362
|
|
—
|
|
—
|
|
116,195,500
|
|
1,162
|
|
2,316,290
|
|
94,343
|
|
10,941
|
|
2,558,098
|
|
31,422
|
|
2,589,520
|
|
|||||||||||
|
Net income (loss)
|
—
|
|
—
|
|
—
|
|
—
|
|
—
|
|
—
|
|
—
|
|
—
|
|
158,155
|
|
158,155
|
|
1,667
|
|
159,822
|
|
|||||||||||
|
Other comprehensive income (loss)
|
—
|
|
—
|
|
—
|
|
—
|
|
—
|
|
—
|
|
—
|
|
(259,964
|
)
|
—
|
|
(259,964
|
)
|
(2,697
|
)
|
(262,661
|
)
|
|||||||||||
|
Proceeds from issuance of common stock, net of offering costs
|
—
|
|
—
|
|
—
|
|
—
|
|
19,020,106
|
|
190
|
|
396,280
|
|
—
|
|
—
|
|
396,470
|
|
—
|
|
396,470
|
|
|||||||||||
|
(Cost) proceeds from issuance of preferred stock, net of offering costs
|
—
|
|
(6
|
)
|
—
|
|
—
|
|
—
|
|
—
|
|
—
|
|
—
|
|
—
|
|
(6
|
)
|
—
|
|
(6
|
)
|
|||||||||||
|
Repurchase of shares of common stock
|
—
|
|
—
|
|
—
|
|
—
|
|
(10,720,003
|
)
|
(107
|
)
|
(160,419
|
)
|
—
|
|
—
|
|
(160,526
|
)
|
—
|
|
(160,526
|
)
|
|||||||||||
|
Stock awards
|
—
|
|
—
|
|
—
|
|
—
|
|
14,643
|
|
—
|
|
—
|
|
—
|
|
—
|
|
—
|
|
—
|
|
—
|
|
|||||||||||
|
Common stock dividends
|
—
|
|
—
|
|
—
|
|
—
|
|
—
|
|
—
|
|
—
|
|
—
|
|
(305,574
|
)
|
(305,574
|
)
|
—
|
|
(305,574
|
)
|
|||||||||||
|
Common unit dividends
|
—
|
|
—
|
|
—
|
|
—
|
|
—
|
|
—
|
|
—
|
|
—
|
|
—
|
|
—
|
|
(3,276
|
)
|
(3,276
|
)
|
|||||||||||
|
Preferred stock dividends
|
—
|
|
—
|
|
—
|
|
—
|
|
—
|
|
—
|
|
—
|
|
—
|
|
(10,851
|
)
|
(10,851
|
)
|
—
|
|
(10,851
|
)
|
|||||||||||
|
Amortization of equity-based compensation
|
—
|
|
—
|
|
—
|
|
—
|
|
—
|
|
—
|
|
313
|
|
—
|
|
—
|
|
313
|
|
4
|
|
317
|
|
|||||||||||
|
Balance at December 31, 2013
|
5,600,000
|
|
135,356
|
|
—
|
|
—
|
|
124,510,246
|
|
1,245
|
|
2,552,464
|
|
(165,621
|
)
|
(147,329
|
)
|
2,376,115
|
|
27,120
|
|
2,403,235
|
|
|||||||||||
|
Net income (loss)
|
—
|
|
—
|
|
—
|
|
—
|
|
—
|
|
—
|
|
—
|
|
—
|
|
(228,106
|
)
|
(228,106
|
)
|
(2,632
|
)
|
(230,738
|
)
|
|||||||||||
|
Other comprehensive income (loss)
|
—
|
|
—
|
|
—
|
|
—
|
|
—
|
|
—
|
|
—
|
|
590,213
|
|
—
|
|
590,213
|
|
6,820
|
|
597,033
|
|
|||||||||||
|
Proceeds from issuance of common stock, net of offering costs
|
—
|
|
—
|
|
—
|
|
—
|
|
15,505
|
|
—
|
|
256
|
|
—
|
|
—
|
|
256
|
|
—
|
|
256
|
|
|||||||||||
|
Proceeds from issuance of preferred stock, net of offering costs
|
—
|
|
—
|
|
6,200,000
|
|
149,860
|
|
—
|
|
—
|
|
—
|
|
—
|
|
—
|
|
149,860
|
|
—
|
|
149,860
|
|
|||||||||||
|
Repurchase of shares of common stock
|
—
|
|
—
|
|
—
|
|
—
|
|
(1,438,213
|
)
|
(14
|
)
|
(21,116
|
)
|
—
|
|
—
|
|
(21,130
|
)
|
—
|
|
(21,130
|
)
|
|||||||||||
|
Stock awards
|
—
|
|
—
|
|
—
|
|
—
|
|
22,916
|
|
—
|
|
—
|
|
—
|
|
—
|
|
—
|
|
—
|
|
—
|
|
|||||||||||
|
Common stock dividends
|
—
|
|
—
|
|
—
|
|
—
|
|
—
|
|
—
|
|
—
|
|
—
|
|
(240,041
|
)
|
(240,041
|
)
|
—
|
|
(240,041
|
)
|
|||||||||||
|
Common unit dividends
|
—
|
|
—
|
|
—
|
|
—
|
|
—
|
|
—
|
|
—
|
|
—
|
|
—
|
|
—
|
|
(2,779
|
)
|
(2,779
|
)
|
|||||||||||
|
Preferred stock dividends
|
—
|
|
—
|
|
—
|
|
—
|
|
—
|
|
—
|
|
—
|
|
—
|
|
(17,378
|
)
|
(17,378
|
)
|
—
|
|
(17,378
|
)
|
|||||||||||
|
Amortization of equity-based compensation
|
—
|
|
—
|
|
—
|
|
—
|
|
—
|
|
—
|
|
526
|
|
—
|
|
—
|
|
526
|
|
6
|
|
532
|
|
|||||||||||
|
Balance at December 31, 2014
|
5,600,000
|
|
135,356
|
|
6,200,000
|
|
149,860
|
|
123,110,454
|
|
1,231
|
|
2,532,130
|
|
424,592
|
|
(632,854
|
)
|
2,610,315
|
|
28,535
|
|
2,638,850
|
|
|||||||||||
|
Net income (loss)
|
—
|
|
—
|
|
—
|
|
—
|
|
—
|
|
—
|
|
—
|
|
—
|
|
103,970
|
|
103,970
|
|
1,241
|
|
105,211
|
|
|||||||||||
|
Other comprehensive income (loss)
|
—
|
|
—
|
|
—
|
|
—
|
|
—
|
|
—
|
|
—
|
|
(121,482
|
)
|
—
|
|
(121,482
|
)
|
(1,486
|
)
|
(122,968
|
)
|
|||||||||||
|
Proceeds from issuance of common stock, net of offering costs
|
—
|
|
—
|
|
—
|
|
—
|
|
12,945
|
|
—
|
|
191
|
|
—
|
|
—
|
|
191
|
|
—
|
|
191
|
|
|||||||||||
|
Repurchase of shares of common stock
|
—
|
|
—
|
|
—
|
|
—
|
|
(9,539,251
|
)
|
(95
|
)
|
(125,500
|
)
|
—
|
|
—
|
|
(125,595
|
)
|
—
|
|
(125,595
|
)
|
|||||||||||
|
Stock awards
|
—
|
|
—
|
|
—
|
|
—
|
|
35,323
|
|
—
|
|
—
|
|
—
|
|
—
|
|
—
|
|
—
|
|
—
|
|
|||||||||||
|
Common stock dividends
|
—
|
|
—
|
|
—
|
|
—
|
|
—
|
|
—
|
|
—
|
|
—
|
|
(204,051
|
)
|
(204,051
|
)
|
—
|
|
(204,051
|
)
|
|||||||||||
|
Common unit dividends
|
—
|
|
—
|
|
—
|
|
—
|
|
—
|
|
—
|
|
—
|
|
—
|
|
—
|
|
—
|
|
(2,423
|
)
|
(2,423
|
)
|
|||||||||||
|
Preferred stock dividends
|
—
|
|
—
|
|
—
|
|
—
|
|
—
|
|
—
|
|
—
|
|
—
|
|
(22,864
|
)
|
(22,864
|
)
|
—
|
|
(22,864
|
)
|
|||||||||||
|
Amortization of equity-based compensation
|
—
|
|
—
|
|
—
|
|
—
|
|
—
|
|
—
|
|
551
|
|
—
|
|
—
|
|
551
|
|
6
|
|
557
|
|
|||||||||||
|
Balance at December 31, 2015
|
5,600,000
|
|
135,356
|
|
6,200,000
|
|
149,860
|
|
113,619,471
|
|
1,136
|
|
2,407,372
|
|
303,110
|
|
(755,799
|
)
|
2,241,035
|
|
25,873
|
|
2,266,908
|
|
|||||||||||
The accompanying notes are an integral part of these consolidated financial statements.
|
79
|
||
INVESCO MORTGAGE CAPITAL INC. AND SUBSIDIARIES
|
In thousands
|
Years Ended December 31,
|
|||||||
|
2015
|
2014
|
2013
|
||||||
|
|
||||||||
|
Cash Flows from Operating Activities
|
||||||||
|
Net income (loss)
|
105,211
|
|
(230,738
|
)
|
159,822
|
|
||
|
Adjustments to reconcile net income (loss) to net cash provided by operating activities:
|
||||||||
|
Amortization of mortgage-backed and credit risk transfer securities premiums and (discounts), net
|
122,925
|
|
124,369
|
|
180,121
|
|
||
|
Amortization of residential loans and asset-backed securities premiums (discounts), net
|
(656
|
)
|
2,761
|
|
994
|
|
||
|
Amortization of commercial loan origination fees
|
(91
|
)
|
(9
|
)
|
(26
|
)
|
||
|
(Reduction in) provision for loan losses
|
(213
|
)
|
(142
|
)
|
884
|
|
||
|
Unrealized (gain) loss on derivative instruments, net
|
(9,597
|
)
|
215,499
|
|
13,923
|
|
||
|
Unrealized (gain) loss on credit derivatives, net
|
4,623
|
|
21,753
|
|
865
|
|
||
|
(Gain) loss on investments, net
|
21,212
|
|
87,168
|
|
182,733
|
|
||
|
Realized (gain) loss on derivative instruments, net
|
44,272
|
|
72,187
|
|
(56,279
|
)
|
||
|
Realized (gain) loss on credit derivatives, net
|
1,140
|
|
—
|
|
—
|
|
||
|
Equity in earnings of unconsolidated ventures
|
(12,630
|
)
|
(6,786
|
)
|
(5,345
|
)
|
||
|
Amortization of equity-based compensation
|
557
|
|
532
|
|
317
|
|
||
|
Amortization of deferred securitization and financing costs
|
3,146
|
|
3,013
|
|
2,446
|
|
||
|
Amortization of net deferred losses on de-designated interest rate swaps to repurchase agreements interest expense
|
66,757
|
|
85,176
|
|
—
|
|
||
|
Non-cash interest income capitalized in commercial loans
|
—
|
|
(768
|
)
|
(832
|
)
|
||
|
(Gain) loss on foreign currency transactions, net
|
1,964
|
|
2,718
|
|
—
|
|
||
|
Changes in operating assets and liabilities:
|
||||||||
|
(Increase) decrease in operating assets
|
5,660
|
|
2,473
|
|
(5,280
|
)
|
||
|
Increase in operating liabilities
|
4,305
|
|
456
|
|
16,099
|
|
||
|
Net cash provided by operating activities
|
358,585
|
|
379,662
|
|
490,442
|
|
||
|
Cash Flows from Investing Activities
|
||||||||
|
Purchase of mortgage-backed and credit risk transfer securities
|
(2,352,380
|
)
|
(4,339,442
|
)
|
(8,323,891
|
)
|
||
|
(Contributions) distributions (from) to investments in unconsolidated ventures, net
|
18,183
|
|
7,191
|
|
(3,757
|
)
|
||
|
Change in other investments
|
(12,875
|
)
|
(52,500
|
)
|
—
|
|
||
|
Principal payments from mortgage-backed and credit risk transfer securities
|
2,602,138
|
|
1,909,632
|
|
2,818,987
|
|
||
|
Proceeds from sale of mortgage-backed and credit risk transfer securities
|
907,155
|
|
3,266,040
|
|
5,041,249
|
|
||
|
Payments on sale of credit derivatives
|
(1,140
|
)
|
—
|
|
—
|
|
||
|
Payment of premiums for interest rate swaptions
|
(1,486
|
)
|
(10,328
|
)
|
(72,723
|
)
|
||
|
(Payments) proceeds (for) from termination of futures, forwards, swaps, swaptions and TBAs
|
(33,945
|
)
|
(48,913
|
)
|
114,538
|
|
||
|
Purchase of residential loans held-for-investment
|
(372,305
|
)
|
(1,816,638
|
)
|
(1,857,673
|
)
|
||
|
Principal payments from residential loans held-for-investment
|
549,565
|
|
255,662
|
|
43,869
|
|
||
|
Principal payments from commercial loans held-for-investment
|
92,796
|
|
399
|
|
—
|
|
||
|
Origination and advances of commercial loans, net of origination fees
|
(157,963
|
)
|
(83,483
|
)
|
(63,741
|
)
|
||
|
Net cash provided by (used in) investing activities
|
1,237,743
|
|
(912,380
|
)
|
(2,303,142
|
)
|
||
|
Cash Flows from Financing Activities
|
||||||||
|
Proceeds from issuance of common stock
|
191
|
|
256
|
|
396,465
|
|
||
|
Repurchase of common stock
|
(125,595
|
)
|
(21,130
|
)
|
(160,527
|
)
|
||
|
Proceeds from (cost of) issuance of preferred stock
|
(36
|
)
|
149,896
|
|
(6
|
)
|
||
|
Due from counterparties
|
(53,830
|
)
|
(54,679
|
)
|
(1,500
|
)
|
||
|
Collateral held payable
|
(9,990
|
)
|
(32,014
|
)
|
46,904
|
|
||
|
Proceeds from repurchase agreements
|
140,861,204
|
|
141,072,770
|
|
182,456,110
|
|
||
|
Principal repayments of repurchase agreements
|
(142,357,783
|
)
|
(142,901,817
|
)
|
(182,697,053
|
)
|
||
|
Proceeds from issuance of exchangeable senior notes
|
—
|
|
—
|
|
400,000
|
|
||
|
Proceeds from asset-backed securities issued by securitization trusts
|
336,077
|
|
1,525,905
|
|
1,687,127
|
|
||
|
Principal repayments of asset-backed securities issued by securitization trusts
|
(518,150
|
)
|
(236,210
|
)
|
(41,722
|
)
|
||
|
Proceeds from secured loans
|
2,325,000
|
|
2,835,247
|
|
—
|
|
||
|
Principal repayments on secured loans
|
(1,925,000
|
)
|
(1,585,247
|
)
|
—
|
|
||
|
Payments of deferred costs
|
—
|
|
(2,199
|
)
|
(16,181
|
)
|
||
|
Payments of dividends and distributions
|
(239,361
|
)
|
(264,528
|
)
|
(332,779
|
)
|
||
|
Net cash provided by (used in) financing activities
|
(1,707,273
|
)
|
486,250
|
|
1,736,838
|
|
||
|
Net change in cash and cash equivalents
|
(110,945
|
)
|
(46,468
|
)
|
(75,862
|
)
|
||
|
Cash and cash equivalents, beginning of period
|
164,144
|
|
210,612
|
|
286,474
|
|
||
|
Cash and cash equivalents, end of period
|
53,199
|
|
164,144
|
|
210,612
|
|
||
|
Supplement Disclosure of Cash Flow Information
|
||||||||
|
Interest paid
|
211,414
|
|
193,275
|
|
320,253
|
|
||
|
Non-cash Investing and Financing Activities Information
|
||||||||
|
Net change in unrealized gain (loss) on mortgage-backed and credit risk transfer securities
|
(189,693
|
)
|
511,857
|
|
(262,661
|
)
|
||
|
Dividends and distributions declared not paid
|
51,734
|
|
61,757
|
|
66,087
|
|
||
|
(Receivable) / payable for mortgage-backed and credit risk transfer securities sold / purchased, net
|
(131,440
|
)
|
457,643
|
|
(522,492
|
)
|
||
|
Repurchase agreements, not settled
|
(50
|
)
|
49
|
|
(27,842
|
)
|
||
|
Collateral held payable, not settled
|
—
|
|
(5,794
|
)
|
5,794
|
|
||
|
Net change in due from counterparties
|
1,425
|
|
(1,425
|
)
|
—
|
|
||
The accompanying notes are an integral part of these consolidated financial statements.
|
80
|
||
INVESCO MORTGAGE CAPITAL INC. AND SUBSIDIARIES
NOTES TO CONSOLIDATED FINANCIAL STATEMENTS
Invesco Mortgage Capital Inc. (the “Company”) is a Maryland corporation primarily focused on investing in, financing and managing residential and commercial mortgage-backed securities and mortgage loans. The Company conducts its business through IAS Operating Partnership L.P. (the “Operating Partnership”) as its sole general partner. As of
December 31, 2015
the Company owned
98.8%
of the Operating Partnership and a wholly-owned subsidiary of Invesco owned the remaining
1.2%
. The Company has
one
operating segment.
The Company primarily invests in:
|
•
|
Residential mortgage-backed securities ("RMBS") that are guaranteed by a U.S. government agency such as the Government National Mortgage Association, or a federally chartered corporation such as the Federal National Mortgage Association ("Fannie Mae") or the Federal Home Loan Mortgage Corporation ("Freddie Mac") (collectively "Agency RMBS");
|
|
•
|
RMBS that are not guaranteed by a U.S. government agency (“non-Agency RMBS”);
|
|
•
|
Credit risk transfer securities that are unsecured obligations issued by government-sponsored enterprises ("GSE CRT");
|
|
•
|
Commercial mortgage-backed securities ("CMBS");
|
|
•
|
Residential and commercial mortgage loans; and
|
|
•
|
Other real estate-related financing agreements.
|
The Company is externally managed and advised by Invesco Advisers, Inc. (the "Manager"), a registered investment adviser and an indirect, wholly-owned subsidiary of Invesco Ltd. (“Invesco”), a leading independent global investment management firm. The Company elected to be taxed as a real estate investment trust (“REIT”) for U.S. federal income tax purposes under the provisions of the Internal Revenue Code of 1986, as amended, commencing with the Company's taxable year ended December 31, 2009. To maintain the Company’s REIT qualification, the Company is generally required to distribute at least
90%
of its REIT taxable income to its stockholders annually. The Company operates its business in a manner that permits exclusion from the "Investment Company" definition under the Investment Company Act of 1940, as amended.
The Company generally finances its investments through short- and long-term borrowings structured as repurchase agreements and secured loans. The Company historically invested in residential loans held-for-investment and financed these investments through asset-backed securities ("ABS") issued by consolidated securitization trusts. The Company has also financed investments through the issuances of debt and equity and may utilize other forms of financing in the future.
Basis of Presentation and Consolidation
In the opinion of management, the consolidated financial statements reflect all adjustments, consisting of normal recurring accruals, which are necessary for a fair presentation of the financial condition and results of operations for the periods presented. All significant intercompany transactions, balances, revenues and expenses are eliminated upon consolidation.
The consolidated financial statements have been prepared in accordance with U.S. GAAP and consolidate the financial statements of the Company, its controlled subsidiaries, and certain residential loan securitization trusts (the "Residential Securitizations") that meet the definition of a variable interest entity ("VIE"). On December 9, 2015, the Company completed the sale of certain beneficial interests in the Residential Securitizations and deconsolidated the Residential Securitizations. Refer to Note 3 - "Variable Interest Entities" for additional information regarding the impact of consolidation and deconsolidation of the Residential Securitizations.
The Residential Securitizations were VIEs because they did not have equity that met the definition of U.S. GAAP equity at risk. In determining if a securitization trust should be consolidated, the Company evaluates whether it has both (i) the power to direct the activities of the securitization trust that most significantly impact its economic performance and (ii) the right to receive benefits from the securitization trust or the obligation to absorb losses of the securitization trust that could be significant. The Company's determination of whether it is the primary beneficiary of a securitization trust includes both a qualitative and quantitative analysis. The Company determined that it was the primary beneficiary of the Residential Securitizations because it was involved in certain aspects of the design of the Residential Securitizations and had certain default oversight rights on defaulted residential loans. In addition, the Company owned the most subordinated class of asset-backed
|
81
|
||
securities issued by the Residential Securitizations and had the obligation to absorb losses and right to receive benefits from the Residential Securitizations that could potentially be significant to the Residential Securitizations.
The Residential Securitizations held pools of residential mortgage loans and issued series of asset-backed securities payable from the cash flows generated by the underlying pools of residential mortgage loans. The Residential Securitizations were non-recourse financing for the residential mortgage loans held-for-investment. Generally, a portion of the asset-backed securities issued by the Residential Securitizations were sold to unaffiliated third parties and the balance was purchased by the Company. The Company classified the underlying residential mortgage loans owned by the Residential Securitizations as residential loans held-for-investment in its consolidated balance sheets. The asset-backed securities issued to third parties were recorded as liabilities on the Company's consolidated balance sheets. The Company recorded interest income on the residential loans held-for-investment, interest expense on the asset-backed securities issued to third parties and direct operating expenses incurred by the Residential Securitizations in the Company's consolidated statements of operations. The Company eliminated all intercompany balances and transactions between itself and the Residential Securitizations. The Company recorded the initial underlying assets and liabilities of the Residential Securitizations at their fair value upon consolidation into the Company and, as such, no gain or loss was recorded upon consolidation.
Use of Estimates
The preparation of consolidated financial statements in conformity with U.S. GAAP requires management to make estimates and assumptions that affect the amounts reported in the consolidated financial statements and accompanying notes. Examples of estimates include, but are not limited to, estimates of the fair values of financial instruments, interest income on mortgage-backed and credit risk transfer securities, allowance for loan losses and other-than-temporary impairment charges. Actual results may differ from those estimates.
Translation of Foreign Currencies
The functional currency of the Company and its subsidiaries is U.S. dollars. Transactions in foreign currencies are recorded at the rates of exchange prevailing on the date of the transactions. At each balance sheet date, monetary assets and liabilities that are denominated in foreign currencies are remeasured at the rates prevailing at the balance sheet date. Gains and losses arising on revaluation are included in the consolidated statements of operations.
The Company's reporting currency is U.S. dollars. Upon consolidation, the assets and liabilities of the Company’s investment in an unconsolidated venture whose functional currency is the Euro is translated to U.S. dollars using the period-end exchange rates. Equity accounts are translated at historical rates, except for the change in retained earnings during the year, which is the result of the income statement translation process. Revenue and expense accounts are translated using the weighted average exchange rate during the period. The cumulative translation adjustments associated with the investment in the unconsolidated venture are recorded in accumulated other comprehensive income (loss), a component of consolidated stockholders’ equity.
The Company generally hedges interest rate and foreign currency exposure with derivative financial instruments. Refer to Note 8 - "Derivatives and Hedging Activities" for further information.
Fair Value Measurements
The Company discloses the fair value of its financial instruments according to a fair value hierarchy (Levels 1, 2, and 3, as defined). In accordance with U.S. GAAP, the Company is required to provide enhanced disclosures regarding instruments in the Level 3 category (which require significant management judgment), including a separate reconciliation of the beginning and ending balances for each major category of assets and liabilities.
To determine fair value of its financial instruments, the Company generally obtains one price per instrument from its primary valuation service. If this service cannot provide a price, the Company will seek a value from other vendors. The valuation services use various observable inputs which may include a combination of benchmark yields, trades, broker/dealer quotes, issuer spreads, bids, offers and benchmark securities to determine prices. Both the Company and the pricing vendor continuously monitor market indicators and economic events to determine if any may have an impact on the valuations.
Overrides of prices from pricing vendors are rare in the current market environment for the assets the Company holds. Examples of instances that would cause an override include if the Company recently traded the same security or there is an indication of market activity that would cause the vendor price to be unreliable. In the rare instance where a price is adjusted, the Company has a control process to monitor the reason for such adjustment.
To gain comfort that vendor prices are representative of current market information, the Company compares the transaction prices of security purchases and sales to the valuation levels provided by the vendors. Price differences exceeding pre-defined tolerance levels are identified and investigated and may be challenged. Trends are monitored over time and if there
|
82
|
||
are indications that the valuations are not comparable to market activity, the vendors are asked to provide detailed information regarding their methodology and inputs. Transparency tools are also available from the vendors which help the Company understand data points and/or market inputs used for pricing securities.
In addition, the Company performs due diligence procedures on all vendors on at least an annual basis. A questionnaire is sent to vendors which requests information such as changes in methodologies, business recovery preparedness, internal controls and confirmation that evaluations are generated based on market data. Physical visits are also made to each vendor’s office.
As described in Note 10 - "Fair Value of Financial Instruments," the Company evaluates the source used to provide the market price for each security and makes a determination on its categorization within the fair value hierarchy. If the price of a security is obtained from quoted prices for identical instruments in active markets, the security is classified as a level 1 security. If the price of a security is obtained from quoted prices for similar instruments or model-derived valuations whose inputs are observable, the security is classified as a level 2 security. If the inputs appear to be unobservable, the security would be classified as a level 3 security. Transfers between levels, if any, are determined by the Company at the end of the reporting period.
Mortgage-Backed and Credit Risk Transfer Securities
All of the Company’s mortgage-backed securities ("MBS") except for Agency and non-Agency residential interest-only securities ("RMBS IOs") are classified as available-for-sale and reported at fair value. Fair value is determined by obtaining valuations from an independent source. If the fair value of a security is not available from a third-party pricing service, or such data appears unreliable, the Company may estimate the fair value of the security using a variety of methods including other pricing services, discounted cash flow analysis, matrix pricing, option adjusted spread models and other fundamental analysis of observable market factors.
The Company records its purchases of mortgage-backed and credit risk transfer securities on the trade date. Although the Company generally intends to hold most of its mortgage-backed and credit risk transfer securities until maturity, the Company may, from time to time, sell any of its mortgage-backed and credit risk transfer securities as part of its overall management of its investment portfolio.
Unrealized gains or losses on all MBS, except for RMBS IOs, are recorded in accumulated other comprehensive income, a separate component of stockholders' equity, until sale or disposition of the investment. Upon sale or disposition, the cumulative gain or loss previously reported in stockholders' equity is recognized in income. Realized gains and losses from sales of MBS are determined based upon the specific identification method.
RMBS IOs are hybrid financial instruments that contain embedded derivatives. RMBS IOs are carried at fair value on the Company's consolidated balance sheet with changes in fair value recognized in the Company's consolidated statements of operations.
GSE CRTs are unsecured obligations of Fannie Mae and Freddie Mac. Coupon payments on the securities are based on LIBOR, and principal payments are based on prepayments, losses and defined credit events in a reference pool of mortgage loans that collateralize Agency RMBS.
The Company has elected the fair value option for GSE CRTs purchased on or after August 24, 2015 due to the complexities associated with bifurcation of GSE CRTs into debt host contract and embedded derivative. Under the fair value option, changes in fair value for GSE CRTs are recognized in the Company's consolidated statements of operations.
GSE CRTs purchased prior to August 24, 2015 are reported at fair value and accounted for as hybrid financial instruments consisting of a debt host contract and an embedded derivative. Unrealized gains or losses arising from changes in fair value of the debt host contract, excluding other-than-temporary impairment, are recognized in accumulated other comprehensive income, a separate component of stockholders’ equity, until sale or disposition of the investment. Upon sale or disposition of the debt host contract, the cumulative gain or loss previously reported as a separate component of stockholders’ equity is recognized in income. Realized gains and losses from sales of GSE CRTs are determined based upon the specific identification method. Realized and unrealized gains or losses arising from changes in fair value of the embedded derivative are recognized in realized and unrealized credit derivative income (loss), net in the Company’s consolidated statements of operations.
The Company considers its portfolio of Agency RMBS to be of high credit quality under applicable accounting guidance. For non-Agency RMBS, GSE CRTs and CMBS, the Company does not rely on ratings from third party agencies to determine the credit quality of the investment. The Company uses internal models that analyze the loans underlying each security and evaluates factors including, but not limited to, delinquency status, loan-to-value ratios, borrower credit scores, occupancy status and geographic concentration to estimate the expected future cash flows. The Company places reliance on these internal models in determining credit quality.
|
83
|
||
While non-Agency RMBS, GSE CRTs and CMBS with expected future losses would generally be purchased at a discount to par, the potential for a significant adverse change in expected cash flows remains. The Company therefore evaluates each security for other-than-temporary impairment at least quarterly.
The determination of whether a security is other-than-temporarily impaired involves judgments and assumptions based on subjective and objective factors. Consideration is given to (i) the length of time and the extent to which the fair value has been less than amortized cost, (ii) the financial condition and near-term prospects of recovery in fair value of the security, and (iii) the Company’s intent to sell the security and whether it is more likely than not that the Company will be required to sell the security before recovery of its amortized cost basis.
The Company recognizes in earnings and reflects as a reduction in the cost basis of the security the amount of any other-than-temporary impairment related to credit losses or impairments on securities that the Company intends to sell or for which it is more likely than not that the Company will need to sell before recoveries. The amount of the other-than-temporary impairment on debt securities related to other factors is recorded consistent with changes in the fair value of all other available-for-sale securities as a component of consolidated stockholders’ equity in other comprehensive income or loss with no change to the cost basis of the security.
Residential Loans Held-For-Investment
Residential loans held-for-investment are residential mortgage loans that were held by consolidated securitization trusts. Residential loans held-for-investment were carried at unpaid principal balance net of any premiums and an allowance for loan losses.
The Company established an allowance for residential loan losses based on the Company's estimate of credit losses. The Company calculated expected losses by estimating the default rate and expected loss severities on the loans. The Company considered the following factors in its evaluation of the allowance for loan losses:
|
•
|
Loan-to-value ratios, credit scores, geographic concentration and other observable data;
|
|
•
|
Historical default rates of loans with similar characteristics; and
|
|
•
|
Expected future macroeconomic trends including changes in home prices and the unemployment rate.
|
Commercial Loans Held-For-Investment
Commercial loans held-for-investment by the Company are carried at amortized cost, net of any allowance for loan losses. An individual loan is considered impaired when it is deemed probable that the Company will not be able to recover its investment and any other anticipated futures payments. The Company generally considers the following factors in evaluating whether a commercial loan is impaired:
|
•
|
Loan-to-value ratios;
|
|
•
|
The most recent financial information available for each loan and associated properties, including net operating income, debt service coverage ratios, occupancy rates, rent rolls, as well as any other factors the Company considers relevant, including, but not limited to, specific loan trigger events that would indicate an adverse change in expected cash flows or payment delinquency;
|
|
•
|
Economic trends, both macroeconomic as well as those directly affecting the properties associated with the loans, and the supply and demand trends in the market in which the subject property is located; and
|
|
•
|
The loan sponsor or borrowing entity’s ability to ensure that properties associated with the loan are managed and operated sufficiently.
|
When an individual commercial loan is deemed to be impaired, the Company records an allowance to reduce the carrying value of the loan to the current present value of expected future cash flows discounted at the loan’s effective interest rate or if the loan is collateral dependent, the Company reduces the carrying value to the estimated fair value of the collateral, with a corresponding charge to provision for loan losses on the Company's consolidated statements of operations.
Interest Income Recognition
Mortgage-Backed Securities
Interest income on MBS is accrued based on the outstanding principal balance of the securities and their contractual terms. Premiums or discounts are amortized or accreted into interest income over the life of the investment using the effective interest method. Interest income on the Company's non-Agency MBS (and other prepayable mortgage-backed securities where the Company may not recover substantially all of its initial investment) is based on estimated cash flows. Management
|
84
|
||
estimates, at the time of purchase, the future expected cash flows and determines the effective interest rate based on these estimated cash flows and the Company’s purchase price. Over the life of the investments, these estimated cash flows are updated and a revised yield is computed based on the current amortized cost of the investment. In estimating these cash flows, there are a number of assumptions that are subject to uncertainties and contingencies, including the rate and timing of principal payments (prepayments, repurchases, defaults and liquidations), the pass through or coupon rate and interest rate fluctuations. These uncertainties and contingencies are difficult to predict and are subject to future events that may impact management’s estimates and the Company's interest income.
For Agency RMBS that cannot be prepaid in such a way that the Company would not recover substantially all of its initial investment, interest income recognition is based on contractual cash flows. The Company does not estimate prepayments in applying the effective interest method.
Credit Risk Transfer Securities
Interest income on credit risk transfer securities is accrued based on the coupon rate of the debt host contract which reflects the credit risk of GSE unsecured senior debt with a similar maturity. Premiums or discounts associated with the purchase of credit risk transfer securities are amortized or accreted into interest income over the life of the debt host contract using the effective interest method. The difference between the coupon rate on the hybrid instrument and the coupon rate on the GSE CRT debt host contract is considered premium income associated with the embedded derivative and is recorded in realized and unrealized credit derivative income (loss), net in the Company’s consolidated statements of operations.
Residential Loans
The Company recognized interest income from residential loans on an accrual basis and amortized the related premiums into interest income using the effective interest method over the weighted average life of these loans. In estimating the weighted average life of these loans, there were a number of assumptions that were subject to estimation, including the rate and timing of principal payments, defaults, loss severity given default and other factors. Coupon interest was recognized as revenue when earned and deemed collectible or until a loan became more than
90 days
past due, at which point the loan was placed on nonaccrual status. Interest previously accrued for loans that had been placed on non-accrual status was reversed against interest income in the period the loan was placed in nonaccrual status. Residential loans delinquent more than
90 days
or in foreclosure were characterized as delinquent. Cash principal and interest that was advanced from servicers after a loan becomes greater than
90 days
past due was recorded as a liability due to the servicer. When a delinquent loan previously placed on nonaccrual status had cured, meaning all delinquent principal and interest had been remitted by the borrower, the loan was placed back on accrual status.
Commercial Loans
The Company recognizes interest income from commercial loans when earned and deemed collectible, or until a loan becomes past due based on the terms of the loan agreement. Any related origination fees, net of origination cost are amortized into interest income using the effective interest method over the life of the loan. Interest received after a loan becomes past due or impaired is used to reduce the outstanding loan principal balance. When a delinquent loan previously placed on nonaccrual status has cured, meaning all delinquent principal and interest have been remitted by the borrower, the loan is placed back on accrual status. Alternately, loans that have been individually impaired may be placed back on accrual status if restructured and after the loan is considered re-performing. A restructured loan is considered re-performing when the loan has been current for at least
12 months
.
Cash and Cash Equivalents
The Company considers all highly liquid investments that have original or remaining maturity dates of three months or less when purchased to be cash equivalents. At
December 31, 2015
, the Company had cash and cash equivalents in excess of the FDIC deposit insurance limit of $
250,000
per institution. The Company mitigates its risk of loss by actively monitoring the counterparties.
Due from Counterparties / Collateral Held Payable
Due from counterparties represents cash posted with the Company's counterparties as collateral for the Company’s derivatives and repurchase agreements. Collateral held payable represents cash posted with the Company by counterparties as collateral under the Company’s derivatives and repurchase agreements. To the extent the Company receives collateral other than cash from its counterparties, such assets are not included in the Company’s consolidated balance sheets. Notwithstanding the foregoing, if the Company either sells such assets or pledges the assets as collateral pursuant to a repurchase agreement, the cash received and the corresponding liability is reflected on the consolidated balance sheets.
|
85
|
||
Investments in Unconsolidated Ventures
The Company’s non-controlling investments in unconsolidated ventures are included in other investments in the consolidated balance sheets and are accounted for under the equity method. Capital contributions, distributions, profits and losses of the entities are allocated in accordance with the terms of the entities’ operating agreements. Such allocations may differ from the stated percentage interests, if any, as a result of preferred returns and allocation formulas as described in the entities' operating agreements.
Deferred Securitization and Financing Costs
As of December 31, 2015, deferred securitization and financing costs consist of costs incurred in connection with the issuance of the Company's exchangeable senior notes. These costs include underwriting, rating agency, legal, accounting and other fees. Deferred costs are amortized as an adjustment to interest expense using the effective interest method over the stated legal maturity of the exchangeable senior notes. As of December 31, 2014, deferred securitization and financing costs also included costs associated with the issuance of asset-backed securities by Residential Securitizations. As a result of deconsolidation of the Company's Residential Securitizations, these deferred securitization costs were written off in 2015. Refer to Note 3 - "Variable Interest Entities" for further information.
Repurchase Agreements
The Company finances its purchases of mortgage-backed and credit risk transfer securities primarily through the use of repurchase agreements. Repurchase agreements are treated as collateralized financing transactions and are carried at their contractual amounts, including accrued interest, as specified in the respective agreements.
Effective January 1, 2015, the Company adopted newly issued accounting guidance for repurchase financings. Under the new standard, the Company no longer applies the "linked" accounting model to instances where the Company purchases mortgage-backed and credit risk transfer securities and enters into repurchase agreements to finance the purchase with the same counterparty. Purchases of mortgage-backed and credit risk transfer securities and repurchase financings are considered separately, and the repurchase agreement component of the transaction is accounted for as a secured borrowing. The Company records the mortgage-backed and credit risk transfer securities and the related repurchase agreement financing on a gross basis in its consolidated balance sheets, and the corresponding interest income and interest expense on a gross basis in its consolidated statements of operations.
None of the Company's repurchase financing transactions prior to January 1, 2015 qualified as linked transactions and therefore were not accounted for as derivatives. Accordingly, the Company did not record a cumulative effect adjustment to retained earnings as of January 1, 2015 as a result of adopting the new guidance.
Secured Loans
The Company's wholly-owned subsidiary, IAS Services LLC, is a member of the Federal Home Loan Bank of Indianapolis ("FHLBI"). As a member of the FHLBI, IAS Services LLC may borrow funds from the FHLBI in the form of secured advances. FHLBI advances are treated as secured financing transactions and are carried at their contractual amounts.
|
86
|
||
Asset-Backed Securities Issued by Securitization Trusts
Asset-backed securities issued by securitization trusts were recorded at principal balances net of unamortized premiums or discounts. The Company recognized interest expense on an accrual basis and amortized the related premiums or discounts into interest expense using the effective interest method over the weighted average contractual maturity of these asset-backed securities.
Dividends and Distributions Payable
Dividends and distributions payable represent dividends declared at the balance sheet date which are payable to common stockholders, preferred stockholders, and an Invesco wholly-owned subsidiary, the non-controlling interest common unit holder of the Operating Partnership.
Earnings (Loss) per Share
The Company calculates basic earnings (loss) per share by dividing net income (loss) attributable to common stockholders for the period by the weighted-average number of shares of the Company’s common stock outstanding for that period. Diluted earnings per share takes into account the effect of dilutive instruments, such as units of limited partnership interest in the Operating Partnership ("OP Units"), exchangeable debt, and unvested restricted stock and uses the average share price for the period in determining the number of incremental shares that are to be added to the weighted-average number of shares outstanding.
Share-Based Compensation
The Company has adopted an equity incentive plan under which its independent directors, as part of their compensation for serving as directors, are eligible to receive quarterly stock awards. In addition, the Company may compensate the officers and employees of its Manager and its affiliates under this plan pursuant to the management agreement.
Share-based compensation arrangements include share options, restricted and non-restricted share awards, performance-based awards and share appreciation rights. For awards to the Company's independent directors, compensation costs relating to share-based payment transactions are recognized in the consolidated financial statements, based on the fair value of the equity or liability instruments issued on the date of grant. Compensation related to stock awards to employees of the Company's Manager and its affiliates is recorded at the estimated fair value of the award during the vesting period. The Company makes an upward or downward adjustment to compensation expense for the difference in the fair value at the date of grant and the date the award is earned.
Underwriting Commissions and Offering Costs
Underwriting commissions and direct costs incurred in connection with the Company’s common and preferred stock offerings are reflected as a reduction of additional paid-in-capital and preferred stock, respectively.
Comprehensive Income
The Company's comprehensive income consists of net income, as presented in the consolidated statements of operations, adjusted for unrealized gains and losses on MBS and the debt host contract associated with GSE CRTs; reclassification of amortization of net deferred losses on de-designated interest rate swaps to repurchase agreements interest expense and foreign currency translation adjustments on an investment in an unconsolidated venture. Unrealized gains and losses on the Company's MBS and the debt host contract associated with GSE CRTs are reclassified into net income upon their sale or termination.
Accounting for Derivative Financial Instruments
U.S. GAAP provides disclosure requirements for derivatives and hedging activities with the intent to provide users of financial statements with an enhanced understanding of: (i) how and why an entity uses derivative instruments; (ii) how derivative instruments and related hedged items are accounted for; and (iii) how derivative instruments and related hedged items affect an entity’s financial position, financial performance, and cash flows. U.S. GAAP requires qualitative disclosures about objectives and strategies for using derivatives, quantitative disclosures about the fair value of and gains and losses on derivative instruments, and disclosures about credit-risk-related contingent features in derivative instruments.
The Company records all derivatives on its consolidated balance sheets at fair value. The accounting for changes in the fair value of derivatives depends on the intended use of the derivative, whether the Company has elected to designate a derivative in a hedging relationship and apply hedge accounting and whether the hedging relationship has satisfied the criteria necessary to apply hedge accounting. Derivatives designated and qualifying as a hedge of the exposure to changes in the fair value of an asset, liability, or firm commitment attributable to a particular risk, such as interest rate risk, are considered fair
|
87
|
||
value hedges. Derivatives designated and qualifying as a hedge of the exposure to variability in expected future cash flows, or other types of forecasted transactions, are considered cash flow hedges. Derivatives may also be designated as hedges of the foreign currency exposure of a net investment in a foreign operation. Hedge accounting generally provides for the matching of the timing of gain or loss recognition on the hedging instrument with the recognition of the changes in the fair value of the hedged asset or liability that are attributable to the hedged risk in a fair value hedge or the earnings effect of the hedged forecasted transactions in a cash flow hedge. The Company may enter into derivative contracts, such as credit default swaps, that are intended to economically hedge certain of its risks, even though hedge accounting does not apply or the Company elects not to apply hedge accounting under U.S. GAAP.
The Company is a party to hybrid financial instruments that contain embedded derivative instruments. At inception, the Company assesses whether the economic characteristics of the embedded derivative instruments are clearly and closely related to the economic characteristics of the remaining component of the financial instrument (i.e., the debt host contract), whether the
financial instrument is remeasured to fair value through earnings and whether a separate instrument with the same terms as the embedded instrument would meet the definition of a derivative instrument. When it is determined that (1) the embedded instrument possesses economic characteristics that are not clearly and closely related to the economic characteristics of the debt host contract, (2) the financial instrument is not remeasured to fair value through earnings and (3) a separate instrument with the same terms would qualify as a derivative instrument, the embedded instrument qualifies as an embedded derivative that is separated from the debt host contract. The embedded derivative is recorded at fair value, and changes in fair value are recorded in realized and unrealized credit derivative income (loss), net in the Company's consolidated statements of operations.
Effective December 31, 2013, the Company voluntarily discontinued hedge accounting for its interest rate swap agreements by de-designating the interest rate swaps as cash flow hedges. No interest rate swaps were terminated in conjunction with this action, and the Company’s risk management and hedging practices were not impacted. However, the Company’s accounting for these transactions changed beginning January 1, 2014. All of the Company’s interest rate swaps had previously been accounted for as cash flow hedges under the applicable guidance. As a result of discontinuing hedge accounting, changes in the fair value of the interest rate swap agreements are recorded in gain (loss) on derivative instruments, net in the Company’s consolidated statements of operations, rather than in accumulated other comprehensive income (loss) (“AOCI”). Also, net interest paid or received under the interest rate swaps, which up through December 31, 2013 was recognized in interest expense, is now recognized in gain (loss) on derivative instruments, net on the Company's consolidated statements of operations. The interest rate swaps continue to be reported as derivative assets or derivative liabilities on the Company’s consolidated balance sheets at their fair value.
As long as the forecasted transactions that were being hedged (i.e., rollovers of the Company’s repurchase agreement borrowings) are still expected to occur, the balance in AOCI from the interest rate swap activity up through December 31, 2013 will remain in AOCI and be recognized in the Company’s consolidated statements of operations as interest expense over the remaining term of the interest rate swaps. Refer to Note 8 - "Derivatives and Hedging Activities" for further information.
The Company evaluates the terms and conditions of its holdings of swaptions, futures contracts, currency forward contracts and to-be-announced ("TBA") securities to determine if an instrument has the characteristics of an investment or should be considered a derivative under U.S. GAAP. Accordingly swaptions, futures contracts, currency forward contracts and TBAs having the characteristics of derivatives are accounted for at fair value with such changes recognized in gain (loss) on derivative instruments, net in the consolidated statements of operations. The fair value of these swaptions, futures contracts, currency forward contracts and TBAs is included in derivative assets or derivative liabilities on the consolidated balance sheets.
Income Taxes
The Company elected to be taxed as a REIT, commencing with the Company's taxable year ended December 31, 2009. Accordingly, the Company will generally not be subject to U.S. federal and applicable state and local corporate income tax to the extent that the Company makes qualifying distributions to its common stockholders, and provided the Company satisfies on a continuing basis, through actual investment and operating results, the REIT requirements including certain asset, income, distribution and stock ownership tests. If the Company fails to qualify as a REIT and does not qualify for certain statutory relief provisions, it will be subject to U.S. federal, state and local income taxes and may be precluded from qualifying as a REIT for the four taxable years following the year in which the Company lost its REIT qualification. Accordingly, the Company’s failure to qualify as a REIT could have a material adverse impact on the Company's results of operations and amounts available for distribution to stockholders.
A REIT’s dividend paid deduction for qualifying dividends to the Company’s stockholders is computed using its REIT taxable income as opposed to net income reported on the consolidated financial statements. REIT taxable income will generally differ from net income because the determination of REIT taxable income is based on tax regulations and not financial accounting principles.
|
88
|
||
The Company has elected to treat one of its subsidiaries as a taxable REIT subsidiary (“TRS”). In general, a TRS may hold assets and engage in activities that the Company cannot hold or engage in directly and generally may engage in any real estate or non-real estate-related business. A TRS is subject to U.S. federal, state and local corporate income taxes.
If a TRS generates net income, the TRS can declare dividends to the Company which will be included in its taxable income and necessitate a distribution to its stockholders. Conversely, if the Company retains earnings at a TRS level, no distribution is required, and the Company can increase book equity of the consolidated entity. The Company has no adjustments regarding its tax accounting treatment of any uncertainties. The Company would recognize interest and penalties related to uncertain tax positions, if any, as income tax expense, which would be included in general and administrative expenses.
Reclassifications
Certain prior period reported amounts have been reclassified to be consistent with the current presentation. Consolidated securitization trust expenses, previously presented in general and administrative expenses, are presented as a separate line item on the Company's consolidated statements of operations. The reclassification of consolidated securitization trust expenses had no impact on net income or equity attributable to common stockholders.
Recent Accounting Pronouncements
None.
Recent Accounting Pronouncements Not Yet Adopted
In February 2015, the FASB issued modifications to existing consolidation guidance for reporting organizations that are required to evaluate whether they should consolidate certain legal entities. The guidance is effective for fiscal years and interim periods within those years beginning after December 15, 2015, and requires either a retrospective or a modified retrospective approach to adoption. Early adoption is permitted. The new guidance is not expected to have a material impact on the Company's consolidated financial statements.
In April 2015, the FASB issued guidance to amend the presentation of debt issuance cost related to a recognized debt liability. Under the new guidance, the debt issuance costs will be presented in the balance sheet as a direct deduction from the carrying amount of the recognized debt liability, consistent with debt discounts. The recognition and measurement guidance for debt issuance costs are not affected under the new guidance. The Company will implement the new guidance in the first quarter of 2016 on a retrospective basis. Upon adoption, the Company will comply with the applicable disclosures for a change in an accounting principle. These disclosures include the nature of and reason for the change in accounting principle, the transition method, a description of the prior-period information that has been retrospectively adjusted, and the effect of the change on the financial statement line items. The new guidance will not have a material impact on the Company's consolidated financial statements.
In January 2016, the FASB issued guidance to improve certain aspects of recognition, measurement, presentation, and disclosure of financial instruments. The Company is required to adopt the new guidance in the first quarter of 2018. Early adoption is permitted. The Company should apply the guidance by means of a cumulative-effect adjustment to the balance sheet as of the beginning of the fiscal year of adoption. The guidance related to equity securities without readily determinable fair values should be applied prospectively to equity investments that exist at the date of adoption. The Company is currently evaluating the potential impact of the new guidance on its consolidated financial statements.
The Company's maximum risk of loss in VIEs in which the Company is not the primary beneficiary at
December 31, 2015
is presented in the table below.
|
$ in thousands
|
Carrying
Amount
|
Company's Maximum Risk of Loss
|
|||
|
Non-Agency RMBS
|
2,692,487
|
|
2,692,487
|
|
|
|
CMBS
|
2,915,964
|
|
2,915,964
|
|
|
|
Total
|
5,608,451
|
|
5,608,451
|
|
|
Refer to Note 4 - "Mortgage-Backed and Credit Risk Transfer Securities" for additional details regarding these investments.
On December 9, 2015, the Company completed the sale of certain beneficial interests (the "Securities") in the Residential Securitizations for $
69.0 million
(the "Transaction"). The Securities sold included the most subordinated classes of asset-backed securities issued by the Residential Securitizations. As a result of the Transaction, the Company no longer has the power
|
89
|
||
to direct the activities of the Residential Securitizations through default oversight rights and is therefore no longer the primary beneficiary of the Residential Securitizations. The Company does not manage the Residential Securitizations nor serve or appoint the loan servicer for the Residential Securitizations. The Company’s risk with respect to each investment in a Residential Securitization was limited to its direct ownership in the Residential Securitization. The residential loans owned by the Residential Securitizations were held solely to satisfy the liabilities of the Residential Securitizations, and the investors in the asset-backed securities issued by the Residential Securitizations had no recourse to the Company.
The Company deconsolidated the assets and liabilities of the Residential Securitizations as of the date of the Transaction. The following table summarizes the amounts deconsolidated from the consolidated balance sheet.
|
$ in thousands
|
As of December 9, 2015
|
|
|
Residential loans, held-for-investment
|
3,181,662
|
|
|
Accrued interest receivable
|
9,889
|
|
|
Deferred securitization and financing costs
|
4,347
|
|
|
Total assets
|
3,195,898
|
|
|
Accrued interest and accrued expenses payable
|
11,413
|
|
|
Asset-backed securities issued by securitization trusts
|
2,740,797
|
|
|
Total liabilities
|
2,752,210
|
|
The deconsolidation of the Residential Securitizations did not qualify for presentation and disclosure as discontinued operations. The Company recorded a loss of
$19.6 million
on deconsolidation of the Residential Securitizations in its consolidated statement of operations as gain (loss) on investments, net. The following table presents the components of the loss on deconsolidation of VIEs.
|
$ in thousands
|
As of December 9, 2015
|
|
|
Gain (loss) related to derecognition of Residential Securitizations, net
|
(13,260
|
)
|
|
Gain (loss) related to remeasurement of retained interest, net
|
3,068
|
|
|
Gain (loss) on sale of the securities, net
|
(9,431
|
)
|
|
Total gain (loss) on deconsolidation of VIEs, net
|
(19,623
|
)
|
The following table summarizes the net income (loss) impact of the Residential Securitizations excluding the loss on deconsolidation.
|
Years ended December 31,
|
||||||||
|
$ in thousands
|
2015
|
2014
|
2013
|
|||||
|
Interest income - Residential loans
|
110,908
|
|
88,073
|
|
34,122
|
|
||
|
Interest expense - Asset-backed securities
|
82,041
|
|
68,159
|
|
26,682
|
|
||
|
Net interest income
|
28,867
|
|
19,914
|
|
7,440
|
|
||
|
(Reduction in) provision for loan losses
|
(213
|
)
|
(142
|
)
|
884
|
|
||
|
Net interest income after (reduction in) provision for loan losses
|
29,080
|
|
20,056
|
|
6,556
|
|
||
|
Expenses - Consolidated securitization trusts
|
8,219
|
|
6,076
|
|
2,137
|
|
||
|
Net income
|
20,861
|
|
13,980
|
|
4,419
|
|
||
|
90
|
||
During the year ended
December 31, 2015
, the Company invested in and consolidated
one
new Residential Securitization with total assets and total liabilities of
$373.5 million
before consolidation into the Company. As of December 31, 2014, the consolidated financial statements included the consolidation of
ten
Residential Securitizations. The following table presents a summary of the assets and liabilities of the Company's consolidated securitization trusts as of
December 31, 2014
. Intercompany balances have been eliminated for purposes of this presentation.
|
$ in thousands
|
December 31, 2014
|
|
|
Residential loans, held-for-investment
|
3,365,003
|
|
|
Accrued interest receivable
|
10,562
|
|
|
Deferred securitization costs
|
5,032
|
|
|
Total assets
|
3,380,597
|
|
|
Accrued interest and accrued expenses payable
|
8,692
|
|
|
Asset-backed securities issued by securitization trusts
|
2,929,820
|
|
|
Total liabilities
|
2,938,512
|
|
Residential Loans Held by Consolidated Securitization Trust
Residential loans held by consolidated securitization trusts were carried at unpaid principal balance net of any premiums and discount and an allowance for loan losses. The residential loans were secured by a lien on the underlying residential property.
The following table details the carrying value for residential loans held-for-investment at
December 31, 2014
.
|
$ in thousands
|
December 31, 2014
|
||
|
Principal balance
|
3,332,192
|
|
|
|
Unamortized premium (discount), net
|
33,553
|
|
|
|
Recorded investment
|
3,365,745
|
|
|
|
Allowance for loan losses
|
(742
|
)
|
|
|
Carrying value
|
3,365,003
|
|
|
Allowance for loan losses on Residential Loans Held by Consolidated Securitization Trusts
As discussed in Note 2 - "Summary of Significant Accounting Policies," the Company established and maintained an allowance for loan losses on residential loans held by consolidated securitization trusts based on the Company's estimate of credit losses.
The following table summarizes the activity in the allowance for loan losses for the years
ended
December 31, 2015
and
December 31, 2014
.
|
$ in thousands
|
December 31, 2015
|
December 31, 2014
|
|||
|
Balance at beginning of period
|
(742
|
)
|
(884
|
)
|
|
|
Charge-offs, net
|
—
|
|
—
|
|
|
|
Reduction in (provision) for loan losses
|
213
|
|
142
|
|
|
|
Deconsolidation of VIEs
|
529
|
|
—
|
|
|
|
Balance at end of period
|
—
|
|
(742
|
)
|
|
|
91
|
||
Asset-Backed Securities Issued by Securitization Trusts
Asset-backed securities issued by securitization trusts were recorded at principal balance net of unamortized premiums or discounts. Asset-backed securities issued by securitization trusts were issued in various tranches and had a weighted average contractual maturity of
28.94 years
at
December 31, 2014
. The investors in the asset-backed securities were not affiliated with the Company and had no recourse to the general credit of the Company.
The asset-backed securities were collateralized by residential loans held in the securitization trusts as summarized in the following table at
December 31, 2014
.
|
December 31, 2014
|
||||||
|
ABS
|
Residential Loans
|
|||||
|
$ in thousands
|
Outstanding
|
Held as Collateral
|
||||
|
Principal balance
|
2,902,378
|
|
3,332,192
|
|
||
|
Interest-only securities
|
15,040
|
|
—
|
|
||
|
Unamortized premium
|
23,735
|
|
41,928
|
|
||
|
Unamortized discount
|
(11,333
|
)
|
(8,375
|
)
|
||
|
Allowance for loan losses
|
—
|
|
(742
|
)
|
||
|
Carrying value
|
2,929,820
|
|
3,365,003
|
|
||
|
Range of weighted average interest rates
|
2.8% - 4.0%
|
|||||
|
Number of securitization trusts consolidated
|
10
|
|
||||
The following tables summarize the Company’s MBS and GSE CRT portfolio by asset type at
December 31, 2015
and
2014
.
|
December 31, 2015
|
|||||||||||||||||||||||
|
$ in thousands
|
Principal
Balance
|
Unamortized
Premium
(Discount)
|
Amortized
Cost
|
Unrealized
Gain/
(Loss), net
|
Fair
Value
|
Net Weighted
Average
Coupon
(1)
|
Period-
end
Weighted
Average
Yield
(2)
|
Quarterly
Weighted
Average
Yield
(3)
|
|||||||||||||||
|
Agency RMBS:
|
|||||||||||||||||||||||
|
15 year fixed-rate
|
1,527,877
|
|
72,389
|
|
1,600,266
|
|
10,664
|
|
1,610,930
|
|
3.72
|
%
|
2.47
|
%
|
2.40
|
%
|
|||||||
|
30 year fixed-rate
|
3,796,091
|
|
249,285
|
|
4,045,376
|
|
18,581
|
|
4,063,957
|
|
4.24
|
%
|
2.81
|
%
|
2.85
|
%
|
|||||||
|
ARM*
|
417,424
|
|
4,625
|
|
422,049
|
|
3,976
|
|
426,025
|
|
2.72
|
%
|
2.58
|
%
|
2.26
|
%
|
|||||||
|
Hybrid ARM
|
3,240,967
|
|
63,324
|
|
3,304,291
|
|
5,234
|
|
3,309,525
|
|
2.73
|
%
|
2.56
|
%
|
2.22
|
%
|
|||||||
|
Total Agency pass-through
|
8,982,359
|
|
389,623
|
|
9,371,982
|
|
38,455
|
|
9,410,437
|
|
3.54
|
%
|
2.65
|
%
|
2.53
|
%
|
|||||||
|
Agency-CMO
(4)
|
1,774,621
|
|
(1,386,284
|
)
|
388,337
|
|
482
|
|
388,819
|
|
2.23
|
%
|
4.29
|
%
|
3.42
|
%
|
|||||||
|
Non-Agency RMBS
(5)(6)(7)
|
4,965,978
|
|
(2,348,080
|
)
|
2,617,898
|
|
74,589
|
|
2,692,487
|
|
2.20
|
%
|
4.00
|
%
|
4.80
|
%
|
|||||||
|
GSE CRT
(8)(9)
|
657,500
|
|
22,593
|
|
680,093
|
|
(21,865
|
)
|
658,228
|
|
1.32
|
%
|
0.72
|
%
|
0.62
|
%
|
|||||||
|
CMBS
(10)
|
3,429,655
|
|
(558,749
|
)
|
2,870,906
|
|
45,058
|
|
2,915,964
|
|
3.95
|
%
|
4.30
|
%
|
4.35
|
%
|
|||||||
|
Total
|
19,810,113
|
|
(3,880,897
|
)
|
15,929,216
|
|
136,719
|
|
16,065,935
|
|
3.08
|
%
|
3.13
|
%
|
3.19
|
%
|
|||||||
*Adjustable-rate mortgage ("ARM")
|
(1)
|
Net weighted average coupon as of
December 31, 2015
is presented net of servicing and other fees.
|
|
(2)
|
Period-end weighted average yield is based on amortized cost as of
December 31, 2015
and incorporates future prepayment and loss assumptions but excludes changes in anticipated interest rates.
|
|
(3)
|
Quarterly weighted average portfolio yield for the period was calculated by dividing interest income, including amortization of premiums and discounts, by the Company's average of the amortized cost of the investments. All yields are annualized.
|
|
(4)
|
Agency collateralized mortgage obligation ("Agency CMO") includes interest-only securities, which represent
27.6%
of the balance based on fair value.
|
|
(5)
|
Non-Agency RMBS held by the Company is
48.4%
variable rate,
45.2%
fixed rate and
6.4%
floating rate based on fair value.
|
|
(6)
|
Of the total discount in non-Agency RMBS,
$281.6 million
is non-accretable.
|
|
(7)
|
Non-Agency RMBS includes interest-only securities, which represent
1.3%
of the balance based on fair value.
|
|
(8)
|
The Company has elected the fair value option for GSE CRTs purchased on or after August 24, 2015, which represent
1.9%
of the balance based on fair value. As a result, GSE CRTs accounted for under the fair value option are not bifurcated between the debt host contract and the embedded derivative.
|
|
(9)
|
GSE CRT weighted average coupon and weighted average yield excludes embedded derivative coupon interest. Coupon interest attributable to the embedded derivative is recorded as realized and unrealized credit derivative income (loss), net on the consolidated statement of operations.
|
|
(10)
|
CMBS includes interest-only securities and commercial real estate mezzanine loan pass-through certificates, which represent
0.9%
and
0.7%
of the balance based on fair value, respectively.
|
|
92
|
||
|
December 31, 2014
|
|
|
|
|
|
|
|
||||||||||||||||
|
$ in thousands
|
Principal
Balance
|
Unamortized
Premium
(Discount)
|
Amortized
Cost
|
Unrealized
Gain, net
|
Fair Value
|
Net
Weighted
Average
Coupon
(1)
|
Period-
end
Weighted
Average
Yield
(2)
|
Quarterly
Weighted
Average
Yield
(3)
|
|||||||||||||||
|
Agency RMBS:
|
|||||||||||||||||||||||
|
15 year fixed-rate
|
1,236,297
|
|
60,764
|
|
1,297,061
|
|
30,040
|
|
1,327,101
|
|
4.05
|
%
|
2.60
|
%
|
2.66
|
%
|
|||||||
|
30 year fixed-rate
|
4,432,301
|
|
297,311
|
|
4,729,612
|
|
60,681
|
|
4,790,293
|
|
4.29
|
%
|
2.97
|
%
|
3.05
|
%
|
|||||||
|
ARM*
|
531,281
|
|
9,068
|
|
540,349
|
|
6,433
|
|
546,782
|
|
2.83
|
%
|
2.27
|
%
|
2.29
|
%
|
|||||||
|
Hybrid ARM
|
2,901,078
|
|
50,757
|
|
2,951,835
|
|
25,083
|
|
2,976,918
|
|
2.78
|
%
|
2.34
|
%
|
2.24
|
%
|
|||||||
|
Total Agency pass-through
|
9,100,957
|
|
417,900
|
|
9,518,857
|
|
122,237
|
|
9,641,094
|
|
3.69
|
%
|
2.68
|
%
|
2.71
|
%
|
|||||||
|
Agency-CMO
(4)
|
1,957,296
|
|
(1,502,785
|
)
|
454,511
|
|
(3,616
|
)
|
450,895
|
|
2.34
|
%
|
4.57
|
%
|
3.62
|
%
|
|||||||
|
Non-Agency RMBS
(5)(6)
|
3,555,249
|
|
(583,890
|
)
|
2,971,359
|
|
90,288
|
|
3,061,647
|
|
3.51
|
%
|
4.12
|
%
|
4.86
|
%
|
|||||||
|
GSE CRT
(7)
|
615,000
|
|
25,814
|
|
640,814
|
|
(15,390
|
)
|
625,424
|
|
1.03
|
%
|
0.49
|
%
|
0.48
|
%
|
|||||||
|
CMBS
(8)
|
3,277,208
|
|
54,893
|
|
3,332,101
|
|
137,734
|
|
3,469,835
|
|
4.74
|
%
|
4.39
|
%
|
4.38
|
%
|
|||||||
|
Total
|
18,505,710
|
|
(1,588,068
|
)
|
16,917,642
|
|
331,253
|
|
17,248,895
|
|
3.61
|
%
|
3.24
|
%
|
3.36
|
%
|
|||||||
*Adjustable-rate mortgage ("ARM")
|
(1)
|
Net weighted average coupon as of
December 31, 2014
is presented net of servicing and other fees.
|
|
(2)
|
Period-end weighted average yield is based on amortized cost as of
December 31, 2014
and incorporates future prepayment and loss assumptions but excludes changes in anticipated interest rates.
|
|
(3)
|
Quarterly weighted average yield for the period was calculated by dividing interest income, including amortization of premiums and discounts, by the Company's average of the amortized cost of the investments. All yields are annualized.
|
|
(4)
|
Agency-CMO includes interest-only securities, which represent
29.1%
of the balance based on fair value.
|
|
(5)
|
Non-Agency RMBS held by the Company is
52.8%
variable rate,
40.1%
fixed rate, and
7.1%
floating rate based on fair value.
|
|
(6)
|
Of the total discount in non-Agency RMBS,
$405.5 million
is non-accretable.
|
|
(7)
|
GSE CRT weighted average coupon and weighted average yield excludes embedded derivative coupon interest recorded as realized and unrealized credit derivative income (loss), net on the consolidated statement of operations.
|
|
(8)
|
CMBS includes commercial real estate mezzanine loan pass-through certificates, which represent
1.3%
of the balance based on fair value.
|
The following table summarizes the Company's non-Agency RMBS portfolio by asset type as of
December 31, 2015
and
2014
.
|
$ in thousands
|
December 31, 2015
|
% of Non-Agency
|
December 31, 2014
|
% of Non-Agency
|
|||||||
|
Prime
|
1,081,428
|
|
40.2
|
%
|
969,849
|
|
31.7
|
%
|
|||
|
Re-REMIC
|
663,853
|
|
24.7
|
%
|
1,000,635
|
|
32.7
|
%
|
|||
|
Alt-A
|
544,306
|
|
20.2
|
%
|
694,467
|
|
22.7
|
%
|
|||
|
Subprime/reperforming
|
402,900
|
|
14.9
|
%
|
396,696
|
|
12.9
|
%
|
|||
|
Total Non-Agency
|
2,692,487
|
|
100.0
|
%
|
3,061,647
|
|
100.0
|
%
|
|||
|
93
|
||
The following table summarizes the credit enhancement provided to the Company's re-securitization of real estate mortgage investment conduit ("Re-REMIC") holdings as of
December 31, 2015
and
2014
.
|
|
Percentage of Re-REMIC Holdings at Fair Value
|
||||
|
Re-REMIC Subordination
(1)
|
December 31, 2015
|
December 31, 2014
|
|||
|
0% - 10%
|
11.0
|
%
|
7.0
|
%
|
|
|
10% - 20%
|
5.6
|
%
|
4.4
|
%
|
|
|
20% - 30%
|
12.7
|
%
|
11.9
|
%
|
|
|
30% - 40%
|
20.8
|
%
|
26.1
|
%
|
|
|
40% - 50%
|
32.8
|
%
|
31.8
|
%
|
|
|
50% - 60%
|
13.3
|
%
|
15.2
|
%
|
|
|
60% - 70%
|
3.8
|
%
|
3.6
|
%
|
|
|
Total
|
100.0
|
%
|
100.0
|
%
|
|
|
(1)
|
Subordination refers to the credit enhancement provided to the Re-REMIC tranche held by the Company by any junior Re-REMIC tranche or tranches in a resecuritization. This figure reflects the percentage of the balance of the underlying securities represented by any junior tranche or tranches at the time of resecuritization. Generally, principal losses on the underlying securities in excess of the subordination amount would result in principal losses on the Re-REMIC tranche held by the Company.
22.9%
of the Company's Re-REMIC holdings are not senior tranches.
|
The components of the carrying value of the Company’s MBS and GSE CRT portfolio at
December 31, 2015
and
2014
are presented below.
|
$ in thousands
|
December 31, 2015
|
December 31, 2014
|
|||
|
Principal balance
|
19,810,113
|
|
18,505,710
|
|
|
|
Unamortized premium
|
495,537
|
|
550,071
|
|
|
|
Unamortized discount
|
(4,376,434
|
)
|
(2,138,139
|
)
|
|
|
Gross unrealized gains
|
287,469
|
|
439,513
|
|
|
|
Gross unrealized losses
|
(150,750
|
)
|
(108,260
|
)
|
|
|
Fair value
|
16,065,935
|
|
17,248,895
|
|
|
The following table summarizes the Company’s MBS and GSE CRT portfolio according to estimated weighted average life classifications as of
December 31, 2015
and
2014
.
|
$ in thousands
|
December 31, 2015
|
December 31, 2014
|
|||
|
Less than one year
|
427,678
|
|
440,471
|
|
|
|
Greater than one year and less than five years
|
6,237,547
|
|
7,997,709
|
|
|
|
Greater than or equal to five years
|
9,400,710
|
|
8,810,715
|
|
|
|
Total
|
16,065,935
|
|
17,248,895
|
|
|
|
94
|
||
The following tables present the estimated fair value and gross unrealized losses of the Company’s MBS and GSE CRTs by length of time that such securities have been in a continuous unrealized loss position at
December 31, 2015
and
2014
.
|
December 31, 2015
|
Less than 12 Months
|
12 Months or More
|
Total
|
|||||||||||||||||||||||
|
$ in thousands
|
Fair
Value
|
Unrealized
Losses
|
Number of Securities
|
Fair
Value
|
Unrealized
Losses
|
Number of Securities
|
Fair
Value
|
Unrealized
Losses
|
Number of Securities
|
|||||||||||||||||
|
Agency RMBS:
|
||||||||||||||||||||||||||
|
15 year fixed-rate
|
600,480
|
|
(8,081
|
)
|
33
|
|
77,506
|
|
(1,482
|
)
|
6
|
|
677,986
|
|
(9,563
|
)
|
39
|
|
||||||||
|
30 year fixed-rate
|
776,065
|
|
(14,827
|
)
|
32
|
|
1,120,391
|
|
(39,497
|
)
|
47
|
|
1,896,456
|
|
(54,324
|
)
|
79
|
|
||||||||
|
ARM
|
200,863
|
|
(501
|
)
|
11
|
|
—
|
|
—
|
|
—
|
|
200,863
|
|
(501
|
)
|
11
|
|
||||||||
|
Hybrid ARM
|
1,913,872
|
|
(17,082
|
)
|
111
|
|
—
|
|
—
|
|
—
|
|
1,913,872
|
|
(17,082
|
)
|
111
|
|
||||||||
|
Total Agency pass through
|
3,491,280
|
|
(40,491
|
)
|
187
|
|
1,197,897
|
|
(40,979
|
)
|
53
|
|
4,689,177
|
|
(81,470
|
)
|
240
|
|
||||||||
|
Agency-CMO
|
166,754
|
|
(3,296
|
)
|
14
|
|
9,118
|
|
(6,934
|
)
|
9
|
|
175,872
|
|
(10,230
|
)
|
23
|
|
||||||||
|
Non-Agency RMBS
|
832,978
|
|
(6,957
|
)
|
73
|
|
331,018
|
|
(10,326
|
)
|
28
|
|
1,163,996
|
|
(17,283
|
)
|
101
|
|
||||||||
|
GSE CRT
(1)
|
340,116
|
|
(10,050
|
)
|
16
|
|
120,877
|
|
(13,605
|
)
|
7
|
|
460,993
|
|
(23,655
|
)
|
23
|
|
||||||||
|
CMBS
|
1,224,985
|
|
(17,328
|
)
|
85
|
|
31,533
|
|
(784
|
)
|
2
|
|
1,256,518
|
|
(18,112
|
)
|
87
|
|
||||||||
|
Total
|
6,056,113
|
|
(78,122
|
)
|
375
|
|
1,690,443
|
|
(72,628
|
)
|
99
|
|
7,746,556
|
|
(150,750
|
)
|
474
|
|
||||||||
(1) Balance includes unrealized losses on both the debt host contract and the embedded derivative.
|
December 31, 2014
|
Less than 12 Months
|
12 Months or More
|
Total
|
|||||||||||||||||||||||
|
$ in thousands
|
Fair
Value
|
Unrealized
Losses
|
Number of Securities
|
Fair
Value
|
Unrealized
Losses
|
Number of Securities
|
Fair
Value
|
Unrealized
Losses
|
Number of Securities
|
|||||||||||||||||
|
Agency RMBS:
|
||||||||||||||||||||||||||
|
15 year fixed-rate
|
10,897
|
|
(42
|
)
|
1
|
|
105,644
|
|
(1,395
|
)
|
6
|
|
116,541
|
|
(1,437
|
)
|
7
|
|
||||||||
|
30 year fixed-rate
|
137,680
|
|
(2,662
|
)
|
5
|
|
1,756,894
|
|
(40,181
|
)
|
62
|
|
1,894,574
|
|
(42,843
|
)
|
67
|
|
||||||||
|
ARM
|
24,074
|
|
(9
|
)
|
1
|
|
3,719
|
|
(23
|
)
|
1
|
|
27,793
|
|
(32
|
)
|
2
|
|
||||||||
|
Hybrid ARM
|
630,775
|
|
(1,544
|
)
|
28
|
|
20,361
|
|
(197
|
)
|
2
|
|
651,136
|
|
(1,741
|
)
|
30
|
|
||||||||
|
Total Agency pass through
|
803,426
|
|
(4,257
|
)
|
35
|
|
1,886,618
|
|
(41,796
|
)
|
71
|
|
2,690,044
|
|
(46,053
|
)
|
106
|
|
||||||||
|
Agency-CMO
|
36,723
|
|
(6,192
|
)
|
18
|
|
265,863
|
|
(9,481
|
)
|
10
|
|
302,586
|
|
(15,673
|
)
|
28
|
|
||||||||
|
Non-Agency RMBS
|
573,122
|
|
(5,799
|
)
|
34
|
|
354,532
|
|
(11,990
|
)
|
21
|
|
927,654
|
|
(17,789
|
)
|
55
|
|
||||||||
|
GSE CRT
(1)
|
306,603
|
|
(25,394
|
)
|
13
|
|
—
|
|
—
|
|
—
|
|
306,603
|
|
(25,394
|
)
|
13
|
|
||||||||
|
CMBS
|
134,364
|
|
(277
|
)
|
11
|
|
227,452
|
|
(3,074
|
)
|
19
|
|
361,816
|
|
(3,351
|
)
|
30
|
|
||||||||
|
Total
|
1,854,238
|
|
(41,919
|
)
|
111
|
|
2,734,465
|
|
(66,341
|
)
|
121
|
|
4,588,703
|
|
(108,260
|
)
|
232
|
|
||||||||
(1) Balance includes unrealized losses on both the debt host contract and the embedded derivative.
Gross unrealized losses on the Company’s Agency RMBS and Agency-CMO were
$81.5 million
and
$10.2 million
, respectively, at
December 31, 2015
. Due to the inherent credit quality of Agency RMBS and Agency-CMO, the Company determined that at
December 31, 2015
, any unrealized losses on its Agency RMBS and Agency-CMO portfolio are not other than temporary.
Gross unrealized losses on the Company’s non-Agency RMBS, GSE CRT and CMBS were
$59.1 million
at
December 31, 2015
. The Company does not consider these unrealized losses to be credit related, but rather due to non-credit related factors such as interest rate spreads, prepayment speeds and market fluctuations. These investment securities are included in the Company's assessment for other-than-temporary-impairment on a quarterly basis.
|
95
|
||
The following table presents the impact of the Company’s MBS and GSE CRT debt host contract on its accumulated other comprehensive income (loss) for the years ended
December 31, 2015
,
2014
and
2013
. The table excludes certain RMBS IOs and GSE CRTs that are accounted for under the fair value option.
|
|
Years Ended December 31,
|
|||||||
|
$ in thousands
|
2015
|
2014
|
2013
|
|||||
|
Accumulated other comprehensive income (loss) from MBS and GSE CRT securities:
|
||||||||
|
Unrealized gain (loss) on MBS and GSE CRT at beginning of period
|
351,774
|
|
(160,083
|
)
|
531,729
|
|
||
|
Unrealized gain (loss) on MBS and GSE CRT
|
(185,416
|
)
|
431,198
|
|
(891,261
|
)
|
||
|
Reclassification of unrealized (gain) loss on sale of MBS and GSE CRT to gain (loss) on investments, net
|
(4,277
|
)
|
80,659
|
|
199,449
|
|
||
|
Balance at end of period
|
162,081
|
|
351,774
|
|
(160,083
|
)
|
||
During the years ended
December 31, 2015
,
2014
and
2013
the Company reclassified
$4.3 million
of net unrealized gains,
$80.7 million
of net unrealized losses and
$199.4 million
of net unrealized losses respectively from other comprehensive income into gain (loss) on investments, net as a result of the Company selling certain investments.
The following table summarizes the components of the Company's total gain (loss) on investments, net for the years ended
December 31, 2015
,
2014
and
2013
.
|
|
Years Ended December 31,
|
|||||||
|
$ in thousands
|
2015
|
2014
|
2013
|
|||||
|
Gross realized gains on sale of investments
|
10,139
|
|
16,353
|
|
39,131
|
|
||
|
Gross realized losses on sale of investments
|
(11,114
|
)
|
(95,783
|
)
|
(238,580
|
)
|
||
|
Net unrealized gains and losses on RMBS IOs (fair value option)
|
(558
|
)
|
(7,738
|
)
|
16,716
|
|
||
|
Net unrealized gains and losses on GSE CRT (fair value option)
|
(56
|
)
|
—
|
|
—
|
|
||
|
Total gain (loss) on investments, net
(1)
|
(1,589
|
)
|
(87,168
|
)
|
(182,733
|
)
|
||
(1) Balance as of
December 31, 2015
excludes gain (loss) on deconsolidation of VIEs, net of
$19.6 million
. Refer to Note 3 - "Variable Interest Entities" for further discussion.
The Company assesses its investment securities for other-than-temporary impairment on a quarterly basis. When the fair value of an investment is less than its amortized cost at the balance sheet date of the reporting period for which impairment is assessed, the impairment is designated as either “temporary” or “other-than-temporary.” The Company evaluates each security that has had a fair value less than amortized cost for
nine
or more consecutive months for other-than-temporary impairment. This analysis includes a determination of estimated future cash flows through an evaluation of the characteristics of the underlying loans and structural features of the investment. Underlying loan characteristics reviewed include, but are not limited to, delinquency status, loan-to-value ratios, borrower credit scores, occupancy status and geographic concentration.
The Company did not have other-than-temporary impairments for the years ended
December 31, 2015
,
2014
and
2013
.
The following table presents components of interest income on the Company’s MBS and GSE CRT portfolio for the years ended
December 31, 2015
,
2014
and
2013
. GSE CRT interest income excludes coupon interest associated with embedded derivatives recorded in realized and unrealized credit derivative income (loss), net.
|
For the Year ended December 31, 2015
|
||||||||
|
$ in thousands
|
Coupon
Interest
|
Net (Premium
Amortization)/ Discount Accretion
|
Interest
Income
|
|||||
|
Agency
|
372,610
|
|
(121,170
|
)
|
251,440
|
|
||
|
Non-Agency
|
110,885
|
|
12,650
|
|
123,535
|
|
||
|
GSE CRT
|
6,681
|
|
(3,088
|
)
|
3,593
|
|
||
|
CMBS
|
149,977
|
|
(11,322
|
)
|
138,655
|
|
||
|
Other
|
1,028
|
|
5
|
|
1,033
|
|
||
|
Total
|
641,181
|
|
(122,925
|
)
|
518,256
|
|
||
|
96
|
||
|
For the Year ended December 31, 2014
|
||||||||
|
$ in thousands
|
Coupon
Interest
|
Net (Premium Amortization)/Discount Accretion
|
Interest
Income (Loss)
|
|||||
|
Agency
|
403,403
|
|
(106,116
|
)
|
297,287
|
|
||
|
Non-Agency
|
135,178
|
|
12,257
|
|
147,435
|
|
||
|
GSE CRT
|
5,428
|
|
(3,014
|
)
|
2,414
|
|
||
|
CMBS
|
159,363
|
|
(27,496
|
)
|
131,867
|
|
||
|
Other
|
59
|
|
—
|
|
59
|
|
||
|
Total
|
703,431
|
|
(124,369
|
)
|
579,062
|
|
||
|
For the Year ended December 31, 2013
|
||||||||
|
$ in thousands
|
Coupon
Interest
|
Net (Premium Amortization)/Discount Accretion
|
Interest
Income (Loss)
|
|||||
|
Agency
|
530,220
|
|
(161,149
|
)
|
369,071
|
|
||
|
Non-Agency
|
155,770
|
|
9,327
|
|
165,097
|
|
||
|
GSE CRT
|
630
|
|
(84
|
)
|
546
|
|
||
|
CMBS
|
140,094
|
|
(28,215
|
)
|
111,879
|
|
||
|
Other
|
194
|
|
—
|
|
194
|
|
||
|
Total
|
826,908
|
|
(180,121
|
)
|
646,787
|
|
||
The following table summarizes commercial loans held-for-investment as of
December 31, 2015
and
2014
that were purchased or originated by the Company.
December 31, 2015
|
$ in thousands
|
Number of
loans
|
Principal
Balance
|
Unamortized (fees)/
costs, net
|
Carrying
value
|
Unfunded
commitment
|
|||||||||
|
Mezzanine loans
|
6
|
|
210,769
|
|
(1,707
|
)
|
209,062
|
|
2,128
|
|
||||
|
Total
|
6
|
|
210,769
|
|
(1,707
|
)
|
209,062
|
|
2,128
|
|
||||
December 31, 2014
|
$ in thousands
|
Number of
loans
|
Principal
Balance
|
Unamortized (fees)/
costs, net
|
Carrying
value
|
Unfunded
commitment
|
|||||||||
|
First mortgage loan
|
1
|
|
19,978
|
|
41
|
|
20,019
|
|
1,623
|
|
||||
|
Subordinate interests:
|
||||||||||||||
|
Mezzanine loans
|
4
|
|
71,643
|
|
(94
|
)
|
71,549
|
|
3,357
|
|
||||
|
Other
(1)
|
2
|
|
54,188
|
|
—
|
|
54,188
|
|
—
|
|
||||
|
Total
|
7
|
|
145,809
|
|
(53
|
)
|
145,756
|
|
4,980
|
|
||||
(1) Other subordinate interests include a B-note and a preferred equity investment.
These loans were not impaired, and no allowance for loan losses has been recorded as of
December 31, 2015
and
2014
.
|
97
|
||
The following table summarizes the Company's other investments as of
December 31, 2015
and
2014
:
|
$ in thousands
|
December 31, 2015
|
December 31, 2014
|
|||
|
FHLBI stock
|
75,375
|
|
62,500
|
|
|
|
Investments in unconsolidated ventures
|
38,413
|
|
43,998
|
|
|
|
Total
|
113,788
|
|
106,498
|
|
|
IAS Services LLC, the Company's wholly-owned subsidiary, is required to purchase and hold FHLBI stock as a condition of membership in FHLBI. The stock is recorded at cost.
The Company has invested in unconsolidated ventures that are managed by an affiliate of the Company's Manager. The unconsolidated ventures invest in the Company's target assets. Refer to Note 15 - "Commitments and Contingencies" for additional details regarding the Company's commitments to these unconsolidated ventures.
The Company has finance the majority of its investment portfolio through repurchase agreements, secured loans and exchangeable senior notes. The following table summarizes certain characteristics of the Company’s borrowings at
December 31, 2015
and
2014
.
|
$ in thousands
|
December 31, 2015
|
December 31, 2014
|
|||||||||||||||
|
|
Amount
Outstanding
|
Weighted
Average
Interest
Rate
|
Weighted
Average
Remaining
Maturity
(Days)
|
Amount
Outstanding
|
Weighted
Average
Interest
Rate
|
Weighted
Average
Remaining
Maturity
(Days)
|
|||||||||||
|
Repurchase Agreements:
|
|||||||||||||||||
|
Agency RMBS
|
8,389,643
|
|
0.65
|
%
|
24
|
|
9,018,818
|
|
0.35
|
%
|
18
|
|
|||||
|
Non-Agency RMBS
|
2,077,240
|
|
1.68
|
%
|
32
|
|
2,676,626
|
|
1.51
|
%
|
36
|
|
|||||
|
GSE CRT
|
488,275
|
|
1.91
|
%
|
19
|
|
468,782
|
|
1.55
|
%
|
27
|
|
|||||
|
CMBS
|
1,170,890
|
|
1.49
|
%
|
23
|
|
1,458,451
|
|
1.32
|
%
|
26
|
|
|||||
|
Secured Loans
|
1,650,000
|
|
0.55
|
%
|
2,937
|
|
1,250,000
|
|
0.37
|
%
|
3,472
|
|
|||||
|
Exchangeable Senior Notes
|
400,000
|
|
5.00
|
%
|
805
|
|
400,000
|
|
5.00
|
%
|
1,170
|
|
|||||
|
Total
|
14,176,048
|
|
1.02
|
%
|
389
|
|
15,272,677
|
|
0.81
|
%
|
335
|
|
|||||
The Company financed its residential loans held-for-investment through asset-backed securities issued by securitization trusts. Refer to Note 3 - "Variable Interest Entities" for a discussion of asset-backed securities issued by securitization trusts.
Repurchase Agreements
Repurchase agreements bear interest at a contractually agreed upon rate and have maturities ranging from
one month
to
twelve months
. Repurchase agreements are being accounted for as secured borrowings since the Company maintains effective control of the financed assets. Under the repurchase agreements, the respective lender retains the right to mark the underlying collateral to fair value. A reduction in the value of pledged assets would require the Company to provide additional collateral or fund margin calls. The Company intends to maintain a level of liquidity that will enable the Company to meet margin calls. In addition, the repurchase agreements are subject to certain financial covenants. The Company was in compliance with these covenants at
December 31, 2015
.
|
98
|
||
The following tables summarize certain characteristics of the Company’s repurchase agreements at
December 31, 2015
and
2014
.
|
December 31, 2015
|
Amount
Outstanding
|
Percent of Total
Amount
Outstanding
|
Company MBS and GSE CRTs
Held as Collateral
|
||||||
|
$ in thousands
Repurchase Agreement Counterparties
|
|||||||||
|
HSBC Securities (USA) Inc
|
1,566,747
|
|
12.9
|
%
|
1,611,020
|
|
|||
|
Royal Bank of Canada
|
1,148,480
|
|
9.5
|
%
|
1,383,839
|
|
|||
|
ING Financial Market LLC
|
1,050,548
|
|
8.7
|
%
|
1,112,102
|
|
|||
|
South Street Securities LLC
|
799,783
|
|
6.6
|
%
|
838,600
|
|
|||
|
Pierpont Securities LLC
|
786,623
|
|
6.5
|
%
|
814,804
|
|
|||
|
Industrial and Commercial Bank of China Financial Services LLC
|
695,933
|
|
5.7
|
%
|
730,941
|
|
|||
|
Mitsubishi UFJ Securities (USA), Inc.
|
627,383
|
|
5.2
|
%
|
657,201
|
|
|||
|
JP Morgan Securities Inc.
|
622,665
|
|
5.1
|
%
|
728,502
|
|
|||
|
Citigroup Global Markets Inc.
|
585,632
|
|
4.8
|
%
|
725,882
|
|
|||
|
Scotia Capital
|
576,137
|
|
4.8
|
%
|
598,343
|
|
|||
|
BNP Paribas Securities Corp.
|
474,053
|
|
3.9
|
%
|
530,584
|
|
|||
|
Wells Fargo Securities, LLC
|
463,673
|
|
3.8
|
%
|
551,667
|
|
|||
|
Goldman, Sachs & Co.
|
428,799
|
|
3.5
|
%
|
552,549
|
|
|||
|
KGS-Alpha Capital Markets, L.P.
|
380,286
|
|
3.1
|
%
|
400,758
|
|
|||
|
Banc of America Securities LLC
|
380,520
|
|
3.1
|
%
|
442,801
|
|
|||
|
Morgan Stanley & Co. Incorporated
|
273,124
|
|
2.3
|
%
|
320,484
|
|
|||
|
Guggenheim Liquidity Services, LLC
|
265,709
|
|
2.2
|
%
|
279,345
|
|
|||
|
All other counterparties
(1)
|
999,953
|
|
8.3
|
%
|
1,180,866
|
|
|||
|
Total
|
12,126,048
|
|
100.0
|
%
|
13,460,288
|
|
|||
(1) Represents amounts outstanding with
nine
counterparties.
|
99
|
||
|
December 31, 2014
|
Amount
Outstanding
|
Percent of Total
Amount
Outstanding
|
Company MBS and GSE CRTs
Held as Collateral
|
|||||||
|
$ in thousands
Repurchase Agreement Counterparties
|
||||||||||
|
Credit Suisse Securities (USA) LLC
|
1,517,530
|
|
11.1
|
%
|
1,925,973
|
|
(1
|
)
|
||
|
HSBC Securities (USA) Inc
|
1,190,769
|
|
8.7
|
%
|
1,225,194
|
|
||||
|
Royal Bank of Canada
|
1,057,798
|
|
7.8
|
%
|
1,278,612
|
|
||||
|
Citigroup Global Markets Inc.
|
979,247
|
|
7.2
|
%
|
1,157,265
|
|
(2
|
)
|
||
|
South Street Securities LLC
|
961,938
|
|
7.1
|
%
|
1,020,054
|
|
||||
|
Banc of America Securities LLC
|
791,196
|
|
5.9
|
%
|
875,984
|
|
(3
|
)
|
||
|
ING Financial Market LLC
|
767,733
|
|
5.6
|
%
|
820,166
|
|
||||
|
Mitsubishi UFJ Securities (USA), Inc.
|
710,058
|
|
5.2
|
%
|
744,836
|
|
||||
|
J.P. Morgan Securities LLC
|
698,856
|
|
5.1
|
%
|
814,896
|
|
||||
|
Industrial and Commercial Bank of China Financial Services LLC
|
682,193
|
|
5.0
|
%
|
716,989
|
|
||||
|
Wells Fargo Securities, LLC
|
627,071
|
|
4.6
|
%
|
754,706
|
|
||||
|
Pierpont Securities LLC
|
601,222
|
|
4.4
|
%
|
627,534
|
|
||||
|
Morgan Stanley & Co. Incorporated
|
589,950
|
|
4.3
|
%
|
632,002
|
|
||||
|
BNP Paribas Securities Corp.
|
559,658
|
|
4.1
|
%
|
622,749
|
|
||||
|
Scotia Capital
|
521,778
|
|
3.8
|
%
|
542,044
|
|
||||
|
KGS-Alpha Capital Markets, L.P.
|
407,920
|
|
3.0
|
%
|
430,241
|
|
||||
|
All other counterparties
(4)
|
957,760
|
|
7.1
|
%
|
1,071,019
|
|
||||
|
Total
|
13,622,677
|
|
100.0
|
%
|
15,260,264
|
|
||||
(1) Includes
$276.1 million
of MBS held as collateral which are eliminated in consolidation.
(2) Includes
$20.3 million
of MBS held as collateral which are eliminated in consolidation.
(3) Includes
$106.8 million
of MBS held as collateral which are eliminated in consolidation.
(4) Represents amounts outstanding with
ten
counterparties.
The Company's repurchase agreement collateral ratio (Company MBS and GSE CRTs Held as Collateral/Amount Outstanding) was
111%
as of December 31, 2015 (December 31, 2014:
112%
).
The Company posted cash collateral of
$710,000
with its repurchase agreement counterparties at
December 31, 2015
.
No
cash collateral was held by repurchase agreement counterparties at December 31,
2014
.
Secured Loans
The Company's wholly-owned subsidiary, IAS Services LLC, is a member of the FHLBI. As a member of the FHLBI, IAS Services LLC has borrowed funds from the FHLBI in the form of secured advances.
As of
December 31, 2015
, IAS Services LLC, had
$1.65 billion
in outstanding secured advances from the FHLBI. These secured advances have fixed or floating rates. Floating rates are based on the three-month FHLB swap rate plus a spread. For the year ended
December 31, 2015
, IAS Services LLC had weighed average borrowings of
$1.6 billion
with a weighted average borrowing rate of
0.41%
and a weighted average maturity of
8.05
years. On January 12, 2016, new FHFA rules were adopted that exclude captive insurance companies from Federal Home Loan Bank membership. Under the new rules, IAS Services LLC is permitted to remain a member of the Federal Home Loan Bank for a period of
five years
, and the FHLBI is permitted to honor the contractual maturity of our existing advances. Accordingly, the Company does not expect there to be any impact to its existing FHLBI borrowings under the FHFA rule.
The ability to borrow from the FHLBI is subject to the Company's continued creditworthiness, pledging of sufficient eligible collateral to secure advances, and compliance with certain agreements with FHLBI. Each advance requires approval by the FHLBI and is secured by collateral in accordance with FHLBI’s credit and collateral guidelines.The FHLBI retains the right to mark the underlying collateral for FHLBI advances to fair value. A reduction in the value of pledged assets would require IAS Services LLC to provide additional collateral.
As of
December 31, 2015
, the FHLBI advances were collateralized by CMBS and Agency RMBS with a fair value of
$1.4 billion
and
$558.9 million
, respectively.
|
100
|
||
As discussed in Note 6 - "Other Investments," IAS Services LLC is required to purchase and hold a certain amount of FHLBI stock, which is based, in part, upon the outstanding principal balance of secured advances from the FHLBI.
Exchangeable Senior Notes
In 2013, a wholly-owned subsidiary of the Company issued
$400.0 million
in aggregate principal amount of Exchangeable Senior Notes (the “Notes”) due
March 15, 2018
. The total net proceeds to the Company after deducting financing expenses was
$387.7 million
.
The terms of the Notes are governed by an indenture (the “Indenture”) by and among the wholly-owned subsidiary, as issuer, the Company, as guarantor, and The Bank of New York Mellon Trust Company, N.A., as trustee (the “Trustee”). The Notes bear interest at
5.00%
per annum, payable semi-annually in arrears on
March 15
and
September 15
of each year, beginning
September 15, 2013
. The Notes may be exchanged for shares of the Company’s common stock at the applicable exchange rate at any time prior to the close of business on March 13, 2018. The initial exchange rate for each
$1,000
aggregate principal amount of the Notes is
42.0893
shares of the Company’s common stock, equivalent to an exchange price of approximately
$23.76
per share, and the maximum exchange rate is
48.4027
shares of the Company's common stock, equivalent to an exchange price of approximately
$20.66
per share. The initial and maximum exchange rates of the Notes are subject to adjustment in certain events. The Notes have not been registered under the Securities Act of 1933, as amended. Under the registration rights agreement between the Company and the initial purchasers of the Notes, the Company filed a prospectus supplement in August 2013 registering for resale
605,034
shares of common stock issuable upon exchange of the Notes. The Company may be required to register additional shares of common stock issuable upon exchange of the Notes at the request of holders as required by the registration rights agreement. Accrued interest payable on the Notes was approximately
$5.9 million
as of
December 31, 2015
(
2014
:
$5.9 million
).
Risk Management Objective of Using Derivatives
The Company is exposed to certain risks arising from both its business operations and economic conditions. The Company principally manages its exposures to a wide variety of business and operational risks through management of its core business activities. The Company manages economic risks, including interest rate, liquidity, credit and foreign exchange rate risk primarily by managing the amount, sources, and duration of its investments, debt funding, and the use of derivative financial instruments. Specifically, the Company enters into derivative financial instruments to manage exposures that arise from business activities that result in the receipt or payment of future known and uncertain cash amounts, the value of which are determined by interest rates. The Company’s derivative financial instruments are used to manage differences in the amount, timing, and duration of the Company’s known or expected cash receipts and its known or expected cash payments principally related to the Company’s investments and borrowings.
The Company also utilizes credit derivatives such as credit default swaps (“CDS”) to provide credit event protection based on a financial index or specific security in exchange for receiving a fixed-rate fee or premium over the term of the contract. These instruments enable the Company to synthetically assume the credit risk of a reference security, portfolio of securities or index of securities. The counterparty pays a premium to the Company, and the Company agrees to make a payment to compensate the counterparty for losses upon the occurrence of a specified credit event. Although contract specific, credit events generally include bankruptcy, failure to pay, restructuring, obligation acceleration, obligation default, or repudiation/moratorium. Upon the occurrence of a defined credit event,the difference between the value of the reference securities and the CDS’s notional amount is recorded as a realized loss in the consolidated statements of operations.
Credit Derivatives
As discussed in Note 2 - "Summary of Significant Accounting Policies," the Company's GSE CRTs purchased prior to August 24, 2015 are accounted for as hybrid financial instruments consisting of a debt host contract and an embedded derivative and are reported at fair value. At
December 31, 2015
, terms of the GSE CRT embedded derivatives are:
|
$ in thousands
|
December 31, 2015
|
December 31, 2014
|
|||
|
Fair value amount
|
(25,722
|
)
|
(21,495
|
)
|
|
|
Notional amount
|
645,000
|
|
615,000
|
|
|
|
Maximum potential amount of future undiscounted payments
|
645,000
|
|
615,000
|
|
|
In 2010, the Company entered into a CDS contract.The Company sold protection against losses on a specific pool of non-Agency RMBS in excess of a specified threshold. In exchange, the Company was paid a stated fixed rate fee of
3%
of the
|
101
|
||
notional amount of the CDS. The Company terminated the CDS in October 2015 in exchange for a payment to the Company of
$1.0 million
.
Interest Rate Swaps
The Company's repurchase agreements are usually settled on a short-term basis ranging from one to twelve months. At each settlement date, the Company refinances each repurchase agreement at the market interest rate at that time. In addition, the Company's secured loans have floating interest rates. As such, the Company is exposed to changing interest rates. The Company’s objectives in using interest rate derivatives are to add stability to interest expense and to manage its exposures to interest rate movements. To accomplish this objective, the Company primarily uses interest rate swaps as part of its interest rate risk management strategy. Interest rate swaps involve the receipt of variable-rate amounts from a counterparty in exchange for the Company making fixed-rate payments over the life of the agreements without exchange of the underlying notional amount.
Effective December 31, 2013, the Company voluntarily discontinued cash flow hedge accounting for its interest rate swaps to gain greater flexibility in managing interest rate exposures. Amounts recorded in AOCI through December 31, 2013 related to cash flow hedges are reclassified to interest expense on repurchase agreements on the consolidated statements of operations as interest is accrued and paid on the related repurchase agreements over the remaining life of the interest rate swap agreements. The Company reclassified
$66.8 million
(
2014
:
$85.2 million
) as an increase to interest expense for the year ended
December 31, 2015
. During the next 12 months, the Company estimates that
$5.2 million
will be reclassified as an increase to interest expense, repurchase agreements.
As a result of discontinuing hedge accounting, beginning January 1, 2014, changes in the fair value of the Company’s interest rate swaps are recorded in gain (loss) on derivative instruments, net on the consolidated statements of operations. Monthly net cash settlements under swaps are recorded in gain (loss) on derivative instruments, net on the consolidated statements of operations.
|
102
|
||
As of
December 31, 2015
, the Company had the following interest rate derivatives outstanding:
|
$ in thousands
Counterparty
|
Notional
|
Maturity Date
|
Fixed Interest
Rate
in Contract
|
||||||||
|
Credit Suisse International
|
500,000
|
|
4/15/2016
|
2.27
|
%
|
||||||
|
The Bank of New York Mellon
|
500,000
|
|
4/15/2016
|
2.24
|
%
|
||||||
|
JPMorgan Chase Bank, N.A.
|
500,000
|
|
5/16/2016
|
2.31
|
%
|
||||||
|
Goldman Sachs Bank USA
|
500,000
|
|
5/24/2016
|
2.34
|
%
|
||||||
|
Goldman Sachs Bank USA
|
250,000
|
|
6/15/2016
|
2.67
|
%
|
||||||
|
Wells Fargo Bank, N.A.
|
250,000
|
|
6/15/2016
|
2.67
|
%
|
||||||
|
JPMorgan Chase Bank, N.A.
|
500,000
|
|
6/24/2016
|
2.51
|
%
|
||||||
|
Citibank, N.A.
|
500,000
|
|
10/15/2016
|
1.93
|
%
|
||||||
|
Deutsche Bank AG
|
150,000
|
|
2/5/2018
|
2.90
|
%
|
||||||
|
ING Capital Markets LLC
|
350,000
|
|
2/24/2018
|
0.95
|
%
|
||||||
|
ING Capital Markets LLC
|
300,000
|
|
5/5/2018
|
0.79
|
%
|
||||||
|
UBS AG
|
500,000
|
|
5/24/2018
|
1.10
|
%
|
||||||
|
ING Capital Markets LLC
|
400,000
|
|
6/5/2018
|
0.87
|
%
|
||||||
|
The Royal Bank of Scotland Plc
|
500,000
|
|
9/5/2018
|
1.04
|
%
|
||||||
|
Citibank, N.A. CME Central Clearing
|
(1)
|
300,000
|
|
2/5/2021
|
2.50
|
%
|
|||||
|
The Royal Bank of Scotland Plc CME Central Clearing
|
(1)
|
300,000
|
|
2/5/2021
|
2.69
|
%
|
|||||
|
Wells Fargo Bank, N.A.
|
200,000
|
|
3/15/2021
|
3.14
|
%
|
||||||
|
JPMorgan Chase Bank, N.A. CME Central Clearing
|
(2)
|
500,000
|
|
5/24/2021
|
2.25
|
%
|
|||||
|
Citibank, N.A.
|
200,000
|
|
5/25/2021
|
2.83
|
%
|
||||||
|
HSBC Bank USA, National Association CME Central Clearing
|
(3)
|
500,000
|
|
6/24/2021
|
2.44
|
%
|
|||||
|
HSBC Bank USA, National Association
|
550,000
|
|
2/24/2022
|
2.45
|
%
|
||||||
|
Deutsche Bank AG CME Central Clearing
|
1,000,000
|
|
6/9/2022
|
2.21
|
%
|
||||||
|
HSBC Bank USA, National Association
|
250,000
|
|
6/5/2023
|
1.91
|
%
|
||||||
|
The Royal Bank of Scotland Plc
|
500,000
|
|
8/15/2023
|
1.98
|
%
|
||||||
|
Goldman Sachs Bank USA CME Central Clearing
|
600,000
|
|
8/24/2023
|
2.88
|
%
|
||||||
|
UBS AG
|
250,000
|
|
11/15/2023
|
2.23
|
%
|
||||||
|
HSBC Bank USA, National Association
|
500,000
|
|
12/15/2023
|
2.20
|
%
|
||||||
|
Morgan Stanley Capital Services, LLC Central Clearing
|
100,000
|
|
4/2/2025
|
2.04
|
%
|
||||||
|
Total
|
11,450,000
|
|
2.12
|
%
|
|||||||
|
(1)
|
Forward start date of February 2016
|
|
(2)
|
Forward start date of May 2016
|
|
(3)
|
Forward start date of June 2016
|
At
December 31, 2015
, the Company’s counterparties held
$109.3 million
in cash margin deposits and approximately
$143.9 million
in Agency RMBS as collateral against its interest rate swaps. In addition, several counterparties posted
$4.9 million
of cash as collateral with the Company. Cash margin posted by the Company is classified as due from counterparties, and cash margin posted by counterparties that are restricted in use, if any, is classified as restricted cash. As of
December 31, 2015
and
2014
, the Company did not have any restricted cash. The Agency RMBS collateral posted by the Company is included in mortgage-backed and credit risk transfer securities on the Company’s consolidated balance sheets. Cash collateral that is not restricted for use by the Company is included in cash and cash equivalents and the liability to return the collateral is included in collateral held payable on the consolidated balance sheets. Non-cash collateral posted by counterparties to the Company would be recognized if any counterparty defaults or if the Company sold the pledged collateral. As of
December 31, 2015
, the Company did not recognize any non-cash collateral held as collateral.
Interest Rate Swaptions
The Company has purchased interest rate swaptions to help mitigate the potential impact of increases or decreases in interest rates on the performance of a portion of the Company’s investment portfolio (referred to as “convexity risk”). The
|
103
|
||
interest rate swaptions provide the Company the option to enter into interest rate swap agreements for a predetermined notional amount, stated term and pay and receive interest rates in the future. The premium paid for interest rate swaptions is reported as a derivative asset in the Company’s consolidated balance sheets. The premium is valued at an amount equal to the fair value of the swaption that would have the effect of closing the position adjusted for nonperformance risk, if any. The difference between the premium and the fair value of the swaption is reported in gain (loss) on derivative instruments, net in the Company’s consolidated statements of operations. If an interest rate swaption expires unexercised, the loss on the interest rate swaption would be equal to the premium paid. If the Company sells or exercises an interest rate swaption, the realized gain or loss on the interest rate swaption would be equal to the difference between the cash or the fair value of the underlying interest rate swap received and the premium paid. The Company had
$10.3 million
(
2014
:
$23.3 million
) of realized loss for interest rate swaptions that expired unexercised during the year ended
December 31, 2015
. The Company sold swaptions during the year ended
December 31, 2013
, realizing a net gain of
$56.3 million
. For the year ended
December 31, 2015
, the Company had
$8.5 million
of unrealized gain (
2014
:
$10.9 million
unrealized gain and
2013
:
$17.0 million
of unrealized loss), which represents the change in fair value of the Company's interest rate swaptions that are recognized directly in earnings.
As of
December 31, 2015
, the Company had the following outstanding interest rate swaptions:
|
$ in thousands
|
Option
|
Underlying Swap
|
|||||||||||||||||
|
Swaption
|
Expiration
|
Cost
|
Fair
Value
|
Average
Months to
Expiration
|
Notional
Amount
|
Average
Pay
Rate
|
Average
Receive
Rate
|
Average
Term
(Years)
|
|||||||||||
|
Receiver
|
< 6 Months
|
1,485
|
|
—
|
|
1
|
300,000
|
|
3M LIBOR
|
1.11
|
%
|
10.0
|
|||||||
|
Total Receiver
|
1,485
|
|
—
|
|
1
|
300,000
|
|
3M LIBOR
|
1.11
|
%
|
10.0
|
||||||||
TBAs, Futures and Currency Forward Contracts
The Company purchases or sells certain TBAs and U.S. Treasury futures contracts to help mitigate the potential impact of changes in interest rates on the performance of the Company's portfolio. Realized and unrealized gains and losses associated with the purchases or sales of the TBAs and U.S. Treasury futures contracts are recognized in gain (loss) on derivative instruments, net in the Company's consolidated statements of operations.
The Company uses currency forward contracts to help mitigate the potential impact of changes in foreign currency exchange rates on the Company's investments denominated in foreign currencies. Realized and unrealized gains and losses associated with the purchases or sales of currency forward contracts are recognized in gain (loss) on derivative instruments, net in the Company's consolidated statements of operations.
|
104
|
||
The following table presents information with respect to our derivative instruments:
|
$ in thousands
|
Notional Amount as
of January 1, 2015 |
Additions
|
Settlement,
Termination,
Expiration
or Exercise
|
Notional Amount as
of December 31, 2015 |
Amount of Realized
Gain (Loss), net on Derivative Instruments (excluding net interest paid or received) for the year ended December 31, 2015 |
||||||||||
|
Interest Rate Swaptions
|
1,050,000
|
|
300,000
|
|
(1,050,000
|
)
|
300,000
|
|
(10,328
|
)
|
|||||
|
Interest Rate Swaps
|
10,550,000
|
|
2,100,000
|
|
(1,200,000
|
)
|
11,450,000
|
|
(31,881
|
)
|
|||||
|
TBAs
|
198,000
|
|
248,000
|
|
(446,000
|
)
|
—
|
|
(2,292
|
)
|
|||||
|
Futures Contracts
|
127,400
|
|
120,900
|
|
(248,300
|
)
|
—
|
|
(943
|
)
|
|||||
|
Currency Forward Contracts
|
35,688
|
|
171,647
|
|
(131,011
|
)
|
76,324
|
|
1,172
|
|
|||||
|
Total
|
11,961,088
|
|
2,940,547
|
|
(3,075,311
|
)
|
11,826,324
|
|
(44,272
|
)
|
|||||
Tabular Disclosure of the Effect of Derivative Instruments on the Balance Sheet
The table below presents the fair value of the Company’s derivative financial instruments, as well as their classification on the consolidated balance sheets as of
December 31, 2015
and
2014
.
|
$ in thousands
|
|
|
|
|
|
|||||||||
|
Derivative Assets
|
Derivative Liabilities
|
|||||||||||||
|
As of December 31, 2015
|
As of December 31, 2014
|
As of December 31, 2015
|
As of December 31, 2014
|
|||||||||||
|
Balance Sheet
|
Fair Value
|
Fair Value
|
Balance Sheet
|
Fair Value
|
Fair Value
|
|||||||||
|
Interest Rate Swaps Asset
|
6,795
|
|
22,772
|
|
Interest Rate Swaps Liability
|
238,045
|
|
253,468
|
|
|||||
|
CDS Contract
|
—
|
|
396
|
|
TBAs
|
—
|
|
558
|
|
|||||
|
Interest Rate Swaptions
|
—
|
|
322
|
|
Currency Forward Contracts
|
103
|
|
—
|
|
|||||
|
Futures Contracts
|
—
|
|
89
|
|
||||||||||
|
Currency Forward Contracts
|
1,864
|
|
599
|
|
||||||||||
Embedded derivatives associated with GSE CRTs are recorded within mortgage-backed and credit risk transfer securities, at fair value, on the consolidated balance sheet. The fair value of the embedded derivative associated with GSE CRTs is a net liability of
$25.7 million
(
2014
: net liability of
$21.5 million
) as of
December 31, 2015
.
Tabular Disclosure of the Effect of Derivative Instruments on the Income Statement
The tables below present the effect of the Company’s derivative financial instruments on the consolidated statements of operations for the years ended
December 31, 2015
,
2014
and
2013
.
|
$ in thousands
|
|
||||||||||
|
Derivative
not designated as
hedging instrument
|
Location of unrealized gain (loss)
recognized in income
on derivative
|
Year ended December 31,
2015 |
Year ended December 31,
2014 |
Year ended December 31,
2013 |
|||||||
|
CDS Contract
|
Realized and unrealized credit derivative income (loss), net
|
648
|
|
(258
|
)
|
(865
|
)
|
||||
|
GSE CRT Embedded Derivatives
|
Realized and unrealized credit derivative income (loss), net
|
(6,411
|
)
|
(21,495
|
)
|
—
|
|
||||
|
Total
|
(5,763
|
)
|
(21,753
|
)
|
(865
|
)
|
|||||
|
105
|
||
The following table summarizes the effect of interest rate swaps, interest rate swaptions, TBAs, futures contracts and currency forward contracts reported in gain (loss) on derivative instruments, net on the consolidated statements of operations for the years ended
December 31, 2015
,
2014
and
2013
.
|
$ in thousands
|
Year ended December 31, 2015
|
||||||||||
|
Derivative
not designated as
hedging instrument
|
Realized gain (loss) on settlement, termination, expiration or
exercise, net
|
Contractual
interest expense
|
Unrealized
gain (loss), net
|
Gain (loss) on derivative instruments, net
|
|||||||
|
Interest Rate Swaps
|
(31,881
|
)
|
(184,373
|
)
|
(554
|
)
|
(216,808
|
)
|
|||
|
Interest Rate Swaptions
|
(10,328
|
)
|
—
|
|
8,521
|
|
(1,807
|
)
|
|||
|
TBAs
|
(2,292
|
)
|
—
|
|
558
|
|
(1,734
|
)
|
|||
|
Futures Contracts
|
(943
|
)
|
—
|
|
(90
|
)
|
(1,033
|
)
|
|||
|
Currency Forward Contracts
|
1,172
|
|
—
|
|
1,162
|
|
2,334
|
|
|||
|
Total
|
(44,272
|
)
|
(184,373
|
)
|
9,597
|
|
(219,048
|
)
|
|||
|
$ in thousands
|
Year ended December 31, 2014
|
||||||||||
|
Derivative
not designated as
hedging instrument
|
Realized gain (loss) on settlement, termination, expiration or
exercise, net
|
Contractual
interest expense
|
Unrealized
gain (loss), net
|
Gain (loss) on derivative instruments, net
|
|||||||
|
Interest Rate Swaps
|
(28,758
|
)
|
(199,783
|
)
|
(223,944
|
)
|
(452,485
|
)
|
|||
|
Interest Rate Swaptions
|
(23,275
|
)
|
—
|
|
10,906
|
|
(12,369
|
)
|
|||
|
TBAs
|
(10,843
|
)
|
—
|
|
(558
|
)
|
(11,401
|
)
|
|||
|
Futures Contracts
|
(11,489
|
)
|
—
|
|
(2,502
|
)
|
(13,991
|
)
|
|||
|
Currency Forward Contracts
|
2,178
|
|
—
|
|
599
|
|
2,777
|
|
|||
|
Total
|
(72,187
|
)
|
(199,783
|
)
|
(215,499
|
)
|
(487,469
|
)
|
|||
|
$ in thousands
|
Year ended December 31, 2013
|
||||||||||
|
Derivative instrument
|
Realized gain (loss) on settlement, termination, expiration or
exercise, net
|
Contractual
interest expense
|
Unrealized
gain (loss), net
|
Gain (loss) on derivative instruments, net
|
|||||||
|
Interest Rate Swaps Ineffectiveness
|
—
|
|
—
|
|
535
|
|
535
|
|
|||
|
Interest Rate Swaptions
|
56,279
|
|
—
|
|
(17,048
|
)
|
39,231
|
|
|||
|
Futures Contracts
|
(2,353
|
)
|
—
|
|
2,590
|
|
237
|
|
|||
|
Total
|
53,926
|
|
—
|
|
(13,923
|
)
|
40,003
|
|
|||
|
106
|
||
The following table presents the impact of the Company’s derivative instruments on its accumulated other comprehensive income for the years ended
December 31, 2015
,
2014
and
2013
.
|
|
Years ended December 31,
|
|||||||
|
$ in thousands
|
2015
|
2014
|
2013
|
|||||
|
Accumulated other comprehensive income (loss) from derivative instruments:
|
||||||||
|
Unrealized gain (loss) on derivative instruments at beginning of period
|
79,110
|
|
(6,066
|
)
|
(435,217
|
)
|
||
|
Unrealized gain (loss) on derivative instruments, net
|
—
|
|
—
|
|
429,151
|
|
||
|
Reclassification of amortization of net deferred losses on de-designated interest rate swaps to repurchase agreements interest expense
|
66,757
|
|
85,176
|
|
—
|
|
||
|
Balance at end of period
|
145,867
|
|
79,110
|
|
(6,066
|
)
|
||
Credit-risk-related Contingent Features
The Company has agreements with each of its bilateral derivative counterparties. Some of those agreements contain a provision whereby if the Company defaults on any of its indebtedness, including default whereby repayment of the indebtedness has not been accelerated by the lender, the Company could also be declared in default on its derivative obligations.
At
December 31, 2015
, the fair value of derivatives in a net liability position, which includes accrued interest but excludes any adjustment for non-performance risk related to these agreements, was
$121.7 million
. The Company has minimum collateral posting thresholds with certain of its derivative counterparties and has posted collateral of
$143.9 million
of Agency RMBS and
$109.3 million
of cash as of
December 31, 2015
. If the Company had breached any of these provisions at
December 31, 2015
, it could have been required to settle its obligations under the agreements at their termination value.
In addition, as of
December 31, 2015
, the Company has an agreement with a central clearing counterparty. The fair value of such derivatives in a net liability position, which includes accrued interest but excludes any adjustment for non-performance risk related to this agreement, was
$121.1 million
.
The Company was in compliance with all of the financial provisions of these counterparty agreements as of
December 31, 2015
.
Certain of the Company's repurchase agreements and derivative transactions are governed by underlying agreements that generally provide for a right of offset under master netting arrangements (or similar agreements), in the event of default or in the event of bankruptcy of either party to the transactions. Assets and liabilities subject to such arrangements are presented on a gross basis in the consolidated balance sheets.
The following tables present information about the assets and liabilities that are subject to master netting arrangements (or similar agreements) and can potentially be offset on the Company’s consolidated balance sheets at
December 31, 2015
and
December 31, 2014
.
Offsetting of Derivative Assets
As of
December 31, 2015
|
Gross Amounts Not Offset in the
Consolidated Balance Sheets
|
|||||||||||||||||
|
$ in thousands
Description
|
Gross
Amounts of
Recognized
Assets
|
Gross
Amounts
Offset in the
Consolidated
Balance
Sheets
|
Net Amounts
of Assets
presented
in the
Consolidated
Balance Sheets
|
Financial
Instruments (1)
|
Collateral
Received
|
Net Amount
|
|||||||||||
|
Derivatives
|
8,659
|
|
—
|
|
8,659
|
|
(4,142
|
)
|
(4,517
|
)
|
—
|
|
|||||
|
Total
|
8,659
|
|
—
|
|
8,659
|
|
(4,142
|
)
|
(4,517
|
)
|
—
|
|
|||||
|
107
|
||
Offsetting of Derivative Liabilities, Repurchase Agreements and Secured Loans
As of
December 31, 2015
|
Gross Amounts Not Offset in the
Consolidated Balance Sheets
|
|||||||||||||||||
|
$ in thousands
Description
|
Gross
Amounts of
Recognized
Liabilities
|
Gross
Amounts
Offset in the
Consolidated
Balance
Sheets
|
Net Amounts
of Liabilities
presented
in the
Consolidated
Balance Sheets
|
Financial
Instruments (2)(3)(5)
|
Collateral
Posted (2)(4)(5)
|
Net Amount
|
|||||||||||
|
Derivatives
|
238,148
|
|
—
|
|
238,148
|
|
(117,240
|
)
|
(109,299
|
)
|
11,609
|
|
|||||
|
Repurchase Agreements
|
12,126,048
|
|
—
|
|
12,126,048
|
|
(12,126,048
|
)
|
—
|
|
—
|
|
|||||
|
Secured Loans
|
1,650,000
|
|
—
|
|
1,650,000
|
|
(1,650,000
|
)
|
—
|
|
—
|
|
|||||
|
Total
|
14,014,196
|
|
—
|
|
14,014,196
|
|
(13,893,288
|
)
|
(109,299
|
)
|
11,609
|
|
|||||
Offsetting of Derivative Assets
As of
December 31, 2014
|
Gross Amounts Not Offset in the
Consolidated Balance Sheets
|
|||||||||||||||||
|
$ in thousands
Description
|
Gross
Amounts of
Recognized
Assets
|
Gross
Amounts
Offset in the
Consolidated
Balance
Sheets
|
Net Amounts
of Assets
presented
in the
Consolidated
Balance Sheets
|
Financial
Instruments (1)
|
Cash
Collateral
Received
|
Net Amount
|
|||||||||||
|
Derivatives
|
24,178
|
|
—
|
|
24,178
|
|
(5,277
|
)
|
(18,901
|
)
|
—
|
|
|||||
|
Total
|
24,178
|
|
—
|
|
24,178
|
|
(5,277
|
)
|
(18,901
|
)
|
—
|
|
|||||
Offsetting of Derivative Liabilities and Repurchase Agreements
As of
December 31, 2014
|
Gross Amounts Not Offset in the
Consolidated Balance Sheets
|
|||||||||||||||||
|
$ in thousands
Description
|
Gross
Amounts of
Recognized
Liabilities
|
Gross
Amounts
Offset in the
Consolidated
Balance
Sheets
|
Net Amounts
of Liabilities
presented
in the
Consolidated
Balance Sheets
|
Financial
Instruments (2)(3)
|
Cash
Collateral
Posted (2)(4)
|
Net Amount
|
|||||||||||
|
Derivatives
|
254,026
|
|
—
|
|
254,026
|
|
(235,908
|
)
|
(18,118
|
)
|
—
|
|
|||||
|
Repurchase Agreements
|
13,622,677
|
|
—
|
|
13,622,677
|
|
(13,622,677
|
)
|
—
|
|
—
|
|
|||||
|
Secured Loans
|
1,250,000
|
|
1,250,000
|
|
(1,250,000
|
)
|
—
|
|
—
|
|
|||||||
|
15,126,703
|
|
—
|
|
15,126,703
|
|
(15,108,585
|
)
|
(18,118
|
)
|
—
|
|
||||||
|
(1)
|
Amounts represent derivatives in an asset position which could potentially be offset against derivatives in a liability position at
December 31, 2015
and
December 31, 2014
, subject to a netting arrangement.
|
|
(2)
|
Amounts represent collateral pledged that is available to be offset against liability balances associated with repurchase agreements, secured loans and derivatives.
|
|
(3)
|
The fair value of securities pledged against the Company's borrowing under repurchase agreements was
$13.5 billion
and
$15.3 billion
at
December 31, 2015
and
December 31, 2014
, respectively, including securities held as collateral that are eliminated in consolidation of
$403.2 million
at
December 31, 2014
.
|
|
(4)
|
Cash collateral received on the Company's derivatives was
$4.9 million
and
$14.9 million
at
December 31, 2015
and
December 31, 2014
, respectively. Non-cash collateral received on the Company's derivatives was
$0.0 million
and
$10.8 million
at
December 31, 2015
and
December 31, 2014
, respectively. Cash collateral posted by the Company on its derivatives was
$109.3 million
and
$57.6 million
at
December 31, 2015
and
December 31, 2014
, respectively.
|
|
(5)
|
The fair value of securities pledged against IAS Services LLC's borrowing under secured loans was
$1.9 billion
and
$1.5 billion
at
December 31, 2015
and
December 31, 2014
, respectively.
|
|
108
|
||
A three-level valuation hierarchy exists for disclosure of fair value measurements based upon the transparency of inputs to the valuation of an asset or liability as of the measurement date. Observable inputs reflect readily obtainable data from independent sources, while unobservable inputs reflect the Company’s market assumptions. The three levels are defined as follows:
|
•
|
Level 1 Inputs
– Quoted prices for identical instruments in active markets.
|
|
•
|
Level 2 Inputs
– Quoted prices for similar instruments in active markets; quoted prices for identical or similar instruments in markets that are not active; and model-derived valuations whose inputs are observable or whose significant value drivers are observable.
|
|
•
|
Level 3 Inputs
– Instruments with primarily unobservable value drivers.
|
The following tables present the Company's assets and liabilities measured at fair value on a recurring basis.
|
December 31, 2015
|
|||||||||||
|
|
Fair Value Measurements Using:
|
|
|||||||||
|
$ in thousands
|
Level 1
|
Level 2
|
Level 3
|
Total at
Fair Value
|
|||||||
|
Assets:
|
|||||||||||
|
Mortgage-backed and credit risk transfer securities
(1) (2)
|
—
|
|
16,091,657
|
|
(25,722
|
)
|
16,065,935
|
|
|||
|
Derivative assets
|
—
|
|
8,659
|
|
—
|
|
8,659
|
|
|||
|
Total assets
|
—
|
|
16,100,316
|
|
(25,722
|
)
|
16,074,594
|
|
|||
|
Liabilities:
|
|||||||||||
|
Derivative liabilities
|
—
|
|
238,148
|
|
—
|
|
238,148
|
|
|||
|
Total liabilities
|
—
|
|
238,148
|
|
—
|
|
238,148
|
|
|||
|
December 31, 2014
|
|||||||||||
|
|
Fair Value Measurements Using:
|
|
|||||||||
|
$ in thousands
|
Level 1
|
Level 2
|
Level 3
|
Total at
Fair Value
|
|||||||
|
Assets:
|
|||||||||||
|
Mortgage-backed and credit risk transfer securities
(1) (2)
|
—
|
|
17,270,390
|
|
(21,495
|
)
|
17,248,895
|
|
|||
|
Derivative assets
|
89
|
|
23,693
|
|
396
|
|
24,178
|
|
|||
|
Total assets
|
89
|
|
17,294,083
|
|
(21,099
|
)
|
17,273,073
|
|
|||
|
Liabilities:
|
|||||||||||
|
Derivative liabilities
|
—
|
|
254,026
|
|
—
|
|
254,026
|
|
|||
|
Total liabilities
|
—
|
|
254,026
|
|
—
|
|
254,026
|
|
|||
|
(1)
|
For more detail about the fair value of the Company's MBS and GSE CRTs, refer to Note 4 - "Mortgage-Backed and Credit Risk Transfer Securities."
|
|
(2)
|
As discussed in Note 2 "Summary of Significant Accounting Policies," the Company's GSE CRTs are accounted for as hybrid financial instruments with an embedded derivative. The hybrid instruments consist of debt host contracts classified as Level 2 and embedded derivatives classified as Level 3. As of
December 31, 2015
, the net embedded derivative liability position of
$25.7 million
includes
$1.0 million
of embedded derivatives in an asset position and
$26.7 million
of embedded derivatives in a liability position. As of December 31, 2014, the net embedded derivative liability position of
$21.5 million
includes
$3.1 million
of embedded derivatives in an asset position and
$24.6 million
of embedded derivatives in a liability position.
|
|
109
|
||
The following table shows a reconciliation of the beginning and ending fair value measurements of the Company's GSE CRT embedded derivatives:
|
$ in thousands
|
December 31, 2015
|
December 31, 2014
|
|||
|
Beginning balance
|
(21,495
|
)
|
—
|
|
|
|
Sales and settlements
|
2,184
|
|
—
|
|
|
|
Realized gains/(losses), net
|
(2,184
|
)
|
—
|
|
|
|
Unrealized gains/(losses), net
|
(4,227
|
)
|
(21,495
|
)
|
|
|
Ending balance
|
(25,722
|
)
|
(21,495
|
)
|
|
The following table summarizes significant unobservable inputs used in the fair value measurement of the Company's GSE CRT embedded derivatives:
|
Fair Value at
|
|||||||||||
|
$ in thousands
|
December 31, 2015
|
Valuation Technique
|
Unobservable Input
|
Range
|
Weighted Average
|
||||||
|
GSE CRT Embedded derivatives
|
(25,722
|
)
|
Market Comparables
|
Prepayment Rate
|
5.72% - 14.37%
|
7.83
|
%
|
||||
|
Vendor Pricing
|
Defaults Rate
|
0.10% - 0.35%
|
0.16
|
%
|
|||||||
|
Fair Value at
|
|||||||||||
|
$ in thousands
|
December 31, 2014
|
Valuation Technique
|
Unobservable Input
|
Range
|
Weighted Average
|
||||||
|
GSE CRT Embedded derivatives
|
(21,495
|
)
|
Market Comparables
|
Prepayment Rate
|
4.46% - 8.98%
|
5.29
|
%
|
||||
|
Vendor Pricing
|
Defaults Rate
|
0.12% - 0.37%
|
0.18
|
%
|
|||||||
These significant unobservable inputs change according to market conditions and security performance. Prepayment rates and default rates are used to estimate the maturity of GSE CRTs in order to identify GSE corporate debt with a similar maturity. Therefore, changes in prepayment rate and default rate do not have an explicit directional impact on the fair value measurement.
The following table shows a reconciliation of the beginning and ending Level 3 fair value measurements of the Company's credit default swap ("CDS") contract:
|
$ in thousands
|
December 31, 2015
|
December 31, 2014
|
|||
|
Beginning balance
|
396
|
|
654
|
|
|
|
Unrealized gains/(losses), net
|
648
|
|
(258
|
)
|
|
|
Sales and settlements
|
(1,044
|
)
|
—
|
|
|
|
Ending balance
|
—
|
|
396
|
|
|
The following table summarizes significant unobservable inputs used in the fair value measurement of the Company's CDS contract as of
December 31, 2014
:
|
Fair Value at
|
|||||||||||
|
$ in thousands
|
December 31, 2014
|
Valuation Technique
|
Unobservable Input
|
Range
|
Weighted Average
|
||||||
|
CDS Contract
|
396
|
|
Discounted cash flow
|
Swap Rate
|
2.39
|
%
|
|||||
|
Discount Rate
|
0.76
|
%
|
|||||||||
|
Credit Spread
|
0.24
|
%
|
|||||||||
|
Constant Prepayment Rate
|
1.0% - 20.0%
|
5.46
|
%
|
||||||||
|
Constant Default Rate
|
0.6% - 100.0%
|
4.15
|
%
|
||||||||
|
Loss Severity
|
1.1% - 62.3%
|
39.35
|
%
|
||||||||
These significant unobservable inputs change according to market conditions and security performance expectations. Significant increases (decreases) in swap rate, discount rate, credit spread, constant prepayment rate, constant
|
110
|
||
default rate or loss severity in isolation would result in a lower (higher) fair value measurement. Generally, a change in the assumption used for the constant default rate would likely be accompanied by a directionally similar change in the assumptions used for swap rate, credit spread and loss severity and a directionally opposite change in the assumption used for discount rate and constant prepayment rate.
The following table presents the carrying value and estimated fair value of the Company's financial instruments that are not carried at fair value on the consolidated balance sheets at
December 31, 2015
and
December 31, 2014
:
|
|
December 31, 2015
|
December 31, 2014
|
|||||||||
|
$ in thousands
|
Carrying
Value
|
Estimated
Fair Value
|
Carrying
Value
|
Estimated
Fair Value
|
|||||||
|
Financial Assets:
|
|||||||||||
|
Residential loans, held-for-investment
|
—
|
|
—
|
|
3,365,003
|
|
3,399,964
|
|
|||
|
Commercial loans, held-for-investment
|
209,062
|
|
209,790
|
|
145,756
|
|
147,497
|
|
|||
|
Other investments
|
113,788
|
|
113,788
|
|
106,498
|
|
106,498
|
|
|||
|
Total
|
322,850
|
|
323,578
|
|
3,617,257
|
|
3,653,959
|
|
|||
|
Financial Liabilities:
|
|||||||||||
|
Repurchase agreements
|
12,126,048
|
|
12,133,352
|
|
13,622,677
|
|
13,630,571
|
|
|||
|
Secured loans
|
1,650,000
|
|
1,650,000
|
|
1,250,000
|
|
1,250,000
|
|
|||
|
Asset-backed securities issued by securitization trusts
|
—
|
|
—
|
|
2,929,820
|
|
2,930,422
|
|
|||
|
Exchangeable senior notes
|
400,000
|
|
376,500
|
|
400,000
|
|
379,500
|
|
|||
|
Total
|
14,176,048
|
|
14,159,852
|
|
18,202,497
|
|
18,190,493
|
|
|||
The following describes the Company’s methods for estimating the fair value for financial instruments.
|
•
|
The fair value of residential loans held-for-investment is a Level 3 fair value measurement which is based on an expected present value technique. This method discounts future estimated cash flows using rates the Company determined best reflect current market interest rates that would be offered for loans with similar characteristics and credit quality.
|
|
•
|
The fair value of commercial loans held-for-investment is a Level 3 fair value measurement. New commercial loans are carried at their unpaid principal balance until the end of the calendar year in which they were originated or purchased unless market factors indicate cost may not be a reliable indicator of fair value. Subsequent to the year of origination, commercial loan investments are valued on at least an annual basis by an independent third party valuation agent using a discounted cash flow technique.
|
|
•
|
The fair value of FHLBI stock, included in "Other investments," is a Level 3 fair value measurement. FHLBI stock may only be sold back to the FHLBI at its discretion at cost. As a result, the cost of the FHLBI stock approximates its fair value.
|
|
•
|
The fair value of investments in unconsolidated ventures, included in "Other investments," is a Level 3 fair value measurement. The fair value measurement is based on the net asset value per share of the Company's investments.
|
|
•
|
The fair value of repurchase agreements is a Level 3 fair value measurement based on an expected present value technique. This method discounts future estimated cash flows using rates the Company determined best reflect current market interest rates that would be offered for repurchase agreements with similar characteristics and credit quality.
|
|
•
|
The fair value of secured loans is a Level 3 fair value measurement. The secured loans have floating rates based on an index plus a spread. Accordingly, the interest rates on these secured loans are at market, and thus the carrying amount approximates fair value.
|
|
•
|
The fair value of asset-backed securities issued by securitization trusts is a Level 3 fair value measurement based on valuations obtained from a third party pricing service. There is not an active trading market for many of the underlying asset-backed securities. Accordingly, these securities are valued by the third party pricing service by discounting future estimated cash flows using rates that best reflect current market interest rates that would be offered for securities with similar characteristics and credit quality.
|
|
•
|
The fair value of exchangeable senior notes is a Level 2 fair value measurement based on a valuation obtained from a third-party pricing service.
|
|
111
|
||
The Company is externally managed and advised by Invesco Advisers, Inc. (the "Manager"), a wholly-owned subsidiary of Invesco Ltd. Under the terms of the management agreement, the Manager and its affiliates provide the Company with its management team, including its officers, along with appropriate support personnel. Each of the Company’s officers is an employee of the Manager or one of its affiliates. The Company does not have any employees. The Manager is not obligated to dedicate any of its employees exclusively to the Company, nor are the Manager or its employees obligated to dedicate any specific portion of its or their time to the Company’s business. The Manager is at all times subject to the supervision and oversight of the Company’s Board of Directors and has only such functions and authority as the Company delegates to it.
The Company has invested
$47.4 million
as of
December 31, 2015
(
2014
:
$149.3 million
) in money market or mutual funds managed by affiliates of the Company’s Manager. The investments are reported as cash and cash equivalents on the Company’s consolidated balance sheets.
Management Fee
The Company pays its Manager a management fee equal to
1.50%
of the Company’s stockholders’ equity per annum. The fee is calculated and payable quarterly in arrears. For purposes of calculating the management fee, stockholders’ equity is equal to the sum of the net proceeds from all issuances of equity securities since inception (allocated on a pro rata daily basis for such issuances during the fiscal quarter of any such issuance), plus retained earnings at the end of the most recently completed calendar quarter (without taking into account any non-cash equity compensation expense incurred in current or prior periods), less any amount paid to repurchase common stock since inception. Stockholder's equity shall exclude (i) any unrealized gains, losses or other items that do not affect realized net income (regardless of whether such items are included in other comprehensive income or loss, or in net income); (ii) cumulative net realized losses that are not attributable to permanently impaired investments and that relate to the investments for which market movement is accounted for in other comprehensive income; provided, however, that such adjustment shall not exceed cumulative unrealized net gains in other comprehensive income; (iii) one-time events pursuant to changes in U.S. GAAP; and (iv) certain non-cash items after discussions between the Manager and the Company’s independent directors and approval by a majority of the Company’s independent directors.
The Company does not pay any management fees on its investments in unconsolidated ventures that are managed by an affiliate of the Manager.
For the year ended
December 31, 2015
, the Company incurred management fees of
$38.6 million
(
2014
:
$37.6 million
;
2013
:
$42.6 million
) of which
$9.8 million
(
2014
:
$9.6 million
;
2013
:
$10.5 million
) was accrued but has not been paid.
Expense Reimbursement
The Company is required to reimburse its Manager for Company operating expenses incurred on its behalf by the Manager, including directors and officers insurance, accounting services, auditing and tax services, filing fees, and miscellaneous general and administrative costs. The Company’s reimbursement obligation is not subject to any dollar limitation.
The following table summarizes the costs originally paid by the Manager, incurred on behalf of the Company for the years ended
December 31, 2015
,
2014
and
2013
.
|
Years ended December 31,
|
||||||||
|
$ in thousands
|
2015
|
2014
|
2013
|
|||||
|
Incurred costs, prepaid or expensed
|
6,463
|
|
5,954
|
|
4,449
|
|
||
|
Incurred costs, charged against equity as a cost of raising capital
|
22
|
|
213
|
|
418
|
|
||
|
Incurred costs, capitalized to other assets
|
—
|
|
—
|
|
7
|
|
||
|
Total incurred costs, originally paid by the Manager
|
6,485
|
|
6,167
|
|
4,874
|
|
||
Termination Fee
A termination fee is due to the Manager upon termination of the management agreement by the Company. The termination fee is equal to three times the sum of the average annual management fee earned by the Manager during the 24-month period before termination, calculated as of the end of the most recently completed fiscal quarter.
|
112
|
||
Securities Convertible into Shares of Common Stock
The non-controlling interest holder of the Operating Partnership units, a wholly-owned Invesco subsidiary, has the right to cause the Operating Partnership to redeem their operating partnership ("OP Units") for cash equal to the market value of an equivalent number of shares of common stock, or at the Company’s option, the Company may purchase their OP Units by issuing one share of common stock for each OP Unit redeemed. The Company has also adopted an equity incentive plan which allows the Company to grant securities convertible into the Company’s common stock to its non-executive directors and employees of the Company's Manager and its affiliates.
In 2013, a wholly-owned subsidiary of the Company issued
$400.0 million
in aggregate principal amount of Exchangeable Senior Notes due March 15,
2018
. The Exchangeable Senior Notes are convertible into shares of common stock. Refer to Note 7 - "Borrowings" for further discussion of the Exchangeable Senior Notes.
Registration Rights
Upon completion of the Company's initial public offering, the Company entered into a registration rights agreement with regard to the common stock and OP Units owned by wholly-owned subsidiaries of Invesco and any shares of common stock that the Manager may elect to receive under the management agreement or otherwise. Under the registration rights agreement, the Company has granted Invesco (i) unlimited demand registration rights to have the common stock and OP Units owned by Invesco and any shares of common stock granted to the Manager registered for resale and (ii) in certain circumstances, the right to “piggy-back” these shares in registration statements the Company might file in connection with any future public offering so long as the Company retains the Manager under the management agreement.
On March 12, 2013, the Company also entered into a registration rights agreement with the initial purchasers of the Notes. Under the registration rights agreement, the Company has designated its automatic shelf registration statement filed on April 2, 2013 to be used for resales of the common stock, if any, issuable upon exchange of the Notes. The Company has filed a supplement to the underlying prospectus in that shelf registration statement to cover resales of the common stock by one noteholder and has agreed to file additional prospectus supplements if requested by noteholders to add such noteholders as selling securityholders. If the shelf registration statement ceases to be effective, additional interest will accrue on the Notes, subject to certain exceptions.
Common Stock
The Company has a dividend reinvestment and stock purchase plan (the “DRSPP”) that allows participating stockholders to purchase shares of common stock directly from the Company. DRSPP participants may also automatically reinvest all or a portion of their dividends in exchange for additional shares of common stock.
During the year ended
December 31, 2015
and
2014
, the Company issued
12,945
(
2014
:
15,505
;
2013
:
1,770,106
) shares of common stock at an average price of
$14.75
(
2014
:
$16.52
;
2013
:
$21.31
) under the DRSPP. The Company received total proceeds of approximately
$191,000
(
2014
:
$256,000
;
2013
:
$37.7 million
), net of issuance costs of
$0
(
2014
:
$0
;
2013
:
$219,000
).
Preferred Stock
Holders of the Company’s Series A Preferred Stock are entitled to receive dividends at an annual rate of
7.75%
of the liquidation preference of
$25.00
per share or
$1.9375
per share per annum. These dividends are cumulative and payable quarterly in arrears.
In September 2014, the Company completed a public offering of
6,200,000
shares of
7.75%
Fixed-to-Floating Series B Cumulative Redeemable Preferred Stock (the "Series B Preferred Stock") at the price of
$25.00
per share. Total proceeds were
$149.9 million
, net of issuance costs of
$5.1 million
. Holders of the Company’s Series B Preferred Stock are entitled to receive dividends at an annual rate of
7.75%
of the liquidation preference of
$25.00
per share or
$1.9375
per share per annum until December 27, 2024. After December 27, 2024, holders are entitled to receive dividends at a floating rate equal to three-month LIBOR plus a spread of
5.18%
of the
$25.00
liquidation preference per annum. These dividends are cumulative and payable quarterly in arrears.
The Company may elect to redeem shares of preferred stock at its option after July 26, 2017 (with respect to the Series A Preferred Stock) and after December 27, 2024 (with respect to the Series B Preferred Stock) for
$25.00
per share, plus any accumulated and unpaid dividends through the date of the redemption. These shares are not redeemable, convertible into or exchangeable for any other property or any other securities of the Company prior to those times, except under circumstances intended to preserve the Company's qualification as a REIT or upon the occurrence of a change in control.
|
113
|
||
Share Repurchase Program
In December 2011, the Company's board of directors approved a share repurchase program to purchase up to
7,000,000
shares of its common shares with no stated expiration date. In December 2013, the Company's board of directors approved an additional share repurchase of up to
20,000,000
of its common shares with no expiration date.
During the twelve months ended
December 31, 2015
, the Company repurchased
9,539,251
(
2014
:
1,438,213
) shares of its common stock at an average repurchase price of
$13.17
(
2014
:
$14.69
) per share for a net cost of
$125.6 million
(
2014
:
$21.1 million
), including acquisition expenses. As of
December 31, 2015
, the Company had authority to purchase
5,302,533
additional shares of its common stock through the share repurchase program.
Share-Based Compensation
The Company established the 2009 Equity Incentive Plan for grants of common stock and other equity based awards to its non-executive directors and officers and employees of the Manager and its affiliates (the “Incentive Plan”). Under the Incentive Plan, a total of
1,000,000
shares of common stock are currently reserved for issuance. Unless terminated earlier, the Incentive Plan will terminate in
2019
, but will continue to govern the unexpired awards.
The Company recognized compensation expense of approximately
$340,000
(
2014
:
$282,000
;
2013
:
$165,000
) related to awards to the Company's non-executive directors for the year ended
December 31, 2015
. During the year ended
December 31, 2015
, the Company issued
23,776
shares (
2014
:
14,632
shares;
2013
:
8,946
shares) of common stock pursuant to the Incentive Plan to the Company’s non-executive directors. The fair market value of the shares granted was determined by the closing stock market price on the date of the grant. The grants vested immediately.
The Company recognized compensation expense of approximately
$219,000
(
2014
:
$290,000
;
2013
:
$197,000
) for the year ended
December 31, 2015
related to awards to employees of the Manager and its affiliates which is reimbursed by the Manager under the management agreement.
The following table summarizes the activity related to restricted stock units to employees of the Manager and its affiliates for the year ended
December 31, 2015
.
|
Year Ended December 31,
|
||||||
|
2015
|
||||||
|
|
Restricted Stock Units
|
Weighted Average Grant Date Fair Value
(1)
|
||||
|
Unvested at the beginning of the year
|
45,545
|
|
$
|
18.67
|
|
|
|
Shares granted during the year
|
17,652
|
|
15.97
|
|
||
|
Shares forfeited during the year
|
(4,600
|
)
|
(17.26
|
)
|
||
|
Shares vested during the year
|
(17,783
|
)
|
(19.53
|
)
|
||
|
Unvested at the end of the year
|
40,814
|
|
$
|
17.29
|
|
|
|
(1)
|
The grant date fair value of restricted stock awards is based on the closing market price of the Company’s common stock at the grant date.
|
|
114
|
||
Dividends
The following table sets forth the dividends declared per share of the Company's common stock.
|
Date Declared
|
Dividends Declared Per Share
|
||||
|
|
Amount
|
Date of Payment
|
|||
|
2015
|
|||||
|
December 15, 2015
|
$
|
0.40
|
|
January 26, 2016
|
|
|
September 15, 2015
|
$
|
0.40
|
|
October 27, 2015
|
|
|
June 15, 2015
|
$
|
0.45
|
|
July 28, 2015
|
|
|
March 17, 2015
|
$
|
0.45
|
|
April 28, 2015
|
|
|
2014
|
|||||
|
December 16, 2014
|
$
|
0.45
|
|
January 27, 2015
|
|
|
September 15, 2014
|
$
|
0.50
|
|
October 28, 2014
|
|
|
June 16, 2014
|
$
|
0.50
|
|
July 28, 2014
|
|
|
March 18, 2014
|
$
|
0.50
|
|
April 28, 2014
|
|
The following table sets forth the dividends declared per share of the Company's Series A Preferred Stock.
|
Date Declared
|
Dividends Declared Per Share
|
||||
|
|
Amount
|
Date of Payment
|
|||
|
2015
|
|||||
|
December 15, 2015
|
$
|
0.4844
|
|
January 25, 2016
|
|
|
September 15, 2015
|
$
|
0.4844
|
|
October 26, 2015
|
|
|
June 15, 2015
|
$
|
0.4844
|
|
July 27, 2015
|
|
|
March 17, 2015
|
$
|
0.4844
|
|
April 27, 2015
|
|
|
2014
|
|||||
|
December 16, 2014
|
$
|
0.4844
|
|
January 26, 2015
|
|
|
September 15, 2014
|
$
|
0.4844
|
|
October 27, 2014
|
|
|
June 16, 2014
|
$
|
0.4844
|
|
July 25, 2014
|
|
|
March 18, 2014
|
$
|
0.4844
|
|
April 25, 2014
|
|
The following table sets forth the dividends declared per share of the Company's Series B Preferred Stock.
|
Date Declared
|
Dividends Declared Per Share
|
||||
|
|
Amount
|
Date of Payment
|
|||
|
2015
|
|||||
|
December 15, 2015
|
$
|
0.4844
|
|
March 28, 2016
|
|
|
September 15, 2015
|
$
|
0.4844
|
|
December 28, 2015
|
|
|
June 15, 2015
|
$
|
0.4844
|
|
September 28, 2015
|
|
|
March 17, 2015
|
$
|
0.4844
|
|
June 29, 2015
|
|
|
2014
|
|||||
|
December 16, 2014
|
$
|
0.4844
|
|
March 27, 2015
|
|
|
November 4, 2014
|
$
|
0.5705
|
|
December 29, 2014
|
|
|
115
|
||
The following table sets forth the dividends declared per share of the Company's preferred and common stock and their related tax characterization for the fiscal tax years ended
December 31, 2015
and
2014
.
|
Tax Characterization of Dividends
|
||||||||||||
|
Fiscal Tax Year
|
Dividends Declared
|
Ordinary Dividends
|
Capital Gain Distribution
|
Carry Forward
|
||||||||
|
Series A Preferred Stock Dividends
|
||||||||||||
|
Fiscal tax year 2015
(1)
|
1.937600
|
|
1.937600
|
|
—
|
|
—
|
|
||||
|
Fiscal tax year 2014
(2)
|
1.937600
|
|
1.937600
|
|
—
|
|
—
|
|
||||
|
Series B Preferred Stock Dividends
|
||||||||||||
|
Fiscal tax year 2015
(3)
|
1.937600
|
|
1.937600
|
|
—
|
|
—
|
|
||||
|
Fiscal tax year 2014
(4)
|
0.570500
|
|
0.570500
|
|
—
|
|
—
|
|
||||
|
Common Stock Dividends
|
||||||||||||
|
Fiscal tax year 2015
(5)
|
1.700000
|
|
1.615469
|
|
—
|
|
0.257840
|
|
||||
|
Fiscal tax year 2014
|
1.950000
|
|
1.776691
|
|
—
|
|
0.173309
|
|
||||
|
(1)
|
Excludes preferred stock dividend of
$0.4844
per share declared on December 15, 2015 having a record date of January 1, 2016, which for federal income tax purposes is a fiscal tax year 2016 dividend.
|
|
(2)
|
Excludes preferred stock dividend of
$0.4844
per share declared on December 16, 2014 having a record date of January 1, 2015, which for federal income tax purposes is a fiscal tax year 2015 dividend.
|
|
(3)
|
Excludes preferred stock dividend of
$0.4844
per share declared on December 15, 2015 having a record date of
March 5, 2016
, which for federal income tax purposes is a fiscal tax year 2016 dividend.
|
|
(4)
|
Excludes preferred stock dividend of
$0.4844
per share declared on December 16, 2014 having a record date of March 5, 2015, which for federal income tax purposes is a fiscal tax year 2015 dividend.
|
|
(5)
|
Ordinary dividends include
$0.173309
of undistributed taxable income carried-forward from fiscal tax year 2014.
|
Earnings per share for the years ended
December 31, 2015
,
2014
and
2013
is computed as follows:
|
$ and share amounts in thousands
|
Years Ended December 31,
|
|||||||
|
|
2015
|
2014
|
2013
|
|||||
|
Numerator (Income)
|
||||||||
|
Basic Earnings:
|
||||||||
|
Net income (loss) available to common stockholders
|
81,106
|
|
(245,484
|
)
|
147,304
|
|
||
|
Effect of dilutive securities:
|
||||||||
|
Income allocated to exchangeable senior notes
|
—
|
|
—
|
|
—
|
|
||
|
Income (loss) allocated to non-controlling interest
|
1,241
|
|
(2,632
|
)
|
1,667
|
|
||
|
Dilutive net income (loss) available to stockholders
|
82,347
|
|
(248,116
|
)
|
148,971
|
|
||
|
Denominator (Weighted Average Shares)
|
||||||||
|
Basic Earnings:
|
||||||||
|
Shares available to common stockholders
|
121,378
|
|
123,105
|
|
132,714
|
|
||
|
Effect of dilutive securities:
|
||||||||
|
Restricted stock awards
|
41
|
|
—
|
|
35
|
|
||
|
OP Units
|
1,425
|
|
1,425
|
|
1,425
|
|
||
|
Exchangeable senior notes
|
—
|
|
—
|
|
—
|
|
||
|
Dilutive Shares
|
122,844
|
|
124,530
|
|
134,174
|
|
||
The following potential common shares were excluded from diluted earnings per common share for the years ended
December 31, 2015
and
2014
as the effect would be anti-dilutive:
16,835,720
for the exchangeable senior notes, respectively, and
0
and
44,421
for restricted stock awards, respectively. The following potential common shares were excluded from diluted
|
116
|
||
earnings per common share for the year ended
December 31, 2013
as the effect would be anti-dilutive:
13,606,952
for the exchangeable senior notes.
Non-controlling interest represents the aggregate Operating Partnership Units in the Company's Operating Partnership held by a wholly-owned Invesco subsidiary. Income allocated to the non-controlling interest is based on the Unit Holders’ ownership percentage of the Operating Partnership. The ownership percentage is determined by dividing the number of OP Units held by the Unit Holders by the total number of dilutive shares of common stock. The issuance of common stock (“Share” or “Shares”) or OP Units changes the percentage ownership of both the Unit Holders and the common stockholders. Since an OP unit is generally redeemable for cash or Shares at the option of the Company, it is deemed to be a Share equivalent. Therefore, such transactions are treated as capital transactions and result in an allocation between stockholders’ equity and non-controlling interest in the accompanying consolidated balance sheets. As of
December 31, 2015
, non-controlling interest related to the outstanding
1,425,000
OP Units represented a
1.2%
interest (
2014
:
1.1%
) in the Operating Partnership.
The following table presents the net income (loss) allocated and distributions paid to the Operating Partnership non-controlling interest for the years ended
December 31, 2015
,
2014
and
2013
.
|
Years ended December 31,
|
||||||||
|
$ in thousands
|
2015
|
2014
|
2013
|
|||||
|
Net income (loss) allocated
|
1,241
|
|
(2,632
|
)
|
1,667
|
|
||
|
Distributions paid
|
2,494
|
|
2,850
|
|
3,491
|
|
||
As of
December 31, 2015
, distributions payable to the non-controlling interest were approximately
$570,000
(
2014
:
$641,000
;
2013
:
$713,000
).
Commitments and contingencies may arise in the ordinary course of business. The Company's material off balance sheet commitments as of
December 31, 2015
are discussed below.
As discussed in Note 6 - "Other Investments", the Company has invested in unconsolidated ventures that are sponsored by an affiliate of the Company’s Manager. The unconsolidated ventures are structured as partnerships, and the Company invests in the partnerships as a limited partner. The entities are structured such that capital commitments are to be drawn down over the life of the partnership as investment opportunities are identified. At
December 31, 2015
, the Company’s undrawn capital and purchase commitments were
$21.1 million
(
2014
:
$31.0 million
).
As discussed in Note 5 - “Commercial Loans Held-for-Investment”, the Company purchases and originates commercial loans. As of
December 31, 2015
, the Company has unfunded commitments on commercial loans held-for-investment of
$2.1 million
(
2014
:
$5.0 million
).
The Company has entered into agreements with financial institutions to guarantee certain obligations of its subsidiaries. The Company would be required to perform under these guarantees in the event of certain defaults. The Company has not had prior claims or losses pursuant to these contracts and expects the risk of loss to be remote.
|
117
|
||
The following is a presentation of selected unaudited results of operations for the quarters ended.
|
$ in thousands except share amounts
|
Q4 15
|
Q3 15
|
Q2 15
|
Q1 15
|
Q4 14
|
Q3 14
|
Q2 14
|
Q1 14
|
|||||||||||||||
|
Interest Income
|
|||||||||||||||||||||||
|
Mortgage-backed and credit risk transfer securities
|
127,633
|
|
129,260
|
|
126,098
|
|
135,265
|
|
143,043
|
|
139,419
|
|
148,195
|
|
148,405
|
|
|||||||
|
Residential loans
|
22,907
|
|
28,380
|
|
30,247
|
|
29,374
|
|
27,185
|
|
22,713
|
|
20,471
|
|
17,704
|
|
|||||||
|
Commercial loans
|
3,982
|
|
3,743
|
|
4,491
|
|
3,115
|
|
3,179
|
|
2,649
|
|
2,061
|
|
1,619
|
|
|||||||
|
Total interest income
|
154,522
|
|
161,383
|
|
160,836
|
|
167,754
|
|
173,407
|
|
164,781
|
|
170,727
|
|
167,728
|
|
|||||||
|
Interest Expense
|
|||||||||||||||||||||||
|
Repurchase agreements
|
41,348
|
|
41,303
|
|
40,931
|
|
43,310
|
|
46,050
|
|
45,756
|
|
47,822
|
|
49,071
|
|
|||||||
|
Secured loans
|
1,940
|
|
1,622
|
|
1,553
|
|
1,464
|
|
1,177
|
|
1,223
|
|
176
|
|
—
|
|
|||||||
|
Exchangeable senior notes
|
5,621
|
|
5,620
|
|
5,613
|
|
5,607
|
|
5,621
|
|
5,620
|
|
5,613
|
|
5,607
|
|
|||||||
|
Asset-backed securities
|
17,128
|
|
20,686
|
|
22,329
|
|
21,898
|
|
20,738
|
|
17,660
|
|
15,826
|
|
13,935
|
|
|||||||
|
Total interest expense
|
66,037
|
|
69,231
|
|
70,426
|
|
72,279
|
|
73,586
|
|
70,259
|
|
69,437
|
|
68,613
|
|
|||||||
|
Net interest income
|
88,485
|
|
92,152
|
|
90,410
|
|
95,475
|
|
99,821
|
|
94,522
|
|
101,290
|
|
99,115
|
|
|||||||
|
(Reduction in) provision for loan losses
|
—
|
|
(81
|
)
|
(70
|
)
|
(62
|
)
|
(90
|
)
|
(209
|
)
|
(50
|
)
|
207
|
|
|||||||
|
Net interest income after (reduction in) provision for loan losses
|
88,485
|
|
92,233
|
|
90,480
|
|
95,537
|
|
99,911
|
|
94,731
|
|
101,340
|
|
98,908
|
|
|||||||
|
Other income (loss)
|
|||||||||||||||||||||||
|
Gain (loss) on investments, net
|
(31,302
|
)
|
(2,958
|
)
|
10,876
|
|
2,172
|
|
(835
|
)
|
(48,364
|
)
|
(20,197
|
)
|
(17,772
|
)
|
|||||||
|
Equity in earnings of unconsolidated ventures
|
3,499
|
|
1,894
|
|
1,231
|
|
6,006
|
|
1,306
|
|
1,145
|
|
3,894
|
|
441
|
|
|||||||
|
Gain (loss) on derivative instruments, net
|
68,296
|
|
(220,602
|
)
|
56,003
|
|
(122,745
|
)
|
(164,637
|
)
|
(3,704
|
)
|
(167,816
|
)
|
(151,312
|
)
|
|||||||
|
Realized and unrealized credit derivative income (loss), net
|
(5,122
|
)
|
2,928
|
|
614
|
|
21,362
|
|
(23,795
|
)
|
(28,613
|
)
|
32,055
|
|
17,487
|
|
|||||||
|
Other investment income (loss), net
|
(574
|
)
|
739
|
|
1,673
|
|
(894
|
)
|
(687
|
)
|
(1,358
|
)
|
—
|
|
—
|
|
|||||||
|
Total other income (loss)
|
34,797
|
|
(217,999
|
)
|
70,397
|
|
(94,099
|
)
|
(188,648
|
)
|
(80,894
|
)
|
(152,064
|
)
|
(151,156
|
)
|
|||||||
|
Expenses
|
13,074
|
|
14,697
|
|
13,551
|
|
13,298
|
|
13,976
|
|
13,293
|
|
13,066
|
|
12,531
|
|
|||||||
|
Net income (loss)
|
110,208
|
|
(140,463
|
)
|
147,326
|
|
(11,860
|
)
|
(102,713
|
)
|
544
|
|
(63,790
|
)
|
(64,779
|
)
|
|||||||
|
Net income (loss) attributable to non-controlling interest
|
1,321
|
|
(1,629
|
)
|
1,685
|
|
(136
|
)
|
(1,176
|
)
|
6
|
|
(729
|
)
|
(733
|
)
|
|||||||
|
Net income (loss) attributable to Invesco Mortgage Capital Inc.
|
108,887
|
|
(138,834
|
)
|
145,641
|
|
(11,724
|
)
|
(101,537
|
)
|
538
|
|
(63,061
|
)
|
(64,046
|
)
|
|||||||
|
Dividends to preferred stockholders
|
5,716
|
|
5,716
|
|
5,716
|
|
5,716
|
|
9,240
|
|
2,713
|
|
2,712
|
|
2,713
|
|
|||||||
|
Undeclared cumulative dividends to preferred stockholders
|
—
|
|
—
|
|
—
|
|
—
|
|
(661
|
)
|
661
|
|
—
|
|
—
|
|
|||||||
|
Net income (loss) attributable to common stockholders
|
103,171
|
|
(144,550
|
)
|
139,925
|
|
(17,440
|
)
|
(110,116
|
)
|
(2,836
|
)
|
(65,773
|
)
|
(66,759
|
)
|
|||||||
|
Earnings (loss) per share:
|
|||||||||||||||||||||||
|
Net income (loss) attributable to common stockholders
|
|||||||||||||||||||||||
|
Basic
|
0.88
|
|
(1.18
|
)
|
1.14
|
|
(0.14
|
)
|
(0.89
|
)
|
(0.02
|
)
|
(0.53
|
)
|
(0.54
|
)
|
|||||||
|
Diluted
|
0.81
|
|
(1.18
|
)
|
1.04
|
|
(0.14
|
)
|
(0.89
|
)
|
(0.02
|
)
|
(0.53
|
)
|
(0.54
|
)
|
|||||||
|
118
|
||
On February 18, 2016, the Company's board of directors authorized an additional
15,000,000
shares of common stock for the existing share repurchase program with no stated expiration date.
|
119
|
||
INVESCO MORTGAGE CAPITAL INC. AND SUBSIDIARIES
Schedule IV
Mortgage Loans on Real Estate
As of
December 31, 2015
|
$ in thousands
|
|||||||||||||||||||||||
|
Asset Type
|
Description
|
Number of loans
|
Interest Rate
|
Maturity Date
|
Periodic Payment Terms
(1)
|
Prior Liens
|
Face Amount of Mortgages
|
Carrying Amount of Mortgages
|
Principal Amount of Loans Subject to Delinquent Principal or Interest
|
||||||||||||||
|
Mezzanine Loans
|
Various
|
6
|
|
LIBOR+6.75% to 10.5% or 7.5% Fixed
|
4/9/2016 to 12/1/2018
|
I
|
—
|
|
210,769
|
|
209,062
|
|
—
|
|
|||||||||
|
—
|
|
210,769
|
|
209,062
|
|
—
|
|
||||||||||||||||
|
(1) Interest ("I")
|
|||||||||||||||||||||||
|
Reconciliation of Carrying Value of Mortgage Loans on Real Estate:
|
|||||||||||||||||||||||
|
2015
|
2014
|
2013
|
|||||||||||||||||||||
|
Beginning balance
|
3,510,759
|
|
1,874,861
|
|
—
|
|
|||||||||||||||||
|
Additions:
|
|||||||||||||||||||||||
|
Principal amount of new loans
|
530,399
|
|
1,887,391
|
|
1,891,646
|
|
|||||||||||||||||
|
Premium (discount) on new loans
|
(131
|
)
|
12,730
|
|
29,768
|
|
|||||||||||||||||
|
Capitalized interests
|
—
|
|
768
|
|
832
|
|
|||||||||||||||||
|
Amortization of premium (discount)
|
(6,204
|
)
|
(6,368
|
)
|
(2,632
|
)
|
|||||||||||||||||
|
Deductions:
|
|||||||||||||||||||||||
|
Collection of principal
|
642,361
|
|
256,061
|
|
43,869
|
|
|||||||||||||||||
|
(Reduction in) provision for loan losses
|
(213
|
)
|
(142
|
)
|
884
|
|
|||||||||||||||||
|
Loss on foreign currency translation
|
1,951
|
|
2,704
|
|
—
|
|
|||||||||||||||||
|
Deconsolidation of VIEs
|
3,181,662
|
|
—
|
|
—
|
|
|||||||||||||||||
|
Ending balance
|
209,062
|
|
3,510,759
|
|
1,874,861
|
|
|||||||||||||||||
|
120
|
||
SIGNATURES
Pursuant to the requirements of Section 13 or 15(d) of the Securities Exchange Act of 1934, the registrant has duly caused this report to be signed on its behalf by the undersigned, thereunto duly authorized.
|
Invesco Mortgage Capital Inc.
|
||
|
By:
|
/s/ Richard J. King
|
|
|
Richard J. King
President and Chief Executive Officer
|
||
|
Date:
|
February 22, 2016
|
|
Pursuant to the requirements of the Securities Exchange Act of 1934, this report has been signed below by the following persons on behalf of the registrant and in the capacities and on the dates indicated.
|
|
Signatures
|
Title
|
Date
|
||
|
By:
|
/s/ Richard J. King
|
President and Chief Executive Officer
|
February 22, 2016
|
||
|
Richard J. King
|
(principal executive officer)
|
||||
|
By:
|
/s/ Richard Lee Phegley, Jr.
|
Chief Financial Officer
|
February 22, 2016
|
||
|
Richard Lee Phegley, Jr.
|
(principal financial and accounting officer)
|
||||
|
By:
|
/s/ G. Mark Armour
|
Director
|
February 22, 2016
|
||
|
G. Mark Armour
|
|||||
|
By:
|
/s/ Karen Dunn Kelley
|
Director
|
February 22, 2016
|
||
|
Karen Dunn Kelley
|
|||||
|
By:
|
/s/ James S. Balloun
|
Director
|
February 22, 2016
|
||
|
James S. Balloun
|
|||||
|
By:
|
/s/ John S. Day
|
Director
|
February 22, 2016
|
||
|
John S. Day
|
|||||
|
By:
|
/s/ Edward J. Hardin
|
Director
|
February 22, 2016
|
||
|
Edward J. Hardin
|
|||||
|
By:
|
/s/ James R. Lientz, Jr.
|
Director
|
February 22, 2016
|
||
|
James R. Lientz, Jr.
|
|||||
|
121
|
||
TABLE OF CONTENTS
Part IItem 1. BusinessItem 1A. Risk FactorsItem 1B. Unresolved Staff CommentsItem 2. PropertiesItem 3. Legal ProceedingsItem 4. Mine and Safety DisclosuresPart IIItem 5. Market For Registrant S Common Equity, Related Stockholder Matters and Issuer Purchases Of Equity SecuritiesItem 6. Selected Financial DataItem 7. Management S Discussion and Analysis Of Financial Condition and Results Of OperationsItem 7A. Quantitative and Qualitative Disclosures About Market RiskItem 8. Financial Statements and Supplementary DataItem 9. Changes in and Disagreements with Accountants on Accounting and Financial DisclosureItem 9A. Controls and ProceduresItem 9B. Other InformationPart IIIItem 10. Directors, Executive Officers and Corporate GovernanceItem 11. Executive CompensationItem 12. Security Ownership Of Certain Beneficial Owners and Management and Related Stockholder MattersItem 13. Certain Relationships and Related Transactions, and Director IndependenceItem 14. Principal Accounting Fees and ServicesPart IVItem 15. Exhibits, Financial Statement SchedulesNote 1 Organization and Business OperationsNote 2 Summary Of Significant Accounting PoliciesNote 3 Variable Interest EntitiesNote 4 Mortgage-backed and Credit Risk Transfer SecuritiesNote 5 Commercial Loans Held-for-investmentNote 6 Other InvestmentsNote 7 BorrowingsNote 8 Derivatives and Hedging ActivitiesNote 9 Offsetting Assets and LiabilitiesNote 10 Fair Value Of Financial InstrumentsNote 11 Related Party TransactionsNote 12 Stockholders EquityNote 13 Earnings Per Common ShareNote 14 Non-controlling Interest Operating PartnershipNote 15 Commitments and ContingenciesNote 16 Summarized Quarterly (unaudited)Note 17 Subsequent Events