INVENTRUST PROPERTIES CORP.
10-Ks and 10-Qs
|
|
|
|
|
|
|
|
|
|
|
|
|
|
|
|
|
|
|
|
|
|
|
|
|
|
|
|
|
|
|
|
|
|
|
|
|
|
|
|
|
|
|
|
|
|
|
|
|
|
UNITED STATES
SECURITIES AND EXCHANGE COMMISSION
WASHINGTON, D.C. 20549
FORM 10-K
|
x
|
ANNUAL REPORT PURSUANT TO SECTION 13 OR 15(d) OF THE SECURITIES EXCHANGE ACT OF 1934
|
|
FOR THE FISCAL YEAR ENDED DECEMBER 31, 2012
|
|
|
¨
|
TRANSITION REPORT PURSUANT TO SECTION 13 OR 15(d) OF THE SECURITIES EXCHANGE ACT OF 1934
|
|
FOR THE TRANSITION PERIOD FROM TO
|
|
COMMISSION FILE NUMBER: 000-51609
Inland American Real Estate Trust, Inc.
(Exact name of registrant as specified in its charter)
|
Maryland
|
|
34-2019608
|
|
(State or other jurisdiction of
incorporation or organization)
|
|
(I.R.S. Employer
Identification No.)
|
|
2901 Butterfield Road, Oak Brook, Illinois
|
|
60523
|
|
(Address of principal executive offices)
|
|
(Zip Code)
|
630-218-8000
(Registrant’s telephone number, including area code)
Securities registered pursuant to Section 12(b) of the Act:
None
Securities registered pursuant to Section 12(g) of the Act:
Common stock, $0.001 par value per share
(Title of Class)
Indicate by check mark if the registrant is a well-known seasoned issuer, as defined in Rule 405 of the Securities Act. Yes
¨
No
x
Indicate by check mark if the registrant is not required to file reports pursuant to Section 13 or Section 15(d) of the Act. Yes
¨
No
x
Indicate by check mark whether the registrant (1) has filed all reports required to be filed by Section 13 or 15(d) of the Securities Exchange Act of 1934 during the preceding 12 months (or for such shorter period that the registrant was required to file such reports), and (2) has been subject to the filing requirements for the past 90 days. Yes
x
No
¨
Indicate by check mark whether the Registrant has submitted electronically and posted on its corporate website, if any, every Interactive Data File required to be submitted and posted pursuant to Rule 405 of Regulation S-T (§232.405 of this chapter) during the preceding 12 months (or for such shorter period that the registrant was required to submit and post such files). Yes
x
No
¨
Indicate by check mark if disclosure of delinquent filers pursuant to Item 405 of Regulation S-K is not contained herein, and will not be contained, to the best of registrant’s knowledge, in definitive proxy or information statements incorporated by reference in Part III of this Form 10-K or any amendment to this Form 10-K.
x
Indicate by check mark whether the registrant is a large accelerated filer, an accelerated filer, a non-accelerated filer or a smaller reporting company. (See definitions of “large accelerated filer,” “accelerated filer” and “smaller reporting company” in Rule 12b-2 of the Exchange Act).
|
Large accelerated filer
|
¨
|
|
Accelerated filer
|
¨
|
|
Non-accelerated filer
|
x
|
|
Smaller reporting company
|
¨
|
Indicate by check mark whether the registrant is a shell company (as defined in Rule 12b-2 of the Exchange Act). Yes
¨
No
x
There is no established market for the registrant’s shares of common stock. The aggregate market value of the registrant’s common stock held by non-affiliates of the registrant as of June 30, 2012 (the last business day of the registrant’s most recently completed second quarter) was approximately $6,327,641,846, based on the estimated per share value of $7.22, as established by the registrant on December 29, 2011.
As of March 1, 2013, there were 892,531,979 shares of the registrant’s common stock outstanding.
INLAND AMERICAN REAL ESTATE TRUST, INC.
TABLE OF CONTENTS
|
|
|
Page
|
|
Item 1.
|
||
|
Item 1A.
|
||
|
Item 1B.
|
||
|
Item 2.
|
||
|
Item 3.
|
||
|
Item 4.
|
||
|
Item 5.
|
||
|
Item 6.
|
||
|
Item 7.
|
||
|
Item 7A.
|
||
|
Item 8.
|
||
|
Item 9.
|
||
|
Item 9A.
|
||
|
Item 9B.
|
||
|
Item 10.
|
||
|
Item 11.
|
||
|
Item 12.
|
||
|
Item 13.
|
||
|
Item 14.
|
||
|
Item 15.
|
||
This Annual Report on Form 10-K includes references to certain trademarks. Courtyard by Marriott
®
, Marriott
®
, Marriott Suites
®
, Residence Inn by Marriott
®
and SpringHill Suites by Marriott
®
trademarks are the property of Marriott International, Inc. (“Marriott”) or one of its affiliates. Doubletree
®
, Embassy Suites
®
, Hampton Inn
®
, Hilton Garden Inn
®
, Hilton Hotels
®
and Homewood Suites by Hilton
®
trademarks are the property of Hilton Hotels Corporation (“Hilton”) or one or more of its affiliates. Hyatt Place
®
trademark is the property of Hyatt Corporation (“Hyatt”). Intercontinental Hotels
®
trademark is the property of IHG. Wyndham
®
and Baymont Inn & Suites
®
trademarks are the property of Wyndham Worldwide. Comfort Inn
®
trademark is the property of Choice Hotels International. Fairmont Hotels and Resorts is a trademark. The Aloft service name is the property of Starwood. For convenience, the applicable trademark or service mark symbol has been omitted but will be deemed to be included wherever the above-referenced terms are used.
General
Inland American Real Estate Trust, Inc., a Maryland corporation, was incorporated in October 2004. We have elected to be taxed, and currently qualify, as a real estate investment trust (“REIT”) for federal tax purposes. We acquire, own, operate and develop a diversified portfolio of commercial real estate, including retail, multi-family, industrial, lodging, and office properties, located in the United States. In addition, we own assets through joint ventures in which we do not own a controlling interest, as well as properties in development. We also invest in marketable securities and other assets.
As of
December 31, 2012
, our portfolio was comprised of
794
properties representing 45.6 million square feet of retail, office and industrial space,
5,311
multi-family units,
5,212
student housing beds and
16,345
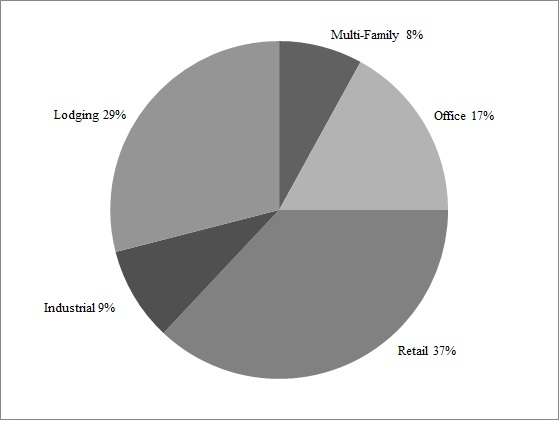
hotel rooms. We believe that a diversified portfolio balances our risk exposure compared to a portfolio with a single asset class. During the economic recession and ongoing sluggish recovery, we believe that a diversified portfolio like ours provides our stockholders with significant benefits and reduces their risk relative to a portfolio concentrated on one property sector or properties located in one geographical area or region. Because we believe that most real estate markets are cyclical in nature, we plan to maintain our diversified portfolio but focus on three specific real estate segments, lodging, student housing and multi-tenant retail. We believe our diversity and size will allow us to continue to effectively deploy capital into sectors and locations where the underlying investment fundamentals are relatively strong. The following chart depicts the allocation of our real estate assets for each segment, as of
December 31, 2012
, based on undepreciated assets within our property portfolio.
Strategy and Objectives
We have defined our long-term portfolio strategy by focusing our diversified assets in three specific real estate asset classes - retail, lodging and student housing. We believe this strategy presents the best opportunity to capitalize on current market trends in commercial real estate and realize income growth in these sectors. A key outcome of our strategy will be an opportunity to explore multiple liquidity events by segment.
Also part of our strategy is to improve the overall quality of our retail, lodging and student housing segments for long-term growth through selective asset acquisition and sales. We continue to use our expertise to capitalize on opportunities in the real estate industry. We believe our capacity to identify and react to investment opportunities is one of our biggest strengths. This strategy will take time as we dispose of less strategic assets and rotate capital into our targeted segments. Our focus has been, and will continue to be, maximizing stockholder value over the long-term.
During the execution of our strategy, we will focus on maintaining a stable income stream to provide a sustainable monthly distribution to our shareholders.
1
Our three objectives in the execution of our strategy are:
|
•
|
Sustaining a monthly stockholder distribution while maintaining capital preservation
|
|
•
|
Tailoring our portfolio to lodging, student housing and retail by expanding and enhancing these growth portfolios
|
|
•
|
Positioning for stockholder liquidity through multiple liquidity events by segment type
|
2012 Highlights
Distributions
We have paid a monthly cash distribution to our stockholders which totaled in the aggregate
$439.2 million
for the year ended
December 31, 2012
, which was equal to $0.50 per share for 2012, assuming that a share was outstanding the entire year. The distributions paid for the year ended
December 31, 2012
were funded from cash flow from operations, distributions from unconsolidated joint ventures and gains on sale of properties.
Investing Activities
Our acquisition and disposition activities in 2012 highlight our move to divesting of less strategic assets and redeploying the capital into our long-term strategic segments, lodging, student housing and multi-tenant retail. We acquired seven upper upscale lodging properties consisting of 2,624 rooms for $525.1 million. We acquired two student housing properties and placed two student housing properties into service for a total of 2,566 beds for $171.9 million. In addition, we acquired two multi-tenant retail properties and expanded two existing multi-tenant retail properties consisting of 554,026 square feet for $106.9 million. As part of our strategy to realign our asset segments with higher performing assets, we sold
166
properties for a gross disposition price of
$603.5 million
, including 143 bank branches (142 retail branches and one office branch), four retail properties, thirteen midscale lodging properties, two industrial properties, and four multi-family properties.
Financing Activities
We successfully refinanced our 2012 maturities of approximately $671.4 million and placed debt on new and existing properties. We were able to obtain favorable rates while still maintaining a manageable debt maturity schedule for future years. As of
December 31, 2012
, we had mortgage debt of approximately
$5.9
billion and have a weighted average interest rate of
5.1%
per annum. Our debt maturities for 2013 are
$882.9 million
.
Operating Results
We experienced organic growth in our lodging and multi-family segments as our same store net operating income results increased
6.7%
and
9.2%
, respectively, from the year ended
December 31, 2011
to 2012. These increases are due to high occupancy and RevPAR and rental rate increases, in the lodging and multi-family segments, respectively. Our retail and industrial segments improved slightly due to maintaining occupancy rates and contractual rental rates. Our office segment remained unchanged as compared to the prior year with a stable occupancy rate.
The following table represents our same store net operating income for the years ended
December 31, 2012 and 2011
. Net operating income is calculated in Item 7 of this Annual Report on Form 10-K.
|
2012 Net
operating
income
|
2011 Net
operating
income
|
Increase
(decrease)
|
Increase
(decrease)
|
Economic
Occupancy
as of
December 31,
2012
|
Economic
Occupancy
as of
December 31,
2011
|
|||||||||||||||
|
Retail
|
$
|
254,082
|
|
$
|
250,385
|
|
$
|
3,697
|
|
1.5
|
%
|
93
|
%
|
94
|
%
|
|||||
|
Lodging
|
169,532
|
|
158,817
|
|
10,715
|
|
6.7
|
%
|
73
|
%
|
72
|
%
|
||||||||
|
Office
|
132,229
|
|
132,050
|
|
179
|
|
0.1
|
%
|
93
|
%
|
93
|
%
|
||||||||
|
Industrial
|
77,094
|
|
75,988
|
|
1,106
|
|
1.5
|
%
|
97
|
%
|
98
|
%
|
||||||||
|
Multi-family
|
46,949
|
|
42,984
|
|
3,965
|
|
9.2
|
%
|
93
|
%
|
93
|
%
|
||||||||
|
$
|
679,886
|
|
$
|
660,224
|
|
$
|
19,662
|
|
3.0
|
%
|
||||||||||
In 2013, we expect similar increases in operating results compared to 2012 in our lodging and multi-family portfolios due to the growth projected in these segments. As occupancy rates increase close to peak levels in lodging and multi-family, the ability to increase rooms rates and rental rates, respectively, will help grow our revenue for each segment in 2013. We believe that our
2
stable occupancy in our retail, office, and industrial portfolios will result in consistent operating performances in these segments.
Effective July 1, 2012, the Company entered into new master management agreements with its property managers, and the subsidiaries of the Company that directly own its properties entered into new property management agreements with the property managers. Each agreement has an initial term ending December 31, 2013, which term will automatically be renewed until June 30, 2015 unless either party to the agreement provides written notice of cancellation before June 30, 2013. Under the agreements, the Company will pay the property managers monthly management fees by property type, as follows: (i) for any bank branch facility (office or retail), 2.50% of the gross income generated by the property; (ii) for any multi-tenant industrial property, 4.00% of the gross income generated by the property; (iii) for any multi-family property, 3.75% of the gross income generated by the property; (iv) for any multi-tenant office property, 3.75% of the gross income generated by the property; (v) for any multi-tenant retail property, 4.50% of the gross income generated by the property; (vi) for any single-tenant industrial property, 2.25% of the gross income generated by the property; (vii) for any single-tenant office property, 2.90% of the gross income generated by the property; and (viii) for any single-tenant retail property, 2.90% of the gross income generated by the property.
Segment Data
We have five business segments: Retail, Lodging, Office, Industrial, and Multi-family. We evaluate segment performance primarily based on net operating income. Net operating income of the segments does not include interest expense, depreciation and amortization, general and administrative expenses, or interest and other investment income from corporate investments. The non-segmented assets include our cash and cash equivalents, investment in marketable securities, construction in progress, and investment in unconsolidated entities. Information related to our business segments, including a measure of profits or loss and revenues from external customers for each of the last three fiscal years and total assets for each of the last two fiscal years, is set forth in Note 14 to our consolidated financial statements in Item 8 of this Annual Report on Form 10-K.
Significant Tenants
For the year ended
December 31, 2012
, we generated more than 18% of our rental revenue (excluding lodging, multi-family, and development properties) from two tenants, SunTrust Banks, Inc. and AT&T, Inc. SunTrust Banks, Inc. leases multiple properties that we own and that are located throughout the United States. These properties collectively generated approximately 10% of our rental revenue for the year ended
December 31, 2012
. For the year ended
December 31, 2012
, approximately 8% of our rental revenue was generated by three properties leased to AT&T, Inc.
Tax Status
We have elected to be taxed as a REIT, under Sections 856 through 860 of the Internal Revenue Code of 1986 as amended (the “Code”) beginning with the tax year ended December 31, 2005. Because we qualify for taxation as a REIT, we generally will not be subject to federal income tax on taxable income that is distributed to stockholders. If we fail to qualify as a REIT in any taxable year, without the benefit of certain relief provisions, we will be subject to federal and state income tax on our taxable income at regular corporate rates. Even if we qualify for taxation as a REIT, we may be subject to certain state and local taxes on our income, property or net worth, respectively, and to Federal income and excise taxes on our undistributed income.
Competition
The commercial real estate market is highly competitive. We compete for tenants in all of our markets with other owners and operators of commercial properties. We compete based on a number of factors that include location, rental rates, security, suitability of the property’s design to tenants’ needs and the manner in which the property is operated and marketed. The number of competing properties in a particular market could have a material effect on a property’s occupancy levels, rental rates and operating income.
We compete with many third parties engaged in real estate investment activities including other REITs, including other REITs sponsored by our sponsor, specialty finance companies, savings and loan associations, banks, mortgage bankers, insurance companies, mutual funds, institutional investors, investment banking firms, lenders, hedge funds, governmental bodies and other entities. There are also other REITs with investment objectives similar to ours and others may be organized in the future. In addition, these same entities seek financing through the same channels that we do. Therefore, we compete for funding in a market where funds for real estate investment may decrease, or grow less than the underlying demand.
3
Employees
As of
December 31, 2012
, we have 88 full-time individuals employed primarily by our multi-family subsidiaries.
We do not employ our executive officers and they do not receive any compensation from us for their services as such officers. Our executive officers are officers of one or more of The Inland Group, Inc.’s affiliated entities, including our business manager, and are compensated by these entities, in part, for their services rendered to us. We do not reimburse the business manager for any compensation paid to persons serving as one of our executive officers or as an executive officer of the business manger or property managers. For the purposes of reimbursement, our secretary is not considered an “executive officer.”
We have entered into a business management agreement with Inland American Business Manager & Advisor, Inc. pursuant to which it serves as our business manager, with responsibility for overseeing and managing our day-to-day operations. We have also entered into property management agreements with each of our property managers. We pay fees to our business manager and our property managers in consideration for the services they perform for us pursuant to these agreements. Except as noted above, we also reimburse these entities for the expenses they incur in performing services for us including the compensation expenses for persons providing services to us.
Conflicts of Interest
Our governing documents require a majority of our directors to be independent. Further, any transactions between The Inland Group, Inc. or its affiliates, including our business manager and property managers, and us must be approved by a majority of our independent directors.
Environmental Matters
Compliance with federal, state and local environmental laws has not had a material adverse effect on our business, assets, or results of operations, financial condition and ability to pay distributions, and we do not believe that our existing portfolio will require us to incur material expenditures to comply with these laws and regulations. However, we cannot predict the impact of unforeseen environmental contingencies or new or changed laws or regulations on our properties.
Seasonality
The lodging segment is seasonal in nature, reflecting higher revenue and operating income during the second and third quarters. This seasonality can be expected to cause fluctuations in our net operating income for the lodging segment. None of our other segments are seasonal in nature.
Access to Company Information
We electronically file our Annual Report on Form 10-K, Quarterly Reports on Form 10-Q, Current Reports on Form 8-K and all amendments to those reports with the Securities and Exchange Commission (“SEC”). The public may read and copy any of the reports that are filed with the SEC at the SEC’s Public Reference Room at 100 F Street, NE, Washington, DC 20549. The public may obtain information on the operation of the Public Reference Room by calling the SEC at (800)-SEC-0330. The SEC maintains an Internet site at www.sec.gov that contains reports, proxy and information statements and other information regarding issuers that file electronically.
We make available, free of charge, by responding to requests addressed to our customer relations group, the Annual Report on Form 10-K, Quarterly Reports on Form 10-Q, Current Reports on Form 8-K and all amendments to those reports on our website, www.inland-american.com. These reports are available as soon as reasonably practicable after such material is electronically filed or furnished to the SEC.
Certifications
We have filed with the Securities and Exchange Commission the principal executive officer and principal financial officer certifications required pursuant to Section 302 of the Sarbanes-Oxley Act of 2002, which are attached as Exhibits 31.1 and 31.2 to this Annual Report on Form 10-K.
4
The occurrence of any of the risks discussed below could have a material adverse effect on our business, financial condition, results of operations and ability to pay distributions to our stockholders.
Risks Related to Our Business
Disruptions in the financial markets or economic conditions could adversely affect our ability to refinance or secure additional debt financing at attractive terms
Credit markets are subject to rapid changes from macro economic factors, including rising interest rates, perceptions of the overall health in the US economy and real estate in particular, and the health and regulatory environment in which our lenders operate and the overall availability of lending sources.
In addition, disruptions in the financial markets or economic conditions may negatively impact commercial real estate fundamentals which could have various negative impacts on the value of our investments including:
|
•
|
a decrease in the values of our investments in commercial properties, below the amounts paid for these investments; or
|
|
•
|
a decrease in revenues from our properties, due to lower occupancy and rental rates, which may make it more difficult for us to pay distributions or meet our debt service obligations on debt financing.
|
Our ongoing strategy depends, in part, upon future acquisitions, and we may not be successful in identifying and consummating these transactions
.
Our long-term business strategic plan is to refine our diversified portfolio of assets and to focus on the retail, lodging, and student housing sectors. As we continue to execute on this strategy, we will rotate capital out of our other asset classes - such as multi-family, office and industrial - to enhance and expand our strategic holdings. There is no assurance we will be able to sell assets at acceptable prices or identify suitable replacement assets on satisfactory terms, if at all. We may also face delays in reinvesting net sales proceeds in new assets which would impact the return we earn on our assets.
We face significant competition for attractive investment opportunities from an indeterminate number of other real estate investors, including investors with significant capital resources such as domestic and foreign corporations and financial institutions, publicly traded and privately held REITs, private institutional investment funds, investment banking firms, life insurance companies and pension funds. As a result of competition, we may be unable to acquire additional properties as we desire or the purchase price may be significantly elevated.
In light of current market conditions and real estate values, we may face significant competition to acquire stabilized properties, or have to accept lease-up risk associated with properties that have lower occupancy. As market conditions and real estate values recover, more properties may become available for acquisition, but we can provide no assurances that these properties will meet our investment objectives or that we will be successful in acquiring these properties. If we are unable to acquire sufficient debt financing at suitable rates or at all, we may be unable to acquire as many additional properties as we anticipate.
Our ongoing strategy involves the disposition of properties; however, we may be unable to sell a property at acceptable terms and conditions, if at all.
As we execute on our long-term strategy we will rotate capital out of certain asset classes, such as multi-family, office and industrial to reinvest into retail, lodging or student housing. Besides executing on our strategy, it may make economic sense to sell properties in any asset class when we believe the value of the leases in place at a property will significantly decline over the remaining lease term, or when the property has limited or no equity with a near-term debt maturity, or when a property has equity but the projected returns do not justify further investment, or when the equity in a property can be redeployed in the portfolio in order to achieve better returns or strategic goals. As we engage to sell these properties, general economic conditions along with property specific issues, such as vacancies, lease terminations and debt defeasance, may negatively affect the value of our properties and therefore reducing our return on the investment or prevent us from selling the property on acceptable terms. Real estate investments often cannot be sold quickly. As a result economic conditions may prevent potential purchasers from obtaining financing on acceptable terms, if at all, thereby delaying our ability to sell our properties.
5
We are the subject of an ongoing investigation by the SEC and have received two related derivative demands by stockholders to conduct investigations. The SEC's investigation, the derivative demands, or both could have a material adverse impact on our business.
We have learned that the SEC is conducting a non-public, formal, fact-finding investigation (the “Investigation”) to determine whether there have been violations of certain provisions of the federal securities laws related to the business management fees, property management fees, transactions with affiliates, timing and amount of distributions paid to investors, determination of property impairments, and any decision regarding whether the Company might become a self-administered REIT.
Our business manager offered to the extent allowed by law or governmental regulation to reduce its business management fee in an aggregate amount necessary to reimburse us for any costs, fees, fines, or assessments, if any, that we may incur as a result of the pending Investigation, other than legal fees incurred by us or fees and costs otherwise covered by insurance. The business manager also offered to waive its reimbursement of legal fees or costs that the business manager incurs in connection with the Investigation. In the event that the business management agreement is terminated or expires in accordance with its terms prior to the conclusion of the pending Investigation or prior to us realizing the full benefit of the business manager's offer to reduce its business management fee in the event that we realize costs, fees, fines or assessments in connection with the Investigation, then we will be required to pay any such costs, fees, fines or assessments. In the event of a termination of the business management agreement, we may not be able to execute our business plan and may suffer losses, which could materially decrease cash available for distribution to our stockholders and have a material adverse impact on our business and financial condition.
We have also received two related demands (“Derivative Demands”) by stockholders to conduct investigations regarding claims that the officers, the board of directors, the business manager, and the affiliates of the business manager (the “Inland American Parties”) breached their fiduciary duties to us in connection with the matters that we disclosed are subject to the Investigation. The first demand claims that the Inland American Parties (i) falsely reported the value of our common stock until September 2010; (ii) caused us to purchase shares of our common stock from stockholders at prices in excess of their value; and (iii) disguised returns of capital paid to stockholders as REIT income resulting in the payment of fees to the business manager for which it was not entitled. The three stockholders in that demand contend that legal proceedings should seek recovery of damages in an unspecified amount allegedly sustained by us. The second demand by another shareholder makes similar claims and further alleges that the Inland American Parties (i) caused us to engage in transactions that unduly favored related parties, (ii) falsely disclosed the timing and amount of distributions, and (iii) falsely disclosed whether we might become a self-administered REIT. A special litigation committee has been formed by the board to investigate the matters related to the Investigation and the Derivative Demands. That investigation is ongoing.
We cannot reasonably estimate the timing or outcome of either the Investigation or the investigation by the special litigation committee, nor can we predict whether or not any of these items may have a material adverse effect on our business. These items may cause us to incur significant legal expense, both directly and as the result of any indemnification obligations. In addition, the Investigation and the Derivative Demands may also divert management's attention from our ordinary business operations or may also limit our ability to obtain financing to fund our on-going operating requirements, which could cause our business to suffer. Adverse findings by the SEC or the special litigation committee, future litigation related thereto, or the incurrence of costs, fees, fines or penalties that are not reimbursed by our business manager by reducing its business management fee or reimbursed by insurance policies, could have a material adverse impact on our business.
We depend on our business manager and our property managers and may not find a suitable replacement if our business management agreement or the property management agreements are terminated.
Most of our officers and our staff are employees of the business manager. We rely on our business manager and our property managers, to design and implement our operating policies and strategies. The agreement with the business manager is terminable upon 60 days' notice by either party or whose term expires July 31, 2013
.
The agreement with the property manager has a term until December 31, 2013 and will extend for an additional eighteen months unless terminated on or before June 30, 2013.
If we, or they, terminate the agreements
,
or permit them to expire in accordance with their terms, we may not be able to execute our business plan and may suffer losses.
If we lose or are unable to obtain key personnel, our ability to implement our investment strategies could be delayed or hindered.
Our success depends to a significant degree upon the contributions of our executive officers and other key personnel of our business manager and property managers. If any of the key personnel of our business manager or property managers were to cease their
6
affiliation with our business manager or property managers, respectively, our operating results could suffer. Further, we do not separately maintain “key person” life insurance that would provide us with proceeds in the event of death or disability of these persons. We believe our future success depends, in part, upon the ability of our business manager and property managers to hire and retain highly skilled managerial, operational and marketing personnel. Competition for such personnel is intense, and we cannot assure you that our business manager or property managers will be successful in attracting and retaining skilled personnel.
We may internalize or partially internalize our management functions and your interests could be diluted.
We may internalize some or all of the functions performed for us by our business manager and/or property managers and the method by which we could internalize these functions could take many forms. For example, we could acquire the business manager and/or property managers through a merger or by purchasing their stock or assets and the consideration we would pay may be cash, shares of our common stock or promissory notes. Issuing shares of common stock would reduce the percentage ownership of our existing stockholders and issuing notes or incurring debt could reduce our cash flow from operating activities or our ability to borrow additional funds.
Internalization transactions involving the acquisition of advisors affiliated with entity sponsors have also, in some cases, been the subject of litigation. Even if these claims are without merit, we could be forced to spend significant amounts of money defending claims.
If we internalize some or all of our management functions, the nature of our costs will change.
If we internalize our management functions, we will likely become directly responsible for the expenses currently paid by the business manager or property manager. Although we currently reimburse our business manager and property managers for most of the general and administrative expenses they incur on our behalf, we cannot be certain that once we internalize these functions our costs will not be higher than the amounts would be if we did not internalize. Further, although we would no longer be required to pay fees for the functions that are internalized, we would expect to incur additional compensation and benefits costs of our officers that are now paid by our business manager and its affiliates and which we do not reimburse. We may also issue equity awards to officers, employees and consultants. Although we would expect that the total compensation and benefits paid to our executive officers will be less than the fees we no longer would have to pay, there is no assurance of this outcome.
If we internalize some or all of our management functions, we could have difficulty integrating these functions as a stand-alone entity, and we may fail to properly identify the appropriate mix of personnel and capital needs to operate as a stand-alone entity. An inability to manage an internalization transaction effectively could, therefore, result in our incurring additional costs and/or experiencing other difficulties. Such difficulties could cause us to incur additional costs, and our management's attention could be diverted from most effectively managing our business and properties.
There is no assurance that we will reach an agreement with our business manager or property managers on the terms of an internalization transaction.
Our business manager and property managers are not obligated to enter into an internalization transaction with us or to do so at any particular price. Our independent directors, as a whole, or a committee thereof, would have to negotiate the specific terms and conditions of any agreement or agreements to acquire these entities, including the actual purchase price. There is no assurance that we will be able to enter into an agreement with the business manager and/or property managers on mutually acceptable terms and in that case, we would have to seek alternative courses of actions to internalize our management functions.
If we seek to internalize our management functions, other than by acquiring our business manager and/or property managers, we could incur greater costs and lose key personnel.
We may decide to pursue an internalization by hiring our own group of executives and other employees or entering into an agreement with a third party, such as a merger, instead of by acquiring our business manager and property managers. The costs that we would incur in this case are uncertain and may be substantial. In addition, certain key personnel of the business manager and/or property managers have employment agreements with those entities, which could restrict our ability to retain such personnel if we do not acquire the business manager and property managers. Further, we would lose the benefit of the experience of the business manager and property managers.
7
The failure of any bank in which we deposit our funds could reduce the amount of cash we have available to pay distributions and make additional investments.
We have deposited our cash and cash equivalents in several banking institutions in an attempt to minimize exposure to the failure or takeover of any one of these entities. However, the Federal Insurance Deposit Corporation, or “FDIC,” generally only insures limited amounts per depositor per insured bank. At December 31, 2012 we had cash and cash equivalents and restricted cash deposited in interest bearing transaction accounts at certain financial institutions exceeding these federally insured levels. If any of the banking institutions in which we have deposited funds ultimately fails, we may lose our deposits over the federally insured levels. The loss of our deposits could reduce the amount of cash we have available to distribute or invest.
Risks Related to our Real Estate Assets
There are inherent risks with real estate investments.
Investments in real estate assets are subject to varying degrees of risk. For example, an investment in real estate cannot generally be quickly converted to cash, limiting our ability to promptly vary our portfolio in response to changing economic, financial and investment conditions. Investments in real estate assets also are subject to adverse changes in general economic conditions which, for example, reduce the demand for rental space.
Among the factors that could impact our real estate assets and the value of an investment in us are:
|
•
|
local conditions such as an oversupply of space or reduced demand for real estate assets of the type that we own or seek to acquire, including, with respect to our lodging facilities, quick changes in supply of and demand for rooms that are rented or leased on a day-to-day basis;
|
|
•
|
inability to collect rent from tenants;
|
|
•
|
vacancies or inability to rent space on favorable terms;
|
|
•
|
inflation and other increases in operating costs, including insurance premiums, utilities and real estate taxes;
|
|
•
|
increases in energy costs or airline fares or terrorist incidents which impact the propensity of people to travel and therefore impact revenues from our lodging facilities, although operating costs cannot be adjusted as quickly;
|
|
•
|
adverse changes in the federal, state or local laws and regulations applicable to us, including those affecting rents, zoning, prices of goods, fuel and energy consumption, water and environmental restrictions;
|
|
•
|
the relative illiquidity of real estate investments;
|
|
•
|
changing market demographics;
|
|
•
|
an inability to acquire and finance, or refinance, properties on favorable terms, if at all;
|
|
•
|
acts of God, such as earthquakes, floods or other uninsured losses;
|
|
•
|
changes or increases in interest rates and availability of financing locally or world-wide.
|
In addition, periods of economic slowdown or recession, or declining demand for real estate, or the public perception that any of these events may occur, could result in a general decline in rents or increased defaults under existing leases. We have experienced these impacts in the last few years. There is no assurance that conditions will improve or that these impacts will not occur in the future.
We depend on tenants for our revenue, and accordingly, lease terminations, tenant default, and bankruptcies could adversely affect the income produced by our properties.
The success of our investments depends on the financial stability of our tenants. Certain economic conditions may adversely affect one or more of our tenants. For example, business failures and downsizings can affect the tenants of our office and industrial properties. Reduced consumer demand for retail products and services may affect the tenants of our retail properties. In addition, our retail shopping center properties typically are anchored by large, nationally recognized tenants, any of which may experience a downturn in their business that may weaken significantly their financial condition. Further, mergers or consolidations among large retail establishments could result in the closure of existing stores or duplicate or geographically overlapping store locations, which could include tenants at our retail properties.
As a result of these factors, our tenants may delay lease commencements, decline to extend or renew their leases upon expiration, fail to make rental payments when due, or declare bankruptcy. Any of these actions could result in the termination of the tenants' leases, the expiration of existing leases without renewal, or the loss of rental income attributable to the terminated or expired leases. In the event of a tenant default or bankruptcy, we may experience delays in enforcing our rights as a landlord and may incur substantial costs in protecting our investment and re-leasing our property. Specifically, a bankruptcy filing by, or relating to, one of our tenants or a lease guarantor would bar efforts by us to collect pre-bankruptcy debts from that tenant or lease guarantor,
8
or its property, unless we receive an order permitting us to do so from the bankruptcy court. In addition, we cannot evict a tenant solely because of bankruptcy. The bankruptcy of a tenant or lease guarantor could delay our efforts to collect past due balances under the relevant leases, and could ultimately preclude collection of these sums. If a lease is assumed by the tenant in bankruptcy, all pre-bankruptcy balances due under the lease must be paid to us in full. If, however, a lease is rejected by a tenant in bankruptcy, we would have only a general, unsecured claim for damages. An unsecured claim would only be paid to the extent that funds are available and only in the same percentage as is paid to all other holders of general, unsecured claims. Restrictions under the bankruptcy laws further limit the amount of any other claims that we can make if a lease is rejected. As a result, it is likely that we would recover substantially less than the full value of the remaining rent during the term.
Geographic concentration also exposes us to risks of oversupply and competition in these markets. Significant increases in the supply of certain property types, including hotels, without corresponding increases in demand could have a material adverse effect on our financial condition, results of operations and our ability to pay distributions.
As of December 31, 2012, approximately, 4%, 5%, 7% and 12% of our base rental income of our consolidated portfolio, excluding our lodging facilities, was generated by a certain property located in the Minneapolis, Dallas, Chicago and Houston metropolitan areas, respectively. Additionally, at December 31, 2012, forty-four of our lodging facilities, or approximately 50% of our lodging portfolio, were located in Washington D.C. and the ten eastern seaboard states ranging from Connecticut to Florida, including seven hotels in North Carolina and seventeen properties in Texas.
Two of our tenants generated a significant portion of our revenue, and rental payment defaults by these significant tenants could adversely affect our results of operations.
For the year ended December 31, 2012, approximately 10% of our rental revenue was generated by over 400 retail banking properties leased to SunTrust Banks, Inc.. Also, for the year ended December 31, 2012, approximately 8% of our rental revenue was generated by three properties leased to AT&T, Inc. The leases for two of the AT&T properties, with approximately 1.7 million and 1.5 million square feet, expire in 2016 and 2017, respectively. As a result of the concentration of revenue generated from these properties, if either SunTrust or AT&T were to cease paying rent or fulfilling its other monetary obligations, we could have significantly reduced rental revenues or higher expenses until the defaults were cured or the properties were leased to a new tenant or tenants.
Leases representing approximately 5.8% of the rentable square feet of our retail, office, and industrial portfolio are scheduled to expire in 2013. We may be unable to renew leases or lease vacant space at favorable rates or at all.
As of December 31, 2012, leases representing approximately 5.8% of the 45,552,250 rentable square feet of our retail, office, and industrial portfolio were scheduled to expire in 2013 and an additional 5.9% of the square footage of our retail, office, and industrial portfolio was available for lease. We may be unable to extend or renew any of these leases, or we may be able to lease these spaces only at rental rates equal to or below existing rental rates. In addition, some of our tenants have leases that include early termination provisions that permit the lessee to terminate all or a portion of its lease with us after a specified date or upon the occurrence of certain events with little or no liability to us. We may be required to offer substantial rent abatements, tenant improvements, early termination rights or below-market renewal options to retain these tenants or attract new ones. Portions of our properties may remain vacant for extended periods of time. Further, some of our leases currently provide tenants with options to renew the terms of their leases at rates that are less than the current market rate or to terminate their leases prior to the expiration date thereof. If we are unable to obtain new rental rates that are on average comparable to our asking rents across our portfolio, then our ability to generate cash flow growth will be negatively impacted.
We may be required to make significant capital expenditures to improve our properties in order to retain and attract tenants.
We expect that, upon the expiration of leases at our properties, we may be required to provide rent or other concessions to tenants, accommodate requests for renovations, build-to-suit remodeling and other improvements or provide additional services to our tenants. As a result, we may have to pay for significant leasing costs or tenant improvements in order to retain tenants whose leases are expiring and to attract new tenants in sufficient numbers. Additionally, we may need to raise capital to fund these expenditures. If we are unable to do so, or if capital is otherwise unavailable, we may be unable to fund the required expenditures. This could result in non-renewals by tenants upon expiration of their leases or the ability to attract new tenants, which would result in declines in revenues from operations.
9
We face significant competition in the leasing market, which may decrease or prevent increases in the occupancy and rental rates of our properties.
We own properties located throughout the United States. We compete with numerous developers, owners and operators of commercial properties, many of which own properties similar to, and in the same market areas as, our properties. If our competitors offer space at rental rates below current market rates, or below the rental rates we currently charge our tenants, we may lose existing or potential tenants and we may be pressured to reduce our rental rates below those we currently charge in order to attract new tenants and retain existing tenants when their leases expire. Also, if our competitors develop additional properties in locations near our properties, there may be increased competition for creditworthy tenants, which may require us to make capital improvements to properties that we would not have otherwise made.
Acts of God, such as earthquakes, floods or other uninsured losses may make us susceptible to adverse economic developments from the effects of these natural disasters in those areas.
Because our properties are concentrated in certain geographic areas, our operating results are likely to be impacted by economic changes affecting the real estate markets in those areas. Adverse events such as hurricanes, floods, wildfires, earthquakes, blizzards or other natural disasters, could cause a loss of revenues at our real estate properties. Elements such as water, wind, hail, or fire damage can increase or accelerate wear on our properties' weatherproofing, and mechanical, electrical and other systems, and cause mold issues. As a result, we may incur additional operating costs and expenditures for capital improvements at these properties.
To qualify as a REIT, we must rely on third parties to operate our hotels.
To continue qualifying as a REIT, we may not, among other things, operate any hotel, or directly participate in the decisions affecting the daily operations of any hotel. Thus, we have retained third party managers to operate our hotel properties. We do not have the authority to directly control any particular aspect of the daily operations of any hotel, such as setting room rates. Thus, even if we believe our hotels are being operated in an inefficient or sub-optimal manner, we may not be able to require an immediate change to the method of operation. Our only alternative for changing the operation of our hotels may be to replace the third party manager of one or more hotels in situations where the applicable management agreement permits us to terminate the existing manager. Certain of these agreements may not be terminated without cause, which generally requires fraud, misrepresentation and other illegal acts. Even if we terminate or replace any manager, there is no assurance that we will be able to find another manager or that we will be able to enter into new management agreements favorable to us. Any change of hotel management would disrupt operations, which could have an adverse material effect on our operating results and financial condition.
Conditions of franchise agreements could adversely affect us.
Our lodging properties are operated pursuant to agreements with nationally recognized franchisors including Marriott International, Inc., Hilton Hotels Corporation, Intercontinental Hotels Group PLC, Hyatt Corporation, and Wyndham Worldwide Corporation. These agreements generally contain specific standards for, and restrictions and limitations on, the operation and maintenance of a hotel in order to maintain uniformity within the particular franchisor's system. These standards are subject to change, in some cases at the discretion of the franchisor, and may restrict our ability to make improvements or modifications to a hotel without the consent of the franchisor. Conversely, these standards may require us to make certain improvements or modifications to a hotel, even if we do not believe the capital improvements are necessary or desirable or will result in an acceptable return on our investment.
These agreements also permit the franchisor to terminate the agreement in certain cases such as a failure to pay royalties and fees or to perform covenants continued in the franchise agreement, bankruptcy, abandonment of the franchise, commission of a felony, assignment of the franchise without the consent of the franchisor or failure to comply with applicable law or maintain applicable standards in the operation and condition of the relevant hotel. If a franchise license terminates due to our failure to comply with the terms and conditions of the agreement, we may be liable to the franchisor for a termination payment. These payments vary. Also, these franchise agreements do not renew automatically. If we were to lose a franchise agreement, there is no assurance that we would be able to enter into an agreement with a different franchisor. Loss of a franchise agreement could have a material adverse effect on our results of operations and financial condition.
Actions of our joint venture partners could negatively impact our performance.
As of December 31, 2012 we had entered into joint venture agreements with nine entities to fund investment is in office, industrial/distribution, retail, lodging, and mixed use properties. The carrying value of our investment in these joint ventures, which we do
10
not consolidate for financial reporting purposes, was $253.4 million. For the year ended December 31, 2012, we recorded income of $1.6 million and impairments and losses of $12.3 million associated with these ventures.
With respect to these investments, we are not in a position to exercise sole decision-making authority regarding the property, or the joint venture. Consequently, our joint venture investments may involve risks not otherwise present with other methods of investing in real estate. For example, our venture partner may have economic or business interests or goals which are or which become inconsistent with our business interests or goals or may take action contrary to our instructions or requests or contrary to our policies or objectives. We have experienced these events from time to time with our current or former venture partners, which in some cases has resulted in litigation. An adverse outcome in any lawsuit could have a material effect on our results of operations and forward condition. In addition, any litigation increases our expenses and prevents our officers and directors from focusing their time and effort on other aspects of our business. Our relationships with our venture partners are contractual in nature. These agreements may restrict our ability to sell our interest when we desire or on advantageous terms and, on the other hand, may be terminated or dissolved under the terms of the agreements and, in each event, we may not continue to own or operate the interests or assets underlying the relationship or may need to purchase these interests or assets at an above-market price to continue ownership.
Credit market disruptions and certain economic trends may increase the likelihood of a commercial developer defaulting on its obligations with respect to our development projects, including projects where we have notes receivable, or becoming bankrupt or insolvent.
We have invested in, and may continue to invest in, projects that are in various stages of pre-development and development. Investing in properties in pre-development or under development, and in lodging facilities in particular, which typically must be renovated or otherwise improved on a regular basis, including renovations and improvements required by existing franchise agreements, subjects us to uncertainties such as the ability to achieve desired zoning for development, environmental concerns of governmental entities or community groups, ability to control construction costs or to build in conformity with plans, specifications and timetables. In many cases, developers may not have adequate capital to address downturns in the market. Further, the developers of the projects in which we have invested are exposed to risks not only with respect to our projects, but also other projects in which they are involved. A default by a developer in respect to one of our development project investments, or the bankruptcy, insolvency or other failure of a developer for one of these projects, may require that we determine whether we want to assume the senior loan, fund monies beyond what we are contractually obligated to fund, take over development of the project, find another developer for the project, or sell our interest in the project. Developer failures could give tenants the right to terminate pre-construction leases, delay efforts to complete or sell the development project and could ultimately preclude us from realizing our anticipated returns. These events could cause a decrease in the value of our development assets and compel us to seek additional sources of funding, which may or may not be available, in order to hold and complete the development project.
Generally, under bankruptcy law and the bankruptcy guarantees we have required of certain of our joint venture development partners, we may seek recourse from the developer-guarantor to complete our development project with a substitute developer partner. However, in the event of a bankruptcy by the developer-guarantor, we cannot provide assurance that the developer or its trustee will satisfy its obligations. The bankruptcy of any developer or the failure of the developer to satisfy its obligations would likely cause us to have to complete the development or find a replacement developer, which could result in delays and increased costs. We cannot provide assurance that we would be able to complete the development on terms as favorable as when we first entered into the project. If we are not able to, or elect not to, the development costs ordinarily would be charged against income for the then-current period if we determine our costs are not recoverable.
Sale leaseback transactions may be recharacterized in a manner unfavorable to us.
From time to time we have entered into a sale leaseback transaction where we purchase a property and then lease the property to the seller. These transactions could, however, be characterized as a financing instead of a sale in the case of the seller's bankruptcy. In this case, we would not be treated as the owner of the property but rather as a creditor with no interest in the property itself. The seller may have the ability in a bankruptcy proceeding to restructure the financing by imposing new terms and conditions. The transaction also may be recharacterized as a joint venture. In this case, we would be treated as a joint venturer with liability, under some circumstances, for debts incurred by the seller relating to the property.
Our investments in equity and debt securities have materially impacted, and may in the future materially impact, our results.
As of December 31, 2012, we owned investment in real estate related equity and debt securities with an aggregate market value of $327.7 million. For the year ended December 31, 2012, we realized gains on sale of securities of $4.3 million, impairments of $1.9 million, and gross unrealized losses of
$2.0 million
. Real estate related equity securities are always unsecured and subordinated to other obligations of the issuer. Investments in real estate-related equity securities are subject to numerous risks including: (1)
11
limited liquidity in the secondary trading market in the case of unlisted or thinly traded securities; (2) substantial market price volatility resulting from, among other things, changes in prevailing interest rates in the overall market or related to a specific issuer, as well as changing investor perceptions of the market as a whole, REIT or real estate securities in particular or the specific issuer in question; (3) subordination to the liabilities of the issuer; (4) the possibility that earnings of the issuer may be insufficient to meet its debt service obligations or to pay distributions; and (5) with respect to investments in real estate-related preferred equity securities, the operation of mandatory sinking fund or call/redemption provisions during periods of declining interest rates that could cause the issuer to redeem the securities. In addition, investments in real estate-related securities involve special risks relating to the particular issuer of the securities, including the financial condition and business outlook of the issuer. Issuers of real estate-related securities generally invest in real estate or real estate-related assets and are subject to the inherent risks associated with real estate-related investments discussed herein. In fact, many of the entities that we have invested in have reduced the dividends paid on their securities. The stock prices for some of these entities have declined since our initial purchase, and in certain cases we have sold these investments at a loss.
Any mortgage loans that we originate or purchase are subject to the risks of delinquency and foreclosure.
We may originate and purchase mortgage loans. Mortgage loans are subject to risks of delinquency and foreclosure, and risks of loss. The ability of a borrower to repay a loan secured by an income-producing property depends primarily upon the successful operation of the property rather than upon the existence of independent income or assets of the borrower. If the net operating income of the property is reduced, the borrower's ability to repay the loan may be impaired. A property's net operating income can be affected by the any of the potential issues associated with real estate-related investments as discussed herein. We bear the risks of loss of principal to the extent of any deficiency between the value of the collateral and the principal and accrued interest of the mortgage loan. In the event of the bankruptcy of a mortgage loan borrower, the mortgage loan to that borrower will be deemed to be collateralized only to the extent of the value of the underlying collateral at the time of bankruptcy (as determined by the bankruptcy court), and the lien securing the mortgage loan will be subject to the avoidance powers of the bankruptcy trustee or debtor-in-possession to the extent the lien is unenforceable under state law. Foreclosure of a mortgage loan can be an expensive and lengthy process that could have a substantial negative effect on our anticipated return on the foreclosed mortgage loan. We may also be forced to foreclose on certain properties, be unable to sell these properties and be forced to incur substantial expenses to improve operations at the property.
We may make a mortgage loan to affiliates of, or entities sponsored by, our sponsor.
If we have excess working capital, we may, from time to time, and subject to the conditions in our articles, make a mortgage loan to affiliates of, or entities sponsored by, our sponsor. These loan arrangements will not be negotiated at arm's length and may contain terms and conditions that are not in our best interest and would not otherwise be applicable if we entered into arrangements with a third-party borrower not affiliated with these entities.
An increase in real estate taxes may decrease our income from properties.
From time to time, the amount we pay for property taxes increases as either property values increase or assessment rates are adjusted. Increases in a property's value or in the assessment rate result in an increase in the real estate taxes due on that property. If we are unable to pass the increase in taxes through to our tenants, our net operating income for the property will decrease.
Uninsured losses or premiums for insurance coverage may adversely affect a stockholder's returns.
We attempt to adequately insure all of our properties against casualty losses. There are types of losses, generally catastrophic in nature, such as losses due to wars, acts of terrorism, earthquakes, floods, hurricanes, pollution or environmental matters that are uninsurable or not economically insurable, or may be insured subject to limitations, such as large deductibles or co-payments. Risks associated with potential acts of terrorism could sharply increase the premiums we pay for coverage against property and casualty claims. Additionally, mortgage lenders sometimes require commercial property owners to purchase specific coverage against terrorism as a condition for providing mortgage loans. These policies may not be available at a reasonable cost, if at all, which could inhibit our ability to finance or refinance our properties. In such instances, we may be required to provide other financial support, either through financial assurances or self-insurance, to cover potential losses. If we incur any casualty losses not fully covered by insurance, the value of our assets will be reduced by the amount of the uninsured loss. In addition, other than any reserves we may establish, we have no designated source of funding to repair or reconstruct any uninsured damaged property.
12
Terrorist attacks and other acts of violence or war may affect the markets in which we operate our operations and our profitability.
We own estate assets located in areas that are susceptible to attack. These attacks may directly impact the value of our assets through damage, destruction, loss or increased security costs. Although we may obtain terrorism insurance, we may not be able to obtain sufficient coverage to fund any losses we may incur. Risks associated with potential acts of terrorism could sharply increase the premiums we pay for coverage against property and casualty claims. Further, certain losses resulting from these types of events are uninsurable or not insurable at reasonable costs.
More generally, any terrorist attack, other act of violence or war, including armed conflicts, could result in increased volatility in or damage to, the United States and worldwide financial markets and economy. Any terrorist incident may, for example, deter people from traveling, which could affect the ability of our hotels to generate operating income and therefore our ability to pay distributions. Additionally, increased economic volatility could adversely affect our tenants' ability to pay rent on their leases or our ability to borrow money or issue capital stock at acceptable prices.
The cost of complying with environmental and other governmental laws and regulations may adversely affect us.
All real property and the operations conducted on real property are subject to federal, state and local laws and regulations (including those of foreign jurisdictions) relating to environmental protection and human health and safety. These laws and regulations generally govern wastewater discharges, air emissions, the operation and removal of underground and above-ground storage tanks, the use, storage, treatment, transportation and disposal of solid and hazardous materials, and the remediation of contamination associated with disposals. We also are required to comply with various local, state and federal fire, health, life-safety and similar regulations. Some of these laws and regulations may impose joint and several liabilities on tenants or owners for the costs of investigating or remediating contaminated properties. These laws and regulations often impose liability whether or not the owner knew of, or was responsible for, the presence of the hazardous or toxic substances. The cost of removing or remediating could be substantial. In addition, the presence of these substances, or the failure to properly remediate these substances, may adversely affect our ability to sell or rent a property or to use the property as collateral for borrowing.
Environmental laws and regulations also may impose restrictions on the manner in which properties may be used or businesses may be operated, and these restrictions may require substantial expenditures by us. Environmental laws and regulations provide for sanctions in the event of noncompliance and may be enforced by governmental agencies or, in certain circumstances, by private parties. Third parties may seek recovery from owners of real properties for personal injury or property damage associated with exposure to released hazardous substances. Compliance with new or more stringent laws or regulations or stricter interpretations of existing laws may require material expenditures by us. For example, various federal, regional and state laws and regulations have been implemented or are under consideration to mitigate the effects of climate change caused by greenhouse gas emissions. Among other things, “green” building codes may seek to reduce emissions through the imposition of standards for design, construction materials, water and energy usage and efficiency, and waste management. We are not aware of any such existing requirements that we believe will have a material impact on our current operations. However, future requirements could increase the costs of maintaining or improving our existing properties or developing new properties.
Our properties may contain or develop harmful mold, which could lead to liability for adverse health effects and costs of remediating the problem.
The presence of mold at any of our properties could require us to undertake a costly program to remediate, contain or remove the mold. Mold growth may occur when moisture accumulates in buildings or on building materials. Some molds may produce airborne toxins or irritants. Concern about indoor exposure to mold has been increasing because exposure to mold may cause a variety of adverse health effects and symptoms, including allergic or other reactions. The presence of mold could expose us to liability from our tenants, their employees and others if property damage or health concerns arise.
We may incur significant costs to comply with the Americans With Disabilities Act.
Our properties generally are subject to the Americans With Disabilities Act of 1990, as amended. Under this act, all places of public accommodation are required to comply with federal requirements related to access and use by disabled persons. The act has separate compliance requirements for “public accommodations” and “commercial facilities” that generally require that buildings and services be made accessible and available to people with disabilities. The act's requirements could require us to
13
remove access barriers and could result in the imposition of injunctive relief, monetary penalties or, in some cases, an award of damages.
Borrowings may reduce the funds available for distribution and increase the risk of loss since defaults may cause us to lose the properties securing the loans.
We have acquired, and may continue to acquire, real estate assets by using either existing financing or borrowing new monies. Our articles permit us to borrow up to 300% of our net assets. In addition, we may obtain loans secured by some or all of our properties or other assets to fund additional acquisitions or operations including to satisfy the requirement that we distribute at least 90% of our annual “REIT taxable income” (subject to certain adjustments) to our stockholders, or as is otherwise necessary or advisable to assure that we qualify as a REIT for federal income tax purposes. Payments required on any amounts we borrow reduce the funds available for, among other things, distributions to our stockholders because cash otherwise available for distribution is required to pay principal and interest associated with amounts we borrow.
Defaults on loans secured by a property we own may result in us losing the property or properties securing the loan that is in default as a result of foreclosure actions initiated by a lender. For tax purposes, a foreclosure would be treated as a sale of the property for a purchase price equal to the outstanding balance of the debt secured by the property. If the outstanding balance of the debt exceeds our tax basis in the property, we would recognize taxable gain on the foreclosure but would not receive any cash proceeds. We also may fully or partially guarantee any monies that subsidiaries borrow to purchase or operate real estate assets. In these cases, we will be responsible to the lender for repaying the loans if the subsidiary is unable to do so. If any mortgage contains cross-collateralization or cross-default provisions, more than one property may be affected by a default.
Lenders may restrict certain aspects of our operations, which could, among other things, limit our ability to make distributions.
The terms and conditions contained in any of our loan documents may require us to maintain cash reserves; limit the aggregate amount we may borrow on a secured and unsecured basis; require us to satisfy restrictive financial covenants; prevent us from entering into certain business transactions, such as a merger, sale of assets or other business combination; restrict our leasing operations; or require us to obtain consent from the lender to complete transactions or make investments that are ordinarily approved only by our board of directors. In addition, secured lenders typically restrict our ability to discontinue insurance coverage on a mortgaged property even though we may believe that the insurance premiums paid to insure against certain losses, such as losses due to wars, acts of terrorism, earthquakes, floods, hurricanes, pollution or environmental matters, are greater than the potential risk of loss
Interest-only indebtedness may increase our risk of default.
We have obtained, and continue to incur interest related to, interest-only mortgage indebtedness. During the interest only period, the amount of each scheduled payment is less than that of a traditional amortizing mortgage loan. The principal balance of the mortgage loan is not reduced (except in the case of prepayments) because there are no scheduled monthly payments of principal during this period. After the interest-only period, we are required either to make scheduled payments of amortized principal and interest or to make a lump-sum or “balloon” payment at maturity. These required principal or balloon payments increase the amount of our scheduled payments and may increase our risk of default under the related mortgage loan if we are unable to fund the lump-sum or balloon amount.
Increases in interest rates could increase the amount of our debt payments.
As of December 31, 2012, approximately $1.3 billion of our total indebtedness bore interest at variable rates. Increases in interest rates on variable rate debt that has not otherwise been hedged through the use of swap agreements reduce the funds available for other needs, including distribution to our stockholders. As fixed rate debt matures, we may not be able to borrow at rates equal to or lower than the rates on the expiring debt. In addition, if rising interest rates cause us to need additional capital to repay indebtedness, we may be forced to sell one or more of our properties or investments in real estate at times which may not permit us to realize the return on the investments we would have otherwise realized.
To hedge against interest rate fluctuations, we use derivative financial instruments, which may be costly and ineffective.
From time to time, we use derivative financial instruments to hedge exposures to changes in interest rates on certain loans secured by our assets. Our derivative instruments currently consist of interest rate swap contracts but may, in the future, include, interest
14
rate cap or floor contracts, futures or forward contracts, options or repurchase agreements. Our actual hedging decisions are determined in light of the facts and circumstances existing at the time of the hedge. There is no assurance that our hedging strategy will achieve our objectives. We may be subject to costs, such as transaction fees or breakage costs, if we terminate these arrangements.
To the extent that we use derivative financial instruments to hedge against interest rate fluctuations, we are exposed to credit risk, basis risk and legal enforceability risks. In this context, credit risk is the failure of the counterparty to perform under the terms of the derivative contract. Basis risk occurs when the index upon which the contract is based is more or less variable than the index upon which the hedged asset or liability is based, thereby making the hedge less effective. Finally, legal enforceability risks encompass general contractual risks including the risk that the counterparty will breach the terms of, or fail to perform its obligations under, the derivative contract. A counterparty could fail, shut down, file for bankruptcy or be unable to pay out contracts. The business failure of a hedging counterparty with whom we enter into a hedging transaction will most likely result in a default. Default by a party with whom we enter into a hedging transaction may result in the loss of unrealized profits and force us to cover our resale commitments, if any, at the then current market price. Although generally we will seek to reserve the right to terminate our hedging positions, it may not always be possible to dispose of or close out a hedging position without the consent of the hedging counterparty, and we may not be able to enter into an offsetting contract to cover our risk. We cannot provide assurance that a liquid secondary market will exist for hedging instruments purchased or sold, and we may be required to maintain a position until exercise or expiration, which could result in losses.
Further, the REIT provisions of the Code may limit our ability to hedge the risks inherent to our operations. We may be unable to manage these risks effectively.
We may be contractually obligated to purchase property even if we are unable to secure financing for the acquisition.
We typically finance a portion of the purchase price for each property that we acquire. However, to ensure that our offers are as competitive as possible, we generally do not enter into contracts to purchase property that include financing contingencies. Thus, we may be contractually obligated to purchase a property even if we are unable to secure financing for the acquisition. In this event, we may choose to close on the property by using cash on hand, which would result in less cash available for other purposes including funding operating costs or paying distributions to our stockholders. Alternatively, we may choose not to close on the acquisition of the property and default on the purchase contract. If we default on any purchase contract, we could lose our earnest money and become subject to liquidated or other contractual damages and remedies.
Risks Related to Our Common Stock
Since Inland American shares are not currently traded on a national stock exchange, there is no established public market for our shares and you may not be able to sell your shares.
There is no established public market for our shares and no assurance that one may develop. Our charter does not require our directors to seek stockholder approval to liquidate our assets by a specified date, nor does our charter require our directors to list our shares for trading on a national exchange by a specified date. There is no assurance the board will pursue a listing or other liquidity event. In addition, even if our board decides to seek a listing of our shares of common stock, there is no assurance that we will satisfy the listing requirements or that our shares will be approved for listing. If and when a listing occurs there is no guarantee you will be able to sell your common shares at a price equal to your initial investment value.
Our stockholders may not be able to sell some or all of their shares under our share repurchases program.
Our share repurchase program contains numerous restrictions that limit our stockholders' ability to sell their shares, including those relating to the number of shares of our common stock that we can repurchase at any given time and limiting the funds we will use to repurchase shares pursuant to the program. Under the program, we may repurchase shares of our common stock, on a quarterly basis only, from the beneficiary of a stockholder that has died or from stockholders that have a “qualifying disability” or are confined to a “long-term care facility” (together, referred to herein as “hardship repurchases”). Our program does not permit us to accept shares for repurchase for any other reason, further, we are authorized to repurchase shares at a price per share equal to 100% of the most recently disclosed estimated per share value of our common stock, which currently is equal to $6.93 per share. Our obligation to repurchase any shares under the program is further conditioned upon our having sufficient funds available to complete the repurchase. For 2013, our board has reserved $10.0 million per calendar quarter for the purpose of funding repurchases associated with death and $15.0 million per calendar quarter for the purpose of funding hardship repurchases. If the funds reserved for either category of repurchase under the program are insufficient to repurchase all of the shares for which repurchase requests have been received for a particular quarter, or if the number of shares accepted for repurchase would cause us to exceed the 5.0% limit set forth therein, we will repurchase the shares in the following order: (1) for death repurchases, we will repurchase shares
15
in chronological order, based upon the beneficial owner's date of death; and (2) for hardship repurchases, we will repurchase shares on a pro rata basis, up to, but not in excess of, the limits described herein; provided, that in the event that the repurchase would result in a stockholder owning less than 150 shares, we will repurchase all of that stockholder's shares. Further, we have no obligation to repurchase shares if the repurchase would violate the restrictions on distributions under Maryland law, which prohibits distributions that would cause a corporation to fail to meet statutory tests of solvency.
Since the repurchase price is equal to our estimated per share value of our common stock, a stockholder may receive less than the amount of their investment in the shares. Moreover, our directors have the discretion to suspend or terminate the program upon 30 days' notice. Therefore, our stockholders may not have the opportunity to make a repurchase request prior to a potential termination of the share repurchase program and our stockholders may not be able to sell any of their shares of common stock back to us. As a result of these restrictions and circumstances, the ability of our stockholders to sell their shares should they require liquidity is significantly restricted.
The estimated value of our common stock is based on a number of assumptions and estimates that may not be accurate or complete and is also subject to a number of limitations.
On December 19, 2012, we announced an estimated value of our common stock equal to $6.93 per share. As with any methodology used to estimate value, the methodology employed by our business manager and reviewed by Real Globe Advisors, LLC was based upon a number of estimates and assumptions that may not be accurate or complete. Further, different parties using different assumptions and estimates could derive a different estimated value per share, which could be significantly different from our estimated value per share. The estimated value per share may not represent current market values or fair values as determined in accordance with U.S. generally accepted accounting principles (or “GAAP”). Real properties are currently carried at their amortized cost basis in the Company's financial statements. The estimated value of our real estate assets used in our analysis does not necessarily represent the value we would receive or accept if the assets were marketed for sale. The market for commercial real estate can fluctuate and values are expected to change in the future. Further, acquisitions and dispositions of properties will have an effect on the value of our estimated price per share, which is not reflected in the current estimated price. Moreover, the estimated per share value of the Company's common stock does not reflect a liquidity discount for the fact that the shares are not currently traded on a national securities exchange, a discount for the non-assumability or prepayment obligations associated with certain of the Company's loans and other costs that may be incurred, including any costs of sale of its assets. Accordingly, with respect to the estimated value per share, we can give no assurance that:
|
•
|
a stockholder would be able to resell his or her shares at this estimated value;
|
|
•
|
a stockholder would ultimately realize distributions per share equal to our estimated value per share upon liquidation of our assets and settlement of our liabilities or a sale of the Company;
|
|
•
|
our shares would trade at a price equal to or greater than the estimated value per share if we listed them on a national securities exchange; or
|
|
•
|
the methodology used to estimate our value per share would be acceptable to FINRA or that the estimated value per share will satisfy the applicable annual valuation requirements under the Employee Retirement Income Security Act of 1974, as amended (“ERISA”) and the Internal Revenue Code of 1986, as amended (the “Code”) with respect to employee benefit plans subject to ERISA and other retirement plans or accounts subject to Section 4975 of the Code.
|
There is no assurance that we will be able to continue paying cash distributions or that distributions will increase over time.
We pay regular monthly cash distributions to our stockholders. However, there are many factors that can affect the availability and timing of cash distributions such as our ability to earn positive yields on our real estate assets, the yields on securities of other entities in which we invest, our operating expense levels, as well as many other variables. Our long-term portfolio strategy may also affect our ability to pay our cash distributions if we are not able to reinvest the capital we receive from our properties dispositions, in a reasonable amount of time, into assets that generate cash flow yields similar to or greater than the properties sold. There is no assurance that we will be able to continue paying distributions at the current level or that the amount of distributions will increase, or not decrease, over time. Even if we are able to continue paying distributions, the actual amount and timing of distributions is determined by our board of directors in its discretion and typically depends on the amount of funds available for distribution, which depends on items such as current and projected cash requirements and tax considerations. As a result, our distribution rate and payment frequency may vary from time to time.
16
Funding distributions from sources other than cash flow from operating activities may negatively impact our ability to sustain or pay future distributions and will result in us having less cash available for other uses, such as property purchases.
If our cash flow from operating activities is not sufficient to fully fund the payment of distributions, the level of our distributions may not be sustainable and some or all of our distributions will be paid from other sources. In addition, from time to time, our business manager has determined, in its sole discretion, to either forgo or defer a portion of the business management fee, which has had the effect of increasing cash flow from operations for the relevant period because we have not had to use that cash to pay any fee or reimbursement which was foregone or deferred during the relevant period. For the year ended December 31, 2012, we paid our business manager a net business management fee of $39.9 million, or approximately 0.35% of our average invested assets on an annual basis, as well as an investment advisory fee of approximately $1.8 million, both of which together are less than the 1% fee that the business manager could have requested under the express terms of the business manager agreement. Our business manager did not forgo or defer any portion of its fee for the year ended December 31, 2012. There is no assurance that, in the future, our business manager will forgo or defer any portion of its business management fee. Further, we would need to use cash at some point in the future to pay any fee or reimbursement that is deferred. We also may use cash from financing activities, components of which may include borrowings (including borrowings secured by our assets), as well as proceeds from the sales of our properties, to fund distributions. To the extent distributions are paid from these sources or gains on sales of assets, we will have less money available for other uses, such as cash needed to refinance existing indebtedness or for the purchase of new assets.
Risks Related to Conflicts of Interest
There are conflicts of interest between us and affiliates of our sponsor that may affect our acquisition of properties and financial performance.
During the ten years ended December 31, 2012 our sponsor and Inland Private Capital Corporation (“IPCC”) sponsored, in the aggregate, three other REITs and 107 real estate exchange private placement limited partnerships and limited liability companies. Two of the REITs, Inland Diversified Real Estate Trust, Inc. and Inland Real Estate Income Trust, Inc., are managed by affiliates of our business manager. Inland Real Estate Corporation (or IRC) and Retail Properties of America, Inc., (or RPAI) are self-managed, but our sponsor and its affiliates continue to hold a significant investment in these entities. We may be seeking to buy real estate assets at the same time as certain of these other programs. Further, certain programs sponsored by our sponsor or IPCC own and manage the type of properties that we own, and in the same geographical areas in which we own them. Therefore, our properties may compete for tenants with other properties owned and managed by these other programs. Persons performing services for our property managers may face conflicts of interest when evaluating tenant leasing opportunities for our properties and other properties owned and managed by these programs, and these conflicts of interest may have an adverse impact on our ability to attract and retain tenants.
Our sponsor may face a conflict of interest in allocating personnel and resources between its affiliates, our business manager and our property managers.
We rely, to a great extent, on persons performing services for our business manager and property managers and their affiliates to manage our day-to-day operations. Some of these persons also provide services to one or more investment programs previously sponsored by our sponsor. Some of these persons also have ownership interests in these affiliates. These individuals face competing demands for their time and service and may have conflicts in allocating their time between our business and assets and the business and assets of our sponsor, its affiliates and the other programs formed and organized by our sponsor. In addition, if another investment program sponsored by our sponsor decides to internalize its management functions, it may do so by hiring and retaining certain of the persons currently performing services for our business manager and property managers, and if it did so, would likely not allow these persons to perform services for us.
We do not have arm's-length agreements with our business manager, our property managers or any other affiliates of our sponsor.
None of the agreements and arrangements with our business manager, our property managers or any other affiliates of our sponsor was negotiated at arm's-length. These agreements may contain terms and conditions that are not in our best interest and would not otherwise be applicable if we entered into arm's length agreements with third parties.
17
Our business manager and its affiliates face conflicts of interest caused by their compensation arrangements with us, which could result in actions that are not in the long-term best interests of our stockholders.
We pay significant fees to our business manager, property managers and other affiliates of our sponsor for services provided to us. Most significantly, our business manager receives fees based on the aggregate book value, including acquired intangibles, of our invested assets. Further, our property managers receive fees based on the gross income from properties under management. Other parties related to, or affiliated with, our business manager or property managers may also receive fees or cost reimbursements from us. These compensation arrangements may cause these entities to take or not take certain actions. For example, these arrangements may provide an incentive for our business manager to borrow more money than prudent to increase the amount we can invest or defer the sale of properties and distribution of proceeds to stockholders to increase management fees. Ultimately, the interests of these parties in receiving fees may conflict with the interest of our stockholders in earning income on their investment in our common stock.
While we have developed our own internal acquisition staff, we utilize entities affiliated with our sponsor to identify real estate assets.
We continue to utilize Inland Real Estate Acquisitions, Inc. (“IREA”) and other affiliates of our sponsor to identify investment opportunities for us. Other public or private programs sponsored by our sponsor or IPCC also rely on these entities to identify potential investments. These entities have, in some cases, rights of first refusal or other pre-emptive rights to the properties that IREA identifies. Our right to acquire properties identified by IREA is subject to the exercise of any prior rights vested in these entities. We may not, therefore, be presented with opportunities to acquire properties that we otherwise would be interested in acquiring.
Risks Related to Our Organization and Structure
Stockholders have limited control over changes in our policies and operations.
Our board of directors determines our major policies, including our investment policies and strategies, and policies regarding financing, debt capitalization, REIT qualification and distributions. Our board of directors may amend or revise certain of these and other policies without a vote of the stockholders.
Stockholders' interest in us will be diluted if we issue additional shares.
Stockholders do not have preemptive rights to any shares issued by us in the future. Our articles authorize us to issue up to 1.5 billion shares of capital stock, of which 1.46 billion shares are designated as common stock and 40 million are designated as preferred stock. Future issuances of common stock, including issuances through our distribution reinvestment plan (“DRP”), reduce the percentage of our shares owned by our current stockholders who do not participate in future stock issuances. Stockholders are generally not entitled to vote on whether or not we issue additional shares. In addition, depending on the terms and pricing of an additional offering of our shares and the value of our properties, our stockholders may experience dilution in the book value and value of their shares. Further, our board could authorize the issuance of stock with terms and conditions that could subordinate the rights of the holders of our current common stock or have the effect of delaying, deferring or preventing a change in control in us, including an extraordinary transaction (such as a merger, tender offer or sale of all or substantially all of our assets) that might provide a premium price for our stockholders.
Stockholders' returns may be reduced if we are required to register as an investment company under the Investment Company Act.
We are not registered, and do not intend to register our company or any of our subsidiaries, as an investment company under the Investment Company Act of 1940, as amended (the “Investment Company Act”). If we or any of our subsidiaries become obligated to register as an investment company, the registered entity would have to comply with regulation under the Investment Company Act with respect to capital structure (including the registered entity's ability to use borrowings), management, operations, transactions with affiliated persons (as defined in the Investment Company Act) and portfolio composition, including disclosure requirements and restrictions with respect to diversification and industry concentration, and other matters. Compliance with the Investment Company Act would limit our ability to make certain investments and require us to significantly restructure our operations and business plan. The costs we would incur and the limitations that would be imposed on us as a result of such compliance and restructuring would negatively affect the value of our common stock, our ability to make distributions and the sustainability of our business and investment strategies.
18
We believe that neither we nor any subsidiaries we own fall within the definition of an investment company under Section 3(a)(1) of the Investment Company Act because we primarily engage in the business of investing in real property, through our wholly or majority owned subsidiaries, each of which has at least 60% of their assets in real property. The company conducts its operations, directly and through wholly or majority-owned subsidiaries, so that none of the company and its subsidiaries is registered or will be required to register as an investment company under the Investment Company Act. Section 3(a)(1) of the Investment Company Act, in relevant part, defines an investment company as (i) any issuer that is, or holds itself out as being, engaged primarily in the business of investing, reinvesting or trading in securities
.
, or (ii) any issuer that is engaged, or proposes to engage, in the business of investing, reinvesting, owning, holding or trading in securities and owns, or proposes to acquire, “investment securities” having a value exceeding 40% of the value of its total assets (exclusive of government securities and cash items) on an unconsolidated basis, which we refer to as the “40% test.” The term “investment securities” generally includes all securities except government securities and securities of majority-owned subsidiaries that are not themselves investment companies and are not relying on the exemption from the definition of investment company under Section 3(c)(1) or Section 3(c)(7) of the Investment Company Act. We and our subsidiaries are primarily engaged in the business of investing in real property and, as such, fall outside of the definition of an investment company under Section 3(a)(1)(A) of the Investment Company Act. We also conduct our operations and the operations of our subsidiaries so that each complies with the 40% test.
Accordingly, we believe that neither we nor any of our wholly and majority-owned subsidiaries are considered investment companies under either Section 3(a)(1)(A) or Section 3(a)(1)(C) of the Investment Company Act. If we or any of our wholly or majority-owned subsidiaries would ever inadvertently fall within one of the definitions of “investment company,” we intend to rely on the exemption provided by Section 3(c)(5)(C) of the Investment Company Act. To rely upon Section 3(c)(5)(C) of the Investment Company Act as it has been interpreted by the SEC staff, an entity would have to invest at least 55% of its total assets in “mortgage and other liens on and interests in real estate,” which we refer to as “qualifying real estate investments” and maintain an additional 25% of its total assets in qualifying real estate investments or other real estate-related assets. The remaining 20% of the entity's assets can consist of miscellaneous assets. These criteria may limit what we buy, sell and hold.
We classify our assets for purposes of Section 3(c)(5)(C) based in large measure upon no-action letters issued by the SEC staff and other interpretive guidance provided by the SEC and its staff. The no-action positions are based on factual situations that may be substantially different from the factual situations we may face, and a number of these no-action positions were issued more than twenty years ago. Pursuant to this guidance, and depending on the characteristics of the specific investments, certain mortgage-backed securities, other mortgage-related instruments, joint venture investments and the equity securities of other entities may not constitute qualifying real estate assets, and therefore, we may limit our investments in these types of assets. The SEC or its staff may not concur with the way we classify our assets. Future revisions to the Investment Company Act or further guidance from the SEC or its staff may cause us to no longer be in compliance with the exemption from the definition of an “investment company” provided by Section 3(c)(5)(C) and may force us to re-evaluate our portfolio and our investment strategy. For example, on August 31, 2011 the SEC issued a concept release and request for comments regarding the Section 3(c)(5)(C) exemption (Release No. IC-29778) in which it contemplated the possibility of issuing new rules or providing new interpretations of the exemption that might, among other things, define the phrase “liens on and other interests in real estate” or consider sources of income in determining a company's “primary business.” To the extent that the SEC or its staff provides more specific or different guidance, we may be required to adjust our strategy accordingly. Any additional guidance from the SEC or its staff could provide additional flexibility to us, or it could further inhibit our ability to pursue the strategies we have chosen.
A change in the value of any of our assets could cause us to fall within the definition of “investment company” and negatively affect our ability to be free from registration and regulation under the Investment Company Act. To avoid being required to register the company or any of its subsidiaries as an investment company under the Investment Company Act, we may be unable to sell assets we would otherwise want to sell and may need to sell assets we would otherwise wish to retain. Sales may be required during adverse market conditions, and we could be forced to accept a price below that which we would otherwise consider acceptable. In addition, we may have to acquire additional income or loss generating assets that we might not otherwise have acquired or may have to forgo opportunities to acquire interests in companies that we would otherwise want to acquire and would be important to our investment strategy. Any such selling, acquiring or holding of assets driven by Investment Company Act considerations could negatively affect the value of our common stock, our ability to make distributions and the sustainability of our business and investment strategies.
If we or our subsidiaries were required to register as an investment company but failed to do so, we or the applicable subsidiary would be prohibited from engaging in our or its business, and criminal and civil actions could be brought against us or the applicable subsidiary. In addition, our contracts would be unenforceable unless a court required enforcement, and a court could appoint a receiver to take control of us and liquidate our business.
19
Maryland law and our organizational documents limit a stockholder's right to bring claims against our officers and directors.
Subject to the limitations set forth in our articles, a director will not have any liability for monetary damages under Maryland law so long as he or she performs his or her duties in good faith, in a manner he or she reasonably believes to be in our best interest, and with the care that an ordinary prudent person in a like position would use under similar circumstances. In addition, our articles, in the case of our directors, officers, employees and agents, and the business management agreement and the property management agreements, in the case of our business manager and property managers, respectively, require us to indemnify these persons for actions taken by them in good faith and without negligence or misconduct, or, in the case of our independent directors, actions taken in good faith without gross negligence or willful misconduct. As a result, we and our stockholders may have more limited rights against these persons than might otherwise exist under common law. In addition, we may be obligated to fund the defense costs incurred by these persons in some cases.
Our board of directors may, in the future, adopt certain measures under Maryland law without stockholder approval that may have the effect of making it less likely that stockholders would receive a “control premium” for their shares.
Corporations organized under Maryland law are permitted to protect themselves from unsolicited proposals or offers to acquire the company. Although we are not subject to these provisions, our stockholders could approve an amendment to our articles eliminating this restriction. If we do become subject to these provisions, our board of directors would have the power under Maryland law to, among other things, amend our articles without stockholder approval to:
|
•
|
stagger our board of directors into three classes;
|
|
•
|
require a two-thirds vote of stockholders to remove directors;
|
|
•
|
empower only remaining directors to fill any vacancies on the board;
|
|
•
|
provide that only the board can fix the size of the board;
|
|
•
|
provide that all vacancies on the board, regardless of how the vacancy was created, may be filled only by the affirmative vote of a majority of the remaining directors in office; and
|
|
•
|
require that special stockholders meetings be called only by holders of a majority of the voting shares entitled to be cast at the meeting.
|
These provisions may discourage an extraordinary transaction, such as a merger, tender offer or sale of all or substantially all of our assets, all of which might provide a premium price for a stockholder's shares.
Further, under the Maryland Business Combination Act, we may not engage in any merger or other business combination with an “interested stockholder” or any affiliate of that interested stockholder for a period of five years after the most recent purchase of stock by the interested stockholder. After the five-year period ends, any merger or other business combination with the interested stockholder must be recommended by our board of directors and approved by the affirmative vote of at least:
|
•
|
80% of all votes entitled to be cast by holders of outstanding shares of our voting stock; and
|
|
•
|
two-thirds of all of the votes entitled to be cast by holders of outstanding shares of our voting stock other than those shares owned or held by the interested stockholder unless, among other things, our stockholders receive a minimum payment for their common stock equal to the highest price paid by the interested stockholder for its common stock.
|
Our articles exempt any business combination involving us and The Inland Group or any affiliate of The Inland Group, including our business manager and property managers, from the provisions of this law.
Our articles place limits on the amount of common stock that any person may own without the prior approval of our board of directors.
To qualify as a REIT, no more than 50% of the outstanding shares of our common stock may be beneficially owned, directly or indirectly, by five or fewer individuals at any time during the last half of each taxable year. Our articles prohibit any persons or groups from owning more than 9.8% of our common stock without the prior approval of our board of directors. These provisions may have the effect of delaying, deferring or preventing a change in control of us, including an extraordinary transaction such as a merger, tender offer or sale of all or substantially all of our assets that might involve a premium price for holders of our common stock. Further, any person or group attempting to purchase shares exceeding these limits could be compelled to sell the additional shares and, as a result, to forfeit the benefits of owning the additional shares.
20
Our articles permit our board of directors to issue preferred stock on terms that may subordinate the rights of the holders of our current common stock or discourage a third party from acquiring us.
Our board of directors is permitted, subject to certain restrictions set forth in our articles, to issue up to forty million shares of preferred stock without stockholder approval. Further, subject to certain restrictions set forth in our articles, our board may classify or reclassify any unissued preferred stock and establish the preferences, conversions or other rights, voting powers, restrictions, limitations as to dividends and other distributions, qualifications, and terms or conditions of redemption of any preferred stock. Thus, our board of directors could authorize us to issue shares of preferred stock with terms and conditions that could subordinate the rights of the holders of our common stock or have the effect of delaying, deferring or preventing a change in control of us, including an extraordinary transaction such as a merger, tender offer or sale of all or substantially all of our assets, that might provide a premium price for holders of our common stock.
Maryland law limits, in some cases, the ability of a third party to vote shares acquired in a “control share acquisition.”
Under the Maryland Control Share Acquisition Act, persons or entities owning “control shares” of a Maryland corporation acquired in a “control share acquisition” have no voting rights with respect to those shares except to the extent approved by a vote of two-thirds of the corporation's disinterested stockholders. Shares of stock owned by the acquirer or by officers or directors who are employees of the corporation, are not considered disinterested for these purposes. “Control shares” are shares of stock that, taken together with all other shares of stock the acquirer previously acquired, would entitle the acquirer to exercise voting power in electing directors within one of the following ranges of voting power:
|
•
|
one-tenth or more but less than one-third of all voting power;
|
|
•
|
one-third or more but less than a majority of all voting power; or
|
|
•
|
a majority or more of all voting power.
|
Control shares do not include shares of stock the acquiring person is entitled to vote as a result of having previously obtained stockholder approval. A “control share acquisition” means the acquisition of control shares, subject to certain exceptions. The Control Share Acquisition Act does not apply to (1) shares acquired in a merger, consolidation or share exchange if the corporation is a party to the transaction or (2) acquisitions approved or exempted by our articles or bylaws. Our articles exempt transactions between us and The Inland Group and its affiliates, including our business manager and property managers, from the limits imposed by the Control Share Acquisition Act. This statute could have the effect of discouraging offers from third parties to acquire us and increase the difficulty of successfully completing this type of offer by anyone other than The Inland Group and its affiliates.
Federal Income Tax Risks
If we fail to qualify as a REIT, we will have less cash to distribute to our stockholders.
Our qualification as a REIT depends on our ability to meet requirements regarding our organization and ownership, distributions of our income, the nature and diversification of our income and assets as well as other tests imposed by the Internal Revenue Code of 1986, as amended (the “Code”). We cannot assure you that our actual operations for any one taxable year will satisfy these requirements. Further, new legislation, regulations, administrative interpretations or court decisions could significantly affect our ability to qualify as a REIT and/or the federal income tax consequences of our qualification as a REIT. If we were to fail to qualify as a REIT and did not qualify for certain statutory relief provisions:
|
•
|
we would not be allowed to deduct distributions paid to stockholders when computing our taxable income;
|
|
•
|
we would be subject to federal, state and local income tax (including any applicable alternative minimum tax) on our taxable income at regular corporate rates;
|
|
•
|
we would be disqualified from being taxed as a REIT for the four taxable years following the year during which we failed to qualify, unless we qualify for certain statutory relief provisions;
|
|
•
|
we would have less cash to pay distributions to stockholders; and
|
|
•
|
we may be required to borrow additional funds or sell some of our assets in order to pay the corporate tax obligations we may incur as a result of being disqualified.
|
In addition, if we were to fail to qualify as a REIT, all distributions to stockholders that we did pay would be subject to tax as regular corporate dividends to the extent of our current and accumulated earnings and profits. This means that our U.S. stockholders who are taxed at individual rates would be taxed on our dividends at long-term capital gains rates of up to 20% and that our corporate stockholders generally would be entitled to the dividends received deduction with respect to such dividends, subject, in each case, to applicable limitations under the Code.
21
We are seeking closing agreements with the Internal Revenue Service (the “IRS”) granting us relief for potential failures to satisfy certain REIT qualification requirements, and we may have to pay a significant penalty even if the IRS grants our requests.
A REIT is subject to a number of organizational and operational requirements, including a requirement that it currently distributes at least 90% of its REIT taxable income (subject to certain adjustments) to its stockholders (the “90% Distribution Test”). We have identified certain distribution and stockholder reimbursement practices that may have caused certain dividends paid by the consolidated Inland American REIT and MB REIT (Florida), Inc. (“MB REIT”) to be treated as preferential dividends, which cannot be used to satisfy the 90% Distribution Requirement. We have also identified the ownership of certain assets by the Inland American REIT and MB REIT that may have violated a REIT qualification requirement that prohibits a REIT from owning "securities" of any one issuer in excess of 5% of the REIT's total assets at the end of any calendar quarter (the "5% Securities Test"). In order to provide greater certainty with respect to the qualification of the Inland American REIT and MB REIT as REITs for federal income tax purposes, management concluded that it was in our best interest and the best interest of our stockholders to request closing agreements from the Internal Revenue Service ("IRS") for both the Inland American REIT and MB REIT with respect to such matters. Accordingly, on October 31, 2012, MB REIT filed a request for a closing agreement with the IRS. Additionally, we filed a separate request for a closing agreement on behalf of the Inland American REIT on March 7, 2013.
We identified certain aspects of the calculation of certain dividends on MB REIT's preferred stock and also aspects of the operation of certain "set aside" provisions with respect to accrued but unpaid dividends on certain classes of MB REIT's preferred stock that may have caused certain dividends to be treated as preferential dividends. In the case of the Inland American REIT, management identified certain aspects of the operation of the dividend reinvestment plan and distribution procedures and also certain reimbursements of stockholder expenses that may have caused certain dividends to be treated as preferential dividends. If these practices resulted in preferential dividends, the Inland American REIT and MB REIT would not have satisfied the 90% Distribution Requirement and thus may not have qualified as REITs, which would result in substantial corporate tax liability for the years in which the Inland American REIT or MB REIT failed to qualify as REITs.
In addition, the Inland American REIT and MB REIT made certain overnight investments in bank commercial paper. While the Code does not provide a specific definition of “cash item”, we believe that overnight commercial paper should be treated as a “cash item”, which is not treated as a “security” for purposes of the 5% Securities Test. If treated as a "security", the bank commercial paper would appear to have represented more than 5% of the respective REIT's total assets at the end of certain calendar quarters. In the event this commercial paper is treated as a "security", we anticipate that we would be required to pay corporate income tax on the income earned with respect to the portion of the commercial paper that violated the 5% Securities Test.
We can provide no assurance that the IRS will accept the Inland American REIT's or MB REIT's closing agreement requests. Even if the IRS accepts those requests, the Inland American and MB REIT may be required to pay a penalty which could be significant.
To maintain REIT status, we may be forced to borrow funds or dispose of assets during unfavorable market conditions to make distributions to our stockholders, which could increase our operating costs and decrease the value of an investment in our company.
To qualify as a REIT, we must distribute 90% of our REIT taxable income (which is determined without regard to the dividends-paid deduction or net capital gain) to our stockholders each year. At times, we may not have sufficient funds to satisfy these distribution requirements and may need to borrow funds or dispose of assets to make these distributions and maintain our REIT status and avoid the payment of income and excise taxes. Our inability to satisfy the distribution requirements with operating cash flow could result from (1) differences in timing between the actual receipt of cash and inclusion of income for federal income tax purposes; (2) the effect of non-deductible capital expenditures; (3) the creation of reserves; or (4) required debt amortization payments. We may need to borrow funds at times when market conditions are unfavorable. Further, if we are unable to borrow funds when needed for this purpose, we would have to find alternative sources of funding or risk losing our status as a REIT.
Even if we qualify as a REIT, we may face other tax liabilities that reduce our cash flows.
Even if we qualify for taxation as a REIT, we may be subject to certain federal, state and local taxes on our income and assets. For example:
|
•
|
We will be subject to tax on any undistributed income. We will be subject to a 4% nondeductible excise tax on the amount, if any, by which distributions we pay in any calendar year plus amounts retained for which federal income tax was paid are less than the sum of 85% of our ordinary income, 95% of our capital gain net income and 100% of our undistributed income from prior years.
|
22
|
•
|
If we have net income from the sale of foreclosure property that we hold primarily for sale to customers in the ordinary course of business or other non-qualifying income from foreclosure property, we must pay a tax on that income at the highest corporate income tax rate.
|
|
•
|
If we sell a property, other than foreclosure property, that we hold primarily for sale to customers in the ordinary course of business, our gain would be subject to the 100% “prohibited transactions” tax.
|
|
•
|
Our taxable REIT subsidiaries are subject to regular corporate federal, state and local taxes.
|
|
•
|
We will be subject to a 100% penalty tax on transactions with a taxable REIT subsidiary that are not conducted on an arm's-length basis.
|
Any of these taxes would decrease cash available for distributions to our stockholders.
The prohibited transactions tax may limit our ability to dispose of our properties.
A REIT's net income from prohibited transactions is subject to a 100% tax. In general, prohibited transactions are sales or other dispositions of property, other than foreclosure property, held primarily for sale to customers in the ordinary course of business. We may be subject to the prohibited transactions tax equal to 100% of net gain upon a disposition of a property. As part of our plan to refine our portfolio, we have selectively disposed of certain of our properties in the past and intend to make additional dispositions in the future. Although a safe harbor to the characterization of the sale of property by a REIT as a prohibited transaction is available, not all of our past dispositions have qualified for that safe harbor and some or all of our future dispositions may not qualify for that safe harbor. We believe that our past dispositions will not be treated as prohibited transactions, and we intend to avoid disposing of property that may be characterized as held primarily for sale to customers in the ordinary course of business. Consequently, we may choose not to engage in certain sales of our properties or may conduct such sales through a taxable REIT subsidiary, which would be subject to federal, state and local income taxation.
We may fail to qualify as a REIT if the IRS successfully challenges the valuation of our common stock used for purposes of our DRP.
In order to satisfy the 90% Distribution Requirement, the dividends we pay must not be “preferential.” A dividend determined to be preferential will not qualify for the dividends paid deduction. To avoid paying preferential dividends, we must treat every stockholder of a class of stock with respect to which we make a distribution the same as every other stockholder of that class, and we must not treat any class of stock other than according to its dividend rights as a class. For example, if certain stockholders receive a distribution that is more or less than the distributions received by other stockholders of the same class, the distribution will be preferential. If any part of a distribution is preferential, none of that distribution will be applied towards satisfying the 90% Distribution Requirement.
Stockholders participating in our DRP receive distributions in the form of shares of our common stock rather than in cash. Currently, the purchase price per share under our DRP is equal to 100% of the “market price” of a share of our common stock. Because our common stock is not yet listed for trading, for these purposes, “market price” means the fair market value of a share of our common stock, as estimated by us. In the past, our DRP has offered participants the opportunity to acquire newly-issued shares of our common stock at a discount to the “market price.” Pursuant to an IRS ruling, the prohibition on preferential dividends does not prohibit a REIT from offering shares under a distribution reinvestment plan at discounts of up to 5% of fair market value, but a discount in excess of 5% of the fair market value of the shares would be considered a preferential dividend. Any discount we have offered in the past was intended to fall within the safe harbor for such discounts set forth in the ruling published by the IRS. However, the fair market value of our common stock has not been susceptible to a definitive determination. If the purchase price under our DRP is deemed to have been at more than a 5% discount at any time, we would be treated as having paid one or more preferential dividends. Similarly, we would be treated as having paid one or more preferential dividends if the IRS successfully asserted that the value of the common stock distributions paid to stockholders participating in our DRP exceeded on a per-share basis the cash distribution paid to our other stockholders, which could occur if the IRS successfully asserted that the fair market value of our common stock exceeded the “market value” used for purposes of calculating the distributions under our DRP. If we are determined to have paid preferential dividends as a result of our DRP, we would likely fail to qualify as a REIT.
Complying with the REIT requirements may force us to liquidate otherwise attractive investments.
To maintain qualification as a REIT, we must ensure that at the end of each calendar quarter, at least 75% of the value of our assets consists of cash, cash items, government securities and qualified real estate assets, including shares of stock in other REITs, certain mortgage loans and mortgage-backed securities. The remainder of our investment in securities (other than governmental securities, qualified real estate assets and securities of taxable REIT subsidiaries) generally cannot include more than 10% of the outstanding voting securities of any one issuer or more than 10% of the total value of the outstanding securities of any one issuer. In addition, in general, no more than 5% of the value of our assets (other than government securities, qualified real estate assets and securities
23
of taxable REIT subsidiaries) can consist of the securities of any one issuer, and no more than 25% of the value of our total securities can be represented by securities of one or more taxable REIT subsidiaries. If we fail to comply with these requirements at the end of any calendar quarter, we must correct the failure within thirty days after the end of the calendar quarter to avoid losing our REIT status and suffering adverse tax consequences. As a result, we may be required to liquidate otherwise attractive investments in order to maintain our REIT status.
If our leases are not respected as true leases for federal income tax purposes, we would fail to qualify as a REIT.
To qualify as a REIT, we must satisfy two gross income tests, pursuant to which specified percentages of our gross income must be passive income such as rent. For the rent we receive under our lease to be treated as qualifying income for purposes of the gross income tests, the leases must be respected as true leases for federal income tax purposes and must not be treated as service contracts, joint ventures or some other type of arrangement. There are no controlling Treasury regulations, published rulings or judicial decisions involving leases with terms substantially the same as our hotel leases that discuss whether such leases constitute true leases for federal income tax purposes. We believe that all of our leases, including our hotel leases, will be respected as true leases for federal income tax purposes. There can be no assurance, however, that the IRS will agree with this characterization. If a significant portion of our leases were not respected as true leases for federal income tax purposes, we would not be able to satisfy either of the two gross income tests and each would likely lose its REIT status.
If MB REIT failed to qualify as a REIT, we would likely fail to qualify as a REIT.
We own 100% of the common stock of MB REIT, which owns a significant portion of our properties and has elected to be taxed as a REIT for federal income tax purposes. MB REIT is subject to the various REIT qualification requirements and other limitations that apply to us. We believe that MB REIT has operated and will continue to operate in a manner to permit it to qualify for taxation as a REIT for federal income tax purposes. However, if MB REIT were to fail to qualify as a REIT, then (1) MB REIT would become subject to regular corporation income tax and (2) our ownership of shares MB REIT would cease to be a qualifying real estate asset for purposes of the 75% asset test applicable to REITs and would become subject to the 5% asset test, the 10% vote test, and the 10% value test generally applicable to our ownership in corporations other than REITs, qualified REIT subsidiaries and taxable REIT subsidiaries. If MB REIT were to fail to qualify as a REIT, we would not satisfy the 5% asset test, the 10% value test, or the 10% vote test, in which event we would fail to qualify as a REIT unless we qualified for certain statutory relief provisions.
If our hotel managers do not qualify as “eligible independent contractors,” we would fail to qualify as a REIT.
Rent paid by a lessee that is a “related party tenant” of ours will not be qualifying income for purposes of the two gross income tests applicable to REITs. We lease our hotels to our certain of our taxable REIT subsidiaries. A taxable REIT subsidiary will not be treated as a “related party tenant,” and will not be treated as directly operating a lodging facility, which is prohibited, to the extent that hotels that our taxable REIT subsidiaries lease are managed by an “eligible independent contractor.”
We believe that the rent paid by our taxable REIT subsidiaries that lease our hotels is qualifying income for purposes of the REIT gross income tests and that our taxable REIT subsidiaries qualify to be treated as “taxable REIT subsidiaries” for federal income tax purposes, but there can be no assurance that the IRS will not challenge this treatment or that a court would not sustain such a challenge. If the IRS successfully challenged this treatment, we would likely fail to satisfy the asset tests applicable to REITs and a significant portion of our income would fail to qualify for the gross income tests. If we failed to satisfy either the asset or gross income tests, we would likely lose our REIT qualification for federal income tax purposes, unless we qualified for certain statutory relief provisions.
If our hotel managers do not qualify as “eligible independent contractors,” we may fail to qualify as a REIT. Each of the hotel management companies that enters into a management contract with our taxable REIT subsidiaries that lease our hotels must qualify as an “eligible independent contractor” under the REIT rules in order for the rent paid to us by taxable REIT subsidiaries to be qualifying income for gross income tests. Among other requirements, in order to qualify as an eligible independent contractor, (1) a manager must be actively engaged in the trade or business of operating hotels for third parties at the time the manger enters into a management contract with a taxable REIT subsidiary lessee and (2) the manager must not own more than 35% of our outstanding shares (by value) and no person or group of persons can own more than 35% of our outstanding shares and the ownership interests of the manager. Although we believe that all of our hotel managers qualify as eligible independent contractors, no complete assurance can be provided that the IRS will not successfully challenge that position.
Complying with REIT requirements may limit our ability to hedge effectively.
The REIT provisions of the Code may limit our ability to hedge the risks inherent to our operations. Under current law, any income that we generate from derivatives or other transactions intended to hedge our interest rate risk with respect to borrowings made
24
to acquire or carry real estate assets generally will not constitute gross income for purposes of the two gross income tests applicable to REITs, so long as we clearly identify any such transactions as hedges for tax purposes before the close of the day on which they are acquired or entered into and we satisfy other identification requirements. In addition, any income from other hedging transactions would generally not constitute gross income for purposes of both the gross income tests. Accordingly, we may have to limit the use of hedging techniques that might otherwise be advantageous, which could result in greater risks associated with interest rate or other changes than we would otherwise incur.
Legislative or regulatory action could adversely affect you.
Changes to the tax laws are likely to occur, and these changes may adversely affect the taxation of our stockholders. Any such changes could have an adverse effect on an investment in our shares or on the market value or the resale potential of our assets. Future legislation might result in a REIT having fewer tax advantages, and it could become more advantageous for a company that invests in real estate to elect to be taxed, for federal income tax purposes, as a corporation. As a result, our charter provides our board of directors with the power, under certain circumstances, to revoke or otherwise terminate our REIT election and cause us to be taxed as a corporation, without the vote of our stockholders. Our board of directors has fiduciary duties to us and our stockholders and could only cause changes in our tax treatment if it determines in good faith that such changes are in the best interest of our stockholders. You are urged to consult with your own tax advisor with respect to the status of legislative, regulatory or administrative developments and proposals and their potential effect on an investment in our stock.
The taxation of dividends may adversely affect the value of our stock.
The maximum tax rate applicable to “qualified dividend income” payable to U.S. stockholders that are taxed at individual rates is 20%. Dividends payable by REITs, however, are generally not eligible for the reduced rates on qualified dividend income. The more favorable rates applicable to regular corporate qualified dividends could cause investors who are taxed at individual rates to perceive investments in REITs to be relatively less attractive than investments in the stocks of non-REIT corporations that pay dividends, which could adversely affect the value of the shares of REITs, including our stock.
None.
We own interests in retail, lodging, office, industrial, and multi-family properties. As of
December 31, 2012
, we, directly or indirectly, including through joint ventures in which we have a controlling interest, owned an interest in 706 properties, excluding our lodging and development properties, located in 38 states and the District of Columbia. In addition, we, through our wholly-owned subsidiaries, Inland American Winston Hotels, Inc., Inland American Orchard Hotels, Inc., Inland American Urban Hotels, Inc., and Inland American Lodging Corporation, own 88 lodging properties in 27 states and the District of Columbia. (Dollar amounts stated in thousands, except for revenue per available room, average daily rate and average rent per square foot).
General
The following table sets forth information regarding the ten largest individual tenants in descending order based on annualized rent paid in 2012 but excluding our lodging, multi-family, and development properties. Annualized rent is computed as revenue for the last month of the period multiplied by twelve months. Average rent per square foot is computed as annualized rent divided by the total occupied square footage at the end of the period. Annualized rent includes rent abatements, lease inducements and straight-line rent GAAP adjustments. Physical occupancy is defined as the percentage of total gross leasable area actually used or occupied by a tenant. Economic occupancy is defined as the percentage of total gross leasable area for which a tenant is obligated to pay rent under the terms of its lease agreement, regardless of the actual use or occupation by that tenant of the area being leased.
25
|
Tenant Name
|
Type
|
2012
Annualized Rental
Income ($)
|
% of Total
Income
|
Square
Footage
|
% of Total
Square
Footage
|
||||||||
|
SunTrust Banks, Inc.
|
Retail / Office
|
55,085
|
|
10.19
|
%
|
2,234,163
|
|
5.21
|
%
|
||||
|
AT&T, Inc.
|
Office
|
44,327
|
|
8.20
|
%
|
3,404,451
|
|
7.93
|
%
|
||||
|
Sanofi-Aventis
|
Office
|
18,034
|
|
3.34
|
%
|
736,572
|
|
1.72
|
%
|
||||
|
United Healthcare Services
|
Office
|
17,532
|
|
3.24
|
%
|
1,210,670
|
|
2.82
|
%
|
||||
|
C&S Wholesalers
|
Industrial
|
15,998
|
|
2.96
|
%
|
3,031,295
|
|
7.06
|
%
|
||||
|
Atlas Cold Storage
|
Industrial
|
14,342
|
|
2.65
|
%
|
1,896,815
|
|
4.42
|
%
|
||||
|
Stop N Shop
|
Retail
|
10,604
|
|
1.96
|
%
|
601,652
|
|
1.40
|
%
|
||||
|
The Geo Group, Inc.
|
Industrial
|
9,850
|
|
1.82
|
%
|
301,029
|
|
0.70
|
%
|
||||
|
Best Buy
|
Retail
|
9,033
|
|
1.67
|
%
|
641,839
|
|
1.50
|
%
|
||||
|
Ross Dress for Less
|
Retail
|
8,717
|
|
1.61
|
%
|
831,741
|
|
1.94
|
%
|
||||
The following sections set forth certain summary information about the character of the properties that we owned at
December 31, 2012
. Certain of the Company’s properties are encumbered by mortgages, totaling
$5,894,443
. Additional detail about the properties can be found on Schedule III – Real Estate and Accumulated Depreciation.
Retail Segment
As of
December 31, 2012
, our retail segment consisted of 585 properties. Our retail segment is centered on 150 multi-tenant properties with an average of approximately 135,000 square feet of total space, located in stable communities, primarily in the southwest and southeast regions of the country. Our retail tenants are largely necessity-based retailers such as grocery and pharmacy, as well as moderate-fashion shoes and clothing retailers, and services such as banking. We own the following types of retail centers:
|
•
|
The majority of our single tenant retail properties are bank branches operated by SunTrust Banks, Inc. The bank branches typically offer a wide range of face-to-face or automated banking services to their customers and are often located on corners or out parcels. Typically, these tenants pay rents with contractual increases over time and bear virtually all expenses associated with operating the facility.
|
|
•
|
Community or neighborhood centers are generally open air and designed for tenants that offer a larger array of apparel and other soft goods. Typically, these centers contain anchor stores and other national retail tenants. Our neighborhood shopping centers are generally in-line strip centers with a grocery store anchor, a drugstore, and other small retailers. Tenants of these centers typically offer necessity-based products.
|
|
•
|
Power centers consist of several anchors, such as department stores, off-price stores, warehouse clubs or stores that offer a large selection of merchandise. Typically, the number of specialty tenants is limited.
|
We have not experienced bankruptcies or receivable write-offs in our retail portfolio that have materially impacted our result of operations. Our multi-tenant retail business is not highly dependent on specific retailers or specific retail industries, which we believe shields the portfolio from significant revenue variances over time.
The following table reflects the types of properties within our retail segment as of
December 31, 2012
.
|
Retail Properties
|
Number of
Properties
|
Total Gross
Leasable
Area (Sq.Ft.)
|
% of
Economic
Occupancy
as of
December 31,
2012
|
Total # of
Financially
Active Leases
as of
December 31,
2012
|
Sum of
Annualized
Rent ($)
|
Average Rent
PSF ($)
|
|||||||||||
|
Bank Branch
|
435
|
|
2,351,816
|
|
99
|
%
|
434
|
|
58,045
|
|
24.98
|
|
|||||
|
Community & Neighborhood Center
|
101
|
|
9,762,429
|
|
92
|
%
|
1,311
|
|
129,034
|
|
14.22
|
|
|||||
|
Power Center
|
49
|
|
10,150,058
|
|
92
|
%
|
1,006
|
|
122,453
|
|
13.17
|
|
|||||
|
585
|
|
22,264,303
|
|
93
|
%
|
2,751
|
|
309,532
|
|
14.95
|
|
||||||
26
The following table represents lease expirations for the retail segment:
|
Lease Expiration Year
|
Number of Expiring Leases
|
GLA of Expiring Leases (Sq. Ft.)
|
Annualized Rent of Expiring Leases ($000)
|
Percent of Total GLA
|
Percent of Total Annualized Rent
|
Expiring Rent/ Square Foot ($)
|
|||||||||||
|
2013
|
416
|
|
1,290,146
|
|
20,563
|
|
6.2
|
%
|
6.6
|
%
|
15.94
|
|
|||||
|
2014
|
327
|
|
2,083,316
|
|
29,716
|
|
10.1
|
%
|
9.6
|
%
|
14.26
|
|
|||||
|
2015
|
359
|
|
2,385,015
|
|
29,927
|
|
11.5
|
%
|
9.7
|
%
|
12.55
|
|
|||||
|
2016
|
320
|
|
1,932,328
|
|
27,408
|
|
9.3
|
%
|
8.8
|
%
|
14.18
|
|
|||||
|
2017
|
625
|
|
3,225,891
|
|
67,818
|
|
15.6
|
%
|
21.9
|
%
|
21.02
|
|
|||||
|
2018
|
289
|
|
2,214,786
|
|
38,989
|
|
10.7
|
%
|
12.6
|
%
|
17.60
|
|
|||||
|
2019
|
87
|
|
1,439,213
|
|
17,490
|
|
7.0
|
%
|
5.6
|
%
|
12.15
|
|
|||||
|
2020
|
64
|
|
996,004
|
|
13,782
|
|
4.8
|
%
|
4.4
|
%
|
13.84
|
|
|||||
|
2021
|
64
|
|
681,484
|
|
9,955
|
|
3.3
|
%
|
3.2
|
%
|
14.61
|
|
|||||
|
2022
|
61
|
|
865,229
|
|
12,107
|
|
4.2
|
%
|
3.9
|
%
|
13.99
|
|
|||||
|
Thereafter
|
139
|
|
3,584,419
|
|
42,499
|
|
17.3
|
%
|
13.7
|
%
|
11.86
|
|
|||||
|
|
2,751
|
|
20,697,831
|
|
310,254
|
|
100
|
%
|
100
|
%
|
14.99
|
|
|||||
We have staggered our lease expirations so that we can manage lease rollover. The percentage of leases expiring each year over the next ten years, as a percentage of annualized rent, averages approximately 9%. In 2017 and 2018, the percentage of leases expiring is higher than average. Of the leases expiring in 2017 and 2018, 52% and 44%, respectively, relate to our large portfolio of bank branches. We believe this is a manageable percentage of lease rollover.
Lodging Segment
Lodging facilities have characteristics different from those found in office, retail, industrial, and multi-family properties. Revenue, operating expenses, and net income of lodging properties are directly tied to the daily hotel sales operation whereas these other asset classes generate revenue from medium to long-term lease contracts. We believe lodging facilities have the benefit of capturing increased revenue opportunities on a daily or weekly basis but are also subject to immediate decreases in lodging revenue as a result of declines in daily rental rates and/or daily occupancy when demand is reduced. Due to seasonality, we expect our lodging revenues to be greater during the second and third quarters with lower revenues in the first and fourth quarters.
We follow two practices common for REITs that own lodging properties: 1) association with national franchise organizations and 2) management of the properties by third-party hotel managers. We have aligned our portfolio with what we believe are the top franchise enterprises in the lodging industry: Marriott, Hilton, Intercontinental, Hyatt, Wyndham, Fairmont and Starwood Hotels. By entering into franchise agreements with these organizations, we believe our lodging operations benefit from enhanced advertising, marketing, and sales programs through the franchisor (in this case, the organization) while the franchisee (in this case, us) pays only a fraction of the overall cost for these programs. We believe effective TV, radio, print, on-line, and other forms of advertisement are necessary to draw customers to our lodging facilities, thus, creating higher occupancy and rental rates, and increased revenue. Additionally, by using the franchise system we are also able to benefit from the frequent traveler rewards programs or “point awards” systems of the franchisor which we believe further bolsters occupancy and overall daily rental rates.
The majority of our lodging facilities and these franchise enterprises are classified in the “upscale” or “upper-upscale” lodging categories. The classifications are defined by Smith Travel Research, an independent provider of lodging industry statistical data. The classification of a property is based on lodging industry standards, which take into consideration many factors such as guest facilities and amenities, level of service and quality of accommodations.
27
The following table reflects the types of properties within our lodging segment as of
December 31, 2012
.
|
Lodging Properties
|
Number
of
Properties
|
Number of
Rooms
|
Average
Occupancy for
the Year ended
December 31,
2012
|
Average Revenue Per
Available Room for
the Year ended
December 31, 2012 ($)
|
Average Daily
Rate for the
Year 2012 ($)
|
|||||||||
|
Luxury
|
1
|
|
545
|
|
61
|
%
|
94
|
|
153
|
|
||||
|
Upper-Upscale
|
18
|
|
5,968
|
|
70
|
%
|
102
|
|
145
|
|
||||
|
Upscale
|
62
|
|
8,888
|
|
75
|
%
|
93
|
|
125
|
|
||||
|
Upper-Midscale
|
7
|
|
944
|
|
73
|
%
|
86
|
|
119
|
|
||||
|
88
|
|
16,345
|
|
73
|
%
|
95
|
|
132
|
|
|||||
Office Segment
Our investments in office properties largely represent assets leased to and occupied by either a diverse group of tenants or to a single tenant that fully occupies the leased space. Examples of our multi-tenant properties include Dulles Executive Plaza and Worldgate Plaza, both located in metropolitan Washington D.C., with space leased to high-technology companies and federal government contractors. Examples of our single tenant properties include three buildings leased and occupied by AT&T and located in three distinct US office markets—Chicago, Illinois, St. Louis, Missouri, and Cleveland, Ohio. In addition, our single tenant office portfolio includes bank offices leased on a net basis to SunTrust Banks, Inc., with locations in the east and southeast regions of the country.
The following table reflects the types of properties within our office segment as of
December 31, 2012
.
|
Office Properties
|
Number
of
Properties
|
Total Gross
Leasable Area
(Sq. Ft.)
|
% of Economic
Occupancy as of
December 31, 2012
|
Total # of
Financially
Active Leases as
of December 31, 2012
|
Sum of
Annualized
Rent ($)
|
Average Rent
PSF ($)
|
|||||||||||
|
Single-Tenant
|
31
|
|
7,416,539
|
|
95
|
%
|
30
|
|
98,023
|
|
13.22
|
|
|||||
|
Multi-Tenant
|
11
|
|
2,809,961
|
|
88
|
%
|
235
|
|
48,234
|
|
17.17
|
|
|||||
|
42
|
|
10,226,500
|
|
93
|
%
|
265
|
|
146,257
|
|
14.30
|
|
||||||
28
The following table represents lease expirations for the office segment:
|
Lease Expiration Year
|
Number of
Expiring Leases
|
GLA of Expiring
Leases (Sq. Ft.)
|
Annualized
Rent of Expiring
Leases ($)
|
Percent of
Total GLA
|
Percent of Total Annualized Rent
|
Expiring
Rent/Square
Foot ($)
|
|||||||||||
|
2013
|
39
|
|
603,670
|
|
9,010
|
|
6.4
|
%
|
6.1
|
%
|
14.93
|
|
|||||
|
2014
|
47
|
|
165,344
|
|
2,513
|
|
1.7
|
%
|
1.7
|
%
|
15.20
|
|
|||||
|
2015
|
46
|
|
400,062
|
|
7,261
|
|
4.2
|
%
|
4.9
|
%
|
18.15
|
|
|||||
|
2016
|
37
|
|
2,563,098
|
|
39,216
|
|
27.0
|
%
|
26.7
|
%
|
15.30
|
|
|||||
|
2017
|
25
|
|
1,858,187
|
|
23,430
|
|
19.6
|
%
|
16.0
|
%
|
12.61
|
|
|||||
|
2018
|
23
|
|
519,760
|
|
11,082
|
|
5.5
|
%
|
7.5
|
%
|
21.32
|
|
|||||
|
2019
|
10
|
|
753,210
|
|
9,894
|
|
7.9
|
%
|
6.7
|
%
|
13.14
|
|
|||||
|
2020
|
5
|
|
425,102
|
|
3,971
|
|
4.5
|
%
|
2.7
|
%
|
9.34
|
|
|||||
|
2021
|
12
|
|
1,310,978
|
|
19,343
|
|
13.8
|
%
|
13.2
|
%
|
14.75
|
|
|||||
|
2022
|
6
|
|
100,669
|
|
2,178
|
|
1.1
|
%
|
1.5
|
%
|
21.63
|
|
|||||
|
Thereafter
|
15
|
|
786,817
|
|
18,964
|
|
8.3
|
%
|
12.9
|
%
|
24.10
|
|
|||||
|
|
265
|
|
9,486,897
|
|
146,861
|
|
100
|
%
|
100
|
%
|
15.48
|
|
|||||
The percentage of leases expiring each year over the next ten years, as a percentage of annualized rent, averages approximately 9%. In 2016 and 2017, 61% and 69%, respectively, of the lease expirations relate to two properties leased by AT&T. In 2016, the lease expires for a property with approximately 1.7 million square feet, occupied by AT&T in Hoffman Estates, Illinois, which is in the greater metro Chicago market. In 2017, the lease expires for a property with approximately 1.5 million square feet, occupied by AT&T in St. Louis, Missouri. We believe this is a manageable percentage of lease rollover.
Industrial Segment
Our industrial segment is comprised of four types of properties: distribution centers, specialty distribution centers, charter schools, and correctional facilities. Our distribution centers are warehouses or other specialized buildings which stock products to be distributed to retailers, wholesalers or directly to consumers. Some properties are located in what we believe are active and sought-after industrial markets, such as the O’Hare airport market of Chicago, Illinois. The specialty distribution centers consist of refrigeration or air conditioned buildings which supply grocery stores in various locations across the country. The charter schools and correctional facilities consist of ten properties under long-term triple net leases.
The following table reflects the types of properties within our industrial segment as of
December 31, 2012
.
|
Industrial Properties
|
Number
of
Properties
|
Total Gross
Leasable Area
(Sq. Ft.)
|
% of Economic
Occupancy as of
December 31,
2012
|
Total # of
Financially
Active Leases as of
December 31,
2012
|
Sum of
Annualized
Rent ($)
|
Average Rent
PSF ($)
|
|||||||||||
|
Distribution Center
|
32
|
|
10,385,577
|
|
96
|
%
|
35
|
|
48,914
|
|
4.71
|
|
|||||
|
Specialty Distribution Center
|
11
|
|
1,896,815
|
|
100
|
%
|
11
|
|
14,342
|
|
7.56
|
|
|||||
|
Charter Schools
|
8
|
|
321,710
|
|
100
|
%
|
8
|
|
6,940
|
|
21.57
|
|
|||||
|
Correctional Facilities
|
2
|
|
457,345
|
|
100
|
%
|
2
|
|
11,995
|
|
26.23
|
|
|||||
|
53
|
|
13,061,447
|
|
97
|
%
|
56
|
|
82,191
|
|
6.48
|
|
||||||
29
The following table represents lease expirations for the industrial segment:
|
Lease Expiration Year
|
Number of
Expiring Leases
|
GLA of Expiring
Leases (Sq. Ft.)
|
Annualized
Rent of Expiring
Leases ($)
|
Percent of
Total GLA
|
Percent of Total
Annualized Rent
|
Expiring
Rent/Square
Foot ($)
|
|||||||||||
|
2013
|
5
|
|
747,458
|
|
4,651
|
|
5.9
|
%
|
5.7
|
%
|
6.22
|
|
|||||
|
2014
|
4
|
|
454,423
|
|
2,563
|
|
3.6
|
%
|
3.1
|
%
|
5.64
|
|
|||||
|
2015
|
4
|
|
885,506
|
|
3,749
|
|
7.0
|
%
|
4.6
|
%
|
4.23
|
|
|||||
|
2016
|
4
|
|
1,367,801
|
|
4,877
|
|
10.8
|
%
|
6.0
|
%
|
3.57
|
|
|||||
|
2017
|
4
|
|
888,749
|
|
5,162
|
|
7.0
|
%
|
6.3
|
%
|
5.81
|
|
|||||
|
2018
|
1
|
|
175,052
|
|
646
|
|
1.4
|
%
|
0.8
|
%
|
3.69
|
|
|||||
|
2019
|
1
|
|
43,500
|
|
130
|
|
0.3
|
%
|
0.2
|
%
|
2.99
|
|
|||||
|
2020
|
1
|
|
301,029
|
|
9,850
|
|
2.4
|
%
|
12.1
|
%
|
32.72
|
|
|||||
|
2021
|
4
|
|
1,049,486
|
|
5,849
|
|
8.3
|
%
|
7.2
|
%
|
5.57
|
|
|||||
|
2022
|
8
|
|
2,402,681
|
|
15,253
|
|
19.0
|
%
|
18.7
|
%
|
6.35
|
|
|||||
|
Thereafter
|
20
|
|
4,361,306
|
|
28,972
|
|
34.4
|
%
|
35.5
|
%
|
6.64
|
|
|||||
|
|
56
|
|
12,676,991
|
|
81,701
|
|
100
|
%
|
100
|
%
|
6.44
|
|
|||||
The percentage of leases expiring each year over the next ten years, as a percentage of annualized rent, averages approximately 7%. We believe this is a manageable percentage of lease rollover.
Multi-family Segment
Our multi-family portfolio consists of conventional apartments and student housing. Our conventional apartment properties are upscale with resident amenities such as business centers, fitness centers, swimming pools, landscaped grounds and clubhouse facilities. The apartment buildings are typically three-story walk-up buildings offering one, two and three bedroom apartments and are leased on per unit basis.
Our student housing portfolio consists of residential and mixed-use communities close to university campuses and in urban infill locations. The student housing properties are high-end properties with amenities such as fitness centers, swimming pools, multimedia lounges, and sports courts. Most of the properties are marketed under the "University House" brand. We are increasing the size of our student housing portfolio through acquisitions and developments. In 2012, we acquired two properties and placed-in-service two properties. The properties are leased on a per bed basis rather than per unit.
The following table reflects the types of properties within our multi-family segment as of
December 31, 2012
.
|
Multi-family Properties
|
Number
of
Properties
|
Total Units / Beds
|
% of Economic
Occupancy as of
December 31,
2012
|
Total #
of Units/
Beds
Occupied
|
Rent
per
Unit/
Bed ($)
|
||||
|
Conventional (units)
|
17
|
5,311
|
90%
|
4,776
|
$992
|
||||
|
Student Housing (beds)
|
9
|
5,212
|
94%
|
4,887
|
$680
|
||||
|
26
|
|
|
|||||||
As previously disclosed, the SEC is conducting a non-public, formal, fact-finding investigation to determine whether there have been violations of certain provisions of the federal securities laws regarding our business manager fees, property management fees, transactions with our affiliates, timing and amount of distributions paid to our investors, determination of property impairments, and any decision regarding whether we might become a self-administered REIT. We have not been accused of any wrongdoing by the SEC. We also have been informed by the SEC that the existence of this investigation does not mean that the SEC has concluded that anyone has broken the law or that the SEC has a negative opinion of any person, entity, or security. We have been cooperating fully with the SEC.
We cannot reasonably estimate the timing of the investigation, nor can we predict whether or not the investigation might have a
material adverse effect on our business.
30
Inland American Business Manager & Advisor, Inc. has offered to reduce its business management fee in an aggregate amount necessary to reimburse the Company for any costs, fees, fines or assessments, if any, which may result from the SEC investigation, other than legal fees incurred by the Company, or fees and costs otherwise covered by insurance. The business manager also offered to waive its reimbursement of legal fees or costs that the business manager incurs in connection with the SEC investigation. On May 4, 2012, Inland American Business Manager & Advisor, Inc. forwarded a letter to the Company that memorializes this arrangement.
A copy of Inland American Business Manager & Advisor, Inc.’s letter to the Company regarding these items was filed on May 7, 2012 with our Quarterly Report on Form 10-Q as of March 31, 2012 and is filed herewith as Exhibit 10.10.
We have also received two related demands by stockholders to conduct investigations regarding claims that the officers, the board of directors, the business manager, and the affiliates of the business manager (the "Inland American Parties")breached their fiduciary duties to us in connection with the matters that we disclosed are subject to the SEC investigation. The first demand claims that the Inland American Parties (i) falsely reported the value of our common stock until September 2010; (ii) caused us to purchase shares of our common stock from stockholders at prices in excess of their value; and (iii) disguised returns of capital paid to stockholders as REIT income resulting in the payment of fees to the business manager for which it was not entitled. The three stockholders in that demand contend that legal proceedings should seek recovery of damages in an unspecified amount allegedly sustained by us. The second demand by another shareholder makes similar claims and further alleges that the Inland American Parties (i) caused us to engage in transactions that unduly favored related parties, (ii) falsely disclosed the timing and amount of distributions, and (iii) falsely disclosed whether we might become a self-administered REIT. There has been no lawsuit filed, however, with regard to these matters.
The full Board of Directors has responded by authorizing the independent directors to investigate the claims contained in the demand letters, as well as any other matters the independent directors see fit to investigate, including matters related to the SEC investigation. Pursuant to this authority, the independent directors have formed a special litigation committee that is comprised solely of independent directors to review and evaluate the matters referred by the full Board to the independent directors, and to recommend to the full Board any further action as is appropriate. The special litigation committee intends to investigate these claims with the assistance of independent legal counsel and will make a recommendation to the Board of Directors after the committee has completed its investigation.
Not applicable.
Market Information
We published an estimated per share value of our common stock to assist broker dealers that sold our common stock in our initial and follow-on “best efforts” offerings to comply with the rules published by the Financial Industry Regulatory Authority (“FINRA”). On December 19, 2012, we announced an estimated value of our common stock equal to $6.93 per share.
To estimate our per share value, our Business Manager relied this year solely on the net asset valuation method. Our Business Manager began its analysis by estimating the value of the Company's real properties using a discounted cash flow of projected net operating income less capital expenditures for each property, for the ten-year period ending December 31, 2022. In this analysis, the Business Manager used a range of discount rates and exit capitalization rates for similar property types and that the Business Manager believed fell within ranges that would be used by similar investors to value the Company's real properties. The Business Manager then applied a sensitivity analysis to create a range of values and recommended a share value number within that range, based upon a variety of facts and assumptions related to, among other things, the nature of our operations, the markets in which our properties are located, and the general economic conditions in the United States. External factors relied upon by our Business Manager to recommend a share price above the mid-point of the net asset valuation range included trends showing declines in capitalization rates in retail and industrial segments, as well as the overall improving economic conditions relative to real estate. Our Business Manager tempered its share price calculation, however, based on uncertainties in the overall economy, including the fiscal cliff and current debt crisis.
31
To arrive at the total asset value, the Business Manager added the value of other assets and investments, such as cash, marketable securities, joint ventures and land held for developments, to the value of the real properties described above. From total asset value, the Business Manager then subtracted the total fair value of the Company's debt. This value was then divided by the number of shares outstanding as of December 1, 2012 to arrive at a per share estimated value.
The Business Manager believes that the net asset value method used to estimate the per share value of our common stock and our assets and liabilities is the most commonly used valuation methodology for a non-listed REIT. The value of our real estate assets reflects an overall decline from original purchase price plus post-acquisition capital investments of 14%. We believe that the assumptions used to estimate value are within the ranges used by sellers of similar properties including joint venture and development assets. The estimated value may not, however, represent current market values or fair values as determined in accordance with U.S. generally accepted accounting principles (or “GAAP”). Real properties are currently carried at their amortized cost basis in the Company's financial statements. The estimated value of our real estate assets did not necessarily represent the value we would receive or accept if the assets were marketed for sale. The market for commercial real estate can fluctuate and values are expected to change in the future. Further, the estimated per share value of the Company's common stock does not reflect a liquidity discount for the fact that the shares are not currently traded on a national securities exchange, a discount for the non-assumability or prepayment obligations associated with certain of the Company's loans and other costs that may be incurred, including any costs of sale of its assets.
As with any methodology used to estimate value, the methodology employed by our Business Manager was based upon a number of estimates and assumptions that may not be accurate or complete. Further, different parties using different assumptions and estimates could derive a different estimated value per share, which could be significantly different from our estimated value per share. The estimated per share value established by us represents neither the fair value according to GAAP of our assets less liabilities, nor the amount that our shares would trade at on a national securities exchange or the amount a stockholder would obtain if he or she tried to sell his or her shares or if we liquidated our assets and distributed the proceeds after paying all of our expenses and liabilities. Accordingly, with respect to the estimated value per share, we can give no assurance that:
|
•
|
a stockholder would be able to resell his or her shares at this estimated value;
|
|
•
|
a stockholder would ultimately realize distributions per share equal to our estimated value per share upon liquidation of our assets and settlement of our liabilities or a sale of the Company;
|
|
•
|
our shares would trade at a price equal to or greater than the estimated value per share if we listed them on a national securities exchange; or
|
|
•
|
the methodology used to estimate our value per share would be acceptable to FINRA or that the estimated value per share will satisfy the applicable annual valuation requirements under the Employee Retirement Income Security Act of 1974, as amended (“ERISA”) and the Internal Revenue Code of 1986, as amended (the “Code”) with respect to employee benefit plans subject to ERISA and other retirement plans or accounts subject to Section 4975 of the Code.
|
The estimated value per share was accepted by our board on December 18, 2012 and reflects the fact that the estimate was calculated at a moment in time. The value of our shares will likely change over time and will be influenced by changes to the value of our individual assets as well as changes and developments in the real estate and capital markets. We currently expect to update our estimated value per share no later than December 31, 2013. Nevertheless, stockholders should not rely on the estimated value per share in making a decision to buy or sell shares of our common stock.
Share Repurchase Program
Our board of directors adopted a share repurchase program, which became effective August 31, 2005 and was suspended as of March 30, 2009. Our board later adopted an Amended and Restated Share Repurchase Program, which was effective from April 11, 2011 through January 31, 2012. Our board subsequently adopted a Second Amended and Restated Share Repurchase Program, which became effective as of February 1, 2012 (the “Second Amended Program”).
Under the Second Amended Program, we may repurchase shares of our common stock, on a quarterly basis, from the beneficiary of a stockholder that has died or from stockholders that have a “qualifying disability” or are confined to a “long-term care facility” (together, referred to herein as “hardship repurchases”). We are authorized to repurchase shares at a price per share equal to 100% of the most recently disclosed estimated per share value of our common stock, which currently is equal to
32
$6.93 per share. Our obligation to repurchase any shares under the Second Amended Program is conditioned upon our having sufficient funds available to complete the repurchase. Our board has initially reserved $10.0 million per calendar quarter for the purpose of funding repurchases associated with death and $15.0 million per calendar quarter for the purpose of funding hardship repurchases. In addition, notwithstanding anything to the contrary, at no time during any consecutive twelve month period may the aggregate number of shares repurchased under the Second Amended Program exceed 5.0% of the aggregate number of issued and outstanding shares of our common stock at the beginning of the twelve month period. For any calendar quarter, if the number of shares accepted for repurchase would cause us to exceed the 5.0% limit, repurchases for death will take priority over any hardship repurchases, in each case in accordance with the procedures, and subject to the funding limits, described in the Second Amended Program and summarized herein.
If, on the other hand, the funds reserved for either category of repurchase under the Second Amended Program are insufficient to repurchase all of the shares for which repurchase requests have been received for a particular quarter, or if the number of shares accepted for repurchase would cause us to exceed the 5.0% limit, we will repurchase the shares in the following order:
|
•
|
for death repurchases, we will repurchase shares in chronological order, based upon the beneficial owner’s date of death; and
|
|
•
|
for hardship repurchases, we will repurchase shares on a pro rata basis, up to, but not in excess of, the limits described herein; provided, that in the event that the repurchase would result in a stockholder owning less than 150 shares, we will repurchase all of that stockholder’s shares.
|
The Second Amended Program will immediately terminate if our shares are approved for listing on any national securities exchange. We may amend or modify any provision of the Second Amended Program, or reject any request for repurchase, at any time at our board’s sole discretion.
The table below outlines the shares of common stock we repurchased pursuant to the Second Amended Program during the three months ended
December 31, 2012
:
|
As of month ended,
|
Total Number of Share Requests (2)
|
Total Number of
Shares Repurchased (2)
|
Average
Price Paid
per Share
|
Total Number of
Shares Purchased
as Part of Publicly
Announced Plans
or Programs (1)
|
Maximum
Number of Shares
That May Yet be
Purchased Under the
Plans or Programs
|
|||||||||
|
October 2012 (3)
|
—
|
|
1,380,980
|
|
$
|
7.22
|
|
1,380,980
|
|
(1
|
)
|
|||
|
November 2012
|
—
|
|
—
|
|
N/A
|
|
—
|
|
(1
|
)
|
||||
|
December 2012 (4)
|
1,334,524
|
|
—
|
|
N/A
|
|
—
|
|
(1
|
)
|
||||
|
(1)
|
A description of the Second Amended Program, including the date that the program was amended, the dollar amount approved, the expiration date and the maximum number of shares that may be purchased thereunder is included in the narrative preceding this table.
|
|
(2)
|
Beginning in April 2012, shares were repurchased in the subsequent quarter that share requests were received.
|
|
(3)
|
There were
1,380,980
share requests outstanding as of the month ended September 30, 2012, which were repurchased in October 2013 at a price of $7.22 per share.
|
|
(4)
|
All share requests outstanding as of the month ended December 31, 2012 were repurchased in January 2013 at a price of $6.93 per share.
|
Stockholders
As of March 1, 2013, we had 185,430 stockholders of record.
Distributions
We have been paying monthly cash distributions since October 2005. During the years ended
December 31, 2012 and 2011
, we declared cash distributions, which are paid monthly in arrears to stockholders, totaling
$440.0 million
and $429.6 million, respectively, in each case equal to $0.50 per share on an annualized basis. During the years ended
December 31, 2012 and 2011
, we paid cash distributions of
$439.2 million
and
$428.7 million
, respectively. For Federal income tax purposes for the years ended
December 31, 2012 and 2011
, 87% and 62% of the distributions paid constituted a return of capital in the applicable year.
33
We intend to continue paying regular monthly cash distributions to our stockholders. However, there are many factors that can affect the amount and timing of cash distributions to stockholders. There is no assurance that we will be able to continue paying distributions at the current level or that the amount of distributions will increase, or not decrease further, over time. Even if we are able to continue paying distributions, the actual amount and timing of distributions is determined by our board of directors in its discretion and typically depends on the amount of funds available for distribution, which depends on items such as current and projected cash requirements and tax considerations. As a result, our distribution rate and payment frequency may vary from time to time.
Notification Regarding Payments of Distributions
Shareholders should be aware that the method by which a shareholder has chosen to receive his or her distributions affects the timing of the shareholder's receipt of those distributions. Specifically, under our transfer agent's payment processing procedures, distributions are paid in the following manner:
(1) those shareholders who have chosen to receive their distributions via ACH wire transfers receive their distributions on the distribution payment date (as determined by our Board of Directors);
(2) those shareholders who have chosen to receive their distributions by paper check are typically mailed those checks on the distribution payment date, but sometimes paper checks are mailed on the day following the distribution payment date; and
(3) for those shareholders holding shares through a broker or other nominee, the distributions payments are wired, or paper checks are mailed, to the broker or other nominee on the day following the distribution payment date.
All shareholders who hold shares directly in record name may change at any time the method through which they receive their distributions from our transfer agent, and those shareholders will not have to pay any fees to us or our transfer agent to make such a change. Also, all shareholders are eligible to participate at no cost in our DRP. Accordingly, each shareholder may select the timing of receipt of distributions from our transfer agent by selecting the method above that corresponds to the desired timing for receipt of the distributions. Because all shareholders may elect to have their distributions sent via ACH wire on the distribution payment date or credited on the distribution payment date to their DRP, we will treat all of our shareholders, regardless of the method by which they have chosen to receive their distributions, as having constructively received their distributions from us on the distribution payment date for federal income tax purposes.
Shareholders who hold shares directly in record name and who would like to change their distribution payment method should complete a “Change of Distribution Election Form.” Also, shareholders who would like to participate in our DRP should complete the “Change of Distribution Election Form.” The form is available on our website under “Investor Relations-Forms.”
We note that the payment method for shareholders who hold shares through a broker or nominee is determined by the broker or nominee. Similarly, the payment method for shareholders who hold shares in a tax-deferred account, such as an IRA, is generally determined by the custodian for the account. Shareholders that currently hold shares through a broker or other nominee and would like to receive distributions via ACH wire or paper check should contact their broker or other nominee regarding their processes for transferring shares to record name ownership. Similarly, shareholders who hold shares in a tax deferred account may need to hold shares outside of their tax-deferred accounts to change the method through which they receive their distributions. Shareholders who hold shares through a tax-deferred account and who would like to change the method through which they receive their distributions should contact their custodians regarding the transfer process and should consult their tax advisor regarding the consequences of transferring shares outside of a tax-deferred account.
34
Securities Authorized for Issuance under Equity Compensation Plans
The following table provides information regarding our equity compensation plans as of
December 31, 2012
.
Equity Compensation Plan Information
|
Plan category
|
Number of securities to
be issued upon
exercise of outstanding
options,
warrants and rights (a)
|
Weighted-average
exercise price of
outstanding options,
warrants
and rights
|
Number of securities
remaining available for
future issuance under
equity compensation
plans (excluding
shares reflected in
column (a))
|
||||||
|
Equity compensation plans approved by security holders:
|
|||||||||
|
Independent Director Stock Option Plan
|
29,000
|
|
$
|
8.87
|
|
46,000
|
|
||
|
Equity compensation plans not approved by security holders
|
—
|
|
$
|
—
|
|
—
|
|
||
|
Total:
|
29,000
|
|
$
|
8.87
|
|
46,000
|
|
||
We have adopted an Independent Director Stock Option Plan, as amended, which, subject to certain conditions, provides for the grant to each independent director of an option to purchase 3,000 shares following their becoming a director and for the grant of additional options to purchase 500 shares on the date of each annual stockholder’s meeting. The options for the initial 3,000 shares are exercisable as follows: 1,000 shares on the date of grant and 1,000 shares on each of the first and second anniversaries of the date of grant. All other options are exercisable on the second anniversary of the date of grant. The exercise price for all options is equal to the fair value of our shares, as defined in the plan, on the date of each grant.
Recent Sales of Unregistered Securities
None.
The following table shows our consolidated selected financial data relating to our consolidated historical financial condition and results of operations. Such selected data should be read in conjunction with Item 7, “Management’s Discussion and Analysis of Financial Condition and Results of Operations” and the consolidated financial statements and related notes appearing elsewhere in this report (dollar amounts are stated in thousands, except per share amounts).
35
|
|
As of and for the year ended December 31,
|
||||||||||||||||||
|
|
2012
|
2011
|
2010
|
2009
|
2008
|
||||||||||||||
|
Balance Sheet Data:
|
|||||||||||||||||||
|
Total assets
|
$
|
10,759,884
|
|
$
|
10,919,190
|
|
$
|
11,391,502
|
|
$
|
11,328,211
|
|
$
|
11,136,866
|
|
||||
|
Mortgages, notes and margins payable, net
|
$
|
6,006,146
|
|
$
|
5,902,712
|
|
$
|
5,532,057
|
|
$
|
5,085,899
|
|
$
|
4,437,997
|
|
||||
|
Operating Data:
|
|||||||||||||||||||
|
Total income
|
$
|
1,437,395
|
|
$
|
1,227,873
|
|
$
|
1,094,696
|
|
$
|
1,058,574
|
|
$
|
965,274
|
|
||||
|
Total interest and dividend income
|
$
|
23,386
|
|
$
|
22,860
|
|
$
|
33,068
|
|
$
|
55,161
|
|
$
|
77,997
|
|
||||
|
Net loss attributable to Company
|
$
|
(69,338
|
)
|
$
|
(316,253
|
)
|
$
|
(176,431
|
)
|
$
|
(397,960
|
)
|
$
|
(365,178
|
)
|
||||
|
Net loss per common share, basic and diluted
|
$
|
(0.08
|
)
|
$
|
(0.37
|
)
|
$
|
(0.21
|
)
|
$
|
(0.49
|
)
|
$
|
(0.54
|
)
|
||||
|
Common Stock Distributions:
|
|||||||||||||||||||
|
Distributions declared to common stockholders
|
$
|
440,031
|
|
$
|
429,599
|
|
$
|
417,885
|
|
$
|
405,337
|
|
$
|
418,694
|
|
||||
|
Distributions per weighted average common share
|
$
|
0.50
|
|
$
|
0.50
|
|
$
|
0.50
|
|
$
|
0.51
|
|
$
|
0.62
|
|
||||
|
Funds from Operations:
|
|||||||||||||||||||
|
Funds from operations (a)
|
$
|
476,714
|
|
$
|
443,459
|
|
$
|
321,828
|
|
$
|
142,601
|
|
$
|
140,064
|
|
||||
|
Cash Flow Data:
|
|||||||||||||||||||
|
Cash flows provided by operating activities
|
$
|
456,221
|
|
$
|
397,949
|
|
$
|
356,660
|
|
$
|
369,031
|
|
$
|
384,365
|
|
||||
|
Cash flows used in investing activities
|
$
|
(118,162
|
)
|
$
|
(286,896
|
)
|
$
|
(380,685
|
)
|
$
|
(563,163
|
)
|
$
|
(2,484,825
|
)
|
||||
|
Cash flows provided by (used in) financing activities
|
$
|
(335,443
|
)
|
$
|
(160,597
|
)
|
$
|
(208,759
|
)
|
$
|
(250,602
|
)
|
$
|
2,636,325
|
|
||||
|
Other Information:
|
|||||||||||||||||||
|
Weighted average number of common shares outstanding, basic and diluted
|
879,685,949
|
|
858,637,707
|
|
835,131,057
|
|
811,400,035
|
|
675,320,438
|
|
|||||||||
|
(a)
|
We consider
“Funds from Operations, or “FFO”
a widely accepted and appropriate measure of performance for a REIT. FFO provides a supplemental measure to compare our performance and operations to other REITs.
Due to certain unique operating characteristics of real estate companies, the National Association of Real Estate Investment Trusts or NAREIT, an industry trade group, has promulgated a standard known as FFO, which it believes reflects the operating performance of a REIT. As defined by NAREIT, FFO means net income computed in accordance with GAAP, excluding gains (or losses) from sales of property, plus depreciation and amortization and impairment charges on depreciable property and after adjustments for unconsolidated partnerships and joint ventures in which we hold an interest. In calculating FFO, impairment charges of depreciable real estate assets are added back even though the impairment charge may represent a permanent decline in value due to decreased operating performance of the applicable property. Further, because gains and losses from sales of property are excluded from FFO, it is consistent and appropriate that impairments, which are often early recognition of losses on prospective sales of property, also be excluded. If evidence exists that a loss reflected in the investment of an unconsolidated entity is due to the write-down of depreciable real estate assets, these impairment charges are added back to FFO. The methodology is consistent with the concept of excluding impairment charges of depreciable assets or early recognition of losses on sale of depreciable real estate assets held by the Company.
|
FFO is neither intended to be an alternative to “net income” nor to “cash flows from operating activities” as determined by GAAP as a measure of our capacity to pay distributions. We believe that FFO is a better measure of our properties’ operating performance because FFO excludes non-cash items from GAAP net income. FFO is calculated as follows (in thousands):
36
|
|
|
Year ended December 31,
|
||||||||||
|
|
|
2012
|
2011
|
2010
|
||||||||
|
Funds from Operations:
|
||||||||||||
|
Net loss attributable to Company
|
$
|
(69,338
|
)
|
$
|
(316,253
|
)
|
$
|
(176,431
|
)
|
|||
|
Add:
|
Depreciation and amortization related to investment properties
|
438,755
|
|
439,077
|
|
443,100
|
|
|||||
|
Depreciation and amortization related to investment in unconsolidated entities
|
48,840
|
|
63,645
|
|
43,845
|
|
||||||
|
Provision for asset impairment
|
77,348
|
|
28,967
|
|
—
|
|
||||||
|
Provision for asset impairment included in discontinued operations
|
5,968
|
|
134,673
|
|
47,529
|
|
||||||
|
Impairment of investment in unconsolidated entities
|
9,365
|
|
113,621
|
|
11,239
|
|
||||||
|
Impairment reflected in equity in earnings of unconsolidated entities
|
470
|
|
16,739
|
|
10,710
|
|
||||||
|
Gain on sale of property reflected in net income attributed to noncontrolling interest
|
5,439
|
|
—
|
|
—
|
|
||||||
|
Loss from sales of investment in unconsolidated entities
|
2,957
|
|
—
|
|
—
|
|
||||||
|
Less:
|
Gains from property sales and transfer of assets
|
40,691
|
|
16,510
|
|
55,412
|
|
|||||
|
Gains from property sales reflected in equity in earnings of unconsolidated entities
|
2,399
|
|
11,141
|
|
242
|
|
||||||
|
Gains from sales of investment in unconsolidated entities
|
—
|
|
7,545
|
|
—
|
|
||||||
|
Noncontrolling interest share of depreciation and amortization related to investment properties
|
—
|
|
1,814
|
|
2,510
|
|
||||||
|
Funds from operations
|
$
|
476,714
|
|
$
|
443,459
|
|
$
|
321,828
|
|
|||
Below is additional information related to certain items that significantly impact the comparability of our Funds from Operations and Net Loss or significant non-cash items from the periods presented (in thousands):
|
|
Year ended December 31,
|
||||||||||
|
|
2012
|
2011
|
2010
|
||||||||
|
Gain on conversion of note receivable to equity interest
|
$
|
—
|
|
$
|
(17,150
|
)
|
$
|
—
|
|
||
|
Payment from note receivable previously impaired
|
$
|
—
|
|
$
|
(2,422
|
)
|
$
|
—
|
|
||
|
Impairment of notes receivable
|
$
|
—
|
|
$
|
—
|
|
$
|
111,896
|
|
||
|
Impairment on securities
|
$
|
1,899
|
|
$
|
24,356
|
|
$
|
1,856
|
|
||
|
(Gain) loss on consolidation of an investment
|
$
|
—
|
|
$
|
—
|
|
$
|
(433
|
)
|
||
|
Straight-line rental income
|
$
|
(11,010
|
)
|
$
|
(13,841
|
)
|
$
|
(17,705
|
)
|
||
|
Amortization of above/below market leases
|
$
|
(2,271
|
)
|
$
|
(1,326
|
)
|
$
|
(433
|
)
|
||
|
Amortization of mark to market debt discounts
|
$
|
6,488
|
|
$
|
7,973
|
|
$
|
6,203
|
|
||
|
Gain on extinguishment of debt
|
$
|
(9,478
|
)
|
$
|
(10,848
|
)
|
$
|
(19,227
|
)
|
||
|
Gain on extinguishment of debt reflected in equity in earnings of unconsolidated entities
|
$
|
(2,176
|
)
|
$
|
—
|
|
$
|
—
|
|
||
|
Acquisition Costs
|
$
|
1,644
|
|
$
|
1,680
|
|
$
|
1,805
|
|
||
37
Certain statements in this “Management’s Discussion and Analysis of Financial Condition and Results of Operations” and elsewhere in this Form 10-K constitute “forward-looking statements” within the meaning of the Federal Private Securities Litigation Reform Act of 1995. Forward-looking statements are statements that are not historical, including statements regarding management’s intentions, beliefs, expectations, representations, plans or predictions of the future and are typically identified by words such as “believe,” “expect,” “anticipate,” “intend,” “estimate,” “may,” “will,” “should” and “could.” Similarly, statements that describe or contain information related to matters such as management’s intent, belief or expectation with respect to the Company’s financial performance, investment strategy and portfolio, cash flows, growth prospects, legal proceedings, amount and timing of anticipated future cash distributions, and other matters are forward-looking statements. These forward-looking statements are not historical facts but are the intent, belief or current expectations of the Company’s management based on their knowledge and understanding of the business and industry, the economy and other future conditions. These statements are not guarantees of future performance, and stockholders should not place undue reliance on forward-looking statements. Actual results may differ materially from those expressed or forecasted in the forward-looking statements due to a variety of risks, uncertainties and other factors, including but not limited to the factors listed and described under “Risk Factors” in this Annual Report on Form 10-K . These factors include, but are not limited to: market and economic volatility experienced by the U.S. economy or real estate industry as a whole, and the local economic conditions in the markets in which the Company’s properties are located; the Company’s ability to refinance maturing debt or to obtain new financing on attractive terms; the availability of cash flow from operating activities to fund distributions; future increases in interest rates; and actions or failures by the Company’s joint venture partners, including development partners. The Company intends that such forward-looking statements be subject to the safe harbors created by Section 27A of the Securities Act of 1933, as amended and Section 21E of the Securities Exchange Act of 1934, as amended. The Company undertakes no obligation to update or revise forward-looking statements to reflect changed assumptions, the occurrence of unanticipated events or changes to future operating results.
The following discussion and analysis relates to the years ended
December 31, 2012, 2011 and 2010
and as of
December 31, 2012 and 2011
. You should read the following discussion and analysis along with our consolidated financial statements and the related notes included in this report.
Overview
We continue to maintain a sustainable distribution rate funded by our operations. In 2012, we began disposing of assets we determined less strategic and reinvesting the capital in real estate assets that we believe will produce attractive current yields and long-term risk-adjusted returns to our stockholders. For our existing portfolio, our property managers for our non-lodging properties actively seek to lease space at favorable rates, control expenses, and maintain strong tenant relationships. We oversee the management of our lodging facilities through active engagement with our third party managers and franchisors to maximize occupancy and daily rates as well as control expenses.
On a consolidated basis, essentially all of our revenues and cash flows from operations for the year ended
December 31, 2012
were generated by collecting rental payments from our tenants, room revenues from lodging properties, distributions from unconsolidated entities and dividend income earned from investments in marketable securities. Our largest cash expense relates to the operation of our properties as well as the interest expense on our mortgages. Our property operating expenses include, but are not limited to, real estate taxes, regular repair and maintenance, management fees, utilities and insurance (some of which are recoverable). Our lodging operating expenses include, but are not limited to, rooms, food and beverage, utility, administrative and marketing, payroll, franchise and management fees and repairs and maintenance expenses.
In 2012, we saw total net operating income increase from
$678.5 million
to
$756.4 million
for the year ended December 31, 2011 to 2012. The increase of
$77.9 million
or
11.5%
was due to same store net operating income increase of approximately
3.0%
or
$19.7 million
, significantly resulting from our increased lodging and multi-family operating performance. The remainder of the increase is a result of a full year of operations of the retail and lodging properties acquired in late 2011 and the property performance for the lodging properties acquired in early 2012.
In evaluating our financial condition and operating performance, management focuses on the following financial and non-financial indicators, discussed in further detail herein:
|
•
|
Cash flow from operations as determined in accordance with U.S. generally accepted accounting principles (“GAAP”).
|
|
•
|
Funds from Operations (“FFO”), a supplemental non-GAAP measure to net income determined in accordance with GAAP.
|
38
|
•
|
Economic and physical occupancy and rental rates.
|
|
•
|
Leasing activity and lease rollover.
|
|
•
|
Managing operating expenses.
|
|
•
|
Average daily room rate, revenue per available room, and average occupancy to measure our lodging properties.
|
|
•
|
Debt maturities and leverage ratios.
|
|
•
|
Liquidity levels.
|
During 2013, we will continue to execute on our strategy of disposing less strategic assets and deploying the capital into segments we believe have opportunity for higher performance, which are multi-tenant retail, lodging, and student housing. While we believe we will continue to see overall same store operating performance increases in 2013, we could see an increase in disposition activity in 2013. This disposition activity could cause us to experience dilution in our operating performance during the period we dispose of properties and prior to our reinvestment in other properties or used to repurchase our shares as the proceeds from disposition will be held in cash pending reinvestment.
We expect to see increased same store operating performance in our lodging and multi-family segments in 2013. The lodging industry is expected to have positive growth for 2013 and the rental growth is projected to continue for the multi-family properties in 2013. Our retail, office and industrial portfolios are expected to maintain high occupancy and have limited lease rollover in the next three years. We believe the retail and industrial segments same store income will be consistent with 2012 results. We do expect to see lower income in the office segment compared to 2012 results. We believe that our debt maturities over the next five years are manageable and although we believe interest rates will rise in the future, we anticipate low interest rates to continue in 2013. We believe we will be maintain our cash distribution in 2013 and anticipate distributions to be funded by cash flow from operations as well as distributions from unconsolidated entities and gains on sales of properties.
Results of Operations
General
Consolidated Results of Operations
This section describes and compares our results of operations for the years ended
December 31, 2012, 2011 and 2010
. We generate most of our net operating income from property operations. In order to evaluate our overall portfolio, management analyzes the operating performance of all properties from period to period and properties we have owned and operated for the same period during each year. Investment properties owned for the entire years ended
December 31, 2012 and 2011
and December 31, 2011 and 2010, respectively, are referred to herein as “same store” properties. Unless otherwise noted, all dollar amounts are stated in thousands (except per share amounts, per square foot amounts, revenue per available room and average daily rate).
Comparison of the years ended December 31, 2012, 2011 and 2010
|
Year ended
December 31, 2012
|
Year ended
December 31, 2011
|
Year ended
December 31, 2010
|
||||||
|
Net loss attributable to Company
|
(69,338
|
)
|
(316,253
|
)
|
(176,431
|
)
|
||
|
Net loss, per common share, basic and diluted
|
(0.08
|
)
|
(0.37
|
)
|
(0.21
|
)
|
||
Our net loss decreased from the years ended
December 31, 2011
to 2012 primarily due to a decrease in one-time impairment charges to unconsolidated entities and to various properties for the year ended
December 31, 2012
compared to 2011. Additionally, operating income increased from same store growth as our lodging and multi-family operating performance increased and from a full year of operations for retail and lodging properties acquired in late 2011 and early 2012.
Our net loss increased from the years ended
December 31, 2010
to 2011 primarily due to an increase in one-time impairment charges to unconsolidated entities and to various properties for the year ended
December 31, 2011
compared to 2010. This was offset by an increase in operating income for the year ended
December 31, 2011
due to a full year of operations for properties acquired in 2011 and 2010, as well as one-time impairment charges to notes receivables for the year ended
December 31, 2010
.
A detailed discussion of our financial performance is outlined below.
39
Operating Income and Expenses:
|
Year ended
December 31, 2012
|
Year ended
December 31, 2011
|
Year ended
December 31, 2010
|
2012 Increase
(decrease) from
2011
|
2011 Increase
(decrease) from
2010
|
|||||||||||||||
|
Income:
|
|||||||||||||||||||
|
Rental income
|
$
|
622,954
|
|
$
|
594,946
|
|
$
|
560,350
|
|
$
|
28,008
|
|
$
|
34,596
|
|
||||
|
Tenant recovery income
|
98,770
|
|
90,213
|
|
85,263
|
|
8,557
|
|
4,950
|
|
|||||||||
|
Other property income
|
15,244
|
|
16,462
|
|
14,544
|
|
(1,218
|
)
|
1,918
|
|
|||||||||
|
Lodging income
|
700,427
|
|
526,252
|
|
434,539
|
|
174,175
|
|
91,713
|
|
|||||||||
|
Operating Expenses:
|
|
|
|||||||||||||||||
|
Lodging operating expenses
|
454,417
|
|
335,372
|
|
275,398
|
|
119,045
|
|
59,974
|
|
|||||||||
|
Property operating expenses
|
128,096
|
|
127,676
|
|
119,005
|
|
420
|
|
8,671
|
|
|||||||||
|
Real estate taxes
|
98,495
|
|
86,292
|
|
80,370
|
|
12,203
|
|
5,922
|
|
|||||||||
|
Provision for asset impairment
|
77,348
|
|
28,967
|
|
—
|
|
48,381
|
|
28,967
|
|
|||||||||
|
General and administrative expenses
|
36,814
|
|
31,032
|
|
36,665
|
|
5,782
|
|
(5,633
|
)
|
|||||||||
|
Business management fee
|
39,892
|
|
40,000
|
|
36,000
|
|
(108
|
)
|
4,000
|
|
|||||||||
Property Income and Operating Expenses
Rental income for non-lodging properties consists of basic monthly rent, straight-line rent adjustments, amortization of acquired above and below market leases, other property, and percentage rental income recorded pursuant to tenant leases. Tenant recovery income consists of reimbursements for real estate taxes, common area maintenance costs, management fees, and insurance costs. Tenant recovery income generally fluctuates correspondingly with property operating expenses and real estate taxes. Other property income for non-lodging properties consists of lease termination fees and other miscellaneous property income. Property operating expenses for non-lodging properties consist of regular repair and maintenance, management fees, utilities and insurance (some of which are recoverable from the tenant).
|
•
|
There was a modest increase in property revenues in the year ended December 31, 2012 compared to 2011. The increase was a result of the full year of operations for the seven properties added in 2011. Same store consolidated property revenues amounted to
$692,777
in 2012 and
$684,011
in 2011, which resulted in a 1.3% increase. Comparatively, same store operating expenses were
$206,801
in 2012 and
$205,279
in 2011, an increase of 1.4%.
|
|
•
|
The increase in property revenues in the year ended December 31, 2011 compared to 2010 was again due to a full year of operations for properties acquired in 2011 and 2010. Same store consolidated property revenues amounted to
$590,186
in 2011 compared to
$590,259
in 2010, which was less than a 1% change. In correlation, same store property operating expenses amounted to
$177,419
in 2011 compared to
$179,940
in 2010, which was a 1% change.
|
Lodging Income and Operating Expenses
Our lodging properties generate revenue through sales of rooms and associated food and beverage services. Lodging operating expenses include the room maintenance, food and beverage, utilities, administrative and marketing, payroll, franchise and management fees, and repairs and maintenance expenses.
|
•
|
The
$174,175
increase in lodging operating income for the year ended December 31, 2012 compared to 2011 was a result of the addition of hotels acquired in 2012 as well as an increase in our same store properties' performance. We acquired five hotels in the first quarter of 2012 and were able to obtain nine months of operating performance. This accounted for approximately $148,305 of the increase. The remaining
$25,870
of the increase was due to improved same store revenues.
The addition of upper upscale properties to our portfolio resulted in higher operating costs. The increase in lodging expenses of
$119,045
(35%) for 2012 was directly correlated to the percentage increase in revenues (33%).
|
|
•
|
Lodging income increased in the year ended December 31, 2011 primarily due to a full year of operations reflected in 2011 for hotels acquired in 2010 in addition to 2011 acquisition of three hotels. In general, the economy was better in 2011 than in prior years which contributed to the increase in hotel performance. As expected, lodging operating expense increased correspondingly to lodging income.
|
40
Provision for Asset Impairment
|
•
|
For the year ended December 31, 2012, we identified certain properties which may have a reduction in the expected holding period and reviewed the probability of these assets’ dispositions. As a result, we recorded a provision for asset impairment of $
77,348
for continuing operations and
$5,968
for discontinued operations, to reduce the book value of certain investment properties to their fair values.
|
|
•
|
For the years ended December 31, 2011 and 2010, we identified certain properties which may have a reduction in the expected holding period and reviewed the probability of these assets’ dispositions. As a result, we recorded a provision for asset impairment of $
28,967
and $
0
in continuing operations, respectively, to reduce the book value of certain investment properties to their new fair values. We disposed of many of the properties
impaired in 2011 and 2010 by December 31, 2012. T
he related impairment charges of
$134,673
and $
47,529
, respectively, are reflected in discontinued operations.
|
General Administrative Expenses and Business Management Fee
After our stockholders have received a non-cumulative, non-compounded return of 5% per annum on their “invested capital,” we pay our business manager an annual business management fee of up to 1% of the “average invested assets,” payable quarterly in an amount equal to 0.25% of the average invested assets as of the last day of the immediately preceding quarter. Once we have satisfied the minimum return on invested capital, the amount of the actual fee paid to the business manager is requested by the business manager and approved by the board of directors up to the amount permitted by the agreement.
|
•
|
We incurred a business management fee of
$39,892
, $40,000 and $36,000, which is equal to 0.35%, 0.35%, and 0.32% of average invested assets for the years ended
December 31, 2012, 2011 and 2010
, respectively.
|
|
•
|
The increase in general and administrative expenses for the year ended December 31, 2012 compared to 2011 was primarily a result of an increase in legal costs and an increase in salary expense as a result of a shift in personnel from our property managers to our business manager. For t
he year ended December 31, 2011, the decrease in general and administrative expenses was primarily a result of a reduction in legal and consulting costs compared to 2010, specifically due to the Lauth settlement and restructure and foreclosure of the Stan Thomas note.
|
Non-Operating Income and Expenses:
|
Year ended
December 31, 2012
|
Year ended
December 31, 2011
|
Year ended
December 31, 2010
|
2012 Increase
(decrease) from
2011
|
2011 Increase
(decrease) from
2010
|
|||||||||||||||
|
Non-operating income and expenses:
|
|||||||||||||||||||
|
Other income
|
$
|
2,710
|
|
$
|
19,145
|
|
$
|
3,095
|
|
$
|
(16,435
|
)
|
$
|
16,050
|
|
||||
|
Interest expense
|
(306,047
|
)
|
(295,447
|
)
|
(271,360
|
)
|
10,600
|
|
24,087
|
|
|||||||||
|
Equity in income (loss) of unconsolidated entities
|
1,998
|
|
(12,802
|
)
|
(18,684
|
)
|
14,800
|
|
5,882
|
|
|||||||||
|
Gain, (loss) and (impairment) of investment in unconsolidated entities, net
|
(12,322
|
)
|
(106,023
|
)
|
(11,239
|
)
|
(93,701
|
)
|
(94,784
|
)
|
|||||||||
|
Realized gain, (loss) and (impairment) on securities, net
|
4,319
|
|
(16,219
|
)
|
21,073
|
|
20,538
|
|
(37,292
|
)
|
|||||||||
|
Income (loss) from discontinued operations, net
|
51,981
|
|
(95,012
|
)
|
27,041
|
|
146,993
|
|
(122,053
|
)
|
|||||||||
Other Income
|
•
|
The significant decrease in other income for the year ended December 31, 2012 was primarily due to the gain recognized on the conversion of a note receivable to equity of $17,150 in an unconsolidated entity for the year ended December 31, 2011.
|
Interest Expense
|
•
|
The increase in interest expense for the year ended December 31, 2012 compared to 2011 was primarily due to the principal amount of mortgage debt financings during 2012 which increased from
$5,812,595
to
$5,894,443
. The increase in interest expense in 2011 over 2010 is a result of the increase in the principal amount of mortgage debt from $5,508,668 to
$5,812,595
as well as a $6,362 amortization of a mark to market mortgage discount as a result of two property loans totaling $43,236 being in default, from 2010. Our weighted average interest rate on outstanding debt was
5.1%
, 5.2%, and 5.1% per annum for the years ended
December 31, 2012, 2011 and 2010
, respectively.
|
41
Equity in Income (Loss) of Unconsolidated Entities
|
•
|
For the year ended December 31, 2012, the equity in income of unconsolidated entities in 2012 was largely a result of a $4,575 gain
from our share of property sales and debt extinguishment in two unconsolidated entities
offset by an impairment charge recognized by one unconsolidated entity of which our portion was
$470
.
|
|
•
|
For the year ended December 31, 2011, the
equity in loss of unconsolidated entities was largely a result of
impairment charges recognized by two unconsolidated entities of which our portion was a
$16,739
, offset by a
$11,141
gain from our share of property sales in two unconsolidated entities.
|
|
•
|
For the year ended December 31, 2010, the equity in loss of unconsolidated entities reflects impairments recognized by one unconsolidated entity of which our portion was $10,710.
|
Gain, (Loss) and (Impairment) of Investment in Unconsolidated Entities, net
|
•
|
For the year ended December 31, 2012,
we recorded an impairment of
$9,365
on our investment in unconsolidated entities related to the Net Lease Strategic Assets Fund LP joint venture, DR Stephens joint venture, and a lodging joint venture.
Additionally, we recorded losses on the sales of 100% of our equity in
the Net Lease Strategic Assets Fund LP joint venture of $1,556
and a lodging joint venture of $1,401.
|
|
•
|
For the year ended December 31, 2011, we recorded an impairment of $113,621 on our investment in unconsolidated entities related to the Net Lease Strategic Assets Fund LP joint venture. The impairment was offset by a $7,545 gain on our investment in unconsolidated entities due to the sale of 100% of our equity in the NRF Healthcare LLC joint venture.
|
|
•
|
For the year ended December 31, 2010, we recorded an impairment of $11,239 on our investment in unconsolidated entities related to a retail development center and two lodging developments.
|
Realized Gain, (Loss) and (Impairment) on Securities, net
|
•
|
For the year ended December 31, 2012, there was a
$1,899
impairment charge for equity securities offset by a $6,218 net realized gain.
|
|
•
|
For the year ended December 31, 2011, the loss was primarily due to a $24,356 impairment charge on equity securities, which was offset by an $8,137 realized gain.
|
|
•
|
For the year ended December 31, 2010, the loss was primarily due to a $1,857 impairment charge on equity securities, which was offset by an $22,930 realized gain.
|
Discontinued Operations
|
•
|
For the year ended
December 31, 2012
we recorded income of
$51,981
from discontinued operations, which primarily included a gain on sale of properties of
$38,516
, a gain on extinguishment of debt of
$9,478
, a gain on transfer of assets of
$2,175
, and provision for asset impairment of $
5,968
.
|
|
•
|
For the year ended
December 31, 2011
, we recorded loss of
$95,012
from discontinued operations, which primarily included a gain on sale of properties of
$11,964
, a gain on extinguishment of debt of
$10,848
, a gain on transfer of assets of
$4,546
, and provision for asset impairment of $
134,673
.
|
|
•
|
For the year ended December 31, 2010, we recorded income of
$27,041
from discontinued operations, which primarily included a gain on sale of properties of
$55,412
, a gain on extinguishment of debt of
$19,227
, and a provision for asset impairment of
$47,529
.
|
Segment Reporting
An analysis of results of operations by segment is below. In order to evaluate our overall portfolio, management analyzes the operating performance of all properties from period to period and properties we have owned and operated for the same period during each year. A total of
765
and
728
of our investment properties satisfied the criteria of being owned for the entire years ended
December 31, 2012 and 2011
and December 31, 2011 and 2010, respectively, and are referred to herein as “same store” properties. This same store analysis allows management to monitor the operations of our existing properties for comparable periods to determine the effects of our new acquisitions on net income. The tables contained throughout summarize certain key operating performance measures for the years ended
December 31, 2012, 2011 and 2010
. The rental rates reflected in retail, office, industrial, and multi-family are inclusive of rent abatements, lease inducements and straight-line rent GAAP adjustments, but exclusive of tenant improvements and lease commissions. For the year ended
December 31, 2012
, these costs associated with leasing space were not material. Physical occupancy is defined as the percentage of total gross leasable area actually used or occupied by a tenant. Economic occupancy is defined as the percentage of total gross leasable area for which a
42
tenant is obligated to pay rent under the terms of its lease agreement, regardless of the actual use or occupation by that tenant of the area being leased.
Retail Segment
The composition of our retail segment has changed from 2010 to 2012 as we, over the three year period, acquired thirty-two multi-tenant retail properties. The non-same store net operating income increased from
$7,898
to
$24,181
for the year ended December 31, 2011 compared to 2012. This was a result of the full operations of properties acquired in the second half of 2011. Additionally, we disposed of 146 properties, including 142 retail bank branches. The net operating income associated with these properties is reflected in discontinued operations on the consolidated statement of operations and other comprehensive income. We anticipate continuing to divest in the remaining bank branches, which are mainly SunTrust Banks, Inc.
Our retail segment net operating income on a same store basis grew slightly for the year ended December 31, 2012 compared to the year ended December 31, 2011 up
1.5%
, or
$254,082
from
$250,385
, respectively. This was a result of the strong same store economic occupancy percentage of
93%
and
94%
for 2012 and 2011, respectively and comparable lease rates year to year. Also, in 2012, same store property operating expenses decreased
$1,751
or
3.0%
, which was due to decreased property management fees and snow removal costs. Tenant recovery income increased on a same store basis by
$2,637
or
4.5%
because of increased real estate taxes, which are fully recoverable. We expect our same store net operating income to have a slight increase in the coming year.
|
|
Total Retail Properties
|
||||||||||
|
|
As of December 31,
|
||||||||||
|
|
2012
|
2011
|
2010
|
||||||||
|
Retail Properties
|
|||||||||||
|
Physical occupancy
|
92
|
%
|
93
|
%
|
93
|
%
|
|||||
|
Economic occupancy
|
93
|
%
|
94
|
%
|
94
|
%
|
|||||
|
Rent per square foot
|
$
|
14.95
|
|
$
|
14.77
|
|
$
|
14.81
|
|
||
|
Investment in properties, undepreciated
|
$
|
4,134,874
|
|
$
|
4,234,336
|
|
$
|
3,926,395
|
|
||
Comparison of Years Ended
December 31, 2012 and 2011
The table below represents operating information for the retail segment and for the same store retail segment consisting of properties acquired prior to January 1, 2011. The properties in the same store portfolio were owned for the entire years ended
December 31, 2012 and 2011
.
43
|
Retail
|
For the year ended
December 31, 2012
|
For the year ended
December 31, 2011
|
Same Store
Portfolio
Change
Favorable/
(Unfavorable)
|
Total Company
Change
Favorable/
(Unfavorable)
|
|||||||||||||||||||||||||||||||||
|
|
Same
Store
Portfolio
|
Non-Same
Store
|
Total
Company
|
Same
Store
Portfolio
|
Non-Same
Store
|
Total
Company
|
Amount
|
%
|
Amount
|
%
|
|||||||||||||||||||||||||||
|
Revenues:
|
|||||||||||||||||||||||||||||||||||||
|
Rental Income
|
$
|
274,976
|
|
$
|
27,347
|
|
$
|
302,323
|
|
$
|
273,119
|
|
$
|
11,330
|
|
$
|
284,449
|
|
$
|
1,857
|
|
0.7
|
%
|
$
|
17,874
|
|
6.3
|
%
|
|||||||||
|
Straight Line Income
|
5,392
|
|
441
|
|
5,833
|
|
7,108
|
|
(174
|
)
|
6,934
|
|
(1,716
|
)
|
(24.1
|
)%
|
(1,101
|
)
|
(15.9
|
)%
|
|||||||||||||||||
|
Tenant Recovery Income
|
61,648
|
|
6,963
|
|
68,611
|
|
59,011
|
|
4,022
|
|
63,033
|
|
2,637
|
|
4.5
|
%
|
5,578
|
|
8.8
|
%
|
|||||||||||||||||
|
Other Property Income
|
5,088
|
|
127
|
|
5,215
|
|
5,124
|
|
90
|
|
5,214
|
|
(36
|
)
|
(0.7
|
)%
|
1
|
|
—
|
%
|
|||||||||||||||||
|
Total Revenues
|
$
|
347,104
|
|
$
|
34,878
|
|
$
|
381,982
|
|
$
|
344,362
|
|
$
|
15,268
|
|
$
|
359,630
|
|
$
|
2,742
|
|
0.8
|
%
|
$
|
22,352
|
|
6.2
|
%
|
|||||||||
|
Expenses:
|
|||||||||||||||||||||||||||||||||||||
|
Property operating expenses
|
$
|
56,301
|
|
$
|
6,659
|
|
$
|
62,960
|
|
$
|
58,052
|
|
$
|
3,899
|
|
$
|
61,951
|
|
$
|
1,751
|
|
3.0
|
%
|
$
|
(1,009
|
)
|
(1.6
|
)%
|
|||||||||
|
Real estate taxes
|
36,721
|
|
4,038
|
|
40,759
|
|
35,925
|
|
3,471
|
|
39,396
|
|
(796
|
)
|
(2.2
|
)%
|
(1,363
|
)
|
(3.5
|
)%
|
|||||||||||||||||
|
Total operating expenses
|
$
|
93,022
|
|
$
|
10,697
|
|
$
|
103,719
|
|
$
|
93,977
|
|
$
|
7,370
|
|
$
|
101,347
|
|
$
|
955
|
|
1.0
|
%
|
$
|
(2,372
|
)
|
(2.3
|
)%
|
|||||||||
|
Net operating income
|
$
|
254,082
|
|
|
$
|
24,181
|
|
$
|
278,263
|
|
$
|
250,385
|
|
$
|
7,898
|
|
$
|
258,283
|
|
$
|
3,697
|
|
1.5
|
%
|
$
|
19,980
|
|
7.7
|
%
|
||||||||
|
Average occupancy for the period
|
93
|
%
|
N/A
|
|
93
|
%
|
94
|
%
|
N/A
|
|
94
|
%
|
|||||||||||||||||||||||||
|
Number of Properties
|
573
|
|
12
|
|
585
|
|
573
|
|
8
|
|
581
|
|
|||||||||||||||||||||||||
Comparison of Years Ended December 31, 2011 and December 31, 2010
The table below represents operating information for the retail segment and for the same store retail segment consisting of properties acquired prior to January 1, 2010. The properties in the same store portfolio were owned for the entire years ended
December 31, 2011 and 2010
.
|
Retail
|
For the year ended
December 31, 2011
|
For the year ended
December 31, 2010
|
Same Store
Portfolio
Change
Favorable/
(Unfavorable)
|
Total Company
Change Favorable/
(Unfavorable)
|
|||||||||||||||||||||||||||||||||
|
|
Same
Store
Portfolio
|
Non-Same
Store
|
Total
Company
|
Same
Store
Portfolio
|
Non-Same
Store
|
Total
Company
|
Amount
|
%
|
Amount
|
%
|
|||||||||||||||||||||||||||
|
Revenues:
|
|||||||||||||||||||||||||||||||||||||
|
Rental income
|
$
|
222,922
|
|
$
|
61,527
|
|
$
|
284,449
|
|
$
|
219,855
|
|
$
|
39,848
|
|
$
|
259,703
|
|
$
|
3,067
|
|
1.4
|
%
|
$
|
24,746
|
|
9.5
|
%
|
|||||||||
|
Straight Line Income
|
6,534
|
|
400
|
|
6,934
|
|
8,963
|
|
(283
|
)
|
8,680
|
|
(2,429
|
)
|
(27.1
|
)%
|
(1,746
|
)
|
(20.1
|
)%
|
|||||||||||||||||
|
Tenant recovery incomes
|
45,810
|
|
17,223
|
|
63,033
|
|
46,854
|
|
10,582
|
|
57,436
|
|
(1,044
|
)
|
(2.2
|
)%
|
5,597
|
|
9.7
|
%
|
|||||||||||||||||
|
Other property income
|
4,180
|
|
1,034
|
|
5,214
|
|
3,728
|
|
1,036
|
|
4,764
|
|
452
|
|
12.1
|
%
|
450
|
|
9.4
|
%
|
|||||||||||||||||
|
Total revenues
|
$
|
279,446
|
|
$
|
80,184
|
|
$
|
359,630
|
|
$
|
279,400
|
|
$
|
51,183
|
|
$
|
330,583
|
|
$
|
46
|
|
—
|
%
|
$
|
29,047
|
|
8.8
|
%
|
|||||||||
|
Expenses:
|
|
|
|
|
|
|
|
|
|
|
|||||||||||||||||||||||||||
|
Property operating expenses
|
$
|
46,080
|
|
$
|
15,871
|
|
$
|
61,951
|
|
$
|
44,417
|
|
$
|
10,381
|
|
$
|
54,798
|
|
$
|
(1,663
|
)
|
(3.7
|
)%
|
$
|
(7,153
|
)
|
(13.1
|
)%
|
|||||||||
|
Real estate taxes
|
28,038
|
|
11,358
|
|
39,396
|
|
28,307
|
|
5,781
|
|
34,088
|
|
269
|
|
1.0
|
%
|
(5,308
|
)
|
(15.6
|
)%
|
|||||||||||||||||
|
Total operating expenses
|
$
|
74,118
|
|
$
|
27,229
|
|
$
|
101,347
|
|
$
|
72,724
|
|
$
|
16,162
|
|
$
|
88,886
|
|
$
|
(1,394
|
)
|
(1.9
|
)%
|
$
|
(12,461
|
)
|
(14.0
|
)%
|
|||||||||
|
Net operating income
|
$
|
205,328
|
|
$
|
52,955
|
|
$
|
258,283
|
|
$
|
206,676
|
|
$
|
35,021
|
|
$
|
241,697
|
|
$
|
(1,348
|
)
|
(0.7
|
)%
|
$
|
16,586
|
|
6.9
|
%
|
|||||||||
|
Average occupancy for the period
|
94
|
%
|
N/A
|
|
94
|
%
|
94
|
%
|
N/A
|
|
94
|
%
|
|||||||||||||||||||||||||
|
Number of Properties
|
553
|
|
28
|
|
581
|
|
553
|
|
20
|
|
573
|
|
|||||||||||||||||||||||||
44
Lodging Segment
During 2012, we continued to execute our lodging portfolio strategy, to move out of certain midscale lodging assets and into more urban, full service properties by acquiring seven upper upscale lodging assets and disposing of thirteen midscale lodging assets. Refining the assets in our lodging portfolio coupled by the significant improvement in the lodging industry has driven the increase in our operating performance for this sector. Our total net operating income for lodging has increased from
$136,959
to
$167,318
to
$214,910
, for the years ended December 31, 2010, 2011 and 2012 respectively. In addition, revenue per available room ("RevPAR") grew 5.5% from
$90
as of December 31, 2011 to
$95
as of December 31, 2012 because the average daily rate ("ADR") grew 5.6% from
$125
to
$132
as well as occupancy increased from
72%
to
73%
for the same period.
Significant growth of RevPAR has occurred in the lodging industry since 2010. RevPAR represents the product of the average daily room rate charged and the average daily occupancy achieved but excludes other revenue generated by a hotel property, such as food and beverage, parking, telephone and other guest service revenues. The lodging industry has seen a recovery in business travelers and leisure transient and our operating managers have been able to push rates which has improved the performance of our lodging segment. On a same store basis, net operating income increased
6.7%
for the years ended December 31, 2011 to December 31, 2012, from
$158,817
to
$169,532
. The same store properties for the years ended December 31, 2010 and December 31, 2011 also had an increase in net operating income of
11.0%
, from
$130,662
to
$145,044
.
We are optimistic our lodging portfolio will continue its strong performance in 2013 with increases in RevPAR and ADR. We believe business and leisure travel is forecasted to remain strong in 2013 with leisure demand continuing to be active, but price sensitive and group travel demand to be flat although at a healthy level. We also expect supply growth to remain below historical levels for the next couple of years, which will also help support the fundamentals for the lodging segment. We believe our revenue per available room will increase consistent with industry expectations.
|
|
Total Lodging Properties
|
||||||||||
|
|
For the year ended December 31,
|
||||||||||
|
|
2012
|
2011
|
2010
|
||||||||
|
Lodging Properties
|
|||||||||||
|
Revenue per available room
|
$
|
95
|
|
$
|
90
|
|
$
|
84
|
|
||
|
Average daily rate
|
$
|
132
|
|
$
|
125
|
|
$
|
119
|
|
||
|
Occupancy
|
73
|
%
|
72
|
%
|
70
|
%
|
|||||
|
Investment in properties, undepreciated, as of December 31
|
$
|
3,296,270
|
|
$
|
2,711,281
|
|
$
|
2,506,029
|
|
||
Comparison of Years Ended
December 31, 2012 and 2011
The table below represents operating information for the lodging segment and for the same store portfolio for properties acquired prior to January 1, 2011. The properties in the same store portfolio were owned for the entire years ended
December 31, 2012 and 2011
.
45
|
Lodging
|
For the year ended
December 31, 2012
|
For the year ended
December 31, 2011
|
Same Store
Portfolio
Change Favorable/
(Unfavorable)
|
Total Company
Change
Favorable/
(Unfavorable)
|
|||||||||||||||||||||||||||||||||
|
|
Same
Store
Portfolio
|
Non-Same
Store
|
Total
Company
|
Same
Store
Portfolio
|
Non-Same
Store
|
Total
Company
|
Amount
|
%
|
Amount
|
%
|
|||||||||||||||||||||||||||
|
Revenues:
|
|||||||||||||||||||||||||||||||||||||
|
Lodging operating income
|
$
|
517,438
|
|
$
|
182,989
|
|
$
|
700,427
|
|
$
|
491,568
|
|
$
|
34,684
|
|
$
|
526,252
|
|
$
|
25,870
|
|
5.3
|
%
|
$
|
174,175
|
|
33.1
|
%
|
|||||||||
|
Expenses:
|
|||||||||||||||||||||||||||||||||||||
|
Lodging operating expenses
|
$
|
323,528
|
|
$
|
130,889
|
|
$
|
454,417
|
|
$
|
310,076
|
|
$
|
25,295
|
|
$
|
335,371
|
|
$
|
(13,452
|
)
|
(4.3
|
)%
|
$
|
(119,046
|
)
|
(35.5
|
)%
|
|||||||||
|
Real estate taxes
|
24,378
|
|
6,722
|
|
31,100
|
|
22,675
|
|
888
|
|
23,563
|
|
(1,703
|
)
|
(7.5
|
)%
|
(7,537
|
)
|
(32.0
|
)%
|
|||||||||||||||||
|
Total operating expenses
|
$
|
347,906
|
|
$
|
137,611
|
|
|
$
|
485,517
|
|
$
|
332,751
|
|
$
|
26,183
|
|
$
|
358,934
|
|
$
|
(15,155
|
)
|
(4.6
|
)%
|
$
|
(126,583
|
)
|
(35.3
|
)%
|
||||||||
|
Net operating income
|
$
|
169,532
|
|
$
|
45,378
|
|
$
|
214,910
|
|
$
|
158,817
|
|
$
|
8,501
|
|
$
|
167,318
|
|
$
|
10,715
|
|
6.7
|
%
|
$
|
47,592
|
|
28.4
|
%
|
|||||||||
|
Average occupancy for the period
|
73
|
%
|
N/A
|
|
73
|
%
|
72
|
%
|
N/A
|
|
72
|
%
|
|||||||||||||||||||||||||
|
Number of Properties
|
78
|
|
10
|
|
88
|
|
78
|
|
3
|
|
81
|
|
|||||||||||||||||||||||||
|
Room Rev Par
|
$
|
94
|
|
n/a
|
|
$
|
95
|
|
$
|
90
|
|
n/a
|
|
$
|
90
|
|
|||||||||||||||||||||
|
Average Daily Rate
|
$
|
128
|
|
n/a
|
|
$
|
132
|
|
$
|
124
|
|
n/a
|
|
$
|
125
|
|
|||||||||||||||||||||
Comparison of Years Ended December 31, 2011 and December 31, 2010
The table below represents operating information for the lodging segment and for the same store portfolio of properties acquired prior to January 1, 2010. The properties in the same store portfolio were owned for the entire years ended December 31, 2011 and December 31, 2010.
|
Lodging
|
For the year ended
December 31, 2011
|
For the year ended
December 31, 2010
|
Same Store
Portfolio
Change
Favorable/
(Unfavorable)
|
Total
Company
Change
Favorable/
(Unfavorable)
|
|||||||||||||||||||||||||||||||||
|
|
Same
Store
Portfolio
|
Non-Same
Store
|
Total
Company
|
Same
Store
Portfolio
|
Non-Same
Store
|
Total
Company
|
Amount
|
%
|
Amount
|
%
|
|||||||||||||||||||||||||||
|
Revenues:
|
|||||||||||||||||||||||||||||||||||||
|
Lodging operating income
|
$
|
447,324
|
|
$
|
78,928
|
|
$
|
526,252
|
|
$
|
413,492
|
|
$
|
21,047
|
|
$
|
434,539
|
|
$
|
33,832
|
|
8.2
|
%
|
$
|
91,713
|
|
21.1
|
%
|
|||||||||
|
Expenses:
|
|
|
|
|
|
|
|
|
|
|
|||||||||||||||||||||||||||
|
Lodging operating expenses
|
$
|
281,972
|
|
$
|
53,399
|
|
$
|
335,371
|
|
$
|
261,529
|
|
$
|
13,869
|
|
$
|
275,398
|
|
$
|
(20,443
|
)
|
(7.8
|
)%
|
$
|
(59,973
|
)
|
(21.8
|
)%
|
|||||||||
|
Real estate taxes
|
20,308
|
|
3,255
|
|
23,563
|
|
21,301
|
|
881
|
|
22,182
|
|
993
|
|
4.7
|
%
|
(1,381
|
)
|
(6.2
|
)%
|
|||||||||||||||||
|
Total operating expenses
|
$
|
302,280
|
|
$
|
56,654
|
|
$
|
358,934
|
|
$
|
282,830
|
|
$
|
14,750
|
|
$
|
297,580
|
|
$
|
(19,450
|
)
|
(6.9
|
)%
|
$
|
(61,354
|
)
|
(17.1
|
)%
|
|||||||||
|
Net operating income
|
$
|
145,044
|
|
$
|
22,274
|
|
$
|
167,318
|
|
$
|
130,662
|
|
$
|
6,297
|
|
$
|
136,959
|
|
$
|
14,382
|
|
11.0
|
%
|
$
|
30,359
|
|
22.2
|
%
|
|||||||||
|
Average occupancy for the period
|
73
|
%
|
N/A
|
|
72
|
%
|
71
|
%
|
N/A
|
|
70
|
%
|
|||||||||||||||||||||||||
|
Number of Properties
|
73
|
|
8
|
|
81
|
|
73
|
|
5
|
|
78
|
|
|||||||||||||||||||||||||
|
Room Rev Par
|
$
|
90
|
|
N/A
|
|
$
|
90
|
|
$
|
84
|
|
N/A
|
|
$
|
84
|
|
|||||||||||||||||||||
|
Average Daily Rate
|
$
|
123
|
|
N/A
|
|
$
|
125
|
|
$
|
119
|
|
N/A
|
|
$
|
119
|
|
|||||||||||||||||||||
Office Segment
We had no acquisitions in our office portfolio in 2012, 2011 and 2010 and minimal dispositions during the same period. Our office segment net operating income totaled $
133,701
for the year ended
December 31, 2010
to $
132,050
for the year ended
December 31, 2011
and to $
132,229
for the year ended
December 31, 2012
. The stability of net operating income was a result
46
of consistent occupancy and rental rates over the periods. We had slight decreases in straight-line rents due to contractual rent changes as well as decreased termination income reflected in other property income when comparing the three periods. The increase in real estate taxes was offset by an increase in tenant recovery income as generally the tenants are responsible for reimbursement of real estate tax and lower property operating expenses due to decreased management fees and lower snow removal costs.
We see market rates continuing to decrease from the current rates as office tenants continue to downsize not only their workforce, but also the space they provide for their employees. The lease expirations reflected in 2016 and 2017 substantially consist of two properties, AT&T in Hoffman Estates, Illinois, which is located in the greater metro Chicago market and AT&T in St. Louis, Missouri. These leases represent 61% of the 2016 lease expirations or approximately 1.7 million square feet and 69% of the 2017 lease expirations or approximately 1.5 million square feet, respectively. In 2013, we expect our same store net operating income to be slightly down to flat.
|
|
Total Office Properties
|
||||||||||
|
|
As of December 31,
|
||||||||||
|
|
2012
|
2011
|
2010
|
||||||||
|
Office Properties
|
|||||||||||
|
Physical occupancy
|
92
|
%
|
92
|
%
|
94
|
%
|
|||||
|
Economic occupancy
|
93
|
%
|
92
|
%
|
94
|
%
|
|||||
|
Rent per square foot
|
$
|
15.42
|
|
$
|
15.13
|
|
$
|
15.09
|
|
||
|
Investment in properties, undepreciated
|
$
|
1,924,468
|
|
$
|
1,925,736
|
|
$
|
1,929,763
|
|
||
Comparison of Years Ended
December 31, 2012 and 2011
The table below represents operating information for the office segment and for the same store portfolio consisting of properties acquired prior to January 1, 2011. The properties in the same store portfolio were owned for the years ended
December 31, 2012 and 2011
.
|
Office
|
For the year ended
December 31, 2012
|
For the year ended
December 31, 2011
|
Same Store
Portfolio
Change Favorable/
(Unfavorable)
|
Total
Company
Change
Favorable/
(Unfavorable)
|
|||||||||||||||||||||||||||||||||
|
|
Same
Store
Portfolio
|
Non-Same
Store
|
Total
Company
|
Same
Store
Portfolio
|
Non-Same
Store
|
Total
Company
|
Amount
|
%
|
Amount
|
%
|
|||||||||||||||||||||||||||
|
Revenues:
|
|||||||||||||||||||||||||||||||||||||
|
Rental income
|
$
|
143,019
|
|
$
|
—
|
|
$
|
143,019
|
|
$
|
143,112
|
|
$
|
—
|
|
$
|
143,112
|
|
$
|
(93
|
)
|
(0.1
|
)%
|
$
|
(93
|
)
|
(0.1
|
)%
|
|||||||||
|
Straight line rental income
|
3,883
|
|
—
|
|
3,883
|
|
4,147
|
|
—
|
|
4,147
|
|
(264
|
)
|
(6.4
|
)%
|
(264
|
)
|
(6.4
|
)%
|
|||||||||||||||||
|
Tenant recovery incomes
|
26,292
|
|
—
|
|
26,292
|
|
25,300
|
|
—
|
|
25,300
|
|
992
|
|
3.9
|
%
|
992
|
|
3.9
|
%
|
|||||||||||||||||
|
Other property income
|
3,089
|
|
—
|
|
3,089
|
|
3,885
|
|
—
|
|
3,885
|
|
(796
|
)
|
(20.5
|
)%
|
(796
|
)
|
(20.5
|
)%
|
|||||||||||||||||
|
Total revenues
|
$
|
176,283
|
|
$
|
—
|
|
$
|
176,283
|
|
$
|
176,444
|
|
$
|
—
|
|
$
|
176,444
|
|
$
|
(161
|
)
|
(0.1
|
)%
|
$
|
(161
|
)
|
(0.1
|
)%
|
|||||||||
|
Expenses:
|
|||||||||||||||||||||||||||||||||||||
|
Property operating expenses
|
$
|
29,963
|
|
$
|
—
|
|
$
|
29,963
|
|
$
|
31,052
|
|
$
|
—
|
|
$
|
31,052
|
|
$
|
1,089
|
|
3.5
|
%
|
$
|
1,089
|
|
3.5
|
%
|
|||||||||
|
Real estate taxes
|
14,091
|
|
—
|
|
14,091
|
|
13,342
|
|
—
|
|
13,342
|
|
(749
|
)
|
(5.6
|
)%
|
(749
|
)
|
(5.6
|
)%
|
|||||||||||||||||
|
Total operating expenses
|
$
|
44,054
|
|
$
|
—
|
|
$
|
44,054
|
|
$
|
44,394
|
|
$
|
—
|
|
$
|
44,394
|
|
$
|
340
|
|
0.8
|
%
|
$
|
340
|
|
0.8
|
%
|
|||||||||
|
Net operating income
|
$
|
132,229
|
|
$
|
—
|
|
$
|
132,229
|
|
$
|
132,050
|
|
$
|
—
|
|
$
|
132,050
|
|
$
|
179
|
|
0.1
|
%
|
$
|
179
|
|
0.1
|
%
|
|||||||||
|
Average occupancy for the period
|
93
|
%
|
N/A
|
|
93
|
%
|
93
|
%
|
N/A
|
|
92
|
%
|
|||||||||||||||||||||||||
|
Number of Properties
|
42
|
|
—
|
|
42
|
|
42
|
|
—
|
|
42
|
|
|||||||||||||||||||||||||
47
Comparison of Years Ended December 31, 2011 and December 31, 2010
The table below represents operating information for the office segment and for the same store portfolio consisting of properties acquired prior to January 1, 2010. The properties in the same store portfolio were owned for the years ended December 31, 2011 and December 31, 2010.
|
Office
|
For the year ended
December 31, 2011
|
For the year ended
December 31, 2010
|
Same Store
Portfolio
Change
Favorable/
(Unfavorable)
|
Total Company
Change
Favorable/
(Unfavorable)
|
|||||||||||||||||||||||||||||||||
|
|
Same
Store
Portfolio
|
Non-Same
Store
|
Total
Company
|
Same
Store
Portfolio
|
Non-Same
Store
|
Total
Company
|
Amount
|
%
|
Amount
|
%
|
|||||||||||||||||||||||||||
|
Revenues:
|
|||||||||||||||||||||||||||||||||||||
|
Rental income
|
$
|
139,165
|
|
$
|
3,947
|
|
$
|
143,112
|
|
$
|
140,922
|
|
$
|
981
|
|
$
|
141,903
|
|
$
|
(1,757
|
)
|
(1.2
|
)%
|
$
|
1,209
|
|
0.9
|
%
|
|||||||||
|
Straight line rental income
|
4,594
|
|
(447
|
)
|
4,147
|
|
6,131
|
|
(376
|
)
|
5,755
|
|
(1,537
|
)
|
(25.1
|
)%
|
(1,608
|
)
|
(27.9
|
)%
|
|||||||||||||||||
|
Tenant recovery incomes
|
24,199
|
|
1,101
|
|
25,300
|
|
26,195
|
|
224
|
|
26,419
|
|
(1,996
|
)
|
(7.6
|
)%
|
(1,119
|
)
|
(4.2
|
)%
|
|||||||||||||||||
|
Other property income
|
3,857
|
|
28
|
|
3,885
|
|
4,229
|
|
(2
|
)
|
4,227
|
|
(372
|
)
|
(8.8
|
)%
|
(342
|
)
|
(8.1
|
)%
|
|||||||||||||||||
|
Total revenues
|
$
|
171,815
|
|
$
|
4,629
|
|
$
|
176,444
|
|
$
|
177,477
|
|
$
|
827
|
|
$
|
178,304
|
|
$
|
(5,662
|
)
|
(3.2
|
)%
|
$
|
(1,860
|
)
|
(1.0
|
)%
|
|||||||||
|
Expenses:
|
|
|
|
|
|
|
|
|
|
|
|||||||||||||||||||||||||||
|
Property operating expenses
|
$
|
29,958
|
|
$
|
1,094
|
|
$
|
31,052
|
|
$
|
31,008
|
|
$
|
(115
|
)
|
$
|
30,893
|
|
$
|
1,050
|
|
3.4
|
%
|
$
|
(159
|
)
|
(0.5
|
)%
|
|||||||||
|
Real estate taxes
|
12,474
|
|
868
|
|
13,342
|
|
13,512
|
|
198
|
|
13,710
|
|
1,038
|
|
7.7
|
%
|
368
|
|
2.8
|
%
|
|||||||||||||||||
|
Total operating expenses
|
$
|
42,432
|
|
$
|
1,962
|
|
$
|
44,394
|
|
$
|
44,520
|
|
$
|
83
|
|
$
|
44,603
|
|
$
|
2,088
|
|
4.7
|
%
|
$
|
209
|
|
0.5
|
%
|
|||||||||
|
Net operating income
|
$
|
129,383
|
|
$
|
2,667
|
|
$
|
132,050
|
|
$
|
132,957
|
|
$
|
744
|
|
$
|
133,701
|
|
$
|
(3,574
|
)
|
(2.7
|
)%
|
$
|
(1,651
|
)
|
(1.2
|
)%
|
|||||||||
|
Average occupancy for the period
|
93
|
%
|
N/A
|
|
92
|
%
|
94
|
%
|
N/A
|
|
94
|
%
|
|||||||||||||||||||||||||
|
Number of Properties
|
39
|
|
3
|
|
42
|
|
39
|
|
3
|
|
42
|
|
|||||||||||||||||||||||||
Industrial Segment
During 2012, our industrial holdings continued to experience high economic occupancy and consistent rental rates. These factors are reflected in the same store net operating income increase of 1.5% for the year ended December 31, 2011 to December 31, 2012, which was a result of scheduled rent increases as well as a reduction of property management fees. Total segment real estate taxes increased from December 31, 2011 of
$1,171
compared to
$2,940
for the same period in 2012. In late 2011, a real estate tax expense cap expired at one of our properties which have net leases and tenants are directly responsible for operating expenses and reimburse us for real estate taxes. This is reflected in the tenant recovery income which increased to
$3,370
from
$1,414
for the year ended December 31, 2012 and 2011.
In early 2010, we acquired charter schools and correctional facilities consisting of nine properties under long-term triple net leases. Additionally in 2011, we placed in service one charter school. These acquisitions contributed to total segment net operating income for
December 31, 2011
exceeding the prior year by
$3,362
or
4.5%
.
Rental rates are expected to remain consistent in 2013 for our specialty distribution centers as well as our charter schools and correctional facilities and slightly increase for our distribution centers. In 2013, we expect our same store net operating income to be flat to slightly up.
|
|
Total Industrial Properties
|
||||||||||
|
|
As of December 31,
|
||||||||||
|
|
2012
|
2011
|
2010
|
||||||||
|
Industrial Properties
|
|||||||||||
|
Physical occupancy
|
96
|
%
|
97
|
%
|
94
|
%
|
|||||
|
Economic occupancy
|
97
|
%
|
98
|
%
|
95
|
%
|
|||||
|
Rent per square foot
|
$
|
6.48
|
|
$
|
6.23
|
|
$
|
6.31
|
|
||
|
Investment in properties, undepreciated
|
$
|
971,935
|
|
$
|
979,579
|
|
$
|
944,871
|
|
||
48
Comparison of Years Ended
December 31, 2012 and 2011
The table below represents operating information for the industrial segment and for the same store portfolio consisting of properties acquired prior to January 1, 2011. The properties in the same store portfolio were owned for the years ended
December 31, 2012 and 2011
.
|
Industrial
|
For the year ended December 31,
2012
|
For the year ended December 31,
2011
|
Same Store
Portfolio
Change
Favorable/
(Unfavorable)
|
Total Company
Change
Favorable/
(Unfavorable)
|
|||||||||||||||||||||||||||||||||
|
|
Same
Store
Portfolio
|
Non-Same
Store
|
Total
Company
|
Same
Store
Portfolio
|
Non-Same
Store
|
Total
Company
|
Amount
|
%
|
Amount
|
%
|
|||||||||||||||||||||||||||
|
Revenues:
|
|||||||||||||||||||||||||||||||||||||
|
Rental income
|
$
|
77,642
|
|
$
|
3,224
|
|
$
|
80,866
|
|
$
|
75,784
|
|
$
|
1,139
|
|
$
|
76,923
|
|
$
|
1,858
|
|
2.5
|
%
|
$
|
3,943
|
|
5.1
|
%
|
|||||||||
|
Straight line rental income
|
2,231
|
|
(16
|
)
|
2,215
|
|
3,816
|
|
40
|
|
3,856
|
|
(1,585
|
)
|
(41.5
|
)%
|
(1,641
|
)
|
(42.6
|
)%
|
|||||||||||||||||
|
Tenant recovery incomes
|
2,609
|
|
761
|
|
3,370
|
|
1,253
|
|
161
|
|
1,414
|
|
1,356
|
|
108.2
|
%
|
1,956
|
|
138.3
|
%
|
|||||||||||||||||
|
Other property income
|
290
|
|
66
|
|
356
|
|
118
|
|
1,002
|
|
1,120
|
|
172
|
|
145.8
|
%
|
(764
|
)
|
(68.2
|
)%
|
|||||||||||||||||
|
Total revenues
|
$
|
82,772
|
|
$
|
4,035
|
|
$
|
86,807
|
|
$
|
80,971
|
|
$
|
2,342
|
|
$
|
83,313
|
|
$
|
1,801
|
|
2.2
|
%
|
$
|
3,494
|
|
4.2
|
%
|
|||||||||
|
Expenses:
|
|||||||||||||||||||||||||||||||||||||
|
Property operating expenses
|
$
|
3,107
|
|
$
|
589
|
|
$
|
3,696
|
|
$
|
3,976
|
|
$
|
268
|
|
$
|
4,244
|
|
$
|
869
|
|
21.9
|
%
|
$
|
548
|
|
12.9
|
%
|
|||||||||
|
Real estate taxes
|
2,571
|
|
369
|
|
2,940
|
|
1,007
|
|
164
|
|
1,171
|
|
(1,564
|
)
|
(155.3
|
)%
|
(1,769
|
)
|
(151.1
|
)%
|
|||||||||||||||||
|
Total operating expenses
|
$
|
5,678
|
|
$
|
958
|
|
$
|
6,636
|
|
$
|
4,983
|
|
$
|
432
|
|
$
|
5,415
|
|
$
|
(695
|
)
|
(13.9
|
)%
|
$
|
(1,221
|
)
|
(22.5
|
)%
|
|||||||||
|
Net operating income
|
$
|
77,094
|
|
$
|
3,077
|
|
$
|
80,171
|
|
$
|
75,988
|
|
$
|
1,910
|
|
$
|
77,898
|
|
$
|
1,106
|
|
1.5
|
%
|
$
|
2,273
|
|
2.9
|
%
|
|||||||||
|
Average occupancy for the period
|
97
|
%
|
N/A
|
|
97
|
%
|
98
|
%
|
N/A
|
|
98
|
%
|
|||||||||||||||||||||||||
|
Number of Properties
|
50
|
|
3
|
|
53
|
|
50
|
|
3
|
|
53
|
|
|||||||||||||||||||||||||
Comparison of Years Ended December 31, 2011 and December 31, 2010
The table below represents operating information for the industrial segment and for the same store portfolio consisting of properties acquired prior to January 1, 2010. The properties in the same store portfolio were owned for the years ended December 31, 2011 and December 31, 2010.
49
|
Industrial
|
For the year ended December 31,
2011
|
For the year ended December 31,
2010
|
Same Store
Portfolio
Change
Favorable/
(Unfavorable)
|
Total Company
Change
Favorable/
(Unfavorable)
|
|||||||||||||||||||||||||||||||||
|
|
Same
Store
Portfolio
|
Non-Same
Store
|
Total
Company
|
Same
Store
Portfolio
|
Non-Same
Store
|
Total
Company
|
Amount
|
%
|
Amount
|
%
|
|||||||||||||||||||||||||||
|
Revenues:
|
|||||||||||||||||||||||||||||||||||||
|
Rental income
|
$
|
59,169
|
|
$
|
17,754
|
|
$
|
76,923
|
|
$
|
60,522
|
|
$
|
14,969
|
|
$
|
75,491
|
|
$
|
(1,353
|
)
|
(2.2
|
)%
|
$
|
1,432
|
|
1.9
|
%
|
|||||||||
|
Straight line rental income
|
3,998
|
|
(142
|
)
|
3,856
|
|
2,496
|
|
443
|
|
2,939
|
|
1,502
|
|
60.2
|
%
|
917
|
|
31.2
|
%
|
|||||||||||||||||
|
Tenant recovery incomes
|
1,253
|
|
161
|
|
1,414
|
|
1,037
|
|
—
|
|
1,037
|
|
216
|
|
20.8
|
%
|
377
|
|
36.4
|
%
|
|||||||||||||||||
|
Other property income
|
70
|
|
1,050
|
|
1,120
|
|
69
|
|
41
|
|
110
|
|
1
|
|
1.4
|
%
|
1,010
|
|
918.2
|
%
|
|||||||||||||||||
|
Total revenues
|
$
|
64,490
|
|
$
|
18,823
|
|
$
|
83,313
|
|
$
|
64,124
|
|
$
|
15,453
|
|
$
|
79,577
|
|
$
|
366
|
|
0.6
|
%
|
$
|
3,736
|
|
4.7
|
%
|
|||||||||
|
Expenses:
|
|||||||||||||||||||||||||||||||||||||
|
Property operating expenses
|
$
|
3,403
|
|
$
|
841
|
|
$
|
4,244
|
|
$
|
3,523
|
|
$
|
324
|
|
$
|
3,847
|
|
$
|
120
|
|
3.4
|
%
|
$
|
(397
|
)
|
(9.4
|
)%
|
|||||||||
|
Real estate taxes
|
1,007
|
|
164
|
|
1,171
|
|
1,123
|
|
71
|
|
1,194
|
|
116
|
|
10.3
|
%
|
23
|
|
2.0
|
%
|
|||||||||||||||||
|
Total operating expenses
|
$
|
4,410
|
|
$
|
1,005
|
|
$
|
5,415
|
|
$
|
4,646
|
|
$
|
395
|
|
$
|
5,041
|
|
$
|
236
|
|
5.1
|
%
|
$
|
(374
|
)
|
(6.9
|
)%
|
|||||||||
|
Net operating income
|
$
|
60,080
|
|
$
|
17,818
|
|
$
|
77,898
|
|
$
|
59,478
|
|
$
|
15,058
|
|
$
|
74,536
|
|
$
|
602
|
|
1.0
|
%
|
$
|
3,362
|
|
4.5
|
%
|
|||||||||
|
Average occupancy for the period
|
98
|
%
|
N/A
|
|
98
|
%
|
98
|
%
|
N/A
|
|
95
|
%
|
|||||||||||||||||||||||||
|
Number of Properties
|
43
|
|
10
|
|
53
|
|
43
|
|
9
|
|
52
|
|
|||||||||||||||||||||||||
Multi-family Segment
Our multi-family portfolio continues to perform well with net operating income increasing
$7,830
or
18.2%
on a total segment basis for the year ended December 31, 2012 compared to the year ended December 31, 2011 and
$9,954
or
30.1%
for the year ended December 31, 2011 compared to the year ended December 31, 2010. The increases were a result of high occupancy which provided the ability to increase rental rates and decrease the concessions, specifically in 2011 and 2012. On a same store basis, net operating income increased
$3,965
or
9.2%
for the year ended December 31, 2012 compared to the year ended December 31, 2011 and
$5,775
or
17.8%
for the year ended December 31, 2011 compared to the year ended December 31, 2010. We believe these increases were a result of the single family housing market downturn and limited availability of credit for new or existing homeowners, which drove demand to multi-family apartments across the nation.
Our multi-family segment consists of conventional apartments and student housing. During 2010, 2011 and 2012, for conventional apartments we acquired 1,072 units and disposed of 3,068 units and for student housing we acquired and placed in service 2,566 student housing beds. During 2013, we anticipate placing one additional student housing property in service and one additional conventional multi-family property in service. During 2014, we anticipate placing another student housing property in service. We expect to see rental rates in the student housing and conventional multi-family continue to rise in 2013 and occupancy to remain consistent with 2012. In 2013, we expect our same store net operating income to be up over 2012 results.
|
|
Total Multi-family Properties
|
||||||||||
|
|
As of December 31,
|
||||||||||
|
|
2012
|
2011
|
2010
|
||||||||
|
Multi-family Properties
|
|||||||||||
|
Economic occupancy
|
92
|
%
|
92
|
%
|
92
|
%
|
|||||
|
End of month scheduled rent per multi-family unit per month
|
$
|
992
|
|
$
|
953
|
|
$
|
925
|
|
||
|
End of month scheduled rent per student housing bed per month
|
$
|
680
|
|
$
|
668
|
|
$
|
655
|
|
||
|
Investment in properties, undepreciated
|
$
|
892,043
|
|
$
|
737,767
|
|
$
|
705,711
|
|
||
50
Comparison of Years Ended
December 31, 2012 and 2011
The table below represents operating information for the multi-family segment and for the same store portfolio consisting of properties acquired prior to January 1, 2011. The properties in the same store portfolio were owned for the years ended
December 31, 2012 and 2011
.
|
Multi-family
|
For the year ended December 31,
2012
|
For the year ended December 31,
2011
|
Same Store
Portfolio
Change
Favorable/
(Unfavorable)
|
Total
Company
Change
Favorable/
(Unfavorable)
|
|||||||||||||||||||||||||||||||||
|
|
Same
Store
Portfolio
|
Non-Same
Store
|
Total
Company
|
Same
Store
Portfolio
|
Non-Same
Store
|
Total
Company
|
Amount
|
%
|
Amount
|
%
|
|||||||||||||||||||||||||||
|
Revenues:
|
|||||||||||||||||||||||||||||||||||||
|
Rental income
|
$
|
79,641
|
|
$
|
4,939
|
|
$
|
84,580
|
|
$
|
75,300
|
|
$
|
—
|
|
$
|
75,300
|
|
$
|
4,341
|
|
5.8
|
%
|
$
|
9,280
|
|
12.3
|
%
|
|||||||||
|
Straight line rental income
|
246
|
|
(11
|
)
|
235
|
|
225
|
|
—
|
|
225
|
|
21
|
|
9.3
|
%
|
10
|
|
4.4
|
%
|
|||||||||||||||||
|
Tenant recovery incomes
|
497
|
|
—
|
|
497
|
|
466
|
|
—
|
|
466
|
|
31
|
|
6.7
|
%
|
31
|
|
6.7
|
%
|
|||||||||||||||||
|
Other property income
|
6,234
|
|
350
|
|
6,584
|
|
6,243
|
|
—
|
|
6,243
|
|
(9
|
)
|
(0.1
|
)%
|
341
|
|
5.5
|
%
|
|||||||||||||||||
|
Total revenues
|
$
|
86,618
|
|
$
|
5,278
|
|
$
|
91,896
|
|
$
|
82,234
|
|
$
|
—
|
|
$
|
82,234
|
|
$
|
4,384
|
|
5.3
|
%
|
$
|
9,662
|
|
11.7
|
%
|
|||||||||
|
Expenses:
|
|||||||||||||||||||||||||||||||||||||
|
Property operating expenses
|
$
|
30,496
|
|
$
|
981
|
|
$
|
31,477
|
|
$
|
30,430
|
|
$
|
—
|
|
$
|
30,430
|
|
$
|
(66
|
)
|
(0.22
|
)%
|
$
|
(1,047
|
)
|
(3.4
|
)%
|
|||||||||
|
Real estate taxes
|
9,173
|
|
432
|
|
9,605
|
|
8,820
|
|
—
|
|
8,820
|
|
(353
|
)
|
(4.0
|
)%
|
(785
|
)
|
(8.9
|
)%
|
|||||||||||||||||
|
Total operating expenses
|
$
|
39,669
|
|
$
|
1,413
|
|
$
|
41,082
|
|
$
|
39,250
|
|
$
|
—
|
|
$
|
39,250
|
|
$
|
(419
|
)
|
(1.1
|
)%
|
$
|
(1,832
|
)
|
(4.7
|
)%
|
|||||||||
|
Net operating income
|
$
|
46,949
|
|
$
|
3,865
|
|
$
|
50,814
|
|
$
|
42,984
|
|
$
|
—
|
|
$
|
42,984
|
|
$
|
3,965
|
|
9.2
|
%
|
$
|
7,830
|
|
18.2
|
%
|
|||||||||
|
Average occupancy for the period
|
93
|
%
|
N/A
|
|
94
|
%
|
93
|
%
|
N/A
|
|
93
|
%
|
|||||||||||||||||||||||||
|
Number of Properties
|
22
|
|
4
|
|
26
|
|
22
|
|
—
|
|
22
|
|
|||||||||||||||||||||||||
Comparison of Years Ended December 31, 2011 and December 31, 2010
The table below represents operating information for the multi-family segment and for the same store portfolio consisting of properties acquired prior to January 1, 2010. The properties in the same store portfolio were owned for the years ended December 31, 2011 and December 31, 2010.
51
|
Multi-family
|
For the year ended December 31,
2011
|
For the year ended December 31,
2010
|
Same Store
Portfolio
Change Favorable/
(Unfavorable)
|
Total Company
Change
Favorable/
(Unfavorable)
|
|||||||||||||||||||||||||||||||||
|
|
Same
Store
Portfolio
|
Non-Same
Store
|
Total
Company
|
Same
Store
Portfolio
|
Non-Same
Store
|
Total
Company
|
Amount
|
%
|
Amount
|
%
|
|||||||||||||||||||||||||||
|
Revenues:
|
|||||||||||||||||||||||||||||||||||||
|
Rental income
|
$
|
68,252
|
|
$
|
7,048
|
|
$
|
75,300
|
|
$
|
63,413
|
|
$
|
2,263
|
|
$
|
65,676
|
|
$
|
4,839
|
|
7.6
|
%
|
$
|
9,624
|
|
14.7
|
%
|
|||||||||
|
Straight line rental income
|
145
|
|
80
|
|
225
|
|
232
|
|
(29
|
)
|
203
|
|
(87
|
)
|
(37.5
|
)%
|
22
|
|
10.8
|
%
|
|||||||||||||||||
|
Tenant recovery incomes
|
446
|
|
20
|
|
466
|
|
360
|
|
11
|
|
371
|
|
86
|
|
23.9
|
%
|
95
|
|
25.6
|
%
|
|||||||||||||||||
|
Other property income
|
5,592
|
|
651
|
|
6,243
|
|
5,253
|
|
190
|
|
5,443
|
|
339
|
|
6.5
|
%
|
800
|
|
14.7
|
%
|
|||||||||||||||||
|
Total revenues
|
74,435
|
|
7,799
|
|
82,234
|
|
69,258
|
|
2,435
|
|
71,693
|
|
5,177
|
|
7.5
|
%
|
10,541
|
|
14.7
|
%
|
|||||||||||||||||
|
Expenses:
|
|
|
|
|
|
|
|
|
|
|
|||||||||||||||||||||||||||
|
Property operating expenses
|
$
|
28,899
|
|
$
|
1,531
|
|
$
|
30,430
|
|
$
|
28,813
|
|
$
|
584
|
|
$
|
29,397
|
|
$
|
(86
|
)
|
(0.3
|
)%
|
$
|
(1,033
|
)
|
(3.4
|
)%
|
|||||||||
|
Real estate taxes
|
7,252
|
|
1,568
|
|
8,820
|
|
7,936
|
|
1,330
|
|
9,266
|
|
684
|
|
8.6
|
%
|
446
|
|
5.1
|
%
|
|||||||||||||||||
|
Total operating expenses
|
$
|
36,151
|
|
$
|
3,099
|
|
$
|
39,250
|
|
$
|
36,749
|
|
$
|
1,914
|
|
$
|
38,663
|
|
$
|
598
|
|
1.6
|
%
|
$
|
(587
|
)
|
(1.5
|
)%
|
|||||||||
|
Net operating income
|
$
|
38,284
|
|
$
|
4,700
|
|
$
|
42,984
|
|
$
|
32,509
|
|
$
|
521
|
|
$
|
33,030
|
|
$
|
5,775
|
|
17.8
|
%
|
$
|
9,954
|
|
30.1
|
%
|
|||||||||
|
Average occupancy for the period
|
93
|
%
|
N/A
|
|
94
|
%
|
92
|
%
|
N/A
|
|
92
|
%
|
|||||||||||||||||||||||||
|
Number of Properties
|
20
|
|
2
|
|
22
|
|
20
|
|
2
|
|
22
|
|
|||||||||||||||||||||||||
Developments
We have development projects that are in various stages of pre-development and development which are funded by borrowings secured by the properties and our equity. Specifically identifiable direct development and construction costs are capitalized, including, where applicable, salaries and related costs, real estate taxes and interest incurred in developing the property. These developments encompass the retail and multi-family segments.
The properties under development and all amounts set forth below are as of
December 31, 2012
. (Dollar amounts stated in thousands.)
|
Name
|
Location
(City, State)
|
Property Type
|
Square
Feet
|
Total Costs
Incurred to
Date ($) (a)
|
Total
Estimated
Costs ($)
(b)
|
Remaining
Costs to be
Funded by
Inland
American ($)
(c)
|
Note
Payable as
of
December 31,
2012 ($)
|
Estimated
Placed in
Service Date
(d) (e)
|
||||
|
Woodbridge
|
Wylie, TX
|
Retail
|
519,745
|
44,932
|
|
69,019
|
|
—
|
|
18,515
|
|
(f)
|
|
Cityville/Cityplace
|
Dallas, TX
|
Multi-family
|
356 units
|
53,840
|
|
62,169
|
|
—
|
|
24,070
|
|
Q2 2013 (e)
|
|
UH at Fullerton
|
Fullerton, CA
|
Student Housing
|
1,198 beds
|
113,327
|
|
128,501
|
|
—
|
|
60,570
|
|
Q3 2013 (e)
|
|
UH at Charlotte
|
Charlotte, NC
|
Student Housing
|
670 beds
|
3,465
|
|
43,230
|
|
15,307
|
|
—
|
|
Q3 2014
|
|
(a)
|
The Total Costs Incurred to Date represent total costs incurred for the development, including any costs allocated to parcels placed in service, but excluding capitalized interest.
|
|
(b)
|
The Total Estimated Costs represent 100% of the development’s estimated costs, including the acquisition cost of the land and building, if any, and excluding capitalized interest. The Total Estimated Costs are subject to change upon, or prior to, the completion of the development and include amounts required to lease the property.
|
|
(c)
|
We anticipate funding remaining development, to the extent any, through construction financing secured by the properties and equity contributions.
|
|
(d)
|
The Estimated Placed in Service Date represents the date the certificate of occupancy is currently anticipated to be obtained. Subsequent to obtaining the certificate of occupancy, each property will go through a lease-up period.
|
|
(e)
|
Leasing activities related to multi-family and student housing properties do not begin until six to nine months prior to the placed in service date.
|
|
(f)
|
Woodbridge is a retail shopping center and development is planned to be completed in phases. As the construction and lease-up of individual phases are completed, the respective phase will be placed in service resulting in a range of estimated placed in service dates through 2016. Of the costs incurred to date, $30,292 relates to phases that have been placed in service as of December 31, 2012.
|
52
As part of our restructure and foreclosure of the Stan Thomas note, we began overseeing as the secured lender certain roadway and utility infrastructure projects that will provide access to the 240 acre Sacramento Railyards property. The Railyards property is located immediately adjacent to, and to the north of, Sacramento’s central business district. The infrastructure projects were planned, approved and funded prior to the foreclosure of the Stan Thomas note. The Railyards property is the subject of a collaborative planning and infrastructure funding effort of various federal, state and local municipalities, and its development is scheduled to be completed in phases during the years 2013-2030. We are currently engaged in efforts both to either sell parcels within the Railyards or to sell the entire property to a master developer. The current book value, excluding capitalized interest, of the Railyards property is $113,832 as of
December 31, 2012
.
Critical Accounting Policies and Estimates
General
The preparation of financial statements in conformity with GAAP requires management to make estimates and assumptions in certain circumstances that affect amounts reported in the accompanying consolidated financial statements and related notes. This section discusses those critical accounting policies and estimates. These judgments often result from the need to make estimates about the effect of matters that are inherently uncertain. GAAP requires information in financial statements about accounting principles, methods used and disclosures pertaining to significant estimates. This discussion addresses our judgment pertaining to trends, events or uncertainties known which were taken into consideration upon the application of those policies.
Acquisitions
We allocate the purchase price of each acquired business between tangible and intangible assets at full fair value at the date of the transaction. Such tangible and intangible assets include land, building and improvements, acquired above market and below market leases, in-place lease value, customer relationships (if any), and any assumed financing that is determined to be above or below market terms. Any additional amounts are allocated to goodwill as required, based on the remaining purchase price in excess of the fair value of the tangible and intangible assets acquired and liabilities assumed. The allocation of the purchase price is an area that requires judgment and significant estimates.
We expense acquisition costs of all transactions as incurred. All costs related to finding, analyzing and negotiating a transaction are expensed as incurred as a general and administrative expense, whether or not the acquisition is completed. These expenses would include acquisition fees, if any, paid to an affiliate of our business manager.
Impairment
We assess the carrying values of the respective long-lived assets, whenever events or changes in circumstances indicate that the carrying amounts of these assets may not be fully recoverable, such as a reduction in the expected holding period of the asset. If it is determined that the carrying value is not recoverable because the undiscounted cash flows do not exceed carrying value, we are required to record an impairment loss to the extent that the carrying value exceeds fair value. The valuation and possible subsequent impairment of investment properties is a significant estimate that can and does change based on our continuous process of analyzing each property and reviewing assumptions about uncertain inherent factors, as well as the economic condition of the property at a particular point in time.
We also evaluate our equity method investments for impairment indicators. The valuation analysis considers the investment positions in relation to the underlying business and activities of our investment and identifies potential declines in fair value. An impairment loss should be recognized if a decline in value of the investment has occurred that is considered to be other than temporary, without ability to recover or sustain operations that would support the value of the investment.
Cost Capitalization and Depreciation Policies
Our policy is to review all expenses paid and capitalize any items which are deemed to be an upgrade or a tenant improvement. These costs are capitalized and included in the investment properties classification as an addition to buildings and improvements.
Buildings and improvements are depreciated on a straight-line basis based upon estimated useful lives of 30 years for buildings and improvements, and 5-15 years for site improvements and furniture, fixtures and equipment. Tenant improvements are depreciated on a straight-line basis over the life of the related lease as a component of depreciation and amortization expense. The portion of the purchase price allocated to acquired above market costs and acquired below market costs is amortized on a straight-line basis over the life of the related lease as an adjustment to net rental income. Acquired in-place lease costs, customer relationship value and other leasing costs are amortized on a straight-line basis over the life of the related lease as a component of amortization expense.
53
Cost capitalization and the estimate of useful lives requires our judgment and includes significant estimates that can and do change based on our process which periodically analyzes each property and on our assumptions about uncertain inherent factors.
Dispositions
The Company accounts for dispositions in accordance with Financial Accounting Standards Board (“FASB”) Accounting Standards Codification (“ASC”) 360-20, Real Estate Sales. The Company recognizes gain in full when real estate is sold, provided (a) the profit is determinable, that is, the collectability of the sales price is reasonably assured or the amount that will not be collectible can be estimated, and (b) the earnings process is virtually complete, that is, the seller is not obliged to perform significant activities after the sale to earn the profit. The Company records the transaction as discontinued operations for all periods presented in accordance with FASB ASC 205-20, Presentation of Financial Statements - Discontinued Operations.
Investment in Marketable Securities
We classify our investment in securities in one of three categories: trading, available-for-sale, or held-to-maturity. Trading securities are bought and held principally for the purpose of selling them in the near term. Held-to-maturity securities are those securities in which we have the ability and intent to hold the security until maturity. All securities not included in trading or held-to-maturity are classified as available-for-sale. Investment in securities at
December 31, 2012 and 2011
consists of common and preferred stock investments and investments in real estate related bonds that are all classified as available-for-sale securities and are recorded at fair value. Unrealized holding gains and losses on available-for-sale securities are excluded from earnings and reported as a separate component of other comprehensive income until realized. Realized gains and losses from the sale of available-for-sale securities are determined on a specific identification basis. A decline in the market value of any available-for-sale security below cost that is deemed to be other than temporary, results in a reduction in the carrying amount to fair value. The impairment is charged to earnings and a new cost basis for the security is established. When a security is impaired, management considers whether we have the ability and intent to hold the investment for a time sufficient to allow for any anticipated recovery in market value and considers whether evidence indicating the cost of the investment is recoverable outweighs evidence to the contrary. Evidence considered in this assessment includes the reasons for the impairment, the severity and duration of the impairment, changes in value subsequent to period end and forecasted performance of the investee.
Revenue Recognition
We commence revenue recognition on our leases based on a number of factors. In most cases, revenue recognition under a lease begins when the lessee takes possession of or controls the physical use of the leased asset. Generally, this occurs on the lease commencement date. The determination of who is the owner, for accounting purposes, of the tenant improvements determines the nature of the leased asset and when revenue recognition under a lease begins. If we are the owner, for accounting purposes, of the tenant improvements, then the leased asset is the finished space and revenue recognition begins when the lessee takes possession of the finished space, typically when the improvements are substantially complete. If we conclude we are not the owner, for accounting purposes, of the tenant improvements (the lessee is the owner), then the leased asset is the unimproved space and any tenant improvement allowances funded under the lease are treated as lease incentives which reduces revenue recognized over the term of the lease. In these circumstances, we begin revenue recognition when the lessee takes possession of the unimproved space for the lessee to construct their own improvements. We consider a number of different factors to evaluate whether it or the lessee is the owner of the tenant improvements for accounting purposes. These factors include:
|
•
|
whether the lease stipulates how and on what a tenant improvement allowance may be spent;
|
|
•
|
whether the tenant or landlord retains legal title to the improvements;
|
|
•
|
the uniqueness of the improvements;
|
|
•
|
the expected economic life of the tenant improvements relative to the length of the lease; and
|
|
•
|
who constructs or directs the construction of the improvements.
|
The determination of who owns the tenant improvements, for accounting purposes, is subject to significant judgment. In making that determination, we consider all of the above factors. No one factor, however, necessarily establishes its determination.
We recognize rental income on a straight-line basis over the term of each lease. The difference between rental income earned on a straight-line basis and the cash rent due under the provisions of the lease agreements is recorded as deferred rent receivable and is included as a component of accounts and rents receivable in the accompanying consolidated balance sheets.
54
Due to the impact of the straight-line basis, rental income generally is greater than the cash collected in the early years and decreases in the later years of a lease. We periodically review the collectability of outstanding receivables. Allowances are taken for those balances that we deem to be uncollectible, including any amounts relating to straight-line rent receivables.
Reimbursements from tenants for recoverable real estate tax and operating expenses are accrued as revenue in the period the applicable expenses are incurred. We make certain assumptions and judgments in estimating the reimbursements at the end of each reporting period. We do not expect the actual results to significantly differ from the estimated reimbursement.
We will recognize lease termination income if there is a signed termination letter agreement, all of the conditions of the agreement have been met, collectability is reasonably assured and the tenant is no longer occupying the property. Upon early lease termination, we will provide for losses related to unrecovered intangibles and other assets.
We recognize lodging operating revenue on an accrual basis consistent with operations.
Consolidation
We evaluate our investments in limited liability companies and partnerships to determine whether such entities may be a variable interest entity (“VIE”). If the entity is a VIE, the determination of whether we are the primary beneficiary must be made. We will consolidate a VIE if we are deemed to be the primary beneficiary, as defined in FASB ASC 810, Consolidation. The equity method of accounting is applied to entities in which we are not the primary beneficiary as defined FASB ASC 810, or the entity is not a VIE and we do not have effective control, but can exercise influence over the entity with respect to its operations and major decisions.
Income Taxes
We operate in a manner intended to enable each entity to qualify as a REIT under Sections 856 through 860 of the Internal Revenue Code of 1986, as amended. Under those sections, a REIT that distributes at least 90% of its “REIT taxable income” determined without regard to the deduction for dividends paid and by excluding any net capital gain to its stockholders each year and that meets certain other conditions will not be taxed on that portion of its taxable income which is distributed to its stockholders. If we fail to distribute the required amount of income to our stockholders, or fail to meet the various REIT requirements, without the benefit of certain relief provisions, we may fail to qualify as a REIT and substantial adverse tax consequences may result. Even if we qualify for taxation as a REIT, we may be subject to certain state and local taxes on our income, property, or net worth, and to federal income and excise taxes on our undistributed taxable income. In addition, taxable income from non-REIT activities managed through taxable REIT subsidiaries is subject to federal, state and local income taxes.
Liquidity and Capital Resources
As of December 31, 2012, we had
$220.8 million
of cash and cash equivalents. We continually evaluate the economic and credit environment and its impact on our business. Maintaining significant capital reserves has become a priority. We believe we are appropriately positioned to have significant cash to utilize in executing our strategy.
Short Term Liquidity and Capital Resources
On a short term basis, our principal demands for funds are to pay our corporate and operating expenses, as well as property capital expenditures, make distributions to our stockholders, and pay/make interest and principal payments on our current indebtedness. Our capital expenditures mainly consist of improvements to hotels, in which a portion is reserved for in restricted escrows. We are negotiating refinancing the remaining 2013 debt at terms that will most likely be at lower rates. We expect to meet our short term liquidity requirements from cash flow from operations, proceeds from our dividend reinvestment plan and distributions from our joint venture investments.
Long Term Liquidity and Capital Resources
On a long term basis, our objectives are to maximize revenue generated by our existing properties, to further enhance the value of our segments that produce attractive current yield and long-term risk-adjusted returns to our stockholders and to generate sustainable and predictable cash flow from our operations to distribute to our stockholders. We believe the increased performance of our lodging and multi-family segments as well as the repositioning of our retail and lodging properties will increase our operating cash flows.
Our principal demands for funds have been and will continue to be:
|
•
|
to pay our expenses and the operating expenses of our properties;
|
55
|
•
|
to make distributions to our stockholders;
|
|
•
|
to service or pay-down our debt;
|
|
•
|
to fund capital expenditures;
|
|
•
|
to invest in properties;
|
|
•
|
to fund joint ventures and development investments; and
|
|
•
|
to fund our share repurchase program.
|
Generally, our cash needs have been and will be funded from:
|
•
|
income earned on our investment properties;
|
|
•
|
interest income on investments and dividend and gain on sale income earned on our investment in marketable securities;
|
|
•
|
distributions from our joint venture investments;
|
|
•
|
proceeds from sales of properties;
|
|
•
|
proceeds from borrowings on properties; and
|
|
•
|
issuance of shares under our distribution reinvestment plan.
|
Distributions
We declared cash distributions to our stockholders per weighted average number of shares outstanding during the period from January 1, 2012 to December 31, 2012 totaling
$440.0 million
or $.50 per share, including amounts reinvested through the dividend reinvestment plan. During the year ended
December 31, 2012
, we paid cash distributions of
$439.2 million
. These cash distributions were paid with
$456.2 million
from our cash flow from operations,
$31.7 million
provided by distributions from unconsolidated entities, as well as
$40.7 million
from gain on sales of properties.
We continue to provide cash distributions to our stockholders from cash generated by our operations. The following chart summarizes the sources of our cash used to pay distributions. Our primary source of cash is cash flow provided by operating activities from our investments as presented in our cash flow statement. We also include distributions from unconsolidated entities to the extent that the underlying real estate operations in these entities generate these cash flows. Gain on sales of properties relate to net profits from the sale of certain properties. Our presentation is not intended to be an alternative to our consolidated statements of cash flow and does not present all the sources and uses of our cash.
The following table presents a historical view of our distribution coverage.
|
2012
|
2011
|
2010
|
2009
|
2008
|
|||||||||||
|
Cash flow provided by operations
|
$
|
456,221
|
|
397,949
|
|
356,660
|
|
369,031
|
|
384,365
|
|
||||
|
Distributions from unconsolidated entities
|
$
|
31,710
|
|
33,954
|
|
31,737
|
|
32,081
|
|
41,704
|
|
||||
|
Gain on sales of properties (1)
|
$
|
40,691
|
|
6,141
|
|
55,412
|
|
—
|
|
—
|
|
||||
|
Distributions declared
|
$
|
(440,031
|
)
|
(429,599
|
)
|
(417,885
|
)
|
(405,337
|
)
|
(418,694
|
)
|
||||
|
Excess (deficiency)
|
$
|
88,591
|
|
8,445
|
|
25,924
|
|
(4,225
|
)
|
7,375
|
|
||||
|
(1)
|
Excludes gains reflected on impaired values.
|
Cash flow from operations for the year ended December 31, 2012 included an increase in the accrued interest expense payable of $22,100 as compared to the year ended December 31, 2011. This was a result of a one-time change in timing of debt service payments from 2011 to 2012.
The following table presents a historical summary of distributions declared, distributions paid and distributions reinvested.
|
2012
|
2011
|
2010
|
2009
|
2008
|
|||||||||||
|
Distributions declared
|
$
|
440,031
|
|
429,599
|
|
417,885
|
|
405,337
|
|
418,694
|
|
||||
|
Distributions paid
|
$
|
439,188
|
|
428,650
|
|
416,935
|
|
411,797
|
|
405,925
|
|
||||
|
Distributions reinvested
|
$
|
191,785
|
|
199,591
|
|
207,296
|
|
231,306
|
|
242,113
|
|
||||
56
Acquisitions and Dispositions of Real Estate Investments
We acquired thirteen and ten properties during the years ended
December 31, 2012 and 2011
, respectively, which were funded with available cash, disposition proceeds, mortgage indebtedness, and the proceeds from the distribution reinvestment plan. We invested net cash of approximately
$447.9 million
and
$446.1 million
for these acquisitions. For the year ended
December 31, 2012
, we sold approximately 143 bank branches (142 retail branches and one office branch), four retail properties, 13 lodging properties, two industrial properties, and four multi-family properties, generating net sales proceeds of
$522.6 million
. Comparatively for the year ended
December 31, 2011
we sold 14 retail, six lodging, four office, one industrial, and one multi-family properties, generating net sales proceeds of
$246.3 million
.
Stock Offering
We have completed two public offerings of our common stock on a best efforts basis as well as offerings of common stock under our distribution reinvestment plan, or “DRP.” Under the DRP, as amended, the purchase price per share is equal to 100% of the “market price” of a share of the Company’s common stock until the shares become listed for trading. For reinvestments made after September 21, 2010 until December 29, 2011, the DRP purchase price was equal to $8.03 per share. After December 29, 2011 until December 19, 2012, the DRP purchase price was equal to $7.22 per share. After December 19, 2012 and until a new estimated value per share has been established, the DRP purchase price is $6.93 per share. We are permitted to offer shares pursuant to the DRP under the existing registration statement until the earlier of March 16, 2015 or the date we sell all $803.0 million worth of shares in the offering. At that time we would consider filing a new registration statement to permit the continued issuance of DRP shares. As of
December 31, 2012
, we had raised a total of approximately $8.8 billion of gross offering proceeds as a result of all of our offerings (inclusive of distribution reinvestments and net of redemptions).
During the year ended
December 31, 2012
, we sold a total of 26,571,399 shares and generated $191.8 million in gross offering proceeds under the DRP, as compared to 24,855,275 shares and $200.0 million during the year ended December 31, 2011. Our average distribution reinvestment plan participation was 44% for the year ended
December 31, 2012
, compared to 47% for the year ended
December 31, 2011
.
Share Repurchase Program
Our board adopted an Amended and Restated Share Repurchase Program, which was effective from April 11, 2011 through January 31, 2012 (the “First Amended Program”). Our board subsequently adopted a Second Amended and Restated Share Repurchase Program, which became effective as of February 1, 2012 (the “Second Amended Program”).
Under the Second Amended Program, we may repurchase shares of our common stock, on a quarterly basis, from the beneficiary of a stockholder that has died or from stockholders that have a “qualifying disability” or are confined to a “long-term care facility” (together, referred to herein as “hardship repurchases”). We are authorized to repurchase shares at a price per share equal to 100% of the most recently disclosed estimated per share value of our common stock, which currently is equal to $6.93 per share. Our obligation to repurchase any shares under the Second Amended Program is conditioned upon our having sufficient funds available to complete the repurchase. Our board has initially reserved $10.0 million per calendar quarter for the purpose of funding repurchases associated with death and $15.0 million per calendar quarter for the purpose of funding hardship repurchases. If the funds reserved for either category of repurchase under the Second Amended Program are insufficient to repurchase all of the shares for which repurchase requests have been received for a particular quarter, or if the number of shares accepted for repurchase would cause us to exceed the 5.0% limit set forth therein, we will repurchase the shares in the following order: (1) for death repurchases, we will repurchase shares in chronological order, based upon the beneficial owner’s date of death; and (2) for hardship repurchases, we will repurchase shares on a pro rata basis, up to, but not in excess of, the limits described herein; provided, that in the event that the repurchase would result in a stockholder owning less than 150 shares, we will repurchase all of that stockholder’s shares.
For the year ended December 31, 2012, we received requests for the repurchase of
7,668,711
shares of our common stock. Of these requests, we repurchased
6,334,187
shares of common stock for
$45.7 million
for the year ended
December 31, 2012
. In January 2013, we repurchased
1,334,524
shares of common stock for
$9.2 million
. There were no additional requests outstanding. The price per share for shares repurchased during the year ended December 31, 2012 was
$7.22
. The price per share for shares repurchased in January 2013 was
$6.93
. All repurchases were funded from proceeds from our distribution reinvestment plan. The table below summarizes the share repurchases.
|
Total number of share repurchase requests
|
Total number of shares repurchased
|
Price per share at date of redemption
|
Total value of shares repurchased
(in thousands)
|
||||||
|
For the year ended December 31, 2012
|
7,668,711
|
|
6,334,187
|
|
$7.22
|
$45,732
|
|||
|
January 2013
|
—
|
|
1,334,524
|
|
$6.93
|
$9,248
|
|||
57
Borrowings
The table below presents, on a consolidated basis, the principal amount, weighted average interest rates and maturity date (by year) on our mortgage debt as of
December 31, 2012
(dollar amounts are stated in thousands).
|
2013
|
2014
|
2015
|
2016
|
2017
|
Thereafter
|
Total
|
|||||||||||||||
|
Maturing debt :
|
|||||||||||||||||||||
|
Fixed rate debt (mortgage loans)
|
$
|
469,193
|
|
246,851
|
|
422,472
|
|
730,600
|
|
1,129,891
|
|
1,604,274
|
|
4,603,281
|
|
||||||
|
Variable rate debt (mortgage loans)
|
$
|
413,714
|
|
422,123
|
|
261,856
|
|
52,397
|
|
100,422
|
|
40,650
|
|
1,291,162
|
|
||||||
|
Weighted average interest rate on debt:
|
|||||||||||||||||||||
|
Fixed rate debt (mortgage loans)
|
5.90
|
%
|
5.50
|
%
|
5.59
|
%
|
5.58
|
%
|
5.74
|
%
|
5.63
|
%
|
5.67
|
%
|
|||||||
|
Variable rate debt (mortgage loans)
|
2.95
|
%
|
3.08
|
%
|
3.12
|
%
|
3.13
|
%
|
3.67
|
%
|
3.47
|
%
|
3.11
|
%
|
|||||||
The debt maturity excludes mortgage discounts associated with debt assumed at acquisition of which a discount of
$27.4
million, net of accumulated amortization, is outstanding as of
December 31, 2012
. Of the total outstanding debt, approximately
$691.5 million
is recourse to us.
As of
December 31, 2012
, we had approximately
$883
million and
$669
million in mortgage debt maturing in 2013 and 2014, respectively. We are negotiating refinancing the remaining 2013 debt maturities at terms that will most likely be at lower rates. We currently anticipate that we will be able to repay or refinance all of our debt on a timely basis, and believe we have adequate sources of funds to meet our short term cash needs. However, there can be no assurance that we can obtain such refinancing on satisfactory terms. Continued volatility in the capital markets could expose us to the risk of not being able to borrow on terms and conditions acceptable to us for future acquisitions or refinancings.
Mortgage loans outstanding as of
December 31, 2012 and 2011
were
$5.9
billion and $5.8 billion, respectively, and had a weighted average interest rate of
5.1%
and 5.2% per annum, respectively. For the years ended
December 31, 2012 and 2011
, we borrowed, net of paydowns,
$18.3 million
and $58.8 million, respectively, secured by our portfolio of marketable securities. For the years ended
December 31, 2012 and 2011
, we borrowed approximately
$709.3 million
and $1.2 billion, respectively, secured by mortgages on our properties and assumed
$232.0 million
and $0, respectively, of debt at acquisition.
Summary of Cash Flows
|
|
Year ended December 31,
|
||||||||||
|
|
2012
|
2011
|
2010
|
||||||||
|
|
(In thousands)
|
||||||||||
|
Cash provided by operating activities
|
$
|
456,221
|
|
$
|
397,949
|
|
$
|
356,660
|
|
||
|
Cash used in investing activities
|
(118,162
|
)
|
(286,896
|
)
|
(380,685
|
)
|
|||||
|
Cash used in financing activities
|
(335,443
|
)
|
(160,597
|
)
|
(208,759
|
)
|
|||||
|
Increase (decrease) in cash and cash equivalents
|
2,616
|
|
|
(49,544
|
)
|
(232,784
|
)
|
||||
|
Cash and cash equivalents, at beginning of year
|
218,163
|
|
267,707
|
|
500,491
|
|
|||||
|
Cash and cash equivalents, at end of year
|
$
|
220,779
|
|
$
|
218,163
|
|
|
$
|
267,707
|
|
|
Cash provided by operating activities was
$456
,
$398
and
$357
million for the years ended
December 31, 2012, 2011 and 2010
, respectively, and was generated primarily from operating income from property operations, and interest and dividends. The increase in operating cash flows from the years ended
December 31, 2010
to
December 31, 2011
to
December 31, 2012
was primarily due to the improved performance of the lodging and multi-family segments as well as a 2012 increase in the accrued interest expense payable of $22,100. This was a result of a one-time change in timing of debt service payments from 2011 to 2012.
58
Cash used in investing activities was
$118
,
$287
and
$381 million
for years ended
December 31, 2012, 2011 and 2010
, respectively. The decrease in cash used in investing activities from the years ended
December 31, 2011
to
December 31, 2012
was primarily due to the proceeds from the sale of our investment properties in 2012. The decrease in cash used in investing activities from the years ended
December 31, 2010
to
December 31, 2011
was primarily due to the proceeds from the sale of unconsolidated entities in 2011.
Cash used in financing activities was
$335
,
$161
and
$209
million for the years ended
December 31, 2012, 2011 and 2010
, respectively. The increase in cash used in financing activities from the years ended
December 31, 2011
to
December 31, 2012
was primarily due to a decrease in proceeds from our mortgage debt of $470 million in 2012, offset by the redemption of noncontrolling interest of $294 million in 2011. The decrease in cash used in financing activities from the years ended
December 31, 2010
to
December 31, 2011
was primarily due to the increase in proceeds from our mortgage debt of $747 million, offset by the increase in our payoffs of mortgage debt of $374 million and by the redemption of noncontrolling interest of $294 million.
We consider all demand deposits, money market accounts and investments in certificates of deposit and repurchase agreements with a maturity of three months or less, at the date of purchase, to be cash equivalents. We maintain our cash and cash equivalents at financial institutions. The combined account balances at one or more institutions periodically exceed the Federal Depository Insurance Corporation (“FDIC”) insurance coverage and, as a result, there is a concentration of credit risk related to amounts on deposit in excess of FDIC insurance coverage.
Off Balance Sheet Arrangements
Contractual Obligations
The table below presents, on a consolidated basis, obligations and commitments to make future payments under debt obligations (including interest), lease agreements, and margin accounts on our marketable securities portfolio as of
December 31, 2012
(dollar amounts are stated in thousands).
|
|
Payments due by period
|
||||||||||||||
|
Total
|
Less than
1 year
|
1-3 years
|
3-5 years
|
More than
5 years
|
|||||||||||
|
Long-Term Debt Obligations
|
$
|
7,533,793
|
|
1,156,473
|
|
2,797,593
|
|
2,096,386
|
|
1,483,341
|
|
||||
|
Ground Lease Payments
|
$
|
36,706
|
|
833
|
|
2,424
|
|
2,424
|
|
31,025
|
|
||||
|
Margins Payable
|
$
|
139,142
|
|
139,142
|
|
—
|
|
—
|
|
—
|
|
||||
Of the total long-term debt obligations, approximately
$691.5 million
is recourse to the Company.
We have acquired several properties subject to the obligation to pay the seller additional monies depending on the future leasing and occupancy of the property. These earnout payments are based on a predetermined formula. Each earnout agreement has a time limit regarding the obligation to pay any additional monies. If at the end of the time period, certain space has not been leased and occupied, we will not have any further obligation. Assuming all the conditions are satisfied, as of
December 31, 2012
, we would be obligated to pay as much as $6.4 million in the future as vacant space covered by these earnout agreements is occupied and becomes rent producing. The information in the above table does not reflect these contractual obligations.
Unconsolidated Real Estate Joint Ventures
Unconsolidated joint ventures are those where we have substantial influence over but do not control the entity. We account for our interest in these ventures using the equity method of accounting. For additional discussion of our investments in joint ventures. Please refer to Note 5 in our consolidated financial statements in Item 8 of this Annual Report on Form 10-K, which is incorporated by reference into this Item 7. Our ownership percentage and related investment in each joint venture is summarized in the following table. (Dollar amounts stated in thousands.)
59
|
Joint Venture
|
Ownership %
|
Investment at
December 31, 2012
|
||||
|
Cobalt Industrial REIT II
|
36
|
%
|
102,599
|
|
||
|
D.R. Stephens Institutional Fund, LLC
|
90
|
%
|
34,541
|
|
||
|
Brixmor/IA JV, LLC
|
(a)
|
|
90,315
|
|
||
|
Other Unconsolidated Joint Ventures
|
Various
|
|
26,344
|
|
||
|
$
|
253,799
|
|
||||
|
(a)
|
We have preferred membership interest and are entitled to a 11% preferred dividend in Brixmor/IA JV, LLC (formerly Centro/IA JV LLC).
|
Subsequent Events
Subsequent to December 31, 2012, we purchased one retail property, two lodging properties, and one student housing property for a gross acquisition price of $119,900.
We are subject to market risk associated with changes in interest rates both in terms of variable-rate debt and the price of new fixed-rate debt upon maturity of existing debt and for acquisitions. We are also subject to market risk associated with our marketable securities investments.
Our interest rate risk management objectives are to limit the impact of interest rate changes on earnings and cash flows and to lower our overall borrowing costs. If market rates of interest on all of the floating rate debt as of
December 31, 2012
permanently increased by 1%, the increase in interest expense on the floating rate debt would decrease future earnings and cash flows by approximately $12.9 million. If market rates of interest on all of the floating rate debt as of
December 31, 2012
permanently decreased by 1%, the decrease in interest expense on the floating rate debt would increase future earnings and cash flows by approximately $12.9 million.
With regard to our variable rate financing, we assess interest rate cash flow risk by continually identifying and monitoring changes in interest rate exposures that may adversely impact expected future cash flows and by evaluating hedging opportunities. We maintain risk management control systems to monitor interest rate cash flow risk attributable to both of our outstanding or forecasted debt obligations as well as our potential offsetting hedge positions. The risk management control systems involve the use of analytical techniques, including cash flow sensitivity analysis, to estimate the expected impact of changes in interest rates on our future cash flows.
We monitor interest rate risk using a variety of techniques, including periodically evaluating fixed interest rate quotes on all variable rate debt and the costs associated with converting the debt to fixed rate debt. Also, existing fixed and variable rate loans that are scheduled to mature in the next year or two are evaluated for possible early refinancing and or extension due to consideration given to current interest rates. Refer to our Borrowings table in Item 7 of this Annual Report on Form 10-K for mortgage debt principal amounts and weighted average interest rates by year and expected maturity to evaluate the expected cash flows and sensitivity to interest rate changes.
We use derivative financial instruments to hedge exposures to changes in interest rates on loans secured by our properties. To the extent we do, we are exposed to credit risk and market risk. Credit risk is the failure of the counterparty to perform under the terms of the derivative contract. When the fair value of a derivative contract is positive, the counterparty owes us, which creates credit risk for us. When the fair value of a derivative contract is negative, we owe the counterparty and, therefore, it does not possess credit risk. It is our policy to enter into these transactions with the same party providing the financing. In the alternative, we seek to minimize the credit risk in derivative instruments by entering into transactions with what we believe are high-quality counterparties. Market risk is the adverse effect on the value of a financial instrument that results from a change in interest rates. The market risk associated with interest-rate contracts is managed by establishing and monitoring parameters that limit the types and degree of market risk that may be undertaken.
We have entered into nine interest rate swap agreements that have converted
$176.4 million
or 9% of our variable rate mortgage loans from variable to fixed rates. As of
December 31, 2012
, the pay rates ranged from 0.79% to 3.32% with maturity dates from January 2, 2013 to September 29, 2014. The interest rate swaps have a notional amount of
$176.4 million
and fair
60
value at
$0.9 million
and $2.3 million as of
December 31, 2012 and 2011
, respectively. Please refer to Note 11 in our consolidated financial statements in Item 8 of this Annual Report on Form 10-K, which is incorporated by reference into this Item 7.
We have, and may in the future enter into, derivative positions that do not qualify for hedge accounting treatment. The gains or losses resulting from marking-to-market, these derivatives at the end of each reporting period are recognized as an increase or decrease in “interest expense” on our consolidated statements of income. In addition, we are, and may in the future be, subject to additional expense based on the notional amount of the derivative positions and a specified spread over LIBOR.
Equity Price Risk
We are exposed to equity price risk as a result of our investments in marketable equity securities. Equity price risk is based on volatility of equity prices and the values of corresponding equity indices.
Other than temporary impairments on our investments in marketable securities were
$1.9
, $24.4 and $1.9 million for the years ended
December 31, 2012, 2011 and 2010
, respectively. We believe that our investments will continue to generate dividend income and we could continue to recognize gains on sale. However, due to general economic and credit market uncertainties it is difficult to project where the REIT market and our portfolio will perform in 2013.
Although it is difficult to project what factors may affect the prices of equity sectors and how much the effect might be, the table below illustrates the impact of a 10% increase and a 10% decrease in the price of the equities held by us would have on the value of the total assets and the book value of the Company as of
December 31, 2012
(dollar amounts stated in thousands).
|
Cost
|
Fair Value
|
Hypothetical 10%
Decrease in
Market Value
|
Hypothetical 10%
Increase in
Market Value
|
|||||||||
|
Equity securities
|
$
|
222,126
|
|
304,811
|
|
274,330
|
|
335,292
|
|
|||
61
INLAND AMERICAN REAL ESTATE TRUST, INC.
(A Maryland Corporation)
Index
|
|
Page
|
|
Financial Statements:
|
|
Schedules not filed:
All schedules other than the ones listed in the Index have been omitted as the required information is inapplicable or the information is presented in the financial statements or related notes.
62
Report of Independent Registered Public Accounting Firm
The Board of Directors and Stockholders
Inland American Real Estate Trust, Inc.:
We have audited the accompanying consolidated balance sheets of Inland American Real Estate Trust, Inc. (the Company) as of December 31, 2012 and 2011, and the related consolidated statements of operations and other comprehensive income, changes in equity, and cash flows for each of the years in the three-year period ended December 31, 2012. In connection with our audits of the consolidated financial statements, we also have audited the financial statement schedule III. These consolidated financial statements and financial statement schedule III are the responsibility of the Company’s management. Our responsibility is to express an opinion on these consolidated financial statements and financial statement schedule III based on our audits.
We conducted our audits in accordance with the standards of the Public Company Accounting Oversight
Board (United States). Those standards require that we plan and perform the audit to obtain reasonable assurance about whether the financial statements are free of material misstatement. An audit includes examining, on a test basis, evidence supporting the amounts and disclosures in the financial statements. An audit also includes assessing the accounting principles used and significant estimates made by management, as well as evaluating the overall financial statement presentation. We believe that our audits provide a reasonable basis for our opinion.
In our opinion, the consolidated financial statements referred to above present fairly, in all material respects, the financial position of Inland American Real Estate Trust, Inc. as of December 31, 2012 and 2011, and the results of their operations and their cash flows for each of the years in the three-year period ended December 31, 2012, in conformity with U.S. generally accepted accounting principles. Also, in our opinion, the related financial statement schedule III, when considered in relation to the basic consolidated financial statements taken as a whole, presents fairly, in all material respects, the information set forth therein.
/S/ KPMG LLP
Chicago, Illinois
March 12, 2013
63
INLAND AMERICAN REAL ESTATE TRUST, INC.
(A Maryland Corporation)
(Dollar amounts in thousands, except share amounts)
|
|
December 31,
2012 |
December 31,
2011 |
|||||
|
Assets
|
|
|
|||||
|
Assets:
|
|
|
|||||
|
Investment properties:
|
|
|
|||||
|
Land
|
$
|
1,882,715
|
|
$
|
1,938,637
|
|
|
|
Building and other improvements
|
8,679,105
|
|
8,465,602
|
|
|||
|
Construction in progress
|
337,384
|
|
323,842
|
|
|||
|
Total
|
10,899,204
|
|
10,728,081
|
|
|||
|
Less accumulated depreciation
|
(1,581,524
|
)
|
(1,301,899
|
)
|
|||
|
Net investment properties
|
9,317,680
|
|
9,426,182
|
|
|||
|
Cash and cash equivalents
|
220,779
|
|
218,163
|
|
|||
|
Restricted cash and escrows
|
104,027
|
|
98,444
|
|
|||
|
Investment in marketable securities
|
327,655
|
|
289,365
|
|
|||
|
Investment in unconsolidated entities
|
253,799
|
|
316,711
|
|
|||
|
Accounts and rents receivable (net of allowance of $10,348 and $9,488)
|
121,773
|
|
114,615
|
|
|||
|
Intangible assets, net
|
298,828
|
|
326,332
|
|
|||
|
Deferred costs and other assets
|
115,343
|
|
129,378
|
|
|||
|
Total assets
|
$
|
10,759,884
|
|
$
|
10,919,190
|
|
|
|
Liabilities and Equity
|
|
|
|||||
|
Liabilities:
|
|
|
|||||
|
Mortgages, notes and margins payable, net
|
$
|
6,006,146
|
|
$
|
5,902,712
|
|
|
|
Accounts payable and accrued expenses
|
142,835
|
|
105,153
|
|
|||
|
Distributions payable
|
37,059
|
|
36,216
|
|
|||
|
Intangible liabilities, net
|
80,769
|
|
83,203
|
|
|||
|
Other liabilities
|
150,325
|
|
128,592
|
|
|||
|
Total liabilities
|
6,417,134
|
|
6,255,876
|
|
|||
|
Commitments and contingencies
|
|
|
|
|
|||
|
Stockholders’ equity:
|
|
|
|||||
|
Preferred stock, $.001 par value, 40,000,000 shares authorized, none outstanding
|
—
|
|
—
|
|
|||
|
Common stock, $.001 par value, 1,460,000,000 shares authorized, 889,424,572 and 869,187,360 shares issued and outstanding
|
889
|
|
869
|
|
|||
|
Additional paid in capital
|
7,921,913
|
|
7,775,880
|
|
|||
|
Accumulated distributions in excess of net loss
|
(3,664,591
|
)
|
(3,155,222
|
)
|
|||
|
Accumulated other comprehensive income
|
84,414
|
|
41,948
|
|
|||
|
Total Company stockholders’ equity
|
4,342,625
|
|
4,663,475
|
|
|||
|
Noncontrolling interests
|
125
|
|
(161
|
)
|
|||
|
Total equity
|
4,342,750
|
|
4,663,314
|
|
|||
|
Total liabilities and equity
|
$
|
10,759,884
|
|
$
|
10,919,190
|
|
|
See accompanying notes to the consolidated financial statements.
64
INLAND AMERICAN REAL ESTATE TRUST, INC.
(A Maryland Corporation)
(Dollar amounts in thousands, except per share amounts)
|
|
Year ended
December 31, 2012 |
Year ended
December 31, 2011 |
Year ended
December 31, 2010 |
||||||||
|
Income:
|
|
|
|
||||||||
|
Rental income
|
$
|
622,954
|
|
$
|
594,946
|
|
$
|
560,350
|
|
||
|
Tenant recovery income
|
98,770
|
|
90,213
|
|
85,263
|
|
|||||
|
Other property income
|
15,244
|
|
16,462
|
|
14,544
|
|
|||||
|
Lodging income
|
700,427
|
|
526,252
|
|
434,539
|
|
|||||
|
Total income
|
1,437,395
|
|
1,227,873
|
|
1,094,696
|
|
|||||
|
Expenses:
|
|
|
|
||||||||
|
General and administrative expenses
|
36,814
|
|
31,032
|
|
36,665
|
|
|||||
|
Property operating expenses
|
128,096
|
|
127,676
|
|
119,005
|
|
|||||
|
Lodging operating expenses
|
454,417
|
|
335,372
|
|
275,398
|
|
|||||
|
Real estate taxes
|
98,495
|
|
86,292
|
|
80,370
|
|
|||||
|
Depreciation and amortization
|
424,236
|
|
407,968
|
|
390,166
|
|
|||||
|
Business management fee
|
39,892
|
|
40,000
|
|
36,000
|
|
|||||
|
Provision for asset impairment
|
77,348
|
|
28,967
|
|
—
|
|
|||||
|
Provision for notes receivable impairment
|
—
|
|
—
|
|
111,896
|
|
|||||
|
Total expenses
|
1,259,298
|
|
1,057,307
|
|
1,049,500
|
|
|||||
|
Operating income
|
$
|
178,097
|
|
$
|
170,566
|
|
$
|
45,196
|
|
||
|
Interest and dividend income
|
23,386
|
|
22,860
|
|
33,068
|
|
|||||
|
Other income
|
2,710
|
|
19,145
|
|
3,095
|
|
|||||
|
Interest expense
|
(306,047
|
)
|
(295,447
|
)
|
(271,360
|
)
|
|||||
|
Equity in income (loss) of unconsolidated entities
|
1,998
|
|
(12,802
|
)
|
(18,684
|
)
|
|||||
|
Gain, (loss) and (impairment) of investment in unconsolidated entities, net
|
(12,322
|
)
|
(106,023
|
)
|
(11,239
|
)
|
|||||
|
Realized gain, (loss) and (impairment) on securities, net
|
4,319
|
|
(16,219
|
)
|
21,073
|
|
|||||
|
Loss before income taxes
|
$
|
(107,859
|
)
|
$
|
(217,920
|
)
|
$
|
(198,851
|
)
|
||
|
Income tax benefit (expense)
|
(7,771
|
)
|
3,387
|
|
4,518
|
|
|||||
|
Net loss from continuing operations
|
$
|
(115,630
|
)
|
$
|
(214,533
|
)
|
$
|
(194,333
|
)
|
||
|
Income (loss) from discontinued operations, net
|
$
|
51,981
|
|
$
|
(95,012
|
)
|
$
|
27,041
|
|
||
|
Net loss
|
$
|
(63,649
|
)
|
$
|
(309,545
|
)
|
$
|
(167,292
|
)
|
||
|
Less: Net income attributable to noncontrolling interests
|
(5,689
|
)
|
(6,708
|
)
|
(9,139
|
)
|
|||||
|
Net loss attributable to Company
|
$
|
(69,338
|
)
|
$
|
(316,253
|
)
|
$
|
(176,431
|
)
|
||
|
Net loss, per common share, from continuing operations, basic and diluted
|
(0.14
|
)
|
(0.26
|
)
|
(0.24
|
)
|
|||||
|
Net income (loss), per common share, from discontinued operations, basic and diluted
|
0.06
|
|
(0.11
|
)
|
0.03
|
|
|||||
|
Net loss, per common share, basic and diluted
|
(0.08
|
)
|
(0.37
|
)
|
(0.21
|
)
|
|||||
|
Weighted average number of common shares outstanding, basic and diluted
|
$
|
879,685,949
|
|
$
|
858,637,707
|
|
$
|
835,131,057
|
|
||
|
Other comprehensive income (loss):
|
|
|
|
|
|
|
|||||
|
Unrealized gain (loss) on investment securities
|
$
|
45,372
|
|
$
|
(24,950
|
)
|
$
|
40,491
|
|
||
|
Reversal of unrealized (gain) loss to realized gain (loss) on investment securities
|
$
|
(4,319
|
)
|
$
|
16,219
|
|
$
|
(21,073
|
)
|
||
|
Unrealized gain on derivatives
|
$
|
1,413
|
|
$
|
1,249
|
|
$
|
300
|
|
||
|
Comprehensive loss attributable to the Company
|
(26,872
|
)
|
(323,735
|
)
|
(156,713
|
)
|
|||||
See accompanying notes to the consolidated financial statements.
65
INLAND AMERICAN REAL ESTATE TRUST, INC.
(A Maryland Corporation)
66
INLAND AMERICAN REAL ESTATE TRUST, INC.
(A Maryland Corporation)
Consolidated Statements of Changes in Equity
(Dollar amounts in thousands)
For the years ended
December 31, 2012, 2011 and 2010
|
|
Number of
Shares |
Common
Stock |
Additional
Paid-in Capital |
Accumulated
Distributions in excess of Net Loss |
Accumulated
Other Comprehensive Income (Loss) |
Noncontrolling
Interests |
Total
|
Noncontrolling
Redeemable Interests |
|||||||||||||||
|
Balance at January 1, 2010
|
823,619,190
|
|
824
|
|
7,397,831
|
|
(1,815,054
|
)
|
29,712
|
|
18,869
|
|
5,632,182
|
|
264,132
|
|
|||||||
|
Net income (loss)
|
—
|
|
—
|
|
—
|
|
(176,431
|
)
|
—
|
|
(106
|
)
|
(176,537
|
)
|
9,245
|
|
|||||||
|
Unrealized gain on investment securities
|
—
|
|
—
|
|
—
|
|
—
|
|
40,491
|
|
—
|
|
40,491
|
|
—
|
|
|||||||
|
Reversal of unrealized gain to realized gain on investment securities
|
—
|
|
—
|
|
—
|
|
—
|
|
(21,073
|
)
|
—
|
|
(21,073
|
)
|
—
|
|
|||||||
|
Unrealized gain on derivatives
|
—
|
|
—
|
|
—
|
|
—
|
|
300
|
|
—
|
|
300
|
|
—
|
|
|||||||
|
Distributions declared
|
—
|
|
—
|
|
—
|
|
(417,885
|
)
|
—
|
|
(2,237
|
)
|
(420,122
|
)
|
(9,245
|
)
|
|||||||
|
Contributions from noncontrolling interests
|
—
|
|
—
|
|
—
|
|
—
|
|
—
|
|
855
|
|
855
|
|
—
|
|
|||||||
|
Proceeds from distribution reinvestment program
|
22,787,584
|
|
22
|
|
207,274
|
|
—
|
|
—
|
|
—
|
|
207,296
|
|
—
|
|
|||||||
|
Balance at December 31, 2010
|
846,406,774
|
|
846
|
|
7,605,105
|
|
(2,409,370
|
)
|
49,430
|
|
17,381
|
|
5,263,392
|
|
264,132
|
|
|||||||
See accompanying notes to the consolidated financial statements.
67
INLAND AMERICAN REAL ESTATE TRUST, INC.
(A Maryland Corporation)
Consolidated Statements of Changes in Equity
(continued)
(Dollar amounts in thousands)
For the years ended
December 31, 2012, 2011 and 2010
|
Number of
Shares |
Common
Stock |
Additional
Paid-in Capital |
Accumulated
Distributions in excess of Net Loss |
Accumulated
Other Comprehensive Income (Loss) |
Noncontrolling
Interests |
Total
|
Noncontrolling
Redeemable Interests |
||||||||||||||||
|
Balance at January 1, 2011
|
846,406,774
|
|
846
|
|
7,605,105
|
|
(2,409,370
|
)
|
49,430
|
|
17,381
|
|
5,263,392
|
|
264,132
|
|
|||||||
|
Net income (loss)
|
—
|
|
—
|
|
—
|
|
(316,253
|
)
|
—
|
|
(1,183
|
)
|
(317,436
|
)
|
7,891
|
|
|||||||
|
Unrealized loss on investment securities
|
—
|
|
—
|
|
—
|
|
—
|
|
(24,950
|
)
|
—
|
|
(24,950
|
)
|
—
|
|
|||||||
|
Reversal of unrealized loss to realized loss on investment securities
|
—
|
|
—
|
|
—
|
|
—
|
|
16,219
|
|
—
|
|
16,219
|
|
—
|
|
|||||||
|
Unrealized gain on derivatives
|
—
|
|
—
|
|
—
|
|
—
|
|
1,249
|
|
—
|
|
1,249
|
|
—
|
|
|||||||
|
Distributions declared
|
—
|
|
—
|
|
—
|
|
(429,599
|
)
|
—
|
|
(660
|
)
|
(430,259
|
)
|
(7,891
|
)
|
|||||||
|
Adjustment to redemption value for noncontrolling interest
|
—
|
|
—
|
|
(13,793
|
)
|
—
|
|
—
|
|
(15,555
|
)
|
(29,348
|
)
|
29,348
|
|
|||||||
|
Contributions from noncontrolling interests
|
—
|
|
—
|
|
—
|
|
—
|
|
—
|
|
651
|
|
651
|
|
—
|
|
|||||||
|
Redemption of noncontrolling interests
|
—
|
|
—
|
|
—
|
|
—
|
|
—
|
|
(795
|
)
|
(795
|
)
|
(293,480
|
)
|
|||||||
|
Proceeds from distribution reinvestment program
|
24,855,275
|
|
25
|
|
199,566
|
|
—
|
|
—
|
|
—
|
|
199,591
|
|
—
|
|
|||||||
|
Share repurchase program
|
(2,074,689
|
)
|
(2
|
)
|
(14,998
|
)
|
—
|
|
—
|
|
—
|
|
(15,000
|
)
|
—
|
|
|||||||
|
Balance at December 31, 2011
|
869,187,360
|
|
869
|
|
7,775,880
|
|
(3,155,222
|
)
|
41,948
|
|
(161
|
)
|
4,663,314
|
|
—
|
|
|||||||
See accompanying notes to the consolidated financial statements.
68
INLAND AMERICAN REAL ESTATE TRUST, INC.
(A Maryland Corporation)
Consolidated Statements of Changes in Equity
(continued)
(Dollar amounts in thousands)
For the years ended
December 31, 2012, 2011 and 2010
|
Number of
Shares |
Common
Stock |
Additional
Paid-in Capital |
Accumulated
Distributions in excess of Net Loss |
Accumulated
Other Comprehensive Income (Loss) |
Noncontrolling
Interests |
Total
|
||||||||||||||||||||
|
Balance at January 1, 2012
|
869,187,360
|
|
$
|
869
|
|
$
|
7,775,880
|
|
$
|
(3,155,222
|
)
|
$
|
41,948
|
|
$
|
(161
|
)
|
$
|
4,663,314
|
|
||||||
|
Net income (loss)
|
—
|
|
—
|
|
—
|
|
(69,338
|
)
|
—
|
|
5,689
|
|
(63,649
|
)
|
||||||||||||
|
Unrealized loss on investment securities
|
—
|
|
—
|
|
—
|
|
—
|
|
45,372
|
|
—
|
|
45,372
|
|
||||||||||||
|
Reversal of unrealized loss to realized loss on investment securities
|
—
|
|
—
|
|
—
|
|
—
|
|
(4,319
|
)
|
—
|
|
(4,319
|
)
|
||||||||||||
|
Unrealized gain on derivatives
|
—
|
|
—
|
|
—
|
|
—
|
|
1,413
|
|
—
|
|
1,413
|
|
||||||||||||
|
Contributions/(distributions) declared, net
|
—
|
|
—
|
|
—
|
|
(440,031
|
)
|
—
|
|
(3,806
|
)
|
(443,837
|
)
|
||||||||||||
|
Disposal of noncontrolling interest
|
—
|
|
—
|
|
—
|
|
—
|
|
—
|
|
(1,597
|
)
|
(1,597
|
)
|
||||||||||||
|
Proceeds from distribution reinvestment program
|
26,571,399
|
|
26
|
|
191,759
|
|
—
|
|
—
|
|
—
|
|
191,785
|
|
||||||||||||
|
Share repurchase program
|
(6,334,187
|
)
|
(6
|
)
|
(45,726
|
)
|
—
|
|
—
|
|
—
|
|
(45,732
|
)
|
||||||||||||
|
Balance at December 31, 2012
|
889,424,572
|
|
$
|
889
|
|
$
|
7,921,913
|
|
$
|
(3,664,591
|
)
|
$
|
84,414
|
|
$
|
125
|
|
$
|
4,342,750
|
|
||||||
See accompanying notes to the consolidated financial statements.
69
INLAND AMERICAN REAL ESTATE TRUST, INC.
(A Maryland Corporation)
(Dollar amounts in thousands)
|
|
Year ended
December 31, 2012 |
Year ended
December 31, 2011 |
Year ended
December 31, 2010 |
||||||||
|
Cash flows from operating activities:
|
|
|
|
||||||||
|
Net loss
|
$
|
(63,649
|
)
|
$
|
(309,545
|
)
|
$
|
(167,292
|
)
|
||
|
Adjustments to reconcile net loss to net cash provided by operating activities:
|
|
|
|
||||||||
|
Depreciation and amortization
|
438,755
|
|
439,759
|
|
443,787
|
|
|||||
|
Amortization of above and below market leases, net
|
(2,271
|
)
|
(1,326
|
)
|
(433
|
)
|
|||||
|
Amortization of debt premiums, discounts, and financing costs
|
16,107
|
|
20,430
|
|
18,424
|
|
|||||
|
Straight-line rental income
|
(11,010
|
)
|
(13,841
|
)
|
(17,705
|
)
|
|||||
|
Gain on extinguishment of debt
|
(9,478
|
)
|
(10,848
|
)
|
(19,227
|
)
|
|||||
|
Gain on sale of property, net
|
(40,691
|
)
|
(16,510
|
)
|
(55,412
|
)
|
|||||
|
(Gain) loss on consolidated investment
|
—
|
|
—
|
|
(433
|
)
|
|||||
|
Provision for asset impairment
|
83,316
|
|
163,641
|
|
47,529
|
|
|||||
|
Impairment of notes receivable
|
—
|
|
—
|
|
111,896
|
|
|||||
|
Equity in (income) loss of unconsolidated of entities
|
(1,998
|
)
|
12,802
|
|
18,684
|
|
|||||
|
Distributions from unconsolidated entities
|
7,171
|
|
9,849
|
|
3,887
|
|
|||||
|
(Gain), loss and impairment of investment in unconsolidated entities, net
|
12,322
|
|
106,023
|
|
11,239
|
|
|||||
|
Realized (gain) loss on investments in securities
|
(6,218
|
)
|
(8,137
|
)
|
(22,929
|
)
|
|||||
|
Impairment of investments in securities
|
1,899
|
|
24,356
|
|
1,856
|
|
|||||
|
Other non-cash adjustments
|
2,019
|
|
(18,649
|
)
|
(278
|
)
|
|||||
|
Changes in assets and liabilities:
|
|
|
|
||||||||
|
Accounts and rents receivable
|
(603
|
)
|
(855
|
)
|
(3,612
|
)
|
|||||
|
Deferred costs and other assets
|
(3,005
|
)
|
(12,138
|
)
|
580
|
|
|||||
|
Accounts payable and accrued expenses
|
33,205
|
|
7,492
|
|
(6,958
|
)
|
|||||
|
Other liabilities
|
350
|
|
5,446
|
|
(6,943
|
)
|
|||||
|
Net cash flows provided by operating activities
|
456,221
|
|
397,949
|
|
356,660
|
|
|||||
|
Cash flows from investing activities:
|
|
|
|
||||||||
|
Purchase of investment properties
|
(447,909
|
)
|
(446,096
|
)
|
(365,427
|
)
|
|||||
|
Acquired in-place and market-lease intangibles, net
|
(15,838
|
)
|
(18,231
|
)
|
(74,841
|
)
|
|||||
|
Acquired goodwill
|
(23,735
|
)
|
—
|
|
—
|
|
|||||
|
Capital expenditures and tenant improvements
|
(89,578
|
)
|
(71,157
|
)
|
(109,827
|
)
|
|||||
|
Investment in development projects
|
(109,441
|
)
|
(74,850
|
)
|
(56,894
|
)
|
|||||
|
Sale of investment properties
|
522,583
|
|
246,317
|
|
301,189
|
|
|||||
|
Purchase of investment securities
|
(23,015
|
)
|
(79,147
|
)
|
(86,986
|
)
|
|||||
|
Sale of investment securities
|
30,095
|
|
33,558
|
|
75,812
|
|
|||||
|
Investment in unconsolidated entities
|
—
|
|
(409
|
)
|
(60,043
|
)
|
|||||
|
Proceeds from the sale of and return of capital from unconsolidated entities
|
13,706
|
|
100,408
|
|
—
|
|
|||||
|
Distributions from unconsolidated entities
|
31,710
|
|
33,954
|
|
31,737
|
|
|||||
|
Payment of leasing fees and franchise fees
|
(11,341
|
)
|
(9,772
|
)
|
(8,211
|
)
|
|||||
|
Purchase of note receivable
|
—
|
|
—
|
|
(34,253
|
)
|
|||||
|
Payments from notes receivable
|
26
|
|
18,443
|
|
26,141
|
|
|||||
|
Restricted escrows
|
(4,735
|
)
|
(6,567
|
)
|
(23,179
|
)
|
|||||
|
Other assets
|
9,310
|
|
(13,347
|
)
|
4,097
|
|
|||||
|
Net cash flows used in investing activities
|
(118,162
|
)
|
(286,896
|
)
|
(380,685
|
)
|
|||||
See accompanying notes to the consolidated financial statements.
70
INLAND AMERICAN REAL ESTATE TRUST, INC.
(A Maryland Corporation)
Consolidated Statements of Cash Flows
(continued)
(Dollar amounts in thousands)
|
Year ended
December 31, 2012 |
Year ended
December 31, 2011 |
Year ended
December 31, 2010 |
|||||||||
|
Cash flows from financing activities:
|
|||||||||||
|
Proceeds from the distribution reinvestment program
|
191,785
|
|
199,591
|
|
207,296
|
|
|||||
|
Shares repurchased
|
(45,732
|
)
|
(15,000
|
)
|
—
|
|
|||||
|
Distributions paid
|
(439,188
|
)
|
(428,650
|
)
|
(416,935
|
)
|
|||||
|
Proceeds from mortgage debt and notes payable
|
709,280
|
|
1,179,594
|
|
432,873
|
|
|||||
|
Payoffs of mortgage debt
|
(722,233
|
)
|
(804,204
|
)
|
(429,737
|
)
|
|||||
|
Principal payments of mortgage debt
|
(34,735
|
)
|
(36,036
|
)
|
(16,812
|
)
|
|||||
|
Proceeds from margin securities debt, net
|
18,284
|
|
58,756
|
|
33,800
|
|
|||||
|
Payment of loan fees and deposits
|
(7,501
|
)
|
(12,473
|
)
|
(8,617
|
)
|
|||||
|
Distributions paid to noncontrolling interests
|
(3,806
|
)
|
(660
|
)
|
(2,237
|
)
|
|||||
|
Distributions paid to noncontrolling redeemable interests
|
—
|
|
(7,891
|
)
|
(9,245
|
)
|
|||||
|
Contributions from noncontrolling interests
|
—
|
|
651
|
|
855
|
|
|||||
|
Redemption of noncontrolling interests
|
—
|
|
(294,275
|
)
|
—
|
|
|||||
|
Disposal of noncontrolling interests
|
(1,597
|
)
|
—
|
|
—
|
|
|||||
|
Net cash flows used in financing activities
|
(335,443
|
)
|
(160,597
|
)
|
(208,759
|
)
|
|||||
|
Net increase (decrease) in cash and cash equivalents
|
2,616
|
|
(49,544
|
)
|
(232,784
|
)
|
|||||
|
Cash and cash equivalents, at beginning of year
|
218,163
|
|
267,707
|
|
500,491
|
|
|||||
|
Cash and cash equivalents, at end of year
|
$
|
220,779
|
|
$
|
218,163
|
|
$
|
267,707
|
|
||
See accompanying notes to the consolidated financial statements.
71
INLAND AMERICAN REAL ESTATE TRUST, INC.
(A Maryland Corporation)
Consolidated Statements of Cash Flows
(continued)
(Dollar amounts in thousands)
|
Year ended December 31, 2012
|
Year ended December 31, 2011
|
Year ended December 31, 2010
|
|||||||||
|
Supplemental disclosure of cash flow information:
|
|||||||||||
|
Purchase of investment properties
|
$
|
(672,125
|
)
|
$
|
(448,169
|
)
|
$
|
(779,986
|
)
|
||
|
Tenant and real estate tax liabilities assumed at acquisition
|
492
|
|
2,073
|
|
4,753
|
|
|||||
|
Assumption of mortgage debt at acquisition
|
232,017
|
|
—
|
|
457,685
|
|
|||||
|
Non-cash discount on assumption of mortgage debt at acquisition
|
(3,311
|
)
|
—
|
|
(47,879
|
)
|
|||||
|
Assumption of lender held escrows
|
(4,982
|
)
|
—
|
|
—
|
|
|||||
|
$
|
(447,909
|
)
|
$
|
(446,096
|
)
|
$
|
(365,427
|
)
|
|||
|
Cash paid for interest, net of capitalized interest of $10,487, $10,851, and $4,302 for 2012, 2011 and 2010
|
$
|
309,478
|
|
$
|
296,065
|
|
$
|
293,301
|
|
||
|
Supplemental schedule of non-cash investing and financing activities:
|
|||||||||||
|
Consolidation of Lauth assets
|
$
|
—
|
|
$
|
—
|
|
$
|
38,365
|
|
||
|
Assumption of mortgage debt at consolidation of Lauth
|
$
|
—
|
|
$
|
—
|
|
$
|
(37,890
|
)
|
||
|
Liabilities assumed at consolidation of Lauth
|
$
|
—
|
|
$
|
—
|
|
$
|
(1,345
|
)
|
||
|
Property surrendered in exchange for extinguishment of debt
|
$
|
28,655
|
|
$
|
35,524
|
|
$
|
10,492
|
|
||
|
Property acquired through exchange of notes receivable
|
$
|
—
|
|
$
|
20,000
|
|
$
|
142,827
|
|
||
|
Conversion of note receivable to equity interest
|
$
|
—
|
|
$
|
17,150
|
|
$
|
121,320
|
|
||
|
Redemption value adjustment for noncontrolling redeemable interest
|
$
|
—
|
|
$
|
29,348
|
|
$
|
—
|
|
||
|
Property acquired through transfer of equity interest
|
$
|
—
|
|
$
|
8,500
|
|
$
|
—
|
|
||
|
Mortgage assumed by buyer upon disposal of property
|
$
|
60,659
|
|
$
|
—
|
|
$
|
—
|
|
||
See accompanying notes to the consolidated financial statements.
72
INLAND AMERICAN REAL ESTATE TRUST, INC.
(A Maryland Corporation)
Notes to Consolidated Financial Statements
(Dollar amounts in thousands, except per share amounts)
December 31, 2012, 2011 and 2010
(1) Organization
Inland American Real Estate Trust, Inc. (the “Company”) was formed on October 4, 2004 (inception) to acquire and manage a diversified portfolio of commercial real estate, primarily retail properties and multi-family (both conventional and student housing), office, industrial and lodging properties, located in the United States and Canada. The Business Management Agreement (the “Agreement”) provides for Inland American Business Manager & Advisor, Inc. (the “Business Manager”), an affiliate of the Company’s sponsor, to be the business manager to the Company. On August 31, 2005, the Company commenced an initial public offering (the “Initial Offering”) of up to
500,000,000
shares of common stock (“Shares”) at
$10.00
each and the issuance of
40,000,000
shares at
$9.50
per share available to be distributed pursuant to the Company’s distribution reinvestment plan. On August 1, 2007, the Company commenced a second public offering (the “Second Offering”) of up to
500,000,000
shares of common stock at
$10.00
per share and up to
40,000,000
shares at
$9.50
per share available to be distributed through the Company’s distribution reinvestment plan. Effective April 6, 2009, the Company elected to terminate the Second Offering. On March 31, 2009, the Company filed a registration statement to register
50,000,000
shares to be issued under the distribution reinvestment plan or “DRP.” Under the DRP, as amended, the purchase price per share is equal to 100% of the “market price” of a share of the Company’s common stock until the shares become listed for trading.
The accompanying consolidated financial statements include the accounts of the Company, as well as all wholly owned subsidiaries and consolidated joint venture investments. Wholly owned subsidiaries generally consist of limited liability companies (LLCs) and limited partnerships (LPs). The effects of all significant intercompany transactions have been eliminated.
Each property is owned by a separate legal entity which maintains its own books and financial records and each entity's assets are not available to satisfy the liabilities of other affiliated entities, except as otherwise disclosed in Mortgages, Notes and Margins Payable Note 10.
At
December 31, 2012
, the Company owned a portfolio of
794
commercial real estate properties compared to
964
properties at
December 31, 2011
. The breakdown by segment is as follows:
|
Segment
|
Property Count
|
Square Ft/Rooms/Units/Beds
(unaudited)
|
|||||||
|
Retail
|
585
|
22,264,303
|
square feet
|
||||||
|
Lodging
|
88
|
16,345
|
rooms
|
||||||
|
Office
|
42
|
10,226,500
|
square feet
|
||||||
|
Industrial
|
53
|
13,061,447
|
square feet
|
||||||
|
Multi-family
|
26
|
5,311
|
|
/
|
5,212
|
|
units/beds
|
||
(2) Summary of Significant Accounting Policies
The accompanying consolidated financial statements have been prepared in accordance with U.S. generally accepted accounting principles (“GAAP”) and require management to make estimates and assumptions that affect the reported amounts of assets and liabilities and disclosure of contingent assets and liabilities at the date of the consolidated financial statements and the reported amounts of revenues and expenses during the reporting periods. Actual results could differ from those estimates.
Revenue Recognition
The Company commences revenue recognition on its leases based on a number of factors. In most cases, revenue recognition under a lease begins when the lessee takes possession of or controls the physical use of the leased asset. Generally, this occurs on the lease commencement date. The determination of who is the owner, for accounting purposes, of the tenant improvements determines the nature of the leased asset and when revenue recognition under a lease begins. If the Company is the owner, for accounting purposes, of the tenant improvements, then the leased asset is the finished space and revenue recognition begins when the lessee takes possession of the finished space, typically when the improvements are substantially complete. If the Company concludes it is not the owner, for accounting purposes, of the tenant improvements (the lessee is the owner), then the
73
INLAND AMERICAN REAL ESTATE TRUST, INC.
(A Maryland Corporation)
Notes to Consolidated Financial Statements
(Dollar amounts in thousands, except per share amounts)
December 31, 2012, 2011 and 2010
leased asset is the unimproved space and any tenant improvement allowances funded under the lease are treated as lease incentives which reduces revenue recognized over the term of the lease. In these circumstances, the Company begins revenue recognition when the lessee takes possession of the unimproved space for the lessee to construct their own improvements. The Company considers a number of different factors to evaluate whether it or the lessee is the owner of the tenant improvements for accounting purposes. These factors include:
|
•
|
whether the lease stipulates how and on what a tenant improvement allowance may be spent;
|
|
•
|
whether the tenant or landlord retains legal title to the improvements;
|
|
•
|
the uniqueness of the improvements;
|
|
•
|
the expected economic life of the tenant improvements relative to the length of the lease; and
|
|
•
|
who constructs or directs the construction of the improvements.
|
The determination of who owns the tenant improvements, for accounting purposes, is subject to significant judgment. In making that determination, the Company considers all of the above factors. No one factor, however, necessarily establishes its determination.
Rental income is recognized on a straight-line basis over the term of each lease. The difference between rental income earned on a straight-line basis and the cash rent due under the provisions of the lease agreements is recorded as deferred rent receivable and is included as a component of accounts and rents receivable in the accompanying consolidated balance sheets.
Revenue for lodging facilities is recognized when the services are provided. Additionally, the Company collects sales, use, occupancy and similar taxes at its lodging facilities which it presents on a net basis (excluded from revenues) on the consolidated statements of operations and other comprehensive income.
The Company records lease termination income if there is a signed termination agreement, all of the conditions of the agreement have been met, the tenant is no longer occupying the property and amounts due are considered collectible.
The Company defers recognition of contingent rental income (i.e. percentage/excess rent) until the specified target that triggers the contingent rental income is achieved.
Consolidation
The Company evaluates its investments in limited liability companies and partnerships to determine whether such entities may be a variable interest entity (“VIE”). If the entity is a VIE, the determination of whether the Company is the primary beneficiary must be made. The primary beneficiary determination is based on a qualitative assessment as to whether the entity has (i) power to direct significant activities of the VIE and (ii) an obligation to absorb losses or the right to receive benefits that could be potentially significant to the VIE. The Company will consolidate a VIE if it is deemed to be the primary beneficiary, as defined in Financial Accounting Standards Board (“FASB”) Accounting Standards Codification (“ASC”) 810, Consolidation. The equity method of accounting is applied to entities in which the Company is not the primary beneficiary as defined in FASB ASC 810, or the entity is not a VIE and the Company does not have effective control, but can exercise influence over the entity with respect to its operations and major decisions.
Reclassifications
Certain reclassifications have been made to the 2011 and 2010 consolidated financial statements to conform to the 2012 presentations. The reclasses primarily represent reclassifications of revenue and expenses to discontinued operations as a result of the sales of investment properties in 2012.
Capitalization and Depreciation
Real estate is reflected at cost less accumulated depreciation. Ordinary repairs and maintenance are expensed as incurred.
74
INLAND AMERICAN REAL ESTATE TRUST, INC.
(A Maryland Corporation)
Notes to Consolidated Financial Statements
(Dollar amounts in thousands, except per share amounts)
December 31, 2012, 2011 and 2010
Depreciation expense is computed using the straight line method. Building and other improvements are depreciated based upon estimated useful lives of
30
years for building and improvements and
5
-
15
years for furniture, fixtures and equipment and site improvements.
Tenant improvements are amortized on a straight line basis over the life of the related lease as a component of depreciation and amortization expense.
Leasing fees are amortized on a straight-line basis over the life of the related lease as a component of depreciation and amortization expense.
Loan fees are amortized on a straight-line basis, which approximates the effective interest method, over the life of the related loan as a component of interest expense.
Direct and indirect costs that are clearly related to the construction and improvements of investment properties are capitalized. Costs incurred for property taxes and insurance are capitalized during periods in which activities necessary to get the property ready for its intended use are in progress. Interest costs are also capitalized during such periods. Additionally, the Company treats investments accounted for by the equity method as assets qualifying for interest capitalization provided (1) the investee has activities in progress necessary to commence its planned principal operations and (2) the investee’s activities include the use of such funds to acquire qualifying assets.
Investment Properties Held for Sale
In determining whether to classify an investment property as held for sale, the Company considers whether: (i) management has committed to a plan to sell the investment property; (ii) the investment property is available for immediate sale, in its present condition; (iii) the Company has initiated a program to locate a buyer; (iv) the Company believes that the sale of the investment property is probable; (v) the Company has received a significant non-refundable deposit for the purchase of the property; (vi) the Company is actively marketing the investment property for sale at a price that is reasonable in relation to its fair value; and (vii) actions required for the Company to complete the plan indicate that it is unlikely that any significant changes will be made to the plan.
If all of the above criteria are met, the Company classifies the investment property as held for sale. On the day that these criteria are met, the Company suspends depreciation on the investment properties held for sale, including depreciation for tenant improvements and additions, as well as on the amortization of acquired in-place leases. The investment properties and liabilities associated with those investment properties that are held for sale are classified separately on the consolidated balance sheets for the most recent reporting period and recorded at the lesser of the carrying value or fair value less costs to sell. Additionally, the operations for the periods presented are classified on the consolidated statements of operations and other comprehensive income as discontinued operations for all periods presented. As of
December 31, 2012 and 2011
, no investment properties were classified as held for sale.
Disposition of Real Estate
The Company accounts for dispositions in accordance with FASB ASC 360-20, Real Estate Sales. The Company recognizes gain in full when real estate is sold, provided (a) the profit is determinable, that is, the collectability of the sales price is reasonably assured or the amount that will not be collectible can be estimated, and (b) the earnings process is virtually complete, that is, the seller is not obliged to perform significant activities after the sale to earn the profit. The Company records the transaction as discontinued operations for all periods presented in accordance with FASB ASC 205-20, Presentation of Financial Statements - Discontinued Operations.
Impairment
The Company assesses the carrying values of the respective long-lived assets, whenever events or changes in circumstances indicate that the carrying amounts of these assets may not be fully recoverable, such as a reduction in the expected holding period of the asset. If it is determined that the carrying value is not recoverable because the undiscounted cash flows do not exceed carrying value, the Company is required to record an impairment loss to the extent that the carrying value exceeds fair value. The valuation and possible subsequent impairment of investment properties is a significant estimate that can and does
75
INLAND AMERICAN REAL ESTATE TRUST, INC.
(A Maryland Corporation)
Notes to Consolidated Financial Statements
(Dollar amounts in thousands, except per share amounts)
December 31, 2012, 2011 and 2010
change based on our continuous process of analyzing each property and reviewing assumptions about uncertain inherent factors, as well as the economic condition of the property at a particular point in time.
The use of projected future cash flows and related holding period is based on assumptions that are consistent with the estimates of future expectations and the strategic plan the Company uses to manage its underlying business. However assumptions and estimates about future cash flows and capitalization rates are complex and subjective. Changes in economic and operating conditions and the Company’s ultimate investment intent that occur subsequent to the impairment analyses could impact these assumptions and result in future impairment charges of the real estate properties.
On a periodic basis, management assesses whether there are any indicators that the carrying value of the Company’s investments in unconsolidated entities may be other than temporarily impaired. To the extent impairment has occurred, the loss is measured as the excess of the carrying value of the investment over the fair value of the investment. The fair value of the underlying investment includes a review of expected cash flows to be received from the investee.
Derivative Instruments
In the normal course of business, the Company is exposed to the effect of interest rate changes. The Company limits these risks by following established risk management policies and procedures including the use of derivatives to hedge interest rate risk on debt instruments.
The Company has a policy of only entering into contracts with established financial institutions based upon their credit ratings and other factors. When viewed in conjunction with the underlying and offsetting exposure that the derivatives are designed to hedge, the Company has not sustained a material loss from those instruments nor does it anticipate any material adverse effect on its net income or financial position in the future from the use of derivatives.
The Company recognizes all derivatives in the balance sheet at fair value. Additionally, the fair value adjustments will affect either equity or net income depending on whether the derivative instruments qualify as a hedge for accounting purposes and, if so, the nature of the hedging activity. When the terms of an underlying transaction are modified, or when the underlying transaction is terminated or completed, all changes in the fair value of the instrument are marked-to-market with changes in value included in net income each period until the instrument matures. Any derivative instrument used for risk management that does not meet the criteria for hedge accounting is marked-to-market each period in the income statement. The Company does not use derivatives for trading or speculative purposes.
Marketable Securities
The Company classifies its investment in securities in one of
three
categories: trading, available-for-sale, or held-to-maturity. Trading securities are bought and held principally for the purpose of selling them in the near term. Held-to-maturity securities are those securities in which the Company has the ability and intent to hold the security until maturity. All securities not included in trading or held-to-maturity are classified as available-for-sale. Investment in securities at
December 31, 2012 and 2011
consists of common and preferred stock investments and investments in real estate related bonds that are all classified as available-for-sale securities and are recorded at fair value. Unrealized holding gains and losses on available-for-sale securities are excluded from earnings and reported as a separate component of other comprehensive income until realized. Realized gains and losses from the sale of available-for-sale securities are determined on a specific identification basis. A decline in the market value of any available-for-sale security below cost that is deemed to be other than temporary, results in a reduction in the carrying amount to fair value. The impairment is charged to earnings and a new cost basis for the security is established. When a security is impaired, the Company considers whether it has the ability and intent to hold the investment for a time sufficient to allow for any anticipated recovery in market value and considers whether evidence indicating the cost of the investment is recoverable outweighs evidence to the contrary. Evidence considered in this assessment includes the reasons for the impairment, the severity and duration of the impairment, changes in value subsequent to period end and forecasted performance of the investee.
Acquisition of Real Estate
The Company allocates the purchase price of each acquired business (as defined in the accounting guidance related to business combinations) between tangible and intangible assets at full fair value at the date of the transaction. Such tangible and
76
INLAND AMERICAN REAL ESTATE TRUST, INC.
(A Maryland Corporation)
Notes to Consolidated Financial Statements
(Dollar amounts in thousands, except per share amounts)
December 31, 2012, 2011 and 2010
intangible assets include land, building and improvements, acquired above market and below market leases, in-place lease value, customer relationships (if any), and any assumed financing that is determined to be above or below market terms. Any additional amounts are allocated to goodwill as required, based on the remaining purchase price in excess of the fair value of the tangible and intangible assets acquired and liabilities assumed. The allocation of the purchase price is an area that requires judgment and significant estimates.
The Company uses the information contained in the independent appraisal obtained at acquisition as the primary basis for the allocation to land and building and improvements. The Company determines whether any financing assumed is above or below market based upon comparison to similar financing terms for similar investment properties. The Company allocates a portion of the purchase price to the estimated acquired in-place lease costs based on estimated lease execution costs for similar leases as well as lost rent payments during assumed lease up period when calculating as if vacant fair values. The Company also evaluates each acquired lease based upon current market rates at the acquisition date and considers various factors including geographical location, size and location of leased space within the investment property, tenant profile, and the credit risk of the tenant in determining whether the acquired lease is above or below market lease costs. After an acquired lease is determined to be above or below market, the Company allocates a portion of the purchase price to such above or below acquired lease costs based upon the present value of the difference between the contractual lease rate and the estimated market rate. For below market leases with fixed rate renewals, renewal periods are included in the calculation of below market in-place lease values. The determination of the discount rate used in the present value calculation is based upon the “risk free rate” and current interest rates. This discount rate is a significant factor in determining the market valuation which requires judgment of subjective factors such as market knowledge, economics, demographics, location, visibility, age and physical condition of the property.
The Company expenses acquisition costs of all transactions as incurred. All costs related to finding, analyzing and negotiating a transaction are expensed as incurred as a general and administrative expense, whether or not the acquisition is completed. These expenses would include acquisition fees, if any, paid to an affiliate of the business manager.
Cash and Cash Equivalents
The Company considers all demand deposits, money market accounts and investments in certificates of deposit and repurchase agreements purchased with a maturity of three months or less, at the date of purchase, to be cash equivalents. The Company maintains its cash and cash equivalents at financial institutions. The combined account balances at one or more institutions periodically exceed the Federal Depository Insurance Corporation (“FDIC”) insurance coverage and, as a result, there is a concentration of credit risk related to amounts on deposit in excess of FDIC insurance coverage. The Company believes that the risk is not significant, as the Company does not anticipate the financial institutions’ non-performance.
Restricted Cash and Escrows
Restricted escrows primarily consist of cash held in escrow comprised of lenders’ restricted escrows of $
36,278
and $
35,728
, post acquisition escrows of $
12,435
and $
16,052
, and lodging furniture, fixtures and equipment reserves of $
50,041
and $
40,570
as of
December 31, 2012 and 2011
, respectively. As of
December 31, 2012 and 2011
, the restricted cash balance was $
5,273
and $
6,094
, respectively.
Goodwill
The excess of the cost of an acquired entity over the net of the amounts assigned to assets acquired (including identified intangible assets) and liabilities assumed was recorded as goodwill. Goodwill has been recognized and allocated to specific properties in our lodging segment since each individual hotel property is an operating segment and considered a reporting unit. The Company tests goodwill for impairment annually or more frequently if events or changes in circumstances indicate impairment.
The Company tested goodwill for impairment by first comparing the estimated fair value of each property with goodwill to the carrying value of the property’s assets, including goodwill. The fair value is based on estimated future cash flow projections that utilize discount and capitalization rates, which are generally unobservable in the market place (Level 3 inputs), but approximate the inputs the Company believes would be utilized by market participants in assessing fair value. The estimates of future cash flows are based on a number of factors including the historical operating results, known trends, and market/
77
INLAND AMERICAN REAL ESTATE TRUST, INC.
(A Maryland Corporation)
Notes to Consolidated Financial Statements
(Dollar amounts in thousands, except per share amounts)
December 31, 2012, 2011 and 2010
economic conditions. If the carrying amount of the property’s assets, including goodwill, exceeds its estimated fair value, the second step of the goodwill impairment test is performed to measure the amount of impairment loss, if any. In this second step, if the implied fair value of goodwill is less than the carrying amount of goodwill, an impairment charge is recorded in an amount equal to that excess.
Beginning with fiscal year 2012, in accordance with FASB ASC 350, Intangibles - Goodwill and Other, the Company tested goodwill for impairment by making a qualitative assessment of whether it is more likely than not the reporting unit's fair value is less than its carrying amount before application of the two-step goodwill impairment test. The two-step goodwill test was not performed for those assets where it was concluded that it is not more likely than not that the fair value of a reporting unit is less than its carrying amount. For those reporting units where this was not the case, the two step procedure detailed above was followed in order to determine goodwill impairment. The Company tested goodwill for impairment as of
December 31, 2012, 2011 and 2010
resulting in no impairment recorded as of
December 31, 2012, 2011 and 2010
.
Income Taxes
Deferred tax assets and liabilities are recognized for the estimated future tax consequences attributed to differences between the financial statement carrying amounts of existing assets and liabilities and their respective tax basis. Deferred tax assets and liabilities are measured using enacted tax rates in effect for the year in which those temporary differences are expected to be recovered or settled.
(3) Acquired Properties
The Company records identifiable assets, liabilities, and goodwill acquired in a business combination at fair value. During the years ended
December 31, 2012, 2011 and 2010
, the Company incurred
$1,644
,
$1,680
and
$1,805
, respectively, of acquisition and transaction costs that were recorded in general and administrative expenses on the consolidated statements of operations and other comprehensive income.
The Company acquired
13
properties for the year ended
December 31, 2012
and
10
properties for the year ended
December 31, 2011
, for a gross acquisition price of
$726,550
and
$449,300
, respectively. The table below reflects acquisition activity for the year ended
December 31, 2012
.
|
Segment
|
Property
|
Date
|
Gross Acquisition Price
(in 000's) |
Square Feet / Rooms
(unaudited) |
||||
|
Lodging
|
Marriott-San Francisco Airport
|
3/23/2012
|
$
|
108,000
|
|
685
|
|
rooms
|
|
Lodging
|
Hilton St. Louis Downtown
|
3/23/2012
|
22,600
|
|
195
|
|
rooms
|
|
|
Lodging
|
Renaissance Arboretum - Austin, TX
|
3/23/2012
|
103,000
|
|
492
|
|
rooms
|
|
|
Lodging
|
Renaissance Waverly - Atlanta, GA
|
3/23/2012
|
97,000
|
|
521
|
|
rooms
|
|
|
Lodging
|
Marriott Griffin Gate Resort & Spa
|
3/23/2012
|
62,500
|
|
409
|
|
rooms
|
|
|
Retail
|
Tomball Town Center Outparcel
|
3/30/2012
|
3,000
|
|
6,541
|
|
square feet
|
|
|
Retail
|
Tulsa Hills Expansion
|
4/20/2012
|
10,600
|
|
74,406
|
|
square feet
|
|
|
Lodging
|
Bohemian Hotel Savannah Riverfront
|
8/9/2012
|
51,200
|
|
75
|
|
rooms
|
|
|
Multi Family
|
University House Retreat, Raleigh
|
12/7/2012
|
40,600
|
|
554
|
|
beds
|
|
|
Multi Family
|
University House Retreat, Tallahassee
|
12/7/2012
|
54,000
|
|
710
|
|
beds
|
|
|
Retail
|
Rockwell Plaza
|
12/21/2012
|
31,000
|
|
254,690
|
|
square feet
|
|
|
Retail
|
Stone Ridge Market
|
12/27/2012
|
62,250
|
|
218,389
|
|
square feet
|
|
|
Lodging
|
Grand Bohemian Hotel Orlando
|
12/27/2012
|
80,800
|
|
247
|
|
rooms
|
|
|
Total
|
|
|
$
|
726,550
|
|
|||
78
INLAND AMERICAN REAL ESTATE TRUST, INC.
(A Maryland Corporation)
Notes to Consolidated Financial Statements
(Dollar amounts in thousands, except for per share amounts)
December 31, 2012, 2011 and 2010
On July 31, 2012, the Company placed in service
two
multi-family properties, University House at Central Florida (
995
beds) and Arizona State University Polytechnic Student Housing (
307
beds) for
$65,300
and
$12,000
, respectively.
For properties acquired as of
December 31, 2012
, the Company recorded revenue of $
119,436
and property net income of $
19,207
, not including related expensed acquisition costs in 2012. For properties acquired as of
December 31, 2011
, the Company recorded revenue of $
46,512
and property net income of $
9,074
, not including related expensed acquisition costs in 2011.
(4) Discontinued Operations
The Company sold
166
properties for the year ended
December 31, 2012
and
26
properties for the year ended
December 31, 2011
for a gross disposition price of
$603,500
and $
242,300
, respectively. The table below reflects disposition activity for the year ended
December 31, 2012
.
|
Segment
|
Property
|
Date
|
Gross Disposition
Price
|
Sq Ft/Units/Rooms
(unaudited)
|
||
|
Retail
|
Citizen Bank Branches – 30 Properties
|
Various Q2
|
27,400
|
81,451
|
|
square feet
|
|
Industrial
|
Union Venture
|
5/17/2012
|
49,600
|
970,168
|
|
square feet
|
|
Retail
|
Lakewood Shopping Center I & II
|
6/21/2012
|
31,500
|
236,679
|
|
square feet
|
|
Lodging
|
Hilton GI - Akron
|
7/31/2012
|
15,500
|
121
|
|
rooms
|
|
Retail
|
Plaza at Eagle's Landing
|
8/2/2012
|
5,300
|
33,265
|
|
square feet
|
|
Retail
|
Canfield Plaza
|
8/31/2012
|
8,800
|
100,958
|
|
square feet
|
|
Industrial
|
Southwide Industrial Center #8
|
9/1/2012
|
300
|
10,185
|
|
square feet
|
|
Lodging
|
Lodging Portfolio - 12 Properties
|
9/13/2012
|
116,000
|
1,643
|
|
rooms
|
|
Multi-family
|
Waterford Place at Shadow Creek
|
9/27/2012
|
25,600
|
296
|
|
units
|
|
Multi-family
|
Villas at Shadow Creek - Waterford Place II Villas
|
9/27/2012
|
27,000
|
264
|
|
units
|
|
Multi-family
|
Fannin Street Apartments
|
9/28/2012
|
72,500
|
678
|
|
units
|
|
Retail
|
Citizen Bank Branches – 34 Properties
|
Various Q3
|
52,900
|
155,211
|
|
square feet
|
|
Retail
|
Citizen Bank Branches – 72 Properties
|
Various Q4
|
106,000
|
347,417
|
|
square feet
|
|
Multi-family
|
Landings at Clear Lake
|
11/15/2012
|
35,000
|
364
|
|
units
|
|
Various
|
Sun Trust Bank Branches -7 Properties
|
Various Q4
|
30,100
|
45,738
|
|
square feet
|
|
Total
|
|
|
$603,500
|
|
||
The Company has presented separately as discontinued operations in all periods the results of operations for all disposed assets in consolidated operations. The Company sold
166
assets and surrendered
one
lodging property and
19
industrial properties (cross-collateralized by one loan) to the lender for the year ended
December 31, 2012
and sold
26
assets and surrendered
three
properties to the lender for the year ended
December 31, 2011
. All properties surrendered for the years ended
December 31, 2012 and 2011
were in satisfaction of non-recourse debt. The components of the Company’s discontinued operations are presented below and include the results of operations for the respective periods that the Company owned such assets or was involved with the operations of such ventures during the years ended
December 31, 2012, 2011 and 2010
.
79
INLAND AMERICAN REAL ESTATE TRUST, INC.
(A Maryland Corporation)
Notes to Consolidated Financial Statements
(Dollar amounts in thousands, except for per share amounts)
December 31, 2012, 2011 and 2010
|
|
Year ended
December 31, 2012 |
Year ended
December 31, 2011 |
Year ended
December 31, 2010 |
||||||||
|
Revenues
|
$
|
70,279
|
|
$
|
135,700
|
|
$
|
168,807
|
|
||
|
Expenses
|
48,054
|
|
101,562
|
|
139,116
|
|
|||||
|
Provision for asset impairment
|
5,968
|
|
134,673
|
|
47,529
|
|
|||||
|
Operating loss from discontinued operations
|
16,257
|
|
(100,535
|
)
|
(17,838
|
)
|
|||||
|
Other Loss
|
(14,445
|
)
|
(21,835
|
)
|
(29,760
|
)
|
|||||
|
Gain on sale of properties, net
|
38,516
|
|
11,964
|
|
55,412
|
|
|||||
|
Gain on extinguishment of debt
|
9,478
|
|
10,848
|
|
19,227
|
|
|||||
|
Gain on transfer of assets
|
$
|
2,175
|
|
$
|
4,546
|
|
$
|
—
|
|
||
|
Income (loss) from discontinued operations, net
|
$
|
51,981
|
|
$
|
(95,012
|
)
|
$
|
27,041
|
|
||
For the years ended
December 31, 2012, 2011 and 2010
, the Company had proceeds from the sale of investment properties of $
545,132
, $
246,317
, and $
301,189
, respectively.
(5) Investment in Partially Owned Entities
Consolidated Entities
On October 11, 2005, the Company entered into a joint venture with Minto (Delaware), LLC, or Minto Delaware who owned all of the outstanding equity of Minto Builders (Florida), Inc. (“MB REIT”) prior to October 11, 2005. Pursuant to the terms of the purchase agreement, the Company purchased
920,000
shares of common stock of MB REIT at a price of
$1,276
per share for a total investment of approximately
$1,172,000
in MB REIT. MB REIT was not considered a VIE as defined in FASB ASC 810, Consolidation, however the Company had a controlling financial interest in MB REIT, had the direct ability to make major decisions for MB REIT through its voting interests, and held key management positions in MB REIT. Therefore this entity was consolidated by the Company and the outside ownership interests were reflected as noncontrolling redeemable interests in the accompanying consolidated financial statements. On October 4, 2011, the Company bought out the common and preferred stock of the consolidated MB REIT joint venture for
$293,480
. No gain or loss was recorded due to this transaction because there was no change in control.
The Company has ownership interests of
67%
in various limited liability companies which own
nine
shopping centers. These entities are considered VIEs as defined in FASB ASC 810, and the Company is considered the primary beneficiary of each of these entities. Therefore, these entities are consolidated by the Company. The entities' agreements contain put/call provisions which grant the right to the outside owners and the Company to require these entities to redeem the ownership interests of the outside owners during future periods. Because the outside ownership interests are subject to a put/call arrangement requiring settlement for a fixed amount, these entities are treated as
100%
owned subsidiaries by the Company with the amount of
$47,762
as of
December 31, 2012 and 2011
due to the outside owners reflected as a financing and included within other liabilities in the accompanying consolidated financial statements. Interest expense is recorded on these liabilities in an amount generally equal to the preferred return due to the outside owners as provided in the entities agreements.
For these VIEs where the Company is the primary beneficiary, the following are the liabilities of the consolidated VIEs, which are not recourse to the Company, and the assets that can be used only to settle those obligations.
|
December 31, 2012
|
December 31, 2011
|
|||||
|
Net investment properties
|
$
|
113,476
|
|
$
|
117,235
|
|
|
Other assets
|
8,687
|
|
9,167
|
|
||
|
Total assets
|
$
|
122,163
|
|
$
|
126,402
|
|
|
Mortgages, notes and margins payable
|
$
|
(84,291
|
)
|
$
|
(84,823
|
)
|
|
Other liabilities
|
(49,648
|
)
|
(49,073
|
)
|
||
|
Total liabilities
|
$
|
(133,939
|
)
|
$
|
(133,896
|
)
|
|
Net assets
|
$
|
(11,776
|
)
|
$
|
(7,494
|
)
|
80
INLAND AMERICAN REAL ESTATE TRUST, INC.
(A Maryland Corporation)
Notes to Consolidated Financial Statements
(Dollar amounts in thousands, except for per share amounts)
December 31, 2012, 2011 and 2010
Unconsolidated Entities
The entities listed below are owned by the Company and other unaffiliated parties in joint ventures. Net income, distributions and capital transactions for these properties are allocated to the Company and its joint venture partners in accordance with the respective partnership agreements. These entities are not consolidated by the Company and the equity method of accounting is used to account for these investments. Under the equity method of accounting, the net equity investment of the Company and the Company’s share of net income or loss from the unconsolidated entity are reflected in the consolidated balance sheets and the consolidated statements of operations and other comprehensive income.
|
Entity
|
Description
|
Ownership %
|
Investment at
December 31, 2012 |
Investment at
December 31, 2011
|
||||||
|
Net Lease Strategic Asset Fund L.P.
|
Diversified portfolio of net lease assets
|
85%(a)
|
$
|
—
|
|
$
|
26,508
|
|
||
|
Cobalt Industrial REIT II
|
Industrial portfolio
|
36%(b)
|
102,599
|
|
113,623
|
|
||||
|
D.R. Stephens Institutional Fund, LLC
|
Industrial and R&D assets
|
90%(c)
|
34,541
|
|
36,218
|
|
||||
|
Brixmor/IA JV, LLC
|
Retail Shopping Centers
|
(d)
|
90,315
|
|
103,567
|
|
||||
|
Other Unconsolidated Entities (e)
|
Various Real Estate investments
|
Various
|
26,344
|
|
36,795
|
|
||||
|
$
|
253,799
|
|
$
|
316,711
|
|
|||||
|
(a)
|
On August 10, 2007, the Company entered into a joint venture with The Lexington Master Limited Partnership (“LMLP”) and LMLP GP LLC (“LMLP GP”), for the purpose of directly or indirectly acquiring, financing, holding for investment, operating, and leasing real estate assets as acquired by the joint venture. The Company’s initial capital contribution was approximately
$127,500
and LMLP’s initial contribution was approximately
$22,500
. On September 5, 2012, the Company entered into a definitive agreement and sold the Company's interest in Net Lease Strategic Asset Fund L.P. to LMLP. The Company received its final distribution of
$9,438
and recorded a loss of
$1,556
on the sale of the investment. For the years ended December 31, 2012 and 2011, the Company recorded an impairment of
$4,200
and
$113,621
, respectively, on this investment.
|
|
(b)
|
On June 29, 2007, the Company entered into a joint venture, Cobalt Industrial REIT II (“Cobalt”), to invest
$149,000
in shares of common beneficial interest. The investment gives the Company the right to a preferred dividend equal to
9%
per annum. The Company analyzed the venture and determined that it was not a VIE. The Company also considered its participating rights under the joint venture agreement and determined that such participating rights also require the agreement of Cobalt, which equates to shared decision making ability, and therefore do not give the Company control over the venture. As such, the Company has significant influence but does not control Cobalt. Therefore, the Company does not consolidate this entity, rather the Company accounts for its investment in the entity under the equity method of accounting.
|
|
(c)
|
On April 23, 2007, the Company entered into a joint venture, D.R. Stephens Institutional Fund, LLC, between the Company and Stephens Ventures III, LLC (“Stephens Member”) for the purpose of acquiring entities engaged in the acquisition, ownership, and development of real property. The Company’s initial capital contribution was limited to approximately
$90,000
and the Stephens Member’s initial contribution was limited to approximately
$10,000
. Stephens & Stephens LLC (“Stephens”), an affiliate of the Stephens Member, is the managing member of D.R. Stephens Institutional Fund, LLC. The Company analyzed the venture and determined that it was not a VIE. The Company also considered its participating rights under the joint venture agreement and determined that such participating rights also require the agreement of Stephens Member, which equates to shared decision making ability, and therefore do not give the Company control over the venture. As such, the Company has significant influence but does not control D.R. Stephens Institutional Fund, LLC. Therefore, the Company does not consolidate this entity, rather the Company accounts for its investment in the entity under the equity method of accounting. As of
December 31,
|
81
INLAND AMERICAN REAL ESTATE TRUST, INC.
(A Maryland Corporation)
Notes to Consolidated Financial Statements
(Dollar amounts in thousands, except for per share amounts)
December 31, 2012, 2011 and 2010
2012
, the Company determined that the investment may have a reduction in the expected holding period. Therefore, for the year ended
December 31, 2012
, the Company recorded an impairment of
$2,700
on this investment.
|
(d)
|
On December 6, 2010, the Company entered into a Joint Venture with Brixmor Residual Holding LLC (“Brixmor”) (formerly Centro NP Residual Holding LLC), resulting in the creation of Brixmor/IA JV, LLC (formerly Centro/IA JV, LLC). The joint venture structure provides the Company with an equity stake of
$121,534
, a preferred capital position and preferred return of
11%
. The Company analyzed the venture and determined that it was not a VIE. The Company also considered its participating rights under the joint venture agreement and determined that such participating rights also require the agreement of Brixmor, which equates to shared decision making ability, and therefore do not give the Company control over the venture. As such, the Company has significant influence but does not control Brixmor/IA JV, LLC. Therefore, the Company does not consolidate this entity, rather the Company accounts for its investment in the entity under the equity method of accounting.
|
|
(e)
|
On July 7, 2011, a foreclosure sale was held on a hotel property which previously secured one of the Company’s notes receivable. The note had been in default and fully impaired since 2009. A trust, on behalf of the lender group, was the successful bidder at the foreclosure sale and thereby, the Company obtained an equity interest in the trust which is the 100% owner of the hotel property. The Company’s interest is not consolidated and the equity method is used to account for the investment. The Company recorded its equity interest at fair value and recognized a gain of
$17,150
in 2011 on the conversion of the note reflected in other income on the consolidated statement of operations and other comprehensive income. As of
December 31, 2012
, the Company recorded an impairment of
$2,465
on one lodging joint venture and a loss of
$1,401
on the sale of another lodging joint venture.
|
In total, the Company recorded an impairment of $
9,365
, $
113,621
and $
11,239
related to
three
,
one
and
two
of its unconsolidated entities for the years ended
December 31, 2012, 2011 and 2010
, respectively.
Combined Financial Information
The following table presents the combined financial information for the Company’s investment in unconsolidated entities.
|
|
Balance as of December 31, 2012
|
Balance as of December 31, 2011
|
|||||
|
Balance Sheets:
|
|
|
|||||
|
Assets:
|
|
|
|||||
|
Real estate assets, net of accumulated depreciation
|
$
|
1,437,268
|
|
$
|
1,949,035
|
|
|
|
Other assets
|
222,096
|
|
485,887
|
|
|||
|
Total Assets
|
$
|
1,659,364
|
|
$
|
2,434,922
|
|
|
|
Liabilities and Equity:
|
|
|
|||||
|
Mortgage debt
|
$
|
1,062,086
|
|
$
|
1,402,462
|
|
|
|
Other liabilities
|
89,573
|
|
94,361
|
|
|||
|
Equity
|
507,705
|
|
938,099
|
|
|||
|
Total Liabilities and Equity
|
$
|
1,659,364
|
|
$
|
2,434,922
|
|
|
|
Company’s share of equity
|
$
|
252,994
|
|
$
|
307,684
|
|
|
|
Net excess of cost of investments over the net book value of underlying net assets (net of accumulated depreciation of $1,714 and $1,372, respectively)
|
805
|
|
9,027
|
|
|||
|
Carrying value of investments in unconsolidated entities
|
$
|
253,799
|
|
$
|
316,711
|
|
|
82
INLAND AMERICAN REAL ESTATE TRUST, INC.
(A Maryland Corporation)
Notes to Consolidated Financial Statements
(Dollar amounts in thousands, except for per share amounts)
December 31, 2012, 2011 and 2010
|
|
For the years ended
|
||||||||||
|
|
December 31,
2012 |
December 31,
2011 |
December 31,
2010 |
||||||||
|
Statements of Operations:
|
|
|
|
||||||||
|
Revenues
|
$
|
202,155
|
|
$
|
283,913
|
|
$
|
287,694
|
|
||
|
Expenses:
|
|
|
|
||||||||
|
Interest expense and loan cost amortization
|
$
|
63,233
|
|
$
|
91,965
|
|
$
|
90,857
|
|
||
|
Depreciation and amortization
|
83,324
|
|
111,699
|
|
99,254
|
|
|||||
|
Operating expenses, ground rent and general and administrative expenses
|
76,149
|
|
159,539
|
|
100,954
|
|
|||||
|
Impairments
|
553
|
|
21,017
|
|
14,019
|
|
|||||
|
Total expenses
|
$
|
223,259
|
|
$
|
384,220
|
|
$
|
305,084
|
|
||
|
Net loss before gain on sale of real estate
|
$
|
(21,104
|
)
|
$
|
(100,319
|
)
|
$
|
(17,390
|
)
|
||
|
Gain on sale of real estate
|
9,484
|
|
9,219
|
|
553
|
|
|||||
|
Net loss
|
$
|
(11,620
|
)
|
$
|
(91,100
|
)
|
$
|
(16,837
|
)
|
||
|
Company’s share of:
|
|
|
|
||||||||
|
Net loss, net of excess basis depreciation of $342, $5 and $84
|
$
|
1,998
|
|
$
|
(12,802
|
)
|
$
|
(18,684
|
)
|
||
The unconsolidated entities had total third party debt of
$1,062,086
at
December 31, 2012
that matures as follows:
|
2013
|
$
|
143,157
|
|
|
2014
|
75,458
|
|
|
|
2015
|
58,950
|
|
|
|
2016
|
4,100
|
|
|
|
2017
|
165,100
|
|
|
|
Thereafter
|
615,321
|
|
|
|
$
|
1,062,086
|
|
|
The debt maturities of the unconsolidated entities are not recourse to the Company and the Company has no obligation to fund such debt maturities. It is anticipated that the joint ventures will be able to repay or refinance all of their debt on a timely basis.
83
INLAND AMERICAN REAL ESTATE TRUST, INC.
(A Maryland Corporation)
Notes to Consolidated Financial Statements
(Dollar amounts in thousands, except for per share amounts)
December 31, 2012, 2011 and 2010
(6) Transactions with Related Parties
The following table summarizes the Company’s related party transactions for the years ended
December 31, 2012, 2011 and 2010
.
|
|
For the years ended
|
Unpaid amount as of
|
|||||||||||||||||
|
|
December 31,
2012 |
December 31,
2011 |
December 31,
2010 |
December 31,
2012 |
December 31,
2011 |
||||||||||||||
|
General and administrative:
|
|
|
|
|
|
||||||||||||||
|
General and administrative reimbursement (a)
|
$
|
12,189
|
|
$
|
9,404
|
|
$
|
8,205
|
|
$
|
4,017
|
|
$
|
2,734
|
|
||||
|
Loan servicing (b)
|
147
|
|
586
|
|
586
|
|
—
|
|
—
|
|
|||||||||
|
Investment advisor fee (c)
|
1,768
|
|
1,564
|
|
1,447
|
|
150
|
|
135
|
|
|||||||||
|
Total general and administrative to related parties
|
$
|
14,104
|
|
$
|
11,554
|
|
$
|
10,238
|
|
$
|
4,167
|
|
$
|
2,869
|
|
||||
|
Property management fees (d)
|
$
|
27,615
|
|
$
|
31,437
|
|
$
|
30,828
|
|
$
|
75
|
|
$
|
(178
|
)
|
||||
|
Business manager fee (e)
|
$
|
39,892
|
|
$
|
40,000
|
|
$
|
36,000
|
|
$
|
9,910
|
|
$
|
10,000
|
|
||||
|
Loan placement fees (f)
|
$
|
1,241
|
|
$
|
1,260
|
|
$
|
845
|
|
$
|
—
|
|
$
|
—
|
|
||||
|
(a)
|
The Business Manager and its related parties are entitled to reimbursement for general and administrative expenses of the Business Manager and its related parties relating to the Company’s administration. Unpaid amounts as of
December 31, 2012 and 2011
are included in accounts payable and accrued expenses on the consolidated balance sheets.
|
|
(b)
|
A related party of the Business Manager provided loan servicing to the Company.
|
|
(c)
|
The Company pays a related party of the Business Manager to purchase and monitor its investment in marketable securities.
|
|
(d)
|
The property managers, entities owned principally by individuals who were related parties of the Business Manager, are entitled to receive property management fees up to a certain percentage of gross operating income (as defined). For the six months ending June 30, 2012, the property managers, entities owned principally by individuals who were related parties of the Business Manager, are entitled to receive property management fees up to
4.5%
of gross operating income (as defined), for management and leasing services; however, (1) for triple-net lease properties, the property managers were entitled to monthly fees equal to
2.9%
of the gross income generated by the applicable property each month and (2) for bank branches, the property managers were entitled to monthly fees equal to
2.5%
of the gross income generated by the applicable property each month in operating companies purchased by the Company. The property managers were entitled to receive an oversight fee of
1%
of gross operating income (as defined). These rates became effective January 1, 2012 when the Company entered into an extension agreement with the property managers which extended the term through June 30, 2012.
|
On July 1, 2012, the Company entered into new master agreements with its property managers and extended the term until December 31, 2013 which will automatically be renewed until June 30, 2015 unless either party to the agreement provides written notice of cancellation before June 30, 2013. Under the new master agreements, the Company will pay the property managers monthly management fees by property type, updated as follows: (i) for any bank branch facility (office or retail),
2.50%
of the gross income generated by the property; (ii) for any multi-tenant industrial property,
4.00%
of the gross income generated by the property; (iii) for any multi-family property,
3.75%
of the gross income generated by the property; (iv) for any multi-tenant office property,
3.75%
of the gross income generated by the property; (v) for any multi-tenant retail property,
4.50%
of the gross income generated by the property; (vi) for any single-tenant industrial property,
2.25%
of the gross income generated by the property; (vii) for any single-tenant office property,
2.90%
of the gross income generated by the property; and (viii) for any single-tenant retail property,
2.90%
of the gross income generated by the property.
84
INLAND AMERICAN REAL ESTATE TRUST, INC.
(A Maryland Corporation)
Notes to Consolidated Financial Statements
(Dollar amounts in thousands, except for per share amounts)
December 31, 2012, 2011 and 2010
In addition to these fees, the property managers receive reimbursements of payroll costs for property level employees. The Company reimbursed the property managers and other affiliates
$14,049
,
$15,752
and
$14,626
for the year ended December 31, 2012, 2011 and 2010, respectively. Unpaid amounts as of December 31, 2012 and 2011 are included in other liabilities on the consolidated balance sheets.
|
(e)
|
After the Company’s stockholders have received a non-cumulative, non-compounded return of
5%
per annum on their “invested capital,” the Company pays its Business Manager an annual business management fee of up to
1%
of the “average invested assets,” payable quarterly in an amount equal to
0.25%
of the average invested assets as of the last day of the immediately preceding quarter. For the years ended
December 31, 2012, 2011 and 2010
, average invested assets were $
11,470,745
,
$11,515,550
and
$11,411,953
. The Company incurred a business management fee of
$39,892
,
$40,000
, and
$36,000
, which is equal to
0.35%
,
0.35%
, and
0.32%
of average invested assets for the years ended
December 31, 2012, 2011 and 2010
, respectively. Pursuant to the letter agreement dated May 4, 2012, the business management fee shall be reduced in each particular quarter for investigation costs exclusive of legal fees incurred in conjunction with the SEC matter. During the year ended December 31, 2012, the Company incurred
$108
of investigation costs, resulting in a business management fee expense of
$39,892
for the year ended December 31, 2012. In addition, effective July 30, 2012, the Company extended the agreement with the Business Manager through July 30, 2013. The terms of the Business Manager Agreement remains unchanged.
|
|
(f)
|
The Company pays a related party of the Business Manager
0.2%
of the principal amount of each loan placed for the Company. Such costs are capitalized as loan fees and amortized over the respective loan term.
|
As of
December 31, 2012 and 2011
, the Company had deposited
$375
and
$373
, respectively, in Inland Bank and Trust, a subsidiary of Inland Bancorp, Inc., an affiliate of The Inland Real Estate Group, Inc.
The Company is party to an agreement with an LLC formed as an insurance association captive (the “Captive”), which is wholly-owned by the Company and two related parties, Inland Real Estate Corporation (“IRC”) and Inland Diversified Real Estate Trust, Inc., and a third party, Retail Properties of America ("RPAI"). The Company paid insurance premiums of
$12,217
,
$9,627
and
$10,096
for the years ended
December 31, 2012, 2011 and 2010
, respectively.
As of
December 31, 2012 and 2011
, the Company held
889,820
and
889,820
shares of IRC valued at $
7,540
and
$6,848
, respectively.
(7) Investment in Marketable Securities
Investment in marketable securities of
$327,655
and
$289,365
at
December 31, 2012 and 2011
, respectively, consists of primarily preferred and common stock investments in other REITs and certain real estate related bonds which are classified as available-for-sale securities and recorded at fair value. The cost basis net of impairments of available-for-sale securities was
$242,370
and
$245,131
at
December 31, 2012 and 2011
, respectively.
Unrealized holding gains and losses on available-for-sale securities are excluded from earnings and reported as a separate component of comprehensive income until realized. The Company has net accumulated other comprehensive income of
$85,285
,
$44,234
and
$52,965
, which includes gross unrealized losses of
$2,014
,
$9,990
and
$5,433
as of
December 31, 2012, 2011 and 2010
, respectively. Gross unrealized losses on investments have a related fair value of
$14,576
as of
December 31, 2012
.
The Company’s policy for assessing recoverability of its available-for-sale securities is to record a charge against net earnings when the Company determines that a decline in the fair value of a security drops below the cost basis and believes that decline to be other-than-temporary. Factors in the assessment of other-than-temporary impairment include determining whether (1) the Company has the ability and intent to hold the security until it recovers, and (2) the length of time and degree to which the security’s price has declined. During the year ended
December 31, 2012
, the Company recorded impairment of
$1,899
compared to an impairment of
$24,356
and
$1,856
for the years ended
December 31, 2011 and 2010
for other-than-temporary declines on certain available-for-sale securities, which is included as a component of realized gain (loss) and (impairment) on securities, net on the consolidated statements of operations and other comprehensive income.
85
INLAND AMERICAN REAL ESTATE TRUST, INC.
(A Maryland Corporation)
Notes to Consolidated Financial Statements
(Dollar amounts in thousands, except for per share amounts)
December 31, 2012, 2011 and 2010
Dividend income is recognized when earned. During the years ended
December 31, 2012, 2011 and 2010
, dividend income of
$20,757
,
$18,586
and
$18,386
was recognized and is included in interest and dividend income on the consolidated statements of operations and other comprehensive income.
(8) Leases
Operating Leases
Minimum lease payments to be received under operating leases, excluding multi-family and lodging properties and assuming no expiring leases are renewed, are as follows:
|
|
Minimum Lease
Payments |
||
|
2013
|
$
|
525,951
|
|
|
2014
|
488,259
|
|
|
|
2015
|
457,727
|
|
|
|
2016
|
408,825
|
|
|
|
2017
|
343,120
|
|
|
|
2018
|
234,662
|
|
|
|
2019
|
204,455
|
|
|
|
2020
|
176,264
|
|
|
|
2021
|
152,872
|
|
|
|
2022
|
113,723
|
|
|
|
Thereafter
|
484,061
|
|
|
|
Total
|
$
|
3,589,919
|
|
The remaining lease terms range from
one
year to
thirty-eight
years. The majority of the revenue from the Company’s properties consists of rents received under long-term operating leases. Some leases provide for the payment of fixed base rent paid monthly in advance, and for the reimbursement by tenants to the Company for the tenant’s pro rata share of certain operating expenses including real estate taxes, special assessments, insurance, utilities, common area maintenance, management fees, and certain building repairs paid by the landlord and recoverable under the terms of the lease. Under these leases, the landlord pays all expenses and is reimbursed by the tenant for the tenant’s pro rata share of recoverable expenses paid. Certain other tenants are subject to net leases which provide that the tenant is responsible for fixed base rent as well as all costs and expenses associated with occupancy. Under net leases where all expenses are paid directly by the tenant rather than the landlord, such expenses are not included in the consolidated statements of operations and other comprehensive income. Under leases where all expenses are paid by the landlord, subject to reimbursement by the tenant, the expenses are included within property operating expenses and reimbursements are included in tenant recovery income on the consolidated statements of operations and other comprehensive income.
86
INLAND AMERICAN REAL ESTATE TRUST, INC.
(A Maryland Corporation)
Notes to Consolidated Financial Statements
(Dollar amounts in thousands, except for per share amounts)
December 31, 2012, 2011 and 2010
(9) Intangible Assets and Goodwill
The following table summarizes the Company’s identified intangible assets, intangible liabilities and goodwill as of
December 31, 2012 and 2011
.
|
|
Balance as of
December 31, 2012 |
Balance as of
December 31, 2011 |
|||||
|
Intangible assets:
|
|
|
|||||
|
Acquired in-place lease
|
$
|
573,711
|
|
$
|
601,959
|
|
|
|
Acquired above market lease
|
41,276
|
|
37,624
|
|
|||
|
Acquired below market ground lease
|
10,536
|
|
8,825
|
|
|||
|
Advance bookings
|
8,410
|
|
5,924
|
|
|||
|
Accumulated amortization
|
(366,301
|
)
|
(335,761
|
)
|
|||
|
Net intangible assets
|
267,632
|
|
318,571
|
|
|||
|
Goodwill, net
|
31,196
|
|
7,761
|
|
|||
|
Total intangible assets, net
|
$
|
298,828
|
|
$
|
326,332
|
|
|
|
Intangible liabilities:
|
|
|
|||||
|
Acquired below market lease
|
$
|
101,430
|
|
$
|
99,187
|
|
|
|
Acquired above market ground lease
|
5,839
|
|
5,840
|
|
|||
|
Accumulated amortization
|
(26,500
|
)
|
(21,824
|
)
|
|||
|
Net intangible liabilities
|
$
|
80,769
|
|
$
|
83,203
|
|
|
The portion of the purchase price allocated to acquired above market lease costs and acquired below market lease costs are amortized on a straight line basis over the life of the related lease, including the respective renewal period for below market lease costs with fixed rate renewals, as an adjustment to rental income. Amortization pertaining to the above market lease costs was applied as a reduction to rental income. Amortization pertaining to the below market lease costs was applied as an increase to rental income. The portion of the purchase price allocated to acquired in-place lease intangibles is amortized on a straight line basis over the life of the related lease.
The following table summarized the amortization related to acquired above and below market lease costs and acquired in-place lease intangibles for the years ended
December 31, 2012, 2011 and 2010
.
|
|
For the years ended
|
||||||||||
|
|
December 31,
2012 |
December 31,
2011 |
December 31,
2010 |
||||||||
|
Amortization of:
|
|
|
|
||||||||
|
Acquired above market lease costs
|
$
|
(4,507
|
)
|
$
|
(5,076
|
)
|
$
|
(5,797
|
)
|
||
|
Acquired below market lease costs
|
$
|
6,771
|
|
$
|
6,767
|
|
$
|
6,218
|
|
||
|
Net rental income increase
|
$
|
2,264
|
|
$
|
1,691
|
|
$
|
421
|
|
||
|
Acquired in-place lease intangibles
|
$
|
56,645
|
|
$
|
63,157
|
|
$
|
71,148
|
|
||
87
INLAND AMERICAN REAL ESTATE TRUST, INC.
(A Maryland Corporation)
Notes to Consolidated Financial Statements
(Dollar amounts in thousands, except for per share amounts)
December 31, 2012, 2011 and 2010
The following table presents the amortization during the next five years and thereafter related to intangible assets and liabilities at
December 31, 2012
.
|
|
2013
|
2014
|
2015
|
2016
|
2017
|
Thereafter
|
Total
|
|||||||||||||||
|
Amortization of:
|
|
|
|
|
|
|
|
|||||||||||||||
|
Acquired above market lease costs
|
$
|
(4,082
|
)
|
(3,648
|
)
|
(3,188
|
)
|
(2,949
|
)
|
(2,481
|
)
|
(6,290
|
)
|
$
|
(22,638
|
)
|
||||||
|
Acquired below market lease costs
|
$
|
5,716
|
|
5,313
|
|
5,109
|
|
4,941
|
|
4,777
|
|
50,017
|
|
$
|
75,873
|
|
||||||
|
Net rental income increase
|
$
|
1,634
|
|
1,665
|
|
1,921
|
|
1,992
|
|
2,296
|
|
43,727
|
|
$
|
53,235
|
|
||||||
|
Acquired in-place lease intangibles
|
$
|
51,083
|
|
37,832
|
|
32,964
|
|
29,836
|
|
23,723
|
|
58,663
|
|
$
|
234,101
|
|
||||||
|
Advance bookings
|
$
|
1,730
|
|
1,694
|
|
557
|
|
—
|
|
—
|
|
—
|
|
$
|
3,981
|
|
||||||
|
Acquired below market ground lease
|
$
|
(206
|
)
|
(206
|
)
|
(206
|
)
|
(206
|
)
|
(206
|
)
|
(5,882
|
)
|
$
|
(6,912
|
)
|
||||||
|
Acquired above market ground lease
|
$
|
140
|
|
140
|
|
140
|
|
140
|
|
140
|
|
4,196
|
|
$
|
4,896
|
|
||||||
(10) Mortgages, Notes and Margins Payable
During the years ended
December 31, 2012 and 2011
, the following debt transactions occurred:
|
Balance at December 31, 2010
|
$
|
5,532,057
|
|
|
New financings
|
1,252,057
|
|
|
|
Paydown of debt
|
(781,606
|
)
|
|
|
Extinguishment of debt
|
(102,983
|
)
|
|
|
Amortization of discount/premium
|
3,187
|
|
|
|
Balance at December 31, 2011
|
$
|
5,902,712
|
|
|
New financings
|
867,651
|
|
|
|
Paydown of debt
|
(409,067
|
)
|
|
|
Assumed financings, net of discount
|
228,706
|
|
|
|
Extinguishment of debt
|
(590,344
|
)
|
|
|
Amortization of discount/premium
|
6,488
|
|
|
|
Balance at December 31, 2012
|
$
|
6,006,146
|
|
Mortgage loans outstanding as of
December 31, 2012 and 2011
were
$5,894,443
and
$5,812,595
and had a weighted average interest rate of
5.1%
and
5.2%
per annum, respectively. Mortgage premium and discount, net was a discount of
$27,439
and
$30,741
as of
December 31, 2012 and 2011
. As of
December 31, 2012
, scheduled maturities for the Company’s outstanding mortgage indebtedness had various due dates through December 2047.
88
INLAND AMERICAN REAL ESTATE TRUST, INC.
(A Maryland Corporation)
Notes to Consolidated Financial Statements
(Dollar amounts in thousands, except for per share amounts)
December 31, 2012, 2011 and 2010
|
|
As of
December 31, 2012 |
Weighted average
interest rate |
||||
|
2013
|
$
|
882,907
|
|
4.52
|
%
|
|
|
2014
|
$
|
668,974
|
|
3.97
|
%
|
|
|
2015
|
$
|
684,328
|
|
4.64
|
%
|
|
|
2016
|
$
|
782,997
|
|
5.42
|
%
|
|
|
2017
|
$
|
1,230,313
|
|
5.57
|
%
|
|
|
Thereafter
|
$
|
1,644,924
|
|
5.57
|
%
|
|
The Company is negotiating refinancing debt maturing in 2013 with various lenders at terms that will allow us to pay lower interest rates. It is anticipated that the Company will be able to repay, refinance or extend the maturities and the Company believes it has adequate sources of funds to meet short term cash needs related to these refinancings. Of the total outstanding debt, approximately
$691,469
is recourse to the Company.
Some of the mortgage loans require compliance with certain covenants, such as debt service ratios, investment restrictions and distribution limitations. As of
December 31, 2012
, the Company was in compliance with all mortgage loan requirements except five loans with a carrying value of
$72,414
; none of which are cross collateralized with any other mortgage loans or recourse to the Company. The stated maturities of the mortgage loans in default are reflected as follows:
$12,100
in 2011,
$17,078
in 2012, and
$43,236
in 2017.
The Company has purchased a portion of its securities through margin accounts. As of
December 31, 2012 and 2011
, the Company recorded a payable of
$139,142
and
$120,858
, respectively, for securities purchased on margin. At
December 31, 2012 and 2011
, the interest rate on the margin loans was
0.560%
and
0.621%
, respectively. Interest expense in the amount of
$756
,
$473
and
$419
was recognized in interest expense on the consolidated statements of operations and other comprehensive income for the years ended
December 31, 2012, 2011 and 2010
, respectively.
(11) Derivatives
As of
December 31, 2012
, in connection with certain mortgages payable that have variable interest rates, the Company has entered into interest rate swap agreements, with a notional value of
$176,394
. The Company’s interest rate swaps involve the receipt of variable-rate amounts from a counterparty in exchange for the Company making fixed rate payments over the life of the agreements without exchange of the underlying notional amount. The interest rate swaps were considered highly effective as of
December 31, 2012
. The change in the fair value of the Company’s swaps as reflected in other comprehensive income was
$1,413
,
$1,249
, and
$300
for the years ended
December 31, 2012, 2011 and 2010
, respectively.
The following table summarizes interest rate swap contracts outstanding as of
December 31, 2012 and 2011
:
|
Date Entered
|
Effective Date
|
End Date
|
Pay
Fixed Rate |
Receive Floating
Rate Index |
Notional
Amount |
Fair Value
as of December 31, 2012 |
Fair Value
as of December 31, 2011 |
||||||||||||
|
March 28, 2008
|
March 28, 2008
|
March 27, 2013
|
3.32%
|
1 month LIBOR
|
33,062
|
|
(243
|
)
|
(1,156
|
)
|
|||||||||
|
January 16, 2009
|
January 13, 2009
|
January 13, 2012
|
1.62%
|
1 month LIBOR
|
N/A
|
|
—
|
|
(10
|
)
|
|||||||||
|
August 19, 2010
|
August 31, 2010
|
March 27, 2012
|
0.63%
|
1 month LIBOR
|
N/A
|
|
—
|
|
(22
|
)
|
|||||||||
|
October 15, 2010
|
November 1, 2010
|
April 23, 2013
|
0.94%
|
1 month LIBOR
|
29,727
|
|
(68
|
)
|
(181
|
)
|
|||||||||
|
January 7, 2011
|
January 7, 2011
|
January 2, 2013
|
0.91%
|
1 month LIBOR
|
26,090
|
|
(1
|
)
|
(121
|
)
|
|||||||||
|
January 7, 2011
|
January 7, 2011
|
January 2, 2013
|
0.91%
|
1 month LIBOR
|
22,696
|
|
—
|
|
(105
|
)
|
|||||||||
|
April 28, 2011
|
May 3, 2011
|
September 30, 2012
|
1.575%
|
1 month LIBOR
|
N/A
|
|
—
|
|
(481
|
)
|
|||||||||
|
September 1, 2011
|
September 29, 2012
|
September 29, 2014
|
0.79%
|
1 month LIBOR
|
56,501
|
|
(507
|
)
|
(130
|
)
|
|||||||||
|
October 14, 2011
|
October 14, 2011
|
October 22, 2013
|
1.04%
|
1 month LIBOR
|
8,318
|
|
(52
|
)
|
(78
|
)
|
|||||||||
|
|
|
|
|
|
$
|
176,394
|
|
$
|
(871
|
)
|
$
|
(2,284
|
)
|
||||||
89
INLAND AMERICAN REAL ESTATE TRUST, INC.
(A Maryland Corporation)
Notes to Consolidated Financial Statements
(Dollar amounts in thousands, except for per share amounts)
December 31, 2012, 2011 and 2010
Risk Management Objective of Using Derivatives
The Company is exposed to certain risk arising from both its business operations and economic conditions. The Company manages economic risks, including interest rate, liquidity, and credit risk, primarily by managing the amount, sources, and duration of its debt funding and through the use of derivative financial instruments. Specifically, the Company enters into derivative financial instruments to add stability to interest expense and to manage its exposure to interest rate movements.
Cash Flow Hedges of Interest Rate Risk
The Company primarily uses interest rate swaps as part of its interest rate risk management strategy. Interest rate swaps designated as cash flow hedges involve the receipt of variable-rate amounts from a counterparty in exchange for the Company making fixed-rate payments over the life of the agreements without exchange of the underlying notional amount.
Derivatives were used to hedge the variable cash flows associated with existing variable-rate debt. The derivative instruments were reported at their fair value of
$871
and
$2,284
in other liabilities at
December 31, 2012 and 2011
, respectively. The effective portion of changes in the fair value of derivatives designated and that qualify as cash flow hedges is recorded in accumulated other comprehensive income (loss) and is subsequently reclassified into earnings in the period that the hedged forecasted transaction affects earnings. During the next 12 months, the Company estimates that $
683
of loss will be reclassified into earnings. The ineffective portion of the change in fair value of the derivatives is recognized directly in earnings.
The tables below present the effect of the Company’s derivative financial instruments on the consolidated statements of operations and other comprehensive income for the years ended
December 31, 2012, 2011 and 2010
:
|
Derivatives in ASC
815 Cash Flow Hedging Relationships |
Amount of Gain or
(Loss) Recognized in OCI on Derivative (Effective Portion) For the years ended December 31, |
Location of
Gain or (Loss) Reclassified from Accumulated OCI into Income (Effective Portion) |
Amount of Gain or (Loss)
Reclassified from Accumulated OCI into Income (Effective Portion) For the years ended December 31, |
Location of
Gain or (Loss) Recognized in Income on Derivative (Ineffective Portion and Amount Excluded from Effectiveness Testing) |
Amount of Gain or
(Loss) Recognized in Income on Derivative (Ineffective Portion and Amount Excluded from Effectiveness Testing) For the years ended December 31, |
|||||||||||||||||||||||||||||||||
|
2012
|
2011
|
2010
|
2012
|
2011
|
2010
|
2012
|
2011
|
2010
|
||||||||||||||||||||||||||||||
|
Interest Rate Products
|
$
|
1,413
|
|
$
|
1,249
|
|
$
|
300
|
|
Interest
expense |
$
|
(2,329
|
)
|
$
|
(4,012
|
)
|
$
|
(4,508
|
)
|
Interest
expense |
$
|
—
|
|
$
|
(84
|
)
|
$
|
473
|
|
|||||||||
(12) Fair Value Measurements
In accordance with FASB ASC 820, Fair Value Measurement and Disclosures, the Company defines fair value based on the price that would be received upon sale of an asset or the exit price that would be paid to transfer a liability in an orderly transaction between market participants at the measurement date. The Company uses a fair value hierarchy that prioritizes observable and unobservable inputs used to measure fair value. The fair value hierarchy consists of three broad levels, which are described below:
|
•
|
Level 1 - Quoted prices in active markets for identical assets or liabilities that the entity has the ability to access.
|
|
•
|
Level 2 - Observable inputs, other than quoted prices included in Level 1, such as quoted prices for similar assets and liabilities in active markets; quoted prices for identical or similar assets and liabilities in markets that are not active; or other inputs that are observable or can be corroborated by observable market data.
|
|
•
|
Level 3 - Unobservable inputs that are supported by little or no market activity and that are significant to the fair value of the assets and liabilities. This includes certain pricing models, discounted cash flow methodologies and similar techniques that use significant unobservable inputs.
|
The Company has estimated the fair value of its financial and non-financial instruments using available market information and valuation methodologies the Company believes to be appropriate for these purposes. Considerable judgment and a high degree
90
INLAND AMERICAN REAL ESTATE TRUST, INC.
(A Maryland Corporation)
Notes to Consolidated Financial Statements
(Dollar amounts in thousands, except for per share amounts)
December 31, 2012, 2011 and 2010
of subjectivity are involved in developing these estimates and, accordingly, they are not necessarily indicative of amounts that would be realized upon disposition.
For assets and liabilities measured at fair value on a recurring basis, quantitative disclosure of the fair value for each major category of assets and liabilities is presented below:
|
|
Fair Value Measurements at December 31, 2012
|
||||||||||
|
|
Using Quoted Prices
in Active Markets for Identical Assets (Level 1) |
Using Significant
Other Observable Inputs (Level 2) |
Using Significant
Other Unobservable Inputs (Level 3) |
||||||||
|
Description
|
|
|
|
||||||||
|
Available-for-sale real estate equity securities
|
$
|
304,811
|
|
$
|
—
|
|
$
|
—
|
|
||
|
Real estate related bonds
|
—
|
|
22,844
|
|
—
|
|
|||||
|
Total assets
|
$
|
304,811
|
|
$
|
22,844
|
|
$
|
—
|
|
||
|
Derivative interest rate instruments
|
$
|
—
|
|
$
|
(871
|
)
|
$
|
—
|
|
||
|
Total liabilities
|
$
|
—
|
|
$
|
(871
|
)
|
$
|
—
|
|
||
|
|
Fair Value Measurements at December 31, 2011
|
||||||||||
|
|
Using Quoted Prices
in Active Markets for Identical Assets (Level 1) |
Using Significant
Other Observable Inputs (Level 2) |
Using Significant
Other Unobservable Inputs (Level 3) |
||||||||
|
Description
|
|
|
|
||||||||
|
Available-for-sale real estate equity securities
|
$
|
274,274
|
|
$
|
—
|
|
$
|
—
|
|
||
|
Real estate related bonds
|
—
|
|
15,091
|
|
—
|
|
|||||
|
Total assets
|
$
|
274,274
|
|
$
|
15,091
|
|
$
|
—
|
|
||
|
Derivative interest rate instruments
|
$
|
—
|
|
$
|
(2,284
|
)
|
$
|
—
|
|
||
|
Total liabilities
|
$
|
—
|
|
$
|
(2,284
|
)
|
$
|
—
|
|
||
Level 1
At
December 31, 2012 and 2011
, the fair value of the available for sale real estate equity securities have been estimated based upon quoted market prices for the same or similar issues when current quoted market prices are available. Unrealized gains or losses on investment are reflected in unrealized gain (loss) on investment securities in other comprehensive income on the consolidated statements of operations and other comprehensive income.
Level 2
To calculate the fair value of the real estate related bonds and the derivative interest rate instruments, the Company primarily uses quoted prices for similar securities and contracts. For the real estate related bonds, the Company reviews price histories for similar market transactions. For the derivative interest rate instruments, the Company uses inputs based on data that is observed in the forward yield curve which is widely observable in the marketplace. The Company also incorporates credit valuation adjustments to appropriately reflect both its own nonperformance risk and the respective counterparty’s nonperformance risk in the fair value measurements which utilizes Level 3 inputs, such as estimates of current credit spreads. However, as of
December 31, 2012 and 2011
, the Company has assessed that the credit valuation adjustments are not significant to the overall valuation of its derivatives. As a result, the Company has determined that its derivative valuations in their entirety are classified in Level 2 of the fair value hierarchy.
91
INLAND AMERICAN REAL ESTATE TRUST, INC.
(A Maryland Corporation)
Notes to Consolidated Financial Statements
(Dollar amounts in thousands, except for per share amounts)
December 31, 2012, 2011 and 2010
Level 3
Non-Recurring Measurements
The following table summarizes activity for the Company’s assets measured at fair value on a non-recurring basis. The Company recognized certain non-cash gains and impairment charges to reflect the investments at their fair values for the years ended
December 31, 2012 and 2011
. The asset groups that were reflected at fair value through this evaluation are:
|
|
As of December 31, 2012
|
As of December 31, 2011
|
|||||||||||||
|
|
Fair Value
Measurements Using Significant Unobservable Inputs (Level 3) |
Total
Gain (Impairment Losses), net |
Fair Value
Measurements Using Significant Unobservable Inputs (Level 3) |
Total
Gain (Impairment Losses), net |
|||||||||||
|
Investment properties
|
$
|
146,085
|
|
$
|
(77,348
|
)
|
$
|
76,346
|
|
$
|
(28,967
|
)
|
|||
|
Investment in unconsolidated entities
|
36,469
|
|
(5,165
|
)
|
43,658
|
|
(96,471
|
)
|
|||||||
|
Total
|
$
|
182,554
|
|
$
|
(82,513
|
)
|
$
|
120,004
|
|
$
|
(125,438
|
)
|
|||
The Company’s estimated fair value relating to the investment properties’ impairment analysis was based on a comparison of letters of intent or purchase contracts, broker opinions of value and discounted cash flow models, which includes contractual inflows and outflows over a specific holding period. The cash flows consist of unobservable inputs such as contractual revenues and forecasted revenues and expenses. These unobservable inputs are based on market conditions and the Company’s expected growth rates. Capitalization rates ranging from
7.00%
to
10.00%
and discount rates ranging from
8.00%
to
11.50%
were utilized in the model and are based upon observable rates that the Company believes to be within a reasonable range of current market rates.
For the year ended
December 31, 2012
, the Company identified certain properties which may have a reduction in the expected holding period, and the Company reviewed the probability of the disposition of these properties. For the years ended,
December 31, 2012, 2011 and 2010
, the Company recorded an impairment of investment properties of
$77,348
,
$28,967
and
$0
, respectively. Certain properties have been disposed and were impaired prior to disposition and the related impairment charge of
$5,968
,
$134,673
and
$47,529
was included in discontinued operations for the years ended
December 31, 2012, 2011 and 2010
, respectively.
For the year ended
December 31, 2012
, the Company identified certain investments in unconsolidated entities that may be other than temporarily impaired. The Company's estimated fair value relating to the investment in unconsolidated entities' impairment analysis was based on letters of intent or purchase contracts, broker opinions of value, expected future cash distributions and the fair value of the Company's interest in the underlying assets of the investment using a net asset value model. The net asset value model utilizes an income capitalization analysis and consists of unobservable inputs such as forecasted net operating income and capitalization rates based on market conditions. Capitalization rates ranging from
6.50%
to
8.25%
were utilized in the model and are based upon observable rates that the Company believes to be within a reasonable range of current market rates.
For the year ended
December 31, 2011
, the Company recognized an investment in unconsolidated entities equal to its equity investment in a trust which owns 100% of a hotel property. The investment was a result of a conversion of a note receivable to an equity interest in which the Company recognized a gain of
$17,150
for the year ended
December 31, 2011
. The fair value of hotel property was estimated based on analysis of appraisals, broker opinions of value, and discounted cash flow models, which includes contractual inflows and outflows over a specific holding period. The cash flows consist of unobservable inputs such as contractual revenues and forecasted revenues and expenses. These unobservable inputs are based on market conditions and expected growth rates. Capitalization rates and discount rates are utilized in the model and are based upon observable rates that the Company believes to be within a reasonable range of current market rates.
For the years ended,
December 31, 2012, 2011 and 2010
, the Company recorded an impairment of investments in unconsolidated entities of
$9,365
,
$113,621
, and
$11,239
, respectively.
92
INLAND AMERICAN REAL ESTATE TRUST, INC.
(A Maryland Corporation)
Notes to Consolidated Financial Statements
(Dollar amounts in thousands, except for per share amounts)
December 31, 2012, 2011 and 2010
For the year ended
December 31, 2010
, the Company determined that it is probable that it will not be able to collect all amounts due under the contractual terms of the note receivables. When the Company assesses the potential impairment of notes receivables, an evaluation of the fair value of the collateral is performed through a review of third party appraisals and discounted cash flow models. The Company's discounted cash flow models include contractual inflows and outflows over a specific holding period and utilize unobservable inputs based on market conditions and the Company's expected growth rates. The Company believes the capitalization rates and discount rates utilized in the models are based upon observable rates that are within a reasonable range of current market rates.
For the years ended
December 31, 2012, 2011 and 2010
, the Company recorded an impairment of notes receivables of
$0
,
$0
and
$111,896
, respectively.
Financial Instruments not Measured at Fair Value
The table below represents the fair value of financial instruments presented at carrying values in our consolidated financial statements as of
December 31, 2012
and
December 31, 2011
.
|
|
December 31, 2012
|
December 31, 2011
|
|||||||||||||
|
|
Carrying Value
|
Estimated Fair Value
|
Carrying Value
|
Estimated Fair Value
|
|||||||||||
|
Mortgage and notes payable
|
$
|
5,894,443
|
|
$
|
5,790,201
|
|
$
|
5,812,595
|
|
$
|
5,524,022
|
|
|||
|
Margins payable
|
$
|
139,142
|
|
$
|
139,142
|
|
$
|
120,858
|
|
$
|
120,858
|
|
|||
The Company estimates the fair value of its debt instruments using a weighted average effective interest rate of
5.1%
per annum. The assumptions reflect the terms currently available on similar borrowing terms to borrowers with credit profiles similar to the Company's. The Company has determined that its debt instrument valuations are classified in Level 2 of the fair value hierarchy.
(13) Income Taxes
The Company is qualified and has elected to be taxed as a real estate investment trust (“REIT”) under the Internal Revenue Code of 1986, as amended, for federal income tax purposes commencing with the tax year ending December 31, 2005. Since the Company qualifies for taxation as a REIT, the Company generally will not be subject to federal income tax on taxable income that is distributed to stockholders. A REIT is subject to a number of organizational and operational requirements, including a requirement that it currently distributes at least
90%
of its REIT taxable income (subject to certain adjustments) to its stockholders. If the Company fails to qualify as a REIT in any taxable year, without the benefit of certain relief provisions, the Company will be subject to federal and state income tax on its taxable income at regular corporate tax rates. Even if the Company qualifies for taxation as a REIT, the Company may be subject to certain state and local taxes on its income, property or net worth and federal income and excise taxes on its undistributed income.
The Company has elected to treat certain of its consolidated subsidiaries, and may in the future elect to treat newly formed subsidiaries, as taxable REIT subsidiaries pursuant to the Internal Revenue Code. Taxable REIT subsidiaries may participate in non-real estate related activities and/or perform non-customary services for tenants and are subject to federal and state income tax at regular corporate tax rates. The Company’s hotels are leased to certain of the Company’s taxable REIT subsidiaries. Lease revenue from these taxable REIT subsidiaries and its wholly-owned subsidiaries is eliminated in consolidation.
The components of income tax expense for the years ended December 31:
93
INLAND AMERICAN REAL ESTATE TRUST, INC.
(A Maryland Corporation)
Notes to Consolidated Financial Statements
(Dollar amounts in thousands, except for per share amounts)
December 31, 2012, 2011 and 2010
|
|
2012
|
2011
|
2010
|
||||||||||||||||||||||||||||||||
|
|
Federal
|
State
|
Total
|
Federal
|
State
|
Total
|
Federal
|
State
|
Total
|
||||||||||||||||||||||||||
|
Current
|
$
|
267
|
|
$
|
2,603
|
|
$
|
2,870
|
|
$
|
110
|
|
$
|
588
|
|
$
|
698
|
|
$
|
1,502
|
|
$
|
1,466
|
|
$
|
2,968
|
|
||||||||
|
Deferred
|
4,412
|
|
489
|
|
4,901
|
|
(3,837
|
)
|
(248
|
)
|
(4,085
|
)
|
(6,698
|
)
|
(788
|
)
|
(7,486
|
)
|
|||||||||||||||||
|
Total income expense (benefit)
|
$
|
4,679
|
|
$
|
3,092
|
|
$
|
7,771
|
|
$
|
(3,727
|
)
|
$
|
340
|
|
$
|
(3,387
|
)
|
$
|
(5,196
|
)
|
$
|
678
|
|
$
|
(4,518
|
)
|
||||||||
Deferred tax assets and liabilities are included within deferred costs and other assets and other liabilities in the consolidated balance sheets, respectively. The components of the deferred tax assets and liabilities at
December 31, 2012 and 2011
were as follows:
|
|
2012
|
2011
|
|||||
|
Net operating loss
|
$
|
11,618
|
|
$
|
16,084
|
|
|
|
Deferred income
|
2,657
|
|
1,536
|
|
|||
|
Basis difference on development property
|
31,916
|
|
31,916
|
|
|||
|
Lease acquisition costs
|
—
|
|
314
|
|
|||
|
Depreciation expense
|
879
|
|
753
|
|
|||
|
Miscellaneous
|
(190
|
)
|
118
|
|
|||
|
Total deferred tax assets
|
46,880
|
|
50,721
|
|
|||
|
Less: Valuation allowance
|
(39,360
|
)
|
(38,300
|
)
|
|||
|
Net deferred tax assets
|
$
|
7,520
|
|
$
|
12,421
|
|
|
|
Deferred tax liabilities
|
$
|
—
|
|
$
|
—
|
|
|
Federal net operating loss carryforwards amounting to
$11,618
begin to expire in 2023, if not utilized by then.
Deferred tax assets are recognized only to the extent that it is more likely than not that they will be realized based on consideration of available evidence, including future reversal of existing taxable temporary differences, future projected taxable income, and tax-planning strategies. In assessing the realizability of deferred tax assets, management considers whether it is more likely than not that some portion or all of the deferred tax assets will not be realized. The ultimate realization of deferred tax assets is dependent upon the generation of future taxable income during the periods in which those temporary differences become deductible. The Company has considered various factors, including future reversals of existing taxable temporary differences, projected future taxable income and tax-planning strategies in making this assessment.
Based upon tax-planning strategies and projections for future taxable income over the periods in which the deferred tax assets are deductible, management believes it is more likely than not that the Company will realize the benefits of these deductible differences, net of the existing valuation allowance of
$39,360
at
December 31, 2012
. The amount of the deferred tax assets considered realizable, however, could be reduced in the near term if estimates of future taxable income during the carryforward period are reduced.
Uncertain Tax Positions
The Company had no unrecognized tax benefits as of or during the three year period ended
December 31, 2012
. The Company expects no significant increases or decreases in unrecognized tax benefits due to changes in tax positions within one year of
December 31, 2012
. The Company has no material interest or penalties relating to income taxes recognized in the consolidated statements of operations and other comprehensive income for the years ended
December 31, 2012, 2011 and 2010
or in the consolidated balance sheets as of
December 31, 2012 and 2011
. As of
December 31, 2012
, the Company’s 2011, 2010, and 2009 tax years remain subject to examination by U.S. and various state tax jurisdictions.
94
INLAND AMERICAN REAL ESTATE TRUST, INC.
(A Maryland Corporation)
Notes to Consolidated Financial Statements
(Dollar amounts in thousands, except for per share amounts)
December 31, 2012, 2011 and 2010
Distributions
For federal income tax purposes, distributions may consist of ordinary income, qualifying dividends, return of capital, capital gains or a combination thereof. Distributions to the extent of the Company’s current and accumulated earnings and profits for federal income tax purposes are taxable to the recipient as ordinary income. Distributions in excess of these earnings and profits will constitute a non-taxable return of capital rather than a dividend and will reduce the recipient’s basis in the shares.
A summary of the average taxable nature of the Company’s common distributions paid for each of the years in the three year period ended
December 31, 2012
is as follows:
|
|
2012
|
2011
|
2010
|
||||||||
|
Ordinary income
|
$
|
0.07
|
|
$
|
0.19
|
|
$
|
0.17
|
|
||
|
Return of capital
|
0.43
|
|
0.31
|
|
0.33
|
|
|||||
|
Total distributions per share
|
$
|
0.50
|
|
$
|
0.50
|
|
$
|
0.50
|
|
||
IRS Closing Agreement
The Company has identified certain distribution and shareholder reimbursement practices that may have caused certain dividends to be treated as preferential dividends, which cannot be used to satisfy the 90% Distribution Requirement. The Company has also identified the ownership of certain assets that may have violated a REIT qualification requirement that prohibits a REIT from owning "securities" of any one issuer in excess of 5% of the REIT's total assets at the end of any calendar quarter (the "5% Securities Test"). In order to provide greater certainty with respect to the Company's qualification as a REIT for federal income tax purposes, management concluded that it was in the best interest of the Company and its stockholders to request closing agreements from the Internal Revenue Service ("IRS") for both the Company and MB REIT with respect to such matters. Accordingly, on October 31, 2012, MB REIT filed a request for a closing agreement with the IRS. Additionally, the Company filed a separate request for a closing agreement on its own behalf on March 7, 2013.
The Company identified certain aspects of the calculation of certain dividends on MB REIT's preferred stock and also aspects of the operation of certain "set aside" provisions with respect to accrued but unpaid dividends on certain classes of MB REIT's preferred stock that may have caused certain dividends to be treated as preferential dividends. In the case of the Company, management identified certain aspects of the operation of the Company's dividend reinvestment plan and distribution procedures and also certain reimbursements of shareholder expenses that may have caused certain dividends to be treated as preferential dividends. If these practices resulted in preferential dividends, the Company and MB REIT would not have satisfied the 90% Distribution Requirement and thus may not have qualified as REITs, which would result in substantial corporate tax liability for the years in which the Company or MB REIT failed to qualify as a REIT.
In addition, the Company and MB REIT made certain overnight investments in bank commercial paper. While the Internal Revenue Code does not provide a specific definition of “cash item”, the Company believes that overnight commercial paper should be treated as a “cash item”, which is not treated as a “security” for purposes of the 5% Securities Test. If treated as a "security", the bank commercial paper would appear to have represented more than 5% of the Company's and MB REIT's total assets at the end of certain calendar quarters. In the event this commercial paper is treated as a "security", the Company anticipates that it would be required to pay corporate income tax on the income earned with respect to the portion of the commercial paper that violated the 5% Securities Test.
The Company can provide no assurance that the IRS will accept the Company's or MB REIT's closing agreement requests. Even if the IRS accepts those requests, the Company and MB REIT may be required to pay a penalty. The Company cannot predict whether such a penalty would be imposed or, if so, the amount of the penalty. The Company believes that (i) the IRS will enter into closing agreements with the Company and MB REIT and (ii) the Business Manager may be liable, in whole or in part, for any penalty imposed in connection with those closing agreements. As noted above, the Company can provide no assurance that the IRS will enter into closing agreements with the Company and MB REIT or that the Company and MB REIT will not be liable for any penalty imposed in connection with those closing agreements. Management believes based on the currently available information, that such penalty, if any, will not have a material adverse effect on the financial statements of the Company.
95
INLAND AMERICAN REAL ESTATE TRUST, INC.
(A Maryland Corporation)
Notes to Consolidated Financial Statements
(Dollar amounts in thousands, except for per share amounts)
December 31, 2012, 2011 and 2010
(14) Segment Reporting
The Company has
five
business segments: Retail, Lodging, Office, Industrial and Multi-family. The Company evaluates segment performance primarily based on net operating income. Net operating income of the segments primarily exclude interest expense, depreciation and amortization, general and administrative expenses, net income of noncontrolling interest and other investment income from corporate investments. The non-segmented assets primarily include the Company’s cash and cash equivalents, investment in marketable securities, construction in progress, investment in unconsolidated entities and notes receivable.
Prior to October 1, 2010, the Company considered the net operating income of the assets of LIP Holdings, LLC, its 100% owned subsidiary (LIP-H), which consisted of
eight
operating office and retail properties, a segment. Due to the settlement and consolidation of the remaining Lauth assets and the disposition of
four
of
eight
LIP-H assets, the Company no longer evaluates the net operating income of these assets as a segment. For the year ended December 31, 2011, the assets of the LIP-H segment were classified into the appropriate segment as identified above. The Company has restated the prior years’ comparatives to conform with current year presentation.
For the year ended
December 31, 2012
, approximately
10%
of the Company’s rental revenue (related to the retail, office, and industrial segments) was generated by over
400
retail banking properties leased to SunTrust Banks, Inc. Also, as of
December 31, 2012
, approximately
8%
of the Company’s rental revenue (related to the retail, office, and industrial segments) was generated by
three
properties leased to AT&T, Inc. As a result of the concentration of revenue generated from these properties, if SunTrust or AT&T were to cease paying rent or fulfilling its other monetary obligations, the Company could have significantly reduced rental revenues or higher expenses until the defaults were cured or the properties were leased to a new tenant or tenants.
96
INLAND AMERICAN REAL ESTATE TRUST, INC.
(A Maryland Corporation)
Notes to Consolidated Financial Statements
(Dollar amounts in thousands, except for per share amounts)
December 31, 2012, 2011 and 2010
The following table summarizes net operating income by segment as of and for the year ended
December 31, 2012
.
|
Total
|
Retail
|
Lodging
|
Office
|
Industrial
|
Multi-
Family
|
||||||||||||||||||
|
Rental income
|
$
|
610,788
|
|
$
|
302,323
|
|
$
|
—
|
|
$
|
143,019
|
|
$
|
80,866
|
|
$
|
84,580
|
|
|||||
|
Straight line income
|
12,166
|
|
5,833
|
|
—
|
|
3,883
|
|
2,215
|
|
235
|
|
|||||||||||
|
Tenant recovery income
|
98,770
|
|
68,611
|
|
—
|
|
26,292
|
|
3,370
|
|
497
|
|
|||||||||||
|
Other property income
|
15,244
|
|
5,215
|
|
—
|
|
3,089
|
|
356
|
|
6,584
|
|
|||||||||||
|
Lodging income
|
700,427
|
|
—
|
|
700,427
|
|
—
|
|
—
|
|
—
|
|
|||||||||||
|
Total income
|
$
|
1,437,395
|
|
$
|
381,982
|
|
$
|
700,427
|
|
$
|
176,283
|
|
$
|
86,807
|
|
$
|
91,896
|
|
|||||
|
Operating expenses
|
$
|
681,008
|
|
$
|
103,719
|
|
$
|
485,517
|
|
$
|
44,054
|
|
$
|
6,636
|
|
$
|
41,082
|
|
|||||
|
Net operating income
|
$
|
756,387
|
|
$
|
278,263
|
|
$
|
214,910
|
|
$
|
132,229
|
|
$
|
80,171
|
|
$
|
50,814
|
|
|||||
|
Non allocated expenses (a)
|
$
|
(500,942
|
)
|
||||||||||||||||||||
|
Other income and expenses (b)
|
$
|
(283,403
|
)
|
||||||||||||||||||||
|
Loss from unconsolidated entities (c)
|
$
|
(10,324
|
)
|
||||||||||||||||||||
|
Provision for asset impairment
|
$
|
(77,348
|
)
|
||||||||||||||||||||
|
Net loss from continuing operations
|
$
|
(115,630
|
)
|
||||||||||||||||||||
|
Income from discontinued operations, net
|
$
|
51,981
|
|
||||||||||||||||||||
|
Net income attributable to noncontrolling interests
|
$
|
(5,689
|
)
|
||||||||||||||||||||
|
Net loss attributable to Company
|
$
|
(69,338
|
)
|
||||||||||||||||||||
|
Balance Sheet Data:
|
|
||||||||||||||||||||||
|
Real estate assets, net (d)
|
$
|
9,279,123
|
|
$
|
3,542,440
|
|
$
|
2,684,575
|
|
$
|
1,482,555
|
|
$
|
799,503
|
|
$
|
770,050
|
|
|||||
|
Non-segmented assets (e)
|
1,480,761
|
|
|||||||||||||||||||||
|
Total Assets
|
$
|
10,759,884
|
|
||||||||||||||||||||
|
Capital expenditures
|
$
|
88,637
|
|
$
|
16,334
|
|
$
|
60,381
|
|
$
|
6,891
|
|
$
|
2,826
|
|
$
|
2,205
|
|
|||||
|
(a)
|
Non allocated expenses consist of general and administrative expenses, business manager management fee and depreciation and amortization.
|
|
(b)
|
Other income and expenses consist of interest and dividend income, interest expense, other income and expenses, realized gain, (loss) and (impairment) on securities, net, and income tax expense.
|
|
(c)
|
Loss from unconsolidated entities consists of equity (losses) in earnings of unconsolidated entities as well as gain, (loss) and (impairment) of investment in unconsolidated entities.
|
|
(d)
|
Real estate assets includes intangible assets, net of amortization.
|
|
(e)
|
Construction in progress is included as non-segmented assets.
|
97
INLAND AMERICAN REAL ESTATE TRUST, INC.
(A Maryland Corporation)
Notes to Consolidated Financial Statements
(Dollar amounts in thousands, except for per share amounts)
December 31, 2012, 2011 and 2010
The following table summarizes net operating income by segment as of and for the year ended
December 31, 2011
.
|
Total
|
Retail
|
Lodging
|
Office
|
Industrial
|
Multi-
Family
|
||||||||||||||||||
|
Rental income
|
$
|
579,784
|
|
$
|
284,449
|
|
$
|
—
|
|
$
|
143,112
|
|
$
|
76,923
|
|
$
|
75,300
|
|
|||||
|
Straight line income
|
15,162
|
|
6,934
|
|
—
|
|
4,147
|
|
3,856
|
|
225
|
|
|||||||||||
|
Tenant recovery income
|
90,213
|
|
63,033
|
|
—
|
|
25,300
|
|
1,414
|
|
466
|
|
|||||||||||
|
Other property income
|
16,462
|
|
5,214
|
|
—
|
|
3,885
|
|
1,120
|
|
6,243
|
|
|||||||||||
|
Lodging income
|
526,252
|
|
—
|
|
526,252
|
|
—
|
|
—
|
|
—
|
|
|||||||||||
|
Total income
|
$
|
1,227,873
|
|
$
|
359,630
|
|
$
|
526,252
|
|
$
|
176,444
|
|
$
|
83,313
|
|
$
|
82,234
|
|
|||||
|
Operating expenses
|
$
|
549,340
|
|
$
|
101,347
|
|
$
|
358,934
|
|
$
|
44,394
|
|
$
|
5,415
|
|
$
|
39,250
|
|
|||||
|
Net operating income
|
$
|
678,533
|
|
$
|
258,283
|
|
$
|
167,318
|
|
$
|
132,050
|
|
$
|
77,898
|
|
$
|
42,984
|
|
|||||
|
Non allocated expenses (a)
|
$
|
(479,000
|
)
|
||||||||||||||||||||
|
Other income and expenses (b)
|
$
|
(266,274
|
)
|
||||||||||||||||||||
|
Loss from unconsolidated entities (c)
|
$
|
(118,825
|
)
|
||||||||||||||||||||
|
Provision for asset impairment
|
$
|
(28,967
|
)
|
||||||||||||||||||||
|
Net loss from continuing operations
|
$
|
(214,533
|
)
|
||||||||||||||||||||
|
Loss from discontinued operations, net
|
$
|
(95,012
|
)
|
||||||||||||||||||||
|
Net income attributable to noncontrolling interests
|
$
|
(6,708
|
)
|
||||||||||||||||||||
|
Net loss attributable to Company
|
$
|
(316,253
|
)
|
||||||||||||||||||||
|
Balance Sheet Data:
|
|||||||||||||||||||||||
|
Real estate assets, net (d)
|
$
|
9,429,500
|
|
$
|
3,803,062
|
|
$
|
2,386,432
|
|
$
|
1,568,153
|
|
$
|
910,227
|
|
$
|
761,626
|
|
|||||
|
Non-segmented assets (e)
|
1,489,690
|
|
|||||||||||||||||||||
|
Total Assets
|
$
|
10,919,190
|
|
||||||||||||||||||||
|
Capital expenditures
|
$
|
83,405
|
|
$
|
18,642
|
|
$
|
53,453
|
|
$
|
5,427
|
|
$
|
4,168
|
|
$
|
1,715
|
|
|||||
|
(a)
|
Non allocated expenses consist of general and administrative expenses, business manager management fee and depreciation and amortization.
|
|
(b)
|
Other income and expenses consist of interest and dividend income, interest expense, other income, realized gain, (loss) and (impairment) on securities, net, and income tax benefit.
|
|
(c)
|
Loss from unconsolidated entities consists of equity losses in earnings of unconsolidated entities as well as gain, (loss) and (impairment) of investment in unconsolidated entities.
|
|
(d)
|
Real estate assets includes intangible assets, net of amortization.
|
|
(e)
|
Construction in progress is included as non-segmented assets.
|
98
INLAND AMERICAN REAL ESTATE TRUST, INC.
(A Maryland Corporation)
Notes to Consolidated Financial Statements
(Dollar amounts in thousands, except for per share amounts)
December 31, 2012, 2011 and 2010
The following table summarizes net operating income by segment as of and for the year ended
December 31, 2010
.
|
Total
|
Retail
|
Lodging
|
Office
|
Industrial
|
Multi-
Family
|
||||||||||||||||||
|
Rental income
|
$
|
542,773
|
|
$
|
259,703
|
|
$
|
—
|
|
$
|
141,903
|
|
$
|
75,491
|
|
$
|
65,676
|
|
|||||
|
Straight line income
|
17,577
|
|
8,680
|
|
—
|
|
5,755
|
|
2,939
|
|
203
|
|
|||||||||||
|
Tenant recovery income
|
85,263
|
|
57,436
|
|
—
|
|
26,419
|
|
1,037
|
|
371
|
|
|||||||||||
|
Other property income
|
14,544
|
|
4,764
|
|
—
|
|
4,227
|
|
110
|
|
5,443
|
|
|||||||||||
|
Lodging income
|
434,539
|
|
—
|
|
434,539
|
|
—
|
|
—
|
|
—
|
|
|||||||||||
|
Total income
|
$
|
1,094,696
|
|
$
|
330,583
|
|
$
|
434,539
|
|
$
|
178,304
|
|
$
|
79,577
|
|
$
|
71,693
|
|
|||||
|
Operating expenses
|
$
|
474,773
|
|
$
|
88,886
|
|
$
|
297,580
|
|
$
|
44,603
|
|
$
|
5,041
|
|
$
|
38,663
|
|
|||||
|
Net operating income
|
$
|
619,923
|
|
$
|
241,697
|
|
$
|
136,959
|
|
$
|
133,701
|
|
$
|
74,536
|
|
$
|
33,030
|
|
|||||
|
Non allocated expenses (a)
|
$
|
(462,831
|
)
|
||||||||||||||||||||
|
Other income and expenses (b)
|
$
|
(209,606
|
)
|
||||||||||||||||||||
|
Loss from unconsolidated entities (c)
|
$
|
(29,923
|
)
|
||||||||||||||||||||
|
Provision for asset impairment (d)
|
$
|
(111,896
|
)
|
||||||||||||||||||||
|
Net loss from continuing operations
|
$
|
(194,333
|
)
|
||||||||||||||||||||
|
Income from discontinued operations, net
|
$
|
27,041
|
|
||||||||||||||||||||
|
Net income attributable to noncontrolling interests
|
$
|
(9,139
|
)
|
||||||||||||||||||||
|
Net loss attributable to Company
|
$
|
(176,431
|
)
|
||||||||||||||||||||
|
(a)
|
Non allocated expenses consist of general and administrative expenses, business manager management fee and depreciation and amortization.
|
|
(b)
|
Other income and expenses consist of interest and dividend income, interest expense, other income and expenses, realized gain, (loss) and (impairment) on securities, net, and income tax benefit.
|
|
(c)
|
Loss from unconsolidated entities consists of equity (losses) in earnings of unconsolidated entities as well as gain, (loss) and (impairment) of investment in unconsolidated entities.
|
|
(d)
|
Provision for asset impairment consists of provision for asset impairment, provision for goodwill impairment, and provision for notes receivable impairment.
|
99
INLAND AMERICAN REAL ESTATE TRUST, INC.
(A Maryland Corporation)
Notes to Consolidated Financial Statements
(Dollar amounts in thousands, except for per share amounts)
December 31, 2012, 2011 and 2010
(15) Earnings (loss) per Share
Basic earnings (loss) per share (“EPS”) are computed by dividing net income (loss) by the weighted average number of common shares outstanding for the period (the “common shares”). Diluted EPS is computed by dividing net income (loss) by the common shares plus potential common shares issuable upon exercising options or other contracts. There are an immaterial amount of potentially dilutive common shares.
The basic and diluted weighted average number of common shares outstanding was
879,685,949
,
858,637,707
and
835,131,057
for the years ended
December 31, 2012, 2011 and 2010
.
(16) Commitments and Contingencies
Certain leases and operating agreements within the lodging segment require the Company to reserve funds relating to replacements and renewals of the hotels' furniture, fixtures and equipment. As of December 31, 2012 the Company has funded
$50,041
in reserves for future improvements. This amount is included in restricted cash and escrows on the consolidated balance sheet as of December 31, 2012.
The Company has learned that the SEC is conducting a non-public, formal, fact-finding investigation to determine whether there have been violations of certain provisions of the federal securities laws regarding the business management fees, property management fees, transactions with affiliates, timing and amount of distributions paid to investors, determination of property impairments, and any decision regarding whether the Company might become a self-administered REIT. The Company has not been accused of any wrongdoing by the SEC. The Company also has been informed by the SEC that the existence of this investigation does not mean that the SEC has concluded that anyone has broken the law or that the SEC has a negative opinion of any person, entity, or security. The Company has been cooperating fully with the SEC.
The Company cannot reasonably estimate the timing of the investigation, nor can the Company predict whether or not the investigation might have a material adverse effect on the business.
Inland American Business Manager & Advisor, Inc. has offered to reduce the business management fee in an aggregate amount necessary to reimburse the Company for any costs, fees, fines or assessments, if any, which may result from the SEC investigation, other than legal fees incurred by the Company, or fees and costs otherwise covered by insurance. The business manager also offered to waive its reimbursement of legal fees or costs that the business manager incurs in connection with the SEC investigation. On May 4, 2012, Inland American Business Manager & Advisor, Inc. forwarded a letter to the Company that memorializes this arrangement.
The Company have also received two related demands by stockholders to conduct investigations regarding claims that the officers, the board of directors, the business manager, and the affiliates of the business manager (the "Inland American Parties") breached their fiduciary duties to the Company in connection with the matters that the Company disclosed are subject to the Investigation. The first demand claims that the Inland American Parties (i) falsely reported the value of our common stock until September 2010; (ii) caused us to purchase shares of our common stock from stockholders at prices in excess of their value; and (iii) disguised returns of capital paid to stockholders as REIT income resulting in the payment of fees to the business manager for which it was not entitled. The three stockholders in that demand contend that legal proceedings should seek recovery of damages in an unspecified amount allegedly sustained by us. The second demand by another shareholder makes similar claims and further alleges that the Inland American Parties (i) caused us to engage in transactions that unduly favored related parties, (ii) falsely disclosed the timing and amount of distributions, and (iii) falsely disclosed whether the Company might become a self-administered REIT. There has been no lawsuit filed, however, with regard to these matters.
The full Board of Directors has responded by authorizing the independent directors to investigate the claims contained in the demand letters, as well as any other matters the independent directors see fit to investigate, including matters related to the SEC investigation. Pursuant to this authority, the independent directors have formed a special litigation committee that is comprised solely of independent directors to review and evaluate the matters referred by the full Board to the independent directors, and to recommend to the full Board any further action as is appropriate. The special litigation committee intends to investigate these claims with the assistance of independent legal counsel and will make a recommendation to the Board of Directors after the committee has completed its investigation.
100
INLAND AMERICAN REAL ESTATE TRUST, INC.
(A Maryland Corporation)
Notes to Consolidated Financial Statements
(Dollar amounts in thousands, except per share amounts)
December 31, 2012, 2011 and 2010
The Company has also filed a number of eviction actions against tenants and is involved in a number of tenant bankruptcies. The tenants in some of the eviction cases may file counterclaims against the Company in an attempt to gain leverage against the Company in connection with the eviction. In the opinion of the Company, none of these counterclaims is likely to result in any material losses to the Company.
The Company is subject, from time to time, to various legal proceedings and claims that arise in the ordinary course of business. While the resolution of these matters cannot be predicted with certainty, management believes, based on currently available information, that the final outcome of such matters will not have a material adverse effect on the financial statements of the Company.
(17) Subsequent Events
Subsequent to December 31, 2012, the Company purchased
one
retail property,
two
lodging properties, and
one
student housing property for a gross acquisition price of
$119,900
.
(18) Quarterly Supplemental Financial Information (unaudited)
The following represents the results of operations, for each quarterly period, during 2012 and 2011.
|
|
2012
|
||||||||||||||
|
|
Dec. 31
|
Sept. 30
|
June 30
|
March 31
|
|||||||||||
|
Total income
|
$
|
370,758
|
|
$
|
368,639
|
|
$
|
378,834
|
|
$
|
319,164
|
|
|||
|
Net loss
|
(2,731
|
)
|
(12,917
|
)
|
(17,791
|
)
|
(30,210
|
)
|
|||||||
|
Net loss attributable to Company
|
(3,569
|
)
|
(17,576
|
)
|
(17,910
|
)
|
(30,283
|
)
|
|||||||
|
Net loss, per common share, basic and diluted (1)
|
(0.01
|
)
|
(0.02
|
)
|
(0.02
|
)
|
(0.03
|
)
|
|||||||
|
Weighted average number of common shares outstanding, basic and diluted (1)
|
886,849,317
|
|
881,717,879
|
|
877,188,933
|
|
872,886,566
|
|
|||||||
|
|
2011
|
||||||||||||||
|
|
Dec. 31
|
Sept. 30
|
June 30
|
March 31
|
|||||||||||
|
Total income
|
$
|
305,208
|
|
$
|
313,418
|
|
$
|
314,966
|
|
$
|
294,281
|
|
|||
|
Net loss
|
(182,076
|
)
|
(48,952
|
)
|
(26,114
|
)
|
(52,403
|
)
|
|||||||
|
Net loss attributable to Company
|
(182,188
|
)
|
(51,677
|
)
|
(27,761
|
)
|
(54,627
|
)
|
|||||||
|
Net loss, per common share, basic and diluted (1)
|
(0.22
|
)
|
(0.06
|
)
|
(0.03
|
)
|
(0.06
|
)
|
|||||||
|
Weighted average number of common shares outstanding, basic and diluted (1)
|
867,028,126
|
|
861,505,671
|
|
855,953,324
|
|
849,843,349
|
|
|||||||
|
(1)
|
Quarterly income per common share amounts may not total to the annual amounts due to rounding and the changes in the number of weighted common shares outstanding
|
101
INLAND AMERICAN REAL ESTATE TRUST, INC.
(A Maryland Corporation)
Schedule III
Real Estate and Accumulated Depreciation
(Dollar amounts in thousands)
December 31, 2012
|
|
|
Initial Cost (A)
|
|
|
Gross amount at which carried at end of period
|
|||||||||||||||||||||||
|
|
Encumbrance
|
Land
|
Buildings and
Improvements
|
Adjustments
to Land
Basis
(C)
|
Adjustments
to Basis (C)
|
Land and
Improvements
|
Buildings and
Improvements
(D)
|
Total (D,E)
|
Accumulated
Depreciation
(D,F)
|
Date of
Completion of
Construction or
Acquisition
|
||||||||||||||||||
|
Retail
|
||||||||||||||||||||||||||||
|
14th STREET MARKET
Plano, TX
|
7,712
|
|
3,500
|
|
9,241
|
|
—
|
|
264
|
|
3,500
|
|
9,505
|
|
13,005
|
|
1,866
|
|
2007
|
|||||||||
|
24 HOUR FITNESS -THE WOODLANDS
Woodlands, TX
|
3,500
|
|
1,540
|
|
11,287
|
|
—
|
|
—
|
|
1,540
|
|
11,287
|
|
12,827
|
|
2,864
|
|
2005
|
|||||||||
|
95th and CICERO
Oak Lawn, IL
|
8,949
|
|
4,500
|
|
9,910
|
|
—
|
|
49
|
|
4,500
|
|
9,959
|
|
14,459
|
|
1,522
|
|
2008
|
|||||||||
|
ALCOA EXCHANGE
Bryant, AR
|
12,200
|
|
4,900
|
|
15,577
|
|
—
|
|
90
|
|
4,900
|
|
15,668
|
|
20,568
|
|
2,621
|
|
2008
|
|||||||||
|
ALCOA EXCHANGE II
Benton, AR
|
—
|
|
1,300
|
|
5,511
|
|
—
|
|
—
|
|
1,300
|
|
5,511
|
|
6,811
|
|
797
|
|
2009
|
|||||||||
|
ANDERSON CENTRAL Anderson, SC
|
13,653
|
|
2,800
|
|
9,961
|
|
—
|
|
382
|
|
2,800
|
|
10,343
|
|
13,143
|
|
1,034
|
|
2010
|
|||||||||
|
ANTOINE TOWN CENTER
Houston, TX
|
5,490
|
|
1,645
|
|
7,343
|
|
—
|
|
188
|
|
1,645
|
|
7,531
|
|
9,176
|
|
1,890
|
|
2005
|
|||||||||
|
ATASCOCITA SHOPPING CENTER
Humble, TX
|
—
|
|
1,550
|
|
7,994
|
|
(398
|
)
|
(2,866
|
)
|
1,152
|
|
5,129
|
|
6,281
|
|
292
|
|
2005
|
|||||||||
|
BARTOW MARKETPLACE
Atlanta, GA
|
23,298
|
|
5,600
|
|
20,154
|
|
—
|
|
50
|
|
5,600
|
|
20,204
|
|
25,804
|
|
2,038
|
|
2010
|
|||||||||
|
BAY COLONY
League City, TX
|
22,255
|
|
3,190
|
|
30,828
|
|
—
|
|
5,452
|
|
3,190
|
|
36,280
|
|
39,470
|
|
8,533
|
|
2005
|
|||||||||
|
BAY COLONY II
League City, TX
|
27,470
|
|
4,500
|
|
32,514
|
|
—
|
|
4,478
|
|
4,500
|
|
36,992
|
|
41,492
|
|
1,584
|
|
2011
|
|||||||||
|
BEAR CREEK VILLAGE CENTER
Wildomar, CA
|
14,361
|
|
3,523
|
|
12,384
|
|
—
|
|
(72
|
)
|
3,523
|
|
12,313
|
|
15,836
|
|
1,698
|
|
2009
|
|||||||||
102
INLAND AMERICAN REAL ESTATE TRUST, INC.
(A Maryland Corporation)
Schedule III
Real Estate and Accumulated Depreciation
(Dollar amounts in thousands)
December 31, 2012
|
|
|
Initial Cost (A)
|
|
|
Gross amount at which carried at end of period
|
|||||||||||||||||||||||
|
|
Encumbrance
|
Land
|
Buildings and
Improvements
|
Adjustments
to Land
Basis
(C)
|
Adjustments
to Basis (C)
|
Land and
Improvements
|
Buildings and
Improvements
(D)
|
Total (D,E)
|
Accumulated
Depreciation
(D,F)
|
Date of
Completion of
Construction or
Acquisition
|
||||||||||||||||||
|
BELLERIVE PLAZA
Nicholasville, KY
|
6,092
|
|
2,400
|
|
7,749
|
|
—
|
|
76
|
|
2,400
|
|
7,825
|
|
10,225
|
|
1,601
|
|
2007
|
|||||||||
|
BENT TREE PLAZA
Raleigh, NC
|
6,433
|
|
1,983
|
|
7,093
|
|
—
|
|
(120
|
)
|
1,983
|
|
6,972
|
|
8,955
|
|
1,044
|
|
2009
|
|||||||||
|
BI-LO—GREENVILLE
Greenville, SC
|
4,286
|
|
1,400
|
|
5,503
|
|
—
|
|
—
|
|
1,400
|
|
5,503
|
|
6,903
|
|
1,268
|
|
2006
|
|||||||||
|
BLACKHAWK TOWN CENTER
Houston, TX
|
12,125
|
|
1,645
|
|
19,982
|
|
—
|
|
1
|
|
1,645
|
|
19,984
|
|
21,629
|
|
5,009
|
|
2005
|
|||||||||
|
BOYNTON COMMONS
Miami, FL
|
27,854
|
|
11,400
|
|
17,315
|
|
—
|
|
146
|
|
11,400
|
|
17,461
|
|
28,861
|
|
1,777
|
|
2010
|
|||||||||
|
BRANDON CENTRE SOUTH
Brandon, FL
|
16,133
|
|
5,720
|
|
19,500
|
|
—
|
|
810
|
|
5,720
|
|
20,310
|
|
26,030
|
|
4,050
|
|
2007
|
|||||||||
|
BROOKS CORNER
San Antonio, TX
|
13,970
|
|
10,600
|
|
13,648
|
|
—
|
|
2,781
|
|
10,600
|
|
16,429
|
|
27,029
|
|
3,831
|
|
2006
|
|||||||||
|
BUCKHEAD CROSSING
Atlanta, GA
|
33,215
|
|
7,565
|
|
27,104
|
|
—
|
|
(1,210
|
)
|
7,565
|
|
25,894
|
|
33,459
|
|
3,576
|
|
2009
|
|||||||||
|
BUCKHORN PLAZA
Bloomsburg, PA
|
9,025
|
|
1,651
|
|
11,770
|
|
—
|
|
772
|
|
1,651
|
|
12,542
|
|
14,193
|
|
2,870
|
|
2006
|
|||||||||
|
CAMPUS MARKETPLACE
San Marcos, CA
|
18,792
|
|
6,723
|
|
27,462
|
|
—
|
|
(160
|
)
|
6,723
|
|
27,302
|
|
34,024
|
|
3,674
|
|
2009
|
|||||||||
103
INLAND AMERICAN REAL ESTATE TRUST, INC.
(A Maryland Corporation)
Schedule III
Real Estate and Accumulated Depreciation
(Dollar amounts in thousands)
December 31, 2012
|
|
|
Initial Cost (A)
|
|
|
Gross amount at which carried at end of period
|
|||||||||||||||||||||||
|
|
Encumbrance
|
Land
|
Buildings and
Improvements
|
Adjustments
to Land
Basis
(C)
|
Adjustments
to Basis (C)
|
Land and
Improvements
|
Buildings and
Improvements
(D)
|
Total (D,E)
|
Accumulated
Depreciation
(D,F)
|
Date of
Completion of
Construction or
Acquisition
|
||||||||||||||||||
|
CENTERPLACE OF GREELEY
Greeley, CO
|
15,518
|
|
3,904
|
|
14,715
|
|
—
|
|
(51
|
)
|
3,904
|
|
14,664
|
|
18,568
|
|
2,093
|
|
2009
|
|||||||||
|
CHESAPEAKE COMMONS
Chesapeake, VA
|
—
|
|
2,669
|
|
10,839
|
|
—
|
|
59
|
|
2,669
|
|
10,897
|
|
13,566
|
|
2,287
|
|
2007
|
|||||||||
|
CHEYENNE MEADOWS
Colorado Springs, CO
|
6,415
|
|
2,023
|
|
6,991
|
|
—
|
|
(149
|
)
|
2,023
|
|
6,842
|
|
8,865
|
|
987
|
|
2009
|
|||||||||
|
CHILI’S—HUNTING BAYOU
Jacinto City, TX
|
—
|
|
400
|
|
—
|
|
—
|
|
—
|
|
400
|
|
—
|
|
400
|
|
—
|
|
2005
|
|||||||||
|
CINEMARK—JACINTO CITY
Jacinto City, TX
|
—
|
|
1,160
|
|
10,540
|
|
(164
|
)
|
(3,668
|
)
|
996
|
|
6,872
|
|
7,868
|
|
422
|
|
2005
|
|||||||||
|
CITIZENS (CFG) DELAWARE
Lewes, DE
|
—
|
|
525
|
|
353
|
|
—
|
|
(4
|
)
|
525
|
|
349
|
|
874
|
|
71
|
|
2007
|
|||||||||
|
CITIZENS (CFG) ILLINOIS
Villa Park, IL
|
—
|
|
575
|
|
379
|
|
(118
|
)
|
(156
|
)
|
457
|
|
223
|
|
681
|
|
—
|
|
2007
|
|||||||||
|
CITIZENS (CFG) ILLINOIS
Westchester, IL
|
—
|
|
725
|
|
582
|
|
—
|
|
(1
|
)
|
725
|
|
580
|
|
1,305
|
|
119
|
|
2007
|
|||||||||
|
CITIZENS (CFG) ILLINOIS
Chicago Heights, IL
|
—
|
|
290
|
|
904
|
|
—
|
|
(2
|
)
|
290
|
|
902
|
|
1,192
|
|
185
|
|
2007
|
|||||||||
|
CITIZENS (CFG) MELLON BANK BLD
Georgetown, DE
|
—
|
|
725
|
|
2,255
|
|
—
|
|
311
|
|
725
|
|
2,567
|
|
3,292
|
|
499
|
|
2007
|
|||||||||
104
INLAND AMERICAN REAL ESTATE TRUST, INC.
(A Maryland Corporation)
Schedule III
Real Estate and Accumulated Depreciation
(Dollar amounts in thousands)
December 31, 2012
|
|
|
Initial Cost (A)
|
|
|
Gross amount at which carried at end of period
|
||||||||||||||||||||||||
|
|
Encumbrance
|
Land
|
Buildings and
Improvements
|
Adjustments
to Land
Basis
(C)
|
Adjustments
to Basis (C)
|
Land and
Improvements
|
Buildings and
Improvements
(D)
|
Total (D,E)
|
Accumulated
Depreciation
(D,F)
|
Date of
Completion of
Construction or
Acquisition
|
|||||||||||||||||||
|
CITIZENS (CFG) NEW HAMPSHIRE
Manchester, NH
|
—
|
|
9,620
|
|
15,633
|
|
—
|
|
—
|
|
9,620
|
|
15,633
|
|
25,253
|
|
3,197
|
|
2007
|
||||||||||
|
CITIZENS (CFG) NEW HAMPSHIRE
Hinsdale, NH
|
—
|
|
172
|
|
281
|
|
(32
|
)
|
(110
|
)
|
140
|
|
171
|
|
310
|
|
—
|
|
2007
|
||||||||||
|
CITIZENS (CFG) NEW JERSEY
Haddon Heights, NJ
|
—
|
|
500
|
|
466
|
|
—
|
|
—
|
|
500
|
|
466
|
|
966
|
|
95
|
|
2007
|
||||||||||
|
CITIZENS (CFG) NEW YORK
Plattsburgh, NY
|
—
|
|
70
|
|
1,342
|
|
(46
|
)
|
(1,126
|
)
|
24
|
|
216
|
|
240
|
|
6
|
|
2007
|
||||||||||
|
CITIZENS (CFG) PENNSYLVANIA
Camp Hill, PA
|
—
|
|
1,150
|
|
1,420
|
|
(508
|
)
|
(917
|
)
|
642
|
|
502
|
|
1,144
|
|
—
|
|
2007
|
||||||||||
|
CITIZENS (CFG) PENNSYLVANIA
Charlerol, PA
|
—
|
|
40
|
|
1,555
|
|
—
|
|
—
|
|
40
|
|
1,555
|
|
1,595
|
|
318
|
|
2007
|
||||||||||
|
CITIZENS (CFG) PENNSYLVANIA
Dallastown, PA
|
—
|
|
150
|
|
962
|
|
(113
|
)
|
(816
|
)
|
37
|
|
146
|
|
183
|
|
1
|
|
2007
|
||||||||||
|
CITIZENS (CFG) PENNSYLVANIA
Glenside, PA
|
—
|
|
385
|
|
1,727
|
|
—
|
|
—
|
|
385
|
|
1,727
|
|
2,112
|
|
353
|
|
2007
|
||||||||||
|
CITIZENS (CFG) PENNSYLVANIA
Reading, PA
|
—
|
|
165
|
|
165
|
|
2,265
|
|
—
|
|
—
|
|
165
|
|
2,265
|
|
2,430
|
|
463
|
|
2007
|
||||||||
|
CITIZENS (CFG) PENNSYLVANIA
York, PA
|
—
|
|
400
|
|
3,016
|
|
(276
|
)
|
(2,513
|
)
|
124
|
|
503
|
|
627
|
|
—
|
|
2007
|
||||||||||
105
INLAND AMERICAN REAL ESTATE TRUST, INC.
(A Maryland Corporation)
Schedule III
Real Estate and Accumulated Depreciation
(Dollar amounts in thousands)
December 31, 2012
|
|
|
Initial Cost (A)
|
|
|
Gross amount at which carried at end of period
|
|||||||||||||||||||||||
|
|
Encumbrance
|
Land
|
Buildings and
Improvements
|
Adjustments
to Land
Basis
(C)
|
Adjustments
to Basis (C)
|
Land and
Improvements
|
Buildings and
Improvements
(D)
|
Total (D,E)
|
Accumulated
Depreciation
(D,F)
|
Date of
Completion of
Construction or
Acquisition
|
||||||||||||||||||
|
CITIZENS (CFG) PENNSYLVANIA
Altoona, PA
|
—
|
|
100
|
|
573
|
|
(18
|
)
|
(218
|
)
|
82
|
|
354
|
|
437
|
|
—
|
|
2007
|
|||||||||
|
CITIZENS (CFG) PENNSYLVANIA
Cranberry, PA
|
—
|
|
100
|
|
483
|
|
(18
|
)
|
(185
|
)
|
82
|
|
298
|
|
380
|
|
—
|
|
2007
|
|||||||||
|
CITIZENS (CFG) RHODE ISLAND
Providence, RI
|
—
|
|
1,278
|
|
3,817
|
|
—
|
|
(7
|
)
|
1,278
|
|
3,810
|
|
5,088
|
|
780
|
|
2007
|
|||||||||
|
CITIZENS (CFG) RHODE ISLAND
Warwick, RI
|
—
|
|
2,254
|
|
15,856
|
|
—
|
|
(30
|
)
|
2,254
|
|
15,826
|
|
18,080
|
|
3,238
|
|
2007
|
|||||||||
106
INLAND AMERICAN REAL ESTATE TRUST, INC.
(A Maryland Corporation)
Schedule III
Real Estate and Accumulated Depreciation
(Dollar amounts in thousands)
December 31, 2012
|
|
|
Initial Cost (A)
|
|
|
Gross amount at which carried at end of period
|
|||||||||||||||||||||||
|
|
Encumbrance
|
Land
|
Buildings and
Improvements
|
Adjustments
to Land
Basis
(C)
|
Adjustments
to Basis (C)
|
Land and
Improvements
|
Buildings and
Improvements
(D)
|
Total (D,E)
|
Accumulated
Depreciation
(D,F)
|
Date of
Completion of
Construction or
Acquisition
|
||||||||||||||||||
|
CITIZENS (CFG) MASSACHUSETTS
Springfield, MA
|
—
|
|
310
|
|
856
|
|
—
|
|
(1
|
)
|
310
|
|
855
|
|
1,165
|
|
175
|
|
2007
|
|||||||||
|
CITIZENS (CFG) MASSACHUSETTS
Springfield, MA
|
—
|
|
300
|
|
243
|
|
(60
|
)
|
(98
|
)
|
240
|
|
144
|
|
385
|
|
—
|
|
2007
|
|||||||||
|
CITY CROSSING
Warner Robins, GA
|
17,418
|
|
4,200
|
|
5,679
|
|
—
|
|
16
|
|
4,200
|
|
5,695
|
|
9,895
|
|
667
|
|
2010
|
|||||||||
|
COWETA CROSSING
Newnan, GA
|
—
|
|
1,143
|
|
4,590
|
|
—
|
|
(349
|
)
|
1,143
|
|
4,240
|
|
5,383
|
|
625
|
|
2009
|
|||||||||
|
CROSS TIMBERS COURT
Flower Mound, TX
|
8,193
|
|
3,300
|
|
9,939
|
|
—
|
|
147
|
|
3,300
|
|
10,086
|
|
13,386
|
|
2,026
|
|
2007
|
|||||||||
|
CROSSROADS AT CHESAPEAKE SQUARE
Chesapeake, VA
|
—
|
|
3,970
|
|
13,732
|
|
—
|
|
1,115
|
|
3,970
|
|
14,847
|
|
18,817
|
|
3,122
|
|
2007
|
|||||||||
|
CUSTER CREEK VILLAGE
Richardson, TX
|
10,149
|
|
4,750
|
|
12,245
|
|
—
|
|
89
|
|
4,750
|
|
12,333
|
|
17,083
|
|
2,474
|
|
2007
|
|||||||||
|
CYFAIR TOWN CENTER
Cypress, TX
|
9,095
|
|
1,800
|
|
13,093
|
|
—
|
|
53
|
|
1,800
|
|
13,146
|
|
14,946
|
|
2,944
|
|
2006
|
|||||||||
|
CYFAIR TOWN CENTER II
Houston, TX
|
32,955
|
|
11,300
|
|
39,840
|
|
—
|
|
2,922
|
|
11,300
|
|
42,762
|
|
54,062
|
|
1,859
|
|
2011
|
|||||||||
|
CYPRESS TOWN CENTER
Houston, TX
|
—
|
|
1,850
|
|
11,630
|
|
(805
|
)
|
(7,314
|
)
|
1,045
|
|
4,315
|
|
5,360
|
|
216
|
|
2005
|
|||||||||
107
INLAND AMERICAN REAL ESTATE TRUST, INC.
(A Maryland Corporation)
Schedule III
Real Estate and Accumulated Depreciation
(Dollar amounts in thousands)
December 31, 2012
|
|
|
Initial Cost (A)
|
|
|
Gross amount at which carried at end of period
|
|||||||||||||||||||||||
|
|
Encumbrance
|
Land
|
Buildings and
Improvements
|
Adjustments
to Land
Basis
(C)
|
Adjustments
to Basis (C)
|
Land and
Improvements
|
Buildings and
Improvements
(D)
|
Total (D,E)
|
Accumulated
Depreciation
(D,F)
|
Date of
Completion of
Construction or
Acquisition
|
||||||||||||||||||
|
DONELSON PLAZA
Nashville, TN
|
2,315
|
|
1,000
|
|
3,147
|
|
—
|
|
—
|
|
1,000
|
|
3,147
|
|
4,147
|
|
663
|
|
2007
|
|||||||||
|
DOTHAN PAVILION
Dothan, AL
|
37,165
|
|
8,200
|
|
38,759
|
|
—
|
|
950
|
|
8,200
|
|
39,710
|
|
47,910
|
|
5,611
|
|
2009
|
|||||||||
|
EAST GATE
Aiken, SC
|
6,800
|
|
2,000
|
|
10,305
|
|
—
|
|
194
|
|
2,000
|
|
10,498
|
|
12,498
|
|
2,165
|
|
2007
|
|||||||||
|
ELDRIDGE TOWN CENTER
Houston, TX
|
9,000
|
|
3,200
|
|
16,663
|
|
—
|
|
305
|
|
3,200
|
|
16,968
|
|
20,168
|
|
4,467
|
|
2005
|
|||||||||
|
FABYAN RANDALL PLAZA
Batavia, IL
|
13,405
|
|
2,400
|
|
22,198
|
|
—
|
|
(4
|
)
|
2,400
|
|
22,194
|
|
24,594
|
|
5,060
|
|
2006
|
|||||||||
|
FAIRVIEW MARKET
Simpsonville, SC
|
2,477
|
|
1,140
|
|
5,241
|
|
—
|
|
(179
|
)
|
1,140
|
|
5,062
|
|
6,201
|
|
676
|
|
2009
|
|||||||||
|
FLOWER MOUND CROSSING
Flower Mound, TX
|
8,342
|
|
4,500
|
|
9,049
|
|
—
|
|
389
|
|
4,500
|
|
9,438
|
|
13,938
|
|
1,944
|
|
2007
|
|||||||||
|
FOREST PLAZA
Fond du Lac, WI
|
1,959
|
|
3,400
|
|
14,550
|
|
—
|
|
553
|
|
3,400
|
|
15,103
|
|
18,503
|
|
2,905
|
|
2007
|
|||||||||
|
FURY’S FERRY
Augusta, GA
|
6,381
|
|
1,600
|
|
9,783
|
|
—
|
|
507
|
|
1,600
|
|
10,290
|
|
11,890
|
|
2,121
|
|
2007
|
|||||||||
|
GARDEN VILLAGE
San Pedro, CA
|
11,977
|
|
3,188
|
|
16,522
|
|
—
|
|
(217
|
)
|
3,188
|
|
16,305
|
|
19,493
|
|
2,219
|
|
2009
|
|||||||||
108
INLAND AMERICAN REAL ESTATE TRUST, INC.
(A Maryland Corporation)
Schedule III
Real Estate and Accumulated Depreciation
(Dollar amounts in thousands)
December 31, 2012
|
|
|
Initial Cost (A)
|
|
|
Gross amount at which carried at end of period
|
|||||||||||||||||||||||
|
|
Encumbrance
|
Land
|
Buildings and
Improvements
|
Adjustments
to Land
Basis
(C)
|
Adjustments
to Basis (C)
|
Land and
Improvements
|
Buildings and
Improvements
(D)
|
Total (D,E)
|
Accumulated
Depreciation
(D,F)
|
Date of
Completion of
Construction or
Acquisition
|
||||||||||||||||||
|
GATEWAY MARKET CENTER
Tampa, FL
|
23,173
|
|
13,600
|
|
4,992
|
|
—
|
|
321
|
|
13,600
|
|
5,313
|
|
18,913
|
|
675
|
|
2010
|
|||||||||
|
GATEWAY PLAZA
Jacksonville, NC
|
10,098
|
|
4,700
|
|
6,769
|
|
—
|
|
(175
|
)
|
4,700
|
|
6,594
|
|
11,294
|
|
728
|
|
2010
|
|||||||||
|
GLENDALE HEIGHTS I, II, III
Glendale Heights, IL
|
4,705
|
|
2,220
|
|
6,399
|
|
—
|
|
172
|
|
2,220
|
|
6,571
|
|
8,791
|
|
1,518
|
|
2006
|
|||||||||
|
GRAFTON COMMONS SHOPPING CENTER
Grafton, WI
|
18,299
|
|
7,200
|
|
26,984
|
|
—
|
|
117
|
|
7,200
|
|
27,101
|
|
34,301
|
|
3,006
|
|
2009
|
|||||||||
|
GRAVOIS DILLON PLAZA
High Ridge, MO
|
12,630
|
|
7,300
|
|
—
|
|
—
|
|
16,122
|
|
7,300
|
|
16,122
|
|
23,422
|
|
3,322
|
|
2007
|
|||||||||
|
HERITAGE CROSSING
Wilson, NC
|
16,800
|
|
4,400
|
|
22,921
|
|
—
|
|
1,252
|
|
4,400
|
|
24,173
|
|
28,573
|
|
2,401
|
|
2010
|
|||||||||
|
HERITAGE HEIGHTS
Grapevine, TX
|
10,719
|
|
4,600
|
|
13,502
|
|
—
|
|
282
|
|
4,600
|
|
13,784
|
|
18,384
|
|
2,720
|
|
2007
|
|||||||||
|
HERITAGE PLAZA—CHICAGO
Carol Stream, IL
|
10,481
|
|
5,297
|
|
8,831
|
|
—
|
|
(423
|
)
|
5,297
|
|
8,408
|
|
13,705
|
|
1,224
|
|
2009
|
|||||||||
|
HIGHLAND PLAZA
Katy, TX
|
—
|
|
2,450
|
|
15,642
|
|
(520
|
)
|
(6,207
|
)
|
1,930
|
|
9,435
|
|
11,365
|
|
601
|
|
2005
|
|||||||||
|
HIRAM PAVILION
Hiram, GA
|
37,609
|
|
4,600
|
|
16,832
|
|
—
|
|
1,198
|
|
4,600
|
|
18,030
|
|
22,630
|
|
1,898
|
|
2010
|
|||||||||
109
INLAND AMERICAN REAL ESTATE TRUST, INC.
(A Maryland Corporation)
Schedule III
Real Estate and Accumulated Depreciation
(Dollar amounts in thousands)
December 31, 2012
|
|
|
Initial Cost (A)
|
|
|
Gross amount at which carried at end of period
|
|||||||||||||||||||||||
|
|
Encumbrance
|
Land
|
Buildings and
Improvements
|
Adjustments
to Land
Basis
(C)
|
Adjustments
to Basis (C)
|
Land and
Improvements
|
Buildings and
Improvements
(D)
|
Total (D,E)
|
Accumulated
Depreciation
(D,F)
|
Date of
Completion of
Construction or
Acquisition
|
||||||||||||||||||
|
HUNTER’S GLEN CROSSING
Plano, TX
|
9,790
|
|
4,800
|
|
11,719
|
|
—
|
|
593
|
|
4,800
|
|
12,312
|
|
17,112
|
|
2,391
|
|
2007
|
|||||||||
|
HUNTING BAYOU
Jacinto City, TX
|
—
|
|
2,400
|
|
16,265
|
|
—
|
|
793
|
|
2,400
|
|
17,058
|
|
19,458
|
|
4,381
|
|
2006
|
|||||||||
|
IA ORLANDO SAND
Orlando, FL
|
—
|
|
19,388
|
|
—
|
|
—
|
|
—
|
|
19,388
|
|
—
|
|
19,388
|
|
—
|
|
2011
|
|||||||||
|
INTECH RETAIL
Indianapolis, IN
|
2,688
|
|
819
|
|
2,038
|
|
—
|
|
121
|
|
819
|
|
2,159
|
|
2,978
|
|
329
|
|
2009
|
|||||||||
|
JAMES CENTER
Tacoma, WA
|
12,734
|
|
4,497
|
|
16,219
|
|
—
|
|
(119
|
)
|
4,497
|
|
16,100
|
|
20,597
|
|
2,398
|
|
2009
|
|||||||||
|
JOSEY OAKS CROSSING
Carrollton, TX
|
9,346
|
|
2,620
|
|
13,989
|
|
—
|
|
238
|
|
2,620
|
|
14,227
|
|
16,847
|
|
2,885
|
|
2007
|
|||||||||
|
LA FITNESS AT ELDRIDGE LAKES
Houston, TX
|
5,000
|
|
500
|
|
8,398
|
|
—
|
|
—
|
|
500
|
|
8,398
|
|
8,898
|
|
369
|
|
2011
|
|||||||||
|
LAKEPORT COMMONS
Sioux City, IA
|
22,950
|
|
7,800
|
|
39,984
|
|
—
|
|
3,037
|
|
7,800
|
|
43,021
|
|
50,821
|
|
7,802
|
|
2007
|
|||||||||
|
LEGACY CROSSING
Marion, OH
|
10,890
|
|
4,280
|
|
13,896
|
|
—
|
|
296
|
|
4,280
|
|
14,191
|
|
18,471
|
|
2,944
|
|
2007
|
|||||||||
|
LEXINGTON ROAD
Athens, GA
|
5,454
|
|
1,980
|
|
7,105
|
|
—
|
|
—
|
|
1,980
|
|
7,105
|
|
9,085
|
|
1,606
|
|
2006
|
|||||||||
110
INLAND AMERICAN REAL ESTATE TRUST, INC.
(A Maryland Corporation)
Schedule III
Real Estate and Accumulated Depreciation
(Dollar amounts in thousands)
December 31, 2012
|
|
|
Initial Cost (A)
|
|
|
Gross amount at which carried at end of period
|
|||||||||||||||||||||||
|
|
Encumbrance
|
Land
|
Buildings and
Improvements
|
Adjustments
to Land
Basis
(C)
|
Adjustments
to Basis (C)
|
Land and
Improvements
|
Buildings and
Improvements
(D)
|
Total (D,E)
|
Accumulated
Depreciation
(D,F)
|
Date of
Completion of
Construction or
Acquisition
|
||||||||||||||||||
|
LINCOLN MALL
Lincoln, RI
|
33,835
|
|
11,000
|
|
50,395
|
|
—
|
|
4,064
|
|
11,000
|
|
54,459
|
|
65,459
|
|
12,232
|
|
2006
|
|||||||||
|
LINCOLN VILLAGE
Chicago, IL
|
22,035
|
|
13,600
|
|
25,053
|
|
—
|
|
780
|
|
13,600
|
|
25,833
|
|
39,433
|
|
5,728
|
|
2006
|
|||||||||
|
LOGAN'S ROADHOUSE
Orlando, FL
|
—
|
|
—
|
|
1,881
|
|
—
|
|
—
|
|
—
|
|
1,881
|
|
1,881
|
|
187
|
|
2010
|
|||||||||
|
LORD SALISBURY CENTER
Salisbury, MD
|
12,600
|
|
11,000
|
|
9,567
|
|
—
|
|
46
|
|
11,000
|
|
9,613
|
|
20,613
|
|
1,927
|
|
2007
|
|||||||||
|
MARKET AT MORSE / HAMILTON
Columbus, OH
|
—
|
|
4,490
|
|
8,734
|
|
(907
|
)
|
(3,504
|
)
|
3,583
|
|
5,230
|
|
8,814
|
|
102
|
|
2007
|
|||||||||
|
MARKET AT WESTLAKE
Westlake Hills, TX
|
4,803
|
|
1,200
|
|
6,274
|
|
—
|
|
79
|
|
1,200
|
|
6,353
|
|
7,553
|
|
1,316
|
|
2007
|
|||||||||
|
MCKINNEY TOWN CENTER
McKinney, TX
|
21,412
|
|
16,297
|
|
22,562
|
|
—
|
|
460
|
|
16,297
|
|
23,022
|
|
39,319
|
|
2,214
|
|
2007
|
|||||||||
|
MERCHANTS CROSSING
Englewood, FL
|
11,112
|
|
3,404
|
|
11,281
|
|
—
|
|
(1,152
|
)
|
3,404
|
|
10,129
|
|
13,533
|
|
1,569
|
|
2009
|
|||||||||
|
MIDDLEBURG CROSSING
Middleburg, FL
|
5,247
|
|
2,760
|
|
7,145
|
|
—
|
|
450
|
|
2,760
|
|
7,595
|
|
10,355
|
|
1,429
|
|
2007
|
|||||||||
|
MONADNOCK MARKETPLACE
Keene, NH
|
26,785
|
|
7,000
|
|
39,008
|
|
—
|
|
307
|
|
7,000
|
|
39,314
|
|
46,314
|
|
9,604
|
|
2006
|
|||||||||
111
INLAND AMERICAN REAL ESTATE TRUST, INC.
(A Maryland Corporation)
Schedule III
Real Estate and Accumulated Depreciation
(Dollar amounts in thousands)
December 31, 2012
|
|
|
Initial Cost (A)
|
|
|
Gross amount at which carried at end of period
|
|||||||||||||||||||||||
|
|
Encumbrance
|
Land
|
Buildings and
Improvements
|
Adjustments
to Land
Basis
(C)
|
Adjustments
to Basis (C)
|
Land and
Improvements
|
Buildings and
Improvements
(D)
|
Total (D,E)
|
Accumulated
Depreciation
(D,F)
|
Date of
Completion of
Construction or
Acquisition
|
||||||||||||||||||
|
NEW FOREST CROSSING II
Houston, TX
|
—
|
|
1,490
|
|
3,922
|
|
(253
|
)
|
(999
|
)
|
1,237
|
|
2,923
|
|
4,160
|
|
175
|
|
2006
|
|||||||||
|
NEWTOWN ROAD
Virginia Beach, VA
|
968
|
|
574
|
|
877
|
|
—
|
|
(877
|
)
|
574
|
|
—
|
|
574
|
|
—
|
|
2006
|
|||||||||
|
NORTHWEST MARKETPLACE
Houston, TX
|
19,965
|
|
2,910
|
|
30,340
|
|
—
|
|
57
|
|
2,910
|
|
30,397
|
|
33,307
|
|
5,967
|
|
2007
|
|||||||||
|
NTB ELDRIDGE
Houston, TX
|
500
|
|
960
|
|
—
|
|
—
|
|
—
|
|
960
|
|
—
|
|
960
|
|
—
|
|
2005
|
|||||||||
|
PALAZZO DEL LAGO
Orlando, FL
|
—
|
|
8,938
|
|
—
|
|
—
|
|
—
|
|
8,938
|
|
—
|
|
8,938
|
|
—
|
|
2010
|
|||||||||
|
PALM HARBOR SHOPPING CENTER
Palm Coast, FL
|
12,100
|
|
2,836
|
|
10,927
|
|
—
|
|
(572
|
)
|
2,836
|
|
10,355
|
|
13,192
|
|
1,459
|
|
2009
|
|||||||||
|
PARADISE PLACE
West Palm Beach, FL
|
10,149
|
|
3,975
|
|
5,912
|
|
—
|
|
19
|
|
3,975
|
|
5,931
|
|
9,906
|
|
600
|
|
2010
|
|||||||||
|
PARADISE SHOPS OF LARGO
Largo, FL
|
6,545
|
|
4,640
|
|
7,483
|
|
—
|
|
(7
|
)
|
4,640
|
|
7,476
|
|
12,116
|
|
1,977
|
|
2005
|
|||||||||
|
PARK WEST PLAZA
Grapevine, TX
|
7,532
|
|
4,250
|
|
8,186
|
|
—
|
|
28
|
|
4,250
|
|
8,214
|
|
12,464
|
|
1,723
|
|
2007
|
|||||||||
|
PARKWAY CENTRE NORTH
Grove City, OH
|
13,892
|
|
4,680
|
|
16,046
|
|
—
|
|
1,821
|
|
4,680
|
|
17,867
|
|
22,547
|
|
3,771
|
|
2007
|
|||||||||
112
INLAND AMERICAN REAL ESTATE TRUST, INC.
(A Maryland Corporation)
Schedule III
Real Estate and Accumulated Depreciation
(Dollar amounts in thousands)
December 31, 2012
|
|
|
Initial Cost (A)
|
|
|
Gross amount at which carried at end of period
|
|||||||||||||||||||||||
|
|
Encumbrance
|
Land
|
Buildings and
Improvements
|
Adjustments
to Land
Basis
(C)
|
Adjustments
to Basis (C)
|
Land and
Improvements
|
Buildings and
Improvements
(D)
|
Total (D,E)
|
Accumulated
Depreciation
(D,F)
|
Date of
Completion of
Construction or
Acquisition
|
||||||||||||||||||
|
PARKWAY CENTRE NORTH
OUTLOT B
Grove City, OH
|
2,198
|
|
900
|
|
2,590
|
|
—
|
|
4
|
|
900
|
|
2,595
|
|
3,495
|
|
549
|
|
2007
|
|||||||||
|
PAVILION AT LAQUINTA
LaQuinta, CA
|
24,200
|
|
15,200
|
|
20,947
|
|
—
|
|
24
|
|
15,200
|
|
20,972
|
|
36,172
|
|
2,842
|
|
2009
|
|||||||||
|
PAVILIONS AT HARTMAN HERITAGE
Independence, MO
|
23,450
|
|
9,700
|
|
28,849
|
|
—
|
|
4,815
|
|
9,700
|
|
33,664
|
|
43,364
|
|
6,291
|
|
2007
|
|||||||||
|
PEACHLAND PROMENADE
Port Charlotte, FL
|
3,233
|
|
1,742
|
|
6,502
|
|
—
|
|
(58
|
)
|
1,742
|
|
6,444
|
|
8,186
|
|
954
|
|
2009
|
|||||||||
|
PENN PARK
Oklahoma City, OK
|
31,000
|
|
6,260
|
|
29,424
|
|
—
|
|
1,799
|
|
6,260
|
|
31,223
|
|
37,483
|
|
5,902
|
|
2007
|
|||||||||
|
PIONEER PLAZA
Mesquite, TX
|
2,250
|
|
373
|
|
3,099
|
|
—
|
|
12
|
|
373
|
|
3,112
|
|
3,484
|
|
657
|
|
2007
|
|||||||||
|
PLEASANT HILL SQUARE
Duluth, GA
|
30,459
|
|
7,950
|
|
22,651
|
|
(3,399
|
)
|
(11,772
|
)
|
4,551
|
|
10,879
|
|
15,430
|
|
94
|
|
2010
|
|||||||||
|
POPLIN PLACE
Monroe, NC
|
22,554
|
|
6,100
|
|
27,790
|
|
—
|
|
436
|
|
6,100
|
|
28,226
|
|
34,326
|
|
4,394
|
|
2008
|
|||||||||
|
PRESTONWOOD SHOPPING CENTER
Dallas, TX
|
26,600
|
|
25,400
|
|
17,193
|
|
—
|
|
251
|
|
25,400
|
|
17,444
|
|
42,844
|
|
1,672
|
|
2010
|
|||||||||
|
PROMENADE FULTONDALE
Fultondale, AL
|
16,870
|
|
5,540
|
|
22,414
|
|
—
|
|
159
|
|
5,540
|
|
22,573
|
|
28,113
|
|
3,115
|
|
2009
|
|||||||||
113
INLAND AMERICAN REAL ESTATE TRUST, INC.
(A Maryland Corporation)
Schedule III
Real Estate and Accumulated Depreciation
(Dollar amounts in thousands)
December 31, 2012
|
|
|
Initial Cost (A)
|
|
|
Gross amount at which carried at end of period
|
|||||||||||||||||||||||
|
|
Encumbrance
|
Land
|
Buildings and
Improvements
|
Adjustments
to Land
Basis
(C)
|
Adjustments
to Basis (C)
|
Land and
Improvements
|
Buildings and
Improvements
(D)
|
Total (D,E)
|
Accumulated
Depreciation
(D,F)
|
Date of
Completion of
Construction or
Acquisition
|
||||||||||||||||||
|
RALEIGH HILLSBOROUGH
Raleigh, NC
|
—
|
|
2,605
|
|
—
|
|
—
|
|
—
|
|
2,605
|
|
—
|
|
2,605
|
|
—
|
|
2007
|
|||||||||
|
RIVERSTONE SHOPPING CENTER
Missouri City, TX
|
21,000
|
|
12,000
|
|
26,395
|
|
—
|
|
232
|
|
12,000
|
|
26,626
|
|
38,626
|
|
5,366
|
|
2007
|
|||||||||
|
RIVERVIEW VILLAGE
Arlington, TX
|
10,121
|
|
6,000
|
|
9,649
|
|
—
|
|
107
|
|
6,000
|
|
9,756
|
|
15,756
|
|
1,956
|
|
2007
|
|||||||||
|
ROCKWELL PLAZA
Oklahoma City, OK
|
16,250
|
|
3,800
|
|
26,296
|
|
—
|
|
—
|
|
3,800
|
|
26,296
|
|
30,096
|
|
—
|
|
2012
|
|||||||||
|
ROSE CREEK
Woodstock, GA
|
4,339
|
|
1,443
|
|
5,630
|
|
—
|
|
(99
|
)
|
1,443
|
|
5,531
|
|
6,974
|
|
820
|
|
2009
|
|||||||||
|
ROSEWOOD SHOPPING CENTER
Columbia, SC
|
3,444
|
|
1,138
|
|
3,946
|
|
—
|
|
(81
|
)
|
1,138
|
|
3,865
|
|
5,003
|
|
583
|
|
2009
|
|||||||||
|
SALTGRASS RESTAURANT-HUNTING BAYOU
Jacinto City, TX
|
—
|
|
540
|
|
—
|
|
—
|
|
—
|
|
540
|
|
—
|
|
540
|
|
—
|
|
2005
|
|||||||||
|
SARASOTA PAVILION
Sarasota, FL
|
40,425
|
|
12,000
|
|
25,823
|
|
—
|
|
222
|
|
12,000
|
|
26,045
|
|
38,045
|
|
2,662
|
|
2010
|
|||||||||
|
SCOFIELD CROSSING
Austin, TX
|
8,435
|
|
8,100
|
|
4,992
|
|
—
|
|
28
|
|
8,100
|
|
5,020
|
|
13,120
|
|
1,062
|
|
2007
|
|||||||||
|
SHALLOTTE COMMONS
Shallotte, NC
|
6,078
|
|
1,650
|
|
9,028
|
|
(606
|
)
|
(4,771
|
)
|
1,044
|
|
4,257
|
|
5,300
|
|
—
|
|
2007
|
|||||||||
114
INLAND AMERICAN REAL ESTATE TRUST, INC.
(A Maryland Corporation)
Schedule III
Real Estate and Accumulated Depreciation
(Dollar amounts in thousands)
December 31, 2012
|
|
|
Initial Cost (A)
|
|
|
Gross amount at which carried at end of period
|
|||||||||||||||||||||||
|
|
Encumbrance
|
Land
|
Buildings and
Improvements
|
Adjustments
to Land
Basis
(C)
|
Adjustments
to Basis (C)
|
Land and
Improvements
|
Buildings and
Improvements
(D)
|
Total (D,E)
|
Accumulated
Depreciation
(D,F)
|
Date of
Completion of
Construction or
Acquisition
|
||||||||||||||||||
|
SHERMAN PLAZA
Evanston, IL
|
30,275
|
|
9,655
|
|
30,982
|
|
—
|
|
8,517
|
|
9,655
|
|
39,499
|
|
49,154
|
|
8,043
|
|
2006
|
|||||||||
|
SHERMAN TOWN CENTER
Sherman, TX
|
33,858
|
|
4,850
|
|
49,273
|
|
—
|
|
157
|
|
4,850
|
|
49,430
|
|
54,280
|
|
10,960
|
|
2006
|
|||||||||
|
SHERMAN TOWN CENTER II
Sherman, TX
|
10,000
|
|
3,000
|
|
14,805
|
|
—
|
|
(36
|
)
|
3,000
|
|
14,769
|
|
17,769
|
|
1,093
|
|
2010
|
|||||||||
|
SHILOH SQUARE
Garland, TX
|
3,238
|
|
1,025
|
|
3,946
|
|
—
|
|
1
|
|
1,025
|
|
3,947
|
|
4,972
|
|
794
|
|
2007
|
|||||||||
|
SIEGEN PLAZA
East Baton Rouge, LA
|
16,600
|
|
9,340
|
|
20,251
|
|
—
|
|
273
|
|
9,340
|
|
20,524
|
|
29,864
|
|
3,372
|
|
2008
|
|||||||||
|
SILVERLAKE
Erlanger, KY
|
5,487
|
|
2,031
|
|
6,975
|
|
—
|
|
(103
|
)
|
2,031
|
|
6,872
|
|
8,903
|
|
993
|
|
2009
|
|||||||||
|
SONIC AT ANTOINE TOWN CENTER
Houston, TX
|
360
|
|
649
|
|
—
|
|
—
|
|
—
|
|
649
|
|
—
|
|
649
|
|
—
|
|
2011
|
|||||||||
|
SOUTHGATE VILLAGE
Pelham, AL
|
5,039
|
|
1,789
|
|
6,266
|
|
—
|
|
(81
|
)
|
1,789
|
|
6,185
|
|
7,974
|
|
733
|
|
2009
|
|||||||||
|
SPARKS CROSSING
Sparks, NV
|
—
|
|
10,330
|
|
23,238
|
|
—
|
|
75
|
|
10,330
|
|
23,313
|
|
33,643
|
|
1,526
|
|
2011
|
|||||||||
|
SPRING TOWN CENTER
Spring, TX
|
—
|
|
3,150
|
|
12,433
|
|
—
|
|
121
|
|
3,150
|
|
12,554
|
|
15,704
|
|
2,985
|
|
2006
|
|||||||||
115
INLAND AMERICAN REAL ESTATE TRUST, INC.
(A Maryland Corporation)
Schedule III
Real Estate and Accumulated Depreciation
(Dollar amounts in thousands)
December 31, 2012
|
|
|
Initial Cost (A)
|
|
|
Gross amount at which carried at end of period
|
|||||||||||||||||||||||
|
|
Encumbrance
|
Land
|
Buildings and
Improvements
|
Adjustments
to Land
Basis
(C)
|
Adjustments
to Basis (C)
|
Land and
Improvements
|
Buildings and
Improvements
(D)
|
Total (D,E)
|
Accumulated
Depreciation
(D,F)
|
Date of
Completion of
Construction or
Acquisition
|
||||||||||||||||||
|
SPRING TOWN CENTER III
Spring, TX
|
—
|
|
1,320
|
|
3,070
|
|
—
|
|
2,008
|
|
1,320
|
|
5,078
|
|
6,398
|
|
897
|
|
2007
|
|||||||||
|
STABLES TOWN CENTER I and II
Spring, TX
|
13,750
|
|
4,650
|
|
19,006
|
|
—
|
|
2,369
|
|
4,650
|
|
21,376
|
|
26,026
|
|
5,111
|
|
2005
|
|||||||||
|
STATE STREET MARKET
Rockford, IL
|
10,348
|
|
3,950
|
|
14,184
|
|
—
|
|
1,771
|
|
3,950
|
|
15,955
|
|
19,905
|
|
3,497
|
|
2006
|
|||||||||
|
STONE CREEK
San Marcos, TX
|
9,939
|
|
—
|
|
—
|
|
—
|
|
9,723
|
|
—
|
|
9,723
|
|
9,723
|
|
301
|
|
||||||||||
|
STONECREST MARKETPLACE
Lithonia, GA
|
34,516
|
|
6,150
|
|
23,321
|
|
—
|
|
377
|
|
6,150
|
|
23,698
|
|
29,848
|
|
2,398
|
|
2010
|
|||||||||
|
STONE RIDGE MARKET
San Antonio, TX
|
28,125
|
|
13,400
|
|
43,812
|
|
—
|
|
—
|
|
13,400
|
|
43,812
|
|
57,212
|
|
—
|
|
2012
|
|||||||||
|
STOP & SHOP—SICKLERVILLE
Sicklerville, NJ
|
8,535
|
|
2,200
|
|
11,559
|
|
—
|
|
—
|
|
2,200
|
|
11,559
|
|
13,759
|
|
2,663
|
|
2006
|
|||||||||
|
STOP N SHOP—BRISTOL
Bristol, RI
|
8,204
|
|
1,700
|
|
11,830
|
|
—
|
|
—
|
|
1,700
|
|
11,830
|
|
13,530
|
|
2,726
|
|
2006
|
|||||||||
|
STOP N SHOP—CUMBERLAND
Cumberland, RI
|
11,531
|
|
2,400
|
|
16,196
|
|
—
|
|
—
|
|
2,400
|
|
16,196
|
|
18,596
|
|
3,731
|
|
2006
|
|||||||||
|
STOP N SHOP - FRAMINGHAM
Framingham, MA
|
9,115
|
|
6,500
|
|
8,517
|
|
—
|
|
—
|
|
6,500
|
|
8,517
|
|
15,017
|
|
1,962
|
|
2006
|
|||||||||
116
INLAND AMERICAN REAL ESTATE TRUST, INC.
(A Maryland Corporation)
Schedule III
Real Estate and Accumulated Depreciation
(Dollar amounts in thousands)
December 31, 2012
|
|
|
Initial Cost (A)
|
|
|
Gross amount at which carried at end of period
|
|||||||||||||||||||||||
|
|
Encumbrance
|
Land
|
Buildings and
Improvements
|
Adjustments
to Land
Basis
(C)
|
Adjustments
to Basis (C)
|
Land and
Improvements
|
Buildings and
Improvements
(D)
|
Total (D,E)
|
Accumulated
Depreciation
(D,F)
|
Date of
Completion of
Construction or
Acquisition
|
||||||||||||||||||
|
STOP N SHOP—HYDE PARK
Hyde Park, NY
|
8,100
|
|
2,000
|
|
12,274
|
|
—
|
|
—
|
|
2,000
|
|
12,274
|
|
14,274
|
|
2,999
|
|
2006
|
|||||||||
|
STOP N SHOP—MALDEN
Malden, MA
|
12,496
|
|
6,700
|
|
13,828
|
|
—
|
|
—
|
|
6,700
|
|
13,828
|
|
20,528
|
|
3,186
|
|
2006
|
|||||||||
|
STOP N SHOP—SOUTHINGTON
Southington, CT
|
11,145
|
|
4,000
|
|
13,938
|
|
—
|
|
—
|
|
4,000
|
|
13,938
|
|
17,938
|
|
3,211
|
|
2006
|
|||||||||
|
STOP N SHOP—SWAMPSCOTT
Swampscott, MA
|
10,879
|
|
4,200
|
|
13,613
|
|
—
|
|
—
|
|
4,200
|
|
13,613
|
|
17,813
|
|
3,136
|
|
2006
|
|||||||||
|
STREETS OF CRANBERRY
Cranberry Township, PA
|
19,834
|
|
4,300
|
|
20,215
|
|
—
|
|
8,268
|
|
4,300
|
|
28,484
|
|
32,784
|
|
5,123
|
|
2007
|
|||||||||
|
STREETS OF INDIAN LAKES
Hendersonville, TN
|
37,500
|
|
8,825
|
|
48,679
|
|
—
|
|
6,314
|
|
8,825
|
|
54,993
|
|
63,818
|
|
7,945
|
|
2008
|
|||||||||
|
SUNCREEK VILLAGE
Plano, TX
|
2,683
|
|
900
|
|
3,155
|
|
—
|
|
26
|
|
900
|
|
3,181
|
|
4,081
|
|
677
|
|
2007
|
|||||||||
|
SUNTRUST BANK I AL
Muscle Shoals, AL
|
966
|
|
675
|
|
1,018
|
|
—
|
|
(1
|
)
|
675
|
|
1,017
|
|
1,692
|
|
190
|
|
2007
|
|||||||||
|
SUNTRUST BANK I AL
Killen, AL
|
426
|
|
633
|
|
449
|
|
—
|
|
—
|
|
633
|
|
449
|
|
1,082
|
|
84
|
|
2007
|
|||||||||
|
SUNTRUST BANK I DC
Brightwood, DC
|
—
|
|
500
|
|
2,082
|
|
—
|
|
(1
|
)
|
500
|
|
2,081
|
|
2,581
|
|
388
|
|
2007
|
|||||||||
|
SUNTRUST BANK I FL
Panama City, FL
|
839
|
|
1,200
|
|
603
|
|
—
|
|
—
|
|
1,200
|
|
603
|
|
1,803
|
|
112
|
|
2007
|
|||||||||
117
INLAND AMERICAN REAL ESTATE TRUST, INC.
(A Maryland Corporation)
Schedule III
Real Estate and Accumulated Depreciation
(Dollar amounts in thousands)
December 31, 2012
|
|
|
Initial Cost (A)
|
|
|
Gross amount at which carried at end of period
|
|||||||||||||||||||||||
|
|
Encumbrance
|
Land
|
Buildings and
Improvements
|
Adjustments
to Land
Basis
(C)
|
Adjustments
to Basis (C)
|
Land and
Improvements
|
Buildings and
Improvements
(D)
|
Total (D,E)
|
Accumulated
Depreciation
(D,F)
|
Date of
Completion of
Construction or
Acquisition
|
||||||||||||||||||
|
SUNTRUST BANK I FL
Orlando, FL
|
—
|
|
1,400
|
|
786
|
|
—
|
|
—
|
|
1,400
|
|
786
|
|
2,186
|
|
147
|
|
2007
|
|||||||||
|
SUNTRUST BANK I FL
Apopka, FL
|
—
|
|
1,276
|
|
620
|
|
—
|
|
—
|
|
1,276
|
|
620
|
|
1,896
|
|
115
|
|
2007
|
|||||||||
|
SUNTRUST BANK I FL
Bayonet Point, FL
|
819
|
|
1,285
|
|
584
|
|
—
|
|
—
|
|
1,285
|
|
584
|
|
1,869
|
|
109
|
|
2007
|
|||||||||
|
SUNTRUST BANK I FL
West Palm Beach, FL
|
—
|
|
800
|
|
879
|
|
—
|
|
—
|
|
800
|
|
879
|
|
1,679
|
|
164
|
|
2007
|
|||||||||
|
SUNTRUST BANK I FL
Daytona Beach, FL
|
940
|
|
600
|
|
681
|
|
—
|
|
—
|
|
600
|
|
681
|
|
1,281
|
|
127
|
|
2007
|
|||||||||
|
SUNTRUST BANK I FL
Sarasota, FL
|
737
|
|
900
|
|
534
|
|
—
|
|
—
|
|
900
|
|
534
|
|
1,434
|
|
100
|
|
2007
|
|||||||||
|
SUNTRUST BANK I FL
Dade City, FL
|
—
|
|
759
|
|
425
|
|
—
|
|
—
|
|
759
|
|
425
|
|
1,184
|
|
79
|
|
2007
|
|||||||||
|
SUNTRUST BANK I FL
Pensacola, FL
|
499
|
|
725
|
|
359
|
|
—
|
|
—
|
|
725
|
|
359
|
|
1,084
|
|
67
|
|
2007
|
|||||||||
|
SUNTRUST BANK I FL
New Smyrna Beach, FL
|
—
|
|
1,100
|
|
1,142
|
|
—
|
|
—
|
|
1,100
|
|
1,142
|
|
2,242
|
|
213
|
|
2007
|
|||||||||
|
SUNTRUST BANK I FL
Clearwater, FL
|
1,308
|
|
1,700
|
|
933
|
|
—
|
|
—
|
|
1,700
|
|
933
|
|
2,633
|
|
174
|
|
2007
|
|||||||||
|
SUNTRUST BANK I FL
Daytona Beach, FL
|
829
|
|
1,218
|
|
601
|
|
—
|
|
—
|
|
1,218
|
|
601
|
|
1,819
|
|
112
|
|
2007
|
|||||||||
|
SUNTRUST BANK I FL
Deltona, FL
|
812
|
|
950
|
|
579
|
|
—
|
|
—
|
|
950
|
|
579
|
|
1,529
|
|
108
|
|
2007
|
|||||||||
118
INLAND AMERICAN REAL ESTATE TRUST, INC.
(A Maryland Corporation)
Schedule III
Real Estate and Accumulated Depreciation
(Dollar amounts in thousands)
December 31, 2012
|
|
|
Initial Cost (A)
|
|
|
Gross amount at which carried at end of period
|
|||||||||||||||||||||||
|
|
Encumbrance
|
Land
|
Buildings and
Improvements
|
Adjustments
to Land
Basis
(C)
|
Adjustments
to Basis (C)
|
Land and
Improvements
|
Buildings and
Improvements
(D)
|
Total (D,E)
|
Accumulated
Depreciation
(D,F)
|
Date of
Completion of
Construction or
Acquisition
|
||||||||||||||||||
|
SUNTRUST BANK I FL
Boca Raton, FL
|
1,172
|
|
1,900
|
|
849
|
|
—
|
|
—
|
|
1,900
|
|
849
|
|
2,749
|
|
158
|
|
2007
|
|||||||||
|
SUNTRUST BANK I FL
Clearwater, FL
|
1,124
|
|
900
|
|
802
|
|
—
|
|
—
|
|
900
|
|
801
|
|
1,701
|
|
149
|
|
2007
|
|||||||||
|
SUNTRUST BANK I FL
Ocala, FL
|
804
|
|
1,476
|
|
574
|
|
—
|
|
—
|
|
1,476
|
|
574
|
|
2,049
|
|
107
|
|
2007
|
|||||||||
|
SUNTRUST BANK I FL
Palm Coast, FL
|
748
|
|
1,100
|
|
534
|
|
—
|
|
—
|
|
1,100
|
|
534
|
|
1,634
|
|
99
|
|
2007
|
|||||||||
|
SUNTRUST BANK I FL
Tampa, FL
|
—
|
|
650
|
|
348
|
|
—
|
|
—
|
|
650
|
|
348
|
|
998
|
|
65
|
|
2007
|
|||||||||
|
SUNTRUST BANK I FL
Fort Meade, FL
|
982
|
|
1,400
|
|
712
|
|
—
|
|
—
|
|
1,400
|
|
712
|
|
2,112
|
|
133
|
|
2007
|
|||||||||
|
SUNTRUST BANK I FL
Fruitland Park, FL
|
446
|
|
575
|
|
321
|
|
—
|
|
—
|
|
575
|
|
321
|
|
896
|
|
60
|
|
2007
|
|||||||||
|
SUNTRUST BANK I FL
Ocala, FL
|
703
|
|
953
|
|
509
|
|
—
|
|
—
|
|
953
|
|
509
|
|
1,462
|
|
95
|
|
2007
|
|||||||||
|
SUNTRUST BANK I FL
Ormond Beach, FL
|
1,063
|
|
950
|
|
771
|
|
—
|
|
—
|
|
950
|
|
771
|
|
1,721
|
|
144
|
|
2007
|
|||||||||
|
SUNTRUST BANK I FL
Gainesville, FL
|
740
|
|
1,100
|
|
537
|
|
—
|
|
—
|
|
1,100
|
|
537
|
|
1,637
|
|
100
|
|
2007
|
|||||||||
|
SUNTRUST BANK I FL
Lakeland, FL
|
509
|
|
625
|
|
366
|
|
—
|
|
—
|
|
625
|
|
366
|
|
991
|
|
68
|
|
2007
|
|||||||||
|
SUNTRUST BANK I FL
Hobe Sound, FL
|
884
|
|
950
|
|
641
|
|
—
|
|
—
|
|
950
|
|
641
|
|
1,591
|
|
119
|
|
2007
|
|||||||||
119
INLAND AMERICAN REAL ESTATE TRUST, INC.
(A Maryland Corporation)
Schedule III
Real Estate and Accumulated Depreciation
(Dollar amounts in thousands)
December 31, 2012
|
|
|
Initial Cost (A)
|
|
|
Gross amount at which carried at end of period
|
|||||||||||||||||||||||
|
|
Encumbrance
|
Land
|
Buildings and
Improvements
|
Adjustments
to Land
Basis
(C)
|
Adjustments
to Basis (C)
|
Land and
Improvements
|
Buildings and
Improvements
(D)
|
Total (D,E)
|
Accumulated
Depreciation
(D,F)
|
Date of
Completion of
Construction or
Acquisition
|
||||||||||||||||||
|
SUNTRUST BANK I FL
Mulberry, FL
|
433
|
|
600
|
|
314
|
|
—
|
|
—
|
|
600
|
|
314
|
|
914
|
|
58
|
|
2007
|
|||||||||
|
SUNTRUST BANK I FL
Indian Harbour Beach, FL
|
764
|
|
1,060
|
|
553
|
|
—
|
|
—
|
|
1,060
|
|
553
|
|
1,613
|
|
103
|
|
2007
|
|||||||||
|
SUNTRUST BANK I FL
Inverness, FL
|
986
|
|
500
|
|
715
|
|
—
|
|
—
|
|
500
|
|
715
|
|
1,215
|
|
133
|
|
2007
|
|||||||||
|
SUNTRUST BANK I FL
Lake Mary, FL
|
1,993
|
|
2,100
|
|
1,422
|
|
—
|
|
—
|
|
2,100
|
|
1,422
|
|
3,522
|
|
265
|
|
2007
|
|||||||||
|
SUNTRUST BANK I FL
Melbourne, FL
|
906
|
|
910
|
|
656
|
|
—
|
|
—
|
|
910
|
|
656
|
|
1,566
|
|
122
|
|
2007
|
|||||||||
|
SUNTRUST BANK I FL
St. Petersburg, FL
|
724
|
|
1,000
|
|
525
|
|
—
|
|
—
|
|
1,000
|
|
524
|
|
1,524
|
|
98
|
|
2007
|
|||||||||
|
SUNTRUST BANK I FL
Lutz, FL
|
653
|
|
1,100
|
|
474
|
|
—
|
|
—
|
|
1,100
|
|
473
|
|
1,573
|
|
88
|
|
2007
|
|||||||||
|
SUNTRUST BANK I FL
Marianna, FL
|
1,179
|
|
275
|
|
841
|
|
—
|
|
—
|
|
275
|
|
841
|
|
1,116
|
|
157
|
|
2007
|
|||||||||
|
SUNTRUST BANK I FL
Gainesville, FL
|
469
|
|
730
|
|
340
|
|
—
|
|
—
|
|
730
|
|
340
|
|
1,070
|
|
63
|
|
2007
|
|||||||||
|
SUNTRUST BANK I FL
Vero Beach, FL
|
1,361
|
|
900
|
|
979
|
|
—
|
|
—
|
|
900
|
|
979
|
|
1,879
|
|
183
|
|
2007
|
|||||||||
|
SUNTRUST BANK I FL
Mount Dora, FL
|
1,065
|
|
500
|
|
772
|
|
—
|
|
—
|
|
500
|
|
772
|
|
1,272
|
|
144
|
|
2007
|
|||||||||
|
SUNTRUST BANK I FL
Sarasota, FL
|
1,172
|
|
1,800
|
|
850
|
|
—
|
|
—
|
|
1,800
|
|
850
|
|
2,650
|
|
158
|
|
2007
|
|||||||||
120
INLAND AMERICAN REAL ESTATE TRUST, INC.
(A Maryland Corporation)
Schedule III
Real Estate and Accumulated Depreciation
(Dollar amounts in thousands)
December 31, 2012
|
|
|
Initial Cost (A)
|
|
|
Gross amount at which carried at end of period
|
|||||||||||||||||||||||
|
|
Encumbrance
|
Land
|
Buildings and
Improvements
|
Adjustments
to Land
Basis
(C)
|
Adjustments
to Basis (C)
|
Land and
Improvements
|
Buildings and
Improvements
(D)
|
Total (D,E)
|
Accumulated
Depreciation
(D,F)
|
Date of
Completion of
Construction or
Acquisition
|
||||||||||||||||||
|
SUNTRUST BANK I FL
New Smyrna Beach, FL
|
556
|
|
300
|
|
403
|
|
—
|
|
—
|
|
300
|
|
403
|
|
703
|
|
75
|
|
2007
|
|||||||||
|
SUNTRUST BANK I FL
Lakeland, FL
|
972
|
|
1,700
|
|
705
|
|
—
|
|
—
|
|
1,700
|
|
705
|
|
2,405
|
|
131
|
|
2007
|
|||||||||
|
SUNTRUST BANK I FL
North Palm Beach, FL
|
—
|
|
1,300
|
|
585
|
|
—
|
|
—
|
|
1,300
|
|
585
|
|
1,885
|
|
109
|
|
2007
|
|||||||||
|
SUNTRUST BANK I FL
Port St. Lucie, FL
|
761
|
|
900
|
|
552
|
|
—
|
|
—
|
|
900
|
|
551
|
|
1,451
|
|
103
|
|
2007
|
|||||||||
|
SUNTRUST BANK I FL
Clearwater, FL
|
—
|
|
1,100
|
|
410
|
|
—
|
|
—
|
|
1,100
|
|
410
|
|
1,510
|
|
76
|
|
2007
|
|||||||||
|
SUNTRUST BANK I FL
Okeechobee, FL
|
861
|
|
1,200
|
|
620
|
|
—
|
|
—
|
|
1,200
|
|
620
|
|
1,820
|
|
115
|
|
2007
|
|||||||||
|
SUNTRUST BANK I FL
Ormond Beach, FL
|
1,186
|
|
650
|
|
859
|
|
—
|
|
—
|
|
650
|
|
859
|
|
1,509
|
|
160
|
|
2007
|
|||||||||
|
SUNTRUST BANK I FL
Osprey, FL
|
999
|
|
1,100
|
|
719
|
|
—
|
|
—
|
|
1,100
|
|
719
|
|
1,819
|
|
134
|
|
2007
|
|||||||||
|
SUNTRUST BANK I FL
Panama City Beach, FL
|
—
|
|
601
|
|
303
|
|
—
|
|
—
|
|
601
|
|
303
|
|
903
|
|
56
|
|
2007
|
|||||||||
|
SUNTRUST BANK I FL
New Port Richey, FL
|
634
|
|
975
|
|
459
|
|
—
|
|
—
|
|
975
|
|
459
|
|
1,434
|
|
86
|
|
2007
|
|||||||||
|
SUNTRUST BANK I FL
Pembroke Pines, FL
|
993
|
|
1,750
|
|
708
|
|
—
|
|
—
|
|
1,750
|
|
708
|
|
2,458
|
|
132
|
|
2007
|
|||||||||
|
SUNTRUST BANK I FL
Orlando, FL
|
992
|
|
1,023
|
|
719
|
|
—
|
|
—
|
|
1,023
|
|
719
|
|
1,742
|
|
134
|
|
2007
|
|||||||||
121
INLAND AMERICAN REAL ESTATE TRUST, INC.
(A Maryland Corporation)
Schedule III
Real Estate and Accumulated Depreciation
(Dollar amounts in thousands)
December 31, 2012
|
|
|
Initial Cost (A)
|
|
|
Gross amount at which carried at end of period
|
|||||||||||||||||||||||
|
|
Encumbrance
|
Land
|
Buildings and
Improvements
|
Adjustments
to Land
Basis
(C)
|
Adjustments
to Basis (C)
|
Land and
Improvements
|
Buildings and
Improvements
(D)
|
Total (D,E)
|
Accumulated
Depreciation
(D,F)
|
Date of
Completion of
Construction or
Acquisition
|
||||||||||||||||||
|
SUNTRUST BANK I FL
Pompano Beach, FL
|
1,237
|
|
1,800
|
|
896
|
|
—
|
|
—
|
|
1,800
|
|
896
|
|
2,696
|
|
167
|
|
2007
|
|||||||||
|
SUNTRUST BANK I FL
Jacksonville, FL
|
647
|
|
1,030
|
|
469
|
|
—
|
|
—
|
|
1,030
|
|
469
|
|
1,499
|
|
87
|
|
2007
|
|||||||||
|
SUNTRUST BANK I FL
Brooksville, FL
|
—
|
|
298
|
|
155
|
|
—
|
|
—
|
|
298
|
|
155
|
|
453
|
|
29
|
|
2007
|
|||||||||
|
SUNTRUST BANK I FL
Miami, FL
|
1,938
|
|
2,803
|
|
1,394
|
|
—
|
|
—
|
|
2,803
|
|
1,394
|
|
4,197
|
|
260
|
|
2007
|
|||||||||
|
SUNTRUST BANK I FL
Rockledge, FL
|
796
|
|
490
|
|
577
|
|
—
|
|
—
|
|
490
|
|
577
|
|
1,067
|
|
107
|
|
2007
|
|||||||||
|
SUNTRUST BANK I FL
Tampa, FL
|
561
|
|
812
|
|
406
|
|
—
|
|
—
|
|
812
|
|
406
|
|
1,218
|
|
76
|
|
2007
|
|||||||||
|
SUNTRUST BANK I FL
Seminole, FL
|
1,586
|
|
1,565
|
|
1,141
|
|
—
|
|
—
|
|
1,565
|
|
1,141
|
|
2,706
|
|
213
|
|
2007
|
|||||||||
|
SUNTRUST BANK I FL
Orlando, FL
|
985
|
|
1,430
|
|
714
|
|
—
|
|
—
|
|
1,430
|
|
713
|
|
2,143
|
|
133
|
|
2007
|
|||||||||
|
SUNTRUST BANK I FL
Jacksonville, FL
|
594
|
|
861
|
|
431
|
|
—
|
|
—
|
|
861
|
|
430
|
|
1,291
|
|
80
|
|
2007
|
|||||||||
|
SUNTRUST BANK I FL
Ocala, FL
|
1,071
|
|
1,500
|
|
764
|
|
—
|
|
—
|
|
1,500
|
|
764
|
|
2,264
|
|
142
|
|
2007
|
|||||||||
|
SUNTRUST BANK I FL
Orlando, FL
|
—
|
|
2,200
|
|
1,142
|
|
—
|
|
—
|
|
2,200
|
|
1,142
|
|
3,342
|
|
213
|
|
2007
|
|||||||||
|
SUNTRUST BANK I FL
Brooksville, FL
|
462
|
|
600
|
|
335
|
|
—
|
|
—
|
|
600
|
|
335
|
|
935
|
|
62
|
|
2007
|
|||||||||
122
INLAND AMERICAN REAL ESTATE TRUST, INC.
(A Maryland Corporation)
Schedule III
Real Estate and Accumulated Depreciation
(Dollar amounts in thousands)
December 31, 2012
|
|
|
Initial Cost (A)
|
|
|
Gross amount at which carried at end of period
|
|||||||||||||||||||||||
|
|
Encumbrance
|
Land
|
Buildings and
Improvements
|
Adjustments
to Land
Basis
(C)
|
Adjustments
to Basis (C)
|
Land and
Improvements
|
Buildings and
Improvements
(D)
|
Total (D,E)
|
Accumulated
Depreciation
(D,F)
|
Date of
Completion of
Construction or
Acquisition
|
||||||||||||||||||
|
SUNTRUST BANK I FL
Spring Hill, FL
|
1,067
|
|
600
|
|
761
|
|
—
|
|
—
|
|
600
|
|
761
|
|
1,361
|
|
142
|
|
2007
|
|||||||||
|
SUNTRUST BANK I FL
St. Augustine, FL
|
1,062
|
|
1,000
|
|
758
|
|
—
|
|
—
|
|
1,000
|
|
758
|
|
1,758
|
|
141
|
|
2007
|
|||||||||
|
SUNTRUST BANK I FL
Port St. Lucie, FL
|
951
|
|
1,050
|
|
689
|
|
—
|
|
—
|
|
1,050
|
|
689
|
|
1,739
|
|
128
|
|
2007
|
|||||||||
|
SUNTRUST BANK I FL
Vero Beach, FL
|
609
|
|
850
|
|
441
|
|
—
|
|
—
|
|
850
|
|
441
|
|
1,291
|
|
82
|
|
2007
|
|||||||||
|
SUNTRUST BANK I FL
Gulf Breeze, FL
|
795
|
|
1,150
|
|
576
|
|
—
|
|
—
|
|
1,150
|
|
576
|
|
1,726
|
|
107
|
|
2007
|
|||||||||
|
SUNTRUST BANK I FL
Casselberry, FL
|
1,259
|
|
2,400
|
|
913
|
|
—
|
|
—
|
|
2,400
|
|
912
|
|
3,312
|
|
170
|
|
2007
|
|||||||||
|
SUNTRUST BANK I FL
Winter Park, FL
|
1,494
|
|
2,700
|
|
1,075
|
|
—
|
|
—
|
|
2,700
|
|
1,074
|
|
3,774
|
|
200
|
|
2007
|
|||||||||
|
SUNTRUST BANK I FL
Fort Pierce, FL
|
—
|
|
1,500
|
|
690
|
|
—
|
|
—
|
|
1,500
|
|
690
|
|
2,190
|
|
129
|
|
2007
|
|||||||||
|
SUNTRUST BANK I FL
Plant City, FL
|
633
|
|
600
|
|
456
|
|
—
|
|
—
|
|
600
|
|
456
|
|
1,056
|
|
85
|
|
2007
|
|||||||||
|
SUNTRUST BANK I FL
St. Petersburg, FL
|
913
|
|
1,540
|
|
662
|
|
—
|
|
—
|
|
1,540
|
|
662
|
|
2,202
|
|
123
|
|
2007
|
|||||||||
|
SUNTRUST BANK I FL
Ormond Beach, FL
|
911
|
|
580
|
|
661
|
|
—
|
|
—
|
|
580
|
|
660
|
|
1,240
|
|
123
|
|
2007
|
|||||||||
|
SUNTRUST BANK I FL
West St. Cloud, FL
|
1,085
|
|
1,840
|
|
786
|
|
(26
|
)
|
—
|
|
1,814
|
|
786
|
|
2,600
|
|
147
|
|
2007
|
|||||||||
123
INLAND AMERICAN REAL ESTATE TRUST, INC.
(A Maryland Corporation)
Schedule III
Real Estate and Accumulated Depreciation
(Dollar amounts in thousands)
December 31, 2012
|
|
|
Initial Cost (A)
|
|
|
Gross amount at which carried at end of period
|
|||||||||||||||||||||||
|
|
Encumbrance
|
Land
|
Buildings and
Improvements
|
Adjustments
to Land
Basis
(C)
|
Adjustments
to Basis (C)
|
Land and
Improvements
|
Buildings and
Improvements
(D)
|
Total (D,E)
|
Accumulated
Depreciation
(D,F)
|
Date of
Completion of
Construction or
Acquisition
|
||||||||||||||||||
|
SUNTRUST BANK I FL
Tamarac, FL
|
899
|
|
1,450
|
|
652
|
|
—
|
|
—
|
|
1,450
|
|
652
|
|
2,102
|
|
121
|
|
2007
|
|||||||||
|
SUNTRUST BANK I GA
Brunswick, GA
|
676
|
|
1,050
|
|
584
|
|
—
|
|
—
|
|
1,050
|
|
584
|
|
1,634
|
|
109
|
|
2007
|
|||||||||
|
SUNTRUST BANK I GA
Kennesaw, GA
|
1,114
|
|
2,100
|
|
955
|
|
—
|
|
—
|
|
2,100
|
|
955
|
|
3,055
|
|
178
|
|
2007
|
|||||||||
|
SUNTRUST BANK I GA
Columbus, GA
|
1,003
|
|
675
|
|
852
|
|
—
|
|
—
|
|
675
|
|
852
|
|
1,527
|
|
159
|
|
2007
|
|||||||||
|
SUNTRUST BANK I GA
Atlanta, GA
|
3,857
|
|
7,184
|
|
3,329
|
|
—
|
|
—
|
|
7,184
|
|
3,330
|
|
10,514
|
|
621
|
|
2007
|
|||||||||
|
SUNTRUST BANK I GA
Chamblee, GA
|
890
|
|
1,375
|
|
756
|
|
—
|
|
—
|
|
1,375
|
|
756
|
|
2,131
|
|
141
|
|
2007
|
|||||||||
|
SUNTRUST BANK I GA
Conyers, GA
|
912
|
|
525
|
|
787
|
|
—
|
|
—
|
|
525
|
|
787
|
|
1,312
|
|
147
|
|
2007
|
|||||||||
|
SUNTRUST BANK I GA
Atlanta, GA
|
1,414
|
|
1,750
|
|
1,211
|
|
—
|
|
—
|
|
1,750
|
|
1,212
|
|
2,962
|
|
226
|
|
2007
|
|||||||||
|
SUNTRUST BANK I GA
Savannah, GA
|
560
|
|
300
|
|
483
|
|
—
|
|
—
|
|
300
|
|
483
|
|
783
|
|
90
|
|
2007
|
|||||||||
|
SUNTRUST BANK I GA
Dunwoody, GA
|
—
|
|
1,325
|
|
1,190
|
|
—
|
|
—
|
|
1,325
|
|
1,190
|
|
2,515
|
|
222
|
|
2007
|
|||||||||
|
SUNTRUST BANK I GA
Douglasville, GA
|
720
|
|
800
|
|
617
|
|
—
|
|
—
|
|
800
|
|
617
|
|
1,417
|
|
115
|
|
2007
|
|||||||||
124
INLAND AMERICAN REAL ESTATE TRUST, INC.
(A Maryland Corporation)
Schedule III
Real Estate and Accumulated Depreciation
(Dollar amounts in thousands)
December 31, 2012
|
|
|
Initial Cost (A)
|
|
|
Gross amount at which carried at end of period
|
|||||||||||||||||||||||
|
|
Encumbrance
|
Land
|
Buildings and
Improvements
|
Adjustments
to Land
Basis
(C)
|
Adjustments
to Basis (C)
|
Land and
Improvements
|
Buildings and
Improvements
(D)
|
Total (D,E)
|
Accumulated
Depreciation
(D,F)
|
Date of
Completion of
Construction or
Acquisition
|
||||||||||||||||||
|
SUNTRUST BANK I GA
Albany, GA
|
293
|
|
325
|
|
253
|
|
—
|
|
—
|
|
325
|
|
253
|
|
578
|
|
47
|
|
2007
|
|||||||||
|
SUNTRUST BANK I GA
Athens, GA
|
540
|
|
865
|
|
466
|
|
—
|
|
—
|
|
865
|
|
466
|
|
1,330
|
|
87
|
|
2007
|
|||||||||
|
SUNTRUST BANK I GA
Macon, GA
|
472
|
|
250
|
|
408
|
|
—
|
|
—
|
|
250
|
|
408
|
|
658
|
|
76
|
|
2007
|
|||||||||
|
SUNTRUST BANK I GA
Atlanta, GA
|
—
|
|
500
|
|
652
|
|
—
|
|
—
|
|
500
|
|
653
|
|
1,153
|
|
122
|
|
2007
|
|||||||||
|
SUNTRUST BANK I GA
Duluth, GA
|
1,366
|
|
1,275
|
|
1,171
|
|
—
|
|
—
|
|
1,275
|
|
1,171
|
|
2,446
|
|
218
|
|
2007
|
|||||||||
|
SUNTRUST BANK I GA
Thomson, GA
|
—
|
|
360
|
|
565
|
|
—
|
|
—
|
|
360
|
|
565
|
|
925
|
|
105
|
|
2007
|
|||||||||
|
SUNTRUST BANK I GA
Madison, GA
|
723
|
|
90
|
|
614
|
|
—
|
|
—
|
|
90
|
|
614
|
|
704
|
|
114
|
|
2007
|
|||||||||
|
SUNTRUST BANK I GA
Savannah, GA
|
—
|
|
325
|
|
674
|
|
—
|
|
—
|
|
325
|
|
674
|
|
999
|
|
126
|
|
2007
|
|||||||||
|
SUNTRUST BANK I GA
Marietta, GA
|
1,298
|
|
2,025
|
|
1,120
|
|
—
|
|
—
|
|
2,025
|
|
1,120
|
|
3,145
|
|
209
|
|
2007
|
|||||||||
|
SUNTRUST BANK I GA
Marietta, GA
|
1,149
|
|
1,200
|
|
992
|
|
—
|
|
—
|
|
1,200
|
|
992
|
|
2,192
|
|
185
|
|
2007
|
|||||||||
|
SUNTRUST BANK I GA
Cartersville, GA
|
1,322
|
|
1,000
|
|
1,141
|
|
—
|
|
—
|
|
1,000
|
|
1,141
|
|
2,141
|
|
213
|
|
2007
|
|||||||||
|
SUNTRUST BANK I GA
Atlanta, GA
|
2,617
|
|
4,539
|
|
2,259
|
|
—
|
|
—
|
|
4,539
|
|
2,259
|
|
6,798
|
|
421
|
|
2007
|
|||||||||
125
INLAND AMERICAN REAL ESTATE TRUST, INC.
(A Maryland Corporation)
Schedule III
Real Estate and Accumulated Depreciation
(Dollar amounts in thousands)
December 31, 2012
|
|
|
Initial Cost (A)
|
|
|
Gross amount at which carried at end of period
|
|||||||||||||||||||||||
|
|
Encumbrance
|
Land
|
Buildings and
Improvements
|
Adjustments
to Land
Basis
(C)
|
Adjustments
to Basis (C)
|
Land and
Improvements
|
Buildings and
Improvements
(D)
|
Total (D,E)
|
Accumulated
Depreciation
(D,F)
|
Date of
Completion of
Construction or
Acquisition
|
||||||||||||||||||
|
SUNTRUST BANK I GA
Lithonia, GA
|
539
|
|
300
|
|
465
|
|
—
|
|
—
|
|
300
|
|
465
|
|
765
|
|
87
|
|
2007
|
|||||||||
|
SUNTRUST BANK I GA
Peachtree City, GA
|
1,197
|
|
1,500
|
|
1,034
|
|
—
|
|
—
|
|
1,500
|
|
1,034
|
|
2,534
|
|
193
|
|
2007
|
|||||||||
|
SUNTRUST BANK I GA
Stone Mountain, GA
|
797
|
|
575
|
|
688
|
|
—
|
|
—
|
|
575
|
|
688
|
|
1,263
|
|
128
|
|
2007
|
|||||||||
|
SUNTRUST BANK I GA
Atlanta, GA
|
1,832
|
|
1,600
|
|
1,581
|
|
—
|
|
—
|
|
1,600
|
|
1,582
|
|
3,182
|
|
295
|
|
2007
|
|||||||||
|
SUNTRUST BANK I GA
Waycross, GA
|
—
|
|
175
|
|
658
|
|
—
|
|
—
|
|
175
|
|
658
|
|
833
|
|
123
|
|
2007
|
|||||||||
|
SUNTRUST BANK I GA
Union City, GA
|
402
|
|
475
|
|
347
|
|
—
|
|
—
|
|
475
|
|
347
|
|
822
|
|
65
|
|
2007
|
|||||||||
|
SUNTRUST BANK I GA
Savannah, GA
|
535
|
|
650
|
|
462
|
|
—
|
|
—
|
|
650
|
|
462
|
|
1,112
|
|
86
|
|
2007
|
|||||||||
|
SUNTRUST BANK I GA
Morrow, GA
|
1,017
|
|
525
|
|
878
|
|
—
|
|
—
|
|
525
|
|
878
|
|
1,403
|
|
164
|
|
2007
|
|||||||||
|
SUNTRUST BANK I GA
Norcross, GA
|
462
|
|
575
|
|
396
|
|
—
|
|
—
|
|
575
|
|
396
|
|
971
|
|
74
|
|
2007
|
|||||||||
|
SUNTRUST BANK I GA
Stockbridge, GA
|
699
|
|
869
|
|
603
|
|
—
|
|
—
|
|
869
|
|
603
|
|
1,472
|
|
112
|
|
2007
|
|||||||||
|
SUNTRUST BANK I GA
Stone Mountain, GA
|
529
|
|
250
|
|
449
|
|
—
|
|
—
|
|
250
|
|
449
|
|
699
|
|
84
|
|
2007
|
|||||||||
|
SUNTRUST BANK I GA
Sylvester, GA
|
450
|
|
575
|
|
388
|
|
—
|
|
—
|
|
575
|
|
388
|
|
963
|
|
72
|
|
2007
|
|||||||||
126
INLAND AMERICAN REAL ESTATE TRUST, INC.
(A Maryland Corporation)
Schedule III
Real Estate and Accumulated Depreciation
(Dollar amounts in thousands)
December 31, 2012
|
|
|
Initial Cost (A)
|
|
|
Gross amount at which carried at end of period
|
|||||||||||||||||||||||
|
|
Encumbrance
|
Land
|
Buildings and
Improvements
|
Adjustments
to Land
Basis
(C)
|
Adjustments
to Basis (C)
|
Land and
Improvements
|
Buildings and
Improvements
(D)
|
Total (D,E)
|
Accumulated
Depreciation
(D,F)
|
Date of
Completion of
Construction or
Acquisition
|
||||||||||||||||||
|
SUNTRUST BANK I GA
Evans, GA
|
1,233
|
|
1,100
|
|
1,065
|
|
—
|
|
—
|
|
1,100
|
|
1,065
|
|
2,165
|
|
198
|
|
2007
|
|||||||||
|
SUNTRUST BANK I GA
Thomson, GA
|
340
|
|
200
|
|
294
|
|
—
|
|
—
|
|
200
|
|
294
|
|
494
|
|
55
|
|
2007
|
|||||||||
|
SUNTRUST BANK I MD
Landover, MD
|
—
|
|
800
|
|
1,174
|
|
—
|
|
—
|
|
800
|
|
1,173
|
|
1,973
|
|
219
|
|
2007
|
|||||||||
|
SUNTRUST BANK I MD
Avondale, MD
|
1,015
|
|
600
|
|
1,414
|
|
—
|
|
(1
|
)
|
600
|
|
1,413
|
|
2,013
|
|
263
|
|
2007
|
|||||||||
|
SUNTRUST BANK I MD
Cambridge, MD
|
1,050
|
|
800
|
|
1,462
|
|
—
|
|
(1
|
)
|
800
|
|
1,461
|
|
2,261
|
|
272
|
|
2007
|
|||||||||
|
SUNTRUST BANK I MD
Cockeysville, MD
|
1,139
|
|
800
|
|
1,575
|
|
—
|
|
(1
|
)
|
800
|
|
1,574
|
|
2,374
|
|
293
|
|
2007
|
|||||||||
|
SUNTRUST BANK I MD
Glen Burnie, MD
|
1,600
|
|
700
|
|
2,229
|
|
—
|
|
(1
|
)
|
700
|
|
2,228
|
|
2,928
|
|
415
|
|
2007
|
|||||||||
|
SUNTRUST BANK I MD
Annapolis, MD
|
1,776
|
|
100
|
|
2,473
|
|
—
|
|
(1
|
)
|
100
|
|
2,473
|
|
2,573
|
|
461
|
|
2007
|
|||||||||
|
SUNTRUST BANK I MD
Prince Frederick, MD
|
1,267
|
|
1,100
|
|
1,737
|
|
—
|
|
(1
|
)
|
1,100
|
|
1,737
|
|
2,837
|
|
324
|
|
2007
|
|||||||||
|
SUNTRUST BANK I NC
Greensboro, NC
|
608
|
|
600
|
|
844
|
|
—
|
|
—
|
|
600
|
|
844
|
|
1,444
|
|
157
|
|
2007
|
|||||||||
|
SUNTRUST BANK I NC
Greensboro, NC
|
510
|
|
550
|
|
719
|
|
—
|
|
—
|
|
550
|
|
719
|
|
1,269
|
|
134
|
|
2007
|
|||||||||
127
INLAND AMERICAN REAL ESTATE TRUST, INC.
(A Maryland Corporation)
Schedule III
Real Estate and Accumulated Depreciation
(Dollar amounts in thousands)
December 31, 2012
|
|
|
Initial Cost (A)
|
|
|
Gross amount at which carried at end of period
|
|||||||||||||||||||||||
|
|
Encumbrance
|
Land
|
Buildings and
Improvements
|
Adjustments
to Land
Basis
(C)
|
Adjustments
to Basis (C)
|
Land and
Improvements
|
Buildings and
Improvements
(D)
|
Total (D,E)
|
Accumulated
Depreciation
(D,F)
|
Date of
Completion of
Construction or
Acquisition
|
||||||||||||||||||
|
SUNTRUST BANK I NC
Apex, NC
|
640
|
|
190
|
|
896
|
|
—
|
|
—
|
|
190
|
|
896
|
|
1,086
|
|
167
|
|
2007
|
|||||||||
|
SUNTRUST BANK I NC
Arden, NC
|
341
|
|
450
|
|
477
|
|
—
|
|
—
|
|
450
|
|
477
|
|
927
|
|
89
|
|
2007
|
|||||||||
|
SUNTRUST BANK I NC
Asheboro, NC
|
490
|
|
400
|
|
690
|
|
—
|
|
—
|
|
400
|
|
690
|
|
1,090
|
|
129
|
|
2007
|
|||||||||
|
SUNTRUST BANK I NC
Bessemer City, NC
|
428
|
|
75
|
|
604
|
|
—
|
|
—
|
|
75
|
|
604
|
|
679
|
|
113
|
|
2007
|
|||||||||
|
SUNTRUST BANK I NC
Durham, NC
|
315
|
|
500
|
|
444
|
|
—
|
|
—
|
|
500
|
|
444
|
|
944
|
|
83
|
|
2007
|
|||||||||
|
SUNTRUST BANK I NC
Charlotte, NC
|
506
|
|
550
|
|
701
|
|
—
|
|
—
|
|
550
|
|
702
|
|
1,252
|
|
131
|
|
2007
|
|||||||||
|
SUNTRUST BANK I NC
Charlotte, NC
|
632
|
|
200
|
|
891
|
|
—
|
|
—
|
|
200
|
|
891
|
|
1,091
|
|
166
|
|
2007
|
|||||||||
|
SUNTRUST BANK I NC
Greensboro, NC
|
654
|
|
425
|
|
915
|
|
—
|
|
—
|
|
425
|
|
915
|
|
1,340
|
|
170
|
|
2007
|
|||||||||
|
SUNTRUST BANK I NC
Creedmoor, NC
|
369
|
|
320
|
|
512
|
|
—
|
|
—
|
|
320
|
|
512
|
|
832
|
|
95
|
|
2007
|
|||||||||
|
SUNTRUST BANK I NC
Durham, NC
|
565
|
|
280
|
|
796
|
|
—
|
|
—
|
|
280
|
|
797
|
|
1,077
|
|
148
|
|
2007
|
|||||||||
|
SUNTRUST BANK I NC
Dunn, NC
|
583
|
|
400
|
|
821
|
|
—
|
|
—
|
|
400
|
|
822
|
|
1,222
|
|
153
|
|
2007
|
|||||||||
|
SUNTRUST BANK I NC
Harrisburg, NC
|
276
|
|
550
|
|
389
|
|
—
|
|
—
|
|
550
|
|
389
|
|
939
|
|
73
|
|
2007
|
|||||||||
128
INLAND AMERICAN REAL ESTATE TRUST, INC.
(A Maryland Corporation)
Schedule III
Real Estate and Accumulated Depreciation
(Dollar amounts in thousands)
December 31, 2012
|
|
|
Initial Cost (A)
|
|
|
Gross amount at which carried at end of period
|
|||||||||||||||||||||||
|
|
Encumbrance
|
Land
|
Buildings and
Improvements
|
Adjustments
to Land
Basis
(C)
|
Adjustments
to Basis (C)
|
Land and
Improvements
|
Buildings and
Improvements
(D)
|
Total (D,E)
|
Accumulated
Depreciation
(D,F)
|
Date of
Completion of
Construction or
Acquisition
|
||||||||||||||||||
|
SUNTRUST BANK I NC
Hendersonville, NC
|
659
|
|
450
|
|
929
|
|
—
|
|
—
|
|
450
|
|
929
|
|
1,379
|
|
173
|
|
2007
|
|||||||||
|
SUNTRUST BANK I NC
Cary, NC
|
—
|
|
230
|
|
708
|
|
—
|
|
—
|
|
230
|
|
709
|
|
939
|
|
132
|
|
2007
|
|||||||||
|
SUNTRUST BANK I NC
Mebane, NC
|
734
|
|
300
|
|
1,034
|
|
—
|
|
—
|
|
300
|
|
1,035
|
|
1,335
|
|
193
|
|
2007
|
|||||||||
|
SUNTRUST BANK I NC
Lenoir, NC
|
1,689
|
|
175
|
|
2,380
|
|
—
|
|
1
|
|
175
|
|
2,381
|
|
2,556
|
|
444
|
|
2007
|
|||||||||
|
SUNTRUST BANK I NC
Roxboro, NC
|
539
|
|
130
|
|
747
|
|
—
|
|
—
|
|
130
|
|
748
|
|
878
|
|
139
|
|
2007
|
|||||||||
|
SUNTRUST BANK I NC
Winston-Salem, NC
|
438
|
|
300
|
|
617
|
|
—
|
|
—
|
|
300
|
|
617
|
|
917
|
|
115
|
|
2007
|
|||||||||
|
SUNTRUST BANK I NC
Oxford, NC
|
826
|
|
280
|
|
1,164
|
|
—
|
|
—
|
|
280
|
|
1,165
|
|
1,445
|
|
217
|
|
2007
|
|||||||||
|
SUNTRUST BANK I NC
Pittsboro, NC
|
294
|
|
25
|
|
408
|
|
—
|
|
—
|
|
25
|
|
408
|
|
433
|
|
76
|
|
2007
|
|||||||||
|
SUNTRUST BANK I NC
Charlotte, NC
|
753
|
|
500
|
|
1,061
|
|
—
|
|
—
|
|
500
|
|
1,061
|
|
1,561
|
|
198
|
|
2007
|
|||||||||
|
SUNTRUST BANK I NC
Greensboro, NC
|
401
|
|
500
|
|
561
|
|
—
|
|
—
|
|
500
|
|
561
|
|
1,061
|
|
104
|
|
2007
|
|||||||||
|
SUNTRUST BANK I NC
Stanley, NC
|
291
|
|
350
|
|
410
|
|
—
|
|
—
|
|
350
|
|
410
|
|
760
|
|
76
|
|
2007
|
|||||||||
|
SUNTRUST BANK I NC
Salisbury, NC
|
273
|
|
275
|
|
382
|
|
—
|
|
—
|
|
275
|
|
382
|
|
657
|
|
71
|
|
2007
|
|||||||||
129
INLAND AMERICAN REAL ESTATE TRUST, INC.
(A Maryland Corporation)
Schedule III
Real Estate and Accumulated Depreciation
(Dollar amounts in thousands)
December 31, 2012
|
|
|
Initial Cost (A)
|
|
|
Gross amount at which carried at end of period
|
|||||||||||||||||||||||
|
|
Encumbrance
|
Land
|
Buildings and
Improvements
|
Adjustments
to Land
Basis
(C)
|
Adjustments
to Basis (C)
|
Land and
Improvements
|
Buildings and
Improvements
(D)
|
Total (D,E)
|
Accumulated
Depreciation
(D,F)
|
Date of
Completion of
Construction or
Acquisition
|
||||||||||||||||||
|
SUNTRUST BANK I NC
Stokesdale, NC
|
—
|
|
250
|
|
477
|
|
—
|
|
—
|
|
250
|
|
477
|
|
727
|
|
89
|
|
2007
|
|||||||||
|
SUNTRUST BANK I NC
Sylva, NC
|
317
|
|
600
|
|
446
|
|
—
|
|
—
|
|
600
|
|
446
|
|
1,046
|
|
83
|
|
2007
|
|||||||||
|
SUNTRUST BANK I NC
Lexington, NC
|
168
|
|
150
|
|
237
|
|
—
|
|
—
|
|
150
|
|
237
|
|
387
|
|
44
|
|
2007
|
|||||||||
|
SUNTRUST BANK I NC
Walnut Cove, NC
|
478
|
|
140
|
|
674
|
|
—
|
|
—
|
|
140
|
|
674
|
|
814
|
|
126
|
|
2007
|
|||||||||
|
SUNTRUST BANK I NC
Waynesville, NC
|
—
|
|
200
|
|
632
|
|
—
|
|
—
|
|
200
|
|
632
|
|
832
|
|
118
|
|
2007
|
|||||||||
|
SUNTRUST BANK I NC
Concord, NC
|
—
|
|
550
|
|
757
|
|
—
|
|
—
|
|
550
|
|
757
|
|
1,307
|
|
141
|
|
2007
|
|||||||||
|
SUNTRUST BANK I NC
Yadkinville, NC
|
668
|
|
250
|
|
941
|
|
—
|
|
—
|
|
250
|
|
941
|
|
1,191
|
|
175
|
|
2007
|
|||||||||
|
SUNTRUST BANK I NC
Rural Hall, NC
|
252
|
|
275
|
|
356
|
|
—
|
|
—
|
|
275
|
|
356
|
|
631
|
|
66
|
|
2007
|
|||||||||
|
SUNTRUST BANK I NC
Summerfield, NC
|
—
|
|
450
|
|
479
|
|
—
|
|
—
|
|
450
|
|
479
|
|
929
|
|
89
|
|
2007
|
|||||||||
|
SUNTRUST BANK I SC
Greenville, SC
|
836
|
|
260
|
|
1,255
|
|
—
|
|
(1
|
)
|
260
|
|
1,254
|
|
1,514
|
|
234
|
|
2007
|
|||||||||
|
SUNTRUST BANK I SC
Fountain Inn, SC
|
—
|
|
36
|
|
904
|
|
—
|
|
(1
|
)
|
36
|
|
903
|
|
939
|
|
168
|
|
2007
|
|||||||||
|
SUNTRUST BANK I SC
Liberty, SC
|
513
|
|
80
|
|
758
|
|
—
|
|
—
|
|
80
|
|
758
|
|
838
|
|
141
|
|
2007
|
|||||||||
130
INLAND AMERICAN REAL ESTATE TRUST, INC.
(A Maryland Corporation)
Schedule III
Real Estate and Accumulated Depreciation
(Dollar amounts in thousands)
December 31, 2012
|
|
|
Initial Cost (A)
|
|
|
Gross amount at which carried at end of period
|
|||||||||||||||||||||||
|
|
Encumbrance
|
Land
|
Buildings and
Improvements
|
Adjustments
to Land
Basis
(C)
|
Adjustments
to Basis (C)
|
Land and
Improvements
|
Buildings and
Improvements
(D)
|
Total (D,E)
|
Accumulated
Depreciation
(D,F)
|
Date of
Completion of
Construction or
Acquisition
|
||||||||||||||||||
|
SUNTRUST BANK I SC
Mauldin, SC
|
590
|
|
350
|
|
878
|
|
—
|
|
(1
|
)
|
350
|
|
878
|
|
1,228
|
|
164
|
|
2007
|
|||||||||
|
SUNTRUST BANK I SC
Greenville, SC
|
543
|
|
160
|
|
816
|
|
—
|
|
—
|
|
160
|
|
815
|
|
975
|
|
152
|
|
2007
|
|||||||||
|
SUNTRUST BANK I SC
Greenville, SC
|
411
|
|
360
|
|
618
|
|
—
|
|
—
|
|
360
|
|
617
|
|
977
|
|
115
|
|
2007
|
|||||||||
|
SUNTRUST BANK I SC
Greenville, SC
|
794
|
|
800
|
|
1,192
|
|
—
|
|
(1
|
)
|
800
|
|
1,192
|
|
1,992
|
|
222
|
|
2007
|
|||||||||
|
SUNTRUST BANK I TN
Kingsport, TN
|
343
|
|
240
|
|
319
|
|
—
|
|
—
|
|
240
|
|
319
|
|
559
|
|
59
|
|
2007
|
|||||||||
|
SUNTRUST BANK I TN
Morristown, TN
|
251
|
|
370
|
|
234
|
|
—
|
|
—
|
|
370
|
|
233
|
|
603
|
|
44
|
|
2007
|
|||||||||
|
SUNTRUST BANK I TN
Brentwood, TN
|
1,112
|
|
1,110
|
|
1,036
|
|
—
|
|
(1
|
)
|
1,110
|
|
1,035
|
|
2,145
|
|
193
|
|
2007
|
|||||||||
|
SUNTRUST BANK I TN
Brentwood, TN
|
1,001
|
|
1,100
|
|
932
|
|
—
|
|
(1
|
)
|
1,100
|
|
931
|
|
2,031
|
|
174
|
|
2007
|
|||||||||
|
SUNTRUST BANK I TN
Nashville, TN
|
1,104
|
|
1,450
|
|
1,028
|
|
—
|
|
(1
|
)
|
1,450
|
|
1,027
|
|
2,477
|
|
191
|
|
2007
|
|||||||||
|
SUNTRUST BANK I TN
Nashville, TN
|
—
|
|
675
|
|
350
|
|
—
|
|
—
|
|
675
|
|
350
|
|
1,025
|
|
65
|
|
2007
|
|||||||||
|
SUNTRUST BANK I TN
East Ridge, TN
|
433
|
|
250
|
|
400
|
|
—
|
|
—
|
|
250
|
|
400
|
|
650
|
|
75
|
|
2007
|
|||||||||
|
SUNTRUST BANK I TN
Nashville, TN
|
952
|
|
735
|
|
872
|
|
—
|
|
(1
|
)
|
735
|
|
872
|
|
1,607
|
|
162
|
|
2007
|
|||||||||
131
INLAND AMERICAN REAL ESTATE TRUST, INC.
(A Maryland Corporation)
Schedule III
Real Estate and Accumulated Depreciation
(Dollar amounts in thousands)
December 31, 2012
|
|
|
Initial Cost (A)
|
|
|
Gross amount at which carried at end of period
|
|||||||||||||||||||||||
|
|
Encumbrance
|
Land
|
Buildings and
Improvements
|
Adjustments
to Land
Basis
(C)
|
Adjustments
to Basis (C)
|
Land and
Improvements
|
Buildings and
Improvements
(D)
|
Total (D,E)
|
Accumulated
Depreciation
(D,F)
|
Date of
Completion of
Construction or
Acquisition
|
||||||||||||||||||
|
SUNTRUST BANK I TN
Chattanooga, TN
|
—
|
|
370
|
|
409
|
|
—
|
|
—
|
|
370
|
|
408
|
|
778
|
|
76
|
|
2007
|
|||||||||
|
SUNTRUST BANK I TN
Lebanon, TN
|
925
|
|
675
|
|
848
|
|
—
|
|
(1
|
)
|
675
|
|
847
|
|
1,522
|
|
158
|
|
2007
|
|||||||||
|
SUNTRUST BANK I TN
Chattanooga, TN
|
677
|
|
425
|
|
630
|
|
—
|
|
(1
|
)
|
425
|
|
630
|
|
1,055
|
|
117
|
|
2007
|
|||||||||
|
SUNTRUST BANK I TN
Chattanooga, TN
|
531
|
|
185
|
|
491
|
|
—
|
|
—
|
|
185
|
|
491
|
|
676
|
|
91
|
|
2007
|
|||||||||
|
SUNTRUST BANK I TN
Loudon, TN
|
411
|
|
410
|
|
383
|
|
—
|
|
—
|
|
410
|
|
383
|
|
793
|
|
71
|
|
2007
|
|||||||||
|
SUNTRUST BANK I TN
Nashville, TN
|
726
|
|
1,400
|
|
671
|
|
—
|
|
(1
|
)
|
1,400
|
|
671
|
|
2,071
|
|
125
|
|
2007
|
|||||||||
|
SUNTRUST BANK I TN
Soddy Daisy, TN
|
423
|
|
150
|
|
394
|
|
—
|
|
—
|
|
150
|
|
393
|
|
543
|
|
73
|
|
2007
|
|||||||||
|
SUNTRUST BANK I TN
Oak Ridge, TN
|
—
|
|
660
|
|
725
|
|
—
|
|
(1
|
)
|
660
|
|
725
|
|
1,385
|
|
135
|
|
2007
|
|||||||||
|
SUNTRUST BANK I TN
Savannah, TN
|
—
|
|
335
|
|
645
|
|
—
|
|
(1
|
)
|
335
|
|
644
|
|
979
|
|
120
|
|
2007
|
|||||||||
|
SUNTRUST BANK I TN
Signal Mountain, TN
|
403
|
|
550
|
|
375
|
|
—
|
|
—
|
|
550
|
|
375
|
|
925
|
|
70
|
|
2007
|
|||||||||
|
SUNTRUST BANK I TN
Smyrna, TN
|
636
|
|
870
|
|
593
|
|
—
|
|
(1
|
)
|
870
|
|
592
|
|
1,462
|
|
110
|
|
2007
|
|||||||||
|
SUNTRUST BANK I TN
Murfreesboro, TN
|
570
|
|
1,000
|
|
530
|
|
—
|
|
(1
|
)
|
1,000
|
|
530
|
|
1,530
|
|
99
|
|
2007
|
|||||||||
132
INLAND AMERICAN REAL ESTATE TRUST, INC.
(A Maryland Corporation)
Schedule III
Real Estate and Accumulated Depreciation
(Dollar amounts in thousands)
December 31, 2012
|
|
|
Initial Cost (A)
|
|
|
Gross amount at which carried at end of period
|
|||||||||||||||||||||||
|
|
Encumbrance
|
Land
|
Buildings and
Improvements
|
Adjustments
to Land
Basis
(C)
|
Adjustments
to Basis (C)
|
Land and
Improvements
|
Buildings and
Improvements
(D)
|
Total (D,E)
|
Accumulated
Depreciation
(D,F)
|
Date of
Completion of
Construction or
Acquisition
|
||||||||||||||||||
|
SUNTRUST BANK I TN
Murfreesboro, TN
|
285
|
|
391
|
|
265
|
|
—
|
|
—
|
|
391
|
|
265
|
|
657
|
|
49
|
|
2007
|
|||||||||
|
SUNTRUST BANK I TN
Johnson City, TN
|
184
|
|
180
|
|
168
|
|
—
|
|
—
|
|
180
|
|
168
|
|
348
|
|
31
|
|
2007
|
|||||||||
|
SUNTRUST BANK I TN
Chattanooga, TN
|
298
|
|
453
|
|
278
|
|
—
|
|
—
|
|
453
|
|
278
|
|
730
|
|
52
|
|
2007
|
|||||||||
|
SUNTRUST BANK I TN
Nashville, TN
|
488
|
|
620
|
|
454
|
|
—
|
|
—
|
|
620
|
|
454
|
|
1,074
|
|
85
|
|
2007
|
|||||||||
|
SUNTRUST BANK I VA
Accomac, VA
|
232
|
|
30
|
|
260
|
|
—
|
|
—
|
|
30
|
|
260
|
|
290
|
|
49
|
|
2007
|
|||||||||
|
SUNTRUST BANK I VA
Richmond, VA
|
273
|
|
300
|
|
306
|
|
—
|
|
—
|
|
300
|
|
306
|
|
606
|
|
57
|
|
2007
|
|||||||||
|
SUNTRUST BANK I VA
Fairfax, VA
|
1,471
|
|
1,000
|
|
1,647
|
|
—
|
|
—
|
|
1,000
|
|
1,647
|
|
2,647
|
|
307
|
|
2007
|
|||||||||
|
SUNTRUST BANK I VA
Fredericksburg, VA
|
911
|
|
1,000
|
|
1,012
|
|
—
|
|
—
|
|
1,000
|
|
1,012
|
|
2,012
|
|
189
|
|
2007
|
|||||||||
|
SUNTRUST BANK I VA
Richmond, VA
|
261
|
|
500
|
|
292
|
|
—
|
|
—
|
|
500
|
|
292
|
|
792
|
|
54
|
|
2007
|
|||||||||
|
SUNTRUST BANK I VA
Collinsville, VA
|
349
|
|
140
|
|
384
|
|
—
|
|
—
|
|
140
|
|
384
|
|
524
|
|
72
|
|
2007
|
|||||||||
|
SUNTRUST BANK I VA
Doswell, VA
|
—
|
|
150
|
|
346
|
|
—
|
|
—
|
|
150
|
|
346
|
|
496
|
|
64
|
|
2007
|
|||||||||
|
SUNTRUST BANK I VA
Lynchburg, VA
|
889
|
|
380
|
|
988
|
|
—
|
|
—
|
|
380
|
|
987
|
|
1,367
|
|
184
|
|
2007
|
|||||||||
133
INLAND AMERICAN REAL ESTATE TRUST, INC.
(A Maryland Corporation)
Schedule III
Real Estate and Accumulated Depreciation
(Dollar amounts in thousands)
December 31, 2012
|
|
|
Initial Cost (A)
|
|
|
Gross amount at which carried at end of period
|
|||||||||||||||||||||||
|
|
Encumbrance
|
Land
|
Buildings and
Improvements
|
Adjustments
to Land
Basis
(C)
|
Adjustments
to Basis (C)
|
Land and
Improvements
|
Buildings and
Improvements
(D)
|
Total (D,E)
|
Accumulated
Depreciation
(D,F)
|
Date of
Completion of
Construction or
Acquisition
|
||||||||||||||||||
|
SUNTRUST BANK I VA
Stafford, VA
|
1,323
|
|
2,200
|
|
1,482
|
|
—
|
|
—
|
|
2,200
|
|
1,482
|
|
3,682
|
|
276
|
|
2007
|
|||||||||
|
SUNTRUST BANK I VA
Gloucester, VA
|
1,036
|
|
760
|
|
1,142
|
|
—
|
|
—
|
|
760
|
|
1,142
|
|
1,902
|
|
213
|
|
2007
|
|||||||||
|
SUNTRUST BANK I VA
Chesapeake, VA
|
653
|
|
450
|
|
726
|
|
—
|
|
—
|
|
450
|
|
725
|
|
1,175
|
|
135
|
|
2007
|
|||||||||
|
SUNTRUST BANK I VA
Lexington, VA
|
204
|
|
310
|
|
228
|
|
—
|
|
—
|
|
310
|
|
228
|
|
538
|
|
42
|
|
2007
|
|||||||||
|
SUNTRUST BANK I VA
Radford, VA
|
165
|
|
90
|
|
185
|
|
—
|
|
—
|
|
90
|
|
185
|
|
275
|
|
34
|
|
2007
|
|||||||||
|
SUNTRUST BANK I VA
Williamsburg, VA
|
489
|
|
530
|
|
547
|
|
—
|
|
—
|
|
530
|
|
547
|
|
1,077
|
|
102
|
|
2007
|
|||||||||
|
SUNTRUST BANK I VA
Salem, VA
|
—
|
|
860
|
|
479
|
|
—
|
|
—
|
|
860
|
|
479
|
|
1,339
|
|
89
|
|
2007
|
|||||||||
|
SUNTRUST BANK I VA
Roanoke, VA
|
1,212
|
|
1,170
|
|
1,357
|
|
—
|
|
—
|
|
1,170
|
|
1,357
|
|
2,527
|
|
253
|
|
2007
|
|||||||||
|
SUNTRUST BANK I VA
New Market, VA
|
—
|
|
150
|
|
634
|
|
—
|
|
—
|
|
150
|
|
634
|
|
784
|
|
118
|
|
2007
|
|||||||||
|
SUNTRUST BANK I VA
Onancock, VA
|
892
|
|
200
|
|
999
|
|
—
|
|
—
|
|
200
|
|
999
|
|
1,199
|
|
186
|
|
2007
|
|||||||||
|
SUNTRUST BANK I VA
Painter, VA
|
157
|
|
120
|
|
176
|
|
—
|
|
—
|
|
120
|
|
176
|
|
296
|
|
33
|
|
2007
|
|||||||||
|
SUNTRUST BANK I VA
Stuart, VA
|
840
|
|
260
|
|
926
|
|
—
|
|
—
|
|
260
|
|
926
|
|
1,186
|
|
172
|
|
2007
|
|||||||||
134
INLAND AMERICAN REAL ESTATE TRUST, INC.
(A Maryland Corporation)
Schedule III
Real Estate and Accumulated Depreciation
(Dollar amounts in thousands)
December 31, 2012
|
|
|
Initial Cost (A)
|
|
|
Gross amount at which carried at end of period
|
|||||||||||||||||||||||
|
|
Encumbrance
|
Land
|
Buildings and
Improvements
|
Adjustments
to Land
Basis
(C)
|
Adjustments
to Basis (C)
|
Land and
Improvements
|
Buildings and
Improvements
(D)
|
Total (D,E)
|
Accumulated
Depreciation
(D,F)
|
Date of
Completion of
Construction or
Acquisition
|
||||||||||||||||||
|
SUNTRUST BANK I VA
Roanoke, VA
|
445
|
|
450
|
|
498
|
|
—
|
|
—
|
|
450
|
|
498
|
|
948
|
|
93
|
|
2007
|
|||||||||
|
SUNTRUST BANK I VA
Vinton, VA
|
—
|
|
399
|
|
243
|
|
—
|
|
—
|
|
399
|
|
243
|
|
642
|
|
45
|
|
2007
|
|||||||||
|
SUNTRUST II FLORIDA
Miami, FL
|
1,550
|
|
1,533
|
|
893
|
|
—
|
|
3
|
|
1,533
|
|
896
|
|
2,429
|
|
164
|
|
2007
|
|||||||||
|
SUNTRUST II FLORIDA
Destin, FL
|
1,408
|
|
1,392
|
|
811
|
|
—
|
|
2
|
|
1,392
|
|
813
|
|
2,206
|
|
149
|
|
2007
|
|||||||||
|
SUNTRUST II FLORIDA
Dunedin, FL
|
—
|
|
1,463
|
|
852
|
|
—
|
|
2
|
|
1,463
|
|
855
|
|
2,318
|
|
157
|
|
2007
|
|||||||||
|
SUNTRUST II FLORIDA
Palm Harbor FL
|
1,094
|
|
1,082
|
|
630
|
|
—
|
|
2
|
|
1,082
|
|
632
|
|
1,715
|
|
116
|
|
2007
|
|||||||||
|
SUNTRUST II FLORIDA
Tallahassee, FL
|
1,694
|
|
1,675
|
|
976
|
|
—
|
|
3
|
|
1,675
|
|
979
|
|
2,654
|
|
179
|
|
2007
|
|||||||||
|
SUNTRUST II FLORIDA
Orlando, FL
|
1,235
|
|
1,221
|
|
711
|
|
—
|
|
2
|
|
1,221
|
|
713
|
|
1,935
|
|
131
|
|
2007
|
|||||||||
|
SUNTRUST II FLORIDA
Melbourne, FL
|
1,140
|
|
1,127
|
|
656
|
|
—
|
|
2
|
|
1,127
|
|
658
|
|
1,785
|
|
121
|
|
2007
|
|||||||||
|
SUNTRUST II FLORIDA
Coral Springs, FL
|
1,333
|
|
1,319
|
|
768
|
|
—
|
|
2
|
|
1,319
|
|
770
|
|
2,089
|
|
141
|
|
2007
|
|||||||||
|
SUNTRUST II FLORIDA
Lakeland, FL
|
1,049
|
|
1,038
|
|
604
|
|
—
|
|
2
|
|
1,038
|
|
606
|
|
1,644
|
|
111
|
|
2007
|
|||||||||
135
INLAND AMERICAN REAL ESTATE TRUST, INC.
(A Maryland Corporation)
Schedule III
Real Estate and Accumulated Depreciation
(Dollar amounts in thousands)
December 31, 2012
|
|
|
Initial Cost (A)
|
|
|
Gross amount at which carried at end of period
|
|||||||||||||||||||||||
|
|
Encumbrance
|
Land
|
Buildings and
Improvements
|
Adjustments
to Land
Basis
(C)
|
Adjustments
to Basis (C)
|
Land and
Improvements
|
Buildings and
Improvements
(D)
|
Total (D,E)
|
Accumulated
Depreciation
(D,F)
|
Date of
Completion of
Construction or
Acquisition
|
||||||||||||||||||
|
SUNTRUST II FLORIDA
Palm Coast, FL
|
—
|
|
1,221
|
|
711
|
|
—
|
|
2
|
|
1,221
|
|
713
|
|
1,935
|
|
131
|
|
2007
|
|||||||||
|
SUNTRUST II FLORIDA
Plant City, FL
|
—
|
|
1,527
|
|
890
|
|
—
|
|
3
|
|
1,527
|
|
892
|
|
2,420
|
|
163
|
|
2007
|
|||||||||
|
SUNTRUST II FLORIDA
South Daytona, FL
|
1,037
|
|
1,026
|
|
598
|
|
—
|
|
2
|
|
1,026
|
|
599
|
|
1,625
|
|
110
|
|
2007
|
|||||||||
|
SUNTRUST II FLORIDA
Pensacola, FL
|
993
|
|
982
|
|
572
|
|
—
|
|
2
|
|
982
|
|
574
|
|
1,556
|
|
105
|
|
2007
|
|||||||||
|
SUNTRUST II FLORIDA
West Palm Beach, FL
|
—
|
|
1,240
|
|
722
|
|
—
|
|
2
|
|
1,240
|
|
724
|
|
1,965
|
|
133
|
|
2007
|
|||||||||
|
SUNTRUST II FLORIDA
Lake Wells, FL
|
—
|
|
815
|
|
475
|
|
—
|
|
1
|
|
815
|
|
476
|
|
1,292
|
|
87
|
|
2007
|
|||||||||
|
SUNTRUST II FLORIDA
Dunnellon, FL
|
—
|
|
339
|
|
198
|
|
—
|
|
1
|
|
339
|
|
198
|
|
537
|
|
36
|
|
2007
|
|||||||||
|
SUNTRUST II FLORIDA
Kissimmee, FL
|
—
|
|
1,180
|
|
687
|
|
—
|
|
2
|
|
1,180
|
|
689
|
|
1,869
|
|
126
|
|
2007
|
|||||||||
|
SUNTRUST II FLORIDA
Port Orange, FL
|
—
|
|
1,131
|
|
659
|
|
—
|
|
2
|
|
1,131
|
|
660
|
|
1,791
|
|
121
|
|
2007
|
|||||||||
|
SUNTRUST II FLORIDA
North Port, FL
|
—
|
|
1,119
|
|
652
|
|
—
|
|
2
|
|
1,119
|
|
654
|
|
1,772
|
|
120
|
|
2007
|
|||||||||
136
INLAND AMERICAN REAL ESTATE TRUST, INC.
(A Maryland Corporation)
Schedule III
Real Estate and Accumulated Depreciation
(Dollar amounts in thousands)
December 31, 2012
|
|
|
Initial Cost (A)
|
|
|
Gross amount at which carried at end of period
|
|||||||||||||||||||||||
|
|
Encumbrance
|
Land
|
Buildings and
Improvements
|
Adjustments
to Land
Basis
(C)
|
Adjustments
to Basis (C)
|
Land and
Improvements
|
Buildings and
Improvements
(D)
|
Total (D,E)
|
Accumulated
Depreciation
(D,F)
|
Date of
Completion of
Construction or
Acquisition
|
||||||||||||||||||
|
SUNTRUST II FLORIDA
Hudson, FL
|
—
|
|
1,095
|
|
638
|
|
—
|
|
2
|
|
1,095
|
|
640
|
|
1,735
|
|
117
|
|
2007
|
|||||||||
|
SUNTRUST II FLORIDA
Port Orange, FL
|
—
|
|
1,030
|
|
600
|
|
—
|
|
2
|
|
1,030
|
|
602
|
|
1,632
|
|
110
|
|
2007
|
|||||||||
|
SUNTRUST II GEORGIA
Atlanta, GA
|
1,487
|
|
1,399
|
|
1,057
|
|
58
|
|
6
|
|
1,458
|
|
1,063
|
|
2,521
|
|
195
|
|
2007
|
|||||||||
|
SUNTRUST II GEORGIA
Bowden, GA
|
—
|
|
900
|
|
680
|
|
37
|
|
4
|
|
938
|
|
684
|
|
1,622
|
|
125
|
|
2007
|
|||||||||
|
SUNTRUST II GEORGIA
St. Simons Island, GA
|
—
|
|
1,124
|
|
849
|
|
47
|
|
5
|
|
1,171
|
|
854
|
|
2,025
|
|
156
|
|
2007
|
|||||||||
|
SUNTRUST II GEORGIA
Dunwoody, GA
|
—
|
|
1,734
|
|
1,310
|
|
72
|
|
7
|
|
1,806
|
|
1,317
|
|
3,123
|
|
241
|
|
2007
|
|||||||||
|
SUNTRUST II GEORGIA
Atlanta, GA
|
1,086
|
|
1,022
|
|
772
|
|
42
|
|
4
|
|
1,064
|
|
776
|
|
1,841
|
|
142
|
|
2007
|
|||||||||
|
SUNTRUST II GEORGIA
Jessup, GA
|
—
|
|
1,010
|
|
763
|
|
42
|
|
4
|
|
1,052
|
|
767
|
|
1,820
|
|
141
|
|
2007
|
|||||||||
|
SUNTRUST II GEORGIA
Brunswick, GA
|
168
|
|
159
|
|
120
|
|
7
|
|
1
|
|
165
|
|
120
|
|
286
|
|
22
|
|
2007
|
|||||||||
|
SUNTRUST II GEORGIA
Roswell, GA
|
1,347
|
|
1,268
|
|
958
|
|
53
|
|
5
|
|
1,320
|
|
963
|
|
2,283
|
|
176
|
|
2007
|
|||||||||
137
INLAND AMERICAN REAL ESTATE TRUST, INC.
(A Maryland Corporation)
Schedule III
Real Estate and Accumulated Depreciation
(Dollar amounts in thousands)
December 31, 2012
|
|
|
Initial Cost (A)
|
|
|
Gross amount at which carried at end of period
|
|||||||||||||||||||||||
|
|
Encumbrance
|
Land
|
Buildings and
Improvements
|
Adjustments
to Land
Basis
(C)
|
Adjustments
to Basis (C)
|
Land and
Improvements
|
Buildings and
Improvements
(D)
|
Total (D,E)
|
Accumulated
Depreciation
(D,F)
|
Date of
Completion of
Construction or
Acquisition
|
||||||||||||||||||
|
SUNTRUST II GEORGIA
Augusta, GA
|
—
|
|
607
|
|
459
|
|
25
|
|
2
|
|
632
|
|
461
|
|
1,094
|
|
84
|
|
2007
|
|||||||||
|
SUNTRUST II MARYLAND
Annapolis, MD
|
2,949
|
|
1,747
|
|
2,890
|
|
—
|
|
2
|
|
1,747
|
|
2,892
|
|
4,639
|
|
530
|
|
2007
|
|||||||||
|
SUNTRUST II MARYLAND
Frederick, MD
|
1,218
|
|
721
|
|
1,193
|
|
—
|
|
1
|
|
721
|
|
1,194
|
|
1,915
|
|
219
|
|
2007
|
|||||||||
|
SUNTRUST II MARYLAND
Waldorf, MD
|
—
|
|
1,269
|
|
2,099
|
|
—
|
|
1
|
|
1,269
|
|
2,100
|
|
3,369
|
|
385
|
|
2007
|
|||||||||
|
SUNTRUST II MARYLAND
Ellicott City, MD
|
—
|
|
962
|
|
1,591
|
|
—
|
|
1
|
|
962
|
|
1,592
|
|
2,554
|
|
292
|
|
2007
|
|||||||||
|
SUNTRUST II NORTH CAROLINA
Belmont, NC
|
—
|
|
453
|
|
1,038
|
|
—
|
|
1
|
|
453
|
|
1,039
|
|
1,492
|
|
190
|
|
2007
|
|||||||||
|
SUNTRUST II NORTH CAROLINA
Carrboro, NC
|
630
|
|
301
|
|
690
|
|
—
|
|
1
|
|
301
|
|
691
|
|
992
|
|
127
|
|
2007
|
|||||||||
|
SUNTRUST II NORTH CAROLINA
Monroe, NC
|
1,257
|
|
601
|
|
1,375
|
|
—
|
|
2
|
|
601
|
|
1,377
|
|
1,978
|
|
252
|
|
2007
|
|||||||||
|
SUNTRUST II NORTH CAROLINA
Lexington, NC
|
787
|
|
376
|
|
861
|
|
—
|
|
1
|
|
376
|
|
862
|
|
1,238
|
|
158
|
|
2007
|
|||||||||
138
INLAND AMERICAN REAL ESTATE TRUST, INC.
(A Maryland Corporation)
Schedule III
Real Estate and Accumulated Depreciation
(Dollar amounts in thousands)
December 31, 2012
|
|
|
Initial Cost (A)
|
|
|
Gross amount at which carried at end of period
|
|||||||||||||||||||||||
|
|
Encumbrance
|
Land
|
Buildings and
Improvements
|
Adjustments
to Land
Basis
(C)
|
Adjustments
to Basis (C)
|
Land and
Improvements
|
Buildings and
Improvements
(D)
|
Total (D,E)
|
Accumulated
Depreciation
(D,F)
|
Date of
Completion of
Construction or
Acquisition
|
||||||||||||||||||
|
SUNTRUST II NORTH CAROLINA
Burlington, NC
|
610
|
|
292
|
|
668
|
|
—
|
|
1
|
|
292
|
|
669
|
|
961
|
|
123
|
|
2007
|
|||||||||
|
SUNTRUST II NORTH CAROLINA
Mocksville, NC
|
—
|
|
1,155
|
|
2,645
|
|
—
|
|
3
|
|
1,155
|
|
2,648
|
|
3,803
|
|
485
|
|
2007
|
|||||||||
|
SUNTRUST II NORTH CAROLINA
Durham, NC
|
1,310
|
|
627
|
|
1,434
|
|
—
|
|
2
|
|
627
|
|
1,436
|
|
2,063
|
|
263
|
|
2007
|
|||||||||
|
SUNTRUST II NORTH CAROLINA
Oakboro, NC
|
555
|
|
265
|
|
607
|
|
—
|
|
1
|
|
265
|
|
608
|
|
873
|
|
111
|
|
2007
|
|||||||||
|
SUNTRUST II NORTH CAROLINA
Concord, NC
|
869
|
|
416
|
|
951
|
|
—
|
|
1
|
|
416
|
|
953
|
|
1,368
|
|
175
|
|
2007
|
|||||||||
|
SUNTRUST II NORTH CAROLINA
Raleigh, NC
|
—
|
|
386
|
|
883
|
|
—
|
|
1
|
|
386
|
|
884
|
|
1,270
|
|
162
|
|
2007
|
|||||||||
|
SUNTRUST II NORTH CAROLINA
Greensboro, NC
|
—
|
|
338
|
|
773
|
|
—
|
|
1
|
|
338
|
|
774
|
|
1,111
|
|
142
|
|
2007
|
|||||||||
|
SUNTRUST II NORTH CAROLINA
Pittsboro, NC
|
222
|
|
106
|
|
243
|
|
—
|
|
—
|
|
106
|
|
243
|
|
349
|
|
45
|
|
2007
|
|||||||||
139
INLAND AMERICAN REAL ESTATE TRUST, INC.
(A Maryland Corporation)
Schedule III
Real Estate and Accumulated Depreciation
(Dollar amounts in thousands)
December 31, 2012
|
|
|
Initial Cost (A)
|
|
|
Gross amount at which carried at end of period
|
|||||||||||||||||||||||
|
|
Encumbrance
|
Land
|
Buildings and
Improvements
|
Adjustments
to Land
Basis
(C)
|
Adjustments
to Basis (C)
|
Land and
Improvements
|
Buildings and
Improvements
(D)
|
Total (D,E)
|
Accumulated
Depreciation
(D,F)
|
Date of
Completion of
Construction or
Acquisition
|
||||||||||||||||||
|
SUNTRUST II NORTH CAROLINA
Yadkinville, NC
|
351
|
|
168
|
|
385
|
|
—
|
|
—
|
|
168
|
|
385
|
|
553
|
|
71
|
|
2007
|
|||||||||
|
SUNTRUST II NORTH CAROLINA
Matthews, NC
|
—
|
|
226
|
|
517
|
|
—
|
|
1
|
|
226
|
|
517
|
|
743
|
|
95
|
|
2007
|
|||||||||
|
SUNTRUST II NORTH CAROLINA
Burlington, NC
|
—
|
|
183
|
|
419
|
|
—
|
|
1
|
|
183
|
|
420
|
|
603
|
|
77
|
|
2007
|
|||||||||
|
SUNTRUST II NORTH CAROLINA
Zebulon, NC
|
706
|
|
338
|
|
773
|
|
—
|
|
1
|
|
338
|
|
774
|
|
1,111
|
|
142
|
|
2007
|
|||||||||
|
SUNTRUST II SOUTH CAROLINA
Belton, SC
|
647
|
|
220
|
|
798
|
|
—
|
|
—
|
|
220
|
|
798
|
|
1,018
|
|
146
|
|
2007
|
|||||||||
|
SUNTRUST II SOUTH CAROLINA
Anderson, SC
|
—
|
|
343
|
|
1,243
|
|
—
|
|
1
|
|
343
|
|
1,244
|
|
1,587
|
|
228
|
|
2007
|
|||||||||
|
SUNTRUST II SOUTH CAROLINA
Travelers Rest, SC
|
918
|
|
312
|
|
1,132
|
|
—
|
|
1
|
|
312
|
|
1,132
|
|
1,444
|
|
208
|
|
2007
|
|||||||||
|
SUNTRUST II TENNESSEE
Nashville, TN
|
1,780
|
|
1,190
|
|
1,619
|
|
—
|
|
3
|
|
1,190
|
|
1,623
|
|
2,812
|
|
297
|
|
2007
|
|||||||||
140
INLAND AMERICAN REAL ESTATE TRUST, INC.
(A Maryland Corporation)
Schedule III
Real Estate and Accumulated Depreciation
(Dollar amounts in thousands)
December 31, 2012
|
|
|
Initial Cost (A)
|
|
|
Gross amount at which carried at end of period
|
|||||||||||||||||||||||
|
|
Encumbrance
|
Land
|
Buildings and
Improvements
|
Adjustments
to Land
Basis
(C)
|
Adjustments
to Basis (C)
|
Land and
Improvements
|
Buildings and
Improvements
(D)
|
Total (D,E)
|
Accumulated
Depreciation
(D,F)
|
Date of
Completion of
Construction or
Acquisition
|
||||||||||||||||||
|
SUNTRUST II TENNESSEE
Lavergne, TN
|
—
|
|
156
|
|
213
|
|
—
|
|
—
|
|
156
|
|
213
|
|
369
|
|
39
|
|
2007
|
|||||||||
|
SUNTRUST II TENNESSEE
Nashville, TN
|
757
|
|
506
|
|
689
|
|
—
|
|
1
|
|
506
|
|
690
|
|
1,196
|
|
126
|
|
2007
|
|||||||||
|
SUNTRUST II TENNESSEE
Nashville, TN
|
538
|
|
360
|
|
489
|
|
—
|
|
1
|
|
360
|
|
490
|
|
850
|
|
90
|
|
2007
|
|||||||||
|
SUNTRUST II TENNESSEE
Chatanooga, TN
|
—
|
|
622
|
|
847
|
|
—
|
|
2
|
|
622
|
|
848
|
|
1,470
|
|
155
|
|
2007
|
|||||||||
|
SUNTRUST II TENNESSEE
Madison, TN
|
—
|
|
587
|
|
798
|
|
—
|
|
2
|
|
587
|
|
800
|
|
1,387
|
|
147
|
|
2007
|
|||||||||
|
SUNTRUST II VIRGINIA
Richmond, VA
|
1,383
|
|
759
|
|
1,423
|
|
—
|
|
(1
|
)
|
759
|
|
1,422
|
|
2,181
|
|
261
|
|
2007
|
|||||||||
|
SUNTRUST II VIRGINIA
Richmond, VA
|
—
|
|
235
|
|
441
|
|
—
|
|
—
|
|
235
|
|
441
|
|
676
|
|
81
|
|
2007
|
|||||||||
|
SUNTRUST II VIRGINIA
Norfolk, VA
|
672
|
|
369
|
|
692
|
|
—
|
|
—
|
|
369
|
|
692
|
|
1,061
|
|
127
|
|
2007
|
|||||||||
|
SUNTRUST II VIRGINIA
Lynchburg, VA
|
—
|
|
242
|
|
454
|
|
—
|
|
—
|
|
242
|
|
453
|
|
695
|
|
83
|
|
2007
|
|||||||||
|
SUNTRUST II VIRGINIA
Cheriton, VA
|
—
|
|
203
|
|
382
|
|
—
|
|
—
|
|
203
|
|
381
|
|
585
|
|
70
|
|
2007
|
|||||||||
|
SUNTRUST II VIRGINIA
Rocky Mount, VA
|
1,117
|
|
613
|
|
1,149
|
|
—
|
|
(1
|
)
|
613
|
|
1,149
|
|
1,761
|
|
211
|
|
2007
|
|||||||||
|
SUNTRUST II VIRGINIA
Petersburg, VA
|
253
|
|
139
|
|
260
|
|
—
|
|
—
|
|
139
|
|
260
|
|
399
|
|
48
|
|
2007
|
|||||||||
141
INLAND AMERICAN REAL ESTATE TRUST, INC.
(A Maryland Corporation)
Schedule III
Real Estate and Accumulated Depreciation
(Dollar amounts in thousands)
December 31, 2012
|
|
|
Initial Cost (A)
|
|
|
Gross amount at which carried at end of period
|
|||||||||||||||||||||||
|
|
Encumbrance
|
Land
|
Buildings and
Improvements
|
Adjustments
to Land
Basis
(C)
|
Adjustments
to Basis (C)
|
Land and
Improvements
|
Buildings and
Improvements
(D)
|
Total (D,E)
|
Accumulated
Depreciation
(D,F)
|
Date of
Completion of
Construction or
Acquisition
|
||||||||||||||||||
|
SUNTRUST III DISTRICT OF COLUMBIA
Washington, DC
|
1,737
|
|
800
|
|
1,986
|
|
—
|
|
—
|
|
800
|
|
1,986
|
|
2,786
|
|
346
|
|
2008
|
|||||||||
|
SUNTRUST III FLORIDA
Avon Park, FL
|
1,091
|
|
1,199
|
|
729
|
|
—
|
|
—
|
|
1,199
|
|
729
|
|
1,928
|
|
127
|
|
2008
|
|||||||||
|
SUNTRUST III FLORIDA
Bartow, FL
|
622
|
|
622
|
|
378
|
|
—
|
|
—
|
|
622
|
|
378
|
|
1,000
|
|
66
|
|
2008
|
|||||||||
|
SUNTRUST III FLORIDA
Belleview, FL
|
560
|
|
616
|
|
374
|
|
—
|
|
—
|
|
616
|
|
374
|
|
991
|
|
65
|
|
2008
|
|||||||||
|
SUNTRUST III FLORIDA
Beverly Hills, FL
|
1,021
|
|
1,020
|
|
620
|
|
—
|
|
—
|
|
1,020
|
|
620
|
|
1,640
|
|
108
|
|
2008
|
|||||||||
|
SUNTRUST III FLORIDA
Boca Raton, FL
|
1,503
|
|
1,474
|
|
896
|
|
—
|
|
—
|
|
1,474
|
|
896
|
|
2,370
|
|
156
|
|
2008
|
|||||||||
|
SUNTRUST III FLORIDA
Bradenton, FL
|
1,009
|
|
990
|
|
602
|
|
—
|
|
—
|
|
990
|
|
602
|
|
1,592
|
|
105
|
|
2008
|
|||||||||
|
SUNTRUST III FLORIDA
Cape Coral, FL
|
1,214
|
|
1,192
|
|
724
|
|
—
|
|
—
|
|
1,192
|
|
724
|
|
1,916
|
|
126
|
|
2008
|
|||||||||
|
SUNTRUST III FLORIDA
Clearwater, FL
|
569
|
|
559
|
|
340
|
|
—
|
|
—
|
|
559
|
|
340
|
|
898
|
|
59
|
|
2008
|
|||||||||
|
SUNTRUST III FLORIDA
Crystal River, FL
|
1,677
|
|
1,646
|
|
1,000
|
|
—
|
|
—
|
|
1,646
|
|
1,000
|
|
2,645
|
|
174
|
|
2008
|
|||||||||
|
SUNTRUST III FLORIDA
Daytona Beach Shores, FL
|
601
|
|
661
|
|
402
|
|
—
|
|
—
|
|
661
|
|
402
|
|
1,063
|
|
70
|
|
2008
|
|||||||||
142
INLAND AMERICAN REAL ESTATE TRUST, INC.
(A Maryland Corporation)
Schedule III
Real Estate and Accumulated Depreciation
(Dollar amounts in thousands)
December 31, 2012
|
|
|
Initial Cost (A)
|
|
|
Gross amount at which carried at end of period
|
|||||||||||||||||||||||
|
|
Encumbrance
|
Land
|
Buildings and
Improvements
|
Adjustments
to Land
Basis
(C)
|
Adjustments
to Basis (C)
|
Land and
Improvements
|
Buildings and
Improvements
(D)
|
Total (D,E)
|
Accumulated
Depreciation
(D,F)
|
Date of
Completion of
Construction or
Acquisition
|
||||||||||||||||||
|
SUNTRUST III FLORIDA
Deland, FL
|
992
|
|
975
|
|
592
|
|
—
|
|
—
|
|
975
|
|
592
|
|
1,567
|
|
103
|
|
2008
|
|||||||||
|
SUNTRUST III FLORIDA
Deland, FL
|
975
|
|
975
|
|
592
|
|
—
|
|
—
|
|
975
|
|
592
|
|
1,567
|
|
103
|
|
2008
|
|||||||||
|
SUNTRUST III FLORIDA
Edgewater, FL
|
1,063
|
|
1,043
|
|
634
|
|
—
|
|
—
|
|
1,043
|
|
634
|
|
1,677
|
|
110
|
|
2008
|
|||||||||
|
SUNTRUST III FLORIDA
Flager Beach, FL
|
941
|
|
924
|
|
562
|
|
—
|
|
—
|
|
924
|
|
562
|
|
1,486
|
|
98
|
|
2008
|
|||||||||
|
SUNTRUST III FLORIDA
Fort Myers, FL
|
690
|
|
678
|
|
412
|
|
—
|
|
—
|
|
678
|
|
412
|
|
1,090
|
|
72
|
|
2008
|
|||||||||
|
SUNTRUST III FLORIDA
Fort Myers, FL
|
1,082
|
|
1,081
|
|
657
|
|
—
|
|
—
|
|
1,081
|
|
657
|
|
1,738
|
|
114
|
|
2008
|
|||||||||
|
SUNTRUST III FLORIDA
Greenacres City, FL
|
1,454
|
|
1,426
|
|
867
|
|
—
|
|
—
|
|
1,426
|
|
867
|
|
2,293
|
|
151
|
|
2008
|
|||||||||
|
SUNTRUST III FLORIDA
Gulf Breeze, FL
|
1,812
|
|
1,778
|
|
1,080
|
|
—
|
|
—
|
|
1,778
|
|
1,080
|
|
2,859
|
|
188
|
|
2008
|
|||||||||
|
SUNTRUST III FLORIDA
Haines City, FL
|
1,107
|
|
1,106
|
|
672
|
|
—
|
|
—
|
|
1,106
|
|
672
|
|
1,778
|
|
117
|
|
2008
|
|||||||||
|
SUNTRUST III FLORIDA
Hallandale, FL
|
2,220
|
|
2,178
|
|
1,323
|
|
—
|
|
—
|
|
2,178
|
|
1,323
|
|
3,501
|
|
230
|
|
2008
|
|||||||||
|
SUNTRUST III FLORIDA
Hamosassa, FL
|
618
|
|
680
|
|
413
|
|
—
|
|
—
|
|
680
|
|
413
|
|
1,093
|
|
72
|
|
2008
|
|||||||||
|
SUNTRUST III FLORIDA
Hilaleah, FL
|
2,154
|
|
2,115
|
|
1,285
|
|
—
|
|
—
|
|
2,115
|
|
1,285
|
|
3,401
|
|
224
|
|
2008
|
|||||||||
143
INLAND AMERICAN REAL ESTATE TRUST, INC.
(A Maryland Corporation)
Schedule III
Real Estate and Accumulated Depreciation
(Dollar amounts in thousands)
December 31, 2012
|
|
|
Initial Cost (A)
|
|
|
Gross amount at which carried at end of period
|
|||||||||||||||||||||||
|
|
Encumbrance
|
Land
|
Buildings and
Improvements
|
Adjustments
to Land
Basis
(C)
|
Adjustments
to Basis (C)
|
Land and
Improvements
|
Buildings and
Improvements
(D)
|
Total (D,E)
|
Accumulated
Depreciation
(D,F)
|
Date of
Completion of
Construction or
Acquisition
|
||||||||||||||||||
|
SUNTRUST III FLORIDA
Inverness, FL
|
525
|
|
577
|
|
350
|
|
—
|
|
—
|
|
577
|
|
350
|
|
927
|
|
61
|
|
2008
|
|||||||||
|
SUNTRUST III FLORIDA
Jacksonville, FL
|
862
|
|
862
|
|
524
|
|
—
|
|
—
|
|
862
|
|
524
|
|
1,385
|
|
91
|
|
2008
|
|||||||||
|
SUNTRUST III FLORIDA
Jacksonville, FL
|
1,101
|
|
1,080
|
|
656
|
|
—
|
|
—
|
|
1,080
|
|
656
|
|
1,736
|
|
114
|
|
2008
|
|||||||||
|
SUNTRUST III FLORIDA
Jupiter, FL
|
1,176
|
|
1,294
|
|
786
|
|
—
|
|
—
|
|
1,294
|
|
786
|
|
2,080
|
|
137
|
|
2008
|
|||||||||
|
SUNTRUST III FLORIDA
Lady Lake, FL
|
1,022
|
|
1,124
|
|
683
|
|
—
|
|
—
|
|
1,124
|
|
683
|
|
1,806
|
|
119
|
|
2008
|
|||||||||
|
SUNTRUST III FLORIDA
Lady Lake, FL
|
1,307
|
|
1,283
|
|
779
|
|
—
|
|
—
|
|
1,283
|
|
779
|
|
2,062
|
|
136
|
|
2008
|
|||||||||
|
SUNTRUST III FLORIDA
Lake Placid, FL
|
1,053
|
|
1,052
|
|
639
|
|
—
|
|
—
|
|
1,052
|
|
639
|
|
1,692
|
|
111
|
|
2008
|
|||||||||
|
SUNTRUST III FLORIDA
Lakeland, FL
|
809
|
|
795
|
|
483
|
|
—
|
|
—
|
|
795
|
|
483
|
|
1,278
|
|
84
|
|
2008
|
|||||||||
|
SUNTRUST III FLORIDA
Largo, FL
|
719
|
|
706
|
|
429
|
|
—
|
|
—
|
|
706
|
|
429
|
|
1,135
|
|
75
|
|
2008
|
|||||||||
|
SUNTRUST III FLORIDA
Lynn Haven, FL
|
879
|
|
863
|
|
525
|
|
—
|
|
—
|
|
863
|
|
525
|
|
1,388
|
|
91
|
|
2008
|
|||||||||
|
SUNTRUST III FLORIDA
Melbourne, FL
|
890
|
|
874
|
|
531
|
|
—
|
|
—
|
|
874
|
|
531
|
|
1,405
|
|
92
|
|
2008
|
|||||||||
|
SUNTRUST III FLORIDA
Miami, FL
|
1,634
|
|
1,633
|
|
992
|
|
—
|
|
—
|
|
1,633
|
|
992
|
|
2,624
|
|
173
|
|
2008
|
|||||||||
144
INLAND AMERICAN REAL ESTATE TRUST, INC.
(A Maryland Corporation)
Schedule III
Real Estate and Accumulated Depreciation
(Dollar amounts in thousands)
December 31, 2012
|
|
|
Initial Cost (A)
|
|
|
Gross amount at which carried at end of period
|
|||||||||||||||||||||||
|
|
Encumbrance
|
Land
|
Buildings and
Improvements
|
Adjustments
to Land
Basis
(C)
|
Adjustments
to Basis (C)
|
Land and
Improvements
|
Buildings and
Improvements
(D)
|
Total (D,E)
|
Accumulated
Depreciation
(D,F)
|
Date of
Completion of
Construction or
Acquisition
|
||||||||||||||||||
|
SUNTRUST III FLORIDA
Miami Beach, FL
|
957
|
|
956
|
|
581
|
|
—
|
|
—
|
|
956
|
|
581
|
|
1,538
|
|
101
|
|
2008
|
|||||||||
|
SUNTRUST III FLORIDA
New Port Richey, FL
|
936
|
|
935
|
|
568
|
|
—
|
|
—
|
|
935
|
|
568
|
|
1,503
|
|
99
|
|
2008
|
|||||||||
|
SUNTRUST III FLORIDA
Orlando, FL
|
1,499
|
|
1,498
|
|
910
|
|
—
|
|
—
|
|
1,498
|
|
910
|
|
2,408
|
|
158
|
|
2008
|
|||||||||
|
SUNTRUST III FLORIDA
Orlando, FL
|
1,278
|
|
1,405
|
|
854
|
|
—
|
|
—
|
|
1,405
|
|
854
|
|
2,259
|
|
149
|
|
2008
|
|||||||||
|
SUNTRUST III FLORIDA
Palm Harbor, FL
|
583
|
|
572
|
|
348
|
|
—
|
|
—
|
|
572
|
|
348
|
|
920
|
|
61
|
|
2008
|
|||||||||
|
SUNTRUST III FLORIDA
Palm Harbor, FL
|
1,378
|
|
1,352
|
|
821
|
|
—
|
|
—
|
|
1,352
|
|
821
|
|
2,173
|
|
143
|
|
2008
|
|||||||||
|
SUNTRUST III FLORIDA
Port St. Lucie, FL
|
945
|
|
928
|
|
564
|
|
—
|
|
—
|
|
928
|
|
564
|
|
1,492
|
|
98
|
|
2008
|
|||||||||
|
SUNTRUST III FLORIDA
Punta Gorda, FL
|
1,696
|
|
1,695
|
|
1,030
|
|
—
|
|
—
|
|
1,695
|
|
1,030
|
|
2,724
|
|
179
|
|
2008
|
|||||||||
|
SUNTRUST III FLORIDA
Roseland, FL
|
993
|
|
974
|
|
592
|
|
—
|
|
—
|
|
974
|
|
592
|
|
1,567
|
|
103
|
|
2008
|
|||||||||
|
SUNTRUST III FLORIDA
Sebring, FL
|
802
|
|
787
|
|
478
|
|
—
|
|
—
|
|
787
|
|
478
|
|
1,265
|
|
83
|
|
2008
|
|||||||||
|
SUNTRUST III FLORIDA
Seminole, FL
|
757
|
|
743
|
|
452
|
|
—
|
|
—
|
|
743
|
|
452
|
|
1,195
|
|
79
|
|
2008
|
|||||||||
|
SUNTRUST III FLORIDA
Spring Hill, FL
|
835
|
|
820
|
|
498
|
|
—
|
|
—
|
|
820
|
|
498
|
|
1,319
|
|
87
|
|
2008
|
|||||||||
145
INLAND AMERICAN REAL ESTATE TRUST, INC.
(A Maryland Corporation)
Schedule III
Real Estate and Accumulated Depreciation
(Dollar amounts in thousands)
December 31, 2012
|
|
|
Initial Cost (A)
|
|
|
Gross amount at which carried at end of period
|
|||||||||||||||||||||||
|
|
Encumbrance
|
Land
|
Buildings and
Improvements
|
Adjustments
to Land
Basis
(C)
|
Adjustments
to Basis (C)
|
Land and
Improvements
|
Buildings and
Improvements
(D)
|
Total (D,E)
|
Accumulated
Depreciation
(D,F)
|
Date of
Completion of
Construction or
Acquisition
|
||||||||||||||||||
|
SUNTRUST III FLORIDA
Spring Hill, FL
|
1,237
|
|
1,360
|
|
827
|
|
—
|
|
—
|
|
1,360
|
|
827
|
|
2,187
|
|
144
|
|
2008
|
|||||||||
|
SUNTRUST III FLORIDA
Spring Hill, FL
|
1,210
|
|
1,330
|
|
808
|
|
—
|
|
—
|
|
1,330
|
|
808
|
|
2,138
|
|
141
|
|
2008
|
|||||||||
|
SUNTRUST III FLORIDA
St. Petersburg, FL
|
953
|
|
936
|
|
569
|
|
—
|
|
—
|
|
936
|
|
569
|
|
1,505
|
|
99
|
|
2008
|
|||||||||
|
SUNTRUST III FLORIDA
Stuart, FL
|
1,733
|
|
1,906
|
|
1,158
|
|
—
|
|
—
|
|
1,906
|
|
1,158
|
|
3,063
|
|
202
|
|
2008
|
|||||||||
|
SUNTRUST III FLORIDA
Sun City Center, FL
|
2,014
|
|
2,013
|
|
1,223
|
|
—
|
|
—
|
|
2,013
|
|
1,223
|
|
3,236
|
|
213
|
|
2008
|
|||||||||
|
SUNTRUST III FLORIDA
Tamarac, FL
|
1,547
|
|
1,518
|
|
922
|
|
—
|
|
—
|
|
1,518
|
|
922
|
|
2,440
|
|
161
|
|
2008
|
|||||||||
|
SUNTRUST III FLORIDA
Valrico, FL
|
605
|
|
605
|
|
367
|
|
—
|
|
—
|
|
605
|
|
367
|
|
972
|
|
64
|
|
2008
|
|||||||||
|
SUNTRUST III FLORIDA
Wildwood, FL
|
760
|
|
760
|
|
462
|
|
—
|
|
—
|
|
760
|
|
462
|
|
1,221
|
|
80
|
|
2008
|
|||||||||
|
SUNTRUST III FLORIDA
Zephyhills, FL
|
817
|
|
802
|
|
488
|
|
—
|
|
—
|
|
802
|
|
488
|
|
1,290
|
|
85
|
|
2008
|
|||||||||
|
SUNTRUST III FLORIDA
Zephyhills, FL
|
1,742
|
|
1,916
|
|
1,164
|
|
—
|
|
—
|
|
1,916
|
|
1,164
|
|
3,080
|
|
203
|
|
2008
|
|||||||||
|
SUNTRUST III GEORGIA
Albany, GA
|
659
|
|
564
|
|
482
|
|
—
|
|
—
|
|
564
|
|
482
|
|
1,046
|
|
84
|
|
2008
|
|||||||||
|
SUNTRUST III GEORGIA
Alpharetta, GA
|
1,917
|
|
1,642
|
|
1,404
|
|
—
|
|
—
|
|
1,642
|
|
1,404
|
|
3,046
|
|
244
|
|
2008
|
|||||||||
146
INLAND AMERICAN REAL ESTATE TRUST, INC.
(A Maryland Corporation)
Schedule III
Real Estate and Accumulated Depreciation
(Dollar amounts in thousands)
December 31, 2012
|
|
|
Initial Cost (A)
|
|
|
Gross amount at which carried at end of period
|
|||||||||||||||||||||||
|
|
Encumbrance
|
Land
|
Buildings and
Improvements
|
Adjustments
to Land
Basis
(C)
|
Adjustments
to Basis (C)
|
Land and
Improvements
|
Buildings and
Improvements
(D)
|
Total (D,E)
|
Accumulated
Depreciation
(D,F)
|
Date of
Completion of
Construction or
Acquisition
|
||||||||||||||||||
|
SUNTRUST III GEORGIA
Alpharetta, GA
|
1,440
|
|
1,233
|
|
1,054
|
|
—
|
|
—
|
|
1,233
|
|
1,054
|
|
2,287
|
|
183
|
|
2008
|
|||||||||
|
SUNTRUST III GEORGIA
Athens, GA
|
1,117
|
|
1,061
|
|
907
|
|
—
|
|
—
|
|
1,061
|
|
907
|
|
1,968
|
|
158
|
|
2008
|
|||||||||
|
SUNTRUST III GEORGIA
Atlanta, GA
|
2,300
|
|
2,005
|
|
1,714
|
|
—
|
|
—
|
|
2,005
|
|
1,714
|
|
3,719
|
|
298
|
|
2008
|
|||||||||
|
SUNTRUST III GEORGIA
Atlanta, GA
|
498
|
|
427
|
|
365
|
|
—
|
|
—
|
|
427
|
|
365
|
|
791
|
|
63
|
|
2008
|
|||||||||
|
SUNTRUST III GEORGIA
Augusta, GA
|
935
|
|
888
|
|
759
|
|
—
|
|
—
|
|
888
|
|
759
|
|
1,647
|
|
132
|
|
2008
|
|||||||||
|
SUNTRUST III GEORGIA
Augusta, GA
|
455
|
|
432
|
|
370
|
|
—
|
|
—
|
|
432
|
|
370
|
|
802
|
|
64
|
|
2008
|
|||||||||
|
SUNTRUST III GEORGIA
Augusta, GA
|
680
|
|
582
|
|
498
|
|
—
|
|
—
|
|
582
|
|
498
|
|
1,080
|
|
87
|
|
2008
|
|||||||||
|
SUNTRUST III GEORGIA
Baxley, GA
|
1,055
|
|
904
|
|
772
|
|
—
|
|
—
|
|
904
|
|
772
|
|
1,676
|
|
134
|
|
2008
|
|||||||||
|
SUNTRUST III GEORGIA
Columbus, GA
|
610
|
|
523
|
|
447
|
|
—
|
|
—
|
|
523
|
|
447
|
|
970
|
|
78
|
|
2008
|
|||||||||
|
SUNTRUST III GEORGIA
Conyers, GA
|
531
|
|
454
|
|
389
|
|
—
|
|
—
|
|
454
|
|
389
|
|
843
|
|
68
|
|
2008
|
|||||||||
|
SUNTRUST III GEORGIA
Douglas, GA
|
706
|
|
615
|
|
526
|
|
—
|
|
—
|
|
615
|
|
526
|
|
1,141
|
|
92
|
|
2008
|
|||||||||
|
SUNTRUST III GEORGIA
Duluth, GA
|
1,182
|
|
1,122
|
|
959
|
|
—
|
|
—
|
|
1,122
|
|
959
|
|
2,081
|
|
167
|
|
2008
|
|||||||||
147
INLAND AMERICAN REAL ESTATE TRUST, INC.
(A Maryland Corporation)
Schedule III
Real Estate and Accumulated Depreciation
(Dollar amounts in thousands)
December 31, 2012
|
|
|
Initial Cost (A)
|
|
|
Gross amount at which carried at end of period
|
|||||||||||||||||||||||
|
|
Encumbrance
|
Land
|
Buildings and
Improvements
|
Adjustments
to Land
Basis
(C)
|
Adjustments
to Basis (C)
|
Land and
Improvements
|
Buildings and
Improvements
(D)
|
Total (D,E)
|
Accumulated
Depreciation
(D,F)
|
Date of
Completion of
Construction or
Acquisition
|
||||||||||||||||||
|
SUNTRUST III GEORGIA
Jonesboro, GA
|
937
|
|
802
|
|
686
|
|
—
|
|
—
|
|
802
|
|
686
|
|
1,488
|
|
119
|
|
2008
|
|||||||||
|
SUNTRUST III GEORGIA
Lawrenceville, GA
|
1,828
|
|
1,593
|
|
1,362
|
|
—
|
|
—
|
|
1,593
|
|
1,362
|
|
2,955
|
|
237
|
|
2008
|
|||||||||
|
SUNTRUST III GEORGIA
Marietta, GA
|
851
|
|
728
|
|
622
|
|
—
|
|
—
|
|
728
|
|
622
|
|
1,351
|
|
108
|
|
2008
|
|||||||||
|
SUNTRUST III GEORGIA
Norcross, GA
|
735
|
|
641
|
|
548
|
|
—
|
|
—
|
|
641
|
|
548
|
|
1,189
|
|
95
|
|
2008
|
|||||||||
|
SUNTRUST III GEORGIA
Tucker, GA
|
891
|
|
777
|
|
664
|
|
—
|
|
—
|
|
777
|
|
664
|
|
1,441
|
|
116
|
|
2008
|
|||||||||
|
SUNTRUST III GEORGIA
Warner Robins, GA
|
1,435
|
|
1,251
|
|
1,069
|
|
—
|
|
—
|
|
1,251
|
|
1,069
|
|
2,320
|
|
186
|
|
2008
|
|||||||||
|
SUNTRUST III GEORGIA
Woodstock, GA
|
1,225
|
|
1,050
|
|
897
|
|
—
|
|
—
|
|
1,050
|
|
897
|
|
1,947
|
|
156
|
|
2008
|
|||||||||
|
SUNTRUST III GEORGIA
Macon, GA
|
388
|
|
332
|
|
284
|
|
—
|
|
—
|
|
332
|
|
284
|
|
615
|
|
49
|
|
2008
|
|||||||||
|
SUNTRUST III MARYLAND
Bladensburg, MD
|
1,040
|
|
563
|
|
1,427
|
|
—
|
|
—
|
|
563
|
|
1,427
|
|
1,989
|
|
248
|
|
2008
|
|||||||||
|
SUNTRUST III MARYLAND
Chestertown, MD
|
822
|
|
368
|
|
933
|
|
—
|
|
—
|
|
368
|
|
933
|
|
1,301
|
|
162
|
|
2008
|
|||||||||
|
SUNTRUST III MARYLAND
Upper Marlboro, MD
|
1,717
|
|
770
|
|
1,952
|
|
—
|
|
—
|
|
770
|
|
1,952
|
|
2,721
|
|
340
|
|
2008
|
|||||||||
148
INLAND AMERICAN REAL ESTATE TRUST, INC.
(A Maryland Corporation)
Schedule III
Real Estate and Accumulated Depreciation
(Dollar amounts in thousands)
December 31, 2012
|
|
|
Initial Cost (A)
|
|
|
Gross amount at which carried at end of period
|
|||||||||||||||||||||||
|
|
Encumbrance
|
Land
|
Buildings and
Improvements
|
Adjustments
to Land
Basis
(C)
|
Adjustments
to Basis (C)
|
Land and
Improvements
|
Buildings and
Improvements
(D)
|
Total (D,E)
|
Accumulated
Depreciation
(D,F)
|
Date of
Completion of
Construction or
Acquisition
|
||||||||||||||||||
|
SUNTRUST III NORTH CAROLINA
Black Mountain, NC
|
972
|
|
617
|
|
953
|
|
—
|
|
—
|
|
617
|
|
953
|
|
1,570
|
|
166
|
|
2008
|
|||||||||
|
SUNTRUST III NORTH CAROLINA
Butner, NC
|
430
|
|
273
|
|
422
|
|
—
|
|
—
|
|
273
|
|
422
|
|
695
|
|
74
|
|
2008
|
|||||||||
|
SUNTRUST III NORTH CAROLINA
Cary, NC
|
758
|
|
546
|
|
843
|
|
—
|
|
—
|
|
546
|
|
843
|
|
1,389
|
|
147
|
|
2008
|
|||||||||
|
SUNTRUST III NORTH CAROLINA
Chapel Hill, NC
|
480
|
|
346
|
|
534
|
|
—
|
|
—
|
|
346
|
|
534
|
|
880
|
|
93
|
|
2008
|
|||||||||
|
SUNTRUST III NORTH CAROLINA
Denton, NC
|
834
|
|
600
|
|
928
|
|
—
|
|
—
|
|
600
|
|
928
|
|
1,528
|
|
162
|
|
2008
|
|||||||||
|
SUNTRUST III NORTH CAROLINA
Erwin, NC
|
514
|
|
320
|
|
495
|
|
—
|
|
—
|
|
320
|
|
495
|
|
815
|
|
86
|
|
2008
|
|||||||||
|
SUNTRUST III NORTH CAROLINA
Greensboro, NC
|
616
|
|
384
|
|
594
|
|
—
|
|
—
|
|
384
|
|
594
|
|
978
|
|
103
|
|
2008
|
|||||||||
|
SUNTRUST III NORTH CAROLINA
Hudson, NC
|
491
|
|
312
|
|
482
|
|
—
|
|
—
|
|
312
|
|
482
|
|
794
|
|
84
|
|
2008
|
|||||||||
149
INLAND AMERICAN REAL ESTATE TRUST, INC.
(A Maryland Corporation)
Schedule III
Real Estate and Accumulated Depreciation
(Dollar amounts in thousands)
December 31, 2012
|
|
|
Initial Cost (A)
|
|
|
Gross amount at which carried at end of period
|
|||||||||||||||||||||||
|
|
Encumbrance
|
Land
|
Buildings and
Improvements
|
Adjustments
to Land
Basis
(C)
|
Adjustments
to Basis (C)
|
Land and
Improvements
|
Buildings and
Improvements
(D)
|
Total (D,E)
|
Accumulated
Depreciation
(D,F)
|
Date of
Completion of
Construction or
Acquisition
|
||||||||||||||||||
|
SUNTRUST III NORTH CAROLINA
Huntersville, NC
|
524
|
|
333
|
|
514
|
|
(157
|
)
|
—
|
|
176
|
|
514
|
|
690
|
|
89
|
|
2008
|
|||||||||
|
SUNTRUST III NORTH CAROLINA
Kannapolis, NC
|
1,100
|
|
792
|
|
1,224
|
|
—
|
|
—
|
|
792
|
|
1,224
|
|
2,016
|
|
213
|
|
2008
|
|||||||||
|
SUNTRUST III NORTH CAROLINA
Kernersville, NC
|
565
|
|
407
|
|
628
|
|
—
|
|
—
|
|
407
|
|
628
|
|
1,035
|
|
109
|
|
2008
|
|||||||||
|
SUNTRUST III NORTH CAROLINA
Marshville, NC
|
358
|
|
224
|
|
345
|
|
—
|
|
—
|
|
224
|
|
345
|
|
569
|
|
60
|
|
2008
|
|||||||||
|
SUNTRUST III NORTH CAROLINA
Mocksville, NC
|
610
|
|
439
|
|
678
|
|
—
|
|
—
|
|
439
|
|
678
|
|
1,118
|
|
118
|
|
2008
|
|||||||||
|
SUNTRUST III NORTH CAROLINA
Monroe, NC
|
536
|
|
335
|
|
517
|
|
—
|
|
—
|
|
335
|
|
517
|
|
852
|
|
90
|
|
2008
|
|||||||||
|
SUNTRUST III NORTH CAROLINA
Monroe, NC
|
633
|
|
395
|
|
610
|
|
—
|
|
—
|
|
395
|
|
610
|
|
1,004
|
|
106
|
|
2008
|
|||||||||
|
SUNTRUST III NORTH CAROLINA
Norwood, NC
|
557
|
|
354
|
|
546
|
|
—
|
|
—
|
|
354
|
|
546
|
|
900
|
|
95
|
|
2008
|
|||||||||
150
INLAND AMERICAN REAL ESTATE TRUST, INC.
(A Maryland Corporation)
Schedule III
Real Estate and Accumulated Depreciation
(Dollar amounts in thousands)
December 31, 2012
|
|
|
Initial Cost (A)
|
|
|
Gross amount at which carried at end of period
|
|||||||||||||||||||||||
|
|
Encumbrance
|
Land
|
Buildings and
Improvements
|
Adjustments
to Land
Basis
(C)
|
Adjustments
to Basis (C)
|
Land and
Improvements
|
Buildings and
Improvements
(D)
|
Total (D,E)
|
Accumulated
Depreciation
(D,F)
|
Date of
Completion of
Construction or
Acquisition
|
||||||||||||||||||
|
SUNTRUST III NORTH CAROLINA
Raleigh, NC
|
1,272
|
|
916
|
|
1,415
|
|
—
|
|
—
|
|
916
|
|
1,415
|
|
2,332
|
|
246
|
|
2008
|
|||||||||
|
SUNTRUST III NORTH CAROLINA
Roxboro, NC
|
845
|
|
608
|
|
940
|
|
—
|
|
—
|
|
608
|
|
940
|
|
1,548
|
|
164
|
|
2008
|
|||||||||
|
SUNTRUST III NORTH CAROLINA
Spencer, NC
|
538
|
|
342
|
|
528
|
|
—
|
|
—
|
|
342
|
|
528
|
|
869
|
|
92
|
|
2008
|
|||||||||
|
SUNTRUST III NORTH CAROLINA
Wake Forest, NC
|
1,347
|
|
841
|
|
1,299
|
|
—
|
|
—
|
|
841
|
|
1,299
|
|
2,139
|
|
226
|
|
2008
|
|||||||||
|
SUNTRUST III NORTH CAROLINA
Youngsville, NC
|
232
|
|
167
|
|
259
|
|
—
|
|
—
|
|
167
|
|
259
|
|
426
|
|
45
|
|
2008
|
|||||||||
|
SUNTRUST III SOUTH CAROLINA
Anderson, SC
|
791
|
|
422
|
|
836
|
|
—
|
|
—
|
|
422
|
|
836
|
|
1,258
|
|
145
|
|
2008
|
|||||||||
|
SUNTRUST III SOUTH CAROLINA
Spartanburg, SC
|
520
|
|
278
|
|
550
|
|
—
|
|
—
|
|
278
|
|
550
|
|
828
|
|
96
|
|
2008
|
|||||||||
|
SUNTRUST III TENNESSEE
Chattanooga, TN
|
574
|
|
597
|
|
343
|
|
—
|
|
—
|
|
597
|
|
343
|
|
940
|
|
60
|
|
2008
|
|||||||||
151
INLAND AMERICAN REAL ESTATE TRUST, INC.
(A Maryland Corporation)
Schedule III
Real Estate and Accumulated Depreciation
(Dollar amounts in thousands)
December 31, 2012
|
|
|
Initial Cost (A)
|
|
|
Gross amount at which carried at end of period
|
|||||||||||||||||||||||
|
|
Encumbrance
|
Land
|
Buildings and
Improvements
|
Adjustments
to Land
Basis
(C)
|
Adjustments
to Basis (C)
|
Land and
Improvements
|
Buildings and
Improvements
(D)
|
Total (D,E)
|
Accumulated
Depreciation
(D,F)
|
Date of
Completion of
Construction or
Acquisition
|
||||||||||||||||||
|
SUNTRUST III TENNESSEE
Chattanooga, TN
|
680
|
|
783
|
|
449
|
|
—
|
|
—
|
|
783
|
|
449
|
|
1,232
|
|
78
|
|
2008
|
|||||||||
|
SUNTRUST III TENNESSEE
Chattanooga, TN
|
464
|
|
533
|
|
306
|
|
—
|
|
—
|
|
533
|
|
306
|
|
839
|
|
53
|
|
2008
|
|||||||||
|
SUNTRUST III TENNESSEE
Chattanooga, TN
|
701
|
|
716
|
|
411
|
|
—
|
|
—
|
|
716
|
|
411
|
|
1,127
|
|
72
|
|
2008
|
|||||||||
|
SUNTRUST III TENNESSEE
Cleveland, TN
|
339
|
|
353
|
|
203
|
|
—
|
|
—
|
|
353
|
|
203
|
|
556
|
|
35
|
|
2008
|
|||||||||
|
SUNTRUST III TENNESSEE
Johnson City, TN
|
112
|
|
115
|
|
66
|
|
—
|
|
—
|
|
115
|
|
66
|
|
180
|
|
11
|
|
2008
|
|||||||||
|
SUNTRUST III TENNESSEE
Jonesborough, TN
|
232
|
|
237
|
|
136
|
|
—
|
|
—
|
|
237
|
|
136
|
|
373
|
|
24
|
|
2008
|
|||||||||
|
SUNTRUST III TENNESSEE
Lake City, TN
|
564
|
|
576
|
|
330
|
|
—
|
|
—
|
|
576
|
|
330
|
|
907
|
|
58
|
|
2008
|
|||||||||
|
SUNTRUST III TENNESSEE
Lawrenceburg, TN
|
303
|
|
310
|
|
178
|
|
—
|
|
—
|
|
310
|
|
178
|
|
488
|
|
31
|
|
2008
|
|||||||||
|
SUNTRUST III TENNESSEE
Murfreesboro, TN
|
581
|
|
593
|
|
340
|
|
—
|
|
—
|
|
593
|
|
340
|
|
934
|
|
59
|
|
2008
|
|||||||||
|
SUNTRUST III TENNESSEE
Nashville, TN
|
846
|
|
973
|
|
558
|
|
—
|
|
—
|
|
973
|
|
558
|
|
1,531
|
|
97
|
|
2008
|
|||||||||
|
SUNTRUST III TENNESSEE
Nashville, TN
|
752
|
|
768
|
|
441
|
|
—
|
|
—
|
|
768
|
|
441
|
|
1,209
|
|
77
|
|
2008
|
|||||||||
|
SUNTRUST III TENNESSEE
Nashville, TN
|
714
|
|
730
|
|
419
|
|
—
|
|
—
|
|
730
|
|
419
|
|
1,148
|
|
73
|
|
2008
|
|||||||||
152
INLAND AMERICAN REAL ESTATE TRUST, INC.
(A Maryland Corporation)
Schedule III
Real Estate and Accumulated Depreciation
(Dollar amounts in thousands)
December 31, 2012
|
|
|
Initial Cost (A)
|
|
|
Gross amount at which carried at end of period
|
|||||||||||||||||||||||
|
|
Encumbrance
|
Land
|
Buildings and
Improvements
|
Adjustments
to Land
Basis
(C)
|
Adjustments
to Basis (C)
|
Land and
Improvements
|
Buildings and
Improvements
(D)
|
Total (D,E)
|
Accumulated
Depreciation
(D,F)
|
Date of
Completion of
Construction or
Acquisition
|
||||||||||||||||||
|
SUNTRUST III VIRGINIA
Alexandria, VA
|
1,778
|
|
1,518
|
|
1,370
|
|
—
|
|
—
|
|
1,518
|
|
1,370
|
|
2,888
|
|
238
|
|
2008
|
|||||||||
|
SUNTRUST III VIRGINIA
Arlington, VA
|
1,573
|
|
1,319
|
|
1,190
|
|
—
|
|
—
|
|
1,319
|
|
1,190
|
|
2,508
|
|
207
|
|
2008
|
|||||||||
|
SUNTRUST III VIRGINIA
Beaverdam, VA
|
293
|
|
273
|
|
246
|
|
—
|
|
—
|
|
273
|
|
246
|
|
520
|
|
43
|
|
2008
|
|||||||||
|
SUNTRUST III VIRGINIA
Franklin, VA
|
546
|
|
458
|
|
413
|
|
—
|
|
—
|
|
458
|
|
413
|
|
871
|
|
72
|
|
2008
|
|||||||||
|
SUNTRUST III VIRGINIA
Gloucester, VA
|
732
|
|
614
|
|
554
|
|
—
|
|
—
|
|
614
|
|
554
|
|
1,169
|
|
96
|
|
2008
|
|||||||||
|
SUNTRUST III VIRGINIA
Harrisonburg, VA
|
439
|
|
368
|
|
332
|
|
—
|
|
—
|
|
368
|
|
332
|
|
701
|
|
58
|
|
2008
|
|||||||||
|
SUNTRUST III VIRGINIA
Lightfoot, VA
|
392
|
|
335
|
|
302
|
|
—
|
|
—
|
|
335
|
|
302
|
|
637
|
|
53
|
|
2008
|
|||||||||
|
SUNTRUST III VIRGINIA
Madison Heights, VA
|
369
|
|
310
|
|
280
|
|
—
|
|
—
|
|
310
|
|
280
|
|
590
|
|
49
|
|
2008
|
|||||||||
|
SUNTRUST III VIRGINIA
Manassas, VA
|
1,853
|
|
1,727
|
|
1,558
|
|
—
|
|
—
|
|
1,727
|
|
1,558
|
|
3,285
|
|
271
|
|
2008
|
|||||||||
|
SUNTRUST III VIRGINIA
Mechanicsville, VA
|
514
|
|
479
|
|
433
|
|
—
|
|
—
|
|
479
|
|
433
|
|
912
|
|
75
|
|
2008
|
|||||||||
|
SUNTRUST III VIRGINIA
Nassawadox, VA
|
273
|
|
254
|
|
229
|
|
—
|
|
—
|
|
254
|
|
229
|
|
484
|
|
40
|
|
2008
|
|||||||||
|
SUNTRUST III VIRGINIA
Radford, VA
|
362
|
|
309
|
|
279
|
|
—
|
|
—
|
|
309
|
|
279
|
|
589
|
|
49
|
|
2008
|
|||||||||
153
INLAND AMERICAN REAL ESTATE TRUST, INC.
(A Maryland Corporation)
Schedule III
Real Estate and Accumulated Depreciation
(Dollar amounts in thousands)
December 31, 2012
|
|
|
Initial Cost (A)
|
|
|
Gross amount at which carried at end of period
|
|||||||||||||||||||||||
|
|
Encumbrance
|
Land
|
Buildings and
Improvements
|
Adjustments
to Land
Basis
(C)
|
Adjustments
to Basis (C)
|
Land and
Improvements
|
Buildings and
Improvements
(D)
|
Total (D,E)
|
Accumulated
Depreciation
(D,F)
|
Date of
Completion of
Construction or
Acquisition
|
||||||||||||||||||
|
SUNTRUST III VIRGINIA
Richmond, VA
|
1,414
|
|
1,186
|
|
1,070
|
|
—
|
|
—
|
|
1,186
|
|
1,070
|
|
2,257
|
|
186
|
|
2008
|
|||||||||
|
SUNTRUST III VIRGINIA
Richmond, VA
|
309
|
|
259
|
|
234
|
|
—
|
|
—
|
|
259
|
|
234
|
|
493
|
|
41
|
|
2008
|
|||||||||
|
SUNTRUST III VIRGINIA
Richmond, VA
|
901
|
|
755
|
|
681
|
|
—
|
|
—
|
|
755
|
|
681
|
|
1,437
|
|
119
|
|
2008
|
|||||||||
|
SUNTRUST III VIRGINIA
Richmond, VA
|
597
|
|
501
|
|
452
|
|
—
|
|
—
|
|
501
|
|
452
|
|
952
|
|
79
|
|
2008
|
|||||||||
|
SUNTRUST III VIRGINIA
Roanoke, VA
|
404
|
|
339
|
|
306
|
|
—
|
|
—
|
|
339
|
|
306
|
|
646
|
|
53
|
|
2008
|
|||||||||
|
SUNTRUST III VIRGINIA
Roanoke, VA
|
160
|
|
149
|
|
135
|
|
—
|
|
—
|
|
149
|
|
135
|
|
284
|
|
23
|
|
2008
|
|||||||||
|
SUNTRUST III VIRGINIA
South Boston, VA
|
839
|
|
716
|
|
646
|
|
—
|
|
—
|
|
716
|
|
646
|
|
1,362
|
|
112
|
|
2008
|
|||||||||
|
SUNTRUST III VIRGINIA
Spotsylvania, VA
|
1,330
|
|
1,136
|
|
1,025
|
|
—
|
|
—
|
|
1,136
|
|
1,025
|
|
2,160
|
|
178
|
|
2008
|
|||||||||
|
SUNTRUST III VIRGINIA
Virginia Beach, VA
|
654
|
|
558
|
|
504
|
|
—
|
|
—
|
|
558
|
|
504
|
|
1,062
|
|
88
|
|
2008
|
|||||||||
|
SYCAMORE COMMONS
Matthews, NC
|
48,382
|
|
12,500
|
|
31,265
|
|
—
|
|
475
|
|
12,500
|
|
31,740
|
|
44,240
|
|
3,548
|
|
2010
|
|||||||||
|
THE CENTER AT HUGH HOWELL
Tucker, GA
|
7,722
|
|
2,250
|
|
11,091
|
|
—
|
|
686
|
|
2,250
|
|
11,777
|
|
14,027
|
|
2,459
|
|
2007
|
|||||||||
154
INLAND AMERICAN REAL ESTATE TRUST, INC.
(A Maryland Corporation)
Schedule III
Real Estate and Accumulated Depreciation
(Dollar amounts in thousands)
December 31, 2012
|
|
|
Initial Cost (A)
|
|
|
Gross amount at which carried at end of period
|
|||||||||||||||||||||||
|
|
Encumbrance
|
Land
|
Buildings and
Improvements
|
Adjustments
to Land
Basis
(C)
|
Adjustments
to Basis (C)
|
Land and
Improvements
|
Buildings and
Improvements
(D)
|
Total (D,E)
|
Accumulated
Depreciation
(D,F)
|
Date of
Completion of
Construction or
Acquisition
|
||||||||||||||||||
|
THE HIGHLANDS
Flower Mound, TX
|
9,745
|
|
5,500
|
|
9,589
|
|
—
|
|
105
|
|
5,500
|
|
9,694
|
|
15,194
|
|
1,959
|
|
2006
|
|||||||||
|
THE MARKET AT HILLIARD
Hilliard, OH
|
11,205
|
|
4,432
|
|
13,308
|
|
—
|
|
3,220
|
|
4,432
|
|
16,528
|
|
20,960
|
|
3,604
|
|
2005
|
|||||||||
|
THOMAS CROSSROADS
Newnan, GA
|
5,624
|
|
1,622
|
|
8,322
|
|
—
|
|
183
|
|
1,622
|
|
8,505
|
|
10,127
|
|
1,235
|
|
2009
|
|||||||||
|
TOMBALL TOWN CENTER
Tomball, TX
|
9,595
|
|
1,938
|
|
14,233
|
|
360
|
|
6,025
|
|
2,298
|
|
20,258
|
|
22,555
|
|
4,185
|
|
2005
|
|||||||||
|
TRIANGLE CENTER
Longview, WA
|
21,932
|
|
12,770
|
|
24,556
|
|
—
|
|
1,722
|
|
12,770
|
|
26,278
|
|
39,048
|
|
6,400
|
|
2005
|
|||||||||
|
TULSA HILLS SHOPPING CENTER
Tulsa, OK
|
37,727
|
|
8,000
|
|
42,272
|
|
4,770
|
|
5,201
|
|
12,770
|
|
47,473
|
|
60,243
|
|
4,305
|
|
2010
|
|||||||||
|
UNIVERSAL PLAZA
Lauderhill, FL
|
9,887
|
|
2,900
|
|
4,950
|
|
—
|
|
27
|
|
2,900
|
|
4,977
|
|
7,877
|
|
504
|
|
2010
|
|||||||||
|
UNIVERSITY OAKS SHOPPING CENTER
Round Rock, TX
|
27,000
|
|
7,250
|
|
25,326
|
|
—
|
|
5,823
|
|
7,250
|
|
31,149
|
|
38,399
|
|
2,819
|
|
2010
|
|||||||||
|
VENTURE POINT
Duluth, GA
|
25,818
|
|
10,400
|
|
12,887
|
|
(273
|
)
|
(5,947
|
)
|
10,127
|
|
6,940
|
|
17,067
|
|
—
|
|
2010
|
|||||||||
|
VICTORY LAKES TOWN CENTER
League City, TX
|
30,825
|
|
8,750
|
|
44,894
|
|
—
|
|
5,425
|
|
8,750
|
|
50,319
|
|
59,069
|
|
2,166
|
|
2011
|
|||||||||
155
INLAND AMERICAN REAL ESTATE TRUST, INC.
(A Maryland Corporation)
Schedule III
Real Estate and Accumulated Depreciation
(Dollar amounts in thousands)
December 31, 2012
|
|
|
Initial Cost (A)
|
|
|
Gross amount at which carried at end of period
|
|||||||||||||||||||||||
|
|
Encumbrance
|
Land
|
Buildings and
Improvements
|
Adjustments
to Land
Basis
(C)
|
Adjustments
to Basis (C)
|
Land and
Improvements
|
Buildings and
Improvements
(D)
|
Total (D,E)
|
Accumulated
Depreciation
(D,F)
|
Date of
Completion of
Construction or
Acquisition
|
||||||||||||||||||
|
WARDS CROSSING
Lynchburg, VA
|
12,904
|
|
2,400
|
|
11,417
|
|
—
|
|
3
|
|
2,400
|
|
11,420
|
|
13,820
|
|
1,221
|
|
2010
|
|||||||||
|
WASHINGTON PARK PLAZA
Homewood, IL
|
30,600
|
|
6,500
|
|
33,912
|
|
—
|
|
(297
|
)
|
6,500
|
|
33,615
|
|
40,115
|
|
6,473
|
|
2005
|
|||||||||
|
WHITE OAK CROSSING
Garner, NC
|
52,000
|
|
19,000
|
|
70,275
|
|
—
|
|
6
|
|
19,000
|
|
70,281
|
|
89,281
|
|
3,473
|
|
2011
|
|||||||||
|
WILLIS TOWN CENTER
Willis, TX
|
—
|
|
1,550
|
|
1,820
|
|
—
|
|
654
|
|
1,550
|
|
2,474
|
|
4,024
|
|
555
|
|
2005
|
|||||||||
|
WINCHESTER TOWN CENTER
Houston, TX
|
—
|
|
495
|
|
3,966
|
|
—
|
|
48
|
|
495
|
|
4,014
|
|
4,509
|
|
1,038
|
|
2005
|
|||||||||
|
WINDERMERE VILLAGE
Houston, TX
|
4,000
|
|
1,220
|
|
6,331
|
|
—
|
|
836
|
|
1,220
|
|
7,168
|
|
8,388
|
|
1,813
|
|
2005
|
|||||||||
|
WOODBRIDGE
Wylie, TX
|
18,186
|
|
—
|
|
—
|
|
—
|
|
24,176
|
|
—
|
|
24,176
|
|
24,176
|
|
1,929
|
|
||||||||||
|
WOODLAKE CROSSING
San Antonio, TX
|
15,575
|
|
3,420
|
|
14,153
|
|
—
|
|
3,424
|
|
3,420
|
|
17,577
|
|
20,997
|
|
1,793
|
|
2009
|
|||||||||
|
Office
|
||||||||||||||||||||||||||||
|
11500 MARKET STREET
Jacinto City, TX
|
—
|
|
140
|
|
346
|
|
(35
|
)
|
(159
|
)
|
105
|
|
187
|
|
292
|
|
12
|
|
2005
|
|||||||||
|
AMERICAN EXPRESS—GREENSBORO
Greensboro, NC
|
26,068
|
|
8,850
|
|
39,527
|
|
—
|
|
5
|
|
8,850
|
|
39,532
|
|
48,382
|
|
5,116
|
|
2009
|
|||||||||
156
INLAND AMERICAN REAL ESTATE TRUST, INC.
(A Maryland Corporation)
Schedule III
Real Estate and Accumulated Depreciation
(Dollar amounts in thousands)
December 31, 2012
|
|
|
Initial Cost (A)
|
|
|
Gross amount at which carried at end of period
|
|||||||||||||||||||||||
|
|
Encumbrance
|
Land
|
Buildings and
Improvements
|
Adjustments
to Land
Basis
(C)
|
Adjustments
to Basis (C)
|
Land and
Improvements
|
Buildings and
Improvements
(D)
|
Total (D,E)
|
Accumulated
Depreciation
(D,F)
|
Date of
Completion of
Construction or
Acquisition
|
||||||||||||||||||
|
AMERICAN EXPRESS—SALT LAKE CITY
Salt Lake City, UT
|
22,676
|
|
9,000
|
|
45,415
|
|
—
|
|
—
|
|
9,000
|
|
45,415
|
|
54,415
|
|
5,793
|
|
2009
|
|||||||||
|
SBC CENTER
Hoffman Estates, IL
|
173,878
|
|
35,800
|
|
287,424
|
|
—
|
|
757
|
|
35,800
|
|
288,181
|
|
323,981
|
|
72,166
|
|
2007
|
|||||||||
|
AT&T—ST LOUIS
St Louis, MO
|
112,695
|
|
8,000
|
|
170,169
|
|
—
|
|
109
|
|
8,000
|
|
170,278
|
|
178,278
|
|
35,742
|
|
2007
|
|||||||||
|
AT&T CLEVELAND
Cleveland, OH
|
29,061
|
|
870
|
|
40,033
|
|
—
|
|
137
|
|
870
|
|
40,170
|
|
41,040
|
|
8,200
|
|
2005
|
|||||||||
|
BRIDGESIDE POINT OFFICE BLDG
Pittsburg, PA
|
16,632
|
|
1,525
|
|
28,609
|
|
—
|
|
—
|
|
1,525
|
|
28,609
|
|
30,134
|
|
7,092
|
|
2006
|
|||||||||
|
COMMONS DRIVE
Aurora, IL
|
3,663
|
|
1,600
|
|
5,746
|
|
—
|
|
2,798
|
|
1,600
|
|
8,544
|
|
10,144
|
|
1,622
|
|
2007
|
|||||||||
|
CRYSTAL LAKE MEDICAL
Crystal Lake, IL
|
—
|
|
2,343
|
|
5,972
|
|
—
|
|
465
|
|
2,343
|
|
6,437
|
|
8,780
|
|
600
|
|
2010
|
|||||||||
|
DAKOTA RIDGE MEDICAL
Littleton, CO
|
—
|
|
1,873
|
|
5,406
|
|
—
|
|
—
|
|
1,873
|
|
5,407
|
|
7,280
|
|
711
|
|
2010
|
|||||||||
|
DENVER HIGHLANDS
Highlands Ranch, CO
|
9,788
|
|
1,700
|
|
11,839
|
|
—
|
|
—
|
|
1,700
|
|
11,839
|
|
13,539
|
|
2,568
|
|
2006
|
|||||||||
|
DULLES EXECUTIVE PLAZA
Herndon, VA
|
68,750
|
|
15,500
|
|
96,083
|
|
—
|
|
3,140
|
|
15,500
|
|
99,223
|
|
114,723
|
|
24,158
|
|
2006
|
|||||||||
|
HOUSTON LAKES
Houston, TX
|
8,988
|
|
3,000
|
|
12,950
|
|
—
|
|
642
|
|
3,000
|
|
13,592
|
|
16,592
|
|
2,926
|
|
2006
|
|||||||||
157
INLAND AMERICAN REAL ESTATE TRUST, INC.
(A Maryland Corporation)
Schedule III
Real Estate and Accumulated Depreciation
(Dollar amounts in thousands)
December 31, 2012
|
|
|
Initial Cost (A)
|
|
|
Gross amount at which carried at end of period
|
|||||||||||||||||||||||
|
|
Encumbrance
|
Land
|
Buildings and
Improvements
|
Adjustments
to Land
Basis
(C)
|
Adjustments
to Basis (C)
|
Land and
Improvements
|
Buildings and
Improvements
(D)
|
Total (D,E)
|
Accumulated
Depreciation
(D,F)
|
Date of
Completion of
Construction or
Acquisition
|
||||||||||||||||||
|
IDS CENTER
Minneapolis, MN
|
147,999
|
|
24,900
|
|
202,016
|
|
—
|
|
22,313
|
|
24,900
|
|
224,329
|
|
249,229
|
|
50,381
|
|
2007
|
|||||||||
|
KINROSS LAKES
Richfield, OH
|
10,065
|
|
825
|
|
14,639
|
|
(468
|
)
|
(11,368
|
)
|
357
|
|
3,271
|
|
3,628
|
|
—
|
|
2005
|
|||||||||
|
MCP ONE
Indianapolis, IN
|
—
|
|
451
|
|
2,861
|
|
—
|
|
1,349
|
|
451
|
|
4,210
|
|
4,660
|
|
563
|
|
2009
|
|||||||||
|
MCP TWO
Indianapolis, IN
|
12,150
|
|
1,990
|
|
9,820
|
|
—
|
|
77
|
|
1,990
|
|
9,897
|
|
11,887
|
|
2,170
|
|
2009
|
|||||||||
|
MCP THREE
Indianapolis, IN
|
11,400
|
|
2,251
|
|
7,178
|
|
—
|
|
505
|
|
2,251
|
|
7,683
|
|
9,933
|
|
932
|
|
2010
|
|||||||||
|
MIDLOTHIAN MEDICAL
Midlothian, VA
|
8,297
|
|
—
|
|
9,041
|
|
—
|
|
113
|
|
—
|
|
9,153
|
|
9,153
|
|
1,456
|
|
2009
|
|||||||||
|
REGIONAL ROAD
Greensboro, NC
|
8,679
|
|
950
|
|
10,501
|
|
—
|
|
122
|
|
950
|
|
10,623
|
|
11,573
|
|
2,389
|
|
2006
|
|||||||||
|
SANOFI AVENTIS
Bridgewater, NJ
|
190,000
|
|
16,900
|
|
192,987
|
|
—
|
|
2,621
|
|
16,900
|
|
195,608
|
|
212,508
|
|
26,899
|
|
2009
|
|||||||||
|
SANTEE—CIVIC CENTER
Santee, CA
|
12,023
|
|
—
|
|
17,838
|
|
—
|
|
422
|
|
—
|
|
18,260
|
|
18,260
|
|
3,917
|
|
2005
|
|||||||||
|
SUNTRUST OFFICE I FL
Bushnell, FL
|
578
|
|
315
|
|
363
|
|
—
|
|
(1
|
)
|
315
|
|
363
|
|
678
|
|
68
|
|
2007
|
|||||||||
|
SUNTRUST OFFICE I FL
Melbourne, FL
|
1,046
|
|
1,260
|
|
662
|
|
—
|
|
(1
|
)
|
1,260
|
|
661
|
|
1,921
|
|
123
|
|
2007
|
|||||||||
158
INLAND AMERICAN REAL ESTATE TRUST, INC.
(A Maryland Corporation)
Schedule III
Real Estate and Accumulated Depreciation
(Dollar amounts in thousands)
December 31, 2012
|
|
|
Initial Cost (A)
|
|
|
Gross amount at which carried at end of period
|
|||||||||||||||||||||||
|
|
Encumbrance
|
Land
|
Buildings and
Improvements
|
Adjustments
to Land
Basis
(C)
|
Adjustments
to Basis (C)
|
Land and
Improvements
|
Buildings and
Improvements
(D)
|
Total (D,E)
|
Accumulated
Depreciation
(D,F)
|
Date of
Completion of
Construction or
Acquisition
|
||||||||||||||||||
|
SUNTRUST OFFICE I GA
Douglas, GA
|
495
|
|
275
|
|
675
|
|
—
|
|
—
|
|
275
|
|
675
|
|
950
|
|
126
|
|
2007
|
|||||||||
|
SUNTRUST OFFICE I MD
Bethesda, MD
|
2,651
|
|
650
|
|
4,617
|
|
—
|
|
(2
|
)
|
650
|
|
4,614
|
|
5,264
|
|
860
|
|
2007
|
|||||||||
|
SUNTRUST OFFICE I NC
Winston-Salem, NC
|
—
|
|
400
|
|
1,471
|
|
—
|
|
(1
|
)
|
400
|
|
1,470
|
|
1,870
|
|
274
|
|
2007
|
|||||||||
|
SUNTRUST OFFICE I NC
Raleigh, NC
|
1,098
|
|
500
|
|
1,700
|
|
—
|
|
(1
|
)
|
500
|
|
1,699
|
|
2,199
|
|
317
|
|
2007
|
|||||||||
|
SUNTRUST OFFICE I VA
Richmond, VA
|
3,826
|
|
1,360
|
|
6,272
|
|
—
|
|
(3
|
)
|
1,360
|
|
6,269
|
|
7,629
|
|
1,168
|
|
2007
|
|||||||||
|
SUNTRUST II OFFICE GEORGIA
Atlanta, GA
|
—
|
|
2,625
|
|
4,355
|
|
—
|
|
(3
|
)
|
2,625
|
|
4,352
|
|
6,977
|
|
798
|
|
2008
|
|||||||||
|
SUNTRUST III OFFICE FLORIDA
Gainesville, FL
|
1,350
|
|
1,667
|
|
457
|
|
—
|
|
—
|
|
1,667
|
|
457
|
|
2,124
|
|
80
|
|
2008
|
|||||||||
|
SUNTRUST III OFFICE FLORIDA
Holy Hill, FL
|
754
|
|
1,058
|
|
290
|
|
—
|
|
—
|
|
1,058
|
|
290
|
|
1,348
|
|
51
|
|
2008
|
|||||||||
|
SUNTRUST III OFFICE GEORGIA
Brunswick, GA
|
1,313
|
|
676
|
|
1,703
|
|
—
|
|
—
|
|
676
|
|
1,703
|
|
2,379
|
|
297
|
|
2008
|
|||||||||
159
INLAND AMERICAN REAL ESTATE TRUST, INC.
(A Maryland Corporation)
Schedule III
Real Estate and Accumulated Depreciation
(Dollar amounts in thousands)
December 31, 2012
|
|
|
Initial Cost (A)
|
|
|
Gross amount at which carried at end of period
|
|||||||||||||||||||||||
|
|
Encumbrance
|
Land
|
Buildings and
Improvements
|
Adjustments
to Land
Basis
(C)
|
Adjustments
to Basis (C)
|
Land and
Improvements
|
Buildings and
Improvements
(D)
|
Total (D,E)
|
Accumulated
Depreciation
(D,F)
|
Date of
Completion of
Construction or
Acquisition
|
||||||||||||||||||
|
SUNTRUST III OFFICE GEORGIA
Gainesville, GA
|
1,782
|
|
799
|
|
2,016
|
|
—
|
|
—
|
|
799
|
|
2,016
|
|
2,815
|
|
351
|
|
2008
|
|||||||||
|
UNITED HEALTH—CYPRESS
Cypress, CA
|
22,000
|
|
10,000
|
|
30,547
|
|
—
|
|
2
|
|
10,000
|
|
30,549
|
|
40,549
|
|
4,480
|
|
2008
|
|||||||||
|
UNITED HEALTH—FREDERICK
Frederick, MD
|
17,173
|
|
5,100
|
|
26,303
|
|
—
|
|
2
|
|
5,100
|
|
26,305
|
|
31,405
|
|
3,683
|
|
2008
|
|||||||||
|
UNITED HEALTH—GREEN BAY
Green Bay, WI
|
27,870
|
|
4,250
|
|
45,725
|
|
—
|
|
23
|
|
4,250
|
|
45,748
|
|
49,998
|
|
6,404
|
|
2008
|
|||||||||
|
UNITED HEALTH—INDIANAPOLIS
Indianapolis, IN
|
16,545
|
|
3,500
|
|
24,248
|
|
—
|
|
2
|
|
3,500
|
|
24,250
|
|
27,750
|
|
3,395
|
|
2008
|
|||||||||
|
UNITED HEALTH—ONALASKA
Onalaska, WI
|
4,149
|
|
4,090
|
|
2,794
|
|
—
|
|
2
|
|
4,090
|
|
2,796
|
|
6,886
|
|
410
|
|
2008
|
|||||||||
|
UNITED HEALTH—WAUWATOSA
Wauwatosa, WI
|
10,050
|
|
1,800
|
|
14,930
|
|
—
|
|
2
|
|
1,800
|
|
14,932
|
|
16,732
|
|
2,090
|
|
2006
|
|||||||||
|
WASHINGTON MUTUAL—ARLINGTON
Arlington, TX
|
20,115
|
|
4,870
|
|
30,915
|
|
—
|
|
5
|
|
4,870
|
|
30,920
|
|
35,790
|
|
6,990
|
|
2007
|
|||||||||
160
INLAND AMERICAN REAL ESTATE TRUST, INC.
(A Maryland Corporation)
Schedule III
Real Estate and Accumulated Depreciation
(Dollar amounts in thousands)
December 31, 2012
|
|
|
Initial Cost (A)
|
|
|
Gross amount at which carried at end of period
|
|||||||||||||||||||||||
|
|
Encumbrance
|
Land
|
Buildings and
Improvements
|
Adjustments
to Land
Basis
(C)
|
Adjustments
to Basis (C)
|
Land and
Improvements
|
Buildings and
Improvements
(D)
|
Total (D,E)
|
Accumulated
Depreciation
(D,F)
|
Date of
Completion of
Construction or
Acquisition
|
||||||||||||||||||
|
WORLDGATE PLAZA
Herndon, VA
|
59,950
|
|
14,000
|
|
79,048
|
|
—
|
|
3,762
|
|
14,000
|
|
82,809
|
|
96,809
|
|
16,995
|
|
2007
|
|||||||||
|
Apartment
|
||||||||||||||||||||||||||||
|
14th STREET—UAB
Birmingham, AL
|
11,770
|
|
4,250
|
|
27,458
|
|
—
|
|
—
|
|
4,250
|
|
27,458
|
|
31,708
|
|
5,586
|
|
2007
|
|||||||||
|
ASU POLYTECHNIC STUDENT HOUSING
Mesa, AZ
|
6,547
|
|
—
|
|
12,122
|
|
—
|
|
—
|
|
—
|
|
12,122
|
|
12,122
|
|
202
|
|
2012
|
|||||||||
|
BLOCK 121
Birmingham, AL
|
15,465
|
|
3,360
|
|
32,087
|
|
(150
|
)
|
2,444
|
|
3,210
|
|
34,531
|
|
37,741
|
|
2,759
|
|
2010
|
|||||||||
|
BRAZOS RANCH APARTMENTS
Rosenberg, TX
|
15,246
|
|
4,000
|
|
22,246
|
|
—
|
|
18
|
|
4,000
|
|
22,264
|
|
26,264
|
|
3,373
|
|
2009
|
|||||||||
|
ENCINO CANYON APARTMENTS
San Antonio, TX
|
12,000
|
|
1,700
|
|
16,443
|
|
—
|
|
—
|
|
1,700
|
|
16,443
|
|
18,143
|
|
3,372
|
|
2007
|
|||||||||
|
FIELDS APARTMENT HOMES
Bloomington, IN
|
18,700
|
|
1,850
|
|
29,783
|
|
—
|
|
26
|
|
1,850
|
|
29,809
|
|
31,659
|
|
6,438
|
|
2007
|
|||||||||
|
GROGANS LANDING APARTMENTS
The Woodlands, TX
|
9,705
|
|
4,380
|
|
10,533
|
|
—
|
|
1,930
|
|
4,380
|
|
12,463
|
|
16,843
|
|
1,994
|
|
2009
|
|||||||||
161
INLAND AMERICAN REAL ESTATE TRUST, INC.
(A Maryland Corporation)
Schedule III
Real Estate and Accumulated Depreciation
(Dollar amounts in thousands)
December 31, 2012
|
|
|
Initial Cost (A)
|
|
|
Gross amount at which carried at end of period
|
|||||||||||||||||||||||
|
|
Encumbrance
|
Land
|
Buildings and
Improvements
|
Adjustments
to Land
Basis
(C)
|
Adjustments
to Basis (C)
|
Land and
Improvements
|
Buildings and
Improvements
(D)
|
Total (D,E)
|
Accumulated
Depreciation
(D,F)
|
Date of
Completion of
Construction or
Acquisition
|
||||||||||||||||||
|
LEGACY AT ART QUARTER
Oklahoma City, OK
|
28,948
|
|
1,290
|
|
35,031
|
|
—
|
|
199
|
|
1,290
|
|
35,229
|
|
36,519
|
|
5,524
|
|
2008
|
|||||||||
|
LEGACY CORNER
Midwest City, OK
|
14,630
|
|
1,600
|
|
23,765
|
|
—
|
|
9
|
|
1,600
|
|
23,774
|
|
25,374
|
|
3,740
|
|
2008
|
|||||||||
|
LEGACY CROSSING
Oklahoma City, OK
|
24,400
|
|
1,110
|
|
29,297
|
|
—
|
|
120
|
|
1,110
|
|
29,417
|
|
30,527
|
|
4,573
|
|
2008
|
|||||||||
|
LEGACY WOODS
Edmond, OK
|
21,190
|
|
2,500
|
|
31,505
|
|
—
|
|
36
|
|
2,500
|
|
31,541
|
|
34,041
|
|
4,965
|
|
2007
|
|||||||||
|
NANTUCKET APARTMENTS
Loveland, OH
|
26,251
|
|
2,170
|
|
30,388
|
|
—
|
|
182
|
|
2,170
|
|
30,570
|
|
32,740
|
|
2,776
|
|
2010
|
|||||||||
|
OAK PARK
Dallas, TX
|
27,193
|
|
9,738
|
|
39,958
|
|
(14
|
)
|
(924
|
)
|
9,724
|
|
39,033
|
|
48,757
|
|
737
|
|
2009
|
|||||||||
|
OAK PARK II
Dallas, TX
|
2,255
|
|
8,499
|
|
—
|
|
(4,056
|
)
|
—
|
|
4,443
|
|
—
|
|
4,443
|
|
—
|
|
2011
|
|||||||||
|
OAK PARK TRS
Dallas, TX
|
3,893
|
|
19,030
|
|
—
|
|
(9,072
|
)
|
—
|
|
9,957
|
|
—
|
|
9,957
|
|
—
|
|
2011
|
|||||||||
|
PARKSIDE APARTMENTS
The Woodlands, TX
|
18,000
|
|
5,500
|
|
15,623
|
|
—
|
|
50
|
|
5,500
|
|
15,673
|
|
21,173
|
|
1,990
|
|
2009
|
|||||||||
|
SEVEN PALMS APARTMENTS
Webster, TX
|
18,750
|
|
3,550
|
|
24,348
|
|
—
|
|
176
|
|
3,550
|
|
24,524
|
|
28,074
|
|
4,954
|
|
2006
|
|||||||||
|
SOUTHGATE APARTMENTS
Louisville, KY
|
10,725
|
|
1,730
|
|
16,356
|
|
—
|
|
20
|
|
1,730
|
|
16,376
|
|
18,106
|
|
4,091
|
|
2007
|
|||||||||
|
STERLING RIDGE ESTATES
The Woodlands, TX
|
14,324
|
|
4,140
|
|
20,550
|
|
—
|
|
(8
|
)
|
4,140
|
|
20,542
|
|
24,682
|
|
2,707
|
|
2009
|
|||||||||
162
INLAND AMERICAN REAL ESTATE TRUST, INC.
(A Maryland Corporation)
Schedule III
Real Estate and Accumulated Depreciation
(Dollar amounts in thousands)
December 31, 2012
|
|
|
Initial Cost (A)
|
|
|
Gross amount at which carried at end of period
|
|||||||||||||||||||||||
|
|
Encumbrance
|
Land
|
Buildings and
Improvements
|
Adjustments
to Land
Basis
(C)
|
Adjustments
to Basis (C)
|
Land and
Improvements
|
Buildings and
Improvements
(D)
|
Total (D,E)
|
Accumulated
Depreciation
(D,F)
|
Date of
Completion of
Construction or
Acquisition
|
||||||||||||||||||
|
THE RADIAN (PENN)
Radian, PA
|
57,353
|
|
—
|
|
79,997
|
|
—
|
|
11,943
|
|
—
|
|
91,939
|
|
91,939
|
|
14,548
|
|
2007
|
|||||||||
|
UNIV HOUSE AT CENTRAL FL
Orlando, FL
|
44,224
|
|
13,319
|
|
51,478
|
|
—
|
|
—
|
|
13,319
|
|
51,478
|
|
64,797
|
|
868
|
|
2012
|
|||||||||
|
UNIV HOUSE AT GAINESVILLE
Gainesville, FL
|
15,827
|
|
6,561
|
|
36,879
|
|
—
|
|
902
|
|
6,561
|
|
37,781
|
|
44,342
|
|
6,690
|
|
2007
|
|||||||||
|
UNIV HOUSE AT HUNTSVILLE
Huntsville, TX
|
13,325
|
|
1,351
|
|
26,308
|
|
—
|
|
1,250
|
|
1,351
|
|
27,559
|
|
28,909
|
|
5,456
|
|
2007
|
|||||||||
|
UNIV HOUSE AT LAFAYETTE
Lafayette, AL
|
9,306
|
|
—
|
|
16,357
|
|
—
|
|
1,742
|
|
—
|
|
18,099
|
|
18,099
|
|
3,547
|
|
2007
|
|||||||||
|
UNIV HOUSE AT THE RETREAT RALEIGH
Raleigh, NC
|
24,360
|
|
2,200
|
|
36,364
|
|
—
|
|
—
|
|
2,200
|
|
36,364
|
|
38,564
|
|
—
|
|
2012
|
|||||||||
|
UNIV HOUSE AT THE RETREAT TALLAHASSEE
Tallahassee, FL
|
32,227
|
|
4,075
|
|
48,636
|
|
—
|
|
—
|
|
4,075
|
|
48,636
|
|
52,711
|
|
—
|
|
2012
|
|||||||||
|
VILLAGES AT KITTY HAWK
Universal City, TX
|
11,550
|
|
2,070
|
|
17,397
|
|
—
|
|
94
|
|
2,070
|
|
17,490
|
|
19,560
|
|
3,727
|
|
2007
|
|||||||||
|
WOODRIDGE APARTMENTS The Woodlands, TX
|
12,721
|
|
3,680
|
|
11,235
|
|
—
|
|
37
|
|
3,680
|
|
11,272
|
|
14,952
|
|
1,405
|
|
2009
|
|||||||||
|
Industrial
|
||||||||||||||||||||||||||||
|
11500 MELROSE AVE -294 TOLLWAY
Franklin Park, IL
|
4,561
|
|
2,500
|
|
5,071
|
|
—
|
|
—
|
|
2,500
|
|
5,071
|
|
7,571
|
|
1,007
|
|
2006
|
|||||||||
163
INLAND AMERICAN REAL ESTATE TRUST, INC.
(A Maryland Corporation)
Schedule III
Real Estate and Accumulated Depreciation
(Dollar amounts in thousands)
December 31, 2012
|
|
|
Initial Cost (A)
|
|
|
Gross amount at which carried at end of period
|
|||||||||||||||||||||||
|
|
Encumbrance
|
Land
|
Buildings and
Improvements
|
Adjustments
to Land
Basis
(C)
|
Adjustments
to Basis (C)
|
Land and
Improvements
|
Buildings and
Improvements
(D)
|
Total (D,E)
|
Accumulated
Depreciation
(D,F)
|
Date of
Completion of
Construction or
Acquisition
|
||||||||||||||||||
|
1800 BRUNING
Itasca, IL
|
10,156
|
|
10,000
|
|
7,971
|
|
—
|
|
85
|
|
10,000
|
|
8,056
|
|
18,056
|
|
1,791
|
|
2006
|
|||||||||
|
500 HARTLAND
Hartland, WI
|
5,860
|
|
1,200
|
|
7,459
|
|
—
|
|
150
|
|
1,200
|
|
7,609
|
|
8,809
|
|
1,694
|
|
2006
|
|||||||||
|
55th STREET
Kenosha, WI
|
7,351
|
|
1,600
|
|
11,115
|
|
—
|
|
—
|
|
1,600
|
|
11,115
|
|
12,715
|
|
2,513
|
|
2007
|
|||||||||
164
INLAND AMERICAN REAL ESTATE TRUST, INC.
(A Maryland Corporation)
Schedule III
Real Estate and Accumulated Depreciation
(Dollar amounts in thousands)
December 31, 2012
|
|
|
Initial Cost (A)
|
|
|
Gross amount at which carried at end of period
|
|||||||||||||||||||||||
|
|
Encumbrance
|
Land
|
Buildings and
Improvements
|
Adjustments
to Land
Basis
(C)
|
Adjustments
to Basis (C)
|
Land and
Improvements
|
Buildings and
Improvements
(D)
|
Total (D,E)
|
Accumulated
Depreciation
(D,F)
|
Date of
Completion of
Construction or
Acquisition
|
||||||||||||||||||
|
ANHEUSER BUSCH
Devens, MA
|
7,546
|
|
2,200
|
|
13,598
|
|
—
|
|
—
|
|
2,200
|
|
13,598
|
|
15,798
|
|
2,538
|
|
2007
|
|||||||||
|
ATLAS—BELVIDERE
Belvidere, IL
|
11,329
|
|
1,600
|
|
15,521
|
|
—
|
|
—
|
|
1,600
|
|
15,521
|
|
17,121
|
|
2,858
|
|
2007
|
|||||||||
|
ATLAS—CARTERSVILLE
Cartersville, GA
|
8,273
|
|
900
|
|
13,112
|
|
—
|
|
(39
|
)
|
900
|
|
13,073
|
|
13,973
|
|
2,403
|
|
2007
|
|||||||||
|
ATLAS—DOUGLAS
Douglas, GA
|
3,432
|
|
75
|
|
6,681
|
|
—
|
|
—
|
|
75
|
|
6,681
|
|
6,756
|
|
1,228
|
|
2007
|
|||||||||
|
ATLAS—GAFFNEY
Gaffney, SC
|
3,350
|
|
950
|
|
5,114
|
|
—
|
|
—
|
|
950
|
|
5,114
|
|
6,064
|
|
940
|
|
2007
|
|||||||||
|
ATLAS—GAINESVILLE
Gainesville, GA
|
7,731
|
|
550
|
|
12,783
|
|
—
|
|
—
|
|
550
|
|
12,783
|
|
13,333
|
|
2,349
|
|
2007
|
|||||||||
|
ATLAS—PENDERGRASS
Pendergrass, GA
|
14,919
|
|
1,250
|
|
24,259
|
|
—
|
|
—
|
|
1,250
|
|
24,259
|
|
25,509
|
|
4,457
|
|
2007
|
|||||||||
165
INLAND AMERICAN REAL ESTATE TRUST, INC.
(A Maryland Corporation)
Schedule III
Real Estate and Accumulated Depreciation
(Dollar amounts in thousands)
December 31, 2012
|
|
|
Initial Cost (A)
|
|
|
Gross amount at which carried at end of period
|
|||||||||||||||||||||||
|
|
Encumbrance
|
Land
|
Buildings and
Improvements
|
Adjustments
to Land
Basis
(C)
|
Adjustments
to Basis (C)
|
Land and
Improvements
|
Buildings and
Improvements
(D)
|
Total (D,E)
|
Accumulated
Depreciation
(D,F)
|
Date of
Completion of
Construction or
Acquisition
|
||||||||||||||||||
|
ATLAS—PIEDMONT
Piedmont, SC
|
13,563
|
|
400
|
|
23,113
|
|
—
|
|
7
|
|
400
|
|
23,120
|
|
23,520
|
|
4,248
|
|
2007
|
|||||||||
|
ATLAS—ST PAUL
St. Paul, MN
|
8,226
|
|
3,890
|
|
10,093
|
|
—
|
|
—
|
|
3,890
|
|
10,093
|
|
13,983
|
|
1,855
|
|
2007
|
|||||||||
|
ATLAS-BROOKLYN PARK
Brooklyn Park, MN
|
7,407
|
|
2,640
|
|
8,934
|
|
—
|
|
—
|
|
2,640
|
|
8,934
|
|
11,574
|
|
1,642
|
|
2007
|
|||||||||
|
ATLAS-NEW ULM
New Ulm, MN
|
6,015
|
|
900
|
|
9,359
|
|
—
|
|
—
|
|
900
|
|
9,359
|
|
10,259
|
|
1,723
|
|
2007
|
|||||||||
|
ATLAS-ZUMBROTA
Zumbrota, MN
|
10,242
|
|
1,300
|
|
16,437
|
|
—
|
|
—
|
|
1,300
|
|
16,437
|
|
17,737
|
|
3,020
|
|
2006
|
|||||||||
|
BAYMEADOW—GLEN BURNIE
Glen Burnie, MD
|
13,824
|
|
1,225
|
|
23,407
|
|
—
|
|
24
|
|
1,225
|
|
23,431
|
|
24,656
|
|
4,988
|
|
2006
|
|||||||||
|
C&S—ABERDEEN
Aberdeen, MD
|
22,720
|
|
4,650
|
|
33,276
|
|
(10
|
)
|
13
|
|
4,640
|
|
33,289
|
|
37,929
|
|
6,990
|
|
2006
|
|||||||||
|
C&S—BIRMINGHAM
Birmingham, AL
|
25,032
|
|
3,400
|
|
40,373
|
|
—
|
|
—
|
|
3,400
|
|
40,373
|
|
43,773
|
|
6,358
|
|
2008
|
|||||||||
|
C&S—NORTH HATFIELD
Hatfield, MA
|
20,280
|
|
4,800
|
|
30,103
|
|
—
|
|
14
|
|
4,800
|
|
30,117
|
|
34,917
|
|
6,324
|
|
2006
|
|||||||||
|
C&S—SOUTH HATFIELD
Hatfield, MA
|
10,000
|
|
2,500
|
|
15,251
|
|
—
|
|
11
|
|
2,500
|
|
15,262
|
|
17,762
|
|
3,205
|
|
2006
|
|||||||||
|
C&S—WESTFIELD
Westfield, MA
|
29,500
|
|
3,850
|
|
45,906
|
|
—
|
|
13
|
|
3,850
|
|
45,919
|
|
49,769
|
|
9,643
|
|
2006
|
|||||||||
|
CLARION
Clarion, IA
|
3,172
|
|
87
|
|
4,790
|
|
—
|
|
90
|
|
87
|
|
4,880
|
|
4,967
|
|
1,033
|
|
2007
|
|||||||||
166
INLAND AMERICAN REAL ESTATE TRUST, INC.
(A Maryland Corporation)
Schedule III
Real Estate and Accumulated Depreciation
(Dollar amounts in thousands)
December 31, 2012
|
|
|
Initial Cost (A)
|
|
|
Gross amount at which carried at end of period
|
|||||||||||||||||||||||
|
|
Encumbrance
|
Land
|
Buildings and
Improvements
|
Adjustments
to Land
Basis
(C)
|
Adjustments
to Basis (C)
|
Land and
Improvements
|
Buildings and
Improvements
(D)
|
Total (D,E)
|
Accumulated
Depreciation
(D,F)
|
Date of
Completion of
Construction or
Acquisition
|
||||||||||||||||||
|
COLOMA
Coloma, MI
|
10,017
|
|
410
|
|
17,110
|
|
—
|
|
772
|
|
410
|
|
17,882
|
|
18,292
|
|
3,317
|
|
2006
|
|||||||||
|
DEER PARK SEACO
Deer Park, TX
|
2,965
|
|
240
|
|
5,271
|
|
—
|
|
—
|
|
240
|
|
5,271
|
|
5,511
|
|
1,192
|
|
2007
|
|||||||||
|
DORAL—WAUKESHA
Waukesha, WI
|
1,364
|
|
240
|
|
2,013
|
|
—
|
|
76
|
|
240
|
|
2,089
|
|
2,329
|
|
456
|
|
2006
|
|||||||||
|
HASKELL-ROLLING PLAINS FACILITY
Haskell, TX
|
—
|
|
45
|
|
19,733
|
|
—
|
|
—
|
|
45
|
|
19,733
|
|
19,778
|
|
3,601
|
|
2008
|
|||||||||
|
HOME DEPOT—LAKE PARK
Valdosta, GA
|
15,469
|
|
1,350
|
|
24,770
|
|
—
|
|
4
|
|
1,350
|
|
24,774
|
|
26,124
|
|
3,468
|
|
2008
|
|||||||||
|
HOME DEPOT—MACALLA
MaCalla, AL
|
17,094
|
|
2,800
|
|
26,067
|
|
—
|
|
4
|
|
2,800
|
|
26,071
|
|
28,871
|
|
3,655
|
|
2008
|
|||||||||
167
INLAND AMERICAN REAL ESTATE TRUST, INC.
(A Maryland Corporation)
Schedule III
Real Estate and Accumulated Depreciation
(Dollar amounts in thousands)
December 31, 2012
|
|
|
Initial Cost (A)
|
|
|
Gross amount at which carried at end of period
|
|||||||||||||||||||||||
|
|
Encumbrance
|
Land
|
Buildings and
Improvements
|
Adjustments
to Land
Basis
(C)
|
Adjustments
to Basis (C)
|
Land and
Improvements
|
Buildings and
Improvements
(D)
|
Total (D,E)
|
Accumulated
Depreciation
(D,F)
|
Date of
Completion of
Construction or
Acquisition
|
||||||||||||||||||
|
HUDSON CORRECTIONAL FACILITY
Hudson, CO
|
—
|
|
1,382
|
|
—
|
|
—
|
|
93,137
|
|
1,382
|
|
93,137
|
|
94,520
|
|
12,713
|
|
2009
|
|||||||||
|
IMAGINE AVONDALE
Avondale, AZ
|
—
|
|
1,195
|
|
5,731
|
|
—
|
|
—
|
|
1,195
|
|
5,731
|
|
6,926
|
|
621
|
|
2010
|
|||||||||
|
IMAGINE COOLIDGE
Coolidge, AZ
|
—
|
|
2,260
|
|
3,895
|
|
(1,490
|
)
|
1,017
|
|
770
|
|
4,913
|
|
5,683
|
|
483
|
|
2010
|
|||||||||
|
IMAGINE COOLIDGE
II Coolidge, AZ
|
—
|
|
1,490
|
|
4,857
|
|
—
|
|
1,025
|
|
1,490
|
|
5,882
|
|
7,372
|
|
229
|
|
2011
|
|||||||||
|
IMAGINE DISCOVERY
Baltimore, MD
|
—
|
|
590
|
|
7,117
|
|
—
|
|
—
|
|
590
|
|
7,117
|
|
7,707
|
|
769
|
|
2010
|
|||||||||
|
IMAGINE FIRESTONE
Firestone, CO
|
—
|
|
680
|
|
6,439
|
|
—
|
|
—
|
|
680
|
|
6,439
|
|
7,119
|
|
697
|
|
2010
|
|||||||||
|
IMAGINE HOPE LAMOND
Washington, DC
|
—
|
|
775
|
|
9,706
|
|
—
|
|
—
|
|
775
|
|
9,706
|
|
10,481
|
|
1,047
|
|
2010
|
|||||||||
|
IMAGINE INDIGO RANCH
Colorado Springs, CO
|
—
|
|
1,150
|
|
7,304
|
|
—
|
|
—
|
|
1,150
|
|
7,304
|
|
8,454
|
|
790
|
|
2010
|
|||||||||
|
IMAGINE TOWN CENTER
Palm Coast, FL
|
—
|
|
1,175
|
|
7,309
|
|
—
|
|
2,606
|
|
1,175
|
|
9,915
|
|
11,090
|
|
879
|
|
2010
|
|||||||||
|
INDUSTRIAL DRIVE
Horican, WI
|
3,709
|
|
200
|
|
6,812
|
|
—
|
|
—
|
|
200
|
|
6,812
|
|
7,012
|
|
1,470
|
|
2007
|
|||||||||
|
KATO/MILMONT
Fremont, CA
|
—
|
|
2,340
|
|
5,460
|
|
—
|
|
3
|
|
2,340
|
|
5,463
|
|
7,803
|
|
182
|
|
2011
|
|||||||||
168
INLAND AMERICAN REAL ESTATE TRUST, INC.
(A Maryland Corporation)
Schedule III
Real Estate and Accumulated Depreciation
(Dollar amounts in thousands)
December 31, 2012
|
|
|
Initial Cost (A)
|
|
|
Gross amount at which carried at end of period
|
|||||||||||||||||||||||
|
|
Encumbrance
|
Land
|
Buildings and
Improvements
|
Adjustments
to Land
Basis
(C)
|
Adjustments
to Basis (C)
|
Land and
Improvements
|
Buildings and
Improvements
(D)
|
Total (D,E)
|
Accumulated
Depreciation
(D,F)
|
Date of
Completion of
Construction or
Acquisition
|
||||||||||||||||||
|
KINSTON
Kinston, NC
|
8,930
|
|
460
|
|
14,837
|
|
—
|
|
250
|
|
460
|
|
15,087
|
|
15,547
|
|
2,899
|
|
2006
|
|||||||||
|
KIRK ROAD
St. Charles, IL
|
7,863
|
|
2,200
|
|
11,413
|
|
—
|
|
42
|
|
2,200
|
|
11,455
|
|
13,655
|
|
2,588
|
|
2007
|
|||||||||
|
LIBERTYVILLE ASSOCIATES
Libertyville, IL
|
14,807
|
|
3,600
|
|
20,563
|
|
—
|
|
9
|
|
3,600
|
|
20,571
|
|
24,171
|
|
4,258
|
|
2005
|
|||||||||
|
MOUNT ZION ROAD
Lebanon, IN
|
24,632
|
|
2,570
|
|
41,667
|
|
—
|
|
—
|
|
2,570
|
|
41,667
|
|
44,237
|
|
8,627
|
|
2007
|
|||||||||
|
NORTH POINTE ONE
Hanahan, SC
|
—
|
|
1,963
|
|
14,588
|
|
—
|
|
587
|
|
1,963
|
|
15,175
|
|
17,138
|
|
1,563
|
|
2011
|
|||||||||
|
NORTH POINTE PARK
Hanahan, SC
|
—
|
|
2,350
|
|
—
|
|
—
|
|
—
|
|
2,350
|
|
—
|
|
2,350
|
|
—
|
|
2011
|
|||||||||
|
OTTAWA
Ottawa, IL
|
1,768
|
|
200
|
|
2,905
|
|
—
|
|
—
|
|
200
|
|
2,905
|
|
3,105
|
|
639
|
|
2007
|
|||||||||
|
SCHNEIDER ELECTRIC
Loves Park, IL
|
11,000
|
|
2,150
|
|
14,720
|
|
(581
|
)
|
(6,935
|
)
|
1,569
|
|
7,785
|
|
9,353
|
|
—
|
|
2007
|
|||||||||
169
INLAND AMERICAN REAL ESTATE TRUST, INC.
(A Maryland Corporation)
Schedule III
Real Estate and Accumulated Depreciation
(Dollar amounts in thousands)
December 31, 2012
|
|
|
Initial Cost (A)
|
|
|
Gross amount at which carried at end of period
|
|||||||||||||||||||||||
|
|
Encumbrance
|
Land
|
Buildings and
Improvements
|
Adjustments
to Land
Basis
(C)
|
Adjustments
to Basis (C)
|
Land and
Improvements
|
Buildings and
Improvements
(D)
|
Total (D,E)
|
Accumulated
Depreciation
(D,F)
|
Date of
Completion of
Construction or
Acquisition
|
||||||||||||||||||
|
THERMO PROCESS SYSTEMS
Sugar Land, TX
|
7,071
|
|
1,202
|
|
11,995
|
|
—
|
|
—
|
|
1,202
|
|
11,995
|
|
13,197
|
|
3,041
|
|
2007
|
|||||||||
|
TRI-STATE HOLDINGS I
Wood Dale, IL
|
4,665
|
|
4,700
|
|
3,973
|
|
—
|
|
—
|
|
4,700
|
|
3,973
|
|
8,673
|
|
862
|
|
2007
|
|||||||||
|
TRI-STATE HOLDINGS II
Houston, TX
|
6,372
|
|
1,630
|
|
11,252
|
|
—
|
|
—
|
|
1,630
|
|
11,252
|
|
12,882
|
|
2,330
|
|
2007
|
|||||||||
|
TRI-STATE HOLDINGS III
Mosinee, WI
|
4,334
|
|
650
|
|
8,083
|
|
—
|
|
—
|
|
650
|
|
8,083
|
|
8,733
|
|
1,674
|
|
2007
|
|||||||||
|
UPS E-LOGISTICS
Elizabethtown, KY
|
9,246
|
|
950
|
|
18,453
|
|
—
|
|
—
|
|
950
|
|
18,453
|
|
19,403
|
|
3,444
|
|
2006
|
|||||||||
170
INLAND AMERICAN REAL ESTATE TRUST, INC.
(A Maryland Corporation)
Schedule III
Real Estate and Accumulated Depreciation
(Dollar amounts in thousands)
December 31, 2012
|
|
|
Initial Cost (A)
|
|
|
Gross amount at which carried at end of period
|
|||||||||||||||||||||||
|
|
Encumbrance
|
Land
|
Buildings and
Improvements
|
Adjustments
to Land
Basis
(C)
|
Adjustments
to Basis (C)
|
Land and
Improvements
|
Buildings and
Improvements
(D)
|
Total (D,E)
|
Accumulated
Depreciation
(D,F)
|
Date of
Completion of
Construction or
Acquisition
|
||||||||||||||||||
|
WESTPORT—MECHANICSBURG
Mechanicsburg, PA
|
4,029
|
|
1,300
|
|
6,185
|
|
—
|
|
486
|
|
1,300
|
|
6,671
|
|
7,971
|
|
1,464
|
|
2006
|
|||||||||
|
Hotel
|
||||||||||||||||||||||||||||
|
ALOFT CHAPEL HILL
Chapel Hill, NC
|
—
|
|
6,484
|
|
16,478
|
|
45
|
|
(45
|
)
|
6,529
|
|
16,434
|
|
22,963
|
|
2,299
|
|
2010
|
|||||||||
|
BOHEMIAN HOTEL SAVANNA
Savanna, GA
|
27,480
|
|
2,300
|
|
24,240
|
|
—
|
|
—
|
|
2,300
|
|
24,240
|
|
26,540
|
|
529
|
|
2012
|
|||||||||
|
COURTYARD BY MARRIOTT QUORUM
Addison, TX
|
18,860
|
|
4,000
|
|
26,141
|
|
—
|
|
2,104
|
|
4,000
|
|
28,245
|
|
32,245
|
|
6,955
|
|
2007
|
|||||||||
|
COURTYARD BY MARRIOTT
Ann Arbor, MI
|
11,846
|
|
4,989
|
|
18,988
|
|
—
|
|
4,175
|
|
4,989
|
|
23,163
|
|
28,153
|
|
6,361
|
|
2007
|
|||||||||
|
COURTYARD BY MARRIOTT DUNN LORING-FAIRFAX
Vienna, VA
|
30,810
|
|
12,100
|
|
40,242
|
|
—
|
|
3,050
|
|
12,100
|
|
43,292
|
|
55,392
|
|
12,077
|
|
2007
|
|||||||||
|
COURTYARD—DOWNTOWN AT UAB
Birmingham, AL
|
14,000
|
|
—
|
|
20,810
|
|
1,553
|
|
1,931
|
|
1,553
|
|
22,741
|
|
24,294
|
|
6,968
|
|
2008
|
|||||||||
|
COURTYARD—FORT MEADE AT NBP
Annapolis Junction, MD
|
14,400
|
|
1,611
|
|
22,622
|
|
—
|
|
2,021
|
|
1,611
|
|
24,643
|
|
26,254
|
|
6,798
|
|
2008
|
|||||||||
|
COURTYARD BY MARRIOTT -WEST LANDS END
Fort Worth, TX
|
7,550
|
|
1,500
|
|
13,416
|
|
—
|
|
1,080
|
|
1,500
|
|
14,495
|
|
15,995
|
|
3,962
|
|
2007
|
|||||||||
171
INLAND AMERICAN REAL ESTATE TRUST, INC.
(A Maryland Corporation)
Schedule III
Real Estate and Accumulated Depreciation
(Dollar amounts in thousands)
December 31, 2012
|
|
|
Initial Cost (A)
|
|
|
Gross amount at which carried at end of period
|
|||||||||||||||||||||||
|
|
Encumbrance
|
Land
|
Buildings and
Improvements
|
Adjustments
to Land
Basis
(C)
|
Adjustments
to Basis (C)
|
Land and
Improvements
|
Buildings and
Improvements
(D)
|
Total (D,E)
|
Accumulated
Depreciation
(D,F)
|
Date of
Completion of
Construction or
Acquisition
|
||||||||||||||||||
|
COURTYARD—FT WORTH
Fort Worth, TX
|
13,792
|
|
774
|
|
45,820
|
|
—
|
|
4,098
|
|
774
|
|
49,918
|
|
50,693
|
|
13,682
|
|
2008
|
|||||||||
|
COURTYARD BY MARRIOTT
Harlingen, TX
|
6,790
|
|
1,600
|
|
13,247
|
|
—
|
|
3,347
|
|
1,600
|
|
16,594
|
|
18,194
|
|
4,870
|
|
2007
|
|||||||||
|
COURTYARD BY MARRIOTT—NORTHWEST
Houston, TX
|
7,038
|
|
1,428
|
|
15,085
|
|
—
|
|
1,539
|
|
1,428
|
|
16,623
|
|
18,051
|
|
4,625
|
|
2007
|
|||||||||
|
COURTYARD BY MARRIOTT—WESTCHASE
Houston, TX
|
16,680
|
|
4,400
|
|
22,626
|
|
—
|
|
3,138
|
|
4,400
|
|
25,764
|
|
30,164
|
|
6,499
|
|
2007
|
|||||||||
|
COURTYARD BY MARRIOTT WEST UNIVERSITY
Houston, TX
|
10,980
|
|
2,200
|
|
16,408
|
|
—
|
|
1,777
|
|
2,200
|
|
18,185
|
|
20,385
|
|
4,739
|
|
2007
|
|||||||||
|
COURTYARD BY MARRIOTT—COUNTRY CLUB PLAZA
Kansas City, MO
|
12,740
|
|
3,426
|
|
16,349
|
|
—
|
|
862
|
|
3,426
|
|
17,211
|
|
20,637
|
|
4,449
|
|
2007
|
|||||||||
|
COURTYARD BY MARRIOTT
Lebanon, NJ
|
10,320
|
|
3,200
|
|
19,009
|
|
—
|
|
2,414
|
|
3,200
|
|
21,422
|
|
24,622
|
|
5,921
|
|
2007
|
|||||||||
|
COURTYARD—NEWARK ELIZABETH
Elizabeth, NJ
|
8,983
|
|
—
|
|
35,177
|
|
—
|
|
2,796
|
|
—
|
|
37,973
|
|
37,973
|
|
11,266
|
|
2008
|
|||||||||
172
INLAND AMERICAN REAL ESTATE TRUST, INC.
(A Maryland Corporation)
Schedule III
Real Estate and Accumulated Depreciation
(Dollar amounts in thousands)
December 31, 2012
|
|
|
Initial Cost (A)
|
|
|
Gross amount at which carried at end of period
|
|||||||||||||||||||||||
|
|
Encumbrance
|
Land
|
Buildings and
Improvements
|
Adjustments
to Land
Basis
(C)
|
Adjustments
to Basis (C)
|
Land and
Improvements
|
Buildings and
Improvements
(D)
|
Total (D,E)
|
Accumulated
Depreciation
(D,F)
|
Date of
Completion of
Construction or
Acquisition
|
||||||||||||||||||
|
COURTYARD—PITTSBURGH DOWNTOWN
Pittsburgh, PA
|
24,461
|
|
2,700
|
|
33,086
|
|
—
|
|
2,001
|
|
2,700
|
|
35,087
|
|
37,787
|
|
4,098
|
|
2010
|
|||||||||
|
COURTYARD—PITTSBURGH WEST HOME
Pittsburgh, PA
|
8,024
|
|
1,500
|
|
14,364
|
|
—
|
|
523
|
|
1,500
|
|
14,886
|
|
16,386
|
|
1,752
|
|
2010
|
|||||||||
|
COURTYARD—RICHMOND
Richmond, VA
|
11,800
|
|
2,173
|
|
—
|
|
—
|
|
19,640
|
|
2,173
|
|
19,640
|
|
21,813
|
|
5,658
|
|
2007
|
|||||||||
|
COURTYARD BY MARRIOTT—ROANOKE AIRPORT
Roanoke, VA
|
14,196
|
|
3,311
|
|
22,242
|
|
—
|
|
2,439
|
|
3,311
|
|
24,682
|
|
27,992
|
|
6,196
|
|
2007
|
|||||||||
|
COURTYARD BY MARRIOTT SEATTLE—FEDERAL WAY
Federal Way, WA
|
22,830
|
|
7,700
|
|
27,167
|
|
—
|
|
1,717
|
|
7,700
|
|
28,883
|
|
36,583
|
|
6,867
|
|
2007
|
|||||||||
|
COURTYARD BY MARRIOTT—WILLIAM CENTER
Tucson, AZ
|
16,030
|
|
4,000
|
|
20,942
|
|
—
|
|
3,261
|
|
4,000
|
|
24,202
|
|
28,202
|
|
6,655
|
|
2007
|
|||||||||
|
COURTYARD BY MARRIOTT
Wilmington, NC
|
—
|
|
2,397
|
|
18,560
|
|
—
|
|
3,483
|
|
2,397
|
|
22,043
|
|
24,440
|
|
5,747
|
|
2007
|
|||||||||
173
INLAND AMERICAN REAL ESTATE TRUST, INC.
(A Maryland Corporation)
Schedule III
Real Estate and Accumulated Depreciation
(Dollar amounts in thousands)
December 31, 2012
|
|
|
Initial Cost (A)
|
|
|
Gross amount at which carried at end of period
|
|||||||||||||||||||||||
|
|
Encumbrance
|
Land
|
Buildings and
Improvements
|
Adjustments
to Land
Basis
(C)
|
Adjustments
to Basis (C)
|
Land and
Improvements
|
Buildings and
Improvements
(D)
|
Total (D,E)
|
Accumulated
Depreciation
(D,F)
|
Date of
Completion of
Construction or
Acquisition
|
||||||||||||||||||
|
COURTYARD—WEST PALM AIRPORT
Palm Coast, FL
|
5,731
|
|
1,900
|
|
8,703
|
|
—
|
|
977
|
|
1,900
|
|
9,680
|
|
11,580
|
|
1,198
|
|
2010
|
|||||||||
|
DOUBLETREE—ATLANTA GALLERIA
Alpharetta, GA
|
6,116
|
|
1,082
|
|
20,397
|
|
—
|
|
1,983
|
|
1,082
|
|
22,380
|
|
23,462
|
|
6,839
|
|
2008
|
|||||||||
|
DOUBLETREE—WASHINGTON DC
Washington, DC
|
26,398
|
|
25,857
|
|
56,964
|
|
—
|
|
3,186
|
|
25,857
|
|
60,149
|
|
86,006
|
|
15,499
|
|
2008
|
|||||||||
|
EMBASSY SUITES—BALTIMORE
Hunt Valley, MD
|
12,661
|
|
2,429
|
|
38,927
|
|
—
|
|
4,765
|
|
2,429
|
|
43,693
|
|
46,122
|
|
13,454
|
|
2008
|
|||||||||
|
FAIRFIELD INN
Ann Arbor, MI
|
—
|
|
1,981
|
|
6,353
|
|
—
|
|
605
|
|
1,981
|
|
6,958
|
|
8,939
|
|
2,254
|
|
2007
|
|||||||||
|
FAIRMONT—DALLAS
Dallas, TX
|
42,324
|
|
8,700
|
|
60,634
|
|
—
|
|
5,813
|
|
8,700
|
|
66,447
|
|
75,147
|
|
5,198
|
|
2011
|
|||||||||
|
HAMPTON INN SUITES—DENVER
Colorado Springs, CO
|
14,000
|
|
6,144
|
|
26,472
|
|
—
|
|
2,076
|
|
6,144
|
|
28,548
|
|
34,692
|
|
8,055
|
|
2008
|
|||||||||
174
INLAND AMERICAN REAL ESTATE TRUST, INC.
(A Maryland Corporation)
Schedule III
Real Estate and Accumulated Depreciation
(Dollar amounts in thousands)
December 31, 2012
|
|
|
Initial Cost (A)
|
|
|
Gross amount at which carried at end of period
|
|||||||||||||||||||||||
|
|
Encumbrance
|
Land
|
Buildings and
Improvements
|
Adjustments
to Land
Basis
(C)
|
Adjustments
to Basis (C)
|
Land and
Improvements
|
Buildings and
Improvements
(D)
|
Total (D,E)
|
Accumulated
Depreciation
(D,F)
|
Date of
Completion of
Construction or
Acquisition
|
||||||||||||||||||
|
HAMPTON INN BALTIMORE-INNER HARBOR
Baltimore, MD
|
13,700
|
|
1,700
|
|
21,067
|
|
—
|
|
1,262
|
|
1,700
|
|
22,329
|
|
24,029
|
|
5,221
|
|
2007
|
|||||||||
|
HAMPTON INN SUITES DULUTH-GWINNETT
Duluth, GA
|
9,287
|
|
488
|
|
12,991
|
|
(90
|
)
|
(3,804
|
)
|
398
|
|
9,187
|
|
9,584
|
|
342
|
|
2007
|
|||||||||
|
HAMPTON INN WHITE PLAINS-TARRYTOWN
Elmsford, NY
|
15,157
|
|
3,200
|
|
26,160
|
|
—
|
|
5,668
|
|
3,200
|
|
31,828
|
|
35,028
|
|
7,673
|
|
2007
|
|||||||||
|
HAMPTON INN
Jacksonville, NC
|
—
|
|
2,753
|
|
3,782
|
|
(1,586
|
)
|
(1,913
|
)
|
1,167
|
|
1,869
|
|
3,036
|
|
17
|
|
2007
|
|||||||||
|
HGI—BOSTON BURLINGTON
Burlington, MA
|
5,871
|
|
4,095
|
|
25,556
|
|
—
|
|
4,021
|
|
4,095
|
|
29,576
|
|
33,671
|
|
7,922
|
|
2008
|
|||||||||
|
HGI—COLORADO SPRINGS
Colorado Springs, CO
|
—
|
|
1,400
|
|
17,522
|
|
—
|
|
2,445
|
|
1,400
|
|
19,967
|
|
21,367
|
|
5,254
|
|
2008
|
|||||||||
175
INLAND AMERICAN REAL ESTATE TRUST, INC.
(A Maryland Corporation)
Schedule III
Real Estate and Accumulated Depreciation
(Dollar amounts in thousands)
December 31, 2012
|
|
|
Initial Cost (A)
|
|
|
Gross amount at which carried at end of period
|
|||||||||||||||||||||||
|
|
Encumbrance
|
Land
|
Buildings and
Improvements
|
Adjustments
to Land
Basis
(C)
|
Adjustments
to Basis (C)
|
Land and
Improvements
|
Buildings and
Improvements
(D)
|
Total (D,E)
|
Accumulated
Depreciation
(D,F)
|
Date of
Completion of
Construction or
Acquisition
|
||||||||||||||||||
|
HGI—WASHINGTON DC
Washington, DC
|
58,381
|
|
18,800
|
|
64,359
|
|
—
|
|
4,973
|
|
18,800
|
|
69,332
|
|
88,132
|
|
19,201
|
|
2008
|
|||||||||
|
HILTON GARDEN INN TAMPA YBOR
Tampa, FL
|
9,460
|
|
2,400
|
|
16,159
|
|
—
|
|
2,068
|
|
2,400
|
|
18,227
|
|
20,627
|
|
4,437
|
|
2007
|
|||||||||
|
HILTON GARDEN INN ALBANY AIRPORT
Albany, NY
|
12,050
|
|
1,645
|
|
20,263
|
|
—
|
|
4,742
|
|
1,645
|
|
25,005
|
|
26,650
|
|
6,493
|
|
2007
|
|||||||||
|
HILTON GARDEN INN
Evanston, IL
|
19,309
|
|
2,920
|
|
27,995
|
|
—
|
|
3,319
|
|
2,920
|
|
31,314
|
|
34,234
|
|
7,223
|
|
2007
|
|||||||||
|
HILTON GARDEN INN RALEIGH -DURHAM
Raleigh, NC
|
7,719
|
|
2,754
|
|
26,050
|
|
—
|
|
4,598
|
|
2,754
|
|
30,648
|
|
33,402
|
|
7,516
|
|
2007
|
|||||||||
|
HILTON GARDEN INN
Westbury, NY
|
21,680
|
|
8,900
|
|
25,156
|
|
—
|
|
4,051
|
|
8,900
|
|
29,207
|
|
38,107
|
|
7,325
|
|
2007
|
|||||||||
|
HILTON GARDEN INN
Wilmington, NC
|
5,200
|
|
6,354
|
|
10,328
|
|
—
|
|
319
|
|
6,354
|
|
10,647
|
|
17,001
|
|
3,700
|
|
2007
|
|||||||||
176
INLAND AMERICAN REAL ESTATE TRUST, INC.
(A Maryland Corporation)
Schedule III
Real Estate and Accumulated Depreciation
(Dollar amounts in thousands)
December 31, 2012
|
|
|
Initial Cost (A)
|
|
|
Gross amount at which carried at end of period
|
|||||||||||||||||||||||
|
|
Encumbrance
|
Land
|
Buildings and
Improvements
|
Adjustments
to Land
Basis
(C)
|
Adjustments
to Basis (C)
|
Land and
Improvements
|
Buildings and
Improvements
(D)
|
Total (D,E)
|
Accumulated
Depreciation
(D,F)
|
Date of
Completion of
Construction or
Acquisition
|
||||||||||||||||||
|
HILTON GARDEN INN HARTFORD NORTH
Windsor, CT
|
10,062
|
|
5,606
|
|
13,892
|
|
—
|
|
4,897
|
|
5,606
|
|
18,790
|
|
24,395
|
|
4,720
|
|
2007
|
|||||||||
|
HILTON GARDEN INN PHOENIX
Phoenix, AZ
|
—
|
|
5,114
|
|
57,105
|
|
—
|
|
868
|
|
5,114
|
|
57,973
|
|
63,087
|
|
14,996
|
|
2008
|
|||||||||
|
HILTON - ST LOUIS DOWNTOWN
St Louis, MO
|
14,690
|
|
780
|
|
22,031
|
|
—
|
|
—
|
|
780
|
|
22,031
|
|
22,811
|
|
822
|
|
2012
|
|||||||||
|
HILTON—UNIVERSITY OF FLORIDA
Gainesville, FL
|
27,775
|
|
—
|
|
50,407
|
|
—
|
|
5,746
|
|
—
|
|
56,153
|
|
56,153
|
|
15,679
|
|
2007
|
|||||||||
|
HOLIDAY INN HARMON MEADOW SECAUCUS
Secaucus, NJ
|
—
|
|
—
|
|
23,291
|
|
1
|
|
9,704
|
|
1
|
|
32,995
|
|
32,996
|
|
8,791
|
|
2007
|
|||||||||
|
HOMEWOOD—HOUSTON GALLERIA
Houston, TX
|
14,840
|
|
1,655
|
|
30,587
|
|
—
|
|
563
|
|
1,655
|
|
31,149
|
|
32,804
|
|
10,157
|
|
2008
|
|||||||||
|
HOMEWOOD SUITES
Albuquerque, NM
|
10,160
|
|
2,400
|
|
18,071
|
|
—
|
|
2,849
|
|
2,400
|
|
20,920
|
|
23,320
|
|
6,361
|
|
2007
|
|||||||||
|
HOMEWOOD SUITES
Baton Rouge, LA
|
12,930
|
|
4,300
|
|
15,629
|
|
—
|
|
2,778
|
|
4,300
|
|
18,407
|
|
22,707
|
|
5,506
|
|
2007
|
|||||||||
|
HOMEWOOD SUITES
Cary, NC
|
12,351
|
|
1,478
|
|
19,404
|
|
—
|
|
6,422
|
|
1,478
|
|
25,826
|
|
27,305
|
|
7,404
|
|
2007
|
|||||||||
177
INLAND AMERICAN REAL ESTATE TRUST, INC.
(A Maryland Corporation)
Schedule III
Real Estate and Accumulated Depreciation
(Dollar amounts in thousands)
December 31, 2012
|
|
|
Initial Cost (A)
|
|
|
Gross amount at which carried at end of period
|
|||||||||||||||||||||||
|
|
Encumbrance
|
Land
|
Buildings and
Improvements
|
Adjustments
to Land
Basis
(C)
|
Adjustments
to Basis (C)
|
Land and
Improvements
|
Buildings and
Improvements
(D)
|
Total (D,E)
|
Accumulated
Depreciation
(D,F)
|
Date of
Completion of
Construction or
Acquisition
|
||||||||||||||||||
|
HOMEWOOD SUITES
Durham, NC
|
7,703
|
|
2,403
|
|
10,441
|
|
(709
|
)
|
(4,095
|
)
|
1,694
|
|
6,346
|
|
8,040
|
|
234
|
|
2007
|
|||||||||
|
HOMEWOOD SUITES
Princeton, NJ
|
14,300
|
|
3,203
|
|
21,300
|
|
—
|
|
1,888
|
|
3,203
|
|
23,187
|
|
26,390
|
|
6,591
|
|
2007
|
|||||||||
|
HOMEWOOD SUITES CLEVELAND SOLON
Solon, OH
|
5,490
|
|
1,900
|
|
10,757
|
|
—
|
|
1,721
|
|
1,900
|
|
12,479
|
|
14,379
|
|
3,825
|
|
2007
|
|||||||||
|
HOMEWOOD SUITES COLORADO SPRINGS NORTH
Colorado Springs, CO
|
7,830
|
|
2,900
|
|
14,011
|
|
—
|
|
2,715
|
|
2,900
|
|
16,726
|
|
19,626
|
|
5,533
|
|
2007
|
|||||||||
|
HYATT REGENCY—OC
Orange County, CA
|
65,000
|
|
18,688
|
|
93,384
|
|
—
|
|
25,844
|
|
18,688
|
|
119,228
|
|
137,916
|
|
27,280
|
|
2008
|
|||||||||
178
INLAND AMERICAN REAL ESTATE TRUST, INC.
(A Maryland Corporation)
Schedule III
Real Estate and Accumulated Depreciation
(Dollar amounts in thousands)
December 31, 2012
|
|
|
Initial Cost (A)
|
|
|
Gross amount at which carried at end of period
|
|||||||||||||||||||||||
|
|
Encumbrance
|
Land
|
Buildings and
Improvements
|
Adjustments
to Land
Basis
(C)
|
Adjustments
to Basis (C)
|
Land and
Improvements
|
Buildings and
Improvements
(D)
|
Total (D,E)
|
Accumulated
Depreciation
(D,F)
|
Date of
Completion of
Construction or
Acquisition
|
||||||||||||||||||
|
HYATT—BOSTON/MEDFORD
Medford, MA
|
14,660
|
|
2,766
|
|
29,141
|
|
—
|
|
368
|
|
2,766
|
|
29,509
|
|
32,275
|
|
9,451
|
|
2008
|
|||||||||
|
GRAND BOHEMIAN HOTEL ORLANDO
Orlando, FL
|
52,017
|
|
7,739
|
|
75,510
|
|
—
|
|
—
|
|
7,739
|
|
75,510
|
|
83,249
|
|
—
|
|
2012
|
|||||||||
|
MARRIOTT—ATL CENTURY CENTER
Atlanta, GA
|
9,628
|
|
—
|
|
36,571
|
|
—
|
|
3,257
|
|
—
|
|
39,828
|
|
39,828
|
|
14,279
|
|
2008
|
|||||||||
|
MARRIOTT—CHICAGO—MED DIST UIC
Chicago, IL
|
8,527
|
|
8,831
|
|
17,911
|
|
—
|
|
5,190
|
|
8,831
|
|
23,101
|
|
31,933
|
|
7,481
|
|
2008
|
|||||||||
|
MARRIOTT—CHARLESTON
Charleston, SC
|
17,328
|
|
—
|
|
26,647
|
|
—
|
|
7,037
|
|
—
|
|
33,685
|
|
33,685
|
|
3,825
|
|
2008
|
|||||||||
|
MARRIOTT—DALLAS
Dallas, TX
|
32,411
|
|
6,300
|
|
45,158
|
|
—
|
|
15,406
|
|
6,300
|
|
60,564
|
|
66,864
|
|
7,753
|
|
2010
|
|||||||||
|
MARRIOTT - GRIFFIN GATE RESORT
Lexington, KY
|
36,250
|
|
8,638
|
|
54,960
|
|
—
|
|
—
|
|
8,638
|
|
54,960
|
|
63,598
|
|
1,952
|
|
2012
|
|||||||||
|
MARRIOTT—NAPA VALLEY
Napa Valley, CA
|
39,820
|
|
14,800
|
|
57,223
|
|
—
|
|
1,381
|
|
14,800
|
|
58,604
|
|
73,404
|
|
3,558
|
|
2011
|
|||||||||
|
MARRIOT - SAN FRANCISCO AIRPORT
San Francisco, CA
|
55,000
|
|
36,700
|
|
72,370
|
|
—
|
|
—
|
|
36,700
|
|
72,370
|
|
109,070
|
|
2,634
|
|
2012
|
|||||||||
|
MARRIOTT—WOODLANDS WATERWAY
Woodlands, TX
|
76,634
|
|
5,500
|
|
98,886
|
|
—
|
|
25,046
|
|
5,500
|
|
123,932
|
|
129,432
|
|
29,479
|
|
2007
|
|||||||||
|
MARRIOTT—WEST DES MOINES
Des Moines, IA
|
10,628
|
|
3,410
|
|
15,416
|
|
—
|
|
4,924
|
|
3,410
|
|
20,340
|
|
23,750
|
|
2,368
|
|
2010
|
|||||||||
|
QUALITY SUITES Charleston, SC
|
10,029
|
|
1,331
|
|
13,709
|
|
—
|
|
13,617
|
|
1,331
|
|
27,326
|
|
28,657
|
|
5,117
|
|
2007
|
|||||||||
179
INLAND AMERICAN REAL ESTATE TRUST, INC.
(A Maryland Corporation)
Schedule III
Real Estate and Accumulated Depreciation
(Dollar amounts in thousands)
December 31, 2012
|
|
|
Initial Cost (A)
|
|
|
Gross amount at which carried at end of period
|
|||||||||||||||||||||||
|
|
Encumbrance
|
Land
|
Buildings and
Improvements
|
Adjustments
to Land
Basis
(C)
|
Adjustments
to Basis (C)
|
Land and
Improvements
|
Buildings and
Improvements
(D)
|
Total (D,E)
|
Accumulated
Depreciation
(D,F)
|
Date of
Completion of
Construction or
Acquisition
|
||||||||||||||||||
|
RENAISSANCE - ATLANTA WAVERLY
Atlanta, GA
|
97,000
|
|
6,834
|
|
90,792
|
|
—
|
|
—
|
|
6,834
|
|
90,792
|
|
97,626
|
|
2,879
|
|
2012
|
|||||||||
|
RENAISSANCE - AUSTIN
Austin, TX
|
83,000
|
|
10,656
|
|
97,960
|
|
—
|
|
—
|
|
10,656
|
|
97,960
|
|
108,616
|
|
2,857
|
|
2012
|
|||||||||
|
RESIDENCE INN—BALTIMORE
Baltimore, MD
|
40,040
|
|
—
|
|
55,410
|
|
—
|
|
3,902
|
|
—
|
|
59,312
|
|
59,312
|
|
16,525
|
|
2008
|
|||||||||
|
RESIDENCE INN
Brownsville, TX
|
6,900
|
|
1,700
|
|
12,629
|
|
—
|
|
1,120
|
|
1,700
|
|
13,749
|
|
15,449
|
|
3,599
|
|
2007
|
|||||||||
|
RESIDENCE INN—CAMBRIDGE
Cambridge, MA
|
31,606
|
|
10,346
|
|
72,735
|
|
—
|
|
1,105
|
|
10,346
|
|
73,840
|
|
84,185
|
|
19,276
|
|
2008
|
|||||||||
|
RESIDENCE INN SOUTH BRUNSWICK-CRANBURY
Cranbury, NJ
|
10,000
|
|
5,100
|
|
15,368
|
|
—
|
|
2,630
|
|
5,100
|
|
17,998
|
|
23,098
|
|
5,099
|
|
2007
|
|||||||||
|
RESIDENCE INN CYPRESS—LOS ALAMITS
Cypress, CA
|
20,650
|
|
9,200
|
|
25,079
|
|
—
|
|
3,359
|
|
9,200
|
|
28,439
|
|
37,639
|
|
8,120
|
|
2007
|
|||||||||
|
RESIDENCE INN DFW AIRPORT NORTH
Dallas-Fort Worth, TX
|
9,560
|
|
2,800
|
|
14,782
|
|
—
|
|
899
|
|
2,800
|
|
15,681
|
|
18,481
|
|
4,003
|
|
2007
|
|||||||||
|
RESIDENCE INN PARK CENTRAL
Dallas , TX
|
8,970
|
|
2,600
|
|
17,322
|
|
—
|
|
2,866
|
|
2,600
|
|
20,188
|
|
22,788
|
|
6,018
|
|
2007
|
|||||||||
180
INLAND AMERICAN REAL ESTATE TRUST, INC.
(A Maryland Corporation)
Schedule III
Real Estate and Accumulated Depreciation
(Dollar amounts in thousands)
December 31, 2012
|
|
|
Initial Cost (A)
|
|
|
Gross amount at which carried at end of period
|
|||||||||||||||||||||||
|
|
Encumbrance
|
Land
|
Buildings and
Improvements
|
Adjustments
to Land
Basis
(C)
|
Adjustments
to Basis (C)
|
Land and
Improvements
|
Buildings and
Improvements
(D)
|
Total (D,E)
|
Accumulated
Depreciation
(D,F)
|
Date of
Completion of
Construction or
Acquisition
|
||||||||||||||||||
|
RESIDENCE INN SOMERSET-FRANKLIN
Franklin , NJ
|
9,890
|
|
3,100
|
|
14,322
|
|
—
|
|
2,323
|
|
3,100
|
|
16,644
|
|
19,744
|
|
4,669
|
|
2007
|
|||||||||
|
RESIDENCE INN
Hauppauge, NY
|
10,810
|
|
5,300
|
|
14,632
|
|
—
|
|
2,404
|
|
5,300
|
|
17,037
|
|
22,337
|
|
4,787
|
|
2007
|
|||||||||
|
RESIDENCE INN WESTCHASE
Westchase, TX
|
12,550
|
|
4,300
|
|
16,969
|
|
—
|
|
3,020
|
|
4,300
|
|
19,989
|
|
24,289
|
|
4,664
|
|
2007
|
|||||||||
|
RESIDENCE INN WEST UNIVERSITY
Houston, TX
|
13,100
|
|
3,800
|
|
18,834
|
|
—
|
|
985
|
|
3,800
|
|
19,819
|
|
23,619
|
|
5,093
|
|
2007
|
|||||||||
|
RESIDENCE INN NASHVILLE AIRPORT
Nashville, TN
|
12,120
|
|
3,500
|
|
14,147
|
|
—
|
|
2,647
|
|
3,500
|
|
16,794
|
|
20,294
|
|
4,219
|
|
2007
|
|||||||||
|
RESIDENCE INN—POUGHKEEPSIE
Poughkeepsie, NY
|
11,693
|
|
1,003
|
|
24,590
|
|
—
|
|
2,263
|
|
1,003
|
|
26,853
|
|
27,855
|
|
7,595
|
|
2008
|
|||||||||
|
RESIDENCE INN ROANOKE AIRPORT
Roanoke, VA
|
5,800
|
|
500
|
|
9,499
|
|
—
|
|
267
|
|
500
|
|
9,766
|
|
10,266
|
|
2,897
|
|
2007
|
|||||||||
|
RESIDENCE INN WILLIAMS CENTRE
Tucson, AZ
|
12,770
|
|
3,700
|
|
17,601
|
|
—
|
|
2,256
|
|
3,700
|
|
19,858
|
|
23,558
|
|
4,923
|
|
2007
|
|||||||||
181
INLAND AMERICAN REAL ESTATE TRUST, INC.
(A Maryland Corporation)
Schedule III
Real Estate and Accumulated Depreciation
(Dollar amounts in thousands)
December 31, 2012
|
|
|
Initial Cost (A)
|
|
|
Gross amount at which carried at end of period
|
|||||||||||||||||||||||
|
|
Encumbrance
|
Land
|
Buildings and
Improvements
|
Adjustments
to Land
Basis
(C)
|
Adjustments
to Basis (C)
|
Land and
Improvements
|
Buildings and
Improvements
(D)
|
Total (D,E)
|
Accumulated
Depreciation
(D,F)
|
Date of
Completion of
Construction or
Acquisition
|
||||||||||||||||||
|
RESIDENCE INN—NEWARK ELIZABETH
Elizabeth, NJ
|
10,321
|
|
—
|
|
41,096
|
|
—
|
|
2,267
|
|
—
|
|
43,363
|
|
43,363
|
|
13,198
|
|
2008
|
|||||||||
|
SPRINGHILL SUITES
Danbury, CT
|
9,130
|
|
3,200
|
|
14,833
|
|
—
|
|
1,600
|
|
3,200
|
|
16,434
|
|
19,634
|
|
3,906
|
|
2007
|
|||||||||
|
Balance
|
5,809,803
|
|
1,902,559
|
|
8,142,837
|
|
(19,845
|
)
|
536,267
|
|
1,882,715
|
|
8,679,105
|
|
10,561,820
|
|
1,581,524
|
|
||||||||||
182
INLAND AMERICAN REAL ESTATE TRUST, INC.
(A Maryland Corporation)
Schedule III
(continued)
Real Estate and Accumulated Depreciation
December 31, 2012
(Dollar amounts in thousands)
Notes:
|
(A)
|
The initial cost to the Company represents the original purchase price of the property, including amounts incurred subsequent to acquisition which were contemplated at the time the property was acquired.
|
|
(B)
|
The aggregate cost of real estate owned at December 31, 2012 for Federal income tax purposes was approximately
$11,241,545
(unaudited).
|
|
(C)
|
Cost capitalized subsequent to acquisition includes payments under master lease agreements as well as additional tangible costs associated with investment properties, including any earnout of tenant space.
|
|
(D)
|
Reconciliation of real estate owned:
|
|
2012
|
2011
|
2010
|
|||||||
|
Balance at January 1,
|
$
|
10,404,239
|
|
10,295,107
|
|
9,551,426
|
|
||
|
Acquisitions and capital improvements
|
762,939
|
|
433,410
|
|
1,058,837
|
|
|||
|
Intangible assets
|
20,618
|
|
4,550
|
|
(73,901
|
)
|
|||
|
Intangible liabilities
|
2,242
|
|
6,846
|
|
10,916
|
|
|||
|
Sales
|
(628,218
|
)
|
(335,674
|
)
|
(252,171
|
)
|
|||
|
Balance at December 31,
|
$
|
10,561,820
|
|
10,404,239
|
|
10,295,107
|
|
||
|
(E)
|
Reconciliation of accumulated depreciation:
|
|
Balance at January 1,
|
$
|
1,301,899
|
|
1,038,829
|
|
717,547
|
|
||
|
Depreciation expense
|
279,625
|
|
263,070
|
|
321,282
|
|
|||
|
Balance at December 31,
|
$
|
1,581,524
|
|
1,301,899
|
|
1,038,829
|
|
||
|
(F)
|
Depreciation is computed based upon the following estimated lives:
|
|
Buildings and improvements
|
30 years
|
||
|
Tenant improvements
|
Life of the lease
|
||
|
Furniture, fixtures & equipment
|
5
|
-
|
15 years
|
183
Not applicable.
As required by Rule 13a-15(b) and Rule 15d-15(b) under the Securities Exchange Act of 1934, as amended (the “Exchange Act”), our management, including our principal executive officer and our principal financial officer evaluated as of
December 31, 2012
, the effectiveness of our disclosure controls and procedures as defined in Exchange Act Rules 13a-15(e) and Rule 15d-15(e). Based on that evaluation, our principal executive officer and our principal financial officer concluded that our disclosure controls and procedures, as of
December 31, 2012
, were effective for the purpose of ensuring that information required to be disclosed by us in this report is recorded, processed, summarized and reported within the time periods specified by the rules and forms of the Exchange Act and is accumulated and communicated to management, including the principal executive officer and our principal financial officer as appropriate to allow timely decisions regarding required disclosures.
Management’s Annual Report on Internal Control Over Financial Reporting
Our management is responsible for establishing and maintaining adequate internal control over financial reporting, as such term is defined in Exchange Act Rules 13a-15(f) and 15d-15(f). Our management, including our principal executive officer and principal financial officer, evaluated as of
December 31, 2012
, the effectiveness of our internal control over financial reporting based on the framework in “Internal Control-Integrated Framework” issued by the Committee of Sponsoring Organizations of the Treadway Commission (COSO). Based on its evaluation, our management has concluded that we maintained effective internal control over financial reporting as of
December 31, 2012
.
This annual report does not include an attestation report of the Company’s independent registered public accounting firm regarding internal control over financial reporting. Management’s report was not subject to attestation by the Company’s independent registered public accounting firm pursuant to permanent deferral of the Securities and Exchange Commission that permit the Company to provide only management’s report in this annual report.
Changes in Internal Control over Financial Reporting
There has been no change in our internal control over financial reporting during the fourth quarter of 2012 that has materially affected, or is reasonably likely to materially affect, our internal control over financial reporting.
None.
The following biographies set forth each director's principal occupation and business, as well as the specific experience, qualifications, attributes and skills that led to the conclusion by the board that he or she should serve as a director of the Company. All ages are stated as of January 1, 2013. As used herein, “Inland” refers to some or all of the entities that are a part of The Inland Real Estate Group of Companies, Inc., which is comprised of a group of independent legal entities, some of which share ownership or have been sponsored and managed by Inland Real Estate Investment Corporation (“IREIC”) or its subsidiaries.
Robert D. Parks, 69
. Chairman of the board and director since October 2004. Mr. Parks has over forty years of experience in the commercial real estate industry, having been a principal of the Inland organization since May 1968. Mr. Parks is currently chairman of IREIC, a position he has held since November 1984. He has also served as a director of Inland Investment Advisors, Inc. since June 1995, and served as a director of Inland Securities Corporation from August 1984 until June 2009. He served as a director of Inland Real Estate Corporation from 1994 through June 2008, and served as chairman of the board from May 1994 to May 2004 and president and chief executive officer from 1994 to April 2008. He also served as a director and chairman of the board of Inland Retail Real Estate Trust, Inc. from its inception in September 1998 to March 2006, and as chief executive officer until December 2004, and as the chairman of the board and a director of Retail Properties of America, Inc. (formerly, Inland Western Retail Real Estate Trust, Inc.) from its inception in March 2003 to October 2010. Mr. Parks also has served as the chairman of the board and a director of Inland Diversified Real Estate Trust, Inc. since its inception in June 2008. Mr. Parks is responsible for the ongoing administration of existing investment programs, corporate budgeting and administration for IREIC. He oversees and coordinates the marketing of all investments and investor relations.
184
He received his bachelor degree from Northeastern Illinois University in Chicago, and his master's degree from the University of Chicago and later taught in Chicago's public schools. He is a member of the National Association of Real Estate Investment Trusts, or “NAREIT.”
With over forty years of experience in the commercial real estate industry, our board believes that Mr. Parks has the depth of experience to implement and oversee our business strategy. As the current or past chairman of the board of each of the other real estate investment trusts, or “REITs,” sponsored by IREIC, including as the past chairman of a New York Stock Exchange-listed REIT, our board believes Mr. Parks has an understanding of the requirements of serving on a public company board and the leadership experience necessary to serve as our chairman.
J. Michael Borden, 76
. Independent director since October 2004. Mr. Borden is president and chief executive officer of Rock Valley Trucking Co., Inc., Total Quality Plastics, Inc., Rock Valley Leasing, Inc., Hufcor Inc. and Airwall, Inc. Mr. Borden also served as the president and chief executive officer of Freedom Plastics, Inc. through February 2009, at which time it filed a voluntary petition for a court-supervised liquidation of all of its assets in the Circuit Court of Rock County, Wisconsin. Mr. Borden also is the chief executive officer of Hufcor Asia Pacific in China and Hong Kong, Marashumi Corp. in Malaysia, Hufcor Australia Group, and F. P. Investments a Real Estate Investment Company. He currently serves on the board of directors of Dowco, Inc., M&I Bank, Competitive Wisconsin, St. Anthony of Padua Charitable Trust and Great Lakes Packaging, is a trustee of The Nature Conservancy and is a regent of the Milwaukee School of Engineering. Mr. Borden previously served as chairman of the board of the Wisconsin Workforce Development Board and as a member of the SBA Advisory Council and the Federal Reserve Bank Advisory Council. He was named Wisconsin entrepreneur of the year in 1998. Mr. Borden received a bachelor degree in accounting and finance from Marquette University, Milwaukee, Wisconsin. He also attended a master of business administration program in finance at Marquette University.
Over the past twenty-five years, Mr. Borden's various businesses have routinely entered into real estate transactions in the ordinary course of business, allowing him to develop experience in acquiring, leasing, developing and redeveloping real estate assets. Our board believes that this experience qualifies him to serve as a director on our board.
Thomas F. Glavin, 52
. Independent director since October 2007. Mr. Glavin is the owner of Thomas F. Glavin & Associates, Inc., a certified public accounting firm that he started in 1988. In that capacity, Mr. Glavin specializes in providing accounting and tax services to closely held companies. Mr. Glavin began his career at Vavrus & Associates, a real estate firm, located in Joliet, Illinois, that owned and managed apartment buildings and health clubs. At Vavrus & Associates, Mr. Glavin was an internal auditor responsible for reviewing and implementing internal controls. In 1984, Mr. Glavin began working in the tax department of Touche Ross & Co., where he specialized in international taxation. In addition to his accounting experience, Mr. Glavin also has been involved in the real estate business for the past seventeen years. Since 1997, Mr. Glavin has been a partner in Gateway Homes, which has zoned, developed and manages a 440 unit manufactured home park in Frankfort, Illinois. Mr. Glavin received his bachelor degree in accounting from Michigan State University in East Lansing, Michigan and a master of science in taxation from DePaul University in Chicago, Illinois. Mr. Glavin is a member of the Illinois CPA Society and the American Institute of Certified Public Accountants.
As a result of his financial experience, including over twenty-eight years in the accounting profession, our board believes that Mr. Glavin is able to provide valuable insight and advice with respect to our financial risk exposures, our financial reporting process and our system of internal controls. Mr. Glavin, who currently serves as the chairman of the audit committee of our board, qualifies as an “audit committee financial expert” as defined by the SEC.
Brenda G. Gujral, 70.
Director since October 2004. Ms. Gujral has served as our president from October 2004 to September 2012. Ms. Gujral is a director of IREIC and has served as its president since February 2012 (and served in that capacity from July 1987 through June 1992 and again from January 1998 through January 2011). In addition, Ms. Gujral served as the chief executive officer of IREIC from January 2008 to February 2012. Ms. Gujral was appointed president of Inland Securities Corporation in January 2013; she previously served as the president and chief operating officer of Inland Securities Corporation from January 1997 to June 2009, and has been a director of Inland Securities Corporation since January 1997. Ms. Gujral has served as a director of Inland Investment Advisors, Inc., an investment advisor, since January 2001, and has served as a director (March 2003 to May 2012) and chief executive officer (June 2005 to November 2007) of Retail Properties of America, Inc. (formerly, Inland Western Retail Real Estate Trust, Inc.) and as president (from June 2008 to May 2009) of Inland Diversified Real Estate Trust, Inc. and as a director and chairman of the board (August 2011 to June 2012) of Inland Real Estate Income Trust, Inc. (formerly, Inland Monthly Income Trust, Inc.). Ms. Gujral also has been the chairman of the board (since May 2001) and the president (since May 2012) of Inland Private Capital Corporation (formerly, Inland Real Estate Exchange Corporation) and a director of Inland Opportunity Business Manager & Advisor, Inc. since April 2009. Ms. Gujral was a director of Inland Retail Real Estate Trust, Inc. from its inception in September 1998 until it was acquired in February 2007.
Ms. Gujral has overall responsibility for the operations of IREIC, including investor relations, regulatory compliance and filings, review of asset management activities and broker-dealer marketing and communication. Ms. Gujral works with internal and outside legal counsel in structuring IREIC's investment programs and in connection with preparing offering documents and
185
registering the related securities with the SEC and state securities commissions. Our board believes that this experience, coupled with her leadership of IREIC, qualify Ms. Gujral to serve as a member of our board.
Ms. Gujral has been with the Inland organization for thirty-five years, becoming an officer in 1982. Prior to joining the Inland organization, she worked for the Land Use Planning Commission of the State of Oregon, establishing an office in Portland, to implement land use legislation for Oregon. Ms. Gujral graduated from California State University, in Fresno. She holds Series 7, 22, 39 and 63 certifications from FINRA, and is a member of NAREIT, the Investment Program Association and the Real Estate Investment Securities Association. Additionally, Ms. Gujral serves on the board of directors of the Disability Rights Center of the Virgin Islands, an organization that focuses on advancing the legal rights of people with disabilities in the U.S. Virgin Islands.
Thomas F. Meagher, 82
. Independent director since October 2004. Mr. Meagher currently serves on the board of directors of DuPage Airport Authority and the TWA Plan Oversight Committee. He also is a former member of the board of trustees of Edward Lowe Foundation, The Private Bank Corp. and the Chicago Chamber of Commerce. Mr. Meagher has previously served on the board of directors of UNR Industries, Rohn Towers, Greyhound Lines Inc., Festival Airlines, Lakeside Bank and Trans World Airlines, where he served as chairman of the board for two years and participated in the sale of the company to American Airlines.
Mr. Meagher began his business career in 1958 when he was selected by American Airlines for its management training program. He subsequently joined Continental Air Transport of Chicago as Executive Vice-President in 1964. In 1970, Mr. Meagher was appointed the first president and chief executive officer of the Chicago Convention and Tourism Bureau, returning to Continental Air Transport as president and chief executive officer in 1972. In 1980, Mr. Meagher purchased Howell Tractor and Equipment Company, a large heavy construction equipment dealership, and sold the company in April 2005.
Mr. Meagher received his bachelor degree from St. Mary's University of Minnesota. Upon graduation, he entered the U.S. Marine Corps Officer Candidate Program, serving with the 2nd Marine Air Wing and achieving the rank of Captain. Mr. Meagher also attended graduate business school at the University of Chicago.
Because of Mr. Meagher's service on the board of directors of a variety of public and private entities, our board believes that he is qualified to serve on our board.
Paula Saban, 59
. Independent director since October 2004. Ms. Saban has worked in the financial services and banking industry for over twenty-five years. She began her career in 1978 with Continental Bank, which later merged into Bank of America. From 1978 to 1990, Ms. Saban held various consultative sales roles in treasury management and in traditional lending areas. She also managed client service teams and developed numerous client satisfaction programs. In 1990, Ms. Saban began designing and implementing various financial solutions for clients with Bank of America's Private Bank and Banc of America Investment Services, Inc. Her clients included top management of publicly-held companies and entrepreneurs. In addition to managing a diverse client portfolio, she was responsible for client management and overall client satisfaction. She retired from Bank of America in 2006 as a senior vice president/private client manager. In 1994, Ms. Saban and her husband started a construction products company, Newport Distribution, Inc., of which she is secretary and treasurer, and a principal stockholder.
Ms. Saban received her bachelor degree from MacMurray College, Jacksonville, Illinois, and her master of business administration from DePaul University, Chicago, Illinois. She holds Series 7 and 63 certifications from FINRA. She is a former president of the Fairview Elementary School PTA and a former trustee of both the Goodman Theatre and Urban Gateways. She served as Legislative Chair of Illinois PTA District 37 and as liaison to the No Child Left Behind Task Force of School District 54. She is currently a board member of a Hands On Suburban Chicago which is a not-for-profit organization that matches community and corporate volunteers of all ages and skills with opportunities to connect and serve.
In her roles with Newport Distribution, Ms. Saban has insight into the development and construction industry. Our board believes that these experiences and this insight make her qualified to serve on our board.
William J. Wierzbicki, 66
. Independent director since October 2005. Mr. Wierzbicki is a registered Professional Planner in the Province of Ontario, Canada, and is a member of both the Canadian Institute of Planners and the Ontario Professional Planners Institute. Mr. Wierzbicki is the sole proprietor of “Planning Advisory Services,” a land-use planning consulting service providing consultation and advice to various local governments, developers and individuals. Through Planning Advisory Services, Mr. Wierzbicki is the planner for the Municipalities of Huron Shores and Price Township as well as the Town of Chapleau. Mr. Wierzbicki previously served as the Coordinator of Current Planning with the City of Sault Ste. Marie, Ontario. In that capacity, his expertise was in the review of residential, commercial and industrial development proposals. Mr. Wierzbicki led the program to develop a new Comprehensive Zoning By-Law for the City of Sault Ste. Marie. Mr. Wierzbicki was the leader of the team that developed the Sault Ste. Marie's Industrial Development Strategy. More recently he has completed a Community Development Plan for Batchwana First Nation's Rankin site and an Official Plan for the
186
Township of Prince. Mr. Wierzbicki received an architectural technologist diploma from the Sault Ste. Marie Technical and Vocational School in Ontario, Canada, and attended Sault College and Algoma University.
Our board believes that Mr. Wierzbicki's experience and knowledge of commercial real estate industry, including with real estate development, qualifies him to serve on our board. In addition, if we determine to acquire any real estate assets in Canada in the future, Mr. Wierzbicki's expertise in the Canadian real estate market will be useful to our board.
Executive Officers
In addition to Mr. Parks, whose biography is set forth above, the following individuals serve as our executive officers. All ages are stated as of January 1, 2013.
Thomas P. McGuinness, 57.
President since September 2012. Mr. McGuinness joined Inland Property Management, Inc. in 1982, and has served as its president since 1991. Mr. McGuinness also has served as president (since 1990) and chairman (since 2001) of Mid-America Management Corporation. From August 2005 through December 2011, Mr. McGuinness served as the president of Inland American HOLDCO LLC (“HOLDCO”), the sole member of each of our property managers, Inland American Retail Management LLC, Inland American Office Management LLC, Inland American Industrial Management LLC and Inland American Apartment Management LLC, and as the chairman, a director and the chief executive officer of the four members of HOLDCO, which are controlled by The Inland Group, Inc. (collectively, the “Parent Companies”). Mr. McGuinness, has served as the president of our business manager since January 2012.
Mr. McGuinness previously served as the president of the Chicagoland Apartment Association and as the regional vice president of the National Apartment Association. He also served on the board of directors of the Apartment Building Owners and Managers Association, and was a trustee with the Service Employees’ Local No. 1 Health and Welfare Fund and its Pension Fund. He holds CLS and CSM accreditations from the International Council of Shopping Centers (“ICSC”). Mr. McGuinness is the husband of JoAnn M. McGuinness. Ms. McGuinness is currently a director of the Inland Group and president of Inland Real Estate Income Trust, Inc., and its business manager.
Roberta S. Matlin, 68
. Vice president - administration since October 2004. Ms. Matlin joined IREIC in November 1984 as director of investor administration and currently serves as a director and senior vice president of IREIC, in the latter capacity directing its day-to-day internal operations. Ms. Matlin also has been a director of Inland Private Capital Corporation (f/k/a Inland Real Estate Exchange Corporation) since May 2001, the vice president of Inland Institutional Capital Partners Corporation since May 2006 and a director since August 2012, and a director of Pan American Bank since December 2007. She also has served as a director and president of Inland Investment Advisors, Inc. since June 1995 and Intervest Southern Real Estate Corporation since July 1995 and a director and vice president of Inland Securities Corporation since July 1995. Ms. Matlin has served as the vice president of Inland Monthly Income Trust, Inc. and its business manager since August 2011. She has served as vice president of Inland Diversified Real Estate Trust, Inc. since September 2008, and the vice president of its business manager since May 2009; she also served as the president of Inland Diversified's business manager from June 2008 to May 2009. Ms. Matlin served as vice president of administration of Retail Properties of America, Inc. (formerly, Inland Western Retail Real Estate Trust, Inc.) from 2003 until 2007, vice president of administration of Inland Retail Real Estate Trust, Inc. from September 1998 until December 2004, vice president of administration of Inland Real Estate Corporation from March 1995 until June 2000 and trustee and executive vice president of Inland Mutual Fund Trust from October 2001 until May 2004. Ms. Matlin also has served as the president of Inland Opportunity Business Manager & Advisor, Inc. since April 2009. Prior to joining Inland, Ms. Matlin worked for the Chicago Region of the Social Security Administration of the United States Department of Health and Human Services. Ms. Matlin received her bachelor degree from the University of Illinois in Champaign. She holds Series 7, 22, 24, 39, 63 and 65 certifications from FINRA. Ms. Matlin is a member of NAREIT, the Investment Program Association and the Real Estate Investment Securities Association.
Jack Potts, 43
. Treasurer and principal financial officer, and the chief financial officer of our business manager, since February 2012. Mr. Potts previously served as our principal accounting officer and the chief accounting officer of our business manager, from September 2007 to January 2012. Mr. Potts also has served as the treasurer of Inland Real Estate Income Trust, Inc., and the treasurer of its business manager from February 2012 through July 2012. Prior to joining the Inland organization, from February 1998 to April 2007, Mr. Potts held various accounting and financial reporting positions with Equity Office Properties Trust, Inc., a then-publicly traded owner and manager of office properties. Mr. Potts previously worked in the field of public accounting and was a manager in the real estate division for Ernst and Young LLP. He received a bachelor degree in accounting from Michigan State University in East Lansing. Mr. Potts is a certified public accountant.
Anna Fitzgerald, 37
. Principal accounting officer and chief accounting officer of our business manager since February 2012. Ms. Fitzgerald joined our business manager in January 2011 as the vice president of accounting. Prior to joining the Inland organization, she had worked as a consultant to the Company, from March 2008 to December 2010. Ms. Fitzgerald was previously employed by Equity Office Properties Trust, Inc. from October 1999 to February 2008, where she held various
187
positions in accounting, financial reporting and treasury. She received a bachelor degree in accounting and finance from Drake University in Des Moines, Iowa. Ms. Fitzgerald is a certified public accountant.
Scott W. Wilton, 51.
Secretary since October 2004. Mr. Wilton joined The Inland Group, Inc. in January 1995. He is assistant vice president of The Inland Real Estate Group, Inc. and assistant counsel with The Inland Real Estate Group law department. Mr. Wilton previously served as secretary of Retail Properties of America, Inc. (formerly, Inland Western Retail Real Estate Trust, Inc.) from March 2003 to November 2005, as secretary of Inland Private Capital Corporation from May 2001 to August 2009 and as secretary of Inland Retail Real Estate Trust, Inc. and Inland Retail Real Estate Advisory Services, Inc. from September 1998 to December 2004. Mr. Wilton is involved in all aspects of The Inland Group, Inc.'s business, including real estate acquisitions and financing, securities law and corporate governance matters, leasing and tenant matters and litigation management. He received bachelor degrees in economics and history from the University of Illinois, Champaign, in 1982 and his law degree from Loyola University, Chicago, Illinois, in 1985. Prior to joining The Inland Group, Inc. Mr. Wilton worked for the Chicago law firm of Williams, Rutstein, Goldfarb, Sibrava and Midura, Ltd., specializing in real estate, corporate transactions and litigation.
Audit Committee
Our board has formed an audit committee comprised of four independent directors, Messrs. Borden, Glavin, Meagher and Ms. Saban. The board has determined that Mr. Glavin, the chairman of the committee, qualifies as an “audit committee financial expert,” as defined by the SEC, and that each member of the committee is independent in accordance with the standards set forth in the committee's charter. The audit committee assists the board in fulfilling its oversight responsibility relating to: (1) the integrity of our financial statements; (2) our compliance with legal and regulatory requirements; (3) the qualifications and independence of the independent registered public accounting firm; (4) the adequacy of our internal controls; and (5) the performance of our independent registered public accounting firm. The audit committee has adopted a written charter, which is available on our website at www.inland-american.com under the “Corporate Governance” tab.
Section 16(a) Beneficial Ownership Reporting Compliance
Section 16(a) of the Exchange Act requires each director, officer and individual beneficially owning more than 10% of our common stock to file initial statements of beneficial ownership (Form 3) and statements of changes in beneficial ownership (Forms 4 and 5) of our common stock with the SEC. Officers, directors and greater than 10% beneficial owners are required by SEC rules to furnish us with copies of all such forms they file. Based solely on a review of the copies of such forms furnished to us during and with respect to the fiscal year ended December 31, 2012, or written representations that no additional forms were required, we believe that all of our officers and directors and persons that beneficially own more than 10% of the outstanding shares of our common stock complied with these filing requirements in 2012.
Code of Ethics
We have adopted a code of ethics applicable to our directors, officers and employees, which is available on our website free of charge at
http://www.inlandamerican.com
. We will provide the code of ethics free of charge upon request to our customer relations group.
Compensation of Executive Officers
All of our executive officers are officers and employees, respectively, of one or more of the affiliates of our business manager and are compensated by those entities, in part, for services rendered to us. We do not separately compensate our executive officers, nor do we reimburse either our business manager or our property managers for any compensation paid to their employees who also serve as our executive officers, other than through the general fees we pay to them under the business management agreement or the property management agreements. For the purposes of reimbursement, our corporate secretary is not considered an “executive officer.” As a result, we do not have, and our board of directors has not considered, a compensation policy or program for our executive officers and has not included in this Form 10-K a “Compensation Discussion and Analysis” or a report from our board of directors with respect to executive compensation. The fees we pay to the business manager and property managers under the business management agreement or the property management agreements are described in more detail in Item 13 of this Form 10-K.
If we decide to pay our named executive officers in the future, the board of directors will review all forms of compensation and approve all stock option grants, warrants, stock appreciation rights and other current or deferred compensation payable to the executive officers with respect to the current or future value of our shares.
188
Independent Director Compensation
We pay each of our independent directors an annual fee of $30,000, plus $1,000 for each meeting of the board attended in person and $500 for each meeting of the board attended by telephone. We also pay the chairperson of the audit committee an annual fee of $10,000, and pay each member of the audit committee $1,000 for each meeting of the audit committee attended in person and $500 for each meeting of the audit committee attended by telephone. We pay the chairperson of every other committee, including any special committee, an annual fee of $5,000, and pay each member of such committee $1,000 for each meeting of the committee attended in person and $500 for each meeting of the committee attended by telephone. We reimburse all of our directors for any out-of-pocket expenses incurred by them in attending meetings. In addition, on the date of each annual meeting of stockholders, we grant to each independent director then in office options to purchase 500 shares of our common stock under our independent director stock option plan.
We do not compensate any director that also is an employee of our Company, our business manager or its affiliates.
The following table further summarizes compensation earned by the independent directors for the year ended December 31, 2012.
|
|
Fees Earned in Cash ($)
|
Option Awards* ($) (1)
|
Total ($)
|
|||
|
J. Michael Borden
|
56,000
|
|
3,610
|
|
59,610
|
|
|
Thomas F. Glavin
|
70,000
|
|
3,610
|
|
73,610
|
|
|
Thomas F. Meagher
|
56,000
|
|
3,610
|
|
59,610
|
|
|
Paula Saban
|
59,000
|
|
3,610
|
|
62,610
|
|
|
William J. Wierzbicki
|
50,000
|
|
3,610
|
|
53,610
|
|
* Each director receives 500 shares at each annual stockholder meeting, with an exercise price equal to the market value of our shares at the time of issuance.
(1) With the exception of Mr. Glavin, each independent director had options to purchase 6,000 shares of our common stock outstanding at
December 31, 2012
. Mr. Glavin had options to purchase 5,000 shares of our common stock outstanding at
December 31, 2012
. All options have been granted pursuant to our independent director stock option plan.
Stock Option Grants
Under our independent director stock option plan, we have authorized and reserved a total of 75,000 shares of our common stock for issuance. The number and type of shares that could be issued under the plan may be adjusted if we are the surviving entity after a reorganization or merger or if we split our stock, are consolidated or are recapitalized. If this occurs, the exercise price of the options will be correspondingly adjusted.
The independent director stock option plan generally provides for the grant of non-qualified stock options to purchase 3,000 shares to each independent director upon his or her appointment subject to satisfying the conditions set forth in the plan. The plan also provides for subsequent grants of options to purchase 500 shares on the date of each annual stockholder's meeting to each independent director then in office. The exercise price for all options is equal to the fair market value of our shares, as defined in the plan, on the date of each grant. However, options may not be granted at any time when the grant, along with the grants to be made at the same time to other independent directors, would exceed 9.8% in value of our issued and outstanding shares of stock or 9.8% in value or number of shares, whichever is more restrictive, of our issued and outstanding shares of common stock.
One-third of the options granted following an individual initially becoming an independent director are exercisable beginning on the date of their grant, one-third become exercisable on the first anniversary of the date of their grant and the remaining one-third become exercisable on the second anniversary of the date of their grant. All other options granted under the independent director stock option plan become fully exercisable on the second anniversary of their date of grant.
Options granted under the independent director stock option plan are exercisable until the first to occur of: the tenth anniversary of the date of grant; the removal for cause of the person as an independent director; or three months following the date the person ceases to be an independent director for any other reason except death or disability.
189
All options generally are exercisable in the case of death or disability for a period of one year after death or the disabling event, provided that the death or disabling event occurs while the person is an independent director. However, if the option is exercised within the first six months after it becomes exercisable, any shares issued pursuant to such exercise may not be sold until the six month anniversary of the date of the grant of the option. Notwithstanding any other provisions of the independent director stock option plan to the contrary, no option issued pursuant thereto may be exercised if exercise would jeopardize our status as a REIT under the Internal Revenue Code of 1986, as amended.
No option may be sold, pledged, assigned or transferred by an independent director in any manner otherwise than by will or by the laws of descent or distribution.
Upon our dissolution, liquidation, reorganization, merger or consolidation as a result of which we are not the surviving corporation, or upon sale of all or substantially all of our assets, the independent director stock option plan will terminate, and any outstanding unexercised options will terminate and be forfeited. However, holders of options may exercise any options that are otherwise exercisable immediately prior to the dissolution, liquidation, consolidation or merger. Additionally, our board may provide for other alternatives in the case of a dissolution, liquidation, consolidation or merger.
Compensation Committee Interlocks and Insider Participation
None of our current or former officers or employees, or the current or former officers or employees of our subsidiaries, participated in any deliberations of our board of directors concerning executive officer compensation during the year ended
December 31, 2012
. In addition, during the year ended
December 31, 2012
, none of our executive officers served as a director or a member of the compensation committee of any entity that has one or more executive officers serving as a member of our board of directors.
Equity Compensation Plan Information
The following table provides information regarding our equity compensation plans as of December 31, 2012.
|
Plan category
|
Number of
securities to be issued upon
exercise
of outstanding
options, warrants and rights
|
Weighted-average exercise price of
outstanding
options, warrants and rights
|
Number of
securities remaining available for future issuance under equity compensation plans
|
||||
|
Equity compensation plans approved by security holders:
|
|
|
|
||||
|
Independent Director Stock Option Plan
|
29,000
|
|
$
|
8.87
|
|
46,000
|
|
|
Equity compensation plans not approved by security holders
|
—
|
|
—
|
|
—
|
|
|
|
|
|
|
|||||
|
Total:
|
29,000
|
|
$
|
8.87
|
|
46,000
|
|
|
|
|
||||||
We have adopted an Independent Director Stock Option Plan which, subject to certain conditions, provides for the grant to each independent director of an option to purchase 3,000 shares following their becoming a director and for the grant of additional options to purchase 500 shares on the date of each annual stockholder's meeting. The options for the initial 3,000 shares are exercisable as follows: 1,000 shares on the date of grant and 1,000 shares on each of the first and second anniversaries of the date of grant. All other options are exercisable on the second anniversary of the date of grant.
Stock Owned by Certain Beneficial Owners and Management
Based on a review of filings with the SEC, the following table shows the amount of common stock beneficially owned (unless otherwise indicated) by (1) persons that are known to beneficially own more than 5% of the outstanding shares of our common stock ; (2) our directors; (3) our executive officers; and (4) our directors and executive officers as a group. All information is as of February 19, 2013.
190
|
Name and Address of Beneficial Owner (1)
|
Amount and Nature
of Beneficial Ownership (2)
|
Percent
of Class
|
|||
|
J. Michael Borden, Independent Director
|
156,099
|
|
(3)
|
*
|
|
|
Thomas F. Glavin, Independent Director
|
27,207
|
|
(4)
|
*
|
|
|
Brenda G. Gujral, Director
|
9,280
|
|
(5)
|
*
|
|
|
Thomas F. Meagher, Independent Director
|
20,280
|
|
(6)
|
*
|
|
|
Robert D. Parks, Director and Chairman of the Board
|
451,920
|
|
(7)
|
*
|
|
|
Paula Saban, Independent Director
|
5,500
|
|
(8)
|
*
|
|
|
William J. Wierzbicki, Independent Director
|
6,934
|
|
(9)
|
*
|
|
|
Thomas P. McGuinness, President
|
—
|
|
—
|
|
|
|
Roberta S. Matlin, Vice President-Administration
|
3,126
|
|
(10)
|
*
|
|
|
Jack Potts, Treasurer and Principal Financial Officer
|
—
|
|
—
|
|
|
|
Anna Fitzgerald, Principal Accounting Officer
|
—
|
|
—
|
|
|
|
Scott W. Wilton, Secretary
|
4,028
|
|
(11)
|
*
|
|
|
|
|
|
|
|
|
|
All Directors and Officers as a group (twelve persons)
|
684,374
|
|
*
|
|
|
|
|
|
|
|||
*Less than 1%
|
(1)
|
The business address of each person listed in the table is c/o Inland American Real Estate Trust, Inc., 2901 Butterfield Road, Oak Brook, Illinois 60523.
|
|
(2)
|
All fractional ownership amounts have been rounded to the nearest whole number.
|
|
(3)
|
Mr. Borden has sole voting and dispositive power over 144,405 shares, including 58,357 shares owned by St. Anthony Padua Charitable Trust, for which Mr. Borden is the trustee, and Mr. Borden and his wife share voting and dispositive power over 6,194 shares. Mr. Borden's shares include vested options exercisable into 5,500 shares of common stock.
|
|
(4)
|
Mr. Glavin and his wife share voting and dispositive power over 22,707 shares. Mr. Glavin's shares include vested options exercisable into 4,500 shares of common stock.
|
|
(5)
|
Ms. Gujral has sole voting and dispositive power over 3,336 shares. Ms. Gujral and her husband share voting and dispositive power over 5,944 shares.
|
|
(6)
|
Mr. Meagher has sole voting and dispositive power over all of the shares that he owns. Mr. Meagher's shares include vested options exercisable into 5,500 shares of common stock.
|
|
(7)
|
Mr. Parks has sole voting and dispositive power over all 451,920 shares.
|
|
(8)
|
Ms. Saban has sole voting and dispositive power over all of the shares that she owns. Ms. Saban's ownership is comprised of vested options exercisable into 5,500 shares of common stock.
|
|
(9)
|
Mr. Wierzbicki and his wife share voting and dispositive power over 1,434 shares. Mr. Wierzbicki's shares include vested options exercisable into 5,500 shares of common stock.
|
|
(10)
|
Ms. Matlin has sole voting and dispositive power over all of the shares that she owns.
|
|
(11)
|
Mr. Wilton and his mother share voting and dispositive power over all 3,351 shares, and Mr. Wilton and his spouse share voting and dispositive power over 677 shares owned by Mr. Wilton's spouse through her individual IRA.
|
Director Independence
Our business is managed under the direction and oversight of our board. The members of our board are J. Michael Borden, Thomas F. Glavin, Brenda G. Gujral, Thomas F. Meagher, Robert D. Parks, Paula Saban and William J. Wierzbicki. As required by our charter, a majority of our directors must be “independent.” As defined by our charter, an “independent director” is a person who: (1) is not directly or indirectly associated, and has not been directly or indirectly associated within the two years prior to becoming an independent director, with the Company, IREIC or our business manager whether by ownership of, ownership interest in, employment by, any material business or professional relationship with or as an officer or director of the Company, IREIC, our business manager or any of their affiliates; (2) does not serve as a director for another REIT originated by IREIC or advised by our business manager or any of its affiliates; and (3) performs no other services for the Company, except as director.
191
Although our shares are not listed for trading on any national securities exchange and therefore our board of directors is not subject to the independence requirements of the New York Stock Exchange (“NYSE”) or any other national securities exchange, our board has evaluated whether our directors are “independent” as defined by the NYSE. The NYSE standards provide that to qualify as an independent director, in addition to satisfying certain bright-line criteria, the board of directors must affirmatively determine that a director has no material relationship with the Company (either directly or as a partner, stockholder or officer of an organization that has a relationship with the Company).
Consistent with these considerations, after a review of all relevant transactions or relationships between each director, or any of his or her family members, and the Company, our management and our independent registered public accounting firm, the board has determined that Messrs. Borden, Glavin, Meagher and Wierzbicki and Ms. Saban qualify as independent directors.
Related Party Transactions
We pay our business manager, an affiliate of our sponsor, IREIC, and its affiliates various fees and compensation. The following is a summary of the fees and compensation we paid to our business manager and its affiliates during the year ended
December 31, 2012
.
After our stockholders have received a non-cumulative, non-compounded return of 5.0% per annum on their “invested capital,” we pay our business manager an annual business management fee of up to 1% of the “average invested assets,” payable quarterly in an amount equal to 0.25% of the average invested assets as of the last day of the immediately preceding quarter. For these purposes, “average invested assets” means, for any period, the average of the aggregate book value of our assets, including lease intangibles, invested, directly or indirectly, in financial instruments, debt and equity securities and equity interests in and loans secured by real estate assets, including amounts invested in REITs and other real estate operating companies, before reserves for depreciation or bad debts or other similar non-cash reserves, computed by taking the average of these values at the end of each month during the period. We pay this fee for services provided or arranged by our business manager, such as managing our day-to-day business operations, arranging for the ancillary services provided by other affiliates and overseeing these services, administering our bookkeeping and accounting functions, consulting with our board, overseeing our real estate assets and providing other services as our board deems appropriate. Pursuant to the letter agreement dated May 4, 2012, the business management fee shall be reduced in each particular quarter for investigation costs exclusive of legal fees incurred in conjunction with the SEC matter. During the year ended
December 31, 2012
, the Company incurred $108 thousand of investigation costs, resulting in a business management fee expense of
$39,892
, or approximately
0.35%
of our “average invested assets” on an annual basis, for the year ended
December 31, 2012
. In addition, effective July 30, 2012, the Company extended the agreement with the Business Manager through July 30, 2013. The terms of the Business Manager Agreement remains unchanged.
We pay Inland Investment Advisors, Inc., another affiliate of our business manager, an annual fee, paid on a monthly basis, totaling 1% of the first $1 to $5 million of marketable securities under management, 0.85% of marketable securities from $5 to $10 million, 0.75% of marketable securities from $10 to $25 million, 0.65% of marketable securities from $25 to $50 million, 0.60% of marketable securities from $50 to $100 million and 0.50% of marketable securities above $100 million. Notwithstanding the above, the total annual fees paid to Inland Investment Advisors plus the annual business management fee paid to our business manager may not exceed the amounts we may pay as the annual business management fee. For the year ended
December 31, 2012
, we paid fees to Inland Investment Advisors in an amount equal to approximately
$1.8 million
.
We also reimburse our business manager and its affiliates for all expenses that it, or any affiliate, pays or incurs on our behalf, including the salaries and benefits of persons employed by the business manager or its affiliates and performing services for us, except for the salaries and benefits of persons who also serve as one of the executive officers or as an executive officer of the business manager. For the purposes of reimbursement, our corporate secretary is not considered an “executive officer”. For the year ended
December 31, 2012
, we incurred approximately
$12.2 million
of these costs. In addition, for any year in which we qualify as a REIT, our business manager must reimburse us for the amounts, if any, by which the total operating expenses paid during the previous year exceed the greater of 2% of the average invested assets for that year or 25% of net income for that year, subject to certain adjustments. Our total operating expenses did not exceed these limits during the year ended December 31, 2012.
Additionally, we pay the business manager a fee for services performed in connection with acquiring a controlling interest in a REIT or other real estate operating company. Acquisition fees, however, are not paid for acquisitions solely of a fee interest in property. The amount of the acquisition fee is equal to 2.5% of the aggregate purchase price paid to acquire the controlling interest. We did not pay any acquisition fees for the year ended
December 31, 2012
.
We pay our property managers, entities owned principally by individuals who are affiliated with our sponsor, a monthly fee up to a certain percentage of gross operating income (as defined). For the six months ending June 30, 2012, the property managers were entitled to receive property management fees up to
4.5%
of gross operating income (as defined), for management and leasing services; however, (1) for triple-net lease properties, the property managers were entitled to monthly fees equal to
2.9%
192
of the gross income generated by the applicable property each month and (2) for bank branches, the property managers were entitled to monthly fees equal to
2.5%
of the gross income generated by the applicable property each month in operating companies purchased by the Company. The property managers were entitled to receive an oversight fee of
1%
of gross operating income (as defined). These rates became effective January 1, 2012 when we entered into an extension agreement with the property managers which extended the term through June 30, 2012.
On July 1, 2012, we entered into new master agreements with its property managers and extended the term until December 31, 2013 which will automatically be renewed until June 30, 2015 unless either party to the agreement provides written notice of cancellation before June 30, 2013. Under the new master agreements, we paid the property managers monthly management fees by property type, updated as follows: (i) for any bank branch facility (office or retail),
2.50%
of the gross income generated by the property; (ii) for any multi-tenant industrial property,
4.00%
of the gross income generated by the property; (iii) for any multi-family property,
3.75%
of the gross income generated by the property; (iv) for any multi-tenant office property,
3.75%
of the gross income generated by the property; (v) for any multi-tenant retail property,
4.50%
of the gross income generated by the property; (vi) for any single-tenant industrial property,
2.25%
of the gross income generated by the property; (vii) for any single-tenant office property,
2.90%
of the gross income generated by the property; and (viii) for any single-tenant retail property,
2.90%
of the gross income generated by the property.
We also pay our property managers, based on the type of property managed, a monthly oversight fee of up to 1% of the gross income from each property managed directly by entities other than our property managers, their affiliates or agents. We do not pay any oversight fees with respect to our lodging properties. Further, as is customary in the industry, we reimburse each property manager, its affiliates and agents for property-level expenses that it or they pay, such as salaries and benefit expenses for on-site employees and other miscellaneous expenses. We paid our property managers management fees of approximately
$27.6 million
for the year ended
December 31, 2012
. We did not pay any oversight fees for the year ended
December 31, 2012
. We also reimbursed the property managers approximately
$14.0
million related to property level payroll costs.
We pay a related party of the business manager 0.2% of the principal amount of each loan placed on our behalf. Such costs are capitalized as loan fees and amortized over the respective loan term. We paid
$1.2 million
for the year ended December 31, 2012. During the first half of 2012, we paid a related party to provide loan servicing. We paid
$0.1 million
for the year ended December 31, 2012.
As of December 31, 2012, we had deposited
$0.4 million
in Inland Bank and Trust, a subsidiary of Inland Bancorp, Inc., an affiliate of The Inland Real Estate Group, Inc., which is owned by The Inland Group, Inc.
We are party to an agreement with a limited liability company formed as an insurance association captive , which is wholly-owned by us and and two related parties, Inland Real Estate Corporation (“IRC”) and Inland Diversified Real Estate Trust, Inc., and a third party, Retail Properties of America ("RPAI"). We paid insurance premiums of
$12.2 million
for the year ended
December 31, 2012
.
We held
889,820
shares of IRC valued $
7.5 million
as of
December 31, 2012
.
Policies and Procedures with Respect to Related Party Transactions
Our charter contains provisions setting forth our ability to engage in certain related party transactions. Our board reviews all of these transactions and, as a general rule, any related party transactions must be approved by a majority of the directors, including a majority of the independent directors not otherwise interested in the transaction. All transactions described under the caption “Related Party Transactions” are subject to board approval, including a majority of the independent directors not otherwise interested in the transaction. In determining whether to approve or authorize a particular related party transaction, these directors will consider whether the transaction between us and the related party is fair and reasonable to us and has terms and conditions no less favorable to us than those available from unaffiliated third parties. We believe that our general policies and procedures regarding related party transactions also are evidenced by the disclosures in this Form 10-K and our prior proxy statements under the caption “Certain Relationships and Related Transactions.” We may in the future adopt more specific written policies and procedures regarding related party transactions.
Fees to Independent Registered Public Accounting Firm
The following table presents fees for professional services rendered by our independent registered public accounting firm, KPMG LLC (“KPMG”), for the audit of our annual financial statements for the years ended
December 31, 2012 and 2011
, together with fees for audit-related services and tax services rendered by KPMG for the years ended
December 31, 2012 and 2011
, respectively.
193
|
Year ended December 31,
|
||||||
|
2012
|
2011
|
|||||
|
Audit fees (1)
|
$
|
1,638,845
|
|
$
|
1,283,000
|
|
|
Audit-related fees
|
—
|
|
—
|
|
||
|
Tax fees (2)
|
514,774
|
|
567,760
|
|
||
|
All other fees
|
—
|
|
—
|
|
||
|
TOTAL
|
$
|
2,153,619
|
|
$
|
1,850,760
|
|
|
(1)
|
Audit fees consist principally of fees paid for the audit of our annual consolidated financial statements and review of our consolidated financial statements included in our quarterly reports.
|
|
(2)
|
Tax fees are comprised of tax compliance fees.
|
Approval of Services and Fees
Our audit committee has reviewed and approved all of the fees charged by KPMG for the years ended
December 31, 2012 and 2011
, and actively monitors the relationship between audit and non-audit services provided by KPMG. The audit committee concluded that all services rendered by KPMG during the years ended
December 31, 2012 and 2011
, respectively, were consistent with maintaining KPMG's independence. Accordingly, the audit committee has approved all of the services provided by KPMG. As a matter of policy, the Company will not engage its primary independent registered public accounting firm for non-audit services other than “audit-related services,” as defined by the SEC, certain tax services and other permissible non-audit services as specifically approved by the chairperson of the audit committee and presented to the full committee at its next regular meeting. The policy also includes limits on hiring partners of, and other professionals employed by, KPMG to ensure that the SEC's auditor independence rules are satisfied.
Under the policy, the audit committee must pre-approve any engagements to render services provided by the Company's independent registered public accounting firm and the fees charged for these services including an annual review of audit fees, audit-related fees, tax fees and other fees with specific dollar value limits for each category of service. During the year, the audit committee will periodically monitor the levels of fees charged by KPMG and compare these fees to the amounts previously approved. The audit committee also will consider on a case-by-case basis and, if appropriate, approve specific engagements that are not otherwise pre-approved. Any proposed engagement that does not fit within the definition of a pre-approved service may be presented to the chairperson of the audit committee for approval.
|
(a)
|
List of documents filed:
|
|
(b)
|
Financial Statements:
|
|
|
Report of Independent Registered Public Account Firm
|
|
|
|
The consolidated financial statements of the Company are set forth in the report in Item 8.
|
|
|
(2)
|
Financial Statement Schedules:
|
|
|
Financial statement schedule for the year ended December 31, 2012 is submitted herewith.
|
|
|
|
Real Estate and Accumulated Depreciation (Schedule III)
|
|
|
(3)
|
Exhibits:
|
|
|
The list of exhibits filed as part of this Annual Report is set forth on the Exhibit Index attached hereto.
|
|
194
|
(b)
|
Exhibits:
|
|
|
The exhibits filed in response to Item 601 of Regulation S-K are listed on the Exhibit Index attached hereto.
|
|
|
(c)
|
Financial Statement Schedules
|
All schedules other than those indicated in the index have been omitted as the required information is inapplicable or the information is presented in the consolidated financial statements or related notes.
195
SIGNATURES
Pursuant to the requirements of Section 13 or 15(d) of the Securities and Exchange Act of 1934, the registrant has duly caused this report to be signed on its behalf by the undersigned, thereunto duly authorized.
INLAND AMERICAN REAL ESTATE TRUST, INC.
|
|
|
/s/ Thomas P. McGuinness
|
|
By:
|
|
Thomas P. McGuinness
|
|
|
President
|
|
|
Date:
|
|
March 12, 2013
|
Pursuant to the requirements of the Securities Act of 1934, this report has been signed below by the following persons on behalf of the registrant and in the capacities and on the dates indicated.
|
|
|
Signature
|
|
Title
|
|
Date
|
|
By:
|
|
/s/ Robert D. Parks
|
|
Director and chairman of the board
|
|
March 12, 2013
|
|
Name:
|
|
Robert D. Parks
|
|
|
||
|
By:
|
|
/s/ Thomas P. McGuinness
|
|
President (principal executive officer)
|
|
March 12, 2013
|
|
Name:
|
|
Thomas P. McGuinness
|
|
|
||
|
By:
|
|
/s/ Jack Potts
|
|
Treasurer and principal financial officer
|
|
March 12, 2013
|
|
Name:
|
|
Jack Potts
|
|
|
||
|
By:
|
|
/s/ Anna N. Fitzgerald
|
|
Principal accounting officer
|
|
March 12, 2013
|
|
Name:
|
|
Anna N. Fitzgerald
|
|
|
||
|
By:
|
|
/s/ J. Michael Borden
|
|
Director
|
|
March 12, 2013
|
|
Name:
|
|
J. Michael Borden
|
|
|
||
|
By:
|
|
/s/ Thomas F. Meagher
|
|
Director
|
|
March 12, 2013
|
|
Name:
|
|
Thomas F. Meagher
|
|
|
||
|
By:
|
|
/s/ Paula Saban
|
|
Director
|
|
March 12, 2013
|
|
Name:
|
|
Paula Saban
|
|
|
||
|
By:
|
|
/s/ William J. Wierzbicki
|
|
Director
|
|
March 12, 2013
|
|
Name:
|
|
William J. Wierzbicki
|
|
|
||
|
By:
|
|
/s/ Thomas F. Glavin
|
|
Director
|
|
March 12, 2013
|
|
Name:
|
|
Thomas F. Glavin
|
|
|
||
|
By:
|
|
/s/ Brenda G. Gujral
|
|
Director
|
|
March 12, 2013
|
|
Name:
|
|
Brenda G. Gujral
|
|
|
||
196
EXHIBIT INDEX
|
EXHIBIT
NO.
|
|
DESCRIPTION
|
|
3.1
|
|
Sixth Articles of Amendment and Restatement of Inland American Real Estate Trust, Inc. (incorporated by reference to Exhibit 3.1 to the Registrant’s Form 8-K, as filed by the Registrant with the SEC on August 26, 2010)
|
|
3.2
|
|
Amended and Restated Bylaws of Inland American Real Estate Trust, Inc., effective as of April 1, 2008 (incorporated by reference to Exhibit 3.2 to the Registrant’s Form 8-K, as filed by the Registrant with the SEC on April 1, 2008), as amended by the Amendment to the Amended and Restated Bylaws of Inland American Real Estate Trust, Inc., effective as of January 20, 2009 (incorporated by reference to Exhibit 3.2 to the Registrant’s Form 8-K, as filed by the Registrant with the SEC on January 23, 2009)
|
|
4.1
|
|
Second Amended and Restated Distribution Reinvestment Plan (incorporated by reference to Exhibit 4.1 to the Registrant’s Form 8-K, as filed by the Registrant with the SEC on September 23, 2010)
|
|
4.2
|
|
Statement regarding restrictions on transferability of shares of common stock (to appear on stock certificate or to be sent upon request and without charge to stockholders issued shares without certificates) (incorporated by reference to Exhibit 4.4 to the Registrant’s Amendment No. 1 to Form S-11 Registration Statement, as filed by the Registrant with the SEC on July 31, 2007 (file number 333-139504))
|
|
10.1
|
|
First Amended and Restated Business Management Agreement, dated as of July 30, 2007, by and between Inland American Real Estate Trust, Inc. and Inland American Business Manager & Advisor, Inc. (incorporated by reference to Exhibit 10.1 to the Registrant’s Form 8-K, as filed by the Registrant with the SEC on August 3, 2009)
|
|
10.2.1
|
|
Master Management Agreement, dated as of July 1, 2012, by and between Inland American Real Estate Trust, Inc. and Inland American Apartment Management LLC (incorporated by reference to Exhibit 10.1 to the Registrant’s Form 8-K, as filed by the Registrant with the SEC on July 6, 2012)
|
|
10.2.2
|
|
Master Management Agreement, dated as of July 1, 2012, by and between Inland American Real Estate Trust, Inc. and Inland American Industrial Management LLC (incorporated by reference to Exhibit 10.2 to the Registrant’s Form 8-K, as filed by the Registrant with the SEC on July 6, 2012)
|
|
10.2.3
|
|
Master Management Agreement, dated as of July 1, 2012, by and between Inland American Real Estate Trust, Inc. and Inland American Office Management LLC (incorporated by reference to Exhibit 10.3 to the Registrant’s Form 8-K, as filed by the Registrant with the SEC on July 6, 2012)
|
197
|
EXHIBIT
NO.
|
|
DESCRIPTION
|
|
10.2.4
|
|
Master Management Agreement, dated as of July 1, 2012, by and between Inland American Real Estate Trust, Inc. and Inland American Retail Management LLC (incorporated by reference to Exhibit 10.4 to the Registrant's Form 8-K, as filed by the Registrant with the SEC on July 6, 2012)
|
|
10.2.5
|
|
Master Management Agreement and Property Management Agreement Extension Agreement, dated as of December 29, 2011, by and between Inland American Real Estate Trust, Inc. and Inland American Apartment Management LLC, Inland American Industrial Management LLC, Inland American Office Management LLC and Inland American Retail Management LLC (incorporated by reference to Exhibit 10.1 to the Registrant’s Form 8-K, as filed by the Registrant with the SEC on December 29, 2011)
|
|
10.3
|
|
First Amended and Restated Property Acquisition Agreement, dated as of July 30, 2007, by and between Inland American Real Estate Trust, Inc. and Inland American Real Estate Acquisitions, Inc. (incorporated by reference to Exhibit 10.3.1 to the Registrant’s Amendment No. 1 to Form S-11 Registration Statement, as filed by the Registrant with the SEC on July 31, 2007 (file number 333-139504))
|
|
10.4
|
|
Form of Indemnification Agreement (previously filed and incorporated by reference to Exhibit 10.5 to the Registrant’s Amendment No. 4 to Form S-11 Registration Statement, as filed by the Registrant with the SEC on August 18, 2005 (file number 333-122743))
|
|
10.5
|
|
Indemnity Agreement, dated as of June 9, 2008, by Inland American Real Estate Trust, Inc. in favor of and for the benefit of Inland Real Estate Acquisitions, Inc. (incorporated by reference to Exhibit 10.177 to the Registrant’s Form 8-K, as filed by the Registrant with the SEC on June 13, 2008)
|
|
10.6
|
|
Amended and Restated Independent Director Stock Option Plan (incorporated by reference to Exhibit 10.1 to the Registrant’s Form 8-K, as filed by the Registrant with the SEC on July 26, 2010)
|
|
10.7
|
|
Articles of Association of Oak Real Estate Association by and among Inland Real Estate Corporation, Inland Real Estate Trust, Inc., Inland Western Retail Real Estate Trust, Inc. and Inland American Real Estate Trust, Inc., dated September 29, 2006 (incorporated by reference to Exhibit 10.139 to the Registrant’s Quarterly Report on Form 10-Q, as filed by the Registrant with the SEC on November 7, 2006)
|
|
10.8
|
|
Operating Agreement of Oak Property and Casualty L.L.C. by and among Inland Real Estate Corporation, Inland Retail Real Estate Trust, Inc., Inland Western Retail Real Estate Trust, Inc. and Inland American Real Estate Trust, Inc, dated September 29, 2006 (incorporated by reference to Exhibit 10.140 to the Registrant’s Quarterly Report on Form 10-Q, as filed by the Registrant with the SEC on November 7, 2006)
|
|
10.9
|
|
Oak Property and Casualty L.L.C. Membership Participation Agreement by and among Inland Real Estate Corporation, Inland Retail Real Estate Trust, Inc., Inland Western Retail Real Estate Trust, Inc., Inland American Real Estate Trust, Inc., and Oak Property and Casualty L.L.C. dated September 29, 2006 (incorporated by reference to Exhibit 10.141 to the Registrant’s Quarterly Report on Form 10-Q, as filed by the Registrant with the SEC on November 7, 2006)
|
|
10.10
|
Letter Agreement, dated May 4, 2012, from Inland American Business Manager & Advisor, Inc. to Inland American Real Estate Trust, Inc. (incorporated by reference to Exhibit 10.1 to the Registrant's Quarterly Report on Form 10-Q, as filed by the Registrant with the SEC on May 7, 2012)
|
|
|
14.1
|
Code of Ethics
|
|
|
21.1
|
|
Subsidiaries of the Registrant*
|
|
23.1
|
|
Consent of KPMG LLP*
|
198
|
EXHIBIT
NO.
|
|
DESCRIPTION
|
|
31.1
|
|
Certification by Principal Executive Officer pursuant to Section 302 of the Sarbanes-Oxley Act of 2002*
|
|
31.2
|
|
Certification by Principal Financial Officer pursuant to Section 302 of the Sarbanes-Oxley Act of 2002*
|
|
32.1
|
|
Certification by Principal Executive Officer pursuant to Section 906 of the Sarbanes-Oxley Act of 2002*
|
|
32.2
|
|
Certification by Principal Financial Officer pursuant to Section 906 of the Sarbanes-Oxley Act of 2002*
|
|
99.1
|
|
Non-Retaliation Policy (incorporated by reference to Exhibit 99.1 to the Registrant’s Form S-11 Registration Statement, as filed by the Registrant with the SEC on February 11, 2005 (file number 333-122743))
|
|
99.2
|
|
Responsibilities of the Compliance Officer of the Company (incorporated by reference to Exhibit 99.2 to the Registrant’s Form S-11 Registration Statement, as filed by the Registrant with the SEC on February 11, 2005 (file number 333-122743))
|
|
99.3
|
|
First Amended and Restated Articles of Incorporation of Minto Builders (Florida), Inc. (incorporated by reference to Exhibit 99.1 to the Registrant’s Form 8-K, as filed by the Registrant with the SEC on October 17, 2005)
|
|
99.4
|
|
Articles of Amendment to the First Amended and Restated Articles of Incorporation of Minto Builders (Florida), Inc. with Respect to 3.5% Series A Cumulative Redeemable Preferred Stock (incorporated by reference to Exhibit 99.2 to the Registrant’s Form 8-K, as filed by the Registrant with the SEC on October 17, 2005)
|
|
99.5
|
|
Second Amended and Restated Articles of Incorporation of Minto Builders (Florida), Inc. (incorporated by reference to Exhibit 99.3 to the Registrant’s Form 8-K, as filed by the Registrant with the SEC on October 17, 2005)
|
|
99.6
|
|
Articles of Amendment to the Second Amended and Restated Articles of Incorporation of Minto Builders (Florida), Inc. with Respect to Convertible Special Voting Stock (incorporated by reference to Exhibit 99.4 to the Registrant’s Form 8-K, as filed by the Registrant with the SEC on October 17, 2005)
|
|
99.7
|
|
Articles of Amendment to the Second Amended and Restated Articles of Incorporation of Minto Builders (Florida), Inc. with Respect to 125 Shares of 12.5% Series B Cumulative Non-Voting Preferred Stock (incorporated by reference to Exhibit 99.5 to the Registrant’s Form 8-K, as filed by the Registrant with the SEC on October 17, 2005)
|
|
99.8
|
|
Amended and Restated Share Repurchase Program, effective April 11, 2011 (incorporated by reference to Exhibit 99.3 to the Registrant’s Form 8-K, as filed by the Registrant with the SEC on March 11, 2011), as amended by the First Amendment to the Amended and Restated Share Repurchase Program of Inland American Real Estate Trust, Inc., effective August 12, 2011 (incorporated by reference to Exhibit 99.2 to the Registrant’s Form 8-K, as filed by the Registrant with the SEC on July 12, 2011),
|
|
99.9
|
|
Second Amended and Restated Share Repurchase Program, effective February 1, 2012 (incorporated by reference to Exhibit 99.2 to the Registrant’s Form 8-K, as filed by the Registrant with the SEC on December 29, 2011)
|
|
101
|
|
The following financial information from our Annual Report on Form 10-K for the year ended December 31, 2011, filed with the Securities and Exchange Commission on March 8, 2012, is formatted in Extensible Business Reporting Language (“XBRL”): (i) Consolidated Balance Sheets, (ii) Consolidated Statements of Operations and Other Comprehensive Income, (iii) Consolidated Statements of Equity, (iv) Consolidated Statements of Cash Flows (v) Notes to Consolidated Financial Statements (tagged as blocks of text).**
|
|
*
|
Filed as part of this Annual Report on Form 10-K.
|
|
**
|
The XBRL related information in Exhibit 101 to this Annual Report on Form 10-K shall not be deemed “filed” for purposes of Section 18 of the Securities and Exchange Act of 1934, as amended, or otherwise subject to liability of that section and shall not be incorporated by reference into any filing or other document pursuant to the Securities Act of 1933, as amended, except as shall be expressly set forth by specific reference in such filing or document.
|
199
TABLE OF CONTENTS
Part IItem 1. BusinessItem 1A. Risk FactorsItem 1B. Unresolved Staff CommentsItem 2. PropertiesItem 3. Legal ProceedingsItem 4. Mine Safety DisclosuresPart IIItem 5. Market For Registrant S Common Equity, Related Stockholder Matters and Issuer Purchases Of Equity SecuritiesItem 6. Selected Financial DataItem 7. Management S Discussion and Analysis Of Financial Condition and Results Of OperationsItem 7A. Quantitative and Qualitative Disclosures About Market RiskItem 8. Consolidated Financial Statements and Supplementary DataItem 9. Changes in and Disagreements with Accountants on Accounting and Financial DisclosureItem 9A. Controls and ProceduresItem 9B. Other InformationPart IIIItem 10. Directors, Executive Officers and Corporate GovernanceItem 11. Executive CompensationItem 12. Security Ownership Of Certain Beneficial Owners and Management and Related Stockholder MattersItem 13. Certain Relationships and Related Transactions, and Director IndependenceItem 14. Principal Accounting Fees and ServicesPart IVItem 15. Exhibits and Financial Statement Schedules