INVESCO LTD.
10-Ks and 10-Qs
|
|
|
|
|
|
|
|
|
|
|
|
|
|
|
|
|
|
|
|
|
|
|
|
|
|
|
|
|
|
|
|
|
|
|
|
|
|
|
|
|
|
|
|
|
|
|
|
|
|
|
|
|
|
|
|
UNITED STATES SECURITIES AND EXCHANGE COMMISSION
Washington, D.C. 20549
Form 10-K
(Mark One)
|
þ
|
ANNUAL REPORT PURSUANT TO SECTION 13 OR 15(d) OF THE SECURITIES EXCHANGE ACT OF 1934
|
|
For the fiscal year ended
December 31, 2017
OR
|
o
|
TRANSITION REPORT PURSUANT TO SECTION 13 OR 15(d) OF THE SECURITIES EXCHANGE ACT OF 1934
|
|
For the transition period from
to
Commission file number 1-13908

Invesco Ltd.
(Exact Name of Registrant as Specified in Its Charter)
|
Bermuda
(State or Other Jurisdiction of Incorporation or Organization)
|
98-0557567
(I.R.S. Employer Identification No.)
|
|
|
1555 Peachtree Street, N.E., Suite 1800, Atlanta, GA
(Address of Principal Executive Offices)
|
30309
(Zip Code)
|
|
Registrant’s telephone number, including area code: (404) 892-0896
Securities registered pursuant to Section 12(b) of the Act:
|
Title of Each Class
|
Name of Exchange on Which Registered
|
|
|
Common Shares, $0.20 par value per share
|
New York Stock Exchange
|
|
Securities registered pursuant to Section 12(g) of the Act: None
Indicate by check mark if the registrant is a well-known, seasoned issuer, as defined in Rule 405 of the Securities Act. Yes
þ
No
o
Indicate by check mark if the registrant is not required to file reports pursuant to Section 13 or Section 15(d) of the Act. Yes
o
No
þ
Indicate by check mark whether the registrant: (1) has filed all reports required to be filed by Section 13 or 15(d) of the Securities Exchange Act of 1934 during the preceding 12 months (or for such shorter period that the registrant was required to file such reports), and (2) has been subject to such filing requirements for the past 90 days. Yes
þ
No
o
Indicate by check mark whether the registrant has submitted electronically and posted on its corporate website, if any, every Interactive Data File required to be submitted and posted pursuant to Rule 405 of Regulation S-T during the preceding 12 months (or for such shorter period that the registrant was required to submit and post such files). Yes
þ
No
o
Indicate by check mark if disclosure of delinquent filers pursuant to Item 405 of Regulation S-K (§ 229.405 of this chapter) is not contained herein, and will not be contained, to the best of registrant's knowledge, in definitive proxy or information statements incorporated by reference in Part III of this Form 10-K or any amendment to this Form 10-K.
þ
Indicate by check mark whether the registrant is a large accelerated filer, an accelerated filer, a non-accelerated filer, smaller reporting company, or an emerging growth company. See the definitions of “large accelerated filer,” “accelerated filer,” “smaller reporting company,” and "emerging growth company" in Rule 12b-2 of the Exchange Act. (Check one):
|
Large accelerated filer
þ
|
Accelerated filer
o
|
Non-accelerated filer
o
(Do not check if a smaller reporting company)
|
Smaller reporting company
o
|
|||
|
Emerging growth company
o
|
||||||
If an emerging growth company, indicate by check mark if the registrant has elected not to use the extended transition period for complying with any new or revised financial accounting standards provided pursuant to Section 13(a) of the Exchange Act.
o
Indicate by check mark whether the registrant is a shell company (as defined in Rule 12b-2 of the Exchange Act.) Yes
o
No
þ
At
June 30, 2017
, the aggregate market value of the voting stock held by non-affiliates was
$14.1 billion
, based on the closing price of the registrant's Common Shares, par value U.S. $0.20 per share, on the New York Stock Exchange. At
January 31, 2018
, the most recent practicable date, the number of Common Shares outstanding was
407,147,646
.
DOCUMENTS INCORPORATED BY REFERENCE
The registrant will incorporate by reference information required in response to Part III, Items 10-14 in its definitive Proxy Statement for its annual meeting of shareholders, to be filed with the Securities and Exchange Commission within 120 days after
December 31, 2017
.
1
TABLE OF CONTENTS
We include cross references to captions elsewhere in this Annual Report on Form 10-K, which we refer to as this “Report,” where you can find related additional information. The following table of contents tells you where to find these captions.
|
Page
|
|
2
SPECIAL CAUTIONARY NOTE REGARDING FORWARD-LOOKING STATEMENTS
This Report, other public filings and oral and written statements by us and our management, may include statements that constitute “forward-looking statements” within the meaning of the United States securities laws. These statements are based on the beliefs and assumptions of our management and on information available to us at the time such statements are made. Forward-looking statements include information concerning future results of our operations, expenses, earnings, liquidity, cash flows and capital expenditures, industry or market conditions, assets under management, acquisitions and divestitures, debt and our ability to obtain additional financing or make payments, regulatory developments, demand for and pricing of our products, the prospects for certain legal contingencies, and other aspects of our business or general economic conditions. In addition, when used in this Report or such other documents or statements, words such as “believes,” “expects,” “anticipates,” “intends,” “plans,” “estimates,” “projects,” “forecasts,” and future or conditional verbs such as “will,” “may,” “could,” “should,” and “would,” and any other statement that necessarily depends on future events, are intended to identify forward-looking statements.
Forward-looking statements are not guarantees and they involve risks, uncertainties and assumptions. Although we make such statements based on assumptions that we believe to be reasonable, there can be no assurance that actual results will not differ materially from our expectations. In most cases, such assumptions will not be expressly stated. We caution investors not to rely unduly on any forward-looking statements.
The following important factors, and other factors described elsewhere in this Report or contained in our other filings with the U.S. Securities and Exchange Commission (SEC), among others, could cause our results to differ materially from any results described in any forward-looking statements:
|
•
|
significant fluctuations in the performance of capital and credit markets worldwide;
|
|
•
|
adverse changes in the global economy;
|
|
•
|
any inability to adjust our expenses quickly enough to match significant deterioration in markets;
|
|
•
|
significant changes in net asset flows into or out of the accounts we manage or declines in market value of the assets in, or redemptions or other withdrawals from, those accounts;
|
|
•
|
variations in demand for our investment products or services, including termination or non-renewal of our investment management agreements;
|
|
•
|
the effect of fluctuations in interest rates, liquidity and credit markets in the U.S. or globally;
|
|
•
|
the investment performance of our investment products;
|
|
•
|
the effect of non-performance by our counterparties;
|
|
•
|
adverse changes in laws or regulations, adverse results in litigation and any other regulatory or other proceedings, governmental investigations, and enforcement actions;
|
|
•
|
the effect of political, economic or social instability in or involving countries in which we invest or do business (including the effect of terrorist attacks, war and other hostilities);
|
|
•
|
our ability to attract and retain key personnel, including investment management professionals;
|
|
•
|
harm to our reputation;
|
|
•
|
our ability to comply with client contractual requirements and/or investment guidelines despite preventative compliance procedures and controls;
|
|
•
|
competitive pressures in the investment management business which may force us to reduce fees we earn;
|
|
•
|
the effect of consolidation in the investment management business;
|
|
•
|
our ability to develop, introduce and support new investment products and services;
|
|
•
|
our ability to acquire and integrate other companies into our operations successfully and the extent to which we can realize anticipated product sales, cost savings or synergies from such acquisitions;
|
|
•
|
our ability to implement our ongoing company-wide transformational initiatives;
|
|
•
|
our ability to access the capital markets in a timely manner;
|
|
•
|
our debt and the limitations imposed by our credit facility;
|
|
•
|
limitations or restrictions on access to distribution channels for our products;
|
|
•
|
the occurrence of breaches and errors in the conduct of our business, including any failure to properly safeguard confidential and sensitive information, cyber-attacks or acts of fraud;
|
|
•
|
the effect of failures or delays in support systems or customer service functions, and other interruptions of our operations;
|
|
•
|
the effect of failures by third party service providers and other key vendors to fulfill their obligations;
|
|
•
|
exchange rate fluctuations, especially as against the U.S. Dollar;
|
|
•
|
impairment of goodwill and other intangible assets; and
|
|
•
|
enactment of adverse federal, state or foreign legislation or changes in government policy or regulation (including accounting standards) affecting our operations, our capital requirements or the way in which our profits are taxed.
|
3
Other factors and assumptions not identified above were also involved in the derivation of these forward-looking statements, and the failure of such other assumptions to be realized may also cause actual results to differ materially from those projected. For more discussion of the risks affecting us, please refer to Item 1A, “Risk Factors.”
You should consider the areas of risk described above in connection with any forward-looking statements that may be made by us and our businesses generally. We expressly disclaim any obligation to update any of the information in this or any other public report if any forward-looking statement later turns out to be inaccurate, whether as a result of new information, future events or otherwise. For all forward-looking statements, we claim the “safe harbor” provided by Section 27A of the Securities Act of 1933, as amended, and Section 21E of the Securities Exchange Act of 1934, as amended.
Item 1.
Business
Introduction
Invesco Ltd. (Invesco or the company) is an independent investment management firm dedicated to delivering an investment experience that helps people get more out of life. Our comprehensive range of active, passive and alternative investment capabilities has been constructed over many years to help clients achieve their investment objectives. We draw on this comprehensive range of capabilities to provide customized solutions designed to deliver key outcomes aligned to client needs (our most important benchmark). Our ability to draw on our comprehensive range of capabilities to provide solutions to clients enables us to provide an investment experience that helps people get more out of life.
With more than 7,000 employees and an on-the-ground presence in 25 countries, Invesco is well positioned to meet the needs of investors across the globe. We have specialized investment teams managing investments across a broad range of asset classes, investment styles and geographies. We provide a comprehensive range of investment capabilities and outcomes, delivered through a diverse set of investment vehicles, to help clients achieve their investment objectives. For decades, individuals and institutions have viewed our organization as a trusted partner for a broad range of investment needs. We have a significant presence in the retail and institutional markets within the investment management industry in North America, EMEA (Europe, Middle East and Africa) and Asia-Pacific, serving clients in more than
150
countries. As of
December 31, 2017
, the firm managed
$937.6 billion
in assets for investors around the world.
The key drivers of success for Invesco are long-term investment performance, high-quality client service and effective distribution relationships, delivered across a diverse spectrum of investment management capabilities, distribution channels, geographic areas and market exposures. By achieving success in these areas, we seek to deliver better outcomes for clients and generate competitive investment results, positive net flows, increased assets under management (AUM) and associated revenues. We are affected significantly by market movements, which are beyond our control; however, we endeavor to mitigate the impact of market movements by maintaining broad diversification across asset classes, investment vehicles, client domiciles and geographies. We measure relative investment performance by comparing our investment capabilities to competitors' products, industry benchmarks and client investment objectives. Generally, distributors, investment advisors and consultants take into consideration longer-term investment performance (e.g., three-year and five-year performance) in their selection of investment products and manager recommendations to their clients, although shorter-term performance may also be an important consideration. Third-party ratings may also influence client investment decisions. We monitor quality of client service in a variety of ways, including periodic client satisfaction surveys, analysis of response times and redemption rates, competitive benchmarking of services and feedback from investment consultants.
Invesco Ltd. is organized under the laws of Bermuda, and our common shares are listed and traded on the New York Stock Exchange under the symbol “IVZ.” We maintain a website at www.invesco.com. (Information contained on our website shall not be deemed to be part of, or be incorporated into, this document).
Strategy
The company focuses on four key long-term strategic objectives that are designed to sharpen our focus on client needs, further strengthen our business over time and help ensure our long-term success:
|
•
|
Achieve strong, long-term investment performance
across distinct investment capabilities with clearly articulated investment philosophies and processes, aligned with client needs;
|
|
•
|
Be instrumental to our clients' success
by delivering our distinctive investment capabilities worldwide to meet their needs;
|
4
|
•
|
Harness the power of our global platform
by continuously improving execution effectiveness to enhance quality and productivity, and allocating our resources to the opportunities that will best benefit clients and our business; and
|
|
•
|
Perpetuate a high-performance organization
by driving greater transparency, accountability, diversity of thought, fact-based decision making and execution at all levels.
|
As an integrated global investment manager, we are keenly focused on meeting clients' needs and operating effectively and efficiently as an integrated, global organization. We take a unified approach to our business and present our financial statements and other disclosures under the single operating segment “investment management.” See Item
8
, Financial Statements and Supplementary Data - Note
17
,
"Geographic Information,” for a geographic breakdown of our consolidated operating revenues for the years ended
December 31, 2017
,
2016
and
2015
.
One of Invesco's great strengths is our separate, distinct investment teams in multiple markets across the globe. A key focus of our business is fostering a strong investment culture and providing the support that enables our investment teams to maintain well-performing investment capabilities. The ability to leverage the capabilities of our investment teams to help clients across the globe achieve their investment objectives is a significant differentiator for our firm.
2017 Developments
Throughout 2017, we continued to execute on our long-term strategic objectives, which further improved our ability to serve clients, strengthened our investment performance and helped us deliver competitive levels of operating income and margins. We also took advantage of opportunities in the market and further invested in our products and capabilities, our global platform and our people in ways that strengthened our business and further differentiated us in the marketplace to help ensure our long-term success.
Invesco achieved solid growth across our global business during 2017, supported by our strong, long-term investment performance, our comprehensive range of strategies and solutions and our robust client engagement efforts. Our broadly diversified offering, combined with our strong investment performance, contributed to long-term AUM net inflows of
$11.5 billion
during 2017. Also during 2017, we launched several new products and further invested in key parts of our business that will benefit our clients and enhance our competitiveness over the long term. We continued to invest in capabilities where we see strong client demand or future opportunities by hiring world-class talent, upgrading our technology platform, launching new products and providing additional resources where necessary. The ability to leverage the capabilities developed by our investment teams to meet client demand across the globe is a significant differentiator for our firm, and we will continue to bring the best of Invesco to different parts of our business where it makes sense for our clients. More specifically, in 2017 Invesco:
|
▪
|
Further strengthened our investment culture, which enabled us to deliver strong, long-term investment performance to our clients across the globe, with
64%
and
75%
of measured actively managed ranked assets in the top half of peer groups* on a three- and five-year basis, respectively, as of December 31, 2017;
|
|
▪
|
2017 marked the ninth consecutive year of positive long-term net flows;
|
|
▪
|
Completed the acquisition of Source, a leading independent specialist provider of exchange-traded funds (ETFs) based in Europe (European ETF business), which added $26.0 billion in AUM (including approximately $7 billion of externally managed AUM) at acquisition date. The combination strengthens Invesco’s existing factor-based capabilities, provides additional scale and relevance in the European ETF market and enhances the firm’s ability to meet client needs globally;
|
|
▪
|
Entered into a definitive agreement to acquire Guggenheim Investments' ETF business, which included
76
ETFs with
$38.4 billion of assets under management as of December 31, 2017
. The acquisition is expected to close in the second quarter of 2018 for an anticipated purchase price of $1.2 billion to be paid in cash. The acquisition will expand the depth, breadth and diversity of Invesco's traditional and smart beta ETFs, while providing additional scale and relevance in the growing ETF market globally. It will also build on our existing self-indexing capability and bring in highly complementary capabilities that further strengthen our ability to deliver the outcomes clients seek and position us for accelerated growth in the future;
|
|
▪
|
Further expanded and enhanced our ability to help advisors engage with clients and improve their investment experience at scale through Jemstep. Announced partnerships with a number of large enterprises for our digital advice capability through Jemstep, and are well down the implementation path with several of them. Jemstep differentiates itself by offering an advisor-powered technology, enhancing the human touch to provide better outcomes to a greater number of clients. While other systems focus on a limited set of market-cap weighted ETFs, Jemstep allows advisors to offer a variety of vehicles, asset classes and investment styles that ultimately help clients achieve their investment objectives;
|
|
▪
|
Further strengthened our investment and distribution teams through new hires and our efforts to attract, develop, motivate and retain the best talent in the industry;
|
5
|
▪
|
Launched a variety of new funds and ETFs which will strengthen our ability to help clients achieve their investment objectives;
|
|
•
|
Added five new funds including a global multi-asset fund to further expand our Cross-Border product range of active capabilities to meet investor demand for medium to long term outcomes, leveraging our global platform;
|
|
•
|
Launched two new income-focused ETFs in order to help investors diversify their income portfolio, providing exposure to intermediate-term corporate bonds and REITs to Canadian real estate investment trusts;
|
|
•
|
Was awarded an A+ rating for the overall approach to responsible investment (strategy and governance) in the 2017 PRI (Principles for Responsible Investment) assessment. The PRI carries out the annual assessment based on how each signatory has progressed year-on-year and relative to peers;
|
|
•
|
Invesco Income Growth Trust received recognition as the investment trust that increased its dividend every year for at least the past 20 years, according to the Association of Investment Companies;
|
|
•
|
Continued to expand our Invesco Solutions team, which brings together the full capabilities of the firm to provide outcomes that help clients meet their investment objectives;
|
|
•
|
Invesco was the winner of the Thomson Reuters Lipper Fund Awards in Canada and received 11 Lipper fund awards for select Trimark, Invesco and PowerShares products and was also named Best Equity ETF Group;
|
|
•
|
Invesco Perpetual was named "Fund Manager of the Year" for the third year running by Tenet Group, and was also the winner at the 2017 Investment Life & Pensions Moneyfacts Awards, and won the Best Targeted Absolute Return Fund Provide Winner Award, as well as the Highly Commended Best Investment Fund Provider Award. Invesco Perpetual expanded its fixed income fund offering with the launch of the Invesco Perpetual Global Emerging Market Bond Fund;
|
|
•
|
Invesco International Growth Funds in the U.S. celebrated 25 years of out-performance. The fund has consistently outperformed its benchmark 100% of the time over all 80 quarterly five-year rolling periods since inception;
|
|
•
|
Invesco Real Estate (IRE) launched an open-ended fund investing in the pan-European (ex-UK) hotel sector and closed the acquisition of a €530m pan-European hotel portfolio, is one of the industry’s largest pan-European deals of institutional investment into the hotel real estate sector in 2017; and
|
|
•
|
Invesco Global Targeted Returns Fund (GTR) won the prestigious Money Management Fund Manager of the Year Awards in Australia.
|
____________
|
*
|
As of
December 31, 2017
,
64%
and
75%
of ranked assets were performing in the top half of peer groups on a 3- and 5-year basis. See Item
7,
“Management's Discussion and Analysis of Financial Condition and Results of Operations - Investment Capabilities Performance Overview,” for more discussion of AUM rankings by investment capability, including additional data regarding the proportion of ranked AUM to total AUM.
|
Combined, these efforts helped us deliver better outcomes for clients while achieving further growth across our global business and further strengthening our competitive position. We continue to believe we are in the early stages of achieving the full potential of our global business.
Industry Trends
Trends around the world continue to transform the investment management industry and underscore the need to be well diversified with broad capabilities globally and across asset classes:
|
•
|
Clients are demanding more from investment managers. While investment performance remains paramount, client engagement and value-added services (including portfolio analytics and providing consultative solutions) increasingly differentiate managers. Invesco is working to enhance the client's user experience through digital marketing (web, mobile, social) and improved service.
|
|
•
|
Due to divergent central bank monetary policies between the U.S Federal Reserve and the central banks of other developed economies , investors are seeking outcome-orientated investment solutions that provide income and manage volatility. The building out of Invesco Solutions to respond to this trend is among the firm's top priorities.
|
|
•
|
Investors are continuing to shift to alternative, passive, and smart beta strategies. As a consequence, client demand for core equities and fixed income portfolios are declining as a share of global flows. Our PowerShares ETFs remain a leader in smart beta ETFs and Invesco has a strong lineup of alternative and multi-asset strategies supported by ongoing product development. Invesco expanded its broad range of ETF capabilities in 2017 with the acquisition of a leading, independent, diversified, at-scale ETF provider in Europe, and the planned acquisition of Guggenheim Investments’ ETF business, which is expected to close in the second quarter of 2018. By expanding the depth, breadth and diversity of Invesco’s traditional and smart beta ETFs, the planned Guggenheim Investments’ ETF business acquisition will significantly enhance our ability to deliver meaningful solutions to institutional and retail clients across the globe.
|
6
|
•
|
We are seeing increased pressure on pricing within the asset management industry, arising from further concentration within our channel distribution partners (which increases their ability to negotiate pricing) and additional regulatory scrutiny on industry fees.
|
|
•
|
Distribution partners are becoming more selective and are moving towards developing fewer relationships and partners, reducing the number of investment managers with whom they work, especially in the U.S. driven by the rules adopted by the Department of Labor.
|
|
•
|
Regulatory activity remains at increased levels and is influencing competitive dynamics. Increased regulatory scrutiny of managers has focused on many areas including transparency/unbundling of fees, inducements, conflicts of interest, capital, liquidity, solvency, leverage, operational risk management, controls and compensation. Invesco continues to proactively work with regulators around the world. Efforts to further modernize and strengthen our global platform will enhance our ability to compete effectively across markets while complying with the variety of applicable regulatory regimes.
|
|
•
|
Although the developed markets in the U.S. and Europe are currently the two largest markets for financial assets by a wide margin, other key emerging markets in the world, such as China and India, are positioned for future growth despite near-term headwinds. As these population-heavy markets mature, we believe investment managers that are truly global will be in the best position to capture this growth. Additionally, population age differences between emerging and developed markets will result in differing investment needs and horizons among countries. Asset allocation and retirement savings schemes also differ substantially among countries. We believe firms such as Invesco, with diversified investment capabilities and product types, are best positioned to meet clients' needs in this global competitive landscape. Invesco has a meaningful market presence in many of the world's most attractive regions, including North America, EMEA and Asia-Pacific. We believe our strong and growing presence in established and emerging markets provides significant long-term growth potential for our business.
|
|
•
|
Technology advances are impacting core elements of the investment management industry which lags other industries in its use of technology. Clients increasingly seek to interact digitally with their investment portfolios. This is leading to established managers investing in and/or acquiring "robo" platforms. As the investment management business becomes more complex, automation will become increasingly important to serve clients effectively and efficiently. Invesco is leveraging technology in all aspects of its business and exploring opportunities to work with third-party technology firms to enhance our clients' investment experience. This includes the addition of Jemstep, our advisor-powered digital advice capability, to offer digital advice as a means for strengthening existing client relationships by offering a comprehensive wealth management service.
|
As a result of the trends discussed above, there are increased signs of a maturing industry in which consolidation is likely to occur. We believe Invesco is well positioned to take advantage of opportunities created by these global industry trends. Our comprehensive range of investment capabilities and broad diversification enable us to continue meeting client needs and strengthen our competitive position through a variety of economic and market environments. Our multi-year strategic objectives are designed to leverage our global presence, our distinctive investment capabilities and our talented people to help us meet client needs. We believe firmly that if we help clients achieve their investment objectives and manage our business effectively and efficiently, we can further grow our business and deliver strong results to shareholders over the long term.
Investment Management Capabilities
Supported by a global platform, Invesco delivers a comprehensive array of investment capabilities and services to retail and institutional investors. We have a significant presence in the retail and institutional markets within the investment management industry in North America, EMEA and Asia-Pacific, serving clients in more than
150
countries.
We believe that the proven strength of our distinct and globally located investment teams and their well-defined investment disciplines and risk management approach provide us with a robust competitive advantage. There are few independent investment managers with teams as globally diverse as Invesco's and with the same breadth and depth of investment capabilities and vehicles. We offer multiple investment objectives within the various asset classes and products that we manage. Our asset classes, broadly defined, include money market, balanced, equity, fixed income and alternatives.
7
The following sets forth our managed investment objectives by asset class:
|
Money Market
|
Balanced
|
Equity
|
Fixed Income
|
Alternatives
|
|
●Cash Plus
|
●Balanced Risk
|
●Emerging Markets
|
●Convertibles
|
●Absolute Return
|
|
●Government/Treasury
|
●Global
|
●International/Global
|
●Core/Core Plus
|
●Commodities
|
|
●Prime
|
● Single Country
|
●Large Cap Core
|
●Emerging Markets
|
●Currencies
|
|
●Taxable
|
●Target Date
|
●Large Cap Growth
|
●Enhanced Cash
|
●Financial Structures
|
|
●Tax-Free
|
●Target Risk
|
●Large Cap Value
|
●Government Bonds
|
●Global Macro
|
|
●Custom Solutions
|
●Traditional Balanced
|
●Low Volatility
|
●High-Yield Bonds
|
●Long/Short Equity
|
|
●Custom Solutions
|
●Mid Cap Core
|
●Intermediate Term
|
●Managed Futures
|
|
|
●Mid Cap Growth
|
●International/Global
|
●Multi-Alternatives
|
||
|
●Mid Cap Value
|
●Investment Grade Credit
|
●Private Capital - Direct
|
||
|
●Passive/Enhanced
|
●Multi-Sector
|
●Private Capital - Fund of Funds
|
||
|
●Regional/Single Country
|
●Municipal Bonds
|
●Private Direct Real Estate
|
||
|
●Sector Funds
|
●Passive/Enhanced
|
●Public Real Estate Securities
|
||
|
●Small Cap Core
|
●Short Duration
|
●Senior Secured Loans
|
||
|
●Small Cap Growth
|
●Stable Value
|
●Custom Solutions
|
||
|
●Small Cap Value
|
●Structured Securities
|
|||
|
●Environmental, Social and Governance
|
●Environmental, Social and Governance
|
|||
|
●Smart Beta
|
●Smart Beta
|
|||
|
●Custom Solutions
|
●Custom Solutions
|
|||
Distribution Channels
Retail AUM originates from clients investing into funds available to the public in the form of shares or units. Institutional AUM originates from entities such as individual corporate clients, insurance companies, endowments, foundations, government authorities, universities or charities. AUM disclosure by distribution channel represents consolidated AUM distributed by type of sales team (the company's internal distribution channels). AUM amounts disclosed as retail channel AUM represents AUM distributed by the company's retail sales team; whereas AUM amounts disclosed as institutional channel AUM represents AUM distributed by the company's institutional sales team.
The company operates as an integrated global investment manager, presenting itself as a single firm to clients around the world. This is supported with the cross-selling of investment capabilities globally and an integrated internal sales force. As a result, the company's retail and institutional sales forces are able to sell products that cross over traditional delineations of retail or institutional vehicle types. Therefore, not all products sold in the disclosed retail distribution channel are "retail" products, and not all products sold in the disclosed institutional channel are "institutional" products. This aggregation, however, is viewed as a proxy for presenting AUM in the retail and institutional markets in which we operate.
The following lists our primary investment vehicles by distribution channel:
|
Retail
|
Institutional
|
||
|
● Closed-end Mutual Funds
|
● Collective Trust Funds
|
||
|
● Exchange-traded Funds (ETF)
|
● Exchange-traded Funds (ETF)
|
||
|
● Individual Savings Accounts (ISA)
|
● Institutional Separate Accounts
|
||
|
● Investment Companies with Variable Capital (ICVC)
|
● Open-end Mutual Funds
|
||
|
● Société d'investissement à Capital Variable (SICAV)
|
● Private Capital Funds
|
||
|
● Investment Trusts
|
|||
|
● Open-end Mutual Funds
|
|||
|
● Separately Managed Accounts (SMA)
|
|||
|
● Unit Investment Trusts (UIT)
|
|||
|
● Variable Insurance Funds
|
|||
8
Retail
Invesco is a significant provider of retail investment solutions to clients in all major markets including North America, EMEA and Asia-Pacific. Retail AUM was
$637.0 billion
at
December 31, 2017
. We offer retail products within all of the major asset classes. Our retail products are primarily distributed through third-party financial intermediaries, including major wire houses, fund supermarkets, regional broker-dealers, insurance companies, banks and financial planners in North America, and independent brokers and financial advisors, banks and supermarket platforms in Europe and Asia.
The U.K., North American and Continental European retail operations rank among the largest by AUM in their respective markets. As of
December 31, 2017
, Invesco Perpetual was the largest retail fund provider in the U.K.; Invesco's U.S. retail business, including our PowerShares ETF franchise, was among the 10 largest non-proprietary fund complexes in the U.S. by long-term assets and Invesco in Continental Europe was among the largest non-proprietary investment managers in the retail channel. Invesco Great Wall, our joint venture in China, was one of the largest Sino-foreign managers of equity products in China, with AUM of approximately
$17.4 billion
as of
December 31, 2017
. We provide our retail clients with one of the industry's most robust and comprehensive product lines.
Institutional
We provide investment solutions to institutional investors globally, with a major presence in North America, EMEA and Asia-Pacific. Institutional AUM was
$300.6 billion
in AUM as of
December 31, 2017
. We offer a broad suite of domestic and global strategies, including traditional and quantitative equities, fixed income (including money market funds for institutional clients), real estate, private equity, financial structures and absolute return strategies. Regional sales forces distribute our products and provide services to clients and intermediaries around the world. We have a diversified client base that includes major public entities, corporations, unions, non-profit organizations, endowments, foundations, pension funds, financial institutions and sovereign wealth funds. Invesco's institutional money market funds serve some of the largest financial institutions, government entities and corporations in the world.
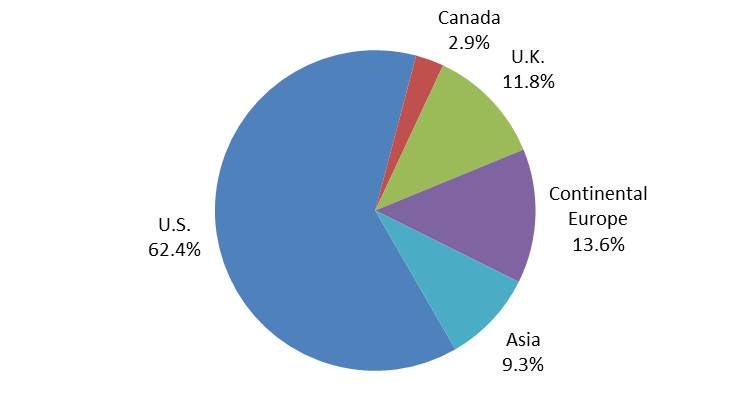
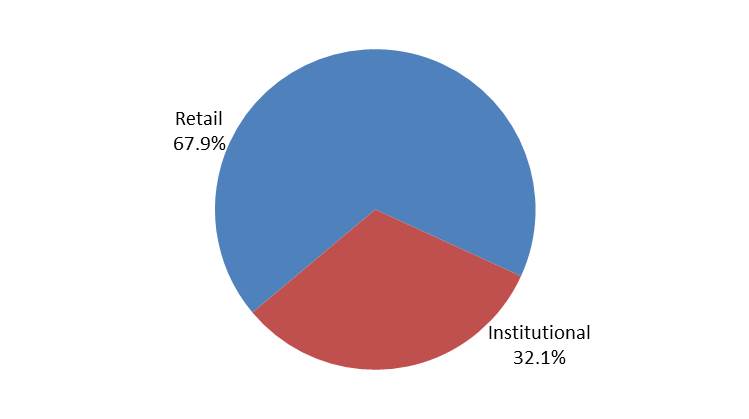
AUM Diversification
One of Invesco's greatest competitive strengths is the diversification in its AUM by client domicile, distribution channel and asset class. Our distribution network has attracted assets of
68%
retail and
32%
institutional as of
December 31, 2017
. By client domicile,
38%
of client AUM are outside the U.S., and we serve clients in more than
150
countries. The following tables present a breakdown of AUM by client domicile, distribution channel and asset class as of
December 31, 2017
. Additionally, the fourth table below illustrates the split of our AUM as Passive and Active.
Passive AUM includes ETFs, unit investment trusts (UITs), certain non-fee earning leverage and other passive mandates.
Active AUM is total AUM less Passive AUM.
9
|
By Client Domicile
|
|
|||||
|
($ in billions)
|
Total
|
1-Yr Change
|
||||
|
c
U.S.
|
585.4
|
|
8.5
|
%
|
||
|
c
Canada
|
26.8
|
|
16.0
|
%
|
||
|
c
U.K.
|
110.9
|
|
12.9
|
%
|
||
|
c
Continental Europe
|
127.1
|
|
76.3
|
%
|
||
|
c
Asia
|
87.4
|
|
9.3
|
%
|
||
|
Total
|
937.6
|
|
||||
|
||||||
|
By Distribution Channel
|
||||||
|
($ in billions)
|
Total
|
1-Yr Change
|
||||
|
c
Retail
|
637.0
|
|
21.0
|
%
|
||
|
c
Institutional
|
300.6
|
|
5.0
|
%
|
||
|
Total
|
937.6
|
|
||||
|
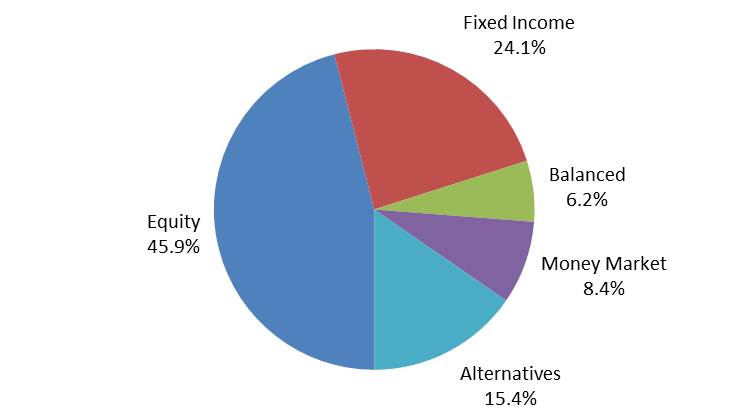
By Asset Class
|
|
|||||
|
($ in billions)
|
Total
|
1-Yr Change
|
||||
|
c
Equity
|
431.2
|
|
18.4
|
%
|
||
|
c
Fixed Income
|
225.8
|
|
11.9
|
%
|
||
|
c
Balanced
|
57.7
|
|
23.3
|
%
|
||
|
c
Money Market
|
78.7
|
|
0.5
|
%
|
||
|
c
Alternatives
|
144.2
|
|
18.2
|
%
|
||
|
Total
|
937.6
|
|
||||
|
Active vs. Passive
|

|
|||||
|
($ in billions)
|
Total
|
1-Yr Change
|
||||
|
c
Active
|
738.6
|
|
10.5
|
%
|
||
|
c
Passive
|
199.0
|
|
37.8
|
%
|
||
|
Total
|
937.6
|
|
||||
10
Employees
As of
December 31, 2017
, the company had
7,030
employees across the globe. As of
December 31, 2016
and
2015
, we had
6,790
and
6,490
employees, respectively. None of our employees is covered under collective bargaining agreements.
Competition
The investment management business is highly competitive, with points of differentiation including investment performance, the range of products offered, brand recognition, business reputation, financial strength, the depth and continuity of relationships, quality of service and the level of fees charged for services. We compete with a large number of investment management firms, commercial banks, investment banks, broker dealers, hedge funds, insurance companies and other financial institutions. We believe that the quality and diversity of our investment capabilities, product types and channels of distribution enable us to compete effectively in the investment management business. We also believe being an independent investment manager is a competitive advantage, as our business model avoids conflicts that are inherent within institutions that both manage and distribute and/or service those products. Lastly, we believe continued execution against our multi-year strategic objectives will further strengthen our long-term competitive position.
Management Contracts
We derive substantially all of our revenues from investment management contracts with funds and other clients. Fees vary with the type of assets being managed, with higher fees earned on actively managed equity and balanced accounts, along with real estate and other alternative asset products, and lower fees earned on fixed income, money market and stable value accounts, as well as certain ETFs. Investment management contracts are generally terminable upon thirty or fewer days' notice. Typically, retail investors may withdraw their funds at any time without prior notice. Institutional clients may elect to terminate their relationship with us or reduce the aggregate amount of assets under management with very short notice periods.
Risk Management
Invesco is committed to continually strengthening and refining our risk management approach. We believe a key factor in Invesco's ability to manage through all market cycles is our integrated approach to risk management. Invesco's enterprise risk management approach is embedded in its management decision-making and processes across the organization and provides the basis for consistent and meaningful risk dialogue up, down and across the company. Broadly, our approach includes two governance structures - one for investments and another for business and operational risks with coordination between the two.
|
•
|
Investment risk oversight is supported by the Global Performance Measurement and Risk group, which provides senior management and the Board with insight into core investment risks.
|
|
•
|
Business and operational risk oversight is supported by the Corporate Risk Management Committee, which facilitates a focus on strategic, operational and other key business risks both existing and emerging, as well as appropriate ongoing management and Board oversight.
|
Further, a network of functional, geographic and specific risk management committees under the guidance and standards of the Corporate Risk Management Committee maintain ongoing risk assessment, management and monitoring processes that provide a bottom-up perspective on the specific risk areas existing in various domains of our business.
Available Information
We file current and periodic reports, proxy statements and other information with the SEC, copies of which can be obtained from the SEC's Public Reference Room at 100 F Street, NE, Washington, DC 20549. Information on the operation of the Public Reference Room can be obtained by calling the SEC at 1-800-SEC-0330.
The SEC maintains a website that contains reports, proxy and information statements and other information regarding issuers that file electronically with the SEC, at www.sec.gov. We make available free of charge on our website, www.invesco.com, our Annual Report on Form 10-K, Quarterly Reports on Form 10-Q, Current Reports on Form 8-K, and amendments to those reports filed or furnished pursuant to Section 13(a) or 15(d) of the Securities Exchange Act of 1934, as amended, as soon as reasonably practicable after we electronically file such material with, or furnish it to, the SEC.
11
Item 1A.
Risk Factors
Volatility and disruption in world capital and credit markets, as well as adverse changes in the global economy, can negatively affect Invesco's revenues, operations, financial condition and liquidity.
In recent years, capital and credit markets have experienced substantial volatility. In this regard:
|
•
|
In the event of extreme circumstances, including economic, political, or business crises, such as a widespread systemic failure or disruptions in the global financial system or failures of firms that have significant obligations as counterparties on financial instruments, we may suffer significant declines in AUM and severe liquidity or valuation problems in managed investment products in which client and company assets are invested, all of which would adversely affect our operating results, financial condition, liquidity, credit ratings, ability to access capital markets, and ability to retain and attract key employees. Additionally, these factors could impact our ability to realize the carrying value of our goodwill and other intangible assets.
|
|
•
|
In addition to the impact of the market volatility on client portfolios, illiquidity and/or volatility of the global fixed income and/or equity markets could negatively affect our ability to manage client inflows and outflows or to timely meet client redemption requests.
|
|
•
|
In the U.S., regulations requiring a variable (“floating”) net asset value (NAV) for institutional prime and tax-free money market funds became effective in October 2016. Those same regulations also provide for the potential imposition of the assessment of fees in connection with redemptions and/or gates that postpone the time in which redemptions must be processed in the event those funds’ weekly liquid assets fall below certain specified thresholds. Our government money market funds and retail prime and tax-free money market funds continue to offer a stable NAV of $1.00 per share and are not required to impose fees and gates; however, we do not guarantee such NAV level. Market conditions could lead to severe liquidity issues in money market products, which could lead to the imposition of fees or gates with respect to institutional prime and tax-free money market funds and an affect on the NAVs of government and retail prime and tax-free money market funds. If our institutional prime or tax-free money market funds were to impose redemption fees or gates delaying the payment of redemption proceeds, or the NAV of one of our government or retail prime or tax-free money market funds were to decline below $1.00 per share, such funds could experience significant redemptions in AUM, loss of shareholder confidence and reputational harm.
|
|
•
|
More broadly, uncertainties regarding geopolitical developments can produce volatility in global financial markets. As an example, the U.K. electorate voted in June 2016 to exit the European Union (Brexit), which resulted in market volatility. Although negotiations between the UK and EU regarding Brexit began in June 2017, it is still uncertain what terms may be agreed to in the final outcome and for any transitional period and what impact those terms may have on global markets. This may impact the levels and composition of our AUM and also negatively impact investor sentiment, which could result in reduced or negative flows. In addition, because the U.K. Pound Sterling is the functional currency for certain of our subsidiaries, any weakening of the U.K. Pound Sterling relative to the U.S. Dollar could negatively impact our reported financial results.
|
We may not adjust our expenses quickly enough to match significant deterioration in global financial markets.
If we are unable to effect appropriate expense reductions in a timely manner in response to declines in our revenues, or if we are otherwise unable to adapt to rapid changes in the global marketplace, our profitability, financial condition and results of operations would be adversely affected.
Our revenues and profitability would be adversely affected by any reduction in AUM as a result of either a decline in market value of such assets or net
outflows, which would reduce the investment management fees we earn.
We derive substantially all of our revenues from investment management contracts with clients. Under these contracts, the investment management fees paid to us are typically based on the market value of AUM. AUM may decline for various reasons. For any period in which revenues decline, our income and operating margin likely would decline by a greater proportion because a majority of our expenses remain fixed. Factors that could decrease AUM (and therefore revenues) include the following:
Declines in the market value of AUM in client portfolios.
These could be caused by price declines in the securities markets generally or by price declines in the market segments in which our AUM are concentrated. Approximately
46%
of our total AUM were invested in the equity asset class and approximately
54%
were invested in the fixed income asset class and other asset classes at
December 31, 2017
. Our AUM as of
January 31, 2018
were
$972.6 billion
. We cannot predict whether volatility in the markets will result in substantial or sustained declines in the securities markets generally or result in price declines in market segments in which our AUM are concentrated. Any of the foregoing could negatively impact our revenues, income and operating margin.
12
Redemptions and other withdrawals from, or shifting among, client portfolios.
These could be caused by investors (in response to adverse market conditions or pursuit of other investment opportunities) reducing their investments in client portfolios in general or in the market segments in which Invesco focuses; investors taking profits from their investments; poor investment performance (relative or absolute) of the client portfolios managed by Invesco; and portfolio risk characteristics, which could cause investors to move assets to other investment managers. Poor performance relative to other investment management firms tends to result in decreased sales and increased redemptions with corresponding decreases in our revenues. Failure of our client portfolios to perform well could, therefore, have a material adverse effect on us. Furthermore, the fees we earn vary with the types of assets being managed, with higher fees earned on actively managed equity and balanced accounts, along with real estate and other alternative asset products, and lower fees earned on fixed income, stable return accounts, and certain ETFs. Our revenues may decline if clients continue to shift their investments to lower fee accounts. In addition, the loss of key personnel or significant investment management professionals could reduce the attractiveness of our products to current and potential clients and adversely affect our revenues and profitability.
Investments in international markets
. Investment products that we manage may have significant investments in international markets that are subject to significant risks of loss from political, economic, diplomatic developments, currency fluctuations, social instability, changes in governmental policies, expropriation, nationalization and asset confiscation. International trading markets, particularly emerging markets and frontier markets, are often smaller, less liquid, less regulated and significantly more volatile than those in the developed world.
Our investment advisory agreements are subject to termination or non-renewal, and our
fund and other investors may withdraw their assets at any time.
Substantially all of our revenues are derived from investment management agreements. Investment management agreements are generally terminable upon 30 or fewer days' notice. Agreements with U.S. registered funds may be terminated with notice, or terminated in the event of an “assignment” (as defined in the Investment Company Act of 1940, as amended), and must be renewed annually by the disinterested members of each fund's Board of Trustees or Directors, as required by law. In addition, the Boards of Trustees or Directors of certain other fund accounts generally may terminate these investment management agreements upon written notice for any reason. Open-end registered fund and unit trust investors may generally withdraw their funds at any time without prior notice. Institutional clients may elect to terminate their relationships with us or reduce the aggregate amount of AUM, generally on short notice. Any termination of or failure to renew a significant number of these agreements, or any other loss of a significant number of our clients or AUM, would adversely affect our revenues and profitability.
Our revenues and profitability from money market and other fixed income assets may be
harmed by interest rate, liquidity and credit volatility.
Certain institutional investors using money market products and other short-term duration fixed income products for cash management purposes may shift these investments to direct investments in comparable instruments in order to realize higher yields than those available in money market and other fund products holding lower yielding instruments. These redemptions would reduce managed assets, thereby reducing our revenues. In addition, rising interest rates will tend to reduce the market value of fixed income investments and fixed income derivatives held in various investment portfolios and other products. Thus, increases in interest rates could have an adverse effect on our revenues from money market portfolios and from other fixed income products. If securities within a money market portfolio default or investor redemptions force the portfolio to realize losses, there could be negative pressure on its NAV. Although money market investments are not guaranteed instruments, the company might decide, under such a scenario, that it is in its best interest to provide support in the form of a support agreement, capital infusion, or other methods to help stabilize a declining NAV. Some of these methods could have an adverse impact on our profitability. Additionally, we have investments in fixed income assets, including collateralized loan obligations and seed money in fixed income funds, the valuation of which could change with changes in interest and default rates.
Performance fees may increase revenue and earnings volatility.
A portion of the company’s revenues is derived from performance fees on investment advisory assignments. Performance fees represented
$113.3 million
, or
2.2%
, of total operating revenues for the year ended
December 31, 2017
. In most cases, performance fees are based on relative or absolute investment returns, although in some cases they are based on achieving specific service standards. Generally, the company is entitled to performance fees only if the returns on the related portfolios exceed agreed-upon periodic or cumulative return targets. If these targets are not exceeded, performance fees for that period will not be earned and, if targets are based on cumulative returns, the company may not earn performance fees in future periods. Performance fees will vary from period to period in relation to volatility in investment returns and the timing of revenue recognition, causing our earnings to be more volatile.
13
The soundness of other financial institutions could adversely affect us.
Financial services institutions are interrelated as a result of trading, clearing, counterparty, or other relationships. We, and the client portfolios that we manage, have exposure to many different industries and counterparties, and routinely execute transactions with counterparties in the financial services industry, including brokers and dealers, commercial banks, investment banks, clearing organizations, hedge funds and other institutions. Many of these transactions expose us or such client portfolios to credit risk in the event of default of its counterparty. While we regularly conduct assessments of such risk posed by counterparties, the risk of non-performance by such parties is subject to sudden swings in the financial and credit markets.
Our financial condition and liquidity would be adversely affected by losses on our seed capital and co-investments
.
The company has investments in managed investment products that invest in a variety of asset classes, including, but not limited to equities, fixed income products, commodities, derivatives, and similar financial instruments, private equity and real estate. Investments in these products are generally made to establish a track record, meet purchase size requirements for trading blocks, or demonstrate economic alignment with other investors in our funds. Adverse market conditions may result in the need to write down the value of these seed capital and co-investments. A reduction in the value of these investments may adversely affect our results of operations or liquidity. As of
December 31, 2017
, the company had
$891.7 million
in seed capital and co-investments, including direct investments in consolidated investment products (CIP).
We operate in an industry that is highly regulated in many countries, and any enforcement action or adverse changes in the laws or regulations governing our business could decrease our revenues and profitability.
As with all investment management companies, our activities are highly regulated in almost all countries in which we conduct business. Laws and regulations applied at the national, state or provincial and local level generally grant governmental agencies and industry self-regulatory authorities broad administrative discretion over our activities, including the power to limit or restrict our business activities, conduct examinations, risk assessments, investigations and capital adequacy reviews, and impose remedial programs to address perceived deficiencies. As a result of regulatory oversight, we could face requirements which negatively impact the way in which we conduct business, increase compliance costs and/or impose additional capital requirements. Our regulators likewise have the authority to commence enforcement actions which could lead to sanctions up to and including the revocation of licenses to operate certain businesses, the suspension or expulsion from a particular jurisdiction or market of any of our business organizations or their key personnel or the imposition of fines and censures on us or our employees. Judgments or findings of wrongdoing by regulatory or governmental authorities, or in private litigation against us, could affect our reputation, increase our costs of doing business and/or negatively impact our revenues. Any of the effects discussed above could have a material negative impact on our results of operations, financial condition or liquidity.
A substantial portion of the products and services we offer are regulated by the Securities and Exchange Commission (SEC), Financial Industry Regulatory Authority (FINRA), the Commodities Future Trading Commission (CFTC), the National Futures Association (NFA) and the Texas Department of Banking in the United States and by the Financial Conduct Authority (FCA) and the Prudential Regulatory Authority (PRA) in the United Kingdom. Subsidiaries operating in the European Union (EU) are subject to various EU Directives, which generally are implemented by member state national legislation and by EU Regulations. Our operations elsewhere in the world are regulated by similar regulatory organizations.
The regulatory environment in which we operate frequently changes and has seen a significant increase in regulation in recent years. Various changes in laws and regulations have been enacted or otherwise implemented in multiple jurisdictions globally in response to the crisis in the financial markets that began in 2007. Various other proposals remain under consideration by legislators, regulators, other government officials and other public policy commentators. Certain enacted provisions and certain other proposals are potentially far reaching and, depending upon their implementation, could have a material impact on our business. While certain of these provisions appear to address perceived problems in the banking sector, some will or may be applied more broadly and affect other financial services companies, including investment managers. While Invesco does not believe that the these post-crisis developments have or will fundamentally change the investment management industry or cause Invesco to reconsider its basic strategy, certain provisions have required, and other provisions will or may require, us to change or impose new limitations on the manner in which we conduct business; they also have increased regulatory burdens and related compliance costs, and will or may continue to do so. More broadly, we may be adversely affected as a result of new or revised legislation or regulations or by changes in the interpretation or enforcement of existing laws and regulations. To the extent that existing regulations are interpreted or amended or future regulations are adopted in a manner that reduces the sale, or increases the redemptions, of our products and services, or that negatively affects the investment performance of our products or impacts our product mix, our aggregate AUM and our revenues could be adversely affected. In addition, regulatory changes have imposed and may continue to impose additional costs or capital requirements, which could negatively impact our profitability or return on equity.
14
In December 2014, then SEC Chair Mary Jo White announced a comprehensive agenda for regulatory change governing the U.S. asset management industry and directed SEC staff to develop a five-part series of new regulations addressing the topics of enhanced portfolio reporting, liquidity risk management, leverage and use of derivatives, adviser wind up and stress testing for funds and advisers. Rules proposed in 2015 for the first two of these initiatives became final in October 2016. The SEC has also proposed a rule that would impose restrictions on the use of derivatives by registered funds. These new industry rules would or could be expected to add additional reporting and compliance costs and may affect the development of new products and the ability to continue to offer certain strategies through a registered investment company format. In late 2017 the SEC announced an updated regulatory agenda which deferred, de-prioritized or removed certain of these items. The practical impact of such changes remains uncertain as of the date of this report.
The EU has promulgated or is considering various new or revised directives pertaining to financial services, including investment managers. Such directives are progressing at various stages, and generally have been, are being or will or would be implemented by national legislation in member states. Ongoing changes in the EU’s regulatory framework applicable to our business, including changes related to Brexit and any other changes in the composition of the EU’s member states, may add further complexity to our global risks and operations.
Developments under regulatory changes will or may include, without limitation:
|
•
|
Expanded regulation over investment management firms.
|
|
•
|
New or increased capital requirements and related regulation.
|
|
•
|
Change to the regulation of money market funds in the EU requiring capital buffers.
|
|
•
|
Limitations on holdings of certain commodities under proposed regulations of the CFTC which could result in capacity constraints for our products that employ commodities as part of their investment strategy.
|
|
•
|
The U.S. Department of Labor adopted regulations in April 2016 that treat as fiduciaries any person who provides investment advice or recommendations to employee benefit plans, plan fiduciaries, plan participants, plan beneficiaries, Individual Retirement Accounts (IRAs) or IRA owners. The regulations have wide-ranging consequences for Invesco and our U.S. distribution partners and product line. Under the new rules, firms and individuals who recommend financial products to retirement investors are be required to act in the best interest of the investor and, to receive variable compensation, would be required to enter into a contract with clients and produce complex disclosure documents intended to highlight financial conflicts of interest that may arise from the compensation the financial adviser receives from firms like Invesco. These rules went into partial effect in June 2017, but the implementation of the enforcement mechanism has been delayed until July 2019. The SEC is reviewing whether it might promulgate its own version of a fiduciary rule, possibly in conjunction with a re-proposed version of these DOL rules. Rules promulgated by the SEC in this area could have wider impact than such DOL rules.
|
|
•
|
Other changes to the distribution of investment funds and other investment products. In the U.S., the SEC previously has proposed and may repropose significant changes to Rule 12b-1, and may propose other regulatory changes impacting distribution of investment funds. Invesco believes these proposals could increase operational and compliance costs. The EU has implemented the Alternative Investment Fund Manager Directive (AIFMD); implementing legislation in member states has, among other elements, imposed restrictions on the marketing and sale within the EU of private equity and other alternative investment funds sponsored by non-EU managers. Various regulators promulgated or are considering other new disclosure or suitability requirements pertaining to the distribution of investment funds and other investment products, including enhanced standards and requirements pertaining to disclosures made to retail investors at the point of sale.
|
|
•
|
In 2015, the FCA undertook a study of the asset management industry and released their final report in June 2017. The report highlighted a number of specific industry issues and proposed a number of remedies that will take place in a number of stages, including: changes to governance, changes to fee structures to provide clients with increased transparency, improved disclosure in client documentation, improved ability for retail clients to change share classes and changes to pension pooling and investment consultant regulations in the institutional segment.
|
|
•
|
The Markets in Financial Instruments Directive II (MiFID II) in the EU, effective in January 2018, seeks to promote a single market for wholesale and retail transactions in financial instruments. MiFID II addresses the conduct of business rules for intermediaries providing investment services and the effective, efficient and safe operation of financial markets. Key elements of MiFID II are the extent to which retrocessions may be paid and the use of trading commissions to fund research. The company has announced that, beginning in January 2018, external research costs incurred for MiFID II impacting funds and client accounts in Europe have been absorbed by the company. We do not expect these costs to be material to the company's financial statements. While the foregoing provisions only impact the EU, client-driven competitive pressures may cause an expansion of these principles to other business regions in which we operate.
|
|
•
|
An increased focus on liquidity in funds (including fixed income funds), an example of which is the SEC’s rules with respect to liquidity and liquidity risk management applicable to certain types of registered U.S. funds that are scheduled to take effect in 2018.
|
15
|
•
|
Increased requirements to provide regulators and investors more granular detail regarding our products and services, including the SEC’s reporting modernization rule applicable to certain types of registered U.S. funds that are scheduled to take effect in 2018.
|
|
•
|
Regulations pertaining to the privacy of data with respect to clients, employees and business partners. In particular, effective May 25, 2018, the EU’s General Data Protection Regulation (GDPR) will strengthen data protection rules for individuals within the EU and the export of data outside of the EU. Compliance with GDPR will require an extensive review of our global data processing systems. A failure to comply with GDPR could result in fines up to 20 million Euros or 4% of our annual revenues, whichever is higher.
|
|
•
|
Increased regulatory scrutiny on operations of private equity funds.
|
|
•
|
Requirements pertaining to the trading of securities and other financial instruments, such as swaps and other derivatives, including certain provisions of the Dodd-Frank Act and European Market Infrastructure Regulation; these include significant reporting requirements, designated trading venues, mandated central clearing arrangements, restrictions on proprietary trading by certain financial institutions, other conduct requirements and potentially new taxes or similar fees.
|
|
•
|
Heightened regulatory examinations and inspections, including enforcement reviews, and a more aggressive posture regarding commencing enforcement proceedings resulting in fines, penalties and additional remedial activities to firms and to individuals. Without limiting the generality of the foregoing, regulators in the United States and the United Kingdom have taken and can be expected to continue to take a more aggressive posture on bringing enforcement proceedings.
|
|
•
|
Enhanced licensing and qualification requirements for key personnel.
|
|
•
|
Guidelines regarding the structure and components of fund manager compensation and other additional rules and regulations and disclosure requirements. Certain provisions impose additional disclosure burdens on public companies. Certain proposals could impose requirements for more widespread disclosures of compensation to highly-paid individuals. Depending upon the scope of any such requirements, Invesco could be disadvantaged in retaining key employees vis-à-vis private companies, including hedge fund sponsors.
|
|
•
|
Strengthening standards regarding various ethical matters, including compliance with the Foreign Corrupt Practices Act, the U.K. Bribery Act and anti-money-laundering laws and regulations.
|
|
•
|
Regulations promulgated to address perceptions that the asset management industry, or certain of its entities or activities, pose systematic risks to the financial system.
|
|
•
|
Regulations promulgated to protect personal data and address risks of fraud, malfeasance or other adverse consequences stemming from cyber attacks.
|
|
•
|
Other changes impacting the identity or the organizational structure of regulators with supervisory authority over Invesco.
|
We cannot at this time predict the full impact of potential legal and regulatory changes or possible enforcement proceedings on our business. Such changes have imposed, and may continue to impose, new compliance costs and/or capital requirements or impact Invesco in other ways that could have a material adverse impact on our results of operations, financial condition or liquidity. Moreover, certain legal or regulatory changes could require us to modify our strategies, businesses or operations, and we may incur other new constraints or costs, including the investment of significant management time and resources in order to satisfy new regulatory requirements or to compete in a changed business environment. In recent years, certain regulatory developments have also added downward pressures regarding fee levels.
To the extent that existing or future regulations affecting the sale of our products and services or our investment strategies cause or contribute to reduced sales or increased redemptions of our products, impair the investment performance of our products or impact our product mix, our AUM and results of operations might be adversely affected.
Distribution of earnings of our subsidiaries may be subject to limitations, including net capital requirements.
Substantially all of our operations are conducted through our subsidiaries. As a result, our cash flow and our ability to fund operations are dependent upon the earnings of our subsidiaries and the distribution of earnings, intercompany loans or other payments by our subsidiaries to us. Any payments to us by our subsidiaries could be subject to statutory or contractual restrictions and are contingent upon our subsidiaries
’
earnings and business considerations. For example, certain of our subsidiaries are required under applicable laws and regulations to maintain appropriate levels of capital. Such requirements may change from time-to-time as additional guidance is released based on a variety of factors, including balance sheet composition, assessment of risk exposures and governance and review from regulators.
These and other similar provisions of applicable laws and regulations may have the effect of limiting withdrawals of capital, repayment of intercompany loans and payment of dividends by such entities. All of our regulated EU subsidiaries are subject to consolidated capital requirements under EU Directives, including those arising from the EU's Capital Requirements Directive and the U.K.'s Internal Capital Adequacy Assessment Process (ICAAP), and capital is maintained within this sub-group to satisfy these regulations. We meet these requirements in part by holding cash and cash
16
equivalents. This retained cash can be used for general business purposes in the European sub-group in the countries where it is located. Due to the capital restrictions, the ability to transfer cash between certain jurisdictions may be limited. In addition, transfers of cash between international jurisdictions may have adverse tax consequences.
As of
December 31, 2017
, the company's minimum regulatory capital requirement was
$761.4 million
. Complying with our regulatory commitments may result in an increase in the capital requirements applicable to the European sub-group. As a result of corporate restructuring and regulatory requirements, certain of these EU subsidiaries may be required to limit their dividends to the ultimate parent company, Invesco Ltd. Our financial condition or liquidity could be adversely affected if certain of our subsidiaries are unable to distribute funds to us.
Civil litigation and governmental investigations and enforcement actions could adversely affect our AUM and future financial results, and increase our costs of doing business.
Invesco and certain related entities have in recent years been subject to various legal proceedings, including civil litigation and governmental investigations and enforcement actions. These actions can arise from normal business operations and/or matters that have been the subject of previous regulatory reviews. Further, as a global company with investment products registered in numerous countries and subject to the jurisdiction of one or more regulators in each country, at any given time, our business operations may be subject to review, investigation or disciplinary action. For example, in the United States, United Kingdom and other jurisdictions in which the company operates, governmental authorities regularly make inquiries, hold investigations and administer market conduct examinations with respect to the company's compliance with applicable laws and regulations. Lawsuits or regulatory enforcement actions arising out of these inquiries may in the future be filed against the company and related entities and individuals in the United States, United Kingdom and other jurisdictions in which the company and its affiliates operate. See Item 8, Financial Statements and Supplementary Data, Note
18
-- "Commitments and Contingencies,” for additional information. Judgments in civil litigation or findings of wrongdoing by regulatory or governmental authorities against us could affect our reputation, increase our costs of doing business and/or negatively impact our revenues, any of which could have a material negative impact on our results of operations, financial condition or liquidity.
We are exposed to a number of risks arising from our international operations.
We operate in a number of jurisdictions outside of the United States. We have offices in numerous countries and sponsor many cross border and local proprietary funds that are domiciled outside the United States and may face difficulties in managing, operating and marketing our international operations. Our international operations expose us to the political and economic consequences of operating in foreign jurisdictions and subject us to expropriation risks, expatriation controls and potential adverse tax consequences.
Terrorist activity and the continued threat of terrorism, as well as increased geopolitical unrest could adversely affect the global economy or specific international, regional and domestic markets, which may cause our AUM, revenue and earnings to decline.
Terrorist activity and the continued threat of terrorism and acts of civil or international hostility, both within the United States and abroad, as well as ongoing military and other actions and heightened security measures in response to these types of threats, may cause significant volatility and declines in the global markets, loss of life, property damage, disruptions to commerce and reduced economic activity. Continued geopolitical unrest and terrorist activity that adversely affect the global economy, capital markets or specific international, regional or domestic markets may cause our AUM, revenue and earnings to decline.
Our investment management professionals and other key employees are a vital part of
our ability to attract and retain clients, and the loss of key individuals or a significant portion of
those professionals could result in a reduction of our revenues and profitability.
Retaining highly skilled technical and management personnel is important to our ability to attract and retain our clients. The market for investment management professionals is competitive and has become more so in periods of growth of the investment management industry. The market for investment professionals and other key personnel is at times characterized by the movement of these professionals among different firms.
Our policy has been to provide our investment management professionals and other key personnel with a supportive professional working environment and compensation and benefits (including equity and other forms of deferred compensation) that we believe are competitive with other leading investment management firms. However, we may not be successful in retaining our key personnel, and the loss of significant investment professionals or other key personnel could reduce the attractiveness of our products to potential and current clients and could, therefore, adversely affect our revenues and profitability.
17
If our reputation is harmed, we could suffer losses in our business, revenues and net income.
Our business depends on earning and maintaining the trust and confidence of clients, regulators and other market participants, and our good reputation is critical to our business. Our reputation is vulnerable to many threats that can be difficult or impossible to control, and costly or impossible to remediate. Regulatory inquiries, investigations or findings of wrongdoing, intentional or unintentional misrepresentation of our products and services in advertising materials, public relations information, social media or other external communications, operational failures (including cyber breaches), employee dishonesty or other misconduct and rumors, among other things, can substantially damage our reputation, even if they are baseless or eventually satisfactorily addressed.
Our business also requires us continuously to manage actual and potential conflicts of interest, including situations where our services to a particular client conflict, or are perceived to conflict, with the interests of other clients or those of Invesco. The willingness of clients to enter into transactions in which such a conflict might arise may be affected if we fail - or appear to fail - to deal appropriately with conflicts of interest. In addition, potential or perceived conflicts could give rise to litigation or regulatory enforcement actions.
We have procedures and controls that are designed to address and manage these risks, but this task can be complex and difficult, and if our procedures and controls fail, our reputation could be damaged. Any damage to our reputation could impede our ability to attract and retain clients and key personnel, and lead to a reduction in the amount of our AUM, any of which could have a material adverse effect on our results of operations, financial condition or liquidity.
Failure to establish adequate controls and risk management policies, the circumvention of controls and policies or fraud could have an adverse effect on our reputation and financial position.
We have established a comprehensive risk management process and continue to enhance various controls, procedures, policies and systems to monitor and manage risks to our business; however, we cannot be assured that such controls, procedures, policies and systems will successfully identify and manage internal and external risks to our business. We are subject to the risk that our employees, contractors or other third parties may deliberately seek to circumvent established controls to commit fraud (including through cyber breaches) or act in ways that are inconsistent with our controls, policies and procedures. Persistent or repeated attempts involving conflicts of interests, circumvention of policies and controls or fraud could have a materially adverse impact on our reputation and could lead to costly regulatory inquiries.
Failure to comply with client contractual requirements and/or investment guidelines could result in damage awards against us and loss of revenues due to client terminations.
Many of the investment management agreements under which we manage assets or provide products or services specify investment guidelines or requirements that we are required to observe in the provision of our services. Laws and regulations impose similar requirements for certain client portfolios (such as registered funds). A failure to comply with these guidelines or requirements could result in damage to our reputation or in our clients seeking to recover losses, withdrawing their assets or terminating their contracts. Regulators likewise may commence enforcement actions for violations of such requirements. Any such effects could cause our revenues and profitability to decline. We maintain various compliance procedures and other controls to prevent, detect and correct such errors. When an error is detected, a payment will typically be made into the applicable client account to correct it. Significant errors for which we are responsible could impact our results of operations, financial condition or liquidity.
The failure or negative performance of products offered by competitors may have a negative impact on similar Invesco products irrespective of our performance.
Many competitors offer similar products to those offered by us and the failure or negative performance of competitors’ products could lead to a loss of confidence in similar Invesco products, irrespective of the performance of such products. Any loss of confidence in a product type could lead to withdrawals, redemptions and liquidity issues in such products, which could have a material adverse effect on our results of operations, financial condition or liquidity.
18
Competitive pressures may force us to reduce the fees we charge to clients, increase
commissions paid to our financial intermediaries or provide more support to those
intermediaries or could limit or reduce sales of our products, all of which could reduce our profitability.
The investment management business is highly competitive, and we compete based on a variety of factors, including investment performance, the range of products offered, brand recognition, business reputation, financial strength, stability and continuity of client and financial intermediary relationships, quality of service, level of fees charged for services and the level of compensation paid and distribution support offered to financial intermediaries. We continue to face market pressures regarding fee levels in certain products. Investors remain attracted to lower fee passive products, which have gained and may continue to gain share at the expense of active products.
We face strong competition in every market in which we operate. Our competitors include a large number of investment management firms, commercial banks, investment banks, broker-dealers, hedge funds, insurance companies and other financial institutions. Some of these institutions have greater capital and other resources, and offer more comprehensive lines of products and services, than we do. Our competitors seek to expand their market share in many of the products and services we offer. If these competitors are successful, our revenues and profitability could be adversely affected. In addition, there are relatively few barriers to entry by new investment management firms, and the successful efforts of new entrants into our various distribution channels around the world have also resulted in increased competition.
In recent years there have been several instances of industry consolidation, both in the area of distributors and manufacturers of investment products. Further consolidation may occur in these areas in the future. The increasing size and market influence of certain distributors of our products and of certain direct competitors may have a negative impact on our ability to compete at the same levels of profitability in the future, should we find ourselves unable to maintain relevance in the markets in which we compete.
We may engage in strategic transactions that could create risks.
We regularly review, and from time-to-time have discussions with and engage in, potential strategic transactions, including potential acquisitions, dispositions, consolidations, joint ventures or similar transactions, some of which may be material. There can be no assurance that we will find suitable candidates for strategic transactions at acceptable prices, have sufficient capital resources to pursue such transactions, be successful in negotiating the required agreements, or successfully close transactions after signing such agreements.
Acquisitions also pose the risk that any business we acquire may lose customers or employees or could underperform relative to expectations. We could also experience financial or other setbacks if pending transactions encounter unanticipated problems, including problems related to closing or integration. Following the completion of an acquisition, we may have to rely on the seller to provide administrative and other support, including financial reporting and internal controls, to the acquired business for a period of time. There can be no assurance that such sellers will do so in a manner that is acceptable to us.
We may be unable to develop new products and services and the development of new products and services may expose us to additional costs or operational risk.
Our financial performance depends, in part, on the company's ability to develop, market and manage new investment products and services. The development and introduction of new products and services requires continued innovative efforts on our part and may require significant time and resources as well as ongoing support and investment. Substantial risk and uncertainties are associated with the introduction of new products and services, including the implementation of new and appropriate operational controls and procedures, shifting client and market preferences, the introduction of competing products or services and compliance with regulatory requirements. New products often must be in the market place for three or more years in order to generate track records required to attract significant AUM inflows. A failure to continue to innovate to introduce successful new products and services or to manage effectively the risks associated with such products and services may impact our market share relevance and may cause our AUM, revenue and earnings to decline.
19
Our ability to maintain our credit ratings and to access the capital markets in a timely manner should we seek to do so depends on a number of factors.
Our access to the capital markets depends significantly on our credit ratings. We have received credit ratings of
A2/Stable, A/Negative and A-/Stable
from Moody's Investor Services ("Moody's"), Standard & Poor's Ratings Service ("S&P"), and Fitch Ratings ("Fitch"), respectively, as of the date hereof. We believe that rating agency concerns include but are not limited to the fact that our revenues are exposed to equity market volatility and the potential impact from regulatory changes to the industry. Additionally, the rating agencies could decide to downgrade the entire investment management industry, based on their perspective of future growth and solvency. Material deterioration of these factors, and others defined by each rating agency, could result in downgrades to our credit ratings, thereby limiting our ability to generate additional financing. Management believes that solid investment grade ratings are an important factor in winning and maintaining institutional business and strives to manage the company to maintain such ratings.
Our credit facility borrowing rates are tied to our credit ratings. A reduction in our long-term credit ratings could increase our borrowing costs, could limit our access to the capital markets and may result in outflows thereby reducing AUM and revenues. Volatility in global finance markets may also affect our ability to access the capital markets should we seek to do so. If we are unable to access capital markets in a timely manner, our business could be adversely affected.
Our indebtedness could adversely affect our financial position or results of operations.
As of
December 31, 2017
, we had outstanding total debt of
$2,075.8 million
, excluding debt of CIP, and total equity attributable to Invesco Ltd. of
$8,696.1 million
. The amount of indebtedness we carry could limit our ability to obtain additional financing for working capital, capital expenditures, acquisitions, debt service requirements or other purposes, increase our vulnerability to adverse economic and industry conditions, limit our flexibility in planning for, or reacting to, changes in our business or industry and place us at a disadvantage in relation to our competitors. Any or all of the above factors could materially adversely affect our financial position or results of operations. The company expects approximately 80% of the $1.2 billion purchase price for the upcoming Guggenheim Investments' ETF acquisition will be funded through the use of the company’s existing credit facility, increasing our outstanding debt in 2018. The company plans to repay the amount borrowed over the course of 2018.
Our credit facility imposes restrictions on our ability to conduct business and, if
amounts borrowed under it were subject to accelerated repayment, we might not have sufficient assets or liquidity to repay such amounts in full.
Our credit facility requires us to maintain specified financial ratios, including maximum debt-to-earnings and minimum interest coverage ratios. The credit facility also contains customary affirmative operating covenants and negative covenants that, among other things, restrict certain of our subsidiaries' ability to incur debt and restrict our ability to transfer assets, merge, make loans and other investments and create liens. The breach of any covenant (either due to our actions or due to a significant and prolonged market-driven decline in our operating results) would result in a default under the credit facility. In the event of any such default, lenders that are party to the credit facility could refuse to make further extensions of credit to us and require all amounts borrowed under the credit facility, together with accrued interest and other fees, to be immediately due and payable. If any indebtedness under the credit facility were subject to accelerated repayment repayment and if we had at that time a significant amount of outstanding debt under the credit facility, we might not have sufficient liquid assets to repay such indebtedness in full.
20
Changes in the distribution channels on which we depend could reduce our net revenues and
hinder our growth.
We sell substantially all of our retail investment products through a variety of third party financial intermediaries, including major wire houses, fund supermarkets, regional broker-dealers, insurance companies, banks and financial planners in North America, and independent brokers and financial advisors, banks and supermarket platforms in Europe and Asia. No single one of these intermediaries is material to our business. Increasing competition for these distribution channels could nevertheless cause our distribution costs to rise, which would lower our net revenues. Following the financial crisis, there has been consolidation of banks and broker-dealers, particularly in the U.S., and a limited amount of migration of brokers and financial advisors away from major banks to independent firms focused largely on providing advice. If these changes continue, our distribution costs could increase as a percentage of our revenues generated. Additionally, particularly outside of the U.S., certain of the third party intermediaries upon whom we rely to distribute our investment products also sell their own competing proprietary funds and investment products, which could limit the distribution of our products. Investors, particularly in the institutional market, rely on external consultants and other third parties for advice on the choice of investment manager. These consultants and third parties tend to exert a significant degree of influence over their clients' choices, and they may favor a competitor of Invesco as better meeting their particular clients' needs. There is no assurance that our investment products will be among their recommended choices in the future. Similarly, particularly in the United States, certain distributors have substantially reduced the number of investment funds they make available to their customers. If a material portion of our distributors were to cease operations or substantially narrow their product offerings, it could have a significant adverse effect on our revenues and profitability. Any failure to maintain strong business relationships with these distribution sources and the consultant community would impair our ability to sell our products, which in turn could have a negative effect on our revenues and profitability.
Our business is vulnerable to deficiencies and failures in support systems and customer service
functions that could lead to breaches and errors or reputational harm, resulting in loss of customers or claims
against us or our subsidiaries.
In addition to investment management, our services include fund administration, sales, distribution, marketing, shareholder servicing and trust, custody and other fiduciary services. In order to be competitive and comply with our agreements, we must properly perform our fund and portfolio administration and related responsibilities, including portfolio recordkeeping and accounting, security pricing, corporate actions, investment restrictions compliance, daily net asset value computations, account reconciliations and required distributions to fund shareholders. The ability to consistently and reliably obtain accurate securities pricing information, process client portfolio and fund shareholder transactions and provide reports and other customer service to fund shareholders and clients in accounts managed by us is essential to our continuing success. Certain types of securities may experience liquidity constraints that would require increased use of fair value pricing, which is dependent on certain subjective judgments that have the potential to be challenged. Any delays or inaccuracies in obtaining pricing information, processing such transactions or such reports or other breaches and errors and any inadequacies in other customer service, could result in reimbursement obligations or other liabilities, or alienate customers and potentially give rise to claims against us. Our customer service capability, as well as our ability to obtain prompt and accurate securities pricing information and to process transactions and reports, is highly dependent on communications and information systems and on third-party service providers. Certain of these processes involve a degree of manual input, and thus problems could occur from time-to-time due to human error. Our failure to properly perform and monitor our operations or our otherwise suffering deficiencies and failures in these systems or service functions could result in material financial loss or costs, regulatory actions, breach of client contracts, reputational harm or legal claims and liability, which in turn could have a negative effect on our revenues and profitability.
The failure of one of our third party service providers or other key vendors to fulfill its obligations could have a material adverse effect on our reputation or business, which may cause our AUM, revenue and earnings to decline.
We depend on third party service providers and other key vendors for various fund administration, accounting, custody, risk analytics, market data, market indices and transfer agent roles, and other distribution and operational needs. If our third party service providers or other key vendors fail to fulfill their obligations to us, it could lead to operational and regulatory problems, including with respect to certain of our products, which could result in losses, enforcement actions, or reputational harm and may cause our AUM, revenue and earnings to decline.
We depend on information technology, and any failures of or damage to, attack on or unauthorized access to our information technology systems or facilities, or those of third parties with which we do business, including as a result of cyber-attacks, could result in significant limits on our ability to conduct our operations and activities, costs and reputational damage.
We are highly dependent upon the use of various proprietary and third-party information and security technology, software applications and other technology systems to operate our business. We are also dependent on the effectiveness of our information and cyber security infrastructure, policies, procedures and capabilities to protect our computer and telecommunications systems and the data that reside on or are transmitted through them. We use our technology to, among other things, manage and trade
21
portfolio investments, support our other operations, obtain securities pricing information, process client transactions, protect the privacy of clients', employees' and business partners' data and provide reports and other customer services to the clients of the funds we manage. Any inaccuracies, delays, systems failures or security breaches in these and other processes could disrupt our business operations, subject us to client, employee or business partner dissatisfaction and losses and/or subject us to reputational harm.
Our computer, communications, data processing, networks, backup, business continuity or other operating, information or technology systems and facilities, including those that we outsource to other providers, may fail to operate properly or become disabled, overloaded or damaged as a result of a number of factors, including events that are wholly or partially beyond our control.
In recent years, several financial services firms suffered successful cyber-attacks launched both domestically and from abroad, resulting in the disruption of services to clients, loss or misappropriation of confidential data and reputational harm. Our status as a global financial institution and the nature of our client base may enhance the risk that we are targeted by such cyber-threats. Although we take protective measures, including measures to effectively secure information through system security technology, and continually monitor and develop our systems to protect our technology infrastructure and data from misappropriation or corruption, our technology systems may still be vulnerable to unauthorized access, computer viruses or other events that have a security impact, such as an external hacker attack by one or more cyber criminals or an authorized employee or vendor causing us to release confidential information inadvertently or through malfeasance, or lose temporarily or permanently data or applications or systems, which could materially harm our operations and reputation. The third parties with which we do business or which facilitate our business activities, including financial intermediaries and technology infrastructure and service providers, are also susceptible to the foregoing risks (including regarding the third parties with which they are similarly interconnected or on which they otherwise rely), and our or their business operations and activities may therefore be adversely affected, perhaps materially, by failures, terminations, errors or malfeasance by, or attacks or constraints on, one or more financial, technology or infrastructure institutions or intermediaries with whom we or they are interconnected or conduct business.
Breach of our technology systems could damage our reputation and could result in the unauthorized disclosure or modification or loss of sensitive or confidential information (including client data); unauthorized disclosure modification or loss of proprietary information relating to our business; inability to process client or company transactions and processes; breach and termination of client contracts; liability for stolen assets, information or identity; remediation costs to repair damage caused by the breach, including damage to systems and recovery of lost data; additional security costs to mitigate against future incidents; regulatory actions (including fines and penalties, which could be material) and litigation costs resulting from the incident. Such consequences could result in material financial loss and have a negative effect on our revenues and profitability.
If we are unable to successfully recover from a disaster or other business continuity
problem, we could suffer material financial loss, loss of human capital, regulatory
actions, reputational harm or legal liability.
If we were to experience a local or regional disaster or other business continuity problem, such as a pandemic or other natural or man-made disaster, our continued success will depend, in part, on the availability of our personnel, our office facilities and the proper functioning of our computer, telecommunication and other related systems and operations. In such an event, we believe our operational size, the multiple locations from which we operate, and our existing back-up systems should mitigate adverse impacts. Nevertheless, we could still experience near-term operational problems with regard to particular areas of our operations. Further, as we strive to achieve cost savings by shifting certain business processes to lower-cost geographic locations such as India, the potential for particular types of natural or man-made disasters, political, economic or infrastructure instabilities, or other country- or region-specific business continuity risks increases. Although we seek to assess regularly and improve our existing business continuity plans, a major disaster, or one that affected certain important operating areas, or our inability to recover successfully should we experience a disaster or other business continuity problem, could materially interrupt our business operations and cause material financial loss, loss of human capital, regulatory actions, reputational harm or legal liability.
Since many of our subsidiary operations are located outside of the United States and
have functional currencies other than the U.S. Dollar, changes in the exchange rates
to the U.S. Dollar affect our reported financial results from one period to the
next.
The largest component of our net assets, revenues and expenses, as well as our AUM, is presently denominated in U.S. dollars. However, we have a large number of subsidiaries outside of the United States whose functional currencies are not the U.S. Dollar. As a result, fluctuations in the exchange rates to the U.S. Dollar affect our reported financial results from one period to the next. Consequently, significant strengthening of the U.S. Dollar relative to the U.K. Pound Sterling, Euro, or Canadian Dollar, among other currencies, could have a material negative impact on our reported financial results.
22
The carrying value of goodwill and other intangible assets on our balance sheet could become impaired, which would adversely affect our results of operations.
We have goodwill and indefinite-lived intangible assets on our balance sheet that are subject to annual impairment reviews. We also have definite-lived intangible assets on our balance sheet that are subject to impairment testing if indicators of impairment are identified. Goodwill and intangible assets totaled
$6,590.7 million
and
$1,558.7 million
, respectively, at
December 31, 2017
. We may not realize the value of such assets. We perform impairment reviews of the book values of these assets on an annual basis or more frequently if impairment indicators are present. A variety of factors could cause such book values to become impaired. Should valuations be deemed to be impaired, a write-down of the related assets would occur, adversely affecting our results of operations for the period. See Item 7, “Management's Discussion and Analysis of Financial Condition and Results of Operations - Critical Accounting Policies - Goodwill” and “- Intangibles,” for additional details of our impairment analysis process.
Legislative and other measures that may be taken by U.S. and/or other governmental authorities could materially increase our tax burden or otherwise adversely affect our financial condition, results of operations or cash flows.
Under current laws, as the company is domiciled and tax resident in Bermuda, taxation in other jurisdictions is dependent upon the types and the extent of the activities of the company undertaken in those jurisdictions. There is a risk that changes in either the types of activities undertaken by the company or changes in tax rules relating to tax residency could subject the company and its shareholders to additional taxation.
On October 21, 2016, the United States Treasury and the IRS published final and temporary regulations under section 385 of the Internal Revenue Code ("385 Regulations") that target the inbound financing of a foreign-parented multinational group's U.S. subsidiaries. There are no immediate impacts to the company's financial position as a result of the application of the 385 Regulations, in particular, as there are broad exceptions for intercompany loans that are short-term in form and substance (cash pooling, short term advances, short-term ordinary course of business payables, etc.). On a go forward basis, the 385 Regulations could limit our ability to efficiently finance or otherwise choose between debt and equity transactions with our U.S. subsidiaries.
The international tax environment continues to change as a result of both coordinated actions by governments and unilateral measures designed by individual countries, both intended to tackle concerns over base erosion and profit shifting (BEPS) and perceived international tax avoidance techniques. The recommendations of the BEPS Project led by the Organization for Economic Cooperation and Development (OECD) are involved in much of the coordinated activity. As with any global implementation process there are concerns about potential lack of consistency in the local application of these items. Some of the recommendations are complex while others contain optional routes, thereby increasing the likelihood of only partial or limited implementation. Although the timing and methods of implementation vary, several jurisdictions have enacted legislation that is aligned with, and in some cases exceeds the scope of, the OECD's recommendations. This could lead to increased uncertainty with tax positions as well as increase the potential for double taxation.
We continually assess the impact of various U.S. federal, state and foreign legislative proposals, and modifications to existing tax treaties between the United States and foreign countries, which could result in a material increase in our U.S. federal, state or foreign taxes. We cannot predict the outcome of any specific legislative proposals. However, if such proposals were to be enacted, or if modifications were to be made to certain existing tax treaties, the consequences could have a materially adverse impact on the company, including increasing our tax burden, increasing costs of our tax compliance or otherwise adversely affecting our future results of operations, financial condition or liquidity.
The Tax Cuts and Jobs Act (the 2017 Tax Act) enacted on December 22, 2017, significantly reformed the taxation of business entities. The new legislation, among other things, includes changes to U.S. federal tax rates, imposes significant additional limitations on the deductibility of interest, allows for the expensing of capital expenditures, and puts into effect the migration from a “worldwide” system of taxation to a territorial system. We continue to examine the impact of this new legislation and the ultimate outcome of the new legislation on our business and financial condition. See also Item 8, Financial Statements and Supplementary Data - in Note 15, "Taxation," for further details and additional discussion on estimated amounts recorded as of December 31, 2017 for the 2017 Tax Act.
23
Examinations and audits by tax authorities could result in additional tax payments
for prior periods.
The company and its subsidiaries are subject to income taxes as well as non-income based taxes, in both the United States and various foreign jurisdictions and are subject to ongoing tax audits in various jurisdictions. The calculation of our tax liabilities involves dealing with uncertainties in the application of complex tax regulations in a multitude of jurisdictions across our global operations. Tax authorities may disagree with certain positions we have taken and assess additional taxes (and, in certain cases, interest, fines or penalties). We recognize potential liabilities and record tax liabilities for anticipated tax audit issues based on our estimate of whether, and the extent to which, additional income taxes will be due. We adjust these liabilities in light of changing facts and circumstances. Due to the complexity of some of these uncertainties, however, the ultimate resolution may result in a payment that is materially different from our current estimate of the tax liabilities.
The European Commission ("EC") continues to investigate certain transfer pricing rulings given by Member States to particular taxpayers that it believes may have violated the EU restriction on State aid. The investigation was triggered by the OECD / BEPS action plan as well as the EU's own agenda to tackle aggressive tax planning and tax avoidance. There is considerable uncertainty with the approach being taken, including retroactive application (10 year period), conflicts with OECD Transfer Pricing Guidelines and implications to bilateral tax treaties. While the company does not believe it has received State aid and is not a party to any investigation, due to the uncertainty of the process and retroactive nature of the assessments any potential future findings could have a materially adverse impact on the company, including increasing our tax burden, increasing costs of our tax compliance or otherwise adversely affecting our future results of operations, financial condition or liquidity.
Bermuda law differs from the laws in effect in the United States and may afford less
protection to shareholders.
Our shareholders may have more difficulty protecting their interests than shareholders of a company incorporated in a jurisdiction of the United States. As a Bermuda company, we are governed by the Companies Act 1981 of Bermuda (Companies Act). The Companies Act differs in some material respects from laws generally applicable to United States corporations and shareholders, including provisions relating to interested directors, mergers, amalgamations and acquisitions, takeovers, shareholder lawsuits and indemnification of directors.
Under Bermuda law, the duties of directors and officers of a company are generally owed to the company only. Shareholders of Bermuda companies do not generally have rights to take action against directors or officers of the company, and may only do so in limited circumstances described in the following paragraph. However, directors and officers may owe duties to a company's creditors in cases of impending insolvency. Directors and officers of a Bermuda company must, in exercising their powers and performing their duties, act honestly and in good faith with a view to the best interests of the company and must exercise the care and skill that a reasonably prudent person would exercise in comparable circumstances. Directors have a duty not to put themselves in a position in which their duties to the company and their personal interests may conflict and also are under a duty to disclose any personal interest in any material contract or proposed material contract with the company or any of its subsidiaries. If a director or officer of a Bermuda company is found to have breached such director’s duties to that company, the director may be held personally liable to the company in respect of that breach of duty.
Class actions and derivative actions are generally not available to shareholders under the laws of Bermuda. However, the Bermuda courts ordinarily would be expected to follow English case law precedent, which would permit a shareholder to commence an action in a company's name against the directors and officers to remedy a wrong done to the company where the act complained of is alleged to be beyond the company's corporate power or is illegal or would result in the violation of the company's memorandum of association or Bye-Laws. Furthermore, consideration would be given by the court to acts that are alleged to constitute a fraud against the minority shareholders or where an act requires the approval of a greater percentage of shareholders than actually approved it. Under our Second Amended and Restated Bye-Laws (Bye-Laws), each of our shareholders agrees to waive any claim or right of action, both individually and on our behalf, other than those involving fraud or dishonesty, against the company or any of our officers, directors or employees. The waiver applies to any action taken by a director, officer or employee, or the failure of such person to take any action, in the performance of his or her duties, except with respect to any matter involving any fraud or dishonesty on the part of the director, officer or employee. This waiver limits the right of shareholders to assert claims against our directors, officers and employees unless the act or failure to act involves fraud or dishonesty.
Our Bye-Laws also provide for indemnification of our directors and officers in respect of any loss arising or liability attaching to them in respect of any negligence, default, breach of duty or breach of trust of which a director or officer may be guilty in relation to the company other than in respect of his or her own fraud or dishonesty, which is the maximum extent of indemnification permitted under the Companies Act.
24
Because we are incorporated in Bermuda, it may be difficult for shareholders to serve process or enforce judgments against us or our directors and officers.
The company is organized under the laws of Bermuda. In addition, certain of our officers and directors reside in countries outside the United States. A substantial portion of the company's assets and the assets of these officers and directors are or may be located outside the United States. Investors may have difficulty effecting service of process within the United States on our directors and officers who reside outside the United States or recovering against the company or these directors and officers on judgments of U.S. courts based on civil liabilities provisions of the U.S. federal securities laws, even though the company has appointed an agent in the United States to receive service of process.
Further, it may not be possible in Bermuda or in countries other than the United States where the company has assets to enforce court judgments obtained in the United States against the company based on the civil liability provisions of U.S. federal or state securities laws. In addition, there is some doubt as to whether the courts of Bermuda and other countries would recognize or enforce judgments of U.S. courts obtained against the company or our directors or officers based on the civil liability provisions of the U.S. federal or state securities laws or would hear actions against the company or those persons based on those laws. We have been advised by our legal advisors in Bermuda that the United States and Bermuda do not currently have a treaty providing for the reciprocal recognition and enforcement of judgments in civil and commercial matters. Some remedies available under the laws of the United States or the states therein, including some remedies available under the U.S. federal securities laws, may not be allowed in Bermuda courts because they may be found to be contrary to Bermuda public policy. Therefore, a final judgment for the payment of money rendered by any federal or state court in the United States based on civil liability, whether or not based solely on U.S. federal or state securities laws, would not automatically be enforceable in Bermuda. Similarly, those judgments may not be enforceable in other countries other than the United States.
We have anti-takeover provisions in our Bye-Laws that may discourage a change of control.
Our Bye-Laws contain provisions that could make it more difficult for a third-party to acquire us or to obtain majority representation on our Board of Directors without the consent of our Board. As a result, shareholders may be limited in their ability to obtain a premium for their shares under such circumstances.
Specifically, our Bye-Laws contain the following provisions that may impede or delay an unsolicited takeover of the company:
|
•
|
we are prohibited from engaging, under certain circumstances, in a business combination (as defined in our Bye-Laws) with any interested shareholder (as defined in our Bye-Laws) for three years following the date that the shareholder became an interested shareholder;
|
|
•
|
our Board of Directors, without further shareholder action, is permitted by our Bye-Laws to issue preference shares, in one or more series, and determine by resolution any designations, preferences, qualifications, privileges, limitations, restrictions, or special or relative rights of an additional series. The rights of preferred shareholders may supersede the rights of common shareholders;
|
|
•
|
shareholders may only remove directors for “cause” (defined in our Bye-laws to mean willful misconduct or gross negligence which is materially injurious to the company, fraud or embezzlement, or a conviction of, or a plea of “guilty” or “no contest” to, a felony);
|
|
•
|
our Board of Directors is authorized to expand its size and fill vacancies; and
|
|
•
|
shareholders cannot act by written consent unless the consent is unanimous.
|
Our independent registered public accounting firm has advised us that it identified an issue related to an independence requirement contained in the Securities Exchange Act of 1934 regulations regarding auditor independence.
In May 2016, PricewaterhouseCoopers LLP (PwC) advised the company that it had identified an issue related to its independence under Rule 2-01(c)(1)(ii)(A) of Regulation S-X (Loan Rule) with respect to certain of PwC’s lenders who own certain Invesco registered funds managed by certain of our wholly-owned investment adviser subsidiaries. The company and such funds are required to have their financial statements audited by a public accounting firm that qualifies as independent under various SEC rules. As discussed below, the Staff of the Securities and Exchange Commission (SEC Staff) has issued a “no-action” letter to another mutual fund complex under substantially similar circumstances and subsequently issued a letter extending the relief provided by the such letter indefinitely.
The Loan Rule prohibits accounting firms, such as PwC, from having certain financial relationships with their audit clients and affiliated entities. Specifically, the Loan Rule provides, in relevant part, that an accounting firm is not independent if it receives a loan from a lender that is a “record or beneficial owner of more than ten percent of the audit client’s equity securities.” For purposes of the Loan Rule, audit clients include all of the registered investment companies advised by affiliates of the company, as well as the company and its other subsidiaries (collectively, the Invesco Funds Complex) for which PwC also serves as
25
independent auditor. PwC informed the company it has relationships with lenders who hold, as record owner, more than ten percent of the shares of certain funds within the Invesco Fund Complex. These relationships call into question PwC’s independence under the Loan Rule with respect to those funds, as well as all other funds in the Invesco Fund Complex and the company and its subsidiaries.
In June 2016, the SEC Staff issued a “no-action” letter to another mutual fund complex (see
Fidelity Management & Research Company et al., No-Action Letter
) related to the audit independence issue described above. In that letter, the SEC Staff confirmed that it would not recommend enforcement action against an audit client that relied on audit services performed by an audit firm that was not in compliance with the Loan Rule in certain specified circumstances. The circumstances described in the no-action letter are substantially similar to the circumstances that called into question PwC’s independence under the Loan Rule with respect to the Invesco Funds Complex, including the company. The company therefore believes that the Invesco Funds Complex can rely on the letter to continue to issue financial statements that are audited by PwC and we intend to do so. In September 2017, the SEC Staff issued a letter extending the relief in the June 2016 no-action letter referenced above. The extension makes no changes to the circumstances in the original no-action letter and does not include a new expiration date, providing indefinite relief.
If in the future the independence of PwC is called into question under the Loan Rule by circumstances that are not addressed in the SEC Staff’s no-action letter, the company will need to take other action and incur additional costs in order for the company’s filings with the SEC containing financial statements to be deemed compliant with applicable securities laws. Such action may include obtaining the review and audit of the financial statements filed by the company by another independent registered public accounting firm. In addition, under such circumstances, the company’s eligibility to issue securities under its existing registration statements on Form S-3 and Forms S-8 may be impacted and certain financial reporting covenants with our lenders may be impacted. There could be other burdensome requirements or impacts on other entities (including registered funds) included in the Invesco Funds Complex. Such consequences could have a material adverse effect on our business, results of operations and financial condition.
Insurance May Not Be Available at a Reasonable Cost to Protect Us from Liability.
We face the inherent risk of liability related to claims from clients, third-party vendors or others, actions taken by regulatory agencies and costs and losses associated with cyber incidents. To help protect against these risks, we purchase insurance in amounts, and against potential liabilities, that we consider appropriate, where such insurance is available at prices we deem reasonable. There can be no assurance, however, that a claim or claims will be covered by insurance or, if covered, will not exceed coverage limits, or that an insurer will meet its obligations regarding coverage, or that coverage will continue to be available on a cost effective basis. Insurance costs are impacted by market conditions and the risk profile of the insured, and may increase significantly over relatively short periods. In addition, certain insurance coverage may not be available or may only be available at prohibitive costs. Renewals of insurance policies may expose us to additional costs through higher premiums or the assumption of higher deductibles or co-insurance liability.
Item 1B.
Unresolved Staff Comments
None
Item 2.
Properties
Our registered office is located in Hamilton, Bermuda, and our corporate headquarters is in leased office space at 1555 Peachtree Street N.E., Suite 1800, Atlanta, Georgia, 30309, U.S.A. Our principal regional centers are maintained in leased facilities, except as noted below, in the following locations:
•
North America: 11 Greenway Plaza, Houston, Texas 77046
•
EMEA: Perpetual Park, Henley-on-Thames, Oxfordshire, RG9 1HH, United Kingdom (owned facilities)
•
Asia: Champion Tower, No. 3 Garden Road, Hong Kong
We maintain a global enterprise center in Hyderabad, India in leased facilities at DivyaSree Orion in the Ranga Reddy District of Hyderabad, India. We lease office space in 25 countries.
Item 3.
Legal Proceedings
See Item 8, Financial Statements and Supplementary Data, Note
18
-- "Commitments and Contingencies - Legal Proceedings," for information regarding legal proceedings.
26
Item 4.
Mine Safety Disclosures
Not applicable
Item 5.
Market for Registrant's Common Equity, Related Stockholder
Matters and Issuer Purchases of Equity Securities
Invesco Ltd. is organized under the laws of Bermuda, and our common shares are listed and traded on the New York Stock Exchange under the symbol “IVZ.” At
January 31, 2018
, there were approximately 5,330 holders of record of our common shares.
The following table sets forth, for the periods indicated, the high and low reported share prices on the New York Stock Exchange, based on data reported by Bloomberg.
|
Invesco Ltd.
Common Shares
|
|||||||||
|
High
|
Low
|
Dividends Declared*
|
|||||||
|
2017
|
|||||||||
|
Fourth Quarter
|
|
$37.85
|
|
|
$33.95
|
|
$0.2900
|
||
|
Third Quarter
|
|
$36.84
|
|
|
$31.58
|
|
$0.2900
|
||
|
Second Quarter
|
|
$35.91
|
|
|
$30.02
|
|
$0.2900
|
||
|
First Quarter
|
|
$33.46
|
|
|
$28.75
|
|
$0.2800
|
||
|
2016
|
|||||||||
|
Fourth Quarter
|
|
$33.34
|
|
|
$27.46
|
|
$0.2800
|
||
|
Third Quarter
|
|
$31.76
|
|
|
$24.34
|
|
$0.2800
|
||
|
Second Quarter
|
|
$32.85
|
|
|
$23.02
|
|
$0.2800
|
||
|
First Quarter
|
|
$33.54
|
|
|
$24.90
|
|
$0.2700
|
||
____________
|
*
|
Dividends declared represent dividends declared and paid during the quarter, but which are attributable to the prior quarter. Invesco declares and pays dividends on a quarterly basis in arrears.
|
27
The following graph illustrates the cumulative total shareholder return of our common shares over the five-year period beginning from the market close on the last trading day of 2012 through and including the last trading day in the fiscal year ended
December 31, 2017
, and compares it to the cumulative total return of the Standard and Poor's (S&P) 500 Index and to a group of peer investment management companies. This table is not intended to forecast future performance of our common shares.
Cumulative Shareholder Returns
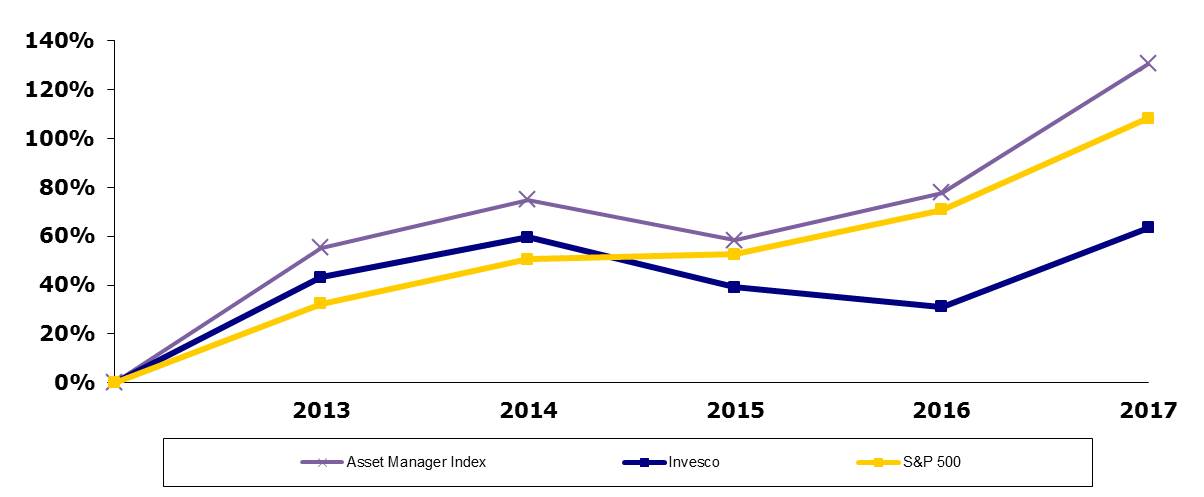
|
Note:
|
Asset Manager Index includes Affiliated Managers Group, Alliance Bernstein, Ameriprise Financial, Bank of New York Mellon, BlackRock, Charles Schwab, Eaton Vance, Federated Investors, Franklin Resources, Invesco Ltd., Lazard, Legg Mason, Northern Trust, Principal Financial Group, State Street, TD Ameritrade, and T. Rowe Price.
|
Important Information Regarding Dividend Payments
Invesco declares and pays dividends on a quarterly basis in arrears. On
January 31, 2018
, the company declared a fourth quarter
2017
cash dividend of
$0.29
per share, which will be paid on
March 2, 2018
to shareholders of record as of
February 15, 2018
, with an ex-dividend date of
February 14, 2018
.
The total dividend attributable to the
2017
fiscal year of
$1.16
per share represented a
3.6%
increase over the total dividend attributable to the
2016
fiscal year of
$1.12
per share. The declaration, payment and amount of any future dividends will be determined by our Board of Directors and will depend upon, among other factors, our earnings, financial condition and capital requirements at the time such declaration and payment are considered. The Board has a policy of managing dividends in a prudent fashion, with due consideration given to profit levels, overall debt levels and historical dividend payouts. See also Item 7, “Management's Discussion and Analysis of Financial Condition and Results of Operations - Liquidity and Capital Resources - Dividends,” for additional details regarding dividends.
Securities Authorized for Issuance under Equity Compensation Plans
The equity compensation plan information required in Item 201(d) of Regulation S-K is set forth in the definitive Proxy Statement for the company's annual meeting of shareholders, which will be filed with the SEC no later than 120 days after the close of the fiscal year ended
December 31, 2017
, and is incorporated by reference in this Report.
28
Repurchases of Equity Securities
The following table shows share repurchase activity during the three months ended
December 31, 2017
:
|
Month
|
Total Number
of Shares
Purchased
(1)
|
Average Price Paid Per Share
|
Total Number of Shares
Purchased as Part of Publicly Announced Plans or Programs (2) |
Approximate Dollar
Value of Shares that
May Yet Be Purchased Under the Plans or Programs (2) (millions) |
|||||||||
|
October 1 - 31, 2017
|
47,975
|
|
|
$35.71
|
|
—
|
|
|
$1,643.0
|
|
|||
|
November 1 - 30, 2017
|
32,529
|
|
|
$35.52
|
|
—
|
|
|
$1,643.0
|
|
|||
|
December 1 - 31, 2017
|
94,996
|
|
|
$36.52
|
|
—
|
|
|
$1,643.0
|
|
|||
|
175,500
|
|
—
|
|
||||||||||
____________
|
(1)
|
An aggregate of
175,500
shares were surrendered to us by Invesco employees to satisfy tax withholding obligations in connection with the vesting of equity awards during the three months ended
December 31, 2017
.
|
|
(2)
|
At
December 31, 2017
, a balance of
$1,643.0 million
remains available under the share repurchase authorizations approved by the Board on October 11, 2013 and July 22, 2016.
|
29
Item 6.
Selected Financial Data
The following tables present selected consolidated financial information for the company as of and for each of the five fiscal years in the period ended
December 31, 2017
. Except as otherwise noted below, the consolidated financial information has been prepared in accordance with U.S. generally accepted accounting principles.
|
As of and For The Years Ended December 31,
|
||||||||||||||
|
$ in millions, except per share and other data
|
2017
|
2016
|
2015
|
2014
|
2013
|
|||||||||
|
Operating Data
(1)
:
|
||||||||||||||
|
Operating revenues
|
5,160.3
|
|
4,734.4
|
|
5,122.9
|
|
5,147.1
|
|
4,644.6
|
|
||||
|
Net revenues
(2)
|
3,754.9
|
|
3,393.2
|
|
3,643.2
|
|
3,608.3
|
|
3,252.0
|
|
||||
|
Operating income
|
1,277.1
|
|
1,176.4
|
|
1,358.4
|
|
1,276.9
|
|
1,120.2
|
|
||||
|
Adjusted operating income
(3)
|
1,480.2
|
|
1,312.8
|
|
1,493.7
|
|
1,495.0
|
|
1,292.1
|
|
||||
|
Operating margin
|
24.7
|
%
|
24.8
|
%
|
26.5
|
%
|
24.8
|
%
|
24.1
|
%
|
||||
|
Adjusted operating margin
(3)
|
39.4
|
%
|
38.7
|
%
|
41.0
|
%
|
41.4
|
%
|
39.7
|
%
|
||||
|
Net income attributable to Invesco Ltd.
|
1,127.3
|
|
854.2
|
|
968.1
|
|
988.1
|
|
940.3
|
|
||||
|
Adjusted net income attributable to Invesco Ltd.
(4)
|
1,105.9
|
|
924.1
|
|
1,048.7
|
|
1,094.8
|
|
953.3
|
|
||||
|
Per Share Data:
|
||||||||||||||
|
Earnings per share:
|
||||||||||||||
|
-basic
|
2.75
|
|
2.06
|
|
2.26
|
|
2.27
|
|
2.10
|
|
||||
|
-diluted
|
2.75
|
|
2.06
|
|
2.26
|
|
2.27
|
|
2.10
|
|
||||
|
Adjusted diluted EPS
(1,4)
|
2.70
|
|
2.23
|
|
2.44
|
|
2.51
|
|
2.13
|
|
||||
|
Dividends declared per share
|
1.1500
|
|
1.1100
|
|
1.0600
|
|
0.9750
|
|
0.8475
|
|
||||
|
Balance Sheet Data:
|
||||||||||||||
|
Total assets
|
31,668.8
|
|
25,734.3
|
|
25,073.2
|
|
20,450.0
|
|
19,256.8
|
|
||||
|
Long-term debt
|
2,075.8
|
|
2,102.4
|
|
2,072.8
|
|
1,576.8
|
|
1,574.9
|
|
||||
|
Debt of consolidated investment products (CIP)
|
4,799.8
|
|
4,403.1
|
|
5,437.0
|
|
5,149.6
|
|
4,181.7
|
|
||||
|
Total equity attributable to Invesco Ltd.
|
8,696.1
|
|
7,503.8
|
|
7,885.3
|
|
8,326.0
|
|
8,392.6
|
|
||||
|
Total permanent equity
|
8,955.6
|
|
7,611.8
|
|
8,695.7
|
|
9,119.8
|
|
8,977.3
|
|
||||
|
Other Data
(1)
:
|
||||||||||||||
|
Ending AUM (in billions)
|
937.6
|
|
812.9
|
|
775.6
|
|
792.4
|
|
778.7
|
|
||||
|
Average AUM (in billions)
|
875.0
|
|
788.8
|
|
794.7
|
|
790.3
|
|
725.6
|
|
||||
|
Headcount
|
7,030
|
|
6,790
|
|
6,490
|
|
6,264
|
|
5,932
|
|
||||
_________
|
(1)
|
The company completed the sale of Atlantic Trust on December 31, 2013. The results of Atlantic Trust have been reflected as discontinued operations. Amounts presented represent continuing operations and exclude Atlantic Trust, with the exception of net income attributable to Invesco Ltd., basic earnings per share and diluted earnings per share.
|
|
(2)
|
Net revenues is a non-GAAP financial measure. See Item
7, “
Summary Operating Information,” footnote
1
, for the definition of this measure and the related reconciliation reference.
|
|
(3)
|
Adjusted operating income and adjusted operating margin are non-GAAP financial measures. See Item
7
, “Summary Operating Information,” footnote
2,
for the definition of these measures and the related reconciliation reference.
|
|
(4)
|
Adjusted net income attributable to Invesco Ltd. and adjusted diluted EPS are non-GAAP financial measures. See Item
7
, “Summary Operating Information,” footnote
3,
for the definition of these measures and the related reconciliation reference.
|
Item 7.
Management's Discussion and Analysis of Financial Condition and
Results of Operations
Executive Overview
The following executive overview summarizes the significant trends affecting our results of operations and financial condition for the periods presented. This overview and the remainder of this management's discussion and analysis supplements and should be read in conjunction with the Consolidated Financial Statements of Invesco Ltd. and its subsidiaries (collectively, the “company” or “Invesco”) and the notes thereto contained elsewhere in this Annual Report on Form 10-K.
Global financial markets in 2017 saw strong returns resulting from healthy economic indicators, improving macroeconomic data, and the expectation for benefits from tax reform in the U.S. Equity markets continued a rally that began the previous year as strong corporate earnings, low unemployment, and improving inflation measures helped to spur the strengthening outlook. In
30
the U.S., higher interest rates and better jobs data helped the markets early in the year. The passing of tax reform, including a significant corporate tax rate reduction late in the year, led equity markets higher with the S&P finishing the year at all-time highs up
19.4%
.
European markets similarly benefited from improving confidence and outlook for future growth, as the plan for the UK’s exit from the EU continued to take shape. The European Central Bank indicated the potential for a slowing of economic stimulus. The Bank of England increased interest rates, which helped to push the FTSE 100 higher, finishing the year up
7.6%
.
Strong corporate results in Asia, continued optimism for global growth, and stability for Japan’s government after the results of a snap election late in the year led the Nikkei higher finishing the year up
19.1%
.
Bond markets were broadly positive during 2017. Accommodative monetary policy drove corporate and high-yield bond outperformance, while government bonds underperformed on rising interest rate expectations and future changes in central bank policies. Overall, the Barclay’s U.S. Aggregate Bond index finished the year up
3.5%
.
The table below summarizes the year ended
December 31
returns based on price appreciation/(depreciation) of several major market indices for
2017
,
2016
, and
2015
:
|
Year ended December 31,
|
|||||||
|
Equity Index
|
Index expressed in currency
|
2017
|
2016
|
2015
|
|||
|
S&P 500
|
U.S. Dollar
|
19.4%
|
9.5%
|
(0.7)%
|
|||
|
FTSE 100
|
British Pound
|
7.6%
|
14.4%
|
(4.9)%
|
|||
|
FTSE 100
|
U.S. Dollar
|
17.9%
|
(4.1)%
|
(10.1)%
|
|||
|
Nikkei 225
|
Japanese Yen
|
19.1%
|
0.4%
|
9.1%
|
|||
|
Nikkei 225
|
U.S. Dollar
|
23.4%
|
3.8%
|
8.0%
|
|||
|
MSCI Emerging Markets
|
U.S. Dollar
|
34.4%
|
8.6%
|
(17.0)%
|
|||
|
Bond Index
|
|||||||
|
Barclays U.S. Aggregate Bond
|
U.S. Dollar
|
3.5%
|
2.7%
|
0.6%
|
|||
The company's financial results are impacted by the fluctuations in exchange rates against the U.S. Dollar, as discussed in the "Foreign Exchange Impact on Balance Sheet, Assets Under Management and Results of Operations" section and the
"Results of Operations for the Years Ended December 31, 2017 compared to December 31, 2016 compared to December 31, 2015" section below.
Throughout 2017, we continued to execute on our long-term strategic objectives, which further improved our ability to serve clients, strengthened our investment performance and helped us deliver competitive levels of operating income and margins. We also took advantage of opportunities in the market and further invested in our products and capabilities, our global platform and our people in ways that strengthened our business and further differentiated us in the marketplace to help ensure our long-term success.
In addition, we benefited from our long-term efforts to ensure a diversified base of assets under management. One of Invesco's core strengths, and a key differentiator for the company within the industry, is our broad diversification across client domiciles, asset classes and distribution channels. Our geographical diversification allows us to recognize growth opportunities in various markets in different parts of the world. This broad diversification mitigates the impact on Invesco of different market cycles.
As of the filing of this Report, Invesco held credit ratings of
A2/Stable, A/Negative and A-/Stable
from Moody's Investor Services Moody's, S&P, and Fitch, respectively.
One of the company's strategic objectives is to harness the power of our global platform, improving effectiveness and efficiency by allocating our resources to the opportunities that will best benefit clients and our business. Consistent with this objective, business optimization charges of
$58.0 million
were recorded in 2017, including
$30.0 million
of staff severance costs recorded in employee compensation expense associated with a business transformation initiative. This is a continuation of efforts to transform several key business support functions to become more effective and efficient by leveraging shared service centers, outsourcing, automation of key processes and optimization of the company's office footprint. Given the size of the opportunity on certain initiatives, including outsourcing of back office functions, the optimization work will continue past the original targeted completion date, and spending has increased. This optimization work will make Invesco a stronger company, further increasing the effectiveness and efficiency of our global platform and will allow us to fund crucial strategic initiatives. As of the end of
2017
, this initiative
31
had produced annualized run-rate expense savings of
$43.8 million
. These savings have helped offset acquisition and regulatory-related increases in operating expenses. Incremental implementation costs in 2018 are estimated to be up to
$35 million
, and the initiative is expected to generate annualized run-rate expense savings of up to $65 million by completion.
The investment management industry is subject to extensive levels of ongoing regulatory oversight and examination. In the U.S., U.K., and other jurisdictions in which the company operates, governmental authorities regularly make inquiries, conduct investigations and administer examinations with respect to compliance with applicable laws and regulations.
The Markets in Financial Instrument Directive (MiFID II) became effective in Europe in January 2018. Invesco is committed to ensuring our investment professionals have access to the external research market in order to achieve our long-term investment performance goals. Therefore, the company has announced that, beginning in January 2018, external research costs incurred for MiFID II impacting funds and client accounts in Europe have been absorbed by the company. We do not expect these costs to be material to the company's financial statements.
On August 18, 2017, Invesco acquired 100% of the outstanding shares of the European ETF business. Our European ETF business is a leading independent specialist provider of ETFs based in Europe, which added $26.0 billion in AUM (including approximately $7 billion of externally managed AUM) at acquisition date. The combination strengthens Invesco's existing factor-based capabilities, provides additional scale and relevance in the European ETF market and enhances the firm's ability to meet client needs globally.
As previously announced, the company has entered into a definitive agreement to acquire Guggenheim Investments' ETF business, which includes
76
ETFs with
$38.4 billion of assets under management as of December 31, 2017
. The acquisition is expected to close in the second quarter of 2018 for an anticipated purchase price of $1.2 billion to be paid in cash. The acquisition will expand the depth, breadth and diversity of Invesco's traditional and smart beta ETFs, while providing additional scale and relevance in the global growing ETF market. It will also build on our existing self-indexing capability and bring in highly complementary capabilities that further strengthen our ability to deliver the outcomes clients seek and position us for accelerated growth in the future.
On December 22, 2017, the 2017 Tax Act was signed into law. The 2017 Tax Act, among other items, reduces the federal corporate tax rate from 35% to 21% effective January 1, 2018. Our intention is to use the additional cash flow generated from the lower tax rate first to reduce the anticipated future outstanding balance on the credit facility resulting from the Guggenheim acquisition. After the acquisition is complete and the credit facility balance is reduced, any residual excess will follow our capital management priorities.
Invesco continues to demonstrate its commitment to supporting financial advisors with industry leading tools and resources, as we believe these areas are key to delivering superior investment experiences. The range of investment capabilities available through Jemstep are broad across the firm's active, alternative and ETF offerings. Additionally, Jemstep offers open architecture to help advisors provide customized solutions for clients. As a market-leading provider of digital solutions, Jemstep continues to expand its capabilities and market presence, and is an integral part of Invesco's growth strategy.
Presentation of Management's Discussion and Analysis of Financial Condition and Results of Operations -- Impact of Consolidated Investment Products
The company provides investment management services to, and has transactions with, various retail mutual funds and similar entities, private equity, real estate, fund-of-funds, collateralized loan obligation products (CLOs), and other investment entities sponsored by the company for the investment of client assets in the normal course of business. The company serves as the investment manager, making day-to-day investment decisions concerning the assets of the products. Investment products that are consolidated are referred to in this Form 10-K (Report) as consolidated investments products (CIP). CIP includes all variable and voting interest entities, as applicable, with effect from the adoption of ASU 2015-02. The company's economic risk with respect to each investment in CIP is limited to its equity ownership and any uncollected management and performance fees. The company is required to consolidate certain managed funds from time-to-time, as discussed more fully in Item 8, Financial Statements and Supplementary Data, Note 1 -- "Accounting Policies -- Basis of Accounting and Consolidation."
The majority of the company's CIP balances are CLO-related. The collateral assets of the CLOs are held solely to satisfy the obligations of the CLOs. The company has no right to the benefits from, nor does it bear the risks associated with, the collateral assets held by the CLOs, beyond the company's direct investments in, and management and performance fees generated from, the CLOs. If the company were to liquidate, the collateral assets would not be available to the general creditors of the company, and as a result, the company does not consider them to be company assets. Likewise, the investors in the CLOs have no recourse to
32
the general credit of the company for the notes issued by the CLOs. The company therefore does not consider this debt to be a company liability.
The impact of CIP is so significant to the presentation of the company’s Consolidated Financial Statements that the company has elected to deconsolidate these products in its non-GAAP disclosures. This Management’s Discussion and Analysis of Financial Condition and Results of Operations contains four distinct sections, which follow after the Assets Under Management discussion:
|
•
|
Results of Operations (years ended
December 31, 2017
compared to
December 31, 2016
compared to
December 31, 2015
);
|
|
•
|
Schedule of Non-GAAP Information;
|
|
•
|
Balance Sheet Discussion; and
|
|
•
|
Liquidity and Capital Resources.
|
To assess the impact of CIP on the company's Results of Operations and Balance Sheet Discussion, refer to Part II, Item 8, Financial Statements, Note
19
, "Consolidated Investment Products." The impact on the company's results of operations is illustrated by a column which shows the dollar-value change in the consolidated figures, as caused by the consolidation of CIP. For example, the impact of CIP on operating revenues for the year ended
December 31, 2017
was a
reduction
of
$32.4 million
. This indicates that their consolidation reduced consolidated revenues by this amount, reflecting the elimination upon their consolidation of the operating revenues earned by Invesco for managing these investment products.
Wherever a non-GAAP measure is referenced, a disclosure will follow in the narrative or in the note referring the reader to the Schedule of Non-GAAP Information, where additional details regarding the use of the non-GAAP measure by the company are disclosed, along with reconciliations of the most directly comparable U.S. GAAP measures to the non-GAAP measures. To further enhance the readability of the Results of Operations section, separate tables for each of the revenue, expense, and other income and expenses (non-operating income/expense) sections of the income statement introduce the narrative that follows, providing a section-by-section review of the company’s income statements for the periods presented.
Summary Operating Information
Summary operating information for
2017
,
2016
and
2015
is presented in the table below.
|
$ in millions, other than per share amounts, operating margins and AUM
|
Year ended December 31,
|
|||||||
|
U.S. GAAP Financial Measures Summary
|
2017
|
2016
|
2015
|
|||||
|
Operating revenues
|
5,160.3
|
|
4,734.4
|
|
5,122.9
|
|
||
|
Operating income
|
1,277.1
|
|
1,176.4
|
|
1,358.4
|
|
||
|
Operating margin
|
24.7
|
%
|
24.8
|
%
|
26.5
|
%
|
||
|
Net income attributable to Invesco Ltd.
|
1,127.3
|
|
854.2
|
|
968.1
|
|
||
|
Diluted EPS
|
2.75
|
|
2.06
|
|
2.26
|
|
||
|
Non-GAAP Financial Measures Summary
|
||||||||
|
Net revenues
(1)
|
3,754.9
|
|
3,393.2
|
|
3,643.2
|
|
||
|
Adjusted operating income
(2)
|
1,480.2
|
|
1,312.8
|
|
1,493.7
|
|
||
|
Adjusted operating margin
(2)
|
39.4
|
%
|
38.7
|
%
|
41.0
|
%
|
||
|
Adjusted net income attributable to Invesco Ltd.
(3)
|
1,105.9
|
|
924.1
|
|
1,048.7
|
|
||
|
Adjusted diluted EPS
(3)
|
2.70
|
|
2.23
|
|
2.44
|
|
||
|
Assets Under Management
|
||||||||
|
Ending AUM (billions)
|
937.6
|
|
812.9
|
|
775.6
|
|
||
|
Average AUM (billions)
|
875.0
|
|
788.8
|
|
794.7
|
|
||
_________
|
(1)
|
Net revenues is a non-GAAP financial measure. Net revenues are operating revenues plus our proportional share of the net revenues of our joint venture investments, less third-party distribution, service and advisory expenses, plus management and performance fees earned from CIP. See "Schedule of Non-GAAP Information" for the reconciliation of operating revenues to net revenues.
|
33
|
(2)
|
Adjusted operating income and adjusted operating margin are non-GAAP financial measures. Adjusted operating margin is adjusted operating income divided by net revenues. Adjusted operating income includes operating income plus our proportional share of the net operating income of our joint venture investments, the operating income impact of the consolidation of investment products, acquisition/disposition related adjustments, compensation expense related to market valuation changes in deferred compensation plans, and other reconciling items. See "Schedule of Non-GAAP Information," for the reconciliation of operating income to adjusted operating income.
|
|
(3)
|
Adjusted net income attributable to Invesco Ltd. and adjusted diluted EPS are non-GAAP financial measures. Adjusted net income attributable to Invesco Ltd. is net income attributable to Invesco Ltd. adjusted to exclude the net income of CIP, add back acquisition/disposition related adjustments, the net income impact of deferred compensation plans and other reconciling items. Adjustments made to net income attributable to Invesco Ltd. are tax-effected in arriving at adjusted net income attributable to Invesco Ltd. By calculation, adjusted diluted EPS is adjusted net income attributable to Invesco Ltd. divided by the weighted average number of shares outstanding (for diluted EPS). See "Schedule of Non-GAAP Information," for the reconciliation of net income attributable to Invesco Ltd. to adjusted net income attributable to Invesco Ltd..
|
34
Investment Capabilities Performance Overview
Invesco's first strategic objective is to achieve strong investment performance over the long-term for our clients. As of
December 31, 2017
,
57%
,
64%
and
75%
of measured ranked actively managed assets performed in the top half of peer groups on a one-year, three-year and five-year basis respectively. The table below presents the one-, three- and five-year performance of our measured ranked actively managed investment products measured by the percentage of AUM ahead of benchmark and AUM in the top half of peer group.
(1)
|
Benchmark Comparison
|
Peer Group Comparison
|
||||||||||||
|
% of AUM Ahead of Benchmark
|
% of AUM In Top Half of Peer Group
|
||||||||||||
|
1yr
|
3yr
|
5yr
|
1yr
|
3yr
|
5yr
|
||||||||
|
Equities
|
|||||||||||||
|
U.S. Core
|
32
|
%
|
9
|
%
|
13
|
%
|
32
|
%
|
6
|
%
|
6
|
%
|
|
|
U.S. Growth
|
40
|
%
|
27
|
%
|
36
|
%
|
40
|
%
|
36
|
%
|
36
|
%
|
|
|
U.S. Value
|
53
|
%
|
91
|
%
|
52
|
%
|
36
|
%
|
55
|
%
|
94
|
%
|
|
|
Sector Funds
|
42
|
%
|
41
|
%
|
17
|
%
|
16
|
%
|
17
|
%
|
20
|
%
|
|
|
U.K.
|
7
|
%
|
19
|
%
|
100
|
%
|
2
|
%
|
6
|
%
|
71
|
%
|
|
|
Canadian
|
47
|
%
|
11
|
%
|
39
|
%
|
47
|
%
|
11
|
%
|
11
|
%
|
|
|
Asian
|
76
|
%
|
91
|
%
|
92
|
%
|
78
|
%
|
83
|
%
|
87
|
%
|
|
|
Continental European
|
46
|
%
|
98
|
%
|
99
|
%
|
45
|
%
|
75
|
%
|
98
|
%
|
|
|
Global
|
56
|
%
|
71
|
%
|
62
|
%
|
40
|
%
|
83
|
%
|
82
|
%
|
|
|
Global Ex U.S. and Emerging Markets
|
13
|
%
|
25
|
%
|
91
|
%
|
4
|
%
|
4
|
%
|
10
|
%
|
|
|
Fixed Income
|
|||||||||||||
|
Money Market
|
99
|
%
|
100
|
%
|
99
|
%
|
98
|
%
|
97
|
%
|
97
|
%
|
|
|
U.S. Fixed Income
|
88
|
%
|
88
|
%
|
86
|
%
|
85
|
%
|
87
|
%
|
85
|
%
|
|
|
Global Fixed Income
|
79
|
%
|
66
|
%
|
68
|
%
|
86
|
%
|
47
|
%
|
43
|
%
|
|
|
Stable Value
|
100
|
%
|
100
|
%
|
100
|
%
|
100
|
%
|
100
|
%
|
100
|
%
|
|
|
Other
|
|||||||||||||
|
Alternatives
|
81
|
%
|
79
|
%
|
71
|
%
|
50
|
%
|
42
|
%
|
49
|
%
|
|
|
Balanced
|
47
|
%
|
49
|
%
|
50
|
%
|
41
|
%
|
95
|
%
|
89
|
%
|
|
____________
|
(1)
|
AUM measured in the one-, three-, and five-year peer group rankings represents
56%
,
56%
, and
53%
of total Invesco AUM, respectively, and AUM measured versus benchmark on a one-, three-, and five-year basis represents
70%
,
67%
, and
62%
of total Invesco AUM, respectively, as of
December 31, 2017
. Peer group rankings are sourced from a widely-used third party ranking agency in each fund's market (Lipper, Morningstar, IA, Russell, Mercer, eVestment Alliance, SITCA, Value Research) and are asset-weighted in USD. Rankings are as of prior quarter-end for most institutional products and preceding month-end for Australian retail funds due to their late release by third parties. Rankings for the most representative fund in each Global Investment Performance Standard (GIPS) composite are applied to all products within each GIPS composite. Excludes passive products, closed-end funds, private equity limited partnerships, non-discretionary direct real estate, unit investment trusts, fund-of-funds with component funds managed by Invesco, stable value building block funds and CLOs. Certain funds and products were excluded from the analysis because of limited benchmark or peer group data. Had these been available, results may have been different. These results are preliminary and subject to revision. Performance assumes the reinvestment of dividends. Past performance is not indicative of future results and may not reflect an investor's experience.
|
35
Foreign Exchange Impact on Balance Sheet, Assets Under Management and Results of Operations
A significant portion of our business is based outside of the U.S. The strengthening or weakening of the U.S. Dollar against other currencies, primarily the Pound Sterling, Canadian Dollar, Euro and Japanese Yen will impact our assets, liabilities, AUM and reported revenues and expenses from period to period. The assets, liabilities and AUM of foreign subsidiaries are translated at period end spot foreign currency exchange rates. The income statements of foreign currency subsidiaries are translated into U.S. Dollars, the reporting currency of the company, using average foreign exchange rates.
The table below sets forth the spot foreign exchange rates used for translation of non-U.S. Dollar denominated asset, liabilities and AUM into U.S. Dollars:
|
Spot Foreign Exchange Rates
|
December 31, 2017
|
December 31, 2016
|
December 31, 2015
|
|||||
|
Pound Sterling ($ per £)
|
1.353
|
|
1.236
|
|
1.474
|
|
||
|
Canadian Dollar (CAD per $)
|
1.253
|
|
1.341
|
|
1.389
|
|
||
|
Japan (¥ per $)
|
112.645
|
|
116.600
|
|
120.275
|
|
||
|
Euro ($ per Euro)
|
1.201
|
|
1.054
|
|
1.086
|
|
||
The table below sets forth the average foreign exchange rates used for translation of non-U.S. Dollar denominated income, including revenues and expenses, into U.S. Dollars:
|
Years ended December 31,
|
||||||||
|
Average Foreign Exchange Rates
|
2017
|
2016
|
2015
|
|||||
|
Pound Sterling ($ per £)
|
1.288
|
|
1.356
|
|
1.528
|
|
||
|
Canadian Dollar (CAD per $)
|
1.297
|
|
1.324
|
|
1.276
|
|
||
|
Japan (¥ per $)
|
112.137
|
|
108.517
|
|
121.014
|
|
||
|
Euro ($ per Euro)
|
1.129
|
|
1.107
|
|
1.110
|
|
||
A comparison of period end spot rates between
December 31, 2017
and
December 31, 2016
shows a strengthening of the Pound Sterling, the Euro, Canadian Dollar and Japanese Yen relative to the U.S. Dollar, which is reflected in the translation of our Pound Sterling-based, Euro-based, Canadian Dollar-based and Japanese Yen-based assets, liabilities and AUM into U.S. Dollars, respectively.
A comparison of period end spot rates between
December 31, 2016
and
December 31, 2015
shows a weakening of the Pound Sterling and the Euro relative to the U.S. Dollar, which is reflected in the translation of our Pound Sterling-based and Euro assets, liabilities and AUM into U.S. Dollars. Over the same period, the Canadian Dollar and Japanese Yen have strengthened relative to the U.S. Dollar, which is reflected in the translation of our Canadian Dollar-based and Japanese Yen-based assets, liabilities and AUM into U.S. Dollars, respectively.
A comparison of the average foreign exchange rates used for the year ended
December 31, 2017
when compared to the year ended
December 31, 2016
shows a weakening of the Pound Sterling and the Japanese Yen relative to the U.S. Dollar, which is reflected in the translation of our Pound Sterling-based and Japanese Yen-based revenue and expenses into U.S. Dollars. Over the same period, the Canadian Dollar and Euro strengthened, which is reflected in the translation of our Canadian Dollar-based and Euro-based revenue and expenses into U.S. Dollars, respectively.
A comparison of the average foreign exchange rates used for the year ended
December 31, 2016
when compared to the year ended
December 31, 2015
shows a significant weakening of the Pound Sterling relative to the U.S. Dollar, together with a weakening of the Canadian Dollar relative to the U.S. Dollar which is reflected in the translation of our Pound Sterling-based and Canadian Dollar-based revenue and expenses into U.S. Dollars. Over the same period, the Japanese Yen strengthened significantly relative to the U.S. Dollar, which was reflected in the translation of our Japanese Yen-based revenue and expenses into U.S. Dollars, respectively. The Euro exchange rate was very similar across the two periods.
36
Assets Under Management
The following presentation and discussion of AUM includes Passive and Active AUM.
Passive AUM includes ETFs, unit investment trusts (UITs), certain non-fee earning leverage and other passive mandates.
Active AUM is total AUM less Passive AUM.
The AUM tables and the discussion below refer to AUM as long-term. As of December 31, 2017, the company changed the presentation of long-term inflows, outflows and AUM to exclude UITs and product leverage. Non-management fee earning AUM now includes Invesco PowerShares QQQ, UITs and product leverage. In the AUM tables below, all periods have been reclassified to conform to the new presentation. The net flows in non-management fee earning AUM can be relatively short-term in nature and, due to the relatively low revenue yield, these can have a significant impact on overall net revenue yield. All periods have been reclassified to conform to the new presentation.
Long-term inflows and the underlying reasons for the movements in this line item include investments from new clients, existing clients adding new accounts/funds or contributions/subscriptions into existing accounts/funds, and new funding commitments into private equity funds. Beginning with the six months ended December 31, 2017, reinvested dividends and capital gains are included in long-term inflows to be consistent with general industry practice. For previous periods, reinvested dividends and capital gains were included in market gains and losses. Long-term outflows reflect client redemptions from accounts/funds and include the return of invested capital on the maturity or liquidation of private equity funds. We present net flows into institutional money market funds separately because shareholders of those funds typically use them as short-term funding vehicles and because their flows are particularly sensitive to short-term interest rate movements.
Changes in AUM were as follows
:
|
2017
|
2016
|
2015
|
||||||||||||||||||||||||
|
$ in billions
|
Total AUM
|
Active
|
Passive
|
Total AUM
|
Active
|
Passive
|
Total AUM
|
Active
|
Passive
|
|||||||||||||||||
|
January 1
|
812.9
|
|
668.5
|
|
144.4
|
|
775.6
|
|
636.5
|
|
139.1
|
|
792.4
|
|
651.0
|
|
141.4
|
|
||||||||
|
Long-term inflows
(1)
|
190.3
|
|
147.4
|
|
42.9
|
|
177.8
|
|
141.9
|
|
35.9
|
|
178.4
|
|
153.6
|
|
24.8
|
|
||||||||
|
Long-term outflows
|
(178.8
|
)
|
(140.6
|
)
|
(38.2
|
)
|
(161.3
|
)
|
(135.0
|
)
|
(26.3
|
)
|
(161.8
|
)
|
(139.5
|
)
|
(22.3
|
)
|
||||||||
|
Long-term net flows
|
11.5
|
|
6.8
|
|
4.7
|
|
16.5
|
|
6.9
|
|
9.6
|
|
16.6
|
|
14.1
|
|
2.5
|
|
||||||||
|
Net flows in non-management fee earning AUM
|
3.0
|
|
—
|
|
3.0
|
|
(6.4
|
)
|
—
|
|
(6.4
|
)
|
(2.2
|
)
|
—
|
|
(2.2
|
)
|
||||||||
|
Net flows in institutional money market funds
|
(3.2
|
)
|
(3.2
|
)
|
—
|
|
12.8
|
|
13.1
|
|
(0.3
|
)
|
(11.9
|
)
|
(12.3
|
)
|
0.4
|
|
||||||||
|
Total net flows
|
11.3
|
|
3.6
|
|
7.7
|
|
22.9
|
|
20.0
|
|
2.9
|
|
2.5
|
|
1.8
|
|
0.7
|
|
||||||||
|
Market gains and losses
(1)
|
66.0
|
|
45.4
|
|
20.6
|
|
37.7
|
|
32.1
|
|
5.6
|
|
(2.6
|
)
|
(0.3
|
)
|
(2.3
|
)
|
||||||||
|
Acquisitions/dispositions, net
|
26.0
|
|
—
|
|
26.0
|
|
(1.2
|
)
|
2.0
|
|
(3.2
|
)
|
(0.7
|
)
|
—
|
|
(0.7
|
)
|
||||||||
|
Foreign currency translation
|
21.4
|
|
21.1
|
|
0.3
|
|
(22.1
|
)
|
(22.1
|
)
|
—
|
|
(16.0
|
)
|
(16.0
|
)
|
—
|
|
||||||||
|
December 31
|
937.6
|
|
738.6
|
|
199.0
|
|
812.9
|
|
668.5
|
|
144.4
|
|
775.6
|
|
636.5
|
|
139.1
|
|
||||||||
|
Average AUM
|
||||||||||||||||||||||||||
|
Average long-term AUM
|
721.5
|
|
632.6
|
|
88.9
|
|
652.1
|
|
586.9
|
|
65.2
|
|
650.2
|
|
587.5
|
|
62.7
|
|
||||||||
|
Average AUM
|
875.0
|
|
705.3
|
|
169.7
|
|
788.8
|
|
653.4
|
|
135.4
|
|
794.7
|
|
653.6
|
|
141.1
|
|
||||||||
|
Revenue yield
|
||||||||||||||||||||||||||
|
Gross revenue yield on AUM
(2)
|
59.6
|
|
70.1
|
|
16.3
|
|
60.7
|
|
70.3
|
|
15.3
|
|
65.0
|
|
75.9
|
|
14.5
|
|
||||||||
|
Gross revenue yield on AUM before performance fees
(2)
|
58.2
|
|
68.5
|
|
16.3
|
|
60.2
|
|
69.6
|
|
15.3
|
|
63.9
|
|
74.6
|
|
14.5
|
|
||||||||
|
Net revenue yield on AUM
(3)
|
42.9
|
|
49.3
|
|
16.3
|
|
43.0
|
|
48.8
|
|
15.3
|
|
45.8
|
|
52.6
|
|
14.5
|
|
||||||||
|
Net revenue yield on AUM before performance fees
(3)
|
41.5
|
|
47.6
|
|
16.3
|
|
42.4
|
|
48.1
|
|
15.3
|
|
44.6
|
|
51.0
|
|
14.5
|
|
||||||||
|
(1)
|
For the six months ended December 31, 2017, reinvested dividends and capital gains of
$7.0 billion
are included in long-term inflows. For previous periods, reinvested dividends and capital gains are included in market gains and losses.
|
|
(2)
|
Gross revenue yield on AUM is equal to annualized total operating revenues divided by average AUM, excluding joint venture (JV) AUM. Our share of the average AUM in
2017
for our JVs in China was
$8.5 billion
(
2016
:
$9.2 billion
,
2015
:
$6.1 billion
). It is appropriate to exclude the average AUM of our JVs for purposes of computing gross revenue yield on AUM, because the revenues resulting from these
|
37
AUM are not presented in our operating revenues. Under U.S. GAAP, our share of the net income of the JVs is recorded as equity in earnings of unconsolidated affiliates on our Consolidated Statements of Income. Additionally, the numerator of the gross revenue yield measure, operating revenues, excludes the management fees earned from CIP; however, the denominator of the measure includes the AUM of these investment products. Therefore, the gross revenue yield measure is not considered representative of the company's true effective fee rate from AUM.
|
(3)
|
Net revenue yield on AUM is equal to annualized net revenues divided by average AUM. See “Schedule of Non-GAAP Information” for a reconciliation of operating revenues to net revenues.
|
Flows
There are numerous drivers of AUM inflows and outflows, including individual investor decisions to change investment preferences, fiduciaries and other gatekeepers making broad asset allocation decisions on behalf of their clients and reallocation of investments within portfolios. We are not a party to these asset allocation decisions, as the company does not generally have access to the underlying investor's decision-making process, including their risk appetite or liquidity needs. Therefore, the company is not in a position to provide meaningful information regarding the drivers of inflows and outflows.
AUM at
December 31, 2017
wer
e
$937.6 billion
(
December 31, 2016
:
$812.9 billion
;
December 31, 2015
:
$775.6 billion
). During the year ended
December 31, 2017
, long-term net
inflows
and net
inflows
in non-management fee earning AUM
increased
AUM by
$11.5 billion
and
$3.0 billion
respectively, offset by net
outflows
of institutional money market funds of
$3.2 billion
.
For the six months ended
December 31, 2017
, long-term net
inflows
included an inflow of
$7.0 billion
related to reinvested dividends and capital gains. For previous periods, reinvested dividends and capital gains are included in market gains and losses. During the year ended
December 31, 2016
, long-term net
inflows
and net
inflows
of institutional money market funds
increased
AUM by
$16.5 billion
and
$12.8 billion
, respectively, offset by net
outflows
in non-management fee earning AUM of
$6.4 billion
. During the year ended
December 31, 2015
, long-term net
inflows
increased
AUM by
$16.6 billion
, offset by net outflows in institutional money market funds of
$11.9 billion
and net outflows in non-management fee earning AUM of
$2.2 billion
.
Net
inflows
during the year ended
December 31, 2017
included long-term net active
inflows
of
$6.8 billion
and net
inflows
of passive AUM of
$4.7 billion
. L
ong-term net inflows included net inflows from our retail distribution channel o
f
$12.4 billion
and net outflows from
our institutional distribution channel of
$0.9 billion
.
By asset class, long-term net flows were positive for the fixed income, balanced and alternatives classes, and were negative for the equity asset class. Long-term net inflows included
$12.8 billion
and
$1.3 billion
from clients domiciled in Continental Europe and Asia, respectively, offset by long-term net outflows of
$1.3 billion
,
$1.0 billion
and
$0.3 billion
from clients domiciled in the U.K., U.S., and Canada, respectively.
Net
inflows
during the year ended
December 31, 2016
included long-term net active
inflows
of
$6.9 billion
and net
inflows
of passive AUM of
$9.6 billion
. Long-term net inflows were split between our institutional distribution channel of
$12.1 billion
and our retail distribution channel of
$4.4 billion
. By asset class, long-term net flows were positive for the fixed income and alternatives classes, and were negative for the equity and balanced asset classes. Long-term net inflows included
$15.5 billion
and
$5.9 billion
from clients domiciled in Asia and the U.S., respectively, offset by long-term net outflows of
$3.3 billion
,
$1.1 billion
and
$0.5 billion
from clients domiciled in Continental Europe, Canada and the U.K., respectively.
Net
inflows
during the year ended
December 31, 2015
included long-term net
inflows
of active AUM
of
$14.1 billion
and passive AUM of
$2.5 billion
. Net flows in
2015
were split between net inflows of
$14.1 billion
into our institutional distribution channel and
$2.5 billion
into our retail distribution channel.
Average AUM during the year ended
December 31, 2017
were
$875.0 billion
, compared to
$788.8 billion
for the year ended
December 31, 2016
a
nd
$794.7 billion
fo
r the year ended
December 31, 2015
.
Market Returns
Market gains and losses include the net change in AUM resulting from changes in market values of the underlying securities from period to period. As discussed in the “Executive Overview” section of this Management’s Discussion and Analysis, during
2017
, global markets saw strong returns for the year. See below for a discussion of the impact of foreign exchange rates on AUM.
During the year ended
December 31, 2017
,
positive
market movement
increased
AUM by
$66.0 billion
, w
ith gains in all asset classes, with the most significant gains arising from the equity asset class. During the year ended
December 31, 2016
,
positive
market movement
increased
AUM by
$37.7 billion
, with gains in each asset asset class, most significantly from the equity asset class. During the year ended
December 31, 2015
, negative market movement decreased AUM by
$2.6 billion
, with declines in the alternatives, fixed income and balanced asset classes, partially offset by gains in the equity asset class.
38
Foreign Exchange Rates
During the year ended
December 31, 2017
, we experienced
increases
in AUM of $
21.4 billion
due to changes in foreign exchange rates (
December 31, 2016
: AUM
decreased
by
$22.1 billion
;
December 31, 2015
: AUM decreased by
$16.0 billion
). See the company's disclosures regarding the changes in foreign exchange rates in the “Foreign Exchange Impact on Balance Sheet, Assets Under Management and Results of Operations” section above for additional information regarding the movement of foreign exchange rates.
Acquisitions and Dispositions
During the year ended
December 31, 2017
, we completed the acquisition of the European ETF business, which added $26.0 billion in passive ETF AUM (including approximately $7 billion of externally managed AUM) at date of purchase. For the year ended
December 31, 2016
, dispositions of $2.7 billion related to the deconsolidation of certain securitization trusts by Invesco Mortgage Capital Inc. (IVR) and other AUM dispositions were partially offset by the acquisition of the controlling interest of Invesco Asset Management (India) Private Limited, which added $2.4 billion to AUM. For the year ended
December 31, 2015
, dispositions resulted in a $0.7 billion decrease in AUM, representing exchange traded notes that did not transfer over as part of the agreement with Deutsche Bank to transition the investment management of the PowerShares DB suite of commodity exchange traded funds to Invesco.
Revenue Yield
Gross revenue yield on AUM
decreased
1.1
basis points to
59.6
basis points in the year ended
December 31, 2017
from the year ended
December 31, 2016
level of
60.7
basis points (
December 31, 2015
:
65.0
basis points). Management does not consider gross revenue yield, the most comparable U.S. GAAP-based measure to net revenue yield, to be a meaningful effective fee rate measure for the reasons outlined in footnote 3 to the Changes in AUM table above. See “Schedule of Non-GAAP Information” for a reconciliation of operating revenues (gross revenues) to net revenues.
Net revenue yield on AUM
decreased
0.1
basis point to
42.9
basis points in the year ended
December 31, 2017
from the year ended
December 31, 2016
level of
43.0
basis points (
December 31, 2015
:
45.8
basis points). Excluding performance fees, the net revenue yield
decreased
0.9
basis points to
41.5
basis points in the year ended
December 31, 2017
from the year ended
December 31, 2016
level of
42.4
basis points (
December 31, 2015
:
44.6
basis points).
Changes in our AUM mix can significantly impact our net revenue yield. Passive AUM generally earn a lower effective fee rate than active asset classes. At
December 31, 2017
, Passive AUM were
$199.0 billion
, representing
21.2%
of total AUM at that date; whereas at
December 31, 2016
, Passive AUM were
$144.4 billion
, representing
17.8%
of our total AUM at that date. This proportional increase in Passive AUM correlates with the decline in net revenue yield in
2017
when compared to
2016
. The acquisition of the European ETF business in the third quarter of 2017 increased the level of passive AUM and has a dilutive impact on the company's overall net revenue yield. The anticipated acquisition of the Guggenheim ETF business in the second quarter of 2018 will increase Passive balances and will have a further dilutive impact on the company's overall net revenue yield. Passive AUM also increased due to non-management fee earning AUM, which
increased
to
$87.8 billion
at
December 31, 2017
compared to
$71.3 billion
at
December 31, 2016
(
$78.1 billion
at
December 31, 2015
). In the year ended
December 31, 2017
, the net revenue yield on Passive AUM was
16.3
basis points compared to
15.3
basis points in the year ended
December 31, 2016
, an
increase
of
1.0
basis points, due to changes in mix of Passive AUM.
Additionally, as a significant proportion of our AUM is based outside of the U.S., changes in foreign exchange rates result in a change to the mix of U.S. Dollar denominated AUM with AUM denominated in other currencies. As fee rates differ across geographic locations, changes to exchange rates have an impact on the net revenue yields. See the company's disclosures regarding the changes in foreign exchange rates in the “Foreign Exchange Impact on Balance Sheet, Assets Under Management and Results of Operations” section above for additional information regarding the movement of foreign exchange rates.
39
Changes in our AUM by channel, asset class, and client domicile, and average AUM by asset class, are presented below:
Total AUM by Channel
(1)
|
$ in billions
|
Total
|
Retail
|
Institutional
|
|||||
|
December 31, 2016
|
812.9
|
|
526.5
|
|
286.4
|
|
||
|
Long-term inflows
(2)
|
190.3
|
|
156.8
|
|
33.5
|
|
||
|
Long-term outflows
|
(178.8
|
)
|
(144.4
|
)
|
(34.4
|
)
|
||
|
Long-term net flows
|
11.5
|
|
12.4
|
|
(0.9
|
)
|
||
|
Net flows in non-management fee earning AUM
|
3.0
|
|
0.1
|
|
2.9
|
|
||
|
Net flows in institutional money market funds
(2)
|
(3.2
|
)
|
(3.2
|
)
|
—
|
|
||
|
Total net flows
|
11.3
|
|
9.3
|
|
2.0
|
|
||
|
Market gains and losses
(2)
|
66.0
|
|
58.5
|
|
7.5
|
|
||
|
Acquisitions/dispositions, net
|
26.0
|
|
26.0
|
|
—
|
|
||
|
Foreign currency translation
|
21.4
|
|
16.7
|
|
4.7
|
|
||
|
December 31, 2017
|
937.6
|
|
637.0
|
|
300.6
|
|
||
|
December 31, 2015
|
775.6
|
|
514.8
|
|
260.8
|
|
||
|
Long-term inflows
|
177.8
|
|
137.0
|
|
40.8
|
|
||
|
Long-term outflows
|
(161.3
|
)
|
(132.6
|
)
|
(28.7
|
)
|
||
|
Long-term net flows
|
16.5
|
|
4.4
|
|
12.1
|
|
||
|
Net flows in non-management fee earning AUM
|
(6.4
|
)
|
(5.3
|
)
|
(1.1
|
)
|
||
|
Net flows in institutional money market funds
|
12.8
|
|
—
|
|
12.8
|
|
||
|
Total net flows
|
22.9
|
|
(0.9
|
)
|
23.8
|
|
||
|
Market gains and losses
(2)
|
37.7
|
|
30.4
|
|
7.3
|
|
||
|
Acquisitions/dispositions, net
|
(1.2
|
)
|
0.4
|
|
(1.6
|
)
|
||
|
Foreign currency translation
|
(22.1
|
)
|
(18.2
|
)
|
(3.9
|
)
|
||
|
December 31, 2016
|
812.9
|
|
526.5
|
|
286.4
|
|
||
|
December 31, 2014
|
792.4
|
|
532.5
|
|
259.9
|
|
||
|
Long-term inflows
|
178.4
|
|
130.0
|
|
48.4
|
|
||
|
Long-term outflows
|
(161.8
|
)
|
(127.5
|
)
|
(34.3
|
)
|
||
|
Long-term net flows
|
16.6
|
|
2.5
|
|
14.1
|
|
||
|
Net flows in non-management fee earning AUM
|
(2.2
|
)
|
(1.5
|
)
|
(0.7
|
)
|
||
|
Net flows in institutional money market funds
|
(11.9
|
)
|
—
|
|
(11.9
|
)
|
||
|
Total net flows
|
2.5
|
|
1.0
|
|
1.5
|
|
||
|
Market gains and losses
(2)
|
(2.6
|
)
|
(4.7
|
)
|
2.1
|
|
||
|
Acquisitions/dispositions, net
|
(0.7
|
)
|
(0.7
|
)
|
—
|
|
||
|
Foreign currency translation
|
(16.0
|
)
|
(13.3
|
)
|
(2.7
|
)
|
||
|
December 31, 2015
|
775.6
|
|
514.8
|
|
260.8
|
|
||
____________
See accompanying notes immediately following these AUM tables.
40
Passive AUM by Channel
(1)
|
$ in billions
|
Total
|
Retail
|
Institutional
|
|||||
|
December 31, 2016
|
144.4
|
|
128.8
|
|
15.6
|
|
||
|
Long-term inflows
|
42.9
|
|
42.9
|
|
—
|
|
||
|
Long-term outflows
|
(38.2
|
)
|
(37.0
|
)
|
(1.2
|
)
|
||
|
Long-term net flows
|
4.7
|
|
5.9
|
|
(1.2
|
)
|
||
|
Net flows in non-management fee earning AUM
|
3.0
|
|
0.1
|
|
2.9
|
|
||
|
Net flows in institutional money market funds
|
—
|
|
—
|
|
—
|
|
||
|
Total net flows
|
7.7
|
|
6.0
|
|
1.7
|
|
||
|
Market gains and losses
|
20.6
|
|
21.0
|
|
(0.4
|
)
|
||
|
Acquisitions/dispositions, net
|
26.0
|
|
26.0
|
|
—
|
|
||
|
Foreign currency translation
|
0.3
|
|
0.2
|
|
0.1
|
|
||
|
December 31, 2017
|
199.0
|
|
182.0
|
|
17.0
|
|
||
|
December 31, 2015
|
139.1
|
|
118.7
|
|
20.4
|
|
||
|
Long-term inflows
|
35.9
|
|
35.9
|
|
—
|
|
||
|
Long-term outflows
|
(26.3
|
)
|
(26.2
|
)
|
(0.1
|
)
|
||
|
Long-term net flows
|
9.6
|
|
9.7
|
|
(0.1
|
)
|
||
|
Net flows in non-management fee earning AUM
|
(6.4
|
)
|
(5.3
|
)
|
(1.1
|
)
|
||
|
Net flows in institutional money market funds
|
(0.3
|
)
|
—
|
|
(0.3
|
)
|
||
|
Total net flows
|
2.9
|
|
4.4
|
|
(1.5
|
)
|
||
|
Market gains and losses
|
5.6
|
|
5.7
|
|
(0.1
|
)
|
||
|
Acquisitions/dispositions, net
|
(3.2
|
)
|
—
|
|
(3.2
|
)
|
||
|
Foreign currency translation
|
—
|
|
—
|
|
—
|
|
||
|
December 31, 2016
|
144.4
|
|
128.8
|
|
15.6
|
|
||
|
December 31, 2014
|
141.4
|
|
119.7
|
|
21.7
|
|
||
|
Long-term inflows
|
24.8
|
|
23.2
|
|
1.6
|
|
||
|
Long-term outflows
|
(22.3
|
)
|
(20.6
|
)
|
(1.7
|
)
|
||
|
Long-term net flows
|
2.5
|
|
2.6
|
|
(0.1
|
)
|
||
|
Net flows in non-management fee earning AUM
|
(2.2
|
)
|
(1.5
|
)
|
(0.7
|
)
|
||
|
Net flows in institutional money market funds
|
0.4
|
|
—
|
|
0.4
|
|
||
|
Total net flows
|
0.7
|
|
1.1
|
|
(0.4
|
)
|
||
|
Market gains and losses
|
(2.3
|
)
|
(1.4
|
)
|
(0.9
|
)
|
||
|
Acquisitions/dispositions, net
|
(0.7
|
)
|
(0.7
|
)
|
—
|
|
||
|
Foreign currency translation
|
—
|
|
—
|
|
—
|
|
||
|
December 31, 2015
|
139.1
|
|
118.7
|
|
20.4
|
|
||
____________
See accompanying notes immediately following these AUM tables.
41
Total AUM by Asset Class
(3)
|
$ in billions
|
Total
|
Equity
|
Fixed Income
|
Balanced
|
Money Market
(5)
|
Alternatives
(6)
|
|||||||||||
|
December 31, 2016
|
812.9
|
|
364.1
|
|
201.7
|
|
46.8
|
|
78.3
|
|
122.0
|
|
|||||
|
Long-term inflows
(2)
|
190.3
|
|
87.9
|
|
47.5
|
|
13.4
|
|
4.1
|
|
37.4
|
|
|||||
|
Long-term outflows
|
(178.8
|
)
|
(99.2
|
)
|
(38.9
|
)
|
(9.8
|
)
|
(3.9
|
)
|
(27.0
|
)
|
|||||
|
Long-term net flows
|
11.5
|
|
(11.3
|
)
|
8.6
|
|
3.6
|
|
0.2
|
|
10.4
|
|
|||||
|
Net flows in non-management fee earning AUM
|
3.0
|
|
0.5
|
|
2.5
|
|
—
|
|
—
|
|
—
|
|
|||||
|
Net flows in institutional money market funds
|
(3.2
|
)
|
—
|
|
—
|
|
—
|
|
(3.2
|
)
|
—
|
|
|||||
|
Total net flows
|
11.3
|
|
(10.8
|
)
|
11.1
|
|
3.6
|
|
(3.0
|
)
|
10.4
|
|
|||||
|
Market gains and losses
(2)
|
66.0
|
|
56.0
|
|
5.0
|
|
3.7
|
|
0.1
|
|
1.2
|
|
|||||
|
Transfers
(5)
|
—
|
|
—
|
|
(3.0
|
)
|
—
|
|
3.0
|
|
—
|
|
|||||
|
Acquisitions/dispositions, net
|
26.0
|
|
12.2
|
|
7.8
|
|
—
|
|
—
|
|
6.0
|
|
|||||
|
Foreign currency translation
|
21.4
|
|
9.7
|
|
3.2
|
|
3.6
|
|
0.3
|
|
4.6
|
|
|||||
|
December 31, 2017
|
937.6
|
|
431.2
|
|
225.8
|
|
57.7
|
|
78.7
|
|
144.2
|
|
|||||
|
Average AUM
|
875.0
|
|
398.2
|
|
213.0
|
|
52.3
|
|
78.6
|
|
132.9
|
|
|||||
|
% of total average AUM
|
100.0
|
%
|
45.5
|
%
|
24.3
|
%
|
6.0
|
%
|
9.0
|
%
|
15.2
|
%
|
|||||
|
December 31, 2015
|
775.6
|
|
370.9
|
|
187.9
|
|
48.1
|
|
64.6
|
|
104.1
|
|
|||||
|
Long-term inflows
|
177.8
|
|
74.6
|
|
48.0
|
|
9.8
|
|
4.0
|
|
41.4
|
|
|||||
|
Long-term outflows
|
(161.3
|
)
|
(93.0
|
)
|
(31.6
|
)
|
(11.5
|
)
|
(3.8
|
)
|
(21.4
|
)
|
|||||
|
Long-term net flows
|
16.5
|
|
(18.4
|
)
|
16.4
|
|
(1.7
|
)
|
0.2
|
|
20.0
|
|
|||||
|
Net flows in non-management fee earning AUM
|
(6.4
|
)
|
(5.1
|
)
|
(1.3
|
)
|
—
|
|
—
|
|
—
|
|
|||||
|
Net flows in institutional money market funds
|
12.8
|
|
—
|
|
—
|
|
—
|
|
12.8
|
|
—
|
|
|||||
|
Total net flows
|
22.9
|
|
(23.5
|
)
|
15.1
|
|
(1.7
|
)
|
13.0
|
|
20.0
|
|
|||||
|
Market gains and losses
(2)
|
37.7
|
|
26.6
|
|
4.3
|
|
2.5
|
|
0.5
|
|
3.8
|
|
|||||
|
Acquisitions/dispositions, net
|
(1.2
|
)
|
0.4
|
|
(1.1
|
)
|
—
|
|
0.4
|
|
(0.9
|
)
|
|||||
|
Foreign currency translation
|
(22.1
|
)
|
(10.3
|
)
|
(4.5
|
)
|
(2.1
|
)
|
(0.2
|
)
|
(5.0
|
)
|
|||||
|
December 31, 2016
|
812.9
|
|
364.1
|
|
201.7
|
|
46.8
|
|
78.3
|
|
122.0
|
|
|||||
|
Average AUM
|
788.8
|
|
356.3
|
|
196.6
|
|
47.3
|
|
74.3
|
|
114.3
|
|
|||||
|
% of total average AUM
|
100.0
|
%
|
45.2
|
%
|
24.9
|
%
|
6.0
|
%
|
9.4
|
%
|
14.5
|
%
|
|||||
|
December 31, 2014
|
792.4
|
|
384.4
|
|
181.6
|
|
50.6
|
|
76.5
|
|
99.3
|
|
|||||
|
Long-term inflows
|
178.4
|
|
80.7
|
|
43.3
|
|
16.1
|
|
3.7
|
|
34.6
|
|
|||||
|
Long-term outflows
|
(161.8
|
)
|
(86.4
|
)
|
(32.2
|
)
|
(14.7
|
)
|
(3.9
|
)
|
(24.6
|
)
|
|||||
|
Long-term net flows
|
16.6
|
|
(5.7
|
)
|
11.1
|
|
1.4
|
|
(0.2
|
)
|
10.0
|
|
|||||
|
Net flows in non-management fee earning AUM
|
(2.2
|
)
|
(1.4
|
)
|
(0.8
|
)
|
—
|
|
—
|
|
—
|
|
|||||
|
Net flows in institutional money market funds
|
(11.9
|
)
|
—
|
|
—
|
|
—
|
|
(11.9
|
)
|
—
|
|
|||||
|
Total net flows
|
2.5
|
|
(7.1
|
)
|
10.3
|
|
1.4
|
|
(12.1
|
)
|
10.0
|
|
|||||
|
Market gains and losses
(2)
|
(2.6
|
)
|
2.1
|
|
(1.4
|
)
|
(0.4
|
)
|
0.2
|
|
(3.1
|
)
|
|||||
|
Acquisitions/dispositions, net
|
(0.7
|
)
|
—
|
|
—
|
|
—
|
|
—
|
|
(0.7
|
)
|
|||||
|
Foreign currency translation
|
(16.0
|
)
|
(8.5
|
)
|
(2.6
|
)
|
(3.5
|
)
|
—
|
|
(1.4
|
)
|
|||||
|
December 31, 2015
|
775.6
|
|
370.9
|
|
187.9
|
|
48.1
|
|
64.6
|
|
104.1
|
|
|||||
|
Average AUM
|
794.7
|
|
386.6
|
|
185.6
|
|
51.2
|
|
70.7
|
|
100.6
|
|
|||||
|
% of total average AUM
|
100.0
|
%
|
48.6
|
%
|
23.4
|
%
|
6.4
|
%
|
8.9
|
%
|
12.7
|
%
|
|||||
____________
See accompanying notes immediately following these AUM tables.
42
Passive AUM by Asset Class
(4)
|
$ in billions
|
Total
|
Equity
|
Fixed Income
|
Balanced
|
Money Market
|
Alternatives
(6)
|
|||||||||||
|
December 31, 2016
|
144.4
|
|
93.5
|
|
41.7
|
|
—
|
|
—
|
|
9.2
|
|
|||||
|
Long-term inflows
|
42.9
|
|
26.3
|
|
12.6
|
|
—
|
|
—
|
|
4.0
|
|
|||||
|
Long-term outflows
|
(38.2
|
)
|
(25.3
|
)
|
(7.3
|
)
|
—
|
|
—
|
|
(5.6
|
)
|
|||||
|
Long-term net flows
|
4.7
|
|
1.0
|
|
5.3
|
|
—
|
|
—
|
|
(1.6
|
)
|
|||||
|
Net flows in non-management fee earning AUM
|
3.0
|
|
0.5
|
|
2.5
|
|
—
|
|
—
|
|
—
|
|
|||||
|
Net flows in institutional money market funds
|
—
|
|
—
|
|
—
|
|
—
|
|
—
|
|
—
|
|
|||||
|
Total net flows
|
7.7
|
|
1.5
|
|
7.8
|
|
—
|
|
—
|
|
(1.6
|
)
|
|||||
|
Market gains and losses
|
20.6
|
|
21.1
|
|
(0.1
|
)
|
—
|
|
—
|
|
(0.4
|
)
|
|||||
|
Acquisitions/dispositions, net
|
26.0
|
|
12.2
|
|
7.8
|
|
—
|
|
—
|
|
6.0
|
|
|||||
|
Foreign currency translation
|
0.3
|
|
0.1
|
|
0.1
|
|
—
|
|
—
|
|
0.1
|
|
|||||
|
December 31, 2017
|
199.0
|
|
128.4
|
|
57.3
|
|
—
|
|
—
|
|
13.3
|
|
|||||
|
Average AUM
|
169.7
|
|
109.8
|
|
50.1
|
|
—
|
|
—
|
|
9.8
|
|
|||||
|
% of total average AUM
|
100.0
|
%
|
64.7
|
%
|
29.5
|
%
|
—
|
%
|
—
|
%
|
5.8
|
%
|
|||||
|
December 31, 2015
|
139.1
|
|
91.0
|
|
38.6
|
|
—
|
|
0.4
|
|
9.1
|
|
|||||
|
Long-term inflows
|
35.9
|
|
22.0
|
|
10.3
|
|
—
|
|
—
|
|
3.6
|
|
|||||
|
Long-term outflows
|
(26.3
|
)
|
(20.2
|
)
|
(2.7
|
)
|
—
|
|
—
|
|
(3.4
|
)
|
|||||
|
Long-term net flows
|
9.6
|
|
1.8
|
|
7.6
|
|
—
|
|
—
|
|
0.2
|
|
|||||
|
Net flows in non-management fee earning AUM
|
(6.4
|
)
|
(5.1
|
)
|
(1.3
|
)
|
—
|
|
—
|
|
—
|
|
|||||
|
Net flows in institutional money market funds
|
(0.3
|
)
|
—
|
|
—
|
|
—
|
|
(0.3
|
)
|
—
|
|
|||||
|
Total net flows
|
2.9
|
|
(3.3
|
)
|
6.3
|
|
—
|
|
(0.3
|
)
|
0.2
|
|
|||||
|
Market gains and losses
|
5.6
|
|
5.8
|
|
(0.5
|
)
|
—
|
|
(0.1
|
)
|
0.4
|
|
|||||
|
Acquisitions/dispositions, net
|
(3.2
|
)
|
—
|
|
(2.7
|
)
|
—
|
|
—
|
|
(0.5
|
)
|
|||||
|
Foreign currency translation
|
—
|
|
—
|
|
—
|
|
—
|
|
—
|
|
—
|
|
|||||
|
December 31, 2016
|
144.4
|
|
93.5
|
|
41.7
|
|
—
|
|
—
|
|
9.2
|
|
|||||
|
Average AUM
|
135.4
|
|
87.4
|
|
38.9
|
|
—
|
|
0.1
|
|
9.0
|
|
|||||
|
% of total average AUM
|
100.0
|
%
|
64.5
|
%
|
28.7
|
%
|
—
|
%
|
0.1
|
%
|
6.6
|
%
|
|||||
|
December 31, 2014
|
141.4
|
|
88.2
|
|
41.1
|
|
—
|
|
—
|
|
12.1
|
|
|||||
|
Long-term inflows
|
24.8
|
|
17.3
|
|
3.7
|
|
—
|
|
—
|
|
3.8
|
|
|||||
|
Long-term outflows
|
(22.3
|
)
|
(14.0
|
)
|
(3.3
|
)
|
—
|
|
—
|
|
(5.0
|
)
|
|||||
|
Long-term net flows
|
2.5
|
|
3.3
|
|
0.4
|
|
—
|
|
—
|
|
(1.2
|
)
|
|||||
|
Net flows in non-management fee earning AUM
|
(2.2
|
)
|
(1.4
|
)
|
(0.8
|
)
|
—
|
|
—
|
|
—
|
|
|||||
|
Net flows in institutional money market funds
|
0.4
|
|
—
|
|
—
|
|
—
|
|
0.4
|
|
—
|
|
|||||
|
Total net flows
|
0.7
|
|
1.9
|
|
(0.4
|
)
|
—
|
|
0.4
|
|
(1.2
|
)
|
|||||
|
Market gains and losses
|
(2.3
|
)
|
0.9
|
|
(2.1
|
)
|
—
|
|
—
|
|
(1.1
|
)
|
|||||
|
Acquisitions/dispositions, net
|
(0.7
|
)
|
—
|
|
—
|
|
—
|
|
—
|
|
(0.7
|
)
|
|||||
|
Foreign currency translation
|
—
|
|
—
|
|
—
|
|
—
|
|
—
|
|
—
|
|
|||||
|
December 31, 2015
|
139.1
|
|
91.0
|
|
38.6
|
|
—
|
|
0.4
|
|
9.1
|
|
|||||
|
Average AUM
|
141.1
|
|
89.4
|
|
41.1
|
|
—
|
|
0.1
|
|
10.5
|
|
|||||
|
% of total average AUM
|
100.0
|
%
|
63.4
|
%
|
29.1
|
%
|
—
|
%
|
0.1
|
%
|
7.4
|
%
|
|||||
____________
See accompanying notes immediately following these AUM tables.
43
Total AUM by Client Domicile
(7)
|
$ in billions
|
Total
|
U.S.
|
Canada
|
U.K.
|
Continental Europe
|
Asia
|
|||||||||||
|
December 31, 2016
|
812.9
|
|
539.5
|
|
23.1
|
|
98.2
|
|
72.1
|
|
80.0
|
|
|||||
|
Long-term inflows
(2)
|
190.3
|
|
95.4
|
|
4.3
|
|
16.3
|
|
51.1
|
|
23.2
|
|
|||||
|
Long-term outflows
|
(178.8
|
)
|
(96.4
|
)
|
(4.6
|
)
|
(17.6
|
)
|
(38.3
|
)
|
(21.9
|
)
|
|||||
|
Long-term net flows
|
11.5
|
|
(1.0
|
)
|
(0.3
|
)
|
(1.3
|
)
|
12.8
|
|
1.3
|
|
|||||
|
Net flows in non-management fee earning AUM
|
3.0
|
|
3.0
|
|
—
|
|
—
|
|
—
|
|
—
|
|
|||||
|
Net flows in institutional money market funds
|
(3.2
|
)
|
(0.9
|
)
|
—
|
|
(1.4
|
)
|
0.3
|
|
(1.2
|
)
|
|||||
|
Total net flows
|
11.3
|
|
1.1
|
|
(0.3
|
)
|
(2.7
|
)
|
13.1
|
|
0.1
|
|
|||||
|
Market gains and losses
(2)
|
66.0
|
|
44.7
|
|
2.2
|
|
7.0
|
|
7.9
|
|
4.2
|
|
|||||
|
Acquisitions/dispositions, net
|
26.0
|
|
—
|
|
—
|
|
—
|
|
26.0
|
|
—
|
|
|||||
|
Foreign currency translation
|
21.4
|
|
0.1
|
|
1.8
|
|
8.4
|
|
8.0
|
|
3.1
|
|
|||||
|
December 31, 2017
|
937.6
|
|
585.4
|
|
26.8
|
|
110.9
|
|
127.1
|
|
87.4
|
|
|||||
|
December 31, 2015
|
775.6
|
|
510.7
|
|
21.7
|
|
104.2
|
|
75.4
|
|
63.6
|
|
|||||
|
Long-term inflows
|
177.8
|
|
101.7
|
|
3.5
|
|
15.7
|
|
25.9
|
|
31.0
|
|
|||||
|
Long-term outflows
|
(161.3
|
)
|
(95.8
|
)
|
(4.6
|
)
|
(16.2
|
)
|
(29.2
|
)
|
(15.5
|
)
|
|||||
|
Long-term net flows
|
16.5
|
|
5.9
|
|
(1.1
|
)
|
(0.5
|
)
|
(3.3
|
)
|
15.5
|
|
|||||
|
Net flows in non-management fee earning AUM
|
(6.4
|
)
|
(6.4
|
)
|
—
|
|
—
|
|
—
|
|
—
|
|
|||||
|
Net flows in institutional money market funds
|
12.8
|
|
7.9
|
|
0.4
|
|
3.2
|
|
(0.1
|
)
|
1.4
|
|
|||||
|
Total net flows
|
22.9
|
|
7.4
|
|
(0.7
|
)
|
2.7
|
|
(3.4
|
)
|
16.9
|
|
|||||
|
Market gains and losses
(2)
|
37.7
|
|
25.1
|
|
1.4
|
|
7.1
|
|
2.7
|
|
1.4
|
|
|||||
|
Acquisitions/dispositions, net
|
(1.2
|
)
|
(3.6
|
)
|
—
|
|
—
|
|
—
|
|
2.4
|
|
|||||
|
Foreign currency translation
|
(22.1
|
)
|
(0.1
|
)
|
0.7
|
|
(15.8
|
)
|
(2.6
|
)
|
(4.3
|
)
|
|||||
|
December 31, 2016
|
812.9
|
|
539.5
|
|
23.1
|
|
98.2
|
|
72.1
|
|
80.0
|
|
|||||
|
December 31, 2014
|
792.4
|
|
532.1
|
|
25.8
|
|
105.1
|
|
71.1
|
|
58.3
|
|
|||||
|
Long-term inflows
|
178.4
|
|
88.4
|
|
3.7
|
|
18.8
|
|
37.5
|
|
30.0
|
|
|||||
|
Long-term outflows
|
(161.8
|
)
|
(86.2
|
)
|
(4.2
|
)
|
(17.9
|
)
|
(29.2
|
)
|
(24.3
|
)
|
|||||
|
Long-term net flows
|
16.6
|
|
2.2
|
|
(0.5
|
)
|
0.9
|
|
8.3
|
|
5.7
|
|
|||||
|
Net flows in non-management fee earning AUM
|
(2.2
|
)
|
(2.2
|
)
|
—
|
|
—
|
|
—
|
|
—
|
|
|||||
|
Net flows in institutional money market funds
|
(11.9
|
)
|
(13.9
|
)
|
—
|
|
0.7
|
|
(0.3
|
)
|
1.6
|
|
|||||
|
Total net flows
|
2.5
|
|
(13.9
|
)
|
(0.5
|
)
|
1.6
|
|
8.0
|
|
7.3
|
|
|||||
|
Market gains and losses
(2)
|
(2.6
|
)
|
(6.8
|
)
|
0.9
|
|
3.0
|
|
1.3
|
|
(1.0
|
)
|
|||||
|
Acquisitions/dispositions, net
|
(0.7
|
)
|
(0.7
|
)
|
—
|
|
—
|
|
—
|
|
—
|
|
|||||
|
Foreign currency translation
|
(16.0
|
)
|
—
|
|
(4.5
|
)
|
(5.5
|
)
|
(5.0
|
)
|
(1.0
|
)
|
|||||
|
December 31, 2015
|
775.6
|
|
510.7
|
|
21.7
|
|
104.2
|
|
75.4
|
|
63.6
|
|
|||||
____________
See accompanying notes immediately following these AUM tables.
44
Passive AUM by Client Domicile
(7)
|
$ in billions
|
Total
|
U.S.
|
Canada
|
U.K.
|
Continental Europe
|
Asia
|
|||||||||||
|
December 31, 2016
|
144.4
|
|
139.9
|
|
0.5
|
|
—
|
|
1.9
|
|
2.1
|
|
|||||
|
Long-term inflows
|
42.9
|
|
30.2
|
|
0.3
|
|
—
|
|
12.4
|
|
—
|
|
|||||
|
Long-term outflows
|
(38.2
|
)
|
(25.0
|
)
|
(0.1
|
)
|
—
|
|
(11.9
|
)
|
(1.2
|
)
|
|||||
|
Long-term net flows
|
4.7
|
|
5.2
|
|
0.2
|
|
—
|
|
0.5
|
|
(1.2
|
)
|
|||||
|
Net flows in non-management fee earning AUM
|
3.0
|
|
3.0
|
|
—
|
|
—
|
|
—
|
|
—
|
|
|||||
|
Net flows in institutional money market funds
|
—
|
|
—
|
|
—
|
|
—
|
|
—
|
|
—
|
|
|||||
|
Total net flows
|
7.7
|
|
8.2
|
|
0.2
|
|
—
|
|
0.5
|
|
(1.2
|
)
|
|||||
|
Market gains and losses
|
20.6
|
|
19.2
|
|
(0.1
|
)
|
—
|
|
1.4
|
|
0.1
|
|
|||||
|
Acquisitions/dispositions, net
|
26.0
|
|
—
|
|
—
|
|
—
|
|
26.0
|
|
—
|
|
|||||
|
Foreign currency translation
|
0.3
|
|
—
|
|
—
|
|
—
|
|
0.2
|
|
0.1
|
|
|||||
|
December 31, 2017
|
199.0
|
|
167.3
|
|
0.6
|
|
—
|
|
30.0
|
|
1.1
|
|
|||||
|
December 31, 2015
|
139.1
|
|
134.4
|
|
0.4
|
|
—
|
|
1.9
|
|
2.4
|
|
|||||
|
Long-term inflows
|
35.9
|
|
35.1
|
|
0.3
|
|
—
|
|
0.5
|
|
—
|
|
|||||
|
Long-term outflows
|
(26.3
|
)
|
(25.4
|
)
|
(0.2
|
)
|
—
|
|
(0.7
|
)
|
—
|
|
|||||
|
Long-term net flows
|
9.6
|
|
9.7
|
|
0.1
|
|
—
|
|
(0.2
|
)
|
—
|
|
|||||
|
Net flows in non-management fee earning AUM
|
(6.4
|
)
|
(6.4
|
)
|
—
|
|
—
|
|
—
|
|
—
|
|
|||||
|
Net flows in institutional money market funds
|
(0.3
|
)
|
—
|
|
—
|
|
—
|
|
—
|
|
(0.3
|
)
|
|||||
|
Total net flows
|
2.9
|
|
3.3
|
|
0.1
|
|
—
|
|
(0.2
|
)
|
(0.3
|
)
|
|||||
|
Market gains and losses
|
5.6
|
|
5.4
|
|
—
|
|
—
|
|
0.2
|
|
—
|
|
|||||
|
Acquisitions/dispositions, net
|
(3.2
|
)
|
(3.2
|
)
|
—
|
|
—
|
|
—
|
|
—
|
|
|||||
|
Foreign currency translation
|
—
|
|
—
|
|
—
|
|
—
|
|
—
|
|
—
|
|
|||||
|
December 31, 2016
|
144.4
|
|
139.9
|
|
0.5
|
|
—
|
|
1.9
|
|
2.1
|
|
|||||
|
December 31, 2014
|
141.4
|
|
137.6
|
|
0.2
|
|
—
|
|
1.8
|
|
1.8
|
|
|||||
|
Long-term inflows
|
24.8
|
|
22.6
|
|
0.1
|
|
—
|
|
0.6
|
|
1.5
|
|
|||||
|
Long-term outflows
|
(22.3
|
)
|
(20.2
|
)
|
—
|
|
—
|
|
(0.6
|
)
|
(1.5
|
)
|
|||||
|
Long-term net flows
|
2.5
|
|
2.4
|
|
0.1
|
|
—
|
|
—
|
|
—
|
|
|||||
|
Net flows in non-management fee earning AUM
|
(2.2
|
)
|
(2.2
|
)
|
—
|
|
—
|
|
—
|
|
—
|
|
|||||
|
Net flows in institutional money market funds
|
0.4
|
|
—
|
|
—
|
|
—
|
|
—
|
|
0.4
|
|
|||||
|
Total net flows
|
0.7
|
|
0.2
|
|
0.1
|
|
—
|
|
—
|
|
0.4
|
|
|||||
|
Market gains and losses
|
(2.3
|
)
|
(2.7
|
)
|
0.1
|
|
—
|
|
0.1
|
|
0.2
|
|
|||||
|
Acquisitions/dispositions, net
|
(0.7
|
)
|
(0.7
|
)
|
—
|
|
—
|
|
—
|
|
—
|
|
|||||
|
Foreign currency translation
|
—
|
|
—
|
|
—
|
|
—
|
|
—
|
|
—
|
|
|||||
|
December 31, 2015
|
139.1
|
|
134.4
|
|
0.4
|
|
—
|
|
1.9
|
|
2.4
|
|
|||||
____________
|
(1)
|
Channel refers to the internal distribution channel from which the AUM originated. Retail AUM represents AUM distributed by the company's retail sales team. Institutional AUM represents AUM distributed by our institutional sales team. This aggregation is viewed as a proxy for presenting AUM in the retail and institutional markets in which the company operates.
|
|
(2)
|
For the six months ended December 31, 2017, reinvested dividends and capital gains of
$7.0 billion
are included in long-term inflows. For previous periods, reinvested dividends and capital gains are included in market gains and losses.
|
|
(3)
|
Asset classes are descriptive groupings of AUM by common type of underlying investments.
|
|
(4)
|
Ending Money Market AUM incl
udes
$74.0 billion
in institutional money market AUM
.
|
45
|
(5
|
During January 2017, the company reclassified certain AUM previously classified in fixed income to money market totaling $3.0 billion.
|
|
(6)
|
See Item 1, “Business - Investment Management Capabilities” for a description of the investment objectives included within the Alternatives asset class.
|
|
(7)
|
Client domicile disclosure groups AUM by the domicile of the underlying clients.
|
Results of Operations for the Years Ended
December 31, 2017
compared to
December 31, 2016
compared to
December 31, 2015
The discussion below includes the use of non-GAAP financial measures. See “Schedule of Non-GAAP Information” for additional details and reconciliations of the most directly comparable U.S. GAAP measures to the non-GAAP measures. 2017 includes the results of the European ETF business from the date of acquisition, August 18, 2017.
Operating Revenues and Net Revenues
The main categories of revenues, and the dollar and percentage change between the periods, are as follows:
|
Variance
|
||||||||||||||||||||
|
Years ended December 31,
|
2017 vs 2016
|
2016 vs 2015
|
||||||||||||||||||
|
$ in millions
|
2017
|
2016
|
2015
|
$ Change
|
% Change
|
$ Change
|
% Change
|
|||||||||||||
|
Investment management fees
|
4,126.6
|
|
3,773.1
|
|
4,061.1
|
|
353.5
|
|
9.4
|
%
|
(288.0
|
)
|
(7.1
|
)%
|
||||||
|
Service and distribution fees
|
852.8
|
|
823.6
|
|
855.4
|
|
29.2
|
|
3.5
|
%
|
(31.8
|
)
|
(3.7
|
)%
|
||||||
|
Performance fees
|
113.3
|
|
44.3
|
|
85.9
|
|
69.0
|
|
155.8
|
%
|
(41.6
|
)
|
(48.4
|
)%
|
||||||
|
Other
|
67.6
|
|
93.4
|
|
120.5
|
|
(25.8
|
)
|
(27.6
|
)%
|
(27.1
|
)
|
(22.5
|
)%
|
||||||
|
Total operating revenues
|
5,160.3
|
|
4,734.4
|
|
5,122.9
|
|
425.9
|
|
9.0
|
%
|
(388.5
|
)
|
(7.6
|
)%
|
||||||
|
Third-party distribution, service and advisory expenses
|
(1,486.5
|
)
|
(1,407.2
|
)
|
(1,579.9
|
)
|
(79.3
|
)
|
5.6
|
%
|
172.7
|
|
(10.9
|
)%
|
||||||
|
Proportional share of revenues, net of third-party distribution expenses, from joint venture investments
|
48.7
|
|
43.7
|
|
61.0
|
|
5.0
|
|
11.4
|
%
|
(17.3
|
)
|
(28.4
|
)%
|
||||||
|
CIP
|
32.4
|
|
22.3
|
|
39.2
|
|
10.1
|
|
45.3
|
%
|
(16.9
|
)
|
(43.1
|
)%
|
||||||
|
Net revenues*
|
3,754.9
|
|
3,393.2
|
|
3,643.2
|
|
361.7
|
|
10.7
|
%
|
(250.0
|
)
|
(6.9
|
)%
|
||||||
____________
|
*
|
Net revenues are operating revenues less third-party distribution, service and advisory expenses, plus our proportional share of net revenues from joint venture arrangements, plus management and performance fees earned from CIP. See “Schedule of Non-GAAP Information” for additional important disclosures regarding the use of net revenues.
|
Operating revenues
increased
by
9.0%
in the year ended
December 31, 2017
to
$5,160.3 million
(year ended
December 31, 2016
:
$4,734.4 million
). Net revenues
increased
by
10.7%
in the year ended
December 31, 2017
to
$3,754.9 million
(year ended
December 31, 2016
:
$3,393.2 million
). Operating revenues
decreased
by
7.6%
in the year ended
December 31, 2016
to $
4,734.4 million
(year ended
December 31, 2015
: $
5,122.9 million
). Net revenues
decreased
by
6.9%
in the year ended
December 31, 2016
to
$3,393.2 million
(year ended
December 31, 2015
:
$3,643.2 million
).
The impact of foreign exchange rate movements
decreased
operating revenues by
$35.3 million
, equivalent to
0.7%
of total operating revenues, during the year ended
December 31, 2017
when compared to the year ended
December 31, 2016
($136.8 million decrease in
2016
as compared to
2015
, or 2.9% of
2016
total operating revenues).
Additionally, our revenues are directly influenced by the level and composition of our AUM. Therefore, movements in global capital market levels, net new business inflows (or outflows) and changes in the mix of investment products between asset classes and geographies may materially affect our revenues from period to period. Market movements are discussed in the "Executive Overview" section of this Management's Discussion and Analysis. During
2017
foreign exchange rate changes and net market gains resulted in a
10.9%
increase
in average AUM when compared to
2016
.
46
See Item 8., Financial Statements and Supplementary Data, Note 1, "Accounting Policies -- Revenue Recognition" for more information regarding the components of each operating revenue category as well as third party distribution, service and advisory expenses.
Investment Management Fees
Investment management fees
increased
by
$353.5 million
(
9.4%
) in the year ended
December 31, 2017
, to
$4,126.6 million
(year ended
December 31, 2016
:
$3,773.1 million
). This compares to a
10.9%
increase
in average AUM. The impact of foreign exchange rate movements
decreased
investment management fees by
$36.4 million
during the year ended
December 31, 2017
as compared to the year ended
December 31, 2016
. After allowing for foreign exchange movements, investment management fees increased by $389.9 million. In addition to foreign exchange rate movements, the change in product mix of AUM results in changes in the average revenue yield derived from AUM due to differing fee rates and structures, which impacts our management fees. Investment management fees in 2017 also include incremental management fees from the acquisition of the European ETF business.
Investment management fees decreased by
$288.0 million
(
7.1%
) in the year ended
December 31, 2016
, to $
3,773.1 million
(year ended
December 31, 2015
: $
4,061.1 million
). The decrease compares to a
0.7%
decrease
in average AUM. The im
pact of foreign exchange rate movements decreased investment management fees by $133.9 million during the year ended
December 31, 2016
as compared to the year ended
December 31, 2015
. The strengthening of the U.S. Dollar against the Pound Sterling and Euro has reduced the weighting of higher fee earning AUM attributable to the U.K. and Continental European products in 2016 when compared to 2015. After allowing for foreign exchange movements, investment management fees decreased by $154.1 million.
See the company's disclosures regarding the changes in AUM and revenue yields during the years ended
December 31, 2017
,
December 31, 2016
and
December 31, 2015
in the “Assets Under Management” section above for additional information regarding the movements in AUM.
Service and Distribution Fees
In the year ended
December 31, 2017
, service and distribution fees
increased
by
$29.2 million
(
3.5%
) to
$852.8 million
(year ended
December 31, 2016
:
$823.6 million
). The impact of foreign exchange rate movements
increased
service and distribution fees by
$0.6 million
during the year ended
December 31, 2017
. After allowing for foreign exchange rate changes, the increase in service and distribution fees was $28.5 million. The increase during
2017
is due to increases in distribution and redemption fees of $20.9 million and administration fees of $16.8 million, partially offset by decreases in transfer agency fees of $8.2 million and service and custodial fees of $0.9 million. The increase relates to increases in AUM that earn these fees and the full year impact of fee revenue from the CollegeBound 529 plan which was funded in July 2016.
In the year ended
December 31, 2016
, service and distribution fees decreased b
y
$31.8 million
(
3.7%
) to $
823.6 million
(year ended
December 31, 2015
: $
855.4 million
). The impact of foreign exchange rate movements decreased service and
distribution f
ees by $1.0 million duri
ng the y
ear ended
December 31, 2016
. After allowing for foreign exchange rate changes, the decrease in service and distribution fees was $30.8 million. The decrease in service and distribution fees during
2016
is due to decreases in administration fees of $16.3 million, distribution and redemption fees of $5.9 million, transfer agency fees of $8.0 million and service and custodial fees of $0.7 million. The decrease relates to decreases in AUM that earn these fees.
Performance Fees
In the year ended
December 31, 2017
, performance fees
increased
by
$69.0 million
(
155.8%
) to
$113.3 million
(year ended
December 31, 2016
:
$44.3 million
). Foreign exchange movements
increased
performance fees by
$0.6 million
in
2017
as compared to
2016
. After allowing for foreign exchange movements, performance fees increased by $68.4 million. The increase in
2017
included $36.8 million of performance fee generated by Invesco's Mortgage Recovery Fund. In addition, we recognized $28.9 million from real estate, $13.1 million from bank loans, $12.9 million from U.K. investment trusts, $7.1 million from private equity, $5.3 million from institutional, $5.2 million from Asia-Pacific and $4.1 million from fixed income. Of our
$937.6 billion
in AUM at
December 31, 2017
, approximately
$48.1 billion
or
5.1%
, could potentially earn performance fees, including carried interests and performance fees related to partnership investments and separate accounts.
In the year ended
December 31, 2016
, performance fees
decreased
by
$41.6 million
(
48.4%
) to $
44.3 million
(year ended
December 31, 2015
: $
85.9 million
). The performance fees generated in
2016
arose primarily due to products managed by the following investment teams: U.K. investment teams ($17.6 million), U.S. Bank Loans ($8.4 million), Global Asset Allocation ($6.7 million), Direct Real Estate Europe ($5.4 million) and Quantitative Strategies ($3.7 million).
47
The performance fees generated in
2015
arose primarily due to products managed by the following investment teams: Direct Real Est
ate ($51.0 million), U.K. Equities ($25.4 million), Asia Pacific teams ($1.5 million), and Global Quantitative Equity team ($5.6 million)
Other Revenues
In the year ended
December 31, 2017
, other revenues
decreased
by
$25.8 million
(
27.6%
) to
$67.6 million
(year ended
December 31, 2016
:
$93.4 million
). The impact of foreign exchange rate movements
decreased
other revenues
$0.1 million
during the year ended
December 31, 2017
as compared to the year ended
December 31, 2016
. After allowing for foreign exchange rate changes, the
decrease
in other revenues was
$25.7 million
. The decrease in other revenues includes decreases in mutual fund front end fees of $16.4 million, which continue to decrease as investors move into clean share classes. Other decreases include real estate transaction fees of $6.3 million, other revenues and transaction fees of $2.4 million and UIT revenues of $0.8 million during the year ended
December 31, 2017
compared to the year ended
December 31, 2016
.
In the year ended
December 31, 2016
, other revenues
decreased
by
$27.1 million
(
22.5%
) to $
93.4 million
(year ended
December 31, 2015
: $
120.5 million
)
. The impact of foreign exchange rate movements increased other revenues by $0.1 million during the year ended
December 31, 2016
as compared to the year ended
December 31, 2015
. After allowing for foreign exchange rate changes, the decrease in other revenues was $27.2 million. The decrease in other revenues includes decreases in mutual fund front end fees o
f $13.2 million related to the transition of investors into clean share classes, UIT revenues of $12.7 million, other revenues and transaction fees of $1.3 million du
ring the year ended
December 31, 2016
compared to the year ended
December 31, 2015
. UIT revenues declined due to decrease in net flows of short-term equity UITs due to uncertainty surrounding the impact of the new fiduciary rules from the U. S. Department of Labor.
Third-Party Distribution, Service and Advisory Expenses
Third-party distribution, service and advisory expenses
increased
by
$79.3 million
(
5.6%
) in the year ended
December 31, 2017
to
$1,486.5 million
(year ended
December 31, 2016
:
$1,407.2 million
). The impact of foreign exchange rate movements
decreased
third-party distribution, service and advisory expenses by
$6.4 million
during the year ended
December 31, 2017
as compared to the year ended
December 31, 2016
. After allowing for foreign exchange rate changes, third-party distribution, service and advisory expenses
increased
by
$85.7 million
. The increase includes increases in renewal commissions of $45.9 million, asset and sales based fees of $22.1 million, service related expenses of $15.7 million, and other expenses of $5.5 million. These increases include the full year impact of distribution fee expense from the CollegeBound 529 plan which was funded in July 2016, and also include the continued impact of investors moving into clean share classes.
Third-party distribution, service and advisory expenses decreased by
$172.7 million
(
10.9%
) in the year ended
December 31, 2016
to
$1,407.2 million
(year ended
December 31, 2015
: $
1,579.9 million
). T
he impact of foreign exchange rate movements decreased third-party distribution, service and advisory expenses by
$29.6 million during th
e year ended
December 31, 2016
as compared to the year ended
December 31, 2015
. After allowing for foreign exchange rate changes, third-party distribution, service and advisory expenses decreased b
y $143.1 million. The decrease includes decreases in rebates of $100.0 million, renewal commissions of $32.6 million, service fees of $15.4 million, front end commissions of $7.2 million, and other expenses of $2.6 million. These decreases include the continued impact of the transition to clean share classes, as investors move into share classes that do not pay distribution fees. The decreases are partially offset by an increase in asset and sales based fees of $13.1 million.
Proportional share of revenues, net of third-party distribution expenses, from joint
venture investments
Management believes that the addition of our proportional share of revenues, net of third-party distribution expenses, from joint venture arrangements should be added to operating revenues to arrive at net revenues, as it is important to evaluate the contribution to the business that our joint venture arrangements are making. See “Schedule of Non-GAAP Information” for additional disclosures regarding the use of net revenues. The company's most significant joint venture arrangement is our
49%
investment in Invesco Great Wall Fund Management Company Limited (the “Invesco Great Wall” joint venture).
Our proportional share of revenues, net of third-party distribution expenses, from joint venture investments
increased
by
$5.0 million
(
11.4%
) to
$48.7 million
for the year ended
December 31, 2017
(year ended
December 31, 2016
:
$43.7 million
) primarily due to changes in asset classes which resulted in higher yield. Our share of the Invesco Great Wall joint venture's average AUM for the year ended
December 31, 2017
was
$8.5 billion
compared to
$9.2 billion
for the year ended
December 31, 2016
.
Our proportional share of revenues, net of third-party distribution expenses, from joint venture investments decreased by $17.3 million (28.4%) to $43.7 million for the year ended
December 31, 2016
(year ended
December 31, 2015
: $61.0 million). Our share
48
of the Invesco Great Wall joint venture's average AUM for the year ended
December 31, 2016
, which was
$9.2 billion
, compared to
$6.1 billion
at the year ended
December 31, 2015
. Although average AUM has increased in the period, changes in the mix of these AUM from higher fee-based equity AUM into lower fee-based fixed income and other AUM have resulted in a decrease in our proportional share of revenues.
Management, performance and other fees earned from CIP
Management believes that the consolidation of investment products may impact a reader's analysis of our underlying results of operations and could result in investor confusion or the production of information about the company by analysts or external credit rating agencies that is not reflective of the underlying results of operations and financial condition of the company. Accordingly, management believes that it is appropriate to adjust operating revenues for the impact of CIP in calculating net revenues. As management and performance fees earned by Invesco from the consolidated products are eliminated upon consolidation of the investment products, management believes that it is appropriate to add these operating revenues back in the calculation of net revenues. See “Schedule of Non-GAAP Information” for additional disclosures regarding the use of net revenues.
The elimination of management and performance fees earned from CIP
increased
by
$10.1 million
to
$32.4 million
in the year ended
December 31, 2017
(year ended
December 31, 2016
:
$22.3 million
). The increase is primarily due to the increase in management fees earned from CLOs.
The elimination of management and performance fees earned from CIP decreased by
$16.9 million
to
$22.3 million
in the year ended
December 31, 2016
(year ended
December 31, 2015
:
$39.2 million
). The decrease is primarily due to the adoption of ASU 2015-02, which resulted in the deconsolidation of certain VIEs (see Note 1, “Accounting Policies,” for the impact upon adoption), partially offset by the impact of newly consolidated funds, and decreased performance fees earned from CIP in the period.
Operating Expenses
The main categories of operating expenses, and the dollar and percentage changes between periods, are as follows:
|
Variance
|
||||||||||||||||||||
|
Years ended December 31,
|
2017 vs 2016
|
2016 vs 2015
|
||||||||||||||||||
|
$ in millions
|
2017
|
2016
|
2015
|
$ Change
|
% Change
|
$ Change
|
% Change
|
|||||||||||||
|
Third-party distribution, service and advisory
|
1,486.5
|
|
1,407.2
|
|
1,579.9
|
|
79.3
|
|
5.6
|
%
|
(172.7
|
)
|
(10.9
|
)%
|
||||||
|
Employee compensation
|
1,537.4
|
|
1,378.8
|
|
1,395.5
|
|
158.6
|
|
11.5
|
%
|
(16.7
|
)
|
(1.2
|
)%
|
||||||
|
Marketing
|
123.7
|
|
114.8
|
|
115.4
|
|
8.9
|
|
7.8
|
%
|
(0.6
|
)
|
(0.5
|
)%
|
||||||
|
Property, office and technology
|
370.1
|
|
325.7
|
|
312.0
|
|
44.4
|
|
13.6
|
%
|
13.7
|
|
4.4
|
%
|
||||||
|
General and administrative
|
365.5
|
|
331.5
|
|
361.7
|
|
34.0
|
|
10.3
|
%
|
(30.2
|
)
|
(8.3
|
)%
|
||||||
|
Total operating expenses
|
3,883.2
|
|
3,558.0
|
|
3,764.5
|
|
325.2
|
|
9.1
|
%
|
(206.5
|
)
|
(5.5
|
)%
|
||||||
The table below sets forth these expense categories as a percentage of total operating expenses and operating revenues, which we believe provides useful information as to the relative significance of each type of expense.
|
$ in millions
|
2017
|
% of Total Operating Expenses
|
% of Operating Revenues
|
2016
|
% of Total Operating Expenses
|
% of Operating Revenues
|
2015
|
% of Total Operating Expenses
|
% of Operating Revenues
|
|||||||||||||||||
|
Third-party distribution, service and advisory
|
1,486.5
|
|
38.3
|
%
|
28.8
|
%
|
1,407.2
|
|
39.6
|
%
|
29.7
|
%
|
1,579.9
|
|
42.0
|
%
|
30.8
|
%
|
||||||||
|
Employee compensation
|
1,537.4
|
|
39.6
|
%
|
29.8
|
%
|
1,378.8
|
|
38.8
|
%
|
29.1
|
%
|
1,395.5
|
|
37.1
|
%
|
27.2
|
%
|
||||||||
|
Marketing
|
123.7
|
|
3.2
|
%
|
2.4
|
%
|
114.8
|
|
3.2
|
%
|
2.4
|
%
|
115.4
|
|
3.1
|
%
|
2.3
|
%
|
||||||||
|
Property, office and technology
|
370.1
|
|
9.5
|
%
|
7.2
|
%
|
325.7
|
|
9.2
|
%
|
6.9
|
%
|
312.0
|
|
8.3
|
%
|
6.1
|
%
|
||||||||
|
General and administrative
|
365.5
|
|
9.4
|
%
|
7.1
|
%
|
331.5
|
|
9.2
|
%
|
7.0
|
%
|
361.7
|
|
9.5
|
%
|
7.1
|
%
|
||||||||
|
Total operating expenses
|
3,883.2
|
|
100.0
|
%
|
75.3
|
%
|
3,558.0
|
|
100.0
|
%
|
75.2
|
%
|
3,764.5
|
|
100.0
|
%
|
73.5
|
%
|
||||||||
49
During the year ended
December 31, 2017
, operating expenses
increased
by
$325.2 million
(
9.1%
) to
$3,883.2 million
(year ended
December 31, 2016
: $
3,558.0 million
). The impact of foreign exchange rate movements
decreased
operating expenses by
$21.2 million
, or
0.5%
of total operating expenses, during the year ended
December 31, 2017
as compared to the year ended
December 31, 2016
. After allowing for foreign exchange rate changes, operating expenses
increased
by
$346.4 million
.
During the year ended
December 31, 2016
, operating expenses decreased by
$206.5 million
(
5.5%
) to $
3,558.0 million
(year ended
December 31, 2015
: $
3,764.5 million
).
The impact of foreign exchange rate movements decreased operating expenses by
$83.2 million, or 2.3% of total operating expenses, during the year ended
December 31, 2016
as compared to the year ended
December 31, 2015
. After allowing for foreign exchange rate changes, operating expenses decreased by $123.3 million.
Third-Party Distribution, Service and Advisory Expenses
Third-party distribution, service and advisory expenses are discussed above in the Operating Revenues and Net Revenues section.
Employee Compensation
Employee compensation includes salary, cash bonuses and share-based payment plans designed to attract and retain the highest caliber employees. Employee staff benefit plan costs and payroll taxes are also included in employee compensation.
Employee compensation
increased
$158.6 million
(
11.5%
) to
$1,537.4 million
in the year ended
December 31, 2017
(year ended
December 31, 2016
:
$1,378.8 million
). The impact of foreign exchange rate movements decreased employee compensation by
$9.6 million
during the year ended
December 31, 2017
as compared to the year ended
December 31, 2016
. After allowing for foreign exchange rate changes, employee compensation increased
$168.2 million
.
Compensation in
2017
increased
$168.2 million
primarily due to increases in annual bonuses and bonuses on performance and transaction fees
of $46.6 million
, base salaries of $28.9 million due to increases in headcount primarily related to the European ETF business acquisition and growth in our shared service centers, staff benefits costs of $27.8 million,
share-based compensation costs of $17.4 million and redundancy costs of $18.9 million.
Increases in compensation expense also included
$18.3 million
in deferred compensation costs related to accelerated vesting for multiple senior executive retirements,
sales commissions, and a $7.3 million non-cash charge related to the partial settlement of a U.K. pension plan.
Employee c
ompensation decreased
$16.7 million
(
1.2%
) to $
1,378.8 million
in the year ended
December 31, 2016
(year ended
December 31, 2015
: $
1,395.5 million
). The impact of foreign exchange rate movements offset the increase in employee compensation by $32.6 million during the year ended
December 31, 2016
as compared to the year ended
December 31, 2015
. After allowing for foreign exchange rate changes, the increase in employee compensation was $15.9 million. Compensation increased in 2016 primarily due to increases in base salaries of $33.3 million, share-based costs of $21.8 million, sales commissions of $4.9 million and redundancy and other staff costs of $9.5 million. These increases are partially offset by decreases in annual cash bonuses of $31.9 million and bonuses on performance and transaction fees of $13.2 million during the year ended
December 31, 2016
when compared to the year ended
December 31, 2015
. Increases in employee compensation costs in the year ended
December 31, 2016
were also offset by a decrease in staff benefits costs of $9.4 million, which includes an incremental credit of $8.6 million related
to an employee benefit plan termination.
Headcount at
December 31, 2017
was
7,030
(
December 31, 2016
and
December 31, 2015
:
6,790
and
6,490
r
espectively).
Marketing
Marketing expenses include the cost of direct advertising of our products through trade publications, television and other media, and public relations costs, such as the marketing of the company's products through conferences or other sponsorships, and the cost of marketing-related employee travel.
Marketing expenses
increased
by
$8.9 million
(
7.8%
) in the year ended
December 31, 2017
to
$123.7 million
(year ended
December 31, 2016
:
$114.8 million
). The impact of foreign exchange rate movements offset the increase in marketing expenses by
$0.2 million
. After allowing for foreign exchange rate movements, marketing expenses increased
$9.1 million
during the year ended
December 31, 2017
as compared to the year ended
December 31, 2016
. The increase includes increases in advertising of $4.5 million, travel and entertainment expenses of $4.1 million and other marketing costs of $1.7 million.
50
Marketing expenses decreased by
$0.6 million
(
0.5%
) in the year ended
December 31, 2016
to
$
114.8 million
(year ended
December 31, 2015
: $
115.4 million
). The impact of foreign exchange rate movements offset the increase in marketing expenses by $3.1 million during the year ended
December 31, 2016
as compared to the year ended
December 31, 2015
. After allowing for foreign exchange rate changes, marketing expenses increased $2.5 million. The increase includes increases in client event expenses
of $2.4 million and sales literature and research of $1.8 million, partially offset by a decrease in advertising of $1.8 million.
Property, Office and Technology
Property, office and technology expenses include rent and utilities for our various leased facilities, depreciation of company-owned property, capitalized software and computer equipment costs, minor non-capitalized computer equipment and software purchases and related maintenance payments, and costs related to externally provided operations, technology, middle office, and back office management services.
Property, office and technology expenses
increased
by
$44.4 million
(
13.6%
) to
$370.1 million
in the year ended
December 31, 2017
(year ended
December 31, 2016
:
$325.7 million
). The impact of foreign exchange rate movements
decreased
property, office and technology expenses by
$2.3 million
during the year ended
December 31, 2017
as compared to the year ended
December 31, 2016
. After allowing for foreign exchange rate movements, expenses
increase
d
$46.7 million
. This increase was comprised of a $34.7 million increase in technology and communications expenses primarily due to increases in outsourced administration costs of $15.2 million driven by activity within our European cross-border business and increases in depreciation and maintenance of $16.9 million as a result of long-term technology projects recently brought into service. Property and office costs increased $12.0 million over the comparable
2016
period, primarily due to increases in rent expenses of $6.1 million and property taxes and office expenses of $4.2 million. Property and office costs in the the year ended
December 31, 2016
included a $3.4 million credit related to a vacated leased property.
Property, office and technology expenses increased b
y
$13.7 million
4.4%
to
$325.7 million
in the year ended
December 31, 2016
(year ended
December 31, 2015
:
$312.0 million
). The impact of foreign exchange rate movements decreased property, office and technology expenses by $7.5 million during the year ended
December 31, 2016
as compared to the year ended
December 31, 2015
. After allowing for foreign exchange rate movements, expenses increased $21.2 million.
Property and office expenses increase
d $7.1 million compared to
2015
, primarily due to increases in property taxes and office expenses of $3.1 million, depreciation expenses of $2.9 million and rent expenses of $1.1 million. The increase in rent expense was offset by a $3.4 million vacated property lease credit in 2016.
Technology and communications expenses
in 2016 increased $14.1 million over
2015
. The increase included increased outsourced administration costs of $7.4 million and increased depreciation and maintenance cost of $6.3 million. The increased depreciation and maintenance costs relate to software, data and cybersecurity improvements that were implemented in 2016.
General and Administrative
General and administrative expenses include professional services costs, such as information service subscriptions, irrecoverable taxes, non-marketing related employee travel expenditures, consulting fees, audit, tax and legal fees, professional insurance costs, recruitment and training costs and the amortization of certain intangible assets.
General and administrative expenses
increased
by
$34.0 million
(
10.3%
) to
$365.5 million
in the year ended
December 31, 2017
(year ended
December 31, 2016
:
$331.5 million
). The impact of foreign exchange rate movements
decreased
general and administrative expenses by
$2.7 million
during the year ended
December 31, 2017
as compared to the year ended
December 31, 2016
. After allowing for foreign exchange rate movements, the
increase
was
$36.7 million
.
General and administrative expenses for the year ended
December 31, 2017
included an increase of $41.4 million in consulting, audit, legal and professional services costs, primarily related to the business optimization initiative and acquisition-related costs. General and administrative expenses also included an increase of $3.9 million in irrecoverable taxes, $6.1 million in fund expenses, $4.6 million in travel expenses and $3.4 million in amortization of intangibles. These increases were partially offset by a decrease of $17.7 million in fund launch costs incurred by CIPs.
General and administrative expenses decreased by
$30.2 million
(
8.3%
) to
$331.5 million
in the year ended
December 31, 2016
(year ended
December 31, 2015
: $
361.7 million
). The impact of foreign exchange movements decreased general and administrative expenses by $10.4 million during the year ended
December 31, 2016
as compared to the year ended
December 31, 2015
. After allowing for foreign exchange movements, the decrease was $19.8 million.
The 2016 decrease included decreased consulting costs and professional services of $17.4 million, travel expenses of $12.5 million, audit and legal costs of $5.4 million and absorbed fund expenses of $4.4 million. 2015 included a provision of $12.6
51
million pertaining to regulatory investigations which did not recur in 2016. The 2016 decrease in consulting costs is offset by an increase of $11.8 million in business optimization related consulting costs. The decreases were also offset by increases in irrecoverable sales taxes (VAT) of $7.9 million, market data services of $6.5 million and amortization of intangibles of $3.3 million.
Operating Income, Adjusted Operating Income, Operating Margin and Adjusted Operating Margin
Operating income
increased
by
$100.7 million
(
8.6%
) to
$1,277.1 million
in the year ended
December 31, 2017
(year ended
December 31, 2016
:
$1,176.4 million
). Operating margin (operating income divided by operating revenues), slightly
decreased
to
24.7%
in the year ended
December 31, 2017
from
24.8%
in the year ended
December 31, 2016
. Adjusted operating income,
increased
by
$167.4 million
(
12.8%
) to
$1,480.2 million
in the year ended
December 31, 2017
from
$1,312.8 million
in the year ended
December 31, 2016
. Adjusted operating margin
increased
to
39.4%
in the year ended
December 31, 2017
from
38.7%
in the year ended
December 31, 2016
. See “Schedule of Non-GAAP Information” for a reconciliation of operating revenues to net revenues, a reconciliation of operating income to adjusted operating income and additional important disclosures regarding net revenues, adjusted operating income and adjusted operating margin.
Operating income decreased by $
182.0 million
(
13.4%
) to $
1,176.4 million
in the year ended
December 31, 2016
(year ended
December 31, 2015
:
$
1,358.4 million
). Operating margin (operating income divided by operating revenues),
decreased
to
24.8%
in the year ended
December 31, 2016
from
26.5%
in the year ended
December 31, 2015
. Adjusted operating income
decreased
by
$180.9 million
(
12.1%
) to
$1,312.8 million
in the year ended
December 31, 2016
from
$1,493.7 million
in the year ended
December 31, 2015
. Adjusted operating margin
decreased
to
38.7%
in the year ended
December 31, 2016
from
41.0%
in the year ended
December 31, 2015
.
Other Income and Expenses
The main categories of other income and expenses, and the dollar and percentage changes between periods are as follows:
|
Variance
|
||||||||||||||||||||
|
Years ended December 31,
|
2017 vs 2016
|
2016 vs 2015
|
||||||||||||||||||
|
$ in millions
|
2017
|
2016
|
2015
|
$ Change
|
% Change
|
$ Change
|
% Change
|
|||||||||||||
|
Equity in earnings of unconsolidated affiliates
|
44.7
|
|
9.3
|
|
35.1
|
|
35.4
|
|
380.6
|
%
|
(25.8
|
)
|
(73.5
|
)%
|
||||||
|
Interest and dividend income
|
13.4
|
|
12.2
|
|
13.0
|
|
1.2
|
|
9.8
|
%
|
(0.8
|
)
|
(6.2
|
)%
|
||||||
|
Interest expense
|
(94.8
|
)
|
(93.4
|
)
|
(81.7
|
)
|
(1.4
|
)
|
1.5
|
%
|
(11.7
|
)
|
14.3
|
%
|
||||||
|
Other gains and losses, net
|
51.5
|
|
22.9
|
|
(1.5
|
)
|
28.6
|
|
124.9
|
%
|
24.4
|
|
N/A
|
|
||||||
|
Other income/(expense) of CIP, net
|
137.3
|
|
79.2
|
|
27.1
|
|
58.1
|
|
73.4
|
%
|
52.1
|
|
192.3
|
%
|
||||||
|
Other income/(expense) of CSIP, net
|
—
|
|
—
|
|
11.7
|
|
—
|
|
—
|
%
|
(11.7
|
)
|
(100.0
|
)%
|
||||||
|
Total other income and expenses
|
152.1
|
|
30.2
|
|
3.7
|
|
121.9
|
|
403.6
|
%
|
26.5
|
|
716.2
|
%
|
||||||
Equity in earnings of unconsolidated affiliates
Equity in earnings of unconsolidated affiliates
increased
by
$35.4 million
(
380.6%
) to
$44.7 million
in the year ended
December 31, 2017
(year ended
December 31, 2016
:
$9.3 million
) primarily due to a
non-cash impairment charge of $17.8 million related to our investment in an Indian joint venture recorded in 2016.
The remaining
increase
in equity in earnings is driven by an $8.3 million increase in earnings from our investments in real estate products and an increase of $6.0 million from our private equity investments.
Equity in earnings of unconsolidated affiliates decreased by
$25.8 million
(
73.5%
) to
$9.3 million
in the year ended
December 31, 2016
(year ended
December 31, 2015
:
$35.1 million
). On April 5, 2016, the company purchased the remaining 51% of Invesco Asset Management (India) Private Limited (formerly our joint venture, Religare Invesco Asset Management Company), which increased our interest to 100%. The company recorded a non-cash impairment charge of $17.8 million related to its 49% investment in its Indian joint venture. The charge related entirely to the devaluation of the Indian Rupee against the U.S. Dollar over the period since the 2013 purchase and is reflected in this line item. The remaining decrease in equity in earnings is driven by decreases of $8.8 million in our share of earnings from our joint venture investments in China and $2.3 million in earnings from our investments in private equity and other funds, partially offset by an increase of $3.1 million in earnings from our investment in Invesco Mortgage Capital Inc.
52
Interest expense
Interest expense increased b
y $11.7 million (14.3%) to
$93.4 million
in the year ended
December 31, 2016
(year ended
December 31, 2015
:
$81.7 million
) primarily due to the new Senior Notes issued in October 2015 and t
he renegotiation of the credit facility which increased the overall borrowing costs versus the comparative period.
Other gains and losses, net
Other gains and losses, net were a net
gain
of
$51.5 million
in the year ended
December 31, 2017
as compared to a net
gain
of
$22.9 million
in the year ended
December 31, 2016
. Included within other gains and losses, net in the year ended
December 31, 2017
are a realized gain of $12.1 million related to revaluation of Euros held in the U.K. in anticipation of payment for the European ETF business acquisition, net trading gains of $24.7 million on the appreciation of investments and the total return swap held for our deferred compensation plans, $14.2 million of net investment gains related to the mark-to-market on our trading investments, $7.2 million of realized gains from available-for-sale investments, a gain of $7.6 million related to an acquisition-related change in the fair value of a contingent consideration liability, net foreign exchange gains on intercompany loans of $4.1 million and $5.8 million of other realized gains. These gains were partially offset by net losses during the period of $21.0 million related to the mark-to-market of foreign exchange put option contracts intended to provide protection against the impact of a significant decline in the Pound Sterling/U.S. Dollar and Euro/U.S. Dollar foreign exchange rates and an investment impairment charge of $3.2 million. See Item 8, Financial Statements and Supplementary Data, - Note
14
, "Other Gains and Losses, Net" for additional information.
Other gains and losses, net were a net gain of
$22.9 million
in the year ended
December 31, 2016
as compared to a net loss of
$1.5 million
in the year ended
December 31, 2015
. Included within other gains and losses, net in the year ended
December 31, 2016
are a gain of $22.0 million related to the mark-to-market of foreign exchange put option contracts intended to provide protection against the impact of a significant decline in the Pound Sterling/U.S Dollar foreign exchange rate, a net gain of $11.2 million resulting from the appreciation of investments held for our deferred compensation plans and net gains of $3.0 million from other trading investments. These gains are partially offset by a net loss of
$7.4 million
related to an acquisition related change in the fair value of the contingent consideration liability and
$6.0 million
in net foreign exchange losses on the revaluation of intercompany foreign currency denominated loans into the various functional currencies of our subsidiaries. See Item 8, Fi
nancial Statements and Supplementary Data, - Note
14
, "Other Gains and Losses, Net" for additional information.
Other income/(expense) of CIP
Upon adoption of ASU 2015-02, the funds previously consolidated as CSIP became VIEs and are now consolidated as CIP. See Item 8, Financial Statements and Supplementary Data - Notes
1
, "Accounting Policies" ” for additional details.
In the year ended
December 31, 2017
, interest and dividend income of CIP
increased
by
$16.3 million
(
8.3%
) to
$211.6 million
(year ended
December 31, 2016
:
$195.3 million
). Interest expense of CIP
increased
by
$31.8 million
(
25.7%
) to
$155.3 million
(year ended
December 31, 2016
:
$123.5 million
). The increase in interest income and interest expense of CIP in the year ended
December 31, 2017
is primarily due to the impact of newly consolidated CLOs and other funds during the year.
In the year ended
December 31, 2016
, interest and dividend income of CIP decreased
by
$57.7 million
(
22.8%
) to
$195.3 million
(year ended
December 31, 2015
:
$253.0 million
). Interest expense of CIP decreased by
$65.4 million
(
34.6%
) to
$123.5 million
(year ended
December 31, 2015
:
$188.9 million
). The decrease in interest income and interest expense of CIP in the year ended
December 31, 2016
is primarily due to the impact of deconsolidation of CLOs upon adoption of ASU 2015-02, partially offset by the impact of newly consolidated CLOs and other funds during 2016.
Included in other gains/(losses) of CIP, net, are realized and unrealized gains and losses on the underlying investments and debt of CIP. In the year ended
December 31, 2017
, other gains and losses of CIP were a net
gain
of
$81.0 million
, as compared to a net
gain
of
$7.4 million
in the year ended
December 31, 2016
. The net gains during
2017
were attributable to market-driven gains of investments held by consolidated funds. In the year ended
December 31, 2016
, other gains and losses of CIP were a net gain of
$7.4 million
, as compared to a net loss of
$37.0 million
in the year ended
December 31, 2015
.
53
Net impact of CIP and related noncontrolling interests in consolidated entities
The net impact to net income attributable to Invesco Ltd. in each period primarily represents the changes in the value of the company's holding in its consolidated CLOs, which is reclassified into other gains/(losses) from accumulated other comprehensive income upon consolidation. The consolidation of investment products during the year ended
December 31, 2017
resulted in an
increase
to net income attributable to Invesco Ltd. of
$2.3 million
(year ended
December 31, 2016
:
$3.0 million
net increase). The consolidation of investment products during the year ended
December 31, 2015
resulted in a decrease to net income attributable to Invesco Ltd. of
$40.4 million
.
Noncontrolling interests in consolidated entities represent the profit or loss amounts attributed to third party investors in CIP. The impact of any gains or losses resulting from valuation changes in the investments of non-CLO CIP attributable to the interests of third parties are offset by resulting changes in gains and losses attributable to noncontrolling interests in consolidated entities and therefore do not have a material effect on the financial condition, operating results (including earnings per share), liquidity or capital resources of the company's common shareholders. Similarly, any gains or losses resulting from valuation changes in the investments of CLOs attributable to the interests of third parties are offset by the calculated value of the notes issued by the CLOs (offsetting in other gains/(losses) of CIP) and therefore also do not have a material effect on the financial condition, operating results (including earnings per share), liquidity or capital resources of the company's common shareholders.
Additionally, CIP represent less than 1% of the company's AUM. Therefore, the net gains or losses of CIP are not indicative of the performance of the company's aggregate assets under management.
Income Before Taxes
Total income before taxes includes income/losses of CIP; however, the company's operating revenues earned from CIP are not included in operating revenues under U.S. GAAP, as such operating revenues are eliminated upon consolidation. Therefore, total U.S. and Foreign income before taxes in Item 8. Financial Statements and Supplementary Data, Note
15
, "Taxation,", which includes income/losses from CIP, and U.S. and Foreign operating revenues in Item 8. Financial Statements and Supplementary Data, Note
17
, "Geographic Information.," in which CIP has been eliminated, may not correlate. The table included in the taxation footnote is formatted such that the income of CIP is separately stated so that the impact of CIP is evident.
Total U.S. income before taxes
increased
$98.6 million
during the year ended
December 31, 2017
to
$638.5 million
from
$539.9 million
for the year ended
December 31, 2016
and includes U.S. income of CIP of
$0.1 million
(
December 31, 2016
:
$2.4 million
). U.S. income from CIP
decreased
$2.3 million
(95.8%) from
2016
due primarily to the impact of gains on consolidated private equity partnerships. Excluding CIP, U.S. income before taxes in
2017
increased
$100.9 million
(
18.8%
) from
December 31, 2016
due to a larger increase in U.S. operating revenues than operating expenses.
Total Foreign income before taxes
increased
$124.0 million
during the year ended
December 31, 2017
to
$790.7 million
from
$666.7 million
during the year ended
December 31, 2016
and includes foreign income of CIP of
$35.9 million
(
December 31, 2016
: foreign income of CIP of
$14.7 million
). Foreign income from CIP
increased
$21.2 million
due primarily to gains on consolidated funds and the impact of newly consolidated funds in
2017
. Excluding CIP, foreign income
increased
by
$102.8 million
(
15.8%
) from
2016
due to a larger increase in foreign operating revenues and other income than operating expenses.
Total U.S. income before taxes
decreased
$148.0 million
to
$539.9 million
during the year ended
December 31, 2016
from
$687.9 million
during the year ended
December 31, 2015
and includes income of CIP of
$2.4 million
(
December 31, 2015
:
$26.0 million
). U.S. income of CIP
decreased
$23.6 million
(
90.8%
) from
2015
due primarily to the impact of private equity partnerships that were deconsolidated upon the adoption of ASU 2015-02. Excluding CIP, U.S. income before taxes in
2016
decrease
d $
124.4 million
(
18.8%
) from
December 31, 2015
du
e to a larger decrease in U.S. operating revenues than operating expenses.
Total Foreign income before taxes
decreased
$7.5 million
to
$666.7 million
during the year ended
December 31, 2016
from
$674.2 million
during the year ended
December 31, 2015
and includes U.S. income of CIP of
$14.7 million
(
December 31, 2015
: losses of CIP of
$72.1 million
). Excluding CIP, foreign income decreased by $94.3 million (12.6%) from 2015 du
e to a larger decrease in foreign operating revenues and other income than operating expenses.
54
Income Tax Expense
Our effective tax rate for the year ended
December 31, 2017
decreased to
18.8%
(year ended
December 31, 2016
:
28.0%
). The decrease included a $130.7 million tax benefit (9.3%) related to the revaluation of deferred tax assets and liabilities following the 2017 Tax Act enacted in the United States. The inclusion of income from non-controlling interests decreased our rate period-over-period by
0.2%
(
0.5%
decrease to the effective tax rate in
2017
and
0.3%
decrease to the effective tax rate in
2016
).
The remainder of the rate movement was primarily due to changes in the mix of pre-tax income. See also Item 8, Financial Statements and Supplementary Data - in Note
15
, "Taxation," for further details and additional discussion on estimated amounts recorded as of December 31, 2017 for the 2017 Tax Act.
Our effective tax rate for the year ended
December 31, 2016
decreased to
28.0%
(year ended
December 31, 2015
:
29.2%
). The inclusion of non-controlling interests decreased our effective tax rate period-over-period b
y 0.4%. (0.3% decrease to the effective tax rate in 2016 and 0.1% increase to the effective tax rate in 2015). 2016 included a 0.4% rate increase as a result of the non-cash impairment charge related to the 49% investment in Invesco Asset Management (India) Private Limited. 2015 included a 0.2% rate increase as a result of tax legislation changes in New York City net of settlements, a 0.2% increase as a result of regulatory investigation charges and a 0.3%
increase relating to unrecognized tax benefits. The remainder of the rate movement was primarily due to changes in the mix of pre-tax income.
Schedule of Non-GAAP Information
We utilize the following non-GAAP performance measures: net revenue (and by calculation, net revenue yield on AUM), adjusted operating income, adjusted operating margin, adjusted net income attributable to Invesco Ltd. and adjusted diluted earnings per share (EPS). The company believes the adjusted measures provide valuable insight into the company’s ongoing operational performance and assist in comparisons to its competitors. These measures also assist the company’s management with the establishment of operational budgets and forecasts and assist the Board of Directors and management of the company in determining incentive compensation decisions. The most directly comparable U.S. GAAP measures are operating revenues (and by calculation, gross revenue yield on AUM), operating income, operating margin, net income attributable to Invesco Ltd. and diluted EPS. Each of these measures is discussed more fully below.
The following are reconciliations of operating revenues, operating income (and by calculation, operating margin), and net income attributable to Invesco Ltd. (and by calculation, diluted EPS) on a U.S. GAAP basis to a non-GAAP basis of net revenues, adjusted operating income (and by calculation, adjusted operating margin), and adjusted net income attributable to Invesco Ltd. (and by calculation, adjusted diluted EPS). These non-GAAP measures should not be considered as substitutes for any U.S. GAAP measures and may not be comparable to other similarly titled measures of other companies. Additional reconciling items may be added in the future to these non-GAAP measures if deemed appropriate. The tax effects related to the reconciling items have been calculated based on the tax rate attributable to the jurisdiction to which the transaction relates. Notes to the reconciliations follow the tables.
Reconciliation of Operating revenues to Net revenues:
|
$ in millions
|
2017
|
2016
|
2015
|
2014
|
2013
|
|||||||||
|
Operating revenues, U.S. GAAP basis
|
5,160.3
|
|
4,734.4
|
|
5,122.9
|
|
5,147.1
|
|
4,644.6
|
|
||||
|
Proportional share of revenues, net of third-party distribution expenses, from joint venture investments
(1)
|
48.7
|
|
43.7
|
|
61.0
|
|
56.7
|
|
51.7
|
|
||||
|
Third party distribution, service and advisory expenses
(2)
|
(1,486.5
|
)
|
(1,407.2
|
)
|
(1,579.9
|
)
|
(1,630.7
|
)
|
(1,489.2
|
)
|
||||
|
CIP
(3)
|
32.4
|
|
22.3
|
|
39.2
|
|
35.2
|
|
37.9
|
|
||||
|
Other reconciling items
(6)
|
—
|
|
—
|
|
—
|
|
—
|
|
7.0
|
|
||||
|
Net revenues
|
3,754.9
|
|
3,393.2
|
|
3,643.2
|
|
3,608.3
|
|
3,252.0
|
|
||||
55
Reconciliation of Operating income to Adjusted operating income:
|
$ in millions
|
2017
|
2016
|
2015
|
2014
|
2013
|
|||||||||
|
Operating income, U.S. GAAP basis
|
1,277.1
|
|
1,176.4
|
|
1,358.4
|
|
1,276.9
|
|
1,120.2
|
|
||||
|
Proportional share of net operating income from joint venture investments
(1)
|
18.4
|
|
15.9
|
|
27.4
|
|
25.9
|
|
21.3
|
|
||||
|
CIP
(3)
|
42.9
|
|
51.0
|
|
63.2
|
|
69.8
|
|
73.0
|
|
||||
|
Business combinations
(4)
|
43.8
|
|
22.3
|
|
12.8
|
|
12.6
|
|
23.0
|
|
||||
|
Compensation expense related to market valuation changes in deferred compensation plans
(5)
|
20.3
|
|
8.1
|
|
4.3
|
|
11.5
|
|
25.1
|
|
||||
|
Other reconciling items
(6)
|
77.7
|
|
39.1
|
|
27.6
|
|
98.3
|
|
29.5
|
|
||||
|
Adjusted operating income
|
1,480.2
|
|
1,312.8
|
|
1,493.7
|
|
1,495.0
|
|
1,292.1
|
|
||||
|
Operating margin*
|
24.7
|
%
|
24.8
|
%
|
26.5
|
%
|
24.8
|
%
|
24.1
|
%
|
||||
|
Adjusted operating margin**
|
39.4
|
%
|
38.7
|
%
|
41.0
|
%
|
41.4
|
%
|
39.7
|
%
|
||||
Reconciliation of Net income attributable to Invesco Ltd. to Adjusted net income attributable to Invesco Ltd.:
|
$ in millions, except per share data
|
2017
|
2016
|
2015
|
2014
|
2013
|
||||||||||||||
|
Net income attributable to Invesco Ltd., U.S. GAAP basis
|
1,127.3
|
|
854.2
|
|
968.1
|
|
988.1
|
|
940.3
|
|
|||||||||
|
CIP, eliminated upon consolidation
(3)
|
(2.3
|
)
|
(3.0
|
)
|
40.4
|
|
(7.8
|
)
|
8.7
|
|
|||||||||
|
Business combinations, net of tax
(4)
|
39.3
|
|
59.5
|
|
14.0
|
|
36.2
|
|
(23.8
|
)
|
|||||||||
|
Deferred compensation plan market valuation changes and dividend income less compensation expense, net of tax
(5)
|
(4.6
|
)
|
(2.5
|
)
|
5.9
|
|
(0.3
|
)
|
(12.6
|
)
|
|||||||||
|
Other reconciling items, net of tax
(6)
|
(53.8
|
)
|
15.9
|
|
20.3
|
|
78.6
|
|
40.7
|
|
|||||||||
|
Adjusted net income attributable to Invesco Ltd.***
|
1,105.9
|
|
924.1
|
|
1,048.7
|
|
1,094.8
|
|
953.3
|
|
|||||||||
|
Average shares outstanding - diluted
|
409.9
|
|
415.0
|
|
429.3
|
|
435.6
|
|
448.5
|
|
|||||||||
|
Diluted EPS
|
|
$2.75
|
|
|
$2.06
|
|
|
$2.26
|
|
|
$2.27
|
|
|
$2.10
|
|
||||
|
Adjusted diluted EPS****
|
|
$2.70
|
|
|
$2.23
|
|
|
$2.44
|
|
|
$2.51
|
|
|
$2.13
|
|
||||
____________
|
*
|
Operating margin is equal to operating income divided by operating revenues.
|
|
**
|
Adjusted operating margin is equal to adjusted operating income divided by net revenues.
|
|
***
|
The effective tax rate on adjusted net income attributable to Invesco Ltd. is 27.0% ( 2016:
26.8%; 2015: 27.1%; 2014: 26.6%; 2013: 26.3%).
|
|
****
|
Adjusted diluted EPS is equal to adju
sted net income attributable to Invesco Ltd. divided by the weighted average number of common and restricted shares outstanding. There is no difference between the calculated earnings per share amounts presented above and the calculated earnings per share amounts under the two class method.
|
|
(1)
|
Proportional share of net revenues and operating income from joint venture investments
|
The company has two joint venture investments in China. The Invesco Great Wall joint venture is one of the largest Sino-foreign managers of equity products in China, with AUM of approximately
$17.4 billion
as of
December 31, 2017
. The company has a
49%
interest in Invesco Great Wall. The company also has a
50%
joint venture with Huaneng Capital Services to access private equity investment opportunities in power generation in China through Huaneng Invesco WLR Investment Consulting Company Ltd. Enhancing our operations in China is one effort that we believe could improve our competitive position over time. Accordingly, we believe that it is appropriate to evaluate the contribution of these joint venture investments to the operations of the business.
Management believes that the addition of our proportional share of revenues, net of distribution expenses, from our Chinese joint venture investments in the computation of net revenues and the addition of our proportional share of operating income in the related computations of adjusted operating income and adjusted operating margin also provide useful information to investors and other users of the company's Consolidated Financial Statements, as management considers it appropriate to evaluate the contribution of its joint ventures to the operations of the business. It is also consistent with the presentation
56
of AUM and net flows (where our proportional share of the ending balances and related activity are reflected) and therefore provides a more meaningful calculation of net revenue yield on AUM.
|
(2)
|
Third-party distribution, service and advisory expenses
|
Third-party distribution, service and advisory expenses include renewal commissions, management fee rebates and distribution costs (12b-1 and marketing support) paid to brokers and independent financial advisors and other service and administrative fees paid to third parties. See Item 8, Financial Statements and Supplementary Data - Note
1
, "Accounting Policies - Revenue Recognition" for additional details. While the terms used for these types of expenses vary by geography, they are all expense items that are closely linked to the value of AUM and the revenue earned by Invesco from AUM; although, from time-to-time, distribution expenses may include commissions paid in connection with the launch of closed-end funds for which there is no corresponding revenue in the period. Since the company has been deemed to be the principal in the third-party arrangements, the company must reflect these expenses gross of operating revenues under U.S. GAAP.
Management believes that the deduction of third-party distribution, service and advisory expenses from operating revenues appropriately reflects the nature of these expenses as being passed through to external parties who perform functions on behalf of, and distribute, the company’s managed funds. Further, these expenses vary extensively by geography due to the differences in distribution channels. The net presentation assists in identifying the revenue contribution generated by the business, removing distortions caused by the differing distribution channel fees and allowing for a fair comparison with U.S. peer investment managers and within Invesco’s own investment units. Additionally, management evaluates net revenue yield on AUM, which is equal to net revenues divided by average AUM during the reporting period. This financial measure is an indicator of the basis point net revenues we receive for each dollar of AUM we manage and is useful when evaluating the company’s performance relative to industry competitors and within the company for capital allocation purposes.
|
(3)
|
CIP
|
See Item 8, Financial Statements and Supplementary Data, Note
19
- “Consolidated Investment Products” for a detailed analysis of the impact to the company’s Consolidated Financial Statements from the consolidation of CIP. The reconciling items add back the management and performance fees earned by Invesco from the consolidated products and remove the revenues and expenses recorded by the consolidated products that have been included in the U.S. GAAP Consolidated Statements of Income.
Management believes that the consolidation of investment products may impact a reader's analysis of our underlying results of operations and could result in investor confusion or the production of information about the company by analysts or external credit rating agencies that is not reflective of the underlying results of operations and financial condition of the company. Accordingly, management believes that it is appropriate to adjust operating revenues, operating income and net income for the impact of CIP in calculating the respective net revenues, adjusted operating income and adjusted net income.
CIP Revenue:
|
Year ended December 31,
|
||||||||||||||
|
$ in millions, except per share data
|
2017
|
2016
|
2015
|
2014
|
2013
|
|||||||||
|
Management fees earned from CIP, eliminated upon consolidation
|
25.5
|
|
20.8
|
|
30.7
|
|
26.7
|
|
27.0
|
|
||||
|
Performance fees earned from CIP, eliminated upon consolidation
|
6.9
|
|
1.5
|
|
8.5
|
|
9.1
|
|
11.3
|
|
||||
|
Other revenues recorded by CIP
|
—
|
|
—
|
|
—
|
|
(0.6
|
)
|
(0.4
|
)
|
||||
|
CIP related adjustments in arriving at net revenues
|
32.4
|
|
22.3
|
|
39.2
|
|
35.2
|
|
37.9
|
|
||||
|
(4)
|
Business combination related adjustments
|
Business combination related adjustments are comprised of amounts incurred by the company in connection with business combinations. Management believes it is useful to investors and other users of our Consolidated Financial Statements to adjust for the transaction and integration charges, the reversal of business combination-related deferred tax liabilities recorded under U.S. GAAP, currency gains recognized on revaluation of foreign currencies held in anticipation of payment for acquisition and other acquisition/disposition related adjustments in arriving at adjusted operating income, adjusted operating margin and adjusted diluted EPS, as this will aid comparability of our results period to period, and aid comparability with peer companies that may not have similar acquisition and disposition related income or charges.
57
See table below for a reconciliation of business combination related items:
|
$ in millions
|
2017
|
2016
|
2015
|
2014
|
2013
|
|||||||||
|
Business combination related:
|
||||||||||||||
|
Employee compensation expense
(a)
|
5.8
|
|
7.0
|
|
—
|
|
—
|
|
2.4
|
|
||||
|
Transaction and integration expense
(b)
|
20.6
|
|
1.4
|
|
2.2
|
|
—
|
|
5.2
|
|
||||
|
Intangible amortization expense
(c)
|
17.4
|
|
13.9
|
|
10.6
|
|
12.6
|
|
15.4
|
|
||||
|
Adjustments to operating income
|
43.8
|
|
22.3
|
|
12.8
|
|
12.6
|
|
23.0
|
|
||||
|
Change in contingent consideration estimates
(d)
|
(7.6
|
)
|
7.4
|
|
(27.1
|
)
|
—
|
|
—
|
|
||||
|
Foreign exchange gain related to business acquisitions
(e)
|
(12.1
|
)
|
—
|
|
—
|
|
—
|
|
—
|
|
||||
|
Other-than-temporary impairment
(f)
|
—
|
|
17.8
|
|
—
|
|
—
|
|
—
|
|
||||
|
Taxation:
|
||||||||||||||
|
Taxation on employee compensation expense
(a)
|
(2.1
|
)
|
(2.7
|
)
|
—
|
|
—
|
|
—
|
|
||||
|
Taxation on transaction and integration
(b)
|
(5.9
|
)
|
(0.5
|
)
|
(0.6
|
)
|
—
|
|
(2.1
|
)
|
||||
|
Taxation on amortization
(c)
|
(1.6
|
)
|
(1.3
|
)
|
(1.5
|
)
|
(1.6
|
)
|
(1.5
|
)
|
||||
|
Deferred taxation
(g)
|
19.6
|
|
19.3
|
|
20.1
|
|
21.8
|
|
21.3
|
|
||||
|
Taxation on change in contingent consideration estimates
(d)
|
2.9
|
|
(2.8
|
)
|
10.3
|
|
—
|
|
—
|
|
||||
|
Taxation on foreign exchange gain related to business
acquisitions
(e)
|
2.3
|
|
—
|
|
—
|
|
—
|
|
—
|
|
||||
|
(Income)/loss from discontinued operations, net of taxes
(h)
|
—
|
|
—
|
|
—
|
|
3.4
|
|
(64.5
|
)
|
||||
|
Adjustments to net income attributable to Invesco Ltd.
|
39.3
|
|
59.5
|
|
14.0
|
|
36.2
|
|
(23.8
|
)
|
||||
____________
|
a.
|
Employee compensation expenses o
f
$5.8 million
incurred in 2017 are related to our European ETF acquisition, while
$7.0 million
incurred in 2016 are associat
ed with the acquisition of Jemstep, a market-leading provider of advisor-focused digital solutions. Expenses in 2013 are related to employee severance expenses associated with the cessation of activities from a previous acquisition.
|
|
b.
|
Transaction and integration expenses reflect the legal, regulatory, advisory, valuation, integration-related employee incentive awards, other professional or consulting fees and general and administrative costs, which includes travel costs related to transactions and the costs of temporary staff involved in executing the transaction, and the post-closing costs of integrating the acquired business into the company’s existing operations, including incremental costs associated with achieving synergy savings.
|
|
c.
|
Intangible amortization expense is associated with intangible assets that are identified from acquisition of a business and are amortized on a straight-line basis over useful lives. See Item 8, Financial Statements and Supplementary Data, Note 5 - “Intangible Assets” for detail.
|
|
d.
|
During 2015, the company acquired investment management contracts from Deutsche Bank and the purchase price was solely comprised of contingent consideration payable in future periods. Adjustment to the fair value of contingent consideration liability is a
decrease of $7.6 million in 2017,
an increase of
$7.4 million
in 2016 and a decrease of
$27.1 million
in 2015. See
|
|
e.
|
Other gains and losses for 2017 includes a realized gain of $12.1 million related to revaluation of Euros held in the U.K. in anticipation of payment for the European ETF business acquisition.
|
|
f.
|
Other-than-temporary impairment includes an impairment charge of
$17.8 million
in 2016
that is related to the acquisition of Invesco Asset Management (India) Private Limited.
|
|
g.
|
While finite-lived intangible assets are amortized under U.S. GAAP, there is no amortization charge on goodwill and indefinite-lived intangibles. In certain qualifying situations, these can be amortized for tax purposes, generally over a 15-year period, as is the case in the U.S. These deferred tax liabilities represent tax benefits that are not included in the Consolidated Statements of Income absent an impairment charge or the disposal of the related business. The company receives these tax benefits but does not anticipate a sale or impairment of these assets in the foreseeable
|
58
future, and therefore the deferred tax liabilities recognized under U.S. GAAP are not expected to be used either through a credit in the Consolidated Statements of Income or through settlement of tax obligations.
|
h.
|
The results of the discontinued operations of Atlantic Trust have been excluded in arriving at adjusted net income attributable to Invesco Ltd., which is the basis of calculating adjusted diluted EPS. Accordingly, the company's non-GAAP financial measures reflect only the continuing business of Invesco.
|
|
(5)
|
Market movement on deferred compensation plan liabilities
|
Certain deferred compensation plan awards are linked to the appreciation (depreciation) of specified investments, typically managed by the company. Invesco hedges economically the exposure to market movements by holding these investments on its balance sheet and through a total return swap financial instrument. U.S. GAAP requires the appreciation (depreciation) in the compensation liability to be expensed over the award vesting period in proportion to the vested amount of the award as part of compensation expense. The full value of the investment and financial instrument appreciation (depreciation) are immediately recorded below operating income in other gains and losses. This creates a timing difference between the recognition of the compensation expense and the investment gain or loss impacting net income attributable to Invesco Ltd. and diluted EPS which will reverse over the life of the award and net to zero at the end of the multi-year vesting period. During periods of high market volatility these timing differences impact compensation expense, operating income and operating margin in a manner which, over the life of the award, will ultimately be offset by gains and losses recorded below operating income on the Consolidated Statements of Income. The non-GAAP measures exclude the mismatch created by differing U.S. GAAP treatments of the market movement on the liability and the investments.
Since these plans are hedged economically, management believes it is useful to reflect the offset ultimately achieved from hedging the investment market exposure in the calculation of adjusted operating income (and by calculation, adjusted operating margin) and adjusted net income (and by calculation, adjusted diluted EPS), to produce results that will be more comparable period to period. The related fund shares will have been purchased on or around the date of grant, eliminating any ultimate cash impact from market movements that occur over the vesting period.
Additionally, dividend income from investments held to hedge economically deferred compensation plans is recorded as dividend income and as compensation expense on the company’s Consolidated Statements of Income on the record dates. This dividend income is passed through to the employee participants in the plan and is not retained by the company. The non-GAAP measures exclude this dividend income and related compensation expense.
See below for a reconciliation of deferred compensation related items:
|
$ in millions
|
2017
|
2016
|
2015
|
2014
|
2013
|
|||||||||
|
Market movement on deferred compensation plan liabilities:
|
||||||||||||||
|
Compensation expense related to market valuation changes in deferred compensation liability
|
20.3
|
|
8.1
|
|
4.3
|
|
11.5
|
|
25.1
|
|
||||
|
Adjustments to operating income
|
20.3
|
|
8.1
|
|
4.3
|
|
11.5
|
|
25.1
|
|
||||
|
Market valuation changes and dividend income from investments and instruments held related to deferred compensation plans in other income/(expense)
|
(27.6
|
)
|
(12.1
|
)
|
4.8
|
|
(11.2
|
)
|
(42.5
|
)
|
||||
|
Taxation:
|
||||||||||||||
|
Taxation on deferred compensation plan market valuation changes and dividend income less compensation expense
|
2.7
|
|
1.5
|
|
(3.2
|
)
|
(0.6
|
)
|
4.8
|
|
||||
|
Adjustments to net income attributable to Invesco Ltd.
|
(4.6
|
)
|
(2.5
|
)
|
5.9
|
|
(0.3
|
)
|
(12.6
|
)
|
||||
59
|
(6)
|
Other reconciling items
|
Each of these other reconciling items has been adjusted from U.S. GAAP to arrive at the company's non-GAAP financial measures for the reasons either outlined in the paragraphs above, due to the unique character and magnitude of the reconciling item, or because the item represents a continuation of a reconciling item adjusted from U.S. GAAP in a prior period.
|
$ in millions
|
2017
|
2016
|
2015
|
2014
|
2013
|
|||||||||
|
Other non-GAAP adjustments:
|
||||||||||||||
|
Investment management fees accrual adjustment
(a)
|
—
|
|
—
|
|
—
|
|
—
|
|
4.3
|
|
||||
|
Third party distribution, service and advisory expenses - European infrastructure initiative
(b)
|
—
|
|
—
|
|
—
|
|
—
|
|
2.7
|
|
||||
|
Adjustments to net revenues
|
—
|
|
—
|
|
—
|
|
—
|
|
7.0
|
|
||||
|
Business optimization charges:
(c)
|
||||||||||||||
|
Employee compensation
|
30.0
|
|
26.4
|
|
12.2
|
|
7.2
|
|
—
|
|
||||
|
Consulting and temporary labor
|
25.3
|
|
21.8
|
|
2.0
|
|
—
|
|
—
|
|
||||
|
Property, office and technology
|
2.7
|
|
1.7
|
|
2.0
|
|
—
|
|
—
|
|
||||
|
Vacated property lease charge/(credit)
|
—
|
|
(3.2
|
)
|
(6.4
|
)
|
33.1
|
|
—
|
|
||||
|
Employee benefit plan termination
(d)
|
—
|
|
(8.6
|
)
|
—
|
|
—
|
|
—
|
|
||||
|
Regulatory charge
(e)
|
—
|
|
1.0
|
|
12.6
|
|
31.1
|
|
—
|
|
||||
|
Legal fees for regulatory charge
(e)
|
—
|
|
—
|
|
0.5
|
|
0.5
|
|
—
|
|
||||
|
Senior executive retirement and related costs
(f)
|
19.7
|
|
—
|
|
—
|
|
—
|
|
—
|
|
||||
|
Fund reimbursement expense
(g)
|
—
|
|
—
|
|
4.7
|
|
31.1
|
|
—
|
|
||||
|
U.K. FSCS levy
(h)
|
—
|
|
—
|
|
—
|
|
(4.7
|
)
|
3.0
|
|
||||
|
European infrastructure initiative
(b)
|
—
|
|
—
|
|
—
|
|
—
|
|
7.8
|
|
||||
|
Capitalized software development write-off
(i)
|
—
|
|
—
|
|
—
|
|
—
|
|
11.7
|
|
||||
|
Adjustments to operating income
|
77.7
|
|
39.1
|
|
27.6
|
|
98.3
|
|
29.5
|
|
||||
|
Foreign exchange hedge
(j)
|
20.6
|
|
(14.2
|
)
|
1.0
|
|
(0.2
|
)
|
(0.6
|
)
|
||||
|
Payment to an investment trust
(k)
|
—
|
|
—
|
|
—
|
|
—
|
|
31.9
|
|
||||
|
Taxation:
|
||||||||||||||
|
Taxation on investment management fees accrual adjustment
(a)
|
—
|
|
—
|
|
—
|
|
—
|
|
(1.1
|
)
|
||||
|
Taxation on European infrastructure initiative
(b)
|
—
|
|
—
|
|
—
|
|
—
|
|
(2.1
|
)
|
||||
|
Taxation on business optimization charges
(c)
|
(19.9
|
)
|
(16.2
|
)
|
(5.1
|
)
|
(2.3
|
)
|
—
|
|
||||
|
Taxation on vacated property lease credit
(c)
|
—
|
|
0.7
|
|
1.3
|
|
(6.4
|
)
|
—
|
|
||||
|
Taxation on employee benefit plan termination
(d)
|
—
|
|
3.3
|
|
—
|
|
—
|
|
—
|
|
||||
|
Taxation on regulatory-related charges
(e)
|
—
|
|
(1.8
|
)
|
(2.7
|
)
|
(0.1
|
)
|
—
|
|
||||
|
Taxation on senior executive retirement and related
costs
(f)
|
(5.9
|
)
|
—
|
|
—
|
|
—
|
|
—
|
|
||||
|
Taxation on fund reimbursement expense
(g)
|
—
|
|
—
|
|
(1.8
|
)
|
(11.7
|
)
|
—
|
|
||||
|
Taxation on U.K. FSCS levy
(h)
|
—
|
|
—
|
|
—
|
|
1.0
|
|
(0.7
|
)
|
||||
|
Taxation on capitalized software development write-off
(i)
|
—
|
|
—
|
|
—
|
|
—
|
|
(4.3
|
)
|
||||
|
Taxation on foreign exchange hedge
(j)
|
(7.8
|
)
|
5.0
|
|
—
|
|
—
|
|
0.2
|
|
||||
|
Taxation on payment to an investment trust
(k)
|
—
|
|
—
|
|
—
|
|
—
|
|
(12.1
|
)
|
||||
|
Tax impact of regulation changes
(l)
|
(118.5
|
)
|
—
|
|
—
|
|
—
|
|
—
|
|
||||
|
Adjustments to net income attributable to Invesco Ltd.
|
(53.8
|
)
|
15.9
|
|
20.3
|
|
78.6
|
|
40.7
|
|
||||
____________
|
a.
|
During the year end
ed December 31, 2013, the company reduced a management fee revenue accrual by
$4.3 million
to reflect a multi-year true-up. Inclusion of this true-up in the company’s non-GAAP financial information woul
d depress the derived metric of net revenue yield on AUM from continuing operations, an important metric calculated
|
60
from a non-GAAP financial measure which is often contemplated by users of the company’s financial information to evaluate the company with industry peers. The true-up is not indicative of a trend in future net revenue yield on AUM; therefore, it is not included in management’s evaluation of the results of the business. On this basis, the amount is added back to management fees to arrive at net revenue.
|
b.
|
European infrastructure transformational initiative: The company outsourced its European transfer agency and made certain structural changes to product and distribution platforms. Expenses incurred related to the European infrastructure activities are excluded in arriving at the non-GAAP financial information. In connection with the initiative, operational process changes resulted in an accounting adjustment recognizing additional distribution expense in the year ended and December 31, 2013.
|
|
c.
|
Business optimization: Operating expenses for
2017
include costs associated with a business transformation initiative that include severance costs of
$30.0 million
, and consulting and temporary labor costs of
$25.3 million
(
2016
:
$26.4 million
and
$21.8 million
, 2015:
$12.2 million
and
$2.0 million
, respectively).
|
A separate business optimization location strategy initiative incurred property related charges and/or credits of the following:
2014
: charges of
$33.1 million
associated with vacating leased properties and severance costs of
$7.2 million
related to the initiative; 2015: property related charges of
$2.0 million
and lease credit of
$6.4 million
; 2016: property related charges of
$1.7 million
and lease credit of
$3.2 million
; and
2017
: property related charges of
$2.7 million
.
|
d.
|
Employee benefit plan termination: Operating expenses for
2016
include an incremental credit of
$8.6 million
related to an employee benefit plan termination
.
|
|
e.
|
General and administrative expenses for
2015
include a provision of
$12.6 million
pertaining to regulatory actions and related legal fees of
$0.5 million
(
2017
:
none
;
2016
:
$1.0 million
). This includes $7.6 million associated with our private equity business.
|
Operating expenses for
2014
include a charge of
$31.1 million
(in respect of the penalty under a settlement of an enforcement proceeding reached with the U.K. Financial Conduct Authority (FCA) pertaining to the company's compliance with certain FCA rules and regulations for the period from May 2008 to November 2012). This charge, together with settlement-related legal costs of $0.5 million, has been recorded in general and administrative expense.
|
f.
|
Operating expenses for
2017
reflect the cost of multiple senior executive retirements, including, among others, the former Senior Managing Director of EMEA and the Chairman of our Private Equity business, which resulted in expenses of
$19.7 million
related to accelerated vesting of deferred compensation and other separation costs. The number of senior executive retirements and magnitude of their retirement costs incurred in one quarter was unprecedented for Invesco. The company deemed it appropriate to adjust these costs from U.S. GAAP total compensation expenses in an effort to isolate and evaluate our level of ongoing compensation expenses and to allow for more appropriate comparisons to internal metrics and with the level of compensation expenses incurred by industry peers.
|
|
g.
|
General and administrative expenses for
2014
and
2015
include charges of
$31.1 million
and
$4.7 million
, respectively, in respect of a multi-year fund reimbursement expense associated with historical private equity management fees. The charge resulted primarily from using a more appropriate methodology regarding the calculation of offsets to management fees.
|
|
h.
|
Included within general and administrative expenses for
2014
is a credit of
$4.7 million
related to the partial refund of a $15.3 million levy in 2010 from the U.K. Financial Services Compensation Scheme. An additional
$3.0 million
charge was recorded in the year ended
December 31, 2013
reflecting revised estimates of the levy.
|
|
i.
|
Property, office and technology expenses includes a charge of
$11.7 million
in the year ended
December 31, 2013
related to the write-off of capitalized IT software development costs.
|
|
j.
|
Included within other gains and losses, net is the mark-to-market of foreign exchange put option contracts intended to provide protection against the impact of a significant decline in the Pound Sterling/U.S. Dollar and the Euro/U.S. Dollar foreign exchange rates. The Pound Sterling contracts provide coverage through December 31, 2018 and the Euro contracts provided coverage through December 27, 2017. The adjustment from U.S. GAAP to non-GAAP earnings removes the impact of market volatility; therefore, the company's non-GAAP results include only the amortization of the cost of the contracts during the contract period.
|
61
|
k.
|
On
December 31, 2013
, at the time of creating a new trust company subsidiary to continue operating the company’s institutional trust activities immediately following the disposition of Atlantic Trust, the company made a
$31.9 million
payment to a managed investment trust, which resulted in the subsequent termination of an outstanding support agreement. This expense was recorded in other gains/(losses) in the company’s Consolidated Statement of Income during the year ended December 31, 2013.
|
|
l.
|
The income tax provision for 2017 includes a retroactive state tax expense of
$12.2 million
related to 2016 and prior open tax years caused by changes in state tax regulations. 2017 also included a $
130.7 million
tax benefit as a result of the revaluation of deferred tax assets and liabilities following the 2017 Tax Act enacted in the United States.
|
62
Cash and cash equivalents
Cash and cash equivalents
increased
by
$678.4 million
from
$1,328.0 million
at
December 31, 2016
to
$2,006.4 million
at
December 31, 2017
. See “Cash Flows Discussion” in the following section within this Management's Discussion and Analysis for additional discussion regarding the movements in cash flows during the periods. See Item
8, Fin
ancial Statements and Supplementary Data - Note
1
, “Accounting Policies - Cash and Cash Equivalents,” regarding requirements to retain liquid resources in certain jurisdictions.
Unsettled fund receivables and payables
Unsettled fund receivables
increased
by
$120.9 million
from
$672.9 million
at
December 31, 2016
to
$793.8 million
at
December 31, 2017
, due primarily
to higher
transaction activity between funds and investors in late December
2017
when compared to late December
2016
in our U.K. and cross-border funds, offset by lower UIT activity. In our U.K. and cross-border operations, unsettled fund receivables are created by the normal settlement periods on transactions initiated by certain clients. In the company's capacity as sponsor of UITs, the company records receivables from brokers, dealers, and clearing organizations for unsettled sell trades of securities and UITs in addition to receivables from customers for unsettled sell trades of UITs. The presentation of the unsettled fund receivables and substantially offsetting payables (
$783.8 million
at
December 31, 2017
up from
$659.3 million
at
December 31, 2016
) at t
rade date reflects the legal relationship between the underlying investor and the company.
Investments
As of
December 31, 2017
we had
$674.6 million
in investments (
December 31, 2016
:
$795.3 million
). Included in investments are
$243.0 million
of seed money investments in affiliated funds used to seed funds as we launch new products, and
$92.3 million
of investments related to assets held for deferred compensation plans, which are also held primarily in affiliated funds. Seed investments
decreased
by
$6.8 million
during the year ended
December 31, 2017
. The decrease in the period reflects redemptions of $172.3 million, partially offset by purchases of $58.0 million, a non-cash increase of $80.9 million due to the deconsolidation of certain CIP in the period (restoring the company's formerly eliminated investment balances) as well as an increase of $24.3 million driven by market valuation changes and foreign exchange movements. Investments related to deferred compensation awards
decreased
by a net
$78.2 million
during the period, primarily related to the disposition of certain investments held to hedge economically one of the company's deferred compensation plans. Such disposition occurred in conjunction with the entrance by the company into a one-year renewable total return swap to more efficiently hedge this deferred compensation plan. This transaction did not have a material impact to the company's operations or financial position.
Included in investments are
$277.3 million
in equity method investments in our Chinese joint ventures and in certain of the company’s private equity partnerships, real estate partnerships and other co-investments (
December 31, 2016
:
$279.0 million
). The
decrease
of
$1.7 million
in equity method investments was driven by capital returns and the consolidation of certain investments during the current period. This decreases were partially offset by current period earnings, capital calls into certain partnership investments and increases due to the changes in foreign exchange rates.
Assets held for policyholders and policyholder payables
One of our subsidiaries, Invesco Perpetual Life Limited, is an insurance company that was established to facilitate retirement savings plans in the U.K. The entity holds assets that are managed for its clients on its balance sheet with an equal and offsetting liability. The
increase
in the balance of these accounts from
$8,224.2 million
at
December 31, 2016
, to
$12,444.5 million
at
December 31, 2017
, was the result of new business net inflows of $3,209.5 million and an increase in the market values of these assets and liabilities of $51.1 million and foreign exchange movements of $959.7 million. The new business inflows can be primarily attributed to pension and retirement funds investing into multi-asset products via this insurance company.
Intangible assets, net
Intangible assets reflect a
net increase
of
$159.3 million
from
$1,399.4 million
at
December 31, 2016
, to
$1,558.7 million
at
December 31, 2017
. The
increase
includes $167.1 million related to the acquisition of the European ETF business, foreign exchange movements of
$9.6 million
, offset by amortization of
$17.4 million
.
63
Goodwill
Goodwill
increased
from
$6,129.2 million
at
December 31, 2016
, to
$6,590.7 million
at
December 31, 2017
. The increase consists of
$193.3 million
related to the acquisition of the European ETF business and foreign exchange movements of $
268.2 million
. See Item 8, Financial Statements and Supplementary Data - Note
6
, "Goodwill," for an analysis of the change in goodwill balances between periods. The company's annual goodwill impairment review is performed as of October 1 of each year. As a result of that analysis, the company determined that no impairment existed at that date. See “Critical Accounting Policies - Goodwill” for additional details of the company's goodwill impairment analysis process.
Long-term debt
Long-term debt
decreased
from
$2,102.4 million
at
December 31, 2016
, to
$2,075.8 million
at
December 31, 2017
,
a decrease
of $
26.6 million
. As of
December 31, 2017
, there was
zero
outstanding on the credit facility (at
December 31, 2016
:
$28.7 million
)
.
Liquidity and Capital Resources
Our capital structure, together with available cash balances, cash flows generated from operations, existing capacity under our credit facility and further capital market activities, if necessary, should provide us with sufficient resources to meet present and future cash needs, including operating, debt and other obligations as they come due and anticipated future capital requirements. Material changes in the company's capital structure over the last three years include:
2017:
During 2017, Invesco entered into a definitive agreement to acquire Guggenheim Investments' ETF business. The acquisition is expected to close in the second quarter of 2018 for an anticipated purchase price of $1.2 billion. The company expects approximately 80% of the purchase price will be funded through the use of the company’s existing credit facility with the remainder paid in cash. The company plans to repay the amount borrowed over the course of 2018, returning leverage ratios to pre-acquisition levels, through the curtailment of open market share repurchases. As such, the company has not repurchased common shares in the open market during 2017. Separately, on August 11, 2017 the company amended and restated the existing credit facility agreement increasing the borrowing limit to
$1.5 billion
and extending the expiration date to
August 11, 2022
.
On December 22, 2017, the 2017 Tax Act, was signed into law. The 2017 Tax Act, among other items, reduces the federal corporate tax rate from 35% to 21% effective January 1, 2018. Our intention is to use the additional cash flow generated from the lower tax rate first to reduce the anticipated future outstanding balance on the credit facility resulting from the Guggenheim acquisition. After the acquisition is complete and the credit facility balance is reduced, any residual excess will follow our capital management priorities.
2016
: During 2016, we repurchased
18.1 million
common sh
ares in open market transactions utilizing
$535.0 million
in cash under the company's board-approved open market share repurchase program.
2015
: During 2015, we repurchased 15.5 million common shares in open market transactions utilizing $548.8 million in cash under the company's board-approved open market share repurchase program. On October 14, 2015, the company completed the issuance of senior notes with aggregate principal amounts of $500 million at 3.750% due January 15, 2026. The proceeds were used, in part, to repay the outstanding balance on the credit facility at that date. Separately, on August 7, 2015, the company amended the existing $1.25 billion credit facility to extend its maturity to August 7, 2020.
Our capital management priorities have evolved with the growth and success of our business and include:
|
•
|
reinvestment in the business;
|
|
•
|
moderate annual growth of dividends (as further discussed in the "Dividends" section below);
|
|
•
|
share repurchase; and
|
|
•
|
target an approximat
e $1 billion cash b
uffer in excess of European regulatory and liquidity requirements.
|
These priorities are executed in a manner consistent with our desire to maintain a strong, investment-grade credit rating. As of the filing of this Report, Invesco held credit ratings of
A2/Stable, A/Negative and A-/Stable
from Moody's, S&P, and Fitch Ratings Fitch, respectively. Our ability to continue to access the capital markets in a timely manner depends on a number of factors, including our credit ratings, the condition of the global economy, investors’ willingness to purchase our securities, interest rates,
64
credit spreads and the valuation levels of equity markets. If we are unable to access capital markets in a timely manner, our business could be adversely impacted. See also Item
1A - "Ri
sk Factors," for more detailed discussion on reliance on credit ratings.
Certain of our subsidiaries are required to maintain minimum levels of capital. Such requirements may change from time-to-time as additional guidance is released based on a variety of factors, including balance sheet composition, assessment of risk exposures and governance, and review from regulators.
These and other similar provisions of applicable laws and regulations may have the effect of limiting withdrawals of capital, repayment of intercompany loans and payment of dividends by such entities. All of our regulated EU subsidiaries are subject to consolidated capital requirements under EU Directives, including those arising from the EU's Capital Requirements Directive and the U.K.'s Internal Capital Adequacy Assessment Process (ICAAP), and capital is maintained within this sub-group to satisfy these regulations. We meet these requirements in part by holding cash and cash equivalents. This retained cash can be used for general business purposes in the European sub-group in the countries where it is located. Due to the capital restrictions, the ability to transfer cash between certain jurisdictions may be limited. In addition, transfers of cash between international jurisdictions may have adverse tax consequences.
We are in compliance with all regulatory minimum net capital requirements. As of
December 31, 2017
, the company's minimum regulatory capital requirement was
$761.4 million
(
December 31, 2016
:
$590.8 million
); the increase was driven primarily by the European ETF business acquisition as well the strengthening of the Pound Sterling against the U.S. Dollar. The total amount of non-U.S. cash and cash equivalents was
$1,595.6 million
at
December 31, 2017
(
December 31, 2016
: $1,168.4 million).
In addition, the company is required to hold cash deposits with clearing organizations or to otherwise segregate cash to maintain compliance with federal and other regulations in connection with its UIT broker dealer entity. At
December 31, 2017
, these cash deposits totaled
$11.4 million
(
December 31, 2016
:
$11.4 million
).
The consolidation of
$6.3 billion
and
$4.8 billion
of total assets and long-term debt of CIP as of
December 31, 2017
, respectively, did not impact the company’s liquidity and capital resources. The majority of CIP balances related to consolidated CLOs.The collateral assets of the CLOs are held solely to satisfy the obligations of the CLOs. The company has no right to the benefits from, nor does it bear the risks associated with, the collateral assets held by the CLOs, beyond the company’s direct investments in, and management and performance fees generated from, these products, which are eliminated upon consolidation. If the company were to liquidate, the collateral assets would not be available to the general creditors of the company, and as a result, the company does not consider them to be company assets. Likewise, if the CLOs were to liquidate, their investors would have no recourse to the general credit of the company. The company therefore does not consider this debt to be an obligation of the company. See Item 8, Financial Statements and Supplementary Data - Note
19
, “
Consolidated Investment Products,” for additional details.
Cash Flows Discussion
The ability to consistently generate free cash flow from operations in excess of dividend payments, share repurchases, capital expenditures, and ongoing operating expenses is one of our company's fundamental financial strengths. Operations continue to be financed from current earnings and borrowings. Our principal uses of cash, other than for operating expenses, include dividend payments, capital expenditures, acquisitions, purchase of our shares in the open market and investments in certain new investment products.
Cash flows of CIP (discussed in Item 8, Financial Statements and Supplementary Data - Note
19
, “Consolidated Investment Products”) are reflected in Invesco's cash provided by or used in operating activities, investing activities and financing activities. Cash held by CIP is not available for general use by Invesco, nor is Invesco cash available for general use by its CIP. Accordingly, the table below presents the consolidated total cash flows of the company and separately presents the impact to the cash flows from CIP. The impact is illustrated in the tables immediately below by a column which shows the dollar-value change in the consolidated figures, as caused by the consolidation of CIP. For example, the impact of CIP on net cash provided by/(used in) operating activities for the year ended
December 31, 2017
reflects cash
used
of
$61.2 million
; however, this was not used as part of the company's corporate cash activities. Excluding the impact of CIP, cash
provided by
operations was
$1,431.9 million
for the year ended
December 31, 2017
.
Also as illustrated in the table below, the sum of the operating, investing and financing cash flows of CIP offsets to a zero impact to the company's change in cash and cash equivalent balances from period to period. The cash flows of CIP do not form part of the company’s cash flow management processes, nor do they form part of the company’s significant liquidity evaluations and decisions for the reasons noted. The discussion that follows the table focuses on the company’s cash flows.
65
Summary of Cash Flow Statement Impact of CIP
|
December 31, 2017
|
December 31, 2016
|
December 31, 2015
|
|||||||||||||||
|
$ in millions
|
Impact of CIP
|
Invesco Ltd. Consolidated
|
Impact of CIP
|
Invesco Ltd. Consolidated
|
Impact of CIP
|
Invesco Ltd. Consolidated
|
|||||||||||
|
Operating activities:
|
|||||||||||||||||
|
Net income/(loss)
|
36.0
|
|
1,161.0
|
|
17.1
|
|
868.3
|
|
(46.1
|
)
|
964.1
|
|
|||||
|
Adjustments to reconcile net income to net cash provided by/(used in) operating activities:
|
|||||||||||||||||
|
Amortization and depreciation
|
—
|
|
116.8
|
|
—
|
|
101.2
|
|
—
|
|
93.6
|
|
|||||
|
Share-based compensation expense
|
—
|
|
175.3
|
|
—
|
|
159.7
|
|
—
|
|
150.3
|
|
|||||
|
Other gains and losses, net
|
38.4
|
|
(39.4
|
)
|
1.9
|
|
(22.9
|
)
|
3.9
|
|
1.5
|
|
|||||
|
Other (gains)/losses of CSIP, net
|
—
|
|
—
|
|
—
|
|
—
|
|
—
|
|
0.8
|
|
|||||
|
Other (gains)/losses of CIP, net
|
(81.0
|
)
|
(81.0
|
)
|
(7.4
|
)
|
(7.4
|
)
|
37.0
|
|
37.0
|
|
|||||
|
Equity in earnings of unconsolidated affiliates
|
20.0
|
|
(44.7
|
)
|
8.9
|
|
(9.3
|
)
|
1.7
|
|
(35.1
|
)
|
|||||
|
Dividends from unconsolidated affiliates
|
—
|
|
2.8
|
|
—
|
|
17.6
|
|
—
|
|
18.7
|
|
|||||
|
Changes in operating assets and liabilities:
|
|||||||||||||||||
|
(Increase)/decrease in cash held by CIP
|
226.2
|
|
226.2
|
|
(509.4
|
)
|
(509.4
|
)
|
39.9
|
|
39.9
|
|
|||||
|
(Increase)/decrease in cash held by CSIP
|
—
|
|
—
|
|
—
|
|
—
|
|
—
|
|
(10.5
|
)
|
|||||
|
(Purchase)/sale of investments by CIP
|
(342.5
|
)
|
(342.5
|
)
|
(487.2
|
)
|
(487.2
|
)
|
—
|
|
—
|
|
|||||
|
(Purchase)/sale of trading investments, net
|
31.4
|
|
174.9
|
|
167.7
|
|
7.0
|
|
—
|
|
(159.0
|
)
|
|||||
|
(Increase)/decrease in receivables
|
(26.0
|
)
|
(3,419.4
|
)
|
116.6
|
|
(3,392.2
|
)
|
(17.0
|
)
|
(4,489.9
|
)
|
|||||
|
Increase/(decrease) in payables
|
36.3
|
|
3,440.7
|
|
(22.4
|
)
|
3,445.9
|
|
3.7
|
|
4,517.0
|
|
|||||
|
Net cash provided by/(used in) operating activities
|
(61.2
|
)
|
1,370.7
|
|
(714.2
|
)
|
171.3
|
|
23.1
|
|
1,128.4
|
|
|||||
|
Investing activities:
|
|||||||||||||||||
|
Purchase of property, equipment and software
|
—
|
|
(111.7
|
)
|
—
|
|
(147.7
|
)
|
—
|
|
(124.5
|
)
|
|||||
|
Purchase of available-for-sale investments
|
8.7
|
|
(7.9
|
)
|
10.1
|
|
(25.9
|
)
|
63.3
|
|
(44.9
|
)
|
|||||
|
Sale of available-for-sale investments
|
(16.2
|
)
|
79.5
|
|
(8.1
|
)
|
59.3
|
|
(62.3
|
)
|
51.1
|
|
|||||
|
Purchase of investments by CIP
|
(5,709.1
|
)
|
(5,709.1
|
)
|
(3,713.6
|
)
|
(3,713.6
|
)
|
(4,080.7
|
)
|
(4,080.7
|
)
|
|||||
|
Sale of investments by CIP
|
5,026.5
|
|
5,026.5
|
|
2,958.1
|
|
2,958.1
|
|
3,543.2
|
|
3,543.2
|
|
|||||
|
Purchase of investments by CSIP
|
—
|
|
—
|
|
—
|
|
—
|
|
—
|
|
(527.5
|
)
|
|||||
|
Sale of investments by CSIP
|
—
|
|
—
|
|
—
|
|
—
|
|
—
|
|
524.2
|
|
|||||
|
Purchase of other investments
|
76.5
|
|
(169.8
|
)
|
88.2
|
|
(125.4
|
)
|
1.7
|
|
(167.8
|
)
|
|||||
|
Sale of other investments
|
—
|
|
97.8
|
|
(65.0
|
)
|
87.9
|
|
—
|
|
111.6
|
|
|||||
|
Returns of capital and distributions from unconsolidated partnership investments
|
(71.5
|
)
|
132.8
|
|
(7.1
|
)
|
38.6
|
|
(0.5
|
)
|
50.5
|
|
|||||
|
Purchase of business
|
—
|
|
(299.2
|
)
|
—
|
|
(121.9
|
)
|
—
|
|
—
|
|
|||||
|
Net cash provided by/(used in) investing activities
|
(685.1
|
)
|
(961.1
|
)
|
(737.4
|
)
|
(990.6
|
)
|
(535.3
|
)
|
(664.8
|
)
|
|||||
|
Financing activities:
|
|||||||||||||||||
|
Proceeds from exercises of share options
|
—
|
|
—
|
|
—
|
|
—
|
|
—
|
|
3.7
|
|
|||||
|
Purchases of treasury shares
|
—
|
|
(63.8
|
)
|
—
|
|
(577.0
|
)
|
—
|
|
(623.7
|
)
|
|||||
|
Dividends paid
|
—
|
|
(471.6
|
)
|
—
|
|
(460.4
|
)
|
—
|
|
(454.5
|
)
|
|||||
|
Excess tax benefits from share-based compensation
|
—
|
|
—
|
|
—
|
|
(1.7
|
)
|
—
|
|
21.2
|
|
|||||
|
Third-party capital invested into CIP
|
449.4
|
|
449.4
|
|
386.7
|
|
386.7
|
|
113.5
|
|
113.5
|
|
|||||
|
Third-party capital distributed by CIP
|
(105.4
|
)
|
(105.4
|
)
|
(91.5
|
)
|
(91.5
|
)
|
(120.0
|
)
|
(120.0
|
)
|
|||||
|
Third-party capital invested into CSIP
|
—
|
|
—
|
|
—
|
|
—
|
|
—
|
|
31.2
|
|
|||||
|
Third-party capital distributed by CSIP
|
—
|
|
—
|
|
—
|
|
—
|
|
—
|
|
(25.9
|
)
|
|||||
|
Borrowings of debt of CIP
|
2,812.4
|
|
2,812.4
|
|
1,327.9
|
|
1,327.9
|
|
2,091.8
|
|
2,091.8
|
|
|||||
|
Repayments of debt of CIP
|
(2,410.1
|
)
|
(2,410.1
|
)
|
(171.5
|
)
|
(171.5
|
)
|
(1,573.1
|
)
|
(1,573.1
|
)
|
|||||
|
Net borrowings/(repayments) under credit facility
|
—
|
|
(28.7
|
)
|
—
|
|
28.7
|
|
—
|
|
—
|
|
|||||
|
Proceeds from issuance of senior notes
|
—
|
|
—
|
|
—
|
|
—
|
|
—
|
|
495.5
|
|
|||||
|
Payment of contingent consideration
|
—
|
|
(13.2
|
)
|
—
|
|
(13.1
|
)
|
—
|
|
(11.3
|
)
|
|||||
|
Net cash provided by/(used in) financing activities
|
746.3
|
|
169.0
|
|
1,451.6
|
|
428.1
|
|
512.2
|
|
(51.6
|
)
|
|||||
|
Increase/(decrease) in cash and cash equivalents
|
—
|
|
578.6
|
|
—
|
|
(391.2
|
)
|
—
|
|
412.0
|
|
|||||
|
Foreign exchange movement on cash and cash equivalents
|
—
|
|
99.8
|
|
—
|
|
(132.2
|
)
|
—
|
|
(74.8
|
)
|
|||||
|
Cash and cash equivalents, beginning of year
|
—
|
|
1,328.0
|
|
—
|
|
1,851.4
|
|
—
|
|
1,514.2
|
|
|||||
|
Cash and cash equivalents, end of year
|
—
|
|
2,006.4
|
|
—
|
|
1,328.0
|
|
—
|
|
1,851.4
|
|
|||||
66
Operating Activities
Operating cash flows include the receipt of investment management and other fees generated from AUM, offset by operating expenses and changes in operating assets and liabilities. In general, after allowing for the change in cash held by CIP, our operating cash flows move in the same direction as our operating income.
During
2017
, cash
provided by
operating activities
increased
$1,199.4 million
to
$1,370.7 million
from
$171.3 million
in
2016
. As shown in the tables above, the impact of CIP to cash provided by operating activities was
$61.2 million
of cash
used
during
2017
compared to
$714.2 million
of cash
used
during
2016
. Excluding the impact of CIP, cash provided by operations was
$1,431.9 million
in
2017
compared to
$885.5 million
in
2016
, an
increase
of
$546.4 million
. This increase is larger than the
$100.7 million
increase in operating income principally due to changes in operating assets and liabilities. Excluding the impact of CIP, the changes in operating assets and liabilities provided
$154.5 million
of cash in
2017
, as compared to utilizing
$201.2 million
in the same period in
2016
, increasing cash provided by operating activities by
$355.7 million
when comparing the two periods. This includes a $59.6 million reduction in payments for annual staff bonuses, related payroll taxes, payroll taxes on annual share award vestings, annual retirement plan contributions, and a
$304.2 million
decrease
in net purchases of trading investments. The increases in receivables and payables, excluding the impact of CIP, of
$3,393.4 million
and
$3,404.4 million
, respectively, include increases in our assets held for policyholders and policyholder payables, as discussed in Item 7, Management's Discussion and Analysis -- Balance Sheet Discussion -- "Assets Held for Policyholders and Policyholder Payables" of $3,260.6 million each. Excluding CIP, there were no significant non-cash items that impacted the comparison between the periods of operating income to net cash provided by operations.
During
2016
, cash
provided by
operating activities
decreased
$957.1 million
to
$171.3 million
from
$1,128.4 million
in
2015
. As shown in the tables above, the impact of CIP to cash
used
by operating activities was
$714.2 million
of cash
used
during
2016
compared to
$23.1 million
of cash
provided by
during
2015
. Excluding the impact of CIP, cash
provided by
operations was
$885.5 million
in
2016
compared to
$1,105.3 million
in
2015
, a decrease of
$219.8 million
. This decrease is larger than the
$182.0 million
decrease in operating income principally due to changes in operating assets and liabilities. Excluding the impact of CIP, the changes in operating assets and liabilities utilized
$201.2 million
of cash in
2016
, as compared to utilizing
$129.1 million
in the same period in
2015
, reducing cash provided by operating activities by
$72.1 million
when comparing the two periods. This includes a $27.0 million increase in additional payroll payments related to annual staff bonus, related payroll taxes, payroll taxes on annual share award vestings, and annual retirement plan contributions and a $1.7 million increase in net purchases of trading investments. The increases in receivables and payables, excluding the impact of CIP, of
$3,508.8 million
and
$3,468.3 million
, respectively, include increases in our assets held for policyholders and policyholder payables, as discussed in Item 7, Management's Discussion and Analysis -- Balance Sheet Discussion -- "Assets Held for Policyholders and Policyholder Payables" of $3,515.9 million each. Excluding CIP, there were no significant non-cash items that impacted the comparison between the periods of operating income to net cash provided by operations.
Investing Activities
Net cash
used in
investing activities totaled
$961.1 million
for the year ended
December 31, 2017
(
2016
: net cash
used
$990.6 million
). As shown in the tables above, the impact of CIP on investing activities, including investment purchases, sales and returns of capital, was
$685.1 million
cash
used
in 2017 (
2016
:
$737.4 million
cash
used
). Excluding the impact of CIP cash flows, net cash
used in
investing activities was
$276.0 million
(
2016
:
$253.2 million
cash
used
).
For the year ended
December 31, 2017
, excluding the impact of CIP, cash outflows include
$299.2 million
related to the purchase of the European ETF business (twelve months ended
December 31, 2016
:
$121.9 million
related to the purchases of Jemstep and the remaining interest in our Indian joint venture) and purchases of available-for-sale investments and other investments of
$262.9 million
(
2016
:
$249.6 million
). These outflows were partially offset by collected proceeds of
$397.8 million
from sales of available-for-sale and other investments combined with returns of capital and distributions from unconsolidated partnerships (
2016
:
$266.0 million
).
During the year ended
December 31, 2017
, the company had capital expenditures of
$111.7 million
(
2016
:
$147.7 million
). Our capital expenditures related principally in each period to technology initiatives, including enhancements to platforms from which we maintain our portfolio management systems and fund accounting systems, improvements in computer hardware and software desktop products for employees, new telecommunications products to enhance our internal information flow, and back-up disaster recovery systems. Also, in each period, a portion of these costs related to leasehold improvements made to the various buildings and workspaces used in our offices. These projects have been funded with proceeds from our operating cash flows.
67
Net cash
used in
investing activities totaled
$990.6 million
for the year ended
December 31, 2016
(
2015
: net cash
used
of
$664.8 million
). As shown in the tables above, CIP, including investment purchases, sales and returns of capital,
used
$737.4 million
(
2015
:
$535.3 million
used
). Excluding CIP cash flows, net cash used in investing activities was
$253.2 million
(
2015
: net cash
used
of
$129.5 million
). Cash outflows include purchases of available-for-sale investments and other investments of
$249.6 million
(
2015
:
$277.7 million
) and purchases of investments by CSIP of
$0.0 million
(
2015
:
$527.5 million
). These outflows were partially offset by collected proceeds of
$266.0 million
from sales of available-for-sale and other investments combined with returns of capital and distributions from unconsolidated partnerships (
2015
:
$276.0 million
). Cash outflows for
2016
also include the purchase of businesses in the amount of
$121.9 million
related to the Jemstep and India joint venture purchases.
Financing Activities
Net cash
provided by
financing activities totaled
$169.0 million
for the year ended
December 31, 2017
(
2016
: cash
provided
of
$428.1 million
). As shown in the tables above, the impact of CIP on financing activities
provided
cash of
$746.3 million
during the year (
2016
: cash
provided
of
$1,451.6 million
). Excluding the impact of CIP, financing activities
used
cash of
$577.3 million
in the year ended
December 31, 2017
(
2016
: cash used of
$1,023.5 million
).
Financing cash
outflows
during the year ended
December 31, 2017
included
$471.6 million
of dividend payments for the dividends declared in January, April, July and November
2017
(
2016
: dividends paid of
$460.4 million
), the payment of
$63.8 million
to meet employees' withholding tax obligations on share vestings (
2016
: $42.0 million), a repayment of the credit facility of
$28.7 million
and a payment of
$13.2 million
of contingent consideration related to the Deutsche Bank management contract purchase (
2016
:
$13.1 million
). Financing cash outflows during the twelve month ended
December 31, 2016
also included the purchase of shares through market transactions totaling $535.0 million and excess tax benefits from share-based compensation of
$1.7 million
.
Net cash
provided
by financing activities totaled
$428.1 million
for the year ended
December 31, 2016
(
2015
: cash
used
of
$51.6 million
). As shown in the tables above, the impact of CIP on financing activities
provided
cash of
$1,451.6 million
during the year (
2015
: cash
provided
of
$512.2 million
). Excluding the impact of CIP, financing activities
used
cash of
$1,023.5 million
in the year ended
December 31, 2016
(
2015
: cash
used
of
$563.8 million
).
Financing cash outflows during the year ended
December 31, 2016
included the purchase of shares through market transactions totaling $535.0 million (
2015
: $548.8 million), the payment of $42.0 million to meet employees' withholding tax obligations on share vestings (
2015
: $74.9 million),
$460.4 million
of dividend payments for the dividends declared in January, April, July and November 2016 (
2015
: dividends paid of
$454.5 million
), payment of
$13.1 million
of contingent consideration related to the Deutsche Bank management contract purchase (
2015
:
$11.3 million
) and excess tax benefits from shared-based compensation of
$1.7 million
(
2015
: inflow of
$21.2 million
). Other financing cash inflows in
2016
include a credit facility borrowing of
$28.7 million
.
Financing cash inflows in 2015 include cash proceeds of
$495.5 million
received upon the completion of the issuance of senior notes with aggregate principal amounts of $500 million at 3.75% due January 15, 2026, net cash of
$5.3 million
invested into CSIP by third-party investors and cash received from the exercise of options of
$3.7 million
.
Dividends
Invesco declares and pays dividends on a quarterly basis in arrears. The
2017
quarterly dividend was
$0.29
per Invesco Ltd. common share. On
January 31, 2018
, the company declared a fourth quarter
2017
cash dividend, which will be paid on
March 2, 2018
, to shareholders of record as of
February 15, 2018
with an ex-dividend date of
February 14, 2018
. The total dividend attributable to the
2017
fiscal year of
$1.16
per share represented a
3.6%
increase over the total dividend attributable to the
2016
fiscal year of
$1.12
per share.
The declaration, payment and amount of any future dividends will be declared by our Board of Directors and will depend upon, among other factors, our earnings, financial condition and capital requirements at the time such declaration and payment are considered. The Board has a policy of managing dividends in a prudent fashion, with due consideration given to profit levels, overall debt levels, and historical dividend payouts.
68
Share Repurchase Plan
The company did not purchase shares in the open market during the year ended
December 31, 2017
(year ended
December 31, 2016
:
18.1 million
shares at a cost of
$535.0 million
). The company did withhold an aggregate of
1.9 million
shares on vesting events during the year ended
December 31, 2017
to meet employees' withholding tax obligations (
December 31, 2016
:
1.5 million
). The fair value of these shares withheld at the respective withholding dates was
$63.8 million
(
December 31, 2016
:
$42.0 million
). At
December 31, 2017
, approximately
$1,643.0 million
remained authorized under the company's share repurchase authorizations approved by the Board on October 11, 2013 and July 22, 2016 (
December 31, 2016
:
$1,643.0 million
).
The carrying value of our long-term debt at
December 31, 2017
was $
2,075.8 million
(
December 31, 2016
: $
2,102.4 million
) and was comprised of the following:
|
$ in millions
|
December 31, 2017
|
December 31, 2016
|
|||
|
Floating rate credit facility expiring August 11, 2022
|
—
|
|
28.7
|
|
|
|
Unsecured Senior Notes:
|
|||||
|
$600 million 3.125% - due November 30, 2022
|
596.9
|
|
596.3
|
|
|
|
$600 million 4.000% - due January 30, 2024
|
594.0
|
|
593.2
|
|
|
|
$500 million 3.750% -- due January 15, 2026
|
495.1
|
|
494.5
|
|
|
|
$400 million 5.375% - due November 30, 2043
|
389.8
|
|
389.7
|
|
|
|
Long-term debt
|
2,075.8
|
|
2,102.4
|
|
|
For the year ended
December 31, 2017
, the company's weighted average cost of debt was
3.94%
(year ended
December 31, 2016
:
3.95%
).
The unsecured $1.5 billion credit agreement is scheduled to expire on August 11, 2022. Financial covenants under the credit agreement include: (i) the quarterly maintenance of a debt/EBITDA leverage ratio, as defined in the credit agreement, of not greater than
3.25
:
1.00
, (ii) a coverage ratio (EBITDA, as defined in the credit agreement/interest payable for the four consecutive fiscal quarters ended before the date of determination) of not less than
4.00
:
1.00
. As of
December 31, 2017
, we were in compliance with our financial covenants. At
December 31, 2017
, our leverage ratio was
1.18
:1.00 (
December 31, 2016
:
1.35
:1.00)
, and our interest coverage ratio was
18.64
:1.00 (
December 31, 2016
:
16.69
:1.00).
The
December 31, 2017
and
2016
coverage ratio calculations are as follows:
|
Last four quarters ended
|
|||||||
|
$ millions
|
December 31, 2017
|
December 31, 2016
|
|||||
|
Net income attributable to Invesco Ltd.
|
1,127.3
|
|
854.2
|
|
|||
|
Impact of CIP on net income attributable to Invesco Ltd.
|
(2.3
|
)
|
(3.0
|
)
|
|||
|
Tax expense
|
268.2
|
|
338.3
|
|
|||
|
Amortization/depreciation
|
116.8
|
|
101.2
|
|
|||
|
Interest expense
|
94.8
|
|
93.4
|
|
|||
|
Share-based compensation expense
|
175.3
|
|
159.7
|
|
|||
|
Unrealized (gains)/losses from investments, net
*
|
(13.4
|
)
|
15.1
|
|
|||
|
EBITDA
**
|
1,766.7
|
|
1,558.9
|
|
|||
|
Adjusted debt
**
|
|
$2,086.4
|
|
|
$2,111.9
|
|
|
|
Leverage ratio (Debt/EBITDA - maximum 3.25:1.00)
|
1.18
|
|
1.35
|
|
|||
|
Interest coverage (EBITDA/Interest Expense - minimum 4.00:1.00)
|
18.64
|
|
16.69
|
|
|||
____________
|
*
|
Adjustments for unrealized gains and losses from investments, as defined in our credit facility, may also include non-cash gains and losses on investments to the extent that they do not represent anticipated future cash receipts or expenditures.
|
69
|
**
|
EBITDA and Adjusted debt are non-GAAP financial measures; however management does not use these measures for anything other than these debt covenant calculations. The calculation of EBITDA above (a reconciliation from net income attributable to Invesco Ltd.) is defined by our credit agreement, and therefore net income attributable to Invesco Ltd. is the most appropriate GAAP measure from which to reconcile to EBITDA. The calculation of Adjusted debt is defined in our credit facility and equals total debt of
$2,075.8 million
plus
$10.6 million
in letters of credit.
|
The discussion that follows identifies risks associated with the company's liquidity and capital resources. The Item 1. Business -- Risk Management section contains a broader discussion of the company's overall approach to risk management.
Credit and Liquidity Risk
Capital management involves the management of the company's liquidity and cash flows. The company manages its capital by reviewing annual and projected cash flow forecasts and by monitoring credit, liquidity and market risks, such as interest rate and foreign currency risks (as discussed in Item 7A, “Quantitative and Qualitative Disclosures About Market Risk”), through measurement and analysis. The company is primarily exposed to credit risk through its cash and cash equivalent deposits, which are held by external firms. The company invests its cash balances in its own institutional money market products, as well as with external high credit-quality financial institutions. These arrangements create exposure to concentrations of credit risk.
Credit Risk
Credit risk is the risk that one party to a financial instrument will cause a financial loss for the other party by failing to meet an obligation. All cash and cash equivalent balances are subject to credit risk, as they represent deposits made by the company with external banks and other institutions. As of
December 31, 2017
, our maximum exposure to credit risk related to our cash and cash equivalent balances is
$2,006.4 million
. See Item 8, Financial Statements and Supplementary Data - No
te
20
, “R
elated Parties,” for information regarding cash and cash equivalents invested in affiliated money market funds.
The company does not utilize credit derivatives or similar instruments to mitigate the maximum exposure to credit risk. The company does not expect any counterparties to its financial instruments to fail to meet their obligations.
Liquidity Risk
Liquidity risk is the risk that the company will encounter difficulty in meeting obligations associated with its financial liabilities as the same become due. The company is exposed to liquidity risk through its
$2,075.8 million
in total debt. The company actively manages liquidity risk by preparing cash flow forecasts for future periods, reviewing them regularly with senior management, maintaining a committed credit facility, scheduling significant gaps between major debt maturities and engaging external financing sources in regular dialogue.
Effects of Inflation
Inflation can impact our organization primarily in two ways. First, inflationary pressures can result in increases in our cost structure, especially to the extent that large expense components such as compensation are impacted. To the degree that these expense increases are not recoverable or cannot be counterbalanced through pricing increases due to the competitive environment, our profitability could be negatively impacted. Secondly, the value of the assets that we manage may be negatively impacted when inflationary expectations result in a rising interest rate environment. Declines in the values of these AUM could lead to reduced revenues as management fees are generally calculated based upon the size of AUM.
Off Balance Sheet Commitments
See Item 8, Financial Statements and Supplementary Data - Note
18
, “Commitments and Contingencies - Off Balance Sheet Commitments,” for more information regarding undrawn capital commitments.
70
Contractual Obligations
We have various financial obligations that require future cash payments. The following table outlines the timing of payment requirements related to our commitments as of
December 31, 2017
:
|
$ in millions
|
Total
(4,5,6)
|
Within 1 Year
|
1-3 Years
|
3-5 Years
|
More Than 5 Years
|
|||||||||
|
Long-term debt
(1)
|
2,075.8
|
|
—
|
|
—
|
|
596.9
|
|
1,478.9
|
|
||||
|
Estimated interest payments on long-term debt
(1)
|
992.3
|
|
83.0
|
|
166.0
|
|
166.0
|
|
577.3
|
|
||||
|
Operating leases
(2)
|
364.5
|
|
59.7
|
|
115.2
|
|
99.2
|
|
90.4
|
|
||||
|
Purchase obligations
(3)
|
333.8
|
|
134.4
|
|
99.5
|
|
49.0
|
|
50.9
|
|
||||
|
Total
|
3,766.4
|
|
277.1
|
|
380.7
|
|
911.1
|
|
2,197.5
|
|
||||
____________
|
(1)
|
Long-term debt includes
$2,075.8 million
of fixed rate debt. Fixed interest payments are reflected in the table above in the periods they are due, and include any issuance discounts. The table above includes the company's debt; debt of CIP is excluded from the table above, as the company is not obligated for these amounts. See Item 8, Financial Statements and Supplementary Data - Note
19
, “Consolidated Investment Products," for additional information.
|
|
(2)
|
Operating leases reflect obligations for leased building space and other assets. See Item 8, Financial Statements and Supplementary Data - Note
13
, “Operating Leases” for sublease information.
|
|
(3)
|
In the ordinary course of business, Invesco enters into contracts or purchase obligations with third parties whereby the third parties provide services to or on behalf of Invesco. Purchase obligations included in the contractual obligations table above represent fixed-price contracts, which are either non-cancelable or cancelable with a penalty. At
December 31, 2017
, the company's obligations primarily reflect standard service contracts for portfolio, market data, office-related services and third-party marketing and promotional services. In addition, the company is a party to certain variable-price contractual arrangements (e.g. contingent future payments based on AUM levels, number of accounts, transaction volume, etc.) for which the company is reimbursed by affiliated funds and as such are not included in the table above. Purchase obligations are recorded as liabilities in the company's Consolidated Financial Statements when services are provided. Purchase obligations also include contingent consideration liabilities.
|
|
(4)
|
The company has capital commitments into co-invested funds that are to be drawn down over the life of the partnership as investment opportunities are identified. At
December 31, 2017
, the company's undrawn capital and purchase commitments were
$292.8 million
. These are not included in the above table. See Item 8, Financial Statements and Supplementary Data - Note
18
, “Commitments and Contingencies” for additional details.
|
|
(5)
|
Due to the uncertainty with respect to the timing of future cash flows associated with unrecognized tax benefits at
December 31, 2017
, the company is unable to make reasonably reliable estimates of the period of cash settlement with the respective taxing authorities. Therefore,
$19.6 million
of gross unrecognized tax benefits have been excluded from the contractual obligations table above. See Item 8, Financial Statements and Supplementary Data, Note
15
- “Taxation” for a discussion regarding income taxes.
|
|
(6)
|
In addition to the contractual obligations in the table above, we periodically make contributions to defined benefit pension plans. For the years ended
December 31, 2017
and
2016
we contributed
$11.8 million
and
$14.2 million
, respectively, to these plans. In 2018, we expect to contribute
$24.5 million
to our defined benefit pension plans. See Item 8, Financial Statements and Supplementary Data - Note
12
, “Retirement Benefit Plans” for detailed benefit pension plan information. The company has various other compensation and benefit obligations, including bonuses, commissions and incentive payments payable, defined contribution plan matching contribution obligations, and deferred compensation arrangements, that are excluded from the table above.
|
71
Critical Accounting Policies and Estimates
Our significant accounting policies are disclosed in Item 8, Financial Statements and Supplementary Data - Note
1
, “Accounting Policies." The accounting policies and estimates that we believe are the most critical to an understanding of our results of operations and financial condition are those that require complex management judgment regarding matters that are highly uncertain at the time policies were applied and estimates were made. These accounting policies and estimates are discussed below; however, the additional accounting policy detail in the footnote previously referenced is important to the discussion of each of the topics. Different estimates reasonably could have been used in the current period that would have had a material effect on these Consolidated Financial Statements, and changes in these estimates are likely to occur from period-to-period in the future.
Taxation
We operate in several countries and several states and other taxing jurisdictions through our various subsidiaries, and must allocate our income, expenses, and earnings under the various laws and regulations of each of these taxing jurisdictions. Accordingly, our provision for income taxes represents our total estimate of the liability that we have incurred for doing business each year in all of our locations. Annually we file tax returns that represent our filing positions within each jurisdiction and settle our return liabilities. Each jurisdiction has the right to audit those returns and may take different positions with respect to income and expense allocations and taxable earnings determinations. Because the determinations of our annual provisions are subject to judgments and estimates, it is possible that actual results will vary from those recognized in our Consolidated Financial Statements. As a result, it is likely that additions to, or reductions of, income tax expense will occur each year for prior reporting periods as actual tax returns and tax audits are settled.
Deferred tax assets, net of any associated valuation allowance, have been recognized based on management's belief that taxable income of the appropriate character, more likely than not, will be sufficient to realize the benefits of these assets over time. In the event that actual results differ from our expectations, or if our historical trends of positive operating income changes, we may be required to record a valuation allowance on some or all of these deferred tax assets, which may have a significant effect on our financial condition and results of operations. In assessing whether a valuation allowance should be established against a deferred income tax asset, the company considers the nature, frequency and severity of recent losses, forecasts of future profitability, the duration of statutory carry back and carry forward periods, among other factors.
The company utilizes a specific recognition threshold and measurement attribute for the Consolidated Financial Statement recognition and measurement of a tax position taken or expected to be taken in a tax return. The prescribed two-step process for evaluating a tax position involves first determining whether it is more likely than not that a tax position will be sustained upon examination by the appropriate taxing authorities. If it is, the second step then requires a company to measure this tax position benefit as the largest amount of benefit that is greater than 50 percent likely of being realized upon ultimate settlement. The company recognizes any interest and penalties related to unrecognized tax benefits on the Consolidated Statements of Income as components of income tax expense.
The company recognized a provisional income tax benefit of
$130.7 million
which is included as a component of the provision for income taxes related to the 2017 Tax Act. See also Item 8, Financial Statements and Supplementary Data - in Note
15
, "Taxation," for further details and additional discussion on estimated amounts recorded as of December 31, 2017 for the 2017 Tax Act.
Goodwill
Our goodwill impairment testing conducted during
2017
and
2016
indicated that the fair value of the reporting unit exceeded its carrying value, indicating that step two of the goodwill impairment test was not necessary; however, the company cannot predict the occurrence of future events that might adversely affect the reported value of goodwill that totaled
$6,590.7 million
and
$6,129.2 million
at
December 31, 2017
and
December 31, 2016
, respectively. Such events include, but are not limited to, strategic decisions made in response to economic and competitive conditions, the impact of the economic environment on the company's AUM, or any other material negative change in AUM and related management fees.
The October 1,
2017
annual goodwill impairment test was performed using a consistent methodology to that used for the
2016
annual impairment test. Fair value of the reporting unit is generally determined using an income approach where estimated future cash flows are discounted to arrive at a single present value amount. The income approach includes inputs that require significant management judgment, including AUM growth rates, product mix, effective fee rates, pre-tax profit margins, effective tax rates and discount rates. The
2017
annual goodwill impairment test includes assumptions updated for current market conditions, including the company's updated forecasts for changes in AUM due to market gains and long-term net flows and the corresponding changes in revenue and expenses. Market gains are based upon historical returns of the S&P 500 index, treasury bond returns and treasury bill returns, as applicable to the company's AUM mix on the testing date. The most sensitive of these assumptions are the estimated cash flows and the use of a weighted average cost of capital as the discount rate to determine present value. The most significant
72
change in assumptions from
2016
related to a change in cost of equity, which resulted in a discount rate of 11.68% for the October 1,
2017
analysis (
2016
: 13.0%).
The discount rates used are estimates of the weighted average cost of capital for the investment management sector reflecting the overall industry risks associated with future cash flows and have been calculated consistently from period to period. While the company believes all assumptions utilized in our assessment are reasonable and appropriate, changes in these estimates could produce different fair value amounts and therefore different goodwill impairment assessments.
Intangible Assets
Where evidence exists that the underlying arrangements have a high likelihood of continued renewal at little or no cost to the company, the intangible asset is assigned an indefinite life and reviewed for impairment on an annual basis. Definite-lived intangible assets are reviewed for impairment whenever events or changes in circumstances indicate that their carrying amount may not be recoverable (i.e. the carrying amount exceeds the fair value of the intangible asset). In addition, management's judgment is required to estimate the period over which definite-lived intangible assets will contribute to the company's cash flows and the pattern in which these assets will be consumed. A change in the remaining useful life of any of these assets, or the reclassification of an indefinite-lived intangible asset to a definite-lived intangible asset, could have a significant impact on the company's amortization expense, which was
$17.4 million
,
$13.9 million
and
$10.6 million
for the years ended December 31,
2017
,
2016
and
2015
, respectively.
Intangible assets not subject to amortization are tested for impairment annually as of October 1 or more frequently if events or changes in circumstances indicate that the asset might be impaired. The impairment test consists of a comparison of the fair value of an intangible asset with its carrying amount. If the carrying amount of the intangible asset exceeds its fair value, an impairment loss is recognized in an amount equal to that excess. Fair value is generally determined using an income approach where estimated future cash flows are discounted to arrive at a single present value amount. The income approach includes inputs that require significant management judgment, including AUM growth rates, product mix, effective fee rates, pre-tax profit margins, effective tax rates and discount rates. The most relevant of these assumptions to the determination of the estimated fair value are the AUM growth rate and discount rate, which is a weighted average cost of capital including consideration of company size premiums. Changes in these estimates could produce different fair value amounts and therefore different impairment conclusions. In
2017
and
2016
, annual impairment reviews of indefinite-lived intangible assets determined that no impairment existed at the respective review dates, the classifications of indefinite-lived and definite-lived remain appropriate, and no changes to the expected lives of the definite-lived intangible assets were required.
Investments
A significant portion of our investments are carried at fair value on our balance sheet with the periodic mark-to-market recorded either in accumulated other comprehensive income in the case of available-for-sale investments, or directly to earnings, in the case of trading assets. Since assumptions are made in determining the fair values of investments for which active markets do not exist, the actual value that may be realized upon the sale or other disposition of these investments could differ from the current carrying values. Fair value calculations are also required in association with our quarterly impairment testing of investments. The accuracy of our other-than-temporary impairment assessments is dependent upon the extent to which we are able to accurately determine fair values. Seed money investments are held in Invesco managed funds with the purpose of providing capital to the funds during their development periods. These investments are recorded at fair value using quoted market prices in active markets; there is no modeling or additional information needed to arrive at the fair values of these investments.
The value of investments may decline for various reasons. The market price may be affected by general market conditions which reflect prospects for the economy as a whole or by specific information pertaining to an industry or individual company. Such declines require further investigation by management, which considers all available evidence to evaluate the realizable value of the investment, including, but not limited to, the following factors:
|
•
|
The probability that the company will be unable to collect all amounts due according to the contractual terms of a debt security not impaired at acquisition;
|
|
•
|
The length of time and the extent to which the market value has been less than cost;
|
|
•
|
The financial condition and near-term prospects of the issuer, including any specific events which may influence the operations of the issuer;
|
|
•
|
The intent and ability of the company to retain its investment in the issuer for a period of time sufficient to allow for any anticipated recovery in market value;
|
|
•
|
The decline in the security's value due to an increase in market interest rates or a change in foreign exchange rates since acquisition;
|
|
•
|
Determination that the security is not realizable; or
|
73
|
•
|
An adverse change in estimated cash flows of a beneficial interest.
|
Our other-than-temporary impairment analysis of available for sale seed money holdings includes a review of the market returns required for each fund portfolio to enable us to recover our original investment. As part of the review, we analyze the absolute amount of any loss to date, the trend of the losses, and percent declines in values of the seed money investments. Along with intent and ability to hold, all of these scenarios are considered as part of our other-than-temporary impairment analysis of seed money holdings.
We also assess our equity method and other investments for impairment. If circumstances indicate that impairment may exist, a more detailed impairment analysis is performed which includes assessing many of the factors listed above.
CIP
Assessing if an entity is a variable interest entity (VIE) or voting interest entity (VOE) involves judgment and analysis on a structure-by-structure basis. Factors included in this assessment include the legal organization of the entity, the company's contractual involvement with the entity and any related party or de facto agent implications of the company's involvement with the entity. A VIE, in the context of the company and its managed funds, is a fund that does not have sufficient equity to finance its operations without additional subordinated financial support, or a fund for which the risks and rewards of ownership are not directly linked to voting interests. If the company is deemed to have the power to direct the activities of the fund that most significantly impact the fund's economic performance, and the obligation to absorb losses/right to receive benefits from the fund that could potentially be significant to the fund, then the company is deemed to be the fund's primary beneficiary and is required to consolidate the fund.
Determining if the company is the primary beneficiary of a VIE also requires significant judgment judgment involved to assess if the company has the power to direct the activities that most significantly affect the fund's economic results and to assess if the company's interests could be deemed significant. If current financial statements are not available for consolidated VIEs or VOEs, estimation of investment valuation is required, which includes assessing available quantitative and qualitative data. Significant changes in these estimates could impact the reported value of the investments held by CIP and the related offsetting equity attributable to noncontrolling interests in consolidated entities on the Consolidated Balance Sheets and the other gains and losses of CIP, net, and related offsetting gains and losses attributable to noncontrolling interests in consolidated entities, net, amounts on the Consolidated Statements of Income.
As of
December 31, 2017
, the company consolidated VIEs that held investments of
$5,658.0 million
(
December 31, 2016
:
$5,066.3 million
). As of
December 31, 2016
the company consolidated VOEs that held fund investments of $49.8 million
. As circumstances supporting estimates and factors change, the determination of VIE and primary beneficiary status may change, as could the determination of the necessity of consolidation of VOEs. Estimation is involved when determining investment and debt valuation for certain CIP; however, changes in the fair values of these amounts are largely offset by noncontrolling interests.
Contingencies
Contingencies arise when we have a present obligation as a result of a past event that is both probable and reasonably estimable. We must from time to time make material estimates with respect to legal and other contingencies. The nature of our business requires compliance with various laws and regulations, as well as various contractual obligations, and exposes us to a variety of legal proceedings and matters in the ordinary course of business. While the outcomes of matters such as these are inherently uncertain and difficult to predict, we maintain reserves reflected in accounts payable and accrued expenses, as appropriate, for identified losses that are, in our judgment, probable and reasonably estimable. We expense any related legal fees as they are incurred. Management's judgment is based on the advice of legal counsel, ruling on various motions by the applicable court, review of the outcome of similar matters, if applicable, and review of guidance from governmental and other regulatory authorities, if applicable. Contingent consideration payable in relation to a business acquisition is recorded as of the acquisition date as part of the fair value transferred in exchange for the acquired business.
Recent Accounting Standards
See Item 8, Financial Statements and Supplementary Data - Note
1
, “Accounting Policies - Accounting Pronouncements Recently Adopted and Pending Accounting Pronouncements.”
74
Item 7A.
Quantitative and Qualitative Disclosures About Market Risk
In the normal course of its business, the company is primarily exposed to market risk in the form of AUM market price risk, securities market risk, interest rate risk, and foreign exchange rate risk.
AUM Market Price Risk
The company's investment management revenues are comprised of fees based on the value of AUM. Declines in the market prices of equity and fixed income securities, commodities and derivatives, or other similar financial instruments held in client portfolios could cause revenues to decline because of lower investment management fees by:
|
•
|
Causing the value of AUM to decrease.
|
|
•
|
Causing the returns realized on AUM to decrease (impacting performance fees).
|
|
•
|
Causing clients to withdraw funds in favor of investments in markets that they perceive to offer greater opportunity and that the company does not serve.
|
|
•
|
Causing clients to rebalance assets away from investments that the company manages into investments that the company does not manage.
|
|
•
|
Causing clients to reallocate assets away from products that earn higher revenues into products that earn lower revenues.
|
Underperformance of client accounts relative to competing products could exacerbate these factors.
Assuming the revenue yield on AUM for the year remains unchanged, a 10% decline in the average AUM for the year would result in a corresponding decline in revenue. Certain expenses, including distribution and compensation expenses, may not vary in proportion with the changes in the market value of AUM. As such, the impact on operating margin or net income of a decline in the market values of AUM may be greater or less than the percentage decline in the market value of AUM.
Securities Market Risk
The company's exposure to market risk from financial instruments measured at fair value arises from its investments and also from its contingent consideration liability. The following table summarizes the impact of a 10% increase or decrease in the fair values or the market inputs contributing to the fair value of these financial instruments:
|
December 31, 2017
|
||||||||
|
$ in millions
|
Fair Value
|
Fair Value assuming 10% increase
|
Fair Value assuming 10% decrease
|
|||||
|
Available-for-sale investments
(a)
|
85.2
|
|
93.7
|
|
76.7
|
|
||
|
Trading investments
(b)
|
277.3
|
|
305.0
|
|
249.6
|
|
||
|
Total assets measured at fair value exposed to market risk
|
362.5
|
|
398.7
|
|
326.3
|
|
||
|
Direct investments in CIP
(c)
|
500.5
|
|
550.6
|
|
450.5
|
|
||
|
Contingent consideration liability
(d)
|
(57.4
|
)
|
(63.1
|
)
|
(51.7
|
)
|
||
____________
|
a.
|
Accounting Standards Update 2016-01, "Financial Instruments - Overall: Recognition and Measurement of Financial Assets and Financial Liabilities" is effective for the company January 1, 2018 and requires that all changes in the fair value of equity investments, other than those accounted for as equity method investments, be recognized in earnings. As such, if a 10% increase or decrease in the fair value of available-for-sale equity investments were to occur, the change attributable to
$69.3 million
of available-for-sale investments would result in a corresponding increase or decrease to our pre-tax earnings.
|
Any gains or losses arising from changes in the fair value of available-for-sale debt securities are recognized in accumulated other comprehensive income, net of tax, until the debt security is sold or otherwise disposed of, or if the debt security is determined to be other-than-temporarily impaired, at which time the cumulative gain or loss previously reported in equity is included in income. The company evaluates the carrying value of debt securities for impairment on a quarterly basis. In its impairment analysis, the company takes into consideration numerous criteria, including the duration and extent of any decline
75
in fair value, and the intent and ability of the company to hold the security for a period of time sufficient for a recovery in value. If the decline in value is determined to be other-than-temporary, the carrying value of the security is generally written down to fair value through the Consolidated Statement of Income. If such a 10% decrease in fair values were to occur, it would not result in an other-than-temporary impairment charge that would be material to our pre-tax earnings.
|
b.
|
If such a 10% increase or decrease in fair values were to occur, the change attributable to
$277.3 million
of these trading investments would result in a corresponding increase or decrease in our pre-tax earnings. At
December 31, 2017
,
$92.3 million
of these trading investments are held to hedge economically certain deferred compensation plans in which the company participates. The company recognizes as compensation expense the appreciation or depreciation of the compensation liability over the award's vesting period in proportion to the vested amount of the award. The company immediately recognizes the appreciation or depreciation of these investments, which is included in other gains and losses. This creates a timing difference between the recognition of the compensation expense and the investment gain or loss impacting net income, which will reverse and will offset to zero over the life of the award at the end of the multi-year vesting period.
|
|
c.
|
These represent Invesco’s direct investments in investment products that are consolidated. Upon consolidation, these direct investments are eliminated, and the assets and liabilities of the CIP are consolidated in the Consolidated Balance Sheet, together with a noncontrolling interest balance representing the portion of the CIP owned by third parties. If a 10% increase or decrease in the fair values of Invesco’s direct investments in CIP were to occur, it would result in a corresponding increase or decrease in our net income attributable to Invesco Ltd.
|
|
d.
|
During 2015, the company acquired investment management contracts from Deutsche Bank. This liability represents the purchase price, which was comprised solely of contingent consideration payable in future periods and is linked to future revenues generated from the contracts. The contingent consideration liability was recorded at fair value at the acquisition date and subsequent changes in the fair value are recorded in Other gains and losses, net in the Consolidated Statements of Income. If a 10% increase or decrease in the fair value of the contingent consideration liability were to occur, it would result in a corresponding increase or decrease in our net income attributable to Invesco Ltd.
|
Cash balances invested in money market funds of
$875.5 million
have been excluded from the table above. These are valued under the market approach at the net asset value of the underlying funds, which is maintained at $1. Assets held for policyholders of
$12,444.5 million
have also been excluded from the table above. The entity holds assets that are managed for its clients on its balance sheet with an equal and offsetting liability to the policyholders, which is linked to the value of the investments. The investments and the policyholder payables held by this business are carried in the Consolidated Balance Sheets as separate account assets and liabilities at fair value in accordance with ASC Topic 944, “Financial Services - Insurance.” Changes in fair value are recorded and offset to zero in the Consolidated Statements of Income in other operating revenues. Increases or decreases in the fair value of these investments will therefore have no impact to our pre-tax earnings.
Interest Rate Risk
Interest rate risk relates to the risk that the fair value of future cash flows of a financial instrument will fluctuate because of changes in market interest rates. The company is exposed to interest rate risk primarily through its external debt and cash and cash equivalent investments. On
December 31, 2017
, the interest rates on
100.0%
of the company's borrowings were fixed for a weighted average period of
9.9
years, and the company had a zero balance on its floating rate credit facility.
The interest rate profile of the financial liabilities of the company on
December 31
was:
|
$ in millions
|
December 31, 2017
|
December 31, 2016
|
|||
|
Long-term debt
|
|||||
|
Fixed rate
|
2,075.8
|
|
2,073.7
|
|
|
|
Floating rate
|
—
|
|
28.7
|
|
|
|
Total
|
2,075.8
|
|
2,102.4
|
|
|
|
Weighted average interest rate percentage
|
3.9
|
%
|
4.0
|
%
|
|
|
Weighted average period for which rate is fixed in years
|
9.9
|
|
11.0
|
|
|
See Item 8, Financial Statements and Supplementary Data, Note
8
, “ Long-Term Debt” for additional disclosures relating to the U.S. Dollar floating and fixed rate obligations.
76
The company's fixed interest financial assets at
December 31, 2017
, include foreign time deposit investments of
$28.6 million
(
2016
:
$26.9 million
). The weighted average interest rate on these investments is
0.39%
(
2016
:
0.30%
) and the weighted average time for which the rate is fixed is
0.1
years (
2016
:
0.2
years).
Foreign Exchange Rate Risk
The company has transactional currency exposures that occur when any of the company’s subsidiaries receive or pay cash in a currency different from its functional currency. Such exposure arises from sales or purchases by operating subsidiaries in currencies other than the subsidiaries’ functional currencies. These exposures are not actively managed.
The company also has certain investments in foreign operations, whose net assets and results of operations are exposed to foreign currency translation risk when translated into U.S. Dollars upon consolidation into Invesco Ltd. A strengthening U.S. Dollar has a negative impact on the company's foreign currency denominated earnings when presented in U.S. Dollars. The company's most significant foreign exchange rate risk exposure relates to the translation of Pound Sterling-denominated transactions into the U.S. Dollar reporting currency. Item 8, Financial Statements and Supplementary Data, Note
17
, "Geographic Information," contains disclosure of revenue from external customers by geography. The disclosure of revenues from external customers earned in the U.K. is an indicator of the company's exposure to the Pound Sterling; however, expenses incurred in the U.K. provide a natural offset to the company's exposure to the Pound Sterling.
Given this exposure, in 2017 the company continued to hedge this risk through out-of-the money put option contracts to hedge economically the foreign currency risk on the translation of its Euro-denominated earnings into U.S. Dollars though the end of 2017 and during the second quarter extended its hedge of the Pound Sterling-denominated earnings into U.S. Dollars through December 31, 2018. These programs may serve to reduce, but not fully eliminate the impact of Pound Sterling and Euro foreign currency risk and the impact on our Consolidated Income Statements. The Pound Sterling/U.S. Dollar contracts have a strike price set at $1.2500 based on the average daily foreign exchange rates for the applicable time period. At December 31, 2017, the fair value of the company's open put option contracts was
$0.8 million
. Other than the fair value of the put option contracts, there is no additional loss exposure to the company, only the potential for a gain should the average exchange rates fall below the strike levels during the hedged periods. At December 31, 2017, a 10% decline in the annual average Pound Sterling to U.S. Dollar exchange rate would result in a positive cash flow from the Pound Sterling/U.S. Dollar contracts of $6.1 million.
The company is exposed to foreign exchange revaluation into the Consolidated Statements of Income on monetary assets and liabilities that are held by subsidiaries in different functional currencies than the subsidiaries' functional currencies. Net foreign exchange revaluation
gains
were
$15.7 million
in
2017
(
2016
:
$5.3 million
of losses), and are included in general and administrative expenses and other gains and losses, net on the Consolidated Statements of Income. We continue to monitor our exposure to foreign exchange revaluation and have put in place net investment hedge structures discussed in Part II, Item 8, Financial Statements, Note
10
--"Other Comprehensive Income/(Loss)."
77
Supplementary Quarterly Financial Data
The following is selected unaudited consolidated data for Invesco Ltd. for the quarters indicated:
|
2017
|
2016
|
||||||||||||||||||||||||||||||
|
$ in millions, except per share data
|
Q4
|
Q3
|
Q2
|
Q1
|
Q4
|
Q3
|
Q2
|
Q1
|
|||||||||||||||||||||||
|
Operating revenues:
|
|||||||||||||||||||||||||||||||
|
Investment management fees
|
1,098.7
|
|
1,062.3
|
|
1,010.4
|
|
955.2
|
|
946.9
|
|
965.9
|
|
946.7
|
|
913.6
|
|
|||||||||||||||
|
Service and distribution fees
|
217.5
|
|
217.6
|
|
211.3
|
|
206.4
|
|
209.1
|
|
213.4
|
|
203.4
|
|
197.7
|
|
|||||||||||||||
|
Performance fees
|
43.0
|
|
42.3
|
|
16.7
|
|
11.3
|
|
17.5
|
|
3.4
|
|
8.9
|
|
14.5
|
|
|||||||||||||||
|
Other
|
16.4
|
|
15.5
|
|
16.0
|
|
19.7
|
|
21.2
|
|
18.9
|
|
30.4
|
|
22.9
|
|
|||||||||||||||
|
Total operating revenues
|
1,375.6
|
|
1,337.7
|
|
1,254.4
|
|
1,192.6
|
|
1,194.7
|
|
1,201.6
|
|
1,189.4
|
|
1,148.7
|
|
|||||||||||||||
|
Operating expenses:
|
|||||||||||||||||||||||||||||||
|
Third-party distribution, service and advisory
|
390.9
|
|
380.4
|
|
365.9
|
|
349.3
|
|
349.5
|
|
362.1
|
|
348.4
|
|
347.2
|
|
|||||||||||||||
|
Employee compensation
|
381.9
|
|
393.1
|
|
365.6
|
|
396.8
|
|
339.0
|
|
345.1
|
|
350.3
|
|
344.4
|
|
|||||||||||||||
|
Marketing
|
40.7
|
|
29.5
|
|
29.1
|
|
24.4
|
|
35.2
|
|
26.4
|
|
28.3
|
|
24.9
|
|
|||||||||||||||
|
Property, office and technology
|
102.8
|
|
92.8
|
|
89.0
|
|
85.5
|
|
85.3
|
|
78.2
|
|
82.3
|
|
79.9
|
|
|||||||||||||||
|
General and administrative
|
115.0
|
|
86.6
|
|
85.9
|
|
78.0
|
|
91.5
|
|
83.5
|
|
78.6
|
|
77.9
|
|
|||||||||||||||
|
Total operating expenses
|
1,031.3
|
|
982.4
|
|
935.5
|
|
934.0
|
|
900.5
|
|
895.3
|
|
887.9
|
|
874.3
|
|
|||||||||||||||
|
Operating income
|
344.3
|
|
355.3
|
|
318.9
|
|
258.6
|
|
294.2
|
|
306.3
|
|
301.5
|
|
274.4
|
|
|||||||||||||||
|
Other income/(expense):
|
|||||||||||||||||||||||||||||||
|
Equity in earnings of unconsolidated affiliates
|
3.6
|
|
12.9
|
|
10.5
|
|
17.7
|
|
11.4
|
|
5.5
|
|
4.6
|
|
(12.2
|
)
|
|||||||||||||||
|
Interest and dividend income
|
6.4
|
|
2.5
|
|
1.6
|
|
2.9
|
|
3.5
|
|
2.6
|
|
2.5
|
|
3.6
|
|
|||||||||||||||
|
Interest expense
|
(23.6
|
)
|
(23.6
|
)
|
(23.6
|
)
|
(24.0
|
)
|
(23.5
|
)
|
(23.9
|
)
|
(22.1
|
)
|
(23.9
|
)
|
|||||||||||||||
|
Other gains and losses, net
|
23.9
|
|
18.9
|
|
2.5
|
|
6.2
|
|
15.6
|
|
16.2
|
|
(4.2
|
)
|
(4.7
|
)
|
|||||||||||||||
|
Other income/(expense) of CIP, net
|
44.8
|
|
31.7
|
|
32.3
|
|
28.5
|
|
9.8
|
|
39.0
|
|
37.9
|
|
(7.5
|
)
|
|||||||||||||||
|
Income before income taxes
|
399.4
|
|
397.7
|
|
342.2
|
|
289.9
|
|
311.0
|
|
345.7
|
|
320.2
|
|
229.7
|
|
|||||||||||||||
|
Income tax (provision)/benefits
|
23.2
|
|
(123.1
|
)
|
(92.6
|
)
|
(75.7
|
)
|
(92.9
|
)
|
(89.8
|
)
|
(83.7
|
)
|
(71.9
|
)
|
|||||||||||||||
|
Net income
|
422.6
|
|
274.6
|
|
249.6
|
|
214.2
|
|
218.1
|
|
255.9
|
|
236.5
|
|
157.8
|
|
|||||||||||||||
|
Net (income)/loss attributable to noncontrolling interests in consolidated entities
|
(14.4
|
)
|
(7.1
|
)
|
(10.0
|
)
|
(2.2
|
)
|
8.4
|
|
(14.7
|
)
|
(11.0
|
)
|
3.2
|
|
|||||||||||||||
|
Net income attributable to Invesco Ltd.
|
408.2
|
|
267.5
|
|
239.6
|
|
212.0
|
|
226.5
|
|
241.2
|
|
225.5
|
|
161.0
|
|
|||||||||||||||
|
Earnings per share*:
|
|||||||||||||||||||||||||||||||
|
-basic
|
|
$1.00
|
|
|
$0.65
|
|
|
$0.58
|
|
|
$0.52
|
|
|
$0.55
|
|
|
$0.58
|
|
|
$0.54
|
|
|
$0.38
|
|
|||||||
|
-diluted
|
|
$0.99
|
|
|
$0.65
|
|
|
$0.58
|
|
|
$0.52
|
|
|
$0.55
|
|
|
$0.58
|
|
|
$0.54
|
|
|
$0.38
|
|
|||||||
|
Average shares outstanding*:
|
|||||||||||||||||||||||||||||||
|
- basic
|
410.0
|
|
410.0
|
|
409.9
|
|
407.7
|
|
408.6
|
|
412.6
|
|
418.9
|
|
418.7
|
|
|||||||||||||||
|
- diluted
|
410.6
|
|
410.5
|
|
410.3
|
|
408.0
|
|
409.0
|
|
412.9
|
|
419.1
|
|
418.9
|
|
|||||||||||||||
|
Dividends declared per share:
|
|
$0.2900
|
|
|
$0.2900
|
|
|
$0.2900
|
|
|
$0.2800
|
|
|
$0.2800
|
|
|
$0.2800
|
|
|
$0.2800
|
|
|
$0.2700
|
|
|||||||
____________
|
*
|
The sum of the quarterly earnings per share amounts may differ from the annual earnings per share amounts due to the required method of computing the weighted average number of shares in interim periods.
|
78
Item 8.
Financial Statements and Supplementary Data
Index to Financial Statements and Supplementary Data
79
Annual Report of Management on Internal Control over Financial Reporting
Management of the company is responsible for establishing and maintaining adequate internal control over financial reporting, as defined in the Securities Exchange Act of 1934, Rules 13a-15(f) and 15d-15(f). The company's internal control over financial reporting is a process designed to provide reasonable assurance regarding the reliability of financial reporting and the preparation of financial statements for external purposes in accordance with generally accepted accounting principles. Because of its inherent limitations, internal control over financial reporting may not prevent or detect misstatements. Also, projections of any evaluation of effectiveness to future periods are subject to the risk that controls may become inadequate because of changes in conditions, or that the degree of compliance with the policies or procedures may deteriorate.
Under the supervision and with the participation of the chief executive officer and chief financial officer, management assessed the effectiveness of our internal controls over financial reporting as of
December 31, 2017
. In making this assessment, management used the criteria set forth by the Committee of Sponsoring Organizations of the Treadway Commission (COSO) in
Internal Control - Integrated Framework (2013)
. Based on this assessment, management concluded that our internal control over financial reporting was effective as of
December 31, 2017
.
The company's independent registered public accounting firm, PricewaterhouseCoopers LLP, has issued an audit report on the effectiveness of our internal control over financial reporting, which is included herein.
Changes in Internal Control over Financial Reporting
There were no changes in the company’s internal control over financial reporting during the fourth quarter of
2017
which were identified in connection with management’s evaluation required by the Securities Exchange Act of 1934 Rules 13a-15(f) and 15d-15(f), that have materially affected, or are reasonably likely to materially affect, the company’s internal control over financial reporting.
80
Report of Independent Registered Public Accounting Firm
To the Board of Directors and Shareholders of Invesco Ltd.
Opinions on the Financial Statements and Internal Control over Financial Reporting
We have audited the accompanying consolidated balance sheets of Invesco Ltd. and its subsidiaries as of
December 31, 2017
and
December 31, 2016
, and the related consolidated statements of income, comprehensive income, cash flows, and changes in equity for each of the three years in the period ended
December 31, 2017
, including the related notes (collectively referred to as the “consolidated financial statements”).
We also have audited the Company's internal control over financial reporting as of
December 31, 2017
, based on criteria established in
Internal Control - Integrated Framework
(2013)
issued by the Committee of Sponsoring Organizations of the Treadway Commission (COSO).
In our opinion, the consolidated financial statements referred to above present fairly, in all material respects, the financial position of the Company as of
December 31, 2017
and
December 31, 2016
, and the results of their operations and their cash flows for each of the three years in the period ended
December 31, 2017
in conformity with accounting principles generally accepted in the United States of America. Also in our opinion, the Company maintained, in all material respects, effective internal control over financial reporting as of
December 31, 2017
, based on criteria established in
Internal Control - Integrated Framework
(2013)
issued by the COSO.
Basis for Opinions
The Company's management is responsible for these consolidated financial statements, for maintaining effective internal control over financial reporting, and for its assessment of the effectiveness of internal control over financial reporting, included in the accompanying Annual Report of Management on Internal Control over Financial Reporting. Our responsibility is to express opinions on the Company’s consolidated financial statements and on the Company's internal control over financial reporting based on our audits. We are a public accounting firm registered with the Public Company Accounting Oversight Board (United States) ("PCAOB") and are required to be independent with respect to the Company in accordance with the U.S. federal securities laws and the applicable rules and regulations of the Securities and Exchange Commission and the PCAOB.
We conducted our audits in accordance with the standards of the PCAOB. Those standards require that we plan and perform the audits to obtain reasonable assurance about whether the consolidated
financial statements are free of material misstatement, whether due to error or fraud, and whether effective internal control over financial reporting was maintained in all material respects.
Our audits of the consolidated
financial statements included performing procedures to assess the risks of material misstatement of the consolidated
financial statements, whether due to error or fraud, and performing procedures that respond to those risks. Such procedures included examining, on a test basis, evidence regarding the amounts and disclosures in the consolidated financial statements. Our audits also included evaluating the accounting principles used and significant estimates made by management, as well as evaluating the overall presentation of the consolidated
financial statements. Our audit of internal control over financial reporting included obtaining an understanding of internal control over financial reporting, assessing the risk that a material weakness exists, and testing and evaluating the design and operating effectiveness of internal control based on the assessed risk. Our audits also included performing such other procedures as we considered necessary in the circumstances. We believe that our audits provide a reasonable basis for our opinions.
Definition and Limitations of Internal Control over Financial Reporting
A company’s internal control over financial reporting is a process designed to provide reasonable assurance regarding the reliability of financial reporting and the preparation of financial statements for external purposes in accordance with generally accepted accounting principles. A company’s internal control over financial reporting includes those policies and procedures that (i) pertain to the maintenance of records that, in reasonable detail, accurately and fairly reflect the transactions and dispositions of the assets of the company; (ii) provide reasonable assurance that transactions are recorded as necessary to permit preparation of financial statements in accordance with generally accepted accounting principles, and that receipts and expenditures of the company are being made only in accordance with authorizations of management and directors of the company; and (iii) provide reasonable assurance regarding prevention or timely detection of unauthorized acquisition, use, or disposition of the company’s assets that could have a material effect on the financial statements.
81
Because of its inherent limitations, internal control over financial reporting may not prevent or detect misstatements. Also, projections of any evaluation of effectiveness to future periods are subject to the risk that controls may become inadequate because of changes in conditions, or that the degree of compliance with the policies or procedures may deteriorate.
/s/ PricewaterhouseCoopers LLP
Atlanta, Georgia
February 23, 2018
We have served as the Company’s auditor since 2013.
82
Invesco Ltd.
Consolidated Balance Sheets
|
As of
|
|||||
|
$ in millions, except per share data
|
December 31, 2017
|
December 31, 2016
|
|||
|
ASSETS
|
|||||
|
Cash and cash equivalents
|
2,006.4
|
|
1,328.0
|
|
|
|
Unsettled fund receivables
|
793.8
|
|
672.9
|
|
|
|
Accounts receivable
|
622.5
|
|
544.2
|
|
|
|
Investments
|
674.6
|
|
795.3
|
|
|
|
Assets of consolidated investment products (CIP):
|
|||||
|
Cash and cash equivalents of CIP
|
511.3
|
|
742.2
|
|
|
|
Accounts receivable and other assets of CIP
|
131.5
|
|
106.2
|
|
|
|
Investments of CIP
|
5,658.0
|
|
5,116.1
|
|
|
|
Assets held for policyholders
|
12,444.5
|
|
8,224.2
|
|
|
|
Prepaid assets
|
124.4
|
|
116.9
|
|
|
|
Other assets
|
61.7
|
|
95.0
|
|
|
|
Property, equipment and software, net
|
490.7
|
|
464.7
|
|
|
|
Intangible assets, net
|
1,558.7
|
|
1,399.4
|
|
|
|
Goodwill
|
6,590.7
|
|
6,129.2
|
|
|
|
Total assets
|
31,668.8
|
|
25,734.3
|
|
|
|
LIABILITIES
|
|||||
|
Accrued compensation and benefits
|
696.1
|
|
654.3
|
|
|
|
Accounts payable and accrued expenses
|
895.7
|
|
812.4
|
|
|
|
Liabilities of CIP:
|
|||||
|
Debt of CIP
|
4,799.8
|
|
4,403.1
|
|
|
|
Other liabilities of CIP
|
498.8
|
|
673.4
|
|
|
|
Policyholder payables
|
12,444.5
|
|
8,224.2
|
|
|
|
Unsettled fund payables
|
783.8
|
|
659.3
|
|
|
|
Long-term debt
|
2,075.8
|
|
2,102.4
|
|
|
|
Deferred tax liabilities, net
|
275.5
|
|
309.7
|
|
|
|
Total liabilities
|
22,470.0
|
|
17,838.8
|
|
|
|
Commitments and contingencies (See Note 18)
|
|
|
|
|
|
|
TEMPORARY EQUITY
|
|||||
|
Redeemable noncontrolling interests in consolidated entities
|
243.2
|
|
283.7
|
|
|
|
PERMANENT EQUITY
|
|||||
|
Equity attributable to Invesco Ltd.:
|
|||||
|
Common shares ($0.20 par value; 1,050.0 million authorized; 490.4 million shares issued as of December 31, 2017 and 2016)
|
98.1
|
|
98.1
|
|
|
|
Additional paid-in-capital
|
6,282.0
|
|
6,227.4
|
|
|
|
Treasury shares
|
(2,781.9
|
)
|
(2,845.8
|
)
|
|
|
Retained earnings
|
5,489.1
|
|
4,833.4
|
|
|
|
Accumulated other comprehensive income/(loss), net of tax
|
(391.2
|
)
|
(809.3
|
)
|
|
|
Total equity attributable to Invesco Ltd.
|
8,696.1
|
|
7,503.8
|
|
|
|
Equity attributable to nonredeemable noncontrolling interests in consolidated entities
|
259.5
|
|
108.0
|
|
|
|
Total permanent equity
|
8,955.6
|
|
7,611.8
|
|
|
|
Total liabilities, temporary and permanent equity
|
31,668.8
|
|
25,734.3
|
|
|
See accompanying notes.
83
Invesco Ltd.
|
Years ended December 31,
|
|||||||||||
|
$ in millions, except per share data
|
2017
|
2016
|
2015
|
||||||||
|
Operating revenues:
|
|||||||||||
|
Investment management fees
|
4,126.6
|
|
3,773.1
|
|
4,061.1
|
|
|||||
|
Service and distribution fees
|
852.8
|
|
823.6
|
|
855.4
|
|
|||||
|
Performance fees
|
113.3
|
|
44.3
|
|
85.9
|
|
|||||
|
Other
|
67.6
|
|
93.4
|
|
120.5
|
|
|||||
|
Total operating revenues
|
5,160.3
|
|
4,734.4
|
|
5,122.9
|
|
|||||
|
Operating expenses:
|
|||||||||||
|
Third-party distribution, service and advisory
|
1,486.5
|
|
1,407.2
|
|
1,579.9
|
|
|||||
|
Employee compensation
|
1,537.4
|
|
1,378.8
|
|
1,395.5
|
|
|||||
|
Marketing
|
123.7
|
|
114.8
|
|
115.4
|
|
|||||
|
Property, office and technology
|
370.1
|
|
325.7
|
|
312.0
|
|
|||||
|
General and administrative
|
365.5
|
|
331.5
|
|
361.7
|
|
|||||
|
Total operating expenses
|
3,883.2
|
|
3,558.0
|
|
3,764.5
|
|
|||||
|
Operating income
|
1,277.1
|
|
1,176.4
|
|
1,358.4
|
|
|||||
|
Other income/(expense):
|
|||||||||||
|
Equity in earnings of unconsolidated affiliates
|
44.7
|
|
9.3
|
|
35.1
|
|
|||||
|
Interest and dividend income
|
13.4
|
|
12.2
|
|
13.0
|
|
|||||
|
Interest expense
|
(94.8
|
)
|
(93.4
|
)
|
(81.7
|
)
|
|||||
|
Other gains and losses, net
|
51.5
|
|
22.9
|
|
(1.5
|
)
|
|||||
|
Other income/(expense) of CSIP, net
|
—
|
|
—
|
|
11.7
|
|
|||||
|
Other income/(expense) of CIP, net
|
137.3
|
|
79.2
|
|
27.1
|
|
|||||
|
Income before income taxes
|
1,429.2
|
|
1,206.6
|
|
1,362.1
|
|
|||||
|
Income tax provision
|
(268.2
|
)
|
(338.3
|
)
|
(398.0
|
)
|
|||||
|
Net income
|
1,161.0
|
|
868.3
|
|
964.1
|
|
|||||
|
Net (income)/loss attributable to noncontrolling interests in consolidated entities
|
(33.7
|
)
|
(14.1
|
)
|
4.0
|
|
|||||
|
Net income attributable to Invesco Ltd.
|
1,127.3
|
|
854.2
|
|
968.1
|
|
|||||
|
Earnings per share:
|
|||||||||||
|
Basic earnings per share
|
|
$2.75
|
|
|
$2.06
|
|
|
$2.26
|
|
||
|
Diluted earnings per share
|
|
$2.75
|
|
|
$2.06
|
|
|
$2.26
|
|
||
|
Dividends declared per share
|
|
$1.1500
|
|
|
$1.1100
|
|
|
$1.0600
|
|
||
See accompanying notes.
84
Invesco Ltd
.
Consolidated Statements of Comprehensive Income
|
Years ended December 31,
|
||||||||
|
$ in millions
|
2017
|
2016
|
2015
|
|||||
|
Net income
|
1,161.0
|
|
868.3
|
|
964.1
|
|
||
|
Other comprehensive income/(loss), net of tax:
|
||||||||
|
Currency translation differences on investments in foreign subsidiaries
|
389.4
|
|
(314.1
|
)
|
(493.9
|
)
|
||
|
Actuarial gain/(loss) related to employee benefit plans
|
21.1
|
|
(39.5
|
)
|
11.1
|
|
||
|
Prior service credit/(cost) related to employee benefit plans
|
—
|
|
(3.1
|
)
|
—
|
|
||
|
Settlement related to employee benefit plans
|
5.9
|
|
(5.5
|
)
|
—
|
|
||
|
Reclassification of prior service (credit)/costs into employee compensation expense
|
—
|
|
(7.0
|
)
|
(7.2
|
)
|
||
|
Reclassification of actuarial (gains)/losses into employee compensation expense
|
2.5
|
|
1.5
|
|
2.2
|
|
||
|
Share of other comprehensive income/(loss) of equity method investments
|
(0.5
|
)
|
(1.1
|
)
|
(0.6
|
)
|
||
|
Unrealized gains/(losses) on available-for-sale investments
|
5.1
|
|
5.2
|
|
(6.0
|
)
|
||
|
Reclassification of net (gains)/losses realized on available-for-sale investments included in other gains and losses
|
(5.4
|
)
|
0.3
|
|
(0.4
|
)
|
||
|
Other comprehensive income/(loss)
|
418.1
|
|
(363.3
|
)
|
(494.8
|
)
|
||
|
Total comprehensive income/(loss)
|
1,579.1
|
|
505.0
|
|
469.3
|
|
||
|
Comprehensive (income)/loss attributable to noncontrolling interests in consolidated entities
|
(33.7
|
)
|
(14.1
|
)
|
4.0
|
|
||
|
Comprehensive income attributable to Invesco Ltd.
|
1,545.4
|
|
490.9
|
|
473.3
|
|
||
See accompanying notes.
85
Invesco Ltd.
|
Years ended December 31,
|
||||||||
|
$ in millions
|
2017
|
2016
|
2015
|
|||||
|
Operating activities:
|
||||||||
|
Net income
|
1,161.0
|
|
868.3
|
|
964.1
|
|
||
|
Adjustments to reconcile net income to net cash provided by/(used in) operating activities:
|
||||||||
|
Amortization and depreciation
|
116.8
|
|
101.2
|
|
93.6
|
|
||
|
Share-based compensation expense
|
175.3
|
|
159.7
|
|
150.3
|
|
||
|
Other gains and losses, net
|
(39.4
|
)
|
(22.9
|
)
|
1.5
|
|
||
|
Other (gains)/losses of CSIP, net
|
—
|
|
—
|
|
0.8
|
|
||
|
Other (gains)/losses of CIP, net
|
(81.0
|
)
|
(7.4
|
)
|
37.0
|
|
||
|
Equity in earnings of unconsolidated affiliates
|
(44.7
|
)
|
(9.3
|
)
|
(35.1
|
)
|
||
|
Dividends from unconsolidated affiliates
|
2.8
|
|
17.6
|
|
18.7
|
|
||
|
Changes in operating assets and liabilities:
|
||||||||
|
(Increase)/decrease in cash held by CIP
|
226.2
|
|
(509.4
|
)
|
39.9
|
|
||
|
(Increase)/decrease in cash held by CSIP
|
—
|
|
—
|
|
(10.5
|
)
|
||
|
(Purchase)/sale of investments by CIP, net
|
(342.5
|
)
|
(487.2
|
)
|
—
|
|
||
|
(Purchase)/sale of trading investments, net
|
174.9
|
|
7.0
|
|
(159.0
|
)
|
||
|
(Increase)/decrease in receivables
|
(3,419.4
|
)
|
(3,392.2
|
)
|
(4,489.9
|
)
|
||
|
Increase/(decrease) in payables
|
3,440.7
|
|
3,445.9
|
|
4,517.0
|
|
||
|
Net cash provided by/(used in) operating activities
|
1,370.7
|
|
171.3
|
|
1,128.4
|
|
||
|
Investing activities:
|
||||||||
|
Purchase of property, equipment and software
|
(111.7
|
)
|
(147.7
|
)
|
(124.5
|
)
|
||
|
Purchase of available-for-sale investments
|
(7.9
|
)
|
(25.9
|
)
|
(44.9
|
)
|
||
|
Sale of available-for-sale investments
|
79.5
|
|
59.3
|
|
51.1
|
|
||
|
Purchase of investments by CIP
|
(5,709.1
|
)
|
(3,713.6
|
)
|
(4,080.7
|
)
|
||
|
Sale of investments by CIP
|
5,026.5
|
|
2,958.1
|
|
3,543.2
|
|
||
|
Purchase of investments by CSIP
|
—
|
|
—
|
|
(527.5
|
)
|
||
|
Sale of investments by CSIP
|
—
|
|
—
|
|
524.2
|
|
||
|
Purchase of other investments
|
(169.8
|
)
|
(125.4
|
)
|
(167.8
|
)
|
||
|
Sale of other investments
|
97.8
|
|
87.9
|
|
111.6
|
|
||
|
Returns of capital and distributions from unconsolidated partnership investments
|
132.8
|
|
38.6
|
|
50.5
|
|
||
|
Purchase of business
|
(299.2
|
)
|
(121.9
|
)
|
—
|
|
||
|
Net cash provided by/(used in) investing activities
|
(961.1
|
)
|
(990.6
|
)
|
(664.8
|
)
|
||
|
Financing activities:
|
||||||||
|
Proceeds from exercises of share options
|
—
|
|
—
|
|
3.7
|
|
||
|
Purchases of treasury shares
|
(63.8
|
)
|
(577.0
|
)
|
(623.7
|
)
|
||
|
Dividends paid
|
(471.6
|
)
|
(460.4
|
)
|
(454.5
|
)
|
||
|
Excess tax benefits from share-based compensation
|
—
|
|
(1.7
|
)
|
21.2
|
|
||
|
Third-party capital invested into CIP
|
449.4
|
|
386.7
|
|
113.5
|
|
||
|
Third-party capital distributed by CIP
|
(105.4
|
)
|
(91.5
|
)
|
(120.0
|
)
|
||
|
Third-party capital invested into CSIP
|
—
|
|
—
|
|
31.2
|
|
||
|
Third-party capital distributed by CSIP
|
—
|
|
—
|
|
(25.9
|
)
|
||
|
Borrowings of debt of CIP
|
2,812.4
|
|
1,327.9
|
|
2,091.8
|
|
||
|
Repayments of debt of CIP
|
(2,410.1
|
)
|
(171.5
|
)
|
(1,573.1
|
)
|
||
|
Net borrowings/(repayments) under credit facility
|
(28.7
|
)
|
28.7
|
|
—
|
|
||
|
Proceeds from issuance of senior notes
|
—
|
|
—
|
|
495.5
|
|
||
|
Payment of contingent consideration
|
(13.2
|
)
|
(13.1
|
)
|
(11.3
|
)
|
||
|
Net cash provided by/(used in) financing activities
|
169.0
|
|
428.1
|
|
(51.6
|
)
|
||
|
Increase/(decrease) in cash and cash equivalents
|
578.6
|
|
(391.2
|
)
|
412.0
|
|
||
|
Foreign exchange movement on cash and cash equivalents
|
99.8
|
|
(132.2
|
)
|
(74.8
|
)
|
||
|
Cash and cash equivalents, beginning of year
|
1,328.0
|
|
1,851.4
|
|
1,514.2
|
|
||
|
Cash and cash equivalents, end of year
|
2,006.4
|
|
1,328.0
|
|
1,851.4
|
|
||
|
Supplemental Cash Flow Information:
|
||||||||
|
Interest paid
|
(85.4
|
)
|
(81.2
|
)
|
(67.5
|
)
|
||
|
Interest received
|
3.1
|
|
5.8
|
|
8.8
|
|
||
|
Taxes paid
|
(256.5
|
)
|
(299.1
|
)
|
(388.7
|
)
|
||
See accompanying notes.
86
Invesco Ltd.
Consolidated Statements of Changes in Equity
|
Equity Attributable to Invesco Ltd.
|
||||||||||||||||||||||||||
|
$ in millions
|
Common Shares
|
Additional Paid-in-Capital
|
Treasury Shares
|
Retained Earnings
|
Accumulated Other Comprehensive Income
|
Total Equity Attributable to Invesco Ltd.
|
Nonredeemable Noncontrolling Interests in Consolidated Entities
|
Total Permanent Equity
|
Redeemable Noncontrolling Interests in Consolidated Entities/Temporary Equity
|
|||||||||||||||||
|
January 1, 2017
|
98.1
|
|
6,227.4
|
|
(2,845.8
|
)
|
4,833.4
|
|
(809.3
|
)
|
7,503.8
|
|
108.0
|
|
7,611.8
|
|
283.7
|
|
||||||||
|
Net income
|
—
|
|
—
|
|
—
|
|
1,127.3
|
|
—
|
|
1,127.3
|
|
4.5
|
|
1,131.8
|
|
29.2
|
|
||||||||
|
Other comprehensive income
|
—
|
|
—
|
|
—
|
|
—
|
|
418.1
|
|
418.1
|
|
—
|
|
418.1
|
|
—
|
|
||||||||
|
Change in noncontrolling interests in consolidated entities, net
|
—
|
|
—
|
|
—
|
|
—
|
|
—
|
|
—
|
|
147.0
|
|
147.0
|
|
(69.7
|
)
|
||||||||
|
Dividends
|
—
|
|
—
|
|
—
|
|
(471.6
|
)
|
—
|
|
(471.6
|
)
|
—
|
|
(471.6
|
)
|
—
|
|
||||||||
|
Employee share plans:
|
||||||||||||||||||||||||||
|
Share-based compensation
|
—
|
|
175.3
|
|
—
|
|
—
|
|
—
|
|
175.3
|
|
—
|
|
175.3
|
|
—
|
|
||||||||
|
Vested shares
|
—
|
|
(123.0
|
)
|
123.0
|
|
—
|
|
—
|
|
—
|
|
—
|
|
—
|
|
—
|
|
||||||||
|
Other share awards
|
—
|
|
2.3
|
|
4.7
|
|
—
|
|
—
|
|
7.0
|
|
—
|
|
7.0
|
|
—
|
|
||||||||
|
Purchase of shares
|
—
|
|
—
|
|
(63.8
|
)
|
—
|
|
—
|
|
(63.8
|
)
|
—
|
|
(63.8
|
)
|
—
|
|
||||||||
|
December 31, 2017
|
98.1
|
|
6,282.0
|
|
(2,781.9
|
)
|
5,489.1
|
|
(391.2
|
)
|
8,696.1
|
|
259.5
|
|
8,955.6
|
|
243.2
|
|
||||||||
See accompanying notes.
87
Invesco Ltd.
Consolidated Statements of Changes in Equity (continued)
|
Equity Attributable to Invesco Ltd.
|
||||||||||||||||||||||||||
|
$ in millions
|
Co
mmon
Shares
|
Additional Paid-in-Capital
|
Treasury Shares
|
Retained Earnings
|
Accumulated Other Comprehensive Income
|
Total Equity Attributable to Invesco Ltd.
|
Nonredeemable Noncontrolling Interests in Consolidated Entities
|
Total Permanent Equity
|
Redeemable Noncontrolling Interests in Consolidated Entities/Temporary Equity
|
|||||||||||||||||
|
January 1, 2016
|
98.1
|
|
6,197.7
|
|
(2,404.1
|
)
|
4,439.6
|
|
(446.0
|
)
|
7,885.3
|
|
810.4
|
|
8,695.7
|
|
167.3
|
|
||||||||
|
Adjustment for adoption of ASU 2015-02
|
|
|
|
|
|
—
|
|
(733.5
|
)
|
(733.5
|
)
|
226.6
|
|
|||||||||||||
|
January 1, 2016, as adjusted
|
98.1
|
|
6,197.7
|
|
(2,404.1
|
)
|
4,439.6
|
|
(446.0
|
)
|
7,885.3
|
|
76.9
|
|
7,962.2
|
|
393.9
|
|
||||||||
|
Net income
|
—
|
|
—
|
|
—
|
|
854.2
|
|
—
|
|
854.2
|
|
(0.9
|
)
|
853.3
|
|
15.0
|
|
||||||||
|
Other comprehensive income (loss)
|
—
|
|
—
|
|
—
|
|
—
|
|
(363.3
|
)
|
(363.3
|
)
|
—
|
|
(363.3
|
)
|
—
|
|
||||||||
|
Change in noncontrolling interests in consolidated entities, net
|
—
|
|
—
|
|
—
|
|
—
|
|
—
|
|
—
|
|
32.0
|
|
32.0
|
|
(125.2
|
)
|
||||||||
|
Dividends
|
—
|
|
—
|
|
—
|
|
(460.4
|
)
|
—
|
|
(460.4
|
)
|
—
|
|
(460.4
|
)
|
—
|
|
||||||||
|
Employee share plans:
|
||||||||||||||||||||||||||
|
Share-based compensation
|
—
|
|
159.7
|
|
—
|
|
—
|
|
—
|
|
159.7
|
|
—
|
|
159.7
|
|
—
|
|
||||||||
|
Vested shares
|
—
|
|
(102.3
|
)
|
102.3
|
|
—
|
|
—
|
|
—
|
|
—
|
|
—
|
|
—
|
|
||||||||
|
Other share awards
|
—
|
|
0.8
|
|
6.2
|
|
—
|
|
—
|
|
7.0
|
|
—
|
|
7.0
|
|
—
|
|
||||||||
|
Tax impact of share-based payment
|
—
|
|
(1.7
|
)
|
—
|
|
—
|
|
—
|
|
(1.7
|
)
|
—
|
|
(1.7
|
)
|
—
|
|
||||||||
|
Purchase of shares
|
—
|
|
(26.8
|
)
|
(550.2
|
)
|
—
|
|
—
|
|
(577.0
|
)
|
—
|
|
(577.0
|
)
|
—
|
|
||||||||
|
December 31, 2016
|
98.1
|
|
6,227.4
|
|
(2,845.8
|
)
|
4,833.4
|
|
(809.3
|
)
|
7,503.8
|
|
108.0
|
|
7,611.8
|
|
283.7
|
|
||||||||
See accompanying notes.
88
Invesco Ltd.
Consolidated Statements of Changes in Equity (continued)
|
Equity attributable to Invesco Ltd.
|
||||||||||||||||||||||||||||||
|
$ in millions
|
Co
mmon
Shares
|
Additional Paid-in-Capital
|
Treasury Shares
|
Retained Earnings
|
Retained Earnings Appropriated for Investors in CIP
|
Accumulated Other Comprehensive Income
|
Total Equity Attributable to Invesco Ltd.
|
Nonredeemable Noncontrolling Interests in Consolidated Entities
|
Total Permanent Equity
|
Redeemable Noncontrolling Interests in Consolidated Entities/Temporary Equity
|
||||||||||||||||||||
|
January 1, 2015
|
98.1
|
|
6,133.6
|
|
(1,898.1
|
)
|
3,926.0
|
|
17.6
|
|
48.8
|
|
8,326.0
|
|
793.8
|
|
9,119.8
|
|
165.5
|
|
||||||||||
|
Adjustment for adoption of ASU 2014-13
|
—
|
|
—
|
|
—
|
|
—
|
|
(17.6
|
)
|
—
|
|
(17.6
|
)
|
—
|
|
(17.6
|
)
|
—
|
|
—
|
|
||||||||
|
January 1, 2015, as adjusted
|
98.1
|
|
6,133.6
|
|
(1,898.1
|
)
|
3,926.0
|
|
—
|
|
48.8
|
|
8,308.4
|
|
793.8
|
|
9,102.2
|
|
165.5
|
|
||||||||||
|
Net income
|
—
|
|
—
|
|
—
|
|
968.1
|
|
—
|
|
—
|
|
968.1
|
|
(2.9
|
)
|
965.2
|
|
(1.1
|
)
|
||||||||||
|
Other comprehensive income (loss)
|
—
|
|
—
|
|
—
|
|
—
|
|
—
|
|
(494.8
|
)
|
(494.8
|
)
|
—
|
|
(494.8
|
)
|
—
|
|
||||||||||
|
Change in noncontrolling interests in consolidated entities, net
|
—
|
|
—
|
|
—
|
|
—
|
|
—
|
|
—
|
|
—
|
|
19.5
|
|
19.5
|
|
2.9
|
|
||||||||||
|
Dividends
|
—
|
|
—
|
|
—
|
|
(454.5
|
)
|
—
|
|
—
|
|
(454.5
|
)
|
—
|
|
(454.5
|
)
|
—
|
|
||||||||||
|
Employee share plans:
|
||||||||||||||||||||||||||||||
|
Share-based compensation
|
—
|
|
150.3
|
|
—
|
|
—
|
|
—
|
|
—
|
|
150.3
|
|
—
|
|
150.3
|
|
—
|
|
||||||||||
|
Vested shares
|
—
|
|
(109.2
|
)
|
109.2
|
|
—
|
|
—
|
|
—
|
|
—
|
|
—
|
|
—
|
|
—
|
|
||||||||||
|
Exercise of options
|
—
|
|
(2.1
|
)
|
5.8
|
|
—
|
|
—
|
|
—
|
|
3.7
|
|
—
|
|
3.7
|
|
—
|
|
||||||||||
|
Other share awards
|
—
|
|
2.7
|
|
3.9
|
|
—
|
|
—
|
|
—
|
|
6.6
|
|
—
|
|
6.6
|
|
—
|
|
||||||||||
|
Tax impact of share-based payment
|
—
|
|
21.2
|
|
—
|
|
—
|
|
—
|
|
—
|
|
21.2
|
|
—
|
|
21.2
|
|
—
|
|
||||||||||
|
Purchase of shares
|
—
|
|
1.2
|
|
(624.9
|
)
|
—
|
|
—
|
|
—
|
|
(623.7
|
)
|
—
|
|
(623.7
|
)
|
—
|
|
||||||||||
|
December 31, 2015
|
98.1
|
|
6,197.7
|
|
(2,404.1
|
)
|
4,439.6
|
|
—
|
|
(446.0
|
)
|
7,885.3
|
|
810.4
|
|
8,695.7
|
|
167.3
|
|
||||||||||
See accompanying notes.
89
Invesco Ltd.
Notes to the Consolidated Financial Statements
1
.
ACCOUNTING POLICIES
Corporate Information
Invesco Ltd. (Parent) and all of its consolidated entities (collectively, the company or Invesco) provide retail and institutional clients with an array of global investment management capabilities. The company operates globally and its sole business is investment management.
Basis of Accounting and Consolidation
The Consolidated Financial Statements have been prepared in accordance with accounting principles generally accepted in the United States and with rules and regulations of the Securities and Exchange Commission and consolidate the financial statements of the Parent and all of its controlled subsidiaries. In the opinion of management, the Consolidated Financial Statements reflect all adjustments, consisting of normal recurring accruals, which are necessary for the fair presentation of the financial condition and results of operations for the periods presented. All significant intercompany transactions, balances, revenues and expenses are eliminated upon consolidation.
The company provides investment management services to, and has transactions with, various retail mutual funds and similar entities, private equity funds, real estate funds, fund-of-funds, collateralized loan obligations (CLOs), and other investment products sponsored by the company in the normal course of business for the investment of client assets. The company serves as the investment manager, making day-to-day investment decisions concerning the assets of these products.
In addition to consolidating the financial statements of the Parent and all of its controlled subsidiaries, the Consolidated Financial Statements include the consolidation of certain investment products (Consolidated Investment Products or CIP) that meet the definition of either a voting rights entity (VOE), if the company is deemed to have a controlling financial interest in the fund, or a variable interest entity (VIE), if the company has been deemed to be the primary beneficiary of the fund.
Certain of these investment products, typically CLOs, funds that are structured as partnership entities (such as private equity funds, real estate funds, and fund-of-funds), and certain non-U.S. mutual funds, are considered, for accounting and consolidation analysis purposes, to be VIEs if the VIE criteria are met. A VIE, in the context of the company and its managed funds, is a fund that does not have sufficient equity to finance its operations without additional subordinated financial support, or a fund for which the risks and rewards of ownership are not directly linked to voting interests. If the company is deemed to have the power to direct the activities of the fund that most significantly impact the fund's economic performance, and the obligation to absorb losses/right to receive benefits from the fund that could potentially be significant to the fund, then the company is deemed to be the fund's primary beneficiary and is required to consolidate the fund.
The company's economic risk with respect to each investment in a CIP is limited to its equity ownership and any uncollected management and performance fees. See Note
19
, "Consolidated Investment Products," for additional information regarding the impact of CIP.
Consolidation Analysis
The company inventories its funds by vehicle type on a quarterly basis. The company assesses modifications to existing funds on an ongoing basis to determine if a significant reconsideration event has occurred. The consolidation analysis includes a detailed review of the terms of the fund's governing documents and a comparison of the significant terms against the consolidation criteria in ASC Topic 810, including a determination of whether the fund is a VIE or a VOE. Seed money and co-investments in managed funds in which the company has determined that it is the primary beneficiary or in which the company has a controlling financial interest are consolidated if the impact of doing so is deemed material. Otherwise, these investments are accounted for as described in the “Investments” accounting policy below.
Upon consolidation of an investment product, the company's gain or loss on its investment (before consolidation) eliminates with the company's share of the offsetting loss or gain in the fund. Upon consolidation of CLOs, the company's and the funds' accounting policies are effectively aligned, resulting in the reclassification of the company's gain or loss (representing the changes in the market value of the company's holding in the consolidated fund) from other comprehensive income into other gains/losses. The net impact from consolidation of funds previously carried as available-for-sale investments to net income attributable to Invesco Ltd. in each period primarily represents the changes in the value of the company's holdings in its consolidated CLOs.
90
Consolidation of CLOs
A significant portion of VIEs are CLOs. CLOs are investment vehicles created for the sole purpose of issuing collateralized loan instruments that offer investors the opportunity for returns that vary with the risk level of their investment. The notes issued by the CLOs are backed by diversified collateral asset portfolios consisting primarily of loans or structured debt. For managing the collateral of the CLO entities, the company earns investment management fees, including in some cases subordinated management fees, as well as contingent performance fees. The company has invested in certain of the entities, generally taking a portion of the unrated, junior subordinated position. The company's investments in CLOs are generally subordinated to other interests in the entities and entitle the company and other subordinated tranche investors to receive the residual cash flows, if any, from the entities. The company's subordinated interest can take the form of (1) subordinated notes, (2) income notes or (3) preference/preferred shares. The company has determined that, although the junior tranches have certain characteristics of equity, they should be accounted for and disclosed as debt on the company's Consolidated Balance Sheets, as the subordinated and income notes have a stated maturity indicating a date for which they are mandatorily redeemable. The preference shares are also classified as debt, as redemption is required only upon liquidation or termination of the CLO and not of the company.
The company determined that it was the primary beneficiary of certain CLOs, as it has the power to direct the activities of the CLOs that most significantly impact the CLOs' economic performance, and the obligation to absorb losses/right to receive benefits from the CLOs that could potentially be significant to the CLOs. The primary beneficiary assessment includes an analysis of the rights of the company in its capacity as investment manager. In some CLOs, the company's role as investment manager provides that the company contractually has the power, as defined in ASC Topic 810, to direct the activities of the CLOs that most significantly impact the CLOs' economic performance, such as managing the collateral portfolio and the CLOs' credit risk. In other CLOs, the company determined that it does not have this power in its role as investment manager due to certain rights held by other investors in the products or restrictions that limit the company's ability to manage the collateral portfolio and its credit risk. Additionally, the primary beneficiary assessment includes an analysis of the company's rights to receive benefits and obligations to absorb losses associated with its first loss position and management/performance fees.
The company has elected the fair value option under ASC Topic 825-10-25 to measure the assets of all consolidated CLOs at fair value. All of the investments held by VIEs are presented at fair value in the company's Consolidated Balance Sheets at
December 31, 2017
and
2016
. The company adopted Accounting Standards Update 2014-13, "Measuring the Financial Assets and the Financial Liabilities of a Consolidated Collateralized Financing Entity" (ASU 2014-13) on January 1, 2015, and accordingly the notes issued by consolidated CLOs are no longer carried at fair value but are now measured under the measurement alternative discussed in ASU 2014-13. The measurement alternative requires that the reporting entity measure both the financial assets and the fair value of the financial liabilities of the CFE by using the more observable of the fair value of the financial assets and the fair value of the financial liabilities, removing any measurement difference previously recorded as net income (loss) attributable to noncontrolling interests in consolidated entities and as an adjustment to retained earnings appropriated for investors in CIP. The company’s subsequent earnings from consolidated CLOs reflect changes in fair value of its own economic interests in the CLOs. Gains or losses on assets and liabilities of the CLOs are not attributed to noncontrolling interests but are offset in other gains/(losses) of CIP.
Consolidation of Private Equity, Real Estate, and Fund-of-Funds
The company also consolidates certain private equity funds and from time to time real estate funds that are structured as partnerships in which the company is the general partner receiving a management and/or performance fee. Private equity investments made by the underlying funds consist of direct investments in, or fund investments in other private equity funds that hold direct investments in, equity or debt securities of operating companies that are generally not initially publicly traded. Private equity funds are considered investment companies and are therefore accounted for under ASC Topic 946, “Financial Services - Investment Companies.” The company has retained the specialized industry accounting principles of these investment products in its Consolidated Financial Statements. See Note
19
, “Consolidated Investment Products,” for additional details.
Consolidation basis
The Consolidated Financial Statements have been prepared primarily on the historical cost basis; however, certain items are presented using other bases such as fair value, where such treatment is required or voluntarily elected, as discussed above. The financial statements of subsidiaries, with the exception of certain CIP, are prepared for the same reporting period as the Parent and use consistent accounting policies, which, where applicable, have been adjusted to U.S. GAAP from local generally accepted accounting principles or reporting regulations. The financial information of certain CIP is included in the company's Consolidated Financial Statements on a
one
-month or a
three
-month lag based upon the availability of fund financial information. Noncontrolling interests in consolidated entities represents the interests in certain entities consolidated by the company either because the company has control over the entity or has determined that it is the primary beneficiary, but of which the company does not own all of the
91
entity's equity. To the extent that noncontrolling interests represent equity which is redeemable or convertible for cash or other assets at the option of the equity holder, these are deemed to represent temporary equity, and are classified as equity attributable to redeemable noncontrolling interests in the Consolidated Balance Sheets. Nonredeemable noncontrolling interests are classified as a component of permanent equity.
Use of Estimates
In preparing the Consolidated Financial Statements, management is required to make estimates and assumptions that affect reported revenues, expenses, assets, liabilities, and disclosure of contingent liabilities. The primary estimates and assumptions made relate to goodwill and intangible impairment, certain investments which are carried at fair value, post-employment benefit plan obligations, and taxes. Additionally, estimation is involved when determining investment and debt valuation for certain CIP; however, changes in the fair values of these amounts are largely offset by noncontrolling interests. Use of available information and application of judgment are inherent in the formation of estimates. Actual results in the future could differ from such estimates and the differences may be material to the Consolidated Financial Statements.
Reclassifications
The presentation of certain prior period amounts has been reclassified to be consistent with the current period presentation. Such reclassifications had no impact on total operating revenues, operating expenses, net income, total assets, total liabilities, or equity attributable to Invesco Ltd.
Acquisition Accounting
In accordance with ASC Topic 805, “Business Combinations," any excess of the cost of the acquisition over the fair values of the identifiable net assets acquired attributable to the company is recognized as goodwill. With certain exceptions,
100%
of the fair values of assets acquired, liabilities assumed, and noncontrolling interests is recognized in acquisitions of less than a
100%
controlling interest when the acquisition constitutes a change in control of the acquired entity. Additionally, when partial ownership in an acquiree is obtained and it is determined that the company controls the acquiree, the assets acquired, liabilities assumed and any noncontrolling interests are recognized and consolidated at
100%
of their fair values at that date, regardless of the percentage ownership in the acquiree. As goodwill is calculated as a residual, all goodwill of the acquired business, not just the company's share, is recognized under this “full-goodwill” approach. Noncontrolling interests are stated at the noncontrolling shareholder's proportion of the pre-acquisition carrying values of the acquired net assets. The results of entities acquired or sold during the year are included from or to the date control changes.
Contingent consideration obligations that are elements of consideration transferred are recognized as of the acquisition date as part of the fair value transferred in exchange for the acquired business. Acquisition-related costs incurred in connection with a business combination are expensed.
Cash and Cash Equivalents
Cash and cash equivalents consist of cash held at banks and short-term investments with a maturity upon acquisition of three months or less. Cash and cash equivalents of CIP are not available for general use by the company.
Cash balances may not be readily accessible to the Parent due to capital adequacy requirements of certain of our subsidiaries.
These and other similar provisions of applicable laws and regulations may have the effect of limiting withdrawals of capital, repayment of intercompany loans and payment of dividends by such entities. All of our regulated EU subsidiaries are subject to consolidated capital requirements under EU Directives, including those arising from the EU's Capital Requirements Directive and the U.K.'s Internal Capital Adequacy Assessment Process (ICAAP), and capital is maintained within this sub-group to satisfy these regulations. We meet these requirements in part by holding cash and cash equivalents. This retained cash can be used for general business purposes in the European sub-group in the countries where it is located. Due to the capital restrictions, the ability to transfer cash between certain jurisdictions may be limited. In addition, transfers of cash between international jurisdictions may have adverse tax consequences.
The company is in compliance with all regulatory minimum net capital requirements.
In addition, the company is required to hold cash deposits with clearing organizations or to otherwise segregate cash to maintain compliance with federal and other regulations in connection with its UIT broker dealer entity. At
December 31, 2017
these cash deposits totaled
$11.4 million
(year ended
December 31, 2016
:
$11.4 million
).
92
Unsettled Fund Receivables and Payables
The company records unsettled fund receivables from underlying fund investors in certain fund products outside the U.S. when these investors place unsettled investments into the funds. Additionally, the company records unsettled fund receivables from certain non-U.S. funds during the settlement period when underlying fund investors redeem their holdings. Settlement periods for both receivables from underlying investors and funds are generally less than four days. Additionally, in its capacity as sponsor of UITs, the company records receivables from brokers, dealers, and clearing organizations for unsettled sell trades of securities and UITs in addition to receivables from customers for unsettled sell trades of UITs. The company also records payables to brokers, dealers, and clearing organization for unsettled buy trades of securities and UITs in addition to payables to customers for unsettled buy trades of securities and UITs. The presentation of the unsettled fund receivables and substantially offsetting payables at trade date reflects the legal relationship between the underlying investor and the company.
Accounts Receivable and Payable
Accounts receivable and payable are recorded at their original invoice amounts. Accounts receivable are also recorded less any allowance for uncollectible amounts.
Investments
The majority of the company’s investment balances relate to balances held in affiliated funds. In the normal course of business, the company invests in various types of affiliated investment products, either as “seed money” or as longer-term investments alongside third-party investors, typically referred to as “co-investments.” Seed money investments are investments held in Invesco managed funds with the purpose of providing capital to the funds during their development periods to allow the funds to achieve critical mass, establish their track records, and obtain third-party investments. Seed money may also be held for regulatory purposes in certain jurisdictions. Co-investments are often required of the investment manager by third-party investors in closed-ended funds to demonstrate an aligning of the investment manager’s interests with those of the third-party investors. The company also invests in affiliated funds in connection with its deferred compensation plans, whereby certain employees defer portions of their annual bonus into funds.
Investments are categorized in this Report as available-for-sale, trading, equity method, foreign time deposits, and other investments. See Note
3
“Investments” for additional details.
Available-for-sale investments include seed money, co-investments in affiliated CLOs, and investments in other debt securities. Available-for-sale investments are measured at fair value. Gains or losses arising from changes in the fair value of available-for-sale investments are recognized in accumulated other comprehensive income, net of tax, until the investment is sold or otherwise disposed of, or if the investment is determined to be other-than-temporarily impaired, at which time the cumulative gain or loss previously reported in equity is included in income. The specific identification method is used to determine the realized gain or loss on securities sold or otherwise disposed.
Trading investments include investments held to settle the company’s deferred compensation plan liabilities, seed money, as well as trading and investing activities in equity and debt securities entered into in its capacity as sponsor of UITs, and other equity securities. Trading securities are securities bought and held principally for the purpose of selling them in the near term. Trading investments are measured at fair value. Gains or losses arising from changes in the fair value of trading investments are included in income.
Equity method investments include investments over which the company is deemed to have significant influence, including corporate joint ventures and non-controlled entities in which the company's ownership is between 20 and 50 percent, and co-investments in certain managed funds generally structured as partnerships or similar vehicles. Investments in joint ventures are investments jointly controlled by the company and external parties. Co-investments in managed funds structured as partnerships or similar vehicles include private equity, real estate, and fund-of-funds. The equity method of accounting requires that the investment is initially recorded at cost, including any excess value paid over the book value of the investment acquired. The carrying amount of the investment is increased or decreased to recognize the company's share of the after-tax profit or loss of the investee after the date of acquisition. The proportionate share of income or loss is included in equity in earnings of unconsolidated affiliates in the Consolidated Statements of Income, and the proportionate share of other comprehensive income or loss is included in accumulated other comprehensive income in the Consolidated Balance Sheets.
Seed money and co-investments in managed funds are required to be consolidated by the company if certain criteria are met. Upon consolidation of material balances, the company’s seed money or co-investment balance is eliminated, and the underlying investments of the managed fund are reflected on the company’s Consolidated Balance Sheets at fair value. These underlying investments are presented in the company's Consolidated Financial Statements as CIP investments. See “Basis of Accounting and
93
Consolidation” for additional information regarding the consolidation criteria. If the company subsequently determines that it no longer controls the managed funds in which it has invested, the company will deconsolidate the funds. Any remaining holding in the managed funds is then accounted for on the bases described above.
Fair value is determined using a valuation hierarchy (discussed in Note
2
, “Fair Value of Assets and Liabilities”), generally by reference to an active trading market, using quoted closing or bid prices as of each reporting period end. When a readily ascertainable market value does not exist for an investment, the fair value is calculated based on the expected cash flows of its underlying net asset base, taking into account applicable discount rates and other factors. Judgment is used to ascertain if a formerly active market has become inactive and in determining fair values when markets have become inactive.
The company evaluates the carrying value of investments for impairment on a quarterly basis. In its impairment analysis, the company takes into consideration numerous criteria, including the duration and extent of any decline in fair value, the intent and ability of the company to hold the security for a period of time sufficient for a recovery in value, recent events specific to the issuer or industry and external credit ratings and recent downgrades with respect to issuers of debt securities held. If the decline in value is determined to be other-than-temporary, the carrying value of the security is generally written down to fair value through the income statement. If the fair value of a debt security, however, is less than its amortized cost, the decline in value is determined to be other-than-temporary, and the company intends to sell the debt security or it is more likely than not that the company will be required to sell the debt security before the recovery of its amortized cost basis, the entire difference between the investment's amortized cost basis and its fair value is recognized as an other-than-temporary impairment through the income statement. If the company does not intend to sell the debt security, and it is not more likely than not that the company will be required to sell the debt security before recovery of its amortized cost basis, then the other-than-temporary impairment is separated into two components: a) the amount representing the credit loss, which is recorded as a charge in the Consolidated Statements of Income, and b) the amount related to all other factors, which is recognized in the Consolidated Statements of Comprehensive Income, net of tax.
Assets Held for Policyholders and Policyholder Payables
One of the company's subsidiaries, Invesco Perpetual Life Limited, is an insurance entity that was established to facilitate retirement savings plans in the U.K. The entity holds assets that are managed for its clients on its balance sheet with an equal and offsetting liability to the policyholders, which is linked to the value of the investments. The investments are legally segregated and are generally not subject to claims that arise from any of the company's other businesses. Investments and policyholder payables held by this business meet the definition of financial instruments and are carried in the Consolidated Balance Sheets as separate account assets and liabilities at fair value in accordance with ASC Topic 944, “Financial Services - Insurance.” Changes in fair value are recorded and offset to zero in the Consolidated Statements of Income in other operating revenues. Management fees earned from policyholder investments are accounted for as described in the company's revenue recognition accounting policy.
Deferred Sales Commissions
Mutual fund shares sold without a sales commission at the time of purchase typically have an asset-based fee (12b-1 fee) that is charged to the fund over a period of years and a contingent deferred sales charge (CDSC). The CDSC is an asset-based fee that is charged to investors that redeem during a stated period. Commissions paid at the date of sale to brokers and dealers for sales of mutual funds that have a CDSC are capitalized and amortized over a period not to exceed the redemption period of the related fund (generally up to
six years
). The deferred sales commission asset, which is included in prepaid assets in our Consolidated Balance Sheets,
is reviewed periodically for impairment by reviewing the recoverability of the asset based on estimated future fees to be collected.
94
Property, Equipment, Software and Depreciation
Property, equipment and software includes owned property, leasehold improvements, computer hardware/software and other equipment and is stated at cost less accumulated depreciation or amortization and any previously recorded impairment in value. Expenditures for major additions and improvements are capitalized; minor replacements, maintenance and repairs are charged to expense as incurred. Amounts incurred are presented as work-in-progress until the construction or purchase of the property and equipment is substantially complete and ready for its intended use, which, at that point, will begin to be depreciated or amortized. Depreciation is provided on property and equipment at rates calculated to write off the cost, less estimated residual value, of each asset on a straight-line basis over its expected useful life: owned buildings over
50 years
, leasehold improvements over the shorter of the lease term or useful life of the improvement; and computers and other various equipment between
three
and
seven
years. Purchased and internally developed software is capitalized where the related costs can be measured reliably, and it is probable that the asset will generate future economic benefits, and amortized into operating expenses on a straight-line basis over its useful life, generally over
five
to
seven
years. The company capitalizes qualified internal and external costs incurred during the application development stage for internally developed software in accordance with ASC Topic 350-40, “Intangibles - Goodwill and Other - Internal-Use Software.” The company reevaluates the useful life determination for property and equipment each reporting period to determine whether events and circumstances warrant a revision to the remaining useful life. On sale or retirement, the asset cost and related accumulated depreciation are removed from the Consolidated Financial Statements and any related gain or loss is reflected in income.
The carrying amounts of property and equipment are reviewed for impairment when events or changes in circumstances indicate that the carrying values may not be recoverable. At each reporting date, an assessment is made for any indication of impairment. If an indication of impairment exists, recoverability is tested by comparing the carrying amount of the asset to the net undiscounted cash flows expected to be generated from the asset. If those net undiscounted cash flows do not exceed the carrying amount (i.e. the asset is not recoverable), the next step would be performed, which is to determine the fair value of the asset and record an impairment charge, if any.
Intangible Assets
Intangible assets identified on the acquisition of a business are capitalized separately from goodwill if the fair value can be measured reliably on initial recognition (transaction date) and, if they are determined to be finite-lived, are amortized and recorded as operating expenses on a straight-line basis over their useful lives, from
two
to
twelve
years, which reflects the pattern in which the economic benefits are realized. Intangible assets consist primarily of mutual fund and other client management contracts, customer relationships and distribution agreements. The company considers its own assumptions, which require management's judgment, about renewal or extension of the term of the arrangement, consistent with its expected use of the asset. A change in the useful life of an intangible asset could have a significant impact on the company's amortization expense.
Where evidence exists that the underlying arrangements have a high likelihood of continued renewal at little or no cost to the company, the intangible asset is assigned an indefinite life and reviewed for impairment on an annual basis. The company reevaluates the useful life determination for intangible assets each reporting period to determine whether events and circumstances warrant a revision to the remaining useful life or an indication of impairment. Management contracts that are managed and operated on a single global platform are reviewed in aggregate as one unit of valuation and are considered interchangeable because investors may freely transfer between funds. Similarly, cash flows generated by new funds added to the global platform are included when determining the fair value of the intangible asset.
Definite-lived intangible assets are reviewed for impairment whenever events or changes in circumstances indicate that their carrying amount may not be recoverable. In addition, management judgment is required to estimate the period over which definite-lived intangible assets will contribute to the company's cash flows and the pattern in which these assets will be consumed. Intangible assets not subject to amortization are tested for impairment annually as of October 1 or more frequently if events or changes in circumstances indicate that the asset might be impaired. The impairment test consists of a comparison of the fair value of an intangible asset with its carrying amount. If the carrying amount of the intangible asset exceeds its fair value, an impairment loss is recognized in an amount equal to that excess. Fair value is generally determined using an income approach where estimated future cash flows are discounted to arrive at a single present value amount.
95
Goodwill
Goodwill represents the excess of cost over the identifiable net assets of businesses acquired and is recorded in the functional currency of the acquired entity. Goodwill is recognized as an asset and is reviewed for impairment annually as of October 1 and between annual tests when events and circumstances indicate that impairment may have occurred. The company has determined that it has
one
reporting unit for goodwill impairment testing purposes, the consolidated Invesco Ltd. single operating segment, which is consistent with internal management reporting and management's oversight of operations. The company evaluated the components of its business, which are business units one level below the operating segment level in making this determination. The company's operating segment represents one reporting unit because all of the components are similar due to the common nature of products and services offered, type of clients, methods of distribution, manner in which each component is operated, extent to which they share assets and resources, and the extent to which they support and benefit from common product development efforts. Traditional profit and loss measures are not produced and therefore not reviewed by component management for any of the components. Furthermore, the financial information that is available by component is not sufficient for purposes of performing a discounted cash flow analysis at the component level in order to test goodwill for impairment at that level. As none of the company's components are reporting units, the company has determined that its single operating segment, investment management, is also its single reporting unit.
ASU 2011-08 allows the option to first qualitatively assess whether it is more likely than not that the fair value of a reporting unit is less than its carrying value. The company did not utilize this optio
n in
2017
a
nd performed a quantitative impairment test. The impairment test for goodwill consists of a two-step approach, which is performed at the reporting unit level. If the carrying amount of the reporting unit exceeds its fair value (the first step of the goodwill impairment test), then the second step is performed to determine if goodwill is impaired and to measure the amount of the impairment loss, if any. The second step of the goodwill impairment test compares the implied fair value of goodwill with the carrying amount of goodwill. If the carrying amount of goodwill exceeds the implied fair value of goodwill, an impairment loss is recognized in an amount equal to that excess.
The principal method of determining fair value of the reporting unit is an income approach where estimated future cash flows are discounted to arrive at a single present value amount. The discount rate used is derived based on the time value of money and the risk profile of the stream of future cash flows. Recent results and projections based on expectations regarding revenue, expenses, capital expenditure and acquisition earn out payments produce a present value for the reporting unit. The present value produced for the reporting unit is the fair value of the reporting unit. This amount is reconciled to the company's market capitalization to determine an implied control premium, which is compared to an analysis of historical control premiums experienced by peer companies over a long period of time to assess the reasonableness of the fair value of the reporting unit.
The company also utilizes a market approach to provide a secondary and corroborative fair value of the reporting unit by using comparable company and transaction multiples to estimate values for our single reporting unit. Discretion and judgment are required in determining whether the transaction data available represents information for companies of comparable nature, scope and size. The results of the secondary market approach to provide a fair value estimate are not combined or weighted with the results of the income approach described above but are used to provide an additional basis to determine the reasonableness of the income approach fair value estimate.
Debt and Financing Costs
Debt issuance costs related to the issuance of Senior Notes are presented as a deduction from the carrying amount of the related debt liability. Debt issuance costs related to the company's credit facility are presented as a deferred asset within Other Assets on the company's Consolidated Balance Sheets. After initial recognition, debt issuance costs are measured at amortized cost. Finance charges and debt issuance costs are amortized over the term of the debt using the effective interest method. Interest charges are recognized in the Consolidated Statement of Income in the period in which they are incurred.
Revenue Recognition
Revenue is measured at the fair value of consideration received or receivable and represents amounts receivable for services provided in the normal course of business, net of discounts, value added tax and other sales-related taxes. Revenue is recognized when there is persuasive evidence of an arrangement, delivery has occurred or services have been provided, collectability is reasonably assured and the revenue can be reliably measured. Revenue represents management, service and distribution, performance and other fees. Revenue is generally accrued over the period for which the service is provided.
Investment management fees are derived from providing professional services to manage client accounts and include fees earned from retail mutual funds, investment companies with variable capital (ICVCs), societes d'investissement a capital variable (SICAVs), exchange-traded funds, investment trusts, other collective investment vehicles, and institutional management contracts.
96
Investment management fees for products offered in the retail distribution channel are generally calculated as a percentage of the daily average asset balances and therefore vary as the levels of AUM change resulting from inflows, outflows and market movements. Investment management fees for products offered in the institutional distribution channel are calculated in accordance with the underlying investment management contracts and also vary in relation to the level of client assets managed.
Service fees are generated through fees charged to cover several types of expenses, including fund accounting fees and other maintenance costs for mutual funds and SICAVs and administrative fees earned from closed-ended funds. Service fees also include transfer agent fees, which are fees charged to cover the expense of processing client share purchases and redemptions, call center support and client reporting. U.S. distribution fees can include 12b-1 fees earned from certain mutual funds to cover allowable sales and marketing expenses for those funds and also include asset-based sales charges paid by certain mutual funds for a period of time after the sale of those funds. Distribution fees typically vary in relation to the amount of client assets managed. Generally, retail products offered outside of the U.S. do not generate a separate distribution fee, as the quoted management fee rate is inclusive of these services.
Performance fee revenues, including carried interests and performance fees related to partnership investments and separate accounts, are generated on certain management contracts when performance hurdles are achieved. Such fee revenues are recorded in operating revenues as of the performance measurement date, when the contractual performance criteria have been met and when the outcome of the transaction can be measured reliably in accordance with Method 1 of ASC Topic 605-20-S99, “Revenue Recognition - Services - SEC Materials.” Cash receipt of performance fees generally occurs after the contractual measurement date; however, the company may receive, from time-to-time, cash distributions of carried interest before the measurement date. Such distributions are reflected as deferred carried interest liabilities within accounts payable and accrued expenses on the Consolidated Balance Sheets. The performance measurement date is defined in each contract in which incentive and performance fee revenue agreements are in effect, and therefore the company has performance fee arrangements that include monthly, quarterly and annual measurement dates. Given the uniqueness of each transaction, performance fee contracts are evaluated on an individual basis to determine if revenues can and should be recognized. The company does not recognize performance fee revenues if there are any future performance contingencies associated with them. As such, these fees are generally not recorded as revenue until the likelihood of claw-back is mathematically improbable. If performance arrangements require repayment of the performance fee for failure to perform during the contractual period, then performance fee revenues are recognized no earlier than the expiration date of these terms. At such point, the associated revenues are considered earned. Performance fees will fluctuate from period to period and may not correlate with general market changes, since most of the fees are driven by relative performance to the respective benchmark rather than by absolute performance.
Other revenues include fees derived primarily from transaction commissions earned upon the sale of new investments into certain of our funds and fees earned upon the completion of transactions in our real estate and private equity asset groups. Real estate transaction fees are derived from commissions earned through the buying and selling of properties. Private equity transaction fees include commissions associated with the restructuring of, and fees from providing advice to, portfolio companies held by the funds. These transaction fees are recorded in the Consolidated Financial Statements on the date when the transactions are legally closed. In its capacity as sponsor of UITs, the company earns other revenues related to transactional sales charges resulting from the sale of UIT products and from the difference between the purchase or bid and offer price of securities temporarily held to form new UIT products. These revenues are recorded as other revenues net of concessions to dealers who distribute UITs to investors.
Distribution, service and advisory fees that are passed through to external parties are presented separately as expenses in accordance with ASC Topic 605-45, “Revenue Recognition - Principal Agent Considerations.” Third-party distribution, service and advisory expenses include periodic “renewal” commissions paid to brokers and independent financial advisors for the continuing oversight of their clients' assets over the time they are invested and are payments for the servicing of client accounts. Renewal commissions are calculated based upon a percentage of the AUM value and apply to much of the company's non-U.S. retail operations, where they can also take the form of management fee rebates. As discussed above, the revenues from our U.S. retail operations include 12b-1 distribution fees, which are passed through to brokers who sell the funds as third-party distribution expenses along with additional marketing support distribution costs. Both the revenues and the costs are dependent on the underlying AUM of the brokers' clients. Third-party distribution expenses also include the amortization of upfront commissions paid to broker-dealers for sales of fund shares with a contingent deferred sales charge (a charge levied to the investor for client redemption of AUM within a certain contracted period of time). The distribution commissions are amortized over the redemption period. Also included in third-party distribution, service and advisory expenses are sub-transfer agency fees that are paid to third parties for processing client share purchases and redemptions, call center support and client reporting.
Interest income is accrued on interest-bearing assets.
Dividend income from investments is recognized on the ex-dividend date.
97
Money Market Fee Waivers
The company is currently voluntarily providing yield support waivers of its management fees on certain money market funds to ensure that they maintain a minimum level of daily net investment income. For the year ended
December 31, 2017
, yield support waivers resulted in a reduction of management and service and distribution fees of approximately
$4.7 million
. During the year ended December 31, 2017, approximately
70.0%
of yield support waivers were offset by a reduction in third party distribution, service and advisory expenses, resulting in a net waiver of
$1.4 million
. The company may increase or decrease the level of fee waivers in future periods.
Share-Based Compensation
The company issues equity-settled share-based awards to certain employees, which are measured at fair value at the date of grant. The fair value determined at the grant date is expensed, based on the company's estimate of shares that will eventually vest, on a straight-line or accelerated basis over the vesting period. The initial forfeiture rate applied to most grants is
3%
per year, based upon the company's historical experience with respect to employee turnover. Fair value for the share awards representing equity interests identical to those associated with shares traded in the open market is determined using the market price at the date of grant.
Deferred Compensation
The company issues deferred cash awards to certain employees which are linked in value to investment products. The employees may earn a return linked to the appreciation or depreciation of specified investments, typically the funds they manage. The company currently hedges economically the exposure to market movements on certain of its deferred compensation plans by holding the investments on its balance sheet and through a total return swap financial instrument. The company recognizes as compensation expense the value of the liability to employees, including the appreciation or depreciation of the liability, over the award's vesting period in proportion to the vested amount of the award. The company immediately recognizes the full value of the related investment, and any subsequent appreciation or depreciation of the investment, in Other gains and losses, net.
Pensions
For defined contribution plans, contributions payable related to the accounting period are charged to the income statement. For defined benefit plans, the cost of providing benefits is separately determined for each plan using the projected unit credit method, based on actuarial valuations performed at each balance sheet date. The company's annual measurement date is December 31. A portion of actuarial gains and losses is recognized through the income statement if the net cumulative unrecognized actuarial gain or loss at the end of the prior period exceeds the greater of
10.0%
of the present value of the defined benefit obligation (before deducting plan assets) at that date and
10.0%
of the fair value of any plan assets.
Advertising Costs
The company expenses the cost of all advertising and promotional activities as incurred. The company incurred advertising costs of
$37.2 million
for the year ended
December 31, 2017
(
December 31, 2016
:
$32.7 million
;
December 31, 2015
:
$35.4 million
). These amounts are included in marketing expenses in the Consolidated Statements of Income.
Leases
The company complies with lease accounting in accordance with ASC Topic 840, "Leases.” Under operating leases, where the lessor retains substantially all the risks and benefits of ownership of the asset, rental payments, as well as any step rent provisions specified in lease agreements, are aggregated and charged evenly to expense over the lease term beginning on the date of initial possession or the effective date of the lease agreement. Maintenance, utility, and tax costs included in lease agreements are expensed in the period incurred. Rental payments dependent upon an existing index or rate are included in the minimum lease payments based on the index or rate in effect at the inception of the lease and are recognized on a straight-line basis over the minimum lease term. Changes in rental payments that result from subsequent changes in the index or rate are expensed in the period incurred. Capital improvement funding and other lease concessions provided by the landlord are recorded as a deferred liability and are amortized evenly over the lease term as a reduction of rental expense.
The company accounts for lease termination costs in accordance with ASC Topic 420, “Exit or Disposal Cost Obligations,” which requires that (1) a liability for costs to terminate a contract before the end of its term shall be recognized at the time termination occurs and measured at fair value and (2) a liability for costs that will continue to be incurred under a contract for its remaining
98
term without economic benefit to the company be recognized and measured at its fair value when the company ceases to use the right conveyed by the contract, net of estimated sublease rentals that could reasonably be obtained even if the company does not anticipate entering into any subleasing arrangements.
Taxation
Income taxes are provided for in accordance with ASC Topic 740, “Income Taxes” (ASC Topic 740). Deferred tax assets and liabilities are recorded for temporary differences between the tax basis of assets and liabilities and the reported amounts in the Consolidated Financial Statements, using the statutory tax rates in effect for the year in which the differences are expected to reverse. The effect on deferred tax assets and liabilities of a change in tax rates is recognized in the results of operations in the period that includes the enactment date. A valuation allowance is recorded to reduce the carrying amounts of deferred tax assets to the amount that is more likely than not to be realized. The company reports a liability for unrecognized tax benefits resulting from uncertain tax positions taken or expected to be taken in a tax return. The company recognizes interest and penalties, if any, related to unrecognized tax benefits in income tax expense.
Certain income tax effects of the 2017 Tax Act are reflected in our financial results in accordance with Staff Accounting Bulletin No. 118 (SAB 118), which provides SEC staff guidance regarding the application of ASC Topic 740 in the reporting period in which the 2017 Tax Act became law. See also Item 8, Financial Statements and Supplementary Data - in Note 15, "Taxation," for further details and additional discussion on estimated amounts recorded as of December 31, 2017 for the 2017 Tax Act.
Earnings Per Share
Basic and diluted earnings per share are computed using the two-class method, which treats unvested restricted shares as if they were a separate class of shares. Under the two-class method, net income attributable to Invesco Ltd. is adjusted for the allocation of earnings to the unvested restricted shares. In addition, the weighted-average shares outstanding is adjusted for unvested restricted shares. There is no difference between the calculated earnings per share amounts attributable to Invesco Ltd. and the calculated earnings per share amounts under the two-class method.
Comprehensive Income
The company's other comprehensive income/(loss) consists of changes in unrealized gains and losses on investment securities classified as available-for-sale, the company's share of other comprehensive income of equity method investments, reclassification adjustments for realized gains/(losses) on those investment securities classified as available-for-sale, foreign currency translation adjustments and employee benefit plan liability adjustments. Such amounts are recorded net of applicable taxes.
Dividends to Shareholders
Dividends to shareholders are recognized on the declaration date. Dividends are declared and paid on a quarterly basis.
Translation of Foreign Currencies
Transactions in foreign currencies (currencies other than the functional currencies of the company's subsidiaries) are recorded at the rates of exchange prevailing on the dates of the transactions. At each balance sheet date, monetary assets and liabilities that are denominated in foreign currencies are remeasured into the functional currencies of the company's subsidiaries at the rates prevailing at the balance sheet date. Gains and losses arising on revaluation are included in the Consolidated Statements of Income.
The company's reporting currency and the functional currency of the Parent is U.S. Dollars. On consolidation, the assets and liabilities of company subsidiary operations whose functional currencies are currencies other than the U.S. Dollar (“foreign” operations) are translated at the rates of exchange prevailing at the balance sheet date. Consolidated Statements of Income amounts are translated at the weighted average rates for the year, which approximate actual exchange rates. Exchange differences arising on the translation of the net assets of foreign operations are taken directly to accumulated other comprehensive income in equity until the disposal of the net investment, at which time they are recognized in the Consolidated Statements of Income. Goodwill and other fair value adjustments arising on acquisition of a foreign entity are treated as assets and liabilities of the foreign entity and are translated at rates of exchange prevailing at the balance sheet date.
The company has in the past purchased several put option contracts to hedge economically foreign currency risk on the translation of its Pound Sterling- and Euro-denominated earnings into U.S. Dollars. See Note
2
, "Fair Value of Assets and Liabilities," for additional information. Additionally, the company may, from time to time, designate certain intercompany debt as non-derivative net investment hedging instruments against foreign currency exposure related to its net investment in foreign operations. See
99
Note
10
, "Other Comprehensive Income/(Loss)." In the management of its cross-border fund operations, foreign currency forward and swap contracts are purchased daily to hedge against foreign exchange rate movements during the four-day client money settlement period. Certain CIP may also utilize such instruments.
Accounting Pronouncements Recently Adopted and Pending Accounting Pronouncements
In May 2014, the FASB issued Accounting Standards Update 2014-09, “Revenue from Contracts with Customers” (ASU 2014-09) which revises revenue recognition criteria and expands disclosure requirements. This new guidance will be effective for interim and annual reporting periods beginning after December 15, 2017. The company has elected to implement this new accounting standard on January 1, 2018 using the modified retrospective transition method applied to those contracts which were not completed as of that date. Under this method, entities are required to report any effect from adoption as a cumulative effect adjustment to retained earnings at the adoption date. The company does not currently expect to report any adjustments to opening retained earnings and does not expect that the new standard will have a material impact on net income or earnings per share measures.
The underlying premise of the new guidance requires the use of a five step model to determine the amount of revenue that reflects the consideration that the company is entitled to for the transfer of services to customers and the timing of such revenue recognition. In addition, ASU 2014-09 also requires certain costs to obtain and fulfill contracts with customers to be capitalized, if they meet certain criteria. The company does not anticipate capitalizing any contract costs.
A key part of management’s implementation efforts included a detailed review of the terms and conditions of a sample of revenue contracts covering a broad range of products across geographic locations. Based upon management’s findings, the company does not anticipate a change in the timing of revenue recognition for investment management and service and distribution fee revenues. The timing of recognition for performance fees (including carried interest) is driven by the terms of each performance fee arrangement. Management has determined that there will not be a cumulative adjustment to opening retained earnings related to performance fee revenues.
Due to the revised criteria related to whether or not the company is acting as a principal or agent, the company expects a change in presentation related to certain costs incurred to fulfill its performance obligations, which are currently presented on a net basis and will be presented as an expense under the new guidance. Furthermore, Investment management fee revenues will be reduced by certain amounts that have previously been reported in Third-party distribution, service and advisory expense.
In February 2015, the FASB issued Accounting Standard Update 2015-02, “Consolidation (Topic 810): Amendments to the Consolidation Analysis.” This standard modifies existing consolidation guidance for reporting organizations that are required to evaluate whether they should consolidate certain legal entities. The company adopted ASU 2015-02 on January 1, 2016 using the modified retrospective approach, which did not require the restatement of prior periods to conform to the post-adoption presentation. The impacts of the adoption of ASU 2015-02 on January 1, 2016 were as follows:
|
•
|
The company consolidated CIP with total assets and liabilities/equity of
$458.5 million
. The company deconsolidated CIP with total assets and total liabilities and equity of
$3,170.6 million
, including CLOs of
$2,366.5 million
.
|
|
•
|
VOE partnership entities (consolidated private equity and fund-of-fund entities) became VIEs upon the adoption and were deconsolidated, along with certain VIE partnership entities.
|
|
•
|
The adoption resulted in the consolidation of certain investment products which became VIEs upon adoption and which were not previously consolidated.
|
|
•
|
The funds consolidated in prior periods as Consolidated Sponsored Investment Products, "CSIP," became VIEs. Accordingly, with effect from January 1, 2016, the consolidation of all VIEs is presented in the aggregate as part of CIP. See Note
19
“Consolidated Investment Products.”
|
In January 2016, the FASB issued Accounting Standards Update 2016-01, “Financial Instruments - Overall: Recognition and Measurement of Financial Assets and Financial Liabilities” (ASU 2016-01). The standard amends certain aspects of recognition, measurement, presentation, and disclosure of financial assets and liabilities. ASU 2016-01 is effective for fiscal years, and interim periods within those years, beginning after December 15, 2017 and, in general, requires a modified retrospective approach to adoption. The standard is effective for the company January 1, 2018. The standard requires that all equity investments, other than those accounted for as equity method investments, be measured at fair value with changes recognized in income. The standard also requires that all net unrealized holding gains related to available-for-sale equity investments be reclassified from accumulated other comprehensive income into retained earnings at the date of adoption. At
December 31, 2017
, the company held available-for-sale seed money investments of
$69.3 million
; net unrealized holding gains on these investments were
$4.2 million
. Based on the company’s assessment of the standard to date, no other significant changes are anticipated.
100
In February 2016, the FASB issued Accounting Standards Update 2016-02, “Leases” (ASU 2016-02). The standard requires that lessees recognize lease assets and lease liabilities on the balance sheet for all leases with a lease term greater than 12 months. ASU 2016-02 is effective for fiscal years and interim periods within those years beginning after December 15, 2018 and requires a modified retrospective approach to adoption. Early adoption is permitted; however, the Company plans to adopt ASU 2016-02 on January 1, 2019. The company is currently evaluating the potential impact of this standard which includes performing a review of a sample of lease arrangements.
In March 2016, the FASB issued Accounting Standards Update 2016-09, “Compensation - Stock Compensation: Improvements to Employee Share-Based Payment Accounting” (ASU 2016-09). The standard is intended to simplify aspects of the accounting for share-based payment transactions, including income tax impacts, classification on the statement of cash flows, and forfeitures. The company adopted ASU 2016-09 on January 1, 2017. One of the impacts of the new rules is that excess tax benefits and tax deficiencies related to vested awards are no longer recorded in additional paid-in-capital but rather as an income tax expense or benefit. This provision requires a prospective approach to adoption. In the year ended
December 31, 2017
, the recognition of excess tax benefits reduced our income tax provision by
$3.8 million
.
Another change resulting from the adoption of ASU 2016-09 relates to the presentation of these excess tax benefits and tax deficiencies in the Consolidated Statement of Cash Flows. The standard requires that excess tax benefits and tax deficiencies be shown as operating cash flows within the Consolidated Statements of Cash Flows; previously, the company reported these cash flow activities as financing cash flows. The company elected to use a prospective approach to adoption related to this provision and in the year ended
December 31, 2017
,
$3.8 million
cash inflows were included within the increase/(decrease) in payables as an operating cash flow in the Consolidated Statements of Cash Flows.
ASU 2016-09 requires that employee taxes paid when shares are withheld for tax withholding purposes be reported as a financing activity in the Consolidated Statements of Cash Flows. The company has retrospectively adopted this change and included
$63.8 million
in financing activities for the year ended
December 31, 2017
(
December 31, 2016
:
$42.0 million
;
December 31, 2015
:
$74.9 million
). Additionally, the new rules allow companies to elect to continue to account for forfeitures using an estimate or instead to elect to account for forfeitures as they occur. The company elected to continue to account for forfeitures using an estimate. The company anticipates fluctuations in its effective tax rate as a result of the excess tax benefits or tax deficiencies being recorded to the income tax provision, particularly in the first quarter of each year when annual share awards vest.
In June 2016, the FASB issued Accounting Standards Update 2016-13, “Financial Instruments-Credit Losses: Measurement of Credit Losses on Financial Instruments” (ASU 2016-13). ASU 2016-13 amends guidance on reporting credit losses for assets measured at amortized cost and available for sale securities. ASU 2016-13 is effective for fiscal years, and interim periods within those years, beginning after December 15, 2019 and requires a modified retrospective approach to adoption. Early adoption in fiscal years, and interim periods within those years, beginning after December 15, 2018 is permitted. The company is currently evaluating the potential impact of this standard.
In August 2016, the FASB issued Accounting Standards Update 2016-15, “Statement of Cash Flows - Classification of Certain Cash Receipts and Cash Payments” (ASU 2016-15). The standard addresses eight specific cash flow issues to reduce diversity in practice in how certain cash receipts and cash payments are presented on the Statements of Cash Flows. ASU 2016-15 is effective for fiscal years and interim periods within those years beginning after December 15, 2017 and the amendment requires a retrospective approach to adoption. The standard requires that an entity make an accounting policy election to classify distributions received from equity method investees using either the cumulative approach or the nature of the distribution approach. The company has elected to use the cumulative approach and continues to assess prior distributions received for the appropriate classification in the statement of cash flows.
In October 2016, the FASB issued Accounting Standards Update 2016-16, “Income Taxes: Intra-Entity Transfers of Assets Other than Inventory” (ASU 2016-16). The standard will require the recognition of income tax consequences of an intra-entity transfer of an asset other than inventory when the transfer occurs, instead of deferring the income tax recognition until the asset is sold to an outside party. ASU 2016-16 is effective for fiscal years and interim periods within those years beginning after December 15, 2017. The amendments require a modified retrospective approach to adoption. The company does not expect this standard to have a material impact on the company's financial condition, results of operations or cash flows.
In October 2016, the FASB issued Accounting Standards Update 2016-17, “Consolidation: Interests Held through Related Parties That Are under Common Control” (ASU 2016-17). The standard addresses how a reporting entity determines if it satisfies the characteristics of a primary beneficiary of a VIE and which party within a group is considered the primary beneficiary. The company adopted ASU 2016-17 on January 1, 2017 and determined that this guidance did not materially change the company's consolidation conclusions.
101
In November 2016, the FASB issued Accounting Standards Update 2016-18, “Statement of Cash Flows: Restricted Cash” (ASU 2016-18). The standard requires that a statement of cash flows explain the change during the period in the total of cash, cash equivalents, and amounts generally described as restricted cash or restricted cash equivalents. The amounts generally described as restricted cash and restricted cash equivalents should be included with cash and cash equivalents when reconciling the beginning-of-period and end-of-period total amounts shown on the statement of cash flows. ASU 2016-18 is effective for fiscal years and interim periods within those years beginning after December 15, 2017 and requires a retrospective approach to adoption. The standard is effective for the company January 1, 2018. For the year ended
December 31, 2017
, the change in cash held by CIP increased cash provided by operations by
$226.2 million
(year-ended
December 31, 2016
: the change in cash held by CIP decreased cash provided by operations by
$509.4 million
). After the adoption of ASU 2016-18, these changes in CIP cash will no longer be presented as a component of the company's cash provided by operations. Instead, the changes in CIP cash will form part of the reconciliation of corporate cash and CIP cash at the end of the Consolidated Statements of Cash Flows. The adoption of this standard does not impact corporate cash and cash equivalents but is a change in presentation within the Consolidated Statements of Cash Flows.
In January 2017, the FASB issued Accounting Standards Update 2017-01, “Business Combinations: Clarifying the Definition of a Business” (ASU 2017-01). The standard clarifies the definition of a business and adds guidance to assist entities when evaluating whether transactions should be accounted for as acquisitions or disposals of assets or as businesses. The standard provides an initial screen to determine whether a set of assets and activities qualifies as a business or as a set of assets. ASU 2017-01 is effective for fiscal years and interim periods within those years beginning after December 15, 2017. The amendments require a prospective approach to adoption. The impact of this standard will depend on the specific terms and conditions of an acquisition or disposition of assets or businesses. The company will apply the new standard to all applicable transactions in the 2018 fiscal year and beyond.
In January 2017, the FASB issued Accounting Standards Update 2017-04, “Intangibles-Goodwill and Other: Simplifying the Test for Goodwill Impairment” (ASU 2017-04). The standard simplifies the subsequent measurement of goodwill by eliminating Step 2 from the goodwill impairment test. Under the amendments of ASU 2017-04, an entity should perform its goodwill impairment test by comparing the fair value of a reporting unit with its carrying amount. An entity will recognize an impairment charge for the amount by which the carrying amount exceeds the reporting unit’s fair value, but the loss cannot exceed the total amount of goodwill allocated to the reporting unit. ASU 2017-04 is effective for fiscal years and interim periods within those years beginning after December 15, 2019. The amendments require a prospective approach to adoption and early adoption is permitted for interim or annual goodwill impairment tests. The company is currently evaluating the impact of this standard.
In February 2017, the FASB issued Accounting Standards Update 2017-05, “Other Income-Gains and Losses from the Derecognition of Nonfinancial Assets: Clarifying the Scope of Asset Derecognition Guidance and Accounting for Partial Sales of Nonfinancial Assets” (ASU 2017-05). The standard clarifies the scope of accounting for gains and losses from the derecognition of nonfinancial assets and adds guidance for partial sales of nonfinancial assets. ASU 2017-05 is effective for fiscal years and interim periods within those years beginning after December 15, 2017 and must be adopted at the same time as ASU 2014-09. The amendments allow either a retrospective or modified retrospective approach to adoption. The company does not expect this standard to have a material impact on the company's financial condition, results of operations or cash flows.
In March 2017, the FASB issued Accounting Standard Update 2017-07, “Compensation-Retirement Benefits: Improving the Presentation of Net Periodic Pension Cost and Net Periodic Postretirement Benefit Cost” (ASU 2017-07). The amendments require that an employer disaggregate the service cost component from the other components of net benefit cost. The amendments also provide guidance on how to present the service cost component and the other components of net benefit cost in the income statement and allow that only the service cost component of net benefit cost is eligible for capitalization. ASU 2017-07 is effective for fiscal years and interim periods within those years beginning after December 15, 2017. The amendments require primarily a retrospective approach to adoption. The application of the new rules will result in the reclassification of pension related costs within the Consolidated Statements of Income and no impact to the results of operations.
102
2
.
FAIR VALUE OF ASSETS AND LIABILITIES
The carrying value and fair value of financial instruments is presented in the below summary table. The fair value of financial instruments held by CIP are presented in Note
19
, "Consolidated Investment Products".
|
December 31, 2017
|
December 31, 2016
|
||||||||||
|
$ in millions
|
Carrying Value
|
Fair Value
|
Carrying Value
|
Fair Value
|
|||||||
|
Cash and cash equivalents
|
2,006.4
|
|
2,006.4
|
|
1,328.0
|
|
1,328.0
|
|
|||
|
Available-for-sale investments
|
85.2
|
|
85.2
|
|
154.0
|
|
154.0
|
|
|||
|
Trading investments
|
277.3
|
|
277.3
|
|
329.6
|
|
329.6
|
|
|||
|
Foreign time deposits
*
|
28.6
|
|
28.6
|
|
26.9
|
|
26.9
|
|
|||
|
Assets held for policyholders
|
12,444.5
|
|
12,444.5
|
|
8,224.2
|
|
8,224.2
|
|
|||
|
Policyholder payables *
|
(12,444.5
|
)
|
(12,444.5
|
)
|
(8,224.2
|
)
|
(8,224.2
|
)
|
|||
|
Put option contracts
|
0.8
|
|
0.8
|
|
21.8
|
|
21.8
|
|
|||
|
UIT-related financial instruments sold, not yet purchased
|
(1.4
|
)
|
(1.4
|
)
|
(6.0
|
)
|
(6.0
|
)
|
|||
|
Contingent consideration liability
|
(57.4
|
)
|
(57.4
|
)
|
(78.2
|
)
|
(78.2
|
)
|
|||
|
Long-term debt
*
|
(2,075.8
|
)
|
(2,258.1
|
)
|
(2,102.4
|
)
|
(2,206.5
|
)
|
|||
____________
|
*
|
These financial instruments are not measured at fair value on a recurring basis. See the indicated footnotes for additional information about the carrying and fair values of these financial instruments. Foreign time deposits are measured at cost plus accrued interest, which approximates fair value, and are accordingly classified as Level 2 securities.
|
A three-level valuation hierarchy exists for disclosure of fair value measurements based upon the transparency of inputs to the valuation of an asset or liability as of the measurement date. The three levels are defined as follows:
|
•
|
Level 1 - inputs to the valuation methodology are quoted prices (unadjusted) for identical assets or liabilities in active markets.
|
|
•
|
Level 2 - inputs to the valuation methodology include quoted prices for similar assets and liabilities in active markets, and inputs that are observable for the asset or liability, either directly or indirectly, for substantially the full term of the financial instrument.
|
|
•
|
Level 3 - inputs to the valuation methodology are unobservable and significant to the fair value measurement.
|
An asset or liability's categorization within the valuation hierarchy is based upon the lowest level of input that is significant to the fair value measurement.
There are three types of valuation approaches: a market approach, which uses observable prices and other relevant information that is generated by market transactions involving identical or comparable assets or liabilities; an income approach, which uses valuation techniques to convert future amounts to a single, discounted present value amount; and a cost approach, which is based on the amount that currently would be required to replace the service capacity of an asset.
The following is a description of the valuation methodologies used for assets and liabilities measured at fair value, as well as the general classification of such assets and liabilities pursuant to the valuation hierarchy.
Cash equivalents
Cash investments in affiliated money market funds are valued under the market approach through the use of quoted market prices in an active market, which is the net asset value of the underlying funds, and are classified within level 1 of the valuation hierarchy.
Available-for-sale investments
Seed money is valued under the market approach through the use of quoted market prices available in an active market and is classified within level 1 of the valuation hierarchy; there is no modeling or additional information needed to arrive at the fair values of these investments. At
December 31, 2017
and
December 31, 2016
, investments in CLOs were valued using pricing information obtained by an independent third-party pricing source. Other debt securities are valued using a cost valuation technique due to the lack of available cash flow and market data and are accordingly also classified within level 3 of the valuation hierarchy.
103
Trading investments
Trading investments include the following:
•
Investments related to deferred compensation plans
Investments related to deferred compensation plans are valued under the market approach through the use of quoted prices in an active market and are classified within level 1 of the valuation hierarchy.
•
Seed money
Seed money is valued under the market approach through the use of quoted market prices available in an active market and is classified within level 1 of the valuation hierarchy; there is no modeling or additional information needed to arrive at the fair values of these investments.
•
Other equity securities
Other equity securities consist of investments in publicly-traded equity securities. These securities are valued under the market approach through the use of quoted prices on an exchange. To the extent these securities are actively traded, valuation adjustments are not applied and they are categorized within level 1 of the valuation hierarchy; otherwise, they are categorized in level 2.
•
UIT-related equity and debt securities
The company invests in UIT-related equity and debt securities consisting of investments in corporate equities, UITs, and from time-to-time municipal securities. Each is discussed more fully below.
Corporate equities
The company temporarily holds investments in corporate equities for purposes of creating a UIT. Corporate equities are valued under the market approach through use of quoted prices on an exchange. To the extent these securities are actively traded, valuation adjustments are not applied and they are categorized within level 1 of the valuation hierarchy; otherwise, they are categorized in level 2.
UITs
The company may hold units of its sponsored UITs at period-end for sale in the primary market or secondary market. Equity UITs are valued under the market approach through use of quoted prices on an exchange. Fixed income UITs are valued using recently executed transaction prices, market price quotations (where observable), bond spreads, or credit default swap spreads. The spread data used is for the same maturities as the underlying bonds. If the spread data does not reference the issuers, then data that references comparable issuers is used. When observable price quotations are not available, fair value is determined based on cash flow models with yield curves, bond or single name credit default spreads, and recovery rates based on collateral value as key inputs. Depending on the nature of the inputs, these investments are categorized as level 1, 2, or 3.
Assets held for policyholders
Assets held for policyholders are measured at fair value under the market approach based on the quoted prices of the underlying funds in an active market and are classified within level 1 of the valuation hierarchy. The policyholder payables are indexed to the value of the assets held for policyholders and are therefore not included in the tables below.
104
Put option contracts
The company has purchased several put option contracts to hedge economically foreign currency risk on the translation of a portion of its Pound Sterling-denominated earnings and Euro-denominated earnings into U.S. Dollars (purchases of
$8.1 million
and
$14.5 million
for the years ended
December 31, 2017
and
December 31, 2016
, respectively). These were the only contracts entered into during the period to hedge economically foreign currency risk for the Pound Sterling-denominated earnings and provide coverage through
December 31, 2018
. The economic hedge is predominantly triggered upon the impact of a significant decline in the Pound sterling/U.S. Dollar foreign exchange rate or Euro/U.S. Dollar foreign exchange rate. Open put option contracts are marked-to-market through earnings, which are recorded in the company's Consolidated Statements of Income in other gains and losses. These derivative contracts are valued using option valuation models and are included in other assets in the company's Consolidated Balance Sheets. The significant inputs in these models (volatility, forward points and swap curves) are readily available in public markets or can be derived from observable market transactions for substantially the full terms of the contracts and are classified within level 2 of the valuation hierarchy. The company recognized a
loss
of
$21.0 million
in the year ended
December 31, 2017
(
gain
of
$22.0 million
in the year ended
December 31, 2016
) related to the change in market value of these put option contracts. In these transactions, the reference rate is an average foreign exchange rate for the applicable time frame.
Deferred compensation-related total return swap
In addition to holding trading investments, in 2017 the company purchased a total return swap (TRS) to hedge economically certain of these deferred compensation liabilities. The notional value of the total return swap at
December 31, 2017
was
$108.3 million
and its market value was
$1.6 million
. The market value of the TRS was determined under the market approach using quoted prices of the underlying investments. The TRS is classified as level 2 of the valuation hierarchy. During the year ended
December 31, 2017
market valuation gains of
$8.8 million
were recognized in other gains and losses, net.
Contingent Consideration Liability
During 2015, the company acquired investment management contracts from Deutsche Bank. Indefinite-lived intangible assets were valued at
$119.3 million
. This transaction was a non-cash investing activity during the period. The purchase price was comprised solely of contingent consideration payable in future periods, and is linked to future revenues generated from the contracts. The contingent consideration liability was recorded at fair value as of the date of acquisition using a discounted cash flow model, and is categorized within level 3 of the valuation hierarchy. At
December 31, 2017
inputs
used
in the
model
included
assumed growth rates in AUM ranging from
(9.2)%
to
8.35%
(weighted average growth rate of
0.16%
) and a discount rate of
3.89%
. Changes in fair value are recorded in Other gains and losses, net in the Consolidated Statements of Income in the period incurred. An increase in AUM levels and a decrease in the discount rate would increase the fair value of the contingent consideration liability while a decrease in forecasted AUM and an increase in the discount rate would decrease the liability.
105
The following table presents, for each of the hierarchy levels described above, the carrying value of the company's assets and liabilities, including major security type for equity and debt securities, which are measured at fair value on the company's Consolidated Balance Sheet as of
December 31, 2017
:
|
As of December 31, 2017
|
|||||||||||
|
$ in millions
|
Fair Value Measurements
|
Quoted Prices in Active Markets for Identical Assets
(Level 1)
|
Significant Other Observable Inputs
(Level 2)
|
Significant Unobservable Inputs
(Level 3)
|
|||||||
|
Assets:
|
|||||||||||
|
Cash equivalents:
|
|||||||||||
|
Money market funds
|
875.5
|
|
875.5
|
|
—
|
|
—
|
|
|||
|
Investments:*
|
|
||||||||||
|
Available-for-sale:
|
|||||||||||
|
Seed money
|
69.3
|
|
69.3
|
|
—
|
|
—
|
|
|||
|
CLOs
|
6.0
|
|
—
|
|
6.0
|
|
—
|
|
|||
|
Other debt securities
|
9.9
|
|
—
|
|
—
|
|
9.9
|
|
|||
|
Trading investments:
|
|
||||||||||
|
Investments related to deferred compensation plans
|
92.3
|
|
92.3
|
|
—
|
|
—
|
|
|||
|
Seed money
|
173.7
|
|
173.7
|
|
—
|
|
—
|
|
|||
|
Other equity securities
|
8.9
|
|
8.9
|
|
—
|
|
—
|
|
|||
|
UIT-related equity and debt securities:
|
|||||||||||
|
Corporate equities
|
2.0
|
|
2.0
|
|
—
|
|
—
|
|
|||
|
UITs
|
0.4
|
|
0.4
|
|
—
|
|
—
|
|
|||
|
Assets held for policyholders
|
12,444.5
|
|
12,444.5
|
|
—
|
|
—
|
|
|||
|
Put option contracts
|
0.8
|
|
—
|
|
0.8
|
|
—
|
|
|||
|
Total
|
13,683.3
|
|
13,666.6
|
|
6.8
|
|
9.9
|
|
|||
|
Liabilities:
|
|
|
|
|
|||||||
|
UIT-related financial instruments sold, not yet purchased:
|
|
||||||||||
|
Exchange traded funds
|
(1.4
|
)
|
(1.4
|
)
|
—
|
|
—
|
|
|||
|
Contingent consideration liability
|
(57.4
|
)
|
—
|
|
—
|
|
(57.4
|
)
|
|||
|
Total
|
(58.8
|
)
|
(1.4
|
)
|
—
|
|
(57.4
|
)
|
|||
____________
|
*
|
Foreign time deposits of
$28.6 million
are excluded from this table. Equity and other investments of
$277.3 million
and
$6.2 million
, respectively, are also excluded from this table. These investments are not measured at fair value, in accordance with applicable accounting standards.
|
106
The following table presents, for each of the hierarchy levels described above, the carrying value of the company's assets and liabilities, including major security type for equity and debt securities, which are measured at fair value on the company's Consolidated Balance Sheet as of
December 31, 2016
:
|
As of December 31, 2016
|
|||||||||||
|
$ in millions
|
Fair Value Measurements
|
Quoted Prices in Active Markets for Identical Assets
(Level 1)
|
Significant Other Observable Inputs
(Level 2) |
Significant Unobservable Inputs
(Level 3) |
|||||||
|
Assets:
|
|||||||||||
|
Cash equivalents:
|
|||||||||||
|
Money market funds
|
476.2
|
|
476.2
|
|
—
|
|
—
|
|
|||
|
Investments:*
|
|||||||||||
|
Available-for-sale:
|
|||||||||||
|
Seed money
|
127.9
|
|
127.9
|
|
—
|
|
—
|
|
|||
|
CLOs
|
12.9
|
|
—
|
|
—
|
|
12.9
|
|
|||
|
Other debt securities
|
13.2
|
|
—
|
|
—
|
|
13.2
|
|
|||
|
Trading investments:
|
|||||||||||
|
Investments related to deferred compensation plans
|
170.5
|
|
170.5
|
|
—
|
|
—
|
|
|||
|
Seed money
|
121.9
|
|
121.9
|
|
—
|
|
—
|
|
|||
|
Other equity securities
|
30.4
|
|
30.4
|
|
—
|
|
—
|
|
|||
|
UIT-related equity and debt securities:
|
|||||||||||
|
Corporate equities
|
1.2
|
|
1.2
|
|
—
|
|
—
|
|
|||
|
UITs
|
5.6
|
|
5.6
|
|
—
|
|
—
|
|
|||
|
Assets held for policyholders
|
8,224.2
|
|
8,224.2
|
|
—
|
|
—
|
|
|||
|
Put option contracts
|
21.8
|
|
—
|
|
21.8
|
|
—
|
|
|||
|
Total
|
9,205.8
|
|
9,157.9
|
|
21.8
|
|
26.1
|
|
|||
|
Liabilities:
|
|
|
|
|
|
|
|
|
|||
|
UIT-related financial instruments sold, not yet purchased:
|
|
|
|
|
|
|
|
|
|||
|
Exchange traded funds
|
(5.2
|
)
|
(5.2
|
)
|
—
|
|
—
|
|
|||
|
U.S. treasury securities
|
(0.8
|
)
|
(0.8
|
)
|
—
|
|
—
|
|
|||
|
Contingent consideration liability
|
(78.2
|
)
|
—
|
|
—
|
|
(78.2
|
)
|
|||
|
Total
|
(84.2
|
)
|
(6.0
|
)
|
—
|
|
(78.2
|
)
|
|||
____________
|
*
|
Foreign time deposits of
$26.9 million
are excluded from this table. Equity and other investments of
$279 million
and
$5.8 million
, respectively, are also excluded from this table. These investments are not measured at fair value, in accordance with applicable accounting standards.
|
107
The following table shows a reconciliation of the beginning and ending fair value measurements for level 3 assets and liabilities during the year ended
December 31, 2017
and
December 31, 2016
, which are valued using significant unobservable inputs:
|
For the year ended December 31, 2017
|
For the year ended December 31, 2016
|
||||||||||||||||
|
$ in millions
|
Contingent Consideration Liability
|
CLOs
|
Other Debt Securities
|
Contingent Consideration Liability
|
CLOs
|
Other Debt Securities
|
|||||||||||
|
Beginning balance
|
(78.2
|
)
|
12.9
|
|
13.2
|
|
(83.9
|
)
|
1.4
|
|
5.9
|
|
|||||
|
Adjustment for adoption of ASU 2015-02
|
—
|
|
—
|
|
—
|
|
—
|
|
11.5
|
|
—
|
|
|||||
|
Beginning balance, as adjusted
|
(78.2
|
)
|
12.9
|
|
13.2
|
|
(83.9
|
)
|
12.9
|
|
5.9
|
|
|||||
|
Purchases/acquisitions
|
—
|
|
—
|
|
7.4
|
|
—
|
|
—
|
|
21.4
|
|
|||||
|
Returns of capital
|
—
|
|
—
|
|
—
|
|
—
|
|
(3.0
|
)
|
—
|
|
|||||
|
Net unrealized gains and losses included in other gains and losses*
|
7.6
|
|
—
|
|
(3.2
|
)
|
(7.4
|
)
|
—
|
|
—
|
|
|||||
|
Net unrealized gains and losses included in accumulated other comprehensive income/(loss)
*
|
—
|
|
—
|
|
—
|
|
—
|
|
3.0
|
|
—
|
|
|||||
|
Disposition/settlements
|
13.2
|
|
—
|
|
(7.5
|
)
|
13.1
|
|
—
|
|
(14.1
|
)
|
|||||
|
Transfer from level 3 to level 2
|
—
|
|
(12.9
|
)
|
—
|
|
—
|
|
—
|
|
—
|
|
|||||
|
Ending balance
|
(57.4
|
)
|
—
|
|
9.9
|
|
(78.2
|
)
|
12.9
|
|
13.2
|
|
|||||
____________
|
*
|
These unrealized gains and losses are attributable to balances still held at the respective year ends.
|
3
.
INVESTMENTS
The disclosures below include details of the company's investments. Investments held by CIP are detailed in Note
19
, "Consolidated Investment Products."
|
$ in millions
|
December 31, 2017
|
December 31, 2016
|
|||
|
Available-for-sale investments:
|
|||||
|
Seed money
|
69.3
|
|
127.9
|
|
|
|
CLOs
|
6.0
|
|
12.9
|
|
|
|
Other debt securities
|
9.9
|
|
13.2
|
|
|
|
Trading investments:
|
|||||
|
Investments related to deferred compensation plans
|
92.3
|
|
170.5
|
|
|
|
Seed money
|
173.7
|
|
121.9
|
|
|
|
UIT-related equity and debt securities
|
2.4
|
|
6.8
|
|
|
|
Other equity securities
|
8.9
|
|
30.4
|
|
|
|
Equity method investments
|
277.3
|
|
279.0
|
|
|
|
Foreign time deposits
|
28.6
|
|
26.9
|
|
|
|
Other
|
6.2
|
|
5.8
|
|
|
|
Total investments
|
674.6
|
|
795.3
|
|
|
108
Available for sale investments
Realized gains and losses recognized in the Consolidated Statements of Income during the year from investments classified as available-for-sale are as follows:
|
2017
|
2016
|
2015
|
||||||||||||||||||||||||
|
$ in millions
|
Proceeds from Sales
|
Gross Realized Gains
|
Gross Realized Losses
|
Proceeds from Sales
|
Gross Realized Gains
|
Gross Realized Losses
|
Proceeds from Sales
|
Gross Realized Gains
|
Gross Realized Losses
|
|||||||||||||||||
|
Seed money
|
62.5
|
|
4.3
|
|
(1.5
|
)
|
42.7
|
|
1.5
|
|
(1.6
|
)
|
48.1
|
|
2.2
|
|
(0.2
|
)
|
||||||||
|
CLOs
|
7.1
|
|
1.9
|
|
—
|
|
3.0
|
|
—
|
|
—
|
|
2.6
|
|
0.5
|
|
—
|
|
||||||||
|
Other debt securities
|
9.9
|
|
2.5
|
|
—
|
|
13.6
|
|
—
|
|
(0.5
|
)
|
0.4
|
|
—
|
|
—
|
|
||||||||
|
79.5
|
|
8.7
|
|
(1.5
|
)
|
59.3
|
|
1.5
|
|
(2.1
|
)
|
51.1
|
|
2.7
|
|
(0.2
|
)
|
|||||||||
Upon the sale of available-for-sale securities, net realized gains of
$7.2 million
, were transferred from accumulated other comprehensive income into the Consolidated Statements of Income during the year ended
December 31, 2017
(year ended
December 31, 2016
:
$0.6 million
net losses, year ended
December 31, 2015
:
$2.5 million
net gains). The specific identification method is used to determine the realized gain or loss on securities sold or otherwise disposed.
Gross unrealized holding gains and losses recognized in other accumulated comprehensive income from available-for-sale investments are presented in the table below:
|
December 31, 2017
|
December 31, 2016
|
||||||||||||||||||||||
|
$ in millions
|
Cost
|
Gross Unrealized Holding Gains
|
Gross Unrealized Holding Losses
|
Fair Value
|
Cost
|
Gross Unrealized Holding Gains
|
Gross Unrealized Holding Losses
|
Fair Value
|
|||||||||||||||
|
Seed money
|
65.1
|
|
5.5
|
|
(1.3
|
)
|
69.3
|
|
127.2
|
|
6.8
|
|
(6.1
|
)
|
127.9
|
|
|||||||
|
CLOs
|
4.9
|
|
1.1
|
|
—
|
|
6.0
|
|
9.2
|
|
3.7
|
|
—
|
|
12.9
|
|
|||||||
|
Other debt securities
|
9.9
|
|
—
|
|
—
|
|
9.9
|
|
13.2
|
|
—
|
|
—
|
|
13.2
|
|
|||||||
|
79.9
|
|
6.6
|
|
(1.3
|
)
|
85.2
|
|
149.6
|
|
10.5
|
|
(6.1
|
)
|
154.0
|
|
||||||||
At
December 31, 2017
,
50
seed money funds (
December 31, 2016
:
103
seed money funds) experienced gross unrealized holding losses. The following table provides a breakdown of the unrealized losses.
|
December 31, 2017
|
December 31, 2016
|
||||||||||
|
$ in millions
|
Fair Value
|
Gross Unrealized Losses
|
Fair Value
|
Gross Unrealized Losses
|
|||||||
|
Less than 12 months
|
9.4
|
|
(0.8
|
)
|
1.9
|
|
(0.2
|
)
|
|||
|
12 months or greater
|
15.0
|
|
(0.5
|
)
|
56.4
|
|
(5.9
|
)
|
|||
|
Total
|
24.4
|
|
(1.3
|
)
|
58.3
|
|
(6.1
|
)
|
|||
The company has reviewed investment securities for other-than-temporary impairment (OTTI) in accordance with its accounting policy and has recognized
$3.2 million
other-than-temporary impairment charges on certain available-for-sale investments during the year ended
December 31, 2017
(year ended
December 31, 2016
:
none
). In contemplation of OTTI, the company conducts a review of the financial condition and near-term prospects of the underlying securities as well as the severity and duration of any declines in fair value. No OTTI is recorded for seeded funds which are expected to recover their value over time and for which the company has the intent and ability to hold the securities until this recovery occurs. For CLO investments, the company reviewed the estimated future cashflows of each CLO. If the present value of the estimated future cashflows is lower than the carrying value of the investment and there is an adverse change in estimated cashflows, the impairment is considered to be other than temporary. During the year ended
December 31, 2017
and
2016
, no such other-than-temporary impairment was recognized.
109
Available-for-sale debt securities as of
December 31, 2017
by maturity, are set out below:
|
Available-for-Sale (Fair Value)
|
||
|
Less than one year
|
9.9
|
|
|
One to five years
|
2.8
|
|
|
Five to ten years
|
3.2
|
|
|
Greater than ten years
|
—
|
|
|
Total available-for-sale
|
15.9
|
|
Trading investments
Net gains recorded in Other gains/(losses) in the Consolidated Statements of Income resulting from trading investments for the year ended
December 31, 2017
, were
$40.4 million
(
December 31, 2016
:
$14.2 million
gain). The portion of trading gains and losses for the year ended
December 31, 2017
, that relates to trading securities still held at
December 31, 2017
, was a
$18.9 million
net
gain
(
December 31, 2016
:
$16.9 million
net
gain
).
Equity method investments
Following are the company's investments in joint ventures and affiliates, which are accounted for using the equity method and are recorded as investments on the Consolidated Balance Sheets:
|
Name of Company
|
Country of Incorporation
|
% Voting Interest Owned
|
|
|
Huaneng Invesco WLR (Beijing) Investment Fund Management Company Ltd.
|
China
|
50.0%
|
|
|
Invesco Great Wall Fund Management Company Limited
|
China
|
49.0%
|
|
|
Pocztylion - ARKA
|
Poland
|
29.3%
|
|
Undistributed earnings from equity method investees have not been a material restriction on the company's ability to pay dividends to shareholders. Equity method investments also include the company's investments in certain of its managed private equity, real estate and other investment entities. The company's investment is generally less than
5%
of the capital of these entities. These entities include variable interest entities for which the company has determined that it is not the primary beneficiary and other investment products structured as partnerships for which the company is the general partner and the other limited partners possess either substantive kick-out, liquidation or participation rights. See Note
1
, “Accounting Policies,” for additional information.
Noncontrolling interests in consolidated entities
The company owns 100% of the voting control of its subsidiary entities, directly or indirectly, with the exception of the following entities, which are consolidated with resulting noncontrolling interests:
|
Name of Company
|
Country of Incorporation
|
% Voting Interest Owned
|
|
|
VV Immobilien Verwaltungs und Beteiligungs GmbH
|
Germany
|
70.0%
|
|
|
VV Immobilien Verwaltungs GmbH
|
Germany
|
70.0%
|
|
|
HVH Immobilien und Beteiligungs GmbH
|
Germany
|
70.0%
|
|
110
4
.
PROPERTY, EQUIPMENT AND SOFTWARE
The following is a summary of property, equipment and software:
|
$ in millions
|
December 31, 2017
|
December 31, 2016
|
|||
|
Technology and Other Equipment
|
261.0
|
|
242.3
|
|
|
|
Software
|
621.9
|
|
467.4
|
|
|
|
Land and Buildings
|
87.5
|
|
68.2
|
|
|
|
Leasehold Improvements
|
204.4
|
|
210.9
|
|
|
|
Work in Process
|
44.8
|
|
117.0
|
|
|
|
Property, Equipment and Software, Gross
|
1,219.6
|
|
1,105.8
|
|
|
|
Less: Accumulated Depreciation
|
(728.9
|
)
|
(641.1
|
)
|
|
|
Property, Equipment and Software, Net
|
490.7
|
|
464.7
|
|
|
Depreciation expense related to property, equipment and software was
$99.4 million
,
$87.3 million
and
$83.0 million
for the years ended
December 31, 2017
,
2016
and
2015
, respectively.
5
.
INTANGIBLE ASSETS
The following table presents the major classes of the company's intangible assets at
December 31
,
2017
and
2016
:
|
$ in millions
|
Gross Book Value
|
Accumulated Amortization
|
Net Book Value
|
|||||
|
December 31, 2017
|
||||||||
|
Management contracts - indefinite-lived
|
1,523.3
|
|
N/A
|
|
1,523.3
|
|
||
|
Management contracts - finite-lived
|
68.8
|
|
(66.3
|
)
|
2.5
|
|
||
|
Customer relationships
|
40.0
|
|
(25.3
|
)
|
14.7
|
|
||
|
Other
|
27.6
|
|
(9.4
|
)
|
18.2
|
|
||
|
Total
|
1,659.7
|
|
(101.0
|
)
|
1,558.7
|
|
||
|
December 31, 2016
|
||||||||
|
Management contracts - indefinite-lived
|
1,363.6
|
|
N/A
|
|
1,363.6
|
|
||
|
Management contracts - finite-lived
|
67.7
|
|
(56.6
|
)
|
11.1
|
|
||
|
Customer relationships
|
40.0
|
|
(21.9
|
)
|
18.1
|
|
||
|
Other
|
9.8
|
|
(3.2
|
)
|
6.6
|
|
||
|
Total
|
1,481.1
|
|
(81.7
|
)
|
1,399.4
|
|
||
On August 18, 2017, Invesco acquired
$167.1 million
in management contracts and technology related intangible assets as part of the acquisition of the European ETF business (2016:
$63.4 million
related to the purchases of Jemstep and the remaining interest in our Indian joint venture). Amortizable intangible assets of
$16.9 million
related to 2017 acquisitions have a weighted-average amortization period of
1.9 years
(2016 acquisitions:
$9.8 million
have a weighted-average amortization period of
1.1 years
).
The
2017
and
2016
annual impairment reviews of indefinite-lived intangible assets determined that
no
impairment existed at the respective review dates. Amortization expense was
$17.4 million
during the year ended
December 31, 2017
(
December 31, 2016
:
$13.9 million
;
December 31, 2015
:
$10.6 million
) and is included within General and administrative expenses in the Consolidated Statements of Income. Estimated amortization expense for each of the five succeeding fiscal years based upon the company's intangible assets at
December 31, 2017
is as follows:
111
|
$ in millions
Years Ended December 31,
|
Estimated Amortization Expense
|
|
|
2018
|
15.6
|
|
|
2019
|
8.1
|
|
|
2020
|
4.7
|
|
|
2021
|
4.7
|
|
|
2022
|
2.3
|
|
112
6
.
GOODWILL
The table below details changes in the goodwill balance:
|
$ in millions
|
Net Book Value
|
|
|
January 1, 2017
|
6,129.2
|
|
|
Business combinations
|
193.3
|
|
|
Foreign exchange
|
268.2
|
|
|
December 31, 2017
|
6,590.7
|
|
|
January 1, 2016
|
6,175.7
|
|
|
Business combinations
|
135.7
|
|
|
Foreign exchange
|
(182.2
|
)
|
|
December 31, 2016
|
6,129.2
|
|
The 2017 addition to goodwill consists of
$193.3 million
related to the preliminary valuation of the acquisition of the European ETF business. The 2016 addition to goodwill consists of
$135.7 million
related to the the acquisitions of our Indian asset management company and Jemstep.
The
2017
and
2016
annual impairment reviews determined that
no
impairment existed at the respective review dates. No interim impairment tests were deemed necessary during
2017
or
2016
.
7
.
OTHER LIABILITIES
The table below details the components of other liabilities:
|
As of
|
|||||
|
$ in millions
|
December 31, 2017
|
December 31, 2016
|
|||
|
Compensation and benefits
|
101.2
|
|
92.8
|
|
|
|
Accrued bonus and deferred compensation
|
594.9
|
|
561.5
|
|
|
|
Accrued compensation and benefits
|
696.1
|
|
654.3
|
|
|
|
Accruals and other liabilities
|
302.3
|
|
280.6
|
|
|
|
Deferred carried interest
|
60.4
|
|
87.7
|
|
|
|
Contingent consideration liability
|
57.4
|
|
78.2
|
|
|
|
Accounts payable
|
320.1
|
|
274.3
|
|
|
|
Income taxes payable
|
155.5
|
|
91.6
|
|
|
|
Accounts payable and accrued expenses
|
895.7
|
|
812.4
|
|
|
113
8
. LONG-TERM
DEBT
The issuer of the senior notes is an indirect 100% owned finance subsidiary of Invesco Ltd. (the Parent), and the Parent fully and unconditionally guaranteed the securities
. As discussed in Note 1, "Accounting Policies - Cash and cash equivalents," certain of our subsidiaries are required to maintain minimum levels of capital. These and other similar provisions of applicable law may have the effect of limiting withdrawals of capital, repayment of intercompany loans and payment of dividends by such entities.
The disclosures below include details of the company's debt. Debt of CIP is detailed in Note
19
, “Consolidated Investment Products.”
|
December 31, 2017
|
December 31, 2016
|
||||||||||
|
$ in millions
|
Carrying Value**
|
Fair Value
|
Carrying Value**
|
Fair Value
|
|||||||
|
Floating rate credit facility expiring August 11, 2022
|
—
|
|
—
|
|
28.7
|
|
28.7
|
|
|||
|
Unsecured Senior Notes*:
|
|||||||||||
|
$600 million 3.125% - due November 30, 2022
|
596.9
|
|
608.8
|
|
596.3
|
|
604.7
|
|
|||
|
$600 million 4.000% - due January 30, 2024
|
594.0
|
|
634.7
|
|
593.2
|
|
625.3
|
|
|||
|
$500 million 3.750% - due January 15, 2026
|
495.1
|
|
515.0
|
|
494.5
|
|
506.4
|
|
|||
|
$400 million 5.375% - due November 30, 2043
|
389.8
|
|
499.6
|
|
389.7
|
|
441.4
|
|
|||
|
Long-term debt
|
2,075.8
|
|
2,258.1
|
|
2,102.4
|
|
2,206.5
|
|
|||
____________
|
*
|
The company's senior note indentures contain certain restrictions on mergers or consolidations. Beyond these items, there are no other restrictive covenants in the indentures.
|
|
**
|
The difference between the principal amounts and the carrying values of the senior notes in the table above reflect the unamortized debt issuance costs and discounts.
|
The fair market value of the company's senior notes was determined by market quotes provided by Bloomberg, which is considered a Level 2 valuation input. In the absence of an active market, the company relies upon the average price quoted by brokers for determining the fair market value of the debt.
Analysis of Borrowings by Maturity:
|
$ in millions
|
December 31, 2017
|
|
|
2022
|
596.9
|
|
|
2024
|
594.0
|
|
|
2026
|
495.1
|
|
|
2043
|
389.8
|
|
|
Long-term debt
|
2,075.8
|
|
On August 11, 2017 the company amended and restated the credit facility agreement increasing the borrowing limit to
$1.5 billion
and extending the expiration date to
August 11, 2022
.
At
December 31, 2017
, the outstanding balance on the credit facility was
zero
. Borrowings under the credit facility will bear interest at (i) LIBOR for specified interest periods or (ii) a floating base rate (based upon the highest of (a) the Bank of America prime rate, (b) the Federal Funds rate plus
0.50%
and (c) LIBOR for an interest period of one month plus
1.00%
), plus, in either case, an applicable margin determined with reference to the higher of the available credit ratings of the company or its indirect subsidiary Invesco Finance PLC. Based on credit ratings as of
December 31, 2017
of the company, the applicable margin for LIBOR-based loans was
1.00%
and for base rate loans was
0.00%
. In addition, the company is required to pay the lenders a facility fee on the aggregate commitments of the lenders (whether or not used) at a rate per annum which is based on the higher of the available credit ratings of company or its indirect subsidiary Invesco Finance PLC. Based on credit ratings as of
December 31, 2017
, the annual facility fee was equal to
0.125%
.
The credit agreement governing the credit facility contains customary restrictive covenants on the company and its subsidiaries. Restrictive covenants in the credit agreement include, but are not limited to: prohibitions on creating, incurring or assuming any liens; entering into merger arrangements; selling, leasing, transferring or otherwise disposing of assets; making a material change
114
in the nature of the business; making a significant accounting policy change in certain situations; entering into transactions with affiliates; and incurring indebtedness through the subsidiaries (other than the borrower, Invesco Finance PLC). Many of these restrictions are subject to certain minimum thresholds and exceptions. Financial covenants under the credit agreement include: (i) the quarterly maintenance of a debt/EBITDA leverage ratio, as defined in the credit agreement, of not greater than
3.25
:
1.00
, (ii) a coverage ratio (EBITDA, as defined in the credit agreement/interest payable for the four consecutive fiscal quarters ended before the date of determination) of not less than
4.00
:
1.00
.
The credit agreement governing the credit facility also contains customary provisions regarding events of default which could result in an acceleration or increase in amounts due, including (subject to certain materiality thresholds and grace periods) payment default, failure to comply with covenants, material inaccuracy of representation or warranty, bankruptcy or insolvency proceedings, change of control, certain judgments, ERISA matters, cross-default to other debt agreements, governmental action prohibiting or restricting the company or its subsidiaries in a manner that has a material adverse effect and failure of certain guaranty obligations. The company is in compliance with all regulatory minimum net capital requirements.
The lenders (and their respective affiliates) may have provided, and may in the future provide, investment banking, cash management, underwriting, lending, commercial banking, leasing, foreign exchange, trust or other advisory services to the company and its subsidiaries and affiliates. These parties may have received, and may in the future receive, customary compensation for these services.
At
December 31, 2017
, the company maintains approximately
$10.6 million
in letters of credit from a variety of banks. The letters of credit are generally one-year automatically-renewable facilities and are maintained for various commercial reasons.
9
.
SHARE CAPITAL
The number of common shares and common share equivalents issued are represented in the table below:
|
In millions
|
December 31, 2017
|
December 31, 2016
|
December 31, 2015
|
|||||
|
Common shares issued
|
490.4
|
|
490.4
|
|
490.4
|
|
||
|
Less: Treasury shares for which dividend and voting rights do not apply
|
(83.3
|
)
|
(86.6
|
)
|
(72.9
|
)
|
||
|
Common shares outstanding
|
407.1
|
|
403.8
|
|
417.5
|
|
||
The company did not purchase shares in the open market during the twelve months ended
December 31, 2017
(year ended
December 31, 2016
:
18.1 million
shares at a cost of
$535.0 million
). Separately, an aggregate of
1.9 million
shares were withheld on vesting events during the year ended
December 31, 2017
to meet employees' withholding tax obligations (
December 31, 2016
:
1.5 million
). The fair value of these shares withheld at the respective withholding dates was
$63.8 million
(
December 31, 2016
:
$42.0 million
). At
December 31, 2017
, approximately
$1,643.0 million
remained authorized under the company's share repurchase authorizations approved by the Board on October 11, 2013 and July 22, 2016 (
December 31, 2016
:
$1,643.0 million
).
Total treasury shares at
December 31, 2017
were
92.4 million
(
December 31, 2016
:
95.9 million
), including
9.1 million
unvested restricted stock awards (
December 31, 2016
:
9.3 million
) for which dividend and voting rights apply. The market price of common shares at the end of
2017
was
$36.54
. The total market value of the company's
92.4 million
treasury shares was
$3.4 billion
at
December 31, 2017
.
Movements in Treasury Shares comprise:
|
Year ended
|
||||||||
|
In millions
|
December 31, 2017
|
December 31, 2016
|
December 31, 2015
|
|||||
|
Beginning balance
|
95.9
|
|
81.3
|
|
69.4
|
|
||
|
Acquisition of common shares
|
1.9
|
|
19.6
|
|
17.4
|
|
||
|
Distribution of common shares
|
(5.2
|
)
|
(4.7
|
)
|
(5.2
|
)
|
||
|
Common shares distributed to meet ESPP obligation
|
(0.2
|
)
|
(0.3
|
)
|
(0.1
|
)
|
||
|
Common shares distributed to meet option exercises
|
—
|
|
—
|
|
(0.2
|
)
|
||
|
Ending balance
|
92.4
|
|
95.9
|
|
81.3
|
|
||
115
10
.
OTHER COMPREHENSIVE INCOME/(LOSS)
The components of accumulated other comprehensive income/(loss) were as follows:
|
2017
|
||||||||||||||
|
$ in millions
|
Foreign currency translation
|
Employee benefit plans
|
Equity method investments
|
Available-for-sale investments
|
Total
|
|||||||||
|
Other comprehensive income/(loss), net of tax:
|
||||||||||||||
|
Currency translation differences on investments in foreign subsidiaries
|
389.4
|
|
—
|
|
—
|
|
—
|
|
389.4
|
|
||||
|
Actuarial gain/(loss) related to employee benefit plans
|
—
|
|
21.1
|
|
—
|
|
—
|
|
21.1
|
|
||||
|
Settlement related to employee benefit plans
|
—
|
|
5.9
|
|
—
|
|
—
|
|
5.9
|
|
||||
|
Reclassification of actuarial (gains)/losses into employee compensation expenses
|
—
|
|
2.5
|
|
—
|
|
—
|
|
2.5
|
|
||||
|
Share of other comprehensive income/(loss) of equity method investments
|
—
|
|
—
|
|
(0.5
|
)
|
—
|
|
(0.5
|
)
|
||||
|
Unrealized gains/(losses) on available-for-sale investments
|
—
|
|
—
|
|
—
|
|
5.1
|
|
5.1
|
|
||||
|
Reclassification of net (gains)/losses realized on available-for-sale investments included in other gains and losses, net
|
—
|
|
—
|
|
—
|
|
(5.4
|
)
|
(5.4
|
)
|
||||
|
Other comprehensive income/(loss)
|
389.4
|
|
29.5
|
|
(0.5
|
)
|
(0.3
|
)
|
418.1
|
|
||||
|
|
||||||||||||||
|
Beginning balance
|
(679.9
|
)
|
(139.2
|
)
|
4.8
|
|
5.0
|
|
(809.3
|
)
|
||||
|
Other comprehensive income/(loss)
|
389.4
|
|
29.5
|
|
(0.5
|
)
|
(0.3
|
)
|
418.1
|
|
||||
|
Ending balance
|
(290.5
|
)
|
(109.7
|
)
|
4.3
|
|
4.7
|
|
(391.2
|
)
|
||||
|
2016
|
||||||||||||||
|
$ in millions
|
Foreign currency translation
|
Employee benefit plans
|
Equity method investments
|
Available-for-sale investments
|
Total
|
|||||||||
|
Other comprehensive income/(loss) net of tax:
|
||||||||||||||
|
Currency translation differences on investments in foreign subsidiaries
|
(314.1
|
)
|
—
|
|
—
|
|
—
|
|
(314.1
|
)
|
||||
|
Actuarial gain/(loss) related to employee benefit plans
|
—
|
|
(39.5
|
)
|
—
|
|
—
|
|
(39.5
|
)
|
||||
|
Prior service credit related to employee benefit plans
|
—
|
|
(3.1
|
)
|
—
|
|
—
|
|
(3.1
|
)
|
||||
|
Settlement related to employee benefit plans
|
—
|
|
(5.5
|
)
|
—
|
|
—
|
|
(5.5
|
)
|
||||
|
Reclassification of prior service (credit)/cost into employee compensation expense
|
—
|
|
(7.0
|
)
|
—
|
|
—
|
|
(7.0
|
)
|
||||
|
Reclassification of actuarial (gains)/losses into employee compensation expenses
|
—
|
|
1.5
|
|
—
|
|
—
|
|
1.5
|
|
||||
|
Share of other comprehensive income/(loss) of equity method investments
|
—
|
|
—
|
|
(1.1
|
)
|
—
|
|
(1.1
|
)
|
||||
|
Unrealized gains/(losses) on available-for-sale investments
|
—
|
|
—
|
|
—
|
|
5.2
|
|
5.2
|
|
||||
|
Reclassification of net (gains)/losses realized on available-for-sale investments included in other gains and losses, net
|
—
|
|
—
|
|
—
|
|
0.3
|
|
0.3
|
|
||||
|
Other comprehensive income/(loss)
|
(314.1
|
)
|
(53.6
|
)
|
(1.1
|
)
|
5.5
|
|
(363.3
|
)
|
||||
|
|
||||||||||||||
|
Beginning balance
|
(365.8
|
)
|
(85.6
|
)
|
5.9
|
|
(0.5
|
)
|
(446.0
|
)
|
||||
|
Other comprehensive income/(loss)
|
(314.1
|
)
|
(53.6
|
)
|
(1.1
|
)
|
5.5
|
|
(363.3
|
)
|
||||
|
Ending balance
|
(679.9
|
)
|
(139.2
|
)
|
4.8
|
|
5.0
|
|
(809.3
|
)
|
||||
116
|
2015
|
||||||||||||||
|
$ in millions
|
Foreign currency translation
|
Employee benefit plans
|
Equity method investments
|
Available-for-sale investments
|
Total
|
|||||||||
|
Other comprehensive income/(loss) net of tax:
|
||||||||||||||
|
Currency translation differences on investments in foreign subsidiaries
|
(493.9
|
)
|
—
|
|
—
|
|
—
|
|
(493.9
|
)
|
||||
|
Actuarial gain/(loss) related to employee benefit plans
|
—
|
|
11.1
|
|
—
|
|
—
|
|
11.1
|
|
||||
|
Reclassification of prior service (credit)/cost into employee compensation expense
|
—
|
|
(7.2
|
)
|
—
|
|
—
|
|
(7.2
|
)
|
||||
|
Reclassification of actuarial (gains)/losses into employee compensation expenses
|
—
|
|
2.2
|
|
—
|
|
—
|
|
2.2
|
|
||||
|
Share of other comprehensive income/(loss) of equity method investments
|
—
|
|
—
|
|
(0.6
|
)
|
—
|
|
(0.6
|
)
|
||||
|
Unrealized gains/(losses) on available-for-sale investments
|
—
|
|
—
|
|
—
|
|
(6.0
|
)
|
(6.0
|
)
|
||||
|
Reclassification of net (gains)/losses realized on available-for-sale investments included in other gains and losses, net
|
—
|
|
—
|
|
—
|
|
(0.4
|
)
|
(0.4
|
)
|
||||
|
Other comprehensive income/(loss)
|
(493.9
|
)
|
6.1
|
|
(0.6
|
)
|
(6.4
|
)
|
(494.8
|
)
|
||||
|
Beginning balance
|
128.1
|
|
(91.7
|
)
|
6.5
|
|
5.9
|
|
48.8
|
|
||||
|
Other comprehensive income/(loss)
|
(493.9
|
)
|
6.1
|
|
(0.6
|
)
|
(6.4
|
)
|
(494.8
|
)
|
||||
|
Ending balance
|
(365.8
|
)
|
(85.6
|
)
|
5.9
|
|
(0.5
|
)
|
(446.0
|
)
|
||||
Net Investment Hedge
During the second quarter of
2016
, the Company designated certain intercompany debt as a non-derivative net investment hedging instrument against foreign currency exposure related to its net investment in foreign operations. At
December 31, 2017
,
£130 million
(
$175.9 million
) of intercompany debt was designated as a net investment hedge. For the twelve months ended
December 31, 2017
, the Company recognized foreign currency
losses
of
$15.3 million
resulting from the net investment hedge within currency translation differences on investments in foreign subsidiaries in other comprehensive income. No hedge ineffectiveness was recognized in income.
11
.
SHARE-BASED COMPENSATION
The company recognized total expenses of
$175.3 million
,
$159.7 million
and
$150.3 million
related to equity-settled share-based payment transactions in
2017
,
2016
and
2015
, respectively. The total income tax benefit recognized in the Consolidated Statements of Income for share-based compensation arrangements was
$48.9 million
for
2017
(
2016
:
$44.7 million
;
2015
:
$43.8 million
).
Share awards are broadly classified into
two
categories: time-vested and performance-vested. Share awards are measured at fair value at the date of grant and are expensed, based on the company's estimate of shares that will eventually vest, on a straight-line or accelerated basis over the vesting period.
Time-vested awards vest ratably over or cliff-vest at the end of a period of continued employee service. Performance-vested awards cliff-vest at the end of or vest ratably over a defined vesting period of continued employee service upon the company's attainment of certain performance criteria. Time-vested and performance-vested share awards are granted in the form of restricted share awards (RSAs) or restricted share units (RSUs). Performance-vested awards are tied to the achievement of specified levels of adjusted diluted earnings per share and adjusted operating margin. In the event that either targeted financial measure is achieved at or above a vesting threshold for a particular performance measurement period, the portion of the performance-vested award subject to targeted financial measures will vest proportionately between
0%
and
100%
based upon the higher achieved level for that year.
With respect to time-vested awards, dividends accrue directly to the employee holder of RSAs, and cash payments in lieu of dividends are made to employee holders of certain RSUs. With respect to performance-vested awards, dividends and cash payments in lieu of dividends are deferred and are paid at the same rate as on our shares if and to the extent the award vests.
117
In May 2016, the company's shareholders approved the 2016 Global Equity Incentive Plan (2016 GEIP), which authorized the issuance of up to
21.7 million
shares under this plan. The 2011 Global Equity Incentive Plan and the 2008 Global Equity Incentive Plan are predecessor plans to the 2016 GEIP. Although there are outstanding awards under the 2011 and 2008 plans, no further grants may be made under such plans. In May 2010, the board approved the 2010 Global Equity Incentive Plan (ST), which authorized the issuance of up to
3 million
shares under this plan. With respect to the 2010 Global Equity Incentive Plan (ST), shares are issued only as employment inducement awards in connection with a strategic transaction and, as a result, do not require shareholder approval under the rules of the New York Stock Exchange or otherwise.
Movements on share awards priced in U.S. Dollars during the years ended December 31, are detailed below:
|
2017
|
2016
|
2015
|
||||||||||||||||||
|
Millions of shares, except fair values
|
Time-Vested
|
Performance-Vested
|
Weighted Average Grant Date Fair Value ($)
|
Time-Vested
|
Performance-Vested
|
Time-
Vested
|
Performance-Vested
|
|||||||||||||
|
Unvested at the beginning of year
|
12.1
|
|
0.8
|
|
31.22
|
|
10.4
|
|
0.6
|
|
11.5
|
|
0.5
|
|
||||||
|
Granted during the year
|
5.3
|
|
0.3
|
|
32.23
|
|
6.5
|
|
0.4
|
|
4.1
|
|
0.3
|
|
||||||
|
Forfeited during the year
|
(0.4
|
)
|
—
|
|
31.51
|
|
(0.3
|
)
|
—
|
|
(0.2
|
)
|
—
|
|
||||||
|
Vested and distributed during the year
|
(5.0
|
)
|
(0.2
|
)
|
31.53
|
|
(4.5
|
)
|
(0.2
|
)
|
(5.0
|
)
|
(0.2
|
)
|
||||||
|
Unvested at the end of the year
|
12.0
|
|
0.9
|
|
31.52
|
|
12.1
|
|
0.8
|
|
10.4
|
|
0.6
|
|
||||||
The total fair value of shares that vested during
2017
was
$168.7 million
(
2016
:
$128.4 million
;
2015
:
$202.6 million
). The weighted average grant date fair value of the U.S. dollar share awards that were granted during
2017
was
$32.23
(
2016
:
$27.44
;
2015
:
$39.99
).
At
December 31, 2017
, there was
$264.1 million
of total unrecognized compensation cost related to non-vested share awards; that cost is expected to be recognized over a weighted average period of
2.43
years.
Employee Stock Purchase Plan (ESPP)
The company operates a nonqualified, broad-based ESPP for all eligible employees. Employees may purchase shares of our common stock generally in annual intervals at
85%
of fair market value. Employee ESPP contributions may not exceed
$6,000
per offering period. Upon the plan vesting date, the company either issues new shares or can utilize shares held in treasury (see Note
9
, "Share Capital") to satisfy the exercise. For the year ended
December 31, 2017
, the company recognized
$0.9 million
in compensation expense related to the employee stock purchase plan (
December 31, 2016
:
$0.9 million
,
December 31, 2015
:
$0.9 million
).
12
.
RETIREMENT BENEFIT PLANS
Defined Contribution Plans
The company operates defined contribution retirement benefit plans for all qualifying employees. The assets of the plans are held separately from those of the company in funds under the control of trustees. When employees leave the plans prior to vesting fully in the contributions, the contributions payable by the company are reduced by the amount of forfeited contributions.
The total amounts charged to the Consolidated Statements of Income for the year ended
December 31, 2017
, of
$73.1 million
(
December 31, 2016
:
$58.6 million
, December 31,
2015
:
$58.4 million
) represent contributions paid or payable to these plans by the company at rates specified in the rules of the plans. As of
December 31, 2017
, accrued contributions of
$26.2 million
(
December 31, 2016
:
$23.1 million
) for the current year will be paid to the plans.
118
Defined Benefit Plans
The company maintains legacy defined benefit pension plans for qualifying employees of its subsidiaries in the U.K., Ireland, Germany and Taiwan. All defined benefit plans are closed to new participants. In December 2016, the company amended the U.K. plan resulting in a curtailment gain and a prior service cost which were recorded in Other comprehensive income/(loss), net of tax. During
2017
, the company recorded
$7.3 million
expense related to a partial settlement of the U.K. pension plan. The company also offered a postretirement medical plan in the U.S., which was closed to new participants in 2005. In 2006, the plan was amended to eliminate benefits for all participants who did not meet retirement eligibility by 2008. In November 2014, Invesco further amended the plan, which resulted in its termination and settlement effective December 31, 2016. The assets of all defined benefit schemes are held in separate trustee-administered funds.
The most recent actuarial valuations of plan assets and the present value of the defined benefit obligation were valued as of
December 31, 2017
. The benefit obligation, related current service cost and prior service cost were measured using the projected unit credit method.
Benefit Obligations and Funded Status
The amounts included in the Consolidated Balance Sheets arising from the company's obligations and plan assets in respect of its defined benefit retirement plans are as follows:
|
Retirement Plans
|
|||||
|
$ in millions
|
2017
|
2016
|
|||
|
Benefit obligation
|
(548.6
|
)
|
(521.2
|
)
|
|
|
Fair value of plan assets
|
486.9
|
|
424.1
|
|
|
|
Funded status
|
(61.7
|
)
|
(97.1
|
)
|
|
|
Amounts recognized in the Consolidated Balance Sheets:
|
|||||
|
Other assets
|
3.6
|
|
3.4
|
|
|
|
Accrued compensation and benefits
|
(65.3
|
)
|
(100.5
|
)
|
|
|
Funded status
|
(61.7
|
)
|
(97.1
|
)
|
|
Changes in the benefit obligations were as follows:
|
Retirement Plans
|
|||||
|
$ in millions
|
2017
|
2016
|
|||
|
January 1
|
521.2
|
|
490.7
|
|
|
|
Service cost
|
2.3
|
|
4.6
|
|
|
|
Interest cost
|
14.1
|
|
16.5
|
|
|
|
Actuarial (gains)/losses
|
3.3
|
|
102.4
|
|
|
|
Exchange difference
|
51.7
|
|
(73.5
|
)
|
|
|
Benefits paid
|
(9.0
|
)
|
(13.8
|
)
|
|
|
Plan amendments
|
—
|
|
4.1
|
|
|
|
Curtailment
|
—
|
|
(9.8
|
)
|
|
|
Settlement
|
(35.0
|
)
|
—
|
|
|
|
December 31
|
548.6
|
|
521.2
|
|
|
Key assumptions used in plan valuations are detailed below. Appropriate local mortality tables are also used. The weighted average assumptions used to determine defined benefit obligations at
December 31
,
2017
, and
2016
are as follows:
|
Retirement Plans
|
|||||
|
2017
|
2016
|
||||
|
Discount rate
|
2.47
|
%
|
2.64
|
%
|
|
|
Expected rate of salary increases
|
3.26
|
%
|
3.26
|
%
|
|
|
Future pension trend rate increases
|
2.97
|
%
|
2.98
|
%
|
|
119
Changes in the fair value of plan assets in the current period were as follows:
|
Retirement Plans
|
|||||
|
$ in millions
|
2017
|
2016
|
|||
|
January 1
|
424.1
|
|
422.7
|
|
|
|
Actual return on plan assets
|
52.3
|
|
71.0
|
|
|
|
Exchange difference
|
41.9
|
|
(69.9
|
)
|
|
|
Contributions from the company
|
11.8
|
|
14.2
|
|
|
|
Benefits paid
|
(9.0
|
)
|
(13.9
|
)
|
|
|
Settlement and other
|
(34.2
|
)
|
—
|
|
|
|
December 31
|
486.9
|
|
424.1
|
|
|
The components of the amount recognized in accumulated other comprehensive income at
December 31
,
2017
, and
2016
are as follows:
|
Retirement Plans
|
|||||
|
$ in millions
|
2017
|
2016
|
|||
|
Prior service cost/(credit)
|
3.9
|
|
3.7
|
|
|
|
Net actuarial loss/(gain)
|
128.3
|
|
164.1
|
|
|
|
Total
|
132.2
|
|
167.8
|
|
|
The amounts in accumulated other comprehensive income expected to be amortized into the Consolidated Income Statement during the year ending
December 31
,
2018
are as follows:
|
$ in millions
|
Retirement Plans
|
|
|
Prior service cost/(credit)
|
0.1
|
|
|
Net actuarial loss/(gain)
|
2.4
|
|
|
Total
|
2.5
|
|
The total accumulated benefit obligation and fair value of plan assets for plans with accumulated benefit obligations in excess of plan assets and the projected benefit obligation and fair value of plan assets for pension plans with projected benefit obligations in excess of plan assets are as follows:
|
Retirement Plans
|
|||||
|
$ in millions
|
2017
|
2016
|
|||
|
Plans with accumulated benefit obligation in excess of plan assets:
|
|||||
|
Accumulated benefit obligation
|
539.4
|
|
512.1
|
|
|
|
Fair value of plan assets
|
474.1
|
|
411.6
|
|
|
|
Plans with projected benefit obligation in excess of plan assets:
|
|
|
|
||
|
Projected benefit obligation
|
539.4
|
|
512.1
|
|
|
|
Fair value of plan assets
|
474.1
|
|
411.6
|
|
|
Net Periodic Benefit Cost
The components of net periodic benefit cost in respect of these defined benefit plans are as follows:
|
Retirement Plans
|
Medical Plan
|
|||||||||||||
|
$ in millions
|
2017
|
2016
|
2015
|
2016
|
2015
|
|||||||||
|
Service cost
|
2.3
|
|
4.6
|
|
5.4
|
|
—
|
|
—
|
|
||||
|
Interest cost
|
14.1
|
|
16.5
|
|
17.7
|
|
—
|
|
—
|
|
||||
|
Expected return on plan assets
|
(22.6
|
)
|
(21.7
|
)
|
(22.9
|
)
|
—
|
|
—
|
|
||||
|
Amortization of prior service cost/(credit)
|
0.2
|
|
—
|
|
0.1
|
|
(11.3
|
)
|
(11.3
|
)
|
||||
|
Amortization of net actuarial (gain)/loss
|
3.0
|
|
1.8
|
|
3.0
|
|
(0.3
|
)
|
(0.3
|
)
|
||||
|
Settlement
|
7.3
|
|
—
|
|
—
|
|
(9.0
|
)
|
—
|
|
||||
|
Net periodic benefit cost/(credit)
|
4.3
|
|
1.2
|
|
3.3
|
|
(20.6
|
)
|
(11.6
|
)
|
||||
120
The weighted average assumptions used to determine net periodic benefit cost for the years ended
December 31
,
2017
,
2016
, and
2015
are:
|
Retirement Plans
|
||||||||
|
2017
|
2016
|
2015
|
||||||
|
Discount rate
|
2.64
|
%
|
3.69
|
%
|
3.52
|
%
|
||
|
Expected return on plan assets
|
5.01
|
%
|
5.53
|
%
|
5.90
|
%
|
||
|
Expected rate of salary increases
|
3.26
|
%
|
3.16
|
%
|
3.06
|
%
|
||
|
Future pension rate increases
|
2.98
|
%
|
2.98
|
%
|
2.88
|
%
|
||
In developing the expected rate of return, the company considers long-term compound annualized returns based on historical and current market data. Using this reference information, the company develops forward-looking return expectations for each asset category and an expected long-term rate of return for a targeted portfolio. Discount rate assumptions were based upon AA-rated corporate bonds of suitable terms and currencies.
Plan Assets
The analysis of the plan assets as of
December 31, 2017
was as follows:
|
$ in millions
|
Retirement Plans
|
% of Plan Assets
|
|||
|
Cash and cash equivalents
|
10.7
|
|
2.2
|
%
|
|
|
Fund investments
|
227.9
|
|
46.8
|
%
|
|
|
Equity securities
|
133.9
|
|
27.5
|
%
|
|
|
Government debt securities
|
20.9
|
|
4.3
|
%
|
|
|
Other assets
|
13.4
|
|
2.8
|
%
|
|
|
Guaranteed investments contracts
|
80.1
|
|
16.5
|
%
|
|
|
Total
|
486.9
|
|
100.0
|
%
|
|
The analysis of the plan assets as of
December 31, 2016
was as follows:
|
$ in millions
|
Retirement Plans
|
% of Plan Assets
|
|||
|
Cash and cash equivalents
|
3.9
|
|
0.9
|
%
|
|
|
Fund investments
|
207.4
|
|
48.9
|
%
|
|
|
Equity securities
|
122.1
|
|
28.8
|
%
|
|
|
Government debt securities
|
73.0
|
|
17.2
|
%
|
|
|
Other assets
|
7.3
|
|
1.7
|
%
|
|
|
Guaranteed investments contracts
|
10.4
|
|
2.5
|
%
|
|
|
Total
|
424.1
|
|
100.0
|
%
|
|
Plan assets are not held in company stock. The investment policies and strategies for plan assets held by defined benefit plans include:
|
•
|
Funding - to have sufficient assets available to pay members benefits;
|
|
•
|
Security - to maintain the minimum Funding Requirement;
|
|
•
|
Stability - to have due regard to the employer's ability in meeting contribution payments given their size and incidence.
|
Fund investments are primarily held in equity and fixed income strategies. The following table presents the carrying value of the plan assets, including major security type for equity and debt securities, which are measured at fair value as of
December 31, 2017
:
121
|
As of December 31, 2017
|
|||||||||||
|
$ in millions
|
Fair Value Measurements
|
Quoted Prices in Active Markets for Identical Assets (Level 1)
|
Significant Other Observable Inputs (Level 2)
|
Significant Unobservable Inputs (Level 3)
|
|||||||
|
Cash and cash equivalents
|
10.7
|
|
10.7
|
|
—
|
|
—
|
|
|||
|
Fund investments
|
227.9
|
|
227.9
|
|
—
|
|
—
|
|
|||
|
Equity securities
|
133.9
|
|
133.9
|
|
—
|
|
—
|
|
|||
|
Government debt securities
|
20.9
|
|
13.9
|
|
7.0
|
|
—
|
|
|||
|
Other assets
|
80.1
|
|
80.1
|
|
—
|
|
—
|
|
|||
|
Guaranteed investments contracts
|
13.4
|
|
—
|
|
—
|
|
13.4
|
|
|||
|
Total
|
486.9
|
|
466.5
|
|
7.0
|
|
13.4
|
|
|||
The following table presents the carrying value of the plan assets, including major security type for equity and debt securities, which are measured at fair value as of
December 31, 2016
:
|
As of December 31, 2016
|
|||||||||||
|
$ in millions
|
Fair Value Measurements
|
Quoted Prices in Active Markets for Identical Assets (Level 1)
|
Significant Other Observable Inputs (Level 2)
|
Significant Unobservable Inputs (Level 3)
|
|||||||
|
Cash and cash equivalents
|
3.9
|
|
3.9
|
|
—
|
|
—
|
|
|||
|
Fund investments
|
207.4
|
|
207.4
|
|
—
|
|
—
|
|
|||
|
Equity securities
|
122.1
|
|
122.1
|
|
—
|
|
—
|
|
|||
|
Government debt securities
|
73.0
|
|
13.7
|
|
59.3
|
|
—
|
|
|||
|
Other assets
|
7.3
|
|
7.3
|
|
—
|
|
—
|
|
|||
|
Guaranteed investment contracts
|
10.4
|
|
—
|
|
—
|
|
10.4
|
|
|||
|
Total
|
424.1
|
|
354.4
|
|
59.3
|
|
10.4
|
|
|||
The following is a description of the valuation methodologies used for each major category of plan assets measured at fair value. Information about the valuation hierarchy levels used to measure fair value is detailed in Note
2
, “Fair Value of Assets and Liabilities.”
Cash and cash equivalents
Cash equivalents include cash in the bank and cash investments in money market funds. Cash investments in money market funds are valued under the market approach through the use of quoted market prices in an active market, which is the net asset value of the underlying funds, and are classified within level 1 of the valuation hierarchy.
Fund investments
These plan assets are primarily invested in affiliated funds and are classified within level 1 of the valuation hierarchy. They are valued at the net asset value of shares held by the plan at year end.
Equity securities, corporate debt securities and other investments
These plan assets are classified within level 1 of the valuation hierarchy and are valued at the closing price reported on the active market on which the individual securities are traded.
Government debt securities
Government debt securities that have a readily available market price are classified within level 1 of the valuation hierarchy. These securities are valued at the closing price reported on the active market on which the individual securities are traded. Government debt securities that include index-linked bonds are classified within level 2 of the valuation hierarchy. Prices for these bonds are calculated using the relevant index ratio.
Guaranteed investment contracts
These plan assets are classified within level 3 of the valuation hierarchy and are valued through use of unobservable inputs by discounting the related cash flows based on current yields of similar instruments with comparable durations considering the credit-worthiness of the issuer. Guaranteed investment contracts balance at
December 31, 2017
is
$13.4 million
compared to
$10.4 million
at
December 31, 2016
.
122
Cash Flows
The estimated amounts of contributions expected to be paid to the plans during 2018 are
$24.5 million
for retirement plans. There are
no
future annual benefits of plan participants covered by insurance contracts issued by the employer or related parties.
The benefits expected to be paid in each of the next five fiscal years and in the five fiscal years thereafter are as follows:
|
$ in millions
|
Retirement Plans
|
|
|
Expected benefit payments:
|
||
|
2018
|
9.3
|
|
|
2019
|
9.6
|
|
|
2020
|
10.0
|
|
|
2021
|
10.3
|
|
|
2022
|
10.6
|
|
|
Thereafter in the succeeding five years
|
59.3
|
|
13
.
OPERATING LEASES
The company leases office space in the majority of its locations of business under non-cancelable operating leases. These leases and commitments expire on varying dates through 2025.
As of
December 31, 2017
, the company's total future commitments by year under non-cancelable operating leases are as follows:
|
$ in millions
|
Total
|
Buildings
|
Other
|
|||||
|
2018
|
59.7
|
|
57.6
|
|
2.1
|
|
||
|
2019
|
61.6
|
|
59.6
|
|
2.0
|
|
||
|
2020
|
53.6
|
|
51.6
|
|
2.0
|
|
||
|
2021
|
50.7
|
|
49.8
|
|
0.9
|
|
||
|
2022
|
48.5
|
|
48.5
|
|
—
|
|
||
|
Thereafter
|
90.4
|
|
90.4
|
|
—
|
|
||
|
Gross lease commitments
|
364.5
|
|
357.5
|
|
7.0
|
|
||
|
Less: future minimum payments expected to be received under non-cancelable subleases
|
6.7
|
|
6.7
|
|
—
|
|
||
|
Net lease commitments
|
357.8
|
|
350.8
|
|
7.0
|
|
||
The company recognized
$54.3 million
,
$46.9 million
, and
$45.7 million
in operating lease expenses in the Consolidated Statements of Income in
2017
,
2016
and
2015
, respectively. These expenses are net of
$1.0 million
,
$10.9 million
and
$7.6 million
of sublease income in
2017
,
2016
and
2015
, respectively.
123
14
.
OTHER GAINS AND LOSSES, NET
The components of other gains and losses, net, are as follows:
|
$ in millions
|
2017
|
2016
|
2015
|
|||||
|
Other gains:
|
||||||||
|
Gain on sale of investments
|
11.3
|
|
1.5
|
|
3.8
|
|
||
|
Gain on trading investments, net
|
40.4
|
|
14.2
|
|
—
|
|
||
|
Foreign exchange hedge gain
|
—
|
|
22.0
|
|
—
|
|
||
|
Gain on contingent consideration liability
|
7.6
|
|
—
|
|
27.1
|
|
||
|
Net foreign exchange gains
|
16.2
|
|
—
|
|
—
|
|
||
|
Other realized gains
|
0.2
|
|
1.4
|
|
0.9
|
|
||
|
Total other gains
|
75.7
|
|
39.1
|
|
31.8
|
|
||
|
Other losses:
|
||||||||
|
Other-than-temporary impairment of available-for-sale investments
|
(3.2
|
)
|
—
|
|
(2.0
|
)
|
||
|
Loss on trading investments, net
|
—
|
|
—
|
|
(13.5
|
)
|
||
|
Loss on contingent consideration liability
|
—
|
|
(7.4
|
)
|
—
|
|
||
|
Net foreign exchange losses
|
—
|
|
(6.0
|
)
|
(2.4
|
)
|
||
|
Foreign exchange hedge loss
|
(21.0
|
)
|
—
|
|
(7.7
|
)
|
||
|
Realized loss on sale of partnerships
|
—
|
|
—
|
|
(7.3
|
)
|
||
|
Other realized losses
|
—
|
|
(2.8
|
)
|
(0.4
|
)
|
||
|
Total other losses
|
(24.2
|
)
|
(16.2
|
)
|
(33.3
|
)
|
||
|
Other gains and losses, net
|
51.5
|
|
22.9
|
|
(1.5
|
)
|
||
124
15
.
TAXATION
The company's (provision) for income taxes for the years ended
December 31
,
2017
,
2016
and
2015
is summarized as follows:
|
$ in millions
|
2017
|
2016
|
2015
|
|||||
|
Current:
|
||||||||
|
Federal
|
(147.5
|
)
|
(161.0
|
)
|
(221.0
|
)
|
||
|
State
|
(30.2
|
)
|
(18.9
|
)
|
(23.4
|
)
|
||
|
Foreign
|
(142.2
|
)
|
(143.0
|
)
|
(161.4
|
)
|
||
|
(319.9
|
)
|
(322.9
|
)
|
(405.8
|
)
|
|||
|
Deferred:
|
|
|
|
|
|
|
||
|
Federal
|
63.0
|
|
(21.1
|
)
|
11.9
|
|
||
|
State
|
(11.2
|
)
|
(0.9
|
)
|
(5.2
|
)
|
||
|
Foreign
|
(0.1
|
)
|
6.6
|
|
1.1
|
|
||
|
51.7
|
|
(15.4
|
)
|
7.8
|
|
|||
|
Total income tax (provision)
|
(268.2
|
)
|
(338.3
|
)
|
(398.0
|
)
|
||
The net deferred tax recognized in the Consolidated Balance Sheets at
December 31
,
2017
and
2016
, respectively, includes the following:
|
$ in millions
|
2017
|
2016
|
|||
|
Deferred tax assets:
|
|||||
|
Deferred compensation arrangements
|
57.6
|
|
79.1
|
|
|
|
Accrued rent expenses
|
7.2
|
|
12.3
|
|
|
|
Tax loss carryforwards
|
94.6
|
|
64.8
|
|
|
|
Postretirement medical, pension and other benefits
|
16.6
|
|
24.4
|
|
|
|
Investment basis differences
|
32.8
|
|
58.3
|
|
|
|
Accrued bonus
|
8.8
|
|
64.8
|
|
|
|
Other
|
17.2
|
|
24.5
|
|
|
|
Total deferred tax assets
|
234.8
|
|
328.2
|
|
|
|
Valuation allowance
|
(94.7
|
)
|
(59.0
|
)
|
|
|
Deferred tax assets, net of valuation allowance
|
140.1
|
|
269.2
|
|
|
|
Deferred tax liabilities:
|
|
|
|
||
|
Deferred sales commissions
|
(11.0
|
)
|
(13.5
|
)
|
|
|
Goodwill and intangibles
|
(377.3
|
)
|
(509.6
|
)
|
|
|
Fixed assets
|
(19.2
|
)
|
(27.6
|
)
|
|
|
Other
|
(8.8
|
)
|
(9.2
|
)
|
|
|
Total deferred tax liabilities
|
(416.3
|
)
|
(559.9
|
)
|
|
|
Net deferred tax assets/(liabilities)
|
(276.2
|
)
|
(290.7
|
)
|
|
Deferred income tax assets and liabilities that relate to the same tax jurisdiction are recorded net on the consolidated balance sheet.The deferred tax asset is included in other assets and the deferred tax liability is separately presented on the consolidated balance sheet.
The 2017 Tax Act was enacted on December 22, 2017. The 2017 Tax Act significantly revised the U.S. Tax Code by reducing the U.S. federal corporate tax rates and requiring companies to pay a one-time transition tax on earnings of certain foreign subsidiaries that were previously tax deferred. At
December 31, 2017
, the company has not completed the accounting for the tax effects of enacting the 2017 Tax Act; however, the company has made a reasonable estimate of the effects on existing deferred tax balances and the one-time transition tax. The company recognized a provisional income tax benefit of
$130.7 million
which is included as a component of the provision for income taxes. The company will continue to make and refine all the calculations as additional analysis is completed. In addition, as a more thorough understanding of the tax law is obtained, potential future guidance is issued, and management makes decisions as a result of the 2017 Tax Act, the estimates could potentially be affected.
125
Provisional Amounts
Deferred tax assets and liabilities:
The company remeasured certain deferred tax assets and liabilities based on the tax rates at which they are expected to reverse in the future, typically 21% under the 2017 Tax Act. However, the company is still analyzing certain aspects of the legislation and refining its calculations. Any updates or changes could affect the measurement of these balances or give rise to new deferred tax amounts. The provisional income tax benefit recorded related to the remeasurement of the deferred tax balance was
$130.7 million
at
December 31, 2017
.
Foreign tax effects:
The one-time transition tax is based on the total post-1986 earnings and profits (E&P) that were previously deferred from U.S. income taxes. The company does not anticipate incurring an income tax liability and therefore
no
provision has been made. However, the company has not completed its analysis as to the existence of foreign subsidiaries it may be deemed to indirectly own (or partially own) through attribution or by way of its investment in various fund products which in turn may hold ownership in foreign subsidiaries where the transition tax may apply. Therefore, our determination as to the need for a net transition tax liability may change once this analysis has been completed.
At
December 31, 2017
the company had tax loss carryforwards accumulated in certain taxing jurisdictions in the aggregate of
$413.3 million
(
2016
:
$243.8 million
), approximately
$35.2 million
of which will expire between 2018 and 2020,
$15.2 million
of which will expire after 2020, with the remaining
$362.9 million
having an indefinite life. The increase in tax loss carryforwards from
2016
to
2017
of
$169.5 million
results from the acquisition of the European ETF business (
$160.1 million
) and the impact of foreign exchange translation on non-U.S. dollar denominated losses (
$23.1 million
) with the remainder of the movement due to additional losses not recognized (
$15.8 million
), offset with loss expiration and utilization (
$30.0 million
). A valuation allowance has been recorded against the deferred tax assets related to these losses where a history of losses in the respective tax jurisdiction makes it unlikely that the deferred tax asset will be realized.
A reconciliation between the statutory rate and the effective tax rate on income from operations for the years ended
December 31
,
2017
,
2016
and
2015
is as follows:
|
2017
|
2016
|
2015
|
||||||
|
Statutory Rate
|
35.0
|
%
|
35.0
|
%
|
35.0
|
%
|
||
|
Foreign jurisdiction statutory income tax rates
|
(9.6
|
)%
|
(8.1
|
)%
|
(9.2
|
)%
|
||
|
State taxes, net of federal tax effect
|
2.2
|
%
|
1.6
|
%
|
1.6
|
%
|
||
|
Impact of the 2017 Tax Act
|
(9.3
|
)%
|
—
|
%
|
—
|
%
|
||
|
Change in valuation allowance for unrecognized tax losses
|
0.4
|
%
|
(0.4
|
)%
|
(0.1
|
)%
|
||
|
Share Based Compensation
|
(0.3
|
)%
|
—
|
%
|
—
|
%
|
||
|
Other
|
1.2
|
%
|
0.3
|
%
|
1.8
|
%
|
||
|
(Gains)/losses attributable to noncontrolling interests
|
(0.8
|
)%
|
(0.4
|
)%
|
0.1
|
%
|
||
|
Effective tax rate per Consolidated Statements of Income
|
18.8
|
%
|
28.0
|
%
|
29.2
|
%
|
||
The company's subsidiaries operate in several taxing jurisdictions around the world, each with its own statutory income tax rate. As a result, the blended average statutory tax rate will vary from year to year depending on the mix of the profits and losses of the company's subsidiaries. The majority of our profits are earned in the U.S. and the U.K.
The enacted U.K. statutory tax rate, for U.S. GAAP purposes, was
19%
as of
December 31, 2017
. As of
December 31, 2017
, the U.S. federal statutory tax rate was
35%
. The 2017 Tax Act enacted for U.S. GAAP purposes on December 22, 2017 reduces the U.S. federal statutory tax rate to 21% from January 1, 2018.
126
The division of income/(losses) before taxes between U.S. and foreign for the years ended
December 31,
2017
,
2016
and
2015
is as follows:
|
$ in millions (except percentages)
|
2017
|
2016
|
2015
|
|||||
|
U.S.
|
638.4
|
|
537.5
|
|
661.9
|
|
||
|
CIP - U.S.
|
0.1
|
|
2.4
|
|
26.0
|
|
||
|
Total U.S. income before income taxes
|
638.5
|
|
539.9
|
|
687.9
|
|
||
|
Foreign
|
754.8
|
|
652.0
|
|
746.3
|
|
||
|
CIP - Foreign
|
35.9
|
|
14.7
|
|
(72.1
|
)
|
||
|
Total Foreign income before income taxes
|
790.7
|
|
666.7
|
|
674.2
|
|
||
|
Income from continuing operations before income taxes
|
1,429.2
|
|
1,206.6
|
|
1,362.1
|
|
||
As a multinational corporation, the company operates in various locations around the world and we generate substantially all of our earnings from our subsidiaries. Under ASC 740-30 deferred tax liabilities are recognized for taxes that would be payable on the unremitted earnings of the company's subsidiaries, direct investments in CIP and joint ventures, except where it is our intention to continue to indefinitely reinvest the undistributed earnings. Our Canadian and U.S. subsidiaries continue to be directly owned by Invesco Holding Company Limited, a U.K. company, which is directly owned by Invesco Ltd. Our Canadian unremitted earnings, for which we are indefinitely reinvested, are estimated to be
$988.0 million
at
December 31, 2017
, compared with
$897.2 million
at
December 31, 2016
. If distributed as a dividend, Canadian withholding tax of
5.0%
would be due. Dividends from our investment in the U.S. should not give rise to additional tax as we are not subject to withholding tax between the U.S. and U.K. Deferred tax liabilities in the amount of
$1.4 million
(
2016
:
$0.9 million
) for withholding tax on unremitted earnings have been recognized. These subsidiaries have regularly remitted earnings and we expect to continue to remit earnings in the foreseeable future. The U.K. dividend exemption should apply to the remainder of our U.K. subsidiary investments. There is no additional tax on dividends from the U.K. to Bermuda.
The company and its subsidiaries file annual income tax returns in the U.S. federal jurisdiction, various U.S. state and local jurisdictions, and in numerous foreign jurisdictions. A number of years may elapse before an uncertain tax position, for which the company has unrecognized tax benefits, is finally resolved. To the extent that the company has favorable tax settlements, or determines that accrued amounts are no longer needed due to a lapse in the applicable statute of limitations or other change in circumstances, such liabilities, as well as the related interest and penalty, would be reversed as a reduction of income tax expense (net of federal tax effects, if applicable) in the period such determination is made. At January 1,
2017
, the company had approximately
$10.5 million
of gross unrecognized income tax benefits (UTBs), of which
$9.5 million
represents the amount of unrecognized tax benefits that, if recognized, would favorably affect the effective tax rate in future periods. A reconciliation of the change in the UTB balance from January 1,
2015
, to
December 31, 2017
, is as follows:
|
$ in millions
|
Gross Unrecognized Income Tax Benefits
|
|
|
Balance at January 1, 2015
|
6.0
|
|
|
Additions for tax positions related to the current year
|
2.5
|
|
|
Additions for tax positions related to prior years
|
2.2
|
|
|
Other reductions for tax positions related to prior years
|
(1.1
|
)
|
|
Reductions for statute closings
|
—
|
|
|
Balance at December 31, 2015
|
9.6
|
|
|
Additions for tax positions related to the current year
|
0.9
|
|
|
Additions for tax positions related to prior years
|
0.1
|
|
|
Other reductions for tax positions related to prior years
|
(0.1
|
)
|
|
Reductions for statute closings
|
—
|
|
|
Balance at December 31, 2016
|
10.5
|
|
|
Additions for tax positions related to the current year
|
0.9
|
|
|
Additions for tax positions related to prior years
|
11.5
|
|
|
Other reductions for tax positions related to prior years
|
(0.2
|
)
|
|
Reductions for statute closings
|
(3.1
|
)
|
|
Balance at December 31, 2017
|
19.6
|
|
127
The company recognizes accrued interest and penalties, as appropriate, related to unrecognized tax benefits as a component of the income tax provision. At
December 31, 2017
, the total amount of gross unrecognized tax benefits was
$19.6 million
. 2017 movement is mainly due to a liability of
$11.0 million
being recorded as a result of an uncertain tax position arising from Illinois Tax Regulation changes enacted in the year and
$3.1 million
reduction related to the expiration of statute of limitations during the year. Of this total,
$16.5 million
(net of tax benefits in other jurisdictions and the federal benefit of state taxes) represents the amount of unrecognized tax benefits that, if recognized, would favorably affect the effective tax rate in future periods. The Consolidated Balance Sheet includes accrued interest and penalties of
$2.9 million
at
December 31, 2017
, reflecting
$1.2 million
for accrued interest and penalties in
2017
(year ended
December 31, 2016
:
$1.7 million
of accrued interest and penalties,
$0.5 million
of settlement for accrued interest and penalties in 2015; year ended
December 31, 2015
:
$1.2 million
accrued interest and penalties,
$0.9 million
settlement o
f for accrued interests and penalties). As a result of the anticipated legislative changes and potential settlements with taxing authorities, it is reasonably possible that the company's gross unrecognized tax benefits balance may change within the next twelve months by a range of
zero
to
$10.0 million
. The company and its subsidiaries are periodically examined by various taxing authorities. With few exceptions, the company is no longer subject to income tax examinations by the primary tax authorities for years prior to 2010. Management monitors changes in tax statutes and regulations and the issuance of judicial decisions to determine the potential impact to uncertain income tax positions. As of
December 31, 2017
, management had identified no other potential subsequent events that could have a significant impact on the unrecognized tax benefits balance.
16
.
EARNINGS PER SHARE
The calculation of earnings per share is as follows:
|
Years ended December 31,
|
|||||||||||
|
In millions, except per share data
|
2017
|
2016
|
2015
|
||||||||
|
Net income, net of taxes
|
|
$1,161.0
|
|
|
$868.3
|
|
|
$964.1
|
|
||
|
Net (income)/loss attributable to noncontrolling interests in consolidated entities
|
(33.7
|
)
|
(14.1
|
)
|
4.0
|
|
|||||
|
Net income attributable to Invesco Ltd. for basic and diluted EPS calculations
|
1,127.3
|
|
854.2
|
|
968.1
|
|
|||||
|
Less: Allocation of earnings to restricted shares
|
(33.7
|
)
|
(24.8
|
)
|
(24.6
|
)
|
|||||
|
Net income attributable to common shareholders
|
|
$1,093.6
|
|
|
$829.4
|
|
|
$943.5
|
|
||
|
Invesco Ltd:
|
|||||||||||
|
Weighted average shares outstanding - basic
|
409.4
|
|
414.7
|
|
428.9
|
|
|||||
|
Dilutive effect of non-participating share-based awards
|
0.5
|
|
0.3
|
|
0.4
|
|
|||||
|
Weighted average shares outstanding - diluted
|
409.9
|
|
415.0
|
|
429.3
|
|
|||||
|
Common shareholders:
|
|||||||||||
|
Weighted average shares outstanding - basic
|
409.4
|
|
414.7
|
|
428.9
|
|
|||||
|
Less: Weighted average restricted shares
|
(12.2
|
)
|
(12.1
|
)
|
(10.9
|
)
|
|||||
|
Weighted average common shares outstanding- basic
|
397.2
|
|
402.6
|
|
418.0
|
|
|||||
|
Dilutive effect of non-participating share-based awards
|
0.5
|
|
0.3
|
|
0.4
|
|
|||||
|
Weighted average common shares outstanding - diluted
|
397.7
|
|
402.9
|
|
418.4
|
|
|||||
|
Earnings per share:
|
|||||||||||
|
Basic earnings per share
|
$2.75
|
$2.06
|
$2.26
|
||||||||
|
Diluted earnings per share
|
$2.75
|
$2.06
|
$2.26
|
||||||||
See Note
11
, “Share-Based Compensation,” for a summary of share awards outstanding under the company's share-based payment programs. These programs could result in the issuance of common shares that would affect the measurement of basic and diluted earnings per share.
The computation of diluted earnings per share during the years ended
December 31
,
2017
,
2016
, and
2015
did not include any anti-dilutive awards. There were
0.1 million
contingently issuable shares excluded from the diluted earnings per share computation during the year ended
December 31, 2017
(
December 31, 2016
:
0.2 million
;
December 31, 2015
:
0.4 million
),
because the necessary performance conditions for the shares to be issuable had not yet been satisfied at the end of the respective period.
128
17
.
GEOGRAPHIC INFORMATION
The company operates under one business segment, investment management. Geographical information is presented below. There are no revenues or long-lived assets attributed to the company's country of domicile, Bermuda.
|
$ in millions
|
U.S.
|
U.K.
|
Continental Europe/Ireland
|
Canada
|
Asia
|
Total
|
|||||||||||
|
For the year ended December 31, 2017
|
|||||||||||||||||
|
Revenue from external customers
|
2,747.9
|
|
955.8
|
|
999.6
|
|
339.0
|
|
118.0
|
|
5,160.3
|
|
|||||
|
Inter-company revenue
|
(5.6
|
)
|
122.8
|
|
(243.0
|
)
|
(16.9
|
)
|
142.7
|
|
—
|
|
|||||
|
Total operating revenues
|
2,742.3
|
|
1,078.6
|
|
756.6
|
|
322.1
|
|
260.7
|
|
5,160.3
|
|
|||||
|
Long-lived assets
|
332.2
|
|
118.3
|
|
10.0
|
|
8.9
|
|
21.3
|
|
490.7
|
|
|||||
|
For the year ended December 31, 2016
|
|||||||||||||||||
|
Revenue from external customers
|
2,544.2
|
|
930.9
|
|
826.8
|
|
325.5
|
|
107.0
|
|
4,734.4
|
|
|||||
|
Inter-company revenue
|
(27.0
|
)
|
99.0
|
|
(188.9
|
)
|
(10.3
|
)
|
127.2
|
|
—
|
|
|||||
|
Total operating revenues
|
2,517.2
|
|
1,029.9
|
|
637.9
|
|
315.2
|
|
234.2
|
|
4,734.4
|
|
|||||
|
Long-lived assets
|
331.6
|
|
95.9
|
|
10.7
|
|
9.4
|
|
17.1
|
|
464.7
|
|
|||||
|
For the year ended December 31, 2015
|
|||||||||||||||||
|
Revenue from external customers
|
2,622.1
|
|
1,153.0
|
|
891.9
|
|
353.9
|
|
102.0
|
|
5,122.9
|
|
|||||
|
Inter-company revenue
|
(8.6
|
)
|
114.4
|
|
(216.7
|
)
|
(7.0
|
)
|
117.9
|
|
—
|
|
|||||
|
Total operating revenues
|
2,613.5
|
|
1,267.4
|
|
675.2
|
|
346.9
|
|
219.9
|
|
5,122.9
|
|
|||||
|
Long-lived assets
|
306.7
|
|
88.3
|
|
6.8
|
|
10.0
|
|
15.1
|
|
426.9
|
|
|||||
Operating revenues reflect the geographical regions from which services are provided.
18
.
COMMITMENTS AND CONTINGENCIES
Commitments and contingencies may arise in the ordinary course of business.
The company has transactions with various private equity, real estate and other investment entities sponsored by the company for the investment of client assets in the normal course of business. Certain of the company's investment products are structured as limited partnerships. The company's investment may take the form of the general partner or a limited partner. The entities are structured such that each partner makes capital commitments that are to be drawn down over the life of the partnership as investment opportunities are identified. At
December 31, 2017
, the company's undrawn capital and purchase commitments were
$292.8 million
(
December 31, 2016
:
$204.1 million
).
The Parent and various company subsidiaries have entered into agreements with financial institutions to guarantee certain obligations of other company subsidiaries. The company would be required to perform under these guarantees in the event of certain defaults. The company has not had prior claims or losses pursuant to these contracts and expects the risk of loss to be remote.
As previously announced, the company has entered into an agreement to purchase Guggenheim Investments' ETF business for a purchase price of
$1.2 billion
, to be paid in cash. It is anticipated that the purchase will be completed within the second quarter of 2018.
129
Legal Contingencies
The company is from time to time involved in litigation relating to claims arising in the ordinary course of its business. The nature and progression of litigation can make it difficult to predict the impact a particular lawsuit will have on the company. There are many reasons that the company cannot make these assessments, including, among others, one or more of the following: the proceeding is in its early stages; the damages sought are unspecified, unsupportable, unexplained or uncertain; the claimant is seeking relief other than compensatory damages; the matter presents novel legal claims or other meaningful legal uncertainties; discovery has not started or is not complete; there are significant facts in dispute; and there are other parties who may share in any ultimate liability.
In management’s opinion, adequate accrual has been made as of
December 31, 2017
to provide for any such losses that may arise from matters for which the company could reasonably estimate an amount. Management is of the opinion that the ultimate resolution of such claims will not materially affect the company’s business, financial position, results of operation or liquidity. Furthermore, in management’s opinion, it is not possible to estimate a range of reasonably possible losses with respect to other litigation contingencies.
The investment management industry also is subject to extensive levels of ongoing regulatory oversight and examination. In the United States, United Kingdom, and other jurisdictions in which the company operates, governmental authorities regularly make inquiries, hold investigations and administer market conduct examinations with respect to the company's compliance with applicable laws and regulations. Additional lawsuits or regulatory enforcement actions arising out of these inquiries may in the future be filed against the company and related entities and individuals in the United States, United Kingdom and other jurisdictions in which the company and its affiliates operate. Any material loss of investor and/or client confidence as a result of such inquiries and/or litigation could result in a significant decline in assets under management, which would have an adverse effect on the company’s future financial results and its ability to grow its business.
In a separate matter, a Canadian subsidiary of the company had previously received assessments related to prior taxation periods up to and including the year ended December 31, 2012 for goods and services tax that the Canada Revenue Agency (CRA) believes should be levied on certain fees payable. The assessments, including applicable interest, are approximately
$7.8 million
. The company has secured a letter of credit in the same amount, which has been posted with the CRA as security for payment. The company objected to and appealed the assessments and in May 2017 the Tax Court of Canada ruled in favor of the CRA. The company filed an appeal with the Federal Court of Appeal in June 2017. Management, with advice from tax advisors and counsel, believes it is more likely than not that its position will prevail upon appeal, and accordingly no provision has been recorded in the Consolidated Financial Statements.
19
.
CONSOLIDATED INVESTMENT PRODUCTS
The following table presents the balances related to CIP that are included on the Consolidated Balance Sheets as well as Invesco's net interest in the CIP for each period presented. At
December 31, 2017
all CIP are VIEs.
|
As of
|
|||||
|
$ in millions
|
December 31, 2017
|
December 31, 2016
|
|||
|
Cash and cash equivalents of CIP
|
511.3
|
|
742.2
|
|
|
|
Accounts receivable and other assets of CIP
|
131.5
|
|
106.2
|
|
|
|
Investments of CIP
|
5,658.0
|
|
5,116.1
|
|
|
|
Less: Debt of CIP
|
(4,799.8
|
)
|
(4,403.1
|
)
|
|
|
Less: Other liabilities of CIP
|
(498.8
|
)
|
(673.4
|
)
|
|
|
Less: Retained earnings
|
16.7
|
|
19.0
|
|
|
|
Less: Accumulated other comprehensive income, net of tax
|
(16.6
|
)
|
(18.0
|
)
|
|
|
Less: Equity attributable to redeemable noncontrolling interests
|
(243.2
|
)
|
(283.7
|
)
|
|
|
Less: Equity attributable to nonredeemable noncontrolling interests
|
(258.6
|
)
|
(107.2
|
)
|
|
|
Invesco's net interests in CIP
|
500.5
|
|
498.1
|
|
|
130
The following table reflects the impact of consolidation of investment products into the Consolidated Statements of Income for the years ended
December 31
,
2017
,
2016
and
2015
.
Summary of Income Statement Impact of CIP
|
Years ended December 31,
|
|||||||||
|
$ in millions
|
2017
|
2016
|
2015
|
||||||
|
Total operating revenues
|
(32.4
|
)
|
(22.3
|
)
|
(39.2
|
)
|
|||
|
Total operating expenses
|
10.5
|
|
28.7
|
|
24.0
|
|
|||
|
Operating income
|
(42.9
|
)
|
(51.0
|
)
|
(63.2
|
)
|
|||
|
Equity in earnings of unconsolidated affiliates
|
(20.0
|
)
|
(8.9
|
)
|
(1.7
|
)
|
|||
|
Interest and dividend income
|
—
|
|
(0.3
|
)
|
(4.4
|
)
|
|||
|
Other gains and losses, net
|
(38.4
|
)
|
(1.9
|
)
|
(3.9
|
)
|
|||
|
Interest and dividend income of CIP
|
211.6
|
|
195.3
|
|
253.0
|
|
|||
|
Interest expense of CIP
|
(155.3
|
)
|
(123.5
|
)
|
(188.9
|
)
|
|||
|
Other gains/(losses) of CIP, net
|
81.0
|
|
7.4
|
|
(37.0
|
)
|
|||
|
Income before income taxes
|
36.0
|
|
17.1
|
|
(46.1
|
)
|
|||
|
Income tax provision
|
—
|
|
—
|
|
—
|
|
|||
|
Net income
|
36.0
|
|
17.1
|
|
(46.1
|
)
|
|||
|
Net (income)/loss attributable to noncontrolling interests in consolidated entities
|
(33.7
|
)
|
(14.1
|
)
|
5.7
|
|
|||
|
Net income attributable to Invesco Ltd.
|
2.3
|
|
3.0
|
|
(40.4
|
)
|
|||
The company's risk with respect to each investment in CIP is limited to its equity ownership and any uncollected management and performance fees. The company has no right to the benefits from, nor does it bear the risks associated with, these investments, beyond the company's direct investments in, and management and performance fees generated from, the investment products. If the company were to liquidate, these investments would not be available to the general creditors of the company, and as a result, the company does not consider investments held by CIP to be company assets. Additionally, the collateral assets of consolidated collateralized loan obligations (CLOs) are held solely to satisfy the obligations of the CLOs, and the investors in the consolidated CLOs have no recourse to the general credit of the company for the notes issued by the CLOs. CIP are taxed at the investor level and not at the product level; therefore, there is no tax provision reflected in the net impact of CIP.
Non-consolidated VIEs
At
December 31, 2017
, the company's carrying value and maximum risk of loss with respect to VIEs in which the company is not the primary beneficiary was
$227.3 million
(
December 31, 2016
:
$234.4 million
).
Balance Sheet information - newly consolidated VIEs/VOEs
During the year ended
December 31, 2017
, the company invested in and consolidated
nineteen
new VIEs (
December 31, 2016
: the company invested in and consolidated fifteen new VIEs and one VOE). The tables below illustrate the summary balance sheet amounts related to these products before consolidation into the company. The balances below are reflective of the balances existing at the consolidation date after the initial funding of the investments by the company and unrelated third-party investors. The current period activity for the consolidated funds, including the initial funding and subsequent investment of initial cash balances into underlying investments of CIP, is reflected in the company’s Consolidated Financial Statements.
131
|
For the year ended December 31, 2017
|
For the year ended December 31, 2016
|
||||||||
|
$ in millions
|
VIEs
|
VIEs
|
VOEs
|
||||||
|
Cash and cash equivalents of CIP
|
277.8
|
|
609.8
|
|
—
|
|
|||
|
Accounts receivable and other assets of CIP
|
11.5
|
|
108.5
|
|
0.2
|
|
|||
|
Investments of CIP
|
851.8
|
|
1,032.8
|
|
49.8
|
|
|||
|
Total assets
|
1,141.1
|
|
1,751.1
|
|
50.0
|
|
|||
|
Debt of CIP
|
544.2
|
|
1,013.3
|
|
—
|
|
|||
|
Other liabilities of CIP
|
331.5
|
|
472.4
|
|
—
|
|
|||
|
Total liabilities
|
875.7
|
|
1,485.7
|
|
—
|
|
|||
|
Total equity
|
265.4
|
|
265.4
|
|
50.0
|
|
|||
|
Total liabilities and equity
|
1,141.1
|
|
1,751.1
|
|
50.0
|
|
|||
During the year ended
December 31, 2017
, the company determined it was no longer the primary beneficiary of
eight
VIEs and
one
VOE. During the year ended
December 31, 2016
, the company determined that it was no longer the primary beneficiary of
ten
VIEs. The amounts deconsolidated from the Consolidated Balance Sheets are illustrated in the table below. There was
no
net impact to the Consolidated Statements of Income for the years ended
December 31, 2017
and
December 31, 2016
from the deconsolidation of these investment products.
|
For the year ended December 31, 2017
|
For the year ended December 31, 2016
|
|||||||
|
$ in millions
|
VIEs
|
VOEs
|
VIEs
|
|||||
|
Cash and cash equivalents of CIP
|
15.8
|
|
—
|
|
40.1
|
|
||
|
Accounts receivable and other assets of CIP
|
4.1
|
|
0.2
|
|
19.0
|
|
||
|
Investments of CIP
|
358.1
|
|
49.8
|
|
418.0
|
|
||
|
Total assets
|
378.0
|
|
50.0
|
|
477.1
|
|
||
|
Debt of CIP
|
4.2
|
|
—
|
|
—
|
|
||
|
Other liabilities of CIP
|
3.1
|
|
—
|
|
23.9
|
|
||
|
Total liabilities
|
7.3
|
|
—
|
|
23.9
|
|
||
|
Total equity
|
370.7
|
|
50.0
|
|
453.2
|
|
||
|
Total liabilities and equity
|
378.0
|
|
50.0
|
|
477.1
|
|
||
The following tables present the fair value hierarchy levels of certain CIP balances which are measured at fair value as of
December 31, 2017
and
December 31, 2016
:
|
As of December 31, 2017
|
||||||||||||||
|
$ in millions
|
Fair Value Measurements
|
Quoted Prices in Active Markets for Identical Assets (Level 1)
|
Significant Other Observable Inputs (Level 2)
|
Significant Unobservable Inputs
(Level 3)
|
Investments Measured at NAV as a practical expedient
|
|||||||||
|
Assets:
|
||||||||||||||
|
Bank loans
|
4,894.2
|
|
—
|
|
4,894.2
|
|
—
|
|
—
|
|
||||
|
Bonds
|
302.0
|
|
—
|
|
302.0
|
|
—
|
|
—
|
|
||||
|
Equity securities
|
203.2
|
|
198.8
|
|
4.4
|
|
—
|
|
—
|
|
||||
|
Equity and fixed income mutual funds
|
19.0
|
|
19.0
|
|
—
|
|
—
|
|
—
|
|
||||
|
Investments in other private equity funds
|
163.4
|
|
—
|
|
—
|
|
—
|
|
163.4
|
|
||||
|
Real estate investments
|
76.2
|
|
—
|
|
—
|
|
76.2
|
|
—
|
|
||||
|
Total assets at fair value
|
5,658.0
|
|
217.8
|
|
5,200.6
|
|
76.2
|
|
163.4
|
|
||||
132
|
|
As of December 31, 2016
|
|||||||||||||
|
$ in millions
|
Fair Value Measurements
|
Quoted Prices in Active Markets for Identical Assets (Level 1)
|
Significant Other Observable Inputs (Level 2)
|
Significant Unobservable Inputs
(Level 3)
|
Investments Measured at NAV as a Practical expedient
|
|||||||||
|
Assets:
|
||||||||||||||
|
Bank loans
|
4,397.8
|
|
—
|
|
4,397.8
|
|
—
|
|
—
|
|
||||
|
Bonds
|
370.9
|
|
—
|
|
370.9
|
|
—
|
|
—
|
|
||||
|
Equity securities
|
167.4
|
|
166.0
|
|
1.4
|
|
—
|
|
—
|
|
||||
|
Equity and fixed income mutual funds
|
13.0
|
|
13.0
|
|
—
|
|
—
|
|
—
|
|
||||
|
Investments in other private equity funds
|
68.6
|
|
—
|
|
—
|
|
—
|
|
68.6
|
|
||||
|
Real estate investments
|
40.7
|
|
—
|
|
—
|
|
40.7
|
|
—
|
|
||||
|
Investments in fixed income fund of funds
|
57.7
|
|
—
|
|
—
|
|
—
|
|
57.7
|
|
||||
|
Total assets at fair value
|
5,116.1
|
|
179.0
|
|
4,770.1
|
|
40.7
|
|
126.3
|
|
||||
The following table shows a reconciliation of the beginning and ending fair value measurements for level 3 assets and liabilities using significant unobservable inputs:
|
Year ended December 31, 2017
|
Year ended December 31, 2016
|
||||
|
$ in millions
|
Level 3 Assets
|
Level 3 Assets
|
|||
|
Beginning balance
|
40.7
|
|
388.6
|
|
|
|
Adjustment for adoption of ASU 2015-02
|
—
|
|
(388.6
|
)
|
|
|
Purchases
|
15.1
|
|
39.4
|
|
|
|
Sales
|
(4.5
|
)
|
—
|
|
|
|
Gains and losses included in the Consolidated Statements of Income*
|
24.9
|
|
1.3
|
|
|
|
Ending balance
|
76.2
|
|
40.7
|
|
|
____________
|
*
|
Included in gains/(losses) of CIP, net in the Consolidated Statement of Income for the year ended
December 31, 2017
are
$24.5 million
in net unrealized
gains
attributable to investments still held at
December 31, 2017
by CIP (year ended
December 31, 2016
:
$1.3 million
net unrealized
gains
attributable to investments still held at
December 31, 2016
).
|
Unforeseen events might occur that would subsequently change the fair values of the investments (and therefore the debt of CLOs, since it is measured as a calculated value based upon the fair value of the assets of CLOs, but the impact of such changes would be limited to the change in the fair values of the company's investments in these products. The impact of any gains or losses resulting from valuation changes in the investments of non-CLO CIP attributable to the interests of third parties are offset by resulting changes in gains and losses attributable to noncontrolling interests in consolidated entities and therefore do not have a material effect on the financial condition, operating results (including earnings per share), liquidity or capital resources of the company's common shareholders. Similarly, any gains or losses resulting from valuation changes in the investments of CLOs attributable to the interests of third parties are offset by the calculated value of the notes issued by the CLOs (offsetting in other gains/(losses) of CIP) and therefore also do not have a material effect on the financial condition, operating results (including earnings per share), liquidity or capital resources of the company's common shareholders.
133
Value of consolidated CLOs
The company elected the fair value option for collateral assets held and notes issued by its consolidated CLOs to eliminate the measurement and recognition inconsistency that would otherwise arise from measuring assets and liabilities and recognizing the related gains and losses on different accounting bases. On January 1, 2015 the company adopted ASU 2014-13 and has elected the measurement alternative for the consolidated CLOs under which the notes issued by the CLOs are measured based on the fair value of the assets of the CLOs.
The collateral assets held by consolidated CLOs are primarily invested in senior secured bank loans, bonds, and equity securities. Bank loan investments at
December 31, 2017
of
$4,859.3 million
(
December 31, 2016
:
$4,397.8 million
), which comprise the majority of consolidated CLO portfolio collateral, are senior secured corporate loans from a variety of industries, including but not limited to the aerospace and defense, broadcasting, technology, utilities, household products, healthcare, oil and gas, transportation, real estate, packaging, and finance industries. Bank loan investments mature at various dates between
2018
and
2026
, pay interest at Libor plus a spread of up to
10.0%
, and typically range in S&P credit rating categories from BBB down to unrated. Interest income on bank loans and bonds is recognized based on the unpaid principal balance and stated interest rate of these investments on an accrual basis. At
December 31, 2017
, the unpaid principal balance exceeds the fair value of the senior secured bank loans and bonds by approximately
$84.6 million
(
December 31, 2016
: the unpaid principal balance exceeded the fair value of the senior secured bank loans and bonds by approximately
$96.6 million
). Approximately
0.41%
of the collateral assets are in default as of
December 31, 2017
(
December 31, 2016
: approximately
0.3%
of the collateral assets were in default). CLO investments are valued based on price quotations provided by third party pricing sources. These third party sources aggregate indicative price quotations daily to provide the company with a price for the CLO investments. The company has developed internal controls to review the reasonableness and completeness of these price quotations on a daily basis. If necessary, price quotations are challenged through the third-party pricing source price challenge process.
In addition, the company's internal valuation committee conducts an annual due diligence review of all independent third-party pricing sources to review the provider's valuation methodology as well as ensure internal controls exist over the valuation of the CLO investments. In the event that the third-party pricing source is unable to price an investment, other relevant factors, data and information are considered, including: i) information relating to the market for the investment, including price quotations for and trading in the investment and interests in similar investments, the market environment, and investor attitudes towards the investment and interests in similar investments; ii) the characteristics of and fundamental analytical data relating to the investment, including, for senior secured corporate loans, the cost, size, current interest rate, period until next interest rate reset, maturity and base lending rate, the terms and conditions of the senior secured corporate loan and any related agreements, and the position of the senior secured corporate loan in the borrower's debt structure; iii) the nature, adequacy and value of the senior secured corporate loan's collateral, including the CLO's rights, remedies and interests with respect to the collateral; iv) for senior secured corporate loans, the creditworthiness of the borrower, based on an evaluation of its financial condition, financial statements and information about the business, cash flows, capital structure and future prospects; v) the reputation and financial condition of the agent and any intermediate participants in the senior secured corporate loan; and vi) general economic and market conditions affecting the fair value of the senior secured corporate loan.
Notes issued by consolidated CLOs mature at various dates between
2025
and
2031
and have a weighted average maturity of
10.0
years. The notes are issued in various tranches with different risk profiles. The interest rates are generally variable rates based on Libor plus a pre-defined spread, which varies from
0.92%
for the more senior tranches to
8.25%
for the more subordinated tranches. The investors in this debt are not affiliated with the company and have no recourse to the general credit of the company for this debt.
Fair value of consolidated real estate funds
The real estate investment vehicles use one or more valuation techniques (e.g. the market approach, the income approach, or the recent transaction "cost" approach) for which sufficient and reliable data is available to value investments classified within level 3. The use of the market approach generally consists of using comparable market transactions, while the use of the income approach generally consists of the net present value of estimated future cash flows, adjusted as appropriate for liquidity, credit, market and/or other risk factors.
The inputs used by the real estate funds in estimating the value of level 3 investments include the original transaction price, recent transactions in the same or similar instruments, as well as completed or pending third-party transactions in the underlying investment or comparable investments. Level 3 investments may also be adjusted to reflect illiquidity and/or non-transferability. Other inputs used include discount rates, cap rates, and income and expense assumptions. The fair value measurement of level 3 investments does not include transaction costs and acquisition fees that may be capitalized as part of the investment's cost basis.
134
Fair value of consolidated partnership entities
Consolidated private equity funds are generally structured as partnerships. Generally, the investment strategy of underlying holdings in these partnerships
is to seek capital appreciation through direct investments in public or private companies with compelling business models or ideas or through investments in partnership investments that also invest in similar private or public companies. Various strategies may be used. Companies targeted could be distressed organizations, targets of leveraged buyouts or fledgling companies in need of venture capital. Investors in CIP generally may not redeem their investment until the partnership liquidates. Generally, the partnerships have a life that ranges from
seven
to
twelve
years unless dissolved earlier. The general partner may extend the partnership term up to a specified period of time as stated in the Partnership Agreement. Some partnerships allow the limited partners to cause an earlier termination upon the occurrence of certain events as specified in the Partnership Agreement.
For private equity partnerships, fair value is determined by reviewing each investment for the sale of additional securities of an issuer to sophisticated investors or for investee financial conditions and fundamentals. Publicly traded portfolio investments are carried at market value as determined by their most recent quoted sale, or if there is no recent sale, at their most recent bid price. For these investments held by CIP, level 1 classification indicates that fair values have been determined using unadjusted quoted prices in active markets for identical assets that the partnership has the ability to access. Level 2 classification may indicate that fair values have been determined using quoted prices in active markets but give effect to certain lock-up restrictions surrounding the holding period of the underlying investments.
The fair value of level 3 investments held by CIP are derived from inputs that are unobservable and which reflect the limited partnerships' own determinations about the assumptions that market participants would use in pricing the investments, including assumptions about risk. These inputs are developed based on the partnership's own data, which is adjusted if information indicates that market participants would use different assumptions. The partnerships which invest directly into private equity portfolio companies (direct private equity funds) take into account various market conditions, subsequent rounds of financing, liquidity, financial condition, purchase multiples paid in other comparable third-party transactions, the price of securities of other companies comparable to the portfolio company, and operating results and other financial data of the portfolio company, as applicable.
The partnerships which invest into other private equity funds (funds-of-funds) take into account information received from those underlying funds, including their reported net asset values and evidence as to their fair value approach, including consistency of their fair value application. These investments do not trade in active markets and represent illiquid long-term investments that generally require future capital commitments. The partnerships' reported share of the underlying net asset values of the underlying funds is used as a practical expedient, as allowed by ASC Topic 820, in arriving at fair value.
Quantitative Information about Level 3 Fair Value Measurements
The following table shows significant unobservable inputs used in the fair value measurement of level 3 assets at
December 31, 2017
:
|
Assets and Liabilities *
|
Fair Value at December 31, 2017 ($ in millions)
|
Valuation Technique
|
Unobservable Inputs
|
Range
|
Weighted Average (by fair value)
|
||||||
|
Real Estate Investments
|
$76.2
|
Discounted Cash Flow
|
Discount rate
|
7% - 33%
|
17.0
|
%
|
|||||
|
Terminal capitalization rate
|
5.3%
|
5.3
|
%
|
||||||||
|
Average rent growth rate
|
2%-3%
|
2.5
|
%
|
||||||||
At
December 31, 2016
,
$40.7 million
of investments held by consolidated real estate funds were valued using recent private market transactions.
The following narrative will indicate the sensitivity of inputs illustrating the impact of significant increases to the inputs. A directionally opposite impact would apply for significant decreases in these inputs:
135
|
•
|
For real estate investments, a change in the average rent growth rate would result in a directionally-opposite change in the assumptions for discount rate and terminal capitalization rate. Significant increases in the average growth rate would result in significantly higher fair values. Significant increases in the assumptions for discount rate and terminal capitalization rate in isolation would result in significantly lower fair value measurements.
|
The table below summarizes as of
December 31, 2017
and
December 31, 2016
, the nature of investments that are valued using the NAV as a practical expedient and any related liquidation restrictions or other factors which may impact the ultimate value realized:
|
December 31, 2017
|
December 31, 2016
|
|||||||||||
|
in millions, except term data
|
Fair Value
|
Total Unfunded Commitments
|
Weighted Average Remaining Term
(2)
|
Fair Value
|
Total Unfunded Commitments
|
Weighted Average Remaining Term
(2)
|
||||||
|
Private equity funds
(1)
|
$163.4
|
$53.9
|
5.5 years
|
$68.6
|
$41.9
|
7.0 years
|
||||||
|
Investments in fixed income fund of funds
(3)
|
—
|
—
|
n/a
|
57.7
|
—
|
n/a
|
||||||
____________
|
(1)
|
These investments are not subject to redemption; however, for certain funds, the investors may sell or transfer their interest, which may require approval by the general partner of the underlying funds.
|
|
(2)
|
These investments are expected to be returned through distributions as a result of liquidations of the funds' underlying assets over the weighted average periods indicated.
|
(3) Investment may be redeemed on a monthly basis.
For investments held by consolidated private equity funds, significant increases in discounts in isolation would result in significantly lower fair value measurements, while significant increases in revenue multiple assumptions in isolation would result in significantly higher fair value measurements. An increase in discount assumptions would result in a directionally opposite change in the assumptions for revenue multiple resulting in lower fair value measurements.
Fair Value of Equity Securities, Bonds, and Equity/Fixed Income Mutual Funds
Equity securities are valued under the market approach through use of quoted prices on an exchange. To the extent these securities are actively traded, valuation adjustments are not applied and they are categorized within level 1 of the valuation hierarchy; otherwise, they are categorized in level 2 or level 3 depending on the inputs used.
Bonds are fair valued using an evaluated quote provided by an independent pricing service. Evaluated quotes provided by the pricing service may be determined without exclusive reliance on quoted prices, and may reflect appropriate factors such as institution-size trading in similar groups of securities, developments related to specific securities, yield, quality, type of issue, coupon rate, maturity, individual trading characteristics and other market data. Depending on the nature of the inputs, these investments are categorized as level 1, 2, or 3.
Equity and fixed income mutual funds are valued under the market approach through the use of quoted market prices available in an active market and is classified within level 1 of the valuation hierarchy; there is no modeling or additional information needed to arrive at the fair values of these investments.
136
20
.
RELATED PARTIES
Certain managed funds are deemed to be affiliated entities under the related party definition in ASC 850, "Related Party Disclosures." Additionally, related parties include those defined in the company's proxy statement. Affiliated balances are illustrated in the tables below:
|
Years ended December 31,
|
||||||||
|
$ in millions
|
2017
|
2016
|
2015
|
|||||
|
Affiliated operating revenues:
|
||||||||
|
Investment management fees
|
3,624.7
|
|
3,274.3
|
|
3,565.8
|
|
||
|
Service and distribution fees
|
851.2
|
|
822.3
|
|
854.0
|
|
||
|
Performance fees
|
73.8
|
|
21.5
|
|
29.2
|
|
||
|
Other
|
59.1
|
|
79.8
|
|
108.5
|
|
||
|
Total affiliated operating revenues
|
4,608.8
|
|
4,197.9
|
|
4,557.5
|
|
||
|
As of December 31,
|
|||||
|
$ in millions
|
2017
|
2016
|
|||
|
Affiliated asset balances:
|
|||||
|
Cash and cash equivalents
|
875.5
|
|
476.2
|
|
|
|
Unsettled fund receivables
|
204.0
|
|
253.2
|
|
|
|
Accounts receivable
|
359.9
|
|
344.4
|
|
|
|
Investments
|
608.5
|
|
728.3
|
|
|
|
Assets held for policyholders
|
12,444.2
|
|
8,224.2
|
|
|
|
Other assets
|
9.2
|
|
2.9
|
|
|
|
Total affiliated asset balances
|
14,501.3
|
|
10,029.2
|
|
|
|
Affiliated liability balances:
|
|||||
|
Accrued compensation and benefits
|
90.7
|
|
76.5
|
|
|
|
Accounts payable and accrued expenses
|
64.5
|
|
94.7
|
|
|
|
Unsettled fund payables
|
288.8
|
|
318.7
|
|
|
|
Total affiliated liability balances
|
444.0
|
|
489.9
|
|
|
21
.
BUSINESS OPTIMIZATION
Business optimization charges of
$58.0 million
were recorded in
2017
(
2016
:
$49.9 million
;
2015
:
$16.2 million
), including
$30.0 million
of staff severance costs recorded in employee compensation,
$25.3 million
recorded in general and administrative expenses, and
$2.7 million
recorded in property, office and technology expenses associated with a business transformation initiative. This is a continuation of efforts to transform several key business support functions to become more effective and efficient by leveraging shared service centers, outsourcing, automation of key processes and optimization of the company's office footprint. Incremental implementation costs in
2018
are estimated to be up to
$35.0 million
. The Consolidated Balance Sheet at
December 31, 2017
does not include any material liabilities related to business optimization efforts.
22
.
SUBSEQUENT EVENTS
On
January 31, 2018
, the company declared a fourth quarter
2017
dividend of
29.0 cents
per share, payable on
March 2, 2018
, to shareholders of record at the close of business on
February 15, 2018
with an ex-dividend date of
February 14, 2018
.
137
Item 9.
Changes in and Disagreements with Accountants on Accounting and
Financial Disclosure
None
Item 9A.
Controls and Procedures
Evaluation of Disclosure Controls and Procedures
Management, with the participation of our chief executive officer and chief financial officer, has evaluated the effectiveness of our disclosure controls and procedures as of
December 31, 2017
. There are inherent limitations to the effectiveness of any system of disclosure controls and procedures, including the possibility of human error and the circumvention or overriding of the controls and procedures. Accordingly, even effective disclosure controls and procedures can only provide reasonable assurance of achieving their control objectives. Based upon this evaluation, our chief executive officer and chief financial officer concluded that the company's disclosure controls and procedures were effective to provide reasonable assurance that information required to be disclosed by us in the reports that we file or submit under the Exchange Act is recorded, processed, summarized and reported, within the time periods specified in the applicable rules and forms, and that it is accumulated and communicated to our management, including our chief executive officer and chief financial officer, as appropriate to allow timely decisions regarding required disclosure.
Management's report on internal control over financial reporting is located in Item 8, “Financial Statements and Supplementary Data” of this Annual Report on Form 10-K. Our independent registered public accounting firm, PricewaterhouseCoopers LLP, have issued an audit report on the effectiveness of our internal control over financial reporting for the year ended
December 31, 2017
.
Item 9B.
Other Information
None
Item 10.
Directors, Executive Officers and Corporate Governance
Invesco filed the certification of its Chief Executive Officer with the New York Stock Exchange (NYSE) in 2017 as required pursuant to Section 303A of the NYSE Listed Company Manual. In addition, Invesco filed the Sarbanes-Oxley Act Section 302 certifications of its Chief Executive Officer and Chief Financial Officer with the Securities and Exchange Commission, which certifications are attached hereto as Exhibit 31.1 and Exhibit 31.2, respectively.
The information required by this Item will be included in the definitive Proxy Statement for the company's annual meeting of shareholders, which will be filed with the SEC no later than 120 days after the close of the fiscal year ended
December 31, 2017
, under the captions “Information About Director Nominees,” “Information About the Executive Officers of the Company,” “Corporate Governance,” “Information About the Board and its Committees,” “Section 16(a) Beneficial Ownership Reporting Compliance,” and possibly elsewhere therein. Such information is incorporated into this Item 10 by reference.
Item 11.
Executive Compensation
The information required by this Item will be included in the definitive Proxy Statement for the company's annual meeting of shareholders, which will be filed with the SEC no later than 120 days after the close of the fiscal year ended
December 31, 2017
, under the captions “Information About the Board and its Committees - Director Compensation,” “Executive Compensation,” “Compensation Committee Interlocks and Insider Participation,” and possibly elsewhere therein. Such information is incorporated into this Item 11 by reference.
138
Item 12.
Security Ownership of Certain Beneficial Owners and Management
and Related Stockholder Matters
The information required by this Item will be included in the definitive Proxy Statement for the company's annual meeting of shareholders, which will be filed with the SEC no later than 120 days after the close of the fiscal year ended
December 31, 2017
, under the captions “Security Ownership of Principal Shareholders,” “Security Ownership of Management,” and possibly elsewhere therein. Such information is incorporated into this Item 12 by reference.
Item 13.
Certain Relationships and Related Transactions, and Director
Independence
The information required by this Item will be included in the definitive Proxy Statement for the company's annual meeting of shareholders, which will be filed with the SEC no later than 120 days after the close of the fiscal year ended
December 31, 2017
, under the captions “Corporate Governance,” “Certain Relationships and Related Transactions,” “Related Person Transaction Policy,” and possibly elsewhere therein. Such information is incorporated into this Item 13 by reference.
Item 14.
Principal Accountant Fees and Services
The information required by this Item will be included in the definitive Proxy Statement for the company's annual meeting of shareholders, which will be filed with the SEC no later than 120 days after the close of the fiscal year ended
December 31, 2017
, under the captions “Fees Paid to Independent Registered Public Accounting Firm,” “Pre-Approval Process and Policy,” and possibly elsewhere therein. Such information is incorporated into this Item 14 by reference.
Item 15.
Exhibits and Financial Statement Schedule
(a)(1) The Consolidated Financial Statements filed as part of this Report are listed in Item 8, “Financial Statements and Supplementary Data.”
(a)(2) No financial statement schedules are required to be filed as part of this Report; therefore, all such schedules have been omitted. Such omission has been made on the basis that information is provided in the Consolidated Financial Statements or related footnotes in Item 8, “Financial Statements and Supplementary Data,” or is not required to be filed as the information is not applicable.
(a)(3) The exhibits listed on the Exhibit Index are included with this Report.
Item 16.
Form 10-K Summary
Not applicable
Exhibit Index
(Note: Exhibits 10.2 through 10.25 and 10.27 through 10.35 are management contracts or compensatory plans or arrangements required to be filed as an exhibit to this Report pursuant to Item 15(b) of this Report. References herein to “AMVESCAP,” or “AMVESCAP PLC” are to the predecessor registrant to Invesco Ltd.)
|
3.1
|
|
|
3.2
|
|
|
4.1
|
|
|
4.2
|
|
139
|
4.3
|
|
|
4.4
|
|
|
4.5
|
|
|
4.6
|
|
|
4.7
|
|
|
4.8
|
|
|
4.9
|
|
|
4.10
|
|
|
10.1
|
|
|
10.2
|
|
|
10.3
|
|
|
10.4
|
|
|
10.5
|
|
|
10.6
|
|
|
10.7
|
|
|
10.8
|
|
|
10.9
|
|
|
10.10
|
|
|
10.11
|
|
|
10.12
|
|
140
|
10.13
|
|
|
10.14
|
|
|
10.15
|
|
|
10.16
|
|
|
10.17
|
|
|
10.18
|
|
|
10.19
|
|
|
10.20
|
|
|
10.21
|
|
|
10.22
|
|
|
10.23
|
|
|
10.24
|
|
|
10.25
|
|
|
10.26
|
|
|
10.27
|
|
|
10.28
|
|
|
10.29
|
|
|
10.30
|
|
141
|
10.31
|
|
|
10.32
|
|
|
10.33
|
|
|
10.34
|
|
|
10.35
|
|
|
10.36
|
|
|
21.0
|
|
|
23.1
|
|
|
31.1
|
|
|
31.2
|
|
|
32.1
|
|
|
32.2
|
|
|
101.INS
|
XBRL Instance Document
|
|
101.SCH
|
XBRL Taxonomy Extension Schema Document
|
|
101.CAL
|
XBRL Taxonomy Extension Calculation Linkbase Document
|
|
101.LAB
|
XBRL Taxonomy Extension Definition Linkbase Document
|
|
101.PRE
|
XBRL Taxonomy Extension Labels Linkbase Document
|
|
101.DEF
|
XBRL Taxonomy Extension Presentation Linkbase Document
|
142
SIGNATURES
Pursuant to the requirements of Section 13 or 15(d) of the Securities Exchange Act of 1934, the registrant has duly caused this Report to be signed on its behalf by the undersigned, thereunto duly authorized.
|
Invesco Ltd.
|
|
|
By:
|
/s/ MARTIN L. FLANAGAN
|
|
Name:
|
Martin L. Flanagan
|
|
Title:
|
President and Chief Executive Officer
|
|
Date:
|
February 23, 2018
|
Pursuant to the requirements of the Securities Exchange Act of 1934, this Report has been signed below by the following persons on behalf of the registrant and in the capacities indicated and on the dates indicated.
|
Name
|
Title
|
Date
|
|
/s/ MARTIN L. FLANAGAN
|
Chief Executive Officer (Principal Executive Officer) and President; Director
|
February 23, 2018
|
|
Martin L. Flanagan
|
||
|
/s/ LOREN M. STARR
|
Senior Managing Director and Chief Financial Officer (Principal Financial Officer)
|
February 23, 2018
|
|
Loren M. Starr
|
||
|
/s/ ANNETTE LEGE
|
Chief Accounting Officer (Principal Accounting Officer)
|
February 23, 2018
|
|
Annette Lege
|
||
|
/s/ BEN F. JOHNSON III
|
Chairman and Director
|
February 23, 2018
|
|
Ben F. Johnson III
|
||
|
/s/ SARAH E. BESHAR
|
Director
|
February 23, 2018
|
|
Sarah E. Beshar
|
||
|
/s/ JOSEPH R. CANION
|
Director
|
February 23, 2018
|
|
Joseph R. Canion
|
||
|
/s/ C. ROBERT HENRIKSON
|
Director
|
February 23, 2018
|
|
C. Robert Henrikson
|
||
|
/s/ DENIS KESSLER
|
Director
|
February 23, 2018
|
|
Denis Kessler
|
||
|
/s/ SIR NIGEL SHEINWALD
|
Director
|
February 23, 2018
|
|
Sir Nigel Sheinwald
|
||
|
/s/ G. RICHARD WAGONER, JR.
|
Director
|
February 23, 2018
|
|
G. Richard Wagoner, Jr.
|
||
|
/s/ PHOEBE A. WOOD
|
Director
|
February 23, 2018
|
|
Phoebe A. Wood
|
||
143
TABLE OF CONTENTS
Part IItem 1. BusinessItem 1A. Risk FactorsItem 1B. Unresolved Staff CommentsItem 2. PropertiesItem 3. Legal ProceedingsItem 4. Mine Safety DisclosuresPart IIItem 5. Market For Registrant's Common Equity, Related Stockholder Matters and Issuer Purchases Of Equity SecuritiesItem 6. Selected Financial DataItem 7. Management's Discussion and Analysis Of Financial Condition and Results Of OperationsItem 8, Financial Statements and Supplementary Data, Note 2 - Fair Value Of Assets and Liabilities For DetailItem 7A. Quantitative and Qualitative Disclosures About Market RiskItem 8. Financial Statements and Supplementary DataItem 9. Changes in and Disagreements with Accountants on Accounting and Financial DisclosureItem 9A. Controls and ProceduresItem 9B. Other InformationPart IIIItem 10. Directors, Executive Officers and Corporate GovernanceItem 11. Executive CompensationItem 12. Security Ownership Of Certain Beneficial Owners and Management and Related Stockholder MattersItem 13. Certain Relationships and Related Transactions, and Director IndependenceItem 14. Principal Accountant Fees and ServicesPart IVItem 15. Exhibits and Financial Statement ScheduleItem 16. Form 10-k Summary