JACK IN THE BOX INC /NEW/
10-Ks and 10-Qs
|
|
|
|
|
|
|
|
|
|
|
|
|
|
|
|
|
|
|
|
|
|
|
|
|
|
|
|
|
|
|
|
|
|
|
|
|
|
|
|
|
|
|
|
|
|
|
|
|
|
|
|
|
|
|
|
|
|
|
UNITED STATES
SECURITIES AND EXCHANGE COMMISSION
Washington, D.C. 20549
FORM 10-K
|
þ
|
ANNUAL REPORT PURSUANT TO SECTION 13 OR 15(d) OF THE SECURITIES EXCHANGE ACT OF 1934
|
FOR THE FISCAL YEAR ENDED
SEPTEMBER 27, 2015
COMMISSION FILE NUMBER 1-9390
|
Delaware
|
|
95-2698708
|
|
(State of Incorporation)
|
|
(I.R.S. Employer Identification No.)
|
|
9330 Balboa Avenue, San Diego, CA
|
|
92123
|
|
(Address of principal executive offices)
|
|
(Zip Code)
|
Registrant’s telephone number, including area code
(858) 571-2121
Securities registered pursuant to Section 12(b) of the Act:
|
Title of each class
|
|
Name of each exchange on which registered
|
|
Common Stock, $0.01 par value
|
|
The NASDAQ Stock Market LLC (NASDAQ Global Select Market)
|
Securities registered pursuant to Section 12(g) of the Act: None
Indicate by check mark whether the registrant is a well-known seasoned issuer, as defined in Rule 405 of the Securities Act.
Yes
þ
No
¨
Indicate by check mark if the registrant is not required to file reports pursuant to Section 13 or 15(d) of the Act.
Yes
¨
No
þ
Indicate by check mark if the registrant (1) has filed all reports required to be filed by Section 13 or 15(d) of the Securities Exchange Act of 1934 during the preceding 12 months (or for such shorter period that the registrant was required to file such reports), and (2) has been subject to such filing requirements for the past 90 days.
Yes
þ
No
¨
Indicate by check mark whether the registrant has submitted electronically and posted on its corporate Website, if any, every Interactive Data File required to be submitted and posted pursuant to Rule 405 of Regulations S-T (§232.405 of this chapter) during the preceding 12 months (or for such shorter period that the registrant was required to submit and post such files).
Yes
þ
No
¨
Indicate by check mark if disclosure of delinquent filers pursuant to Item 405 of Regulation S-K (§229.405 of this chapter) is not contained herein, and will not be contained, to the best of registrant’s knowledge, in definitive proxy or information statements incorporated by reference in Part III of this Form 10-K or any amendment to this Form 10-K.
þ
Indicate by check mark whether the registrant is a large accelerated filer, an accelerated filer, a non-accelerated filer, or a smaller reporting company. See the definitions of “large accelerated filer,” “accelerated filer” and “smaller reporting company” in Rule 12b-2 of the Exchange Act.
Large accelerated filer
þ
Accelerated filer
¨
Non-accelerated filer
¨
Smaller reporting company
¨
Indicate by check mark whether the registrant is a shell company (as defined in Rule 12b-2 of the Exchange Act).
Yes
¨
No
þ
The aggregate market value of the common stock held by non-affiliates of the registrant as of the last business day of the registrant’s most recently completed second fiscal quarter, computed by reference to the closing price reported on the NASDAQ Global Select Market — Composite Transactions as of
April 10, 2015
, was approximately
$3.5 billion
.
Number of shares of common stock, $0.01 par value, outstanding as of the close of business on
November 13, 2015
—
35,793,030
.
DOCUMENTS INCORPORATED BY REFERENCE
Portions of the Proxy Statement to be filed with the Securities and Exchange Commission in connection with the
2016
Annual Meeting of Stockholders are incorporated by reference into Part III hereof.
JACK IN THE BOX INC.
TABLE OF CONTENTS
|
|
|
Page
|
|
|
PART I
|
|
|
Item 1.
|
Business
|
|
|
Item 1A.
|
Risk Factors
|
|
|
Item 1B.
|
Unresolved Staff Comments
|
|
|
Item 2.
|
Properties
|
|
|
Item 3.
|
Legal Proceedings
|
|
|
Item 4.
|
Mine Safety Disclosures
|
|
|
PART II
|
||
|
Item 5.
|
Market for Registrant’s Common Equity, Related Stockholder Matters and Issuer Purchases of Equity Securities
|
|
|
Item 6.
|
Selected Financial Data
|
|
|
Item 7.
|
Management’s Discussion and Analysis of Financial Condition and Results of Operations
|
|
|
Item 7A.
|
Quantitative and Qualitative Disclosures About Market Risk
|
|
|
Item 8.
|
Financial Statements and Supplementary Data
|
|
|
Item 9.
|
Changes in and Disagreements With Accountants on Accounting and Financial Disclosure
|
|
|
Item 9A.
|
Controls and Procedures
|
|
|
Item 9B.
|
Other Information
|
|
|
PART III
|
||
|
Item 10.
|
Directors, Executive Officers and Corporate Governance
|
|
|
Item 11.
|
Executive Compensation
|
|
|
Item 12.
|
Security Ownership of Certain Beneficial Owners and Management and Related Stockholder Matters
|
|
|
Item 13.
|
Certain Relationships and Related Transactions, and Director Independence
|
|
|
Item 14.
|
Principal Accounting Fees and Services
|
|
|
PART IV
|
||
|
Item 15.
|
Exhibits, Financial Statement Schedules
|
|
FORWARD-LOOKING STATEMENTS
From time to time, we make oral and written forward-looking statements that reflect our current expectations regarding future results of operations, economic performance, financial condition and achievements of Jack in the Box Inc. (the “Company”). A forward-looking statement is neither a prediction nor a guarantee of future events or results. In some cases, forward-looking statements can be identified by words such as “anticipate,” “assume,” “believe,” “estimate,” “expect,” “forecast,” “goals,” “guidance,” “intend,” “plan,” “project,” “may,” “should,” “will,” “would,” and similar expressions. Certain forward-looking statements are included in this Form 10-K, principally in the sections captioned “Business,” “Legal Proceedings,” “Consolidated Financial Statements” and “Management’s Discussion and Analysis of Financial Condition and Results of Operations,” including statements regarding our strategic plans and operating strategies. Although we believe that the expectations reflected in our forward-looking statements are based on reasonable assumptions, such expectations and forward-looking statements may prove to be materially incorrect due to known and unknown risks and uncertainties.
In some cases, information regarding certain important factors that could cause our actual results to differ materially from any forward-looking statement appears together with such statement. In addition, the factors described under “Risk Factors” and “Discussion of Critical Accounting Estimates” in this Form 10-K, as well as other possible factors not listed, could cause our actual results, economic performance, financial condition or achievements to differ materially from those expressed in any forward-looking statements. As a result, investors should not place undue reliance on such forward-looking statements, which speak only as of the date of this report. The Company is under no obligation to update forward-looking statements, whether as a result of new information or otherwise.
1
|
ITEM 1.
|
BUSINESS
|
The Company
Overview
. Jack in the Box Inc., based in San Diego, California, operates and franchises
2,910
Jack in the Box
®
quick-service restaurants (“QSRs”) and Qdoba Mexican Eats
®
fast-casual restaurants ("Qdoba"). References to the Company throughout this Annual Report on Form 10-K are made using the first person notations of “we,” “us” and “our.”
Jack in the Box
. The first Jack in the Box restaurant opened in 1951. Jack in the Box is one of the nation’s largest hamburger chains and, based on number of restaurants, is the second largest QSR hamburger chain in eight of our top
10
major markets, which comprise
61%
of the total system. As of the end of our fiscal year on
September 27, 2015
, the Jack in the Box system included
2,249
restaurants in
21
states, and Guam, of which
413
were company-operated and
1,836
were franchise-operated.
Qdoba Mexican Eats.
To supplement our core growth and balance the risk associated with growing solely in the highly competitive hamburger segment of the QSR industry, in 2003 we acquired Qdoba Restaurant Corporation, operator and franchisor of Qdoba Mexican Eats. Qdoba is the
second
largest fast-casual Mexican food brand in the United States. As of
September 27, 2015
, the Qdoba system included
661
restaurants in
47
states, the District of Columbia and Canada, of which
322
were company-operated and
339
were franchise-operated.
Strategic Plan.
Our long-term strategic plan focuses on continued growth, increasing average unit volumes, and improving restaurant profitability and returns on invested capital.
Through the execution of our refranchising strategy over the last five years, we have increased franchise ownership of the Jack in the Box system from 57% at the end of fiscal 2010 to
82%
at the end of fiscal
2015
. In fiscal 2015, our Jack in the Box franchisees independently developed
16
new franchise restaurants, and we expect the majority of Jack in the Box new unit growth will be through franchise restaurants.
Through new unit growth, acquisitions of franchised Qdoba restaurants in select markets, and the refranchising of Jack in the Box restaurants, Qdoba has become a more prominent part of our company restaurant operations. As of the end of fiscal
2015
, Qdoba comprised approximately
44%
of our total company-operated units as compared with approximately 16% five years ago. We plan to continue to build out the number of Qdoba company locations at an accelerated pace over the next several years. Accelerating the growth of our Qdoba brand by increasing market penetration is anticipated to generate heightened brand awareness.
Restaurant Concepts
Jack in the Box
. Jack in the Box restaurants offer a broad selection of distinctive, innovative products including classic burgers like our Jumbo Jack
®
, and innovative new product lines such as our Buttery Jack
™
. We also offer tacos, regular and curly fries, specialty sandwiches, salads and real ice cream shakes. We allow our guests to customize their meals to their tastes and order any product when they want it, including breakfast items any time of day (or night).
The Jack in the Box restaurant chain was the first major hamburger chain to develop and expand the concept of drive-thru restaurants. In addition to drive-thru windows, most of our restaurants have seating capacities ranging from 20 to 100 persons and are open 18-24 hours a day. Drive-thru sales currently account for approximately
70%
of sales at company-operated restaurants. The average check in fiscal year
2015
was
$7.15
for company-operated restaurants.
With a presence in only
21
states, we believe Jack in the Box is a brand with significant growth opportunities. In fiscal
2015
, we continued to expand in existing markets. We opened
two
company-operated restaurants and franchisees opened
16
Jack in the Box restaurants during the year. In fiscal
2016
, we expect to open approximately
20
new Jack in the Box restaurants system-wide.
2
The following table summarizes the changes in the number of company-operated and franchise Jack in the Box restaurants over the past five years:
|
|
Fiscal Year
|
||||||||||||||
|
|
2015
|
2014
|
2013
|
2012
|
2011
|
||||||||||
|
Company-operated restaurants:
|
|||||||||||||||
|
Beginning of period
|
431
|
|
465
|
|
547
|
|
629
|
|
956
|
|
|||||
|
New
|
2
|
|
1
|
|
6
|
|
19
|
|
15
|
|
|||||
|
Refranchised
|
(21
|
)
|
(37
|
)
|
(78
|
)
|
(97
|
)
|
(332
|
)
|
|||||
|
Closed
|
(6
|
)
|
(2
|
)
|
(11
|
)
|
(4
|
)
|
(10
|
)
|
|||||
|
Acquired from franchisees
|
7
|
|
4
|
|
1
|
|
—
|
|
—
|
|
|||||
|
End of period total
|
413
|
|
431
|
|
465
|
|
547
|
|
629
|
|
|||||
|
% of system
|
18
|
%
|
19
|
%
|
21
|
%
|
24
|
%
|
28
|
%
|
|||||
|
Franchise restaurants:
|
|||||||||||||||
|
Beginning of period
|
1,819
|
|
1,786
|
|
1,703
|
|
1,592
|
|
1,250
|
|
|||||
|
New
|
16
|
|
11
|
|
11
|
|
18
|
|
16
|
|
|||||
|
Refranchised
|
21
|
|
37
|
|
78
|
|
97
|
|
332
|
|
|||||
|
Closed
|
(13
|
)
|
(11
|
)
|
(5
|
)
|
(4
|
)
|
(6
|
)
|
|||||
|
Sold to company
|
(7
|
)
|
(4
|
)
|
(1
|
)
|
—
|
|
—
|
|
|||||
|
End of period total
|
1,836
|
|
1,819
|
|
1,786
|
|
1,703
|
|
1,592
|
|
|||||
|
% of system
|
82
|
%
|
81
|
%
|
79
|
%
|
76
|
%
|
72
|
%
|
|||||
|
System end of period total
|
2,249
|
|
2,250
|
|
2,251
|
|
2,250
|
|
2,221
|
|
|||||
Qdoba
. Qdoba’s menu features Mexican-themed food items including burritos, tacos, salads, and quesadillas. Guests can customize their meals by adding 3-cheese queso, guacamole, and a variety of sauces and salsas without paying an extra charge. In fiscal 2016, the Qdoba brand will continue to evolve through menu innovation, and a new restaurant design, uniforms, and logo. Our new logo modifies the full name of our brand from Qdoba Mexican Grill
®
to Qdoba Mexican Eats to better reflect the flavors and variety our menu offers.
Our restaurants also offer a variety of catering options that can be tailored to feed groups of ten to several hundred. While some of our restaurants serve breakfast, the majority generally operate from 10:30 a.m. to 10:00 p.m. and have a seating capacity that ranges from 60 to 80 persons, including outdoor patio seating at many locations. In fiscal
2015
, the average check for company-operated restaurants was
$11.82
, which excludes catering sales.
We believe there is significant opportunity for continued growth at Qdoba, and currently estimate the long-term growth potential for Qdoba to be approximately 2,000 units across the United States. Our company-operated restaurants are generally located in larger market areas, while franchise development is more weighted towards non-traditional sites (airports, campuses, etc.) or areas where local franchisees can operate more efficiently. During fiscal
2015
, we opened
17
company-operated restaurants and franchisees opened
22
Qdoba restaurants, including 11 non-traditional sites. In fiscal
2016
,
50-60
new Qdoba restaurants are expected to open system-wide, of which approximately half are expected to be company-operated locations.
3
The following table summarizes the changes in the number of company-operated and franchise Qdoba restaurants over the past five years:
|
|
Fiscal Year
|
||||||||||||||
|
|
2015
|
2014
|
2013
|
2012
|
2011
|
||||||||||
|
Company-operated restaurants:
|
|||||||||||||||
|
Beginning of period
|
310
|
|
296
|
|
316
|
|
245
|
|
188
|
|
|||||
|
New
|
17
|
|
16
|
|
34
|
|
26
|
|
25
|
|
|||||
|
Refranchised
|
—
|
|
—
|
|
(3
|
)
|
—
|
|
—
|
|
|||||
|
Closed
|
(5
|
)
|
(2
|
)
|
(64
|
)
|
(1
|
)
|
—
|
|
|||||
|
Acquired from franchisees
|
—
|
|
—
|
|
13
|
|
46
|
|
32
|
|
|||||
|
End of period total
|
322
|
|
310
|
|
296
|
|
316
|
|
245
|
|
|||||
|
% of system
|
49
|
%
|
49
|
%
|
48
|
%
|
50
|
%
|
42
|
%
|
|||||
|
Franchise restaurants:
|
|||||||||||||||
|
Beginning of period
|
328
|
|
319
|
|
311
|
|
338
|
|
337
|
|
|||||
|
New
|
22
|
|
22
|
|
34
|
|
32
|
|
42
|
|
|||||
|
Refranchised
|
—
|
|
—
|
|
3
|
|
—
|
|
—
|
|
|||||
|
Closed
|
(11
|
)
|
(13
|
)
|
(16
|
)
|
(13
|
)
|
(9
|
)
|
|||||
|
Sold to company
|
—
|
|
—
|
|
(13
|
)
|
(46
|
)
|
(32
|
)
|
|||||
|
End of period total
|
339
|
|
328
|
|
319
|
|
311
|
|
338
|
|
|||||
|
% of system
|
51
|
%
|
51
|
%
|
52
|
%
|
50
|
%
|
58
|
%
|
|||||
|
System end of period total
|
661
|
|
638
|
|
615
|
|
627
|
|
583
|
|
|||||
Site Selection and Design
Site selections for all new company-operated Jack in the Box and Qdoba restaurants are made after an economic analysis and a review of demographic data and other information relating to population density, traffic, competition, restaurant visibility and access, available parking, surrounding businesses and opportunities for market penetration. Restaurants developed by franchisees are built to brand specifications on sites we have reviewed.
Each of our brands have multiple restaurant models with different seating capacities to improve our flexibility in selecting locations for our restaurants. Management believes that this flexibility enables the Company to match the restaurant configuration with the specific economic, demographic, geographic or physical characteristics of a particular site.
The majority of our Jack in the Box restaurants are constructed on leased land or on land that we purchased and subsequently sold, along with the improvements, in sale and leaseback transactions. Typical costs to develop a traditional Jack in the Box restaurant, excluding the land value, range from
$1.2 million
to
$2.0 million
. Upon completion of a sale and leaseback transaction, the Company’s initial cash investment is reduced to the cost of equipment, which ranges from approximately
$0.3 million
to
$0.5 million
.
The majority of Qdoba restaurants are located in leased spaces ranging from conventional large-scale retail projects to smaller neighborhood retail strip centers as well as non-traditional locations such as airports, college campuses and food courts. Qdoba restaurant development costs generally range from
$0.5 million
to
$1.5 million
depending on the type, square footage and geographic region. In fiscal 2015, we began testing new restaurant design elements as part of our brand evolution. Each element will be evaluated to determine the optimum design for new units and remodels of existing locations.
Franchising Program
Jack in the Box
. The Jack in the Box franchise agreement generally provides for an initial franchise fee of
$50,000
per restaurant for a
20-year term, royalty payments, and
marketing fees at
5%
of gross sales. Royalty rates, typically
5%
of gross sales, can range from
1%
to as high as
15%
of gross sales, and some existing agreements provide for variable rates and/or royalty holidays. We may offer development agreements to franchisees for construction of one or more new restaurants over a defined period of time and in a defined geographic area. Developers are required to pay a fee, which may be credited against a portion of the franchise fee due when restaurants open in the future. Developers may forfeit such fees and lose their rights to future development if they do not maintain the required schedule of openings. To stimulate growth we have offered lower royalty rates to franchisees who opened restaurants within specified time frames.
In connection with the sale of a company-operated restaurant, the restaurant equipment and the right to do business at that location for a specified term are sold to the franchisee. The aggregate price is negotiated based upon the value of the restaurant as
4
a going concern, which depends on various factors, including the sales and cash flows of the restaurant, as well as its location and history. In addition, the land and building are generally leased or subleased to the franchisee at a negotiated rent, typically equal to the greater of a minimum base rent or a percentage of gross sales. The franchisee is usually required to pay property taxes, insurance and ancillary costs, and is responsible for maintaining the restaurant.
Qdoba.
The current Qdoba franchise agreement generally provides for an initial franchise fee of
$30,000
per restaurant, a
10-year t
erm with a
10-year
option to extend at a fee of
$5,000
, royalty payments, and marketing fees of up to
2%
of gross sales. Most franchisees are also required to spend a minimum of
1%
of gross sales on local marketing for their restaurants. Royalty rates are typically
5%
of gross sales. We offer development agreements to franchisees for the construction of one or more new restaurants over a defined period of time and in a defined geographic area for a development fee, a portion of which may be credited against franchise fees due for restaurants when they are opened. If the developer does not maintain the required schedule of openings, they may forfeit such fees and lose their rights to future development. We continue to pursue non-traditional locations both through multi-location commitments and single unit franchise agreements. Currently, the non-traditional franchise agreements we offer provide for a $30,000 initial franchise fee, and a 6% royalty rate. To enhance our multi unit non-traditional growth, we may offer agreements that provide for lower fees.
Restaurant Management and Operations
Jack in the Box and Qdoba restaurants are operated by a company manager or franchise operator who is directly responsible for the operations of the restaurant, including product quality, service, food safety, cleanliness, inventory, cash control and the conduct and appearance of employees. We focus on attracting, selecting, engaging and retaining employees and franchisees who share our passion for creating long-lasting, successful restaurants.
At both brands, restaurant managers are supervised by district managers, who are overseen by directors of operations, who report to vice presidents of operations. Under our performance system, vice presidents and directors are eligible for an annual incentive based on achievement of goals related to region level sales, profit, and company-wide performance. District managers and restaurant managers are eligible for quarterly incentives based on growth in restaurant sales and profit and/or certain other operational performance standards.
Jack in the Box.
Company restaurant managers are required to attend extensive management training classes involving a combination of classroom instruction and on-the-job training in specially designated training restaurants. Restaurant managers and supervisory personnel train other restaurant employees in accordance with detailed procedures and guidelines using training aids available at each location.
Qdoba
. The Qdoba Career Map is the core development tool used to provide employees with detailed education by position, from entry level to restaurant manager. Restaurant managers and hourly team members are certified to train and develop employees through a series of on-the-job and classroom trainings that focus on knowledge, skills and behaviors. The Team Member Progression program within the Career Map tool recognizes achievement for our cooks and line servers who showcase excellence in their positions. Team members must have, or acquire, specific technical and behavioral skills to reach an achievement level.
Customer Satisfaction
Company-operated and franchise-operated restaurants devote significant resources toward ensuring that all of our restaurants offer quality food and excellent service. To help us maintain a high level of customer satisfaction, our Voice of Guest program provides restaurant managers, district managers, and franchise operators with ongoing feedback from guests who complete a short guest satisfaction survey via an invitation typically provided on the register receipt. In these surveys, guests rate their satisfaction with key elements of their restaurant experience, including friendliness, food quality, cleanliness, speed of service and order accuracy. In 2015, the Jack in the Box and Qdoba systems received approximately
2.0 million
and
0.2 million
guest survey responses, respectively. Our Guest Relations department also receives feedback that guests report either by telephone or via our website, and communicates that feedback to restaurant managers and franchise operators. We also collect guest feedback through social media and other resources.
Food Safety and Quality
Our “farm-to-fork” food safety and quality assurance programs are designed to maintain high standards for the food products and food preparation procedures used by our vendors and in our restaurants. We maintain product specifications and our Food Safety and Regulatory Compliance Department must approve all suppliers of food products to our restaurants. We manage food safety in our restaurants through a comprehensive food safety management program that is based on the Food and Drug Administration (“FDA”) Food Code and the Hazard Analysis & Critical Control Points (“HACCP”) system. HACCP includes employee training, testing, documented restaurant practices and attention to product safety and quality at each stage of the food
5
preparation cycle. The U.S. Department of Agriculture, FDA and the Center for Science in the Public Interest have recognized our HACCP-based program as a leader in the industry. In addition, our food safety management program uses American National Standards Institute certified food safety training programs to train our company and franchise restaurant management employees on food safety practices for our restaurants.
Supply Chain
Historically, we provided purchasing and distribution services for our company-operated restaurants and most of our franchise-operated restaurants. Our remaining franchisees purchased product from approved suppliers and distributors. In fiscal 2012, all of our company-operated Qdoba restaurants and approximately 90% of our Qdoba franchisees began utilizing the distribution services of a third-party distributor under a long-term contract, ending February 2017.
In July 2012, all of our Jack in the Box company-operated restaurants and approximately
90%
of our Jack in the Box franchisees entered into a long-term contract with another third-party distributor to provide distribution services to our Jack in the Box restaurants through August 2022. In the fourth quarter of fiscal 2012, we completed the transition of services from one distribution center and our remaining centers were transitioned by the end of the first quarter of fiscal 2013. Since June 2015, the remaining 10% of our Jack in the Box franchisees have utilized the same third-party distributor under the same long-term contract agreement.
The primary commodities purchased by our restaurants are beef, poultry, pork, cheese and produce. We monitor the primary commodities we purchase in order to minimize the impact of fluctuations in price and availability, and we may enter into purchasing contracts and pricing arrangements when we consider them advantageous. However, certain commodities remain subject to price fluctuations. We believe all essential food and beverage products are available, or can be made available, upon short notice from alternative qualified suppliers.
Information Systems
At our shared services corporate support center, we have centralized financial accounting systems, human resources and payroll systems, and a communications and network infrastructure that supports both Jack in the Box and Qdoba corporate functions. Our restaurant software allows for daily polling of sales, inventory and other data from the restaurants directly. Our company restaurants and traditional site franchise restaurants use standardized Windows-based touch screen point-of-sale (“POS”) platforms. These platforms allow the restaurants to accept cash, credit cards and our re-loadable gift cards. Our Qdoba POS system is also enhanced with an integrated guest loyalty program as well as a takeout and delivery interface. The takeout and delivery interface is used to manage online and catering orders which are distributed to sites via a hosted online ordering website.
We have developed business intelligence systems that provide visibility to the key metrics in the operation of company and franchise restaurants. These systems play an integral role in accumulating and analyzing market information. Our company restaurants use labor scheduling systems to assist managers in managing labor hours based on forecasted sales volumes. We also have inventory management systems which enable timely and accurate deliveries of food and packaging to our restaurants. To support order accuracy and speed of service, our drive-thru Jack in the Box restaurants use color order confirmation screens. We are currently engaged in a comprehensive review of our restaurant level technologies at Jack in the Box and Qdoba to identify opportunities to integrate systems across both of our brands.
Advertising and Promotion
Jack in the Box.
At Jack in the Box, we build brand awareness through our marketing and advertising programs and activities. These activities are supported primarily by financial contributions to a marketing fund from all company and franchise restaurants based on a percentage of gross sales. Activities to advertise restaurant products, promote brand awareness and attract customers include, but are not limited to, system and regional campaigns on television, radio and print media, as well as digital and social media.
Qdoba.
At Qdoba, the goal of our advertising and marketing efforts is to build brand awareness and generate traffic, and we seek to build brand advocates by delivering a great guest experience in the restaurants. All restaurants contribute a small percentage of gross sales to a fund primarily used for production and development of radio and print media, as well as digital and social media. Advertising is primarily done at the regional or local level for both company and franchise owned and operated restaurants, and is determined by the local management. Advertising is created at the brand level and the system operators can utilize these assets, or tap into our in-house creative services group to create custom advertising that meets their particular communication objectives while adhering to brand standards.
6
Employees
At
September 27, 2015
, we had approximately
20,700
employees, of whom
19,800
were restaurant employees,
600
were corporate personnel, and
300
were field management or administrative personnel. Employees are paid on an hourly basis, except certain restaurant management, operations and corporate management, and administrative personnel. We employ both full- and part-time restaurant employees in order to provide the flexibility necessary during peak periods of restaurant operations. We have not experienced any significant work stoppages, and we support our employees, including part-time workers, by offering industry competitive wages and benefits.
Executive Officers
The following table sets forth the name, age, position and years with the Company of each person who is an executive officer of Jack in the Box Inc.:
|
Name
|
Age
|
Positions
|
Years with the
Company
|
|||
|
Leonard A. Comma
|
46
|
Chairman of the Board and Chief Executive Officer
|
14
|
|||
|
Mark H. Blankenship, Ph.D.
|
54
|
Executive Vice President, Chief People, Culture and Corporate Strategy Officer
|
18
|
|||
|
Jerry P. Rebel
|
58
|
Executive Vice President and Chief Financial Officer
|
12
|
|||
|
Phillip H. Rudolph
|
57
|
Executive Vice President, Chief Legal and Risk Officer and Corporate Secretary
|
8
|
|||
|
Frances L. Allen
|
53
|
President, Jack in the Box Brand
|
1
|
|||
|
Timothy P. Casey
|
55
|
President, Qdoba Restaurant Brand
|
3
|
|||
|
Keith M. Guilbault
|
52
|
Senior Vice President and Chief Marketing Officer
|
11
|
|||
|
Paul D. Melancon
|
59
|
Senior Vice President of Finance, Controller and Treasurer
|
10
|
|||
|
Carol A. DiRaimo
|
54
|
Vice President of Investor Relations and Corporate Communications
|
7
|
|||
|
Dean C. Gordon
|
53
|
Vice President of Supply Chain
|
6
|
|||
|
Raymond Pepper
|
54
|
Vice President and General Counsel
|
18
|
|||
The following sets forth the business experience of each executive officer for at least the last five years:
Mr. Comma has been Chairman of the Board and Chief Executive Officer since January 2014. From May 2012 until October 2014, he served as President, and from November 2010 through January 2014, as Chief Operating Officer. Mr. Comma served as Senior Vice President and Chief Operating Officer from February 2010 to November 2010, Vice President Operations Division II from February 2007 to February 2010, Regional Vice President of the Company’s Southern California region from May 2006 to February 2007 and Director of Convenience-Store & Fuel Operations for the Company’s proprietary chain of Quick Stuff convenience stores from August 2001 to May 2006. Mr. Comma has 23 years of retail and franchise experience.
Dr. Blankenship has been Executive Vice President, Chief People, Culture and Corporate Strategy Officer since November 2013. He was previously Senior Vice President and Chief Administrative Officer from October 2010 to November 2013, Vice President, Human Resources and Operational Services from October 2005 to October 2010 and Division Vice President, Human Resources from October 2001 to September 2005. Dr. Blankenship has
18
years of experience with the Company in various human resource and training positions.
Mr. Rebel has been Executive Vice President and Chief Financial Officer since October 2005. He was previously Senior Vice President and Chief Financial Officer from January 2005 to October 2005 and Vice President and Controller of the Company from September 2003 to January 2005. Prior to joining the Company in 2003, Mr. Rebel held senior level positions with Fleming Companies and CVS Corporation. He has more than
35
years of corporate finance experience.
Mr. Rudolph has been Chief Legal and Risk Officer since October 2014, Executive Vice President since February 2010, and Corporate Secretary since November 2007. Before becoming Chief Legal and Risk Officer, he was General Counsel since November 2007. Prior to joining the Company, Mr. Rudolph was Vice President and General Counsel for Ethical Leadership Group. He was previously a partner in the Washington, D.C. office of Foley Hoag, LLP, and a Vice President at McDonald’s Corporation where, among other roles, he served as U.S. and International General Counsel. Before joining McDonald’s, Mr. Rudolph spent 15 years with the law firm of Gibson, Dunn & Crutcher, LLP, the last six of which he spent as a litigation partner in the firm’s Washington, D.C. office. Mr. Rudolph has more than
30
years of legal experience.
Ms. Allen has served as President of the Jack in the Box brand since October 2014. She joined the Company with more than 30 years of branding and marketing experience, including senior leadership roles at such major organizations as Denny’s, Dunkin’ Brands, Sony Ericsson Mobile Communications, PepsiCo and Frito-Lay. From July 2010 to October 2014, Ms. Allen worked for Denny’s Corp., most recently as its Chief Brand Officer and, previously, as its Chief Marketing Officer. From 2007 to 2009, she
7
was Chief Marketing Officer of Dunkin’ Brands, from 2004 to 2007, she was Vice President of Marketing, North America at Sony Ericsson Mobile Communications, and from 1998 to 2004, she held several positions at PepsiCo, most recently as Vice President of Marketing. Prior to that, Ms. Allen served at Frito-Lay as Director of International Advertising, and worked for several advertising agencies.
Mr. Casey has been President of Qdoba since March 2013. From 2010 until March 2013, he served as President and Chief Executive Officer of MFOC Holdco, Inc., the parent company of the Mrs. Fields Brand and TCBY. From 2007 to 2010, Mr. Casey was an executive with International Coffee & Tea, which operated and franchised The Coffee Bean & Tea Leaf, most recently serving as Vice President of Global Brand Marketing, Product Development and Operations. As Regional Vice President at Starbucks from 1998 to 2004, Mr. Casey managed more than 500 stores in a 10-state region. Prior to joining Starbucks in 1996, Mr. Casey held leadership positions in marketing and operations with Circle K Corporation and Southland Corporation. He has more than 30 years experience in the restaurant and retail industries.
Mr. Guilbault has been Senior Vice President and Chief Marketing Officer since November 2013. He was previously Vice President of Menu & Innovation from October 2012 to November 2013, Vice President of Franchising from October 2010 to October 2012, Division Vice President of Operations Initiatives from February 2010 to October 2010 and Division Vice President of Brand Innovation & Regional Marketing from February 2006 to February 2010. He joined the Company in 2004 as a Regional Vice President in Central California. Including his service with Jack in the Box Inc., Mr. Guilbault has more than 15 years of experience in management positions with several companies, including Mobil Oil Corporation, Priceline WebHouse Club and Freemarkets, Inc.
Mr. Melancon has been Senior Vice President of Finance, Controller and Treasurer since November 2013. He was previously Vice President of Finance, Controller and Treasurer from September 2008 to November 2013 and Vice President and Controller from July 2005 to September 2008. Before joining the Company, Mr. Melancon held senior financial positions at several major companies, including Guess?, Inc., Hyper Entertainment, Inc. (a subsidiary of Sony Corporation of America) and Sears, Roebuck and Company. Mr. Melancon has more than 35 years of experience in accounting and finance, including 11 years with Price Waterhouse.
Ms. DiRaimo has been Vice President of Investor Relations and Corporate Communications since July 2008. She previously spent 14 years at Applebee’s International, Inc. where she held various positions including Vice President of Investor Relations from February 2004 to November 2007. Ms. DiRaimo has more than
30
years of corporate finance and public accounting experience, including positions with Gilbert/Robinson Restaurants, Inc. and Deloitte.
Mr. Gordon has been Vice President of Supply Chain since October 2012. He was previously Division Vice President of Purchasing from February 2009 to October 2012. Prior to joining the Company in February 2009, Mr. Gordon was Vice President of Supply Chain Management for Potbelly Sandwich Works from December 2005 to February 2009, and he held various positions with Applebee’s International from August 2000 to December 2005, most recently as Executive Director of Procurement. Mr. Gordon also held a number of positions at Prandium, Inc., an operator of multiple restaurant concepts, from October 1994 to August 2000. Mr. Gordon has over 20 years of Supply Chain Management experience.
Mr. Pepper has been Vice President and General Counsel since September 2014. He was previously Vice President, Deputy General Counsel since September 2013 and Division Vice President, Deputy General Counsel from July 2009 to September 2013. Prior to that, Mr. Pepper held the positions of Division Vice President, Corporate Counsel from 2003 to 2009 and Director, Corporate Counsel from 1997 to 2003. Before joining the Company, Mr. Pepper spent 11 years with the law firm of Miller, Boyko and Bell, both as an associate and partner. Mr. Pepper has 29 years of legal experience.
Trademarks and Service Marks
The Jack in the Box, Qdoba Mexican Eats, and Qdoba names are of material importance to us, and each is a registered trademark and service mark in the United State and elsewhere. In addition, we have registered or applied to register numerous service marks and trade names for use in our businesses, including the Jack in the Box logo, Qdoba logos, Qdoba Mexican Grill mark and various product names and designs.
Seasonality
Restaurant sales and profitability are subject to seasonal fluctuations because of factors such as vacation and holiday travel and events, seasonal weather conditions, and crises, which affect the public’s dining habits.
8
Competition and Markets
The restaurant business is highly competitive and is affected by local and national economic conditions, including unemployment levels, population and socioeconomic trends, traffic patterns, competitive changes in a geographic area, changes in consumer dining habits and preferences, and new information regarding diet, nutrition and health that affect consumer spending habits. Key elements of competition in the industry are the quality and innovation in the food products offered, price and perceived value, quality of service experience, including technological innovations, speed of service, personnel, advertising and other marketing efforts, name identification, restaurant location, and image and attractiveness of the facilities.
Each Jack in the Box and Qdoba restaurant competes directly and indirectly with a large number of national and regional restaurant chains, some of which have significantly greater financial resources, as well as with locally-owned and/or independent restaurants in the quick-service and the fast-casual segments, and other “food away from home” consumer options including catering and delivery services. In selling franchises, we compete with many other restaurant franchisors, some of whom have substantially greater financial resources.
Available Information
The Company’s primary website can be found at www.jackinthebox.com. We make available free of charge at this website (under the caption “Investors — SEC Filings”) all of our reports filed or furnished pursuant to Section 13(a) or 15(d) of the Securities Exchange Act of 1934, including our Annual Report on Form 10-K, our Quarterly Reports on Form 10-Q and our Current Reports on Form 8-K, and amendments to those reports. These reports are made available on the website as soon as reasonably practicable after their filing with, or furnishing to, the Securities and Exchange Commission (“SEC”). You may read and copy any materials we file with the SEC at the SEC’s Public Reference Room at 100 F Street, NE, Washington, DC 20549. You may obtain information on the operation of the Public Reference Room by calling the SEC at 1-800-SEC-0330. The SEC also maintains an Internet site that contains our reports, proxy and information statements, and other information at www.sec.gov.
Regulation
Each restaurant is subject to regulation by federal agencies, as well as licensing and regulation by state and local health, sanitation, safety, fire, zoning, building, taxing and other agencies and departments. Restaurants are also subject to rules and regulations imposed by owners and/or operators of shopping centers, college campuses, airports, military bases or other locations in which a restaurant is located. Difficulties or failures in obtaining and maintaining any required permits, licenses or approvals, or difficulties in complying with applicable rules and regulations, could result in restricted operations, closures of existing restaurants, delays or cancellations in the opening of new restaurants, increased cost of operations or the imposition of fines and other penalties.
We are also subject to federal, state and international laws regulating the offer and sale of franchises, as well as judicial and administrative interpretations of such laws. Such laws impose registration and disclosure requirements on franchisors in the offer and sale of franchises, and may also apply substantive standards to the relationship between franchisor and franchisee, including limitations on the ability of franchisors to terminate franchises and alter franchise arrangements.
We are subject to the federal Fair Labor Standards Act and various state laws governing such matters as minimum wages, exempt status classification, overtime, breaks and other working conditions for company employees. Many of our food service personnel are paid at rates based on the federal and state minimum wage and, accordingly, increases in the minimum wage increase labor costs for us and our franchisees. Federal and state laws may also require us to provide paid and unpaid leave to our employees, or healthcare or other employee benefits, which could result in significant additional expense to us. We are also subject to federal immigration laws requiring compliance with work authorization documentation and verification procedures.
We are subject to certain guidelines under the Americans with Disabilities Act of 1990 and various state codes and regulations, which require restaurants to provide full and equal access to persons with physical disabilities.
We are also subject to various federal, state and local laws regulating the discharge of materials into the environment. The cost of complying with these laws increases the cost of operating existing restaurants and developing new restaurants. Additional costs relate primarily to the necessity of obtaining more land, landscaping, storm drainage control and the cost of more expensive equipment necessary to decrease the amount of effluent emitted into the air, ground and surface waters.
Some of our Qdoba restaurants sell alcoholic beverages, which require licensing. The regulations governing licensing may impose requirements on licensees including minimum age of employees, hours of operation, and advertising and handling of alcoholic beverages. The failure of a Qdoba restaurant to obtain or retain a license could adversely affect the store’s results of operations.
We have processes in place to monitor compliance with applicable laws and regulations governing our operations.
9
|
ITEM 1A.
|
RISK FACTORS
|
We caution you that our business and operations are subject to a number of risks and uncertainties. The factors listed below are important factors that could cause our actual results to differ materially from our historical results and from projections in the forward-looking statements contained in this report, in our other filings with the SEC, in our news releases and in oral statements by our representatives. However, other factors that we do not anticipate or that we do not consider significant based on currently available information may also have an adverse effect on our results.
Risks Related to the Food Service Industry.
Food service businesses such as ours may be materially and adversely affected by changes in consumer preferences, national and regional economic, political and socioeconomic conditions, attitudes and changes in consumer dining habits (whether or not based on new information regarding diet, nutrition or health), as well as by the cost of food at home compared to food away from home, technological innovations, health-based regulations or other factors. Adverse economic conditions, such as higher levels of unemployment, lower levels of consumer confidence and decreased discretionary spending may reduce restaurant traffic and sales and impose practical limits on pricing. If adverse or uncertain economic conditions persist for an extended period of time, consumers may make long-lasting changes to their spending behavior. The impact of these factors may be exacerbated by the geographic profile of our Jack in the Box brand. Specifically, nearly 70% of the restaurants in our Jack in the Box system are located in the states of California and Texas. Economic conditions, state and local laws, government regulations, weather conditions or natural disasters affecting those states may therefore more greatly impact our results than would similar occurrences in other locations.
The performance of our business may also be adversely affected by factors such as:
|
•
|
seasonal sales fluctuations;
|
|
•
|
severe weather and other natural disasters;
|
|
•
|
unfavorable trends or developments concerning operating costs such as inflation, increased costs of food, fuel, utilities, technology, labor (including due to legislated minimum wage increases, labor disruptions, employee relations issues or new administrative interpretations of regulations impacting labor costs), insurance, or employee benefits (including healthcare, workers’ compensation and other insurance costs and premiums);
|
|
•
|
the impact of initiatives by competitors and increased competition generally;
|
|
•
|
lack of customer acceptance of new menu items, service initiatives or potential price increases necessary to cover higher input costs;
|
|
•
|
customers trading down to lower priced items and/or shifting to competitive offerings with lower priced products;
|
|
•
|
the availability of qualified, experienced management and hourly employees; and
|
|
•
|
failure to anticipate or respond quickly to relevant market trends or to implement successful advertising and marketing programs, including technology-based programs.
|
In addition, if economic conditions deteriorate or are uncertain for a prolonged period of time, or if our operating results decline unexpectedly, we may be required to record impairment charges, which will negatively impact our results of operations for the periods in which they are recorded. Due to the foregoing or other factors, results for any one quarter are not necessarily indicative of results to be expected for any other quarter or for a full fiscal year. These fluctuations may cause our operating results to be below expectations of public market analysts and investors, and may adversely impact our stock price.
Risks Related to Food and Commodity Costs and Availability
. We and our franchisees are subject to volatility in food and commodity costs and availability. Accordingly, our profitability depends in part on our ability to anticipate and react to changes in food costs and availability. For example, prices for feed ingredients used to produce beef, pork and chicken could be adversely affected by changes in worldwide supply or demand or by regulatory mandates, leading to higher prices. In recent years, food and commodity costs increased significantly, out-pacing general inflation and industry expectations. Looking forward, we anticipate volatile or uncertain price conditions to continue.
We seek to manage food and commodity costs, including through extended fixed price contracts, strong category and commodity management, and purchasing fundamentals. However, certain commodities such as beef and pork, which represent approximately 20% and 6%, respectively, of our consolidated commodity spend, do not lend themselves to fixed price contracts.
We cannot assure you that we will successfully enter into fixed price contracts on a timely basis or on commercially favorable pricing terms. In addition, although we have fixed price contracts for produce, we are subject to force majeure clauses resulting from weather or acts of God that may result in temporary spikes in costs.
Further, we cannot assure you that we or our franchisees will be able to successfully anticipate and react effectively to changing food and commodity costs by adjusting purchasing practices or menu offerings. We also may not be able to pass along price
10
increases to our customers as a result of adverse economic conditions, competitive pricing or other factors. Therefore, variability of food and other commodity costs could adversely affect our profitability and results of operations.
A significant number of our Jack in the Box and Qdoba restaurants are company-operated, so we continue to have exposure to operating cost issues. Exposure to these fluctuating costs, including increases in commodity costs, could negatively impact our margins as well as franchisee margins and franchisee financial health.
Risk Related to Our Brands and Reputation.
Multi-unit food service businesses such as ours can be materially and adversely affected by widespread negative publicity of any type, particularly regarding food quality, food safety, nutritional content, safety or public health issues (such as epidemics or the prospect of a pandemic), obesity or other health concerns, and employee relations issues, among other things. Adverse publicity in these areas could damage the trust customers place in our brands. The increasingly widespread use of mobile communications and social media applications has amplified the speed and scope of adverse publicity and could hamper our ability to promptly correct misrepresentations or otherwise respond effectively to negative publicity. We have put in place HACCP-based and Food Safety Management programs to minimize the risk of food safety issues arising in our restaurants and at our vendors. Nevertheless, food safety risks cannot be completely eliminated. Any outbreak of illness attributed to company or franchised restaurants, or within the food service industry, or any widespread negative publicity regarding our brands or the restaurant industry in general could cause a decline in our company and our franchisees’ restaurant sales, and could have a material adverse effect on our financial condition and results of operations.
In addition, the success of our business strategy depends on the value and relevance of our brands and reputation, including implementation and success of brand strategies. If customers perceive that we and our franchisees fail to deliver a consistently positive and relevant experience, our brands could suffer. This could have an adverse effect on our business. Moreover, while we devote considerable efforts and resources to protecting our trademarks and other intellectual property, if these efforts are not successful, the value of our brands may be harmed. This could also have a material adverse effect on our business.
Supply and Distribution Risks
. Dependence on frequent deliveries of fresh produce and other food products subjects food service businesses such as ours to the risk that shortages or interruptions in supply could adversely affect the availability, quality or cost of ingredients or require us to incur additional costs to obtain adequate supplies. Deliveries of supplies may be affected by adverse weather conditions, natural disasters, distributor or supplier financial or solvency issues, product recalls, or other issues. Further, increases in fuel prices could result in increased distribution costs. In addition, if any of our distributors, suppliers, vendors or other contractors fail to meet our quality standards or otherwise do not perform adequately, or if any one or more of such entities seeks to terminate its agreement or fails to perform as anticipated, or if there is any disruption in any of our distribution or supply relationships or operations for any reason, our business, financial condition and results of operations may be materially affected.
Risks Associated with Severe Weather and Natural Disasters
. Food service businesses such as ours can be materially and adversely affected by severe weather conditions, such as severe storms, hurricanes, flooding, prolonged drought or protracted heat or cold waves, and natural disasters, such as earthquakes and wild fires, and their aftermath. Any of these can result in:
|
•
|
lost restaurant sales when consumers stay home or are physically prevented from reaching the restaurants;
|
|
•
|
property damage, loss of product, and resulting lost sales when locations are forced to close for extended periods of time;
|
|
•
|
interruptions in supply when distributors or vendors suffer damages or transportation is negatively affected; and
|
|
•
|
increased costs if agricultural capacity is diminished or if insurance recoveries do not cover all of our losses.
|
If systemic or widespread adverse changes in climate or weather patterns occur, we could experience more of these losses, and such losses could have a material adverse effect on our results of operations and financial condition.
Growth and Development Risks
. We intend to grow both Qdoba and Jack in the Box by developing additional company-owned restaurants and through new restaurant development by franchisees, both in existing markets and in new markets. Development involves substantial risks, including the risk of:
|
•
|
the inability to identify suitable franchisees;
|
|
•
|
limited availability of financing for the Company and for franchisees at acceptable rates and terms;
|
|
•
|
development costs exceeding budgeted or contracted amounts;
|
|
•
|
delays in completion of construction;
|
|
•
|
the inability to identify, or the unavailability of suitable sites at acceptable cost and other leasing or purchase terms;
|
|
•
|
developed properties not achieving desired revenue or cash flow levels once opened;
|
|
•
|
the negative impact of a new restaurant upon sales at nearby existing restaurants;
|
|
•
|
the challenge of developing in areas where competitors are more established or have greater penetration or access to suitable development sites;
|
|
•
|
incurring substantial unrecoverable costs in the event a development project is abandoned prior to completion;
|
11
|
•
|
impairment charges resulting from underperforming restaurants or decisions to curtail or cease investment in certain locations or markets;
|
|
•
|
in new geographic markets where we have limited or no existing locations, the inability to successfully expand or acquire critical market presence for our brands, acquire name recognition, successfully market our products or attract new customers;
|
|
•
|
unique regulations or challenges applicable to operating in non-traditional locations, such as airports, college campuses, military or government facilities;
|
|
•
|
the challenge of identifying, recruiting and training qualified restaurant management;
|
|
•
|
the inability to obtain all required permits;
|
|
•
|
changes in laws, regulations and interpretations, including interpretations of the requirements of the Americans with Disabilities Act; and
|
|
•
|
general economic and business conditions.
|
Although we manage our growth and development activities to help reduce such risks, we cannot assure that our present or future growth and development activities will perform in accordance with our expectations. Our inability to expand in accordance with our plans or to manage the risks associated with our growth could have a material adverse effect on our results of operations and financial condition.
Risks Related to Franchisee Financial and Business Operations
. The opening and continued success of franchise restaurants depends on various factors, including the demand for our franchises, the selection of appropriate franchisee candidates, the identification and availability of suitable sites, and negotiation of acceptable lease or purchase terms for new locations, permitting and regulatory compliance, the ability to meet construction schedules, the availability of financing, and the financial and other capabilities of our franchisees and developers. See “Growth and Development Risks” above. Despite our due diligence performed during the recruiting process, we cannot assure you that franchisees and developers planning the opening of franchise restaurants will have the business abilities or sufficient access to financial resources necessary to open the restaurants required by their agreements, or will prove to be effective operators and remain aligned with us on operations, promotional or capital-intensive initiatives.
Our franchisees are contractually obligated to operate their restaurants in accordance with all applicable laws and regulations, as well as standards set forth in our agreements with them. However, franchisees are independent third parties whom we cannot and do not control. If franchisees do not successfully operate restaurants in a manner consistent with applicable laws and required standards, royalty, and in some cases rent, payments to us may be adversely affected. If customers have negative perceptions or experiences with operational execution, food quality or safety at our franchised locations, our brands’ image and reputation could be harmed, which in turn could negatively impact our business and operating results.
With an increase in the proportion of Jack in the Box franchised restaurants, the percentage of our revenues derived from royalties and rents at Jack in the Box franchise restaurants has increased, as has the risk that earnings could be negatively impacted by defaults in the payment of royalties and rents. As small businesses, some of our franchise operators, may be negatively and disproportionately impacted by strategic initiatives, capital requirements, inflation, labor costs, employee relations issues or other causes. In addition, franchisee business obligations may not be limited to the operation of Jack in the Box or Qdoba restaurants, making them subject to business and financial risks unrelated to the operation of our restaurants. These unrelated risks could adversely affect a franchisee’s ability to make payments to us or to make payments on a timely basis. We cannot assure that franchisees will successfully participate in our strategic or marketing initiatives or operate their restaurants in a manner consistent with our concepts and standards. As compared to some of our competitors, our Jack in the Box brand has relatively fewer franchisees who, on average, operate more restaurants per franchisee. There are significant risks to our business if a franchisee, particularly one who operates a large number of restaurants, encounters financial difficulties or fails to adhere to our standards and projects an image inconsistent with our brands.
Risk Relating to Competition, Menu Innovation and Successful Execution of our Operational Strategies and Initiatives.
As part of our long term business plan, in addition to growth through development of new restaurants, we are focused on increasing same-store sales and average unit volumes. These plans are subject to a number of risks and uncertainties, including risks related to competition, menu innovation and the successful execution of our operational strategies and initiatives. The restaurant industry is highly competitive with respect to price, service, location, personnel, advertising, brand identification and the type, quality and innovativeness of menu items and new and differentiated service offerings
.
There are many well-established competitors. Each of our restaurants competes directly and indirectly with a large number of national and regional restaurant chains, as well as with locally-owned and/or independent quick-service restaurants, fast-casual restaurants, casual dining restaurants, sandwich shops and similar types of businesses. The trend toward convergence in grocery, deli and restaurant services has and may continue to increase the number of our competitors. Such increased competition could decrease the demand for our products and negatively affect our sales and profitability. Some of our competitors have substantially greater financial, marketing, operating and other resources than we have, which may give them a competitive advantage. Certain of our competitors have introduced a variety of new products
12
and service offerings and engaged in substantial price discounting in the past, and may adopt similar strategies in the future. In an effort to increase same-store sales, we continue to make improvements to our facilities, to implement new service and training initiatives, and to introduce new products and discontinue other menu items. However, there can be no assurance that our facility improvements will foster increases in sales and yield the desired return on investment, that our service initiatives or our overall strategies will be successful, that our menu offerings and promotions will generate sufficient customer interest or acceptance to increase sales, or that competitive product offerings, pricing and promotions will not have an adverse effect upon our margins, sales results and financial condition. In addition, the success of our strategy depends on, among other factors, our ability to motivate restaurant personnel and franchisees to execute our initiatives and achieve sustained high service levels.
Advertising and Promotion Risks.
Some of our competitors have greater financial resources, which enable them to purchase significantly more advertising, particularly television and radio ads, than we are able to purchase. Should our competitors increase spending on advertising and promotion, or should the cost of advertising increase or our advertising funds decrease for any reason, including reduced sales or implementation of reduced spending strategies, or should our advertising and promotion be less effective than our competitors, there could be a material adverse effect on our results of operations and financial condition. The growing prevalence and importance of social media platforms and mobile technology also pose challenges and risks for our marketing, advertising and promotional strategies. Failure to effectively use these platforms or technology could cause our advertising to be less effective than our competitors. Moreover, improper or damaging use of social media or mobile technology by our employees, franchisees, or guests could increase the Company’s costs, lead to litigation or result in negative publicity that could also have a materially adverse effect on our results.
Taxes.
Our income tax provision is sensitive to expected earnings and, as those expectations change, our income tax provisions may vary from quarter-to-quarter and year-to-year. In addition, from time to time, we may take positions for filing our tax returns that differ from the treatment for financial reporting purposes. The ultimate outcome of such positions could have an adverse impact on our effective tax rate.
Risks Related to Reducing Operating Costs
. In recent years, we have identified strategies and taken steps to reduce operating costs to align with the increased Jack in the Box franchise ownership and to further integrate Jack in the Box and Qdoba brand restaurant systems. These strategies include outsourcing certain functions, reducing headcount, and integrating restaurant information systems between our brands. We continue to evaluate and implement further cost-saving initiatives. However, the ability to reduce our operating costs through these initiatives is subject to risks and uncertainties, and we cannot assure that these activities, or any other activities that we may undertake in the future, will achieve the desired cost savings and efficiencies. Failure to achieve such desired savings could adversely affect our results of operations and financial condition.
Risks Related to Loss of Key Personnel.
We believe that our success will depend, in part, on our ability to attract and retain the services of skilled personnel, including key executives. The loss of services of any such personnel could have a material adverse effect on our business.
Risks Related to Government Regulations, Including Regulations Increasing Labor Costs.
The restaurant industry is subject to extensive federal, state and local governmental regulations as described in Item 1 under “Regulation.” We are subject to rules and regulations including but not limited to those related to:
|
•
|
the preparation, ingredients, labeling, packaging, advertising and sale of food;
|
|
•
|
building and zoning requirements;
|
|
•
|
sanitation and safety standards;
|
|
•
|
employee healthcare, including the implementation and legal, regulatory and cost implications of the Affordable Care Act;
|
|
•
|
labor and employment, including minimum wage adjustments, overtime, working conditions, employment eligibility and documentation, sick leave, and other employee benefit and fringe benefit requirements, and changing judicial, administrative or regulatory interpretations of federal or state labor laws;
|
|
•
|
the registration, offer, sale, termination and renewal of franchises;
|
|
•
|
truth-in-advertising, consumer protection and the security of information;
|
|
•
|
Americans with Disabilities Act;
|
|
•
|
payment cards;
|
|
•
|
liquor sales; and
|
|
•
|
climate change, including the potential impact of greenhouse gases, water consumption, or a tax on carbon emissions.
|
The increasing amount and complexity of regulations and their interpretation may increase the costs to us and our franchisees of labor and compliance, and increase our exposure to legal and regulatory claims which, in turn, could have a material adverse effect on our business. While we strive to comply with all applicable existing statutory and administrative rules, we cannot predict the effect on operations from issuance of additional requirements in the future.
13
Risks Related to Computer Systems, Information Technology and Cyber Security
. We and our franchisees rely on computer systems and information technology to conduct our business. A material failure or interruption of service or a breach in security of our computer systems caused by malware or other attack could cause reduced efficiency in operations, loss or misappropriation of data, or business interruptions, or could impact delivery of food to restaurants or financial functions such as vendor payment or employee payroll. We have business continuity plans that attempt to anticipate and mitigate such failures, but it is possible that significant capital investment could be required to rectify these problems, or more likely that cash flows could be impacted, in the shorter term.
We have instituted controls intended to adhere to payment card industry data security standards and protect our point of sale (POS) systems and to limit third party access for vendors that require access to our restaurant networks. However, we cannot control every particular risk, particularly those affecting our franchise locations which are independent businesses. Our security architecture is decentralized, such that payment card information is primarily confined to the restaurant where the specific transaction took place. However, a security breach involving our POS, personnel, franchise operations reporting or other systems could result in disclosure or theft of confidential customer or employee or other proprietary data, and potentially cause loss of consumer confidence or potential costs, fines and litigation, including costs associated with reputational damage, consumer fraud or privacy breach. These risks may be magnified by the increased use of mobile communications and other new technologies, and are subject to increased and changing regulation. The costs of compliance and risk mitigation planning, including increased investment in technology or personnel in order to protect valuable business or consumer information, may negatively impact our results of operations.
Risks Related to the Failure of Internal Controls
. We maintain a documented system of internal controls, which is reviewed and monitored by an Internal Controls Committee and tested by the Company’s full-time internal audit department. The internal audit department reports to the Audit Committee of the Board of Directors. We believe we have a well-designed system to maintain adequate internal controls on the business; however, we cannot be certain that our controls will be adequate in the future or that adequate controls will be effective in preventing or detecting all error and all fraud. A control system, no matter how well designed and operated, can provide only reasonable, not absolute, assurance that the control system’s objectives will be met. The design of any system of controls is based in part on certain assumptions about the likelihood of future events, and there can be no assurance that any design will succeed in achieving its stated goals under all potential future conditions. If our internal controls are ineffective, we may not be able to accurately report our financial results or prevent fraud. Any failures in the effectiveness of our internal controls could have a material adverse effect on our operating results or cause us to fail to meet reporting obligations.
Environmental and Land Risks and Regulations.
We own or lease the real properties on which our Jack in the Box company-operated restaurants are located, and either own or lease (and subsequently sublease to the franchisee) a majority of our Jack in the Box franchised restaurant sites. We also own or lease the real properties upon which our company-operated Qdoba restaurants are located. We have engaged and continue to engage in real estate development projects. As is the case with any owner or operator of real property, we are subject to eminent domain proceedings that can impact the value of investments we have made in real property, and we are subject to other potential liabilities and damages arising out of owning, operating, leasing or otherwise having interests in real property. In addition, we are subject to a variety of federal, state and local governmental regulations relating to the use, storage, discharge, emission and disposal of hazardous materials. Failure to comply with environmental laws could result in the imposition by governmental agencies or courts of law of severe penalties or restrictions on our operations. We are unaware of any significant hazards on properties we own or have owned, or operate or have operated. Accordingly, we do not have environmental liability insurance for our restaurants, nor do we maintain a reserve to cover such events. In the event of the determination of contamination on such properties, the Company, as owner or operator, could be held liable for severe penalties and costs of remediation, and this could result in material liability.
Risks Related to Leverage.
As of
September 27, 2015
, the Company has a credit facility comprised of a
$900.0 million
revolving credit agreement and a
$300.0 million
term loan. We may also request the issuance of up to
$75.0 million
in letters of credit, the outstanding amount of which reduces our net borrowing capacity under the agreement. For additional information related to our credit facility, refer to Note 7,
Indebtedness
, of the notes to the consolidated financial statements. Increased leverage resulting from borrowings under our credit facility could have certain material adverse effects on the Company, including but not limited to the following:
|
•
|
our ability to obtain additional financing in the future for acquisitions, working capital, capital expenditures and general corporate or other purposes could be impaired, or any such financing may not be available on terms favorable to us;
|
|
•
|
a substantial portion of our cash flows could be required for debt service and, as a result, might not be available for our operations or other purposes;
|
|
•
|
any substantial decrease in net operating cash flows or any substantial increase in expenses could make it difficult for us to meet our debt service requirements or could force us to modify our operations or sell assets;
|
|
•
|
our ability to operate our business and our ability to repurchase stock or pay cash dividends to our stockholders may be restricted by the financial and other covenants set forth in the credit facility;
|
14
|
•
|
our ability to withstand competitive pressures may be decreased; and
|
|
•
|
our level of indebtedness may make us more vulnerable to economic downturns and reduce our flexibility in responding to changing business, regulatory and economic conditions.
|
Our ability to repay expected borrowings under our credit facility and to meet our other debt or contractual obligations (including compliance with applicable financial covenants) will depend upon our future performance and our cash flows from operations, both of which are subject to prevailing economic conditions and financial, business and other known and unknown risks and uncertainties, certain of which are beyond our control. In addition, to the extent that banks in our revolving credit facility become insolvent, our ability to borrow to the full level of our facility could be limited.
Risks of Market Volatility
. Many factors affect the trading price of our stock, including factors over which we have no control, such as reports on the economy or the price of commodities, as well as negative or positive announcements by competitors, regardless of whether the report relates directly to our business. In addition to investor expectations about our prospects, trading activity in our stock can reflect the portfolio strategies and investment allocation changes of institutional holders and non-operating initiatives such as a share repurchase program. Any failure to meet market expectations whether for sales, growth rates, refranchising goals, earnings per share or other metrics could cause our share price to drop.
Risks of Changes in Accounting Policies and Assumptions
. Changes in accounting standards, policies or related interpretations by accountants or regulatory entities may negatively impact our results. Many accounting standards require management to make subjective assumptions and estimates, such as those required for long-lived assets, retirement benefits, self-insurance, restaurant closing costs, share-based compensation, goodwill and other intangibles, legal accruals, and income taxes. Changes in those underlying assumptions and estimates could significantly change our results.
Litigation.
We are subject to complaints or litigation brought by former, current or prospective employees, customers, franchisees, vendors, landlords, shareholders or others. We assess contingencies to determine the degree of probability and range of possible loss for potential accrual in our financial statements. An estimated loss contingency is accrued if it is probable that a liability has been incurred and the amount of loss can be reasonably estimated. Because lawsuits are inherently unpredictable and unfavorable resolutions could occur, assessing contingencies is highly subjective and requires judgments about future events. We regularly review contingencies to determine the adequacy of the accruals and related disclosures. However, the amount of ultimate loss may differ from these estimates. A judgment that is not covered by insurance or that is significantly in excess of our insurance coverage for any claims could materially adversely affect our financial condition or results of operations. In addition, regardless of whether any claims against us are valid or whether we are found to be liable, claims may be expensive to defend, and may divert management’s attention away from operations and hurt our performance. Further, adverse publicity resulting from claims may harm our business or that of our franchisees.
|
ITEM 1B.
|
UNRESOLVED STAFF COMMENTS
|
None.
|
ITEM 2.
|
PROPERTIES
|
The following table sets forth information regarding our operating Jack in the Box and Qdoba restaurant properties as of
September 27, 2015
:
|
Company-
Operated
|
Franchise
|
Total
|
|||||||
|
Company-owned restaurant buildings:
|
|||||||||
|
On company-owned land
|
41
|
|
184
|
|
225
|
|
|||
|
On leased land
|
134
|
|
505
|
|
639
|
|
|||
|
Subtotal
|
175
|
|
689
|
|
864
|
|
|||
|
Company-leased restaurant buildings on leased land
|
560
|
|
929
|
|
1,489
|
|
|||
|
Franchise directly-owned or directly-leased restaurant buildings
|
—
|
|
557
|
|
557
|
|
|||
|
Total restaurant buildings
|
735
|
|
2,175
|
|
2,910
|
|
|||
15
Our restaurant leases generally provide for fixed rental payments (with cost-of-living index adjustments) plus real estate taxes, insurance and other expenses. In addition, approximately
15%
of our leases provide for contingent rental payments between
1%
and
15%
of the restaurant’s gross sales once certain thresholds are met. We have generally been able to renew our restaurant leases as they expire at then-current market rates. The remaining terms of ground leases range from approximately
one
year to
53
years, including optional renewal periods. The remaining lease terms of our other leases range from approximately
one
year to
42
years, including optional renewal periods. At
September 27, 2015
, our restaurant leases had initial terms expiring as follows:
|
|
Number of Restaurants
|
|||||
|
Fiscal Year
|
Ground
Leases
|
Land and
Building
Leases
|
||||
|
2016 – 2020
|
261
|
|
717
|
|
||
|
2021 – 2025
|
226
|
|
564
|
|
||
|
2026 – 2030
|
133
|
|
142
|
|
||
|
2031 and later
|
19
|
|
66
|
|
||
Our principal executive offices are located in San Diego, California in an owned facility of approximately
150,000
square feet. We also own our
70,000
square foot Jack in the Box Innovation Center and approximately
four
acres of undeveloped land directly adjacent to it. Qdoba’s Corporate Support Center is located in a leased facility in Lakewood, Colorado. We believe our principal executive offices, innovation center, and corporate support center facilities are suitable and adequate for our present purposes.
|
ITEM 3.
|
LEGAL PROCEEDINGS
|
See Note 16,
Commitments, Contingencies and Legal Matters
, of the notes to the consolidated financial statements for a discussion of our legal proceedings.
|
ITEM 4.
|
MINE SAFETY DISCLOSURES
|
Not applicable.
16
|
ITEM 5.
|
MARKET FOR REGISTRANT’S COMMON EQUITY, RELATED STOCKHOLDER MATTERS AND ISSUER PURCHASES OF EQUITY SECURITIES
|
Market Information.
Our common stock is traded on the Nasdaq Global Select Market under the symbol “JACK.” The following table sets forth the high and low sales prices for our common stock during the fiscal quarters indicated, as reported on the NASDAQ — Composite Transactions:
|
|
12 Weeks Ended
|
16 Weeks
Ended |
||||||||||||||
|
|
September 27,
2015 |
July 5,
2015 |
April 12,
2015 |
January 18,
2015 |
||||||||||||
|
High
|
$
|
98.26
|
|
$
|
96.40
|
|
$
|
99.99
|
|
$
|
87.50
|
|
||||
|
Low
|
$
|
63.94
|
|
$
|
85.30
|
|
$
|
81.56
|
|
$
|
63.84
|
|
||||
|
|
12 Weeks Ended
|
16 Weeks
Ended |
||||||||||||||
|
|
September 28,
2014 |
July 6,
2014 |
April 13,
2014 |
January 19,
2014 |
||||||||||||
|
High
|
$
|
65.87
|
|
$
|
61.39
|
|
$
|
62.90
|
|
$
|
51.26
|
|
||||
|
Low
|
$
|
55.14
|
|
$
|
52.41
|
|
$
|
48.82
|
|
$
|
38.53
|
|
||||
Dividends.
During the third quarter of fiscal 2014, the Board of Directors approved the initiation of a regular quarterly cash dividend. In fiscal 2015, the Board of Directors declared two cash dividends of
$0.20
per share each, and two cash dividends of
$0.30
per share each. In fiscal 2014, we declared two cash dividends of $0.20 per share each. Our dividend is subject to the discretion and approval of our Board of Directors and our compliance with applicable law, and depending on, among other things, our results of operations, financial condition, level of indebtedness, capital requirements, contractual restrictions, restrictions in our credit agreement and other factors that our Board of Directors may deem relevant.
Stock Repurchases.
The following table summarizes shares repurchased during the quarter ended
September 27, 2015
. The average price paid per share in column (b) below does not include the cost of brokerage fees:
|
(a)
Total Number of Shares Purchased |
(b)
Average Price Paid Per Share |
(c)
Total Number of Shares Purchased as Part of Publicly Announced Programs |
(d)
Maximum Dollar Value That May Yet Be Purchased Under These Programs |
|||||||||||
|
$
|
65,521,071
|
|
||||||||||||
|
July 6, 2015 - August 2, 2015
|
—
|
|
$
|
—
|
|
—
|
|
$
|
65,521,071
|
|
||||
|
August 3, 2015 - August 30, 2015
|
776,207
|
|
$
|
82.26
|
|
776,207
|
|
$
|
1,648,729
|
|
||||
|
August 31, 2015 - September 27, 2015
|
20,400
|
|
$
|
79.55
|
|
20,400
|
|
$
|
25,468
|
|
||||
|
Total
|
796,607
|
|
$
|
82.19
|
|
796,607
|
|
|||||||
Stockholders.
As of
November 13, 2015
, there were
573
stockholders of record.
17
Securities Authorized for Issuance Under Equity Compensation Plans
. The following table summarizes the equity compensation plans under which Company common stock may be issued as of
September 27, 2015
. Stockholders of the Company have approved all plans requiring such approval.
|
(a) Number of securities to be issued upon exercise of outstanding options, warrants and rights (1)
|
(b) Weighted-average exercise price of outstanding options (1)
|
(c) Number of securities remaining for future issuance under equity compensation plans (excluding securities reflected in column (a))
|
||||
|
Equity compensation plans approved by security holders (2)
|
1,265,208
|
$42.72
|
2,733,786
|
|||
____________________________
|
(1)
|
Includes shares issuable in connection with our outstanding stock options, performance-vested stock awards, nonvested stock awards and units, and non-management director deferred stock equivalents. The weighted-average exercise price in column (b) includes the weighted-average exercise price of stock options only.
|
|
(2)
|
For a description of our equity compensation plans, refer to Note 12,
Share-Based Employee Compensation
, of the notes to the consolidated financial statements.
|
Performance Graph.
The following graph compares the cumulative return to holders of the Company’s common stock at September 30th of each year to the yearly weighted cumulative return of a Peer Group Index and to the Standard & Poor’s (“S&P”) 500 Index for the same period. The below comparison assumes $100 was invested on September 30, 2010 in the Company’s common stock and in the comparison groups and assumes reinvestment of dividends. The Company paid dividends beginning in fiscal 2014.
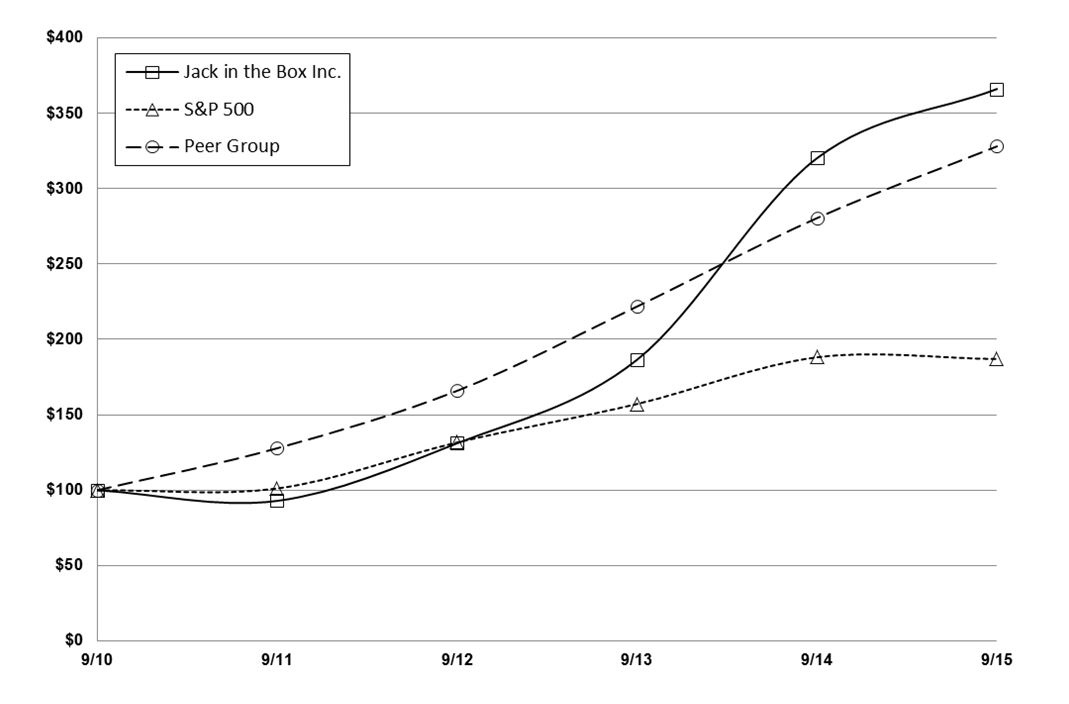
|
2010
|
2011
|
2012
|
2013
|
2014
|
2015
|
|
|
Jack in the Box Inc.
|
$100
|
$93
|
$131
|
$187
|
$320
|
$366
|
|
S&P 500 Index
|
$100
|
$101
|
$132
|
$157
|
$188
|
$187
|
|
Peer Group (1)
|
$100
|
$128
|
$166
|
$222
|
$281
|
$328
|
____________________________
|
(1)
|
The Peer Group Index comprises the following companies: Brinker International, Inc.; Buffalo Wild Wings, Inc.; Chipotle Mexican Grill Inc.; Cracker Barrel Old Country Store, Inc.; DineEquity, Inc.; Domino’s Pizza, Inc.; Panera Bread Company; Ruby Tuesday, Inc.; Sonic Corp.; The Cheesecake Factory Inc.; and The Wendy’s Company.
|
18
|
ITEM 6.
|
SELECTED FINANCIAL DATA
|
Our fiscal year is
52
or
53
weeks, ending the Sunday closest to
September 30
. All years presented include
52
weeks. The selected financial data reflects as discontinued operations,
62
closed Qdoba stores and our distribution business for all years presented. This selected financial data should be read in conjunction with our audited consolidated financial statements and accompanying notes and Management’s Discussion and Analysis of Financial Condition and Results of Operations included elsewhere in this Annual Report on Form 10-K. Our consolidated financial information may not be indicative of our future performance.
|
|
Fiscal Year
|
|||||||||||||||||||
|
|
2015
|
2014
|
2013
|
2012
|
2011
|
|||||||||||||||
|
|
(in thousands, except per share data)
|
|||||||||||||||||||
|
Statements of Earnings Data (1):
|
||||||||||||||||||||
|
Total revenues
|
$
|
1,540,317
|
|
$
|
1,484,131
|
|
$
|
1,489,867
|
|
$
|
1,509,295
|
|
$
|
1,632,825
|
|
|||||
|
Operating costs and expenses
|
$
|
1,340,005
|
|
$
|
1,318,275
|
|
$
|
1,356,302
|
|
$
|
1,417,624
|
|
$
|
1,542,752
|
|
|||||
|
Losses (gains) on the sale of company-operated restaurants, net
|
3,139
|
|
3,548
|
|
(4,640
|
)
|
(29,145
|
)
|
(61,125
|
)
|
||||||||||
|
Total operating costs and expenses, net
|
$
|
1,343,144
|
|
$
|
1,321,823
|
|
$
|
1,351,662
|
|
$
|
1,388,479
|
|
$
|
1,481,627
|
|
|||||
|
Earnings from continuing operations
|
$
|
112,601
|
|
$
|
94,844
|
|
$
|
82,608
|
|
$
|
68,104
|
|
$
|
85,878
|
|
|||||
|
Earnings per Share and Share Data (1):
|
||||||||||||||||||||
|
Earnings per share from continuing operations:
|
||||||||||||||||||||
|
Basic
|
$
|
3.00
|
|
$
|
2.33
|
|
$
|
1.91
|
|
$
|
1.55
|
|
$
|
1.74
|
|
|||||
|
Diluted
|
$
|
2.95
|
|
$
|
2.26
|
|
$
|
1.84
|
|
$
|
1.52
|
|
$
|
1.71
|
|
|||||
|
Cash dividends declared per common share
|
$
|
1.00
|
|
$
|
0.40
|
|
$
|
—
|
|
$
|
—
|
|
$
|
—
|
|
|||||
|
Weighted-average shares outstanding — Diluted (2)
|
38,215
|
|
41,973
|
|
44,899
|
|
44,948
|
|
50,085
|
|
||||||||||
|
Market price at year-end
|
$
|
79.71
|
|
$
|
65.73
|
|
$
|
40.10
|
|
$
|
28.11
|
|
$
|
19.92
|
|
|||||
|
Other Operating Data:
|
||||||||||||||||||||
|
Jack in the Box restaurants:
|
||||||||||||||||||||
|
Company-operated average unit volume
|
$
|
1,858
|
|
$
|
1,708
|
|
$
|
1,606
|
|
$
|
1,557
|
|
$
|
1,405
|
|
|||||
|
Franchise-operated average unit volume (3)
|
$
|
1,429
|
|
$
|
1,337
|
|
$
|
1,312
|
|
$
|
1,313
|
|
$
|
1,286
|
|
|||||
|
System average unit volume (3)
|
$
|
1,510
|
|
$
|
1,412
|
|
$
|
1,381
|
|
$
|
1,379
|
|
$
|
1,331
|
|
|||||
|
Change in company-operated same-store sales
|
5.1
|
%
|
2.0
|
%
|
1.0
|
%
|
4.6
|
%
|
3.1
|
%
|
||||||||||
|
Change in franchise-operated same-store sales (3)
|
7.0
|
%
|
2.0
|
%
|
0.1
|
%
|
3.0
|
%
|
1.3
|
%
|
||||||||||
|
Change in system same-store sales (3)
|
6.5
|
%
|
2.0
|
%
|
0.3
|
%
|
3.4
|
%
|
1.8
|
%
|
||||||||||
|
Qdoba restaurants:
|
||||||||||||||||||||
|
Company-operated average unit volume (4)
|
$
|
1,199
|
|
$
|
1,114
|
|
$
|
1,080
|
|
$
|
1,060
|
|
$
|
1,003
|
|
|||||
|
Franchise-operated average unit volume (3)
|
$
|
1,140
|
|
$
|
1,028
|
|
$
|
961
|
|
$
|
958
|
|
$
|
987
|
|
|||||
|
System average unit volume (3)(4)
|
$
|
1,169
|
|
$
|
1,070
|
|
$
|
1,017
|
|
$
|
1,000
|
|
$
|
992
|
|
|||||
|
Change in company-operated same-store sales (4)
|
8.3
|
%
|
5.7
|
%
|
0.5
|
%
|
3.2
|
%
|
5.4
|
%
|
||||||||||
|
Change in franchise-operated same-store sales (3)
|
10.4
|
%
|
6.3
|
%
|
1.1
|
%
|
1.9
|
%
|
5.4
|
%
|
||||||||||
|
Change in system same-store sales (3)(4)
|
9.3
|
%
|
6.0
|
%
|
0.8
|
%
|
2.5
|
%
|
5.4
|
%
|
||||||||||
|
Capital expenditures
|
$
|
86,226
|
|
$
|
60,525
|
|
$
|
84,690
|
|
$
|
80,200
|
|
$
|
129,312
|
|
|||||
|
Balance Sheet Data (at end of period) (1):
|
||||||||||||||||||||
|
Total assets
|
$
|
1,303,979
|
|
$
|
1,270,665
|
|
$
|
1,319,209
|
|
$
|
1,463,725
|
|
$
|
1,432,322
|
|
|||||
|
Long-term debt, excluding current maturities
|
$
|
688,579
|
|
$
|
497,012
|
|
$
|
349,393
|
|
$
|
405,276
|
|
$
|
447,350
|
|
|||||
|
Stockholders’ equity
|
$
|
15,953
|
|
$
|
257,911
|
|
$
|
472,018
|
|
$
|
411,945
|
|
$
|
405,956
|
|
|||||
____________________________
|
(1)
|
Financial data was extracted or derived from our audited financial statements.
|
|
(2)
|
Weighted-average shares reflect the impact of common stock repurchases under Board-approved programs.
|
|
(3)
|
Changes in same-store sales and average unit volume are presented for franchise restaurants and on a system-wide basis, which includes company and franchise restaurants. Franchise sales represent sales at franchise restaurants and are revenues of our franchisees. We do not record franchise sales as revenues; however, our royalty revenues are calculated based on a percentage of franchise sales. We believe franchise and system sales growth and average unit volume information is useful to investors as a significant indicator of the overall strength of our business as it incorporates our significant revenue drivers which are company and franchise same-store sales as well as net unit development. Company, franchise and system changes in same-store sales include the results of all restaurants that have been open more than one year.
|
|
(4)
|
Average unit volumes and same-store sales for all periods presented have been restated to exclude sales for restaurants reported as discontinued operations.
|
19
|
ITEM 7.
|
MANAGEMENT’S DISCUSSION AND ANALYSIS OF FINANCIAL CONDITION AND RESULTS OF OPERATIONS
|
GENERAL
For an understanding of the significant factors that influenced our performance during the past three fiscal years, we believe our Management’s Discussion and Analysis of Financial Condition and Results of Operations (“MD&A”) should be read in conjunction with the Consolidated Financial Statements and related Notes included in this Annual Report as indexed on page F-1.
Comparisons under this heading refer to the
52
-week periods ended
September 27, 2015
,
September 28, 2014
and
September 29, 2013
for fiscal years
2015
,
2014
and
2013
respectively, unless otherwise indicated.
Our MD&A consists of the following sections:
|
•
|
Overview
— a general description of our business and fiscal
2015
highlights.
|
|
•
|
Financial reporting
— a discussion of changes in presentation, if any.
|
|
•
|
Results of operations
— an analysis of our consolidated statements of earnings for the three years presented in our consolidated financial statements.
|
|
•
|
Liquidity and capital resources
— an analysis of cash flows including capital expenditures, aggregate contractual obligations, share repurchase activity, dividends, known trends that may impact liquidity, and the impact of inflation.
|
|
•
|
Discussion of critical accounting estimates
— a discussion of accounting policies that require critical judgments and estimates.
|
|
•
|
New accounting pronouncements
— a discussion of new accounting pronouncements, dates of implementation and impact on our consolidated financial position or results of operations, if any.
|
We have included in our MD&A certain performance metrics that management uses to assess Company performance and which we believe will be useful in analyzing and understanding our results of operations. These metrics include the following:
|
•
|
Changes in sales at restaurants open more than one year (“same-store sales”) and average unit volumes (“AUVs”) are presented for franchised restaurants and on a system-wide basis, which includes company and franchise restaurants. Franchise sales represent sales at franchise restaurants and are revenues of our franchisees. We do not record franchise sales as revenues; however, our royalty revenues and percentage rent revenues are calculated based on a percentage of franchise sales. We believe franchise and system same-store sales and AUV information is useful to investors as a significant indicator of the overall strength of our business.
|
|
•
|
Company restaurant margin (“restaurant margin”) is defined as Company restaurant sales less expenses incurred directly by our restaurants in generating those sales (food and packaging costs, payroll and employee benefits, and occupancy and other costs). We also present restaurant margin as a percentage of Company restaurant sales.
|
|
•
|
Franchise margin is defined as total franchise revenues less total franchise costs and is also presented as a percentage of franchise revenues.
|
Restaurant margin and franchise margin are not measurements determined in accordance with generally accepted accounting principles (“GAAP”) and should not be considered in isolation, or as an alternative, to income from operations, or other similarly titled measures of other companies.
OVERVIEW
As of
September 27, 2015
, we operated and franchised
2,249
Jack in the Box restaurants, primarily in the western and southern United States, including one in Guam, and
661
Qdoba restaurants throughout the United States and including four in Canada.
Our primary source of revenue is from retail sales at Jack in the Box and Qdoba company-operated restaurants. We also derive revenue from Jack in the Box and Qdoba franchise restaurants, including rental revenue, royalties (based upon a percent of sales) and franchise fees. Historically, we also generated revenue from distribution sales of food and packaging commodities to franchisees. We completed the outsourcing of this function in the first quarter of fiscal 2013, and franchisees who previously utilized our distribution services now purchase product directly from our distribution service providers or other approved suppliers. In addition, we recognize gains or losses from the sale of company-operated restaurants to franchisees, which are included as a line item within operating costs and expenses, net in the accompanying consolidated statements of earnings.
20
The following summarizes the most significant events occurring in fiscal
2015
and certain trends compared to prior years:
|
•
|
Qdoba’s New Pricing Structure
—
In October 2014, Qdoba restaurants rolled out a new simplified pricing structure system-wide where guests who choose to build their own meal pay a set price per entrée based on the protein chosen and without being charged extra for additional items such as guacamole or queso. This resulted in an increase in the average check.
|
|
•
|
Same-Store Sales Growth
—
Same-store sales grew
5.1%
at company-operated Jack in the Box restaurants driven primarily by favorable product mix changes, transaction growth and price increases. Qdoba’s same-store sales increase of
8.3%
at company-operated restaurants was driven primarily by our new simplified pricing structure and catering.
|
|
•
|
Commodity Costs
—
Commodity costs increased approximately 1.3% and 1.4% in 2015 at our Jack in the Box and Qdoba restaurants, respectively, compared with a year ago. Beef represents the largest portion, or approximately 20%, of the Company’s overall commodity spend. We typically do not enter into fixed price contracts for our beef needs. In 2016, we currently expect our beef costs to be flat to slightly deflationary as compared to fiscal 2015. We expect our overall commodity costs in fiscal 2016 to increase approximately 1% at Jack in the Box restaurants and to decrease approximately 3% at our Qdoba restaurants.
|
|
•
|
Restaurant Margin Expansion
—
Our consolidated company-operated restaurant margin increased 190 basis points in 2015 to 20.4%. Jack in the Box’s company-operated restaurant margin improved 220 basis points to 20.7% due primarily to leverage from same-store sales increases and benefits from refranchising activities. Restaurant margins at our Qdoba company-operated restaurants improved 140 basis points to 19.7% primarily reflecting benefits from the new simplified pricing structure and leverage from same-store sales growth.
|
|
•
|
Jack in the Box Franchising Program
—
In 2015,
Jack in the Box franchisees opened a total of
16
restaurants, and we sold 21 company-operated restaurants to franchisees. Our Jack in the Box system was
82%
franchised at the end of fiscal
2015
. In fiscal
2016
, approximately
20
new Jack in the Box restaurants are expected to open system-wide, the majority of which we expect to be through franchised restaurants.
|
|
•
|
Qdoba New Unit Growth
—
In 2015, we opened
17
company-operated restaurants; franchisees opened
22
restaurants of which 11 were in non-traditional locations such as airports and college campuses. In fiscal
2016
,
50-60
new Qdoba restaurants are expected to open system-wide, of which approximately half are expected to be company-operated locations. The majority of our franchise new unit development is expected to be in non-traditional locations.
|
|
•
|
Credit Facility
—
In July 2015, we completed an amendment to our existing credit agreement to increase overall borrowing capacity to $1.2 billion, consisting of a $900.0 million revolving credit agreement and a $300.0 million term loan, both maturing in March 2019.
|
|
•
|
Return of Cash to Shareholders
—
During 2015 we returned cash to shareholders in the form of share repurchases and quarterly cash dividends. We repurchased over
3.7 million
shares of our common stock at an average price of
$84.71
per share, totaling
$317.1 million
, including the cost of brokerage fees. We also declared dividends of $1.00 per share totaling
$37.6 million
, and raised the quarterly dividend by 50% in the third quarter.
|
FINANCIAL REPORTING
During fiscal 2012, we entered into an agreement to outsource our Jack in the Box distribution business. In the third quarter of fiscal 2013, we closed 62 Qdoba restaurants (the “2013 Qdoba Closures”) as part of a comprehensive Qdoba market performance review. The results of operations and other charges for our distribution business and the 2013 Qdoba Closures are reported as discontinued operations for all periods presented. Refer to Note 2,
Discontinued Operations
, for additional information. Unless otherwise noted, amounts and disclosures throughout our MD&A relate to our continuing operations.
In 2015, on our consolidated statements of earnings, we began to separately state our franchise revenue derived from rentals and those derived from royalties and other. To provide clarity, we additionally have separately stated the associated rental expense and depreciation and amortization, related to the rental revenues received from franchisees. For comparison purposes, we have reclassified prior year franchise revenue and franchise costs line items to reflect the new method of presentation.
21
RESULTS OF OPERATIONS
The following table presents certain income and expense items included in our consolidated statements of earnings as a percentage of total revenues, unless otherwise indicated. Percentages may not add due to rounding.
CONSOLIDATED STATEMENTS OF EARNINGS DATA
|
|
Fiscal Year
|
||||||||
|
|
2015
|
2014
|
2013
|
||||||
|
Revenues:
|
|||||||||
|
Company restaurant sales
|
75.1
|
%
|
75.5
|
%
|
76.8
|
%
|
|||
|
Franchise rental revenues
|
14.7
|
%
|
14.6
|
%
|
13.9
|
%
|
|||
|
Franchise royalties and other
|
10.2
|
%
|
9.8
|
%
|
9.3
|
%
|
|||
|
Total revenues
|
100.0
|
%
|
100.0
|
%
|
100.0
|
%
|
|||
|
Operating costs and expenses, net:
|
|||||||||
|
Company restaurant costs:
|
|||||||||
|
Food and packaging (1)
|
31.3
|
%
|
31.9
|
%
|
32.6
|
%
|
|||
|
Payroll and employee benefits (1)
|
27.1
|
%
|
27.5
|
%
|
28.0
|
%
|
|||
|
Occupancy and other (1)
|
21.3
|
%
|
22.1
|
%
|
22.3
|
%
|
|||
|
Total company restaurant costs (1)
|
79.6
|
%
|
81.5
|
%
|
82.9
|
%
|
|||
|
Franchise occupancy expenses (2)
|
75.0
|
%
|
77.8
|
%
|
77.6
|
%
|
|||
|
Franchise support and other costs (3)
|
10.0
|
%
|
9.5
|
%
|
9.0
|
%
|
|||
|
Selling, general and administrative expenses
|
14.4
|
%
|
13.9
|
%
|
14.8
|
%
|
|||
|
Impairment and other charges, net
|
0.8
|
%
|
1.0
|
%
|
0.9
|
%
|
|||
|
Losses (gains) on the sale of company-operated restaurants
|
0.2
|
%
|
0.2
|
%
|
(0.3
|
)%
|
|||
|
Earnings from operations
|
12.8
|
%
|
10.9
|
%
|
9.3
|
%
|
|||
|
Income tax rate (4)
|
36.9
|
%
|
35.3
|
%
|
32.8
|
%
|
|||
____________________________
|
(1)
|
As a percentage of company restaurant sales.
|
|
(2)
|
As a percentage of franchise rental revenues.
|
|
(3)
|
As a percentage of franchise royalties and other.
|
|
(4)
|
As a percentage of earnings from continuing operations and before income taxes.
|
SAME-STORE SALES DATA
Same-store sales increased as follows:
|
Fiscal Year
|
||||||
|
2015
|
2014
|
2013
|
||||
|
Jack in the Box:
|
||||||
|
Company
|
5.1%
|
2.0%
|
1.0%
|
|||
|
Franchise
|
7.0%
|
2.0%
|
0.1%
|
|||
|
System
|
6.5%
|
2.0%
|
0.3%
|
|||
|
Qdoba:
|
||||||
|
Company
|
8.3%
|
5.7%
|
0.5%
|
|||
|
Franchise
|
10.4%
|
6.3%
|
1.1%
|
|||
|
System
|
9.3%
|
6.0%
|
0.8%
|
|||
22
The following table summarizes the changes in the number and mix of Jack in the Box (“JIB”) and Qdoba company and franchise restaurants in each fiscal year:
|
|
2015
|
2014
|
2013
|
||||||||||||||||||||||||
|
|
Company
|
Franchise
|
Total
|
Company
|
Franchise
|
Total
|
Company
|
Franchise
|
Total
|
||||||||||||||||||
|
Jack in the Box:
|
|||||||||||||||||||||||||||
|
Beginning of year
|
431
|
|
1,819
|
|
2,250
|
|
465
|
|
1,786
|
|
2,251
|
|
547
|
|
1,703
|
|
2,250
|
|
|||||||||
|
New
|
2
|
|
16
|
|
18
|
|
1
|
|
11
|
|
12
|
|
6
|
|
11
|
|
17
|
|
|||||||||
|
Refranchised
|
(21
|
)
|
21
|
|
—
|
|
(37
|
)
|
37
|
|
—
|
|
(78
|
)
|
78
|
|
—
|
|
|||||||||
|
Acquired from franchisees
|
7
|
|
(7
|
)
|
—
|
|
4
|
|
(4
|
)
|
—
|
|
1
|
|
(1
|
)
|
—
|
|
|||||||||
|
Closed
|
(6
|
)
|
(13
|
)
|
(19
|
)
|
(2
|
)
|
(11
|
)
|
(13
|
)
|
(11
|
)
|
(5
|
)
|
(16
|
)
|
|||||||||
|
End of year
|
413
|
|
1,836
|
|
2,249
|
|
431
|
|
1,819
|
|
2,250
|
|
465
|
|
1,786
|
|
2,251
|
|
|||||||||
|
% of JIB system
|
18
|
%
|
82
|
%
|
100
|
%
|
19
|
%
|
81
|
%
|
100
|
%
|
21
|
%
|
79
|
%
|
100
|
%
|
|||||||||
|
% of consolidated system
|
56
|
%
|
84
|
%
|
77
|
%
|
58
|
%
|
85
|
%
|
78
|
%
|
61
|
%
|
85
|
%
|
79
|
%
|
|||||||||
|
Qdoba:
|
|||||||||||||||||||||||||||
|
Beginning of year
|
310
|
|
328
|
|
638
|
|
296
|
|
319
|
|
615
|
|
316
|
|
311
|
|
627
|
|
|||||||||
|
New
|
17
|
|
22
|
|
39
|
|
16
|
|
22
|
|
38
|
|
34
|
|
34
|
|
68
|
|
|||||||||
|
Refranchised
|
—
|
|
—
|
|
—
|
|
—
|
|
—
|
|
—
|
|
(3
|
)
|
3
|
|
—
|
|
|||||||||
|
Acquired from franchisees
|
—
|
|
—
|
|
—
|
|
—
|
|
—
|
|
—
|
|
13
|
|
(13
|
)
|
—
|
|
|||||||||
|
Closed
|
(5
|
)
|
(11
|
)
|
(16
|
)
|
(2
|
)
|
(13
|
)
|
(15
|
)
|
(64
|
)
|
(16
|
)
|
(80
|
)
|
|||||||||
|
End of year
|
322
|
|
339
|
|
661
|
|
310
|
|
328
|
|
638
|
|
296
|
|
319
|
|
615
|
|
|||||||||
|
% of Qdoba system
|
49
|
%
|
51
|
%
|
100
|
%
|
49
|
%
|
51
|
%
|
100
|
%
|
48
|
%
|
52
|
%
|
100
|
%
|
|||||||||
|
% of consolidated system
|
44
|
%
|
16
|
%
|
23
|
%
|
42
|
%
|
15
|
%
|
22
|
%
|
39
|
%
|
15
|
%
|
21
|
%
|
|||||||||
|
Consolidated:
|
|
||||||||||||||||||||||||||
|
Total system
|
735
|
|
2,175
|
|
2,910
|
|
741
|
|
2,147
|
|
2,888
|
|
761
|
|
2,105
|
|
2,866
|
|
|||||||||
|
% of consolidated system
|
25
|
%
|
75
|
%
|
100
|
%
|
26
|
%
|
74
|
%
|
100
|
%
|
27
|
%
|
73
|
%
|
100
|
%
|
|||||||||
Jack in the Box Brand
Company Restaurant Operations
The following table presents Jack in the Box company restaurant sales, costs and margin, and restaurant costs and margin as a percentage of the related sales. Percentages may not add due to rounding
(dollars in thousands)
:
|
|
2015
|
2014
|
2013
|
||||||||||||||||||
|
Company restaurant sales
|
$
|
782,525
|
|
$
|
782,461
|
|
$
|
850,512
|
|
||||||||||||
|
Company restaurant costs:
|
|||||||||||||||||||||
|
Food and packaging
|
247,931
|
|
31.7
|
%
|
254,891
|
|
32.6
|
%
|
284,221
|
|
33.4
|
%
|
|||||||||
|
Payroll and employee benefits
|
215,598
|
|
27.6
|
%
|
218,000
|
|
27.9
|
%
|
241,149
|
|
28.4
|
%
|
|||||||||
|
Occupancy and other
|
157,281
|
|
20.1
|
%
|
164,433
|
|
21.0
|
%
|
182,493
|
|
21.5
|
%
|
|||||||||
|
Total company restaurant costs
|
$
|
620,810
|
|
79.3
|
%
|
$
|
637,324
|
|
81.5
|
%
|
$
|
707,863
|
|
83.2
|
%
|
||||||
|
Restaurant margin
|
$
|
161,715
|
|
20.7
|
%
|
$
|
145,137
|
|
18.5
|
%
|
$
|
142,649
|
|
16.8
|
%
|
||||||
23
Company restaurant sales remained relatively flat in
2015
and decreased
$68.1 million
in
2014
as compared with the respective prior year. Higher AUV growth in 2015 was offset by a decrease in sales attributable to a reduction in the average number of company-operated restaurants resulting from the execution of our refranchising strategy which includes the sale of restaurants to franchisees. The decrease in restaurant sales in 2014 is due primarily to decreases in the average number of company-operated restaurants related to the execution of our refranchise strategy, partially offset by an increase in AUVs at our company-operated restaurants. The following table presents the approximate impact of these increases (decreases) on Jack in the Box company restaurant sales (
in millions
):
|
2015 vs. 2014
|
2014 vs. 2013
|
|||||||
|
Decrease in the average number of restaurants
|
$
|
(68.7
|
)
|
$
|
(122.1
|
)
|
||
|
AUV increase
|
68.8
|
|
54.0
|
|
||||
|
Total increase (decrease) in company restaurant sales
|
$
|
0.1
|
|
$
|
(68.1
|
)
|
||
Same-store sales at Jack in the Box company-operated restaurants increased
5.1%
in
2015
and
2.0%
in
2014
, primarily driven by price increases and favorable product mix changes in both years, and in 2015 an increase in transactions. The following table summarizes the change in company-operated same-store sales:
|
|
Increase/(Decrease)
|
|||||
|
|
2015 vs. 2014
|
2014 vs. 2013
|
||||
|
Average check (1)
|
4.2
|
%
|
3.6
|
%
|
||
|
Transactions
|
0.9
|
%
|
(1.6
|
)%
|
||
|
Increase in same-store sales
|
5.1
|
%
|
2.0
|
%
|
||
____________________________
|
(1)
|
Includes price increases of approximately
2.2%
and
2.7%
in
2015
and
2014
, respectively.
|
Food and packaging costs as a percentage of company restaurant sales decreased to
31.7%
in
2015
from
32.6%
in
2014
, and
33.4%
in 2013. In 2015 and 2014, the benefits of menu price increases and product mix changes more than offset higher commodity costs. In 2015, commodity costs increased 1.3% as higher costs for beef, eggs and produce were partially offset by lower costs for pork and shortening. Eggs and beef increased most significantly by approximately 53% and 10%, respectively, in 2015. In 2014, commodity costs increased 1.8% primarily due to higher costs for beef, pork, and potatoes. For fiscal 2016, we currently expect commodity costs to increase approximately 1% at Jack in the Box restaurants.
Payroll and employee benefit costs as a percentage of company restaurant sales decreased to
27.6%
in 2015 from
27.9%
in
2014
, and
28.4%
in 2013. In
2015
, sales leverage, the benefits of refranchising and lower costs for group insurance driven by favorable claim trends were partially offset by higher wages from minimum wage increases, unfavorable development trends associated with workers’ compensation claims and an increase in incentive compensation driven by strong operating performance. In
2014
, the decrease in payroll and employee benefit costs as a percentage of company restaurant sales per comparison with 2013 relates to leverage from AUV sales increases and the benefits of refranchising lower performing company-operated restaurants, which were partially offset by higher levels of incentive compensation.
As a percentage of company restaurant sales, occupancy and other costs decreased to
20.1%
in
2015
from
21.0%
in
2014
, and
21.5%
in 2013. The decrease in 2015 is related to sales leverage and the benefits of refranchising, partially offset by higher costs for credit card fees, maintenance and repair expenses and equipment costs due to beverage and technology upgrades at our restaurants. In 2014, occupancy and other costs as a percentage of company restaurant sales decreased due to sales leverage and the benefits of refranchising, partially offset by the impact of higher utility costs and higher depreciation expense related to restaurant remodel programs.
24
Jack in the Box Franchise Operations
The following table presents Jack in the Box franchise revenues, costs, and margin in each fiscal year and other information we believe is useful in analyzing the change in franchise operating results (
dollars in thousands
):
|
2015
|
2014
|
2013
|
||||||||||
|
Franchise rental revenues
|
$
|
226,494
|
|
$
|
216,944
|
|
$
|
207,458
|
|
|||
|
Royalties
|
$
|
133,726
|
|
$
|
124,538
|
|
$
|
117,855
|
|
|||
|
Re-image contributions to franchisees
|
—
|
|
(22
|
)
|
(1,990
|
)
|
||||||
|
Franchise fees and other
|
2,431
|
|
3,323
|
|
5,460
|
|
||||||
|
Franchise royalties and other
|
$
|
136,157
|
|
$
|
127,839
|
|
$
|
121,325
|
|
|||
|
Total franchise revenues
|
$
|
362,651
|
|
$
|
344,783
|
|
$
|
328,783
|
|
|||
|
Rental expense
|
$
|
136,782
|
|
$
|
134,975
|
|
$
|
128,157
|
|
|||
|
Depreciation and amortization
|
33,128
|
|
33,844
|
|
32,876
|
|
||||||
|
Franchise occupancy expenses
|
$
|
169,910
|
|
$
|
168,819
|
|
$
|
161,033
|
|
|||
|
Franchise support and other costs
|
11,726
|
|
10,052
|
|
9,590
|
|
||||||
|
Total franchise costs
|
$
|
181,636
|
|
$
|
178,871
|
|
$
|
170,623
|
|
|||
|
Franchise margin
|
$
|
181,015
|
|
$
|
165,912
|
|
$
|
158,160
|
|
|||
|
Franchise margin as a % of franchise revenue
|
49.9
|
%
|
48.1
|
%
|
48.1
|
%
|
||||||
|
Average number of franchise restaurants
|
1,828
|
|
1,794
|
|
1,721
|
|
||||||
|
% increase
|
1.9
|
%
|
4.2
|
%
|
|
|||||||
|
Franchise restaurant AUVs
|
$
|
1,429
|
|
$
|
1,337
|
|
$
|
1,312
|
|
|||
|
Increase in franchise-operated same-store sales
|
7.0
|
%
|
2.0
|
%
|
||||||||
|
Royalties as a percentage of franchise restaurant sales
|
5.1
|
%
|
5.2
|
%
|
5.2
|
%
|
||||||
Franchise rental revenues increased
$9.6 million
, or
4.4%
, in
2015
and
$9.5 million
, or
4.6%
, in
2014
as compared with the respective prior year. In 2015, the increase primarily reflects higher AUVs resulting in an increase in revenues from percentage rent. In 2014, franchise rental revenues increased due primarily to an increase in the number of franchise restaurants leased or subleased from the Company, and an increase in AUVs.
Franchise royalties and other increased
$8.3 million
or 6.5% in 2015 and
$6.5 million
or 5.4% in 2014 versus the respective prior year. In 2015, higher AUVs at franchise restaurants drove an increase in revenues from royalties. In 2014, an increase in the number of franchised restaurants, higher AUVs and a decrease in re-image contributions of $2.0 million, recorded as a reduction of franchise royalties and other, contributed to the increase in franchise royalties and other. In 2015 and 2014, these increases were partially offset by a reduction in franchise fees of $0.7 million and $2.0 million, respectively.
Franchise occupancy expenses, principally rents and depreciation on properties subleased or leased to franchisees, increased
$1.1 million
in
2015
and
$7.8 million
in
2014
. In 2015, the increase was due to higher rental expense related to customary rent increases partially offset by a decrease in depreciation expense related to building assets becoming fully depreciated, which more than offset the additional depreciation expense driven by our refranchising strategy. The increase in
2014
as compared with
2013
was primarily driven by an increase in the average number of franchise restaurants.
Franchise support and other costs increased
$1.7 million
in 2015 and
$0.5 million
in 2014 due to an increase in the number of franchised restaurants, and in 2015, the recognition of bad debt expense of $0.8 million.
25
Qdoba Brand
Company Restaurant Operations
The following table presents Qdoba company restaurant sales, costs and margin, and restaurant costs and margin as a percentage of the related sales. Percentages may not add due to rounding
(dollars in thousands)
:
|
|
2015
|
2014
|
2013
|
||||||||||||||||||
|
Company restaurant sales
|
$
|
374,338
|
|
$
|
338,451
|
|
$
|
293,268
|
|
||||||||||||
|
Company restaurant costs:
|
|||||||||||||||||||||
|
Food and packaging
|
114,057
|
|
30.5
|
%
|
102,447
|
|
30.3
|
%
|
88,464
|
|
30.2
|
%
|
|||||||||
|
Payroll and employee benefits
|
97,704
|
|
26.1
|
%
|
90,494
|
|
26.7
|
%
|
79,235
|
|
27.0
|
%
|
|||||||||
|
Occupancy and other
|
88,742
|
|
23.7
|
%
|
83,428
|
|
24.6
|
%
|
73,093
|
|
24.9
|
%
|
|||||||||
|
Total company restaurant costs
|
$
|
300,503
|
|
80.3
|
%
|
$
|
276,369
|
|
81.7
|
%
|
$
|
240,792
|
|
82.1
|
%
|
||||||
|
Restaurant margin
|
$
|
73,835
|
|
19.7
|
%
|
$
|
62,082
|
|
18.3
|
%
|
$
|
52,476
|
|
17.9
|
%
|
||||||
Company restaurant sales increased
$35.9 million
in
2015
and
$45.2 million
in
2014
as compared with the respective prior year. In 2015, the increase is primarily related to growth in AUVs, and to a lesser extent, an increase in the number of company-operated restaurants. In 2014, the increase in restaurant sales is due to an increase in the average number of Qdoba company-operated restaurants, as well as an increase in AUVs. The following table presents the approximate impact of these increases on company restaurant sales (
in millions
):
|
Fiscal Year
|
||||||||
|
2015 vs. 2014
|
2014 vs. 2013
|
|||||||
|
AUV increase
|
$
|
25.9
|
|
$
|
9.2
|
|
||
|
Increase in the average number of restaurants
|
10.0
|
|
36.0
|
|
||||
|
Total increase in company restaurant sales
|
$
|
35.9
|
|
$
|
45.2
|
|
||
Same-store sales at Qdoba company-operated restaurants increased
8.3%
in
2015
and
5.7%
in
2014
. In 2015, the increase in same-store sales was primarily driven by the new simplified menu pricing structure, and growth in catering sales. In 2014, the increases were related to favorable product mix, transaction growth, price increases, higher catering sales and lower discounting. The following table summarizes the change in company-operated same-store sales:
|
|
Increase/(Decrease)
|
|||||
|
|
2015 vs. 2014
|
2014 vs. 2013
|
||||
|
Average check (1)
|
7.3
|
%
|
4.2
|
%
|
||
|
Transactions
|
(0.1
|
)%
|
0.7
|
%
|
||
|
Catering
|
1.1
|
%
|
0.8
|
%
|
||
|
Increase in same-store sales
|
8.3
|
%
|
5.7
|
%
|
||
____________________________
|
(1)
|
Includes price increases of approximately
0.2%
and
1.0%
in 2015 and 2014, respectively.
|
Food and packaging costs as a percentage of company restaurant sales increased to
30.5%
in 2015 from
30.3%
in
2014
, and
30.2%
in 2013. In 2015, higher commodity costs were partially offset by the benefits from the new pricing structure. In 2014, food and packaging costs increased slightly as the benefits of retail price increases and lower discounting were more than offset by higher commodity costs.
In 2015, commodity costs increased 1.4% at our Qdoba restaurants primarily due to higher costs for beef, partially offset by lower costs for produce, pork and beans. In the current year, beef costs increased most significantly, by 12%. In 2014, commodity costs increased 1.4% due to higher costs for produce and pork. For fiscal 2016, we currently expect Qdoba commodity costs to decrease approximately 3% compared with fiscal 2015.
Payroll and employee benefit costs as a percentage of company restaurant sales decreased to
26.1%
in 2015 from
26.7%
in
2014
, and
27.0%
in 2013. The decrease in 2015 is driven primarily by leverage from same-store sales increases and lower levels of incentive compensation, partially offset by increases in labor staffing. In 2014, the decline primarily relates to leverage from same-store sales increases and a change in our staffing mix in the second quarter of fiscal 2014 that utilizes a more variable labor model, partially offset by higher levels of incentive compensation.
26
As a percentage of company restaurant sales, occupancy and other costs decreased to
23.7%
of company restaurant sales in
2015
, from
24.6%
in
2014
and
24.9%
in
2013
. In 2015, the decrease was primarily due to sales leverage, partially offset by higher costs for credit card fees, property rent, and start up costs associated with a new catering call center. In 2014, the decrease was due to sales leverage which more than offset higher maintenance and repair expenses and costs for utilities, as well as an increase in equipment rental costs related to upgraded beverage equipment.
Qdoba Franchise Operations
The following table presents Qdoba franchise revenues, costs, and margin in each fiscal year and other information we believe is useful in analyzing the change in franchise operating results (
dollars in thousands
):
|
2015
|
2014
|
2013
|
||||||||||
|
Franchise rental revenues
|
$
|
208
|
|
$
|
238
|
|
$
|
55
|
|
|||
|
Royalties
|
$
|
19,033
|
|
$
|
16,448
|
|
$
|
14,808
|
|
|||
|
Franchise fees and other
|
1,562
|
|
1,750
|
|
2,441
|
|
||||||
|
Franchise royalties and other
|
$
|
20,595
|
|
$
|
18,198
|
|
$
|
17,249
|
|
|||
|
Total franchise revenues
|
$
|
20,803
|
|
$
|
18,436
|
|
$
|
17,304
|
|
|||
|
Rental expense (1)
|
$
|
192
|
|
$
|
215
|
|
$
|
16
|
|
|||
|
Franchise support and other costs
|
3,962
|
|
3,800
|
|
2,928
|
|
||||||
|
Total franchise costs
|
$
|
4,154
|
|
$
|
4,015
|
|
$
|
2,944
|
|
|||
|
Franchise margin
|
$
|
16,649
|
|
$
|
14,421
|
|
$
|
14,360
|
|
|||
|
Franchise margin as a % of franchise revenue
|
80.0
|
%
|
78.2
|
%
|
83.0
|
%
|
||||||
|
Average number of franchise restaurants
|
333
|
|
322
|
|
311
|
|
||||||
|
% increase
|
3.4
|
%
|
3.5
|
%
|
|
|||||||
|
Franchise restaurant AUVs
|
$
|
1,140
|
|
$
|
1,028
|
|
$
|
961
|
|
|||
|
Increase in franchise-operated same-store sales
|
10.4
|
%
|
6.3
|
%
|
||||||||
|
Royalties as a percentage of franchise restaurant sales
|
5.0
|
%
|
5.0
|
%
|
4.9
|
%
|
||||||
____________________________
|
(1)
|
Included in franchise occupancy expenses in the accompanying consolidated statements of earnings.
|
Franchise royalties and other increased
$2.4 million
or
13.2%
in
2015
and
$0.9 million
or
5.5%
in
2014
as compared with the respective prior year. Increases in both years primarily relate to higher AUVs resulting in an increase in revenues from royalties, and to a lesser extent, an increase in the average number of Qdoba franchise restaurants. In 2014, these increases were partially offset by a reduction in franchise fees of $0.7 million.
Franchise support and other costs increased
$0.2 million
in
2015
and
$0.9 million
in
2014
in comparison with the respective prior year.
Selling, general and administrative (“SG&A”) expenses
The following table presents the change in SG&A expenses in each fiscal year compared with the prior year (
in thousands
):
|
|
Increase/(Decrease)
|
|||||||
|
|
2015 vs. 2014
|
2014 vs. 2013
|
||||||
|
Pension and postretirement benefits
|
$
|
4,989
|
|
$
|
(17,386
|
)
|
||
|
Cash surrender value of COLI policies, net
|
3,833
|
|
1,365
|
|
||||
|
Incentive compensation (including share-based compensation)
|
3,851
|
|
1,181
|
|
||||
|
Pre-opening costs
|
1,648
|
|
(777
|
)
|
||||
|
Insurance
|
(1,163
|
)
|
545
|
|
||||
|
Advertising
|
(982
|
)
|
(2,298
|
)
|
||||
|
Employee relocation
|
(463
|
)
|
1,152
|
|
||||
|
Other
|
2,644
|
|
2,365
|
|
||||
|
$
|
14,357
|
|
$
|
(13,853
|
)
|
|||
27
In 2015 and 2014, the changes in pension and postretirement benefits primarily relate to changes in the discount rates as compared with the respective prior year.
The cash surrender value of our Company-owned life insurance (“COLI”) policies, net of changes in our non-qualified deferred compensation obligation supported by these policies, are subject to market fluctuations. The changes in market values had a negative impact of $0.6 million in 2015, and a positive impact of $3.2 million in 2014 and $4.6 million in 2013.
In 2015 and 2014, the higher levels of incentive compensation reflects improvements in the Company’s results compared with performance goals. In 2015, higher incentive compensation also relates to an increase in share-based compensation due to our annual grant of nonvested stock units which vest over five years. As this is our fifth year of offering such grants, we are expensing one additional year of grants compared to a year ago. In 2014, a decrease in share based compensation due to accelerated vesting for retiree eligible executives in 2013 partially offset the increases in other forms of incentive compensation.
In 2015, pre-opening costs increased due to an increase in the number of Qdoba restaurants under construction as compared to a year ago, as well as higher pre-opening labor costs. In 2014, pre-opening costs decreased primarily due to a decline in the number of new Jack in the Box company restaurant openings as compared to the prior year.
Insurance costs in 2015 decreased primarily due to an unfavorable $1.0 million general liability legal settlement recognized in the prior year as well as favorable group insurance trends in the current year. In 2014, costs were higher primarily related to aforementioned legal settlement.
Advertising costs in 2015 and 2014 were impacted by our refranchising strategy at Jack in the Box, which resulted in a decrease in company-operated restaurants and the related overhead expenses to manage and support those restaurants, including advertising costs, which are primarily contributions to our marketing funds determined as a percentage of gross restaurant sales. As such, in 2015 and 2014, advertising costs decreased at Jack in the Box and were partially offset in both years by same-store sales growth at Jack in the Box and Qdoba restaurants, and in 2014 higher advertising expenses at Qdoba.
Impairment and other charges, net
The following table presents the components of impairment and other charges, net in each fiscal year (
in thousands
):
|
2015
|
2014
|
2013
|
||||||||||
|
Accelerated depreciation
|
$
|
6,260
|
|
$
|
1,202
|
|
$
|
2,554
|
|
|||
|
Costs of closed restaurants (primarily lease obligations) and other
|
3,592
|
|
2,841
|
|
2,469
|
|
||||||
|
Losses on the disposition of property and equipment, net
|
1,319
|
|
1,674
|
|
1,091
|
|
||||||
|
Restaurant impairment charges
|
557
|
|
570
|
|
3,874
|
|
||||||
|
Restructuring costs
|
29
|
|
8,621
|
|
3,451
|
|
||||||
|
$
|
11,757
|
|
$
|
14,908
|
|
$
|
13,439
|
|
||||
Impairment and other charges, net decreased
$3.2 million
in
2015
versus 2014 due to a decrease in restructuring activities, partially offset by an increase in accelerated depreciation recognized in connection with various initiatives at our company-operated Jack in the Box restaurants. In 2015, accelerated depreciation includes $3.6 million recognized in connection with beverage equipment upgrades and $1.5 million related to projects designed to upgrade outdoor lighting and certain technology at our restaurants.
In 2014, impairment and other charges, net increased $1.5 million in 2014 versus 2013 due primarily to an increase in restructuring costs incurred in connection with the comprehensive review of our organizational structure, partially offset by declines in restaurant impairment and accelerated depreciation charges. Restructuring costs increased $5.2 million due to a charge related to a restaurant software asset we no longer plan to place in service. Restaurant impairment charges decreased $3.3 million due to charges in 2013 to write down the carrying value underperforming Jack in the Box restaurants and Jack in the Box restaurants we closed. Accelerated depreciation decreased $1.4 million due to a decrease in restaurant enhancement activity in 2014.
Losses on the disposition of property and equipment, net included income of $0.9 million in 2015 and
$2.8 million
in 2013 from the resolution of eminent domain matters involving Jack in the Box restaurants. For additional detail, refer to Note 9,
Impairment and Other Charges, Net
, of the notes to the consolidated financial statements.
28
(Losses) gains on the sale of company-operated restaurants
(Losses) gains on the sale of company-operated restaurants to franchisees, net are detailed in the following table (
dollars in thousands
):
|
2015
|
2014
|
2013
|
||||||||||
|
Number of restaurants sold to franchisees
|
21
|
|
37
|
|
81
|
|
||||||
|
(Losses) gains on the sale of company-operated restaurants
|
$
|
(3,139
|
)
|
$
|
(1,692
|
)
|
$
|
4,640
|
|
|||
|
Loss on the anticipated sale of a Jack in the Box market
|
—
|
|
(1,856
|
)
|
—
|
|
||||||
|
Total (losses) gains on the sale of company-operated restaurants
|
$
|
(3,139
|
)
|
$
|
(3,548
|
)
|
$
|
4,640
|
|
|||
Gains and losses are impacted by the number of restaurants sold and changes in average gains or losses recognized, which relate to specific sales and cash flows of those restaurants. In 2015, 2014 and 2013, (losses) gains on the sale of company-operated restaurants include additional gains of $1.5 million, $2.1 million and $3.3 million, respectively, recognized upon the extension of the underlying franchise and lease agreements related to Jack in the Box restaurants sold in previous years. In 2014, the loss on the anticipated sale of a Jack in the Box market relates to 25 company-operated restaurants of which we sold 20, and closed the remaining five in the second quarter of fiscal 2015. For additional detail, refer to Note 3, S
ummary of Refranchisings, Franchisee Development and Acquisitions
, of the notes to the consolidated financial statements.
Interest Expense, Net
Interest expense, net is comprised of the following (
in thousands
):
|
2015
|
2014
|
2013
|
||||||||||
|
Interest expense
|
$
|
19,180
|
|
$
|
16,531
|
|
$
|
16,471
|
|
|||
|
Interest income
|
(377
|
)
|
(853
|
)
|
(1,220
|
)
|
||||||
|
Interest expense, net
|
$
|
18,803
|
|
$
|
15,678
|
|
$
|
15,251
|
|
|||
Interest expense, net increased
$3.1 million
in 2015 as compared to a year ago due to higher average borrowings, partially offset by a charge in 2014 to write-off deferred financing fees in connection with the refinancing of our credit facility. In 2014, interest expense, net increased $0.4 million compared with the respective prior year due to a decrease in interest income attributable to a decline in notes receivable related to refranchising transactions. Both 2014 and 2013 include the write-off of deferred finance fees of
$0.8 million
and $0.9 million, respectively, recorded in connection with refinancing of our credit facility in each year.
Income Taxes
The income tax provisions reflect effective tax rates of
36.9%
,
35.3%
and
32.8%
of pretax earnings from continuing operations in
2015
,
2014
and
2013
, respectively. In 2015, the major component of the year-over-year change in tax rates was a decrease in the market performance of insurance products used to fund certain non-qualified retirement plans which are excluded from taxable income. The tax rate increase in 2014 versus 2013 is primarily related to the expiration of the Work Opportunity Tax Credit offset by the release of a valuation allowance on California tax credits due to a change in state tax law, and a decrease in the market performance of insurance products used to fund certain non-qualified retirement plans which are excluded from taxable income.
Earnings from Continuing Operations
Earnings from continuing operations were
$112.6 million
, or
$2.95
per diluted share, in
2015
;
$94.8 million
, or
$2.26
per diluted share, in
2014
; and
$82.6 million
, or
$1.84
per diluted share, in
2013
.
Losses from Discontinued Operations, Net
The losses from our distribution business and the 2013 Qdoba Closures have been reported as discontinued operations for all periods presented. Refer to Note 2,
Discontinued Operations
, in the notes to our consolidated financial statements for further information regarding our discontinued operations.
29
Losses from discontinued operations net of tax, are as follows for each discontinued operation in each fiscal year
(in thousands)
:
|
2015
|
2014
|
2013
|
||||||||||
|
Distribution business
|
$
|
(430
|
)
|
$
|
(790
|
)
|
$
|
(3,974
|
)
|
|||
|
2013 Qdoba Closures
|
(3,359
|
)
|
(5,104
|
)
|
(27,482
|
)
|
||||||
|
$
|
(3,789
|
)
|
$
|
(5,894
|
)
|
$
|
(31,456
|
)
|
||||
These losses from discontinued operations reduced diluted earnings per share by the following in each fiscal year (amounts may not add due to rounding):
|
2015
|
2014
|
2013
|
||||||||||
|
Distribution business
|
$
|
(0.01
|
)
|
$
|
(0.02
|
)
|
$
|
(0.09
|
)
|
|||
|
2013 Qdoba Closures
|
(0.09
|
)
|
(0.12
|
)
|
(0.61
|
)
|
||||||
|
$
|
(0.10
|
)
|
$
|
(0.14
|
)
|
$
|
(0.70
|
)
|
||||
LIQUIDITY AND CAPITAL RESOURCES
General
Our primary sources of short-term and long-term liquidity are expected to be cash flows from operations and our revolving bank credit facility.
We generally reinvest available cash flows from operations to develop new restaurants or enhance existing restaurants, to reduce debt, to repurchase shares of our common stock and to pay cash dividends. Our cash requirements consist principally of:
|
•
|
working capital;
|
|
•
|
capital expenditures for new restaurant construction and restaurant renovations;
|
|
•
|
income tax payments;
|
|
•
|
debt service requirements; and
|
|
•
|
obligations related to our benefit plans.
|
Based upon current levels of operations and anticipated growth, we expect that cash flows from operations, combined with other financing alternatives in place or available, will be sufficient to meet our capital expenditure, working capital and debt service requirements for at least the next twelve months and the foreseeable future.
As is common in the restaurant industry, we maintain relatively low levels of accounts receivable and inventories, and our vendors grant trade credit for purchases such as food and supplies. We also continually invest in our business through the addition of new units and refurbishment of existing units, which are reflected as long-term assets and not as part of working capital. As a result, we may at times maintain current liabilities in excess of current assets, which results in a working capital deficit.
Cash Flows
The table below summarizes our cash flows from operating, investing and financing activities for each of the past three fiscal years (
in thousands
):
|
2015
|
2014
|
2013
|
||||||||||
|
Total cash provided by (used in):
|
||||||||||||
|
Operating activities
|
$
|
226,875
|
|
$
|
201,022
|
|
$
|
198,872
|
|
|||
|
Investing activities
|
(84,473
|
)
|
(42,979
|
)
|
(33,939
|
)
|
||||||
|
Financing activities
|
(135,208
|
)
|
(157,116
|
)
|
(163,762
|
)
|
||||||
|
Effect of exchange rate changes
|
(29
|
)
|
7
|
|
4
|
|
||||||
|
Increase in cash and cash equivalents
|
$
|
7,165
|
|
$
|
934
|
|
$
|
1,175
|
|
|||
Operating Activities
.
Operating cash flows increased
$25.9 million
in
2015
compared with
2014
due primarily to an increase in net earnings in fiscal 2015 and a reduction in prepaid income taxes of $20.3 million, offset by an income tax refund of $20.5 million received in the fourth quarter of 2014 as a result of a fixed asset cost segregation study.
In 2014, operating cash flows increased $2.2 million compared with 2013 due primarily to the tax benefits realized as a result of the fixed asset cost segregation study which resulted in an income tax refund and a decrease in income tax payments. These decreases in cash flows were partially offset by an increase in property rent payments due to timing differences associated with payments for the month of October.
30
Investing Activities
.
Cash flows used in investing activities increased
$41.5 million
in
2015
compared with
2014
due primarily to an increase in capital expenditures, cash used to acquire assets held for sale and leaseback, and a decrease in proceeds from assets held for sale and leaseback and the sale of company-operated restaurants. In
2014
, cash flows used in investing activities increased
$9.0 million
compared with
2013
due primarily to decreases in proceeds from assets held for sale and leaseback and the sale of company-operated restaurants, partially offset by decreases in capital expenditures, cash used to acquire assets held for sale and leaseback, and acquisitions of franchise-operated restaurants.
Capital Expenditures
—
The composition of capital expenditures in each fiscal year is summarized in the table below (
in thousands
):
|
2015
|
2014
|
2013
|
||||||||||
|
Jack in the Box:
|
||||||||||||
|
New restaurants
|
$
|
2,402
|
|
$
|
3,533
|
|
$
|
5,887
|
|
|||
|
Restaurant facility expenditures
|
36,062
|
|
22,680
|
|
40,670
|
|
||||||
|
Other, including information technology
|
3,464
|
|
4,645
|
|
3,716
|
|
||||||
|
$
|
41,928
|
|
$
|
30,858
|
|
$
|
50,273
|
|
||||
|
Qdoba:
|
||||||||||||
|
New restaurants
|
$
|
26,686
|
|
$
|
13,189
|
|
$
|
22,672
|
|
|||
|
Restaurant facility expenditures
|
3,762
|
|
4,477
|
|
4,722
|
|
||||||
|
Other, including information technology
|
3,623
|
|
301
|
|
149
|
|
||||||
|
$
|
34,071
|
|
$
|
17,967
|
|
$
|
27,543
|
|
||||
|
Shared Services:
|
||||||||||||
|
Information technology
|
$
|
7,315
|
|
$
|
5,786
|
|
$
|
4,162
|
|
|||
|
Other, including facility improvements
|
2,912
|
|
5,914
|
|
2,712
|
|
||||||
|
$
|
10,227
|
|
$
|
11,700
|
|
$
|
6,874
|
|
||||
|
Consolidated capital expenditures
|
$
|
86,226
|
|
$
|
60,525
|
|
$
|
84,690
|
|
|||
Our capital expenditure program includes, among other things, investments in new locations and equipment, restaurant remodeling, and information technology enhancements. In
2015
, capital expenditures increased
$25.7 million
due primarily to an increase in spending related to building new Qdoba restaurants, exterior lighting enhancements at our Jack in the Box restaurants, and information technology infrastructure at both brands, partially offset by a decrease in spending related to Qdoba’s corporate support center. In
2014
, capital expenditures decreased
$24.2 million
compared with
2013
due primarily to a decrease in spending related to the exteriors of Jack in the Box restaurants and new Qdoba restaurants, partially offset by an increase in spending for leasehold improvements related to Qdoba’s new corporate support center.
In fiscal
2016
, capital expenditures are expected to be approximately
$100
-
$120 million
. Increased spending in fiscal 2016 is primarily related to remodels at Qdoba company-operated restaurants, as well as increases in spending for information technology upgrades to support both brands. We plan to open
4
new Jack in the Box and approximately
25-30
new Qdoba company-operated restaurants in fiscal 2016.
Sale of Company-Operated Restaurants
—
We have continued to expand franchise ownership in the Jack in the Box system primarily through the sale of company-operated restaurants to franchisees. The following table details proceeds received in connection with our refranchising activities in each fiscal year (
dollars in thousands
):
|
2015
|
2014
|
2013
|
||||||||||
|
Number of restaurants sold to franchisees
|
21
|
|
37
|
|
81
|
|
||||||
|
Total proceeds
|
$
|
3,951
|
|
$
|
10,536
|
|
$
|
30,619
|
|
|||
We expect total proceeds from the sale of Jack in the Box restaurants in
2016
to be minimal.
31
Assets Held for Sale and Leaseback
—
We use sale and leaseback financing to lower the initial cash investment in our Jack in the Box restaurants to the cost of the equipment, whenever possible. In 2015, we exercised our right of first refusal related to five leased properties which we intend to sell and leaseback within the next 12 months. The following table summarizes the cash flow activity related to sale and leaseback transactions in each fiscal year (
dollars in thousands
):
|
2015
|
2014
|
2013
|
||||||||||
|
Number of restaurants sold and leased back
|
—
|
|
3
|
|
24
|
|
||||||
|
Proceeds from sale and leaseback transactions
|
$
|
—
|
|
$
|
5,698
|
|
$
|
47,431
|
|
|||
|
Purchases of assets intended for sale and leaseback
|
$
|
(10,396
|
)
|
$
|
(2,801
|
)
|
$
|
(26,058
|
)
|
|||
As of
September 27, 2015
, we had investments of approximately
$15.2 million
relating to seven restaurant properties that we expect to sell and leaseback during fiscal
2016
.
Acquisition of Franchise-Operated Restaurants
—
In 2015 and 2014, we acquired seven and four Jack in the Box franchise restaurants, respectively. In 2013, we acquired 13 Qdoba franchise restaurants in select markets where we believe there is continued opportunity for restaurant development. Additionally, in 2013 we exercised our right of first refusal and acquired one Jack in the Box restaurant. The following table details franchise-operated restaurant acquisition activity in each fiscal year (
dollars in thousands
):
|
2015
|
2014
|
2013
|
||||||||||
|
Number of restaurants acquired from franchisees
|
7
|
|
4
|
|
14
|
|
||||||
|
Cash used to acquire franchise-operated restaurants
|
$
|
—
|
|
$
|
1,750
|
|
$
|
12,064
|
|
|||
The purchase price was primarily allocated to liabilities assumed and property and equipment in 2015, and property and equipment, goodwill and reacquired franchise rights in 2014 and 2013. For additional information, refer to Note 3,
Summary of Refranchisings, Franchisee Development and Acquisitions
, of the notes to the consolidated financial statements.
Financing Activities
.
Cash used in financing activities decreased
$21.9 million
in
2015
and
$6.6 million
in
2014
as compared with the respective prior year. The decrease in
2015
is due primarily to an increase in borrowings under our credit facility, partially offset by an increase in cash used to pay dividends and a decrease in proceeds from the issuance of common stock. The decrease in
2014
is due primarily to an increase in borrowings under our credit facility and the change in our book overdraft related to the timing of working capital receipts and disbursements, partially offset by an increase in cash used to repurchase shares of our common stock and to pay dividends, and a decrease in proceeds from the issuance of common stock.
Credit Facility
—
On July 1, 2015, the Company amended its credit facility to increase its overall borrowing capacity. The amended credit facility was increased to
$1.2 billion
, consisting of (i) a
$900.0 million
revolving credit agreement and (ii) a
$300.0 million
term loan. In connection with the amendment, the Company borrowed $300.0 million under the term loan and approximately $360.0 million under the revolving credit agreement. The proceeds from the amendment were used to repay all borrowings under the credit facility prior to the amendment and pay related transaction fees and expenses associated with amending the credit facility.
We are subject to a number of customary covenants under our credit facility, including limitations on additional borrowings, acquisitions, loans to franchisees, lease commitments, stock repurchases, dividend payments and requirements to maintain certain financial ratios. We were in compliance with all covenants as of
September 27, 2015
.
At
September 27, 2015
, we had
$300.0 million
outstanding under the term loan, borrowings under the revolving credit agreement of
$395.0 million
and letters of credit outstanding of
$25.2 million
. For additional information related to our credit facility, refer to Note 7,
Indebtedness
, of the notes to the consolidated financial statements.
Interest Rate Swaps
— To reduce our exposure to rising interest rates under our credit facility, we consider interest rate swaps. In
August 2010
, we entered into two forward-looking swaps that effectively converted
$100.0 million
of our variable rate term loan to a fixed-rate basis beginning
September 2011
through
September 2014
. In April 2014, we entered into nine forward-starting interest rate swap agreements that effectively convert $300.0 million of our variable rate borrowings to a fixed rate basis from October 2014 through October 2018. In June 2015, we entered into eleven forward-starting interest rate swap agreements that effectively convert an additional $200.0 million of our variable rate borrowings and future expected variable rate borrowings to a fixed rate from October 2015 through October 2018, and $500.0 million from October 2018 through October 2022. For additional information, refer to Note 6,
Derivative Instruments
, of the notes to the consolidated financial statements and Item 7A,
Quantitative and Qualitative Disclosures about Market Risk
, of this Report.
Repurchases of Common Stock
—
During fiscal 2015, we repurchased
3.7 million
shares at an aggregate cost of
$317.1 million
, compared with 5.6 million shares at an aggregate cost of $319.7 million in fiscal 2014, and 4.0 million shares at an aggregate cost
32
of $140.1 million in fiscal 2013. As of
September 27, 2015
, there was approximately $25,500 remaining under a stock buyback program which expires in November 2016, and an additional
$200.0 million
remaining under a stock buyback program commencing in fiscal 2016 and expiring in November 2017.
Repurchases of common stock included in our consolidated statements of cash flows for 2015 and 2014 include $3.1 million and $7.3 million, respectively, related to repurchase transactions traded in the prior fiscal year and settled in the subsequent year. For additional information, refer to Note 13,
Stockholders’ Equity
, of the notes to the consolidated financial statements and Item 5,
Market for Registrant’s Common Equity, Related Stockholder Matters and Issuer Purchases of Equity Securities,
of this Report.
Dividends
—
The Company did not pay any cash dividends on its common stock during 2013. On May 9, 2014, the Board of Directors approved the initiation of a regular quarterly cash dividend. Two quarterly cash dividend payments of $0.20 per share each were declared totaling $15.9 million in fiscal 2014. In fiscal 2015, the Board of Directors declared two cash dividends of
$0.20
per share each, and two cash dividends of
$0.30
per share each, totaling
$37.6 million
. Future dividends are subject to approval by our Board of Directors.
Off-Balance Sheet Arrangements
We are not a party to any off-balance sheet arrangements that have, or are reasonably likely to have, a current or future material effect on our financial condition, changes in financial condition, results of operations, liquidity, capital expenditures or capital resources.
Contractual Obligations and Commitments
The following is a summary of our contractual obligations and commercial commitments as of
September 27, 2015
(
in thousands
):
|
|
Payments Due by Fiscal Year
|
|||||||||||||||||||
|
Total
|
Less than
1 year
|
1-3 years
|
3-5 years
|
After 5 years
|
||||||||||||||||
|
Contractual Obligations:
|
||||||||||||||||||||
|
Credit facility term loan (1)
|
$
|
319,223
|
|
$
|
30,539
|
|
$
|
60,743
|
|
$
|
227,941
|
|
$
|
—
|
|
|||||
|
Revolving credit agreement (1)
|
413,860
|
|
9,620
|
|
15,392
|
|
388,848
|
|
—
|
|
||||||||||
|
Capital lease obligations
|
22,934
|
|
4,040
|
|
5,873
|
|
5,169
|
|
7,852
|
|
||||||||||
|
Operating lease obligations
|
1,498,290
|
|
246,636
|
|
388,762
|
|
310,034
|
|
552,858
|
|
||||||||||
|
Purchase commitments (2)
|
2,412,500
|
|
802,700
|
|
815,100
|
|
406,500
|
|
388,200
|
|
||||||||||
|
Benefit obligations (3)
|
67,378
|
|
8,463
|
|
11,836
|
|
12,890
|
|
34,189
|
|
||||||||||
|
Total contractual obligations
|
$
|
4,734,185
|
|
$
|
1,101,998
|
|
$
|
1,297,706
|
|
$
|
1,351,382
|
|
$
|
983,099
|
|
|||||
|
Other Commercial Commitments:
|
||||||||||||||||||||
|
Stand-by letters of credit (4)
|
$
|
25,200
|
|
$
|
25,200
|
|
$
|
—
|
|
$
|
—
|
|
$
|
—
|
|
|||||
____________________________
|
(1)
|
Includes interest expense estimated at interest rates in effect on
September 27, 2015
.
|
|
(2)
|
Includes purchase commitments for food, beverage, and packaging items to support system-wide restaurant operations.
|
|
(3)
|
Includes expected payments associated with our non-qualified defined benefit plan, postretirement benefit plans and our non-qualified deferred compensation plan through fiscal 2025.
|
|
(4)
|
Consists primarily of letters of credit for workers’ compensation and general liability insurance.
|
We maintain a noncontributory defined benefit pension plan (“Qualified Plan”) covering substantially all full-time employees hired before
January 1, 2011
. Our policy is to fund our Qualified Plan at amounts necessary to satisfy the minimum amount required by law, plus additional amounts as determined by management to improve the plan’s funded status. Contributions beyond fiscal
2015
will depend on pension asset performance, future interest rates, future tax law changes, and future changes in regulatory funding requirements. Based on the funding status of our Qualified Plan as of our last measurement date, there was no minimum contribution required. For additional information related to our pension plans, refer to Note 11,
Retirement Plans
, of the notes to the consolidated financial statements.
33
DISCUSSION OF CRITICAL ACCOUNTING ESTIMATES
We have identified the following as our most critical accounting estimates, which are those that are most important to the portrayal of the Company’s financial condition and results, and that require management’s most subjective and complex judgments. Information regarding our other significant accounting estimates and policies are disclosed in Note 1,
Nature of Operations and Summary of Significant Accounting Policies
, of the notes to the consolidated financial statements.
Long-lived Assets
— Property, equipment and certain other assets, including amortized intangible assets, are reviewed for impairment on an annual basis or whenever events or changes in circumstances indicate that their carrying value may not be recoverable. This review generally includes a restaurant-level analysis, except when we are actively selling a group of restaurants, in which case we perform our impairment evaluations at the group level. Impairment evaluations for individual restaurants take into consideration a restaurant’s operating cash flows, the period of time since a restaurant has been opened or remodeled, refranchising expectations, and the maturity of the related market. Impairment evaluations for a group of restaurants take into consideration the group’s expected future cash flows and sales proceeds from bids received, if any, or fair market value based on, among other considerations, the specific sales and cash flows of those restaurants. If the assets of a restaurant or group of restaurants subject to our impairment evaluation are not recoverable based upon the forecasted, undiscounted cash flows, we recognize an impairment loss as the amount by which the carrying value of the assets exceeds fair value. Our estimates of cash flows used to assess impairment are subject to a high degree of judgment and may differ from actual cash flows due to, among other things, economic conditions or changes in operating performance. During fiscal year
2015
, we recorded impairment charges totaling
$0.4 million
to write down one underperforming Jack in the Box restaurant to its estimated fair value.
Retirement Benefits
— Our defined benefit and other postretirement plans’ costs and liabilities are determined using several statistical and other actuarial factors, which attempt to anticipate future events, including assumptions about discount rates, expected return on plan assets, health care cost trend rates and mortality rates. The assumed discount rate and expected return on plan assets are the assumptions that generally have the most significant impact on our benefit costs and retirement obligations.
Our discount rate is set annually by us, with assistance from our actuaries, and is determined by considering the average of pension yield curves constructed of a population of high-quality bonds with a Moody’s or Standard and Poor’s rating of “AA” or better meeting certain other criteria. As of
September 27, 2015
, our discount rates were
4.79%
for our Qualified Plan,
4.45%
for our non-qualified defined benefit plan, and
4.47%
for our postretirement health plans.
Our expected long-term rate of return on assets is determined taking into consideration our projected asset allocation and economic forecasts prepared with the assistance of our actuarial consultants. As of
September 27, 2015
, our assumed expected long-term rate of return was 6.50% for our Qualified Plan.
The actuarial assumptions used may differ materially from actual results due to changing market and economic conditions, higher or lower turnover and retirement rates or longer or shorter life spans of participants. These differences may affect the amount of pension expense we record. A hypothetical 25 basis point reduction in the assumed discount rate and expected long-term rate of return on plan assets would have resulted in an estimated increase of
$2.4 million
and
$0.9 million
, respectively, in our fiscal
2015
pension and postretirement expense.
In 2015, we began using the RP-2014 mortality tables and the MP-2014 mortality improvement scale in the estimation of our benefit obligation for our defined benefit pension and postretirement health plans as they reflect improved life expectancies and an expectation that the trend will continue. This change most significantly impacted our defined benefit pension plans and resulted in an increase in the combined projected benefit obligation of $35.6 million from September 28, 2014 to September 27, 2015.
We expect our pension and postretirement expense to decrease $5.3 million in fiscal 2016 principally due to the sunsetting of our Qualified Plan on December 31, 2015, at which time participants will no longer accrue benefits, resulting in a reduction of the service cost component of our expense and a change in the amortization period for actuarial gains and losses from the average remaining service period of plan participants to the average future lifetime of all participants. An increase in our discount rate also contributed to the expected decrease in our pension and postretirement expense.
Self-Insurance
— We are self-insured for a portion of our losses related to workers’ compensation, general liability and other legal claims and health benefits. In estimating our self-insurance accruals, we utilize independent actuarial estimates of expected losses, which are based on statistical analysis of historical data. These assumptions are closely monitored and adjusted when warranted by changing circumstances. Should a greater amount of claims occur compared to what was estimated, or should medical costs increase beyond what was expected, accruals might not be sufficient, and additional expense may be recorded.
34
Restaurant Closing Costs
— Restaurant closing costs consist of future lease commitments, net of anticipated sublease rentals and expected ancillary costs. We record a liability for the net present value of any remaining lease obligations, net of estimated sublease income, at the date we cease using a property. Subsequent adjustments to the liability as a result of changes in estimates of sublease income or lease cancellations are recorded in the period incurred. The estimates we make related to sublease income are subject to a high degree of judgment and may differ from actual sublease income due to changes in economic conditions, desirability of the sites and other factors. During fiscal year 2015, we recorded charges of $2.7 million related to revised sublease assumptions and adjustments for lease terminations.
Share-based Compensation —
We offer share-based compensation plans to attract, retain and incentivize key officers, non-employee directors and employees to work toward the financial success of the Company. Share-based compensation cost for our stock option grants is estimated at the grant date based on the award’s fair-value as calculated by an option pricing model and is recognized as expense ratably over the requisite service period. The option pricing models require various highly judgmental assumptions including volatility and expected option life. If any of the assumptions used in the model change significantly, share-based compensation expense may differ materially in the future from that recorded in the current period.
Goodwill and Other Intangibles
— We evaluate goodwill and non-amortizing intangible assets annually, or more frequently if indicators of impairment are present. Our impairment analyses first include a qualitative assessment to determine whether events or circumstances indicate the carrying amount may not be recoverable. If this assessment results in a less-than 50% likelihood that impairment exists, then further analysis is not required. If the results of these analyses indicate otherwise, then we compare the fair value of the reporting unit for goodwill and the fair value of the intangible asset to their respective carrying values. If the determined fair values of the respective assets are less than the related carrying amounts, an impairment loss is recognized. The methods we use to estimate fair value include future cash flow assumptions, which may differ from actual cash flows due to, among other things, economic conditions or changes in operating performance. We performed our annual assessment of impairment over all of our goodwill and other intangibles assets during the fourth quarter of 2015, and qualitatively determined that no impairment existed as of
September 27, 2015
. As of the impairment testing date, the fair value of our reporting units significantly exceeded their carrying values.
Legal Accruals —
The Company is subject to claims and lawsuits in the ordinary course of its business. A determination of the amount accrued, if any, for these contingencies is made after analysis of each matter. We continually evaluate such accruals and may increase or decrease accrued amounts as we deem appropriate. Because lawsuits are inherently unpredictable, and unfavorable resolutions could occur, assessing contingencies is highly subjective and requires judgment about future events. As a result, the amount of ultimate loss may differ from those estimates.
Income Taxes —
We estimate certain components of our provision for income taxes. These estimates include, among other items, depreciation and amortization expense allowable for tax purposes, allowable tax credits, effective rates for state and local income taxes, and the tax deductibility of certain other items. We adjust our effective income tax rate as additional information on outcomes or events becomes available. Our estimates are based on the best available information at the time that we prepare the income tax provision. We generally file our annual income tax returns several months after our fiscal year-end. Income tax returns are subject to audit by federal, state and local governments, generally years after the returns are filed. These returns could be subject to material adjustments or differing interpretations of the tax laws.
NEW ACCOUNTING PRONOUNCEMENTS
See Note 1,
Nature of Operations and Summary of Significant Accounting Policies
, of the notes to the consolidated financial statements for a discussion of the impact of new accounting pronouncements on our consolidated financial statements.
|
ITEM 7A.
|
QUANTITATIVE AND QUALITATIVE DISCLOSURES ABOUT MARKET RISK
|
Our primary exposure to risks relating to financial instruments is changes in interest rates. Our credit facility is comprised of a revolving credit facility and a term loan, bearing interest at an annual rate equal to the prime rate or LIBOR plus an applicable margin based on a financial leverage ratio. As of
September 27, 2015
, the applicable margin for the LIBOR-based revolving loans and term loan was set at
1.75%
.
We use interest rate swap agreements to reduce exposure to interest rate fluctuations. In April 2014, we entered into nine forward-starting interest rate swap agreements that effectively convert $300.0 million of our variable rate borrowings to a fixed rate basis from October 2014 through October 2018. In June 2015, we entered into eleven forward-starting interest rate swap agreements that effectively convert an additional $200.0 million of our variable rate borrowings to a fixed rate from October 2015 through October 2018, and $500.0 million from October 2018 through October 2022. Based on the applicable margin in effect as of
September 27, 2015
, these twenty interest rate swaps would yield average fixed rates of 2.60%, 2.93%, 3.65%, 4.16%, 4.37%,
35
4.64%, 4.82% and 4.92% in years one through eight, respectively. For additional information related to our interest rate swaps, refer to Note 6,
Derivative
Instruments
, of the notes to the consolidated financial statements.
A hypothetical 100 basis point increase in short-term interest rates, based on the outstanding unhedged balance of our revolving credit facility and term loan at
September 27, 2015
, would result in an estimated increase of
$2.0 million
in annual interest expense.
We are also exposed to the impact of commodity and utility price fluctuations. Many of the ingredients we use are commodities or ingredients that are affected by the price of other commodities, weather, seasonality, production, availability and various other factors outside our control. In order to minimize the impact of fluctuations in price and availability, we monitor the primary commodities we purchase and may enter into purchasing contracts and pricing arrangements when considered to be advantageous. However, certain commodities remain subject to price fluctuations. We are exposed to the impact of utility price fluctuations related to unpredictable factors such as weather and various other market conditions outside our control. Our ability to recover increased costs for commodities and utilities through higher prices is limited by the competitive environment in which we operate. From time to time, we enter into futures and option contracts to manage these fluctuations. At
September 27, 2015
, we had no such contracts in place.
|
ITEM 8.
|
FINANCIAL STATEMENTS AND SUPPLEMENTARY DATA
|
The consolidated financial statements, related financial information, and the Report of Independent Registered Public Accounting Firm required to be filed are indexed on page F-1 and are incorporated herein.
|
ITEM 9.
|
CHANGES IN AND DISAGREEMENTS WITH ACCOUNTANTS ON ACCOUNTING AND FINANCIAL DISCLOSURE
|
None.
|
ITEM 9A.
|
CONTROLS AND PROCEDURES
|
Conclusion Regarding the Effectiveness of Disclosure Controls and Procedures
Based on an evaluation of the Company’s disclosure controls and procedures (as defined in Rule 13(a)-15(e) of the Securities Exchange Act of 1934, as amended), as of the end of the Company’s fiscal year ended
September 27, 2015
, the Company’s Chief Executive Officer and Chief Financial Officer (its principal executive officer and principal financial officer, respectively) have concluded that the Company’s disclosure controls and procedures were effective.
Changes in Internal Control Over Financial Reporting
There have been no significant changes in the Company’s internal control over financial reporting that occurred during the Company’s fiscal quarter ended
September 27, 2015
that have materially affected, or are reasonably likely to materially affect, the Company’s internal control over financial reporting.
Management’s Report on Internal Control Over Financial Reporting
Management, including our principal executive officer and principal financial officer, is responsible for establishing and maintaining adequate internal control over financial reporting (as defined in Rule 13a-15(f) under the Exchange Act). The Company’s internal control over financial reporting is designed to provide reasonable assurance to the Company’s management and Board of Directors regarding the preparation and fair presentation of published financial statements.
Because of its inherent limitations, internal control over financial reporting may not prevent or detect misstatements. Therefore, even those systems determined to be effective can provide only reasonable assurance with respect to financial statement preparation and presentation.
Management assessed the effectiveness of the Company’s internal control over financial reporting as of
September 27, 2015
. In making this assessment, our management used the criteria set forth in 1992 by the Committee of Sponsoring Organizations of the Treadway Commission (“COSO”) in Internal Control-Integrated Framework. Management has concluded that, as of
September 27, 2015
, the Company’s internal control over financial reporting was effective, at a reasonable assurance level, based on these criteria.
The Company’s independent registered public accounting firm, KPMG LLP, has issued an audit report on the effectiveness of our internal control over financial reporting, which follows.
36
Report of Independent Registered Public Accounting Firm
The Board of Directors and Stockholders
Jack in the Box Inc.:
We have audited the internal control over financial reporting of Jack in the Box Inc. (the Company) as of
September 27, 2015
, based on criteria established in
Internal Control — Integrated Framework (1992),
issued by the Committee of Sponsoring Organizations of the Treadway Commission (“COSO”). The Company’s management is responsible for maintaining effective internal control over financial reporting and for its assessment of the effectiveness of internal control over financial reporting, included in the accompanying Management’s Report on Internal Control Over Financial Reporting. Our responsibility is to express an opinion on the Company’s internal control over financial reporting based on our audit.
We conducted our audit in accordance with the standards of the Public Company Accounting Oversight Board (United States). Those standards require that we plan and perform the audit to obtain reasonable assurance about whether effective internal control over financial reporting was maintained in all material respects. Our audit included obtaining an understanding of internal control over financial reporting, assessing the risk that a material weakness exists, and testing and evaluating the design and operating effectiveness of internal control based on the assessed risk. Our audit also included performing such other procedures as we considered necessary in the circumstances. We believe that our audit provides a reasonable basis for our opinion.
A company’s internal control over financial reporting is a process designed to provide reasonable assurance regarding the reliability of financial reporting and the preparation of financial statements for external purposes in accordance with generally accepted accounting principles. A company’s internal control over financial reporting includes those policies and procedures that (1) pertain to the maintenance of records that, in reasonable detail, accurately and fairly reflect the transactions and dispositions of the assets of the company; (2) provide reasonable assurance that transactions are recorded as necessary to permit preparation of financial statements in accordance with generally accepted accounting principles, and that receipts and expenditures of the company are being made only in accordance with authorizations of management and directors of the company; and (3) provide reasonable assurance regarding prevention or timely detection of unauthorized acquisition, use, or disposition of the company’s assets that could have a material effect on the financial statements.
Because of its inherent limitations, internal control over financial reporting may not prevent or detect misstatements. Also, projections of any evaluation of effectiveness to future periods are subject to the risk that controls may become inadequate because of changes in conditions, or that the degree of compliance with the policies or procedures may deteriorate.
In our opinion, the Company maintained, in all material respects, effective internal control over financial reporting as of
September 27, 2015
, based on criteria established in
Internal Control — Integrated Framework (1992)
issued by COSO.
We also have audited, in accordance with the standards of the Public Company Accounting Oversight Board (United States), the consolidated balance sheets of Jack in the Box Inc. and subsidiaries as of
September 27, 2015
and
September 28, 2014
, and the related consolidated statements of earnings, comprehensive income, cash flows, and stockholders’ equity for the
fifty-two
weeks ended
September 27, 2015
,
September 28, 2014
, and
September 29, 2013
, and our report dated
November 19, 2015
, expressed an unqualified opinion on those consolidated financial statements.
/s/ KPMG LLP
San Diego, California
November 19, 2015
37
|
ITEM 9B.
|
OTHER INFORMATION
|
None.
|
ITEM 10.
|
DIRECTORS, EXECUTIVE OFFICERS AND CORPORATE GOVERNANCE
|
That portion of our definitive Proxy Statement appearing under the captions “Election of Directors,” “Directors Qualifications and Biographical Information,” “Committees of the Board” and “Section 16(a) Beneficial Ownership Reporting Compliance” to be filed with the Commission pursuant to Regulation 14A within 120 days after
September 27, 2015
and to be used in connection with our
2016
Annual Meeting of Stockholders is hereby incorporated by reference.
Information regarding our executive officers is set forth in Item 1 of Part I of this Report under the caption “Executive Officers.”
That portion of our definitive Proxy Statement appearing under the caption “Committees of the Board - Audit Committee,” relating to the members of the Company’s Audit Committee and the members of the Audit Committee who qualify as financial experts, is also incorporated herein by reference.
That portion of our definitive Proxy Statement appearing under the caption “Stockholder Proposals for the 2016 Annual Meeting,” relating to the procedures by which stockholders may recommend candidates for director to the Nominating and Governance Committee of the Board of Directors, is also incorporated herein by reference.
We have adopted a Code of Ethics, which applies to all Jack in the Box Inc. directors, officers and employees, including the Chief Executive Officer, Chief Financial Officer, Controller and all of the financial team. The Code of Ethics is posted on the Company’s website, www.jackinthebox.com (under the “Investors — Corporate Governance — Code of Conduct” caption) and in print free of charge to any stockholder upon request. We intend to satisfy the disclosure requirement regarding any amendment to, or waiver of, a provision of the Code of Ethics for the Chief Executive Officer, Chief Financial Officer and Controller or persons performing similar functions, by posting such information on our website. No such waivers have been issued during fiscal
2015
.
We have also adopted a set of Corporate Governance Principles and Practices for our Board of Directors and charters for all of our Board Committees, including the Audit, Compensation, and Nominating and Governance Committees. The Corporate Governance Principles and Practices and committee charters are available on our website at www.jackinthebox.com and in print free of charge to any shareholder who requests them. Written requests for our Code of Business Conduct and Ethics, Corporate Governance Principles and Practices and committee charters should be addressed to Jack in the Box Inc., 9330 Balboa Avenue, San Diego, California 92123, Attention: Corporate Secretary.
|
ITEM 11.
|
EXECUTIVE COMPENSATION
|
That portion of our definitive Proxy Statement appearing under the caption “Executive Compensation,” “Compensation Tables,” “Director Compensation,” “Compensation Committee Interlocks and Insider Participation” and “Compensation Committee Report” to be filed with the Commission pursuant to Regulation 14A within 120 days after
September 27, 2015
and to be used in connection with our
2016
Annual Meeting of Stockholders is hereby incorporated by reference.
|
ITEM 12.
|
SECURITY OWNERSHIP OF CERTAIN BENEFICIAL OWNERS AND MANAGEMENT AND RELATED STOCKHOLDER MATTERS
|
That portion of our definitive Proxy Statement appearing under the caption “Security Ownership of Certain Beneficial Owners and Management” to be filed with the Commission pursuant to Regulation 14A within 120 days after
September 27, 2015
and to be used in connection with our
2016
Annual Meeting of Stockholders is hereby incorporated by reference. Information regarding equity compensation plans under which Company common stock may be issued as of
September 27, 2015
is set forth in Item 5 of this Report.
38
|
ITEM 13.
|
CERTAIN RELATIONSHIPS AND RELATED TRANSACTIONS, AND DIRECTOR INDEPENDENCE
|
That portion of our definitive Proxy Statement appearing under the caption “Certain Relationships and Related Transactions” and “Director Independence,” if any, to be filed with the Commission pursuant to Regulation 14A within 120 days after
September 27, 2015
and to be used in connection with our
2016
Annual Meeting of Stockholders is hereby incorporated by reference.
|
ITEM 14.
|
PRINCIPAL ACCOUNTING FEES AND SERVICES
|
That portion of our definitive Proxy Statement appearing under the caption “Independent Registered Public Accounting Fees and Services” to be filed with the Commission pursuant to Regulation 14A within 120 days after
September 27, 2015
and to be used in connection with our
2016
Annual Meeting of Stockholders is hereby incorporated by reference.
|
ITEM 15.
|
EXHIBITS, FINANCIAL STATEMENT SCHEDULES
|
|
|
Financial Statements
. See Index to Consolidated Financial Statements on page F-1 of this Report.
|
|
|
Financial Statement Schedules
. None.
|
|
Number
|
|
Description
|
|
Form
|
|
Filed with SEC
|
|
3.1
|
|
Restated Certificate of Incorporation, as amended, dated September 21, 2007
|
|
10-K
|
|
11/20/2009
|
|
3.1.1
|
|
Certificate of Amendment of Restated Certificate of Incorporation dated September 21, 2007
|
|
8-K
|
|
9/24/2007
|
|
3.2
|
|
Amended and Restated Bylaws dated August 7, 2013
|
|
10-Q
|
|
8/8/2013
|
|
10.1.1
|
Credit Agreement dated as of June 29, 2010 by and among Jack in the Box Inc. and the lenders named therein
|
8-K
|
7/1/2010
|
|||
|
10.1.2
|
Collateral Agreement dated as of June 29, 2010 by and among Jack in the Box Inc. and the lenders named therein
|
8-K
|
7/1/2010
|
|||
|
10.1.3
|
Guaranty Agreement dated as of June 29, 2010 by and among Jack in the Box Inc. and the lenders named therein
|
8-K
|
7/1/2010
|
|||
|
10.1.4
|
|
First Amendment to the Credit Agreement dated as of February 16, 2012 by and among Jack in the Box Inc. and the lenders named therein
|
|
10-Q
|
|
2/23/2012
|
|
10.1.7
|
Second Amended and Restated Credit Agreement dated as of March 19, 2014, among Jack in the Box Inc., Wells Fargo Bank, National Association, as administrative agent, and the other lender and agent parties thereto
|
8-K
|
3/20/2014
|
|||
|
10.1.8
|
Amended and Restated Guaranty Agreement dated as of March 19, 2014, among Jack in the Box Inc., Wells Fargo Bank, National Association, as administrative agent, and the subsidiaries of Jack in the Box Inc. party thereto
|
8-K
|
3/20/2014
|
|||
|
10.1.9
|
Amended and Restated Collateral Agreement dated as of March 19, 2014, among Jack in the Box Inc., Wells Fargo Bank, National Association, as administrative agent, and the subsidiaries of Jack in the Box Inc. party thereto
|
8-K
|
3/20/2014
|
|||
39
|
Number
|
|
Description
|
|
Form
|
|
Filed with SEC
|
|
10.1.10
|
Waiver, Joinder and Second Amendment, dated as of July 1, 2015, among Jack in the Box Inc., the Guarantors party thereto, Wells Fargo Bank, National Association, as administrative agent, and the lenders party thereto.
|
8-K
|
7/7/2015
|
|||
|
10.2*
|
|
Form of Compensation and Benefits Assurance Agreement for Executives
|
|
10-Q
|
|
2/20/2008
|
|
10.2.1*
|
|
Form of Revised Compensation and Benefits Assurance Agreement for certain officers
|
|
10-Q
|
|
5/17/2012
|
|
10.2.2*
|
Form of Revised Compensation and Benefits Assurance Agreement for certain officers, dated May 8, 2014
|
10-K
|
11/20/2014
|
|||
|
10.3*
|
|
Amended and Restated Supplemental Executive Retirement Plan
|
|
10-Q
|
|
2/18/2009
|
|
10.3.1 *
|
First Amendment to Jack in the Box Inc. Supplemental Executive Retirement Plan, As Amended and Restated Effective January 1, 2009
|
8-K
|
9/22/2015
|
|||
|
10.4*
|
|
Amended and Restated Executive Deferred Compensation Plan
|
|
10-Q
|
|
2/18/2009
|
|
10.4.1 *
|
Jack in the Box Inc. Executive Deferred Compensation Plan, As Amended and Restated Effective January 1, 2016
|
8-K
|
9/22/2015
|
|||
|
10.5*
|
|
Amended and Restated Deferred Compensation Plan for Non-Management Directors
|
|
10-K
|
|
11/22/2006
|
|
10.6*
|
Amended and Restated Non-Employee Director Stock Option Plan Dated September 17, 1999
|
10-K
|
2/2/1999
|
|||
|
10.8*
|
|
Amended and Restated 2004 Stock Incentive Plan
|
|
DEF 14A
|
|
1/12/2012
|
|
10.8.1*
|
|
Form of Restricted Stock Award for officers and certain members of management under the 2004 Stock Incentive Plan
|
|
10-Q
|
|
8/5/2009
|
|
10.8.3*
|
|
Jack in the Box Inc. Non-Employee Director Stock Option Award Agreement under the 2004 Stock Incentive Plan
|
|
8-K
|
|
11/15/2005
|
|
10.8.4*
|
|
Form of Restricted Stock Unit Award Agreement for Non-Employee Director under the 2004 Stock Incentive Plan
|
|
10-K
|
|
11/20/2009
|
|
10.8.5*
|
|
Form of Time-Vested Restricted Stock Unit Award Agreement under the 2004 Stock Incentive Plan
|
|
10-K
|
|
11/24/2010
|
|
10.8.6*
|
Form of Restricted Stock Unit Grant Agreement for Non-Employee Directors under the 2004 Stock Incentive Plan
|
10-Q
|
5/14/2015
|
|||
|
10.8.7*
|
|
Form of Stock Option and Performance Unit Awards Agreement under the 2004 Stock Incentive Plan
|
|
10-K
|
|
11/20/2009
|
|
10.8.8*
|
|
Form of Stock Option and Performance Share Awards Agreement under the 2004 Stock Incentive Plan
|
|
10-Q
|
|
2/23/2012
|
|
10.8.9*
|
Form of Stock Option and Performance Share Awards Agreement under the 2004 Stock Incentive Plan
|
10-K
|
11/22/2013
|
|||
|
10.8.10*
|
Form of Time-Vested Restricted Stock Unit Award Agreement under the 2004 Stock Incentive Plan
|
10-K
|
11/22/2013
|
|||
|
10.8.11*
|
Form of Time-Vesting Restricted Stock Unit Award Agreement under the 2004 Stock Incentive Plan
|
10-Q
|
2/18/2015
|
|||
|
10.8.12*
|
Form of Stock Option and Performance Share Award Agreement under the 2004 Stock Incentive Plan
|
10-Q
|
2/18/2015
|
|||
40
|
Number
|
|
Description
|
|
Form
|
|
Filed with SEC
|
|
10.10.1*
|
|
Amended and Restated Performance Bonus Incentive Plan effective October 4, 2010
|
|
DEF 14A
|
|
1/13/2011
|
|
10.11*
|
|
Form of Amended and Restated Indemnification Agreement between the registrant and individual directors, officers and key employees
|
|
10-Q
|
|
8/10/2012
|
|
23.1
|
|
Consent of Independent Registered Public Accounting Firm
|
|
_____
|
|
Filed herewith
|
|
31.1
|
|
Certification of Chief Executive Officer pursuant to Section 302 of the Sarbanes-Oxley Act of 2002
|
|
_____
|
|
Filed herewith
|
|
31.2
|
|
Certification of Chief Financial Officer pursuant to Section 302 of the Sarbanes-Oxley Act of 2002
|
|
_____
|
|
Filed herewith
|
|
32.1
|
|
Certification of Chief Executive Officer pursuant to 18 U.S.C. Section 1350, as adopted pursuant to Section 906 of the Sarbanes-Oxley Act of 2002
|
|
_____
|
|
Filed herewith
|
|
32.2
|
|
Certification of Chief Financial Officer pursuant to 18 U.S.C. Section 1350, as adopted pursuant to Section 906 of the Sarbanes-Oxley Act of 2002
|
|
_____
|
|
Filed herewith
|
|
101.INS
|
|
XBRL Instance Document
|
|
|
||
|
101.SCH
|
|
XBRL Taxonomy Extension Schema Document
|
|
|
||
|
101.CAL
|
|
XBRL Taxonomy Extension Calculation Linkbase Document
|
|
|
||
|
101.DEF
|
|
XBRL Taxonomy Extension Definition Linkbase Document
|
|
|
||
|
101.LAB
|
|
XBRL Taxonomy Extension Label Linkbase Document
|
|
|
||
|
101.PRE
|
|
XBRL Taxonomy Extension Presentation Linkbase Document
|
|
|
||
* Management contract or compensatory plan.
ITEM 15(c) All schedules have been omitted as the required information is inapplicable, immaterial or the information is presented in the consolidated financial statements or related notes.
41
SIGNATURES
Pursuant to the requirements of Section 13 or 15(d) of the Securities Exchange Act of 1934, the registrant has duly caused this report to be signed on its behalf by the undersigned, thereunto duly authorized.
|
JACK IN THE BOX INC.
|
||
|
By:
|
/s/ JERRY P. REBEL
|
|
|
|
Jerry P. Rebel
Executive Vice President and Chief Financial Officer (principal financial officer)
(Duly Authorized Signatory)
|
|
|
November 19, 2015
|
||
Pursuant to the requirements of the Securities Exchange Act of 1934, this report has been signed below by the following persons on behalf of the registrant and in the capacities and on the dates indicated.
Each person whose signature appears below constitutes and appoints Leonard A. Comma and Jerry P. Rebel, jointly and severally, his attorneys-in-fact, each with the power of substitution, for him or her in any and all capacities, to sign any amendments to this report, and to file the same, with exhibits thereto and other documents in connection therewith with the Securities and Exchange Commission, hereby ratifying and confirming all that each of said attorneys-in-fact, or his substitute or substitutes may do or cause to be done by virtue hereof.
|
Signature
|
|
Title
|
|
Date
|
|
/s/ LEONARD A. COMMA
|
|
Chairman of the Board and Chief Executive Officer (principal executive officer)
|
|
November 19, 2015
|
|
Leonard A. Comma
|
||||
|
/s/ JERRY P. REBEL
|
|
Executive Vice President and Chief Financial Officer (principal financial officer and principal accounting officer)
|
|
November 19, 2015
|
|
Jerry P. Rebel
|
||||
|
/s/ DAVID L. GOEBEL
|
|
Director
|
|
November 19, 2015
|
|
David L. Goebel
|
||||
|
/s/ SHARON P. JOHN
|
|
Director
|
|
November 19, 2015
|
|
Sharon P. John
|
||||
|
/s/ MADELEINE A. KLEINER
|
|
Director
|
|
November 19, 2015
|
|
Madeleine A. Kleiner
|
||||
|
/s/ MICHAEL W. MURPHY
|
|
Director
|
|
November 19, 2015
|
|
Michael W. Murphy
|
||||
|
/s/ JAMES M. MYERS
|
|
Director
|
|
November 19, 2015
|
|
James M. Myers
|
||||
|
/s/ DAVID M. TEHLE
|
|
Director
|
|
November 19, 2015
|
|
David M. Tehle
|
||||
|
/s/ JOHN T. WYATT
|
Director
|
|
November 19, 2015
|
|
|
John T. Wyatt
|
|
|||
42
INDEX TO CONSOLIDATED FINANCIAL STATEMENTS
|
|
|
Page
|
|
Report of Independent Registered Public Accounting Firm
|
|
|
|
Consolidated Balance Sheets
|
|
|
|
Consolidated Statements of Earnings
|
|
|
|
Consolidated Statements of Comprehensive Income
|
||
|
Consolidated Statements of Cash Flows
|
|
|
|
Consolidated Statements of Stockholders’ Equity
|
|
|
|
Notes to Consolidated Financial Statements
|
|
|
Schedules not filed: All schedules have been omitted as the required information is inapplicable, immaterial or the information is presented in the consolidated financial statements or related notes.
F-1
Report of Independent Registered Public Accounting Firm
The Board of Directors and Stockholders
Jack in the Box Inc.:
We have audited the accompanying consolidated balance sheets of Jack in the Box Inc. and subsidiaries (the Company) as of
September 27, 2015
and
September 28, 2014
, and the related consolidated statements of earnings, comprehensive income, cash flows, and stockholders’ equity for the fifty-two weeks ended
September 27, 2015
,
September 28, 2014
, and
September 29, 2013
. These consolidated financial statements are the responsibility of the Company’s management. Our responsibility is to express an opinion on these consolidated financial statements based on our audits.
We conducted our audits in accordance with the standards of the Public Company Accounting Oversight Board (United States). Those standards require that we plan and perform the audit to obtain reasonable assurance about whether the financial statements are free of material misstatement. An audit includes examining, on a test basis, evidence supporting the amounts and disclosures in the financial statements. An audit also includes assessing the accounting principles used and significant estimates made by management, as well as evaluating the overall financial statement presentation. We believe that our audits provide a reasonable basis for our opinion.
In our opinion, the consolidated financial statements referred to above present fairly, in all material respects, the financial position of Jack in the Box Inc. and subsidiaries as of
September 27, 2015
and
September 28, 2014
, and the results of their operations and their cash flows for the
fifty-two
weeks ended
September 27, 2015
,
September 28, 2014
, and
September 29, 2013
, in conformity with U.S. generally accepted accounting principles.
We also have audited, in accordance with the standards of the Public Company Accounting Oversight Board (United States), the internal control over financial reporting of Jack in the Box Inc. as of
September 27, 2015
, based on criteria established in
Internal Control - Integrated Framework (1992)
issued by the Committee of Sponsoring Organizations of the Treadway Commission (COSO), and our report dated
November 19, 2015
, expressed an unqualified opinion on the effectiveness of the Company’s internal control over financial reporting.
/s/ KPMG LLP
San Diego, California
November 19, 2015
F-2
JACK IN THE BOX INC. AND SUBSIDIARIES
(Dollars in thousands, except per share data)
|
September 27,
2015 |
September 28,
2014 |
|||||||
|
ASSETS
|
||||||||
|
Current assets:
|
||||||||
|
Cash and cash equivalents
|
$
|
17,743
|
|
$
|
10,578
|
|
||
|
Accounts and other receivables, net
|
47,975
|
|
50,014
|
|
||||
|
Inventories
|
7,376
|
|
7,481
|
|
||||
|
Prepaid expenses
|
16,240
|
|
36,314
|
|
||||
|
Deferred income taxes
|
40,033
|
|
36,810
|
|
||||
|
Assets held for sale
|
15,516
|
|
4,766
|
|
||||
|
Other current assets
|
3,106
|
|
597
|
|
||||
|
Total current assets
|
147,989
|
|
146,560
|
|
||||
|
Property and equipment, at cost:
|
||||||||
|
Land
|
112,991
|
|
113,622
|
|
||||
|
Buildings
|
1,091,237
|
|
1,090,360
|
|
||||
|
Restaurant and other equipment
|
315,235
|
|
291,443
|
|
||||
|
Construction in progress
|
43,914
|
|
24,522
|
|
||||
|
1,563,377
|
|
1,519,947
|
|
|||||
|
Less accumulated depreciation and amortization
|
(835,114
|
)
|
(797,818
|
)
|
||||
|
Property and equipment, net
|
728,263
|
|
722,129
|
|
||||
|
Intangible assets, net
|
14,765
|
|
15,604
|
|
||||
|
Goodwill
|
149,027
|
|
149,074
|
|
||||
|
Other assets, net
|
263,935
|
|
237,298
|
|
||||
|
$
|
1,303,979
|
|
$
|
1,270,665
|
|
|||
|
LIABILITIES AND STOCKHOLDERS’ EQUITY
|
||||||||
|
Current liabilities:
|
||||||||
|
Current maturities of long-term debt
|
$
|
26,677
|
|
$
|
10,871
|
|
||
|
Accounts payable
|
32,137
|
|
31,810
|
|
||||
|
Accrued liabilities
|
170,575
|
|
163,626
|
|
||||
|
Total current liabilities
|
229,389
|
|
206,307
|
|
||||
|
Long-term debt, net of current maturities
|
688,579
|
|
497,012
|
|
||||
|
Other long-term liabilities
|
370,058
|
|
309,435
|
|
||||
|
Stockholders’ equity:
|
||||||||
|
Preferred stock $0.01 par value, 15,000,000 shares authorized, none issued
|
—
|
|
—
|
|
||||
|
Common stock $0.01 par value, 175,000,000 shares authorized, 81,096,156 and 80,127,387 issued, respectively
|
811
|
|
801
|
|
||||
|
Capital in excess of par value
|
402,986
|
|
356,727
|
|
||||
|
Retained earnings
|
1,316,119
|
|
1,244,897
|
|
||||
|
Accumulated other comprehensive loss
|
(132,530
|
)
|
(90,132
|
)
|
||||
|
Treasury stock, at cost, 45,314,529 and 41,571,752 shares, respectively
|
(1,571,433
|
)
|
(1,254,382
|
)
|
||||
|
Total stockholders’ equity
|
15,953
|
|
257,911
|
|
||||
|
$
|
1,303,979
|
|
$
|
1,270,665
|
|
|||
See accompanying notes to consolidated financial statements.
F-3
JACK IN THE BOX INC. AND SUBSIDIARIES
(In thousands, except per share data)
|
|
Fiscal Year
|
|||||||||||
|
|
2015
|
2014
|
2013
|
|||||||||
|
Revenues:
|
||||||||||||
|
Company restaurant sales
|
$
|
1,156,863
|
|
$
|
1,120,912
|
|
$
|
1,143,780
|
|
|||
|
Franchise rental revenues
|
226,702
|
|
217,182
|
|
207,513
|
|
||||||
|
Franchise royalties and other
|
156,752
|
|
146,037
|
|
138,574
|
|
||||||
|
1,540,317
|
|
1,484,131
|
|
1,489,867
|
|
|||||||
|
Operating costs and expenses, net:
|
||||||||||||
|
Company restaurant costs:
|
||||||||||||
|
Food and packaging
|
361,988
|
|
357,338
|
|
372,685
|
|
||||||
|
Payroll and employee benefits
|
313,302
|
|
308,494
|
|
320,384
|
|
||||||
|
Occupancy and other
|
246,023
|
|
247,861
|
|
255,586
|
|
||||||
|
Total company restaurant costs
|
921,313
|
|
913,693
|
|
948,655
|
|
||||||
|
Franchise occupancy expenses
|
170,102
|
|
169,034
|
|
161,049
|
|
||||||
|
Franchise support and other costs
|
15,688
|
|
13,852
|
|
12,518
|
|
||||||
|
Selling, general and administrative expenses
|
221,145
|
|
206,788
|
|
220,641
|
|
||||||
|
Impairment and other charges, net
|
11,757
|
|
14,908
|
|
13,439
|
|
||||||
|
Losses (gains) on the sale of company-operated restaurants
|
3,139
|
|
3,548
|
|
(4,640
|
)
|
||||||
|
1,343,144
|
|
1,321,823
|
|
1,351,662
|
|
|||||||
|
Earnings from operations
|
197,173
|
|
162,308
|
|
138,205
|
|
||||||
|
Interest expense, net
|
18,803
|
|
15,678
|
|
15,251
|
|
||||||
|
Earnings from continuing operations and before income taxes
|
178,370
|
|
146,630
|
|
122,954
|
|
||||||
|
Income taxes
|
65,769
|
|
51,786
|
|
40,346
|
|
||||||
|
Earnings from continuing operations
|
112,601
|
|
94,844
|
|
82,608
|
|
||||||
|
Losses from discontinued operations, net of income tax benefit
|
(3,789
|
)
|
(5,894
|
)
|
(31,456
|
)
|
||||||
|
Net earnings
|
$
|
108,812
|
|
$
|
88,950
|
|
$
|
51,152
|
|
|||
|
Net earnings per share — basic (1):
|
||||||||||||
|
Earnings from continuing operations
|
$
|
3.00
|
|
$
|
2.33
|
|
$
|
1.91
|
|
|||
|
Losses from discontinued operations
|
(0.10
|
)
|
(0.14
|
)
|
(0.73
|
)
|
||||||
|
Net earnings per share
|
$
|
2.89
|
|
$
|
2.18
|
|
$
|
1.18
|
|
|||
|
Net earnings per share — diluted (1):
|
||||||||||||
|
Earnings from continuing operations
|
$
|
2.95
|
|
$
|
2.26
|
|
$
|
1.84
|
|
|||
|
Losses from discontinued operations
|
(0.10
|
)
|
(0.14
|
)
|
(0.70
|
)
|
||||||
|
Net earnings per share
|
$
|
2.85
|
|
$
|
2.12
|
|
$
|
1.14
|
|
|||
|
Weighted-average shares outstanding:
|
||||||||||||
|
Basic
|
37,587
|
|
40,781
|
|
43,351
|
|
||||||
|
Diluted
|
38,215
|
|
41,973
|
|
44,899
|
|
||||||
|
Cash dividends declared per common share
|
$
|
1.00
|
|
$
|
0.40
|
|
$
|
—
|
|
|||
________________________
(1) Earnings per share may not add due to rounding.
See accompanying notes to consolidated financial statements.
F-4
JACK IN THE BOX INC. AND SUBSIDIARIES
CONSOLIDATED STATEMENTS OF COMPREHENSIVE INCOME
(In thousands)
|
Fiscal Year
|
||||||||||||
|
2015
|
2014
|
2013
|
||||||||||
|
Net earnings
|
$
|
108,812
|
|
$
|
88,950
|
|
$
|
51,152
|
|
|||
|
Cash flow hedges:
|
||||||||||||
|
Net change in fair value of derivatives
|
(26,596
|
)
|
(1,890
|
)
|
(110
|
)
|
||||||
|
Net loss reclassified to earnings
|
2,011
|
|
1,291
|
|
1,353
|
|
||||||
|
(24,585
|
)
|
(599
|
)
|
1,243
|
|
|||||||
|
Tax effect
|
9,517
|
|
229
|
|
(476
|
)
|
||||||
|
(15,068
|
)
|
(370
|
)
|
767
|
|
|||||||
|
Unrecognized periodic benefit costs:
|
||||||||||||
|
Actuarial (losses) gains arising during the period
|
(54,407
|
)
|
(49,173
|
)
|
98,764
|
|
||||||
|
Actuarial losses and prior service cost reclassified to earnings
|
9,863
|
|
5,245
|
|
18,895
|
|
||||||
|
(44,544
|
)
|
(43,928
|
)
|
117,659
|
|
|||||||
|
Tax effect
|
17,243
|
|
16,821
|
|
(45,079
|
)
|
||||||
|
(27,301
|
)
|
(27,107
|
)
|
72,580
|
|
|||||||
|
Other:
|
||||||||||||
|
Foreign currency translation adjustments
|
(45
|
)
|
10
|
|
8
|
|
||||||
|
Tax effect
|
16
|
|
(3
|
)
|
(4
|
)
|
||||||
|
(29
|
)
|
7
|
|
4
|
|
|||||||
|
Other comprehensive (loss) income, net of tax
|
(42,398
|
)
|
(27,470
|
)
|
73,351
|
|
||||||
|
Comprehensive income
|
$
|
66,414
|
|
$
|
61,480
|
|
$
|
124,503
|
|
|||
See accompanying notes to consolidated financial statements.
F-5
JACK IN THE BOX INC. AND SUBSIDIARIES
(In thousands)
|
|
Fiscal Year
|
|||||||||||
|
|
2015
|
2014
|
2013
|
|||||||||
|
Cash flows from operating activities:
|
||||||||||||
|
Net earnings
|
$
|
108,812
|
|
$
|
88,950
|
|
$
|
51,152
|
|
|||
|
Adjustments to reconcile net earnings to net cash provided by operating activities:
|
||||||||||||
|
Depreciation and amortization
|
89,468
|
|
91,384
|
|
96,219
|
|
||||||
|
Deferred finance cost amortization
|
2,309
|
|
2,175
|
|
2,277
|
|
||||||
|
Excess tax benefits from share-based compensation arrangements
|
(18,602
|
)
|
(17,664
|
)
|
(2,094
|
)
|
||||||
|
Deferred income taxes
|
(3,191
|
)
|
4,152
|
|
(18,604
|
)
|
||||||
|
Share-based compensation expense
|
12,420
|
|
10,358
|
|
11,392
|
|
||||||
|
Pension and postretirement expense
|
18,749
|
|
13,760
|
|
31,147
|
|
||||||
|
Losses (gains) on cash surrender value of company-owned life insurance
|
1,240
|
|
(6,049
|
)
|
(8,998
|
)
|
||||||
|
Losses (gains) on the sale of company-operated restaurants
|
3,139
|
|
3,548
|
|
(4,640
|
)
|
||||||
|
Losses on the disposition of property and equipment
|
1,847
|
|
1,680
|
|
789
|
|
||||||
|
Impairment charges and other
|
6,815
|
|
10,434
|
|
30,785
|
|
||||||
|
Loss on early retirement of debt
|
—
|
|
789
|
|
939
|
|
||||||
|
Changes in assets and liabilities, excluding acquisitions and dispositions:
|
||||||||||||
|
Accounts and other receivables
|
(82
|
)
|
19,589
|
|
33,994
|
|
||||||
|
Inventories
|
105
|
|
(300
|
)
|
27,415
|
|
||||||
|
Prepaid expenses and other current assets
|
35,255
|
|
14,051
|
|
15,211
|
|
||||||
|
Accounts payable
|
2,281
|
|
(627
|
)
|
(26,945
|
)
|
||||||
|
Accrued liabilities
|
798
|
|
7,140
|
|
(10,560
|
)
|
||||||
|
Pension and postretirement contributions
|
(25,374
|
)
|
(25,349
|
)
|
(23,886
|
)
|
||||||
|
Other
|
(9,114
|
)
|
(16,999
|
)
|
(6,721
|
)
|
||||||
|
Cash flows provided by operating activities
|
226,875
|
|
201,022
|
|
198,872
|
|
||||||
|
Cash flows from investing activities:
|
||||||||||||
|
Purchases of property and equipment
|
(86,226
|
)
|
(60,525
|
)
|
(84,690
|
)
|
||||||
|
Purchases of assets intended for sale and leaseback
|
(10,396
|
)
|
(2,801
|
)
|
(26,058
|
)
|
||||||
|
Proceeds from sale and leaseback of assets
|
—
|
|
5,698
|
|
47,431
|
|
||||||
|
Proceeds from the sale of company-operated restaurants
|
3,951
|
|
10,536
|
|
30,619
|
|
||||||
|
Collections on notes receivable
|
5,917
|
|
2,974
|
|
6,448
|
|
||||||
|
Acquisition of franchise-operated restaurants
|
—
|
|
(1,750
|
)
|
(12,064
|
)
|
||||||
|
Other
|
2,281
|
|
2,889
|
|
4,375
|
|
||||||
|
Cash flows used in investing activities
|
(84,473
|
)
|
(42,979
|
)
|
(33,939
|
)
|
||||||
|
Cash flows from financing activities:
|
||||||||||||
|
Borrowings on revolving credit facilities
|
857,000
|
|
652,000
|
|
646,000
|
|
||||||
|
Repayments of borrowings on revolving credit facilities
|
(768,000
|
)
|
(521,000
|
)
|
(721,000
|
)
|
||||||
|
Proceeds from issuance of debt
|
300,000
|
|
200,000
|
|
200,000
|
|
||||||
|
Principal repayments on debt
|
(198,397
|
)
|
(193,399
|
)
|
(175,946
|
)
|
||||||
|
Debt issuance costs
|
(2,030
|
)
|
(3,607
|
)
|
(4,392
|
)
|
||||||
|
Dividends paid on common stock
|
(37,390
|
)
|
(15,808
|
)
|
—
|
|
||||||
|
Proceeds from issuance of common stock
|
15,170
|
|
31,748
|
|
61,993
|
|
||||||
|
Repurchases of common stock
|
(320,163
|
)
|
(323,866
|
)
|
(132,833
|
)
|
||||||
|
Excess tax benefits from share-based compensation arrangements
|
18,602
|
|
17,664
|
|
2,094
|
|
||||||
|
Change in book overdraft
|
—
|
|
(848
|
)
|
(39,678
|
)
|
||||||
|
Cash flows used in financing activities
|
(135,208
|
)
|
(157,116
|
)
|
(163,762
|
)
|
||||||
|
Effect of exchange rate changes on cash and cash equivalents
|
(29
|
)
|
7
|
|
4
|
|
||||||
|
Net increase in cash and cash equivalents
|
7,165
|
|
934
|
|
1,175
|
|
||||||
|
Cash and cash equivalents at beginning of year
|
10,578
|
|
9,644
|
|
8,469
|
|
||||||
|
Cash and cash equivalents at end of year
|
$
|
17,743
|
|
$
|
10,578
|
|
$
|
9,644
|
|
|||
See accompanying notes to consolidated financial statements.
F-6
JACK IN THE BOX INC. AND SUBSIDIARIES
CONSOLIDATED STATEMENTS OF STOCKHOLDERS’ EQUITY
(Dollars in thousands)
|
Number
of Shares
|
Amount
|
Capital in
Excess of
Par Value
|
Retained
Earnings
|
Accumulated
Other
Comprehensive
Loss
|
Treasury
Stock
|
Total
|
|||||||||||||||||||||
|
Balance at September 30, 2012
|
75,827,894
|
|
$
|
758
|
|
$
|
221,100
|
|
$
|
1,120,671
|
|
$
|
(136,013
|
)
|
$
|
(794,571
|
)
|
$
|
411,945
|
|
|||||||
|
Shares issued under stock plans, including tax benefit
|
2,687,277
|
|
27
|
|
64,272
|
|
—
|
|
—
|
|
—
|
|
64,299
|
|
|||||||||||||
|
Share-based compensation
|
—
|
|
—
|
|
11,392
|
|
—
|
|
—
|
|
—
|
|
11,392
|
|
|||||||||||||
|
Purchases of treasury stock
|
—
|
|
—
|
|
—
|
|
—
|
|
—
|
|
(140,121
|
)
|
(140,121
|
)
|
|||||||||||||
|
Net earnings
|
—
|
|
—
|
|
—
|
|
51,152
|
|
—
|
|
—
|
|
51,152
|
|
|||||||||||||
|
Foreign currency translation adjustment
|
—
|
|
—
|
|
—
|
|
—
|
|
4
|
|
—
|
|
4
|
|
|||||||||||||
|
Effect of interest rate swaps, net
|
—
|
|
—
|
|
—
|
|
—
|
|
767
|
|
—
|
|
767
|
|
|||||||||||||
|
Effect of actuarial gains and prior service cost, net
|
—
|
|
—
|
|
—
|
|
—
|
|
72,580
|
|
—
|
|
72,580
|
|
|||||||||||||
|
Balance at September 29, 2013
|
78,515,171
|
|
785
|
|
296,764
|
|
1,171,823
|
|
(62,662
|
)
|
(934,692
|
)
|
472,018
|
|
|||||||||||||
|
Shares issued under stock plans, including tax benefit
|
1,612,216
|
|
16
|
|
49,605
|
|
—
|
|
—
|
|
—
|
|
49,621
|
|
|||||||||||||
|
Share-based compensation
|
—
|
|
—
|
|
10,358
|
|
—
|
|
—
|
|
—
|
|
10,358
|
|
|||||||||||||
|
Dividends declared
|
—
|
|
—
|
|
—
|
|
(15,876
|
)
|
—
|
|
—
|
|
(15,876
|
)
|
|||||||||||||
|
Purchases of treasury stock
|
—
|
|
—
|
|
—
|
|
—
|
|
—
|
|
(319,690
|
)
|
(319,690
|
)
|
|||||||||||||
|
Net earnings
|
—
|
|
—
|
|
—
|
|
88,950
|
|
—
|
|
—
|
|
88,950
|
|
|||||||||||||
|
Foreign currency translation adjustment
|
—
|
|
—
|
|
—
|
|
—
|
|
7
|
|
—
|
|
7
|
|
|||||||||||||
|
Effect of interest rate swaps, net
|
—
|
|
—
|
|
—
|
|
—
|
|
(370
|
)
|
—
|
|
(370
|
)
|
|||||||||||||
|
Effect of actuarial losses and prior service cost, net
|
—
|
|
—
|
|
—
|
|
—
|
|
(27,107
|
)
|
—
|
|
(27,107
|
)
|
|||||||||||||
|
Balance at September 28, 2014
|
80,127,387
|
|
801
|
|
356,727
|
|
1,244,897
|
|
(90,132
|
)
|
(1,254,382
|
)
|
257,911
|
|
|||||||||||||
|
Shares issued under stock plans, including tax benefit
|
968,769
|
|
10
|
|
33,762
|
|
—
|
|
—
|
|
—
|
|
33,772
|
|
|||||||||||||
|
Share-based compensation
|
—
|
|
—
|
|
12,420
|
|
—
|
|
—
|
|
—
|
|
12,420
|
|
|||||||||||||
|
Dividends declared
|
—
|
|
—
|
|
77
|
|
(37,590
|
)
|
—
|
|
—
|
|
(37,513
|
)
|
|||||||||||||
|
Purchases of treasury stock
|
—
|
|
—
|
|
—
|
|
—
|
|
—
|
|
(317,051
|
)
|
(317,051
|
)
|
|||||||||||||
|
Net earnings
|
—
|
|
—
|
|
—
|
|
108,812
|
|
—
|
|
—
|
|
108,812
|
|
|||||||||||||
|
Foreign currency translation adjustment
|
—
|
|
—
|
|
—
|
|
—
|
|
(29
|
)
|
—
|
|
(29
|
)
|
|||||||||||||
|
Effect of interest rate swaps, net
|
—
|
|
—
|
|
—
|
|
—
|
|
(15,068
|
)
|
—
|
|
(15,068
|
)
|
|||||||||||||
|
Effect of actuarial losses and prior service cost, net
|
—
|
|
—
|
|
—
|
|
—
|
|
(27,301
|
)
|
—
|
|
(27,301
|
)
|
|||||||||||||
|
Balance at September 27, 2015
|
81,096,156
|
|
$
|
811
|
|
$
|
402,986
|
|
$
|
1,316,119
|
|
$
|
(132,530
|
)
|
$
|
(1,571,433
|
)
|
$
|
15,953
|
|
|||||||
See accompanying notes to consolidated financial statements.
F-7
JACK IN THE BOX INC. AND SUBSIDIARIES
NOTES TO CONSOLIDATED FINANCIAL STATEMENTS
NOTES TO CONSOLIDATED FINANCIAL STATEMENTS
1. NATURE OF OPERATIONS AND SUMMARY OF SIGNIFICANT ACCOUNTING POLICIES
Nature of operations
— Founded in 1951, Jack in the Box Inc. (the “Company”) operates and franchises Jack in the Box
®
quick-service restaurants and Qdoba Mexican Eats
®
(“Qdoba”) fast-casual restaurants. The following table summarizes the number of restaurants as of the end of each fiscal year:
|
2015
|
2014
|
2013
|
||||
|
Jack in the Box:
|
||||||
|
Company-operated
|
413
|
431
|
465
|
|||
|
Franchise
|
1,836
|
1,819
|
1,786
|
|||
|
Total system
|
2,249
|
2,250
|
2,251
|
|||
|
Qdoba:
|
||||||
|
Company-operated
|
322
|
310
|
296
|
|||
|
Franchise
|
339
|
328
|
319
|
|||
|
Total system
|
661
|
638
|
615
|
|||
References to the Company throughout these notes to the consolidated financial statements are made using the first person notations of “we,” “us” and “our.” Comparisons throughout these notes to the consolidated financial statements refer to the
52
-week periods ended
September 27, 2015
,
September 28, 2014
and
September 29, 2013
for fiscal years
2015
,
2014
and
2013
respectively, unless otherwise indicated.
Basis of presentation
— The accompanying consolidated financial statements have been prepared in accordance with U.S. generally accepted accounting principles and the rules and regulations of the Securities and Exchange Commission (“SEC”). During fiscal 2012, we entered into an agreement to outsource our Jack in the Box distribution business. In the third quarter of fiscal 2013, we closed
62
Qdoba restaurants (the “2013 Qdoba Closures”) as part of a comprehensive Qdoba market performance review. The results of operations for our distribution business and for the 2013 Qdoba Closures are reported as discontinued operations for all periods presented. Refer to Note 2,
Discontinued Operations
, for additional information. Unless otherwise noted, amounts and disclosures throughout these notes to the consolidated financial statements relate to our continuing operations.
Reclassifications and adjustments
— Certain prior year amounts in these notes and in the consolidated financial statements have been reclassified to conform to the fiscal 2015 presentation.
In 2015, on our consolidated statements of earnings, we began to separately state our franchise revenues derived from rentals and those derived from royalties and other. To provide clarity, we additionally have separately stated the associated rental expense and depreciation and amortization related to the rental income received from franchisees. For comparison purposes, we have reclassified prior year franchise revenue and franchise costs line items to reflect the new method of presentation.
Principles of consolidation
— The consolidated financial statements include the accounts of the Company, its wholly-owned subsidiaries and the accounts of any variable interest entities (“VIEs”) where we are deemed the primary beneficiary. All significant intercompany accounts and transactions are eliminated.
The Financial Accounting Standards Board (“FASB”) authoritative guidance on consolidation requires the primary beneficiary of a VIE to consolidate that entity. The primary beneficiary of a VIE is an enterprise that has a controlling financial interest in the VIE. Controlling financial interest exists when an enterprise has both the power to direct the activities that most significantly impact the VIE’s economic performance and the obligation to absorb losses or the right to receive benefits of the VIE that could potentially be significant to the VIE.
The primary entities in which we possess a variable interest are franchise entities, which operate our franchise restaurants. We do not possess any ownership interests in franchise entities. We have reviewed these franchise entities and determined that we are not the primary beneficiary of the entities and therefore, these entities have not been consolidated. We hold and consolidate a variable interest in a subsidiary formed for the purpose of operating a franchisee lending program. For information related to this VIE, refer to Note 15,
Variable Interest Entities
.
Fiscal year
— Our fiscal year is
52
or
53
weeks ending the Sunday closest to
September 30
. Fiscal years
2015
,
2014
and
2013
include
52
weeks.
F-8
JACK IN THE BOX INC. AND SUBSIDIARIES
NOTES TO CONSOLIDATED FINANCIAL STATEMENTS
Use of estimates
— In preparing the consolidated financial statements in conformity with U.S. generally accepted accounting principles, management is required to make certain assumptions and estimates that affect reported amounts of assets, liabilities, revenues, expenses and the disclosure of contingencies. In making these assumptions and estimates, management may from time to time seek advice and consider information provided by actuaries and other experts in a particular area. Actual amounts could differ materially from these estimates.
Cash and cash equivalents
—
We invest cash in excess of operating requirements in short-term, highly liquid investments with original maturities of three months or less, which are considered cash equivalents.
Accounts and other receivables, net
is primarily comprised of receivables from franchisees, tenants and credit card processors. Franchisee receivables primarily include rents, royalties, and marketing fees associated with lease and franchise agreements. Tenant receivables relate to subleased properties where we are on the master lease agreement. We accrue interest on notes receivable based on the contractual terms. The allowance for doubtful accounts is based on historical experience and a review of existing receivables. Changes in accounts and other receivables are classified as an operating activity in the consolidated statements of cash flows.
Inventories
consist principally of food, packaging and supplies, and are valued at the lower of cost or market on a first-in, first-out basis. Changes in inventories are classified as an operating activity in the consolidated statements of cash flows.
Assets held for sale
typically represent the costs for new sites and existing sites that we plan to sell and lease back within the next year. Gains or losses realized on sale-leaseback transactions are deferred and amortized to income over the lease terms. If the determination is made that we no longer expect to sell an asset within the next year, the asset is reclassified out of assets held for sale. Assets held for sale also periodically includes the net book value of property and/or equipment we plan to sell within the next year. Assets held for sale consisted of the following at each fiscal year-end (
in thousands
):
|
2015
|
2014
|
|||||||
|
Assets held for sale and leaseback
|
$
|
15,216
|
|
$
|
3,477
|
|
||
|
Other property and equipment held for sale
|
300
|
|
1,289
|
|
||||
|
Assets held for sale
|
$
|
15,516
|
|
$
|
4,766
|
|
||
Property and equipment, net
— Expenditures for new facilities and equipment, and those that substantially increase the useful lives of the property, are capitalized. Facilities leased under capital leases are stated at the present value of minimum lease payments at the beginning of the lease term, not to exceed fair value. Maintenance and repairs are expensed as incurred. When property and equipment are retired or otherwise disposed of, the related cost and accumulated depreciation are removed from the accounts, and gains or losses on the dispositions are reflected in results of operations.
Buildings, equipment and leasehold improvements are generally depreciated using the straight-line method based on the estimated useful lives of the assets, over the initial lease term for certain assets acquired in conjunction with the lease commencement for leased properties, or the remaining lease term for certain assets acquired after the commencement of the lease for leased properties. In certain situations, one or more option periods may be used in determining the depreciable life of assets related to leased properties if we deem that an economic penalty would be incurred otherwise. In either circumstance, our policy requires lease term consistency when calculating the depreciation period, in classifying the lease and in computing straight-line rent expense. Building, leasehold improvement assets and equipment are assigned lives that range from
2
to
35
years. Depreciation expense related to property and equipment was
$88.8 million
,
$90.7 million
and
$92.0 million
in
2015
,
2014
, and
2013
, respectively.
Impairment of long-lived assets
— We evaluate our long-lived assets, such as property and equipment, for impairment on an annual basis or whenever events or changes in circumstances indicate that their carrying value may not be recoverable. This review generally includes a restaurant-level analysis, except when we are actively selling a group of restaurants in which case we perform our impairment evaluations at the group level. Impairment evaluations for individual restaurants take into consideration a restaurant’s operating cash flows, the period of time since a restaurant has been opened or remodeled, refranchising expectations, and the maturity of the related market. Impairment evaluations for a group of restaurants take into consideration the group’s expected future cash flows and sales proceeds from bids received, if any, or fair market value based on, among other considerations, the specific sales and cash flows of those restaurants. If the assets of a restaurant or group of restaurants subject to our impairment evaluation are not recoverable based upon the forecasted, undiscounted cash flows, we recognize an impairment loss by the amount which the carrying value of the assets exceeds fair value. Long-lived assets that meet the held for sale criteria, which excludes assets intended to be sold and leased back, are held for sale and reported at the lower of their carrying value or fair value, less estimated costs to sell.
F-9
JACK IN THE BOX INC. AND SUBSIDIARIES
NOTES TO CONSOLIDATED FINANCIAL STATEMENTS
Goodwill and intangible assets
— Goodwill is the excess of the purchase price over the fair value of identifiable net assets acquired, if any. We generally record goodwill in connection with the acquisition of restaurants from franchisees. Likewise, upon the sale of restaurants to franchisees, goodwill is decremented. The amount of goodwill written-off is determined as the fair value of the reporting unit disposed of as a percentage of the fair value of the reporting unit retained. Goodwill is evaluated for impairment annually, or more frequently if indicators of impairment are present. We first assess qualitative factors to determine whether the existence of events or circumstances leads to a determination that it is more likely than not that the fair value of a reporting unit is less than its carrying amount. If the qualitative factors indicate that it is more likely than not that the fair value of a reporting unit is less than its carrying amount, we perform a two-step impairment test of goodwill. In the first step, we estimate the fair value of the reporting unit and compare it to the carrying value of the reporting unit. If the carrying value exceeds the fair value of the reporting unit, the second step is performed to measure the amount of the impairment loss, if any. In the second step, the amount of the impairment loss is the excess of the carrying amount of the goodwill over its implied fair value.
Intangible assets, net is comprised primarily of acquired franchise contract costs, our Qdoba trademark, lease acquisition costs and reacquired franchise rights. Acquired franchise contract costs and our Qdoba trademark were recorded in connection with our acquisition of Qdoba Restaurant Corporation in fiscal
2003
. Acquired franchise contract costs represent the acquired value of franchise contracts, which are amortized over the term of the franchise agreements plus options based on the projected royalty revenue stream. Our Qdoba trademark asset has an indefinite life and is not amortized. Lease acquisition costs primarily represent the fair values of acquired lease contracts having contractual rents lower than fair market rents and are amortized on a straight-line basis over the remaining initial lease term. Reacquired franchise rights are recorded in connection with our acquisition of franchised restaurants and are amortized over the remaining contractual period of the franchise contract in which the right was granted.
Our non-amortizing intangible asset is evaluated for impairment annually, or more frequently if indicators of impairment are present. We first assess qualitative factors to determine whether the existence of events or circumstances leads to a determination that it is more likely than not that the fair value of the intangible asset is less than its carrying amount. If the qualitative factors indicate that it is more likely than not that the fair value of the intangible asset is less than its carrying amount, we compare the fair value of the non-amortizing intangible asset with its carrying amount. If the carrying amount of an intangible asset exceeds its fair value, an impairment loss is recognized equal to the excess.
Company-owned life insurance
— We have purchased company-owned life insurance (“COLI”) policies to support our non-qualified benefit plans. The cash surrender values of these policies were
$99.5 million
and
$100.7 million
as of
September 27, 2015
and
September 28, 2014
, respectively, and are included in other assets, net in the accompanying consolidated balance sheets. Changes in cash surrender values are included in selling, general and administrative expenses in the accompanying consolidated statements of earnings. These policies reside in an umbrella trust for use only to pay plan benefits to participants or to pay creditors if the Company becomes insolvent.
Leases
—
We review all leases for capital or operating classification at their inception under the FASB authoritative guidance for leases. Our operations are primarily conducted under operating leases. Within the provisions of certain leases, there are rent holidays and escalations in payments over the base lease term, as well as renewal periods. The effects of the holidays and escalations have been reflected in rent expense on a straight-line basis over the expected lease term. Differences between amounts paid and amounts expensed are recorded as deferred rent. The lease term commences on the date when we have the right to control the use of the leased property. Certain leases also include contingent rent provisions based on sales levels, which are accrued at the point in time we determine that it is probable such sales levels will be achieved.
Revenue recognition
— Revenue from company restaurant sales is recognized when the food and beverage products are sold and are presented net of sales taxes.
Our franchise arrangements generally provide for franchise fees and continuing fees based upon a percentage of sales (“royalties”). In order to renew a franchise agreement upon expiration, a franchisee must obtain the Company’s approval and pay then current fees. Franchise development and license fees are recorded as deferred revenue until we have substantially performed all of our contractual obligations and the restaurant has opened for business. Franchise royalties are recorded in revenues on an accrual basis. Among other things, a franchisee may be provided the use of land and building, generally for a period of
20
years, and is required to pay negotiated rent, property taxes, insurance and maintenance. Certain franchise rents, which are contingent upon sales levels, are recognized in the period in which the contingency is met.
Gift cards
— We sell gift cards to our customers in our restaurants and through selected third parties. The gift cards sold to our customers have no stated expiration dates and are subject to actual and/or potential escheatment rights in several of the jurisdictions in which we operate. We recognize income from gift cards when redeemed by the customer.
F-10
JACK IN THE BOX INC. AND SUBSIDIARIES
NOTES TO CONSOLIDATED FINANCIAL STATEMENTS
While we will continue to honor all gift cards presented for payment, we may determine the likelihood of redemption to be remote for certain card balances due to, among other things, long periods of inactivity. In these circumstances, to the extent we determine there is no requirement for remitting balances to government agencies under unclaimed property laws, card balances may be recognized as a reduction to selling, general and administrative expenses in the accompanying consolidated statements of earnings.
Income recognized on unredeemed gift card balances was
$1.0 million
,
$0.8 million
and
$0.7 million
in fiscal
2015
,
2014
and
2013
, respectively.
Pre-opening costs
associated with the opening of a new restaurant consist primarily of employee training costs and are expensed as incurred and included in selling, general and administrative expenses in the accompanying consolidated statements of earnings.
Restaurant closure costs
— All costs associated with exit or disposal activities are recognized when they are incurred. Restaurant closure costs, which are included in impairment and other charges, net and losses (gains) on the sale of company-operated restaurants in the accompanying consolidated statements of earnings, consist of future lease commitments, net of anticipated sublease rentals, and expected ancillary costs.
Self-insurance
— We are self-insured for a portion of our workers’ compensation, general liability, employee medical and dental, and automotive claims. We utilize a paid-loss plan for our workers’ compensation, general liability and automotive programs, which have predetermined loss limits per occurrence and in the aggregate. We establish our insurance liability (undiscounted) and reserves using independent actuarial estimates of expected losses for determining reported claims and as the basis for estimating claims incurred but not reported. As of
September 27, 2015
and
September 28, 2014
, our estimated liability for general liability and workers’ compensation claims exceeded our self-insurance retention limits by
$25.8 million
and
$24.6 million
, respectively, which we expect our insurance providers to pay on our behalf in accordance with the contractual terms of our insurance policies.
Advertising costs
— We administer marketing funds which include contractual contributions. In fiscal
2015
, the marketing funds at franchise and company-operated restaurants were generally
5%
and
2%
of gross revenues at Jack in the Box and Qdoba restaurants, respectively, and in both fiscal
2014
and
2013
the marketing funds were approximately
5%
and
1%
of gross revenues at Jack in the Box and Qdoba restaurants, respectively. We record contributions from franchisees as a liability included in accrued liabilities in the accompanying consolidated balance sheets until such funds are expended. The contributions to the marketing funds are designated for marketing initiatives and advertising and we act as an agent for the franchisees with regard to these contributions. Therefore, we do not reflect franchisee contributions to the funds in our consolidated statements of earnings or cash flows.
Production costs of commercials, programming and other marketing activities are charged to the marketing funds when the advertising is first used for its intended purpose, and the costs of advertising are charged to operations as incurred. Total contributions and other marketing expenses, are included in selling, general, and administrative expenses in the accompanying consolidated statements of earnings. The following table provides a summary of advertising costs related to company-operated restaurants in each fiscal year (
in thousands
):
|
2015
|
2014
|
2013
|
||||||||||
|
Jack in the Box
|
$
|
41,895
|
|
$
|
42,349
|
|
$
|
46,739
|
|
|||
|
Qdoba
|
17,687
|
|
18,215
|
|
16,123
|
|
||||||
|
Total
|
$
|
59,582
|
|
$
|
60,564
|
|
$
|
62,862
|
|
|||
Share-based compensation
— We account for our share-based compensation under the FASB authoritative guidance on stock compensation
,
which generally requires, among other things, that all employee share-based compensation be measured using a fair value method and that the resulting compensation cost be recognized in the financial statements. Compensation expense for our share-based compensation awards is generally recognized on a straight-line basis over the shorter of the vesting period or the period from the date of grant to the date the employee becomes eligible to retire.
Income taxes
— Deferred tax assets and liabilities are recognized for the future tax consequences attributable to differences between the financial statement carrying amounts of existing assets and liabilities and their respective tax bases, as well as tax loss and credit carryforwards. Deferred tax assets and liabilities are measured using enacted tax rates expected to apply to taxable income in the years in which those temporary differences are expected to be recovered or settled. We recognize interest and, when applicable, penalties related to unrecognized tax benefits as a component of our income tax provision.
Authoritative guidance issued by the FASB prescribes a minimum probability threshold that a tax position must meet before a financial statement benefit is recognized. The minimum threshold is defined as a tax position that is more likely than not to be
F-11
JACK IN THE BOX INC. AND SUBSIDIARIES
NOTES TO CONSOLIDATED FINANCIAL STATEMENTS
sustained upon examination by the applicable taxing authority, including resolution of any related appeals or litigation processes, based on the technical merits of the position. Refer to Note 10,
Income Taxes
, for additional information.
Derivative instruments
—
From time to time, we use interest rate swap agreements to manage interest rate exposure. We do not speculate using derivative instruments. We purchase derivative instruments only for the purpose of risk management.
All derivatives are recognized on the consolidated balance sheets at fair value based upon quoted market prices. Changes in the fair values of derivatives are recorded in earnings or other comprehensive income (“OCI”), based on whether or not the instrument is designated as a hedge transaction. Gains or losses on derivative instruments that qualify for hedge designation are reported in OCI and are reclassified to earnings in the period the hedged item affects earnings. If the underlying hedge transaction ceases to exist, any associated amounts reported in OCI are reclassified to earnings at that time. Any ineffectiveness is recognized in earnings in the current period. Refer to Note 5,
Fair Value Measurements
, and Note 6,
Derivative Instruments,
for additional information regarding our derivative instruments.
Contingencies
— We recognize liabilities for contingencies when we have an exposure that indicates it is probable that an asset has been impaired or that a liability has been incurred and the amount of impairment or loss can be reasonably estimated. Our ultimate legal and financial liability with respect to such matters cannot be estimated with certainty and requires the use of estimates. When the reasonable estimate is a range, the recorded loss will be the best estimate within the range. We record legal settlement costs when those costs are probable and reasonably estimable.
Segment reporting
— An operating segment is defined as a component of an enterprise that engages in business activities from which it may earn revenues and incur expenses, and about which separate financial information is regularly evaluated by our chief operating decision makers in deciding how to allocate resources. Similar operating segments can be aggregated into a single operating segment if the businesses are similar. We operate our business in two operating segments, Jack in the Box and Qdoba Restaurant Operations. Refer to Note 17,
Segment Reporting
, for additional discussion regarding our segments.
Effect of new accounting pronouncements
— In August 2015, the FASB issued Accounting Standards Update (“ASU”) No. 2015-15, “
Interest-Imputation of Interest: Presentation and Subsequent Measurement of Debt Issuance Costs Associated with Line-of-Credit Arrangements
,” which addresses line-of-credit arrangements that were omitted from ASU No. 2015-03 (see below). This ASU states that the SEC staff would not object to an entity deferring and presenting debt issuance costs related to a line-of-credit arrangement as an asset and subsequently amortizing those costs ratably over the term of the arrangement, regardless of whether there are any outstanding borrowings on the line-of-credit arrangement. This new standard is effective for annual reporting periods beginning after December 15, 2015, including interim periods within that reporting period, with early adoption permitted. We do not expect that this standard will have a material impact on our consolidated financial statements or disclosures upon adoption.
In May 2014, the FASB issued ASU No. 2014-09,
Revenue from Contracts with Customers (Topic 606)
, which provides a comprehensive new revenue recognition model that requires a company to recognize revenue in an amount that reflects the consideration it expects to receive for the transfer of promised goods or services to its customers. The standard also requires additional disclosure regarding the nature, amount, timing and uncertainty of revenue and cash flows arising from contracts with customers. This ASU is effective for annual periods and interim periods beginning after December 15, 2017. The ASU is to be applied retrospectively or using a cumulative effect transition method and early adoption is not permitted. We are currently evaluating the effect that this pronouncement will have on our consolidated financial statements and related disclosures.
In April 2015, the FASB issued ASU No. 2015-04,
Practical Expedient for the Measurement Date of an Employer's Defined Benefit Obligation and Plan Assets
, which provides a practical expedient that permits a company to measure defined benefit plan assets and obligations using the month-end date that is closest to the company's fiscal year-end and apply that practical expedient consistently from year to year. The practical expedient should be applied consistently to all plans if the company has more than one plan. This ASU is effective prospectively for financial statements issued for fiscal years beginning after December 15, 2015, and interim periods within those fiscal years, with early adoption permitted. We early adopted this standard in fiscal 2015 and measured our defined benefit plan assets and obligation as of September 30, 2015, which did not have a material impact on our consolidated financial statements and related disclosures.
In April 2015, the FASB issued ASU No. 2015-03,
Simplifying the Presentation of Debt Issuance Costs
, which changes the presentation of debt issuance costs in financial statements. Under this ASU, an entity presents such costs on the balance sheet as a direct deduction from the related debt liability rather than as an asset. This new standard is effective for annual reporting periods beginning after December 15, 2015, including interim periods within that reporting period, with early adoption permitted. We do not plan to adopt this standard early and do not expect that it will have a material impact on our consolidated financial statements or disclosures upon adoption.
F-12
JACK IN THE BOX INC. AND SUBSIDIARIES
NOTES TO CONSOLIDATED FINANCIAL STATEMENTS
In June 2014, the FASB issued ASU No. 2014-12,
Accounting for Share-Based Payments when the Terms of an Award Provide That a Performance Target Could Be Achieved after the Requisite Service Period
, which requires a reporting entity to treat a performance target that affects vesting and that could be achieved after the requisite service period as a performance condition. This standard is to be applied prospectively for annual and interim periods beginning after December 15, 2015, with early adoption permitted. We early adopted this standard on September 29, 2014. This pronouncement did not have a material impact on our consolidated financial statements.
In April 2014, the FASB issued ASU No. 2014-08,
Presentation of Financial Statements (Topic 205) and Property, Plant, and Equipment (Topic 360): Reporting Discontinued Operations and Disclosures of Disposals of Components of an Entity
, which modifies the definition of discontinued operations to include only disposals of an entity that represent strategic shifts that have or will have a major effect on an entity's operations and financial results. This ASU also expands the disclosure requirements for disposals which meet the definition of a discontinued operation and requires entities to disclose information about disposals of individually significant components that do not meet the definition of discontinued operations. The standard is effective prospectively for annual and interim periods beginning after December 15, 2014, with early adoption permitted. We early adopted this standard on September 29, 2014. This pronouncement did not have a material impact on our consolidated financial statements.
2. DISCONTINUED OPERATIONS
Distribution business
— During fiscal 2012, we entered into an agreement with a third party distribution service provider pursuant to a plan approved by our board of directors to sell our Jack in the Box distribution business. During the first quarter of fiscal 2013, we completed the transition of our distribution centers. The operations and cash flows of the business have been eliminated and in accordance with the provisions of the FASB authoritative guidance on the presentation of financial statements, the results are reported as discontinued operations for all periods presented.
The following table summarizes our distribution business results, which are included in discontinued operations for each fiscal year (
in thousands
):
|
2015
|
2014
|
2013
|
||||||||||
|
Revenue
|
$
|
—
|
|
$
|
—
|
|
$
|
37,743
|
|
|||
|
Loss before income tax benefit
|
$
|
(703
|
)
|
$
|
(1,276
|
)
|
$
|
(6,446
|
)
|
|||
In 2015 and 2014, the loss includes
$0.5 million
and
$0.9 million
, respectively, related to insurance and other settlements and
$0.2 million
and
$0.3 million
, respectively, related to our lease commitments. The loss in fiscal 2013 includes costs incurred to exit the distribution business consisting of
$1.9 million
for accelerated depreciation of a long-lived asset disposed of upon completion of the transaction,
$1.6 million
(net of reversals for deferred rent of
$0.4 million
) for future lease commitments,
$1.2 million
primarily related to costs incurred to terminate certain vendor contracts, and
$1.3 million
related to distribution center specific workers’ compensation claims. The loss on the sale of the distribution business was not material to our results of operations.
Our liability for lease commitments related to our distribution centers is included in accrued liabilities and other long-term liabilities in the accompanying consolidated balance sheets and was
$0.2 million
and
$0.5 million
as of September 27, 2015 and September 28, 2104, respectively. The lease commitment balance as of September 27, 2015 relates to
one
distribution center subleased at a loss. The future minimum lease payments and receipts for the next five fiscal years and thereafter are included in the amounts disclosed in Note 8,
Leases
.
2013 Qdoba Closures
— During the third quarter of fiscal 2013, we closed
62
Qdoba restaurants. The decision to close these restaurants was based on a comprehensive analysis that took into consideration levels of return on investment and other key operating performance metrics. Since the closed restaurants were not predominantly located near those remaining in operation, we did not expect the majority of cash flows and sales lost from these closures to be recovered. In addition, we did not anticipate any ongoing involvement or significant direct cash flows from the closed stores. Therefore, in accordance with the provisions of the FASB authoritative guidance on the presentation of financial statements
,
the results of operations for these restaurants are reported as discontinued operations for all periods presented.
F-13
JACK IN THE BOX INC. AND SUBSIDIARIES
NOTES TO CONSOLIDATED FINANCIAL STATEMENTS
The following table summarizes the results related to the 2013 Qdoba Closures for each fiscal year (
in thousands
):
|
2015
|
2014
|
2013
|
||||||||||
|
Company restaurant sales
|
$
|
—
|
|
$
|
—
|
|
$
|
28,036
|
|
|||
|
Asset impairments
|
$
|
—
|
|
$
|
(2,170
|
)
|
$
|
(22,239
|
)
|
|||
|
Future lease commitments (1)
|
(4,594
|
)
|
(4,536
|
)
|
(10,301
|
)
|
||||||
|
Bad debt expense
|
(366
|
)
|
—
|
|
—
|
|
||||||
|
Brokers commissions
|
(234
|
)
|
(652
|
)
|
—
|
|
||||||
|
Other exit costs
|
(302
|
)
|
(889
|
)
|
(3,075
|
)
|
||||||
|
Operating losses
|
—
|
|
—
|
|
(8,961
|
)
|
||||||
|
Loss before income tax benefit
|
$
|
(5,496
|
)
|
$
|
(8,247
|
)
|
$
|
(44,576
|
)
|
|||
___________________________________________
(1) Future lease commitments in 2013 are shown net of reversals for deferred rent and tenant improvement allowances of
$4.3 million
.
We do not expect the remaining costs to be incurred related to the closures to be material; however, the estimates we make related to our future lease obligations, primarily sublease income, are subject to a high degree of judgment and may differ from actual sublease income due to changes in economic conditions, desirability of the sites and other factors.
Our liability for lease commitments related to the 2013 Qdoba closures is included in accrued liabilities and other long-term liabilities in the accompanying consolidated balance sheets and has changed as follows during fiscal year 2015 (
in thousands
):
|
Balance at September 28, 2014
|
$
|
5,737
|
|
|
|
Adjustments
|
4,594
|
|
||
|
Cash payments
|
(6,075
|
)
|
||
|
Balance at September 27, 2015
|
$
|
4,256
|
|
|
In 2015, adjustments primarily relate to revisions to certain sublease and cost assumptions due to changes in market conditions as well as charges to terminate
five
lease agreements. These amounts were partially offset by favorable adjustments for locations that we have subleased. The balance at September 27, 2015 relates to
six
locations subleased at a loss and
15
locations we are marketing for sublease. The future minimum lease payments and receipts for the next five fiscal years and thereafter are included in the amounts disclosed in Note 8,
Leases
.
3. SUMMARY OF REFRANCHISINGS, FRANCHISEE DEVELOPMENT AND ACQUISITIONS
Refranchisings and franchisee development
— The following table summarizes the number of restaurants sold to franchisees, the number of restaurants developed by franchisees and the related (losses) gains and fees recognized in each fiscal year (
dollars in thousands
):
|
2015
|
2014
|
2013
|
||||||||||
|
Restaurants sold to franchisees
|
21
|
|
37
|
|
81
|
|
||||||
|
New restaurants opened by franchisees
|
38
|
|
33
|
|
45
|
|
||||||
|
Initial franchise fees
|
$
|
1,453
|
|
$
|
1,886
|
|
$
|
4,017
|
|
|||
|
Proceeds from the sale of company-operated restaurants (1)
|
$
|
3,951
|
|
$
|
10,536
|
|
$
|
30,619
|
|
|||
|
Net assets sold (primarily property and equipment)
|
(4,283
|
)
|
(5,558
|
)
|
(15,680
|
)
|
||||||
|
Goodwill related to the sale of company-operated restaurants
|
(47
|
)
|
(170
|
)
|
(629
|
)
|
||||||
|
Other (2)
|
(2,760
|
)
|
(6,500
|
)
|
(9,670
|
)
|
||||||
|
(Losses) gains on the sale of company-operated restaurants
|
(3,139
|
)
|
(1,692
|
)
|
4,640
|
|
||||||
|
Loss on anticipated sale of a Jack in the Box company-operated market (3)
|
—
|
|
(1,856
|
)
|
—
|
|
||||||
|
(Losses) gains on the sale of company-operated restaurants
|
$
|
(3,139
|
)
|
$
|
(3,548
|
)
|
$
|
4,640
|
|
|||
____________________________
|
(1)
|
Amounts in 2015, 2014 and 2013 include additional proceeds of
$1.5 million
,
$2.1 million
and
$3.3 million
, respectively, recognized upon the extension of the underlying franchise and lease agreements related to restaurants sold in a prior year.
|
|
(2)
|
Amounts in all years presented primarily represent impairment and lease commitment charges related to restaurants closed in connection with the sale of the related markets, and charges for operating restaurant leases with lease commitments in excess of our sublease rental income.
|
F-14
JACK IN THE BOX INC. AND SUBSIDIARIES
NOTES TO CONSOLIDATED FINANCIAL STATEMENTS
|
(3)
|
In 2014, the loss on the anticipated sale of a Jack in the Box market relates to
25
company-operated restaurants of which we sold
20
, and closed the remaining
five
, in the second quarter of fiscal 2015.
|
Franchise acquisitions
— We acquired
seven
,
four
and
one
Jack in the Box franchise restaurants in 2015, 2014 and 2013, respectively, and in 2013, we acquired
13
Qdoba franchise restaurants. We account for the acquisition of franchised restaurants using the acquisition method of accounting for business combinations. The purchase price allocations were based on fair value estimates determined using significant unobservable inputs (Level 3). The goodwill recorded primarily relates to the sales growth potential of the markets acquired and is expected to be deductible for income tax purposes. The following table provides detail of the combined acquisitions in each fiscal year (
dollars in thousands
):
|
2015
|
2014
|
2013
|
||||||||||
|
Restaurants acquired from franchisees
|
7
|
|
4
|
|
14
|
|
||||||
|
Property and equipment
|
$
|
646
|
|
$
|
1,398
|
|
$
|
3,030
|
|
|||
|
Reacquired franchise rights
|
—
|
|
96
|
|
148
|
|
||||||
|
Goodwill
|
—
|
|
256
|
|
9,169
|
|
||||||
|
Gains on the acquisition of franchise-operated restaurants
|
(33
|
)
|
—
|
|
—
|
|
||||||
|
Liabilities assumed
|
(613
|
)
|
—
|
|
(283
|
)
|
||||||
|
Total consideration
|
$
|
—
|
|
$
|
1,750
|
|
$
|
12,064
|
|
|||
4. GOODWILL AND INTANGIBLE ASSETS, NET
The changes in the carrying amount of goodwill during fiscal
2015
and
2014
by reportable segment were as follows (
in thousands
):
|
Jack in the
Box
|
Qdoba
|
Total
|
||||||||||
|
Balance at September 29, 2013
|
$
|
48,391
|
|
$
|
100,597
|
|
$
|
148,988
|
|
|||
|
Acquisition of franchised restaurants
|
256
|
|
—
|
|
256
|
|
||||||
|
Sale of company-operated restaurants to franchisees
|
(170
|
)
|
—
|
|
(170
|
)
|
||||||
|
Balance at September 28, 2014
|
48,477
|
|
100,597
|
|
149,074
|
|
||||||
|
Sale of company-operated restaurants to franchisees
|
(47
|
)
|
—
|
|
(47
|
)
|
||||||
|
Balance at September 27, 2015
|
$
|
48,430
|
|
$
|
100,597
|
|
$
|
149,027
|
|
|||
Intangible assets, net consist of the following as of the end of each fiscal year (
in thousands
):
|
2015
|
2014
|
|||||||
|
Amortized intangible assets:
|
||||||||
|
Gross carrying amount
|
$
|
17,267
|
|
$
|
17,272
|
|
||
|
Less accumulated amortization
|
(11,302
|
)
|
(10,468
|
)
|
||||
|
Net carrying amount
|
5,965
|
|
6,804
|
|
||||
|
Non-amortized intangible assets:
|
||||||||
|
Trademark
|
8,800
|
|
8,800
|
|
||||
|
Net carrying amount
|
$
|
14,765
|
|
$
|
15,604
|
|
||
Amortized intangible assets include acquired franchise contracts recorded in connection with our acquisition of Qdoba in
2003
, lease acquisition costs and reacquired franchise rights. The weighted-average life of these amortized intangible assets is approximately
27 years
. Total amortization expense related to intangible assets was
$0.8 million
,
$0.9 million
and
$1.0 million
in fiscal 2015, 2014 and 2013, respectively.
The following table summarizes, as of
September 27, 2015
, the estimated amortization expense for each of the next five fiscal years (
in thousands
):
|
2016
|
$
|
784
|
|
|
2017
|
$
|
736
|
|
|
2018
|
$
|
692
|
|
|
2019
|
$
|
645
|
|
|
2020
|
$
|
621
|
|
F-15
JACK IN THE BOX INC. AND SUBSIDIARIES
NOTES TO CONSOLIDATED FINANCIAL STATEMENTS
5. FAIR VALUE MEASUREMENTS
Financial assets and liabilities
— The following table presents the financial assets and liabilities measured at fair value on a recurring basis (
in thousands
):
|
|
Total
|
Quoted
Prices
in Active
Markets for
Identical
Assets (3)
(Level 1)
|
Significant
Other
Observable
Inputs (3)
(Level 2)
|
Significant
Unobservable
Inputs (3)
(Level 3)
|
||||||||||||
|
Fair Value Measurements as of September 27, 2015:
|
||||||||||||||||
|
Non-qualified deferred compensation plan (1)
|
$
|
(35,003
|
)
|
$
|
(35,003
|
)
|
$
|
—
|
|
$
|
—
|
|
||||
|
Interest rate swaps (Note 6) (2)
|
(26,374
|
)
|
—
|
|
(26,374
|
)
|
—
|
|
||||||||
|
Total liabilities at fair value
|
$
|
(61,377
|
)
|
$
|
(35,003
|
)
|
$
|
(26,374
|
)
|
$
|
—
|
|
||||
|
Fair Value Measurements as of September 28, 2014:
|
||||||||||||||||
|
Non-qualified deferred compensation plan (1)
|
$
|
(35,602
|
)
|
$
|
(35,602
|
)
|
$
|
—
|
|
$
|
—
|
|
||||
|
Interest rate swaps (Note 6) (2)
|
(1,789
|
)
|
—
|
|
(1,789
|
)
|
—
|
|
||||||||
|
Total liabilities at fair value
|
$
|
(37,391
|
)
|
$
|
(35,602
|
)
|
$
|
(1,789
|
)
|
$
|
—
|
|
||||
____________________________
|
(1)
|
We maintain an unfunded defined contribution plan for key executives and other members of management excluded from participation in our qualified savings plan. The fair value of this obligation is based on the closing market prices of the participants’ elected investments.
|
|
(2)
|
We entered into interest rate swaps to reduce our exposure to rising interest rates on our variable debt. The fair values of our interest rate swaps are based upon Level 2 inputs which include valuation models as reported by our counterparties. The key inputs for the valuation models are quoted market prices, interest rates and forward yield curves.
|
|
(3)
|
We did not have any transfers in or out of Level 1, 2 or 3.
|
The fair values of the Company’s debt instruments are based on the amount of future cash flows associated with each instrument discounted using the Company’s borrowing rate. At
September 27, 2015
, the carrying value of all financial instruments was not materially different from fair value, as the borrowings are prepayable without penalty. The estimated fair values of our capital lease obligations approximated their carrying values as of
September 27, 2015
.
Non-financial assets and liabilities
— Our non-financial instruments, which primarily consist of property and equipment, goodwill and intangible assets, are reported at carrying value and are not required to be measured at fair value on a recurring basis. However, on an annual basis or whenever events or changes in circumstances indicate that their carrying value may not be recoverable, non-financial instruments are assessed for impairment. If the carrying values are not fully recoverable, they are written down to fair value.
In connection with our impairment reviews performed during fiscal 2015, we recorded an impairment charge of
$0.4 million
related to one under performing Jack in the Box restaurant which is currently held for use. No other material fair value adjustments were required. Refer to Note 9,
Impairment and Other Charges, Net,
for additional information regarding impairment charges.
6. DERIVATIVE INSTRUMENTS
Objectives and strategies
— We are exposed to interest rate volatility with regard to our variable rate debt. To reduce our exposure to rising interest rates, in
August 2010
, we entered into
two
interest rate swap agreements that effectively converted
$100.0 million
of our variable rate term loan borrowings to a fixed-rate basis from
September 2011
through
September 2014
. In April 2014, we entered into
nine
forward-starting interest rate swap agreements that effectively convert
$300.0 million
of our variable rate borrowings, and future expected variable rate borrowings to a fixed rate basis from October 2014 through October 2018. Additionally, in June 2015, we entered into
eleven
forward-starting interest rate swap agreements that effectively convert an additional
$200.0 million
of our variable rate borrowings to a fixed rate from October 2015 through October 2018, and
$500.0 million
from October 2018 through October 2022.
These agreements have been designated as cash flow hedges under the terms of the FASB authoritative guidance for derivatives and hedging. To the extent that they are effective in offsetting the variability of the hedged cash flows, changes in the fair values of the derivatives are not included in earnings but are included in OCI. These changes in fair value are subsequently reclassified into net earnings as a component of interest expense as the hedged interest payments are made on our term debt.
F-16
JACK IN THE BOX INC. AND SUBSIDIARIES
NOTES TO CONSOLIDATED FINANCIAL STATEMENTS
Financial position
— The following derivative instruments were outstanding as of the end of each fiscal year (
in thousands
):
|
|
September 27, 2015
|
September 28, 2014
|
||||||||||
|
|
Balance
Sheet
Location
|
Fair
Value
|
Balance
Sheet
Location
|
Fair
Value
|
||||||||
|
Derivatives designated as hedging instruments:
|
||||||||||||
|
Interest rate swaps (Note 5)
|
Accrued
liabilities |
$
|
(3,379
|
)
|
Accrued
liabilities |
$
|
(1,789
|
)
|
||||
|
Interest rate swaps (Note 5)
|
Other long-term liabilities
|
(22,995
|
)
|
Other long-term liabilities
|
—
|
|
||||||
|
Total derivatives
|
$
|
(26,374
|
)
|
$
|
(1,789
|
)
|
||||||
Financial performance
— The following table summarizes the accumulated OCI activity related to our interest rate swap derivative instruments in each fiscal year (
in thousands
):
|
Location of
Loss
in Income
|
2015
|
2014
|
2013
|
|||||||||||
|
Loss recognized in OCI
|
N/A
|
$
|
(26,596
|
)
|
$
|
(1,890
|
)
|
$
|
(110
|
)
|
||||
|
Loss reclassified from accumulated OCI into net earnings
|
Interest
expense, net
|
$
|
2,011
|
|
$
|
1,291
|
|
$
|
1,353
|
|
||||
Amounts reclassified from accumulated OCI into interest expense represent payments made to the counterparty for the effective portions of the interest rate swaps. During fiscal years
2015
,
2014
and
2013
, our interest rate swaps had
no
hedge ineffectiveness.
The detail of our long-term debt at the end of each fiscal year is as follows (
in thousands
):
|
2015
|
2014
|
|||||||
|
Revolver, variable interest rate based on an applicable margin plus LIBOR, 2.00% at September 27, 2015
|
$
|
395,000
|
|
$
|
306,000
|
|
||
|
Term loan, variable interest rate based on an applicable margin plus LIBOR, 1.95% at September 27, 2015
|
300,000
|
|
197,500
|
|
||||
|
Capital lease obligations, 3.9% weighted average interest rate at September 27, 2015
|
20,256
|
|
4,383
|
|
||||
|
715,256
|
|
507,883
|
|
|||||
|
Less current portion
|
(26,677
|
)
|
(10,871
|
)
|
||||
|
$
|
688,579
|
|
$
|
497,012
|
|
|||
New credit facility
— On July 1, 2015, the Company amended its credit facility to increase our overall borrowing capacity. The amended credit facility was increased to
$1.2 billion
, consisting of (i) a
$900.0 million
revolving credit agreement and (ii) a
$300.0 million
term loan. The interest rate did not change as a result of the amendment and continues to be based on the Company’s leverage ratio and can range from the London Interbank Offered Rate (“LIBOR”) plus
1.25%
to
2.00%
. The amendment also, among other things, amended certain covenants already contained in the credit agreement. Both the revolving credit agreement and the term loan have maturity dates of
March 19, 2019
did not change as part of the amendment. As part of the existing credit agreement, we may also request the issuance of up to
$75.0 million
in letters of credit, the outstanding amount of which reduces our net borrowing capacity under the agreement. As of
September 27, 2015
, our unused borrowing capacity was
$479.8 million
.
Use of proceeds
— Upon amendment, the Company borrowed
$300.0 million
under the amended term loan and approximately
$360.0 million
under the amended revolving credit agreement. The proceeds from the amendment were used to repay all borrowings under the credit facility prior to the amendment and to pay related transaction fees and expenses associated with amending the facility. The proceeds will also be available for permitted share repurchases, permitted dividends, permitted acquisitions, ongoing working capital requirements and other general corporate purposes.
Collateral
— The Company’s obligations under the credit facility are secured by first priority liens and security interests in the capital stock, partnership and membership interests owned by the Company and/or its subsidiaries, and any proceeds thereof, subject to certain restrictions set forth in the credit agreement. Additionally, there is a negative pledge on all tangible and intangible assets (including all real and personal property) with customary exceptions as reflected in the credit agreement.
F-17
JACK IN THE BOX INC. AND SUBSIDIARIES
NOTES TO CONSOLIDATED FINANCIAL STATEMENTS
Covenants
— We are subject to a number of customary covenants under our credit facility, including limitations on additional borrowings, acquisitions, loans to franchisees, lease commitments, stock repurchases and dividend payments, and requirements to maintain certain financial ratios as defined in the credit agreement.
Future cash payments
— Scheduled principal payments on our long-term debt outstanding at
September 27, 2015
for each of the next five fiscal years and thereafter are as follows (
in thousands
):
|
2016
|
$
|
26,677
|
|
|
|
2017
|
26,216
|
|
||
|
2018
|
29,482
|
|
||
|
2019
|
623,078
|
|
||
|
2020
|
2,237
|
|
||
|
Thereafter
|
7,566
|
|
||
|
$
|
715,256
|
|
||
We may make voluntary prepayments of the loans under the revolving credit agreement and term loan at any time without premium or penalty. Specific events such as asset sales, certain issuances of debt, and insurance and condemnation recoveries, may trigger a mandatory prepayment.
8. LEASES
As lessee
— We lease restaurants and other facilities, which generally have renewal clauses of
5
to
20
years exercisable at our option. In some instances, our leases have provisions for contingent rentals based upon a percentage of defined revenues. Many of our leases also have rent escalation clauses and require the payment of property taxes, insurance and maintenance costs. We also lease certain restaurant and office equipment. Minimum rental obligations are accounted for on a straight-line basis over the term of the initial lease, plus lease option terms for certain locations.
The components of rent expense were as follows in each fiscal year (
in thousands
):
|
2015
|
2014
|
2013
|
||||||||||
|
Minimum rentals
|
$
|
212,722
|
|
$
|
213,082
|
|
$
|
210,638
|
|
|||
|
Contingent rentals
|
2,549
|
|
1,986
|
|
1,840
|
|
||||||
|
Total rent expense
|
215,271
|
|
215,068
|
|
212,478
|
|
||||||
|
Less rental expense on subleased properties
|
(141,946
|
)
|
(139,976
|
)
|
(136,970
|
)
|
||||||
|
Net rent expense
|
$
|
73,325
|
|
$
|
75,092
|
|
$
|
75,508
|
|
|||
The following table presents as of
September 27, 2015
, future minimum lease payments under capital and operating leases, including leases recorded as lease obligations relating to continuing and discontinued operations (
in thousands
):
|
Fiscal Year
|
Capital
Leases
|
Operating
Leases
|
||||||
|
2016
|
$
|
4,040
|
|
$
|
246,636
|
|
||
|
2017
|
3,355
|
|
210,994
|
|
||||
|
2018
|
2,518
|
|
177,768
|
|
||||
|
2019
|
2,647
|
|
168,564
|
|
||||
|
2020
|
2,522
|
|
141,470
|
|
||||
|
Thereafter
|
7,852
|
|
552,858
|
|
||||
|
Total minimum lease payments
|
22,934
|
|
$
|
1,498,290
|
|
|||
|
Less amount representing interest, 3.9% weighted average interest rate
|
(2,678
|
)
|
||||||
|
Present value of obligations under capital leases
|
20,256
|
|
||||||
|
Less current portion
|
(3,240
|
)
|
||||||
|
Long-term capital lease obligations
|
$
|
17,016
|
|
|||||
Total future minimum lease payments of approximately
$1.0 billion
included in the table above are expected to be recovered under our non-cancelable operating subleases.
F-18
JACK IN THE BOX INC. AND SUBSIDIARIES
NOTES TO CONSOLIDATED FINANCIAL STATEMENTS
Assets recorded under capital leases are included in property and equipment, and consisted of the following at each fiscal year-end (
in thousands
):
|
2015
|
2014
|
|||||||
|
Buildings
|
$
|
10,716
|
|
$
|
19,105
|
|
||
|
Equipment
|
16,770
|
|
—
|
|
||||
|
Less accumulated amortization
|
(8,453
|
)
|
(15,667
|
)
|
||||
|
$
|
19,033
|
|
$
|
3,438
|
|
|||
Amortization of assets under capital leases is included in depreciation and amortization expense on the consolidated statements of earnings.
As lessor
— We lease or sublease restaurants to certain franchisees and others under agreements that generally provide for the payment of percentage rentals in excess of stipulated minimum rentals, usually for a period of
20
years. Most of our leases have rent escalation clauses and renewal clauses of
5
to
20
years. The following table summarizes rents received under these agreements in each fiscal year (
in thousands
):
|
2015
|
2014
|
2013
|
||||||||||
|
Total rental income (1)
|
$
|
232,264
|
|
$
|
222,443
|
|
$
|
213,009
|
|
|||
|
Contingent rentals
|
$
|
28,348
|
|
$
|
19,551
|
|
$
|
16,966
|
|
|||
|
(1)
|
Includes contingent rentals.
|
The minimum rents receivable expected to be received under these non-cancelable operating leases and subleases, including leases recorded as lease obligations relating to continuing and discontinuing operations, and excluding contingent rentals, as of
September 27, 2015
are as follows (
in thousands
):
|
Fiscal Year
|
|
||
|
2016
|
$
|
224,400
|
|
|
2017
|
204,802
|
|
|
|
2018
|
184,853
|
|
|
|
2019
|
199,905
|
|
|
|
2020
|
196,635
|
|
|
|
Thereafter
|
1,387,889
|
|
|
|
Total minimum future rent receivable
|
$
|
2,398,484
|
|
Assets held for lease and included in property and equipment consisted of the following at each fiscal year-end (
in thousands
):
|
2015
|
2014
|
|||||||
|
Land
|
$
|
72,248
|
|
$
|
72,143
|
|
||
|
Buildings
|
678,044
|
|
689,056
|
|
||||
|
Equipment
|
4,374
|
|
4,492
|
|
||||
|
754,666
|
|
765,691
|
|
|||||
|
Less accumulated depreciation
|
(453,056
|
)
|
(434,526
|
)
|
||||
|
$
|
301,610
|
|
$
|
331,165
|
|
|||
9. IMPAIRMENT AND OTHER CHARGES, NET
Impairment and other charges, net in the accompanying consolidated statements of earnings is comprised of the following (
in thousands
):
|
2015
|
2014
|
2013
|
||||||||||
|
Accelerated depreciation
|
$
|
6,260
|
|
$
|
1,202
|
|
$
|
2,554
|
|
|||
|
Costs of closed restaurants (primarily lease obligations) and other
|
3,592
|
|
2,841
|
|
2,469
|
|
||||||
|
Losses on disposition of property and equipment, net
|
1,319
|
|
1,674
|
|
1,091
|
|
||||||
|
Restaurant impairment charges
|
557
|
|
570
|
|
3,874
|
|
||||||
|
Restructuring costs
|
29
|
|
8,621
|
|
3,451
|
|
||||||
|
$
|
11,757
|
|
$
|
14,908
|
|
$
|
13,439
|
|
||||
F-19
JACK IN THE BOX INC. AND SUBSIDIARIES
NOTES TO CONSOLIDATED FINANCIAL STATEMENTS
Accelerated depreciation
— When a long-lived asset will be replaced or otherwise disposed of prior to the end of its estimated useful life, the useful life of the asset is adjusted based on the estimated disposal date and accelerated depreciation is recognized. Accelerated depreciation primarily relates to expenses at our Jack in the Box company restaurants for the replacement of technology and beverage equipment in 2015, and restaurant facility enhancements in 2014 and 2013. In 2015, we recognized a
$3.6 million
charge related to the replacement of our beverage equipment at Jack in the Box company restaurants and a
$1.5 million
charge related to projects designed to upgrade outdoor lighting and certain technology at our restaurants.
Restaurant closing costs
consist of future lease commitments, net of anticipated sublease rentals and expected ancillary costs. Total accrued restaurant closing costs, included in accrued liabilities and other long-term liabilities, changed as follows during fiscal year 2015 (
in thousands
):
|
Balance at beginning of year
|
$
|
13,173
|
|
|
|
Adjustments (1)
|
2,653
|
|
||
|
Cash payments
|
(6,119
|
)
|
||
|
Balance at end of year
|
$
|
9,707
|
|
|
___________________________________________
|
(1)
|
Adjustments relate primarily to certain sublease and cost assumptions. The estimates we make related to our future lease obligations, primarily the sublease income we anticipate, are subject to a high degree of judgment and may differ from actual sublease income due to changes in economic conditions, desirability of the sites and other factors.
|
The future minimum lease payments and receipts for the next five fiscal years and thereafter are included in the amounts disclosed in Note 8,
Leases
. Our obligations under the leases included in the above table expire at various dates between fiscal
2016
and
2029
.
Disposition of property and equipment
— Losses on the disposition of property and equipment were offset by gains from the resolution of
one
and
four
eminent domain matters involving Jack in the Box restaurants in 2015 and 2013, respectively, with related gains of
$0.9 million
and
$2.8 million
, recognized in each respective year.
Restaurant impairment charges
— When events and circumstances indicate that our long-lived assets might be impaired and their carrying amount is greater than the undiscounted cash flows we expect to generate from such assets, we recognize an impairment loss as the amount by which the carrying value exceeds the fair value of the assets. Impairment charges in fiscal
2015
,
2014
and
2013
primarily represent charges to write down the carrying value of underperforming Jack in the Box restaurants and Jack in the Box restaurants we intend to or have closed.
Restructuring costs
— Since the beginning of 2012, we have been engaged in a comprehensive review of our organization structure, including evaluating opportunities to decrease general and administrative expenses, as well as improve profitability across both brands.
The following is a summary of the costs incurred in connection with these activities during each fiscal year (
in thousands
):
|
2015
|
2014
|
2013
|
||||||||||
|
Severance costs
|
$
|
29
|
|
$
|
2,141
|
|
$
|
2,821
|
|
|||
|
Other
|
—
|
|
6,480
|
|
630
|
|
||||||
|
$
|
29
|
|
$
|
8,621
|
|
$
|
3,451
|
|
||||
In 2014, other represents an impairment charge recognized related to a restaurant software asset we no longer planned to place in service as we integrate certain systems across both our brands. In addition to the costs summarized in the table above, in fiscal 2012 we incurred restructuring charges of
$15.5 million
. We may incur additional charges related to our restructuring activities; however, we are unable to make a reasonable estimate at this time.
F-20
JACK IN THE BOX INC. AND SUBSIDIARIES
NOTES TO CONSOLIDATED FINANCIAL STATEMENTS
10. INCOME TAXES
Income taxes consist of the following in each fiscal year (
in thousands
):
|
2015
|
2014
|
2013
|
||||||||||
|
Current:
|
||||||||||||
|
Federal
|
$
|
59,362
|
|
$
|
43,864
|
|
$
|
51,367
|
|
|||
|
State
|
9,598
|
|
3,770
|
|
7,583
|
|
||||||
|
68,960
|
|
47,634
|
|
58,950
|
|
|||||||
|
Deferred:
|
||||||||||||
|
Federal
|
(2,018
|
)
|
3,700
|
|
(16,897
|
)
|
||||||
|
State
|
(1,173
|
)
|
452
|
|
(1,707
|
)
|
||||||
|
(3,191
|
)
|
4,152
|
|
(18,604
|
)
|
|||||||
|
Income tax expense from continuing operations
|
$
|
65,769
|
|
$
|
51,786
|
|
$
|
40,346
|
|
|||
|
Income tax benefit from discontinued operations
|
$
|
(2,410
|
)
|
$
|
(3,629
|
)
|
$
|
(19,566
|
)
|
|||
A reconciliation of the federal statutory income tax rate to our effective tax rate for continuing operations is as follows:
|
2015
|
2014
|
2013
|
|||||||
|
Computed at federal statutory rate
|
35.0
|
%
|
35.0
|
%
|
35.0
|
%
|
|||
|
State income taxes, net of federal tax benefit
|
3.7
|
|
3.3
|
|
3.4
|
|
|||
|
Benefit of jobs tax credits, net of valuation allowance
|
(1.1
|
)
|
(1.2
|
)
|
(1.9
|
)
|
|||
|
Expense (benefit) related to COLIs
|
0.3
|
|
(1.6
|
)
|
(2.9
|
)
|
|||
|
Other, net
|
(1.0
|
)
|
(0.2
|
)
|
(0.8
|
)
|
|||
|
36.9
|
%
|
35.3
|
%
|
32.8
|
%
|
||||
The tax effects of temporary differences that give rise to significant portions of deferred tax assets and deferred tax liabilities at each year-end are presented below (
in thousands
):
|
2015
|
2014
|
|||||||
|
Deferred tax assets:
|
||||||||
|
Accrued pension and postretirement benefits
|
$
|
92,456
|
|
$
|
77,170
|
|
||
|
Accrued insurance
|
13,245
|
|
12,874
|
|
||||
|
Accrued incentive compensation
|
6,412
|
|
3,090
|
|
||||
|
Accrued vacation pay expense
|
2,193
|
|
2,132
|
|
||||
|
Deferred income
|
1,417
|
|
1,436
|
|
||||
|
Impairment
|
23,982
|
|
25,391
|
|
||||
|
Lease commitments related to closed or refranchised locations
|
11,471
|
|
12,686
|
|
||||
|
Other reserves and allowances
|
1,584
|
|
1,303
|
|
||||
|
Tax loss and tax credit carryforwards
|
14,081
|
|
10,705
|
|
||||
|
Leasing transactions
|
11,442
|
|
7,201
|
|
||||
|
Share-based compensation
|
9,331
|
|
9,416
|
|
||||
|
Other, net
|
12,238
|
|
1,418
|
|
||||
|
Total gross deferred tax assets
|
199,852
|
|
164,822
|
|
||||
|
Valuation allowance
|
(11,563
|
)
|
(8,624
|
)
|
||||
|
Total net deferred tax assets
|
188,289
|
|
156,198
|
|
||||
|
Deferred tax liabilities:
|
||||||||
|
Property and equipment, principally due to differences in depreciation
|
(38,403
|
)
|
(38,362
|
)
|
||||
|
Intangible assets
|
(30,132
|
)
|
(28,149
|
)
|
||||
|
Other
|
(1,568
|
)
|
(2,069
|
)
|
||||
|
Total gross deferred tax liabilities
|
(70,103
|
)
|
(68,580
|
)
|
||||
|
Net deferred tax assets
|
$
|
118,186
|
|
$
|
87,618
|
|
||
Deferred tax assets at
September 27, 2015
include state net operating loss carry-forwards of approximately
$76.2 million
expiring at various times between
2017
and
2035
. At
September 27, 2015
and
September 28, 2014
, we recorded a valuation allowance related to losses and state tax credits of
$11.6 million
and
$8.6 million
, respectively. The current year change in the valuation
F-21
JACK IN THE BOX INC. AND SUBSIDIARIES
NOTES TO CONSOLIDATED FINANCIAL STATEMENTS
allowance of
$3.0 million
relates primarily to increases in valuation allowance on state net operating losses and state tax credits. We believe that it is more likely than not that these loss and credit carry-forwards will not be realized and that the remaining deferred tax assets will be realized through future taxable income or alternative tax strategies.
Our gross unrecognized tax benefits associated with uncertain income tax positions decreased during fiscal 2015 and 2014 based on the final assessment of a state income tax audit. A reconciliation of the beginning and ending amounts of unrecognized tax benefits follows (
in thousands
):
|
2015
|
2014
|
|||||||
|
Balance beginning of year
|
$
|
374
|
|
$
|
769
|
|
||
|
Change related to tax positions
|
(374
|
)
|
(395
|
)
|
||||
|
Balance at end of year
|
$
|
—
|
|
$
|
374
|
|
||
From time to time, we may take positions for filing our tax returns which may differ from the treatment of the same item for financial reporting purposes. The ultimate outcome of these items will not be known until the Internal Revenue Service or state has completed its examination or until the statute of limitations has expired.
At September 27, 2015, the Company no longer has any gross unrecognized tax benefits associated with uncertain income tax positions. During the year, the Company concluded an audit regarding a specific claim with California. The conclusion of this audit eliminated our unrecognized tax benefits associated with uncertain income tax positions.
The major jurisdictions in which the Company files income tax returns include the United States and states in which we operate that impose an income tax. The federal statutes of limitations have not expired for fiscal years
2012
and forward. The Company’s federal statute of limitations for fiscal years 2009 and 2011 were extended and remain open. The statutes of limitations for California and Texas, which constitute the Company’s major state tax jurisdictions, have not expired for fiscal years 2010 and 2011, respectively, and forward.
11. RETIREMENT PLANS
We sponsor programs that provide retirement benefits to our employees. These programs include defined contribution plans, defined benefit pension plans and postretirement healthcare plans.
Defined contribution plans
—
We maintain a qualified savings plan pursuant to Section 401(k) of the Internal Revenue Code, which allows administrative and clerical employees who have satisfied the service requirements and reached age
21
to defer a percentage of their pay on a pre-tax basis. We match
50%
of the first
4%
of compensation deferred by the participant. Our contributions under this plan were
$1.2 million
in fiscal
2015
, and
$1.0 million
in
2014
and
2013
. We also maintain an unfunded, non-qualified deferred compensation plan for key executives and other members of management who are excluded from participation in the qualified savings plan. This plan allows participants to defer up to
50%
of their salary and
85%
of their bonus, on a pre-tax basis. We match
100%
of the first
3%
contributed by the participant. To compensate executives no longer eligible to participate in our supplemental defined benefit pension plan, we also contribute a supplemental amount equal to
4%
of an eligible employee’s salary and bonus for a period of
10
years in such eligible position. Our contributions under the non-qualified deferred compensation plan were
$1.3 million
in fiscal
2015
and
$1.1 million
in fiscal
2014
and
2013
. In all plans, a participant’s right to Company contributions vests at a rate of
25%
per year of service.
Defined benefit pension plans
—
We sponsor two defined benefit pension plans, a “Qualified Plan” covering substantially all full-time employees hired prior to January 1, 2011, and an unfunded supplemental executive retirement plan (“SERP”) which provides certain employees additional pension benefits and was closed to new participants effective
January 1, 2007
. In fiscal 2011, the Board of Directors approved changes to our Qualified Plan whereby participants will no longer accrue benefits effective
December 31, 2015
. This change was accounted for as a plan “curtailment” in accordance with FASB authoritative guidance. Benefits under both plans are based on the employees’ years of service and compensation over defined periods of employment.
Postretirement healthcare plans
—
We also sponsor two healthcare plans, closed to new participants, that provide postretirement medical benefits to certain employees who have met minimum age and service requirements. The plans are contributory; with retiree contributions adjusted annually, and contain other cost-sharing features such as deductibles and coinsurance.
F-22
JACK IN THE BOX INC. AND SUBSIDIARIES
NOTES TO CONSOLIDATED FINANCIAL STATEMENTS
Obligations and funded status
— The following table provides a reconciliation of the changes in benefit obligations, plan assets and funded status of our retirement plans as of
September 27, 2015
and
September 28, 2014
(
in thousands
):
|
|
Qualified Plan
|
SERP
|
Postretirement Health Plans
|
|||||||||||||||||||||
|
|
2015
|
2014
|
2015
|
2014
|
2015
|
2014
|
||||||||||||||||||
|
Change in benefit obligation:
|
||||||||||||||||||||||||
|
Obligation at beginning of year
|
$
|
434,896
|
|
$
|
382,068
|
|
$
|
69,733
|
|
$
|
64,717
|
|
$
|
27,626
|
|
$
|
33,243
|
|
||||||
|
Service cost
|
7,592
|
|
7,633
|
|
676
|
|
490
|
|
—
|
|
—
|
|
||||||||||||
|
Interest cost
|
19,750
|
|
20,196
|
|
2,945
|
|
3,049
|
|
1,196
|
|
1,639
|
|
||||||||||||
|
Participant contributions
|
—
|
|
—
|
|
—
|
|
—
|
|
114
|
|
123
|
|
||||||||||||
|
Actuarial loss (gain)
|
16,757
|
|
59,661
|
|
6,447
|
|
5,652
|
|
1,008
|
|
(6,082
|
)
|
||||||||||||
|
Benefits paid
|
(10,261
|
)
|
(10,963
|
)
|
(4,455
|
)
|
(4,175
|
)
|
(1,184
|
)
|
(1,456
|
)
|
||||||||||||
|
Settlements
|
(26,470
|
)
|
(23,699
|
)
|
—
|
|
—
|
|
—
|
|
—
|
|
||||||||||||
|
Other
|
—
|
|
—
|
|
—
|
|
—
|
|
151
|
|
159
|
|
||||||||||||
|
Obligation at end of year
|
$
|
442,264
|
|
$
|
434,896
|
|
$
|
75,346
|
|
$
|
69,733
|
|
$
|
28,911
|
|
$
|
27,626
|
|
||||||
|
Change in plan assets:
|
||||||||||||||||||||||||
|
Fair value at beginning of year
|
$
|
356,312
|
|
$
|
336,425
|
|
$
|
—
|
|
$
|
—
|
|
$
|
—
|
|
$
|
—
|
|
||||||
|
Actual return on plan assets
|
(6,924
|
)
|
34,549
|
|
—
|
|
—
|
|
—
|
|
—
|
|
||||||||||||
|
Participant contributions
|
—
|
|
—
|
|
—
|
|
—
|
|
114
|
|
123
|
|
||||||||||||
|
Employer contributions
|
20,000
|
|
20,000
|
|
4,455
|
|
4,175
|
|
919
|
|
1,174
|
|
||||||||||||
|
Benefits paid
|
(10,261
|
)
|
(10,963
|
)
|
(4,455
|
)
|
(4,175
|
)
|
(1,184
|
)
|
(1,456
|
)
|
||||||||||||
|
Settlements
|
(26,470
|
)
|
(23,699
|
)
|
—
|
|
—
|
|
—
|
|
—
|
|
||||||||||||
|
Other
|
—
|
|
—
|
|
—
|
|
—
|
|
151
|
|
159
|
|
||||||||||||
|
Fair value at end of year
|
$
|
332,657
|
|
$
|
356,312
|
|
$
|
—
|
|
$
|
—
|
|
$
|
—
|
|
$
|
—
|
|
||||||
|
Funded status at end of year
|
$
|
(109,607
|
)
|
$
|
(78,584
|
)
|
$
|
(75,346
|
)
|
$
|
(69,733
|
)
|
$
|
(28,911
|
)
|
$
|
(27,626
|
)
|
||||||
|
Amounts recognized on the balance sheet:
|
||||||||||||||||||||||||
|
Current liabilities
|
$
|
—
|
|
$
|
—
|
|
$
|
(4,477
|
)
|
$
|
(4,479
|
)
|
$
|
(1,294
|
)
|
$
|
(1,269
|
)
|
||||||
|
Noncurrent liabilities
|
(109,607
|
)
|
(78,584
|
)
|
(70,869
|
)
|
(65,254
|
)
|
(27,617
|
)
|
(26,357
|
)
|
||||||||||||
|
Total liability recognized
|
$
|
(109,607
|
)
|
$
|
(78,584
|
)
|
$
|
(75,346
|
)
|
$
|
(69,733
|
)
|
$
|
(28,911
|
)
|
$
|
(27,626
|
)
|
||||||
|
Amounts in AOCI not yet reflected in net periodic benefit cost:
|
||||||||||||||||||||||||
|
Unamortized actuarial loss, net
|
$
|
153,156
|
|
$
|
114,482
|
|
$
|
31,738
|
|
$
|
26,425
|
|
$
|
3,226
|
|
$
|
2,400
|
|
||||||
|
Unamortized prior service cost
|
—
|
|
—
|
|
811
|
|
1,080
|
|
—
|
|
—
|
|
||||||||||||
|
Total
|
$
|
153,156
|
|
$
|
114,482
|
|
$
|
32,549
|
|
$
|
27,505
|
|
$
|
3,226
|
|
$
|
2,400
|
|
||||||
|
Other changes in plan assets and benefit obligations recognized in OCI:
|
||||||||||||||||||||||||
|
Net actuarial loss (gain)
|
$
|
46,952
|
|
$
|
49,603
|
|
$
|
6,447
|
|
$
|
5,652
|
|
$
|
1,008
|
|
$
|
(6,082
|
)
|
||||||
|
Amortization of actuarial loss
|
(8,278
|
)
|
(3,575
|
)
|
(1,134
|
)
|
(859
|
)
|
(182
|
)
|
(542
|
)
|
||||||||||||
|
Amortization of prior service cost
|
—
|
|
—
|
|
(269
|
)
|
(269
|
)
|
—
|
|
—
|
|
||||||||||||
|
Total recognized in OCI
|
38,674
|
|
46,028
|
|
5,044
|
|
4,524
|
|
826
|
|
(6,624
|
)
|
||||||||||||
|
Net periodic benefit cost and other losses
|
12,347
|
|
6,912
|
|
5,024
|
|
4,667
|
|
1,378
|
|
2,181
|
|
||||||||||||
|
Total recognized in comprehensive income
|
$
|
51,021
|
|
$
|
52,940
|
|
$
|
10,068
|
|
$
|
9,191
|
|
$
|
2,204
|
|
$
|
(4,443
|
)
|
||||||
|
Amounts in AOCI expected to be amortized in fiscal 2016 net periodic benefit cost:
|
||||||||||||||||||||||||
|
Net actuarial loss
|
$
|
2,828
|
|
$
|
1,259
|
|
$
|
218
|
|
|||||||||||||||
|
Prior service cost
|
—
|
|
240
|
|
—
|
|
||||||||||||||||||
|
Total
|
$
|
2,828
|
|
$
|
1,499
|
|
$
|
218
|
|
|||||||||||||||
Additional year-end pension plan information
—
The projected benefit obligation (“PBO”) is the actuarial present value of benefits attributable to employee service rendered to date, including the effects of estimated future pay increases. The accumulated benefit obligation (“ABO”) also reflects the actuarial present value of benefits attributable to employee service rendered to date but does not include the effects of estimated future pay increases. Therefore, the ABO as compared to plan assets is an indication of the assets currently available to fund vested and nonvested benefits accrued through the end of the fiscal year. The funded status is measured as the difference between the fair value of a plan’s assets and its PBO.
F-23
JACK IN THE BOX INC. AND SUBSIDIARIES
NOTES TO CONSOLIDATED FINANCIAL STATEMENTS
As of
September 27, 2015
and
September 28, 2014
, the Qualified Plan’s ABO exceeded the fair value of its plan assets. The SERP is an unfunded plan and, as such, had no plan assets as of
September 27, 2015
and
September 28, 2014
. The following sets forth the PBO, ABO and fair value of plan assets of our pension plans as of the measurement date in each fiscal year (
in thousands
):
|
2015
|
2014
|
|||||||
|
Qualified Plan:
|
||||||||
|
Projected benefit obligation
|
$
|
442,264
|
|
$
|
434,896
|
|
||
|
Accumulated benefit obligation
|
$
|
441,451
|
|
$
|
433,010
|
|
||
|
Fair value of plan assets
|
$
|
332,657
|
|
$
|
356,312
|
|
||
|
SERP:
|
||||||||
|
Projected benefit obligation
|
$
|
75,346
|
|
$
|
69,733
|
|
||
|
Accumulated benefit obligation
|
$
|
74,388
|
|
$
|
68,914
|
|
||
|
Fair value of plan assets
|
$
|
—
|
|
$
|
—
|
|
||
Net periodic benefit cost
— The components of the fiscal year net periodic benefit cost were as follows (
in thousands
):
|
2015
|
2014
|
2013
|
||||||||||
|
Qualified Plan:
|
||||||||||||
|
Service cost
|
$
|
7,592
|
|
$
|
7,633
|
|
$
|
10,210
|
|
|||
|
Interest cost
|
19,750
|
|
20,196
|
|
19,964
|
|
||||||
|
Expected return on plan assets
|
(23,273
|
)
|
(24,492
|
)
|
(22,715
|
)
|
||||||
|
Actuarial loss
|
8,278
|
|
3,575
|
|
15,665
|
|
||||||
|
Net periodic benefit cost
|
$
|
12,347
|
|
$
|
6,912
|
|
$
|
23,124
|
|
|||
|
SERP:
|
||||||||||||
|
Service cost
|
$
|
676
|
|
$
|
490
|
|
$
|
543
|
|
|||
|
Interest cost
|
2,945
|
|
3,049
|
|
2,664
|
|
||||||
|
Actuarial loss
|
1,134
|
|
859
|
|
2,170
|
|
||||||
|
Amortization of unrecognized prior service cost
|
269
|
|
269
|
|
269
|
|
||||||
|
Net periodic benefit cost
|
$
|
5,024
|
|
$
|
4,667
|
|
$
|
5,646
|
|
|||
|
Postretirement health plans:
|
||||||||||||
|
Interest cost
|
$
|
1,196
|
|
$
|
1,639
|
|
$
|
1,586
|
|
|||
|
Actuarial loss
|
182
|
|
542
|
|
791
|
|
||||||
|
Net periodic benefit cost
|
$
|
1,378
|
|
$
|
2,181
|
|
$
|
2,377
|
|
|||
Prior service costs are amortized on a straight-line basis from date of participation to full eligibility. Unrecognized gains or losses are amortized using the “corridor approach” under which the net gain or loss in excess of 10% of the greater of the PBO or the market-related value of the assets, if applicable, is amortized. For fiscal years 2015, 2014 and 2013, actuarial losses were amortized on a straight-line basis over the expected remaining service period of plan participants expected to receive benefits for our Qualified Plan, the expected remaining future lifetime and expected future working lifetime for inactive and active participants, respectively, for our SERP and the expected remaining future lifetime of inactive participants expected to receive benefits for our postretirement health plans.
F-24
JACK IN THE BOX INC. AND SUBSIDIARIES
NOTES TO CONSOLIDATED FINANCIAL STATEMENTS
Assumptions
—
We determine our actuarial assumptions on an annual basis. In determining the present values of our benefit obligations and net periodic benefit costs as of and for the fiscal years ended
September 27, 2015
,
September 28, 2014
and
September 29, 2013
, we used the following weighted-average assumptions:
|
2015
|
2014
|
2013
|
|||||||
|
Assumptions used to determine benefit obligations (1):
|
|||||||||
|
Qualified Plan:
|
|||||||||
|
Discount rate
|
4.79
|
%
|
4.60
|
%
|
5.37
|
%
|
|||
|
Rate of future pay increases
|
3.50
|
%
|
3.50
|
%
|
3.50
|
%
|
|||
|
SERP:
|
|||||||||
|
Discount rate
|
4.45
|
%
|
4.36
|
%
|
4.88
|
%
|
|||
|
Rate of future pay increases
|
3.50
|
%
|
3.50
|
%
|
3.50
|
%
|
|||
|
Postretirement health plans:
|
|||||||||
|
Discount rate
|
4.47
|
%
|
4.43
|
%
|
5.04
|
%
|
|||
|
Assumptions used to determine net periodic benefit cost (2):
|
|||||||||
|
Qualified Plan:
|
|||||||||
|
Discount rate
|
4.60
|
%
|
5.37
|
%
|
4.34
|
%
|
|||
|
Long-term rate of return on assets
|
6.50
|
%
|
7.25
|
%
|
7.25
|
%
|
|||
|
Rate of future pay increases
|
3.50
|
%
|
3.50
|
%
|
3.50
|
%
|
|||
|
SERP:
|
|||||||||
|
Discount rate
|
4.36
|
%
|
4.88
|
%
|
4.34
|
%
|
|||
|
Rate of future pay increases
|
3.50
|
%
|
3.50
|
%
|
3.50
|
%
|
|||
|
Postretirement health plans:
|
|||||||||
|
Discount rate
|
4.43
|
%
|
5.04
|
%
|
4.34
|
%
|
|||
____________________________
|
(1)
|
Determined as of end of year.
|
|
(2)
|
Determined as of beginning of year.
|
The assumed discount rates were determined by considering the average of pension yield curves constructed of a population of high-quality bonds with a Moody’s or Standard and Poor’s rating of “AA” or better whose cash flow from coupons and maturities match the year-by-year projected benefit payments from the plans. As benefit payments typically extend beyond the date of the longest maturing bond, cash flows beyond
30
years were discounted back to the
30th
year and then matched like any other payment.
The assumed expected long-term rate of return on assets is the weighted average rate of earnings expected on the funds invested or to be invested to provide for the pension obligations. The long-term rate of return on assets was determined taking into consideration our projected asset allocation and economic forecasts prepared with the assistance of our actuarial consultants.
The assumed discount rate and expected long-term rate of return on assets have a significant effect on amounts reported for our pension and postretirement plans. A quarter percentage point decrease in the discount rate and long-term rate of return used would have decreased fiscal
2015
earnings before income taxes by
$2.4 million
and
$0.9 million
, respectively.
The assumed average rate of compensation increase is the average annual compensation increase expected over the remaining employment periods for the participating employees.
F-25
JACK IN THE BOX INC. AND SUBSIDIARIES
NOTES TO CONSOLIDATED FINANCIAL STATEMENTS
For measurement purposes, the weighted-average assumed health care cost trend rates for our postretirement health plans were as follows for each fiscal year:
|
2015
|
2014
|
2013
|
|||||||
|
Healthcare cost trend rate for next year:
|
|||||||||
|
Participants under age 65
|
8.00
|
%
|
8.25
|
%
|
8.50
|
%
|
|||
|
Participants age 65 or older (1)
|
7.50
|
%
|
7.75
|
%
|
8.00
|
%
|
|||
|
Rate to which the cost trend rate is assumed to decline:
|
|||||||||
|
Participants under age 65 (1)
|
4.50
|
%
|
4.50
|
%
|
4.80% / 4.90%
|
|
|||
|
Participants age 65 or older (1)
|
4.50
|
%
|
4.50
|
%
|
4.80% / 4.90%
|
|
|||
|
Year the rate reaches the ultimate trend rate:
|
|||||||||
|
Participants under age 65 (1)
|
2030
|
|
2030
|
|
2038 / 2045
|
|
|||
|
Participants age 65 or older (1)
|
2028
|
|
2028
|
|
2037 / 2045
|
|
|||
____________________________
|
(1)
|
Where two rates and/or years are stated, these relate to the two post retirement health plans sponsored by the Company. Where one rate and/or year are stated, these were the same for both plans.
|
The assumed healthcare cost trend rate represents our estimate of the annual rates of change in the costs of the healthcare benefits currently provided by our postretirement plans. The healthcare cost trend rate implicitly considers estimates of healthcare inflation, changes in healthcare utilization and delivery patterns, technological advances and changes in the health status of the plan participants. The healthcare cost trend rate assumption has a significant effect on the amounts reported. For example, a
1.0%
change in the assumed healthcare cost trend rate would have the following effect on the 2015 net periodic benefit cost and end of year PBO (
in thousands
):
|
1% Point
Increase
|
1% Point
Decrease
|
|||||||
|
Total interest and service cost
|
$
|
143
|
|
$
|
(121
|
)
|
||
|
Postretirement benefit obligation
|
$
|
3,494
|
|
$
|
(2,972
|
)
|
||
Plan assets
—
Our investment philosophy is to (1) protect the corpus of the fund; (2) establish investment objectives that will allow the market value to exceed the present value of the vested and unvested liabilities over time; while (3) obtaining adequate investment returns to protect benefits promised to the participants and their beneficiaries. Our asset allocation strategy utilizes multiple investment managers in order to maximize the plan’s return while minimizing risk. We regularly monitor our asset allocation, and senior financial management and the Finance Committee of the Board of Directors review performance results at least semi-annually. We continually review our target asset allocation for our Qualified Plan and when changes are made, we reallocate our plan assets over a period of time, as deemed appropriate by senior financial management, to achieve our target asset allocation. Our plan asset allocation at the end of fiscal
2015
and target allocations were as follows:
|
2015
|
Target
|
Minimum
|
Maximum
|
|||||||||
|
Domestic equity
|
25
|
%
|
25
|
%
|
15
|
%
|
35
|
%
|
||||
|
International equity
|
27
|
|
25
|
|
15
|
%
|
35
|
%
|
||||
|
Core fixed funds
|
27
|
|
25
|
|
20
|
%
|
30
|
%
|
||||
|
Real return bonds
|
—
|
|
3
|
|
—
|
%
|
10
|
%
|
||||
|
Alternative investments
|
4
|
|
5
|
|
—
|
%
|
10
|
%
|
||||
|
Real estate
|
12
|
|
8
|
|
—
|
%
|
10
|
%
|
||||
|
High yield
|
2
|
|
5
|
|
—
|
%
|
10
|
%
|
||||
|
Commodities
|
3
|
|
4
|
|
—
|
%
|
10
|
%
|
||||
|
100
|
%
|
100
|
%
|
|||||||||
F-26
JACK IN THE BOX INC. AND SUBSIDIARIES
NOTES TO CONSOLIDATED FINANCIAL STATEMENTS
The fair values of the Qualified Plan’s assets at
September 27, 2015
and
September 28, 2014
by asset category are as follows (
in thousands
):
|
|
|
Total
|
Quoted Prices
in Active
Markets for
Identical
(Level 1)
|
Significant
Other
Observable
Inputs
(Level 2)
|
Significant
Unobservable
Inputs
(Level 3)
|
||||||||||||||
|
Items Measured at Fair Value at September 27, 2015:
|
|||||||||||||||||||
|
Asset Category:
|
|||||||||||||||||||
|
Cash and cash equivalents
|
(1
|
)
|
$
|
3,629
|
|
$
|
3,629
|
|
$
|
—
|
|
$
|
—
|
|
|||||
|
Equity:
|
|||||||||||||||||||
|
U.S
|
(2
|
)
|
15,812
|
|
15,812
|
|
—
|
|
—
|
|
|||||||||
|
Commingled
|
(3
|
)
|
169,701
|
|
169,701
|
|
—
|
|
—
|
|
|||||||||
|
Fixed income:
|
|||||||||||||||||||
|
Corporate bonds
|
(4
|
)
|
7,243
|
|
7,243
|
|
—
|
|
—
|
|
|||||||||
|
Other
|
(6
|
)
|
88,621
|
|
29,054
|
|
59,567
|
|
—
|
|
|||||||||
|
Diversified funds
|
(7
|
)
|
10,684
|
|
10,684
|
|
—
|
|
—
|
|
|||||||||
|
Real estate
|
(8
|
)
|
36,967
|
|
—
|
|
—
|
|
36,967
|
|
|||||||||
|
$
|
332,657
|
|
$
|
236,123
|
|
$
|
59,567
|
|
$
|
36,967
|
|
||||||||
|
Items Measured at Fair Value at September 28, 2014:
|
|||||||||||||||||||
|
Asset Category:
|
|||||||||||||||||||
|
Cash and cash equivalents
|
(1
|
)
|
$
|
900
|
|
$
|
900
|
|
$
|
—
|
|
$
|
—
|
|
|||||
|
Equity:
|
|||||||||||||||||||
|
U.S
|
(2
|
)
|
17,063
|
|
17,063
|
|
—
|
|
—
|
|
|||||||||
|
Commingled
|
(3
|
)
|
147,221
|
|
147,221
|
|
—
|
|
—
|
|
|||||||||
|
Fixed income:
|
|||||||||||||||||||
|
Corporate bonds
|
(4
|
)
|
13,122
|
|
13,122
|
|
—
|
|
—
|
|
|||||||||
|
Government and mortgage securities
|
(5
|
)
|
11,631
|
|
11,631
|
|
—
|
|
—
|
|
|||||||||
|
Other
|
(6
|
)
|
121,666
|
|
—
|
|
121,666
|
|
—
|
|
|||||||||
|
Diversified funds
|
(7
|
)
|
12,116
|
|
12,116
|
|
—
|
|
—
|
|
|||||||||
|
Real estate
|
(8
|
)
|
32,593
|
|
—
|
|
—
|
|
32,593
|
|
|||||||||
|
$
|
356,312
|
|
$
|
202,053
|
|
$
|
121,666
|
|
$
|
32,593
|
|
||||||||
|
(1)
|
Cash and cash equivalents are comprised of commercial paper, short-term bills and notes, and short-term investment funds, which are valued at unadjusted quoted market prices.
|
|
(2)
|
U.S. equity securities are comprised of investments in common stock of U.S. companies for total return purposes. These investments are valued by the trustee at closing prices from national exchanges on the valuation date.
|
|
(3)
|
Commingled equity securities are comprised of investments in mutual funds, the fair value of which is determined by reference to the fund’s underlying assets, which are primarily marketable equity securities that are traded on national exchanges and valued at unadjusted quoted market prices.
|
|
(4)
|
Corporate bonds are comprised of mutual funds traded on national securities exchanges, valued at unadjusted quoted market prices, as well as securities traded in markets that are not considered active, which are valued based on quoted market prices, broker/dealer quotations.
|
|
(5)
|
Government and mortgage securities are comprised of government and municipal bonds, including treasury bills, notes and index linked bonds which are valued using an unadjusted quoted price in an active market or observable, market-based inputs.
|
|
(6)
|
Other fixed income securities are comprised of other commingled funds invested in registered securities which are valued at the unadjusted quoted price in an active market (level 1) or exchange and long-duration US government/credit funds which are valued based on observable inputs, which include quoted market prices in active markets for similar securities, valuations based on commonly quoted benchmark interest rates, maturities, ratings and/or securities indices (level 2)
|
|
(7)
|
Diversified funds are comprised of exchange-traded commodities futures and treasury bills, which are valued at unadjusted quoted market prices.
|
|
(8)
|
Real estate is investments in a real estate investment trust for purposes of total return. These investments are valued at unit values provided by the investment managers and their consultants.
|
F-27
JACK IN THE BOX INC. AND SUBSIDIARIES
NOTES TO CONSOLIDATED FINANCIAL STATEMENTS
The following table presents the changes in Level 3 investments for the Qualified Plan during
2014
and
2015
(
in thousands
):
|
|
Real Estate
|
||
|
Balance at September 29, 2013
|
$
|
29,352
|
|
|
Actual return on plan assets:
|
|||
|
Relating to assets still held at the reporting date
|
3,520
|
|
|
|
Relating to assets sold during the period
|
18
|
|
|
|
Purchases, sales and settlements
|
(297
|
)
|
|
|
Balance at September 28, 2014
|
$
|
32,593
|
|
|
Actual return on plan assets:
|
|||
|
Relating to assets still held at the reporting date
|
$
|
4,665
|
|
|
Relating to assets sold during the period
|
40
|
|
|
|
Purchases, sales and settlements
|
(331
|
)
|
|
|
Balance at September 27, 2015
|
$
|
36,967
|
|
Future cash flows
—
Our policy is to fund our plans at or above the minimum required by law. As of the date of our last actuarial funding valuation, there was
no
minimum requirement. Contributions expected to be paid in the next fiscal year and the projected benefit payments for each of the next five fiscal years and the total aggregate amount for the subsequent five fiscal years are as follows (
in thousands
):
|
Pension Plans
|
Postretirement
Health Plans
|
|||||||
|
Estimated net contributions during fiscal 2016
|
$
|
24,477
|
|
$
|
1,320
|
|
||
|
Estimated future year benefit payments during fiscal years:
|
||||||||
|
2016
|
$
|
14,548
|
|
$
|
1,324
|
|
||
|
2017
|
$
|
14,831
|
|
$
|
1,403
|
|
||
|
2018
|
$
|
15,361
|
|
$
|
1,470
|
|
||
|
2019
|
$
|
16,147
|
|
$
|
1,673
|
|
||
|
2020
|
$
|
17,233
|
|
$
|
1,711
|
|
||
|
2021-2025
|
$
|
105,016
|
|
$
|
9,208
|
|
||
We will continue to evaluate contributions to our Qualified Plan based on changes in pension assets as a result of asset performance in the current market and economic environment. Expected benefit payments are based on the same assumptions used to measure our benefit obligations at
September 27, 2015
and include estimated future employee service.
12. SHARE-BASED EMPLOYEE COMPENSATION
Stock incentive plans
—
We offer share-based compensation plans to attract, retain and motivate key officers, employees and non-employee directors to work toward the financial success of the Company.
Our stock incentive plans are administered by the Compensation Committee of the Board of Directors and have been approved by the stockholders of the Company. The terms and conditions of our share-based awards are determined by the Compensation Committee for each award date and may include provisions for the exercise price, expirations, vesting, restriction on sales and forfeitures, as applicable. We issue new shares to satisfy stock issuances under our stock incentive plans.
Our Amended and Restated 2004 Stock Incentive Plan authorizes the issuance of up to
11,600,000
common shares in connection with the granting of stock options, stock appreciation rights, restricted stock purchase rights, restricted stock bonuses, restricted stock units or performance units to key employees, directors, and other designated employees. As of
September 27, 2015
,
2,590,664
shares of common stock were available for future issuance under this plan.
We also maintain a deferred compensation plan for non-management directors under which those who are eligible to receive fees or retainers may choose to defer receipt of their compensation. The deferred amounts are converted to stock equivalents. The plan requires settlement in shares of our common stock based on the number of stock equivalents and dividend equivalents at the time of a participant’s separation from the Board of Directors. This plan provides for the issuance of up to
350,000
shares of common stock in connection with the crediting of stock equivalents. As of
September 27, 2015
,
143,122
shares of common stock were available for future issuance under this plan.
F-28
JACK IN THE BOX INC. AND SUBSIDIARIES
NOTES TO CONSOLIDATED FINANCIAL STATEMENTS
We terminated our employee stock purchase plan (“ESPP”) on February 26, 2015. The ESPP plan was available for all eligible employees to purchase shares of common stock at
95%
of the fair market value on the date of purchase. Employees could authorize us to withhold up to
15%
of their base compensation during any offering period, subject to certain limitations.
Compensation expense
—
The components of share-based compensation expense recognized in each year are as follows (
in thousands
):
|
2015
|
2014
|
2013
|
||||||||||
|
Stock options
|
$
|
2,782
|
|
$
|
2,660
|
|
$
|
5,075
|
|
|||
|
Performance share awards
|
4,229
|
|
3,923
|
|
2,311
|
|
||||||
|
Nonvested stock awards
|
156
|
|
310
|
|
430
|
|
||||||
|
Nonvested stock units
|
4,989
|
|
3,247
|
|
3,356
|
|
||||||
|
Deferred compensation for directors
|
264
|
|
218
|
|
220
|
|
||||||
|
Total share-based compensation expense
|
$
|
12,420
|
|
$
|
10,358
|
|
$
|
11,392
|
|
|||
Stock options
—
Prior to fiscal
2007
, options granted had contractual terms of
10
or
11
years and employee options generally vested over a
four
-year period. Beginning fiscal
2007
, option grants have contractual terms of
seven
years and employee options vest over a
three
-year period. Options may vest sooner for employees meeting certain age and years of service thresholds. All option grants provide for an option exercise price equal to the closing market value of the common stock on the date of grant.
The following is a summary of stock option activity for fiscal
2015
:
|
Shares
|
Weighted
Average
Exercise
Price
|
Weighted
Average
Remaining
Contractual
Term (Years)
|
Aggregate
Intrinsic
Value
(in thousands)
|
||||||||
|
Options outstanding at September 28, 2014
|
1,189,570
|
|
$26.74
|
||||||||
|
Granted
|
123,042
|
|
$73.53
|
||||||||
|
Exercised
|
(708,096
|
)
|
$21.29
|
||||||||
|
Forfeited
|
(10,168
|
)
|
$38.74
|
||||||||
|
Options outstanding at September 27, 2015
|
594,348
|
|
$42.72
|
4.66
|
$
|
21,984
|
|
||||
|
Options exercisable at September 27, 2015
|
285,820
|
|
$30.34
|
3.88
|
$
|
14,112
|
|
||||
|
Options exercisable and expected to vest at September 27, 2015
|
594,348
|
|
$42.72
|
4.66
|
$
|
21,984
|
|
||||
The aggregate intrinsic value in the table above is the amount by which the current market price of our stock on
September 27, 2015
exceeds the exercise price.
We use a valuation model to determine the fair value of options granted which requires the input of highly subjective assumptions, including the expected volatility of the stock price. The following table presents the weighted-average assumptions used for stock option grants in each fiscal year, along with the related weighted-average grant date fair value:
|
2015
|
2014
|
2013
|
||||||||||
|
Risk-free interest rate
|
1.78
|
%
|
2.05
|
%
|
1.09
|
%
|
||||||
|
Expected dividends yield
|
1.09
|
%
|
—
|
%
|
—
|
%
|
||||||
|
Expected stock price volatility
|
32.09
|
%
|
39.18
|
%
|
42.24
|
%
|
||||||
|
Expected life of options (in years)
|
6.00
|
|
6.50
|
|
6.50
|
|
||||||
|
Weighted-average grant date fair value
|
$
|
22.04
|
|
$
|
20.04
|
|
$
|
11.84
|
|
|||
The risk-free interest rate was determined by a yield curve of risk-free rates based on published U.S. Treasury spot rates in effect at the time of grant and has a term equal to the expected life of the related options. The dividend yield assumption is based on the Company’s history and expectations of dividend payouts at the grant date. We declared our first dividend on May 9, 2014. The expected stock price volatility in all years represents the Company’s historical volatility. The expected life of the options represents the period of time the options are expected to be outstanding and is based on historical trends.
As of
September 27, 2015
, there was approximately
$2.8 million
of total unrecognized compensation cost, net of estimated forfeitures, related to stock options grants which is expected to be recognized over a weighted-average period of
1.3
years. The total intrinsic value of stock options exercised was
$41.8 million
,
$42.4 million
and
$25.9 million
in
2015
,
2014
and
2013
, respectively.
F-29
JACK IN THE BOX INC. AND SUBSIDIARIES
NOTES TO CONSOLIDATED FINANCIAL STATEMENTS
Performance share awards
—
Performance share awards, granted in the form of stock units, represent a right to receive a certain number of shares of common stock based on the achievement of corporate performance goals and continued employment during the vesting period. Performance share awards issued to executives vest at the end of a
three
-year period and vested amounts may range from
0%
to as high as
150%
of targeted amounts depending on the achievement of performance measures at the end of a
three
-year period. The expected cost of the shares is based on the fair value of our stock on the date of grant and is reflected over the vesting period with a reduction for estimated forfeitures. These awards may be settled in cash or shares of common stock at the election of the Company on the date of grant. It is our intent to settle these awards with shares of common stock.
The following is a summary of performance share award activity for fiscal
2015
:
|
Shares
|
Weighted-
Average Grant
Date Fair
Value
|
||||
|
Performance share awards outstanding at September 28, 2014
|
330,203
|
|
$25.69
|
||
|
Granted
|
40,594
|
|
$73.53
|
||
|
Issued
|
(189,584
|
)
|
$26.70
|
||
|
Forfeited
|
(5,362
|
)
|
$48.54
|
||
|
Performance adjustments
|
(12,937
|
)
|
$27.49
|
||
|
Performance share awards outstanding at September 27, 2015
|
162,914
|
|
$59.37
|
||
As of
September 27, 2015
, there was approximately
$5.0 million
of total unrecognized compensation cost related to performance share awards which is expected to be recognized over a weighted-average period of
1.5
years. The weighted-average grant date fair value of awards granted was
$73.53
,
$47.29
and
$27.49
in
2015
,
2014
and
2013
, respectively. The total fair value of awards that became fully vested during
2015
,
2014
and
2013
was
$3.5 million
,
$3.6 million
and
$1.0 million
, respectively.
Nonvested stock awards
—
We previously issued nonvested stock awards (“RSAs”) to certain executives under our share ownership guidelines. Effective fiscal
2009
, we no longer issue RSA awards and have replaced them with grants of nonvested restricted stock units. The RSAs vest, subject to the discretion of our Board of Directors in certain circumstances, upon retirement or termination based upon years of service. These awards are amortized to compensation expense over the estimated vesting period based upon the fair value of our common stock on the award date. At
September 27, 2015
, RSAs outstanding totaled
95,815
shares with a weighted average grant date fair value of
$20.56
per share.
In fiscal 2015, there was no activity related to RSAs. As of
September 27, 2015
, there was approximately
$0.2 million
of total unrecognized compensation cost related to RSAs, which is expected to be recognized over a weighted-average period of
2.1
years.
Nonvested restricted stock units
—
Nonvested restricted stock units (“RSUs”) are generally issued to executives, non-management directors and certain other members of management and employees. Prior to fiscal
2011
, RSUs were granted to certain Executive and Senior Vice Presidents pursuant to our share ownership guidelines. These awards vest upon retirement or termination based on years of service. As of
September 27, 2015
,
60,272
of such RSUs were outstanding.
Beginning fiscal
2011
, we replaced the ownership share grants with time-vested RSUs for certain Vice Presidents and Officers that vest ratably over
five
years and have a
50%
or
100%
holding requirement on settled shares, which must be held until termination. As of
September 27, 2015
,
106,138
of such RSUs were outstanding. RSUs issued to non-management directors vest
12 months
from the date of grant, or upon termination of board service if the director elects to defer receipt, and totaled
40,468
units outstanding as of
September 27, 2015
. RSUs issued to certain other employees either cliff vest or vest ratably over
3
years and totaled
126,095
units outstanding as of
September 27, 2015
. These awards are amortized to compensation expense over the estimated vesting period based upon the fair value of our common stock on the award date discounted by the present value of the expected dividend stream over the vesting period.
F-30
JACK IN THE BOX INC. AND SUBSIDIARIES
NOTES TO CONSOLIDATED FINANCIAL STATEMENTS
The following is a summary of RSU activity for fiscal
2015
:
|
Shares
|
Weighted-
Average Grant
Date Fair
Value
|
||||
|
Nonvested stock units outstanding at September 28, 2014
|
330,871
|
|
$33.73
|
||
|
Granted
|
93,570
|
|
$75.07
|
||
|
Released
|
(69,720
|
)
|
$34.44
|
||
|
Forfeited
|
(21,748
|
)
|
$46.83
|
||
|
Nonvested stock units outstanding at September 27, 2015
|
332,973
|
|
$44.34
|
||
As of
September 27, 2015
, there was approximately
$6.8 million
of total unrecognized compensation cost related to RSUs, which is expected to be recognized over a weighted-average period of
2.7
years. The weighted-average grant date fair value of awards granted was
$75.07
,
$49.79
and
$28.95
in
2015
,
2014
and
2013
, respectively. In
2015
,
2014
and
2013
, the total fair value of RSUs that vested and were released was
$2.4 million
,
$3.5 million
and
$0.9 million
, respectively.
Non-management directors’ deferred compensation
—
All awards outstanding under our directors’ deferred compensation plan are accounted for as equity-based awards and deferred amounts are converted into stock equivalents at the then-current market price of our common stock. During fiscal
2014
and 2013,
10,616
and
44,714
shares of common stock were issued in connection with director retirements having a fair value of
$0.6 million
and
$1.4 million
, respectively. No common stock was issued in connection with director retirements in 2015.
The following is a summary of the stock equivalent activity for fiscal
2015
:
|
Stock
Equivalents
|
Weighted-
Average Grant
Date Fair
Value
|
||||
|
Stock equivalents outstanding at September 28, 2014
|
75,466
|
|
$23.44
|
||
|
Deferred directors’ compensation
|
2,761
|
|
$95.09
|
||
|
Dividend equivalents
|
931
|
|
$83.79
|
||
|
Stock equivalents outstanding at September 27, 2015
|
79,158
|
|
$26.64
|
||
Employee stock purchase plan
—
The following is a summary of shares issued pursuant to our ESPP in each fiscal year:
|
2015
|
2014
|
2013
|
||||||||||
|
Common stock issued
|
1,371
|
|
4,055
|
|
7,144
|
|
||||||
|
Fair value of common stock issued
|
$
|
70.78
|
|
$
|
49.25
|
|
$
|
29.71
|
|
|||
13. STOCKHOLDERS’ EQUITY
Repurchases of common stock
—
In February 2014 and July 2014, the Board of Directors approved two new programs which provided repurchase authorizations for up to
$200.0 million
and
$100.0 million
, respectively, in shares of our common stock, expiring November 2015. Additionally, in November 2014 and May 2015, the Board of Directors approved two
$100.0 million
stock buyback programs that expire in November 2016. In September 2015, the Board of Directors approved an additional
$200.0 million
stock buyback program commencing in fiscal year 2016 and expiring in November 2017. During fiscal 2015, we repurchased
3.7 million
shares at an aggregate cost of
$317.1 million
. As of
September 27, 2015
, there was approximately
$25,500
remaining under a May 2015 stock buyback program which expires in November 2016, and an additional
$200.0 million
remaining under a September 2015 stock buyback program commencing in fiscal 2016 and expiring in November 2017.
Dividends
—
In fiscal 2015, the Board of Directors declared two cash dividends of
$0.20
per share each, and two cash dividends of
$0.30
per share each totaling
$37.6 million
. Future dividends are subject to approval by our Board of Directors.
F-31
JACK IN THE BOX INC. AND SUBSIDIARIES
NOTES TO CONSOLIDATED FINANCIAL STATEMENTS
14. AVERAGE SHARES OUTSTANDING
Our basic earnings per share calculation is computed based on the weighted-average number of common shares outstanding. Our diluted earnings per share calculation is computed based on the weighted-average number of common shares outstanding adjusted by the number of additional shares that would have been outstanding had the potentially dilutive common shares been issued. Potentially dilutive common shares include stock options, nonvested stock awards and units, non-management director stock equivalents and shares issuable under our ESPP. Performance share awards are included in the average diluted shares outstanding each period if the performance criteria have been met at the end of the respective periods.
The following table reconciles basic weighted-average shares outstanding to diluted weighted-average shares outstanding (
in thousands
):
|
2015
|
2014
|
2013
|
|||||||
|
Weighted-average shares outstanding — basic
|
37,587
|
|
40,781
|
|
43,351
|
|
|||
|
Effect of potentially dilutive securities:
|
|||||||||
|
Stock options
|
274
|
|
641
|
|
957
|
|
|||
|
Nonvested stock awards and units
|
199
|
|
281
|
|
371
|
|
|||
|
Performance share awards
|
155
|
|
270
|
|
220
|
|
|||
|
Weighted-average shares outstanding — diluted
|
38,215
|
|
41,973
|
|
44,899
|
|
|||
|
Excluded from diluted weighted-average shares outstanding:
|
|||||||||
|
Antidilutive
|
84
|
|
153
|
|
145
|
|
|||
|
Performance conditions not satisfied at the end of the period
|
15
|
|
20
|
|
209
|
|
|||
15. VARIABLE INTEREST ENTITIES
In January 2011, we formed Jack in the Box Franchise Finance, LLC (“FFE”) for the purpose of operating a franchisee lending program to assist Jack in the Box franchisees in re-imaging their restaurants. We are the sole equity investor in FFE. The lending program was comprised of a
$20.0 million
commitment from the Company in the form of a capital note and an
$80.0 million
Senior Secured Revolving Securitization Facility (“FFE Facility”) entered into with a third party. The lending period and the revolving period expired in
June 2012
. At
September 27, 2015
and September 28, 2014, we had
no
borrowings under the FFE Facility and do not plan to make any further contributions.
We determined that FFE is a VIE and that the Company is its primary beneficiary. We considered a variety of factors in identifying the primary beneficiary of FFE including, but not limited to, who holds the power to direct matters that most significantly impact FFE’s economic performance (such as determining the underwriting standards and credit management policies), as well as what party has the obligation to absorb the losses of FFE. Based on these considerations, we determined that the Company is the primary beneficiary and the entity is reflected in the accompanying consolidated financial statements.
F-32
JACK IN THE BOX INC. AND SUBSIDIARIES
NOTES TO CONSOLIDATED FINANCIAL STATEMENTS
FFE’s assets consolidated by the Company represent assets that can be used only to settle obligations of the consolidated VIE. Likewise, FFE’s liabilities consolidated by the Company do not represent additional claims on the Company’s general assets; rather they represent claims against the specific assets of FFE. The impact of FFE’s results were not material to the Company’s consolidated statement of earnings or cash flows. FFE’s balance sheet consisted of the following at
September 27, 2015
and September 28, 2014 (
in thousands
):
|
2015
|
2014
|
||||||
|
Cash
|
$
|
100
|
|
$
|
—
|
|
|
|
Other current assets (1)
|
1,037
|
|
2,494
|
|
|||
|
Other assets, net (1)
|
1,928
|
|
5,776
|
|
|||
|
Total assets
|
$
|
3,065
|
|
$
|
8,270
|
|
|
|
Current liabilities (2)
|
$
|
1,134
|
|
$
|
2,833
|
|
|
|
Other long-term liabilities (2)
|
1,793
|
|
5,367
|
|
|||
|
Retained earnings
|
138
|
|
70
|
|
|||
|
Total liabilities and stockholders’ equity
|
$
|
3,065
|
|
$
|
8,270
|
|
|
____________________________
(1)
Consists primarily of amounts due from franchisees.
(2)
Consists primarily of the capital note contribution from Jack in the Box which is eliminated in consolidation.
In 2015, we received
$3.9 million
of early prepayments on notes receivable due from franchisees, which increased our cash flows from investing activities in the year-to-date period.
The Company’s maximum exposure to loss is equal to its outstanding contributions as of
September 27, 2015
. This amount represents estimated losses that would be incurred should all franchisees default on their loans without any consideration of recovery. To offset the credit risk associated with the Company’s variable interest in FFE, the Company holds a security interest in the assets of FFE subordinate and junior to all other obligations of FFE.
16. COMMITMENTS, CONTINGENCIES AND LEGAL MATTERS
Commitments
—
As of
September 27, 2015
, we had unconditional purchase obligations during the next five fiscal years as follows (
in thousands
):
|
2016
|
$
|
802,700
|
|
|
|
2017
|
567,500
|
|
||
|
2018
|
247,600
|
|
||
|
2019
|
206,400
|
|
||
|
2020
|
200,100
|
|
||
|
Total
|
$
|
2,024,300
|
|
|
These obligations primarily represent amounts payable under purchase contracts for goods related to system-wide restaurant operations.
Legal matters
—
The Company assesses contingencies, including litigation contingencies, to determine the degree of probability and range of possible loss for potential accrual in its financial statements. An estimated loss contingency is accrued in the financial statements if it is probable that a liability has been incurred and the amount of the loss can be reasonably estimated. Because litigation is inherently unpredictable, assessing contingencies is highly subjective and requires judgments about future events. When evaluating litigation contingencies, we may be unable to provide a meaningful estimate due to a number of factors, including the procedural status of the matter in question, the availability of appellate remedies, insurance coverage related to the claim or claims in question, the presence of complex or novel legal theories, and/or the ongoing discovery and development of information important to the matter. In addition, damage amounts claimed in litigation against us may be unsupported, exaggerated or unrelated to possible outcomes, and as such are not meaningful indicators of our potential liability or financial exposure. The Company regularly reviews contingencies to determine the adequacy of the accruals and related disclosures. The ultimate amount of loss may differ from these estimates.
F-33
JACK IN THE BOX INC. AND SUBSIDIARIES
NOTES TO CONSOLIDATED FINANCIAL STATEMENTS
Gessele v. Jack in the Box Inc.
— In August 2010, five former employees instituted litigation in federal court in Oregon alleging claims under the federal Fair Labor Standards Act and Oregon wage and hour laws. The plaintiffs alleged that the Company failed to pay non-exempt employees for certain meal breaks and improperly made payroll deductions for shoe purchases and for workers’ compensation expenses, and later added additional claims relating to timing of final pay and related wage and hour claims involving employees of a franchisee. The most recent complaint seeks damages of
$45.0 million
but does not provide a basis for that amount. In fiscal 2012, we accrued for a single claim for which we believe a loss is both probable and estimable; this accrued loss contingency did not have a material effect on our results of operations. We have not established a loss contingency accrual for those claims as to which we believe liability is not probable or estimable, and we plan to vigorously defend against this lawsuit. Nonetheless, an unfavorable resolution of this matter in excess of our current accrued loss contingencies could have a material adverse effect on our business, results of operations, liquidity or financial condition.
Other legal matters
— In addition to the matter described above, the Company is subject to normal and routine litigation brought by former, current or prospective employees, customers, franchisees, vendors, landlords, shareholders or others. We intend to defend ourselves in any such matters. Some of these matters may be covered, at least in part, by insurance. Our insurance liability (undiscounted) and reserves are established in part by using independent actuarial estimates of expected losses for reported claims and for estimating claims incurred but not reported. As of
September 27, 2015
, our estimated liability for general liability and workers’ compensation claims exceeded our self-insurance retention limits by
$25.8 million
. We expect to be fully covered for these amounts by surety bond issuers or our insurance providers. Although the Company currently believes that the ultimate determination of liability in connection with legal claims pending against it, if any, in excess of amounts already provided for these matters in the consolidated financial statements will not have a material adverse effect on our business, the Company’s annual results of operations, liquidity or financial position, it is possible that our results of operations, liquidity, or financial position could be materially affected in a particular future reporting period by the unfavorable resolution of one or more of these matters or contingencies during such period.
Lease guarantees
—
In connection with the sale of the distribution business, we have assigned the lease at
one
of our distribution centers to a third party. Under this agreement, which expires in 2017, the Company remains secondarily liable for the lease payments for which we were responsible under the original lease. As of
September 27, 2015
, the amount remaining under this lease guarantee totaled
$1.3 million
. We have not recorded a liability for this guarantee as the likelihood of the third party defaulting on the assignment agreements was deemed to be less than probable.
17. SEGMENT REPORTING
Our principal business consists of developing, operating and franchising our Jack in the Box and Qdoba restaurant concepts, each of which we consider reportable operating segments. Since the beginning of 2012, we have been engaged in restructuring activities related to our internal organization and have now instituted a shared-services model (refer also to Note 9,
Impairment and Other Charges, Net
). As a result, in fiscal 2014, our chief operating decision makers, which consist of a collective group of executive leadership, revised the method by which they determine performance and strategy for our segments. This change was made to reflect a shared-services model whereby each brand’s results of operations are assessed separately and do not include costs related to certain corporate functions which support both brands. Our segment reporting structure reflects the Company’s current management structure, internal reporting method and financial information used in deciding how to allocate Company resources. Based upon certain quantitative thresholds, each operating segment is considered a reportable segment. This change to our segment reporting did not change our reporting units for goodwill.
F-34
JACK IN THE BOX INC. AND SUBSIDIARIES
NOTES TO CONSOLIDATED FINANCIAL STATEMENTS
We measure and evaluate our segments based on segment revenues and earnings from operations. The reportable segments do not include an allocation of the costs related to shared service functions, such as accounting/finance, human resources, audit services, legal, tax and treasury; nor do they include unallocated costs such as pension expense and share-based compensation. These costs are reflected in the caption “Shared services and unallocated costs,” and therefore, the measure of segment profit or loss is before such items. As it was impractical to recast prior period information, 2014 segment information is reported under both the old basis and new basis of segmentation (
in thousands
):
|
2015
|
2014
|
2013
|
|||||||||||||
|
(New)
|
(Old)
|
||||||||||||||
|
Revenues by Segment:
|
|||||||||||||||
|
Jack in the Box restaurant operations
|
$
|
1,145,176
|
|
$
|
1,127,243
|
|
$
|
1,127,243
|
|
$
|
1,179,295
|
|
|||
|
Qdoba restaurant operations
|
395,141
|
|
356,888
|
|
356,888
|
|
310,572
|
|
|||||||
|
Consolidated revenues
|
$
|
1,540,317
|
|
$
|
1,484,131
|
|
$
|
1,484,131
|
|
$
|
1,489,867
|
|
|||
|
Earnings from Operations by Segment:
|
|||||||||||||||
|
Jack in the Box restaurant operations
|
$
|
265,230
|
|
$
|
235,574
|
|
$
|
130,408
|
|
$
|
113,864
|
|
|||
|
Qdoba restaurant operations
|
47,264
|
|
34,287
|
|
32,016
|
|
24,470
|
|
|||||||
|
FFE operations (1)
|
—
|
|
—
|
|
(116
|
)
|
(129
|
)
|
|||||||
|
Shared services and unallocated costs
|
(112,182
|
)
|
(104,005
|
)
|
—
|
|
—
|
|
|||||||
|
Losses on the sale of company-operated restaurants
|
(3,139
|
)
|
(3,548
|
)
|
—
|
|
—
|
|
|||||||
|
Consolidated earnings from operations
|
197,173
|
|
162,308
|
|
162,308
|
|
138,205
|
|
|||||||
|
Interest expense, net
|
18,803
|
|
15,678
|
|
15,678
|
|
15,251
|
|
|||||||
|
Consolidated earnings from continuing operations and before income taxes
|
$
|
178,370
|
|
$
|
146,630
|
|
$
|
146,630
|
|
$
|
122,954
|
|
|||
|
Total Expenditures for Long-Lived Assets by Segment (Including Discontinued Operations):
|
|||||||||||||||
|
Jack in the Box restaurant operations
|
$
|
41,928
|
|
$
|
30,858
|
|
$
|
38,132
|
|
$
|
55,221
|
|
|||
|
Qdoba restaurant operations
|
34,071
|
|
17,967
|
|
22,393
|
|
29,469
|
|
|||||||
|
Shared services and unallocated costs
|
10,227
|
|
11,700
|
|
—
|
|
—
|
|
|||||||
|
Consolidated expenditures for long-lived assets
|
$
|
86,226
|
|
$
|
60,525
|
|
$
|
60,525
|
|
$
|
84,690
|
|
|||
|
Total Depreciation Expense by Segment:
|
|||||||||||||||
|
Jack in the Box restaurant operations
|
$
|
64,597
|
|
$
|
66,409
|
|
$
|
73,663
|
|
$
|
76,191
|
|
|||
|
Qdoba restaurant operations
|
17,103
|
|
16,992
|
|
16,992
|
|
15,815
|
|
|||||||
|
Shared services and unallocated costs
|
7,078
|
|
7,254
|
|
—
|
|
—
|
|
|||||||
|
Consolidated depreciation expense
|
$
|
88,778
|
|
$
|
90,655
|
|
$
|
90,655
|
|
$
|
92,006
|
|
|||
____________________________
(1) FFE operations are included in the Jack in the Box operations segment under the new basis of segmentation.
We do not evaluate, manage or measure performance of segments using asset, interest income and expense, or income tax information; accordingly, this information by segment is not prepared or disclosed.
18. SUPPLEMENTAL CONSOLIDATED CASH FLOW INFORMATION
Additional information related to cash flows is as follows (
in thousands
):
|
2015
|
2014
|
2013
|
||||||||||
|
Cash paid during the year for:
|
||||||||||||
|
Interest, net of amounts capitalized
|
$
|
16,233
|
|
$
|
13,754
|
|
$
|
12,824
|
|
|||
|
Income tax payments
|
$
|
28,764
|
|
$
|
29,145
|
|
$
|
43,365
|
|
|||
|
Non cash transactions:
|
||||||||||||
|
Equipment capital lease obligations incurred
|
$
|
16,770
|
|
$
|
—
|
|
$
|
—
|
|
|||
|
(Decrease) increase in accrued stock repurchases
|
$
|
(3,112
|
)
|
$
|
(4,176
|
)
|
$
|
7,288
|
|
|||
|
Increase in dividends accrued or converted to common stock equivalents
|
$
|
174
|
|
$
|
68
|
|
$
|
—
|
|
|||
|
Increase (decrease) in obligation for purchases of property and equipment (1)
|
$
|
5,388
|
|
$
|
(1,187
|
)
|
$
|
(1,274
|
)
|
|||
____________________________
(1) In 2013, amounts also include changes in obligations related to assets held for sale.
F-35
JACK IN THE BOX INC. AND SUBSIDIARIES
NOTES TO CONSOLIDATED FINANCIAL STATEMENTS
19. SUPPLEMENTAL CONSOLIDATED FINANCIAL STATEMENT INFORMATION (
in thousands
)
|
September 27,
2015 |
September 28,
2014 |
|||||||
|
Accounts and other receivables, net:
|
||||||||
|
Trade
|
$
|
36,990
|
|
$
|
35,975
|
|
||
|
Income tax receivable
|
7,914
|
|
8,306
|
|
||||
|
Notes receivable
|
1,726
|
|
3,574
|
|
||||
|
Other
|
2,900
|
|
2,955
|
|
||||
|
Allowance for doubtful accounts
|
(1,555
|
)
|
(796
|
)
|
||||
|
$
|
47,975
|
|
$
|
50,014
|
|
|||
|
Prepaid expenses
|
||||||||
|
Prepaid income taxes
|
$
|
7,645
|
|
$
|
27,956
|
|
||
|
Other
|
8,595
|
|
8,358
|
|
||||
|
$
|
16,240
|
|
$
|
36,314
|
|
|||
|
Other assets, net:
|
||||||||
|
Company-owned life insurance policies
|
$
|
99,513
|
|
$
|
100,753
|
|
||
|
Deferred tax assets
|
78,151
|
|
50,807
|
|
||||
|
Deferred rent receivable
|
45,330
|
|
41,872
|
|
||||
|
Other
|
40,941
|
|
43,866
|
|
||||
|
$
|
263,935
|
|
$
|
237,298
|
|
|||
|
Accrued liabilities:
|
||||||||
|
Payroll and related taxes
|
$
|
56,223
|
|
$
|
54,905
|
|
||
|
Insurance
|
35,370
|
|
34,834
|
|
||||
|
Advertising
|
20,692
|
|
21,452
|
|
||||
|
Sales and property taxes
|
11,574
|
|
11,760
|
|
||||
|
Gift card liability
|
4,608
|
|
4,064
|
|
||||
|
Deferred franchise fees
|
1,198
|
|
1,464
|
|
||||
|
Other
|
40,910
|
|
35,147
|
|
||||
|
$
|
170,575
|
|
$
|
163,626
|
|
|||
|
Other long-term liabilities:
|
||||||||
|
Pension plans
|
$
|
180,476
|
|
$
|
143,838
|
|
||
|
Straight-line rent accrual
|
46,807
|
|
48,835
|
|
||||
|
Other
|
142,775
|
|
116,762
|
|
||||
|
$
|
370,058
|
|
$
|
309,435
|
|
|||
F-36
JACK IN THE BOX INC. AND SUBSIDIARIES
NOTES TO CONSOLIDATED FINANCIAL STATEMENTS
20.
UNAUDITED QUARTERLY RESULTS OF OPERATIONS
(
in thousands, except per share data
)
|
|
16 Weeks
Ended
|
12 Weeks Ended
|
||||||||||||||
|
Fiscal Year 2015
|
January 18,
2015 |
April 12,
2015 |
July 5,
2015 |
September 27,
2015 |
||||||||||||
|
Revenues
|
$
|
468,621
|
|
$
|
358,122
|
|
$
|
359,506
|
|
$
|
354,068
|
|
||||
|
Earnings from operations
|
$
|
63,236
|
|
$
|
41,868
|
|
$
|
50,395
|
|
$
|
41,674
|
|
||||
|
Net earnings
|
$
|
35,835
|
|
$
|
23,005
|
|
$
|
26,831
|
|
$
|
23,141
|
|
||||
|
Net earnings per share:
|
||||||||||||||||
|
Basic
|
$
|
0.93
|
|
$
|
0.61
|
|
$
|
0.72
|
|
$
|
0.64
|
|
||||
|
Diluted
|
$
|
0.91
|
|
$
|
0.60
|
|
$
|
0.71
|
|
$
|
0.63
|
|
||||
|
|
16 Weeks
Ended |
12 Weeks Ended
|
||||||||||||||
|
Fiscal Year 2014
|
January 19,
2014 |
April 13,
2014 |
July 6,
2014 |
September 28,
2014 |
||||||||||||
|
Revenues
|
$
|
450,081
|
|
$
|
340,870
|
|
$
|
348,492
|
|
$
|
344,687
|
|
||||
|
Earnings from operations
|
$
|
57,204
|
|
$
|
32,879
|
|
$
|
43,000
|
|
$
|
29,225
|
|
||||
|
Net earnings
|
$
|
32,286
|
|
$
|
15,801
|
|
$
|
24,703
|
|
$
|
16,160
|
|
||||
|
Net earnings per share:
|
||||||||||||||||
|
Basic
|
$
|
0.76
|
|
$
|
0.38
|
|
$
|
0.62
|
|
$
|
0.41
|
|
||||
|
Diluted
|
$
|
0.74
|
|
$
|
0.37
|
|
$
|
0.61
|
|
$
|
0.40
|
|
||||
During the quarter ended September 28, 2014, we recorded an adjustment to decrease tax expense by
$2.1 million
due to the impact of a change in state tax law enacted July 2013 related to California enterprise zone tax credits.
21. SUBSEQUENT EVENTS
Declaration of dividend
— On November 12, 2015, the Board of Directors declared a cash dividend of
$0.30
per share, to be paid on December 22, 2015 to shareholders of record as of the close of business on December 9, 2015. Future dividends will be subject to approval by our Board of Directors.
F-37
TABLE OF CONTENTS
Part IItem 1. BusinessItem 1A. Risk FactorsItem 1B. Unresolved Staff CommentsItem 2. PropertiesItem 3. Legal ProceedingsItem 4. Mine Safety DisclosuresPart IIItem 5. Market For Registrant S Common Equity, Related Stockholder Matters and Issuer Purchases Of Equity SecuritiesItem 6. Selected Financial DataItem 7. Management S Discussion and Analysis Of Financial Condition and Results Of OperationsItem 7A. Quantitative and Qualitative Disclosures About Market RiskItem 8. Financial Statements and Supplementary DataItem 9. Changes in and Disagreements with Accountants on Accounting and Financial DisclosureItem 9A. Controls and ProceduresItem 9B. Other InformationPart IIIItem 10. Directors, Executive Officers and Corporate GovernanceItem 11. Executive CompensationItem 12. Security Ownership Of Certain Beneficial Owners and Management and Related Stockholder MattersItem 13. Certain Relationships and Related Transactions, and Director IndependenceItem 14. Principal Accounting Fees and ServicesPart IVItem 15. Exhibits, Financial Statement SchedulesItem 15(a) (1) Financial Statements . See Index To Consolidated Financial Statements on Page F-1 Of This ReportItem 15(a) (1)Item 15(a) (2) Financial Statement Schedules . NoneItem 15(a) (2)Item 15(a) (3) ExhibitsItem 15(a) (3)Item 15(b) All Required Exhibits Are Filed Herein Or Incorporated By Reference As Described in Item 15(a)(3)