JAKKS PACIFIC INC
10-Ks and 10-Qs
|
|
|
|
|
|
|
|
|
|
|
|
|
|
|
|
|
|
|
|
|
|
|
|
|
|
|
|
|
|
|
|
|
|
|
|
|
|
|
|
|
|
|
|
|
|
|
|
|
|
|
|
|
|
|
|
|
|
|
|
|
|
UNITED STATES
SECURITIES AND EXCHANGE COMMISSION
Washington, D.C. 20549
FORM 10-K
(Mark One)
|
x
|
ANNUAL REPORT UNDER SECTION 13 OR 15(d) OF THE SECURITIES EXCHANGE ACT OF 1934
|
|
For the Fiscal Year Ended December 31, 2012
|
|
|
o
|
TRANSITION REPORT UNDER SECTION 13 OR 15(d)OF THE SECURITIES EXCHANGE ACT OF 1934
|
For the transition period from ____________ to ____________
Commission File Number 0-28104
JAKKS PACIFIC, INC.
(Exact name of registrant as specified in its charter)
|
Delaware
|
95-4527222
|
|
(State or other jurisdiction of
|
(I.R.S. Employer
|
|
incorporation or organization)
|
Identification No.)
|
|
22619 Pacific Coast Highway
|
|
|
Malibu, California
|
90265
|
|
(Address of principal executive offices)
|
(Zip Code)
|
Registrant’s telephone number, including area code: (310) 456-7799
Securities registered pursuant to Section 12(b) of the Exchange Act:
|
Title of each class
|
Name of each exchange
on which registered
|
|
Common Stock, $.001 par value per share
|
Nasdaq Global Select
|
Securities registered pursuant to Section 12(g) of the Exchange Act:
Title of Class
Common Stock, $.001 par value per share
Indicate by check mark if the registrant is a well-known seasoned issuer, as defined in Rule 405 of the Securities Act. Yes
o
No
x
Indicate by check mark if the registrant is not required to file reports pursuant to Section 13 or Section 15 of the Act. Yes
o
No
x
Indicate by check mark whether the registrant (1) has filed all reports required to be filed by Section 13 or 15(d) of the Securities Exchange Act of 1934 during the preceding 12 months (or for such shorter period that the registrant was required to file such reports), and (2) has been subject to such filing requirements for the past 90 days. Yes
x
No
o
Indicate by check mark whether the registrant has submitted electronically and posted on its corporate web site, if any, every Interactive Data File required to be submitted and posted pursuant to Rule 405 of Regulation S-T during the preceding 12 months (or for such shorter period that the registrant was required to submit and post such files). Yes
x
No
o
Indicate by check mark if disclosure of delinquent filers pursuant to Item 405 of Regulation S-K is not contained herein, and will not be contained, to the best of registrant’s knowledge, in definitive proxy or information statements incorporated by reference in Part III of this Form 10-K or any amendment to this Form 10-K.
o
Indicate by a check mark whether the registrant is a large accelerated filer, an accelerated filer, a non-accelerated filer or a smaller reporting company. See the definition of “large accelerated filer,” “large accelerated filer” and “smaller reporting company” in Rule 12b-2 of the Exchange Act. (check one):
|
o
Large Accelerated Filer
|
x
Accelerated Filer
|
o
Non-Accelerated Filer
|
o
Smaller Reporting Company
|
|
|
|
(Do not check if a Smaller Reporting Company)
|
|
Indicate by check mark whether the registrant is a shell company (as defined in Rule 12b-2 of the Exchange Act). Yes
o
No
x
The aggregate market value of the voting and non-voting common equity (the only such common equity being Common Stock, $.001 par value per share) held by non-affiliates of the registrant (computed by reference to the closing sale price of the Common Stock on June 29, 2012 of $16.01) is $350,398,959.
The number of shares outstanding of the registrant’s Common Stock, $.001 par value (being the only class of its common stock), is 22,307,838 (as of March 15, 2013).
Documents Incorporated by Reference
None.
JAKKS PACIFIC, INC.
INDEX TO ANNUAL REPORT ON FORM 10-K
For the Fiscal Year ended December 31, 2012
Items in Form 10-K
|
Page
|
||
|
PART I
|
||
|
2
|
||
|
11
|
||
|
Item 1B.
|
Unresolved Staff Comments
|
None
|
|
16
|
||
|
17
|
||
|
N/A
|
||
|
PART II
|
||
|
19
|
||
|
23
|
||
|
25
|
||
|
38
|
||
|
40
|
||
|
Item 9.
|
Changes in and Disagreements With Accountants on Accounting and Financial Disclosure
|
None
|
|
75
|
||
|
Item 9B.
|
Other Information
|
None
|
|
PART III
|
||
|
77
|
||
|
80
|
||
|
94
|
||
|
96
|
||
|
96
|
||
|
PART IV
|
||
|
98
|
||
|
100
|
||
|
Certifications
|
DISCLOSURE REGARDING FORWARD-LOOKING STATEMENTS
This report includes “forward-looking statements” within the meaning of Section 27A of the Securities Act of 1933 and Section 21E of the Securities Exchange Act of 1934. For example, statements included in this report regarding our financial position, business strategy and other plans and objectives for future operations, and assumptions and predictions about future product demand, supply, manufacturing, costs, marketing and pricing factors are all forward-looking statements. When we use words like “intend,” “anticipate,” “believe,” “estimate,” “plan” or “expect,” we are making forward-looking statements. We believe that the assumptions and expectations reflected in such forward-looking statements are reasonable, based upon information available to us on the date hereof, but we cannot assure you that these assumptions and expectations will prove to have been correct or that we will take any action that we may presently be planning. We have disclosed certain important factors that could cause our actual results to differ materially from our current expectations elsewhere in this report. You should understand that forward-looking statements made in this report are necessarily qualified by these factors. We are not undertaking to publicly update or revise any forward-looking statement if we obtain new information or upon the occurrence of future events or otherwise.
1
In this report, “JAKKS,” the “Company,” “we,” “us” and “our” refer to JAKKS Pacific, Inc. and its subsidiaries.
Company Overview
We are a leading multi-line, multi-brand toy company that designs, produces, markets and distributes toys and related products, pet toys, consumables and related products, electronics and related products, kids indoor and outdoor furniture, and other consumer products. We focus our business on acquiring or licensing well-recognized trademarks and brand names, most with long product histories (“evergreen brands”). We seek to acquire these evergreen brands because we believe they are less subject to market fads or trends. We also develop proprietary products marketed under our own trademarks and brand names, and have historically acquired complementary businesses to further grow our portfolio. For accounting purposes, our products can be divided into two segments: (i) traditional toys and electronics and (ii) role play, novelty and seasonal toys. Segment information with respect to revenues, assets and profits or losses attributable to each segment is contained in Note 3 to the audited financial statements contained below in Item 8. Our products include:
Traditional Toys and Electronics
| ● | Action figures and accessories, including licensed characters, principally based on Monsuno, Batman, Ultimate Fighting Champion (UFC), Total Non-Stop Action (TNA) wrestling and Pokémon ® franchises; | |
| ● | Toy vehicles, including Road Champs ®, Fly Wheels® and MXS ® toy vehicles and accessories; | |
| ● | Electronics products, including SpyNet spy products, EyeClops™ Bionic Eye products, Laser Challenge ® and Plug It In & Play TV Games ™ based on Disney® brands and other popular brands; | |
| ● | Dolls and accessories, including small dolls, large dolls, fashion dolls and baby dolls based on licenses, including Disney Princess®, Disney Fairies®, Cabbage Patch Kids®, Hello Kitty®, Graco® and Fisher Price® plush, infant and pre-school toys; | |
| ● |
Private label products as “exclusives” for a myriad of retail customers in many product categories; and
|
|
| ● | Pet products, including toys, consumables, and accessories, branded JAKKS Pets®, some of which also feature licenses, including Kong ® . In 2011, we launched our proprietary brand of assorted pet products under American Classics ™. |
Role Play, Novelty and Seasonal Toys
| ● | Food play and activity kits, including, Creepy Crawlers ™ and BloPens®, | |
| ● | Role play, dress-up, pretend play and novelty products for boys and girls based on well known brands and entertainment properties such as Black & Decker®, McDonald’s ®, Dirt Devil ®, Disney Princess ®, Disney Fairies® and Dora the Explorer ®, as well as those based on our own proprietary brands; | |
| ● | Indoor and outdoor kids’ furniture, activity trays and tables and room décor; kiddie pools, seasonal and outdoor products, including those based on Crayola®, Disney® characters and more, and Funnoodle ® pool floats; and | |
| ● | Halloween and everyday costumes for all ages based on licensed and proprietary non-licensed brands, including Spiderman®, Iron Man, Toy Story®, Sesame Street®, Power Rangers®¸Hasbro® brands and Disney Princess®, and related Halloween accessories. | |
2
We continually review the marketplace to identify and evaluate popular and evergreen brands and product categories that we believe have the potential for growth. We endeavor to generate growth within these lines by:
|
●
|
creating innovative products under our established licenses and brand names;
|
|
●
|
adding new items to the branded product lines that we expect will enjoy greater popularity;
|
|
●
|
infusing innovation and technology when appropriate to make them more appealing to today’s kids; and
|
|
●
|
focusing our marketing efforts to enhance consumer recognition and retailer interest.
|
Our Business Strategy
In addition to developing our own proprietary brands and marks, licensing popular trademarks enables us to use these high-profile marks at a lower cost than we would incur if we purchased these marks or developed comparable marks on our own. By licensing trademarks, we have access to a far greater range of marks than would be available for purchase. We also license technology developed by unaffiliated inventors and product developers to enhance the design and functionality of our products.
We sell our products through our in-house sales staff and independent sales representatives to toy and mass-market retail chain stores, department stores, office supply stores, drug and grocery store chains, club stores, toy specialty stores and wholesalers. Our three largest customers are Wal-Mart, Target and Toys ‘R’ Us, which accounted for approximately 18.1%, 16.2% and 12.5%, respectively, of our net sales in 2012. No other customer accounted for more than 10.0% of our net sales in 2012.
Our Growth Strategy
The execution of our growth strategy has normally resulted in increased levels of revenues and earnings. However, in 2011 and 2012, we experienced a decline in sales mainly due to declines in a few key product lines and a challenging economy. In 2011 and 2012, we generated net sales of $677.8 million and $666.8 million, respectively, and net income of $8.5 million and net loss of $104.8 million, respectively. Approximately 32.2% and 42.4% of our net sales in 2011 and 2012, respectively, were attributable to our acquisitions since 2008. Key elements of our growth strategy include:
●
Expand Core Products.
We manage our existing and new brands through strategic product development initiatives, including introducing new products, modifying existing products and extending existing product lines to maximize their longevity. Our marketing teams and product designers strive to develop new products or product lines to offer added technological, aesthetic and functional improvements to our extensive portfolio.
●
Enter New Product Categories.
We use our extensive experience in the toy and other consumer product industries to evaluate products and licenses in new product categories and to develop additional product lines. We began marketing licensed classic video games for simple plug-in use with television sets and expanded into several related categories by infusing additional technologies such as motion gaming and through the licensing of this category from our current licensors, such as Disney
®
and MTV Networks which owns
Nickelodeon
®
.
●
Pursue Strategic Acquisitions.
We supplement our internal growth with selected strategic acquisitions. Most recently, in July 2012 we acquired the business of Maui, Inc., an Ohio corporation, Kessler Services, Inc., a Nevada corporation, and A.S. Design Limited, a Hong Kong corporation (collectively, “Maui”). Maui is a leading manufacturer and distributor of spring and summer activity toys and impulse toys. We will continue focusing our acquisition strategy on businesses or brands that we believe have compatible product lines and/or offer valuable trademarks or brands.
3
●
Acquire Additional Character and Product Licenses.
We have acquired the rights to use many familiar brand and character names and logos from third parties that we use with our primary trademarks and brands. Currently, among others, we have license agreements with
Nickelodeon
,
Disney
®, UFC and
Warner Bros
®, as well as with the licensors of the many popular licensed children’s characters previously mentioned, among others. We intend to continue to pursue new licenses from these entertainment and media companies and other licensors. We also intend to continue to purchase additional inventions and product concepts through our existing network of inventors and product developers.
●
Expand International Sales.
We believe that foreign markets, especially Europe, Australia, Canada, Latin America and Asia, offer us significant growth opportunities. In 2012, our sales generated outside the United States were approximately $132.0 million, or 19.8% of total net sales. We intend to continue to expand our international sales and in 2012 opened sales offices and expanded distribution agreements in Latin America and China to capitalize on our experience and our relationships with foreign distributors and retailers.
We expect these initiatives to continue to contribute to our international growth in 2013.
●
Capitalize On Our Operating Efficiencies.
We believe that our current infrastructure and operating model can accommodate growth without a proportionate increase in our operating and administrative expenses, thereby increasing our operating margins.
The execution of our growth strategy, however, is subject to several risks and uncertainties and we cannot assure you that we will continue to experience growth in, or maintain our present level of net sales (see “Risk Factors,” beginning on
page 11
).
For example, our growth strategy will place additional demands upon our management, operational capacity and financial resources and systems. The increased demand upon management may necessitate our recruitment and retention of additional qualified management personnel. We cannot assure you that we will be able to recruit and retain qualified personnel or expand and manage our operations effectively and profitably. To effectively manage future growth, we must continue to expand our operational, financial and management information systems and to train, motivate and manage our work force. While we believe that our operational, financial and management information systems will be adequate to support our future growth, no assurance can be given they will be adequate without significant investment in our infrastructure. Failure to expand our operational, financial and management information systems or to train, motivate or manage employees could have a material adverse effect on our business, financial condition and results of operations.
Moreover, implementation of our growth strategy is subject to risks beyond our control, including competition, market acceptance of new products, changes in economic conditions, our ability to obtain or renew licenses on commercially reasonable terms and our ability to finance increased levels of accounts receivable and inventory necessary to support our sales growth, if any.
Furthermore, we cannot assure you that we can identify attractive acquisition candidates or negotiate acceptable acquisition terms, and our failure to do so may adversely affect our results of operations and our ability to sustain growth.
Finally, our acquisition strategy involves a number of risks, each of which could adversely affect our operating results, including difficulties in integrating acquired businesses or product lines, assimilating new facilities and personnel and harmonizing diverse business strategies and methods of operation; diversion of management attention from operation of our existing business; loss of key personnel from acquired companies; and failure of an acquired business to achieve targeted financial results.
4
Industry Overview
According to Toy Industry Association, Inc., the leading toy industry trade group, the United States is the world’s largest toy market, followed by Japan and Western Europe. Total retail sales of toys, excluding video games, in the United States, were approximately $16.5 billion in 2012. We believe the two largest United States toy companies, Mattel and Hasbro, collectively hold a dominant share of the domestic non-video toy market. In addition, hundreds of smaller companies compete in the design and development of new toys, the procurement of character and product licenses, and the improvement and expansion of previously introduced products and product lines.
Over the past few years, the toy industry has experienced substantial consolidation among both toy companies and toy retailers. We believe that the ongoing consolidation of toy companies provides us with increased growth opportunities due to retailers’ desire to not be entirely dependent upon a few dominant toy companies. Retailer concentration also enables us to ship products, manage account relationships and track point of sale information more effectively and efficiently.
Products
We focus our business on acquiring or licensing well-recognized trademarks or brand names, and we seek to acquire evergreen brands which are less subject to market fads or trends. Generally, our license agreements for products and concepts call for royalties ranging from 1% to 14% of net sales, and some may require minimum guarantees and advances. Our principal products include:
Traditional Toys and Electronics
Electronics Products
Our electronic products category includes our
Plug It In & Play TV Games
®
, Spynet Spy
products
, EyeClops
™ Bionic Eye products and
Laser Challenge
® product lines. Our current
Plug It In & Play
TV Games
®
titles, geared to the pre-school and leisure gamer segments, include licenses from
Namco
®,
Disney
,
Marvel
® and
Nickelodeon
®
, and feature such games as
SpongeBob SquarePants
®, Big Buck Hunter® Pro, Walking Dead,
Dora the Explorer
®,
Disney Princess
®,
Ms. Pac-Man
® and
Pac-Man
®.
In 2013, we expect to launch our EZ DJ Pro DJ platform enabling users to mix and match tunes as well as portable baby monitors.
Wheels Products
|
●
|
Motorized and plastic toy vehicles and accessories.
|
Our extreme sports offerings include our
MXS
line of motorcycles with generic and well-known riders and other vehicles include off-road vehicles and skateboards, which are sold individually and with playsets and accessories. In 2012, we launched our proprietary line of motorized trains and track sets under the brand Power Trains. In 2013, we expect to relaunch our proprietary line of rip cord powered action wheels, Fly Wheels.
Action Figures and Accessories
We currently develop, manufacture and distribute other action figures and action figure accessories including those based on the animated series
Pokémon
®
,
UFC
®
and
TNA
®
wrestling and Batman
®
, capitalizing on the expertise we built in the action figure category. In 2011, we launched a line of action figures, playsets and accessories based on the
Pirates of the Caribbean
®
and
Real Steel
®
movie franchises; and figurines based on
Smurfs
®
and
Phineas and Ferb
®
.
In 2012, we launched a line of action figures, playsets and accessories based on the boys animated television show Monsuno, which premiered domestically on Nicktoons
®
in February 2012 and internationally in the fall of 2012. In 2013, we expect to expand our line of 31” figures to include Superman
®
, Power Rangers
®
and Star Wars
®
.
5
Dolls
Dolls and accessories include small dolls, large dolls, fashion dolls and baby dolls based on licenses, including
Disney Princess®, Disney Fairies®, Cabbage Patch Kids®, Hello Kitty®, Graco® and Fisher Price®
, including an extensive line of baby doll accessories that emulate real baby products that mothers today use; plush, infant and pre-school toys, and private label fashion dolls for other retailers and sold to Disney Stores and Disney Parks and Resorts.
Pet
Products
We entered the Pet Products category with our acquisition of Pet Pal, whose products include pet toys, treats, beds, clothes and related pet products. These products are marketed under JAKKS Pets® and our own proprietary brand of assorted pet products under the brand American Classics
™
as well as
licenses including
Kong
® and numerous other entertainment and consumer product properties.
Role Play, Novelty & Seasonal
Role play and Dress-up Products
Our line of role play and dress-up products for boys and girls features entertainment and consumer products properties such as
Disney Princess
®,
Disney
Fairies
®
, Dora the Explorer
®
,
and
Black & Decker
®. These products generated a significant amount of sales in 2011 and 2012, and we expect that level of sales to continue in 2013.
Seasonal/ Outdoor Products
We have a wide range of seasonal toys and outdoor and leisure products including our recently acquired Maui line of proprietary products including Sky Ball and Wave Hoop among other outdoor toys. Our
Funnoodle
pool toys include the basic Funnoodle pool floats and a variety of other pool toys.
Indoor and Outdoor Kids’ Furniture
We produce an extensive array of licensed indoor and outdoor kids' furniture and activity tables, and room decor. Our licensed portfolio includes character licenses, including Crayola®, Disney Princess®, Toy Story
®,
Mickey Mouse
®,
Dora the Explorer
®
, and others. Products include children’s puzzle furniture, tables and chairs to activity sets, trays, stools and a line of licensed molded kiddie pools, among others.
Halloween and Everyday Costume Play
We produce an expansive and innovative line of Halloween costumes and accessories which includes a wide range of non-licensed Halloween costumes such as horror, pirates, historical figures and aliens to animals, vampires, angels and more, as well as popular licensed characters from top intellectual property owners including Disney
®
, Hasbro
®
, Marvel
®
, Sesame Workshop
®
, Mattel
®
, and many others.
DreamPlay Technology
In September 2012, we formed a joint venture with NantWorks LLC called DreamPlay Toys LLC to exploit their patented recognition technologies in conjunction with toy and consumer products. In 2013, we expect to launch a line of toy products which utilizes the technologies to enhance the play pattern of the toys as well as enhance the in-store experience of the consumer.
6
World Wrestling Entertainment Video Games
In June 1998, we formed a joint venture with THQ, a developer, publisher and distributor of interactive entertainment software for the leading hardware game platforms in the home video game market. The joint venture entered into a license agreement with the WWE under which it acquired the exclusive worldwide right to publish WWE video games on all hardware platforms. Pursuant to a Settlement Agreement and Mutual Release dated December 22, 2009, the joint venture was terminated on December 31, 2009 and we received and recorded as income as received fixed payments from THQ of $6.0 million in each of 2010 and 2011 and $3.0 million in 2012. An amended settlement agreement called for the payment of an additional $1.0 million October 30, 2012 (which we received) and $0.4 million each in ten consecutive monthly payments beginning February 28, 2013, on December 19, 2012, THQ filed voluntary petitions under Chapter 11 of the U.S. Bankruptcy Court, and on January 24, 2013 the US Bankruptcy Court approved the sale of most of THQ’s assets to multiple buyers. Given that the final payment received from THQ (in October 2012) was within 90 days of their filing for bankruptcy, we have not recognized this payment as revenue and have reserved the amount received pending the final settlement of THQ’s assets in accordance with bankruptcy law.
Sales, Marketing and Distribution
We sell all of our products through our own in-house sales staff and independent sales representatives to toy and mass-market retail chain stores, department stores, office supply stores, drug and grocery store chains, club stores, toy specialty stores and wholesalers. Our three largest customers are Wal-Mart, Target and Toys ‘R’ Us, which accounted for approximately 56.6% of our net sales in 2011 and 46.8% of our net sales in 2012. With the
Pet Pal
® product line, we distribute pet products to key pet supply retailers Petco and Petsmart in addition to many other pet retailers and our existing customers. We generally sell products to our customers pursuant to letters of credit or, in some cases, on open account with payment terms typically varying from 30 to 90 days. From time to time, we allow our customers credits against future purchases from us in order to facilitate their retail markdown and sales of slow-moving inventory. We also sell our products through e-commerce sites, including Toysrus.com and Amazon.com.
We contract the manufacture of most of our products to unaffiliated manufacturers located in The People’s Republic of China (“China”). We sell the finished products on a letter of credit basis or on open account to our customers, many of whom take title to the goods in Hong Kong or China. These methods allow us to reduce certain operating costs and working capital requirements. A portion of our sales originate in the United States, so we hold certain inventory in our warehouse and fulfillment facilities. To date, a significant portion of all of our sales has been to domestic customers. We intend to continue expanding distribution of our products into foreign territories and, accordingly, we have:
|
●
|
engaged representatives to oversee sales in certain territories,
|
|
●
|
engaged distributors in certain territories,
|
|
●
|
established direct relationships with retailers in certain territories,
|
|
●
|
opened sales offices in Europe,
|
|
●
|
opened sales offices and a distribution center in Canada, and
|
|
●
|
expanded in-house resources dedicated to product development and marketing of our lines.
|
7
Outside of the United States, we currently sell our products primarily in Europe, Australia, Canada, Latin America and Asia. Sales of our products abroad accounted for approximately $108.5 million, or 16.0% of our net sales, in 2011 and approximately $132.0 million, or 19.8% of our net sales, in 2012. We believe that foreign markets present an attractive opportunity, and we plan to intensify our marketing efforts and further expand our distribution channels abroad.
We establish reserves for sales allowances, including promotional allowances and allowances for anticipated defective product returns, at the time of shipment. The reserves are determined as a percentage of net sales based upon either historical experience or upon estimates or programs agreed upon by our customers and us.
We obtain, directly, or through our sales representatives, orders for our products from our customers and arrange for the manufacture of these products as discussed below. Cancellations generally are made in writing, and we take appropriate steps to notify our manufacturers of these cancellations. We may incur costs or other losses as a result of cancellations.
We maintain a full-time sales and marketing staff, many of whom make on-site visits to customers for the purpose of showing product and soliciting orders for products. We also retain a number of independent sales representatives to sell and promote our products, both domestically and internationally. Together with retailers, we occasionally test the consumer acceptance of new products in selected markets before committing resources to large-scale production.
We publicize and advertise our products in trade and consumer magazines and other publications, market our products at international, national and regional toy and other specialty trade shows, conventions and exhibitions and carry on cooperative advertising programs with toy and mass market retailers and other customers which include the use of print and television ads and in-store displays. We also produce and broadcast television commercials for several of our product lines, if we expect that the resulting increase in our net sales will justify the relatively high cost of television advertising.
Product Development
Each of our product lines has an in-house manager responsible for product development. The in-house manager identifies and evaluates inventor products and concepts and other opportunities to enhance or expand existing product lines or to enter new product categories. In addition, we create proprietary products to fully exploit our concept and character licenses. Although we do have the capability to create and develop products from inception to production, we also use third-parties to provide a portion of the sculpting, sample making, illustration and package design required for our products in order to accommodate our increasing product innovations and introductions. Typically, the development process takes from three to nine months from concept to production and shipment to our customers.
We employ a staff of designers for all of our product lines. We occasionally acquire our other product concepts from unaffiliated third parties. If we accept and develop a third party’s concept for new toys, we generally pay a royalty on the sale of the toys developed from this concept, and may, on an individual basis, guarantee a minimum royalty. In addition, we engage third-party developers to program our line of
Plug it in & Play TV Games
. Royalties payable to inventors and developers generally range from 1% to 5% of the wholesale sales price for each unit of a product sold by us. We believe that utilizing experienced third-party inventors gives us access to a wide range of development talent. We currently work with numerous toy inventors and designers for the development of new products and the enhancement of existing products.
Safety testing of our products is done at the manufacturers’ facilities by quality control personnel employed by us or by independent third-party contractors engaged by us. Safety testing is designed to meet or exceed regulations imposed by federal and state, as well as applicable international governmental authorities, our retail partners, licensors and the Toy Industry Association. We also closely monitor quality assurance procedures for our products for safety purposes. In addition, independent laboratories engaged by some of our larger customers and licensors test certain of our products.
8
Manufacturing and Supplies
Most of our products are currently produced by overseas third-party manufacturers, which we choose on the basis of quality, reliability and price. Consistent with industry practice, the use of third-party manufacturers enables us to avoid incurring fixed manufacturing costs, while maximizing flexibility, capacity and production technology. Substantially all of the manufacturing services performed overseas for us are paid for on open account with the manufacturers. To date, we have not experienced any material delays in the delivery of our products; however, delivery schedules are subject to various factors beyond our control, and any delays in the future could adversely affect our sales. Currently, we have ongoing relationships with over eighty different manufacturers. We believe that alternative sources of supply are available to us, although we cannot be assured that we can obtain adequate supplies of manufactured products.
Although we do not conduct the day-to-day manufacturing of our products, we are extensively involved in the design of the product prototype and production tools, dyes and molds for our products and we seek to ensure quality control by actively reviewing the production process and testing the products produced by our manufacturers. We employ quality control inspectors who rotate among our manufacturers’ factories to monitor the production of substantially all of our products.
The principal raw materials used in the production and sale of our toy products are plastics, zinc alloy, plush, printed fabrics, paper products and electronic components, all of which are currently available at reasonable prices from a variety of sources. Although we do not manufacture our products, we own the majority of the tools, dyes and molds used in the manufacturing process, and these are transferable among manufacturers if we choose to employ alternative manufacturers. Tools, dyes and molds represent a substantial portion of our property and equipment with a net book value of $10.4 million in 2011 and $10.8 million in 2012. Substantially all of these assets are located in China.
Trademarks and Copyrights
Most of our products are produced and sold under trademarks owned by or licensed to us. We typically register our properties, and seek protection under the trademark, copyright and patent laws of the United States and other countries where our products are produced or sold. These intellectual property rights can be significant assets. Accordingly, while we believe we are sufficiently protected, the loss of some of these rights could have an adverse effect on our business, financial condition and results of operations.
Competition
Competition in the toy industry is intense. Globally, certain of our competitors have greater financial resources, larger sales and marketing and product development departments, stronger name recognition, longer operating histories and benefit from greater economies of scale. These factors, among others, may enable our competitors to market their products at lower prices or on terms more advantageous to customers than those we could offer for our competitive products. Competition often extends to the procurement of entertainment and product licenses, as well as the marketing and distribution of products and the obtaining of adequate shelf space. Competition may result in price reductions, reduced gross margins and loss of market share, any of which could have a material adverse effect on our business, financial condition and results of operations. In each of our product lines we compete against one or both of the toy industry’s two dominant companies, Mattel and Hasbro. In addition, we compete in our Halloween costume lines with Rubies. We also compete with numerous smaller domestic and foreign toy manufacturers, importers and marketers in each of our product categories.
Seasonality and Backlog
In 2012, approximately 67.2% of our net sales were made in the third and fourth quarters. Generally, the first quarter is the period of lowest shipments and sales in our business and in the toy industry and therefore it is also the least profitable quarter due to various fixed costs. Seasonality factors may cause our operating results to fluctuate significantly from quarter to quarter. However, our seasonal products are primarily sold in the spring and summer seasons.
Our results of operations may also fluctuate as a result of factors such as the timing of new products (and related expenses) introduced by us or our competitors, the advertising activities of our competitors, delivery schedules set by our customers and the emergence of new market entrants. We believe, however, that the low retail price of most of our products may be less subject to seasonal fluctuations than higher priced toy products.
We ship products in accordance with delivery schedules specified by our customers, who generally request delivery of products within three to six months of the date of their orders for orders shipped FOB China or Hong Kong and within three days for orders shipped domestically. Because customer orders may be canceled at any time without penalty, our backlog may not accurately indicate sales for any future period.
9
Government and Industry Regulation
Our products are subject to the provisions of the Consumer Product Safety Act (“CPSA”), the Federal Hazardous Substances Act (“FHSA”), the Flammable Fabrics Act (“FFA”) and the regulations promulgated thereunder. The CPSA and the FHSA enable the Consumer Products Safety Commission (“CPSC”) to exclude from the market consumer products that fail to comply with applicable product safety regulations or otherwise create a substantial risk of injury, and articles that contain excessive amounts of a banned hazardous substance. The FFA enables the CPSC to regulate and enforce flammability standards for fabrics used in consumer products. The CPSC may also require the repurchase by the manufacturer of articles. Similar laws exist in some states and cities and in various international markets. We maintain a quality control program designed to ensure compliance with all applicable laws.
Employees
As of February 28, 2013, we employed 828 persons, all of whom are full-time employees, including three executive officers. We employed 371 people in the United States, 10 people in Canada, 297 people in Hong Kong, 136 people in China, 12 people in the United Kingdom, 1 person in Spain, and 1 person in France. We believe that we have good relationships with our employees. None of our employees are represented by a union.
Environmental Issues
We are subject to legal and financial obligations under environmental, health and safety laws in the United States and in other jurisdictions where we operate. We are not currently aware of any material environmental liabilities associated with any of our operations.
Available Information
We make available free of charge on or through our Internet website, www.jakks.com, our annual report on Form 10-K, quarterly reports on Form 10-Q, current reports on Form 8-K, and amendments to these reports filed or furnished pursuant to Section 13(a) or 15(d) of the Securities Exchange Act of 1934 as soon as reasonably practicable after we electronically file such material with, or furnish it to, the SEC. The contents of our website are not incorporated in or deemed to be a part of any such report.
Our Corporate Information
We were formed as a Delaware corporation in 1995. Our principal executive offices are located at 22619 Pacific Coast Highway, Malibu, California 90265. Our telephone number is (310) 456-7799 and our Internet Website address is www.jakks.com. The contents of our website are not incorporated in or deemed to be a part of this Annual Report Form 10-K.
10
From time to time, including in this Annual Report on Form 10-K, we publish forward-looking statements, as disclosed in our Disclosure Regarding Forward-Looking Statements, beginning immediately following the Table of Contents of this Annual Report. We note that a variety of factors could cause our actual results and experience to differ materially from the anticipated results or other expectations expressed or anticipated in our forward-looking statements. The factors listed below are risks and uncertainties that may arise and that may be detailed from time to time in our public announcements and our filings with the Securities and Exchange Commission, such as on Forms 8-K, 10-Q and 10-K. We undertake no obligation to make any revisions to the forward-looking statements contained in this Annual Report on Form 10-K to reflect events or circumstances occurring after the date of the filing of this report.
Our inability to redesign, restyle and extend our existing core products and product lines as consumer preferences evolve, and to develop, introduce and gain customer acceptance of new products and product lines, may materially and adversely impact our business, financial condition and results of operations.
Our business and operating results depend largely upon the appeal of our products. Our continued success in the toy industry will depend upon our ability to redesign, restyle and extend our existing core products and product lines as consumer preferences evolve, and to develop, introduce and gain customer acceptance of new products and product lines. Several trends in recent years have presented challenges for the toy industry, including:
|
●
|
the phenomenon of children outgrowing toys at younger ages, particularly in favor of interactive and high technology products;
|
|
●
|
increasing use of technology;
|
|
●
|
shorter life cycles for individual products; and
|
|
●
|
higher consumer expectations for product quality, functionality and value.
|
We cannot assure you that:
|
●
|
our current products will continue to be popular with consumers;
|
|
●
|
the product lines or products that we introduce will achieve any significant degree of market acceptance; or
|
|
●
|
the life cycles of our products will be sufficient to permit us to recover licensing, design, manufacturing, marketing and other costs associated with those products
|
Our failure to achieve any or all of the foregoing benchmarks may adversely affect our business, financial condition and results of operations.
The failure of our character-related and theme-related products to become and/or remain popular with children may materially and adversely impact our business, financial condition and results of operations.
The success of many of our character-related and theme-related products depends upon the popularity of characters in movies, television programs, live sporting exhibitions, and other media and events. We cannot assure you that:
| ● |
media associated with our character-related and theme-related product lines will be released at the times we expect or will be successful;
|
|
●
|
the success of media associated with our existing character-related and theme-related product lines will result in substantial promotional value to our products;
|
|
●
|
we will be successful in renewing licenses upon expiration on terms that are favorable to us; or
|
|
●
|
we will be successful in obtaining licenses to produce new character-related and theme-related products in the future.
|
Our failure to achieve any or all of the foregoing benchmarks may cause the infrastructure of our operations to fail, thereby adversely affecting our business, financial condition and results of operations.
11
There are risks associated with our license agreements.
|
●
|
Our current licenses require us to pay minimum royalties
|
Sales of products under trademarks or trade or brand names licensed from others account for substantially all of our net sales. Product licenses allow us to capitalize on characters, designs, concepts and inventions owned by others or developed by toy inventors and designers. Our license agreements generally require us to make specified minimum royalty payments, even if we fail to sell a sufficient number of units to cover these amounts. In addition, under certain of our license agreements, if we fail to achieve certain prescribed sales targets, we may be unable to retain or renew these licenses.
|
●
|
Some of our licenses are restricted as to use
|
Under the majority of our license agreements, the licensors have the right to review and approve our use of their licensed products, designs or materials before we may make any sales. If a licensor refuses to permit our use of any licensed property in the way we propose, or if their review process is delayed, our development or sale of new products could be impeded.
|
●
|
New licenses are difficult and expensive to obtain
|
Our continued success will substantially depend upon our ability to obtain additional licenses. Intense competition exists for desirable licenses in our industry. We cannot assure you that we will be able to secure or renew significant licenses on terms acceptable to us. In addition, as we add licenses, the need to fund additional royalty advances and guaranteed minimum royalty payments may strain our cash resources.
|
●
|
A limited number of licensors account for a large portion of our net sales
|
We derive a significant portion of our net sales from a limited number of licensors. If one or more of these licensors were to terminate or fail to renew our license or not grant us new licenses, our business, financial condition and results of operations could be adversely affected.
The toy industry is highly competitive and our inability to compete effectively may materially and adversely impact our business, financial condition and results of operations.
The toy industry is highly competitive. Globally, certain of our competitors have financial and strategic advantages over us, including:
|
●
|
greater financial resources;
|
|
●
|
larger sales, marketing and product development departments;
|
|
●
|
stronger name recognition;
|
|
●
|
longer operating histories; and
|
|
●
|
greater economies of scale.
|
In addition, the toy industry has no significant barriers to entry. Competition is based primarily upon the ability to design and develop new toys, procure licenses for popular characters and trademarks and successfully market products. Many of our competitors offer similar products or alternatives to our products. Our competitors have obtained and are likely to continue to obtain licenses that overlap our licenses with respect to products, geographic areas and markets. We cannot assure you that we will be able to obtain adequate shelf space in retail stores to support our existing products, expand our products and product lines or continue to compete effectively against current and future competitors.
12
We may not be able to sustain or manage our growth, which may prevent us from increasing our net revenues.
We have experienced rapid growth in our product lines which was achieved through acquisitions of businesses, products and licenses. This growth in product lines has contributed significantly to our total revenues over the last few years. For example, revenues associated with companies we acquired since 2008 were approximately $218.5 million and $282.6 million, in 2011 and 2012, respectively, representing 32.2% and 42.4%, respectively, of our total revenues for those periods. As a result, comparing our period-to-period operating results may not be meaningful and results of operations from prior periods may not be indicative of future results. We cannot assure you that we will continue to experience growth in, or maintain our present level of, net sales.
Our growth strategy calls for us to continuously develop and diversify our toy business by acquiring other companies, entering into additional license agreements, refining our product lines and expanding into international markets, which will place additional demands upon our management, operational capacity and financial resources and systems. The increased demand upon management may necessitate our recruitment and retention of qualified management personnel. We cannot assure you that we will be able to recruit and retain qualified personnel or expand and manage our operations effectively and profitably. To effectively manage future growth, we must continue to expand our operational, financial and management information systems and to train, motivate and manage our work force. There can be no assurance that our operational, financial and management information systems will be adequate to support our future operations. Failure to expand our operational, financial and management information systems or to train, motivate or manage employees could have a material adverse effect on our business, financial condition and results of operations.
In addition, implementation of our growth strategy is subject to risks beyond our control, including competition, market acceptance of new products, changes in economic conditions, our ability to obtain or renew licenses on commercially reasonable terms and our ability to finance increased levels of accounts receivable and inventory necessary to support our sales growth, if any. Accordingly, we cannot assure you that our growth strategy will be successful.
If we are unable to acquire and integrate companies and new product lines successfully, we will be unable to implement a significant component of our growth strategy.
Our growth strategy depends, in part, upon our ability to acquire companies and new product lines.
Future acquisitions, if any, may succeed only if we can effectively assess characteristics of potential target companies and product lines, such as:
|
●
|
attractiveness of products;
|
|
●
|
suitability of distribution channels;
|
|
●
|
management ability;
|
|
●
|
financial condition and results of operations; and
|
|
●
|
the degree to which acquired operations can be integrated with our operations.
|
We cannot assure you that we can identify attractive acquisition candidates or negotiate acceptable acquisition terms, and our failure to do so may adversely affect our results of operations and our ability to sustain growth. Our acquisition strategy involves a number of risks, each of which could adversely affect our operating results, including:
|
●
|
difficulties in integrating acquired businesses or product lines, assimilating new facilities and personnel and harmonizing diverse business strategies and methods of operation;
|
|
●
|
diversion of management attention from operation of our existing business;
|
|
●
|
loss of key personnel from acquired companies; and
|
|
●
|
failure of an acquired business to achieve targeted financial results.
|
13
A limited number of customers account for a large portion of our net sales, so that if one or more of our major customers were to experience difficulties in fulfilling their obligations to us, cease doing business with us, significantly reduce the amount of their purchases from us or return substantial amounts of our products, it could have a material adverse effect on our business, financial condition and results of operations.
Our three largest customers accounted for 46.8% of our net sales in 2012. Except for outstanding purchase orders for specific products, we do not have written contracts with or commitments from any of our customers and pursuant to the terms of certain of our vendor agreements, even some purchase orders may be cancelled without penalty up until delivery. A substantial reduction in or termination of orders from any of our largest customers could adversely affect our business, financial condition and results of operations. In addition, pressure by large customers seeking price reductions, financial incentives, changes in other terms of sale or for us to bear the risks and the cost of carrying inventory could also adversely affect our business, financial condition and results of operations. If one or more of our major customers were to experience difficulties in fulfilling their obligations to us, cease doing business with us, significantly reduce the amount of their purchases from us or return substantial amounts of our products, it could have a material adverse effect on our business, financial condition and results of operations. In addition, the bankruptcy or other lack of success of one or more of our significant retailers could negatively impact our revenues and bad debt expense.
We depend upon our Chief Executive Officer and any loss or interruption of his services could adversely affect our business, financial condition and results of operations.
Our success has been largely dependent upon the experience and continued services of Stephen G. Berman, our President and Chief Executive Officer. We cannot assure you that we would be able to find an appropriate replacement for Mr. Berman should the need arise, and any loss or interruption of the services of Mr. Berman could adversely affect our business, financial condition and results of operations.
We depend upon third-party manufacturers, and if our relationship with any of them is harmed or if they independently encounter difficulties in their manufacturing processes, we could experience product defects, production delays, cost overruns or the inability to fulfill orders on a timely basis, any of which could adversely affect our business, financial condition and results of operations.
We depend upon many third-party manufacturers who develop, provide and use the tools, dyes and molds that we generally own to manufacture our products. However, we have limited control over the manufacturing processes themselves. As a result, any difficulties encountered by the third-party manufacturers that result in product defects, production delays, cost overruns or the inability to fulfill orders on a timely basis could adversely affect our business, financial condition and results of operations.
We do not have long-term contracts with our third-party manufacturers. Although we believe we could secure other third-party manufacturers to produce our products, our operations would be adversely affected if we lost our relationship with any of our current suppliers or if our current suppliers’ operations or sea or air transportation with our overseas manufacturers were disrupted or terminated even for a relatively short period of time. Our tools, dyes and molds are located at the facilities of our third-party manufacturers.
Although we do not purchase the raw materials used to manufacture our products, we are potentially subject to variations in the prices we pay our third-party manufacturers for products, depending upon what they pay for their raw materials.
We have substantial sales and manufacturing operations outside of the United States, subjecting us to risks common to international operations.
We sell products and operate facilities in numerous countries outside the United States. For the year ended December 31, 2012, sales to our international customers comprised approximately 19.8% of our net sales. We expect our sales to international customers to account for a greater portion of our revenues in future fiscal periods. Additionally, we utilize third-party manufacturers, located principally in China, and are subject to the risks normally associated with international operations, including:
|
●
|
currency conversion risks and currency fluctuations;
|
|
●
|
limitations, including taxes, on the repatriation of earnings;
|
|
●
|
political instability, civil unrest and economic instability;
|
14
|
●
|
greater difficulty enforcing intellectual property rights and weaker laws protecting such rights;
|
|
●
|
complications in complying with laws in varying jurisdictions and changes in governmental policies;
|
|
●
|
greater difficulty and expenses associated with recovering from natural disasters;
|
|
●
|
transportation delays and interruptions;
|
|
●
|
the potential imposition of tariffs; and
|
|
●
|
the pricing of intercompany transactions may be challenged by taxing authorities in both Hong Kong and the United States, with potential increases in income taxes.
|
Our reliance upon external sources of manufacturing can be shifted, over a period of time, to alternative sources of supply, should such changes be necessary. However, if we were prevented from obtaining products or components for a material portion of our product line due to medical, political, labor or other factors beyond our control, our operations would be disrupted while alternative sources of products were secured. Also, the imposition of trade sanctions by the United States against a class of products imported by us from, or the loss of “normal trade relations” status by, China could significantly increase our cost of products imported from that nation. Because of the importance of international sales and international sourcing of manufacturing to our business, our financial condition and results of operations could be significantly and adversely affected if any of the risks described above were to occur.
Our business is subject to extensive government regulation and any violation by us of such regulations could result in product liability claims, loss of sales, diversion of resources, damage to our reputation, increased warranty costs or removal of our products from the market, and we cannot assure you that our product liability insurance for the foregoing will be sufficient.
Our business is subject to various laws, including the Federal Hazardous Substances Act, the Consumer Product Safety Act, the Flammable Fabrics Act and the rules and regulations promulgated under these acts. These statutes are administered by the CPSC, which has the authority to remove from the market products that are found to be defective and present a substantial hazard or risk of serious injury or death. The CPSC can require a manufacturer to recall, repair or replace these products under certain circumstances. We cannot assure you that defects in our products will not be alleged or found. Any such allegations or findings could result in:
|
●
|
product liability claims;
|
|
●
|
loss of sales;
|
|
●
|
diversion of resources;
|
|
●
|
damage to our reputation;
|
|
●
|
increased warranty costs; and
|
|
●
|
removal of our products from the market.
|
Any of these results may adversely affect our business, financial condition and results of operations. There can be no assurance that our product liability insurance will be sufficient to avoid or limit our loss in the event of an adverse outcome of any product liability claim.
We depend upon our proprietary rights and our inability to safeguard and maintain the same, or claims of third parties that we have violated their intellectual property rights, could have a material adverse effect on our business, financial condition and results of operations.
We rely upon trademark, copyright and trade secret protection, nondisclosure agreements and licensing arrangements to establish, protect and enforce our proprietary rights in our products. The laws of certain foreign countries may not protect intellectual property rights to the same extent or in the same manner as the laws of the United States. We cannot assure you that we or our licensors will be able to successfully safeguard and maintain our proprietary rights. Further, certain parties have commenced legal proceedings or made claims against us based upon our alleged patent infringement, misappropriation of trade secrets or other violations of their intellectual property rights. We cannot assure you that other parties will not assert intellectual property claims against us in the future. These claims could divert our attention from operating our business or result in unanticipated legal and other costs, which could adversely affect our business, financial condition and results of operations.
15
Market conditions and other third-party conduct could negatively impact our margins and implementation of other business initiatives.
Economic conditions, such as rising fuel prices and decreased consumer confidence, may adversely impact our margins. In addition, general economic conditions were significantly and negatively affected by the September 11th terrorist attacks and could be similarly affected by any future attacks. Such a weakened economic and business climate, as well as consumer uncertainty created by such a climate, could adversely affect our sales and profitability. Other conditions, such as the unavailability of electronics components, may impede our ability to manufacture, source and ship new and continuing products on a timely basis. Significant and sustained increases in the price of oil could adversely impact the cost of the raw materials used in the manufacture of our products, such as plastic.
We may not have the funds necessary to purchase our outstanding convertible senior notes upon a fundamental change or other purchase date, as required by the indenture governing the notes.
On November 10, 2009, we sold an aggregate of $100.0 million of 4.50% Convertible Senior Notes due 2014 (the “Notes”). The Notes are senior unsecured obligations of JAKKS, will pay interest semi-annually at a rate of 4.50% per annum and will mature on November 1, 2014. Prior to August 1, 2014, holders of the Notes may convert their Notes only upon specified events. Upon conversion, the Notes may be settled, at our election, in cash, shares of our common stock, or a combination of cash and shares of our common stock. Holders of the Notes may require us to repurchase for cash all or some of their Notes upon the occurrence of a fundamental change (as defined in the Notes).
We have a history of making acquisitions that result in material amounts of goodwill. Any future acquisitions may also result in material amounts of goodwill which, if impaired, would result in a reduction in our net income.
Goodwill is the amount by which the cost of an acquisition exceeds the fair value of the net assets we acquire. Current accounting standards require that goodwill not be amortized but instead be periodically evaluated for impairment based upon the fair value of the reporting unit. Goodwill currently on our books and any goodwill associated with future acquisitions are subject to the same impairment risk.
We have a full valuation allowance on the entire balance of deferred taxes on our books since their future realization is uncertain.
Deferred tax assets are realized by prior and future taxable income of appropriate character. Current accounting standards require that a valuation allowance be recorded if it is not likely that sufficient taxable income of appropriate character will be generated in the U.S. to realize the deferred tax assets. In the fourth quarter of 2012, we recognized an impairment of our deferred tax assets, resulting in a non-cash charge to income of $91.7 million. While we currently have no remaining deferred tax assets on our books, any future deferred tax assets are subject to the same impairment risk.
The following is a listing of the principal leased offices maintained by us as of February 28, 2013:
|
Property
|
|
Location
|
|
Approximate
Square Feet
|
|
Lease Expiration
Date
|
|
|
Domestic
|
|||||||
|
Corporate Office
|
Malibu, California
|
29,500
|
February 28, 2015
|
||||
|
Showroom and Design Center
|
Santa Monica, California
|
28,200
|
February 28, 2016
|
||||
|
Distribution Center
|
City of Industry, California
|
800,000
|
April 30, 2018
|
||||
|
Distribution Center
|
Newton, NC
|
109,000
|
August 31, 2013
|
||||
|
Moose Mountain Office
|
Township of Parisippany-Troy Hills, NJ
|
2,100
|
March 31, 2014
|
||||
|
Sales Office/Showroom
|
Bentonville, Arkansas
|
9,000
|
September 30, 2014
|
||||
|
Showroom
|
Minneapolis, Minnesota
|
1,560
|
December 31, 2013
|
||||
|
Kids Only Office
|
Westborough, MA
|
5,500
|
December 31, 2013
|
||||
|
Disguise Office
|
Poway, California
|
24,200
|
December 31, 2015
|
||||
|
Maui Toys Office/Warehouse
|
Youngstown, Ohio
|
73,000
|
Monthly
|
||||
|
Maui Toys Office
|
Santa Monica, California
|
10,000
|
Monthly
|
||||
|
International
|
|||||||
|
Distribution Center
|
Brampton, Ontario, Canada
|
105,700
|
December 31, 2014
|
||||
|
Europe Office
|
Berkshire, UK
|
2,215
|
February 25, 2015
|
||||
|
Hong Kong Headquarters
|
Kowloon, Hong Kong
|
36,600
|
June 30, 2013
|
||||
|
Hong Kong Showroom
|
Kowloon, Hong Kong
|
22,630
|
June 30, 2016
|
||||
|
Production Inspection and Testing Office
|
Shenzhen, China
|
5,417
|
May 14, 2013
|
||||
|
Production Inspection Office
|
Nanjing, China
|
2,000
|
September 15, 2013
|
||||
|
Moose Mountain HK Office
|
Kowloon, Hong Kong
|
6,198
|
June 30, 2015
|
||||
|
Moose Mountain China Office
|
Shenzhen, China
|
224
|
May 14, 2013
|
||||
|
France Office
|
Paris, France
|
160
|
May 31, 2013
|
||||
16
We are a party to, and certain of our property is the subject of, various other pending claims and legal proceedings that routinely arise in the ordinary course of our business, but we do not believe that any of these claims or proceedings will have a material effect on our business, financial condition or results of operations. See Note 21 to the consolidated financial statements for additional information on litigation.
17
Not applicable.
18
Market Information
Our common stock is traded on the Nasdaq Global Select exchange under the symbol “JAKK.” The following table sets forth, for the periods indicated, the range of high and low sales prices for our common stock on this exchange.
|
Price Range of
Common Stock
|
|
|||||||
|
High
|
Low
|
|||||||
|
2011:
|
||||||||
|
First quarter
|
$
|
19.46
|
$
|
16.58
|
||||
|
Second quarter
|
21.21
|
17.46
|
||||||
|
Third quarter
|
20.37
|
14.01
|
||||||
|
Fourth quarter
|
19.76
|
13.45
|
||||||
|
2012:
|
||||||||
|
First quarter
|
17.70
|
13.29
|
||||||
|
Second quarter
|
19.39
|
15.10
|
||||||
|
Third quarter
|
16.74
|
14.01
|
||||||
|
Fourth quarter
|
14.24
|
11.83
|
||||||
Performance Graph
The graph and tables below display the relative performance of our common stock, the Russell 2000 Price Index (the “Russell 2000”) and a peer group index, by comparing the cumulative total stockholder return (which assumes reinvestment of dividends, if any) on an assumed $100 investment on December 31, 2007 in our common stock, the Russell 2000 and the peer group index over the period from January 1, 2008 to December 31, 2012.
In accordance with recently enacted regulations implemented by the Securities and Exchange Commission, we retained the services of an expert compensation consultant. In the performance of its services, such consultant used a peer group index for its analysis of our compensation policies. We believe that these companies represent a cross-section of publicly-traded companies with product lines and businesses similar to our own throughout the comparison period and, accordingly, we are using the same peer group for purposes of the performance graph, except that RC2 Corp was not included in the performance peer group and EMak Worldwide Inc. and THQ Inc. were not included in the compensation peer group. Our peer group index includes the following companies:
Activision, Inc., Electronic Arts, Inc., EMak Worldwide, Inc., Hasbro, Inc., Leapfrog Enterprises, Inc., Mattel, Inc., Kid Brands, Inc. and Take-Two Interactive, Inc. and THQ Inc.
19
The historical performance data presented below may not be indicative of the future performance of our common stock, any reference index or any component company in a reference index.
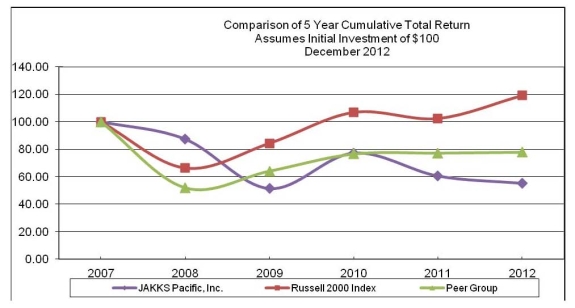
Annual Return Percentage
|
|
December 31,
2008
|
|
|
December 31,
2009
|
|
|
December 31,
2010
|
|
|
December 31,
2011
|
|
|
December 31,
2012
|
|||||||
|
JAKKS Pacific
|
(12.6
|
)%
|
(41.3
|
)%
|
50.4
|
%
|
(21.6
|
)%
|
(8.9
|
)%
|
||||||||||
|
Peer Group
|
(48.0
|
) |
23.2
|
19.5
|
0.9
|
0.8
|
||||||||||||||
|
Russell 2000
|
(33.8
|
) |
(27.2
|
)
|
26.9
|
(4.2
|
) |
16.3
|
||||||||||||
Indexed Returns
|
|
January 1,
2007
|
|
|
December 31,
2008
|
|
|
December 31,
2009
|
|
|
December 31,
2010
|
|
|
December
31,
2011
|
|
|
December 31,
2012
|
|
|||||||
|
JAKKS Pacific
|
$
|
100.0
|
$
|
87.4
|
$
|
51.3
|
$
|
77.2
|
$
|
60.5
|
$
|
55.2
|
||||||||||||
|
Peer Group
|
100.0
|
52.0
|
64.1
|
76.5
|
77.2
|
77.8
|
||||||||||||||||||
|
Russell 2000
|
100.0
|
66.2
|
84.2
|
106.8
|
102.3
|
119.1
|
||||||||||||||||||
Security Holders
To the best of our knowledge, as of March 8, 2013, there were 115 holders of record of our common stock. We believe there are numerous beneficial owners of our common stock whose shares are held in “street name.”
Dividends
In July 2011, we implemented a cash dividend program in the amount of $0.40 per share annually, payable on a quarterly basis to holders of record of our common stock.
During 2012, we paid total dividends per share of $0.40 to holders of our common stock. During 2012, the Board of Directors declared dividends on a quarterly basis on February 21, 2012, April 18, 2012, July 17, 2012, and October 22, 2012, and we paid the dividends during the subsequent quarter in which the dividends were declared. The payment of dividends on common stock is at the discretion of the Board of Directors and is subject to customary limitations. While no assurances can be given, it is the intention of our Board of Directors to continue authorizing the quarterly dividend to the extent the Board determines that we have sufficient funds available. Effective February 20, 2013, the dividend amount was reduced to $0.28 per share annually.
20
On March 5, 2012, our board of directors unanimously adopted a stockholder rights plan and declared a dividend of one right for each outstanding share of our common stock. The Board adopted the rights plan in response to Oaktree Capital Management's unsolicited and highly conditional indication of interest as well as a subsequent indication by Oaktree Capital Management that it may accumulate additional shares of our stock in the open market.
The rights plan was designed to protect against any potential coercive or abusive takeover techniques and to help ensure that our stockholders are not deprived of the opportunity to realize full and fair value on their investment. The plan, which was adopted following evaluation and consultation with our outside advisors, is similar to plans adopted by numerous publicly traded companies.
In connection with the adoption of the stockholder rights plan, our board of directors declared a dividend of one right for each share of our common stock held by stockholders of record as of the close of business on March 15, 2012. Initially, the rights were not exercisable and traded with the shares of the Company's common stock. Under the plan, the rights were to be exercisable only 10 business days either after a person or group becomes an "acquiring person" by acquiring beneficial ownership of 10% or more of the Company's common stock or if a person or group commences a tender or exchange offer which, if consummated, would result in a person owning 10% or more of our common stock. In addition, if a person or group acquired beneficial ownership of 10% or more of our common stock, each right would have generally entitled the holder, other than the acquiring person or group, to acquire, for the exercise price of $80.00 per right, shares of our common stock (or, in certain circumstances, other consideration) having a market value equal to twice the right's then-current exercise price. Our board of directors retained the option to redeem the rights at a price of $0.01 per right at any time up to ten business days after a person or group acquires beneficial ownership of 10% or more of our common stock.
The rights plan expired on March 4, 2013.
21
Equity Compensation Plan Information
The table below sets forth the following information as of the year ended December 31, 2012 for (i) all compensation plans previously approved by our stockholders and (ii) all compensation plans not previously approved by our stockholders, if any:
(a)
the number of securities to be issued upon the exercise of outstanding options, warrants and rights;
(b) the weighted-average exercise price of such outstanding options, warrants and rights; and
(c) other than securities to be issued upon the exercise of such outstanding options, warrants and rights, the number of securities remaining available for future issuance under the plans.
|
Plan Category
|
|
Number of
Securities to
be Issued
upon release of
restricted stock,
Exercise of
Outstanding
Options,
Warrants
and Rights
(a)
|
|
|
Weighted-
Average Exercise
Price of
Outstanding
Options,
Warrants and
Rights
(b)
|
|
|
Number of
Securities
Remaining
Available for
Future Issuance
Under
Equity
Compensation
Plans (Excluding
Securities Reflected
in
Column (a & b))
(c)
|
||||
|
Equity compensation plans approved by security holders
|
134,644
|
$
|
19.82
|
803,976
|
||||||||
|
Equity compensation plans not approved by security holders
|
―
|
―
|
—
|
|||||||||
|
Total
|
134,644
|
$
|
19.82
|
803,976
|
||||||||
Equity compensation plans approved by our stockholders consists of the 2002 Stock Award and Incentive Plan. Additionally, 95,315 shares of restricted stock awards remained unvested as of December 31, 2012.
22
You should read the financial data set forth below in conjunction with “Management’s Discussion and Analysis of Financial Condition and Results of Operations” (included in Item 7) and our consolidated financial statements and the related notes (included in Item 8).
|
Years Ended December 31,
|
||||||||||||||||||||
|
2008
|
2009
|
2010
|
2011
|
2012
|
||||||||||||||||
|
(In thousands, except per share data)
|
||||||||||||||||||||
|
Consolidated Statement of Income Data:
|
||||||||||||||||||||
|
Net sales
|
$
|
903,397
|
$
|
803,704
|
$
|
747,268
|
$
|
677,751
|
$
|
666,762
|
||||||||||
|
Cost of sales
|
582,184
|
600,776
|
502,318
|
483,761
|
468,825
|
|||||||||||||||
|
Gross profit
|
321,213
|
202,928
|
244,950
|
193,990
|
197,937
|
|||||||||||||||
|
Selling, general and administrative expenses
|
241,301
|
227,036
|
194,753
|
192,710
|
211,159
|
|||||||||||||||
|
Write-down of intangible assets
|
9,076
|
8,221
|
—
|
―
|
―
|
|||||||||||||||
|
Write-down of goodwill
|
—
|
407,125
|
—
|
―
|
―
|
|||||||||||||||
|
Reorganization charges
|
—
|
12,994
|
—
|
―
|
―
|
|||||||||||||||
|
Income (loss) from operations
|
70,836
|
(452,448
|
)
|
50,197
|
1,280
|
(13,222
|
) | |||||||||||||
|
Profit (loss) from video game joint venture
|
17,092
|
(16,128
|
)
|
6,000
|
6,000
|
3,000
|
||||||||||||||
|
Equity in net income/(loss) of Joint Venture
|
—
|
—
|
(56
|
)
|
(34
|
) |
130
|
|||||||||||||
|
Interest income
|
3,396
|
318
|
333
|
412
|
671
|
|||||||||||||||
|
Interest expense
|
(2,425
|
)
|
(7,930
|
)
|
(6,732
|
)
|
(8,196
|
) |
(9,228
|
) | ||||||||||
|
Income (loss) before provision (benefit) for income taxes
|
88,899
|
(476,188
|
)
|
49,742
|
(538
|
) |
(18,649
|
) | ||||||||||||
|
Provision (benefit) for income taxes
|
12,842
|
(90,678
|
)
|
2,693
|
(9,010
|
) |
86,151
|
|||||||||||||
|
Net income (loss)
|
$
|
76,057
|
$
|
(385,510
|
)
|
$
|
47,049
|
$
|
8,472
|
$
|
(104,800
|
) | ||||||||
|
Basic earnings (loss) per share
|
$
|
2.78
|
$
|
(14.02
|
)
|
$
|
1.71
|
$
|
0.32
|
$
|
(4.37
|
) | ||||||||
|
Diluted earnings (loss) per share
|
$
|
2.42
|
$
|
(14.02
|
)
|
$
|
1.52
|
$
|
0.32
|
$
|
(4.37
|
) | ||||||||
|
Dividends declared per common share
|
—
|
—
|
—
|
$
|
0.20
|
$
|
0.40
|
|||||||||||||
During the fourth quarter of 2012, we booked a charge of $91.7 million to provision for income taxes related to the establishment of a full valuation allowance on our deferred tax assets.
During the third quarter of 2012, we acquired Maui, Inc., an Ohio corporation, Kessler Services, Inc., a Nevada corporation, and A.S. Design Limited, a Hong Kong corporation (collectively, “Maui”).
During the fourth quarter of 2011, we acquired Moose Mountain Toymakers Limited, a Hong Kong corporation, and Moose Mountain Marketing, Inc., a New Jersey Corporation (collectively, “Moose Mountain”).
During the fourth quarter of 2009, we incurred reorganization charges of $13.0 million related to office space consolidations and headcount reductions to right-size our general and administrative expenses, given the decrease in sales in 2009.
During the second and third quarters of 2009, we booked an aggregate cumulative write-down of $23.5 million related to our Preferred Return Receivable from our THQ joint venture as a result of the arbitration ruling which lowered the preferred return payment from a rate of 10% of net sales of the WWE video games sold by the joint venture to a rate of 6% of net sales.
During the second quarter of 2009, we booked a charge of $24.0 million related to the write-down of certain excess and impaired inventory. We also booked a charge of $33.2 million related to the write-down of license advances and minimum guarantees that are not expected to be earned through sales of that licensed product.
23
During the second quarter of 2009, we determined that the tradenames “Child Guidance,” “Play Along” and certain tradenames associated with our Crafts and Activities product lines would either be discontinued, or were under-performing. Consequently, the intangible assets associated with these tradenames were written off to “Write-down of Intangible Assets”, resulting in a non-cash charge of $8.2 million. During the second quarter of 2009, we determined that the significant decline in our market capitalization is likely to be sustained. Our market capitalization did not change significantly despite the dismissals subject to appeal of the WWE lawsuit, and the lower revenue expectations for 2009 versus 2008 were factors that indicated that an interim goodwill impairment test was required. As a result, we determined that $407.1 million, or all of the goodwill related to previous acquisitions, including the acquisition of Disguise in December 2008, was impaired. This amount is included in “Write-down of Goodwill” in the accompanying condensed consolidated statements of operations.
During the fourth quarter of 2008, we acquired Tollytots, Kids Only and Disguise.
During the third quarter of 2008, we decided to discontinue the use of the “Toymax” and “Trendmaster” tradenames on products and market these products under the JAKKS Pacific trademark. Consequently, the intangible assets associated with these tradenames were written off to write-down of intangible assets, resulting in a charge of $3.5 million. Also, we adjusted the value of the Child Guidance trademark to reflect lower sales expectations for this tradename, resulting in a charge to Write-down of Intangible Assets of $5.6 million.
|
At December 31,
|
||||||||||||||||||||
|
2008
|
2009
|
2010
|
2011
|
2012
|
||||||||||||||||
|
(In thousands)
|
||||||||||||||||||||
|
Consolidated Balance Sheet Data:
|
||||||||||||||||||||
|
Cash and cash equivalents
|
$
|
169,520
|
$
|
254,837
|
$
|
278,346
|
$
|
257,258
|
$
|
189,321
|
||||||||||
|
Working capital
|
325,061
|
352,189
|
387,252
|
374,652
|
186,581
|
|||||||||||||||
|
Total assets
|
1,028,124
|
634,093
|
633,406
|
615,234
|
554,825
|
|||||||||||||||
|
Short-term debt
|
—
|
20,262
|
—
|
―
|
70,710
|
|||||||||||||||
|
Long-term debt
|
98,000
|
86,728
|
89,458
|
92,188
|
94,918
|
|||||||||||||||
|
Total stockholders’ equity
|
746,953
|
372,109
|
412,408
|
393,591
|
207,220
|
|||||||||||||||
24
The following Management’s Discussion and Analysis of Financial Condition and Results of Operations contains forward-looking statements that involve risks and uncertainties. Our actual results could differ materially from those anticipated in these forward-looking statements as a result of various factors. You should read this section in conjunction with our consolidated financial statements and the related notes (included in Item 8).
Critical Accounting Policies
The accompanying consolidated financial statements and supplementary information were prepared in accordance with accounting principles generally accepted in the United States of America. Significant accounting policies are discussed in Note 2 to the Consolidated Financial Statements, Item 8. Inherent in the application of many of these accounting policies is the need for management to make estimates and judgments in the determination of certain revenues, expenses, assets and liabilities. As such, materially different financial results can occur as circumstances change and additional information becomes known. The policies with the greatest potential effect on our results of operations and financial position include:
Allowance for Doubtful Accounts.
Our allowance for doubtful accounts is based upon management’s assessment of the business environment, customers’ financial condition, historical collection experience, accounts receivable aging, customer disputes and the collectability of specific customer accounts. If there were a deterioration of a major customer’s creditworthiness, or actual defaults were higher than our historical experience, our estimates of the recoverability of amounts due to us could be overstated, which could have an adverse impact on our operating results. Our allowance for doubtful accounts is also affected by the time at which uncollectible accounts receivable balances are actually written off.
Major customers’ accounts are monitored on an ongoing basis; more in-depth reviews are performed based upon changes in a customer’s financial condition and/or the level of credit being extended. When a significant event occurs, such as a bankruptcy filing by a specific customer, and on a quarterly basis, the allowance is reviewed for adequacy and the balance or accrual rate is adjusted to reflect current risk prospects.
Revenue Recognition.
Our revenue recognition policy is to recognize revenue when persuasive evidence of an arrangement exists, title transfer has occurred (product shipment), the price is fixed or determinable and collectability is reasonably assured. Sales are recorded net of sales returns and discounts, which are estimated at the time of shipment based upon historical data. JAKKS routinely enters into arrangements with its customers to provide sales incentives and support customer promotions and we provide allowances for returns and defective merchandise. Such programs are primarily based upon customer purchases, customer performance of specified promotional activities and other specified factors such as sales to consumers. Accruals for these programs are recorded as sales adjustments that reduce gross revenue in the period the related revenue is recognized.
Goodwill and other indefinite-lived intangible assets.
Goodwill and indefinite-lived intangible assets are not amortized, but are tested for impairment at least annually at the reporting unit level.
Factors we consider important that could trigger an impairment review include the following:
|
●
|
significant underperformance relative to expected historical or projected future operating results;
|
|
|
●
|
significant changes in the manner of our use of the acquired assets or the strategy for our overall business; and
|
|
|
●
|
significant negative industry or economic trends.
|
Due to the subjective nature of the impairment analysis, significant changes in the assumptions used to develop the estimate could materially affect the conclusion regarding the future cash flows necessary to support the valuation of long-lived assets, including goodwill. The valuation of goodwill involves a high degree of judgment. Based upon the assumptions underlying the valuation, impairment is determined by estimating the fair value of a reporting unit and comparing that value to the reporting unit’s book value. If the implied fair value is more than the book value of the reporting unit, an impairment loss is not indicated. If impairment exists, the fair value of the reporting unit is allocated to all of its assets and liabilities excluding goodwill, with the excess amount representing the fair value of goodwill. An impairment loss is measured as the amount by which the book value of the reporting unit’s goodwill exceeds the estimated fair value of that goodwill.
25
Goodwill and intangible assets amounted to $118.2 million as of December 31, 2012.
Reserve for Inventory Obsolescence
. We value our inventory at the lower of cost or market. Based upon a consideration of quantities on hand, actual and projected sales volume, anticipated product selling prices and product lines planned to be discontinued, slow-moving and obsolete inventory is written down to its net realizable value.
Failure to accurately predict and respond to consumer demand could result in us under-producing popular items or overproducing less popular items. Furthermore, significant changes in demand for our products would impact management’s estimates in establishing our inventory provision.
Management estimates are monitored on a quarterly basis and a further adjustment to reduce inventory to its net realizable value is recorded, as an increase to cost of sales, when deemed necessary under the lower of cost or market standard.
Income Allocation for Income Taxes.
Our annual income tax provision and related income tax assets and liabilities are based upon actual income as allocated to the various tax jurisdictions based upon our transfer pricing study, US and foreign statutory income tax rates and tax regulations and planning opportunities in the various jurisdictions in which we operate. Significant judgment is required in interpreting tax regulations in the US and foreign jurisdictions, and in evaluating worldwide uncertain tax positions. Actual results could differ materially from those judgments, and changes from such judgments could materially affect our consolidated financial statements.
Income taxes and interest and penalties related to income tax payable.
We do not file a consolidated return for our foreign subsidiaries. We file federal and state returns and our foreign subsidiaries each file returns in their respective jurisdictions, as applicable. Deferred taxes are provided on a liability method, whereby deferred tax assets are recognized as deductible temporary differences and operating loss and tax credit carry-forwards and deferred tax liabilities are recognized for taxable temporary differences. Temporary differences are the differences between the reported amounts of assets and liabilities and their tax bases. Deferred tax assets are reduced by a valuation allowance when, in the opinion of management, it is more likely than not that some or all of the deferred tax assets will not be realized. Deferred tax assets and liabilities are adjusted for the effects of changes in tax laws and rates on the date of enactment.
We must assess the likelihood that we will be able to recover our deferred tax assets. Deferred tax assets are reduced by a valuation allowance, if, based upon the weight of available evidence, it is more likely than not that we will not realize some portion or all of the deferred tax assets. We consider all available positive and negative evidence when assessing whether it is more likely than not that deferred tax assets are recoverable. We consider evidence such as our past operating results, the existence of cumulative losses in previous periods and our forecast of future taxable income. We believe this to be a critical accounting policy because should there be a change in our ability to recover our deferred tax assets, our tax provision would increase in the period in which we determine that the recovery is not likely, which could have a material impact on our results of operations.
We have not provided for United States, federal income and foreign withholding taxes on the undistributed earnings of our foreign subsidiaries because we intend to reinvest such earnings indefinitely. Should we decide to remit this income to the U.S. in a future period, our provision for income taxes may increase materially in the period that our intent changes.
We accrue a tax reserve for additional income taxes and interest, which may become payable in future years as a result of audit adjustments by tax authorities. The reserve is based upon management’s assessment of all relevant information and is periodically reviewed and adjusted as circumstances warrant. As of December 31, 2012, our income tax reserves were approximately $4.8 million and relate to the potential income tax audit adjustments, primarily in the areas of income allocation, foreign depreciation allowances and state taxes.
We recognize current period interest expense and the reversal of previously recognized interest expense that has been determined to not be assessable due to the expiration of the related audit period or other compelling factors on the income tax liability for unrecognized tax benefits as interest expense, and penalties and penalty reversals related to the income taxes payable as other expense in our consolidated statements of operations.
26
Share-Based Compensation
. We grant restricted stock and options to purchase our common stock to our employees (including officers) and non-employee directors under our 2002 Stock Award and Incentive Plan (the “Plan”), which incorporated the shares remaining under our Third Amended and Restated 1995 Stock Option Plan. The benefits provided under the Plan are share-based payments. Related to the stock option grants, we estimate the value of share-based awards on the date of grant using the Black-Scholes option-pricing model. The determination of the fair value of share-based payment awards on the date of grant using an option-pricing model is affected by our stock price, as well as assumptions regarding a number of complex and subjective variables. These variables include our expected stock price volatility over the term of the awards, actual and projected employee stock option exercise behaviors, cancellations, terminations, risk-free interest rates and expected dividends. Related to the restricted stock award grants, we determine the value of each award based on the market value of the underlying common stock at the date of each grant and expense each award over the stipulated service period.
Recent Developments
During the second quarter of 2012, we amended the Settlement Agreement pursuant to which our joint venture with THQ was terminated as of December 31, 2009. In accordance with the original settlement agreement, we received and recorded as income $6.0 million in each of June 2010 and 2011. Although the amended settlement agreement called for the payment of an additional $1.0 million on October 30, 2012 (which we received) and $0.4 million each in ten consecutive monthly payments beginning February 28, 2013, on December 19, 2012, THQ filed voluntary petitions under Chapter 11 of the U.S. Bankruptcy Court, and on January 24, 2013 the US Bankruptcy Court approved the sale of most of THQ’s assets to multiple buyers. Given that the final payment received from THQ (in October 2012) was within 90 days of their filing for bankruptcy, we have not recognized this payment as revenue and have reserved the amount received pending the final settlement of THQ’s assets in accordance with bankruptcy law.
Acquisitions
On September 14, 2012, we acquired all of the stock of JKID, LTD., a United Kingdom corporation, for an initial cash consideration of $1.1 million and deferred cash payments of $5.5 million payable in five semi-annual payments of $1.1 million each. In addition, we agreed to pay an earn-out of up to an aggregate amount of $4.4. million in cash over the two year period of 2015 through 2016, based upon the achievement of certain financial performance criteria, which has been accrued and recorded as goodwill as of December 31, 2012. We have not finalized our purchase price allocation for JKID. JKID is the developer of augmented reality technology that enhances the play patterns of toys and consumer products.
On July 26, 2012, we acquired all of the stock of Maui, Inc., an Ohio corporation, Kessler Services, Inc., a Nevada corporation, and A.S. Design Limited, a Hong Kong corporation (collectively, "Maui"). The total initial consideration of $37.6 million consisted of $36.2 million in cash and the assumption of liabilities in the amount of $1.4 million. In addition, we agreed to pay an earn-out of up to an aggregate amount of $18.0 million in cash over the three calendar years following the acquisition based upon the achievement of certain financial performance criteria, which has been accrued and recorded as goodwill as of December 31, 2012.
On October 14, 2011, we acquired all of the stock of Moose Mountain Toymakers Limited, a Hong Kong company, and a related New Jersey company, Moose Mountain Marketing, Inc. (collectively, “Moose Mountain”). The total initial consideration of $31.5 million consisted of $16.0 million in cash and the assumption of liabilities in the amount of $15.5 million, and resulted in goodwill of $13.5 million. In addition, we agreed to pay an earn-out of up to an aggregate amount of $5.3 million in cash over the three calendar years following the acquisition based upon the achievement of certain financial performance criteria. The fair value of the expected earn-out was included in goodwill and assumed liabilities as of December 31, 2011. Moose Mountain is a leading designer and producer of foot to floor ride-ons, inflatable environments, wagons, pinball machines and tents and was included in our results of operations from the date of acquisition.
27
Results of Operations
The following table sets forth, for the periods indicated, certain statement of operations data as a percentage of net sales.
|
Years Ended December 31,
|
||||||||||||
|
2010
|
2011
|
2012
|
||||||||||
|
Net Sales
|
100.0
|
%
|
100.0
|
%
|
100.0
|
%
|
||||||
|
Cost of Sales
|
67.2
|
71.4
|
70.3
|
|||||||||
|
Gross profit
|
32.8
|
28.6
|
29.7
|
|||||||||
|
Selling, general and administrative expenses
|
26.1
|
28.4
|
31.7
|
|||||||||
|
Income (loss) from operations
|
6.7
|
0.2
|
(2.0
|
) | ||||||||
|
Profit from video game joint venture
|
0.8
|
0.9
|
0.5
|
|||||||||
|
Interest income
|
—
|
0.1
|
0.1
|
|||||||||
|
Interest expense
|
(0.9
|
)
|
(1.2
|
) |
(1.4
|
) | ||||||
|
Income (loss) before provision (benefit) for income taxes
|
6.6
|
―
|
(2.8
|
) | ||||||||
|
Provision (benefit) for income taxes
|
0.3
|
(1.3
|
) |
12.9
|
||||||||
|
Net income (loss)
|
6.3
|
%
|
1.3
|
%
|
(15.7
|
)%
|
||||||
The following table summarizes, for the periods indicated, certain income statement data by segment (in thousands).
|
|
Years Ended December 31,
|
|||||||||||
|
2010
|
2011
|
2012
|
||||||||||
|
Net Sales
|
||||||||||||
|
Traditional Toys and Electronics
|
$
|
358,356
|
$
|
348,852
|
$
|
363,681
|
||||||
|
Role Play, Novelty and Seasonal Toys
|
388,912
|
328,899
|
303,081
|
|||||||||
|
747,268
|
677,751
|
666,762
|
||||||||||
|
Cost of Sales
|
||||||||||||
|
Traditional Toys and Electronics
|
238,157
|
247,951
|
249,860
|
|||||||||
|
Role Play, Novelty and Seasonal Toys
|
264,161
|
235,810
|
218,965
|
|||||||||
|
502,318
|
483,761
|
468,825
|
||||||||||
|
Gross Margin
|
||||||||||||
|
Traditional Toys and Electronics
|
120,199
|
100,901
|
113,821
|
|||||||||
|
Role Play, Novelty and Seasonal Toys
|
124,751
|
93,089
|
84,116
|
|||||||||
|
$
|
244,950
|
$
|
193,990
|
$
|
197,937
|
|||||||
28
Comparison of the Years Ended December 31, 2012 and 2011
Net Sales
Traditional Toys and Electronics.
Net sales of our Traditional Toys and Electronics segment were $363.7 million in 2012, compared to $348.9 million in 2011, representing an increase of $14.8 million, or 4.2%. The increase in net sales was primarily due to the launch of Power Train, action figures based on the animation series Monsuno®, Disney® large dolls and accessories, Winx Club® dolls and sales contribution of our recently acquired Moose Mountain division. This was offset in part by decreases in unit sales of some products, including plush and action figures based on the Club Penguin® brand, Spy Net® and electronics based on the Plug it in and Play TV Games® brand.
Role Play, Novelties and Seasonal Products
. Net sales of our Role Play, Novelties and Seasonal Products were $303.1 million in 2012, compared to $328.9 million in 2011, representing a decrease of $25.8 million, or 7.8%. The decrease in net sales was primarily due to decreases in unit sales of role play and dress-up toys, including those based on Disney Princess® and Disney Fairies®. This was partially offset by the sales contribution of our recently acquired Maui Toys division.
Cost of Sales
Traditional Toys
and Electronics
. Cost of sales of our Traditional Toys and Electronics segment was $249.9 million, or 68.7% of related net sales, in 2012, compared to $248.0 million, or 71.1% of related net sales, in 2011, representing an increase of $1.9 million, or 0.8%. This percentage cost of sales decrease was primarily due to charges in 2011 of $12.8 million related to the write-down of license advances and minimum guarantees that are not expected to be earned through sales of that licensed product, whereas 2012 charges related to the write-down of licenses was approximately $3.7 million. Excluding these charges, cost of sales was $235.2 million in 2011 and $246.2 million in 2012, representing an increase of $11.0 million, or 4.7%, this increase primarily consisted of an increase in product costs of $7.5 million, which is in line with the higher volume of sales. Excluding the license impairment charges, royalty expense for our Traditional Toys and Electronics segment increased by $3.7 million, which is in line with the higher volume of sales. Our depreciation of molds and tools was comparable year over year.
Role Play, Novelties and Seasonal Products
. Cost of sales of our Role Play, Novelties and Seasonal Products segment was $219.0 million in 2012, or 72.2% of related net sales, compared to $235.8 million in 2011, or 71.7% of related net sales, representing a decrease of $16.8 million, or 7.1%. This percentage cost of sales increase was partially due to charges of $5.3 million and $3.6 million in 2011 and 2012, respectively, related to the write-down of license advances and minimum guarantees that are not expected to be earned out through sales of that licensed product. Excluding these charges, cost of sales was $215.4 million in 2012 and $230.5 million in 2011, representing a decrease of $15.1 million, or 6.6%. This decrease which primarily consisted of a decrease in product costs of $12.5 million, which is in line with the lower volume of sales. Excluding the license impairment charges, royalty expense decreased by $2.8 million, which is in line with the lower volume of sales. Royalty expense as a percentage of sales decreased due to changes in the product mix to more products with lower royalty rates or proprietary products with no royalty rates from products with higher royalty rates.
Selling, General and Administrative Expenses
Selling, general and administrative expenses were $211.2 million in 2012 and $192.7 million in 2011, constituting 31.7% and 28.4% of net sales, respectively. The overall increase of $18.5 million was primarily due to the incremental overhead of our recent acquisitions, Moose Mountain ($7.3 million) and Maui ($2.5 million). Additionally, increases in
other
direct selling expenses ($1.
9
million), product development ($1.2 million), travel expenses ($1.2 million), legal and financial advising fees related to the unsolicited indication of interest to acquire our company ($1.0 million) and legal expenses ($0.6 million) contributed to the increase to selling, general and administrative expenses year over year. Advertising and tradeshow expenses increased as a result of new product line launches in 2012, such as Monsuno®, and the introduction of our DreamPlay® technology ($7.7 million). This was offset in part by decreases in amortization expense related to intangible assets other than goodwill ($1.3 million), bad debt recovery ($0.6 million), currency exchange gains ($1.0 million) and restricted stock compensation ($0.5 million).
29
Reorganization Charges
We incurred reorganization charges in 2009 to consolidate and stream-line our existing business functions. This was necessary given the decreased volume of consolidated sales in 2009 from 2008 and the added general and administrative expenses from the three acquisitions made at the end of 2008. Restructuring charges relate to the termination of lease obligations, one-time severance termination benefits, fixed asset write-offs and other contract terminations and are accounted for in accordance with “Exit and Disposal Cost Obligations”, ASC 420-10. We establish a liability for a cost associated with an exit or disposal activity when a liability is incurred, rather than at the date we commit to an exit plan.
The components of the reorganization charges are as follows (in thousands):
|
Accrued Balance
|
Accrued Balance
|
|||||||||||||||
|
|
December 31, 2011
|
Accrual
|
Actual
|
December 31, 2012
|
||||||||||||
|
Lease abandonment costs
|
$
|
3,484
|
$ |
—
|
$
|
1,243
|
$
|
2,241
|
||||||||
|
Total reorganization charges
|
$
|
3,484
|
$ |
—
|
$
|
1,243
|
$
|
2,241
|
||||||||
Profit from Video Game Joint Venture
We recognized $6.0 million in 2011 and $3.0 million in 2012 in income related to our video game joint venture. Pursuant to a Settlement Agreement and Mutual Release dated December 22, 2009, the joint venture was terminated on December 31, 2009 and we received and recorded as income as received fixed payments from THQ of $6.0 million in 2011 and $3.0 million in 2012. Although an amended settlement agreement called for the payment of an additional $1.0 million October 30, 2012 (which we received) and $0.4 million each in ten consecutive monthly payments beginning February 28, 2013, on December 19, 2012, THQ filed voluntary petitions under Chapter 11 of the U.S. Bankruptcy Court, and on January 24, 2013 the US Bankruptcy Court approved the sale of most of THQ’s assets to multiple buyers. Given that the final payment received from THQ (in October 2012) was within 90 days of their filing for bankruptcy, we have not recognized this payment as revenue and have reserved the amount received pending the final settlement of THQ’s assets in accordance with bankruptcy law.
Interest Income
Interest income in 2012 was $0.
7
million, comparable to $0.4 million in 2011.
Interest Expense
Interest expense was $9.2 million in 2012, as compared to $8.2 million in 2011. In 2012, we recorded interest expense of $8.0 million related to our convertible senior notes payable, $0.8 million related to our credit facility and $0.4 million related to the interest component of our Maui acquisition earn out payment. In 2011, we recorded interest expense of $8.0 million related to our convertible senior notes payable and net interest expense of $0.2 million related to uncertain tax positions taken or expected to be taken in a tax return.
30
Provision for Income Taxes
Our income tax expense, which includes federal, state and foreign income taxes and discrete items, was $86.2 million, or an effective tax rate of (462%) for 2012. During 2011, the income tax benefit was $9.0 million, or an effective tax rate of 1,671%.
Included in the tax expense of $86.2 million are discrete tax expenses of $92.5 million comprised of expense of $91.7 million relating to the establishment of a 100% valuation allowance against our U.S. deferred tax assets, $0.4 million benefit related to reduction of uncertain tax positions due to statute expiration, $0.5 million expense related to state tax apportionment changes and $0.7 million expense related to income tax audit settlement. (see Note 13 of the Notes to Consolidated Financial Statements). Absent these discrete tax expenses, our effective tax rate for 2012 was 34.2%, primarily due to the foreign rate differential between the United States and Hong Kong. The foreign rate differential is impacted by the proportion of Hong Kong earnings to overall earnings and is expected to vary depending on the level of consolidated earnings
We assess the available positive and negative evidence to estimate if sufficient future taxable income will be generated to use the existing deferred tax assets by jurisdiction. For the three-year period ended December 31, 2012, we were in a cumulative pre-tax loss position in the U.S. On the basis of this evaluation, as of December 31, 2012, a valuation allowance of $91.7 million has been recorded against the U.S. deferred tax assets that more likely than not will not be realized. The net deferred tax liabilities of $3.1 million represent the net deferred tax liabilities in the foreign jurisdiction, where we are in a cumulative income position.
In 2011, included in the tax benefit of $9.0 million were discrete tax benefits of $2.1 million. These tax benefits were comprised of $1.7 million related to state tax apportionment changes and
an adjustment to record various outstanding state tax refunds and
$0.3 million reduction of uncertain tax positions related to foreign depreciation due to statute expiration. Absent these discrete tax benefits, our effective tax rate for 2011 would have been 1,288%, due to the foreign rate differential between the United States and Hong Kong. The foreign rate differential is impacted by the proportion of Hong Kong earnings to overall earnings and is expected to vary depending upon the level of consolidated earnings.
As of December 31, 2012, we had net deferred tax liabilities of approximately $3.1 million.
Comparison of the Years Ended December 31, 2011 and 2010
Net Sales
Traditional Toys and Electronics.
Net sales of our Traditional Toys and Electronics segment were $348.9 million in 2011, compared to $358.4 million in 2010, representing a decrease of $9.5 million, or 2.7%. The decrease in net sales was primarily due to lower unit sales of our UFC® and TNA® action figures and accessories, JAKKS™ dolls based on Taylor Swift®, JAKKS™ dolls based on Disney Fairies® and Disney Princess®, electronics based on TV Games and EyeClops® brands, and other JAKKS products, including Real Construction™ activity products , Girl Gourmet® and pet toy products. This was offset in part by increases in unit sales of some products, including In My Pocket & Friends™, Cabbage Patch Kids®, Smurfs® and Pokémon® figures and accessories.
Role Play, Novelties and Seasonal Products
. Net sales of our Role Play, Novelties and Seasonal Products were $328.9 million in 2011, compared to $388.9 million in 2010, representing a decrease of $60.0 million, or 15.4%. The decrease in net sales was primarily due to decreases in unit sales of our Halloween costumes and accessories, and role play and dress-up toys, including those based on Disney Princess® and Disney Fairies®.
Cost of Sales
Traditional Toys
and Electronics
. Cost of sales of our Traditional Toys and Electronics segment was $248.0 million, or 71.1% of related net sales, in 2011, compared to $238.2 million, or 66.5% of related net sales in 2010, representing an increase of $9.8 million, or 4.1%. This percentage cost of sales increase was primarily due to charges in 2011 of $12.8 million related to the write-down of license advances and minimum guarantees that are not expected to be earned through sales of that licensed product. Excluding these charges, cost of sales was $235.2 million in 2011, representing a decrease of $3.0 million in 2011 , or 1.3%, which primarily consisted of a decrease in product costs of $4.6 million, which is in line with the lower volume of sales. Product costs as a percentage of sales increased primarily due to the mix of the product sold and higher sales of closeout product. Excluding the license impairment charges, royalty expense for our Traditional Toys and Electronics segment increased by $3.0 million and increased as a percentage of net sales due to changes in the product mix to more products with higher royalty rates from products with lower royalty rates or proprietary products with no royalty rates. Our depreciation of molds and tools decreased by $1.4 million primarily due to decreased purchases of molds and tools in this segment.
31
Role Play, Novelties and Seasonal Products
. Cost of sales of our Role Play, Novelties and Seasonal Products segment was $235.8 million, or 71.7% of related net sales in 2011, compared to $264.2 million, or 67.9% of related net sales in 2010, representing a decrease of $28.4 million, or 10.7%. This percentage cost of sales increase was partially due to charges in 2011of $5.3 million related to the write-down of license advances and minimum guarantees that are not expected to be earned out through sales of that licensed product. Excluding these one-time charges, cost of sales was $230.5 million, representing a decrease of $33.7 million in 2011, or 12.8%, which primarily consisted of a decrease in product costs of $28.0 million, which is in line with the lower volume of sales. Product costs as a percentage of net sales increased primarily due to the mix of the product sold. Excluding the one-time charges, royalty expense decreased by $5.8 million, which is in line with the lower volume of sales. Royalty expense as a percentage of net sales was comparable year over year. Our depreciation of molds and tools was comparable year over year.
Selling, General and Administrative Expenses
Selling, general and administrative expenses were $192.7 million in 2011 and $194.8 million in 2010, constituting 28.4% and 26.1% of net sales, respectively. The overall decrease of $2.1 million in such costs was primarily due to decreases in direct selling expenses ($5.5 million), stock based compensation ($2.8 million), and depreciation and amortization ($1.4 million), offset by increases in general and administrative expenses ($6.5 million), and product development ($1.1 million). The increase in general and administrative expenses was primarily due to increases in legal and financial advising fees related to the unsolicited indication of interest to acquire our company ($3.7 million), legal expense ($1.6 million), other professional fees ($0.7 million) and travel expenses ($1.2 million), and employee relocation expenses ($0.5 million), offset in part by decreases in donation expenses ($0.9 million) and insurance expense ($0.4 million). Product development expenses increased as a result of new product line launches in 2012 such as Monsuno™ and Winx Club®. The decrease in direct selling expenses was primarily due to decreases in variable selling expenses related to the lower volume of sales in 2011. The decrease in depreciation and amortization was mainly due to a decrease in amortization expense related to intangible assets other than goodwill ($0.9 million).
32
Reorganization Charges
We incurred reorganization charges in 2009 to consolidate and stream-line our existing business functions. This was necessary given the decreased volume of consolidated sales in 2009 from 2008 and the added general and administrative expenses from the three acquisitions made at the end of 2008. Restructuring charges relate to the termination of lease obligations, one-time severance termination benefits, fixed asset write-offs and other contract terminations and are accounted for in accordance with “Exit and Disposal Cost Obligations”, ASC 420-10. We establish a liability for a cost associated with an exit or disposal activity when a liability is incurred, rather than at the date we commit to an exit plan.
The components of the reorganization charges are as follows (in thousands):
|
Accrued Balance
|
Accrued Balance
|
|||||||||||||||
|
|
December 31, 2010
|
Accrual
|
Actual
|
December 31, 2011
|
||||||||||||
|
Lease abandonment costs
|
$
|
5,264
|
$ |
—
|
$
|
(1,780)
|
$
|
3,484
|
||||||||
|
Total reorganization charges
|
$
|
5,264
|
$ |
—
|
$
|
(1,780)
|
$
|
3,484
|
||||||||
Profit from Video Game Joint Venture
We recognized $6.0 million in each of 2010 and 2011 in income related to our video game joint venture. Pursuant to a Settlement Agreement and Mutual Release dated December 22, 2009, the joint venture was terminated on December 31, 2009 and we received and recorded as income as received fixed payments from THQ of $6.0 million in each of 2010 and 2011. Although an amended settlement agreement called for the payment of an additional $4.0 million during 2012 ($3.0 million of which we received) and $0.4 million each in ten consecutive monthly payments beginning February 28, 2013, on December 19, 2012, THQ filed voluntary petitions under Chapter 11 of the U.S. Bankruptcy Court, and on January 24, 2013 the US Bankruptcy Court approved the sale of most of THQ’s assets to multiple buyers. Given that the final payment received from THQ ($1.0 million in October 2012) was within 90 days of their filing for bankruptcy, we have not recognized this payment as revenue and have reserved the amount received pending the final settlement of THQ’s assets in accordance with bankruptcy law.
33
Interest Income
Interest income in 2011 was $0.4 million, compared to $0.3 million in 2010.
Interest Expense
Interest expense was $8.2 million in 2011, compared to $6.7 million in 2010. In 2011, we recorded interest expense of $8.0 million related to our convertible senior notes payable and net interest expense of $0.2 million related to uncertain tax positions taken or expected to be taken in a tax return. In 2010, we recorded interest expense of $8.9 million related to our convertible senior notes payable and offset in part by a net benefit of $1.6 million related to uncertain tax positions taken or expected to be taken in a tax return.
Provision for Income Taxes
Our income tax benefit, which includes federal, state and foreign income taxes, was $9.0 million, or an effective tax rate of 1,671% for 2011. During 2010, the income tax expense was $2.7 million, or an effective tax provision rate of 5.41%.
Included in the tax benefit of $9.0 million were discrete tax benefits of $2.1 million. These tax benefits were comprised of $0.3 million reduction of uncertain tax positions related to foreign depreciation due to statute expiration, $1.7 million benefit related to state tax apportionment changes and
an adjustment to record various outstanding state tax refunds
. (see Note 13 of the Notes to Condensed Consolidated Financial Statements). Absent these discrete tax benefits, our effective tax rate for 2011 was 1,288%, primarily due to the foreign rate differential between the United States and Hong Kong. The foreign rate differential is impacted by the proportion of Hong Kong earnings to overall earnings and is expected to vary depending upon the level of consolidated earnings.
In 2010, included in the tax expense of $2.7 million were discrete tax benefits of $10.3 million. These tax benefits were comprised of $4.7 million reduction of uncertain tax positions due to settlement of 2003-2006 IRS exams and statute expirations, $4.0 million benefit related to a refund received from the IRS for previously filed amended returns, and $1.7 million benefit attributable to a transfer pricing adjustment. Absent these discrete tax benefits, our effective tax rate for 2010 would have been 26.2%.
As of December 31, 2011, we had net deferred tax assets of approximately $81.6 million.
34
Quarterly Fluctuations and Seasonality
We have experienced significant quarterly fluctuations in operating results and anticipate these fluctuations in the future. The operating results for any quarter are not necessarily indicative of results for any future period. Our first quarter is typically expected to be the least profitable as a result of lower net sales but substantially similar fixed operating expenses. This is consistent with the performance of many companies in the toy industry.
The following table presents our unaudited quarterly results for the years indicated. The seasonality of our business is reflected in this quarterly presentation.
|
|
2011
|
2012
|
|||||||||||||||||||||||||||||
|
|
First
|
Second
|
Third
|
Fourth
|
First
|
Second
|
Third
|
Fourth
|
|||||||||||||||||||||||
|
(unaudited)
|
Quarter
|
Quarter
|
Quarter
|
Quarter
|
Quarter
|
Quarter
|
Quarter
|
Quarter
|
|||||||||||||||||||||||
|
Net sales
|
$
|
72,323
|
131,930
|
332,419
|
141,079
|
$
|
73,405
|
145,359
|
314,491
|
133,507
|
|||||||||||||||||||||
|
As a % of full year
|
10.7
|
%
|
19.5
|
%
|
49.0
|
%
|
20.8
|
%
|
11.0
|
%
|
21.8
|
%
|
47.2
|
%
|
20.0
|
%
|
|||||||||||||||
|
Gross Profit
|
24,271
|
45,092
|
105,670
|
18,957
|
23,566
|
46,893
|
96,712
|
30,766
|
|||||||||||||||||||||||
|
As a % of full year
|
12.5
|
%
|
23.2
|
%
|
54.5
|
%
|
9.8
|
%
|
11.9
|
%
|
23.7
|
%
|
48.9
|
%
|
15.5
|
%
|
|||||||||||||||
|
As a % of net sales
|
33.6
|
%
|
34.2
|
%
|
31.8%
|
13.4
|
%
|
32.1
|
%
|
32.3
|
%
|
30.8
|
%
|
23.0
|
%
|
||||||||||||||||
|
Income (loss) from operations
|
(14,790
|
) |
1,998
|
50,068
|
(35,996
|
) |
(19,410
|
) |
107
|
37,296
|
(31,215
|
) | |||||||||||||||||||
|
As a % of full year
|
(1,155.5
|
)%
|
156.1
|
%
|
3,911.6
|
%
|
(2,812.2
|
)%
|
146.8
|
%
|
(0.8
|
)%
|
(282.1
|
)%
|
236.1
|
%
|
|||||||||||||||
|
As a % of net sales
|
(20.4
|
)%
|
1.5
|
%
|
15.1
|
%
|
(25.5
|
)%
|
(26.4
|
)%
|
0.1
|
%
|
11.9
|
%
|
(23.4
|
)%
|
|||||||||||||||
|
Income (loss) before provision
(benefit) for income taxes
|
(16,716
|
) |
6,087
|
48,081
|
(37,990
|
) |
(21,192
|
) |
288
|
36,426
|
(34,171
|
) | |||||||||||||||||||
|
As a % of net sales
|
(23.1
|
)%
|
4.6
|
%
|
14.5
|
%
|
(26.9
|
)%
|
(28.9
|
)%
|
0.2
|
%
|
11.6
|
%
|
(25.6
|
)%
|
|||||||||||||||
|
Net income (loss)
|
(10,575
|
) |
4,240
|
34,825
|
(20,018
|
) |
(16,000
|
) |
214
|
30,443
|
(119,457
|
) | |||||||||||||||||||
|
As a % of net sales
|
(14.6
|
)%
|
3.2
|
%
|
10.5
|
%
|
(14.2
|
)%
|
(21.8)
|
)%
|
0.1
|
%
|
9.7
|
%
|
(89.5
|
)%
|
|||||||||||||||
|
Diluted (loss) earnings per share
|
$
|
(0.39
|
) |
0.16
|
1.10
|
(0.77
|
) |
$
|
(0.62
|
) |
0.01
|
1.10
|
(5.45
|
) | |||||||||||||||||
|
Weighted average shares
and equivalents outstanding
|
27,217
|
27,096
|
32,922
|
25,839
|
25,831
|
25,870
|
28,933
|
21,923
|
|||||||||||||||||||||||
Consistent with the seasonality of our business, first quarter 2011 and 2012 experienced seasonally low sales which coupled with fixed overhead including incremental overhead from the 2011 acquisition of Moose Mountain, resulted in significant net losses.
In the fourth quarter of 2011 and 2012, we experienced poor performance of some of our products which coupled with advertising commitments, license royalty shortfalls and retailer markdowns due to lower than anticipated sales and sell-through, resulted in significant net losses.
In the third quarter of 2012, we repurchased 4.0 million shares of our outstanding common stock resulting in lower weighted average shares outstanding in the third and fourth quarters of 2012.
35
Quarterly and year-to-date computations of income (loss) per share amounts are made independently. Therefore, the sum of the per share amounts for the quarters may not agree with the per share amounts for the year.
Debt with Conversion and Other Options
The provisions of ASC 470-20, “
Debt with Conversion and Other Options
” are applicable to the 4.5% convertible notes, see Note 12, Convertible Senior Notes. ASC 470-20 requires that we separately account for the liability (debt) and equity (conversion feature) components of the Notes in a manner that reflects our nonconvertible debt borrowing rate at the date of issuance when interest cost is recognized in subsequent periods. We allocated $13.7 million of the $100.0 million principal amount of the Notes to the equity component, which represents a discount to the debt and will be amortized into interest expense through November 1, 2014. Accordingly, our effective annual interest rate on the Notes will be approximately 7.9%. The Notes are classified as long-term debt in the balance sheet at December 31, 2011 based on their November 1, 2014 maturity date. Debt issuance costs of approximately $3.7 million are being amortized to interest expense over the five year term of the Notes.
Liquidity and Capital Resources
As of December 31, 2012, we had working capital of $186.6 million, compared to $374.7 million as of December 31, 2011. This decrease was primarily attributable to the incurrence of short term debt of $70.7 million, a decrease in cash and cash equivalents of $67.9 million and changes in our tax positions of $38.3 million.
Operating activities provided net cash of $24.2 million, $44.3 million and $67.5 million for the years ended December 31, 2012, 2011 and 2010, respectively. Net cash was impacted primarily by our net loss, adjusted for non-cash items such as deferred income taxes. Our accounts receivable turnover as measured by days sales for the quarter outstanding in accounts receivable was 73 days, 67 days and 56 days as of December 31, 2012, 2011 and 2010, respectively. Other than open purchase orders issued in the normal course of business, we have no obligations to purchase finished goods from our manufacturers. As of December 31, 2012, we had cash and cash equivalents of $189.3 million.
Cash used in investing activities totaled $72.7 million, $36.3 million and $13.2 million for the years ended December 31, 2012, 2011 and 2010, respectively. Cash used in 2012 consisted primarily of $36.2 million cash paid and liabilities incurred for the Maui acquisition, $13.1 million cash paid for the purchase of office furniture and equipment and molds and tooling used in the manufacture of our products, the $10.9 million investment in JKID, $8.0 million cash paid to NantWorks LLC for recognition technology exclusivity rights, and the $7.0 million paid to NantWorks LLC for our ownership interest in DreamPlay LLC. In 2011, our investing activities consisted primarily of cash paid for the Moose Mountain Acquisition of $16.0 million, Tollytots earn-out of $1.7 million, Kids Only earn-out of $3.7 million, and $12.5 million cash paid for the purchase of office furniture and equipment and molds and tooling used in the manufacture of our products. In 2010, our investing activities consisted primarily of cash paid for the Kids Only earn-out of $1.9 million and the purchase of office furniture and equipment and molds and tooling used in the manufacture of our products of $11.6 million. As part of our strategy to develop and market new products, we have entered into various character and product licenses with royalties generally ranging from 1% to 14% payable on net sales of such products. As of December 31, 2012, these agreements required future aggregate minimum guarantees of $26.5 million, exclusive of $22.0 million in advances already paid. Of this $26.5 million future minimum guarantee, $14.6 million is due over the next twelve months.
Cash used in financing activities totaled $19.4 million, $29.1 million and $30.8 million for the years ended December 31, 2012, 2011 and 2010, respectively. Cash used in 2012 consisted primarily of $80.0 million cash paid for the repurchase of our common stock and $9.6 million cash paid as dividends to our shareholders, offset by $70.7 million cash provided by the asset based loan we secured in September 2012.
The following is a summary of our significant contractual cash obligations for the periods indicated that existed as of December 31, 2012 and is based upon information appearing in the notes to the consolidated financial statements (in thousands):
|
Less than
1 year
|
|
|
1 – 3
years
|
|
|
3 – 5
years
|
|
|
More Than
5 years
|
Total
|
||||||||||
|
Long-term debt
|
$
|
—
|
$
|
100,000
|
$
|
―
|
$
|
—
|
$
|
100,000
|
||||||||||
|
Interest on long-term debt
|
4,500
|
3,878
|
―
|
—
|
8,378
|
|||||||||||||||
|
Operating leases
|
13,112
|
24,340
|
4,743
|
—
|
42,195
|
|||||||||||||||
|
Minimum guaranteed license/royalty payments
|
14,573
|
10,885
|
1,000
|
―
|
26,458
|
|||||||||||||||
|
Employment contracts
|
9,551
|
10,575
|
2,605
|
—
|
22,731
|
|||||||||||||||
| Revolving credit facility | 70,710 |
—
|
— | — | 70,710 | |||||||||||||||
|
Total contractual cash obligations
|
$
|
112,446
|
$
|
149,678
|
$
|
8,348
|
$
|
—
|
$
|
270,472
|
||||||||||
The above table excludes any potential uncertain income tax liabilities that may become payable upon examination of our income tax returns by taxing authorities. Such amounts and periods of payment cannot be reliably estimated. See Note 13 to the financial statements for further explanation of our uncertain tax positions.
36
In September 2012, we acquired all of the stock of JKID, LTD., a United Kingdom corporation for an initial cash consideration of $1.1 million and deferred cash payments of $5.5 million payable in five semi-annual payments of $1.1 million each. In addition, we agreed to pay an earn-out of up to an aggregate amount of $4.4 million in cash over the two year period of 2015 through 2016, based upon the achievement of certain financial performance criteria, which has been accrued and recorded as goodwill as of December 31, 2012. All future changes to the earn-out liability will be charged to income. JKID is the developer of augmented reality technology that enhances the play patterns of toys and consumer products.
In July 2012, we acquired all of the stock of Maui, Inc., an Ohio corporation, Kessler Services, Inc., a Nevada corporation, and A.S. Design Limited, a Hong Kong corporation (collectively, “Maui”). The initial cash consideration totaled $36.2 million. In addition, we agreed to pay an earn-out of up to an aggregate amount of $18.0 million in cash over the three calendar years following the acquisition based upon the achievement of certain financial performance criteria, which has been accrued and recorded as goodwill as of December 31, 2012. All future changes to the earn-out liability will be charged to income. Maui is a leading manufacturer and distributor of spring and summer activity toys and impulse toys and was included in our results of operations from the date of acquisition.
In
October
2011, we acquired all of the stock of Moose Mountain Toymakers Limited, a Hong Kong company, and a related New Jersey company, Moose Mountain Marketing, Inc. (collectively, “Moose Mountain”). The total initial consideration of $31.5 million consisted of $16.0 million in cash and the assumption of liabilities in the amount of $15.5 million, and resulted in goodwill of $13.5 million. In addition, we agreed to pay an earn-out of up to an aggregate amount of $5.3 million in cash over the three calendar years following the acquisition based upon the achievement of certain financial performance criteria. The fair value of the expected earn-out was included in goodwill and assumed liabilities as of December 31, 2011. Moose Mountain is a leading designer and producer of foot to floor ride-ons, inflatable environments, wagons, pinball machines and tents and was included in our results of operations from the date of acquisition.
In October 2010, our Board of Directors authorized us to repurchase up to $30.0 million of our common stock. As of December 31, 2011, we
completed the authorization and
purchased 1,771,633 shares at an aggregate cost of approximately $30.0 million.
In October 2008, we acquired substantially all of the assets of Tollytots Limited. The total initial consideration of $26.8 million consisted of $12.0 million in cash and the assumption of liabilities in the amount of $14.8 million, and resulted in goodwill of $4.1 million, all of which has been determined to be impaired and was written off in the quarter ended June 30, 2009. In addition, we agreed to pay an earn-out of up to an aggregate amount of $5.0 million in cash over the three calendar years following the acquisition based upon the achievement of certain financial performance criteria, which will be recorded as goodwill when and if earned. In the first earn-out period ended December 31, 2009, no portion of the earn-out was earned, while $1.7 million was earned for each of the second and third earn-out periods ended December 31, 2010 and 2011. Tollytots is a leading designer and producer of licensed baby dolls and baby doll pretend play accessories based on well-known brands and was included in our results of operations from the date of acquisition.
In October 2008, we acquired all of the stock of Kids Only, Inc. and a related Hong Kong company, Kids Only Limited (collectively, “Kids Only”). The total initial consideration of $23.8 million consisted of $20.4 million in cash and the assumption of liabilities in the amount of $3.4 million, and resulted in goodwill of $13.2 million, all of which has been determined to be impaired and was written off in the quarter ended June 30, 2009. In addition, we agreed to pay an earn-out of up to an aggregate amount of $5.6 million in cash over the three calendar years following the acquisition based upon the achievement of certain financial performance criteria, which will be recorded as goodwill when and if earned. For the earn-out periods ended September 30, 2009, 2010 and 2011, $1.9 million, $1.9 million and $1.8 million were earned, respectively. Kids Only is a leading designer and producer of licensed indoor and outdoor kids’ furniture, and has an extensive portfolio which also includes baby dolls and accessories, room décor and a myriad of other children’s toy products and was included in our results of operations from the date of acquisition.
On September 27, 2012, we entered into a secured credit facility with Wells Fargo Bank, National Association (the “Loan Agreement”). The Loan Agreement provides for a $75 million working capital revolving credit facility. The amounts outstanding under the revolving credit facility are payable in full upon maturity of the credit facility on April 30, 2013. The credit facility is secured by a substantial amount of our assets. The amount outstanding on the credit facility at December 31, 2012 was $70.7 million; the total borrowing capacity was approximately $53.2 million based on applicable advance rates applied to our accounts receivable and inventory.
Our ability to borrow under the Loan Agreement is subject to our ongoing compliance with certain financial covenants, including that we (a) maintain and earn on a consolidated basis as of the last day of each fiscal quarter, for the rolling four quarter period ending on such date, consolidated Net Profit (as defined in the Loan Agreement) equal to or greater than $1 (one dollar); (b) maintain a ratio of consolidated total funded debt to consolidated EBITDA (the “consolidated leverage ratio”) of not greater than (i) 4.00:1.0 on September 30, 2012, (ii) 3.00:1.0 on December 31, 2012 and thereafter; and (c) maintain Liquidity (as defined in the Loan Agreement) of at least $100.0 million.
The Loan Agreement allows us to borrow under the credit facility at LIBOR or at a base rate, plus applicable margins based upon the funded debt to EBITDA leverage ratio for the most recent twelve month rolling quarter end. Applicable margins vary between a 150 to 200 basis point spread over LIBOR and between a negative 50 to zero basis point spread on base rate loans. As of December 31, 2012, the rate on the credit facility was 3.25%. In addition, the credit facility has an unused line fee, ranging from 12.5 to 25 basis points based upon the unused amount of the credit facility.
The Loan Agreement also contains customary events of default, including a cross default provision and a change of control provision. In the event of a default, all obligations under the Loan Agreement may be declared immediately due and payable. For certain events of default relating to insolvency and receivership, all outstanding obligations become due and payable.
37
As of December 31, 2012, we were not in compliance with two of the three financial covenants under the Loan Agreement, but were in compliance with all of the remaining covenants. At December 31, 2012, we had consolidated Net Profit of negative $22.8 million, a consolidated leverage ratio of 17.66 and Liquidity of $189.5 million. We were required to obtain waivers from our lender to avoid breaches of financial covenants for the period ending December 31, 2012. Based upon current internal financial forecasts for the first quarter of 2013, we may not comply with the consolidated Net Profit covenant required under the Loan Agreement for the period ending March 31, 2013.
Accordingly, as a result of the failure to meet any of these financial covenants or any other covenants under the Loan Agreement, the lender may declare an event of default, which would have a material adverse effect on our financial condition and results of operations. We would be required to obtain amendments and/or waivers or renegotiate the Loan Agreement with our lender; however, there is no assurance that the lender will grant any waiver or agree to an amendment or renegotiation of the Loan Agreement. Any such amendment or waiver will likely require payment of a fee, result in higher interest rates on outstanding loan amounts and/or impose other restrictions. If the lender does not agree to a waiver and/or amendment and determines that an event of default has occurred, the lender may accelerate all obligations under the Loan Agreement, demand immediate repayment of all obligations and/or terminate all commitments to extend further credit under the Loan Agreement. If access to our credit facility is limited or terminated, liquidity would be constrained, affecting our operations and growth prospects and requiring that we seek additional equity or debt financing. There is no assurance that such alternative financing will be available on acceptable terms or at all. Furthermore, any equity financing may result in dilution to existing stockholders and any debt financing may include restrictive covenants that could impede our ability to effectively operate and grow our business in the future.
In November 2009, we sold an aggregate of $100.0 million of 4.50% Convertible Senior Notes due 2014 (the “Notes”). The Notes are senior unsecured obligations of the Company, will pay interest semi-annually at a rate of 4.50% per annum and will mature on November 1, 2014. The initial conversion rate was 63.2091 shares of our common stock per $1,000 principal amount of notes (equivalent to an initial conversion price of approximately $15.82 per share of common stock), subject to adjustment in certain circumstances. As a result of the cash dividend of $0.10 per share declared by the Board of Directors and paid on October 3, 2011, January 3, 2012
, April 2, 2012, July 2, 2012, October 1, 2012 and January 2, 2013
the new conversion rate will be 67.9486 shares of JAKKS common stock per $1,000 principal amount of notes (or approximately $14.72 per share). Prior to August 1, 2014, holders of the Notes may convert their Notes only upon specified events. Upon conversion, the Notes may be settled, at our election, in cash, shares of our common stock, or a combination of cash and shares of our common stock. Holders of the Notes may require us to repurchase for cash all or some of their Notes upon the occurrence of a fundamental change (as defined in the Notes).
We believe that our cash flows from operations and cash and cash equivalents will be sufficient to meet our working capital and capital expenditure requirements and provide us with adequate liquidity to meet our anticipated operating needs for at least the next 12 months. We expect our capital expenditures to be approximately $ 14.0 million in 2013. Although operating activities are expected to provide cash, to the extent we grow significantly in the future, our operating and investing activities may use cash and, consequently, this growth may require us to obtain additional sources of financing. There can be no assurance that any necessary additional financing will be available to us on commercially reasonable terms, if at all. We intend to finance our long-term liquidity requirements out of net cash provided by operations and net cash and cash equivalents. As of December 31, 2012, we do not have any off-balance sheet arrangements.
We have cumulative undistributed earnings of non-U.S. subsidiaries that we consider to be permanently reinvested outside the U.S. Should those earnings be repatriated to the U.S., we would incur additional tax expense. Other than for short-term financing needs of our U.S. parent company, we do not intend to repatriate those earnings to the U.S. The amount of cash and short term investments held by our foreign subsidiaries was $182.6 million and $207.4 million for the years ended December 31, 2012 and 2011, respectively.
During the last three fiscal years ending December 31, 2012, we do not believe that inflation has had a material impact on our net sales and revenues and on income from continuing operations.
Exchange Rates
Sales from our United States and Hong Kong operations are denominated in U.S. dollars and our manufacturing costs are denominated in either U.S. or Hong Kong dollars. Operations and operating expenses of all of our operations are denominated in local currency, thereby creating exposure to changes in exchange rates. Changes in the Hong Kong dollar/U.S. dollar exchange rate may positively or negatively affect our operating results. The exchange rate of the Hong Kong dollar to the U.S. dollar has been fixed by the Hong Kong government since 1983 at HK$7.80 to US$1.00 and, accordingly, has not represented a currency exchange risk to the U.S. dollar. We cannot assure you that the exchange rate between the United States and Hong Kong currencies will continue to be fixed or that exchange rate fluctuations between the United States and Hong Kong currencies will not have a material adverse effect on our business, financial condition or results of operations.
Market risk represents the risk of loss that may impact our financial position, results of operations or cash flows due to adverse changes in financial and commodity market prices and rates. We are exposed to market risk in the areas of changes in United States and international borrowing rates and changes in foreign currency exchange rates. In addition, we are exposed to market risk in certain geographic areas that have experienced or remain vulnerable to an economic downturn, such as China. We purchase substantially all of our inventory from companies in China, and, therefore, we are subject to the risk that such suppliers will be unable to provide inventory at competitive prices. While we believe that, should such events occur we would be able to find alternative sources of inventory at competitive prices, we cannot assure you that we would be able to do so. These exposures are directly related to our normal operating and funding activities. To date, we have not used derivative instruments or engaged in hedging activities to minimize our market risk.
38
Interest Rate Risk
In November 2009, we issued convertible senior notes payable of $100.0 million with a fixed interest rate of 4.50% per annum which remain outstanding as of December 31, 2012. Accordingly, we are not generally subject to any direct risk of loss related to these notes arising from changes in interest rates.
Our exposure to market risk includes interest rate fluctuations in connection with our revolving credit facility, see Note 11 Credit Facility in the accompanying notes to the consolidated financial statements for additional information. Borrowings under the revolving credit facility bear interest at a variable rate based on Prime Lending Rate or LIBOR Rate at the option of the Company. For Prime Lending Rate loans, the interest rate is equal to the highest of (i) the daily weighted average federal funds rate on overnight transactions plus 1.5%, (ii) Wells Fargo’s prime rate and (iii) a one month LIBOR rate plus 1.5%, in each case there is an additional margin ranging from negative 0.50% to nil based on certain conditions. For LIBOR rate loans, the interest rate is equal to a LIBOR rate plus a margin ranging from 1.50% to 2.00% based on certain conditions. Borrowings under the revolving credit facility are therefore subject to risk based upon prevailing market interest rates. Interest rate risk may result from many factors, including governmental monetary and tax policies, domestic and international economic and political considerations and other factors that are beyond our control. At December 31, 2012, the maximum amount borrowed under the Credit Facility was $70.7 million and the average amount of borrowings outstanding was $64.3 million. If the prevailing market interest rates relative to these borrowing increased by 10%, our interest expense during the period ended December 31, 2012 would have increased by less than $0.1 million.
Foreign Currency Risk
We have wholly-owned subsidiaries in Hong Kong, China, the United Kingdom, France, Spain, France and Canada. Sales are generally made by these operations on FOB China or Hong Kong terms and are denominated in U.S. dollars. However, purchases of inventory and Hong Kong operating expenses are typically denominated in Hong Kong dollars and local operating expenses in China are denominated in local currency, thereby creating exposure to changes in exchange rates. Changes in the Chinese Yuan or Hong Kong dollar/U.S. dollar exchange rates may positively or negatively affect our gross margins, operating income and retained earnings. The exchange rate of the Hong Kong dollar to the U.S. dollar has been fixed by the Hong Kong government since 1983 at HK$7.80 to US$1.00 and, accordingly, has not represented a currency exchange risk to the U.S. dollar. Our mainland China operations are funded in Chinese Yuan. We do not believe that near-term changes in these exchange rates, if any, will result in a material effect on our future earnings, fair values or cash flows. Therefore, we have chosen not to enter into foreign currency hedging transactions. We cannot assure you that this approach will be successful, especially in the event of a significant and sudden change in the value of the Hong Kong dollar or Chinese Yuan.
39
Report of Independent Registered Public Accounting Firm
The Board of Directors and Stockholders
JAKKS Pacific, Inc.
Malibu, California
We have audited the accompanying consolidated balance sheets of JAKKS Pacific, Inc. as of December 31, 2012 and 2011 and the related consolidated statements of operations, comprehensive income (loss), stockholders’ equity, and cash flows for each of the three years in the period ended December 31, 2012. These financial statements are the responsibility of the Company’s management. Our responsibility is to express an opinion on these financial statements based on our audits.
We conducted our audits in accordance with the standards of the Public Company Accounting Oversight Board (United States). Those standards require that we plan and perform the audit to obtain reasonable assurance about whether the financial statements are free of material misstatement. An audit includes examining, on a test basis, evidence supporting the amounts and disclosures in the financial statements, assessing the accounting principles used and significant estimates made by management, as well as evaluating the overall financial statement presentation. We believe that our audits provide a reasonable basis for our opinion.
In our opinion, the consolidated financial statements referred to above present fairly, in all material respects, the financial position of JAKKS Pacific, Inc. at December 31, 2012 and 2011, and the results of its operations and its cash flows for each of the three years in the period ended December 31, 2012, in conformity with accounting principles generally accepted in the United States of America.
We also have audited, in accordance with the standards of the Public Company Accounting Oversight Board (United States), JAKKS Pacific, Inc.'s internal control over financial reporting as of December 31, 2012, based on criteria established in
Internal Control – Integrated Framework
issued by the Committee of Sponsoring Organizations of the Treadway Commission (COSO) and our report dated March 15, 2013 expressed an unqualified opinion thereon.
|
/s/ BDO USA, LLP
|
|
|
BDO USA, LLP
|
|
|
Los Angeles, California
|
|
|
March 15, 2013
|
|
40
JAKKS PACIFIC, INC. AND SUBSIDIARIES
CONSOLIDATED BALANCE SHEETS
|
December 31,
|
||||||||
|
2011
|
2012
|
|||||||
|
(In thousands, except
|
||||||||
|
share data)
|
||||||||
|
Assets
|
||||||||
|
Current assets
|
||||||||
|
Cash and cash equivalents
|
$ | 257,258 | $ | 189,321 | ||||
|
Marketable securities
|
214 | 218 | ||||||
|
Accounts receivable, net of allowance for uncollectible accounts of $3,069 and $2,536, at
December 31, 2011 and 2012 respectively
|
103,637 | 105,455 | ||||||
|
Inventory, net
|
47,019 | 59,690 | ||||||
|
Income tax receivable
|
24,166 | 24,008 | ||||||
|
Deferred income taxes
|
34,505 | 7,058 | ||||||
|
Prepaid expenses and other
|
30,686 | 20,306 | ||||||
|
Total current assets
|
497,485 | 406,056 | ||||||
|
Property and equipment
|
||||||||
|
Office furniture and equipment
|
13,606 | 14,268 | ||||||
|
Molds and tooling
|
61,005 | 73,487 | ||||||
|
Leasehold improvements
|
6,788 | 7,044 | ||||||
|
Total
|
81,399 | 94,799 | ||||||
|
Less accumulated depreciation and amortization
|
65,213 | 78,973 | ||||||
|
Property and equipment, net
|
16,186 | 15,826 | ||||||
|
Deferred income taxes
|
47,081 |
—
|
||||||
|
Intangibles
|
21,753 | 67,054 | ||||||
|
Other long term assets
|
3,670 | 4,584 | ||||||
|
Investment in DreamPlay
|
—
|
7,000 | ||||||
|
Investment in joint venture
|
2,736 | 3,161 | ||||||
|
Goodwill, net
|
24,015 | 48,836 | ||||||
|
Trademarks, net
|
2,308 | 2,308 | ||||||
|
Total assets
|
$ | 615,234 | $ | 554,825 | ||||
|
Liabilities and Stockholders’ Equity
|
||||||||
|
Current liabilities
|
||||||||
|
Accounts payable
|
$ | 26,430 | $ | 37,793 | ||||
|
Accrued expenses
|
50,780 | 63,677 | ||||||
|
Reserve for sales returns and allowances
|
43,440 | 34,373 | ||||||
|
Income taxes payable
|
2,183 | 12,922 | ||||||
|
Short term debt
|
—
|
70,710 | ||||||
|
Total current liabilities
|
122,833 | 219,475 | ||||||
|
Convertible senior notes, net
|
92,188 | 94,918 | ||||||
|
Other liabilities
|
1,630 | 18,345 | ||||||
|
Income taxes payable
|
4,992 | 4,687 | ||||||
|
Deferred income taxes
|
—
|
10,180 | ||||||
|
Total liabilities
|
221,643 | 347,605 | ||||||
|
Commitments and Contingencies
|
||||||||
|
Stockholders’ equity
|
||||||||
|
Preferred shares, $.001 par value; 5,000,000 shares authorized; nil outstanding
|
— | — | ||||||
|
Common stock, $.001 par value; 100,000,000 shares authorized; 25,943,214 and 21,969,355
shares issued in 2011 and 2012 respectively; 25,943,214 and 21,969,355 shares outstanding,
respectively
|
26 | 22 | ||||||
|
Additional paid-in capital
|
274,532 | 202,577 | ||||||
|
Retained earnings
|
123,174 | 8,836 | ||||||
|
Accumulated other comprehensive loss
|
(4,141 | ) | (4,215 | ) | ||||
|
Total stockholders’ equity
|
393,591 | 207,220 | ||||||
|
Total liabilities and stockholders’ equity
|
$ | 615,234 | $ | 554,825 | ||||
See accompanying notes to consolidated financial statements.
41
JAKKS PACIFIC, INC. AND SUBSIDIARIES
CONSOLIDATED STATEMENTS OF OPERATIONS
|
Years Ended December 31,
|
||||||||||||
|
2010
|
2011
|
2012
|
||||||||||
|
(In thousands, except per share amounts)
|
||||||||||||
|
Net sales
|
$ | 747,268 | $ | 677,751 | $ | 666,762 | ||||||
|
Cost of sales
|
502,318 | 483,761 | 468,825 | |||||||||
|
Gross profit
|
244,950 | 193,990 | 197,937 | |||||||||
|
Selling, general and administrative expenses
|
194,753 | 192,710 | 211,159 | |||||||||
|
Income (loss) from operations
|
50,197 | 1,280 | (13,222 | ) | ||||||||
|
Profit from video game joint venture
|
6,000 | 6,000 | 3,000 | |||||||||
|
Equity in net income/(loss) of joint venture
|
(56 | ) | (34 | ) | 130 | |||||||
|
Interest income
|
333 | 412 | 671 | |||||||||
|
Interest expense
|
(6,732 | ) | (8,196 | ) | (9,228 | ) | ||||||
|
Income (loss) before provision (benefit) for income taxes
|
49,742 | (538 | ) | (18,649 | ) | |||||||
|
Provision (benefit) for income taxes
|
2,693 | (9,010 | ) | 86,151 | ||||||||
|
Net income (loss)
|
$ | 47,049 | $ | 8,472 | $ | (104,800 | ) | |||||
|
Basic earnings (loss) per share
|
$ | 1.71 | $ | 0.32 | $ | (4.37 | ) | |||||
|
Basic weighted number of shares
|
27,491 | 26,760 | 23,963 | |||||||||
|
Diluted earnings (loss) per share
|
$ | 1.52 | $ | 0.32 | $ | (4.37 | ) | |||||
|
Diluted weighted number of shares
|
34,513 | 26,893 | 23,963 | |||||||||
See accompanying notes to consolidated financial statements.
42
JAKKS PACIFIC, INC. AND SUBSIDIARIES
CONSOLIDATED STATEMENTS OF COMPREHENSIVE INCOME (LOSS)
|
Years Ended December 31,
|
|||||||||||
|
2010
|
2011
|
2012
|
|||||||||
|
(In thousands)
|
|||||||||||
|
|
|||||||||||
|
Net income (loss)
|
$ | 47,049 | $ | 8,472 | $ | (104,800 | ) | ||||
|
Other comprehensive income (loss):
|
|||||||||||
|
Foreign currency translation adjustment
|
(60 | ) | 147 | (74 | ) | ||||||
|
Comprehensive income (loss)
|
$ | 46,989 | $ | 8,619 | $ | (104,874 | ) | ||||
See accompanying notes to consolidated financial statements.
43
JAKKS PACIFIC, INC. AND SUBSIDIARIES
CONSOLIDATED STATEMENTS OF STOCKHOLDERS’ EQUITY
YEARS ENDED DECEMBER 31, 20010, 2011 AND 2012
(In thousands)
|
Common Stock
|
Accumulated
|
|||||||||||||||||||||||||||
|
Additional
|
Other
|
Total
|
||||||||||||||||||||||||||
|
Number
|
Treasury
|
Paid-in
|
Retained
|
Comprehensive
|
Stockholders’
|
|||||||||||||||||||||||
|
of Shares
|
Amount
|
Stock
|
Capital
|
Earnings
|
Loss
|
Equity
|
||||||||||||||||||||||
|
Balance, December 31, 2009
|
27,639 | $ | 28 | $ | — | $ | 303,474 | $ | 72,835 | $ | (4,228 | ) | $ | 372,109 | ||||||||||||||
|
Excess tax deficiency on stock options
|
— | — | — | (713 | ) | — | — | (713 | ) | |||||||||||||||||||
|
Restricted stock grants
|
298 | — | — | 4,619 | — | — | 4,619 | |||||||||||||||||||||
|
Reversal of stock option compensation
|
— | — | — | (224 | ) | — | — | (224 | ) | |||||||||||||||||||
|
Retirement of common stock
|
(292 | ) | — | — | (4,554 | ) | — | — | (4,554 | ) | ||||||||||||||||||
|
Repurchase of common stock
|
— | — | (5,641 | ) | — | — | — | (5,641 | ) | |||||||||||||||||||
|
Retirement of restricted stock
|
(34 | ) | — | — | (177 | ) | — | — | (177 | ) | ||||||||||||||||||
|
Net income
|
— | — | — | — | 47,049 | — | 47,049 | |||||||||||||||||||||
|
Foreign currency translation adjustment
|
— | — | — | — | — | (60 | ) | (60 | ) | |||||||||||||||||||
|
Balance, December 31, 2010
|
27,611 | 28 | (5,641 | ) | 302,425 | 119,884 | (4,288 | ) | 412,408 | |||||||||||||||||||
|
Exercise
of options
|
18 | ― | ― | 276 | ― | ― | 276 | |||||||||||||||||||||
|
Exercise
of warrants
|
100 | ― | ― | 1,135 | ― | ― | 1,135 | |||||||||||||||||||||
|
Excess tax benefit on stock options
|
― | ― | ― | 363 | ― | ― | 363 | |||||||||||||||||||||
|
Restricted stock grants
|
141 | ― | ― | 1,594 | ― | ― | 1,594 | |||||||||||||||||||||
|
Dividends declared
|
― | ― | ― | ― | (5,182 | ) | ― | (5,182 | ) | |||||||||||||||||||
|
Retirement of common stock
|
(1,772 | ) | (2 | ) | 5,641 | (29,998 | ) | ― | ― | (24,359 | ) | |||||||||||||||||
|
Retirement of restricted stock
|
(155 | ) | ― | ― | (1,263 | ) | ― | ― | (1,263 | ) | ||||||||||||||||||
|
Net income
|
― | ― | ― | ― | 8,472 | ― | 8,472 | |||||||||||||||||||||
|
Foreign currency translation adjustment
|
― | ― | ― | ― | ― | 147 | 147 | |||||||||||||||||||||
|
Balance, December 31, 2011
|
25,943 | 26 | ― | 274,532 | 123,174 | (4,141 | ) | 393,591 | ||||||||||||||||||||
|
Exercise
of options
|
8 | ― | ― | 101 | ― | ― | 101 | |||||||||||||||||||||
|
Excess tax deficiency on stock options
|
― | ― | ― | (114 | ) | ― | ― | (114 | ) | |||||||||||||||||||
|
Restricted stock grants
|
32 | ― | ― | 1,122 | ― | ― | 1,122 | |||||||||||||||||||||
|
Dividends declared
|
― | ― | ― | ― | (9,538 | ) | ― | (9,538 | ) | |||||||||||||||||||
|
Issued warrants
|
― | ― | ― | 7,035 | ― | ― | 7,035 | |||||||||||||||||||||
|
Retirement of restricted stock
|
(14 | ) | ― | ― | (103 | ) | ― | ― | (103 | ) | ||||||||||||||||||
|
Repurchase of common stock
|
(4,000 | ) | (4 | ) | ― | (79,996 | ) | ― | ― | (80,000 | ) | |||||||||||||||||
|
Net income
|
― | ― | ― | ― | (104,800 | ) | ― | (104,800 | ) | |||||||||||||||||||
|
Foreign currency translation adjustment
|
― | ― | ― | ― | ― | (74 | ) | (74 | ) | |||||||||||||||||||
| Balance, December 31, 2012 | 21,969 | $ | 22 | $ | ― | $ | 202,577 | $ | 8,836 | $ | (4,215 | ) | $ | 207,220 | ||||||||||||||
See accompanying notes to consolidated financial statements.
44
JAKKS PACIFIC, INC. AND SUBSIDIARIES
CONSOLIDATED STATEMENTS OF CASH FLOWS
|
Years Ended December 31,
|
||||||||||||
|
2010
|
2011
|
2012
|
||||||||||
|
(In thousands)
|
||||||||||||
|
Cash flows from operating activities
|
||||||||||||
|
Net income (loss)
|
$ | 47,049 | $ | 8,472 | $ | (104,800 | ) | |||||
|
Adjustments to reconcile net income (loss) to net cash provided by
operating activities
|
||||||||||||
|
Depreciation and amortization
|
28,657 | 25,931 | 24,628 | |||||||||
|
Share-based compensation expense
|
4,395 | 1,594 | 1,122 | |||||||||
|
Loss on disposal of property and equipment
|
74 | 470 | 54 | |||||||||
|
Write-down of debt issuance costs
|
495 | — | — | |||||||||
|
Investments in joint ventures
|
6,653 | 34 | 169 | |||||||||
|
Deferred income taxes
|
(10,168 | ) | (628 | ) | 82,394 | |||||||
|
Changes in operating assets and liabilities, net of acquisitions
|
||||||||||||
|
Accounts receivable
|
7,454 | 27,816 | 1,249 | |||||||||
|
Inventory
|
(8,773 | ) | (3,020 | ) | (10,666 | ) | ||||||
|
Prepaid expenses and other
|
2,534 | 2,936 | 11,793 | |||||||||
|
Income tax receivable
|
15,962 | (5,114 | ) | 158 | ||||||||
|
Accounts payable
|
(5,268 | ) | (16,700 | ) | 12,173 | |||||||
|
Accrued expenses
|
(9,575 | ) | (8,330 | ) | 4,994 | |||||||
|
Income taxes payable
|
(5,640 | ) | (4,269 | ) | 10,193 | |||||||
|
Reserve for sales returns and allowances
|
(5,519 | ) | 15,062 | (9,067 | ) | |||||||
|
Other liabilities
|
(865 | ) | 5 | (97 | ) | |||||||
| Excess tax deficiency from exercise of stock options | — | — | (114 | ) | ||||||||
|
Total adjustments
|
20,416 | 35,787 | 128,983 | |||||||||
|
Net cash provided by operating activities
|
67,465 | 44,259 | 24,183 | |||||||||
|
Cash flows from investing activities
|
||||||||||||
|
Purchases of property and equipment
|
(11,605 | ) | (12,455 | ) | (13,066 | ) | ||||||
|
Change in other assets
|
193 | 271 | (459 | ) | ||||||||
|
Proceeds from sale of property and equipment
|
99 | 26 | — | |||||||||
|
Investment in DreamPlay LLC
|
— | — | (7,000 | ) | ||||||||
|
Contributions to joint venture
|
— | (2,696 | ) | (1,524 | ) | |||||||
|
Distributions from joint venture
|
930 | |||||||||||
|
Cash paid for intangible assets
|
— | — | (8,000 | ) | ||||||||
|
Cash paid for net assets of businesses acquired
|
(1,875 | ) | (21,429 | ) | (43,620 | ) | ||||||
|
Net purchases of marketable securities
|
(5 | ) | (7 | ) | (5 | ) | ||||||
|
Net cash used in investing activities
|
(13,193 | ) | (36,290 | ) | (72,744 | ) | ||||||
|
Cash flows from financing activities
|
||||||||||||
|
Proceeds from stock options exercised
|
— | 276 | 101 | |||||||||
|
Proceeds from warrants exercised
|
— | 1,135 | — | |||||||||
|
Common stock surrendered
|
(177 | ) | (1,263 | ) | (103 | ) | ||||||
|
Common stock repurchased
|
(10,195 | ) | (24,359 | ) | (80,000 | ) | ||||||
|
Proceeds from credit facility borrowings
|
— | — | 70,710 | |||||||||
|
Credit facility costs
|
— | — | (546 | ) | ||||||||
|
Dividends paid
|
— | (5,182 | ) | (9,538 | ) | |||||||
|
Repayment of capital lease obligations
|
(129 | ) | (27 | ) | — | |||||||
|
Retirement of convertible notes
|
(20,262 | ) | — | — | ||||||||
|
Tax benefit from stock options exercised
|
― | 363 | — | |||||||||
|
Net cash used in financing activities
|
(30,763 | ) | (29,057 | ) | (19,376 | ) | ||||||
|
Net (decrease) increase in cash and cash equivalents
|
23,509 | (21,088 | ) | (67,937 | ) | |||||||
|
Cash and cash equivalents, beginning of year
|
254,837 | 278,346 | 257,258 | |||||||||
|
Cash and cash equivalents, end of year
|
$ | 278,346 | $ | 257,258 | $ | 189,321 | ||||||
|
Cash paid (refunded) during the period for:
|
||||||||||||
|
Interest
|
$ | 4,880 | $ | 4,534 | $ | 5,051 | ||||||
|
Income taxes
|
$ | 22,539 | $ | (7,249 | ) | $ | (9,020 | ) | ||||
See Notes 4, 5 and 19 for additional supplemental information to consolidated statements of cash flows.
See accompanying notes to consolidated financial statements.
45
JAKKS PACIFIC, INC. AND SUBSIDIARIES
NOTES TO CONSOLIDATED FINANCIAL STATEMENTS
DECEMBER 31, 2012
JAKKS Pacific, Inc. (the “Company”) is engaged in the development, production and marketing of consumer products, including toys and related products, electronic products, pet toys and related products, and other consumer products, many of which are based on highly-recognized character and entertainment licenses. The Company commenced its primary business operations in July 1995 through the purchase of substantially all of the assets of a Hong Kong toy company. The Company markets its product lines domestically and internationally.
The Company was incorporated under the laws of the State of Delaware in January 1995.
Principles of consolidation
The consolidated financial statements include accounts of the Company and its wholly-owned subsidiaries. In consolidation, all significant inter-company balances and transactions are eliminated.
Cash and cash equivalents
The Company considers all highly liquid investments with an original maturity of three months or less, when acquired, to be cash equivalents. The Company maintains its cash in bank deposits which, at times, may exceed federally insured limits. The Company has not experienced any losses in such accounts. The Company believes it is not exposed to any significant credit risk of cash and cash equivalents.
Cash and cash equivalents are maintained at financial institutions and, at times, balances may exceed federally insured limits. The Company has never experienced any losses related to these balances. All of the Company’s non-interest bearing cash balances were fully insured at December 31, 2012 due to a temporary federal program in effect from December 31, 2010 through December 31, 2012. Under the program, there is no limit to the amount of insurance for eligible accounts. Beginning 2013, insurance coverage will revert to $250,000 per depositor at each financial institution, and our non-interest bearing cash balances may again exceed federally insured limits.
Accounts Receivable and Allowance for Doubtful Accounts
Credit is granted to customers on an unsecured basis. Credit limits and payment terms are established based on extensive evaluations
made on an ongoing basis throughout the fiscal year of the financial performance, cash generation, financing availability, and liquidity status of each customer. Customers are reviewed at least annually, with more frequent reviews performed as necessary, depending upon the customer’s financial condition and the level of credit being extended. For customers who are experiencing financial difficulties, management performs additional financial analyses before shipping to those customers on credit. The Company uses a variety of financial arrangements to ensure collectability of accounts receivable of customers deemed to be a credit risk, including requiring letters of credit, purchasing various
forms of credit insurance with unrelated third parties, or requiring cash in advance of shipment.
The Company records an allowance for doubtful accounts based upon management’s assessment of the business environment, customers’ financial condition, historical collection experience, accounts receivable aging, customer disputes, and the collectability of specific customer accounts.
Use of estimates
The preparation of consolidated financial statements in conformity with accounting principles generally accepted in the United States of America requires management to make estimates and assumptions that affect the reported amounts of assets and liabilities, disclosure of contingent assets and liabilities at the dates of the financial statements, and the reported amounts of revenue and expenses during the reporting periods. Actual future results could differ from those estimates.
46
Revenue recognition
Revenue is recognized upon the shipment of goods to customers or their agents, depending upon terms, provided there are no uncertainties regarding customer acceptance, the sales price is fixed or determinable and collectability is reasonably assured.
Generally the Company does not allow product returns. It provides its customers a negotiated allowance for breakage or defects, which is recorded when the related revenue is recognized. However, the Company does make occasional exceptions to this policy and consequently accrues a return allowance based upon historic return amounts and management estimates. The Company occasionally grants credits to facilitate markdowns and sales of slow moving merchandise. These credits are recorded as a reduction of gross sales at the time of occurrence.
The Company’s reserve for sales returns and allowances decreased by $9.0 million from $43.4 million as of December 31, 2011 to $34.4 million as of December 31, 2012. This decrease was primarily due to certain customers taking their year-end allowances related to 2011 and 2012 during 2012.
47
Fair value measurements
Fair value is the price that would be received to sell an asset or paid to transfer a liability in an orderly transaction between market participants at the measurement date. In determining fair value, the Company uses various methods including market, income and cost approaches. Based upon these approaches, the Company often utilizes certain assumptions that market participants would use in pricing the asset or liability, including assumptions about risk and/or the risks inherent in the inputs to the valuation technique. These inputs can be readily observable, market-corroborated, or generally unobservable inputs. The Company utilizes valuation techniques that maximize the use of observable inputs and minimize the use of unobservable inputs. Based upon observable inputs used in the valuation techniques, the Company is required to provide information according to the fair value hierarchy. The fair value hierarchy ranks the quality and reliability of the information used to determine fair values into three broad levels as follows:
|
Level 1:
|
Valuations for assets and liabilities traded in active markets from readily available pricing sources for market transactions involving identical assets or liabilities.
|
|
|
Level 2:
|
Valuations for assets and liabilities traded in less active dealer or broker markets. Valuations are obtained from third-party pricing services for identical or similar assets or liabilities.
|
|
|
Level 3:
|
Valuations incorporate certain assumptions and projections in determining the fair value assigned to such assets or liabilities.
|
In instances where the determination of the fair value measurement is based upon inputs from different levels of the fair value hierarchy, the level in the fair value hierarchy within which the entire fair value measurement falls is based upon the lowest level input that is significant to the fair value measurement in its entirety. The Company’s assessment of the significance of a particular input to the fair value measurement in its entirety requires judgment, and considers factors specific to the asset or liability.
The following table summarizes the Company’s financial assets measured at fair value on a recurring basis as of December 31 (in thousands):
|
Fair Value Measurements
|
||||||||||||||||
|
Carrying Amount as of
|
|
|
As of December 31, 2011
|
|||||||||||||
|
December 31, 2011
|
Level 1
|
Level 2
|
Level 3
|
|||||||||||||
|
Cash equivalents
|
$
|
85,343
|
$
|
85,343
|
$
|
—
|
$
|
—
|
||||||||
|
Marketable securities
|
214
|
214
|
—
|
—
|
||||||||||||
|
$
|
85,557
|
$
|
85,557
|
$
|
—
|
$
|
—
|
|||||||||
|
Fair Value Measurements
|
||||||||||||||||
|
Carrying Amount as of
|
|
|
As of December 31, 2012
|
|||||||||||||
|
December 31, 2012
|
Level 1
|
Level 2
|
Level 3
|
|||||||||||||
|
Cash equivalents
|
$
|
102,173
|
$
|
102,173
|
$
|
—
|
$
|
—
|
||||||||
|
Marketable securities
|
218
|
218
|
—
|
—
|
||||||||||||
|
$
|
102,391
|
$
|
102,391
|
$
|
—
|
$
|
—
|
|||||||||
The Company’s accounts receivable, short term debt, accounts payable and accrued expenses represent financial instruments. The carrying value of these financial instruments is a reasonable approximation of fair value.
The fair value of the $100.0 million of convertible senior notes payable for the years ended December 31, 2011, and 2012 was approximately $113.9 and $107.9 million, respectively, based upon the most recent quoted market price. The fair value of the $100.0 million convertible senior notes is considered to be a Level 1 measurement on the fair value hierarchy.
For the years ended December 31, 2011 and 2012, there was no impairment to the value of the Company’s non-financial assets.
48
Inventory
Inventory, which includes the ex-factory cost of goods, capitalized warehouse costs and in-bound freight and duty, is valued at the lower of cost (first-in, first-out) or market, net of inventory obsolescence reserve, and consists of the following (in thousands):
|
December 31,
|
||||||||
|
2011
|
2012
|
|||||||
|
Raw materials
|
$ | 2,428 | $ | 3,296 | ||||
|
Finished goods
|
44,591 | 56,394 | ||||||
| $ | 47,019 | $ | 59,690 | |||||
Property and equipment
Property and equipment are stated at cost and are being depreciated using the straight-line method over their estimated useful lives as follows:
|
Office equipment
|
5 years
|
|
Automobiles
|
5 years
|
|
Furniture and fixtures
|
5 - 7 years
|
|
Leasehold improvements
|
Shorter of length of lease or 10 years
|
The Company uses the usage method as its depreciation methodology for molds and tools used in the manufacturing of its products, which is more closely correlated to production of goods. The Company believes that the usage method more accurately matches costs with revenues. Furthermore, the useful estimated life of molds and tools is two years.
For the years ended December 31, 2010, 2011, and 2012, the Company’s aggregate depreciation expense related to property and equipment was $15.7 million, $13.9 million and $
13.6
million, respectively.
49
Advertising
Production costs of commercials and programming are charged to operations in the period during which the production is first aired. The costs of other advertising, promotion and marketing programs are charged to operations in the period incurred. Advertising expense for the years ended December 31, 2010, 2011 and 2012, was approximately $15.4 million, $15.5 million and $18.8 million, respectively.
The Company also participates in cooperative advertising arrangements with some customers, whereby it allows a discount from invoiced product amounts in exchange for customer purchased advertising that features the Company’s products. Typically, these discounts range from 1% to 6% of gross sales, and are generally based upon product purchases or specific advertising campaigns. Such amounts are accrued when the related revenue is recognized or when the advertising campaign is initiated. These cooperative advertising arrangements are accounted for as direct selling expenses.
Income taxes
The Company does not file a consolidated return with its foreign subsidiaries. The Company files federal and state returns and its foreign subsidiaries file returns in their respective jurisdictions. Deferred taxes are provided on an asset and liability method whereby deferred tax assets are recognized as deductible temporary differences and operating loss and tax credit carry-forwards and deferred tax liabilities are recognized for taxable temporary differences. Temporary differences are the differences between the reported amounts of assets and liabilities and their tax basis. Deferred tax assets are reduced by a valuation allowance when, in the opinion of management, it is more likely than not that some portion or all of the deferred tax assets will not be realized. Deferred tax assets and liabilities are adjusted for the effects of changes in tax laws and rates on the date of enactment.
Foreign Currency Translation Exposure
The Company’s reporting currency is the US dollar. The translation of its net investment in subsidiaries with non-US dollar functional currencies subjects the Company to currency exchange rate fluctuations in its results of operations and financial position. Assets and liabilities of subsidiaries with non-US dollar functional currencies are translated into US dollars at year-end exchange rates. Income, expense, and cash flow items are translated at average exchange rates prevailing during the year. The resulting currency translation adjustments are recorded as a component of accumulated other comprehensive loss/gain within stockholders’ equity. The Company’s primary currency translation exposures in 2010, 2011 and 2012 were related to its net investment in entities having functional currencies denominated in the Hong Kong dollar.
Foreign Currency Transaction Exposure
Currency exchange rate fluctuations may impact the Company’s results of operations and cash flows. The Company’s currency transaction exposures include gains and losses realized on unhedged inventory purchases and unhedged receivables and payables balances that are denominated in a currency other than the applicable functional currency. Gains and losses on unhedged inventory purchases and other transactions associated with operating activities are recorded in the components of operating income in the consolidated statement of operations. Inventory purchase transactions denominated in the Hong Kong dollar were the primary transactions that cause foreign currency transaction exposure for the Company in 2010, 2011 and 2012.
Accounting for the impairment of finite-lived intangible assets
Long-lived assets with finite lives, which include property and equipment and intangible assets other than goodwill, are evaluated at least annually for impairment when events or changes in circumstances indicate that the carrying amount of the assets may not be recoverable through the estimated undiscounted future cash flows from the use of these assets. When any such impairment exists, the related assets will be written down to fair value. Finite-lived intangible assets consist primarily of product technology rights, acquired backlog, customer relationships, product lines and license agreements. These intangible assets are amortized over the estimated economic lives of the related assets. There were no impairments for years ended December 31, 2011 and 2012.
Goodwill and other indefinite-lived intangible assets
Goodwill and indefinite-lived intangible assets are not amortized, but are tested for impairment at least annually at the reporting unit level. Losses in value are recorded when material impairment has occurred in the underlying assets or when the benefits of the identified intangible assets are realized. Indefinite-lived intangible assets other than goodwill consist of trademarks.
50
The carrying value of goodwill and trademarks are based upon cost, which is subject to management’s current assessment of fair value. Management evaluates fair value recoverability using both objective and subjective factors. Objective factors include management’s best estimates of projected future earnings and cash flows and analysis of recent sales and earnings trends. Subjective factors include competitive analysis and the Company’s strategic focus.
For the years ended December 31, 2011 and 2012, there was no impairment to the value of the Company's goodwill or trademarks.
Share-based Compensation
The Company measures all employee stock-based compensation awards using a fair value method and records such expense in its consolidated financial statements. The Company recorded $0.2 million reversal of stock option compensation in 2010, nil in 2011 and nil in 2012. The company recorded $4.6 million, $1.6 million, and $1.1 million of restricted stock expense, in 2010, 2011, and 2012, respectively. See Note 17 for further details relating to share based compensation.
Earnings per share
The following table is a reconciliation of the weighted-average shares used in the computation of basic and diluted earnings per share (“EPS”) for the periods presented (in thousands, except per share data):
|
2010
|
||||||||||||
|
Weighted
|
||||||||||||
|
Average
|
||||||||||||
|
Income
|
Shares
|
Per Share
|
||||||||||
|
Basic EPS
|
||||||||||||
|
Income available to common stockholders
|
$
|
47,049
|
27,491
|
$ |
1.71
|
|||||||
|
Effect of dilutive securities:
|
||||||||||||
|
Assumed conversion of convertible senior notes
|
5,434
|
6,785
|
||||||||||
|
Options and warrants
|
―
|
44
|
||||||||||
|
Unvested restricted stock grants
|
―
|
193
|
||||||||||
|
Diluted EPS
|
||||||||||||
|
Income available to common stockholders plus assumed exercises and conversion
|
$
|
52,483
|
34,513
|
$ |
1.52
|
|||||||
51
|
2011
|
||||||||||||
|
Weighted
|
||||||||||||
|
Average
|
||||||||||||
|
Income
|
Shares
|
Per Share
|
||||||||||
|
Basic EPS
|
||||||||||||
|
Income available to common stockholders
|
$
|
8,472
|
26,760
|
$ |
0.32
|
|||||||
|
Effect of dilutive securities:
|
||||||||||||
|
Assumed conversion of convertible senior notes
|
―
|
―
|
||||||||||
|
Options and warrants
|
―
|
22
|
||||||||||
|
Unvested restricted stock grants
|
―
|
111 | ||||||||||
|
Diluted EPS
|
||||||||||||
|
Income available to common stockholders plus assumed exercises and conversion
|
$
|
8,472
|
26,893
|
$ |
0.32
|
|||||||
|
2012
|
||||||||||||
|
Weighted
|
||||||||||||
|
Average
|
||||||||||||
|
Loss
|
Shares
|
Per Share
|
||||||||||
|
Basic EPS
|
||||||||||||
|
Loss available to common stockholders
|
$
|
(104,800
|
) |
23,963
|
$ |
(4.37
|
) | |||||
|
Effect of dilutive securities:
|
||||||||||||
|
Options and warrants
|
―
|
―
|
||||||||||
| Assumed conversion of convertible senior notes |
―
|
― | ||||||||||
|
Unvested restricted stock grants
|
―
|
―
|
||||||||||
|
Diluted EPS
|
||||||||||||
|
Loss available to common stockholders plus assumed exercises and conversion
|
$
|
(104,800
|
) |
23,963
|
$ |
(4.37
|
) | |||||
Basic earnings per share is calculated using the weighted average number of common shares outstanding during the period. Diluted earnings per share is calculated using the weighted average number of common shares and common share equivalents outstanding during the period (which consist of warrants, options and convertible debt to the extent they are dilutive). For the years ended December 31, 2011 and 2012, the convertible notes interest and related common share equivalent of 6,334,621 and 6,577,727 were excluded from the diluted earnings per share calculation because they were anti-dilutive. Potentially dilutive stock options of 301,499, 171,119 and 134,644 for the years ended December 31, 2010, 2011 and 2012, respectively, were excluded from the computation of diluted earnings per share since they would have been anti-dilutive. Potentially dilutive restricted stock of nil, nil, and 93,933 for the years ended December 31, 2010, 2011 and 2012, respectively, were excluded from the computation of diluted earnings per share since they would have been anti-dilutive
.
Debt with Conversion and Other Options
The provisions of ASC 470-20, “
Debt with Conversion and Other Options
” are applicable to the 4.5% convertible notes, see Note 12, Convertible Senior Notes. ASC 470-20 requires the Company to separately account for the liability (debt) and equity (conversion feature) components of the Notes in a manner that reflects the Company’s nonconvertible debt borrowing rate at the date of issuance when interest cost is recognized in subsequent periods. The company allocated $13.7 million of the $100.0 million principal amount of the Notes to the equity component, which represents a discount to the debt and will be amortized into interest expense through November 1, 2014. Accordingly, the company’s effective annual interest rate on the Notes will be approximately 7.9%. The Notes are classified as long-term debt in the balance sheet at December 31, 2012 based upon their November 1, 2014 maturity date. Debt issuance costs of approximately $3.5 million are being amortized to interest expense over the five year term of the Notes.
52
The Company is a worldwide producer and marketer of children’s toys and other consumer products, principally engaged in the design, development, production, marketing and distribution of its diverse portfolio. In 2010, the Company re-aligned its products into two new categories to better reflect the business. The Company’s reportable segments are Traditional Toys and Electronics and Role Play, Novelty and Seasonal Toys, each of which includes worldwide sales.
The Traditional Toys and Electronics segment includes action figures, vehicles, playsets, plush products, dolls, accessories, electronic products, construction toys, infant and pre-school toys, foot to floor ride-on vehicles, wagons and pet products and related products.
The Role Play, Novelty and Seasonal segment includes role play and dress-up products, novelty toys, seasonal and outdoor products, indoor and outdoor kids’ furniture and Halloween and everyday costume play.
Segment performance is measured at the operating income level. All sales are made to external customers and general corporate expenses have been attributed to the various segments based upon sales volumes. Segment assets are comprised of accounts receivable and inventories, net of applicable reserves and allowances, goodwill, molds and tooling and other assets.
Results are not necessarily those that would be achieved were each segment an unaffiliated business enterprise. Information by segment and a reconciliation to reported amounts as of December 31, 2011 and 2012 and for the three years in the period ended December 31, 2012 are as follows (in thousands):
|
Years Ended December 31,
|
||||||||||||
|
2010
|
2011
|
2012
|
||||||||||
|
Net Sales
|
||||||||||||
|
Traditional Toys and Electronics
|
$
|
358,356
|
$
|
348,852
|
$
|
363,681
|
||||||
|
Role Play, Novelty and Seasonal Toys
|
388,912
|
328,899
|
303,081
|
|||||||||
|
$
|
747,268
|
$
|
677,751
|
$
|
666,762
|
|||||||
|
Years Ended December 31,
|
||||||||||||
|
2010
|
2011
|
2012
|
||||||||||
|
Operating Income (Loss)
|
||||||||||||
|
Traditional Toys and Electronics
|
$
|
18,078
|
$
|
(3,974
|
) |
$
|
(12,263
|
) | ||||
|
Role Play, Novelty and Seasonal Toys
|
32,119
|
5,254
|
(959
|
) | ||||||||
|
$
|
50,197
|
$
|
1,280
|
$
|
(13,222
|
) | ||||||
|
Years Ended December 31,
|
||||||||||||
|
2010
|
2011
|
2012
|
||||||||||
|
Depreciation and Amortization Expense
|
||||||||||||
|
Traditional Toys and Electronics
|
$
|
17,058
|
$
|
15,212
|
$
|
13,941
|
||||||
|
Role Play, Novelty and Seasonal Toys
|
8,134
|
7,253
|
7,588
|
|||||||||
|
$
|
25,192
|
$
|
22,465
|
$
|
21,529
|
|||||||
|
December 31,
|
||||||||
|
2011
|
2012
|
|||||||
|
Assets
|
||||||||
|
Traditional Toys and Electronics
|
$
|
269,411
|
$
|
309,940
|
||||
|
Role Play, Novelty and Seasonal Toys
|
345,823
|
244,885
|
||||||
|
$
|
615,234
|
$
|
554,825
|
|||||
53
Information regarding the Company’s operations in different geographical areas is presented below on the basis the Company uses to manage its business. Net revenues are categorized based upon location of the customer, while long-lived assets are categorized based upon the Company’s ownership. Tools, dyes and molds represent a substantial portion of the long-lived assets included in the United States with a net book value of $10.4 million in 2011 and $10.8 million in 2012 and substantially all of these assets are located in China. The following table’s present information about the Company by geographic area as of December 31, 2011 and 2012 and for the three years ended December 31, 2012 (in thousands):
|
December 31,
|
||||||||
|
|
2011
|
2012
|
||||||
|
Long-lived Assets
|
||||||||
| China | $ | 10,378 |
$
|
10,793 | ||||
|
United States
|
|
4,896
|
|
3,762
|
||||
|
Hong Kong
|
912
|
1,271
|
||||||
|
$
|
16,186
|
$
|
15,826
|
|||||
|
Years Ended December 31,
|
||||||||||||
|
2010
|
2011
|
2012
|
||||||||||
|
Net Sales by Geographic Area
|
||||||||||||
|
United States
|
$
|
633,900
|
$
|
569,233
|
$
|
534,714
|
||||||
|
Europe
|
46,965
|
43,225
|
60,870
|
|||||||||
|
Canada
|
32,927
|
29,538
|
28,077
|
|||||||||
|
Hong Kong
|
7,319
|
2,898
|
1,713
|
|||||||||
|
Other
|
26,157
|
32,857
|
41,388
|
|||||||||
|
$
|
747,268
|
$
|
677,751
|
$
|
666,762
|
|||||||
Major Customers
Net sales to major customers were as follows (in thousands, except for percentages):
|
2010
|
2011
|
2012
|
||||||||||||||||||||||
|
Percentage of
|
Percentage of
|
Percentage of
|
||||||||||||||||||||||
|
Amount
|
Net Sales
|
Amount
|
Net Sales
|
Amount
|
Net Sales
|
|||||||||||||||||||
|
Wal-Mart
|
$
|
171,515
|
23.0
|
%
|
$
|
166,928
|
24.6
|
%
|
$
|
120,610
|
18.1
|
%
|
||||||||||||
|
Target
|
115,416
|
15.5
|
131,781
|
19.4
|
107,873
|
16.2
|
||||||||||||||||||
|
Toys ‘R’ Us
|
111,180
|
14.9
|
85,087
|
12.6
|
83,688
|
12.5
|
||||||||||||||||||
|
$
|
398,111
|
53.4
|
%
|
$
|
383,796
|
56.6
|
%
|
$
|
312,171
|
46.8
|
%
|
|||||||||||||
No other customer accounted for more than 10% of the Company’s total net sales.
At December 31, 2011 and 2012, the Company’s three largest customers accounted for approximately 41.3% and 42.1%, respectively, of net accounts receivable. The concentration of the Company’s business with a relatively small number of customers may expose the Company to material adverse effects if one or more of its large customers were to experience financial difficulty. The Company performs ongoing credit evaluations of its top customers and maintains an allowance for potential credit losses.
The Company owned a fifty percent interest in a joint venture with THQ Inc. (“THQ”), which developed, published and distributed interactive entertainment software for the leading hardware game platforms in the home video game market. Pursuant to a Settlement Agreement and Mutual Release (the “Agreement”) dated December 22, 2009, the joint venture was terminated on December 31, 2009 and THQ is obligated to pay the Company fixed payments in the aggregate amount of $20.0 million, to be paid in installments of $6.0 million on each of June 30, 2010 (payment received in June 2010) and 2011 (payment received in June 2011) and $4.0 million on each of June 30, 2012 and 2013 which the Company will record as income on a cash basis when received, as the Company cannot reasonably assure its collectability. Pursuant to an amendment to the Agreement, the 2012 installment is to be paid $2.0 million on June 20, 2012 (payment received in June 2012) and $1.0 million plus accrued interest of 5% per annum on each of August 30, 2012 (payment received in August 2012) and October 30, 2012 (payment received in October 2012) and the 2013 installment was to be paid in ten equal monthly non-interest bearing installments of $0.4 million commencing on February 28, 2013. On December 19, 2012, THQ filed voluntary petitions under Chapter 11 of the U.S. Bankruptcy Court, and on January 24, 2013 the US Bankruptcy Court approved the sale of most of THQ’s assets to multiple buyers. Given that the final payment received from THQ (in October 2012) was within 90 days of their filing for bankruptcy, the Company has not recognized this payment as revenue and has reserved the amount received pending the final settlement of THQ’s assets in accordance with bankruptcy law.
54
The Company owns a fifty percent interest in a joint venture (“Pacific Animation Partners”) with the U.S. entertainment subsidiary of a leading Japanese advertising and animation production company. The joint venture was created to develop and produce a boys’ animated television show, which it licenses worldwide for television broadcast as well as consumer products. The Company is producing and marketing toys based upon the television program under a license from the joint venture. The joint venture has also licensed certain other merchandising rights to third parties. The Company is responsible for fifty percent of the operating expenses of the joint venture and thirty-one percent of the production costs of the television show. The joint venture completed and delivered 26 episodes of the show, which began airing in February 2012, and commenced production on an additional 52 episodes of the show. The Company is responsible for production costs in the aggregate amount of approximately $
4.1
million, of which $2.7 million and $1.4 million were paid in 2011 and 2012, respectively. The Company’s investment is being accounted for using the equity method. For the years ended December 31, 2011 and 2012, the Company recognized a loss from the joint venture of $ 34,260 and income of $130,476, respectively, including producer fees and royalty income from the joint venture in the amount of nil and $300,195.
As of December 31, 2011 and 2012, the balance of the investment in the Pacific Animation Partners joint venture includes the following components (in thousands):
|
December 31,
|
December 31,
|
|||||||
|
2011
|
2012
|
|||||||
|
Capital Contributions
|
$
|
2,826
|
$
|
3,420
|
||||
|
Equity in cumulative net (loss)
|
(90)
|
(259)
|
||||||
|
Investment in joint venture
|
$
|
2,736
|
$
|
3,161
|
||||
On September 12, 2012, the Company entered into a joint venture (“DreamPlay Toys”) with NantWorks LLC (“NantWorks”) in which it owns a fifty percent interest. Pursuant to the operating agreement of DreamPlay Toys, the Company paid to NantWorks cash in the amount of $8.0 million and issued NantWorks a warrant to purchase 1.5 million shares of the Company’s common stock at a value of $7.0 million in exchange for the exclusive right to arrange for the provision of the NantWorks recognition technology platform for toy products. The Company has classified these rights as an intangible asset and will amortize the asset over the anticipated revenue stream from the exploitation of these rights. The joint venture entered into a Toy Services Agreement with an initial term of three years expiring on October 1, 2015 and a renewal period at the option of the Company expiring October 1, 2018, subject to the achievement of certain financial targets, to develop and produce toys utilizing recognition technologies owned by NantWorks. Pursuant to the terms of the Toy Services Agreement, NantWorks is entitled to receive a preferred return based upon net sales of DreamPlay Toys product sales and third-party license fees. The Company retains the financial risk of the joint venture and is responsible for the day-to-day operations, including development, sales and distribution, for which it is entitled to receive any remaining profit or is responsible for any losses, and the results of operations of the joint venture will be consolidated with the Company’s results. Sales of DreamPlay Toys products is expected to commence in the third quarter of 2013.
In addition, the Company invested $7.0 million in cash in exchange for a five percent economic interest in a related entity, DreamPlay LLC, that will exploit the recognition technologies in non-toy consumer product categories. NantWorks has the right to repurchase the Company’s interest for $7.0 million. The Company has classified this investment as a long term asset on its balance sheet.
The Company acquired the following entities to further enhance its existing product lines and to continue diversification into other toy categories and seasonal businesses:
In October 2008, the Company acquired substantially all of the assets of Tollytots Limited. The total initial consideration of $26.8 million consisted of $12.0 million in cash and the assumption of liabilities in the amount of $14.8 million, and resulted in goodwill of $4.1 million, all of which has been determined to be impaired and was written off in the quarter ended June 30, 2009. In addition, the Company agreed to pay an earn-out of up to an aggregate amount of $5.0 million in cash over the three calendar years following the acquisition based upon the achievement of certain financial performance criteria, which will be recorded as goodwill when and if earned. In the first earn-out period ended December 31, 2009, no portion of the earn-out was earned, while $1.7 million was earned for each of the second and third earn-out periods ended December 31, 2010 and 2011. Tollytots is a leading designer and producer of licensed baby dolls and baby doll pretend play accessories based on well-known brands and was included in our results of operations from the date of acquisition.
55
In October 2008, the Company acquired all of the stock of Kids Only, Inc. and a related Hong Kong company, Kids Only Limited (collectively, “Kids Only”). The total initial consideration of $23.8 million consisted of $20.4 million in cash and the assumption of liabilities in the amount of $3.4 million, and resulted in goodwill of $13.2 million, all of which has been determined to be impaired and was written off in the quarter ended June 30, 2009. In addition, the Company agreed to pay an earn-out of up to an aggregate amount of $5.6 million in cash over the three calendar years following the acquisition based upon the achievement of certain financial performance criteria, which will be recorded as goodwill when and if earned. For the earn-out periods ended September 30, 2009, 2010 and 2011, $1.9 million, $1.9 million and $1.8 million were earned, respectively. Kids Only is a leading designer and producer of licensed indoor and outdoor kids’ furniture, and has an extensive portfolio which also includes baby dolls and accessories, room décor and a myriad of other children’s toy products and was included in our results of operations from the date of acquisition.
In October 2011, the Company acquired all of the stock of Moose Mountain Toymakers Limited, a Hong Kong company, and a related New Jersey company, Moose Mountain Marketing, Inc. (collectively, “Moose Mountain”). The total initial consideration of $31.5 million consisted of $16.0 million in cash and the assumption of liabilities in the amount of $15.5 million, and resulted in goodwill of $13.5 million. In addition, the Company agreed to pay an earn-out of up to an aggregate amount of $5.3 million in cash over the three calendar years following the acquisition based upon the achievement of certain financial performance criteria. The fair value of the expected earn-out of $4.6 million was included in goodwill and assumed liabilities as of December 31, 2011. All future changes to the earn-out liability will be charged to income. Moose Mountain is a leading designer and producer of foot to floor ride-ons, inflatable environments, wagons, pinball machines and tents and was included in our results of operations from the date of acquisition.
O
n July 26, 2012, the Company acquired all of the stock of Maui, Inc., an Ohio corporation, Kessler Services, Inc., a Nevada corporation, and A.S. Design Limited, a Hong Kong corporation (collectively, “Maui”). The initial cash consideration totaled $36.2 million. In addition, the Company agreed to pay an earn-out of up to an aggregate amount of $18.0 million in cash over the three calendar years following the acquisition based upon the achievement of certain financial performance criteria, which has been accrued and recorded as goodwill as of December 31, 2012. All future changes to the earn-out liability will be charged to income. Maui is a leading manufacturer and distributor of spring and summer activity toys and impulse toys and was included in the Company’s results of operations from the date of acquisition.
On September 14, 2012, the Company acquired all of the stock of JKID, LTD., a United Kingdom corporation for an initial cash consideration of $1.1 million and deferred cash payments of $5.5 million payable in five semi-annual payments of $1.1 million each. In addition, the Company agreed to pay an earn-out of up to an aggregate amount of $4.4 million in cash over the two year period of 2015 through 2016, based upon the achievement of certain financial performance criteria, which has been accrued and recorded as goodwill as of December 31, 2012. All future changes to the earn-out liability will be charged to income. The Company has not finalized its purchase price allocation for JKID as of December 31, 2012. JKID is the developer of augmented reality technology that enhances the play patterns of toys and consumer products.
The changes in the carrying amount of goodwill for the years ended December 31, 2011 and 2012 are as follows (in thousands):
|
Traditional
Toys
and
Electronics
|
Role Play,
Novelty and
Seasonal
Toys
|
Total
|
||||||||||
|
Balance, January 1, 2011:
|
||||||||||||
|
Goodwill
|
$
|
2,445
|
$ |
4,543
|
$ |
6,988
|
||||||
|
Additions to goodwill during the year
|
13,485
|
―
|
13,485
|
|||||||||
|
Adjustment to goodwill during the year
|
1,667
|
1,875
|
3,542
|
|||||||||
|
Balance December 31, 2011
:
|
$ |
17,597
|
$ |
6,418
|
$
|
24,015
|
||||||
|
Balance, January 1, 2012:
|
||||||||||||
|
Goodwill
|
$ |
17,597
|
$ |
6,418
|
$
|
24,015
|
||||||
|
Additions to goodwill during the year
|
10,896
|
13,193
|
24,089
|
|||||||||
|
Adjustment to goodwill during the year
|
732
|
— |
732
|
|||||||||
|
Balance December 31, 2012:
|
$
|
29,225
|
$ |
19,611
|
$ |
48,836
|
||||||
56
The Company assesses goodwill and indefinite-lived intangible assets for impairment on an annual basis by reviewing relevant qualitative and quantitative factors. More frequent evaluations may be required if the Company experiences changes in its business climate or as a result of other triggering events that take place. If carrying value exceeds fair value, a possible impairment exists and further evaluation is performed. The Company performed a qualitative assessment of its annual goodwill impairment during the fourth quarter of 2012 and concluded that more likely than not the fair value of the goodwill is not less than its carrying amount.
In November 2011, the Company made an earn-out payment in the amount of $1.9 million related to the Kids Only acquisition. In December 2011, the Company also recorded an earn-out related to the Tollytots acquisitions of $1.7 million. These amounts were recorded as Goodwill in 2011.
Please refer to Note 5 for goodwill for current year acquisitions.
57
Intangible assets other than goodwill consist primarily of licenses, product lines, customer relationships and trademarks. Amortized intangible assets are included in intangibles in the accompanying balance sheets. Trademarks are disclosed separately in the accompanying balance sheets. Debt offering costs from the issuance of the Company’s convertible senior notes are included in other long term assets in the accompanying balance sheets. Intangible assets and debt issuance costs are as follows (in thousands, except for weighted useful lives):
|
December 31, 2011
|
December 31, 2012
|
|||||||||||||||||||||||||||
|
Weighted
Useful
Lives
|
Gross
Carrying
Amount
|
Accumulated
Amortization
|
Net
Amount
|
Gross
Carrying
Amount
|
Accumulated
Amortization
|
Net
Amount
|
||||||||||||||||||||||
|
(Years)
|
||||||||||||||||||||||||||||
|
Amortized Intangible Assets:
|
||||||||||||||||||||||||||||
|
Licenses
|
4.96
|
$ |
91,488
|
$ |
(72,797
|
) | $ |
18,691
|
$ |
91,488
|
$ |
(77,844
|
) | $ |
13,644
|
|||||||||||||
|
Product lines
|
3.65
|
19,500
|
(18,787
|
) |
713
|
66,594
|
(19,561
|
) |
47,033
|
|||||||||||||||||||
|
Customer relationships
|
5.28
|
7,096
|
(4,800
|
) |
2,296
|
9,347
|
(5,903
|
) |
3,444
|
|||||||||||||||||||
|
Trade names
|
3,000
|
(250
|
) |
2,750
|
||||||||||||||||||||||||
|
Non-compete/ Employment contracts
|
3.84
|
3,133
|
(3,080
|
) |
53
|
3,333
|
(3,150
|
) |
183
|
|||||||||||||||||||
|
Total amortized intangible assets
|
121,217
|
(99,464
|
) |
21,753
|
173,762
|
(106,708
|
) |
67,054
|
||||||||||||||||||||
|
Deferred Costs:
|
||||||||||||||||||||||||||||
|
Debt issuance costs
|
5.00
|
3,678
|
(1,592
|
) |
2,086
|
4,224
|
(2,609
|
) |
1,615
|
|||||||||||||||||||
|
Unamortized Intangible Assets:
|
||||||||||||||||||||||||||||
|
Trademarks
|
2,308
|
―
|
2,308
|
2,308
|
―
|
2,308
|
||||||||||||||||||||||
|
$
|
127,203
|
$ |
(101,056
|
) | $ |
26,147
|
$
|
180,294
|
$ |
(109,317
|
) | $ |
70,977
|
|||||||||||||||
58
For the years ended December 31, 2010, 2011, and 2012, the Company’s aggregate amortization expense related to intangible assets and deferred costs was $10.2 million, $9.3 million and $8.3 million, respectively. The Company currently estimates continuing future amortization expense to be approximately (in thousands):
|
2013
|
$
|
9,382
|
||
|
2014
|
6,298
|
|||
|
2015
|
5,278
|
|||
|
2016
|
5,429
|
|||
|
2017
|
5,392
|
|||
|
Thereafter
|
36,890
|
|||
|
$
|
68,669
|
Financial instruments that subject the Company to concentration of credit risk are cash and cash equivalents and accounts receivable. Cash equivalents consist principally of short-term money market funds. These instruments are short-term in nature and bear minimal risk. To date, the Company has not experienced losses on these instruments.
The Company performs ongoing credit evaluations of its customers’ financial conditions, but does not require collateral to support domestic customer accounts receivable. Most goods shipped FOB Hong Kong or China are secured with irrevocable letters of credit.
At December 31, 2011 and 2012, the Company’s three largest customers accounted for approximately 41.3% and
42.1
%, respectively, of net accounts receivable. The concentration of the Company’s business with a relatively small number of customers may expose the Company to material adverse effects if one or more of its large customers were to experience financial difficulty. The Company performs ongoing credit evaluations of its top customers and maintains an allowance for potential credit losses.
Accrued expenses consist of the following (in thousands):
|
2011
|
2012
|
|||||||
|
Royalties
|
$
|
22,193
|
$
|
20,887
|
||||
|
Sales commissions
|
617
|
1,594
|
||||||
|
Bonuses
|
1,020
|
780
|
||||||
|
Professional fees
|
1,924
|
4,791
|
||||||
|
Acquisition earn-out
|
4,634
|
6,000
|
||||||
|
Salaries and employee benefits
|
2,497
|
3,891
|
||||||
|
Interest expense
|
750
|
1,055
|
||||||
|
Unearned revenue
|
760
|
1,057
|
||||||
|
Molds and tools
|
1,746
|
2,225
|
||||||
|
Reorganization costs
|
3,484
|
2,241
|
||||||
|
Media expense
|
2,106
|
5,602
|
||||||
|
Inventory liabilities
|
3,319
|
4,395
|
||||||
|
Other
|
5,730
|
9,159
|
||||||
|
$
|
50,780
|
$
|
63,677
|
|||||
In addition to royalties currently payable on the sale of licensed products during the quarter, the Company records a liability as Accrued Royalties for the estimated shortfall in achieving minimum royalty guarantees pursuant to certain license agreements (Note 16).
The Company incurred reorganization charges in the fourth quarter of 2009 to consolidate and stream-line its existing business functions. This was especially necessary given the decreased volume of consolidated sales in 2009 from 2008 and the added general and administrative expenses from the three acquisitions made at the end of 2008. Reorganization charges relate to the termination of lease obligations, one-time severance termination benefits, fixed asset write-offs and other contract terminations and are accounted for in accordance with “Exit and Disposal Cost Obligations” ASC 420-10.
59
These reorganization charges relate to the Company's Traditional Toys and Electronics segment. The components of the reorganization charges are as follows (in thousands):
|
Accrued Balance
|
Accrued Balance
|
|||||||||||||||
|
|
December 31, 2011
|
Accrual
|
Payments
|
December 31, 2012
|
||||||||||||
|
Lease abandonment costs
|
$
|
3,484
|
$
|
—
|
$
|
1,243
|
$
|
2,241
|
||||||||
|
Total reorganization charges
|
$
|
3,484
|
$
|
—
|
$
|
1,243
|
$
|
2,241
|
||||||||
A director of the Company is a partner in a law firm that acts as counsel to the Company. The Company incurred legal fees and expenses to the law firm in the amount of approximately $2.7 million in 2010, $3.4 million in 2011 and $2.9 million in 2012. As of December 31, 2011 and 2012, legal fees and reimbursable expenses of $0.8 million and $0.5 million, respectively, were payable to this law firm.
On September 27, 2012, the Company and its domestic subsidiaries entered into a secured credit facility with Wells Fargo Bank, National Association (the “Loan Agreement”). The Loan Agreement provides for a $75 million working capital revolving credit facility. The amounts outstanding under the revolving credit facility are payable in full upon maturity of the credit facility on April 30, 2013. The credit facility is secured by a substantial amount of the assets of the Company. The amount outstanding on the credit facility at December 31, 2012 was $70.7 million; the total borrowing capacity was approximately $75.0 million.
Aggregate maturities of the debt related to this credit facility are as follows (in thousands):
|
Year ending December 31:
|
2013
|
$ |
70,710
|
||
|
Total
|
$
|
70,710
|
The Company’s ability to borrow under the Loan Agreement is subject to its ongoing compliance with certain financial covenants, including that the Company and its subsidiaries (a) maintain and earn on a consolidated basis as of the last day of each fiscal quarter, for the rolling four quarter period ending on such date, consolidated Net Profit (as defined in the Loan Agreement) equal to or greater than $1 (one dollar); (b) maintain a ratio of consolidated total funded debt to consolidated EBITDA (the “consolidated leverage ratio”) of not greater than (i) 4.00:1.0 on September 30, 2012, (ii) 3.00:1.0 on December 31, 2012 and thereafter; and (c) maintain Liquidity (as defined in the Loan Agreement) of at least $100.0 million.
The Loan Agreement allows the Company to borrow under the credit facility at LIBOR or at a base rate, plus applicable margins based upon the funded debt to EBITDA leverage ratio for the most recent twelve month rolling quarter end. Applicable margins vary between a 150 to 200 basis point spread over LIBOR and between a negative 50 to zero basis point spread on base rate loans. As of December 31, 2012, the rate on the credit facility was 3.25%. In addition, the credit facility has an unused line fee, ranging from 12.5 to 25 basis points based upon the unused amount of the credit facility.
The Loan Agreement also contains customary events of default, including a cross default provision and a change of control provision. In the event of a default, all of the obligations of the Company and its subsidiaries under the Loan Agreement may be declared immediately due and payable. For certain events of default relating to insolvency and receivership, all outstanding obligations become due and payable.
As of December 31, 2012, the Company was not in compliance with two of the three financial covenants under the Loan Agreement, but was in compliance with all of the remaining covenants. At December 31, 2012, the Company had consolidated Net Profit of negative $22.8 million, a consolidated leverage ratio of 17.66 and Liquidity of $189.5 million. The Company was required to obtain waivers from its lender to avoid breaches of financial covenants for the period ending December 31, 2012. Based upon current internal financial forecasts for the first quarter of 2013, the Company may not comply with the consolidated Net Profit covenant required under the Loan Agreement for the period ending March 31, 2013.
Accordingly, as a result of the failure to meet any of these financial covenants or any other covenants under the Loan Agreement, the lender may declare an event of default, which would have a material adverse effect on the Company’s financial condition and results of operations. The Company would be required to obtain amendments and/or waivers or renegotiate the Loan Agreement with its lender; however, there is no assurance that the lender will grant any waiver or agree to an amendment or renegotiation of the Loan Agreement.
Any such amendment or waiver will likely require payment of a fee, result in higher interest rates on outstanding loan amounts and/or impose other restrictions. If the lender does not agree to a waiver and/or amendment and determines that an event of default has occurred, the lender may accelerate all obligations of the Company under the Loan Agreement, demand immediate repayment of all obligations and/or terminate all commitments to extend further credit under the Loan Agreement. If access to the credit facility is limited or terminated, liquidity would be constrained, affecting the Company’s operations and growth prospects and requiring that the Company seek additional equity or debt financing. There is no assurance that such alternative financing will be available on acceptable terms or at all. Furthermore, any equity financing may result in dilution to existing stockholders and any debt financing may include restrictive covenants that could impede the Company’s ability to effectively operate and grow its business in the future.
60
Convertible senior notes consist of the following (in thousands):
|
December 31,
|
||||||||
|
2011
|
2012
|
|||||||
|
4.50% Convertible senior notes (due 2014)
|
$
|
100,000
|
$
|
100,000
|
||||
|
$
|
100,000
|
$
|
100,000
|
|||||
In November 2009, the Company sold an aggregate of $100.0 million of 4.50% Convertible Senior Notes due 2014 (the “Notes”). The Notes are senior unsecured obligations of the Company, will pay interest semi-annually at a rate of 4.50% per annum and will mature on November 1, 2014. The initial conversion rate was 63.2091 shares of our common stock per $1,000 principal amount of notes (equivalent to an initial conversion price of approximately $15.82 per share of common stock), subject to adjustment
under
certain circumstances. As a result of the cash dividend of $0.10 per share declared by the Board of Directors paid on October 3, 2011, January 3, 2012
, April 2, 2012, July 2, 2012, October 1, 2012 and January 2, 2013
the new conversion rate will be 67.9486 shares of JAKKS common stock per $1,000 principal amount of notes (or approximately $14.72 per share). Prior to August 1, 2014, holders of the Notes may convert their Notes only upon
the occurrence of
specified events. Upon conversion, the Notes may be settled, at the Company’s election, in cash, shares of our common stock, or a combination of cash and shares of our common stock. Holders of the Notes may require that the Company repurchase for cash all or some of their Notes upon the occurrence of a fundamental change (as defined in the Notes).
The provisions of ASC 470-20, “
Debt with Conversion and Other Options
” are applicable to the 4.50% convertible notes. ASC 470-20 requires the Company to separately account for the liability (debt) and equity (conversion feature) components of the Notes in a manner that reflects the Company’s nonconvertible debt borrowing rate at the date of issuance when interest cost is recognized in subsequent periods. The Company allocated $13.7 million of the $100.0 million principal amount of the Notes to the equity component, which represents a discount to the debt and will be amortized as interest expense through November 1, 2014. Accordingly, the Company’s effective annual interest rate on the Notes will be approximately 7.9%. The Notes are classified as long-term debt in the balance sheet at December 31, 2012 based upon their November 1, 2014 maturity date. Debt issuance costs of approximately $3.7 million are also being amortized to interest expense over the five year term of the Notes.
Key components of the 4.50% convertible senior notes consist of the following (in thousands):
|
December 31,
|
||||||||
|
2011
|
2012
|
|||||||
|
Principal amount of notes
|
$
|
100,000
|
$
|
100,000
|
||||
|
Unamortized equity component
|
(7,812
|
)
|
(5,082
|
) | ||||
|
Net carrying amount of the convertible notes
|
$
|
92,188
|
$
|
94,918
|
||||
61
|
Years Ended December 31,
|
||||||||||||
|
2010
|
2011
|
2012
|
||||||||||
|
Contractual interest expense on the coupon
|
$
|
4,500
|
$ |
4,500
|
$ |
4,500
|
||||||
|
Amortization of equity component and debt issuance costs recognized as interest expense
|
3,466
|
|
3,466
|
|
3,468
|
|||||||
|
$
|
7,966
|
$
|
7,966
|
$
|
7,968
|
|||||||
The Company does not file a consolidated return with its foreign subsidiaries. The Company files federal and state returns and its foreign subsidiaries file returns in their respective jurisdictions.
The Company’s income tax expense, which includes federal, state and foreign income taxes, was $86.2 million, or an effective tax rate of (462%) for the year ended 2012. For the years ended 2010 and 2011, the provision for income taxes, which included Federal, state and foreign income taxes, was an expense of $2.7 million and a benefit of $9.0 million, reflecting effective tax provision rates of 5.41% and 1,671%, respectively.
Included in the 2012 tax expense of $86.2 million were discrete tax expenses of $92.5 million comprised of expense of $91.7 million relating to the establishment of a 100% valuation allowance against our U.S. deferred tax assets, $0.4 million benefit related to reduction of uncertain tax positions due to statute expiration, $0.5 million expense related to state tax apportionment changes and $0.7 million expense related to income tax audit settlement.
For the years ended 2010 and 2011, provision for income taxes includes federal, state and foreign income taxes at effective tax rates of 5.41% and 1,671%, respectively. The increase in the effective rate in 2011 was primarily due to a decrease in the Company’s consolidated and United States earnings compared to 2010 and the recognition of certain discrete income tax adjustments. These discrete adjustments include $0.3 million reduction of uncertain tax positions related to foreign depreciation due to statute expiration and $1.7 million benefit related to state tax apportionment changes and
an adjustment to record various outstanding state tax refunds
. Exclusive of these discrete items, the effective tax rate would be 26.2% in 2010 and 1,288% in 2011. The increase in the effective rate absent discrete items was due to the foreign rate differential between the United States and Hong Kong. The foreign rate differential is impacted by the proportion of Hong Kong earnings to overall earnings and is expected to vary depending upon the level of consolidated earnings.
For the years ended 2011 and 2012, provision for income taxes includes federal, state and foreign income taxes at effective tax rates of 1,671% and (462%), respectively. Exclusive of these discrete items, the effective tax provision rate would be 1,288% in 2011 and 34.2% in 2012.
The decrease in the effective rate absent discrete items was due to the foreign rate differential between the United States and Hong Kong. The rate exclusive of discrete items can be materially impacted by the ratio of Hong Kong earnings over consolidated earnings.
For year ended 2012, the Company had net deferred tax liabilities of approximately $3.1 million.
62
Provision (benefit) for income taxes reflected in the accompanying consolidated statements of operations are comprised of the following (in thousands):
|
2010
|
2011
|
2012
|
||||||||||
|
Federal
|
$
|
1,656
|
$
|
(12,674
|
) |
$
|
97
|
|||||
|
State and local
|
3,290
|
(661
|
) |
307
|
||||||||
|
Foreign
|
7,915
|
4,590
|
3,467
|
|||||||||
|
Total Current
|
12,861
|
(8,745
|
) |
3,871
|
||||||||
|
APIC
|
(713
|
)
|
363
|
(114
|
) | |||||||
|
Deferred
|
(9,455
|
)
|
(628
|
) |
82,394
|
|||||||
|
Total
|
$
|
2,693
|
$
|
(9,010
|
) |
$
|
86,151
|
|||||
The components of deferred tax assets/(liabilities) are as follows (in thousands):
|
2011
|
2012
|
|||||||
|
Net deferred tax assets/(liabilities):
|
||||||||
|
Current:
|
||||||||
|
Reserve for sales allowances and possible losses
|
$
|
2,184
|
$
|
1,124
|
||||
|
Accrued expenses
|
3,127
|
3,908
|
||||||
|
Federal and state net operating loss carryforwards
|
9,035
|
―
|
||||||
|
Prepaid Royalties
|
18,338
|
18,155
|
||||||
|
Accrued Royalties
|
2,081
|
2,328
|
||||||
|
Inventory
|
5,480
|
6,591
|
||||||
|
State income taxes
|
(6,767
|
) |
(7,429
|
) | ||||
|
Other
|
1,027
|
1,063
|
||||||
|
Gross current
|
34,505
|
25,740
|
||||||
|
Valuation allowance
|
―
|
(18,682
|
) | |||||
|
Net Current
|
34,505
|
7,058
|
||||||
|
Long Term:
|
||||||||
|
Federal and state net operating loss carry fowards
|
―
|
17,305
|
||||||
|
Property and equipment
|
3,777
|
5,380
|
||||||
|
Original issue discount interest
|
(20,273
|
) |
(19,095
|
) | ||||
|
Goodwill and intangibles
|
61,076
|
50,765
|
||||||
|
Share Based Compensation
|
2,588
|
2,467
|
||||||
|
Other
|
(87
|
) |
6,009
|
|||||
|
Gross long-term
|
47,081
|
62,831
|
||||||
|
Valuation allowance
|
―
|
(73,011
|
) | |||||
|
Net long-term
|
―
|
(10,180
|
) | |||||
|
Total net deferred tax assets/(liabilities)
|
$
|
81,586
|
$
|
(3,122
|
) | |||
63
Provision (benefit) for income taxes varies from the U.S. federal statutory rate. The following reconciliation shows the significant differences in the tax at statutory and effective rates:
|
2010
|
2011
|
2012
|
||||||||||
|
Federal income tax expense (benefit)
|
35.0
|
%
|
35.0
|
%
|
35.0
|
%
|
||||||
|
State income tax expense, net of federal tax effect
|
1.65
|
415.9
|
5.6
|
|||||||||
|
Effect of differences in U.S. and Foreign statutory rates
|
(14.55
|
)
|
1031.8
|
20.8
|
||||||||
|
Uncertain tax positions
|
(10.39
|
)
|
54.2
|
2.1
|
||||||||
|
Refund from IRS Exam
|
(8.03
|
)
|
―
|
―
|
||||||||
|
State tax refund adjustment
|
—
|
180.0
|
―
|
|||||||||
|
Goodwill write-down
|
—
|
―
|
―
|
|||||||||
|
Foreign NOLs
|
—
|
―
|
―
|
|||||||||
|
Other
|
1.73
|
(46.2
|
) |
(6.4
|
) | |||||||
|
Foreign deemed dividend
|
— | — |
(51.8
|
) | ||||||||
|
Foreign tax credit
|
— | — |
24.4
|
|||||||||
|
Valuation Allowance
|
— | — |
(491.7
|
) | ||||||||
|
5.41
|
%
|
1670.7
|
%
|
(462.0)
|
%
|
|||||||
Deferred taxes result from temporary differences between tax bases of assets and liabilities and their reported amounts in the consolidated financial statements. The temporary differences result from costs required to be capitalized for tax purposes by the U.S. Internal Revenue Code (“IRC”), and certain items accrued for financial reporting purposes in the year incurred but not deductible for tax purposes until paid. The Company has established a full valuation allowance on net deferred tax assets in the United States since, in the opinion of management, it is not more likely than not that the U.S. net deferred tax assets will be realized.
The components of income (loss) before provision (benefit) for income taxes are as follows (in thousands):
|
2010
|
2011
|
2012
|
||||||||||
|
Domestic
|
$
|
20,066
|
$
|
(30,577
|
) |
$
|
(38,674
|
) | ||||
|
Foreign
|
29,676
|
30,039
|
20,025
|
|||||||||
|
$
|
49,742
|
$
|
(538
|
) |
$
|
(18,649
|
) | |||||
The Company has approximately $190 million of cumulative undistributed earnings
of non-U.S. subsidiaries for which U.S. taxes have not been provided on December 31, 2012. These earnings are intended to be permanently reinvested outside the U.S. If future events necessitate that these earnings should be repatriated to the U.S., an additional tax expense and related liability may be required.
The Company uses a recognition threshold and measurement process for recording in the financial statements uncertain tax positions (“UTP”) taken or expected to be taken in a tax return.
Approximately $0.6 million of new unrecognized tax positions (UTPs) were recognized in 2012. These UTPs are associated with a reserve for equipment depreciation in Hong Kong, withholding tax in Hong Kong and U.S. research and development credits. In addition, approximately $0.2 million of Hong Kong based UTPs and $0.6 million U.S. UTPs became de-recognized during 2012, primarily due to statute expirations. These items were included in the 2012 income tax provision, except for the UTP related to the new acquisition and carryforward credits. During 2011, approximately $1.0 million of the liability for UTP was recognized.
Current interest on uncertain income tax liabilities is recognized as interest expense and penalties are recognized in selling, general and administrative expenses in the consolidated statement of operations. During 2010, the Company de-recognized $1.6 million of current year interest expense relating to UTPs. During 2011, the Company recognized $0.2 million of current year interest expense relating to UTPs. During 2012, the Company recognized $27,000 of current year interest expense relating to UTPs.
64
The following table provides further information of UTPs that would affect the effective tax rate, if recognized, as of December 31, 2012 (in millions):
|
Balance, January 1, 2010
|
$
|
16.8
|
||
|
Current year additions
|
1.8
|
|||
|
Current year reduction due to lapse of applicable statute of limitations
|
(13.6
|
) | ||
|
Balance, January 1, 2011
|
5.0
|
|||
|
Current year additions
|
1.0
|
|||
|
Current year reduction due to lapse of applicable statute of limitations
|
(1.0
|
) | ||
|
Balance, January 1, 2012
|
5.0
|
|||
|
Current year additions
|
0.6
|
|||
|
Current year reduction due to lapse of applicable statute of limitations
|
(0.8
|
) | ||
|
Balance, December 31, 2012
|
$
|
4.8
|
Tax years 2009 through 2011 remain subject to examination in the United States and tax years 2008 through 2011 are still subject to examination in California. The tax years 2006 through 2011 are still subject to examination in Hong Kong. In the normal course of business, the Company is audited by federal, state, and foreign tax authorities. The U.S. Internal Revenue Service concluded its examination related to the 2009 U.S. federal income tax return in December 2012.
The Company was under examination by various state jurisdictions during 2012. The ultimate resolution of the state examinations, including matters that may be resolved within the next twelve months, is not yet determinable.
Management assesses the available positive and negative evidence to estimate if sufficient future taxable income will be generated to use the existing deferred tax assets by jurisdiction. A significant piece of objective negative evidence evaluated was the cumulative loss incurred over the three-year period ended December 31, 2012. Such objective evidence limits the ability to consider other subjective evidence such as our projections for future growth. The Company is required to establish a valuation allowance for the U.S. deferred tax assets and record a charge to income if Management determines, based upon available evidence at the time the determination is made, that it is more likely than not that some portion or all of the deferred tax assets may not be realized.
For the three-year period ended December 31, 2012, the Company was in a cumulative pre-tax loss position in the U.S. On the basis of this evaluation, as of December 31, 2012, a valuation allowance of $91.7 million has been recorded against the U.S. deferred tax assets that more likely than not will not be realized. The net deferred tax liabilities of $3.1 million represent the net deferred tax liabilities in the foreign jurisdiction, where the Company is in a cumulative income position. The amount of the deferred tax asset considered realizable, however, could be adjusted if estimates of future taxable income during the carryforward period are reduced or increased, or if objective negative evidence in the form of cumulative losses is no longer present and additional weight may be given to subjective evidence such as our projections for growth.
65
The Company leases office, warehouse and showroom facilities and certain equipment under operating leases. Rent expense for the years ended December 31, 2010, 2011 and 2012 totaled $15.3 million, $14.5 million and $
13.3
million, respectively. The following is a schedule of minimum annual lease payments (in thousands).
|
2013
|
$
|
13,112
|
||
|
2014
|
11,950
|
|||
|
2015
|
8,147
|
|||
|
2016
|
4,243
|
|||
|
2017
|
3,557
|
|||
|
Thereafter
|
1,186
|
|||
|
$
|
42,195
|
66
The Company has 105,000,000 authorized shares of stock consisting of 100,000,000 shares of $.001 par value common stock and 5,000,000 shares of $.001 par value preferred stock. On December 31, 2012, shares issued and outstanding were 21,969,355. On December 31, 2011 shares issued and outstanding were 25,943,214.
All issuances of common stock, including those issued pursuant to stock option and warrant exercises, restricted stock grants and acquisitions, are issued from the Company’s authorized but not issued and outstanding shares.
On September 12, 2012, the Company entered into a joint venture (“DreamPlay Toys”) with NantWorks LLC (“NantWorks”) in which it owns a fifty percent interest. Pursuant to the operating agreement of DreamPlay Toys, the Company paid to NantWorks cash in the amount of $8.0 million and issued NantWorks a warrant to purchase 1.5 million shares of the Company’s common stock at an exercise price of $16.2823 per share at a value of $7.0 million in exchange for the exclusive right to arrange for the provision of the NantWorks platform for toy products. The fair value of the warrant was estimated using the Black-Scholes method, using assumptions consistent with our application of ASC 505-50, Equity-Based Payments to Non-Employees (“ASC 505-50”), which are as follows:
|
September 12,
|
||||
|
2012
|
||||
|
Risk-free interest rate
|
0.70
|
%
|
||
|
Expected volatility
|
42.28
|
%
|
||
|
Expected life (years)
|
5.0
|
|||
|
Expected dividend yield
|
2.5
|
%
|
||
The Company’s computation of expected volatility is based upon the historical daily volatility of its publicly traded stock. The Company used the warrant’s contracted life for the expected life. The dividend yield assumption is based upon the Company’s annualized dividend yield at the time of issuance. The risk-free interest rate is equal to the U.S. Treasury rate in effect at the time of the grant for instruments with a similar expected life.
On July 5, 2012, the Company completed a self-tender offer to its shareholders and purchased 4 million shares of its common stock at a price of $20.00 per share for a total of $80.0 million, excluding offering costs of approximately $0.6 million. The tendered shares were immediately retired.
During 2012, the company declared a cash dividend of $0.10 per share to shareholders of record as of market close on March 15, 2012, June 15, 2012, September 14, 2012 and December 14, 2012. Cash paid for these dividends were approximately $2.6 million, $2.6 million, $2.2 million and $2.2 million, respectively.
During 2011, the Company declared a cash dividend of $0.10 per share to shareholders of record as of market close on September 12, 2011 and December 12, 2011. Cash paid for these dividends were approximately $2.6 million and $2.6 million, respectively.
In October 2010, the Company’s Board of Directors authorized the repurchase of up to $30.0 million of its common stock. As of December 31, 2011, 1,771,633 shares at a value of $30.0 million were repurchased. The repurchased stock represented approximately 6.8% of the company’s outstanding shares of common stock at the time of the repurchase, and were subsequently retired by the company.
67
The Company has entered into various license agreements whereby the Company may use certain characters and intellectual properties in conjunction with its products. Generally, such license agreements provide for royalties to be paid at 1% to 14% of net sales with minimum guarantees and advance payments.
In the event the Company determines that a shortfall in achieving the minimum guarantee is likely, a liability is recorded for the estimated short fall and charged to royalty expense.
Future annual minimum royalty guarantees as of December 31, 2012 are as follows (in thousands):
|
2013
|
$
|
14,573
|
||
|
2014
|
7,542
|
|||
|
2015
|
2,613
|
|||
|
2016
|
730
|
|||
|
2017
|
500
|
|||
|
Thereafter
|
500
|
|||
|
$
|
26,458
|
68
The Company has entered into employment and consulting agreements with certain executives expiring through December 31, 2018
. The aggregate future annual minimum guaranteed amounts due under those agreements as of December 31, 2012 are as follows (in thousands):
|
2013
|
$
|
9,551
|
||
|
2014
|
5,275
|
|||
|
2015
|
3,085
|
|||
|
2016
|
2,215
|
|||
|
2017
|
1,290
|
|||
|
Thereafter
|
1,315
|
|||
|
$
|
22,731
|
Under its 2002 Stock Award and Incentive Plan (“the Plan”), which incorporated its Third Amended and Restated 1995 Stock Option Plan, the Company has reserved 6,525,000 shares of its common stock for issuance upon the exercise of options granted under the Plan, as well as for the awarding of other securities. Under the Plan, employees (including officers), non-employee directors and independent consultants may be granted options to purchase shares of common stock and other securities (Note 15). The vesting of these options and other securities may vary, but typically vest on a step-up basis over a maximum period of 5 years. Restricted shares typically vest in the same manner, with the exception of certain awards vesting over one to two years. Share-based compensation expense is recognized on a straight-line basis over the requisite service period.
Restricted Stock
Under the Plan, share-based compensation payments may include the issuance of shares of restricted stock. Restricted stock award grants are based upon employment contracts, which vary by individual and year, and are subject to vesting conditions. Seven non-employee directors receive grants of restricted stock at a value of $100,000 annually which vest after one year – this amount is prorated if a director is appointed within the year. In addition, at the discretion of Management and approval of the Board, non-executive employees also receive restricted stock awards, which occurs approximately once per year.
During 2012, the Company issued a total of 79,812 shares of restricted stock
; of which, 40,750 shares of restricted stock were issued to two executive officers and were, subsequently, forfeited based upon the Company not meeting certain financial targets for the year. The remaining 39,062 shares were granted to its non-employee directors. Also during 2012, certain employees, including an executive officer, surrendered an aggregate of 13,993 shares of restricted stock at a value of $0.2 million to cover income taxes on the vesting of shares. Additionally, the Company cancelled an aggregate of 6,428 shares of restricted stock due to the departure from the Company of three employees prior to vesting of their shares. As of December 31, 2012, 95,315
shares of the restricted stock remained unvested, representing a weighted average grant date fair value of $1.6 million.
During 2011, the Company issued a total of 141,480 shares of restricted stock. 49,769 shares of restricted stock were issued to one executive officer. Additionally, the Company granted and issued an aggregate of
26,480
shares to its non-employee directors. Lastly, the Company granted and issued an aggregate of
65,231
shares of restricted stock to its non-executive employees. As of December 31, 2011, 142,184 shares of the restricted stock remained unvested, representing a weighted average grant date fair value of $2.6 million.
During 2010, the Company issued a total of 297,874 shares of restricted stock. 240,000 shares of restricted stock were issued to two executive officers. Additionally, the Company granted and issued an aggregate of 47,874 shares to its non-employee directors. Lastly, the Company granted and issued an aggregate of 10,000 shares of restricted stock to its non-executive employees. As of December 31, 2010, 324,635 shares of restricted stock remained unvested, representing a weighted average grant date fair value of $4.9 million.
69
The table below summarizes the grant activity for the year ended December 31, 2012 and is broken down in the following three distinct groups because each group has unique characteristics: executives, board of directors, and employees:
|
Group Type
|
# Shares
Granted
|
Average Grant Date
Value
|
Vest Schedule Range
|
||||||||
|
Executives
|
40,750
|
*
|
$
|
14.11
|
1-6 years
|
||||||
|
Board of directors (non-executives)
|
39,062
|
14.54
|
1 year
|
||||||||
|
Employees
|
–
|
–
|
N/A
|
||||||||
|
Total
|
79,812
|
$
|
14.32
|
1 – 6 years
|
|||||||
*All 40,750 shares were cancelled prior to vest.
The following table summarizes the restricted stock award activity, annually, for the years ended December 31, 2010, 2011 and 2012:
|
Restricted Stock Awards
|
||||||||
|
|
Number of
Shares
|
Weighted
Average
Fair
Value
|
||||||
|
Outstanding, December 31, 2009
|
436,443
|
$
|
20.24
|
|||||
|
Awarded
|
297,874
|
$
|
12.27
|
|||||
|
Released
|
(385,532
|
)
|
$
|
18.64
|
||||
|
Forfeited
|
(24,150
|
)
|
$
|
17.98
|
||||
|
Outstanding, December 31, 2010
|
324,635
|
$
|
14.99
|
|||||
|
Awarded
|
141,480
|
$
|
18.31
|
|||||
|
Released
|
(240,978
|
) |
$
|
13.93
|
||||
|
Forfeited
|
(82,953
|
) |
$
|
18.32
|
||||
|
Outstanding, December 31, 2011
|
142,184
|
$
|
18.15
|
|||||
|
Awarded
|
79,812
|
$
|
14.32
|
|||||
|
Released
|
(79,503
|
) |
$
|
18.19
|
||||
|
Forfeited
|
(47,178
|
) |
$
|
14.45
|
||||
|
Outstanding, December 31, 2012
|
95,315
|
$
|
16.75
|
|||||
As of December 31, 2012, there was $1.6 million of total unrecognized compensation cost related to non-vested restricted stock awards, which is expected to be recognized over a weighted-average period of less than one year.
Stock Options
Share-based compensation cost is measured at the grant date, based on the estimated fair value of the award, and is recognized as expense over the employee's requisite service period.
The Company uses the Black-Scholes method of valuation for share-based option awards. In valuing the stock options, the Black-Scholes model incorporates assumptions about stock volatility, expected term of stock options, and risk free interest rate. The valuation is reduced by an estimate of stock option forfeitures.
The amount of share-based compensation expense recognized in the years ended December 31, 2010, 2011 and 2012 is based on options granted prior to January 1, 2006 and restricted stock, and ultimately expected to vest, and it has been reduced for estimated forfeitures. The revised shared-based compensation guidance requires forfeitures to be estimated at the time of grant and revised, if necessary, in subsequent periods if actual forfeitures differ from those estimates.
The following table summarizes the total share-based compensation expense and related tax benefits recognized (in thousands):
|
Year Ended December 31,
|
||||||||||||
|
2010
|
2011
|
2012
|
||||||||||
|
Stock option compensation expense (benefit)
|
$
|
(224
|
)
|
$
|
―
|
$
|
―
|
|||||
|
Tax benefit related to stock option compensation
|
$
|
—
|
$
|
―
|
$
|
―
|
||||||
|
Restricted stock compensation expense
|
$
|
4,619
|
$
|
1,594
|
$
|
1,122
|
||||||
|
Tax benefit related to restricted stock compensation
|
$
|
1,788
|
$
|
(909
|
) |
$
|
114
|
|||||
70
As of December 31, 2012, 803,976 shares were available for future grant. Additional shares may become available to the extent that options or shares of restricted stock presently outstanding under the Plan terminate or expire. Stock option activity pursuant to the Plan is summarized as follows:
|
Weighted
|
||||||||
|
Average
|
||||||||
|
Number
|
Exercise
|
|||||||
|
of Shares
|
Price
|
|||||||
|
Outstanding, December 31, 2009
|
444,715
|
$
|
19.63
|
|||||
|
Granted
|
—
|
$ |
—
|
|||||
|
Exercised
|
—
|
$ |
—
|
|||||
|
Canceled
|
(126,450
|
)
|
$ |
20.64
|
||||
|
Outstanding, December 31, 2010
|
318,265
|
$
|
19.23
|
|||||
|
Granted
|
―
|
$ |
―
|
|||||
|
Exercised
|
(17,250
|
)
|
$ |
15.03
|
||||
|
Canceled
|
(118,350
|
)
|
$ |
20.02
|
||||
|
Outstanding, December 31, 2011
|
182,665
|
$
|
19.11
|
|||||
|
Granted
|
―
|
$ |
―
|
|||||
|
Exercised
|
(7,500
|
) | $ |
13.47
|
||||
|
Canceled
|
(40,521
|
) | $ |
18.45
|
||||
|
Outstanding, December 31, 2012
|
134,644
|
$ |
19.82
|
|||||
The following characteristics apply to the Plan stock options that are fully vested, or expected to vest, as of December 31, 2012:
|
Aggregate intrinsic value of options outstanding
|
$
|
―
|
||
|
Weighted-average contractual term of options outstanding (in years)
|
1.86
|
|||
|
Number of options currently exercisable
|
134,644
|
|||
|
Weighted-average exercise price of options currently exercisable
|
$
|
19.82
|
||
|
Aggregate intrinsic value of options currently exercisable
|
$
|
―
|
||
|
Weighted-average contractual term of currently exercisable (in years)
|
1.86
|
The following table summarizes information about stock options outstanding and exercisable at December 31, 2012:
|
Outstanding
|
Exercisable
|
||||||||||||||||||||
|
Weighted
|
Weighted
|
Weighted
|
|||||||||||||||||||
|
Average
|
Average
|
Average
|
|||||||||||||||||||
|
Option Price
|
Number
|
Life
|
Exercise
|
Number
|
Exercise
|
||||||||||||||||
|
Range
|
of Shares
|
in Years
|
Price
|
of Shares
|
Price
|
||||||||||||||||
| $ 0.00 – $9.99 |
―
|
―
|
$
|
―
|
―
|
$ |
―
|
||||||||||||||
| $ 10.00 – $19.99 |
52,500
|
2.00
|
$
|
17.56
|
52,500
|
$ |
17.56
|
||||||||||||||
| $ 20.00 – $50.00 |
82,144
|
1.78
|
$
|
21.27
|
82,144
|
$ |
21.27
|
||||||||||||||
Non-Employee Stock Warrants
In 2003, we granted 100,000 stock warrants with an exercise price of $11.35 per share and ten year term to third parties in connection with the acquisition of licensing rights for certain key intellectual property relating to our video game joint venture. The exercise price of the 2003 stock warrants is equal to the fair market value of our common stock at the date of grant. In 2012, we granted 1,500,000 stock warrants with an exercise price of $16.28 per share and a five year term to a third party as partial consideration for the exclusive right to use certain recognition technology in connection with our toy products. The exercise price of the 2012 stock warrants is equal to the volume-weighted average price of our common stock over the five trading days preceding the date of grant. All warrants vest upon grant and are exercisable over the terms of the warrants.
At December 31, 2012, we had 1,500,000 stock warrants outstanding with an exercise price of $16.28 per share and an expiration date of September 12, 2017. During 2011, all of the 2003 stock warrants were exercised in full and at December 31, 2011, we had no stock warrants outstanding. At December 31, 2010, we had 100,000 stock warrants outstanding with a weighted average exercise price per share of $11.35.
We measure the fair value of our warrants granted on the measurement date. The fair value of the 2012 stock warrant is capitalized as an intangible asset and will be amortized to expense in our consolidated statements of operations when the related product is released and the related net sales are recognized, which is expected to be in the third quarter of 2013. The 2003 warrants were fully amortized in our consolidated statements of operations through 2009. In fiscal 2010, 2011 and 2012 there was no amortization expense related to warrants.
The Company sponsors for its U.S. employees, a defined contribution plan under Section 401(k) of the Internal Revenue Code. The Plan provided that employees may defer up to 50% of their annual compensation subject to annual dollar limitations, and that the Company will make a matching contribution equal to 100% of each employe
e’s deferral, up to 5% of the employee’s annual compensation. The Company suspended its matching contribution effective January 1, 2010 and restarted the matching contribution effective January 1, 2011. Company matching contributions
, which vest immediately, totaled nil, $2.1 million and $2.7 million for 2010, 2011 and 2012, respectively.
71
In 2012, an executive officer surrendered an aggregate of 943 shares of restricted stock at a value of less than $0.1 million to cover his income taxes due on the 2012 vesting of restricted shares granted to him in 2011. During 2012, certain employees surrendered an aggregate of 13,050 shares of restricted stock at a value of $0.2 million to cover their income taxes due on the 2012 vesting of the restricted shares granted them in 2009, 2010 and 2011. Additionally, the Company recognized a $0.1 million tax deficiency from the vesting of restricted stock.
In 2011, an executive officer surrendered an aggregate of 57,096 shares of restricted stock at a value of $1.0 million to cover his income taxes due on the 2011 vesting of restricted shares granted to him in 2010 and 2011. During 2011, certain employees surrendered an aggregate of 13,986 shares of restricted stock at a value of $0.2 million to cover their income taxes due on the 2011 vesting of the restricted shares granted them in 2006 and 2009. Additionally, the Company recognized a $0.4 million tax benefit from the vesting of restricted stock.
In 2010, certain employees surrendered an aggregate of 9,967 shares of restricted stock at a value of $0.2 million to cover their income taxes due on the 2010 vesting of the restricted shares granted them in 2006 and 2009. Additionally, the company recognized a $0.7 million tax deficiency from the vesting of restricted stock.
Selected unaudited quarterly financial data for the years 2011 and 2012 are summarized below:
|
2011
|
2012
|
|||||||||||||||||||||||||||||||
|
First
|
Second
|
Third
|
Fourth
|
First
|
Second
|
Third
|
Fourth
|
|||||||||||||||||||||||||
|
Quarter
|
Quarter
|
Quarter
|
Quarter
|
Quarter
|
Quarter
|
Quarter
|
Quarter
|
|||||||||||||||||||||||||
|
(in thousands, except per share data)
|
||||||||||||||||||||||||||||||||
|
Net sales
|
$ | 72,323 | 131,930 | 332,419 | 141,079 | $ | 73,405 | $ | 145,359 | $ | 314,491 | $ | 133,507 | |||||||||||||||||||
|
Gross profit
|
$ | 24,271 | 45,092 | 105,670 | 18,987 | $ | 23,566 | $ | 46,893 | $ | 96,712 | $ | 30,766 | |||||||||||||||||||
|
Income (loss) from operations
|
$ | (14,790 | ) | 1,998 | 50,068 | (35,996 | ) | $ | (19,410 | ) | $ | 107 | $ | 37,296 | $ | (31,215 | ) | |||||||||||||||
|
Income (loss) before provision (benefit) for income taxes
|
$ | (16,716 | ) | 6,087 | 48,081 | (37,990 | ) | $ | (21,192 | ) | $ | 288 | $ | 36,426 | $ | (34,171 | ) | |||||||||||||||
|
Net income (loss)
|
$ | (10,575 | ) | 4,240 | 34,825 | (20,018 | ) | $ | (16,000 | ) | $ | 214 | $ | 30,443 | $ | (119,457 | ) | |||||||||||||||
|
Basic earnings (loss) per share
|
$ | (0.39 | ) | 0.16 | 1.32 | (0.77 | ) | $ | (0.62 | ) | $ | 0.01 | $ | 1.38 | $ | (5.45 | ) | |||||||||||||||
|
Weighted average shares outstanding
|
27,217 | 26,948 | 26,476 | 25,839 | 25,831 | 25,765 | 22,110 | 21,923 | ||||||||||||||||||||||||
|
Diluted earnings (loss) per share
|
$ | (0.39 | ) | 0.16 | 1.10 | (0.77 | ) | $ | (0.62 | ) | $ | 0.01 | $ | 1.10 | $ | (5.45 | ) | |||||||||||||||
|
Weighted average shares and equivalents outstanding
|
27,217 | 27,096 | 32,922 | 25,839 | 25,831 | 25,870 | 28,933 | 21,923 | ||||||||||||||||||||||||
In the fourth quarter of 2011 and 2012, we experienced poor performance of some of our products which coupled with advertising commitments, license royalty shortfalls and retailer markdowns due to lower than anticipated sales and sell-through, resulted in significant net losses.
In the fourth quarter of 2012, the Company recognized an impairment of its deferred tax assets, resulting in a non-cash charge to income of $91.7 million.
Quarterly and year-to-date computations of income (loss) per share amounts are made independently. Therefore, the sum of the per share amounts for the quarters may not agree with the per share amounts for the year.
72
The Company is a party to, and certain of its property is the subject of, various other pending claims and legal proceedings that routinely arise in the ordinary course of its business. The Company does not believe that any of these claims or proceedings will have a material effect on its business, financial condition or results of operations.
Profit from Video Game Joint Venture
Pursuant to a Settlement Agreement and Mutual Release dated December 22, 2009, the joint venture was terminated on December 31, 2009. As a result, the Company recognized $6.0 million in income related to our video game joint venture in 2010 and 2011. In 2010 and 2011 the Company received payments from THQ of $6.0 million each, which was recognized as income from joint venture. The Settlement Agreement was amended during the second quarter of 2012, we amended. The amendment called for the payment of an additional $1.0 million on October 30, 2012 (which the Company received) and $0.4 million each in ten consecutive monthly payments beginning February 28, 2013. On December 19, 2012, THQ filed voluntary petitions under Chapter 11 of the U.S. Bankruptcy Court, and on January 24, 2013 the US Bankruptcy Court approved the sale of most of THQ’s assets to multiple buyers. Given that the final payment received from THQ (in October 2012) was within 90 days of their filing for bankruptcy, the Company has not recognized this payment as revenue and has reserved the amount received pending the final settlement of THQ’s assets in accordance with bankruptcy law.
73
Report of Independent Registered Public Accounting Firm
The Board of Directors and Stockholders
JAKKS Pacific, Inc.
Malibu, California
The audits referred to in our report dated March 15, 2013 relating to the consolidated financial statements of JAKKS Pacific, Inc., which is contained in Item 8 of this Form 10-K also included the audit of the financial statement schedule (Schedule II) listed in the accompanying index. This financial statement schedule is the responsibility of the Company's management. Our responsibility is to express an opinion on this financial statement schedule based upon our audits.
In our opinion such financial statement schedule, when considered in relation to the basic consolidated financial statements taken as a whole, presents fairly, in all material respects, the information set forth therein.
|
/s/ BDO USA, LLP
|
BDO USA, LLP
Los Angeles, California
March 15, 2013
74
JAKKS PACIFIC, INC. AND SUBSIDIARIES
SCHEDULE II—VALUATION AND QUALIFYING ACCOUNTS
YEARS ENDED DECEMBER 31, 2010, 2011 and 2012
Allowances are deducted from the assets to which they apply, except for sales returns and allowances.
|
Balance at
|
Charged to
|
Balance
|
||||||||||||||
|
Beginning
|
Costs and
|
at End
|
||||||||||||||
|
of Period
|
Expenses
|
Deductions
|
of Period
|
|||||||||||||
|
(In thousands)
|
||||||||||||||||
|
Year ended December 31, 2010:
|
||||||||||||||||
|
Allowance for:
|
||||||||||||||||
|
Uncollectible accounts
|
$
|
2,543
|
$
|
1,086
|
$
|
(851
|
)
|
$
|
2,778
|
|||||||
|
Reserve for potential product obsolescence
|
9,872
|
6,844
|
(8,245
|
)
|
8,471
|
|||||||||||
|
Reserve for sales returns and allowances
|
33,897
|
52,412
|
(57,931
|
)
|
28,378
|
|||||||||||
|
$
|
46,312
|
$
|
60,342
|
$
|
(67,027
|
)
|
$
|
39,627
|
||||||||
|
Year ended December 31, 2011:
|
||||||||||||||||
|
Allowance for:
|
||||||||||||||||
|
Uncollectible accounts
|
$
|
2,778
|
$ |
461
|
$ |
(170
|
) | $ |
3,069
|
|||||||
|
Reserve for potential product obsolescence
|
8,471
|
8,099
|
(8,297
|
) |
8,273
|
|||||||||||
|
Reserve for sales returns and allowances
|
28,378
|
67,947
|
(52,885
|
) |
43,440
|
|||||||||||
|
$
|
39,627
|
$
|
76,507
|
$
|
(61,352
|
) |
$
|
54,782
|
||||||||
|
Year ended December 31, 2012:
|
||||||||||||||||
|
Allowance for:
|
||||||||||||||||
|
Uncollectible accounts
|
$
|
3,069
|
$ |
(351
|
) | $ |
(182
|
) | $ |
2,536
|
||||||
|
Reserve for potential product obsolescence
|
8,273
|
7,902
|
(6,224
|
) |
9,951
|
|||||||||||
|
Reserve for sales returns and allowances
|
43,440
|
42,565
|
(51,632
|
) |
34,373
|
|||||||||||
|
$
|
54,782
|
$ |
50,116
|
$ |
(58,038
|
) | $ |
46,860
|
||||||||
Evaluation of Disclosure Controls and Procedures.
Our Chief Executive Officer and Chief Financial Officer, after evaluating the effectiveness of our disclosure controls and procedures (as defined in Exchange Act Rules 13a-15(e) and 15d-15(e)) as of the end of the period covered by this Annual Report, have concluded that as of that date, our disclosure controls and procedures were adequate and effective to ensure that information required to be disclosed by us in the reports we file or submit with the Securities and Exchange Commission is recorded, processed, summarized and reported within the time periods specified in the Securities and Exchange Commission’s rules and forms.
Changes in Internal Control over Financial Reporting.
There has been no change in our internal control over financial reporting identified in connection with the evaluation required by Exchange Act Rules 13a-15(d) and 15d-15 that occurred during the fourth quarter period covered by this Annual Report that has materially affected, or is reasonably likely to materially affect, our internal control over financial reporting.
Management’s Annual Report on Internal Control over Financial Reporting.
We, as management, are responsible for establishing and maintaining adequate “internal control over financial reporting” (as defined in Exchange Act Rule 13a-15(f)). Our internal control system was designed by or is under the supervision of management and our board of directors to provide reasonable assurance regarding the reliability of financial reporting and the preparation of published financial statements.
All internal control systems, no matter how well designed, have inherent limitations. Therefore, even those systems determined to be effective can provide only reasonable assurance with respect to financial statement preparation and presentation.
Our management, including our Chief Executive Officer and Chief Financial Officer, evaluated the effectiveness of our internal control over financial reporting as of December 31, 2012. In making this assessment, management used the criteria set forth by the Committee of Sponsoring Organizations of the Treadway Commission (COSO) in
Internal Control — Integrated Framework
. We believe that, as of December 31, 2012, our internal control over financial reporting was effective based upon those criteria.
Management’s assessment did not include the internal controls of
Maui, Inc., A.S. Design Limited and JKID, LTD.
, due to the limited time between the respective purchase dates and management’s assessment, nor did it include Kessler Services, Inc., as it was dissolved prior to December 31, 2012.
Our independent registered public accounting firm has issued a report on our internal controls over financial reporting. This report appears below.
75
Report of the Independent Registered Public Accounting Firm
.
Report of Independent Registered Public Accounting Firm
The Board of Directors and Stockholders
JAKKS Pacific, Inc.
Malibu, California
We have audited JAKKS Pacific, Inc.’s internal control over financial reporting as of December 31, 2012, based on criteria established in
Internal Control – Integrated Framework
issued by the Committee of Sponsoring Organizations of the Treadway Commission (the COSO criteria). JAKKS Pacific, Inc.’s management is responsible for maintaining effective internal control over financial reporting and for its assessment of the effectiveness of internal control over financial reporting, included in the accompanying Item 9A, “Management’s Report on Internal Control Over Financial Reporting”. Our responsibility is to express an opinion on the company’s internal control over financial reporting based on our audit.
We conducted our audit in accordance with the standards of the Public Company Accounting Oversight Board (United States). Those standards require that we plan and perform the audit to obtain reasonable assurance about whether effective internal control over financial reporting was maintained in all material respects. Our audit included obtaining an understanding of internal control over financial reporting, assessing the risk that a material weakness exists, and testing and evaluating the design and operating effectiveness of internal control based on the assessed risk. Our audit also included performing such other procedures as we considered necessary in the circumstances. We believe that our audit provides a reasonable basis for our opinion.
A company’s internal control over financial reporting is a process designed to provide reasonable assurance regarding the reliability of financial reporting and the preparation of financial statements for external purposes in accordance with generally accepted accounting principles. A company’s internal control over financial reporting includes those policies and procedures that (1) pertain to the maintenance of records that, in reasonable detail, accurately and fairly reflect the transactions and dispositions of the assets of the company; (2) provide reasonable assurance that transactions are recorded as necessary to permit preparation of financial statements in accordance with generally accepted accounting principles, and that receipts and expenditures of the company are being made only in accordance with authorizations of management and directors of the company; and (3) provide reasonable assurance regarding prevention or timely detection of unauthorized acquisition, use, or disposition of the company’s assets that could have a material effect on the financial statements.
Because of its inherent limitations, internal control over financial reporting may not prevent or detect misstatements. Also, projections of any evaluation of effectiveness to future periods are subject to the risk that controls may become inadequate because of changes in conditions, or that the degree of compliance with the policies or procedures may deteriorate.
As indicated in the accompanying Item 9A, “Management’s Annual Report on Internal Control over Financial Reporting,” management’s assessment of and conclusion on the effectiveness of internal control over financial reporting did not include the internal controls of Maui, Inc., A.S. Design Limited, Kessler Services, Inc. and JKID, LTD which were acquired on July 26, 2012, July 26, 2012, July 26, 2012, and September 14, 2012, respectively (collectively, “2012 Acquired Entities”), and which are included in the consolidated balance sheets of JAKKS Pacific, Inc. as of December 31, 2012, and the related consolidated statements of operations, comprehensive income (loss), stockholders’ equity, and cash flows for the year then ended. The 2012 Acquired Entities constituted 3.3% and 6.3% of total assets and net assets, respectively, as of December 31, 2012, and 1.3% and 0.8% of revenues and net loss, respectively, for the year then ended. Management did not assess the effectiveness of internal control over financial reporting of the 2012 Acquired Entities because of the timing of the acquisitions in 2012. Our audit of internal control over financial reporting of JAKKS Pacific, Inc. also did not include an evaluation of the internal control over financial reporting of the 2012 Acquired Entities.
In our opinion, JAKKS Pacific, Inc. maintained, in all material respects, effective internal control over financial reporting as of December 31, 2012, based on the COSO criteria.
We also have audited, in accordance with the standards of the Public Company Accounting Oversight Board (United States), the
consolidated balance sheets of JAKKS Pacific, Inc. as of December 31, 2012 and 2011, and the related consolidated statements of operations, comprehensive income (loss), stockholders’ equity, and cash flows for each of the three years in the period ended December 31, 2012 and our report dated March 15, 2013 expressed an unqualified opinion thereon.
|
/s/ BDO USA, LLP
|
|
|
BDO USA, LLP
|
|
|
Los Angeles, California
|
|
|
March 15, 2013
|
76
Directors and Executive Officers
Our directors and executive officers are as follows:
|
Name
|
Age
|
Positions with the Company
|
||
|
Stephen G. Berman
|
48
|
Chief Executive Officer, President, Secretary and Director
|
||
|
Joel M. Bennett
|
51
|
Executive Vice President and Chief Financial Officer
|
||
|
John J. McGrath
|
47
|
Chief Operating Officer
|
||
|
Marvin W. Ellin
|
80
|
Director
|
||
|
Robert E. Glick
|
67
|
Director
|
||
|
Michael G. Miller
|
65
|
Director
|
||
|
Murray L. Skala
|
66
|
Director
|
||
|
Peter F. Reilly
|
48
|
Director
|
||
|
Leigh Anne Brodsky
|
54
|
Director
|
||
|
Rex H. Poulsen
|
61 |
Director
|
Stephen G. Berman
has been our Chief Operating Officer (until August 23, 2011) and Secretary and one of our directors since co-founding JAKKS in January 1995. From February 17, 2009 through March 31, 2010 he was also our Co-Chief Executive Officer and has been our Chief Executive Officer since April 1, 2010. Since January 1, 1999, he has also served as our President. From our inception until December 31, 1998, Mr. Berman was also our Executive Vice President. From October 1991 to August 1995, Mr. Berman was a Vice President and Managing Director of THQ International, Inc., a subsidiary of THQ. From 1988 to 1991, he was President and an owner of Balanced Approach, Inc., a distributor of personal fitness products and services.
John J. (Jack) McGrath
is our Chief Operating Officer. He was our Executive Vice President of Operations from December 2007 until August 2011 and became Chief Operating Officer in August 2011. Mr. McGrath was our Vice President of Marketing from 1999 to August 2003 and became a Senior Vice President of Operations in August 2003 and Executive Vice President of Operations in December 2007. From January 1992 to December 1998, Mr. McGrath was Director of Marketing at Mattel Inc. and prior thereto he was a PFC in the U.S. Army. Mr. McGrath holds a Bachelor of Science degree in Marketing.
Joel M. Bennett
joined us in September 1995 as Chief Financial Officer and was given the additional title of Executive Vice President in May 2000. From August 1993 to September 1995, he served in several financial management capacities at Time Warner Entertainment Company, L.P., including as Controller of Warner Brothers Consumer Products Worldwide Merchandising and Interactive Entertainment. From June 1991 to August 1993, Mr. Bennett was Vice President and Chief Financial Officer of TTI Technologies, Inc., a direct-mail computer hardware and software distribution company. From 1986 to June 1991, Mr. Bennett held various financial management positions at The Walt Disney Company, including Senior Manager of Finance for its international television syndication and production division. Mr. Bennett began his career at Ernst & Young LLP as an auditor from August 1983 to August 1986. Mr. Bennett holds a Bachelor of Science degree in Accounting and a Master of Business Administration degree in Finance and is a Certified Public Accountant (inactive).
Marvin W. Ellin
has been one of our directors since October 2010. Mr. Ellin was a founding partner and the managing partner of Miller Ellin & Company LLP, a public accounting firm, for 50 years. The firm consisted of over 40 professionals and had extensive experience handling diverse clients with domestic and international operations including SEC filings, audit, tax compliance and financial advisory services. Mr. Ellin holds a Bachelor of Business Administration degree and a Juris Doctor degree and is a member of the AICPA, NYSSCPA and the New York State Bar Association. Miller Ellin & Company LLP was also a registered accounting firm with the PCAOB and a member of the Center for Public Company Audit Firms of the AICPA. Effective January 1, 2009 the firm merged into Rosen Seymour Shapss Martin & Company LLP and Mr. Ellin is a retired partner of such firm.
Robert E. Glick
has been one of our directors since October 1996. For more than 20 years and until May, 2007, Mr. Glick was an officer, director and principal stockholder in a number of privately-held companies which manufacture and market women’s apparel. Since May 2007, Mr. Glick has been a consultant to a publicly-held company which manufactures and markets women’s apparel.
Michael G. Miller
has been one of our directors since February 1996. From 1979 until May 1998, Mr. Miller was President and a director of a group of privately-held companies, including a list brokerage and list management consulting firm, a database management consulting firm, and a direct mail graphic and creative design firm. Mr. Miller’s interests in such companies were sold in May 1998. Mr. Miller is currently President of Zenith Technologies, LLC, a private home appliance manufacturer.
77
Murray L. Skala
has been one of our directors since October 1995. Since 1976, Mr. Skala has been a partner of the law firm Feder Kaszovitz LLP, our general counsel.
Peter F. Reilly
has been one of our directors since April 21, 2012. Mr. Reilly has been the president and chief operating officer of Strategic Industries, LLC (“Strategic”) since 2007 and prior thereto was its chief financial officer from 2000 to 2007. Strategic is a diversified holding and management company operating in the automotive products and consumer product segments. Prior to joining Strategic, from 1991 to 2000, Mr. Reilly served in various senior financial positions of various entities affiliated with Hanson Industries, PLC. Mr. Reilly began his career at Ernst & Young LLP as an auditor from 1986 to 1991. Mr. Reilly also serves on the boards of directors of several private companies and has previously served on the board of directors of Dura Automotive Systems, Inc. and Jackson Hewitt Tax Service Inc. Mr. Reilly is a Certified Public Accountant (Inactive). He received his Bachelor of Arts degree in Accounting from Rutgers University in 1986.
Leigh Anne Brodsky
has been one of our directors since May 8, 2012. Ms. Brodsky is a 25-year veteran of the children’s entertainment and toy industry. Until September 2011 she served as President of Nickelodeon Consumer Products, Inc., where she oversaw parent company Viacom’s worldwide licensing and merchandising business, which included Nickelodeon, MTV and Comedy Central. Prior to her nearly 13 years with Viacom, Ms. Brodsky worked in senior executive roles for Golden Books Entertainment Group, Lorne Michaels’ Broadway Video and Scripps Howard’s United Media. Ms. Brodsky is currently a Board member of the Children’s Brain Tumor Foundation and served from 2010 to 2011 as an elected Board member of the Toy Industry Association.
Rex H. Poulsen
has been a director since December 26, 2012. Mr. Poulsen is currently a partner in the Glendale, California office of Hutchinson and Bloodgood LLP, a regional certified public accounting and consulting firm registered with the PCAOB. Mr. Poulsen has been continuously licensed as a Certified Public Accountant since 1974, and has spent most of his career with public accounting firms as an independent auditor of both private and publicly-held companies. Mr. Poulsen also has extensive experience in assisting clients in the areas of due diligence, valuation, and other services related to the purchase and sale of businesses, as well as providing services in connection with litigation matters including forensic accounting assignments and expert witness testimony. Mr. Poulsen’s client industries are primarily hospitality, manufacturing, service providers, not-for-profit organizations and include international and multi-national companies. Mr. Poulsen received a Bachelor of Science degree in Accounting from Weber State University in 1973, and is a member of the American Institute of Certified Public Accountants and the California Society of Certified Public Accountants.
A majority of our directors are “independent,” as defined under the rules of Nasdaq. Such independent directors are Messrs. Ellin, Glick, Miller, Reilly and Poulsen and Ms. Brodsky. Our directors hold office until the next annual meeting of stockholders and until their successors are elected and qualified. Our officers are elected annually by our Board of Directors and serve at its discretion. Except for Messrs. Ellin, Reilly and Poulsen and Ms. Brodsky, all of our current independent directors have served as such for more than the past five years and were initially selected for their experience as businessmen (Glick, Miller and Reilly) or financial expertise (Ellin, Reilly and Poulen) or industry experience (Brodsky). We believe that our board is best served by benefiting from this blend of business and financial expertise and experience. Our remaining directors consist of our chief executive officer who brings management’s perspective to the board’s deliberations and, our longest serving director (Skala), who, as an attorney with many years experience advising businesses, is able to provide guidance to the board from a legal perspective. From September 10, 2004 through December 26, 2012, when he resigned for personal reasons, Dan Almagor was also on our board of directors and was classified as an independent director.
Committees of the Board of Directors
We have an Audit Committee, a Compensation Committee and a Nominating and Corporate Governance Committee.
Audit Committee.
The primary functions of the Audit Committee are to select or to recommend to our Board the selection of outside auditors; to monitor our relationships with our outside auditors and their interaction with our management in order to ensure their independence and objectivity; to review, and to assess the scope and quality of, our outside auditor’s services, including the audit of our annual financial statements; to review our financial management and accounting procedures; to review our financial statements with our management and outside auditors; and to review the adequacy of our system of internal accounting controls. Messrs. Miller, Ellin, Reilly and Poulsen are the current members of the Audit Committee and are each “independent” (as that term is defined in NASD Rule 4200(a)(14)), and are each able to read and understand fundamental financial statements. Mr. Poulsen, our audit committee financial expert, is the Chairman of the Audit Committee and possesses the financial expertise required under Rule 401(h) of Regulation S-K of the Act and NASD Rule 4350(d)(2). He is further “independent”, as that term is defined under Item 7(d)(3)(iv) of Schedule 14A under the Exchange Act. We will, in the future, continue to have (i) an Audit Committee of at least three members comprised solely of independent directors, each of whom will be able to read and understand fundamental financial statements (or will become able to do so within a reasonable period of time after his or her appointment); and (ii) at least one member of the Audit Committee that will possess the financial expertise required under NASD Rule 4350(d)(2). Our Board has adopted a written charter for the Audit Committee and the Audit Committee reviews and reassesses the adequacy of that charter on an annual basis. The full text of the charter is available on our website at www.jakks.com.
Compensation Committee.
The functions of the Compensation Committee are to make recommendations to the Board regarding compensation of management employees and to administer plans and programs relating to employee benefits, incentives, compensation and awards under our 2002 Stock Award and Incentive Plan (the “2002 Plan”). Messrs. Glick (Chairman) and Miller and Ms. Brodsky are the current members of the Compensation Committee. The Board has determined that each of them is “independent,” as defined under the applicable rules of Nasdaq.
78
Nominating and Corporate Governance Committee.
The functions of the Nominating and Corporate Governance Committee are to develop our corporate governance system and to review proposed new members of our board of directors, including those recommended by our stockholders. Messrs. Glick (Chairman) and Ellin and Ms. Brodsky are the current members of our Nominating and Corporate Governance Committee. The Nominating and Corporate Governance Committee operates pursuant to a written charter adopted by the Board. The full text of the charter is available on our website at
www.jakks.com.
The Board has determined that each member of this Committee is “independent,” as defined under the applicable rules of Nasdaq.
Section 16(a) Beneficial Ownership Reporting Compliance
Based solely upon a review of Forms 3 and 4 and amendments thereto furnished to us during 2012 and Forms 5 and amendments thereto furnished to us with respect to 2012, during 2012, each of our directors and executive officers untimely filed one report on Form 4 reporting one late transaction. Based solely upon a review of Forms 3 and 4 and amendments thereto furnished to us during 2012 and Forms 5 and amendments thereto furnished to us with respect to 2012, all other Forms 3, 4 and 5 required to be filed during 2012 were done so on a timely basis.
Code of Ethics
We have a Code of Ethics (which we call a code of conduct) that applies to all our employees, officers and directors. This code was filed as an exhibit to our Annual Report on Form 10-K for the fiscal year ended December 31, 2003. We have posted on our website, www.jakks.com, the full text of such Code. We will disclose when there have been waivers of, or amendments to, such Code, as required by the rules and regulations promulgated by the Securities and Exchange Commission and/or Nasdaq.
79
COMPENSATION DISCUSSION AND ANALYSIS
Compensation Philosophy and Objectives
We believe that a strong management team comprised of highly talented individuals in key positions is critical to our ability to deliver sustained growth and profitability, and our executive compensation program is an important tool for attracting and retaining such individuals. We also believe that our most important resource is our people. While some companies may enjoy an exclusive or limited franchise or are able to exploit unique assets or proprietary technology, we depend fundamentally on the skills, energy and dedication of our employees to drive our business. It is only through their constant efforts that we are able to innovate through the creation of new products and the continual rejuvenation of our product lines, to maintain superior operating efficiencies, and to develop and exploit marketing channels. With this in mind, we have consistently sought to employ the most talented, accomplished and energetic people available in the industry. Therefore, we believe it is vital that our named executive officers receive an aggregate compensation package that is both highly competitive with the compensation received by similarly-situated executive officers at peer group companies, and also reflective of each individual named executive officer’s contributions to our success on both a long-term and short-term basis. As discussed in greater depth below, the objectives of our compensation program are designed to execute this philosophy by compensating our executives at the top quartile of their peers.
Our executive compensation program is designed with three main objectives:
| ● | to offer a competitive total compensation opportunity that will allow us to continue to retain and motivate highly talented individuals to fill key positions; |
| ● |
to align a significant portion of each executive’s total compensation with our annual performance and the interests of our stockholders; and
|
| ● |
reflect the qualifications, skills, experience and responsibilities of our executives
|
Administration and Process
Our executive compensation program is administered by the Compensation Committee. The Compensation Committee receives legal advice from our outside general counsel and has retained Frederick W. Cook & Co., Inc. (“FWC), a compensation consulting firm, which provides advice directly to the Compensation Committee. Historically, the base salary, bonus structure and the long-term equity compensation of our executive officers are governed by the terms of their individual employment agreements (see “-Employment Agreements and Termination of Employment Arrangements”) and we expect that to continue in the future. With respect to our chief executive officer and president and our chief operating officer the Compensation Committee, with input from FWC, establishes target performance levels for incentive bonuses based on a number of factors that are designed to further our executive compensation objectives, including our performance, the compensation received by similarly-situated executive officers at peer group companies, the conditions of the markets in which we operate and the relative earnings performance of peer group companies.
Historically, a factor given considerable weight in establishing bonus performance criteria is Adjusted EPS which is the net income per share of our common stock calculated on a fully-diluted basis in accordance with GAAP, applied on a basis consistent with past periods, as adjusted in the sole discretion of the Compensation Committee to take account of extraordinary or special items.
As explained in greater detail below (see “
Employment Agreements and Termination of Employment Arrangements
”), pursuant to the terms of Mr. Berman’s amended and restated 2010 employment agreement, with respect to 2012, during the first quarter, the Compensation Committee established the targeted level of our Adjusted EPS (as defined below) growth, and the corresponding bonus levels, as a percentage of base salary, Mr. Berman earns if the target is met. Pursuant to the terms of his employment agreement as in effect on January 1, 2012, this bonus is capped at a maximum of 200% of base salary, although the Compensation Committee has the authority, in its discretion, to increase the maximum. The Compensation Committee also has wide discretion to set the target levels of Adjusted EPS and it works together with FWC to establish target levels that will accomplish the general objectives outlined above of also promoting growth and alignment with our shareholders’ interests. Mr. Berman’s agreement as in effect on January 1, 2012 also provides for an additional annual performance bonus capped at a maximum of 100% of base salary, payable solely in shares of restricted stock, which can be earned by Mr. Berman if the Company’s performance meets certain criteria established by the Compensation Committee during the first quarter. In addition, Mr. Berman’s agreement as in effect on January 1, 2012 provided for an annual grant of $500,000 of restricted stock, the initial vesting of which depended solely on EPS targets established in the agreement; if initial vesting occurred, then the restricted stock vested over time.
80
Pursuant to a September 2012 amendment to Mr. Berman’s employment agreement, commencing in 2013, his annual bonus has been restructured so that part of it is now capped at 300% of his base salary and the performance criteria and vesting are solely within the discretion of the Compensation Committee, which will establish all of the criteria during the first quarter of each fiscal year for that year’s bonus, based upon financial and non-financial factors selected by the Compensation Committee, and another part of his annual performance bonus will be based upon the success of a joint venture entity we initiated in September 2012. The portion of the bonus equal to 200% of base salary is payable in cash and the balance in restricted stock vesting over three years. In addition, the annual grant of $500,000 of restricted stock was changed to $3,500,000 of restricted stock and the vesting criteria was also changed from being solely based upon established EPS targets to being based upon performance standards established by the Compensation Committee during the first quarter of each year.
On August 23, 2011 we entered into an amended employment agreement with John J. (Jack) McGrath whereby he became Chief Operating Officer. As disclosed in greater detail below, Mr. McGrath’s employment agreement also provides for fixed and adjustable bonuses payable based upon adjusted EPS, which targets are set in the agreement, based upon input from FWC, with the adjustable bonus capped at a maximum of 125% of base salary.
While the Compensation Committee does not establish target performance levels for our chief financial officer, it does consider similar factors when determining such officer’s bonus. The employment agreement for Mr. Bennett expired on December 31, 2009 and from January 1, 2010 through October 20, 2011 Mr. Bennett was an employee at will until his entry into a new employment agreement dated October 21, 2011. Prior to its expiration, the agreement authorized our Compensation Committee and Board of Directors to award an annual bonus to Mr. Bennett in an amount up to 50% of his salary as the Committee or Board determined in its discretion and also gave the Compensation Committee and the Board the discretionary authority to pay Mr. Bennett additional incentive compensation as it determined. Mr. Bennett’s new employment agreement does not contain a limitation on the percentage of salary that can be granted as a bonus.
The current employment agreements with our named executive officers also gives the Compensation Committee the authority to award additional compensation to each of them as it determines in its sole discretion based upon criteria it establishes.
The Compensation Committee also annually reviews the overall compensation of our named executive officers for the purpose of determining whether discretionary bonuses should be granted. In 2012, FWC presented a report to the Compensation Committee comparing our performance, size and executive compensation levels to those of peer group companies. FWC also reviewed with the Compensation Committee the base salaries, annual bonuses, total cash compensation, long-term compensation and total compensation of our senior executive officers relative to those companies. The performance comparison presented to the Compensation Committee each year includes a comparison of our total shareholder return, earnings per share growth, sales, net income (and one-year growth of both measures) to the peer group companies. The Compensation Committee reviews this information along with details about the components of each named executive officer’s compensation.
Peer Group
One of the factors considered by the Compensation Committee is the relative performance and the compensation of executives of peer group companies. The peer group is comprised of a group of the companies selected in conjunction with FWC that we believe provides relevant comparative information, as these companies represent a cross-section of publicly-traded companies with product lines and businesses similar to our own throughout the comparison period. The composition of the peer group is reviewed annually and companies are added or removed from the group as circumstances warrant. For the last fiscal year, the peer group companies utilized for executive compensation analysis, which remained the same as in the previous year (except that THQ Inc. is no longer included since it filed for the protection of the bankruptcy laws), were:
|
●
|
Activision, Inc.
|
|
|
●
|
Electronic Arts, Inc.
|
|
|
●
|
Hasbro, Inc.
|
|
|
●
|
Leapfrog Enterprises, Inc.
|
|
|
●
|
Mattel, Inc.
|
|
|
●
|
Kid Brands, Inc.
|
|
|
●
|
Take-Two Interactive, Inc.
|
Elements of Executive Compensation
The compensation packages for the Company’s senior executives have both performance-based and non-performance based elements. Based on its review of each named executive officer’s total compensation opportunities and performance, and our performance, the Compensation Committee determines each year’s compensation in the manner that it considers to be most likely to achieve the objectives of our executive compensation program. The specific elements, which include base salary, annual cash incentive compensation and long-term equity compensation, are described below.
The Compensation Committee has negative discretion to adjust performance results used to determine annual incentive and the vesting schedule of long-term incentive payouts to the named executive officers. The Compensation Committee also has discretion to grant bonuses even if the performance targets were not met.
81
Base Salary
Mr. Berman received compensation in 2012 pursuant to the terms of his employment agreement; Mr. McGrath became an executive officer on August 23, 2011 pursuant to the terms of an amendment to his employment agreement and Mr. Bennett was an employee at will until entry into a new employment agreement on October 21, 2011. As discussed in greater detail below, the employment agreement for Mr. Berman was to expire on December 31, 2010 and Mr. Bennett’s employment agreement expired on December 31, 2009. Effective November 11, 2010, Mr. Berman entered into an amended and restated employment agreement. Pursuant to the terms of their employment agreements as in effect on December 31, 2012, Messrs. Berman, McGrath, and Bennett each receive a base salary which is increased automatically each year by $25,000 for Mr. Berman and $15,000 for each of Messrs. McGrath and Bennett pursuant to the terms of their respective employment agreements. Mr. Bennett’s prior employment agreement, which expired in 2009, did not provide for automatic annual increases in base salary. Any further increase in base salary, as the case may be, is determined by the Compensation Committee based on a combination of two factors. The first factor is the Compensation Committee’s evaluation of the salaries paid in peer group companies to executives with similar responsibilities. The second factor is the Compensation Committee’s evaluation of the executive’s unique role, job performance and other circumstances. Evaluating both of these factors allows us to offer a competitive total compensation value to each individual named executive officer taking into account the unique attributes of, and circumstances relating to, each individual, as well as marketplace factors. This approach has allowed us to continue to meet our objective of offering a competitive total compensation value and attracting and retaining key personnel. Based on its review of these factors, the Compensation Committee determined not to increase the base salary of each of Messrs. Berman, McGrath and Bennett above the contractually required minimum increase in 2012 as unnecessary to maintain our competitive total compensation position in the marketplace.
Annual Cash Incentive Compensation
The function of the annual cash bonus is to establish a direct correlation between the annual incentives awarded to the participants and our financial performance. This purpose is in keeping with our compensation program’s objective of aligning a significant portion of each executive’s total compensation with our annual performance and the interests of our shareholders.
The employment agreements as in effect on January 1, 2012 for Messrs. Berman and McGrath provided for an incentive cash bonus award based on a percentage of each participant’s base salary if the performance goals set by the Compensation Committee are met for that year. The employment agreements mandated that the specific criteria to be used is growth in earnings per share and the Compensation Committee sets the various target thresholds to be met to earn increasing amounts of the bonus up to a maximum of 200% of base salary for Mr. Berman and 125% for Mr. McGrath, although the Compensation Committee has the ability to increase the maximum in its discretion. During 2011, Messrs. Berman and McGrath were not entitled to a bonus based upon the target thresholds incorporated into their respective employment agreements. Commencing in 2012, the Compensation Committee is required to meet to establish criteria for earning the annual performance bonus (and with respect to Mr. Berman, any additional annual performance bonus) during the first quarter of the year.
The employment agreements as in effect on January 1, 2012 for Messrs. Berman, McGrath and Bennett contemplate that the Compensation Committee may grant discretionary bonuses in situations where, in its sole judgment, it believes they are warranted. The Compensation Committee approaches this aspect of the particular executive’s compensation package by looking at the other components of the executive’s aggregate compensation and then evaluating if any additional compensation is appropriate to meet our compensation goals. As part of this review, the Compensation Committee, with significant input from FWC, collects information about the total compensation packages in our peer group and various indicia of performance by the peer group such as sales, one-year sales growth, net income, one-year net income growth, market capitalization, size of companies, one- and three-year stockholder returns, etc. and then compares such data to our corresponding performance data. The Compensation Committee did not approve any discretionary bonuses for 2012.
Long-Term Compensation
Long-term compensation is an area of particular emphasis in our executive compensation program, because we believe that these incentives foster the long-term perspective necessary for our continued success. Again, this emphasis is in keeping with our compensation program objective of aligning a significant portion of each executive’s total compensation with our long-term performance and the interests of our shareholders.
Historically, our long-term compensation program has focused on the granting of stock options that vested over time. However, commencing in 2006 we began shifting the emphasis of this element of compensation and we currently favor the issuance of restricted stock awards. The Compensation Committee believes that the award of full-value shares that vest over time is consistent with our overall compensation philosophy and objectives as the value of the restricted stock varies based upon the performance of our common stock, thereby aligning the interests of our executives with our shareholders. The Compensation Committee has also determined that awards of restricted stock are anti-dilutive as compared to stock options inasmuch as it feels that less restricted shares have to be granted to match the compensation value of stock options.
Mr. Berman’s 2010 amended and restated employment provides for annual grants of $500,000 of restricted stock which vest in equal annual installments through January 1, 2017, which is one year following the life of the agreement, subject to meeting the 3% vesting condition, as defined in the agreement. (As described in greater detail below, pursuant to the 2012 amendment, commencing in 2013, this bonus will be changed to $3,500,000 of restricted stock to be earned based upon performance targets established by the Compensation Committee during the first quarter of each year.) Mr. McGrath’s amended employment agreement provides for annual grants of $75,000 of restricted stock which vests in equal installments over three years subject to meeting certain EPS milestones. The Company did not meet the vesting requirements contained in either employment agreement for 2012 so both of Messrs. Berman and McGrath forfeited their stock awards for 2012. As explained in greater detail below (see “
Employment Agreements and Termination of Employment Arrangements
”), Mr. Berman’s employment agreement also provides for an annual performance bonus. The specific criteria for determining such bonus is contained in the employment agreement for 2010 and 2011. Commencing in 2012, the criteria for earning such bonus are to be established by the Compensation Committee. This bonus, if earned, is payable partially in cash and partially in shares of restricted common stock. Mr. Berman’s agreement also provides for an additional annual performance bonus, payable solely in shares of restricted stock, which can be earned by Mr. Berman if the Company’s performance meets certain criteria to be established by the Compensation Committee during the first quarter of each year.
82
After a review of all of the factors discussed above, the Compensation Committee determined that, in keeping with our compensation objectives, Mr. Berman was not awarded a bonus for 2012.
Other Benefits and Perquisites
Our executive officers participate in the health and dental coverage, life insurance, paid vacation and holidays, 401(k) retirement savings plans and other programs that are generally available to all of the Company’s employees.
The provision of any additional perquisites to each of the named executive officers is subject to review by the Compensation Committee. Historically, these perquisites include payment of an automobile allowance and matching contributions to a 401(k) defined contribution plan. In 2012, the named executive officers were granted the following perquisite: automobile allowance. We value perquisites at their incremental cost to us in accordance with SEC regulations.
We believe that the benefits and perquisites we provide to our named executive officers are within competitive practice and customary for executives in key positions at comparable companies. Such benefits and perquisites serve our objective of offering competitive compensation that allows us to continue to attract, retain and motivate highly talented people to these critical positions, ultimately providing a substantial benefit to our shareholders.
Change of Control/Termination Agreements
We recognize that, as with any public company, it is possible that a change of control may take place in the future. We also recognize that the threat or occurrence of a change of control can result in significant distractions of key management personnel because of the uncertainties inherent in such a situation. We further believe that it is essential and in our best interest and the interests of our shareholders to retain the services of our key management personnel in the event of the threat or occurrence of a change of control and to ensure their continued dedication and efforts in such event without undue concern for their personal financial and employment security. In keeping with this belief and its objective of retaining and motivating highly talented individuals to fill key positions, which is consistent with our general compensation philosophy, the employment agreement for named chief executive officers contain provisions which guarantee specific payments and benefits upon a termination of employment without good reason following a change of control of the Company. In addition, the employment agreements also contain provisions providing for certain lump-sum payments in the event the executive is terminated without “cause” or if we materially breach the agreement leading the affected executive to terminate the agreement for good reason.
Additional details of the terms of the change of control agreements and termination provisions outlined above are provided below.
Impact of Accounting and Tax Treatments
Section 162(m) of the Internal Revenue Code (the “Code”) prohibits publicly held companies like us from deducting certain compensation to any one named executive officer in excess of $1,000,000 during the tax year. However, Section 162(m) provides that, to the extent that compensation is based on the attainment of performance goals set by the Compensation Committee pursuant to plans approved by the Company’s shareholders, the compensation is not included for purposes of arriving at the $1,000,000.
83
The Company, through the Compensation Committee, intends to attempt to qualify executive compensation as tax deductible to the extent feasible and where it believes it is in our best interests and in the best interests of our shareholders. However, the Compensation Committee does not intend to permit this arbitrary tax provision to distort the effective development and execution of our compensation program. Thus, the Compensation Committee is permitted to and will continue to exercise discretion in those instances in which mechanistic approaches necessary to satisfy tax law considerations could compromise the interests of our shareholders. In addition, because of the uncertainties associated with the application and interpretation of Section 162(m) and the regulations issued thereunder, there can be no assurance that compensation intended to satisfy the requirements for deductibility under Section 162(m) will in fact be
deductible.
Compensation Risk Management
As part of its annual review of our executive compensation program, the Compensation Committee reviews with management the design and operation of our incentive compensation arrangements for senior management, including executive officers, to determine if such programs might encourage inappropriate risk-taking that could have a material adverse effect on the Company. The Compensation Committee considered, among other things, the features of the Company’s compensation program that are designed to mitigate compensation-related risk, such as the performance objectives and target levels for incentive awards (which are based on overall Company performance), and its compensation recoupment policy. The Compensation Committee also considered our internal control structure which, among other things, limits the number of persons authorized to execute material agreements, requires approval of our board of directors for matters outside of the ordinary course and its whistle blower program. Based upon the above, the Compensation Committee concluded that any risks arising from the Company’s compensation plans, policies and practices are not reasonably likely to have a material adverse effect on the Company.
Impact of Shareholder Advisory Vote
At our 2012 annual meeting, our shareholders approved our current executive compensation with over 58% of all shares actually voting on the issue (over 46% of all outstanding shares whether or not voting) affirmatively giving their approval. Accordingly, we believe that this vote ratifies our executive compensation philosophy and policies, as currently adopted and implemented, and we intend to continue such philosophy and policies.
Compensation Committee Report
The compensation committee has reviewed and discussed with management the Compensation Discussion and Analysis (the “CD&A”) for the year ended December 31, 2012. In reliance on the reviews and discussions referred to above, the compensation committee recommended to the board, and the board has approved, that the CD&A be furnished in the annual report on Form 10-K for the year ended December 31, 2012.
|
By the Compensation Committee of the Board of Directors:
Robert E. Glick, Chairman
Michael G. Miller, Member
Leigh Anne Brodsky, Member
|
Summary Compensation Table
|
Name and
Principal
Position
|
Year
|
Salary
($)
|
Bonus
($)
|
Stock
Awards
($)
|
|
Option
Awards
($)
|
Non-Equity
Incentive Plan
Compensation
($)
|
Change in
Pension
Value and
Nonqualified
Deferred
Compensation
Earnings ($)
|
All Other
Compensation
($) (3)
|
Total
($)
|
|||||||||||||||||||
|
Stephen G. Berman
|
2012
|
1,165,000 | ― | ― | — | — | — | 30,500 | 1,195,500 | ||||||||||||||||||||
|
Chief Executive Officer,
|
2011
|
1,140,000 | ― | ― | — | — | — | 34,500 | 1,174,500 | ||||||||||||||||||||
|
President and Secretary
|
2010
|
1,115,000 | 1,413,000 | 1,863,900 | (1) | (2) | — | — | — | 18,000 | 4,409,900 | ||||||||||||||||||
|
John J. McGrath
|
2012
|
615,000 | — | — | 26,900 | 641,900 | |||||||||||||||||||||||
|
Chief Operating Officer
|
2011
|
539,973 | ― | ― | — | — | — | 29,400 | 569,373 | ||||||||||||||||||||
|
Joel M. Bennett
|
2012
|
435,000 | ― | — | — | — | — | 24,500 | 459,500 | ||||||||||||||||||||
|
Executive Vice
|
2011
|
420,000 | — | — | — | — | — | 34,000 | 454,000 | ||||||||||||||||||||
|
President and Chief Financial Officer
|
2010
|
420,000 | 100,000 | ― | — | — | — | 12,000 | 532,000 |
84
____________
|
(1)
|
Pursuant to the 2002 Plan, on January 1, 2010, 120,000 shares of restricted stock were granted to the Named Officer, all of which were scheduled to vest on January 1, 2011 if we met certain financial criteria. This criteria was met and Mr. Berman’s shares vested on such date.
|
|
(2)
|
Also includes 18,238 shares which vest in seven annual tranches (the first six equal to 14.5% of grant and the last equal to 13%) over six years; and 4,089 shares which vest in three equal tranches on December 31, 2011, 2012 and 2013.
|
|
(3)
|
Represents automobile allowances paid in the amount of $18,000 and $12,000 to each of Messrs. Berman and Mr. Bennett respectively, for 2010, 2011 and 2012 and $12,900 and $14,400 to Mr. McGrath for 2011 and 2012, respectively; amount also includes matching contributions made by us to the Named Officer’s 401(k) defined contribution plan in the amount of nil, $16,500 and $12,500, respectively, for Mr. Berman for 2010, 2011 and 2012, nil, $22,000 and $12,500, respectively, for Mr. Bennett for 2010, 2011 and 2012 and $16,500 and $12,500 to Mr. McGrath for 2011 and 2012, respectively. See “Employee Pension Plan.”
|
The following table sets forth certain information regarding all equity-based compensation awards outstanding as of December 31, 2012 by the Named Officers:
Outstanding Equity Awards At Fiscal Year-end
|
Option Awards
|
Stock Awards
|
|||||||||||||||||||||||||||||||||||
|
Name
|
|
Number of
Securities
Underlying
Unexercised
Options
Exercisable
(#)
|
|
|
Number of
Securities
Underlying
Unexercised
Options
Unexercisable
(#)
|
|
|
Equity
Incentive
Plan
Awards:
Number of
Securities
Underlying
Unexercised
Unearned
Options (#)
|
|
|
Option
Exercise
Price
($)
|
|
|
Option
Expiration
Date
|
|
|
Number
of
Shares or
Units of
Stock
that
Have
Not
Vested
(#)
|
|
|
Market
Value of
Shares or
Units of
Stock
that
Have
Not Vested
($) (1)
|
|
|
Equity
Incentive
Plan
Awards:
Number
of
Unearned
Shares,
Units or
Other
Rights
that
Have Not
Vested
(#)
|
|
|
Equity
Incentive
Plan
Awards:
Market
or Payout
Value of
Unearned
Shares,
Units or
Other
Rights
That
Have Not
Vested
($)
|
||||||||||
|
Stephen G. Berman
|
—
|
—
|
—
|
—
|
—
|
10,304
|
$
|
129,006
|
—
|
—
|
||||||||||||||||||||||||||
|
John J. McGrath
|
—
|
—
|
—
|
—
|
—
|
5,909
|
$
|
73,981
|
—
|
—
|
||||||||||||||||||||||||||
|
Joel M. Bennett
|
—
|
—
|
—
|
—
|
—
|
—
|
—
|
—
|
—
|
|||||||||||||||||||||||||||
|
(1)
|
The product of (x) $12.52 (the closing sale price of the common stock on December 31, 2012) multiplied by (y) the number of unvested restricted shares outstanding.
|
85
The following table sets forth certain information regarding amount realized upon the vesting and exercise of any equity-based compensation awards during 2012 by the Named Officers:
Options Exercises And Stock Vested
|
|
Option Awards
|
|
|
Stock Awards
|
|
|||||||||||
|
Name
|
|
Number of
Shares
Acquired on
Exercise (#)
|
|
|
Value
Realized on
Exercise
($)
|
|
|
Number of
Shares
Acquired on
Vesting (#)
|
|
|
Value
Realized on
Vesting ($)
(1)
|
|||||
|
Stephen G. Berman
|
—
|
—
|
—
|
—
|
||||||||||||
|
John J. McGrath
|
—
|
—
|
—
|
—
|
||||||||||||
|
Joel M. Bennett
|
—
|
—
|
—
|
—
|
||||||||||||
|
(1)
|
Represents the product of (x) the closing sale price of the common stock on the date of vesting multiplied by (y) the number of restricted shares vested.
|
Potential Payments upon Termination or Change in Control
The following tables describe potential payments and other benefits that would have been received by each Named Officer at, following or in connection with any termination, including, without limitation, resignation, severance, retirement or a constructive termination of such Named Officer, or a change in control of our Company or a change in such Named Officer’s responsibilities on December 31, 2012. The potential payments listed below assume that there is no earned but unpaid base salary at December 31, 2012.
Stephen G. Berman
|
|
|
Upon
Retirement
|
|
|
Quits For
“Good
Reason”
(2)
|
|
|
Upon
Death
|
|
|
Upon
“Disability”
(3)
|
|
|
Termination
Without
“Cause”
|
|
|
Termination
For “Cause”
(4)
|
|
|
Involuntary
Termination
In
Connection
with Change
of
Control(5)
|
|
|||||||
|
Base Salary
|
|
$
|
-
|
|
|
$
|
6,990,000
|
|
|
$
|
-
|
|
|
$
|
-
|
|
|
$
|
6,990,000
|
|
|
$
|
-
|
|
|
$
|
11,819,056
|
(6)
|
|
Restricted Stock -
Performance-Based
|
|
-
|
-
|
-
|
-
|
-
|
-
|
-
|
||||||||||||||||||||
|
Annual Cash Incentive
Award (1)
|
-
|
-
|
-
|
-
|
-
|
-
|
-
|
|||||||||||||||||||||
86
|
(1) Assumes that if the Named Officer is terminated on December 31, 2012, they were employed through the end of the incentive period.
|
|
|
(2) Defined as (i) our violation or failure to perform or satisfy any material covenant, condition or obligation required to be performed or satisfied by us, or (ii) the material change in the nature, titles or scope of the duties, obligations, rights or powers of the Named Officer’s employment resulting from any action or failure to act by us.
|
|
|
(3) Defined as a Named Officer’s inability to perform his duties by reason of any disability or incapacity (due to any physical or mental injury, illness or defect) for an aggregate of 180 days in any consecutive 12-month period.
|
|
|
(4) Defined as (i) the Named Officer’s conviction of, or entering a plea of guilty or nolo contendere (which plea is not withdrawn prior to its approval by the court) to, a felony offense and either the Named Officer’s failure to perfect an appeal of such conviction prior to the expiration of the maximum period of time within which, under applicable law or rules of court, such appeal may be perfected or, if he does perfect such an appeal, the sustaining of his conviction of a felony offense on appeal; or (ii) the determination by our Board of Directors, after due inquiry, based upon convincing evidence, that the Named Officer has:
|
|
(A) committed fraud against, or embezzled or misappropriated funds or other assets of, our Company (or any subsidiary);
|
|
|
(B) violated, or caused our Company (or any subsidiary) or any of our officers, employees or other agents, or any other individual or entity to violate, any material law, rule, regulation or ordinance, or any material written policy, rule or directive of our Company or our Board of Directors;
|
|
|
(C) willfully, or because of gross or persistent inaction, failed properly to perform his duties or acted in a manner detrimental to, or adverse to our interests; or
|
|
|
(D) violated, or failed to perform or satisfy any material covenant, condition or obligation required to be performed or satisfied by him under his employment agreement with us;
|
and that, in the case of any violation or failure referred to in clause (B), (C) or (D), above, such violation or failure has caused, or is reasonably likely to cause, us to suffer or incur a substantial casualty, loss, penalty, expense or other liability or cost.
87
|
(5) Section 280G of the Code disallows a company’s tax deduction for what are defined as “excess parachute payments” and Section 4999 of the Code imposes a 20% excise tax on any person who receives excess parachute payments. As discussed above, Mr. Berman is entitled to certain payments upon termination of his employment, including termination following a change in control of our Company. Under the terms of his employment agreement (see “ - Employment Agreements”), Mr. Berman is not entitled to any payments that would be an excess parachute payment, and such payments are to be reduced by the least amount necessary to avoid the excise tax. Accordingly, our tax deduction would not be disallowed under Section 280G of the Code, and no excise tax would be imposed under Section 4999 of the Code.
|
|
|
(6) Under the terms of Mr. Berman’s employment agreement (see “ - Employment Agreements”), if a change of control occurs and within two years thereafter Mr. Berman is terminated without “Cause” or quits for “Good Reason”, then he has the right to receive a payment equal to 2.99 times his then current base amount as defined in the Code (which was $3,939,685 in 2012).
|
John J. McGrath
|
|
|
Upon
Retirement
|
|
|
Quits For
“Good
Reason”
(2)
|
|
|
Upon
Death
|
|
|
Upon
“Disability”
(3)
|
|
|
Termination
Without
“Cause”
|
|
|
Termination
For “Cause”
(4)
|
|
|
Involuntary
Termination
In
Connection
with Change
of
Control(5)
|
|
|||||||
|
Base Salary
|
|
$
|
-
|
|
|
$
|
1,230,000
|
|
|
$
|
-
|
|
|
$
|
-
|
|
|
$
|
1,230,000
|
|
|
$
|
-
|
|
|
$
|
1,230,000
|
(6)
|
|
Restricted Stock - Performance-Based
|
|
-
|
-
|
-
|
-
|
-
|
-
|
-
|
||||||||||||||||||||
|
Annual Cash Incentive Award (1)
|
-
|
-
|
-
|
-
|
-
|
-
|
-
|
|||||||||||||||||||||
|
(1) Assumes that if the Named Officer is terminated on December 31, 2012, they were employed through the end of the incentive period.
|
|
|
(2) Defined as (i) our violation or failure to perform or satisfy any material covenant, condition or obligation required to be performed or satisfied by us, or (ii) the material change in the nature, titles or scope of the duties, obligations, rights or powers of the Named Officer’s employment resulting from any action or failure to act by us.
|
|
|
(3) Defined as a Named Officer’s inability to perform his duties by reason of any disability or incapacity (due to any physical or mental injury, illness or defect) for an aggregate of 180 days in any consecutive 12-month period.
|
|
|
(4) Defined as (i) the Named Officer’s conviction of, or entering a plea of guilty or nolo contendere (which plea is not withdrawn prior to its approval by the court) to, a felony offense and either the Named Officer’s failure to perfect an appeal of such conviction prior to the expiration of the maximum period of time within which, under applicable law or rules of court, such appeal may be perfected or, if he does perfect such an appeal, the sustaining of his conviction of a felony offense on appeal; or (ii) the determination by our Board of Directors, after due inquiry, based on convincing evidence, that the Named Officer has:
|
|
(A) committed fraud against, or embezzled or misappropriated funds or other assets of, our Company (or any subsidiary);
|
|
|
(B) violated, or caused our Company (or any subsidiary) or any of our officers, employees or other agents, or any other individual or entity to violate, any material law, rule, regulation or ordinance, or any material written policy, rule or directive of our Company or our Board of Directors;
|
|
|
(C) willfully, or because of gross or persistent inaction, failed properly to perform his duties or acted in a manner detrimental to, or adverse to our interests; or
|
|
|
(D) violated, or failed to perform or satisfy any material covenant, condition or obligation required to be performed or satisfied by him under his employment agreement with us;
|
and that, in the case of any violation or failure referred to in clause (B), (C) or (D), above, such violation or failure has caused, or is reasonably likely to cause, us to suffer or incur a substantial casualty, loss, penalty, expense or other liability or cost.
|
(5) Section 280G of the Code disallows a company’s tax deduction for what are defined as “excess parachute payments” and Section 4999 of the Code imposes a 20% excise tax on any person who receives excess parachute payments. As discussed above, Mr. McGrath is entitled to certain payments upon termination of his employment, including termination following a change in control of our Company. Under the terms of his employment agreement (see “ - Employment Agreements”), Mr. McGrath is not entitled to any payments that would be an excess parachute payment, and such payments are to be reduced by the least amount necessary to avoid the excise tax. Accordingly, our tax deduction would not be disallowed under Section 280G of the Code, and no excise tax would be imposed under Section 4999 of the Code.
|
|
|
(6) Under the terms of Mr. McGrath’s employment agreement (see “ - Employment Agreements”), if a change of control occurs and within two years thereafter Mr. McGrath is terminated without “Cause” or quits for “Good Reason”, then he has the right to receive a payment equal to the greater of two times his then current base salary or the payments due for the remainder of the term of his employment agreement.
|
Joel M. Bennett
|
|
|
Upon
Retirement
|
|
|
Quits For
“Good
Reason”
(2)
|
|
|
Upon
Death
|
|
|
Upon
“Disability”
(3)
|
|
|
Termination
Without
“Cause”
|
|
|
Termination
For “Cause”
(4)
|
|
|
Involuntary
Termination
In
Connection
with Change
of
Control(5)
|
|
|||||||
|
Base Salary
|
|
$
|
-
|
|
|
$
|
840,000
|
|
|
$
|
-
|
|
|
$
|
-
|
|
|
$
|
840,000
|
|
|
$
|
-
|
|
|
$
|
840,000
|
(6)
|
|
Restricted Stock -
Performance-Based
|
|
-
|
-
|
-
|
-
|
-
|
-
|
-
|
||||||||||||||||||||
|
Annual Cash Incentive
Award (1)
|
-
|
-
|
-
|
-
|
-
|
-
|
-
|
|||||||||||||||||||||
88
|
(1) Assumes that if the Named Officer is terminated on December 31, 2012, they were employed through the end of the incentive period.
|
|
|
(2) Defined as (i) our violation or failure to perform or satisfy any material covenant, condition or obligation required to be performed or satisfied by us, or (ii) the material change in the nature, titles or scope of the duties, obligations, rights or powers of the Named Officer’s employment resulting from any action or failure to act by us.
|
|
|
(3) Defined as a Named Officer’s inability to perform his duties by reason of any disability or incapacity (due to any physical or mental injury, illness or defect) for an aggregate of 180 days in any consecutive 12-month period.
|
|
|
(4) Defined as (i) the Named Officer’s conviction of, or entering a plea of guilty or nolo contendere (which plea is not withdrawn prior to its approval by the court) to, a felony offense and either the Named Officer’s failure to perfect an appeal of such conviction prior to the expiration of the maximum period of time within which, under applicable law or rules of court, such appeal may be perfected or, if he does perfect such an appeal, the sustaining of his conviction of a felony offense on appeal; or (ii) the determination by our Board of Directors, after due inquiry, based on convincing evidence, that the Named Officer has:
|
|
(A) committed fraud against, or embezzled or misappropriated funds or other assets of, our Company (or any subsidiary);
|
|
|
(B) violated, or caused our Company (or any subsidiary) or any of our officers, employees or other agents, or any other individual or entity to violate, any material law, rule, regulation or ordinance, or any material written policy, rule or directive of our Company or our Board of Directors;
|
|
|
(C) willfully, or because of gross or persistent inaction, failed properly to perform his duties or acted in a manner detrimental to, or adverse to our interests; or
|
|
|
(D) violated, or failed to perform or satisfy any material covenant, condition or obligation required to be performed or satisfied by him under his employment agreement with us;
|
and that, in the case of any violation or failure referred to in clause (B), (C) or (D), above, such violation or failure has caused, or is reasonably likely to cause, us to suffer or incur a substantial casualty, loss, penalty, expense or other liability or cost.
89
|
(5) Section 280G of the Code disallows a company’s tax deduction for what are defined as “excess parachute payments” and Section 4999 of the Code imposes a 20% excise tax on any person who receives excess parachute payments. As discussed above, Mr. Bennett is entitled to certain payments upon termination of his employment, including termination following a change in control of our Company. Under the terms of his employment agreement (see “ - Employment Agreements”), Mr. Bennett is not entitled to any payments that would be an excess parachute payment, and such payments are to be reduced by the least amount necessary to avoid the excise tax. Accordingly, our tax deduction would not be disallowed under Section 280G of the Code, and no excise tax would be imposed under Section 4999 of the Code.
|
|
|
(6) Under the terms of Mr. Bennett’s employment agreement (see “ - Employment Agreements”), if a change of control occurs and within two years thereafter Mr. Bennett is terminated without “Cause” or quits for “Good Reason”, then he has the right to receive a payment equal to the greater of two times his then current base salary or the payments due for the remainder of the term of his employment agreement.
|
Compensation of Directors
Analogous to our executive compensation philosophy, it is our desire to similarly compensate our non-employee directors for their services in a way that will serve to attract and retain highly qualified members. As changes in the securities laws require greater involvement by, and places additional burdens on, a company’s directors it becomes even more necessary to locate and retain highly qualified directors. As such, after consulting with FWC, the Compensation Committee developed and the Board approved a structure for the compensation package of our non-employee directors so that the total compensation package of our non-employee directors would be at approximately the median total compensation package for non-employee directors in our peer group.
In December 2009, our board of directors, after consulting with FWC, changed the compensation package for non-employee directors as of January 1, 2010 by (i) increasing the annual cash stipend to $75,000, (ii) eliminating meeting fees for attendance at both board and committee meetings, (iii) increasing the annual fees paid to committee chairs and the members of the audit committee, (iv) decreasing by $25,000 the value of the annual grant of restricted shares of our common stock to $100,000 and (v) imposing minimum share holding requirements. Specifically, the chair of the audit committee receives an annual fee of $30,000, each member of the audit committee receives a $15,000 annual fee (including the chair), the chair of the compensation committee and the nominating and governance committee each receives an annual fee of $15,000 and each member of such committees (including the chair) receives an annual fee of $10,000. Newly-elected non-employee directors will receive a portion of the foregoing annual consideration, pro rated according to the portion of the year in which they serve in such capacity.
In February 2010 our board determined the terms for the minimum share holding requirements. Pursuant to the new minimum share holding requirements, each director will be required to hold shares with a value equal to at least two times the average annual cash stipend paid to the director during the prior two calendar years. In determining the value of a director’s share holdings, each option, whether or not in the money, will count as ½ share. To illustrate: if a director wishes to sell shares in 2013, he will have to hold shares with a market value of at least $208,000 prior to and following any sale of shares calculated as of the date of the sale, such $208,000 minimum calculated by taking the average cash stipend of $104,000 paid during the prior two years ($110,000 in 2011 and $98,000 in 2012) multiplied by two.
90
The following table sets forth the compensation we paid to our non-employee directors for our fiscal year ended December 31, 2012:
Director Compensation
|
Name
|
Year
|
|
Fees
Earned
or Paid in
Cash
($)
|
|
Stock
Awards
($)
|
|
Option
Awards
($)
|
|
Non-Equity
Incentive
Plan
Compensation
($)
|
|
Change in
Pension Value
and
Nonqualified
Deferred
Compensation
Earnings
($)
|
|
All Other
Compensation
($)
|
|
Total
($)
|
||||||||||||||||
|
Dan Almagor
|
2012
|
147,500
|
98,234
|
(1)
|
—
|
—
|
—
|
—
|
245,734
|
||||||||||||||||||||||
|
Marvin W. Ellin
|
2012
|
107,500
|
98,234
|
(1)
|
—
|
—
|
—
|
—
|
205,734
|
||||||||||||||||||||||
|
Robert E. Glick
|
2012
|
115,000
|
98,234
|
(1)
|
—
|
—
|
—
|
—
|
213,234
|
||||||||||||||||||||||
|
Michael G. Miller
|
2012
|
110,000
|
98,234
|
(1)
|
—
|
—
|
—
|
—
|
208,234
|
||||||||||||||||||||||
|
Murray L. Skala
|
2012
|
75,000
|
98,234
|
(1)
|
—
|
—
|
—
|
—
|
173,234
|
||||||||||||||||||||||
|
Peter F. Reilly
|
2012
|
40,822
|
40,822
|
(2)
|
—
|
—
|
—
|
—
|
81,644
|
||||||||||||||||||||||
|
Leigh Anne Brodsky
|
2012
|
34,356
|
35,905
|
(3)
|
—
|
—
|
—
|
—
|
70,261
|
||||||||||||||||||||||
|
Rex H. Poulsen
|
(4)
|
2012
|
—
|
—
|
—
|
—
|
—
|
—
|
—
|
||||||||||||||||||||||
| (1) The value of the shares was determined by taking the product of (a) 6,962 shares of restricted stock multiplied by (b) $14.11, the last sales price of our common stock on December 30, 2012, as reported by Nasdaq, the date prior to the date the shares were granted, all of which shares vested on January 1, 2013. | |
| (2) The value of the shares was determined by taking the product of (a) 2,334 shares of restricted stock multiplied by (b) $17.49, the last sales price of our common stock on April 20, 2012, as reported by Nasdaq, the date prior to the date the shares were granted, all of which shares vested on January 1, 2013. | |
| (3) The value of the shares was determined by taking the product of (a) 1,918 shares of restricted stock multiplied by (b) $18.72, the last sales price of our common stock on May 7, 2012, as reported by Nasdaq, the date prior to the date the shares were granted, all of which shares vested on January 1, 2013. | |
| (4) Mr. Poulsen was appointed on December 26, 2012 and did not receive any compensation in 2012. |
Employment Agreements and Termination of Employment Arrangements
In March 2003 we amended and restated our employment agreement with Mr. Berman and we entered into a new amended and restated agreement with Mr. Berman on November 11, 2010. On July 17, 2007 we entered into a new employment agreement with Joel Bennett which expired on December 31, 2009 and we entered into a new employment agreement with Mr. Bennett on October 31, 2011. We entered into an emended employment agreement with Mr. McGrath on August 23, 2011 when he became our Chief Operating Officer.
Mr. Berman’s amended and restated 2003 employment agreement, which was effective until November 11, 2010, at which time it was superseded by his second amended and restated employment agreement, pursuant to which he served as our Co-Chief Executive Officer, President and Chief Operating Officer through March 31, 2010 when he became the sole Chief Executive Officer, provided for an annual base salary in 2010 of $1,150,000. Mr. Berman’s 2003 agreement was set to expire on December 31, 2010. His base salary under the 2003 agreement was subject to annual increases determined by our Board of Directors, but in an amount not less than $25,000 per annum. For each fiscal year between 2007 through 2010, Mr. Berman’s bonus depended on our achieving certain earnings per share growth targets, with such earnings per share growth targets to be determined annually by the Compensation Committee of our Board of Directors. Depending on the levels of earnings per share growth that we achieve in each fiscal year, Mr. Berman would receive an annual bonus of from 0% to up to 200% of his base salary. This bonus was paid in accordance with the terms and conditions of our 2002 Stock Award and Incentive Plan. In addition, in consideration for modifying and replacing the pre-tax income formula provided in his prior employment agreement for determining his annual bonus, and for entering into the amended employment agreement, Mr. Berman was granted the right to be issued an aggregate of 1,080,000 shares of restricted stock. The first tranche of restricted stock, totaling 240,000 shares, was granted at the time the agreement became effective in 2003, and 120,000 shares were granted on each of January 1, 2004, 2005, 2006 and 2007 (or 480,000 shares in the aggregate). In each subsequent year of the employment agreement term, Mr. Berman received 120,000 shares of restricted stock. The grant of these shares was in accordance with our 2002 Stock Award and Incentive Plan, and the vesting of each tranche of restricted stock was subject to our achieving pre-tax income in excess of $2,000,000 in the fiscal year that the grant is made. Each tranche of restricted stock granted from January 1, 2004 through January 1, 2008 was subject to a two-year vesting period, which may be accelerated to one year if we achieved certain earnings per share growth targets. Each tranche of restricted stock to be granted thereafter through January 1, 2010, was subject to a one-year vesting period.
On November 11, 2010 we entered into a second amended and restated employment agreement with Stephen Berman, our President, Chief Executive Officer and Chief Operating Officer. This agreement extended the term of the 2003 agreement to December 31, 2015 from its current termination date of December 31, 2010. The new amended and restated agreement also provides, among other things, new provisions for (i) an annual salary of $1,140,000 in 2011 and annual increases thereafter at the discretion of the Board but no less than $25,000; (ii) an annual restricted stock award of $500,000 of our common stock commencing January 1, 2011, subject to vesting in equal installments through January 1, 2017, except that the vesting of each annual $500,000 award is conditioned on EPS (defined as our net income per share of our common stock, calculated on a fully diluted basis) for the fiscal year in which the shares are issued being equal to minimum EPS as follows: $1.41 for 2011, $1.45 for 2012, $1.49 for 2013, $1.54 for 2014, and $1.59 for 2015. If the minimum EPS vesting condition for the first tranche is not met, then the $500,000 grant lapses, but if the vesting condition is satisfied for the first tranche of the $500,000 grant, then each subsequent tranche of the $500,000 grant will vest; (iii) an annual performance bonus as follows: (x) 2010 bonus (previously established in March 2010) remains unchanged except that 20% of the bonus will be paid in restricted stock which will vest in six equal annual installments of 14.5% of the number of shares, the first on the date in 2011 that the bonus is determined to have been earned, and a seventh and final installment of 13% of the shares on January 1, 2017, and (y) for years commencing January 1, 2011, an amount equal to up to 200% of base salary, to be paid in stock and cash (20-40% in stock, in the percentages set forth on Exhibit E to the agreement), bonus criteria using “Adjusted” EPS growth (as defined in the agreement) to be determined by our Compensation Committee in the first quarter of each fiscal year, except that Adjusted EPS criteria (but not vesting) for 2011 shall range from $1.37 - $1.78 as stated in Exhibit D to the agreement, and shares will vest in equal annual installments commencing with the date the Bonus for a fiscal year is determined to have been earned and thereafter on January 1 in each subsequent year until the final installment on January 1, 2017, and (z) an additional bonus equal to 100% of base salary to be paid entirely in restricted stock; the criteria and vesting schedules to be determined by our Compensation Committee in the first fiscal quarter of each year, using criteria to be selected by such Committee which are in its discretion such as grown in net sales, return on invested capital, growth in free cash flow, total shareholder return (or any combination); (iv) restrictions on sale of our securities such that he cannot sell any shares of our common stock if his shares remaining after a sale are not equal to at least three times his then base salary; (v) life insurance in the amount of $1.5 million; (vi) severance if we terminate the agreement without cause (as defined in the agreement) or Mr. Berman terminates it for Good Reason (as defined in the agreement), in an amount equal to the base salary at termination date multiplied by the number of years and partial years remaining in the term; and (vii) restrictive covenants, change of control provisions and our ownership of certain intellectual property.
91
On October 19, 2011, we clarified our employment agreement with Mr. Berman. The clarification corrects and clarifies certain cross references relating to Mr. Berman’s entitlement to severance upon a qualifying termination following a change of control (as defined in his employment agreement). It also clarifies that a material change in the nature and/or scope of the duties, obligations, rights or powers of his employment under the agreement would be deemed to include his ceasing to be the Chief Executive Officer and President of a publicly traded company (one of the standards for determining whether Mr. Berman has “good reason” to terminate his employment under his employment agreement), and further provides that Mr. Berman's post-change of control severance benefits shall be payable upon a qualifying termination of employment within a two year period following a change of control (the agreement originally provided for a one year period).
On September 21, 2012, in connection with our entry into agreements dated September 10, 2012 with NantWorks LLC to form DreamPlay Toys LLC and DreamPlay LLC, all Delaware limited liability companies, we entered into Amendment Number One to Mr. Berman’s Second Amended and Restated Employment Agreement dated November 11, 2012 (as previously modified by the October 20, 2011 letter amendment); DreamPlay Toys LLC will develop, market and sell toys and consumer products incorporating NantWorks’ proprietary iD (iDream) image recognition technology and DreamPlay LLC’s business is the extension of such image recognition technology to non-toy consumer products and applications.
The following description modifies and supersedes, to the extent inconsistent with, the disclosure in the preceding paragraphs. The term of Mr. Berman’s employment agreement has been extended to December 31, 2018 and provides (i) that commencing on January 1, 2013 the amount of the annual restricted stock award shall increase to up to $3.5M, with the vesting of each annual grant to be determined by the Compensation Committee based upon performance criteria it establishes during the first quarter of the year of grant; (ii) commencing with 2013 Mr. Berman can earn an annual performance bonus described below. Part of the annual performance bonus in an amount not exceeding 300% of that year’s base salary can be earned based upon financial and non-financial factors determined annually by the Compensation Committee during the first quarter of each year. The other part of the additional annual performance bonus can be earned in an amount equal to one-half of the cash distributions we receive from DreamPlay LLC, subject to satisfaction of the following three conditions: (1) we have positive net income after deducting the aggregate annual performance bonus, (2) the aggregate annual performance bonus cannot exceed 2.9% of our net income for such year except that if our net income exceeds $385,000 for the year the percentage limitation shall be reduced to 1% and if our net income for the year exceeds $770,000 the percentage limitation is reduced to 0.5% and (3) we have received an aggregate of at least $15 million of net income from DreamPlay Toys LLC and DreamPlay LLC. The amendment also provides (i) that the portion of the annual performance bonus up to amount equal to 200% of that year’s base salary shall be paid in cash, and any excess over 200% of such base salary shall be paid in shares of restricted stock vesting in equal quarterly installments with the initial installment vesting upon grant and the balance over three years following the award date; (ii) for a life insurance policy of $5 million or such lesser amount we can obtain for an annual premium of up to $10,000; (iii) for the reimbursement of legal fees in negotiating this amendment of up to $25,000, (iv) that the full amount of the payments and benefits payable in the event of a Change in Control (as defined in the employment agreement) shall be paid, even if it triggers an excise tax imposed by the tax code if the net after-tax amount would still be greater than reducing the total payments and benefits to avoid such excise tax, and (vi) the term “Good Reason Event” has been expanded to include a change in the composition of our board of directors where the majority of the directors were not in office on September 15, 2012.
On August 23, 2011 we entered into an amended employment agreement with John J. (Jack) McGrath whereby he became our Chief Operating Officer. The amended employment agreement, which runs through December 31, 2013, provides for an annual salary of $600,000; an annual increase over the prior year’s base salary of at least $15,000; an annual award of $75,000 of restricted stock, subject to vesting in equal installments over three years, provided, however, that the initial vesting of the first installment of each year’s award is conditioned on “Adjusted” EPS (as defined in the amended agreement) for the fiscal year in which the shares are issued being equal to minimum “Adjusted” EPS as follows: 2011 vesting condition: greater of $1.41 or 3% higher than 2010 “Adjusted” EPS; 2012 vesting: greater of $1.45 or 3% higher than 2011“Adjusted” EPS; and 2013 vesting condition: greater of $1.49 or 3% higher than “Adjusted” 2012 EPS. The amended agreement also provides for an annual bonus opportunity of up to 125% of salary payable 50% in cash and 50% in restricted stock (with a four year vesting) based upon “Adjusted” EPS growth. Bonus targets for 2011 range from $1.37 -$1.78. The bonus targets for 2012 and 2013 will be set by the Compensation Committee.
92
On July 17, 2007, we entered into a new employment agreement with Mr. Bennett that expired on December 31, 2009, pursuant to which he received (i) a base salary of $400,000 per year; (ii) an annual discretionary bonus of up to 50% of his annual base salary, determined by the Compensation Committee or the Board of Directors; (iii) a $1,000 per month car allowance; and (iv) a one-time grant of 15,000 shares of restricted stock, vesting over three years in equal annual installments of 5,000 shares on December 31, 2007, 2008 and 2009, provided he remains employed by us on each vesting date. Mr. Bennett has been working since January 1, 2010 without a contract. Mr. Bennett’s salary for 2010, as determined by our compensation committee was $420,000. In February 2011, our board of directors awarded Mr. Bennett a $100,000 cash bonus for his performance in 2010.
On October 21, 2011, we entered into an employment agreement with Joel M. Bennett, the Company’s Executive Vice President and Chief Financial Officer, with a term ending on December 31, 2013. Pursuant to the new agreement, Mr. Bennett is entitled to an annual base salary of $420,000, to be increased annually by at least $15,000 over the prior year’s base salary, and will be eligible at the discretion of the Compensation Committee to receive bonuses or other compensation in the form of cash or equity-based awards upon the achievement of performance goals determined by the Board or the Compensation Committee. In the event of Mr. Bennett’s termination of employment by the Company without “cause” or by Mr. Bennett for “good reason,” in each case other than within two years following a “change in control” (each as defined in the agreement), Mr. Bennett would be entitled to receive, in addition to accrued benefits, cash severance equal to the amount of base salary payable for the remainder of his term and continuation of his medical, hospitalization and dental insurance through the remainder of his term. In the event of Mr. Bennett’s termination of employment by the Company without “cause” or by Mr. Bennett for “good reason” within two years following a “change of control,” Mr. Bennett would be entitled to receive, in addition to accrued benefits, severance equal to the higher of two times his annual base salary and his base salary payable for the remainder of his term.
The foregoing is only a summary of the material terms of our employment agreements with the Named Officers. For a complete description, copies of such agreements are annexed herein in their entirety as exhibits or are otherwise incorporated herein by reference.
On October 19, 2011, our Board of Directors approved the material terms of and adoption of our Company’s Change in Control Severance Plan (the “Severance Plan”), which applies to certain of our key employees. None of our named executive officers participate in the Severance Plan. The Severance Plan provides that if, within the two year period immediately following the “change in control” date (as defined in the Severance Plan), a participant has a qualifying termination of employment, the participant will be entitled to severance equal to a multiple of monthly base salary, which multiple is the greater of (i) the number of months remaining in the participant’s term of employment under his or her employment agreement and (ii) a number ranging between 12 and 18; accelerated vesting of all unvested equity awards; and continued health care coverage for the number of months equal to the multiple used to determine the severance payment
.
Employee Benefits Plan
We sponsor for our U.S. employees (including the Named Officers), a defined contribution plan under Section 401(k) of the Internal Revenue Code. The Plan provided that employees may defer up to 50% of their annual compensation subject to annual dollar limitations, and that we will make a matching contribution equal to 100% of each employee’s deferral, up to 5% of the employee’s annual compensation.
T
he Company suspended its matching
contribution effective January 1, 2010 and restarted the matching contribution effective January 1, 2011. Company matching contributions, which vest
immediately, totaled nil, $2.1 million, and $2.7 million for 2010, 2011 and 2012, respectively.
Compensation Committee Interlocks and Insider Participation
None of our executive officers has served as a director or member of a compensation committee (or other board committee performing equivalent functions) of any other entity, one of whose executive officers served as a director or a member of our Compensation Committee.
93
The following table sets forth certain information as of March 15, 2013 with respect to the beneficial ownership of our common stock by (1) each person known by us to own beneficially more than 5% of the outstanding shares of our common stock, (2) each of our directors, (3) each Named Officer, and (4) all our directors and executive officers as a group.
|
Name and Address of
Beneficial Owner(1)(2)
|
|
Amount and
Nature of
Beneficial
Ownership
(s)(3)
|
|
|
Percent of
Outstanding
Shares(4)
|
|||
|
Black Rock, Inc.
|
1,673,664
|
(5)
|
7.5
|
|||||
|
Dimensional Fund Advisors LP
|
1,851,703
|
(6)
|
8.3
|
|||||
|
Third Avenue Management LLC
|
1,467,149
|
(7)
|
6.6
|
|||||
|
Pzena Investment Management, LLC
|
1,334,965
|
(8)
|
6.0
|
|||||
|
FMR LLC
|
2,595,599
|
(9)
|
11.6
|
|||||
|
The Vanguard Group, Inc.
|
1,252,276
|
(10)
|
5.6
|
|||||
|
Franklin Resources, Inc.
|
1,611,060
|
(11)
|
7.2
|
|||||
|
Dr. Patrick Soon-Shiong
|
1,975,782
|
(12)
|
8.9
|
|||||
|
Stephen G. Berman
|
421,582
|
(13)
|
1.9
|
|||||
|
John J. McGrath
|
21,215
|
(14)
|
*
|
|||||
|
Joel M. Bennett
|
37,866
|
|
*
|
|||||
|
Marvin W. Ellin
|
21,589
|
(15)
|
*
|
|||||
|
Robert E. Glick
|
75,198
|
(16)
|
*
|
|||||
|
Michael G. Miller
|
75,198
|
(17)
|
*
|
|||||
|
Murray L. Skala
|
75,198
|
(18)
|
*
|
|||||
|
Peter F. Reilly
|
10,248
|
(19)
|
*
|
|||||
|
Leigh Anne Brodsky
|
9,832
|
(20)
|
*
|
|||||
|
Rex H. Poulsen
|
6,743
|
(21)
|
*
|
|||||
|
All directors and executive officers as a group (10 persons)
|
754,669
|
(22)
|
3.4
|
%
|
||||
______________
|
*
|
Less than 1% of our outstanding shares.
|
|
(1)
|
Unless otherwise indicated, such person’s address is c/o JAKKS Pacific, Inc., 22619 Pacific Coast Highway, Malibu, California 90265.
|
|
(2)
|
The number of shares of common stock beneficially owned by each person or entity is determined under the rules promulgated by the Securities and Exchange Commission. Under such rules, beneficial ownership includes any shares as to which the person or entity has sole or shared voting power or investment power. The percentage of our outstanding shares is calculated by including among the shares owned by such person any shares which such person or entity has the right to acquire within 60 days after March 4, 2013. The inclusion herein of any shares deemed beneficially owned does not constitute an admission of beneficial ownership of such shares.
|
|
(3)
|
Except as otherwise indicated, exercises sole voting power and sole investment power with respect to such shares.
|
|
(4)
|
Does not include any shares of common stock issuable upon the conversion of $100.0 million of our 4.50% convertible senior notes due 2014, initially convertible at the rate of 63.2091 shares of common stock per $1,000 principal amount at issuance of the notes (but subject to adjustment under certain circumstances as described in the notes).
|
|
(5)
|
The address of BlackRock, Inc. is 40 East 52
nd
Street, New York, NY 10022. All the information presented in this Item with respect to this beneficial owner was extracted solely from the Schedule 13G/A filed on February 8, 2013.
|
|
(6)
|
The address of Dimensional Fund Advisors LP (formerly known as Dimensional Fund Advisors, Inc.) is Palisades West, Building One, 6300 Bee Cove Road, Austin, TX 78746. Possesses sole voting power over 1,825,267 shares. All the information presented in this Item with respect to this beneficial owner was extracted solely from the Schedule 13G/A filed on February 11, 2013..
|
|
(7)
|
The address of Third Avenue Management, LLC is 622 Third Avenue, 32
rd
Floor, New York, NY 10017. All the information presented in this Item with respect to this beneficial owner was extracted solely from the Schedule 13G filed on February 14, 2013..
|
94
|
(8)
|
The address of Pzena Investments Management, LLC is 120 W 45
th
Street, 20
th
Floor, New York, NY 10036. Possesses sole voting power with respect to only 1,185,090 of such shares. All the information presented in this Item with respect to this beneficial owner was extracted solely from the Schedule 13G filed on February 7, 2013.
|
|
(9)
|
The address of FMR LLC is 82 Devonshire Street, Boston, MA 02109. Possesses sole voting power with respect to only 475,599 of such shares. All the information presented in this Item with respect to this beneficial owner was extracted solely from the Schedule 13G filed on February 14, 2013.
|
|
(10)
|
The address of The Vanguard Group, Inc. is 100 Vanguard Blvd., Malvern, PA 19355. Possesses sole voting power with respect to 33,738 of such shares, sole dispositive power to 1,219,638 shares and shared dispositive power with respect to 32,638 of such shares. All the information presented in this Item with respect to this beneficial owner was extracted solely from the Schedule 13G filed on February 11, 2013.
|
|
(11)
|
The address of Franklin Resources, Inc. is One Franklin Parkway, San Mateo, CA 94403. Sole voting and dispositive power is held by Franklin Templeton Investments Corp. All the information presented in this Item with respect to this beneficial owner was extracted solely from the Schedule 13G filed on February 5, 2013.
|
|
(12)
|
The address of Dr. Patrick Soon-Shiong is 10182 Culver Blvd., Culver City, CA 90232. All of the shares are owned jointly with California Capital Z, LLC. All the information presented in this Item with respect to this beneficial owner was extracted solely from the Schedule 13D filed on October 15, 2012.
|
|
(13)
|
Includes 279,553 shares of common stock issued on January 1, 2013 pursuant to the terms of Mr. Berman’s January 1, 2003 Employment Agreement (as last amended on September 21, 2012), which shares are further subject to the terms of our January 1, 2013 Restricted Stock Award Agreement with Mr. Berman (the “Berman Agreement”). The Berman Agreement provides that Mr. Berman will forfeit his rights to all 279,553 shares unless certain conditions precedent are met prior to January 1, 2043, as described in the Berman Agreement, whereupon the forfeited shares will become authorized but unissued shares of our common stock. Also includes 18,238 shares granted on February 11, 2011 representing the stock component of his 2010 performance bonus which vest in seven tranches over six years, with each of the first six tranches equal to 14.5% of the total grant, and a seventh tranche equal to 13% of the total grant. The initial tranche vested on February 11, 2011 with each succeeding tranche vesting on January 1 of each year commencing with January 1, 2012 with the final tranche vesting on January 1, 2017. Also includes 2,726 shares remaining of the 4,089 shares granted on February 11, 2011 for his 2010 discretionary bonus, which shares
vest on December 31, 2013.
|
|
(14)
|
Includes 5,990 shares of common stock issued on January 1, 2013 pursuant to the terms of Mr. McGrath’s March 4, 2010 Employment Agreement (as amended on August 23, 2011), which shares are further subject to the terms of our January 1, 2032 Restricted Stock Award Agreement with Mr. McGrath (the “McGrath Agreement”). The McGrath Agreement provides that Mr. McGrath will forfeit his rights to all 5,990 shares unless certain conditions precedent are met prior to January 1, 2014, as described in the McGrath Agreement, whereupon the forfeited shares will become authorized but unissued shares of our common stock. Also includes 11,192 shares of common stock issued pursuant to our 2002 Stock Award and Incentive Plan, pursuant to which 5,909 of such shares may not be sold, mortgaged, transferred or otherwise encumbered prior to December 31, 2013.
|
|
(15)
|
Consists of 21,589 shares of common stock issued pursuant to our 2002 Stock Award and Incentive Plan, pursuant to which 7,914 of such shares may not be sold, mortgaged, transferred or otherwise encumbered prior to January 1, 2014.
|
|
(16)
|
Includes 22,500 shares which Mr. Glick may purchase upon the exercise of certain stock options and 52,698 shares of Common Stock issued pursuant to our 2002 Stock Award and Incentive Plan, pursuant to which 7,914 of such shares may not be sold, mortgaged, transferred or otherwise encumbered prior to January 1, 2014.
|
|
(17)
|
Includes 22,500 shares which Mr. Miller may purchase upon the exercise of certain stock options and 52,698 shares of Common Stock issued pursuant to our 2002 Stock Award and Incentive Plan, pursuant to which 7,914 of such shares may not be sold, mortgaged, transferred or otherwise encumbered prior to January 1, 2014.
|
|
(18)
|
Includes 22,500 shares which Mr. Skala may purchase upon the exercise of certain stock options and 52,698 shares of Common Stock issued pursuant to our 2002 Stock Award and Incentive Plan, pursuant to which 7,914 of such shares may not be sold, mortgaged, transferred or otherwise encumbered prior to January 1, 2014.
|
|
(19)
|
Consists of 10,248 shares of common stock issued pursuant to our 2002 Stock Award and Incentive Plan, pursuant to which 7,914 of such shares may not be sold, mortgaged, transferred or otherwise encumbered prior to January 1, 2014.
|
|
(20)
|
Consists of 9,832 shares of common stock issued pursuant to our 2002 Stock Award and Incentive Plan, pursuant to which 7,914 of such shares may not be sold, mortgaged, transferred or otherwise encumbered prior to January 1, 2014.
|
|
(21)
|
Consists of 6,743 shares of common stock issued pursuant to our 2002 Stock Award and Incentive Plan, pursuant to which 6,743 of such shares may not be sold, mortgaged, transferred or otherwise encumbered prior to January 1, 2014.
|
|
(22)
|
Includes an aggregate of 67,500 shares which the directors and executive officers may purchase upon the exercise of certain stock options.
|
95
|
(a)
|
Transactions with Related Persons
|
One of our directors, Murray L. Skala, is a partner in the law firm of Feder Kaszovitz LLP, which has performed, and is expected to continue to perform, legal services for us. In 2012, we incurred approximately $2.9 million for legal fees and reimbursable expenses payable to that firm. As of December 31, 2011 and 2012, legal fees and reimbursable expenses of $0.8 million and $0.5 million, respectively, were payable to this law firm.
|
(b)
|
Review, Approval or Ratification of Transactions with Related Persons
|
Pursuant to our Ethical Code of Conduct (a copy of which may be found on our website, www.jakks.com), all of our employees are required to disclose to our General Counsel, the Board of directors or any committee established by the Board of Directors to receive such information, any material transaction or relationship that reasonably could be expected to give rise to actual or apparent conflicts of interest between any of them, personally, and us. In addition, our Ethical Code of Conduct also directs all employees to avoid any self-interested transactions without full disclosure. This policy, which applies to all of our employees, is reiterated in our Employee Handbook which states that a violation of this policy could be grounds for termination. In approving or rejecting a proposed transaction, our General Counsel, Board of Directors or designated committee will consider the facts and circumstances available and deemed relevant, including but not limited to, the risks, costs, and benefits to us, the terms of the transactions, the availability of other sources for comparable services or products, and, if applicable, the impact on director independence. Upon concluding their review, they will only approve those agreements that, in light of known circumstances, are in or are not inconsistent with, our best interests, as they determine in good faith.
|
(c)
|
Director Independence
|
For a description of our Board of Directors and its compliance with the independence requirements therefore as promulgated by the Securities and Exchange Commission and Nasdaq, see “Item 10- Directors, Executive Officers and Corporate Governance”.
Before our principal accountant is engaged by us to render audit or non-audit services, where required by the rules and regulations promulgated by the Securities and Exchange Commission and/or Nasdaq, such engagement is approved by the Audit Committee.
The following are the fees of BDO USA, LLP, our principal accountant, for the two years ended December 31, 2012, for services rendered in connection with the audit for those respective years (all of which have been pre-approved by the Audit Committee):
|
|
2011
|
2012
|
||||||
|
Audit Fees
|
$
|
1,282,563
|
$
|
1,068,975
|
||||
|
Audit Related Fees
|
$
|
22,513
|
$
|
29,284
|
||||
|
Tax Fees
|
$
|
—
|
$
|
—
|
||||
|
All Other Fees
|
$
|
—
|
$
|
—
|
||||
|
$
|
1,305,076
|
$
|
1,098,259
|
|||||
96
Audit Fees
consist of the aggregate fees for professional services rendered for the audit of our annual financial statements and the reviews of the financial statements included in our Forms 10-Q and for any other services that were normally provided by our auditors in connection with our statutory and regulatory filings or engagements.
Audit Related Fees
consist of the aggregate fees billed for professional services rendered for assurance and related services that were reasonably related to the performance of the audit or review of our financial statements and were not otherwise included in Audit Fees. These fees primarily relate to statutory audit requirements and audits of employee benefit plans.
Tax Fees
consist of the aggregate fees billed for professional services rendered for tax consulting. Included in such Tax Fees were fees for consultancy, review, and advice related to our income tax provision and the appropriate presentation on our financial statements of the income tax related accounts.
All Other Fees
consist of the aggregate fees billed for products and services provided by our auditors and not otherwise included in Audit Fees, Audit Related Fees or Tax Fees.
Our Audit Committee has considered whether the provision of the non-audit services described above is compatible with maintaining our auditors’ independence and determined that such services are appropriate.
97
The following documents are filed as part of this Annual Report on Form 10-K:
|
(1)
|
Financial Statements (included in Item 8):
|
|
●
|
Reports of Independent Registered Public Accounting Firm
|
|
●
|
Consolidated Balance Sheets as of December 31, 2011 and 2012
|
|
●
|
Consolidated Statements of Operations for the years ended December 31, 2010, 2011 and 2012
|
|
●
|
Consolidated Statements of Other Comprehensive Income (Loss) for the years ended December 31, 2010, 2011 and 2012
|
|
●
|
Consolidated Statements of Stockholders’ Equity for the years ended December 31, 2010, 2011 and 2012
|
|
●
|
Consolidated Statements of Cash Flows for the years ended December 31, 2010, 2011 and 2012
|
|
●
|
Notes to Consolidated Financial Statements
|
|
(2)
|
Financial Statement Schedules (included in Item 8):
|
|
●
|
Schedule II — Valuation and Qualifying Accounts
|
|
(3)
|
Exhibits:
|
|
Exhibit
Number
|
Description
|
|
|
3.1
|
Amended and Restated Certificate of Incorporation of the Company (1)
|
|
|
3.2
|
Amended and Restated By-Laws of the Company (2)
|
|
|
4.1
|
Rights Agreement dated as of March 5, 2012 between the Company and Computershare Trust Company, N.A., as Rights Agent (3)
|
|
|
10.1.1
|
Third Amended and Restated 1995 Stock Option Plan (4)
|
|
|
10.1.2
|
1999 Amendment to Third Amended and Restated 1995 Stock Option Plan (5)
|
|
|
10.1.3
|
2000 Amendment to Third Amended and Restated 1995 Stock Option Plan (6)
|
|
|
10.1.4
|
2001 Amendment to Third Amended and Restated 1995 Stock Option Plan (7)
|
|
|
10.2
|
2002 Stock Award and Incentive Plan (8)
|
|
|
10.2.1
|
2008 Amendment to 2002 Stock Award and Incentive Plan (9)
|
|
|
10.3
|
Amended and Restated Employment Agreement between the Company and Jack Friedman, dated as of March 26, 2003 (10)
|
|
|
10.4
|
Amended and Restated Employment Agreement between the Company and Stephen G. Berman dated as of March 26, 2003 (10)
|
|
|
10.4.1
|
Second Amended and Restated Employment Agreement between the Company and Stephen G. Berman dated as of November 11, 2010 (11)
|
|
|
10.4.2
|
Clarification Letter dated October 20, 2011 with respect to Mr. Berman’s Second Amended and Restated employment agreement (12)
|
|
|
10.4.3
|
Amendment Number One to Mr. Berman’s Second Amended and Restated Employment Agreement dated September 21, 2012 (13)
|
|
|
10.5
|
Office Lease dated November 18, 1999 between the Company and Winco Maliview Partners (14)
|
|
|
10.6
|
Form of Restricted Stock Agreement (10)
|
|
|
10.7
|
Employment Agreement between the Company and Joel M. Bennett, dated October 21, 2011 (2)
|
|
|
10.9
|
Employment Agreement between the Company and John a/k/a Jack McGrath, dated March 4, 2010 (15)
|
|
|
10.9.1
|
First Amendment to Employment Agreement between the Company and John a/k/a Jack McGrath, dated August 23, 2011 (15)
|
|
|
14
|
Code of Ethics (16)
|
|
|
21
|
Subsidiaries of the Company (*)
|
|
|
31.1
|
Rule 13a-14(a)/15d-14(a) Certification of Stephen G. Berman (*)
|
|
|
31.2
|
Rule 13a-14(a)/15d-14(a) Certification of Joel Bennett (*)
|
|
|
32.1
|
Section 1350 Certification of Stephen G. Berman (*)
|
|
|
32.2
|
Section 1350 Certification of Joel Bennett (*)
|
98
|
(1)
|
Filed previously as Appendix 2 to the Company’s Schedule 14A Proxy Statement, filed August 23, 2002, and incorporated herein by reference.
|
|
(2)
|
Filed previously as an exhibit to the Company’s Current Report on Form 8-K filed October 21, 2011, and incorporated herein by reference.
|
|
(3)
|
Filed previously as an exhibit to the Company’s Current Report on Form 8-K filed March 5, 2012, and incorporated herein by reference..
|
|
(4)
|
Filed previously as Appendix A to the Company’s Schedule 14A Proxy Statement, filed June 23, 1998, and incorporated herein by reference
|
|
(5)
|
Filed previously as an exhibit to the Company’s Registration Statement on Form S-8 (Reg. No. 333-90055), filed November 1, 1999, and incorporated herein by reference.
|
|
(6)
|
Filed previously as an exhibit to the Company’s Registration Statement on Form S-8 (Reg. No. 333-40392), filed June 29, 2000, and incorporated herein by reference.
|
|
(7)
|
Filed previously as Appendix B to the Company’s Schedule 14A Proxy Statement, filed June 11, 2001, and incorporated herein by reference.
|
|
(8)
|
Filed previously as an exhibit to the Company’s Registration Statement on Form S-8 (Reg. No. 333-101665), filed December 5, 2002, and incorporated herein by reference.
|
|
(9)
|
Filed previously as an exhibit to the Company’s Schedule 14A Proxy Statement, filed August 20, 2008, and incorporated herein by reference.
|
|
(10)
|
Filed previously as an exhibit to the Company’s Annual Report on Form 10-K for its fiscal year ended December 31, 2002, filed March 31, 2003, and incorporated herein by reference.
|
|
(11)
|
Filed previously as an exhibit to the Company’s Current Report on Form 8-K filed November 17, 2010, and incorporated herein by reference.
|
|
(12)
|
Filed previously as an exhibit to the Company’s Current Report on Form 8-K filed October 21, 2011, and incorporated herein by reference.
|
|
(13)
|
Filed previously as an exhibit to the Company’s Current Report on Form 8-K filed September 25, 2012, and incorporated herein by reference.
|
|
(14)
|
Filed previously as an exhibit to the Company’s Annual Report on Form 10-K for its fiscal year ended December 31, 1999, filed March 30, 2000, and incorporated herein by reference.
|
|
(15)
|
Filed previously as an exhibit to the Company’s Current Report on Form 8-K filed August 24, 2011, and incorporated herein by reference.
|
|
(16)
|
Filed previously as an exhibit to the Company’s Annual Report on Form 10-K for its fiscal year ended December 31, 2003, filed March 15, 2004, and incorporated herein by reference.
|
|
(*)
|
Filed herewith.
|
99
Pursuant to the requirements of Section 13 or 15(d) of the Securities Exchange Act of 1934, the registrant has duly caused this report to be signed on its behalf by the undersigned, thereunto duly authorized.
|
Dated: March 15, 2013
|
JAKKS PACIFIC, INC.
|
|
|
By:
|
/s/ STEPHEN G. BERMAN
|
|
|
Stephen G. Berman
|
||
|
Chief Executive Officer
|
||
Pursuant to the requirements of the Securities Exchange Act of 1934, this report has been signed below by the following persons on behalf of the registrant and in the capacities and on the dates indicated.
|
Signature
|
Title
|
Date
|
||
|
/s/ STEPHEN G. BERMAN
|
Director and |
March 15, 2013
|
||
|
Stephen G. Berman
|
Chief Executive Officer
|
|||
|
/s/ JOEL M. BENNETT
|
Chief Financial Officer
(Principal Financial Officer and
|
March 15, 2013
|
||
|
Joel M. Bennett
|
Principal Accounting Officer)
|
|||
|
/s/ REX H. POULSEN
|
Director
|
March 15, 2013
|
||
|
Rex H. Poulsen
|
|
|||
|
/s/ ROBERT E. GLICK
|
Director |
March 15, 2013
|
||
|
Robert E. Glick
|
|
|||
|
/s/ MICHAEL G. MILLER
|
Director
|
March 15, 2013
|
||
|
Michael G. Miller
|
|
|||
|
/s/ MURRAY L. SKALA
|
Director
|
March 15, 2013
|
||
|
Murray L. Skala
|
|
|||
|
/s/ MARVIN W. ELLIN
|
Director
|
March 15, 2013
|
||
|
Marvin W. Ellin
|
|
|||
| /s/ LEIGH ANNE BRODSKY | Director |
March 15, 2013
|
||
| Leigh Anne Brodsky | ||||
| /s/ PETER F. REILLY | Director |
March 15, 2013
|
||
| Peter F. Reilly | ||||
100
EXHIBIT INDEX
|
Exhibit
Number
|
Description
|
|
|
3.1
|
Amended and Restated Certificate of Incorporation of the Company (1)
|
|
|
3.2
|
Amended and Restated By-Laws of the Company (2)
|
|
|
4.1
|
Rights Agreement dated as of March 5, 2012 between the Company and Computershare Trust Company, N.A., as Rights Agent (3)
|
|
|
10.1.1
|
Third Amended and Restated 1995 Stock Option Plan (4)
|
|
|
10.1.2
|
1999 Amendment to Third Amended and Restated 1995 Stock Option Plan (5)
|
|
|
10.1.3
|
2000 Amendment to Third Amended and Restated 1995 Stock Option Plan (6)
|
|
|
10.1.4
|
2001 Amendment to Third Amended and Restated 1995 Stock Option Plan (7)
|
|
|
10.2
|
2002 Stock Award and Incentive Plan (8)
|
|
|
10.2.1
|
2008 Amendment to 2002 Stock Award and Incentive Plan (9)
|
|
|
10.3
|
Amended and Restated Employment Agreement between the Company and Jack Friedman, dated as of March 26, 2003 (10)
|
|
|
10.4
|
Amended and Restated Employment Agreement between the Company and Stephen G. Berman dated as of March 26, 2003 (10)
|
|
|
10.4.1
|
Second Amended and Restated Employment Agreement between the Company and Stephen G. Berman dated as of November 11, 2010 (11)
|
|
|
10.4.2
|
Clarification Letter dated October 20, 2011 with respect to Mr. Berman’s Second Amended and Restated employment agreement (12)
|
|
|
10.4.3
|
Amendment Number One to Mr. Berman’s Second Amended and Restated Employment Agreement dated September 21, 2012 (13)
|
|
|
10.5
|
Office Lease dated November 18, 1999 between the Company and Winco Maliview Partners (14)
|
|
|
10.6
|
Form of Restricted Stock Agreement (10)
|
|
|
10.7
|
Employment Agreement between the Company and Joel M. Bennett, dated October 21, 2011 (2)
|
|
|
10.9
|
Employment Agreement between the Company and John a/k/a Jack McGrath, dated March 4, 2010 (15)
|
|
|
10.9.1
|
First Amendment to Employment Agreement between the Company and John a/k/a Jack McGrath, dated August 23, 2011 (15)
|
|
|
14
|
Code of Ethics (16)
|
|
|
21
|
Subsidiaries of the Company (*)
|
|
|
31.1
|
Rule 13a-14(a)/15d-14(a) Certification of Stephen G. Berman (*)
|
|
|
31.2
|
Rule 13a-14(a)/15d-14(a) Certification of Joel Bennett (*)
|
|
|
32.1
|
Section 1350 Certification of Stephen G. Berman (*)
|
|
|
32.2
|
Section 1350 Certification of Joel Bennett (*)
|
|
(1)
|
Filed previously as Appendix 2 to the Company’s Schedule 14A Proxy Statement, filed August 23, 2002, and incorporated herein by reference.
|
|
(2)
|
Filed previously as an exhibit to the Company’s Current Report on Form 8-K filed October 21, 2011, and incorporated herein by reference.
|
|
(3)
|
Filed previously as an exhibit to the Company’s Current Report on Form 8-K filed March 5, 2012, and incorporated herein by reference..
|
|
(4)
|
Filed previously as Appendix A to the Company’s Schedule 14A Proxy Statement, filed June 23, 1998, and incorporated herein by reference
|
|
(5)
|
Filed previously as an exhibit to the Company’s Registration Statement on Form S-8 (Reg. No. 333-90055), filed November 1, 1999, and incorporated herein by reference.
|
|
(6)
|
Filed previously as an exhibit to the Company’s Registration Statement on Form S-8 (Reg. No. 333-40392), filed June 29, 2000, and incorporated herein by reference.
|
|
(7)
|
Filed previously as Appendix B to the Company’s Schedule 14A Proxy Statement, filed June 11, 2001, and incorporated herein by reference.
|
|
(8)
|
Filed previously as an exhibit to the Company’s Registration Statement on Form S-8 (Reg. No. 333-101665), filed December 5, 2002, and incorporated herein by reference.
|
101
|
(9)
|
Filed previously as an exhibit to the Company’s Schedule 14A Proxy Statement, filed August 20, 2008, and incorporated herein by reference.
|
|
(10)
|
Filed previously as an exhibit to the Company’s Annual Report on Form 10-K for its fiscal year ended December 31, 2002, filed March 31, 2003, and incorporated herein by reference.
|
|
(11)
|
Filed previously as an exhibit to the Company’s Current Report on Form 8-K filed November 17, 2010, and incorporated herein by reference.
|
|
(12)
|
Filed previously as an exhibit to the Company’s Current Report on Form 8-K filed October 21, 2011, and incorporated herein by reference.
|
|
(13)
|
Filed previously as an exhibit to the Company’s Current Report on Form 8-K filed September 25, 2012, and incorporated herein by reference.
|
|
(14)
|
Filed previously as an exhibit to the Company’s Annual Report on Form 10-K for its fiscal year ended December 31, 1999, filed March 30, 2000, and incorporated herein by reference.
|
|
(15)
|
Filed previously as an exhibit to the Company’s Current Report on Form 8-K filed August 24, 2011, and incorporated herein by reference.
|
|
(16)
|
Filed previously as an exhibit to the Company’s Annual Report on Form 10-K for its fiscal year ended December 31, 2003, filed March 15, 2004, and incorporated herein by reference.
|
|
(*)
|
Filed herewith.
|
102
TABLE OF CONTENTS
Part IItem 1. BusinessItem 1A. Risk FactorsItem 2. PropertiesItem 3. Legal ProceedingsItem 4. Mine Safety DisclosuresPart IIItem 5. Market For Registrant S Common Equity, Related Stockholder Matters and Issuer Purchases Of Equity SecuritiesItem 6. Selected Financial DataItem 7. Management S Discussion and Analysis Of Financial Condition and Results Of OperationsItem 7A. Quantitative and Qualitative Disclosures About Market RiskItem 8. Consolidated Financial Statements and Supplementary DataNote 1 Principal IndustryNote 2 Summary Of Significant Accounting PoliciesNote 3 Business Segments, Geographic Data, Sales By Product Group and Major CustomersNote 4 Joint VenturesNote 5 Business CombinationsNote 6 GoodwillNote 7 Intangible Assets Other Than GoodwillNote 8 Concentration Of Credit RiskNote 9 Accrued ExpensesNote 10 Related Party TransactionsNote 11 Credit FacilityNote 12 Convertible Senior NotesNote 13 Income TaxesNote 14 LeasesNote 15 Common Stock, Preferred Stock and WarrantsNote 16 CommitmentsNote 17 Share-based PaymentsNote 18 Employee Benefits PlanNote 19 Supplemental Information To Consolidated Statements Of Cash FlowsNote 20 Selected Quarterly Financial Data (unaudited)Note 21 LitigationItem 9A. Controls and ProceduresPart IIIItem 10. Directors, Executive Officers, and Corporate GovernanceItem 11. Executive CompensationItem 12. Security Ownership Of Certain Beneficial Owners and Management and Related Stockholder MattersItem 13. Certain Relationships and Related Transactions, and Director IndependenceItem 14. Principal Accountant Fees and ServicesPart IVItem 15. Exhibits and Financial Statement Schedules