JAZZ PHARMACEUTICALS PLC
10-Ks and 10-Qs
|
|
|
|
|
|
|
|
|
|
|
|
|
|
|
|
|
|
|
|
|
|
|
|
|
|
|
|
|
|
|
|
|
|
|
|
|
|
|
|
|
|
|
|
|
|
|
|
|
|
|
|
|
|
|
|
|
|
|
UNITED STATES
SECURITIES AND EXCHANGE COMMISSION
WASHINGTON, D.C. 20549
FORM 10-K
(Mark One)
|
ý
|
ANNUAL REPORT PURSUANT TO SECTION 13 OR 15(d) OF THE SECURITIES EXCHANGE ACT OF 1934
|
For the fiscal year ended
December 31, 2017
or
|
¨
|
TRANSITION REPORT PURSUANT TO SECTION 13 OR 15(d) OF THE SECURITIES EXCHANGE ACT OF 1934
|
For the transition period from to
Commission File Number: 001-33500
JAZZ PHARMACEUTICALS PUBLIC LIMITED COMPANY
(Exact name of registrant as specified in its charter)
|
Ireland
|
|
98-1032470
|
|
(State or other jurisdiction of incorporation or organization)
|
|
(I.R.S. Employer Identification No.)
|
Fifth Floor, Waterloo Exchange
Waterloo Road, Dublin 4, Ireland
011-353-1-634-7800
(Address, including zip code, and telephone number, including area code, of registrant’s principal executive offices)
Securities registered pursuant to Section 12(b) of the Act:
|
Title of each class
|
|
Name of each exchange on which registered
|
|
Ordinary shares, nominal value $0.0001 per share
|
|
The NASDAQ Stock Market LLC
|
|
Ordinary share purchase rights
|
The NASDAQ Stock Market LLC
|
|
Securities registered pursuant to Section 12(g) of the Act:
None
Indicate by check mark if the registrant is a well-known seasoned issuer, as defined in Rule 405 of the Securities Act. Yes
ý
No
¨
Indicate by check mark if the registrant is not required to file reports pursuant to Section 13 or Section 15(d) of the Act. Yes
¨
No
ý
Indicate by check mark whether the registrant (1) has filed all reports required to be filed by Section 13 or 15(d) of the Securities Exchange Act of 1934 during the preceding 12 months (or for such shorter period that the registrant was required to file such reports), and (2) has been subject to such filing requirements for the past 90 days. Yes
ý
No
¨
Indicate by check mark whether the registrant has submitted electronically and posted on its corporate Web site, if any, every Interactive Data File required to be submitted and posted pursuant to Rule 405 of Regulation S-T during the preceding 12 months (or for such shorter period that the registrant was required to submit and post such files). Yes
ý
No
¨
Indicate by check mark if disclosure of delinquent filers pursuant to Item 405 of Regulation S-K is not contained herein, and will not be contained, to the best of registrant’s knowledge, in definitive proxy or information statements incorporated by reference in Part III of this Form 10-K or any amendment to this Form 10-K.
ý
Indicate by check mark whether the registrant is a large accelerated filer, an accelerated filer, a non-accelerated filer, a smaller reporting company, or emerging growth company. See the definitions of “large accelerated filer,” “accelerated filer,” “smaller reporting company,” and “emerging growth company” in Rule 12b-2 of the Exchange Act.
|
Large accelerated filer
x
|
|
Accelerated filer
¨
|
|
Non-accelerated filer
¨
|
|
Smaller reporting company
¨
|
Emerging growth company
¨
|
|
|
|
|
(Do not check if a smaller reporting company)
|
|
|||||
If an emerging growth company, indicate by check mark if the registrant has elected not to use the extended transition period for complying with any new or revised financial accounting standards provided pursuant to Section 13(a) of the Exchange Act.
¨
Indicate by check mark whether the registrant is a shell company (as defined in Rule 12b-2 of the Act). Yes
¨
No
ý
The aggregate market value of the voting and non-voting common equity held by non-affiliates of the registrant, as of
June 30, 2017
, the last business day of the registrant’s most recently completed second fiscal quarter, was approximately
$6,713,735,825
based upon the last sale price reported for the registrant’s ordinary shares on such date on The NASDAQ Global Select Market. The calculation of the aggregate market value of voting and non-voting common equity excludes
16,931,148
ordinary shares of the registrant held by executive officers, directors and shareholders that the registrant concluded were affiliates of the registrant on that date. Exclusion of such shares should not be construed to indicate that any such person possesses the power, direct or indirect, to direct or cause the direction of the management or policies of the registrant or that such person is controlled by or under common control with the registrant.
As of
February 20, 2018
, a total of
59,803,396
ordinary shares, nominal value $0.0001 per share, of the registrant were outstanding.
DOCUMENTS INCORPORATED BY REFERENCE
Certain information required by Part III, Items 10-14 of this Form 10-K is incorporated by reference to the registrant’s definitive Proxy Statement for the
2018
Annual General Meeting of Shareholders to be filed with the Securities and Exchange Commission pursuant to Regulation 14A not later than 120 days after the end of the fiscal year covered by this Form 10-K, provided that if such Proxy Statement is not filed within such period, such information will be included in an amendment to this Form 10-K to be filed within such 120-day period.
1
JAZZ PHARMACEUTICALS PLC
2017
ANNUAL REPORT ON FORM 10-K
TABLE OF CONTENTS
|
Page
|
||
|
PART I
|
||
|
Item 1.
|
||
|
Item 1A.
|
||
|
Item 1B.
|
||
|
Item 2.
|
||
|
Item 3.
|
||
|
Item 4.
|
||
|
PART II
|
||
|
Item 5.
|
||
|
Item 6.
|
||
|
Item 7.
|
||
|
Item 7A.
|
||
|
Item 8.
|
||
|
Item 9.
|
||
|
Item 9A.
|
||
|
Item 9B.
|
||
|
PART III
|
||
|
Item 10.
|
||
|
Item 11.
|
||
|
Item 12.
|
||
|
Item 13.
|
||
|
Item 14.
|
||
|
PART IV
|
||
|
Item 15.
|
||
|
Item 16.
|
||
We own or have rights to various copyrights, trademarks, and trade names used in our business in the U.S. and/or other countries, including the following: Jazz Pharmaceuticals
®
, Xyrem
®
(sodium oxybate) oral solution, Erwinaze
®
(asparaginase
Erwinia chrysanthemi
), Erwinase
®
,
Defitelio
®
(defibrotide sodium), Defitelio
®
(defibrotide), Prialt
®
(ziconotide) intrathecal infusion, CombiPlex
®
and Vyxeos
®
(daunorubicin and cytarabine) liposome for injection. This report also includes trademarks, service marks and trade names of other companies. Trademarks, service marks and trade names appearing in this Annual Report on Form 10-K are the property of their respective owners.
2
CAUTIONARY NOTE REGARDING FORWARD-LOOKING STATEMENTS
This Annual Report on Form 10-K contains forward-looking statements within the meaning of Section 27A of the Securities Act of 1933, as amended, and Section 21E of the Securities Exchange Act of 1934, as amended, which are subject to the “safe harbor” created by those sections. Forward-looking statements are based on our management’s beliefs and assumptions and on information currently available to our management. In some cases, you can identify forward-looking statements by terms such as “may,” “will,” “should,” “could,” “would,” “expect,” “plan,” “anticipate,” “believe,” “estimate,” “project,” “predict,” “propose,” “intend,” “continue,” “potential,” “possible,” “foreseeable,” “likely,” “unforeseen” and similar expressions intended to identify forward-looking statements. These statements involve known and unknown risks, uncertainties and other factors which may cause our actual results, performance, time frames or achievements to be materially different from any future results, performance, time frames or achievements expressed or implied by the forward-looking statements. We discuss many of these risks, uncertainties and other factors in this Annual Report on
Form 10-K in greater detail under the heading “Risk Factors.” Given these risks, uncertainties and other factors, you should not place undue reliance on these forward-looking statements. Also, these forward-looking statements represent our estimates and assumptions only as of the date of this filing. You should read this Annual Report on Form 10-K completely and with the understanding that our actual future results may be materially different from what we expect. We hereby qualify our forward-looking statements by our cautionary statements. Except as required by law, we assume no obligation to update our forward-looking statements publicly, or to update the reasons that actual results could differ materially from those anticipated in these forward-looking statements, even if new information becomes available in the future.
NOTE REGARDING COMPANY REFERENCE
In this report, unless otherwise indicated or the context otherwise requires, all references to “Jazz Pharmaceuticals,” “the registrant,” “we,” “us,” and “our” refer to Jazz Pharmaceuticals plc and its consolidated subsidiaries.
|
Item 1.
|
Business
|
Overview
Jazz Pharmaceuticals plc is an international biopharmaceutical company focused on improving patients’ lives by identifying, developing and commercializing meaningful products that address unmet medical needs.
We have a diverse portfolio of products and product candidates, with a focus in the areas of sleep and hematology/oncology. Our lead marketed products are:
|
•
|
Xyrem
®
(sodium oxybate) oral solution
, the only product approved by the U.S. Food and Drug Administration, or FDA, and marketed in the U.S. for the treatment of both cataplexy and excessive daytime sleepiness, or EDS, in patients with narcolepsy;
|
|
•
|
Erwinaze
®
(asparaginase
Erwinia chrysanthemi
)
, a treatment approved in the U.S. and in certain markets in Europe (where it is marketed as Erwinase
®
) for patients with acute lymphoblastic leukemia, or ALL, who have developed hypersensitivity to
E. coli
-derived asparaginase;
|
|
•
|
Defitelio
®
(defibrotide sodium)
, a product approved in the U.S. for the treatment of adult and pediatric patients with hepatic veno-occlusive disease, or VOD, also known as sinusoidal obstruction syndrome, or SOS, with renal or pulmonary dysfunction following hematopoietic stem cell transplantation, or HSCT, and in Europe (where it is marketed as Defitelio
®
(defibrotide)) for the treatment of severe VOD in adults and children undergoing HSCT therapy; and
|
|
•
|
Vyxeos
®
(daunorubicin and cytarabine) liposome for injection
, a product approved in the U.S. for the treatment of adults with newly-diagnosed therapy-related acute myeloid leukemia, or t-AML, or acute myeloid leukemia, or AML, with myelodysplasia-related changes, or AML-MRC.
|
Our strategy is to create shareholder value by:
|
•
|
Growing sales of the existing products in our portfolio, including by identifying and investing in growth opportunities such as new treatment indications and new geographic markets;
|
|
•
|
Acquiring or licensing rights to clinically meaningful and differentiated products on the market or product candidates at various stages of development; and
|
|
•
|
Pursuing targeted development of post-discovery differentiated product candidates.
|
3
We apply a disciplined approach to allocating our resources between investments in our current commercial and development portfolio and acquisitions or in-licensing of new assets.
In 2017, we continued to increase our focus on research and development activities and achieved meaningful milestones in our clinical development of new product candidates, activities related to line extensions and new indications for existing products and the generation of additional clinical data for existing products, all in our sleep and hematology/oncology therapeutic areas.
A summary of our ongoing development activities is provided below:
|
Project
|
Disease Area
|
Status
|
|
Sleep
|
||
|
Solriamfetol (JZP-110)
|
Excessive sleepiness, or ES, in obstructive sleep apnea, or OSA
|
Submitted a new drug application, or NDA, to the FDA in fourth quarter of 2017; preparing to submit a marketing authorization application, or MAA, to the European Medicines Agency, or EMA, in late 2018
|
|
Solriamfetol (JZP-110)
|
ES in narcolepsy
|
Submitted an NDA to the FDA in fourth quarter of 2017; preparing to submit an MAA to EMA in late 2018
|
|
Solriamfetol (JZP-110)
|
ES in Parkinson’s disease
|
First patient enrolled in Phase 2 trial in first quarter of 2017; targeting completion of enrollment by late 2018
|
|
Xyrem
|
EDS and cataplexy in pediatric narcolepsy patients with cataplexy
|
Expect to submit a supplemental NDA, or sNDA, and pediatric written request report to the FDA in mid-2018
|
|
JZP-507
|
EDS and cataplexy in narcolepsy
|
Expect to be ready to submit an NDA to the FDA as early as mid-2018
|
|
JZP-258
|
EDS and cataplexy in narcolepsy
|
First patient enrolled in Phase 3 trial in first quarter of 2017; expect to complete enrollment in fourth quarter of 2018; subject to results of trial, expect to submit an NDA to the FDA in 2019
|
|
JZP-258
|
Idiopathic hypersomnia, or IH
|
Expect to initiate Phase 3 trial in second half of 2018
|
|
Oxybate once-nightly dosing
|
Narcolepsy
|
Program progressing; evaluation of deuterated oxybate and other formulation options continues as part of once-nightly development
process |
|
Hematology/Oncology
|
||
|
Vyxeos
|
High-risk AML
|
Submitted an MAA to the EMA in fourth quarter of 2017
|
|
Vyxeos
|
Myelodysplastic syndrome, or MDS
|
Preparing for Phase 2 trial with cooperative group with planned initiation in second half of 2018
|
|
Defibrotide
|
Prevention of VOD in high-risk patients following HSCT
|
First patient enrolled in Phase 3 trial in first quarter of 2017
|
|
Defibrotide
|
Prevention of acute Graft versus Host Disease, or aGvHD, following HSCT
|
First patient enrolled in Phase 2 proof of concept trial in first quarter of 2018
|
|
Defibrotide
|
Transplant-associated thrombotic microangiopathy, or TA-TMA
|
Expect to activate sites in pivotal Phase 2 trial in fourth quarter of 2018
|
|
Asparaginase
|
ALL and other hematological malignancies
|
Evaluation of early-stage product candidates
|
|
CombiPlex combinations
|
Oncology/hematological disorders
|
Pre-clinical evaluation of oncology therapeutic combinations
|
We are also engaged in a number of licensing and collaboration agreements with third parties for the development of product candidates. For more information, see “Business—Research and Development” in this Part I, Item 1.
Our Commercialized Products
Xyrem
Xyrem is the only treatment approved by the FDA and marketed for both EDS and cataplexy in patients with narcolepsy. Sodium oxybate, the active pharmaceutical ingredient, or API, in Xyrem, is a formulation of the sodium salt of gamma-hydroxybutyrate, or GHB, an endogenous neurotransmitter and metabolite of gamma-aminobutyric acid. Xyrem was approved in the U.S. for the treatment of cataplexy in patients with narcolepsy in 2002 and was approved for EDS in patients with narcolepsy in 2005. The American Academy of Sleep Medicine recommended Xyrem as a standard of care for the treatment of both EDS and cataplexy associated with narcolepsy.
4
Narcolepsy is a chronic neurological disorder caused by a loss of neurons that produce the neurotransmitter hypocretin (also known as orexin), which is hypothesized to stabilize sleep-wake states. The primary symptoms of narcolepsy include EDS, cataplexy, sleep paralysis, hypnogogic hallucinations and disrupted nighttime sleep. EDS is an essential symptom of narcolepsy, is present in all narcolepsy patients and is characterized by chronic, pervasive sleepiness as well as sudden irresistible and overwhelming urges to sleep (inadvertent naps and sleep attacks). Cataplexy, the sudden loss of muscle tone, can be one of the most debilitating symptoms of narcolepsy. Cataplexy is present in approximately 70% of patients with narcolepsy. Cataplexy can range from slight weakness or a drooping of facial muscles to the complete loss of muscle tone resulting in postural collapse. It may also impair a patient’s vision or speech. Cataplexy is often triggered by strong emotions such as laughter, anger or surprise. Cataplexy can severely impair a patient’s quality of life and ability to function.
Narcolepsy may affect many areas of life, including limiting a patient’s education and employment opportunities and leading to driving or machinery accidents or difficulties at work resulting in disability or job dismissal. Patients with narcolepsy may also suffer from significant medical comorbidities, including depression, suicide risk, anxiety, diseases of the digestive system, respiratory diseases and cardiac disorders.
It is estimated that narcolepsy affected approximately 1 in 2,000 people in the U.S., or approximately 160,000 people, in 2017. We believe that fewer than half of those people have been definitively diagnosed with narcolepsy. In the fourth quarter of 2017, the average number of active Xyrem patients in the U.S. was approximately 13,525 patients, and we believe that there are significantly more narcoleptic patients with cataplexy and/or EDS who might benefit from treatment with Xyrem. In an effort to reach more patients, we continue to implement initiatives such as outreach to prescribers who treat narcolepsy, physician/healthcare provider education, enhanced patient and physician support services and unbranded disease awareness programs for the public.
In
2017
, net product sales of Xyrem were
$1,186.7 million
, which represented
74%
of our total net product sales.
Our marketing, sales and distribution of Xyrem are subject to a risk evaluation and mitigation strategy, or REMS, which is required by the FDA to ensure the safe distribution of Xyrem and minimize the risk of misuse, abuse and diversion of sodium oxybate. Under the Xyrem REMS, all of the Xyrem sold in the U.S. must be dispensed and shipped directly to patients through a central pharmacy. Xyrem may not be stocked in retail pharmacies. Physicians and patients must complete an enrollment process prior to fulfillment of Xyrem prescriptions, and each physician and patient receives materials concerning the risks and benefits of Xyrem before the physician can prescribe, or a patient can receive, the product. Whenever a prescription is received by the central pharmacy, the central pharmacy verifies the prescription and must speak with the patient before each prescription of Xyrem is filled and sent to the patient. The central pharmacy ships the product directly to the patient by a courier service, and the patient or his/her designee signs for the package. The initial shipment may include only up to a one-month supply, and refill orders may include only up to a three-month supply.
We have an agreement with Express Scripts Specialty Distribution Services, Inc., or Express Scripts, to exclusively distribute Xyrem in the U.S. and provide patient support services related to Xyrem. Our agreement with Express Scripts, which has been in effect since July 2002, expires on July 1, 2019, subject to a one-year extension at Jazz’s discretion. The agreement may be terminated by either party at any time without cause on 180 days’ prior written notice to the other party. We own all standard operating procedures, business rules and the related intellectual property for the services Express Scripts provides related to patient support programs. The agreement provides for Express Scripts to assist in the orderly transfer of the services that Express Scripts provides to us and the related intellectual property, including intellectual property related to the patient database, to any new pharmacy that we may engage.
Xyrem is currently sold in 21 countries by UCB Pharma Limited, or UCB (which has rights to market Xyrem in 54 countries), and, as of January 1, 2018, we directly market Xyrem in Canada for the treatment of cataplexy in patients with narcolepsy. We had previously licensed the Canadian marketing rights to Xyrem to Valeant Canada Limited, or Valeant, and supplied Xyrem to Valeant.
Nine companies have filed abbreviated new drug applications, or ANDAs, with the FDA seeking approval to market a generic version of Xyrem. We filed patent lawsuits against each of the ANDA filers in the U.S. District Court for the District of New Jersey, or the District Court, asserting that such generic products would violate our patents covering Xyrem. We have settled lawsuits against five of the ANDA filers, including the first filer, Roxane Laboratories, Inc., which was acquired by West-Ward Pharmaceuticals Corp. (a wholly owned subsidiary of Hikma Pharmaceuticals PLC), or West-Ward. We granted West-Ward the right to sell an authorized generic version of Xyrem, or AG Product, beginning on January 1, 2023, or earlier under certain circumstances, including circumstances related to the licensing or market entry of another generic sodium oxybate product, a final decision that all unexpired claims of the Xyrem patents are invalid and/or unenforceable, or a substantial reduction in Xyrem net sales over specified periods of time. We also granted West-Ward a license to launch its own generic sodium oxybate product as early as six months after it has the right to sell the AG Product, unless it elects to continue to sell the AG Product, which it may do for up to a total of five years. In a separate settlement with Par Pharmaceutical, Inc., or Par, we granted Par the right to sell a limited volume of AG Product beginning on July 1, 2023, or earlier under certain
5
circumstances, including acceleration of West-Ward’s AG Product launch date. Each of Par and the other three settling filers have been granted a license to launch its own generic sodium oxybate product on or after December 31, 2025, or earlier under certain circumstances, including the launch by West-Ward or another party of a generic sodium oxybate product under its ANDA. We cannot predict the timing or outcome of the ongoing ANDA litigation proceedings against the remaining non-settling ANDA filers. For a description of these and other legal proceedings and settlement agreements related to Xyrem, see “Legal Proceedings” in Part I, Item 3 of this Annual Report on Form 10-K.
In January 2017, the FDA approved West-Ward’s ANDA for a generic sodium oxybate product. The FDA’s letter approving West-Ward’s ANDA notes that, as the first ANDA applicant, West-Ward is eligible for 180 days of generic drug exclusivity. West-Ward’s ANDA approval also includes a waiver that permits West-Ward to use a separate REMS program from the Xyrem REMS on the condition that the REMS approved with West-Ward’s ANDA, or the generic sodium oxybate REMS, be open to all future sponsors of ANDAs or NDAs for sodium oxybate products. The FDA has also tentatively approved two additional ANDAs for generic sodium oxybate products.
The actual timing of any commercial launch of an AG Product or a generic sodium oxybate product is uncertain. We expect that the launch of any generic sodium oxybate product, including any AG Product, or the approval and launch of other products that compete with Xyrem, would be likely to have a material adverse effect on our sales of Xyrem and on our business, financial condition, results of operations and growth prospects. For discussion regarding the risks associated with our ANDA settlement agreements, the approval and tentative approval of ANDAs, the potential launch of AG Products or generic versions of Xyrem, or the approval and launch of other sodium oxybate or other products that compete with Xyrem, as well as other risks and challenges we face with respect to Xyrem, see “Business—Government Regulation—
The Hatch-Waxman Act
” and “Business—Competition” in this Part I, Item 1 and the risk factors under the headings “Risks Related to Xyrem and the Significant Impact of Xyrem Sales,” “
We face substantial competition from other companies, including companies with greater resources, including larger sales organizations and more experience working with large and diverse product portfolios, than we have
” and
“Risks Related to Our Intellectual Property” in Part I, Item 1A of this Annual Report on Form 10‑K.
Xyrem is a controlled substance in the U.S., subject to regulation by the U.S. Drug Enforcement Administration, or DEA, under the Controlled Substances Act, or CSA. Therefore, its manufacturing and distribution are highly restricted. The API for Xyrem is manufactured for us by a single source supplier. The finished product for Xyrem is manufactured both by us in our facility in Athlone, Ireland and by our U.S.-based Xyrem supplier. For more information regarding Xyrem supply, see “Business—Manufacturing” in this Part I, Item 1 and the risk factor under the heading “
The loss of our single source suppliers, delays or problems in the supply of our products for commercial sale or our product candidates for use in our clinical trials, or our or our suppliers’ failure to comply with manufacturing regulations, could materially and adversely affect our business, financial condition, results of operations and growth prospects
” in Part I, Item 1A of this Annual Report on Form 10‑K.
Erwinaze
Erwinaze (called Erwinase in markets outside the U.S., and which we refer to in this report as Erwinaze unless otherwise indicated or the context otherwise requires) is a biologic product used in conjunction with chemotherapy to treat patients with ALL who have developed hypersensitivity to
E. coli
-derived asparaginase. Erwinaze is an asparaginase, a type of enzyme that can deprive leukemic cells of an amino acid essential for their growth. It is derived from a rare bacterium (
Erwinia chrysanthemi
) and is immunologically distinct from
E. coli
-derived asparaginase and suitable for patients with hypersensitivity to
E. coli
-derived treatments. For ALL patients with hypersensitivity to
E. coli
-derived asparaginase, Erwinaze can be a crucial component of their therapeutic regimen.
ALL is the most common childhood cancer. The American Cancer Society estimates that between 5,000 to 6,000 new cases of ALL will be diagnosed in the U.S. in 2018. Based on data from the U.S. National Cancer Institute and the U.S. Census Bureau available in 2015, we estimate that approximately 50% of ALL patients were diagnosed under age 15 and approximately 20% were diagnosed between 15 and 39 years of age. A study published by Dana Farber Cancer Institute, with median follow-up of 57 months, concluded that the intensive use of high-dose asparaginase has an important role in the treatment of children with ALL. Data reported in two separate papers published in
Pediatric Blood & Cancer
and
Journal of Clinical Oncology,
respectively, suggest that up to 20% of ALL patients may develop hypersensitivity to
E. coli
-derived asparaginase. Current treatment guidelines and protocols recommend switching a patient receiving
E. coli-
derived asparaginase to treatment with Erwinaze if the patient’s hypersensitivity reaction to the
E. coli
-derived asparaginase is Grade 2-4, indicating that the hypersensitivity reaction has resulted in an intervention or interruption in infusion occurring in the patient’s treatment regimen. While pediatric treatment protocols commonly include asparaginase, adult protocols do not. In addition, we believe that Erwinaze has the potential for use in patients with silent hypersensitivity, a situation in which
E. coli
-derived asparaginase may induce antibodies that can neutralize the enzyme or increase its clearance, thereby depriving patients of its therapeutic benefits without manifesting the clinical symptoms of hypersensitivity.
Erwinaze was originally developed by Public Health England, a national executive agency of the United Kingdom, or UK. First approved by the FDA under a biologics license application, or BLA, for administration via intramuscular injection in
6
conjunction with chemotherapy, Erwinaze was launched in the U.S. in November 2011. In December 2014, the FDA approved a supplemental BLA for administration of Erwinaze via intravenous infusion in conjunction with chemotherapy. In Europe and elsewhere around the world, Erwinase is sold pursuant to marketing authorizations, named patient programs, temporary use authorizations or similar authorizations. Erwinaze is exclusively licensed to us for worldwide marketing, sales and distribution by Porton Biopharma Limited, or PBL, a company that is wholly owned by the UK Secretary of State for Health. PBL also manufactures the product for us and is our sole supplier for Erwinaze. We are obligated to make tiered royalty payments to PBL based on worldwide net sales of Erwinaze. Our license and manufacturing agreement with PBL expires in December 2020, subject to automatic five-year extensions unless terminated by either party in writing by December 2018. We cannot predict whether the term of the agreement will be extended or, if extended, the terms of any such extension.
Erwinaze has been granted orphan drug exclusivity by the FDA for the treatment of ALL in the U.S. until November 2018, and we believe that it is protected by exclusivity that prevents approval of a biosimilar in the U.S. through late 2023 under the U.S. Biologics Price Competition and Innovation Act, or BPCIA.
In
2017
, net product sales of Erwinaze were
$197.3 million
, which represented
12%
of our total net product sales.
Defitelio
Defibrotide, the API in Defitelio, is the sodium salt of a complex mixture of single-stranded oligodeoxyribonucleotides derived from porcine DNA. In
in vitro
studies, defibrotide has shown a number of pharmacological effects that suggest it has a role in both protection of the endothelial cells that form the inner lining of blood vessels and restoration of the balance between clot formation and breakdown in the blood.
Defibrotide has been developed for the treatment and prevention of VOD, a potentially life-threatening complication of HSCT. Stem cell transplantation is a frequently used treatment modality for hematologic cancers and other conditions in both adults and children. Certain conditioning regimens used as part of HSCT can damage the cells that line the hepatic vessels, which is thought to lead to the development of VOD, also referred to as SOS, a blockage of the small vessels in the liver, that can lead to liver failure and potentially result in significant dysfunction in other organs such as the kidneys and lungs. Severe VOD is the most extreme form of VOD and is associated with multi-organ failure and high rates of morbidity and mortality. An analysis of retrospective data, prospective cohort studies and clinical trials published between 1979 and 2007 found that the 100-day mortality rate in severe VOD cases is greater than 80%. Based on data from published surveys and our market research, we estimate that, in Europe, approximately 35,600 patients will undergo HSCT in 2018, approximately 5,300 will be considered at high risk for the development of VOD, and the incidence of VOD will be approximately 2,800 patients; in the U.S., we estimate that approximately 21,600 patients will undergo HSCT in 2018, approximately 3,400 will be considered at high risk for the development of VOD, and the incidence of VOD will be approximately 1,000 to 2,000 patients. Our review of relevant literature and market research also suggests that about one-third to two-thirds of VOD patients may be eligible for treatment using defibrotide.
In October 2013, the European Commission, or EC, granted marketing authorization under exceptional circumstances for Defitelio for the treatment of severe VOD in adults and children undergoing HSCT. Defitelio is also the only approved treatment for this potentially life-threatening condition in the European Union, or EU. We launched Defitelio in certain European countries beginning in 2014 and continue to launch the product in additional European countries on a rolling basis. In those European markets where Defitelio is approved but not yet launched, our medical science liaisons and medical directors respond to medical information requests regarding defibrotide and provide information consistent with local treatment protocols. We intend to eventually commercialize Defitelio in all European markets where it has marketing authorization. We also continue to provide patients access to defibrotide where it is not commercially available outside the U.S. on a named patient basis.
In August 2014, we acquired from Sigma-Tau Pharmaceuticals, Inc., or Sigma-Tau, the rights to defibrotide for the treatment and prevention of VOD in North America, Central America and South America. In exchange for the rights to defibrotide in the Americas, we made an upfront payment of $75.0 million to Sigma-Tau and also made milestone payments of $175.0 million comprised of (i) $25.0 million upon the acceptance for filing by the FDA of the first NDA for defibrotide for VOD, paid in the fourth quarter of 2015; and (ii) an additional $150.0 million upon FDA approval of defibrotide for VOD, paid in the second quarter of 2016.
In March 2016, the FDA approved our NDA for Defitelio for the treatment of adult and pediatric patients with VOD with renal or pulmonary dysfunction following HSCT. We launched Defitelio in the U.S. shortly after FDA approval. In July 2017, we obtained regulatory approval of defibrotide in Canada, and we launched the product in Canada in the third quarter of 2017.
Defibrotide has been granted orphan drug designation by the EC and the Korean Ministry of Food and Drug Safety to treat and prevent VOD. The Commonwealth of Australia-Department of Health has granted defibrotide orphan drug designation for the treatment of VOD. In addition, the EC granted orphan drug designation to defibrotide for the prevention of aGvHD, another potentially fatal complication of HSCT that afflicts up to 50% of all donor transplant patients. We are also
7
developing defibrotide for other potential indications. For more information regarding defibrotide development activities, see “Business—Research and Development” in this Part I, Item 1.
In
2017
, Defitelio/defibrotide product sales were
$133.7 million
, which represented
8%
of our total net product sales.
Vyxeos
Vyxeos is a liposome formulation of a fixed combination of daunorubicin and cytarabine for intravenous infusion that is indicated for the treatment of adults with newly-diagnosed t-AML or AML-MRC and has been shown to have synergistic effects at killing leukemia cells in vitro and in animal models. Vyxeos is the first injectable fixed ratio, drug delivery combination oncology product based on our CombiPlex technology platform approved by the FDA.
AML is a rapidly progressing and life-threatening blood cancer that begins in the bone marrow, which produces most of the body's new blood cells. AML cells crowd out healthy cells and move aggressively into the bloodstream to spread cancer to other parts of the body. AML is a relatively rare disease representing 1.3% of all new cancer cases. The American Cancer Society has estimated that more than 20,000 people would be diagnosed with AML in the U.S. and nearly 11,000 people would die from the disease in the U.S. in 2018. The median age at diagnosis is 68 years old, with rising age associated with a progressively worsening prognosis. There is also a reduced tolerance for intensive chemotherapy as patients age. AML has the lowest survival rate of any form of leukemia. Patients with newly diagnosed t-AML or AML-MRC may have a particularly poor prognosis.
In August 2017, the FDA approved our NDA for Vyxeos for the treatment of adults with newly-diagnosed t-AML or AML-MRC. We launched and began shipping Vyxeos in the U.S. in August 2017. We submitted an MAA for Vyxeos to the EMA in the fourth quarter of 2017 for the treatment of t-AML or AML-MRC.
Vyxeos has been granted orphan drug exclusivity by the FDA until August 2024 for the treatment of adults with newly-diagnosed t-AML or AML-MRC and has received orphan drug designation by the EC for the treatment of AML. For more information regarding our CombiPlex technology platform and Vyxeos development, see “Business—Research and Development” in this Part I, Item 1.
In 2017, Vyxeos product sales were
$33.8 million
, which represented
2.1%
of our total net product sales.
Prialt and other products
We commercialize Prialt, an intrathecally administered infusion of ziconotide, approved by the FDA in December 2004 for the management of severe chronic pain in patients for whom intrathecal therapy is warranted, and who are intolerant of or refractory to other treatment, such as systemic analgesics, adjunctive therapies or intrathecal morphine. Intrathecal therapy is the delivery of the drug into the intrathecal space in the spine through an infusion system comprised of a programmable infusion pump and catheter. For most patients who achieve good pain relief and tolerability with Prialt, pain relief can be maintained over time without cumulative toxicity. Prialt is the only FDA-approved non-opioid intrathecal analgesic. We have worldwide rights to Prialt, excluding certain countries outside of the U.S. licensed by Eisai Co. Limited, or Eisai, from Elan Pharmaceuticals, Inc. (subsequently acquired by Perrigo Company plc) in May 2010. We sell the product in the U.S., and we supply Prialt to Eisai, which sells the product in certain countries outside of the U.S.
We also sell psychiatry and other products in the U.S.
Research and Development
Our development projects currently include clinical development of new product candidates, activities related to line extensions for existing products and the generation of additional clinical data for existing products in our sleep and hematology/oncology therapeutic areas.
In the sleep therapeutic area, we have the following ongoing and planned development activities:
|
•
|
Solriamfetol
(JZP-110)
|
Phase 3 Clinical Trials and NDA Submission
. Solriamfetol is a late-stage investigational compound being developed for potential treatment of ES in patients with narcolepsy and ES in patients with OSA. We acquired worldwide development, manufacturing and commercial rights to solriamfetol from Aerial BioPharma LLC, or Aerial, in January 2014, other than in certain jurisdictions in Asia where SK Biopharmaceuticals Co., Ltd, or SK, retains rights. We conducted two Phase 3 clinical trials in patients with ES associated with OSA and one Phase 3 clinical trial in patients with ES associated with narcolepsy. In the second quarter of 2017, we presented positive efficacy results along with safety results from our two Phase 3 clinical trials in patients with ES associated with OSA and one Phase 3 clinical trial in patients with ES associated with narcolepsy. In addition, we enrolled approximately 640 patients from our Phase 2 and Phase 3 clinical trials in an ongoing open label extension trial evaluating the long-term safety and
8
maintenance of efficacy of solriamfetol, and we have completed the interim data analysis in this trial. We submitted an NDA to the FDA in the fourth quarter of 2017 to seek approval for solriamfetol in the treatment of ES associated with OSA and ES associated with narcolepsy. In the event our NDA is approved, we expect that solriamfetol will be subject to scheduling by the DEA, which will need to be completed after approval of our NDA, but before it can be commercially launched. We are preparing to submit an MAA to the EMA for solriamfetol in late 2018.
Phase 2 Clinical Trial
. We commenced patient enrollment in a Phase 2 clinical trial of solriamfetol in patients with ES associated with Parkinson’s disease in the U.S. in the first quarter of 2017 and are targeting completion of enrollment in late 2018. We expect to enroll approximately 50 adult patients in this trial. There are no FDA-approved therapies for ES in Parkinson’s disease in the U.S.
Other Activities
. We are also evaluating future pipeline expansion opportunities for solriamfetol in other disorders and conditions, as well as opportunities for geographic expansion.
|
•
|
Xyrem
|
Phase 3 Clinical Trial of Xyrem in Children and Adolescents
. While in many patients narcolepsy can begin during childhood and adolescence, there has been limited information on the treatment of pediatric narcolepsy patients with Xyrem. We worked with the FDA and several leading specialists to design a clinical trial to generate additional data on the treatment of pediatric narcolepsy patients with Xyrem. We conducted a Phase 3 clinical trial to assess the safety and efficacy of Xyrem in children and adolescents aged seven to 17 who have narcolepsy with cataplexy. In the second quarter of 2017, we presented positive efficacy results along with the safety results from this trial. We anticipate submitting an sNDA and pediatric written request report to the FDA in mid-2018.
|
•
|
JZP-507
|
JZP-507 is an investigational new drug candidate with a 50% reduction in sodium content compared to Xyrem that in a pilot study has demonstrated bioequivalence to Xyrem. We are investigating JZP-507 for the potential treatment of both narcolepsy with cataplexy and EDS in narcolepsy. We expect to be ready to submit an NDA to the FDA as early as mid-2018. We believe that JZP-507 would offer a clinically meaningful benefit to patients compared to Xyrem.
|
•
|
JZP-258
|
Phase 3 Clinical Trial in Narcolepsy
. JZP-258 is an investigational new drug candidate that contains 90% less sodium than Xyrem and is being developed for the potential treatment of both narcolepsy with cataplexy and EDS in narcolepsy. We believe that JZP-258 would offer a clinically meaningful benefit to patients compared to Xyrem. We enrolled the first patient in a Phase 3 clinical trial of JZP-258 in the EU and U.S. in the first quarter of 2017 and expect to complete enrollment in the fourth quarter of 2018. Subject to the results of this trial, we anticipate submitting an NDA to the FDA in 2019.
Planned Phase 3 Clinical Trial in IH.
IH is a chronic, neurological disorder that is primarily characterized by EDS. There are no FDA-approved therapies for IH in the U.S. We expect to initiate a Phase 3 clinical trial to evaluate JZP-258 in the treatment of IH in the second half of 2018.
Other Activities.
We are also pursuing activities related to the potential development of once-nightly dosing options for narcolepsy patients that we believe would provide clinically meaningful improvements to patients compared to Xyrem. We are exploring formulation options, including an evaluation of deuterated oxybate.
In the hematology and oncology therapeutic area, we have the following ongoing and planned development activities:
|
•
|
Vyxeos
|
MAA Submission
. We submitted an MAA for Vyxeos to the EMA in the fourth quarter of 2017 for the treatment of t-AML or AML-MRC. The EMA granted accelerated assessment of the MAA for Vyxeos; accelerated assessment is granted for products expected to be of major interest for public health and can potentially shorten the duration of the EMA’s review by up to six months. Vyxeos has received orphan drug designation by the EC for the treatment of AML.
Planned Phase 2 Cooperative Group MDS Clinical Trial.
Myelodysplasia syndromes are hematopoietic stem cell disorders that are characterized by blood cell dysplasias and ineffective hematopoiesis. For most patients, MDS will lead to progressive marrow failure with profound cytopenias. In some patients, MDS will evolve into AML. We are preparing for a Phase 2 clinical trial with a cooperative group to evaluate Vyxeos in the treatment of MDS, with planned initiation in the second half of 2018.
Other Activities.
We are also assessing the potential for approval of Vyxeos in other countries and for development of Vyxeos in additional indications.
9
|
•
|
Defibrotide
|
Phase 3 Clinical Trial
. In the first quarter of 2017, we enrolled the first patient in a Phase 3 clinical trial of defibrotide to evaluate the safety and efficacy of defibrotide for the prevention of VOD in high-risk and very high-risk patients following HSCT. We expect to enroll approximately 400 patients in this global trial and, depending on the results from the interim analysis, the enrollment could increase to up to approximately 600 patients.
Phase 2 aGvHD Clinical Trial
. We enrolled the first patient in a Phase 2 proof of concept trial to evaluate defibrotide for the prevention of aGvHD following HSCT in the first quarter of 2018.
Planned Pivotal Phase 2 TA-TMA Clinical Trial
. We expect to activate sites in a pivotal Phase 2 clinical trial to evaluate defibrotide in the treatment of TA-TMA in the fourth quarter of 2018.
Other Activities
. We are also evaluating the potential of defibrotide in additional post-HSCT complications, as well as its potential utility in other serious, life-threatening conditions.
|
•
|
Asparaginase Programs
. We are pursuing activities related to the development of improved products, including recombinant crisantaspase, for patients with ALL or other hematological malignancies.
|
|
•
|
CombiPlex
. CombiPlex is a technology platform that enables the design and rapid evaluation of various combinations of therapies to deliver enhanced anti-cancer activity. CombiPlex seeks to identify the most synergistic ratio of drugs in vitro and fix this ratio in a nano-scale delivery complex that maintains the synergistic combination after administration. CombiPlex utilizes two proprietary nano-scale delivery platforms: liposomes to control the release and distribution of water-soluble drugs and drugs that are both water- and fat-soluble (amphipathic), and nanoparticles to control the release and distribution of non-water-soluble (hydrophobic) drugs. We are evaluating the use of CombiPlex in a number of therapeutic combinations in oncology.
|
We have also entered into in a number of licensing and collaboration agreements, including:
|
•
|
ImmunoGen
. In August 2017, we entered into a collaboration and option agreement with ImmunoGen, Inc., or ImmunoGen, granting us rights to opt into exclusive, worldwide licenses to develop and commercialize two early-stage, hematology-related antibody-drug conjugate, or ADC, programs, IMGN779 and IMGN632, as well as an additional ADC program to be designated during the term of the agreement. IMGN779 is a CD33-targeted ADC that ImmunoGen is investigating for the treatment of AML, and IMGN632 is a CD123-targeted ADC that ImmunoGen is investigating for the treatment of hematological malignancies, including AML and blastic plasmacytoid dendritic cell neoplasm. Both IMGN779 and IMGN632 are in Phase 1 testing.
|
|
•
|
Pfenex
. In July 2016, we entered into an agreement with Pfenex, Inc., or Pfenex, granting us worldwide rights to develop and commercialize multiple early-stage hematology product candidates and an option for us to negotiate a license for a recombinant pegaspargase product candidate. This agreement was amended in December 2017.
|
|
•
|
XL-protein
. In May 2017, we entered into a license agreement with XL-protein GmbH, or XLp, for the rights to develop, manufacture and commercialize products using XLp’s PASylation
®
technology to extend the plasma half-life of selected asparaginase product candidates.
|
We recorded research and development expenses of
$198.4 million
,
$162.3 million
and
$135.3 million
in
2017
,
2016
and
2015
, respectively. We also recorded charges of
$85.0 million
,
$23.8 million
and
$0.0 million
to in-process research and development in
2017
,
2016
and
2015
, respectively.
Sales and Marketing
We have commercial operations primarily in the U.S. and Europe. In the U.S., our products are marketed through our commercial teams, including approximately 160 trained, experienced sales professionals who promote Xyrem, Erwinaze, Defitelio, Vyxeos and Prialt directly to physicians in specialties appropriate for each product. We also provide reimbursement support for all of our U.S. products.
Outside of the U.S., our hematology and oncology sales force has approximately 25 hematology field specialists responsible for promoting Erwinase and Defitelio in approved markets where we commercialize these products. In those markets where Erwinase and Defitelio are not currently approved, approximately 24 medical science liaisons and nine medical directors are responsible for responding to medical information requests and for providing information consistent with local treatment protocols. We also utilize distributors in certain markets outside the U.S. where we do not market our products directly, as further described in “Business—Customers and Information About Geographic Areas” in this Part I, Item 1.
10
Our commercial activities include marketing-related services, distribution services and commercial support services. We employ third party vendors, such as advertising agencies, market research firms and suppliers of marketing and other sales support-related services, to assist with our commercial activities.
We have a relatively small number of sales representatives compared with the number of sales representatives of most other pharmaceutical companies with marketed products. We believe that the size of our sales force is appropriate to effectively reach our target audience for our marketed products in the specialty markets in which we currently operate. We promote Defitelio, Erwinaze and Vyxeos to many hematology and oncology specialists who operate in the same hospitals, and we believe that we benefit from operational synergies from this overlap. Continued growth of our current marketed products and the launch of any future products, including Vyxeos in Europe and solriamfetol, may require further expansion of our sales force and sales support organization in the U.S. and internationally.
Competition
The pharmaceutical industry is highly competitive and dominated by a number of large, established pharmaceutical companies, as well as specialty pharmaceutical companies that market products and develop product candidates in sleep, hematology/oncology, pain and other therapeutic areas. Many of these companies, particularly large pharmaceutical and life sciences companies, have substantially greater financial, operational and human resources than we do. They can spend more on, and have more expertise in, research and development, regulatory, manufacturing, distribution and sales activities. As a result, our competitors may obtain regulatory approvals for their product candidates more rapidly than we may and may market their products more effectively than we do. Smaller or earlier stage companies may also prove to be significant competitors, particularly through collaborative arrangements with large, established companies.
Our ability to continue to grow requires that we compete successfully with other pharmaceutical companies for product and product candidate acquisition and in-licensing opportunities. These competitors include other specialty pharmaceutical companies and established companies that may have a competitive advantage over us due to their size and financial resources.
We also face competition, and may in the future face additional competition, from manufacturers of generic drugs. Certain U.S. state laws allow for, and in some instances in the absence of specific instructions from the prescribing physician mandate, the dispensing of generic products rather than branded products where a generic version is available. Generic competition often results in decreases in the prices at which branded products can be sold, particularly when there is more than one generic available in the marketplace. Other companies could also develop products that are similar, but not identical, to our marketed products, such as an alternative formulation or an alternative delivery technology, and seek approval in the U.S. through a Section 505(b)(2) NDA approval pathway that allows companies to seek approval of a product that is similar, but not identical, to a previously-approved brand-name product, and rely to some degree on the previously-approved product’s safety and efficacy data.
Our products and product candidates may also compete in the future with new products currently under development by others. Any products that we develop are likely to be in a highly competitive market, and many of our competitors may succeed in developing products that may render our products obsolete or noncompetitive. In particular, certain of our products and product candidates face or may face competition as described below:
|
•
|
Xyrem
. While Xyrem is the only product approved by the FDA and currently marketed in the U.S. for the treatment of both cataplexy and EDS in patients with narcolepsy, nine companies have filed ANDAs with the FDA seeking approval to market a generic version of Xyrem, the FDA has approved or tentatively approved three ANDAs and we believe that it is likely that the FDA will approve or tentatively approve additional ANDAs. We settled ANDA patent lawsuits against five ANDA filers and, in connection with those settlement agreements, we granted each of the settling filers rights to sell an AG Product and/or its own generic sodium oxybate product as described elsewhere in this Annual Report on Form 10-K. We have ongoing patent lawsuits against the remaining ANDA filers and cannot predict the specific timing or outcome of events with respect to those and other proceedings with such filers or whether there will be additional ANDA filers. Accordingly, the actual timing of any commercial launch of an AG Product or a generic sodium oxybate product is uncertain.
|
In addition to generic competition, other companies could develop and launch sodium oxybate or other products that are similar, but not identical, to Xyrem, such as an alternative formulation or a different delivery technology, and seek approval in the U.S. by referencing Xyrem and relying, to some degree, on the FDA’s approval of Xyrem and related determinations of safety and efficacy. For example, Avadel Pharmaceuticals plc, or Avadel, a company that is using its proprietary technology for delivery of a sodium oxybate formulation to eliminate second nighttime dosing for narcolepsy patients, has stated that it is conducting a Phase 3 pivotal trial pursuant to an FDA-approved special protocol assessment, and has indicated that it intends to seek approval of its product candidate using a Section 505(b)(2) NDA approval pathway referencing Xyrem. We are also aware of products being developed by others for use as
11
treatment options in cataplexy and/or EDS in patients with narcolepsy that have different safety profiles and mechanisms of action than Xyrem, including a product to treat adult patients with narcolepsy with or without cataplexy that received marketing approval in Europe in 2016. While this product is currently not approved by the FDA for marketing in the U.S., the company that has exclusive U.S. commercialization rights to this product has announced that it expects to establish an expanded access program for the product in early 2018 and to submit an NDA to the FDA for the treatment of narcolepsy in adult patients during the first half of 2018. The receipt of marketing approval and commercialization of this product, Avadel’s product or other products that may be approved in the U.S. for the treatment of narcolepsy patients could, depending on the targeted patient population, reduce Xyrem sales, which could have the additional effect of potentially triggering acceleration of market entry of AG Products or other generic sodium oxybate products under our ANDA litigation settlement agreements, as described elsewhere in this Annual Report on Form 10-K.
As alternatives to Xyrem, cataplexy is often treated with tricyclic antidepressants and selective serotonin reuptake inhibitors, or SSRIs, or selective norepinephrine reuptake inhibitors, or SNRIs, even though these products are not approved by the FDA for the treatment of cataplexy. Tricyclic antidepressants are a class of antidepressant drugs first used in the 1950s. The use of these drugs can often result in somnolence, which exacerbates the EDS already experienced by all patients with narcolepsy. SSRIs and SNRIs are compounds typically used for the treatment of clinical depression. Somnolence and insomnia are commonly reported side effects of SSRIs, while loss of sleep is a commonly reported side effect of SNRIs. These side effects may be problematic for patients with narcolepsy.
The only other products both approved by the FDA and currently marketed for the treatment of EDS in patients with narcolepsy are Provigil
®
(modafinil) and Nuvigil
®
(armodafinil), which are marketed by Teva Pharmaceutical Industries Limited, or Teva, and generic versions of Provigil. Provigil, its generic equivalents and Nuvigil are also approved for improving wakefulness in patients with EDS associated with treated OSA or shift work disorder. Xyrem is often used in conjunction with stimulants and wakefulness promoting agents, including Provigil, its generic equivalents and Nuvigil, which are administered during the day.
For further discussion regarding legal proceedings related to Xyrem, the risks associated with our ANDA settlement agreements, the approval and tentative approval of ANDAs, the potential launch of AG Products or generic versions of Xyrem, or the approval and launch of other sodium oxybate or other products that compete with Xyrem, as well as other risks and challenges we face with respect to Xyrem, see “Business—Government Regulation—
The Hatch-Waxman Act
” in this Part I, Item 1, the risk factors under the heading “Risks Related to Xyrem and the Significant Impact of Xyrem Sales,” Risks Related to Our Intellectual Property” and the risk factor under the heading “
We face substantial competition from other companies, including companies with greater resources, including larger sales organizations and more experience working with large and diverse product portfolios, than we have
” in Part I, Item 1A of this Annual Report on Form 10‑K and “Legal Proceedings” in Part I, Item 3 of this Annual Report on Form 10‑K.
|
•
|
Erwinaze
. Erwinaze is a biologic product used in conjunction with chemotherapy and is indicated for patients with ALL who have developed hypersensitivity to
E. coli
-derived asparaginase. While there is currently no direct competition to Erwinaze to treat ALL patients with hypersensitivity to
E. coli
-derived asparaginase, other companies have developed or are developing new treatments for ALL, including new asparaginase treatments that could reduce the rate of hypersensitivity in patients with ALL, and new treatment protocols are being developed for ALL that may not include asparaginase-containing regimens. For example, a number of companies are developing new immunotherapy treatments for relapsed or refractory ALL patients, including one treatment that was recently approved. The development of these new treatments could negatively impact our ability to grow sales of Erwinaze in patient populations where the benefit of an asparaginase-containing regimen is not well established. As a biologic product, Erwinaze also faces potential competition from biosimilar products.
|
|
•
|
Defitelio
.
Defitelio is the only approved treatment in the U.S. for the treatment of adult and pediatric patients with VOD, also known as SOS, with renal or pulmonary dysfunction following HSCT and the only approved treatment in the EU for severe VOD in adults and children undergoing HSCT. Various anti-clotting strategies have been tried by researchers in patients with VOD with mixed results, including Activase (alteplase), a recombinant tissue plasminogen activator marketed by Genentech, Inc., generic heparin sodium injection and Thrombate III (antithrombin III (human)), marketed by Grifols Therapeutics, Inc. While there is currently no direct competition to Defitelio to treat severe VOD, changes in the types of conditioning regimens used as part of HSCT may affect the incidence rate of VOD and demand for Defitelio.
|
|
•
|
Vyxeos
. AML, the cancer indication for which we commercialize Vyxeos, has alternative established therapies. A key consideration in the treatment of AML patients is the patient’s suitability for chemotherapy. The patient population studied in the Vyxeos Phase 3 clinical trial included AML patients deemed able to tolerate chemotherapy. The existing options for the treatment of newly-diagnosed t-AML patients who can tolerate chemotherapy include
|
12
cytarabine in combination with an anthracycline (i.e., daunorubicin), known as 7+3. In addition, we are aware of several other products that have been recently approved by the FDA or are in development for use as treatment options for AML patients, such as targeted agents (FLT-3, IDH-1, IDH-2, CD-33, CAR T‑cell). Some of the patient populations being studied for these products in development overlap with the patient population studied in the Vyxeos Phase 3 clinical trial. The existence of established treatment options and the development of competing products for the treatment of newly-diagnosed t-AML or AML-MRC could negatively impact our ability to successfully commercialize Vyxeos and achieve the level of sales we expect.
|
•
|
Solriamfetol
. With respect to solriamfetol, other treatments for ES in patients with narcolepsy include stimulants and wake-promoting agents, such as Provigil and Nuvigil, and generic versions of stimulants and wake-promoting agents. We are also aware of off-label uses of stimulants for ES in patients with OSA. Solriamfetol, if approved by the FDA, will likely face competition from this genericized market. In addition, we are aware of several other products in development for use as potential treatment options for ES in patients with narcolepsy or OSA, including, for example, pitolisant, mazindol, modafinil combinations and Avadel’s once-nightly sodium oxybate formulation.
|
For more information on the competitive risks we face generally, see the risk factor under the heading “
We face substantial competition from other companies, including companies with greater resources, including larger sales organizations and more experience working with large and diverse product portfolios, than we have”
in Part I, Item 1A of this Annual Report on Form 10-K.
Customers and Information About Geographic Areas
In the U.S., our lead marketed product, Xyrem, is sold to one specialty pharmacy, Express Scripts, which ships Xyrem directly to patients. Erwinaze, Defitelio and Vyxeos are sold to hospitals through a specialty distributor, McKesson Corporation. Prialt is sold in the U.S. through an exclusive pharmacy to other pharmacies and medical facilities, and our other products are sold in the U.S. primarily to distributors who distribute the product to pharmacies and hospitals. We have distribution services agreements made in the ordinary course of business with these distributors, which include prompt payment discounts and various standard service fees or rebate arrangements. Purchases are made on a purchase order basis.
Outside of the U.S., we distribute Erwinase through Durbin PLC, a UK-based wholesaler and distributor, to hospitals and local wholesalers in Europe where we market Erwinase directly and, in markets where we do not market Erwinase directly, to local distributors and wholesalers in Europe and elsewhere in the world. We distribute Defitelio in European countries where the product has been launched commercially primarily through IDIS Limited, or IDIS, a UK-based distributor. We also work with IDIS and a number of local distributors in Europe and elsewhere in the world to distribute defibrotide on a named patient basis.
Xyrem is currently sold in 21 countries by UCB (which has rights to market Xyrem in 54 countries), and, as of January 1, 2018, we directly market Xyrem in Canada for the treatment of cataplexy in patients with narcolepsy. We had previously licensed the Canadian marketing rights to Xyrem to Valeant and supplied Xyrem to Valeant.
Eisai has rights to market Prialt in numerous countries outside of the U.S. While we retain the rights to Prialt in the remaining non-U.S. territories, we are not currently selling the product outside of the U.S.
Information on our total revenues by product, attributed to U.S. and non-U.S. sources and attributed to customers who represented at least 10% of our total revenues in each of
2017
,
2016
and
2015
, as well as the location of our long-lived assets, is included in Note 16 to our consolidated financial statements in this Annual Report on Form 10-K.
We are headquartered in Dublin, Ireland. We also have offices in Palo Alto, California; Philadelphia, Pennsylvania; Ewing, New Jersey; Vancouver, British Columbia; Oxford, United Kingdom; Lyon, France; Villa Guardia (Como), Italy; Athlone, Ireland; and elsewhere in Europe. For a discussion of risks related to our operations, see the risk factors under the headings “Risks Related to Our Business,” “Risks Related to Our Industry” and “Risks Related to Our Financial Condition and Results” in Part I, Item 1A of this Annual Report on Form 10-K and “Quantitative and Qualitative Disclosure About Market Risk” in Part II, Item 7A of this Annual Report on Form 10-K.
Manufacturing
We received FDA approval of our manufacturing and development facility in Athlone, Ireland in June 2016, and we commenced commercial operations at this facility in the third quarter of 2016. We are using this facility for the manufacture of Xyrem and development-stage product candidates, including JZP-507 and JZP-258, and we expect to manufacture these products commercially at our Athlone facility should these candidates receive regulatory approval. However, other than our Athlone facility and our manufacturing plant in Italy where we produce the defibrotide drug substance, we currently do not have our own commercial manufacturing capability for our products, product candidates, or their APIs, or packaging capability.
13
As a result, our ability to develop and supply products in a timely and competitive manner depends primarily on third party suppliers, in most cases single source suppliers, being able to meet our ongoing commercial and clinical trial needs.
Lead Marketed Products
Xyrem.
In 2010, we entered into an agreement with Siegfried (USA) Inc., subsequently renamed Siegfried USA, LLC, or Siegfried, for the supply of sodium oxybate, the API of Xyrem. Siegfried supplies sodium oxybate to our U.S.-based manufacturer of Xyrem and, through a Siegfried affiliate in Europe, to our Athlone facility. Although Siegfried has been our only supplier of sodium oxybate since 2012, we have the right to purchase a portion of our worldwide requirements of sodium oxybate from other suppliers. Under our agreement, we provide periodic rolling forecasts to Siegfried, and a portion of each rolling forecast constitutes a firm purchase order. The agreement with Siegfried expires in April 2021, subject to automatic three-year extensions until either party provides notice to the other of its intent to terminate the agreement at least 18 months before the end of the then-current term. Either party has the right to terminate the agreement in the event of the other party’s uncured material breach or insolvency. During the term of the agreement and, under certain circumstances for 18 months after the agreement terminates, Siegfried is not permitted to manufacture sodium oxybate for any other company.
Effective October 1, 2015, we entered into a Master Manufacturing Services Agreement, or the Master Agreement, with Patheon Pharmaceuticals Inc., which we refer to together with its affiliates as Patheon. The Master Agreement establishes the general terms and conditions pursuant to which Patheon will provide manufacturing services for drug products, including Xyrem, as specified by us in product agreements entered into from time to time. Although we have commenced manufacturing of Xyrem in our Athlone facility, we expect to rely on Patheon as our U.S.-based supplier of Xyrem for the foreseeable future. However, we are not required to purchase Xyrem exclusively from Patheon. The Master Agreement expires on December 31, 2020 and may be extended for additional two-year terms if Patheon is then providing manufacturing services for any product, unless either party provides 18 months prior notice of termination. In addition, we may terminate the Master Agreement for any reason upon 12 months’ prior written notice, and either party has the right to terminate the agreement in the event of the other party’s uncured material breach.
Quotas from the DEA are required in order to manufacture and package sodium oxybate and Xyrem in the U.S. For information related to DEA quota requirements, see “Business—Government Regulation—Other Regulatory Requirements—Controlled Substance Regulations” in this Part I, Item 1.
Erwinaze.
Erwinaze is exclusively licensed to us, and manufactured for us, by PBL, a company that is wholly owned by the UK Secretary of State for Health, which is our sole supplier for Erwinaze. Our license and manufacturing agreement with PBL expires in December 2020, subject to automatic five-year extensions unless terminated by either party in writing by December 2018. Either party has the right to terminate the agreement in the event of the other party’s uncured material breach or insolvency. We provide periodic rolling forecasts to PBL, and a portion of each rolling forecast constitutes a firm purchase order. The Erwinaze BLA includes a number of post-marketing commitments related to the manufacture of Erwinaze by PBL.
In January 2017, the FDA issued a warning letter to PBL indicating that it was not satisfied with PBL’s responses to the FDA Form 483 issued to PBL in March 2016 and citing significant violations of current Good Manufacturing Practices, or cGMP, for finished pharmaceuticals and significant deviations from cGMP for APIs. In March 2017, PBL filed a response to the warning letter with the FDA. PBL continues to address the issues identified by the FDA in the warning letter. In the UK, where PBL’s manufacturing facilities are located, PBL is subject to similar inspections conducted by the UK Medicines and Healthcare Products Regulatory Agency, or MHRA. Following a site inspection of PBL by MHRA in December 2017, MHRA issued an inspection report listing several major findings, including major deficiencies and failures by PBL to comply with cGMP. In January 2018, PBL filed a response to the report with the MHRA. We cannot predict if or when PBL will correct the violations and deviations to the satisfaction of the FDA and MHRA or whether the FDA and MHRA will be satisfied with PBL’s responses. Any failure by PBL to respond to the satisfaction of the FDA and MHRA could result in enforcement actions by the FDA or MHRA, including the FDA refusing admission of Erwinaze into the U.S.
Moreover, the current manufacturing capacity for Erwinaze is completely absorbed by demand for the product. We are working with PBL to address the production delays and quality challenges, and related regulatory scrutiny. As a consequence of constrained manufacturing capacity, we have had an extremely limited or no ability to build product inventory levels that can be used to absorb supply disruptions resulting from quality, regulatory or other issues. We have experienced product quality, manufacturing and inventory challenges that have resulted, and may continue to result from time to time, in disruptions in our ability to supply certain markets and have caused, and may in the future cause, us to implement batch-specific, modified product use instructions. Most recently, we have been experiencing temporary supply disruptions in the first quarter of 2018 in the U.S. and other countries. We cannot predict whether the required remediation activities in connection with the January 2017 FDA warning letter or the December 2017 MHRA report will further strain manufacturing capacity and adversely affect Erwinaze supply, particularly in light of our extremely limited product inventory. As capacity constraints and supply disruptions continue, whether as a result of continued quality, manufacturing or regulatory issues or otherwise, we will be
14
unable to build a desired excess level of product inventory, our ability to supply the market may continue to be compromised and physicians’ decisions to use Erwinaze have been, and may continue to be, negatively impacted.
If quality, manufacturing or regulatory issues persist and result in a disruption to supply or capacity constraints, under our agreement with PBL, we do not have the right to engage a backup supplier for Erwinaze except in very limited circumstances, such as following the termination of the agreement by us due to the uncured material breach or the cessation of manufacturing by our supplier. If we are required to engage a backup or alternative supplier, the transfer of technical expertise and manufacturing process to the backup or alternative supplier would be difficult, costly and time-consuming, might not be successful and would increase the likelihood of a delay or disruption in manufacturing or a shortage of supply of Erwinaze. If we fail to obtain a sufficient supply of Erwinaze, our sales of and revenues from Erwinaze, our future maintenance and potential growth of the market for this product, and/or our business, financial condition, results of operations and growth prospects could be materially adversely affected.
Defitelio/defibrotide. We are our sole supplier of, and we believe that we are currently the sole worldwide producer of, the defibrotide drug compound. We manufacture the defibrotide compound in a single facility located in Villa Guardia, near Como, Italy. Patheon currently processes the defibrotide compound into its finished vial form under a specific product agreement entered into under an agreement with Patheon. Patheon is the sole provider of our commercial and clinical supply of Defitelio; however, we are not required to purchase Defitelio exclusively from Patheon. If Patheon does not or is not able to supply us with Defitelio for any reason, it may take time and resources to implement and execute the necessary technology transfer to another processor, and such delay could negatively impact our anticipated revenues from Defitelio and could potentially cause us to breach contractual obligations with customers or to violate local laws requiring us to deliver the product to those in need.
Vyxeos.
Vyxeos is manufactured using our CombiPlex technology platform, which we acquired through the acquisition of Celator Pharmaceuticals, Inc. CombiPlex products represent formulations with increased manufacturing complexities associated with producing drug delivery vehicles encapsulating two or more drugs that are maintained at a fixed ratio and, in the case of Vyxeos, two drugs that are co-encapsulated in a freeze-dried format. Vyxeos is manufactured by Baxter Oncology GmbH, or Baxter, which is a sole source supplier from a single site location. Our manufacturing agreement with Baxter expires in August 2022, subject to automatic three-year renewal terms, unless terminated by either party 24 months’ prior to the end of the initial term or any renewal term. Either party has the right to terminate the agreement for breach, subject to customary cure periods, and either party may terminate the agreement immediately in the event of the other party’s insolvency. While other contract manufacturers may be able to produce Vyxeos, the proprietary technology that supports the manufacture of Vyxeos is not easily transferable.
Product Candidates
Siegfried has supplied us with both the API and finished product for our development activities involving solriamfetol, including our Phase 3 clinical trials. We expect that Siegfried will manufacture and supply solriamfetol drug product for commercial sale if solriamfetol receives regulatory approval and that, in the short term, Siegfried will be the sole provider of our commercial supply of solriamfetol. We also expect that solriamfetol will be subject to scheduling by the DEA, which will need to be completed after NDA approval, and depending on DEA’s scheduling classification, we may be required to obtain a DEA quota for Siegfried to manufacture solriamfetol. For information related to DEA quota requirements, see “Business—Government Regulation—Other Regulatory Requirements—Controlled Substance Regulations” in this Part I, Item 1. If Siegfried does not or is not able to supply us with solriamfetol for any reason, including due to a failure to obtain any necessary DEA quotas, it may take time and resources to implement and execute the necessary technology transfer to another provider, and such delay could negatively impact our anticipated revenues from an approved solriamfetol product.
JZP-507 and JZP-258 are currently manufactured at our Athlone facility, and we expect to manufacture these products commercially at our Athlone facility should these candidates proceed through development and receive regulatory approval. Certain of our other product candidates and their APIs are supplied to us by third party contract manufacturers.
For further discussion of the challenges we face with respect to supply of our products and product candidates, see the risk factor under the heading “
The loss of our single source suppliers, delays or problems in the supply of our products for commercial sale or our product candidates for use in our clinical trials, or our or our suppliers’ failure to comply with manufacturing regulations, could materially and adversely affect our business, financial condition, results of operations and growth prospects”
in Part I, Item 1A of this Annual Report on Form 10‑K.
15
Patents and Proprietary Rights
We actively seek to patent, or to acquire or obtain licenses to third party patents, to protect our products and related inventions and improvements that we consider important to our business. We own a portfolio of U.S and non-U.S. patents and patent applications and have licensed rights to a number of issued patents and patent applications. Our owned and licensed patents and patent applications cover or relate to our products and product candidates, including certain formulations, uses to treat particular conditions, distribution methods and methods of administration, drug delivery technologies and delivery profiles and methods of production. Patents extend for varying periods according to the date of the patent filing or grant and the legal term of patents in the various countries where patent protection is obtained. The patent laws of non-U.S. countries differ from those in U.S., and the degree of protection afforded by non-U.S. patents may be different from the protection offered by U.S. patents.
The patents and patent applications that relate to our lead marketed products and product candidates include:
|
•
|
Xyrem.
We have 22 patents in the U.S. relating to Xyrem that expire at various times from December 2019 to March 2033, of which 18 are listed in the FDA’s publication “Approved Drug Products with Therapeutic Equivalence Evaluations,” or the Orange Book. These patents relate to Xyrem’s stable and microbially resistant formulation, its manufacturing process, its method of use, including its restricted distribution system, and its method of administration. Of the patents listed in the Orange Book, five are formulation patents expiring between December 2019 and July 2020; seven are associated with the Xyrem REMS, expiring between December 2022 and June 2024; three are method of use patents covering Xyrem’s use in narcolepsy, which expire in December 2019; and three are method of administration patents relating to a drug-drug interaction, or DDI, between Xyrem and divalproex sodium expiring in March 2033. Four patents are not listed in the Orange Book but also relate to Xyrem: two for methods for making the formulation expiring December 2019, one for a distribution system expiring June 2024 and one for method of administration expiring March 2033. We have received a pediatric written request from the FDA, and we intend to submit the results of a pediatric clinical study in response to this request. If the FDA determines that the submission meets the terms and conditions of the written request, then six months of pediatric exclusivity will be added to the term of each patent listed for Xyrem in the Orange Book. A Xyrem formulation patent has issued in multiple non-U.S. countries and will expire in December 2019. In November 2017, the European Patent Office issued a patent related to the method of administration of Xyrem relating to the DDI between Xyrem and divalproex sodium, expiring in February 2034. In addition to our issued patents, we have patent applications relating to Xyrem pending in the U.S. and other countries.
|
Nine companies have filed ANDAs with the FDA seeking approval to market a generic version of Xyrem. We filed patent lawsuits against each of the ANDA filers in the District Court asserting that such generic products would violate our patents covering Xyrem. We have settled lawsuits against five of the ANDA filers. Certain ANDA filers filed petitions for inter partes review, or IPR, by the Patent Trial and Appeal Board, or the PTAB, of the U.S. Patent and Trademark Office, or USPTO, with respect to the validity of certain distribution, method of use and formulation patents covering Xyrem. The PTAB instituted IPR trials with respect to certain of these petitions. In July 2016 and March 2017, the PTAB issued final decisions that the claims of six patents and three claims in a seventh patent associated with the Xyrem REMS are unpatentable. Those PTAB decisions are part of a consolidated appeal currently pending before the United States Court of Appeal for the Federal Circuit, or Federal Circuit. If the Federal Circuit upholds the PTAB decisions on appeal, we will not be able to enforce claims the PTAB found unpatentable. For further description of these legal proceedings, see “Legal Proceedings” in Part I, Item 3 of this Annual Report on Form 10-K.
In September 2016, Jazz Pharmaceuticals, Inc., our wholly owned subsidiary, submitted a Citizen Petition to the FDA requesting that, for safety reasons, the FDA refuse to approve any sodium oxybate ANDA with a proposed package insert or REMS that omits the portions of the Xyrem package insert and the Xyrem REMS that instruct prescribers on adjusting the dose of the product when it is co-administered with divalproex sodium (also known as valproate or valproic acid). In January 2017, the FDA granted the Citizen Petition with respect to the Xyrem package insert, concluding that it will not approve any sodium oxybate ANDA referencing Xyrem that does not include in its package insert the portions of the currently approved Xyrem package insert related to the DDI with divalproex sodium. Our Xyrem DDI patents cover these instructions on the Xyrem package insert and Xyrem REMS. We cannot predict whether one or more of the non-settling ANDA filers, or a company that files a Section 505(b)(2) application for a drug referencing Xyrem, may pursue regulatory strategies to avoid infringing our method of administration patents notwithstanding the FDA’s response to the Citizen Petition, or whether any such strategy would be successful. Likewise, we cannot predict whether we will be able to maintain the validity of any of our patents or will otherwise obtain a judicial determination that a generic or other sodium oxybate product, its package insert or the generic sodium oxybate REMS or another separate REMS will infringe any of our patents or, if we prevail in proving infringement, whether a court will grant an injunction that prevents any non-settling ANDA filer or
16
other company introducing a different sodium oxybate product from marketing its product, or instead require that party to pay damages in the form of lost profits or a reasonable royalty.
For a description of the foregoing matters, see “Business-Government Regulation-The Hatch-Waxman Act” in this Part I, Item 1, the risk factors under the headings “Risks Related to Xyrem and the Significant Impact of Xyrem Sales” and “Risks Related to Our Intellectual Property” in Part I, Item 1A of this Annual Report on Form 10-K and “Legal Proceedings” in Part I, Item 3 of this Annual Report on Form 10-K.
|
•
|
Erwinaze
. Erwinaze has no patent protection. It was granted orphan drug exclusivity by the FDA for the treatment of ALL in the U.S. until November 2018, and we believe that it is protected by exclusivity that prevents approval of a biosimilar in the U.S. through late 2023 under the BPCIA. For more details, see “Business—Government Regulation—Orphan Drug and Other Exclusivities” in this Part I, Item 1.
|
|
•
|
Defitelio
. The unique process of deriving defibrotide from porcine DNA is extensive and uses both chemical and biological processes that rely on complex characterization methods. We have a portfolio of U.S. and non-U.S. patents and patent applications relating to various compositions, methods of use and methods of characterization, some of which have expired and others will expire at various times between now and June 2035. None of these patents are listed in the Orange Book. Defibrotide has been granted orphan drug designation by the EC and the Korean Ministry of Food and Drug Safety to treat and prevent VOD. The Commonwealth of Australia-Department of Health has granted defibrotide orphan drug designation for the treatment of VOD. In addition, the EC has granted orphan drug designation to defibrotide for the prevention of aGvHD.
|
|
•
|
Vyxeos.
We have a portfolio of U.S. and non-U.S. patents and patent applications for Vyxeos and the CombiPlex technology platform relating to various compositions and methods of use. These include three U.S. patents expiring between April 2025 and April 2029 and two U.S. patents covering CombiPlex expiring in January 2027, subject to any patent term extensions. Vyxeos has been granted orphan drug exclusivity by the FDA until August 2024, seven years from its FDA approval, for the treatment of adults with newly-diagnosed t-AML or AML-MRC. In addition, Vyxeos has been granted orphan drug designation by the EC for the treatment of AML.
|
|
•
|
Solriamfetol
. We acquired rights to solriamfetol from Aerial in January 2014, including Aerial’s patent rights relating to solriamfetol, other than in certain jurisdictions in Asia where SK retains rights. We have a portfolio of U.S. and non-U.S. patents and patent applications for solriamfetol relating to various compositions and methods of use. Three U.S. method of use patents covering treatment of sleep-related conditions will expire between June 2026 and August 2027, subject to any patent term extension.
|
|
•
|
JZP-507 and JZP-258.
Certain patents and patent applications relating to Xyrem cover JZP-507 and JZP-258. In addition, JZP-507 and JZP-258 are claimed in formulation patents that will expire in January 2033.
|
We also rely on trade secrets and other unpatented proprietary information, to protect our products and commercial position, particularly with respect to our products with limited or no patent protection, such as Erwinaze. We seek to protect our trade secrets and other unpatented proprietary information in part through confidentiality agreements with our employees, consultants, advisors and partners. Nevertheless, our employees, consultants, advisors and partners may unintentionally or willfully disclose our proprietary information to competitors, and we may not have adequate remedies for such disclosures. In addition, if our employees, consultants, advisors or partners develop inventions or processes independently, or jointly with us, that may be applicable to our products, disputes may arise about ownership or proprietary rights to those inventions and processes. Such inventions and processes will not necessarily become our property but may remain the property of those third parties or their employers. Enforcing a claim that a third party illegally obtained, or is using any of our inventions or trade secrets is expensive and time-consuming, and the outcome is unpredictable. In addition, courts outside of the U.S. are sometimes less willing to protect trade secrets. Moreover, our competitors may independently develop equivalent knowledge, methods and know-how.
For further discussion of the challenges we face in obtaining or maintaining patent and/or trade secret protection, see the risk factors under the heading “Risks Related to Our Intellectual Property” in Part I, Item 1A of this Annual Report on Form 10‑K.
In addition, we have a number of trademarks and service marks, and pending trademark and service mark applications, in the U.S. and elsewhere in the world to further protect the proprietary position of our products.
Government Regulation
The manufacturing, labeling, packaging, adverse event reporting, storage, advertising, promotion, sale, distribution, record keeping, importing and exporting of our products and our research and development activities are subject to extensive regulation by the FDA, the EC, the competent authorities of the EU member states and other regulatory authorities.
17
Regulations differ from country to country. As a result of these regulations, product development, approval and commercialization processes are expensive and time-consuming.
Approval of Pharmaceutical Products
We are not permitted to market a pharmaceutical product in the U.S. or in the EU member states until we receive approval from the FDA, the EC or the competent authorities of the EU member states, as applicable. An application for marketing approval must contain information demonstrating the quality, safety and efficacy of the pharmaceutical product.
United States
In the U.S., the FDA regulates the review, approval, manufacturing and marketing of our products. The steps required before a drug or biologic may be approved for marketing in the U.S. generally include:
|
•
|
preclinical laboratory tests and animal tests;
|
|
•
|
submission to the FDA of an investigational new drug application, or IND, for human clinical testing, which must become effective before human clinical trials commence;
|
|
•
|
adequate and well-controlled human clinical trials to establish the safety and efficacy of the drug or biologic for each indication, as further described below;
|
|
•
|
the submission to the FDA of the NDA or BLA;
|
|
•
|
satisfactory completion of an FDA inspection of the manufacturing facilities at which the product is made, analyzed and stored to assess compliance with cGMP;
|
|
•
|
potential FDA audit of the nonclinical and clinical trial sites that generated the data in support of the application; and
|
|
•
|
FDA review and approval of the application.
|
Human clinical trials conducted before approval of a product for a specific indication generally proceed in three sequential phases, although the phases may overlap. In Phase 1, the initial introduction of the drug into human subjects, the drug is typically tested to assess metabolism, pharmacokinetics, pharmacological actions and side effects associated with increasing doses. Phase 2 usually involves clinical trials in a limited patient population to determine the effectiveness of the drug for a particular indication or indications, dosage tolerance and optimum dosage and to identify common adverse effects and safety risks. If a drug demonstrates evidence of effectiveness and an acceptable safety profile in Phase 2, Phase 3 clinical trials are undertaken to obtain additional information about clinical efficacy and safety in a larger number of patients. In addition, Phase 4, or post-approval, clinical trials may be required by the FDA and are used to gain additional safety data or to document a clinical benefit in the case of products approved under Accelerated Approval regulations.
Clinical trials must be conducted in accordance with general investigational plans and protocols, as well as the FDA’s requirements, commonly referred to as good clinical practices, for conducting, recording and reporting the results of clinical trials to ensure that the data and results are credible and accurate and that the trial participants are adequately protected. The FDA enforces good clinical practices through periodic inspections of trial sponsors, principal investigators and trial sites.
To obtain FDA approval of a product candidate, an applicant, also called a sponsor, must submit certain data and information in the form of an NDA or BLA, as applicable, and generally pay a user fee. The FDA performs an initial review of a submitted NDA or BLA before it accepts it for filing and may refuse to file an application and/or request additional information before acceptance. Once an NDA or BLA submission is accepted for filing, the FDA begins an in-depth review of the application. Under the current goals and policies agreed to by the FDA under the Prescription Drug User Fee Act, or PDUFA, for a new molecular entity, the FDA has ten months from the filing decision in which to complete its initial review of a standard application and respond to the applicant, and eight months for a priority application for a new molecular entity. The FDA does not always meet its PDUFA goal dates, and in certain circumstances, the PDUFA goal date may be extended.
If the FDA determines that a REMS is necessary to ensure that the benefits of the drug outweigh the risks, a sponsor may be required to include a proposed REMS (as part of the application or after approval), which may include a patient package insert or a medication guide to provide information to consumers about the product’s risks and benefits; a plan for communication to healthcare providers; and restrictions on the product’s distribution referred to as elements to assure safe use, or ETASU. Xyrem is required to have a REMS. See the discussion regarding REMS under “Business—Government Regulation—
The Hatch-Waxman Act
” below and in the risk factors under the headings “
The distribution and sale of Xyrem are subject to significant regulatory oversight and restrictions and the requirements of a risk evaluation and mitigation strategy, and these restrictions and requirements, as well as the potential impact of changes to these restrictions and requirements, subject us to increased risks and uncertainties, any of which could negatively impact sales of Xyrem
” and “Risks Related to Our Intellectual Property” in Part I, Item 1A of this Annual Report on Form 10-K.
During the review of a marketing application, the FDA also evaluates any manufacturing and nonclinical and clinical trial facilities for the proposed product. When the FDA’s evaluation is complete, it issues an approval letter or a complete response letter. A complete response letter generally outlines the deficiencies in the submission and may require substantial additional testing or information in order for the FDA to reconsider the application. If and when those deficiencies have been addressed
18
to the FDA’s satisfaction in a resubmission of the application, the FDA will issue an approval letter. The FDA may also refer an application to the appropriate advisory committee, typically a panel of clinicians, for review, evaluation and a recommendation as to whether the application should be approved. The FDA is not bound by the recommendations of the advisory committee.
The FDA has and has used various programs, including Fast Track, Priority Review, Breakthrough Therapy and Accelerated Approval (Subpart H and E), that are intended to expedite the process for reviewing certain applications and/or provide for approval on the basis of surrogate endpoints or restricted distribution. Generally, drugs and biologics may be eligible for one or more of these programs if they are intended for serious or life-threatening diseases or conditions, have potential to address unmet medical needs, or may provide meaningful benefit over existing treatments.
Europe and Rest of World
Outside of the U.S., our ability to market a medicinal product generally depends upon receiving a marketing authorization from the appropriate regulatory authority. The requirements governing the conduct of clinical trials, obtaining marketing authorization, fulfillment of pharmacovigilance obligations, obtaining pricing and reimbursement and related matters vary widely from country to country. In any country, however, we will generally be permitted to commercialize our products if the appropriate regulatory authority is satisfied that we have presented adequate evidence of safety, quality and efficacy and grants a related authorization. The time needed to secure approval for medicinal products may be longer or shorter than that required for FDA approval.
In the EU, marketing authorization for medicinal products can be obtained through several different procedures. These are through a centralized, mutual recognition procedure, decentralized procedure, or national procedure (single EU member state). The centralized procedure allows a company to submit a single application to the EMA. Based on a positive opinion of the EMA, the EC will grant a centralized marketing authorization that is valid in all EU member states and three of the four European Free Trade Association, or EFTA, countries (Iceland, Liechtenstein and Norway). The centralized procedure is mandatory for certain medicinal products, including orphan medicinal products and biologic products, and optional for certain other products. The decentralized procedure allows companies to file identical applications for authorization to several EU member states simultaneously for medicinal products that have not yet been authorized in any EU member state. The competent authority of one EU member state, selected by the applicant, assesses the application for marketing authorization. The competent authorities of the other EU member states are subsequently required to grant marketing authorization for their territories on the basis of this assessment except where grounds of potential serious risk to public health require this authorization to be refused. The mutual recognition procedure allows companies that have a medicinal product already authorized in one EU member state to apply for this authorization to be recognized by the competent authorities in other EU member states.
The maximum timeframe for the evaluation of a marketing authorization application is 210 days, subject to certain exceptions. The initial marketing authorization granted in the EU is valid for five years. Once renewed, the authorization is usually valid for an unlimited period unless the national competent authority or the EC decides on justified grounds to proceed with one additional five-year renewal. The renewal of a marketing authorization is subject to a re-evaluation of the risk-benefit balance of the product by the national competent authorities or the EMA.
In addition, products may be granted marketing authorization under exceptional circumstances in the EU if an applicant can demonstrate that comprehensive data on the efficacy and safety of the product under normal conditions of use cannot be provided due to certain specified objective and verifiable reasons. A marketing authorization granted under exceptional circumstances is valid for five years, subject to an annual reassessment of conditions imposed by the competent authorities. In October 2013, the EC granted marketing authorization under exceptional circumstances for Defitelio for the treatment of severe VOD in adults and children undergoing HSCT.
The making available or placing on the EU market of unauthorized medicinal products is generally prohibited. However, the competent authorities of the EU member states may exceptionally and temporarily allow the supply of such products, either on a named patient basis or through a compassionate use process, to individual patients or a group of patients with a chronically or seriously debilitating disease or whose disease is considered to be life-threatening, and who cannot be treated satisfactorily by an authorized medicinal product.
Clinical studies must currently be conducted in accordance with the requirements of the EU Clinical Trials Directive and applicable good clinical practice standards. All entities conducting clinical trials in the EU will be required to comply with the requirements of the new EU Clinical Trials Regulation, which may enter into force in 2019. The new EU Clinical Trials Regulation, which will replace the EU Clinical Trials Directive, introduces a complete overhaul of the existing regulation of clinical trials for medicinal products in the EU, including a new coordinated procedure for authorization of clinical trials that is reminiscent of the mutual recognition procedure for marketing authorization of medicinal products, and an increased obligation on sponsors to publish clinical trial results.
19
The Hatch-Waxman Act
The approval process described above for the U.S. is premised on the applicant being the owner of, or having obtained a right of reference to, all of the data required to prove the safety and effectiveness of a drug product. This type of marketing application, sometimes referred to as a “full” or “stand-alone” NDA, is governed by Section 505(b)(1) of the Federal Food, Drug and Cosmetic Act, or FDCA. A Section 505(b)(1) NDA contains full reports of investigations of safety and effectiveness, which includes the results of preclinical and clinical trials, together with detailed information on the manufacture and composition of the product, in addition to other information as described above.
Alternatively, the Drug Price Competition and Patent Term Restoration Act of 1984, or the Hatch-Waxman Act, provides two abbreviated approval pathways for drug products that are in some way follow-on versions of products already covered by an approved NDA. The first path, under Section 505(b)(2), is for the approval of a product that is similar, but not identical, to a previously-approved brand-name product, which is referred to as the reference listed drug, or RLD. Under this path, the applicant is permitted to rely to some degree on the FDA’s finding that the RLD is safe and effective and must submit its own product-specific data of safety and effectiveness to the extent necessary because of the differences between the products. The FDA may then approve the new drug product for all or some of the label indications for which the RLD has been approved or for a new indication sought by the Section 505(b)(2) applicant.
The second path established under the Hatch-Waxman Act is for the approval of generic drugs. Section 505(j) of the FDCA permits the submission of an ANDA for a generic version of an approved, brand-name drug. Generally, an ANDA must contain data and information showing that the proposed generic product and the approved RLD (1) have the same active ingredient, in the same strength and dosage form, to be delivered via the same route of administration, (2) are intended for the same uses, and (3) are bioequivalent. This data and information are provided instead of independently demonstrating the proposed generic product’s safety and effectiveness, which are inferred from the fact that the generic product is the same as the RLD the FDA previously found to be safe and effective.
To the extent that an ANDA or a Section 505(b)(2) NDA applicant is relying on the FDA’s findings for an already-approved product, the applicant is required to certify that there are no patents listed for that product in the Orange Book, or that for each Orange Book-listed patent the listed patent has expired, or will expire on a particular date and approval is sought after patent expiration, or the listed patent is invalid or will not be infringed by the manufacture, use or sale of the new product. A certification that approval is sought after patent expiration is called a “Paragraph III Patent Certification.” A certification that the new product will not infringe the RLD’s Orange Book-listed patents or that such patents are invalid is called a “Paragraph IV Patent Certification,” or Paragraph IV Certification. If the patent is for an approved method of use, an ANDA or Section 505(b)(2) applicant can also file a statement, called a “section viii statement,” that the application does not seek approval of the use covered by the listed patent. If the applicant does not challenge the listed patents, the ANDA or the Section 505(b)(2) NDA will not be approved until all the listed patents claiming the RLD have expired, as well as any additional period of exclusivity that might be obtained for completing pediatric studies pursuant to the FDA’s written request. The ANDA or the Section 505(b)(2) NDA may also be subject to delay in review or approval based on applicable non-patent exclusivities, such as exclusivity that results from obtaining approval of a new chemical entity or of a new use of a previously approved active ingredient.
If the applicant has provided a Paragraph IV Certification to the FDA, the applicant must also send a notice of such certification to the holder of the NDA and the relevant patent holders once the ANDA or the Section 505(b)(2) NDA has been accepted for filing by the FDA. The NDA and patent holders may then initiate a legal challenge to the proposed generic product for infringing the patent. The filing of a patent infringement lawsuit within 45 days of receipt of a notice of Paragraph IV Certification automatically prevents the FDA from approving the ANDA or the Section 505(b)(2) NDA until the earliest of 30 months after the NDA holder’s receipt of the notice of Paragraph IV Certification, expiration of the patent, settlement of the lawsuit or a decision in the infringement case that is favorable to the ANDA applicant. The 30-month stay period may also be shortened or lengthened upon order of the court in the infringement lawsuit. For drugs with five-year exclusivity, if an action for patent infringement is initiated after year four of that exclusivity period, then the 30-month stay period is extended by such amount of time so that 7.5 years has elapsed since the approval of the NDA for the RLD. This period could be extended by six months if the NDA sponsor obtains pediatric exclusivity. Alternatively, if the listed patent holder does not file a patent infringement lawsuit within the required 45-day period, the applicant will not be subject to the 30-month stay. The FDA may issue tentative approval of an ANDA if the generic applicant meets all conditions for approval but cannot receive effective approval because the 30-month stay or another period of regulatory exclusivity, including an exclusivity held by another ANDA filer, has not expired. If an ANDA is approved after the 30-month stay and before conclusion of any relevant patent litigation at the district, and potentially appellate, court, a generic manufacturer could nonetheless choose to commercialize the generic product, also known as a launch “at risk.” In the event of such commercialization, the generic manufacturer generally would be liable for damages if the NDA holder ultimately prevails in the patent litigation.
20
Section 505-1(i)(1) of the FDCA generally provides that (i) an ANDA that references a drug subject to a REMS with ETASU is required to have a REMS with the same elements as the RLD and (ii) the ANDA drug and the RLD shall use a single shared system to assure safe use. However, the FDA may waive this requirement for a single shared system and approve an ANDA with a separate REMS with differing but comparable aspects of ETASU under certain circumstances.
The FDA approval of the West-Ward ANDA in January 2017 includes a waiver of the shared REMS requirement that permits West-Ward to use a separate REMS program from the Xyrem REMS, or the generic sodium oxybate REMS, on the condition that the generic sodium oxybate REMS be open to all future sponsors of ANDAs or NDAs for sodium oxybate products. This could potentially include future sodium oxybate products approved under Section 505(b)(2). In connection with the waiver, FDA issued a statement that it considers the generic sodium oxybate REMS to have the same ETASU as the Xyrem REMS and operationalizes those elements in a comparable manner to achieve the same level of safety as the Xyrem REMS.
Specifically, the FDA stated that both the Xyrem REMS and the generic sodium oxybate REMS require that (1) healthcare providers who prescribe the drug be specially certified; (2) the drug be dispensed only by pharmacies that are specially certified; and (3) the drug be dispensed and shipped only to patients who are enrolled in the REMS program with documentation of safe use conditions. However, the FDA stated that the generic sodium oxybate REMS, unlike the Xyrem REMS, permits multiple certified pharmacies and multiple databases that are connected via an electronic “switch” system. The generic sodium oxybate REMS also requires the certified pharmacies in its system to contact the Xyrem REMS program to verify that the patient has no other active prescriptions for Xyrem that overlap with the generic prescription to be filled and to identify any patient and prescriber disenrollments from the Xyrem system for suspected abuse, misuse and diversion.
We were not involved in development of the generic sodium oxybate REMS and were not consulted regarding any features of this REMS. Our settlement agreements with certain of the ANDA filers do not directly impact the FDA’s waiver of the single shared system REMS requirement, any other ANDA filer’s ability to develop and implement the generic sodium oxybate REMS for its generic sodium oxybate product or our ability to take any action with respect to the generic sodium oxybate REMS. We cannot predict the outcome or impact on our business of any future action that we may take with respect to the FDA’s waiver of the single shared system REMS requirement, its approval and tentative approval of generic versions of Xyrem or the consequences of distribution of sodium oxybate through the generic sodium oxybate REMS approved by the FDA or another separate REMS. We expect that the launch of any generic sodium oxybate product, including any AG Product, or the approval and launch of other products that compete with Xyrem, would be likely to have a material adverse effect on our sales of Xyrem and on our business, financial condition, results of operations and growth prospects. For more information, see the risk factors under the headings “Risks Related to Xyrem and the Significant Impact of Xyrem Sales” and “Risks Related to Our Intellectual Property” in Part I, Item 1A of this Annual Report on Form 10‑K.
Under the Hatch-Waxman Act, newly approved drugs and indications may benefit from a statutory period of non-patent marketing exclusivity. The Hatch-Waxman Act provides five-year marketing exclusivity to the first applicant to gain approval of an NDA for a new chemical entity, meaning that the FDA has not previously approved any other new drug containing the same active moiety. The Hatch-Waxman Act prohibits the FDA from accepting for review an ANDA or a Section 505(b)(2) NDA for another version of such drug during the five-year exclusive period; however, as explained above, submission of an ANDA or Section 505(b)(2) NDA containing a Paragraph IV Certification is permitted after four years, which may trigger litigation leading to a 30-month stay of approval of the ANDA or Section 505(b)(2) NDA that could extend to 7.5 years after approval of the RLD. Protection under the Hatch-Waxman Act will not prevent the submission or approval of another “full” NDA; however, the applicant would be required to conduct its own preclinical and adequate and well-controlled clinical trials to demonstrate safety and effectiveness. The Hatch-Waxman Act also provides three years of marketing exclusivity for the approval of new and supplemental NDAs, including Section 505(b)(2) NDAs, for, among other things, new indications, dosages, or strengths of an existing drug, if new clinical investigations that were conducted or sponsored by the applicant are determined by the FDA to be essential to the approval of the application.
The Hatch-Waxman Act also permits a patent term extension of up to five years as compensation for patent term lost during product development and the FDA regulatory review process. However, a patent term extension cannot extend the remaining term of a patent beyond a total of 14 years after the FDA approves a marketing application. The patent term extension period is generally equal to the sum of one-half the time between the effective date of an IND and the submission date of an NDA, and all of the time between the submission date of an NDA and the approval of that application, up to a total of five years. Only one patent applicable to a product or its use may be extended, and only if the regulatory review leads to the first commercial marketing of that drug, and the extension must be applied for prior to expiration of the patent. The USPTO, in consultation with the FDA, reviews and approves applications for patent term extension. We will consider applying for a patent term extension for some of our patents to add patent life beyond the expiration date, if we meet the legal requirements permitting an extension and depending on the expected length of clinical trials and other factors involved in the submission of an NDA.
We intend to vigorously defend any patents for our approved products, including our Orange Book-listed patents. For a further description of these matters, see “Legal Proceedings” in Part I, Item 3 of this Annual Report on Form 10-K, and the risk
21
factors under the headings “Risks Related to Xyrem and the Significant Impact of Xyrem Sales” and “Risks Related to Our Intellectual Property” in Part I, Item 1A of this Annual Report on Form 10-K.
Orphan Drug and Other Exclusivities
Some jurisdictions, including the U.S., may designate drugs or biologics for relatively small patient populations as orphan drugs. The FDA grants orphan drug designation to drugs or biologics intended to treat a rare disease or condition that affects fewer than 200,000 individuals in the U.S., or more than 200,000 individuals in the U.S. if there is no reasonable expectation that the cost of developing and making available in the U.S. a drug or biologic for this type of disease or condition will be recovered from sales in the U.S. for that product. An orphan drug designation does not shorten the duration of the regulatory review and approval process. However, if the FDA grants orphan drug designation for an indication and the product is the first approved for that indication, the product is entitled to orphan drug exclusivity, which means the FDA may not approve any other application to market the same product for the same indication for a period of seven years from the time of FDA approval. The FDA may grant orphan drug designation to a product that is otherwise the same as one already approved for the same indication if the sponsor can present a plausible hypothesis that its product is clinically superior to the previously approved drug. To be approved with orphan drug exclusivity, however, the sponsor would have to demonstrate that the drug is clinically superior to the previously approved drug. Even if a product is approved with orphan drug exclusivity, competitors may receive approval of different drugs or biologics for the indications for which the orphan product has exclusivity, or approval of the same drug for different indications or uses.
The FDA approved Xyrem as an orphan drug for the treatment of EDS and cataplexy in patients with narcolepsy, but the periods of orphan drug exclusivity for Xyrem have expired. In January 2018, Avadel announced that it had obtained an orphan drug designation from the FDA for its once-nightly sodium oxybate formulation for the treatment of narcolepsy. To obtain orphan drug exclusivity, Avadel will have to show actual clinical superiority to Xyrem, or if applicable, to any other oxybate product approved for the treatment of EDS and cataplexy in narcolepsy. If the FDA approves Avadel’s sodium oxybate product for the treatment of EDS and cataplexy in narcolepsy and grants Avadel’s product orphan drug exclusivity, then the FDA cannot approve another oxybate product for the treatment of EDS and cataplexy in narcolepsy during the exclusivity period unless such oxybate product demonstrates clinical superiority to Avadel’s product.
Erwinaze has been granted orphan drug exclusivity by the FDA for the treatment of ALL until November 2018. Defibrotide has been granted orphan drug exclusivity by the FDA to treat and prevent VOD until March 2023. Vyxeos has been granted orphan drug exclusivity by the FDA for the treatment of AML until August 2024.
Separately, Erwinaze, as a biologic product approved under a BLA, is subject to the BPCIA. The BPCIA authorizes the FDA to license a biological product that is biosimilar to an FDA-licensed biologic, or reference product, through an abbreviated pathway. The BPCIA provides periods of exclusivity that protect a reference product from competition by biosimilars. Under the BPCIA, the FDA may not accept a biosimilar application for review until four years after the date of first licensure of the reference product, and the biosimilar cannot be licensed until 12 years after the reference product was first licensed. We believe that Erwinaze will receive exclusivity that prevents approval of a biosimilar in the U.S. through late 2023 under the BPCIA.
Products also may be eligible for an additional six months of regulatory exclusivity or patent protection if the sponsor submits pediatric data that fairly respond to a written request from the FDA for such data. This effectively extends the period during which, because of regulatory exclusivity or listed patents, the FDA cannot approve an ANDA or Section 505(b)(2) NDA. We will consider seeking pediatric exclusivity for our products whenever appropriate. For example, in response to a written request from the FDA to generate additional data, we conducted a Phase 3 clinical trial to assess the safety and efficacy of Xyrem in children and adolescents aged seven to 17 who have narcolepsy with cataplexy. We anticipate submitting an sNDA including data that fairly responds to the pediatric written request to the FDA in mid-2018.
In the EU, orphan drug designation may be granted to products that can be used to treat life-threatening diseases or chronically debilitating conditions with an incidence of no more than five in 10,000 people or that, for economic reasons, would be unlikely to be developed without incentives. Orphan medicinal products are entitled to ten years of market exclusivity in all EU member states and a range of other benefits during the development and regulatory review process. However, marketing authorization may be granted to a similar medicinal product with the same orphan indication during the ten-year period with the consent of the marketing authorization holder for the original orphan medicinal product or if the manufacturer of the original orphan medicinal product is unable to supply sufficient quantities. Marketing authorization may also be granted to a similar medicinal product with the same orphan indication if the similar product is deemed safer, more effective or otherwise clinically superior to the original orphan medicinal product. The period of market exclusivity may, in addition, be reduced to six years if it can be demonstrated on the basis of available evidence that the original orphan medicinal product is sufficiently profitable not to justify maintenance of market exclusivity. Defibrotide received orphan drug designation by the EC to treat and prevent VOD prior to grant of marketing authorization in the EU. It has also received orphan drug designation by the Korean Ministry of Food and Drug Safety for this indication. The Commonwealth of Australia-
22
Department of Health has granted defibrotide orphan drug designation for the treatment of VOD. In addition, the EC granted orphan drug designation to defibrotide for the prevention of aGvHD, another potentially fatal complication of HSCT.
Post-Approval Regulation
After approval, certain changes to the approved product, such as adding new indications, making certain manufacturing changes, modifying a REMS or making certain additional labeling claims, are subject to further regulatory review and approval. Obtaining approval for a new indication generally requires that additional clinical studies be conducted.
Often, even after a drug or biologic has been approved by the FDA for sale, the FDA may impose certain post-approval requirements, including the conduct of additional clinical studies and trials. Holders of an approved NDA or BLA are required to: report certain adverse reactions to the FDA; comply with certain requirements concerning advertising and promotional labeling for their products; submit drug safety or adverse event reports; and continue to have quality control and manufacturing procedures conform to cGMP after approval. For example, the FDA’s approval of the BLA for Erwinaze includes a number of post-marketing commitments related to the manufacture of Erwinaze by us and PBL.
Similarly, outside of the U.S., we are subject to a variety of post-authorization regulations, including with respect to clinical studies, product manufacturing, advertising and promotion, distribution, and safety reporting. For example, the marketing authorization in the EU for Defitelio was granted under exceptional circumstances and requires us to comply with a number of post-marketing obligations, including obligations relating to the manufacturing of the drug substance and finished product, the submission of data concerning patients treated with the product collected through a third-party patient registry and the establishment of a multi-center, multinational and prospective observational patient registry.
We monitor adverse events resulting from the use of our commercial products, as do the regulatory authorities, and we file periodic reports with the authorities concerning adverse events. The FDA also periodically inspects our records related to safety reporting. Following such inspections, the FDA may issue notices on Form FDA 483 and warning letters that could cause us to modify certain activities. A Form FDA 483 notice, if issued at the conclusion of an FDA inspection, can list conditions the FDA investigators believe may have violated relevant FDA regulations or guidance. Failure to adequately and promptly correct the observation(s) can result in further regulatory enforcement action.
The authorities review these events and reports, and if they determine that any events and/or reports indicate a trend or signal, they can require a change in a product label, restrict sales and marketing and/or require or conduct other actions, potentially including withdrawal or suspension of the product from the market. From time to time, the FDA issues drug safety communications on its adverse event reporting system based on its review of reported adverse events. For more information, see the risk factor under the heading “
The distribution and sale of Xyrem are subject to significant regulatory oversight and restrictions and the requirements of a risk evaluation and mitigation strategy, and these restrictions and requirements, as well as the potential impact of changes to these restrictions and requirements, subject us to increased risks and uncertainties, any of which could negatively impact sales of Xyrem
” in Part I, Item 1A of this Annual Report on Form 10-K.
The holder of an EU marketing authorization for a medicinal product must also comply with the EU’s pharmacovigilance legislation, which includes requirements for conducting pharmacovigilance, or the assessment and monitoring of the safety of medicinal products. The EMA reviews periodic safety update reports submitted by marketing authorization holders. If the EMA has concerns that the risk benefit profile of a product has varied, it can adopt an opinion advising that the existing marketing authorization for the product be varied and requiring the marketing authorization holder to conduct post-authorization safety studies. The opinion is then submitted for approval by the EC. Non-compliance with such obligations can lead to the variation, suspension or withdrawal of marketing authorization or imposition of financial penalties or other enforcement measures.
The manufacturing process for pharmaceutical products is highly regulated, and regulators may shut down manufacturing facilities that they believe do not comply with regulations. We and our third party suppliers are subject to cGMP, which are extensive regulations governing manufacturing processes, stability testing, record keeping and quality standards as defined by the FDA, the EMA, the competent authorities of EU member states and other regulatory authorities. The FDA also periodically inspects the sponsor’s records related to manufacturing facilities, which effort includes assessment of compliance with cGMP. Following such inspections, the FDA may issue notices on Form FDA 483 and warning letters. In addition to Form FDA 483 notices and warning letters, failure to comply with the statutory and regulatory requirements may result in suspension of manufacturing, product seizure, withdrawal of the product from the market, administrative, civil and criminal penalties, among other enforcement remedies both in the U.S. and in non-U.S. countries.
In addition, various requirements apply to the manufacturing and placing on the EU market of medicinal products. The manufacturing of medicinal products in the EU requires a manufacturing authorization, and the manufacturing authorization holder must comply with various requirements set out in the applicable EU laws, regulations and guidance. These requirements include compliance with EU cGMP standards when manufacturing medicinal products and APIs, including the manufacture of APIs outside of the EU with the intention to import the APIs into the EU. Similarly, the distribution of medicinal products into
23
and within the EU is subject to compliance with the applicable EU laws, regulations and guidelines, including the requirement to hold appropriate authorizations for distribution granted by the competent authorities of the EU member states. Marketing authorization holders may be subject to civil, criminal or administrative sanctions, including suspension of manufacturing authorization, in case of non-compliance with the EU or EU member states’ requirements applicable to the manufacturing of medicinal products.
U.S. Healthcare Reform
The Patient Protection and Affordable Care Act, as amended by the Healthcare and Education Reconciliation Act of 2010, which we refer to together as the Healthcare Reform Act, is a sweeping measure intended to expand healthcare coverage within the U.S., primarily through the imposition of health insurance mandates on employers and individuals, the provision of subsidies to eligible individuals enrolled in plans offered on the health insurance exchanges, and the expansion of the Medicaid program. This law has substantially changed the way healthcare is financed by both governmental and private insurers and significantly impacts the pharmaceutical industry. Changes that may affect our business include those governing enrollment in federal healthcare programs, reimbursement changes, benefits for patients within a coverage gap in the Medicare Part D prescription drug program (commonly known as the “donut hole”), rules regarding prescription drug benefits under the health insurance exchanges, changes to the Medicaid Drug Rebate program, expansion of the Public Health Service’s 340B drug pricing program, or 340B program, fraud and abuse and enforcement. These changes have impacted previously existing government healthcare programs and have resulted in the development of new programs, including Medicare payment for performance initiatives and improvements to the physician quality reporting system and feedback program. Details of the changes to the Medicaid Drug Rebate program and the 340B program are discussed under “Pharmaceutical Pricing and Reimbursement” in this Part I, Item 1 and the risk factor
“If we fail to comply with our reporting and payment obligations under the Medicaid Drug Rebate program or other governmental pricing programs, we could be subject to additional reimbursement requirements, penalties, sanctions and fines, which could have a material adverse effect on our business, financial condition, results of operations and growth prospects”
in Part I, Item 1A of this Annual Report on Form 10-K.
Some states have elected not to expand their Medicaid programs by raising the income limit to 133% of the federal poverty level, as is permitted under the Healthcare Reform Act. For each state that does not choose to expand its Medicaid program, there may be fewer insured patients overall, which could impact our sales, business and financial condition. Where Medicaid patients receive insurance coverage under any of the new options made available through the Healthcare Reform Act, the possibility exists that manufacturers may be required to pay Medicaid rebates on drugs used under these circumstances, a decision that could impact manufacturer revenues. In addition, there have been delays in the implementation of key provisions of the Healthcare Reform Act, including the excise tax on generous employer-based health insurance plans. The implications of these delays for our sales, business and financial condition, if any, are not yet clear.
Moreover, additional legislative changes to or regulatory changes under the Healthcare Reform Act remain possible and appear likely in the 115th U.S. Congress and under the Trump Administration. In this regard, the U.S. Tax Cuts and Jobs Act of 2017, signed into law in December 2017, includes a provision repealing, effective January 1, 2019, the tax-based shared responsibility payment imposed by the Healthcare Reform Act on certain individuals who fail to maintain qualifying health coverage for all or part of a year that is commonly referred to as the “individual mandate.” The nature and extent of any additional legislative changes to the Healthcare Reform Act are uncertain at this time. We expect that the Healthcare Reform Act, as currently enacted or as it may be amended, and other healthcare reform measures that may be adopted in the future, could have a material adverse effect on our industry generally and on our ability to maintain or increase sales of our existing products or to successfully commercialize our product candidates, if approved.
Other Regulatory Requirements
We are also subject to regulation by other regional, national, state and local agencies, including the DEA, the U.S. Department of Justice, or DOJ, the Federal Trade Commission, or FTC, the U.S. Department of Commerce, or DOC, the Office of Inspector General, or OIG, of the U.S. Department of Health and Human Services, or HHS, and other regulatory bodies. In addition to the FDCA, other statutes and regulations govern to varying degrees the research, development, manufacturing and commercial activities relating to prescription pharmaceutical products, including preclinical testing, approval, production, labeling, sale, distribution, import, export, post-market surveillance, advertising, dissemination of information, promotion, marketing, and pricing to government purchasers and government healthcare programs. Our partners, including our suppliers and distributors and the central pharmacy for Xyrem, are subject to many of the same requirements.
Controlled Substance Regulations
A drug product approved by the FDA may be subject to scheduling as a controlled substance under the CSA, depending on the drug’s potential for abuse. Controlled substances that are pharmaceutical products are subject to a high degree of regulation under the CSA, which establishes, among other things, certain registration, manufacturing quotas, security, recordkeeping, reporting, import, export and other requirements administered by the DEA. The DEA classifies controlled substances into five schedules: Schedule I, II, III, IV or V. Schedule I substances by definition have a high potential for abuse,
24
have no currently “accepted medical use” in the U.S., lack accepted safety for use under medical supervision, and may not be prescribed, marketed or sold in the U.S. Pharmaceutical products approved for use in the U.S. may be listed as Schedule II, III, IV or V, with Schedule II substances considered to present the highest potential for abuse or dependence and Schedule V substances the lowest relative risk of abuse among such substances. Sodium oxybate, in the form of an API, is regulated by the DEA as a Schedule I controlled substance. When contained in Xyrem, sodium oxybate is regulated as a Schedule III controlled substance. We expect that solriamfetol will be subject to scheduling under the CSA, which will need to be completed after NDA approval and before commercial launch. Individual states also impose similar requirements for controlled substances.
The DEA limits the quantity of certain Schedule I controlled substances that may be manufactured and procured in the U.S. in any given calendar year through a quota system and, as a result, quotas from the DEA are required in order to manufacture and package sodium oxybate and Xyrem in the U.S. Accordingly, we require DEA quotas for Siegfried, our U.S.‑based sodium oxybate supplier, to procure sodium oxybate and for Patheon, our U.S.-based Xyrem supplier, to obtain the sodium oxybate from Siegfried in order to manufacture and supply us with Xyrem.
As a Schedule III drug, Xyrem is also subject to DEA and state regulations relating to manufacturing, storage, distribution and physician prescription procedures, including limitations on prescription refills. In addition, the third parties who perform our clinical and commercial manufacturing, distribution, dispensing and clinical studies for Xyrem are required to maintain necessary DEA registrations and state licenses. The DEA periodically inspects facilities for compliance with its rules and regulations. For more information, see the risk factor under the heading
“We are subject to significant ongoing regulatory obligations and oversight, which may result in significant additional expense and limit our ability to commercialize our products”
in Part I, Item 1A of this Annual Report on Form 10-K.
Sales and Marketing Regulations
We are also subject to various U.S. federal and state laws restricting certain marketing practices in the pharmaceutical industry, including anti-kickback laws and false claims laws. The federal healthcare program anti-kickback statute prohibits, among other things, knowingly and willfully offering, paying, soliciting or receiving remuneration to induce or in return for purchasing, leasing, ordering or arranging for or recommending the purchase, lease or order of any healthcare item or service reimbursable under Medicare, Medicaid or other federally financed healthcare programs. Violations of the federal anti-kickback statute may be punished by civil and criminal fines, imprisonment, and/or exclusion from participation in federal healthcare programs. The federal civil False Claims Act, or the False Claims Act, prohibits, among other things, any person from knowingly presenting, or causing to be presented, a false or fraudulent claim for payment of federal funds, or knowingly making, or causing to be made, a false statement to get a false claim paid. Violations of the False Claims Act may result in significant financial penalties and damages. In addition, the Physician Payment Sunshine Act provisions of the Healthcare Reform Act require extensive tracking of payments and transfers of value to physicians and teaching hospitals and public reporting of the data collected, and government agencies and private entities may inquire about our marketing practices or pursue other enforcement activities based on the disclosures in those public reports.
The majority of states also have statutes or regulations similar to the federal anti-kickback law and the False Claims Act, which apply to items and services reimbursed under Medicaid and other state programs, or, in several states, apply regardless of the payor. A number of states now require pharmaceutical companies to report expenses relating to the marketing and promotion of pharmaceutical products and to report gifts and payments to individual physicians in the states. Other states restrict when pharmaceutical companies may provide meals to prescribers or engage in other marketing related activities. Some states require the posting of information relating to clinical studies and their outcomes. In addition, California, Connecticut, Massachusetts and Nevada require pharmaceutical companies to implement compliance programs or marketing codes of conduct. Outside the U.S., we are also subject to similar regulations in those countries where we market and sell products.
The number and complexity of both U.S. federal and state laws continue to increase, and additional governmental resources are being added to enforce these laws and to prosecute companies and individuals who are believed to be violating them. In May and October 2016 and in February 2017, we received subpoenas from the U.S. Attorney’s Office for the District of Massachusetts requesting documents related to our support of 501(c)(3) organizations that provide financial assistance to Medicare patients and documents concerning the provision of financial assistance to Medicare patients taking drugs sold by us. We are cooperating with the government’s investigation of our support of charitable organizations, and the outcome of this investigation could include an enforcement action or a settlement with the federal government. The OIG has established guidelines that permit pharmaceutical manufacturers to make donations to charitable organizations who provide co-pay assistance to Medicare patients, provided that such organizations, among other things, are
bona fide
charities, are entirely independent of and not controlled by the manufacturer, provide aid to applicants on a first-come basis according to consistent financial criteria, and do not link aid to use of a donor’s product. If we or our vendors or donation recipients are deemed to fail to comply with relevant laws, regulations or evolving government guidance in the operation of these programs, such facts could be used as the basis for an enforcement action by the federal government. If the federal government were to file an enforcement action against us as a result of the investigation and could establish the elements of a violation of relevant laws,
25
we could be subject to damages, fines and penalties, which could be substantial, along with other criminal, civil or administrative sanctions. Any settlement with the federal government could result in substantial payments and entry into a corporate integrity agreement, which would impose costs and burdens on the operation of our business. For more information regarding applicable laws and regulations, see the risk factor under the heading “
We are subject to significant ongoing regulatory obligations and oversight, which may result in significant additional expense and limit our ability to commercialize our products
-
Other Regulatory Authorities
” in Part I, Item 1A of this Annual Report on Form 10-K.
The FDA, the competent authorities of the EU member states and other governmental authorities require advertising and promotional labeling to be truthful and not misleading, and products to be marketed only for their approved indications and in accordance with the provisions of the approved label. The FDA routinely provides its interpretations of that authority in informal communications and also in more formal communications such as untitled letters or warning letters, and although such communications may not be considered final agency decisions, companies may decide not to contest the agency’s interpretations so as to avoid disputes with the FDA, even if they believe the claims to be truthful, not misleading and otherwise lawful. In recent years, certain courts have determined that the First Amendment of the U.S. Constitution permits communications regarding off-label uses of drug products, as long as such communications are truthful and not misleading. At the beginning of 2017, the FDA released proposed rule changes and draft guidance on FDA’s interpretation on the limitations of such speech. These cases and regulatory actions create additional uncertainty regarding the limits of permissible communication regarding our products.
The FDA, the competent authorities of the EU member states and other governmental authorities also actively investigate allegations of off-label promotion activities in order to enforce regulations prohibiting these types of activities. A company that is found to have promoted an approved product for off-label uses may be subject to significant liability, including civil and administrative financial penalties and other remedies as well as criminal financial penalties and other sanctions. Even when a company is not determined to have engaged in off-label promotion, the allegation from government authorities or market participants that a company has engaged in such activities could have a significant impact on the company’s sales, business and financial condition. The U.S. government has also required companies that have engaged in such activities to enter into complex corporate integrity agreements and deferred- or non-prosecution agreements that impose significant reporting and other burdens on the affected companies. For all of our products, it is important that we maintain a comprehensive compliance program. Failure to maintain a comprehensive and effective compliance program, and to integrate the operations of acquired businesses into a combined comprehensive and effective compliance program on a timely basis, could subject us to a range of regulatory actions that could affect our ability to commercialize our products and could harm or prevent sales of the affected products, or could substantially increase the costs and expenses of commercializing and marketing our products.
In the EU, the advertising and promotion of our products are subject to EU member states’ laws governing promotion of medicinal products, interactions with physicians, misleading and comparative advertising and unfair commercial practices. In addition, other legislation adopted by individual EU member states may apply to the advertising and promotion of medicinal products. Violations of the rules governing the promotion of medicinal products in the EU could be penalized by administrative measures, fines and imprisonment. These laws may further limit or restrict the advertising and promotion of our products to the general public and may also impose limitations on our promotional activities with health care professionals.
To help patients afford our products, we have various programs to assist them, including patient assistance programs, a Xyrem free product voucher program and co-pay coupon programs for certain products. These programs and related risks are discussed in greater detail in the risk factor under the heading “
Changes in healthcare law and implementing regulations, including those based on recently enacted legislation, as well as changes in healthcare policy, may impact our business in ways that we cannot currently predict and these changes could have a material adverse effect on our business and financial condition
” in Part I, Item 1A of this Annual Report on Form 10-K.
Anti-Corruption Legislation
Our business activities outside of the U.S. are subject to the U.S. Foreign Corrupt Practices Act, or FCPA, and similar anti-bribery or anti-corruption laws, regulations, industry self-regulation codes of conduct and physicians’ codes of professional conduct or rules of other countries in which we operate, including the UK Bribery Act of 2010, or the UK Bribery Act. The FCPA and similar anti-corruption laws in foreign countries generally prohibit the offering, promising, giving, or authorizing others to give anything of value, either directly or indirectly, to U.S. or non-U.S. government officials in order to improperly influence any act or decision, secure an improper advantage, or obtain or retain business. Excepted from the FCPA are payments to facilitate or expedite routine government action and bona fide, reasonable reimbursement of expenses. The FCPA also requires public companies to make and keep books and records that accurately and fairly reflect the transactions of the company and to devise and maintain an adequate system of internal accounting controls. The UK Bribery Act prohibits giving, offering, or promising bribes to any person, including UK and non-UK government officials and private persons, as well as requesting, agreeing to receive, or accepting bribes from any person. In addition, under the UK Bribery Act, companies which carry on a business or part of a business in the UK may be held liable for bribes given, offered or promised to any person, including UK and non-UK government officials and private persons in any country, by employees and persons associated with
26
the company in order to obtain or retain business or a business advantage for the company. Liability is strict, with no element of a corrupt state of mind, but a defense of having in place adequate procedures designed to prevent bribery is available. Furthermore, under the UK Bribery Act there is no exception for facilitation payments. As described above, our business is heavily regulated and therefore involves significant interaction with public officials, including officials of non-U.S. governments. Additionally, in many other countries, the health care providers who prescribe pharmaceuticals are employed by their government, and the purchasers of pharmaceuticals are government entities; therefore, our dealings with these prescribers and purchasers may be subject to the FCPA. Recently the Securities and Exchange Commission, or SEC, and the DOJ have increased their FCPA enforcement activities with respect to pharmaceutical companies. In addition, under the Dodd-Frank Wall Street Reform and Consumer Protection Act, or Dodd-Frank Act, private individuals who report to the SEC original information that leads to successful enforcement actions may be eligible for a monetary award.
We are engaged in ongoing efforts that are designed to ensure our compliance with these laws, including due diligence, training, policies, procedures, and internal controls. However, there is no certainty that all employees and third party business partners (including our distributors, wholesalers, agents, contractors, and other partners) will comply with anti-bribery laws. In particular, we do not control the actions of our suppliers and other third party agents, although we may be liable for their actions. Violation of these laws may result in civil or criminal sanctions, which could include monetary fines, criminal penalties, and disgorgement of past profits, which could have a material adverse impact on our business and financial condition.
Data Privacy and Protection
We are also subject to laws and regulations governing privacy and data security. These laws include security breach notification requirements and protection of consumer health information. The legislative and regulatory landscape for privacy and data security continues to evolve, and there has been an increasing focus on privacy and data security issues which may affect our business. Although there are legal mechanisms to facilitate the transfer of personal data from the European Economic Area, or EEA, and Switzerland to the U.S., the decision of the European Court of Justice that invalidated the safe harbor framework on which we previously relied has increased uncertainty around compliance with EU privacy law requirements. As a result of the decision, it was no longer possible to rely on safe harbor certification as a legal basis for the transfer of personal data from the EU to entities in the U.S. In February 2016, the EC announced an agreement with the DOC to replace the invalidated safe harbor framework with a new EU-U.S. “Privacy Shield.” On July 12, 2016, the EC adopted a decision on the adequacy of the protection provided by the Privacy Shield. The Privacy Shield is intended to address the requirements set out by the European Court of Justice in its recent ruling by imposing more stringent obligations on companies, providing stronger monitoring and enforcement by the DOC and FTC and making commitments on the part of public authorities regarding access to information.
U.S.-based companies may certify compliance with the privacy principles of the Privacy Shield. Certification to the Privacy Shield, however, is not mandatory. If a U.S.-based company does not certify compliance with the Privacy Shield, it may rely on other authorized mechanisms to transfer personal data. In September 2016, we filed for certification for our U.S.-based subsidiaries under the Privacy Shield. This certification was approved in January 2017.
The privacy and data security landscape is still in flux. In October 2016, an action for annulment of the EC decision on the adequacy of Privacy Shield was brought before the European Court of Justice by three French digital rights advocacy groups, La Quadrature du Net, French Data Network and the Fédération FDN. This case, Case T-738/16, is currently pending before the European Court of Justice. Should the European Court of Justice invalidate the Privacy Shield, it will no longer be possible to transfer data from the EU to entities in the U.S. under a Privacy Shield certification, in which case other legal mechanisms would need to be put in place.
Healthcare providers who prescribe our products and research institutions that we collaborate with are subject to privacy and security requirements under the Health Insurance Portability and Accountability Act of 1996, as amended by the Health Information Technology for Economic and Clinical Health Act, or HIPAA. Although we are not directly subject to HIPAA other than with respect to providing certain employee benefits, we could potentially be subject to criminal penalties if we, our affiliates or our agents knowingly obtain or disclose individually identifiable health information maintained by a HIPAA-covered entity in a manner that is not authorized or permitted by HIPAA.
Failure to comply with current and future laws and regulations could result in government enforcement actions (including the imposition of significant penalties), criminal and civil liability for us and our officers and directors and/or adverse publicity that negatively affect our business.
If we or our vendors fail to comply with applicable data privacy laws, or if the legal mechanisms we or our vendors rely upon to allow for the transfer of personal data from the EEA or Switzerland to the U.S. (or other countries not considered by the EC to provide an adequate level of data protection) are not considered adequate, we could be subject to government enforcement actions and significant penalties against us, and our business could be adversely impacted if our ability to transfer personal data outside of the EEA or Switzerland is restricted, which could adversely impact our operating results. The EU General Data Protection Regulation, which was officially adopted in April 2016 and will be applicable in May 2018, will
27
introduce new data protection requirements in the EU, as well as substantial fines for breaches of the data protection rules. The EU General Data Protection Regulation will increase our responsibility and liability in relation to personal data that we process, and we may be required to put in place additional mechanisms to ensure compliance with the new EU data protection rules. In addition, data protection authorities of the different EU member states may interpret the EU Data Protection Directive and national laws differently, and guidance on implementation and compliance practices are often updated or otherwise revised, which adds to the complexity of processing personal data in the EU.
Additional requirements and restrictions regarding, among other things, the export and importation of products, intellectual property rights, the environment, taxation and work safety apply in individual countries, and non-compliance with such requirements may result in civil, criminal or administrative sanctions.
Pharmaceutical Pricing and Reimbursement
Our ability to commercialize our products successfully, and to attract commercialization partners for our products, depends in significant part on the availability of adequate financial coverage and reimbursement from third party payors, including governmental payors (such as the Medicare and Medicaid programs in the U.S.), managed care organizations and private health insurers. Third party payors decide which drugs can be reimbursed and establish reimbursement and co-pay levels and conditions for reimbursement. Third party payors are increasingly challenging the prices charged for medical products and services and examining their cost effectiveness, in addition to their safety and efficacy. In some cases, for example, third party payors try to encourage the use of less expensive generic products through their prescription benefits coverage and reimbursement and co-pay policies. We may need to conduct expensive pharmacoeconomic and/or clinical studies in order to demonstrate the cost effectiveness of our products. Even with studies, our products may be considered less safe, less effective or less cost-effective than other products, and third party payors may not provide and maintain price approvals, coverage and reimbursement for our products or any of our product candidates that we commercialize, in whole or in part. The process for determining whether a payor will provide coverage for a product may be separate from the process for setting the price or reimbursement rate that the payor will pay for the product once coverage is approved. Third party payors may limit coverage to specific products on an approved list, or formulary, which might not include all of the approved products for a particular indication. For example, third party payors have started to require discounts and/or exclusivity arrangements with some drug manufacturers in exchange for including a specific product on their formularies. Any such requirements could have a negative impact on revenues from sales of our current and potential future products.
In the U.S., drug pricing by pharmaceutical companies is currently, and is expected to continue to be, under close scrutiny, including with respect to companies that have increased the price of products after acquiring those products from other companies. Several states have recently passed laws aimed at increasing transparency relating to drug pricing, and other states may do so in the future. For more information, see the risk factors under the headings “
Changes in healthcare law and implementing regulations, including those based on recently enacted legislation, as well as changes in healthcare policy, may impact our business in ways that we cannot currently predict, and these changes could have a material adverse effect on our business and financial condition
” and “
We are subject to significant ongoing regulatory obligations and oversight, which may result in significant additional expense and limit our ability to commercialize our products
” in Part I, Item 1A of this Annual Report on Form 10-K.
We participate in and have certain price reporting obligations to the Medicaid Drug Rebate program, several state Medicaid supplemental rebate programs and other governmental pricing programs, and we have obligations to report the average sales price for certain of our drugs to the Medicare program. Under the Medicaid Drug Rebate program, we are required to pay a rebate to each state Medicaid program for our covered outpatient drugs that are dispensed to Medicaid beneficiaries and paid for by a state Medicaid program as a condition of having federal funds being made available to the states for our drugs under Medicaid and Part B of the Medicare program. Risks relating to price reporting and payment obligations are further discussed in the risk factor under the heading “
If we fail to comply with our reporting and payment obligations under the Medicaid Drug Rebate program or other governmental pricing programs, we could be subject to additional reimbursement requirements, penalties, sanctions and fines, which could have a material adverse effect on our business, financial condition, results of operations and growth prospects”
in Part I, Item 1A of this Annual Report on Form 10-K.
Federal law requires that any company that participates in the Medicaid Drug Rebate program also participate in the 340B program in order for federal funds to be available for the manufacturer’s drugs under Medicaid and Medicare Part B. The 340B program requires participating manufacturers to agree to charge statutorily defined covered entities no more than the 340B “ceiling price” for the manufacturer’s covered outpatient drugs. These 340B covered entities include a variety of community health clinics and other entities that receive health services grants from the Public Health Service, as well as hospitals that serve a disproportionate share of low-income patients. The 340B ceiling price is calculated using a statutory formula, which is based on the average manufacturer price and rebate amount for the covered outpatient drug as calculated under the Medicaid Drug Rebate program.
28
In order to be eligible to have our products paid for with federal funds under the Medicaid and Medicare Part B programs and purchased by certain federal agencies and grantees, we participate in the U.S. Department of Veterans Affairs, or VA, Federal Supply Schedule, or FSS, pricing program. Under this program, we are obligated to make our products available for procurement on an FSS contract and charge a price to four federal agencies - the VA, U.S. Department of Defense, Public Health Service and U.S. Coast Guard - that is no higher than the statutory Federal Ceiling Price, or FCP. The FCP is based on the non-federal average manufacturer price, or Non-FAMP, which we calculate and report to the VA on a quarterly and annual basis. We also participate in the Tricare Retail Pharmacy program, under which we pay quarterly rebates on utilization of innovator products that are dispensed through the Tricare Retail Pharmacy network to Tricare beneficiaries. The rebates are calculated as the difference between the annual Non-FAMP and FCP.
Similar to what is occurring in the U.S., political, economic and regulatory developments outside of the U.S. are also subjecting the healthcare industry to fundamental changes and challenges. Pressure by governments and other stakeholders on prices and reimbursement levels continue to exist. In various EU member states we expect to be subject to continuous cost-cutting measures, such as lower maximum prices, lower or lack of reimbursement coverage and incentives to use cheaper, usually generic, products as an alternative. Health Technology Assessment, or HTA, of medicinal products is becoming an increasingly common part of the pricing and reimbursement procedures in some EU member states, including countries representing major markets. The HTA process, which is governed by the national laws of these countries, is the procedure according to which the assessment of the public health impact, therapeutic impact and the economic and societal impact of use of a given medicinal product in the national healthcare systems of the individual country is conducted. HTA generally focuses on the clinical efficacy and effectiveness, safety, cost and cost-effectiveness of individual medicinal products, as well as their potential implications for the healthcare system. Those elements of medicinal products are compared with other treatment options available on the market. The outcome of HTA regarding specific medicinal products will often influence the pricing and reimbursement status granted to these medicinal products by the competent authorities of individual EU member states. Pursuant to Directive 2011/24/EU, a voluntary network of national authorities or bodies responsible for HTA in the individual EU member states was established. The EU member states were required to implement the provisions of the Directive into their national legislation by October 2013. The purpose of the network is to facilitate and support the exchange of scientific information concerning HTAs. This could lead to harmonization between EU member states of the criteria taken into account in the conduct of HTA and their impact on pricing and reimbursement decisions.
In the EU, our products are marketed through various channels and within different legal frameworks. In certain EU member states, reimbursement for unauthorized products is provided through national named patient or compassionate use programs. Such reimbursement may no longer be available if authorization for named patient or compassionate use programs expire or are terminated or if marketing authorization is granted for the product. In other EU member states, authorization and reimbursement policies may also delay commercialization of our products, or may adversely affect our ability to sell our products on a profitable basis. After initial price and reimbursement approvals, reductions in prices and changes in reimbursement levels can be triggered by multiple factors, including reference pricing systems and publication of discounts by third party payors or authorities in other countries. In the EU, prices can be reduced further by parallel distribution and parallel trade, or arbitrage between low-priced and high-priced EU member states.
For more information, see the risk factor under the heading “
Access and adequate reimbursement coverage may not be available for our products, which could diminish our sales or affect our ability to sell our products profitably
” in Part I, Item 1A of this Annual Report on Form 10‑K.
Employees
As of
February 20, 2018
, we had approximately 1,210 employees worldwide. We consider our employee relations to be good.
Environment, Health and Safety
Our operations are subject to complex and increasingly stringent environmental, health and safety laws and regulations in the countries where we operate and, in particular, in Italy and Ireland where we have manufacturing facilities. Our manufacturing activities in Italy and Ireland involve the controlled storage, use and disposal of chemicals and solvents. Environmental and health and safety authorities in the relevant jurisdictions administer laws governing, among other matters, the emission of pollutants into the air (including the workplace), the discharge of pollutants into bodies of water, the storage, use, handling and disposal of hazardous substances, the exposure of persons to hazardous substances, and the general health, safety and welfare of employees and members of the public. In certain cases, such laws, directives and regulations may impose strict liability for pollution of the environment and contamination resulting from spills, disposals or other releases of hazardous substances or waste or any migration of such hazardous substances or waste. Costs, damages and/or fines may result from the
29
presence, investigation and remediation of such contamination at properties currently or formerly owned, leased or operated by us or at off-site locations, including where we have arranged for the disposal of hazardous substances or waste. In addition, we may be subject to third party claims, including for natural resource damages, personal injury and property damage, in connection with such contamination.
About Jazz Pharmaceuticals plc
Jazz Pharmaceuticals plc was formed under the laws of Ireland (registered number 399192) as a private limited liability company in March 2005 under the name Azur Pharma Limited and was subsequently re-registered as a public limited company under the name Azur Pharma Public Limited Company, or Azur Pharma, in October 2011. On January 18, 2012, the businesses of Jazz Pharmaceuticals, Inc. and Azur Pharma were combined in a merger transaction, in connection with which Azur Pharma was re-named Jazz Pharmaceuticals plc and we became the parent company of and successor to Jazz Pharmaceuticals, Inc.
Our predecessor, Jazz Pharmaceuticals, Inc., was incorporated in California in March 2003 and was reincorporated in Delaware in January 2004.
Available Information
We file or furnish pursuant to Section 13(a) or 15(d) of the Securities Exchange Act of 1934, as amended, or Exchange Act, as applicable, our Annual Reports on Form 10-K, Quarterly Reports on Form 10-Q, Current Reports on Form 8-K, amendments to those reports, proxy statements and other information electronically with the SEC. Further copies of these reports are located at the SEC’s Public Reference Room at 100 F Street, NE, Washington, D.C. 20549. Information on the operation of the Public Reference Room can be obtained by calling the SEC at 1-800-SEC-0330. The SEC maintains a website that contains reports, proxy statements and other information regarding our filings at www.sec.gov.
The mailing address of our headquarters is Fifth Floor, Waterloo Exchange, Waterloo Road, Dublin 4, Ireland, and our telephone number at that location is 353-1-634-7800. Our website is www.jazzpharmaceuticals.com. Through a link on our website, we make copies of our periodic and current reports, amendments to those reports, proxy statements and other information available, free of charge, as soon as reasonably practicable after we electronically file such material with, or furnish it to, the SEC. Information found on, or accessible through, our website is not a part of, and is not incorporated into, this Annual Report on Form 10-K.
|
Item 1A.
|
Risk Factors
|
We have identified the following risks and uncertainties that may have a material adverse effect on our business, financial condition or results of operations. The risks described below are not the only ones we face. Additional risks not presently known to us or that we currently believe are immaterial may also significantly impair our business operations. Our business could be harmed by any of these risks. The trading price of our ordinary shares could decline due to any of these risks, and you may lose all or part of your investment. In assessing these risks, you should also refer to the other information contained in this Annual Report on Form 10-K, including our consolidated financial statements and accompanying notes.
Risks Related to Xyrem and the Significant Impact of Xyrem Sales
Xyrem is our largest selling product, and our inability to maintain or increase sales of Xyrem would have a material adverse effect on our business, financial condition and results of operations.
Xyrem is our largest selling product, and our financial results are significantly influenced by sales of Xyrem, which accounted for
74.1%
and
75.0%
of our net product sales for the years ended December 31, 2017 and 2016. Our future plans assume that sales of Xyrem will increase, but we cannot assure you that we can maintain sales of Xyrem at or near current levels, or that Xyrem sales will continue to grow.
We have periodically increased the price of Xyrem, most recently in January 2018, and we cannot assure you that price adjustments we have taken or may take in the future will not negatively affect Xyrem sales volumes.
In addition to other risks described herein, our ability to maintain or increase Xyrem product sales is subject to a number of risks and uncertainties, the most important of which are discussed in more detail below, including those related to:
|
•
|
the potential U.S. introduction of a generic version of Xyrem before the entry dates specified in our settlements with certain abbreviated new drug application, or ANDA, filers or on terms that are different from those contemplated by the settlement agreements, as further described below;
|
30
|
•
|
the potential U.S. introduction of new products that compete with, or otherwise disrupt the market for, Xyrem in the treatment of cataplexy and/or excessive daytime sleepiness, or EDS, in narcolepsy;
|
|
•
|
changes to or uncertainties around regulatory restrictions, including, among other things, changes to our Xyrem risk evaluation and mitigation strategy, or REMS, as further described below;
|
|
•
|
challenges and potential challenges to our intellectual property around Xyrem, including uncertainty in ongoing ANDA litigation or the possibility of new ANDA filers and challenges;
|
|
•
|
any increase in pricing pressure from, changes in policies by, or restrictions on reimbursement imposed by, third party payors;
|
|
•
|
changes in healthcare laws and policy, including changes in requirements for patient assistance programs, rebates, reimbursement and coverage by federal healthcare programs, and changes resulting from increased scrutiny on pharmaceutical pricing and REMS programs by government entities;
|
|
•
|
operational disruptions at the Xyrem central pharmacy or any failure to comply with our REMS obligations to the satisfaction of the U.S. Food and Drug Administration, or FDA;
|
|
•
|
any supply or manufacturing problems, including any problems with our sole source Xyrem active pharmaceutical ingredient, or API, provider;
|
|
•
|
continued acceptance of Xyrem by physicians and patients, including as a result of negative publicity that surfaces from time to time;
|
|
•
|
changes to our label, including new safety warnings or changes to our boxed warning, that further restrict how we market and sell Xyrem; and
|
|
•
|
our U.S.-based API and Xyrem suppliers’ ability to obtain sufficient quotas from the U.S. Drug Enforcement Administration, or DEA, to satisfy our needs for Xyrem.
|
These and the other risks described below related to Xyrem product sales and protection of our proprietary rights could have a material adverse effect on our ability to maintain or increase sales of Xyrem.
If sales of Xyrem were to decline significantly, we might need to reduce our operating expenses or seek to raise additional funds, which would have a material adverse effect on our business, financial condition, results of operations and growth prospects, or we might not be able to acquire, in-license or develop new products in the future to grow our business.
The launch of a generic version of Xyrem or other sodium oxybate products that compete with Xyrem would adversely affect sales of Xyrem.
Although Xyrem is protected by patents covering its manufacture, formulation, distribution system and method of use, nine companies have filed ANDAs with the FDA seeking approval to market a generic version of Xyrem. We filed patent lawsuits against each of the ANDA filers in the U.S. District Court for the District of New Jersey, or the District Court, asserting that such generic products would violate our patents covering Xyrem. The most recent ANDA was filed in November 2017, and we filed a patent lawsuit against that filer in the District Court in January 2018. We do not know whether additional ANDAs have been or will be filed.
We have settled lawsuits against five of the ANDA filers. On April 5, 2017, we settled all lawsuits against the first filer, Roxane Laboratories, Inc., which was acquired by West-Ward Pharmaceuticals Corp. (a wholly owned subsidiary of Hikma Pharmaceuticals PLC), or West-Ward, granting West-Ward the right to sell an authorized generic version of Xyrem, or AG Product, beginning on January 1, 2023, or earlier under certain circumstances, including circumstances related to the licensing or market entry of another generic sodium oxybate product, a final decision that all unexpired claims of the Xyrem patents are invalid and/or unenforceable, or a substantial reduction in Xyrem net sales over specified periods of time. We also granted West-Ward a license to launch its own generic sodium oxybate product as early as six months after it has the right to sell the AG Product, unless it elects to continue to sell the AG Product, which it may do for up to a total of five years. On January 9, 2018, we settled all litigation with Par Pharmaceutical, Inc., or Par, granting Par the right to sell a limited volume of AG Product beginning on July 1, 2023, or earlier under certain circumstances, including acceleration of the West-Ward AG Product launch date. We also granted Par a license to launch its own generic sodium oxybate product on or after December 31, 2025, or earlier under certain circumstances, including circumstances related to launch of a generic sodium oxybate product by West-Ward or another company under its ANDA. We have also settled all lawsuits with three of the other ANDA filers, granting each of them a license to launch its own generic sodium oxybate product on or after December 31, 2025, or earlier under certain circumstances, including the launch by West-Ward or another party of a generic sodium oxybate product under its ANDA. In accordance with legal requirements, we have submitted our Xyrem settlement agreements to the U.S. Federal Trade Commission, or FTC, and the U.S. Department of Justice, or DOJ, for review.
31
Patent lawsuits against three of the remaining non-settling ANDA filers have been consolidated as one case and remain pending in the District Court. Although no trial date has been set, discovery is scheduled to conclude in the third quarter of 2018, and the trial in this consolidated case could occur as early as the third quarter of 2018. For further description of these settlements and legal proceedings, see “Legal Proceedings” in Part I, Item 3 of this Annual Report on Form 10-K. We cannot predict the timing or outcome of the ANDA litigation proceedings against the remaining non-settling ANDA filers.
Certain ANDA filers filed petitions for inter partes review, or IPR, by the Patent Trial and Appeal Board, or PTAB, of the U.S. Patent and Trademark Office, or USPTO, with respect to the validity of certain distribution, method of use and formulation patents covering Xyrem. The PTAB instituted IPR trials with respect to certain of these petitions. In July 2016, the PTAB issued final decisions that the claims of six patents associated with the Xyrem REMS, or REMS patents, are unpatentable. In March 2016, the PTAB partially instituted an IPR on three claims of a seventh REMS patent, declining to review 25 of 28 claims, and, in March 2017, the PTAB issued a final decision that the three claims they reviewed are unpatentable. The July 2016 and March 2017 PTAB decisions are part of a consolidated appeal currently pending before the United States Court of Appeals for the Federal Circuit, or the Federal Circuit. If the Federal Circuit upholds the PTAB decisions on appeal, we will not be able to enforce claims the PTAB found unpatentable. For further description of these legal proceedings, see “Legal Proceedings” in Part I, Item 3 of this Annual Report on Form 10‑K. We cannot predict whether additional post-grant patent review challenges will be filed by any of the ANDA filers or any other entity, the outcome of any proceeding, including any appeal, or the impact any IPR or other proceeding might have on ongoing ANDA litigation proceedings or other aspects of our Xyrem business.
In January 2017, the FDA approved West-Ward’s ANDA for a generic sodium oxybate product. The FDA’s letter approving West-Ward’s ANDA notes that, as the first ANDA applicant, West-Ward is eligible for 180 days of generic drug exclusivity. West-Ward’s ANDA approval also includes a waiver that permits West-Ward to use a separate REMS program from the Xyrem REMS on the condition that the REMS approved with West-Ward’s ANDA, or the generic sodium oxybate REMS, be open to all future sponsors of ANDAs or new drug applications, or NDAs, for sodium oxybate products. In January 2017, the FDA tentatively approved two additional ANDAs for generic sodium oxybate products, and we believe that it is likely that the FDA will approve or tentatively approve additional ANDAs.
The actual timing of any commercial launch of an AG Product or a generic sodium oxybate product is uncertain. For example, to the extent that one or more of the non-settling ANDA filers continues to litigate our Xyrem patents and obtains a final judicial decision prior to January 1, 2023 that all unexpired claims of the Xyrem patents are invalid and/or unenforceable, any party who has obtained or maintains FDA approval for its generic product and is able to distribute its product through an approved sodium oxybate REMS could potentially enter the market with a generic sodium oxybate product, subject in some cases to West-Ward’s right to 180-day exclusivity. West-Ward’s AG Product launch date would be accelerated to approximately the date of that final judicial decision, which would also accelerate the permitted launch of Par’s AG Product and could accelerate the launch of other generic sodium oxybate products.
Moreover, subject in some cases to West-Ward’s 180-day exclusivity, one or more of the non-settling ANDA filers that obtains or maintains FDA approval for its generic sodium oxybate product and is able to distribute its product through an approved generic sodium oxybate REMS could also launch its generic product in the absence of a final decision that all unexpired claims of the Xyrem patents are invalid and/or unenforceable. Circumstances that could result in such a launch include, for example, a judicial determination that the introduction of such filer’s generic product does not infringe our patents; a judicial determination that Xyrem patents are valid and infringed but that an injunction is not warranted; or a decision by a non-settling ANDA filer, before applicable ongoing patent litigation is concluded, to launch a generic product at risk of being held liable for damages for patent infringement. It is also possible that we could enter into settlement agreements with one or more ANDA filers that would permit such a filer to enter the market on or prior to the launch date(s) agreed with West-Ward. In the event of any such launch by another non-settling ANDA filer, except in limited circumstances related to an “at risk” launch, the launch date for West-Ward’s AG Product would be accelerated to a date on or prior to the date of such entry, which could lead to acceleration of the other settling filers’ launch dates as described above.
Another circumstance that could trigger acceleration of West-Ward’s launch date for an AG Product, which would also lead to acceleration of Par’s launch date for its AG Product and ultimately could lead to acceleration of the other settling filers’ launch dates for their generic sodium oxybate products, is a substantial reduction in Xyrem net sales. Such a reduction could occur under various circumstances, including if we introduce, or a third party introduces, a product to treat EDS or cataplexy in narcolepsy that substantially erodes Xyrem net sales prior to January 1, 2023.
For example, other companies could develop and launch sodium oxybate or other products that are similar, but not identical, to Xyrem, such as an alternative formulation or a different delivery technology, and seek approval in the U.S. through an NDA approval pathway under Section 505(b)(2) of the Federal Food, Drug and Cosmetic Act, or FDCA, by referencing Xyrem and relying, to some degree, on the FDA’s approval of Xyrem and related determinations of safety and efficacy. Avadel Pharmaceuticals plc, or Avadel, a company that is using its proprietary technology for delivery of a sodium oxybate formulation to eliminate second nighttime dosing for narcolepsy patients, has stated that it is conducting a Phase 3 pivotal trial pursuant to
32
an FDA-approved special protocol assessment, and has indicated that it intends to seek approval of its product candidate using a Section 505(b)(2) NDA approval pathway referencing Xyrem.
We are also aware of products being developed by others for use as treatment options in cataplexy and/or EDS in patients with narcolepsy that have different safety profiles and mechanisms of action than Xyrem, including a product to treat adult patients with narcolepsy with or without cataplexy that received marketing approval in Europe in 2016. While this product is currently not approved by the FDA for marketing in the U.S., the company that has exclusive U.S. commercialization rights to this product has announced that it expects to establish an expanded access program for the product in early 2018 and to submit an NDA to the FDA for the treatment of narcolepsy in adult patients during the first half of 2018. The receipt of marketing approval and commercialization of this product, Avadel’s product or other products that may be approved in the U.S. for the treatment of narcolepsy patients could, depending on the targeted patient population, reduce Xyrem sales, which could have the additional effect of potentially triggering acceleration of market entry of AG Products or other generic sodium oxybate products under our ANDA litigation settlement agreements, as described above and elsewhere in this Annual Report on Form 10-K.
After any introduction of a generic product, whether or not it is an AG Product, a significant percentage of the prescriptions written for Xyrem may be filled with the generic product. Certain U.S. state laws allow for, and in some instances in the absence of specific instructions from the prescribing physician mandate, the dispensing of generic products rather than branded products where a generic version is available. This would result in reduction in sales of, and revenue from, Xyrem, although we would continue to receive royalty and other revenue based on sales of an AG Product in accordance with the terms of our settlement agreements. Any ANDA holder launching any AG Product or another generic sodium oxybate product will establish the price of the AG Product and/or its own generic sodium oxybate product. However, generic competition often results in decreases in the prices at which branded products can be sold, particularly when there is more than one generic product available.
We expect that the launch of any generic sodium oxybate product, including any AG Product, or the approval and launch of other products that compete with Xyrem, would be likely to have a material adverse effect on our sales of Xyrem and on our business, financial condition, results of operations and growth prospects.
For further discussion regarding legal proceedings and settlement agreements related to Xyrem, the risks associated with our ANDA settlement agreements, the approval and tentative approval of ANDAs, the potential launch of AG Products or generic versions of Xyrem, or the approval and launch of other sodium oxybate or other products that compete with Xyrem, as well as other risks and challenges we face with respect to Xyrem, see “Business—Government Regulation—
The Hatch-Waxman Act
” and “Business—Competition” in Part I, Item 1 of this Annual Report on Form 10-K, the other risk factors under the heading “Risks Related to Xyrem and the Significant Impact of Xyrem Sales” and the risk factors under the headings “
We face substantial competition from other companies, including companies with greater resources, including larger sales organizations and more experience working with large and diverse product portfolios, than we have
” and “Risks Related to Our Intellectual Property” in this Part I, Item 1A and “Legal Proceedings” in Part I, Item 3 of this Annual Report on Form 10‑K.
The distribution and sale of Xyrem are subject to significant regulatory oversight and restrictions and the requirements of a risk evaluation and mitigation strategy, and these restrictions and requirements, as well as the potential impact of changes to these restrictions and requirements, subject us to increased risks and uncertainties, any of which could negatively impact sales of Xyrem.
The FDA requires that we maintain a REMS for Xyrem to help ensure the safe distribution of Xyrem and minimize the risk of misuse, abuse and diversion of sodium oxybate. In February 2015, the FDA approved the current Xyrem REMS, which requires, among other things, that Xyrem be distributed through a single pharmacy. In the FDA’s letter approving the Xyrem REMS, the FDA stated that (i) the approval action should not be construed or understood as agreement with what the FDA stated was our position that dispensing through a single pharmacy is the only way to ensure that the benefits of Xyrem outweigh its risks, and that the FDA has continuing concerns that limiting the distribution of Xyrem to one pharmacy imposes burdens on patient access and the healthcare delivery system, and (ii) as with all REMS, the FDA intends to evaluate the Xyrem REMS on an ongoing basis and will require modifications as may be appropriate. We cannot predict whether the FDA will request, seek to require or ultimately require modifications to, or impose additional requirements on, the Xyrem REMS, including in connection with the submission of applications for new oxybate indications or products, or whether FDA will permit modifications to the Xyrem REMS that we consider warranted in connection with the submission of applications for new oxybate indications or products. Any modifications required or rejected by the FDA could make it more difficult or expensive for us to distribute Xyrem, make distribution easier for sodium oxybate competitors, impair the safety profile of Xyrem, disrupt continuity of care for Xyrem patients and/or negatively affect sales of Xyrem.
In August 2015, we implemented the current Xyrem REMS, and we have submitted and expect to continue to submit ongoing assessments as set forth in the FDA’s Xyrem REMS approval letter. However, we cannot guarantee that our implementation and ongoing assessments will be satisfactory to the FDA or that the Xyrem REMS will satisfy the FDA’s
33
expectations in its evaluation of the Xyrem REMS on an ongoing basis. Any failure to comply with the REMS obligations could result in enforcement action by the FDA; lead to changes in our Xyrem REMS obligations; negatively affect sales of Xyrem; result in additional costs and expenses for us; and/or take a significant amount of time, any of which could materially and adversely affect our business, financial condition, results of operations and growth prospects.
While we have an exclusive agreement with Express Scripts Specialty Distribution Services, Inc., the central pharmacy for Xyrem, through June 2019 (subject to a one-year extension at Jazz’s discretion unless either party provides 180 days’ notice to the other of its intent to terminate the agreement), if the central pharmacy does not fulfill its contractual obligations to us, fails to meet the requirements of the Xyrem REMS applicable to the central pharmacy, provides timely notice that it wants to terminate our agreement, refuses or fails to adequately serve patients, or fails to promptly and adequately address operational challenges, whether expected or unexpected, the fulfillment of Xyrem prescriptions and our sales would be adversely affected. If we change to a new central pharmacy, new contracts might be required with government and other insurers who pay for Xyrem, and the terms of any new contracts could be less favorable to us than current agreements. In addition, any new central pharmacy would need to be registered with the DEA and certified and would also need to implement the particular processes, procedures and activities necessary to distribute Xyrem under the Xyrem REMS. Transitioning to a new pharmacy could result in product shortages, which would negatively affect sales of Xyrem, result in additional costs and expenses for us and/or take a significant amount of time, any of which could materially and adversely affect our business, financial condition, results of operations and growth prospects.
Section 505-1(i)(1) of the FDCA generally provides that (i) an ANDA that references a drug subject to a REMS with elements to assure safe use, or ETASU, is required to have a REMS with the same elements as the reference listed drug, or RLD, and (ii) the ANDA drug and the RLD shall use a single shared system to assure safe use. However, the FDA may waive this requirement for a single shared system and approve an ANDA with a separate REMS with differing but comparable aspects of ETASU under certain circumstances. These requirements do not apply to an application submitted under Section 505(b)(2) of the FDCA, even if that application references a drug subject to a REMS with ETASU.
In January 2017, the FDA announced approval of the West-Ward ANDA and waived the shared REMS requirement. The FDA’s waiver of the shared REMS requirement permits West-Ward to use a separate REMS program from the Xyrem REMS, or the generic sodium oxybate REMS, on the condition that the generic sodium oxybate REMS be open to all future sponsors of ANDAs or NDAs for sodium oxybate products. This could potentially include future sodium oxybate products approved under Section 505(b)(2). We cannot predict whether a company marketing a sodium oxybate product approved under Section 505(b)(2) would be required or permitted to distribute its product through the generic sodium oxybate REMS or a separate REMS. In connection with the waiver, FDA issued a statement that it considers the generic sodium oxybate REMS to have the same ETASU as the Xyrem REMS and operationalizes those elements in a comparable manner to achieve the same level of safety as the Xyrem REMS. We were not involved in development of the generic sodium oxybate REMS and were not consulted regarding any features of this REMS. A sodium oxybate distribution system that is less restrictive than the Xyrem REMS, such as the generic sodium oxybate REMS, which provides that generic sodium oxybate products could be distributed through multiple pharmacies, could increase the risks associated with sodium oxybate distribution. Any negative outcomes, including risks to the public, caused by or otherwise related to a separate sodium oxybate REMS, could have a significant negative impact in terms of product liability, public acceptance of Xyrem as a treatment for EDS and cataplexy in narcolepsy, and prescribers’ willingness to prescribe, and patients’ willingness to take, Xyrem, as patients, consumers and others may not differentiate generic sodium oxybate from Xyrem or differentiate between the different REMS programs, any of which could have a material adverse effect on our Xyrem business.
We may face pressure to modify the Xyrem REMS or to license or share intellectual property pertinent to the Xyrem REMS, including proprietary data required for the safe distribution of sodium oxybate, in connection with the FDA’s approval of the generic sodium oxybate REMS or otherwise. Our settlement agreements with certain of the ANDA filers do not directly impact the FDA’s waiver of the single shared system REMS requirement, any other ANDA filer’s ability to develop and implement the generic sodium oxybate REMS for its generic sodium oxybate product or our ability to take any action with respect to the generic sodium oxybate REMS. We cannot predict the outcome or impact on our business of any future action that we may take with respect to the FDA’s waiver of the single shared system REMS requirement, its approval and tentative approval of generic versions of Xyrem or the consequences of distribution of sodium oxybate through the generic sodium oxybate REMS approved by the FDA or another separate REMS.
In September 2016, Jazz Pharmaceuticals, Inc., our wholly owned subsidiary, submitted a Citizen Petition to the FDA requesting that, for safety reasons, the FDA refuse to approve any sodium oxybate ANDA with a proposed package insert or REMS that omits the portions of the Xyrem package insert and the Xyrem REMS that instruct prescribers on adjusting the dose of the product when it is co-administered with divalproex sodium (also known as valproate or valproic acid). In January 2017, the FDA granted the Citizen Petition with respect to the Xyrem package insert. The FDA concluded that it will not approve any sodium oxybate ANDA referencing Xyrem that does not include in its package insert the portions of the currently approved Xyrem package insert related to the drug-drug interaction, or DDI, with divalproex sodium. Our Xyrem DDI patents cover
34
these instructions on the Xyrem package insert and Xyrem REMS. We cannot predict whether one or more of the non-settling ANDA filers, or a company that files a Section 505(b)(2) application for a drug referencing Xyrem, may pursue regulatory strategies to avoid infringing our method of administration patents notwithstanding the FDA’s response to the Citizen Petition, or whether any such strategy would be successful. Likewise, we cannot predict whether we will be able to maintain the validity of any of our patents or will otherwise obtain a judicial determination that a generic or other sodium oxybate product, its package insert or the generic sodium oxybate REMS or another separate REMS will infringe any of our patents or, if we prevail in proving infringement, whether a court will grant an injunction that prevents any non-settling ANDA filer or other company introducing a different sodium oxybate product from marketing its product, or instead require that party to pay damages in the form of lost profits or a reasonable royalty.
For a description of the foregoing matters, see “Business-Government Regulation-The Hatch-Waxman Act” in Part I, Item 1 of this Annual Report on Form 10-K, and the risk factors under the headings “
The launch of a generic version of Xyrem or other sodium oxybate products that compete with Xyrem would adversely affect sales of Xyrem
” and “Risks Related to Our Intellectual Property” in this Part I, Item 1A.
REMS and the improper use of REMS as a means of improperly blocking or delaying competition for branded pharmaceutical products have increasingly drawn public scrutiny from Congress, the FTC and the FDA. Congress, for example, has introduced proposed legislation aimed at preventing companies from using REMS and other restricted distribution programs as a means to deny potential competitors access to product samples needed for bioequivalence testing. The FDA has stated that it will seek to coordinate with the FTC in identifying and publicizing practices the FTC finds to be anticompetitive and has further stated that the FDA has concerns related to the role of REMS programs in delaying approval of generic products. It is possible that the FTC, the FDA, other governmental authorities or other third parties could claim that, or launch an investigation into whether, we are using the Xyrem REMS in an anticompetitive manner (including in light of the FDA’s statement in the Xyrem REMS approval letter that the Xyrem REMS could be used in an anticompetitive manner inconsistent with applicable provisions of the FDCA) or have engaged in other anticompetitive practices. The FDCA further states that a REMS ETASU shall not be used by an NDA holder to block or delay generic drugs or drugs covered by an application under Section 505(b)(2) from entering the market. Several of the ANDA applicants have asserted that our REMS patents should not have been listed in the FDA’s publication “Approved Drug Products with Therapeutic Equivalence Evaluations,” or the Orange Book, and that the Xyrem REMS is blocking competition. We cannot predict the outcome of any potential government investigation of these claims or the impact of any similar claims that may be made in the future.
The FDA has required that Xyrem’s labeling include a boxed warning regarding the risk of central nervous system depression and misuse and abuse. A boxed warning is the strongest type of warning that the FDA can require for a drug product and warns prescribers that the drug carries a significant risk of serious or even life-threatening adverse effects. A boxed warning also means, among other things, that the product cannot be advertised through reminder ads, or ads that mention the pharmaceutical brand name but not the indication or medical condition it treats. Our Xyrem REMS includes unique features that provide more extensive information about adverse events, including deaths, than is generally available for other products that are not subject to similar REMS requirements. As required by the FDA and other regulatory agencies, the adverse event information that we collect for Xyrem is regularly reported to the FDA and could result in the FDA requiring changes to Xyrem labeling, including additional warnings or boxed warnings, or requiring us to take other actions that could have an adverse effect on patient and prescriber acceptance of Xyrem.
Any failure to demonstrate our substantial compliance with applicable regulatory requirements to the satisfaction of the FDA or any other regulatory authority could result in such regulatory authorities taking actions in the future, which could have a material adverse effect on Xyrem sales and therefore on our business, financial condition, results of operations and growth prospects. For more information, see the risk factor under the heading “
We are subject to significant ongoing regulatory obligations and oversight, which may result in significant additional expense and limit our ability to commercialize our products
” in this Part I, Item 1A.
Risks Related to Our Business
While Xyrem remains our largest product, our success also depends on our ability to effectively commercialize our other products and, in the case of our product candidates, our ability to obtain regulatory approval in the U.S. and Europe and, if approved, to successfully launch and commercialize those product candidates. Our inability to do so could have a material adverse effect on our business, financial condition, results of operations and growth prospects.
In addition to Xyrem, we are commercializing a portfolio of products, including our other lead marketed products, Erwinaze, Defitelio and Vyxeos, and we are making significant investments in solriamfetol and other product candidates that are currently not approved as marketed products in any jurisdiction.
35
Erwinaze
Erwinaze (called Erwinase in markets outside the U.S.), a biologic product, is used in conjunction with chemotherapy to treat patients with acute lymphoblastic leukemia, or ALL, with hypersensitivity to
E. coli
-derived asparaginase. Erwinaze was approved by the FDA under a biologics license application, or BLA, and was launched in the U.S. in November 2011. It is also being sold under marketing authorizations, named patient programs, temporary use authorizations or similar authorizations in multiple countries in Europe and elsewhere. Erwinaze is licensed from, and manufactured by, a single source, Porton Biopharma Limited, or PBL, a company that is wholly owned by the UK Secretary of State for Health. Our agreement with PBL, including our license, expires in December 2020, subject to five-year extensions unless terminated by either party in writing by December 2018. We cannot predict whether the term of the agreement will be extended or, if extended, the terms of any such extension. If the agreement is terminated, we will lose our license to sell Erwinaze in any market after December 2020, except under specified terms for a post-termination transition period.
Our ability to successfully and sustainably grow sales of Erwinaze is subject to a number of challenges, including the limited population of patients with ALL and the incidence of hypersensitivity reactions to
E. coli
-derived asparaginase within that population and our need to apply for and receive marketing authorizations, through the European Union’s, or EU’s, mutual recognition procedure or otherwise in certain additional countries if we decide to launch promotional efforts in those countries. Another significant challenge to our ability to maintain current sales levels and to increase sales is our extremely limited inventory of Erwinaze, past and continuing supply disruptions and our need to minimize or avoid additional supply disruptions due to capacity constraints, production delays, quality or regulatory challenges and other manufacturing difficulties. See the discussion regarding Erwinaze supply issues in the risk factor under the heading “
The loss of our single source suppliers, delays or problems in the supply of our products for commercial sale or our product candidates for use in our clinical trials, or our or our suppliers’ failure to comply with manufacturing regulations, could materially and adversely affect our business, financial condition, results of operations and growth prospects
” in this Part I, Item 1A.
We also face numerous other risks that may impact Erwinaze sales, including regulatory risks, the development of new asparaginase treatments or treatment protocols that could reduce the rate of hypersensitivity in patients with ALL, the development of new treatment protocols for ALL that may not include asparaginase-containing regimens, difficulties with obtaining and maintaining favorable pricing and reimbursement arrangements, and potential competition from future biosimilar products. In addition, if we fail to comply with our obligations under our agreement with the licensor and supplier of Erwinaze or lose rights to Erwinaze, including if our agreement terminates at the end of its current term in December 2020, or if we otherwise fail to maintain or grow sales of Erwinaze, our growth prospects could be negatively affected.
Defitelio
We made a significant investment in Defitelio in 2014, adding the product to our portfolio as a result of our acquisition of Gentium S.r.l, or Gentium, which we refer to as the Gentium Acquisition, and then securing worldwide rights to the product by acquiring rights to defibrotide in the Americas in August 2014. We began to commercialize Defitelio in certain European countries in 2014. On March 30, 2016, the FDA approved our NDA for Defitelio for the treatment of adult and pediatric patients with hepatic veno-occlusive disease, or VOD, also known as sinusoidal obstruction syndrome, or SOS, with renal or pulmonary dysfunction following hematopoietic stem cell transplantation, or HSCT. We launched Defitelio in the U.S. shortly after FDA approval.
Our ability to realize the anticipated benefits from this investment is subject to risks and uncertainties, including:
|
•
|
the continued acceptance of Defitelio in the U.S. by hospital pharmacy and therapeutics committees and the continued availability of favorable pricing and adequate coverage and reimbursement by government programs and third party payors;
|
|
•
|
the limited experience of, and need to educate, U.S. physicians in recognizing, diagnosing and treating VOD, particularly in adults;
|
|
•
|
the possibility that physicians recognizing VOD symptoms may not initiate or may delay initiation of treatment while waiting for those symptoms to improve, or may terminate treatment before the end of the recommended dosing schedule;
|
|
•
|
our ability to successfully maintain or grow sales of Defitelio in Europe and other non-U.S. countries;
|
|
•
|
delays or problems in the supply or manufacture of the product;
|
|
•
|
the limited size of the population of VOD patients who are indicated for treatment with Defitelio (particularly if changes in HSCT treatment protocols reduce the incidence of VOD diagnosis);
|
|
•
|
our ability to meet the post-marketing commitments and requirements imposed by the FDA in connection with its approval of our NDA for Defitelio; and
|
|
•
|
our ability to obtain marketing approval in other countries and to develop the product for additional indications.
|
The process of maintaining pricing and reimbursement approvals is complex and varies from country to country. Many European countries periodically review their reimbursement classes, which could have an adverse impact on the reimbursement
36
status of Defitelio. We cannot predict the outcome of any periodic reviews required to maintain pricing and reimbursement approvals across Europe. In addition, orphan products that have a significant impact on patient survival, such as Defitelio, may be budgeted on a local rather than national level. The balance of all of these factors will determine our ability to maintain favorable pricing and reimbursement approvals in Europe. Furthermore, after initial pricing and reimbursement approvals, reductions in prices and changes in reimbursement levels can be triggered by multiple factors, including reference pricing systems and publication of discounts by third party payors or authorities in other countries. In the EU, prices can be reduced further by parallel distribution and parallel trade, or arbitrage between low-priced and high-priced countries. If any of these events occurs, our anticipated revenue from Defitelio in the EU would be negatively affected. If we are unable to maintain favorable pricing and reimbursement approvals in countries that represent significant markets, especially where a country’s reimbursed price influences other countries, our anticipated revenue from and growth prospects for Defitelio in the EU could be negatively affected. In addition, our ability to commercialize Defitelio successfully in the U.S. will depend on, among other things, the continued availability of adequate coverage or reimbursement by U.S. government programs and third party payors.
The European Commission, or EC, granted marketing authorization to Defitelio under “exceptional circumstances” because it was not possible to obtain complete information about the product due to the rarity of the disease and because ethical considerations prevented conducting a study directly comparing Defitelio with best supportive care or a placebo. A marketing authorization granted under exceptional circumstances is subject to approval conditions and an annual reassessment of the risk-benefit balance by European Medicines Agency, or EMA. As a result, if we fail to meet the approval condition for Defitelio established by the EC, which requires that we set up a patient registry to investigate the long-term safety, health outcomes and patterns of utilization of Defitelio during normal use, or if it is determined that the balance of risks and benefits of using Defitelio changes materially, the EMA could vary, suspend or withdraw the marketing authorization for Defitelio. In addition, the FDA imposed several post-marketing commitments and requirements in connection with its approval of our NDA for Defitelio in March 2016, including the requirement that we conduct a clinical trial to analyze the safety of defibrotide versus best supportive care in the prevention of VOD in adult and pediatric patients. We may be unable to comply with these or other post-marketing obligations imposed as part of the marketing approvals for Defitelio. If we fail to meet any of these post-marketing obligations, our sales of and revenues from Defitelio could be materially adversely affected, and our future maintenance and potential growth of the market for this product may be limited.
The size of the population of VOD patients who are indicated for treatment with Defitelio is limited, and changes in HSCT treatment protocols could reduce the incidence of VOD diagnosis. Changes in treatment protocols that reduce the incidence of VOD diagnosis could adversely affect our anticipated revenues from Defitelio and our business, financial condition, results of operations and growth prospects.
We are also assessing the potential for approval of defibrotide in other countries and for development of defibrotide in additional indications. We cannot know when, if ever, defibrotide will be approved in any other country or under what circumstances, and what, if any, additional clinical or other development activities will be required in order to potentially obtain such regulatory approval and the cost associated with such required activities, if any. If we fail to obtain approval for defibrotide in other countries or for new indications, or if any future approvals we receive are for narrower indications than we expect, our anticipated revenue from defibrotide and our growth prospects would be negatively affected.
Due to the limited amount of historical sales data from commercialization of Defitelio, our Defitelio sales will be difficult to predict from period to period. As a result, Defitelio sales results or trends in any period are not necessarily indicative of future performance. If sales of Defitelio do not reach the levels we expect, our anticipated revenue from Defitelio would be negatively affected, which could have a material adverse effect on our business, financial condition, results of operations and growth prospects.
Vyxeos
We made a significant investment in Vyxeos through the acquisition of Celator Pharmaceuticals, Inc., or Celator, which we refer to as the Celator Acquisition. Vyxeos is the first injectable fixed ratio, drug delivery combination oncology product based on our CombiPlex technology platform approved by the FDA and that we expect to be considered for approval by the EMA. In August 2017, the FDA approved our NDA for Vyxeos for the treatment of adults with newly-diagnosed therapy-related acute myeloid leukemia, or t-AML, or AML with myelodysplasia-related changes, or AML-MRC. We launched and began shipping Vyxeos in the U.S. in August 2017, and our U.S. commercial launch is still at an early stage.
We submitted a marketing authorization application, or MAA, for Vyxeos in Europe for the treatment of t-AML or AML-MRC in the fourth quarter of 2017. We cannot predict whether we will be able to obtain approval in Europe in a timely manner, or at all.
Our ability to realize the anticipated benefits from our investment in Vyxeos is subject to a number of additional risks and uncertainties, including:
|
•
|
our ability to differentiate Vyxeos from other liposomal chemotherapies and generically available chemotherapy combinations with which physicians and treatment centers are more familiar;
|
37
|
•
|
delays or problems in the supply or manufacture of the product, including the ability of the third parties upon which we rely to manufacture Vyxeos and its APIs to manufacture sufficient quantities in accordance with applicable specifications;
|
|
•
|
the need to establish pricing and reimbursement support for Vyxeos in the U.S. and in other countries;
|
|
•
|
the acceptance of Vyxeos in the U.S. and other countries by hospital pharmacy and therapeutics committees and the availability of adequate coverage and reimbursement by government programs and third party payors;
|
|
•
|
the approval and use of new and novel compounds in AML that are only approved for use in combination with other agents and that have not been tested in combination with Vyxeos; and
|
|
•
|
the limited size of the population of high-risk AML patients who may potentially be indicated for treatment with Vyxeos, particularly given the ongoing clinical trials by other companies with the same patient population.
|
Due to the lack of historical sales data from commercialization of Vyxeos, our Vyxeos sales will be difficult to predict from period to period. As a result, Vyxeos sales results or trends in any period may not necessarily be indicative of future performance. If sales of Vyxeos do not reach the levels we expect, or we are unable to obtain regulatory approval for Vyxeos in Europe in a timely manner, or at all, our anticipated revenue from the product will be negatively affected, which could have a material adverse effect on our business, financial condition, results of operations and growth prospects.
In addition, the FDA imposed two post-marketing requirements in connection with its approval of our NDA for Vyxeos, including the requirement that we conduct a safety study to characterize infusion-related reactions in patients treated with Vyxeos and a clinical trial to determine dosing to minimize toxicity in patients with moderate and severe renal impairment. In the event that we are unable to comply with these or other post-marketing obligations imposed as part of the marketing approval for Vyxeos, our sales of and revenues from Vyxeos could be materially adversely affected, and our future maintenance and potential growth of the market for this product may be limited.
If we fail to maintain or increase revenue from sales of Erwinaze, Defitelio and Vyxeos, our business, financial condition, results of operations and growth prospects could be materially adversely affected. In addition to the specific risks described above, sales volumes and revenues from each of these products could be negatively affected by other risks and uncertainties described elsewhere in this Part I, Item 1A.
In addition, if we fail to obtain approvals for certain of our marketed products in new indications or formulations, we will be unable to commercialize our products in new indications or formulations, which could have a material adverse effect on our business, financial condition, results of operations and growth prospects.
Solriamfetol
In 2017, we announced positive efficacy results from our two Phase 3 clinical trials of solriamfetol, a late-stage investigational compound being developed for potential treatment of excessive sleepiness, or ES, in patients with obstructive sleep apnea, or OSA, and from our Phase 3 clinical trial of solriamfetol in patients with narcolepsy. We submitted an NDA to the FDA in the fourth quarter of 2017 to seek approval for solriamfetol in the treatment of ES associated with OSA and ES associated with narcolepsy. We cannot predict whether our NDA will be approved by the FDA in a timely manner, or at all. Our ability to realize the anticipated benefits from an approved solriamfetol product is subject to a number of risks and uncertainties, including, among other things, the outcome of DEA scheduling review, which will need to be completed after NDA approval, if any, market acceptance for an approved solriamfetol product, potential competition and the availability of adequate pricing, coverage and reimbursement by government programs and third party payors.
Other Product Candidates
In furtherance of our growth strategy, we have made significant investments in a number of other product candidates, including ongoing development activities for two other product candidates in our sleep therapeutic area. For JZP-507, an investigational new drug candidate with a 50% reduction in sodium content compared to Xyrem that in a pilot study has demonstrated bioequivalence to Xyrem, we expect to be ready to submit an NDA to the FDA as early as mid-2018 and, subject to the results of an ongoing Phase 3 trial, we expect to submit an NDA to the FDA in 2019 for JZP-258, an investigational new drug candidate that contains 90% less sodium than Xyrem.
Any failure or delay in completing necessary clinical trials and conducting other activities, including chemistry, manufacturing and controls, or CMC, activities, that are required to complete our planned NDA submissions and obtain regulatory approval could materially and adversely affect our business, financial condition, results of operations and growth prospects. See the discussion under the heading “
Conducting clinical trials is costly and time-consuming, and the outcomes are uncertain. A failure to prove that our product candidates are safe and effective in clinical trials, or to generate data in clinical trials to support expansion of the therapeutic uses for our existing products, could materially and adversely affect our business, financial condition, results of operations and growth prospects
” in this Part I, Item 1A for a discussion of risks related to our clinical trials of solriamfetol and other product candidates. See also the discussions under the headings “
The loss of our single source suppliers, delays or problems in the supply of our products for commercial sale or our product candidates for use in our
38
clinical trials, or our or our suppliers’ failure to comply with manufacturing regulations, could materially and adversely affect our business, financial condition, results of operations and growth prospects”
and “
The regulatory approval process is expensive, time-consuming and uncertain and may prevent us or our partners from obtaining approvals for the commercialization of some or all of our product candidates”
in this Part I, Item 1A.
If we are unable to obtain regulatory approval for our product candidates in a timely manner, or at all, or if sales of an approved product do not reach the levels we expect, our anticipated revenue from our product candidates would be negatively affected, which could have a material adverse effect on our business, financial condition, results of operations and growth prospects.
The loss of our single source suppliers, delays or problems in the supply of our products for commercial sale or our product candidates for use in our clinical trials, or our or our suppliers’ failure to comply with manufacturing regulations, could materially and adversely affect our business, financial condition, results of operations and growth prospects.
The manufacture of pharmaceutical products requires significant expertise and capital investment, including the development of process controls required to consistently produce the API and the finished product in sufficient quantities while meeting detailed product specifications on a repeated basis. We and our manufacturers may encounter difficulties in production, including difficulties with production costs and yields, process controls, quality control and quality assurance, including testing of stability, impurities and impurity levels and other product specifications by validated test methods, and compliance with strictly enforced U.S., state and non-U.S. regulations. These difficulties can be heightened when we or our suppliers are required to produce finished product at commercial scale or to produce increased quantities to meet growing demand. In addition, we and our suppliers are subject to the FDA’s current Good Manufacturing Practices, or cGMP, requirements, DEA regulations and other equivalent rules and regulations prescribed by non-U.S. regulatory authorities. If we or any of our suppliers encounter these or any other manufacturing, quality or compliance difficulties with respect to any of our products, we may be unable to obtain or maintain regulatory approval, or meet commercial demand, for such products, which could adversely affect our business, financial condition, results of operations and growth prospects.
We received FDA approval of our manufacturing and development facility in Athlone, Ireland in June 2016, and we commenced commercial operations at this facility in the third quarter of 2016. We are using this facility for the manufacture of Xyrem and development-stage products, including JZP-507 and JZP-258, and we expect to manufacture these products commercially at our Athlone facility should these candidates receive regulatory approval. However, other than our Athlone facility and our manufacturing plant in Italy where we produce the defibrotide drug substance, we currently do not have our own commercial manufacturing capability for our products, product candidates or their APIs, or packaging capability. As a result, our ability to develop and supply products in a timely and competitive manner depends primarily on third party suppliers being able to meet our ongoing commercial and clinical trial needs for API, other raw materials, packaging materials and finished products. In part due to the limited market size for our products and product candidates, we have a single source of supply for most of our marketed products, product candidates and their APIs. These single source arrangements put us at risk of interruption in supply in the event of manufacturing, quality or compliance difficulties at our suppliers.
Siegfried USA, LLC and its affiliates, or Siegfried, have been our sole supplier of sodium oxybate, the API for Xyrem, since 2012. Siegfried supplies sodium oxybate to our U.S.-based manufacturer of Xyrem and, through a Siegfried affiliate in Europe, to our Athlone facility. We expect that Siegfried will continue to be our sole supplier of sodium oxybate for the foreseeable future, and we cannot assure you that Siegfried can or will continue to supply on a timely basis, or at all, sufficient quantities of API to enable the manufacture of the quantities of Xyrem that we need. Patheon Pharmaceuticals Inc., which we refer to together with its affiliates as Patheon, is our sole U.S.-based manufacturer and supplier of Xyrem. Although we have commenced manufacturing of Xyrem in our Athlone facility, we expect to rely on Patheon as our U.S.-based supplier of Xyrem for the foreseeable future, and we cannot assure you that Patheon can or will continue to supply on a timely basis, or at all, the quantities of Xyrem that we need from Patheon.
Sodium oxybate is a Schedule I controlled substance in the U.S. The DEA limits the quantity of Schedule I controlled substances that may be manufactured and procured in the U.S. in any given calendar year through a quota system and, as a result, quotas from the DEA are required to manufacture and procure sodium oxybate in the U.S. Accordingly, we require DEA quotas for Siegfried in the U.S. to manufacture sodium oxybate and for Patheon, our U.S.-based Xyrem supplier, to procure the sodium oxybate from Siegfried to manufacture and supply us with Xyrem. Because the DEA typically grants quotas on an annual basis, Siegfried and Patheon are required to request and justify allocation of sufficient annual DEA quotas, as well as any additional DEA quotas necessary if our commercial or clinical requirements exceed the allocated quotas throughout the year. For the last few years, our suppliers were allocated only a portion of the published annual aggregate quota for the API. If one or more ANDA filers were to begin manufacturing a generic sodium oxybate product, generic manufacturers would need to obtain a portion of the annual aggregate API quota, which could decrease the DEA quota allocation obtained on our behalf by Siegfried and Patheon. In the past, we have had to engage in lengthy efforts to obtain the needed quotas after the original annual quotas had first been allocated. If, in the future, we and our third party suppliers cannot obtain the quotas that are
39
needed on a timely basis, or at all, our business, financial condition, results of operations and growth prospects could be materially and adversely affected.
Erwinaze is licensed from, and manufactured for us by, a single source, PBL, a company that is wholly owned by the UK Secretary of State for Health. The FDA’s approval of the BLA for Erwinaze includes a number of post-marketing commitments related to the manufacture of Erwinaze by PBL. We cannot predict if or when PBL will comply with its manufacturing-related post-marketing commitments that are part of the BLA approval. In January 2017, the FDA issued a warning letter to PBL indicating that it was not satisfied with PBL’s response to the FDA Form 483 issued to PBL in March 2016 and citing significant violations of cGMP for finished pharmaceuticals and significant deviations from cGMP for APIs. In March 2017, PBL filed a response to the warning letter with the FDA. PBL continues to address the issues identified by the FDA in the warning letter. We cannot predict if or when PBL will correct the violations and deviations to the satisfaction of the FDA or whether the FDA will be satisfied with PBL’s response to the warning letter. Any failure to do so to the satisfaction of the FDA could result in the FDA refusing admission of Erwinaze into the U.S., as well as additional enforcement actions by the FDA and other regulatory entities.
In the United Kingdom, or UK, where PBL’s manufacturing facilities are located, PBL is subject to similar inspections conducted by the UK Medicines and Healthcare Products Regulatory Agency, or MHRA. Following a site inspection of PBL by MHRA in December 2017, MHRA issued an inspection report listing several major findings, including major deficiencies and failures by PBL to comply with cGMP. In January 2018, PBL filed a response to the report with the MHRA. We cannot predict if or when PBL will correct the violations and deviations to the satisfaction of MHRA or whether the MHRA will be satisfied with PBL’s response to the inspection report. Any failure by PBL to do so to the satisfaction of the MHRA could result in an enforcement action by the MHRA.
Inability to comply with regulatory requirements of the FDA, the MHRA or other competent authorities in the EU member states in which Erwinaze is subject to marketing authorization could adversely affect Erwinaze supply, particularly in light of our extremely limited product inventory, and could result in: enforcement actions by the FDA, MHRA or other EU member states’ competent authorities (including the issuance of the local equivalents of FDA Form 483s or warning letters); the approval of the FDA or other competent authorities being suspended, varied, or revoked; product release being delayed or suspended; or product being seized or recalled. Any of these actions could have a material adverse effect on our sales of, and revenues from, Erwinaze and limit our future maintenance and potential growth of the market for this product. In addition, if the FDA or any non-U.S. regulatory authority mandates any changes to the specifications for Erwinaze, we may face challenges having product produced to meet such specifications, and our supplier may increase its price to supply Erwinaze meeting such specifications, which may result in additional costs to us or a delay in supply and may decrease any profit we would otherwise achieve with Erwinaze.
Moreover, the current manufacturing capacity for Erwinaze is completely absorbed by demand for the product. As a consequence of constrained manufacturing capacity, we have had an extremely limited or no ability to build product inventory levels that can be used to absorb supply disruptions resulting from quality, regulatory or other issues. We have experienced product quality, manufacturing and inventory challenges that have resulted, and may continue to result from time to time, in disruptions in our ability to supply certain markets and have caused, and may in the future cause, us to implement batch-specific, modified product use instructions. Most recently, we have been experiencing temporary supply disruptions in the first quarter of 2018 in the U.S. and other countries. We cannot predict whether the required remediation activities in connection with the January 2017 FDA warning letter or the December 2017 MHRA report will further strain manufacturing capacity and adversely affect Erwinaze supply, particularly in light of our extremely limited product inventory. As capacity constraints and supply disruptions continue, whether as a result of continued quality, manufacturing or regulatory issues or otherwise, we will be unable to build a desired excess level of product inventory, our ability to supply the market may continue to be compromised and physicians’ decisions to use Erwinaze have been, and may continue to be, negatively impacted.
If quality, manufacturing or regulatory issues persist and result in a disruption to supply or capacity constraints, under our agreement with PBL, we do not have the right to engage a backup supplier for Erwinaze except in very limited circumstances, such as following the termination of the agreement by us due to the uncured material breach or the cessation of manufacturing by our supplier. If we are required to engage a backup or alternative supplier, the transfer of technical expertise and manufacturing process to the backup or alternative supplier would be difficult, costly and time-consuming, might not be successful and would increase the likelihood of a delay or disruption in manufacturing or a shortage of supply of Erwinaze. If we fail to obtain a sufficient supply of Erwinaze, our sales of and revenues from Erwinaze, our future maintenance and potential growth of the market for this product, and/or our business, financial condition, results of operations and growth prospects could be materially adversely affected.
We are our sole supplier of, and we believe that we are currently the sole worldwide producer of, the defibrotide drug compound. We manufacture the defibrotide compound in a single facility located in Villa Guardia, near Como, Italy. Patheon currently processes the defibrotide compound into its finished vial form, and Patheon is the sole provider of our commercial and clinical supply of Defitelio. If Patheon does not or is not able to supply us with Defitelio for any reason, it may take time
40
and resources to implement and execute the necessary technology transfer to another processor, and such delay could negatively impact our anticipated revenues from Defitelio and could potentially cause us to breach contractual obligations with customers or to violate local laws requiring us to deliver the product to those in need.
In addition, the API in Defitelio is derived from porcine DNA. If our porcine DNA supplier experiences safety or other issues that impact its ability to supply porcine materials to us as needed, we may not be able to find alternative suppliers in a timely fashion, which could negatively impact our supply of Defitelio.
Vyxeos is manufactured using our CombiPlex technology platform. CombiPlex products represent formulations with increased manufacturing complexities associated with producing drug delivery vehicles encapsulating two or more drugs that are maintained at a fixed ratio and, in the case of Vyxeos, two drugs that are co-encapsulated in a freeze-dried format. Vyxeos is manufactured by Baxter Oncology GmbH, or Baxter, which is a sole source supplier from a single site location. Baxter manufactured batches that were used in the Phase 3 clinical trial for Vyxeos, but Baxter has since experienced batch failures due to mechanical, component and other issues. While other contract manufacturers may be able to produce Vyxeos, the proprietary technology that supports the manufacture of Vyxeos is not easily transferable. Consequently, engaging an alternate manufacturer may be difficult, costly and time-consuming. If Baxter does not deliver sufficient quantities of Vyxeos in accordance with applicable specifications on a timely basis, whether due to batch failures or other delays, our ability to successfully commercialize Vyxeos and generate sales of this product at the level we expect could be materially and adversely affected. See also the discussion under the heading “
While Xyrem remains our largest product, our success also depends on our ability to effectively commercialize our other products and, in the case of our product candidates, our ability to obtain regulatory approval in the U.S. and Europe and, if approved, to successfully launch and commercialize those product candidates. Our inability to do so could have a material adverse effect on our business, financial condition, results of operations and growth prospects
” in this Part I, Item 1A.
In addition, while the APIs in Vyxeos, daunorubicin and cytarabine, are available from a number of suppliers, certain suppliers have received warning letters from the FDA. As a result, we have qualified other suppliers for each API, and we provided the qualification data to the FDA. If the FDA restricts importation of API from either supplier, and we are unable to qualify API from additional suppliers in a timely manner, or at all, our ability to successfully commercialize Vyxeos and generate sales of this product at the level we expect could be materially and adversely affected.
To conduct our ongoing and any future clinical trials of, complete marketing authorization submissions for, and potentially launch our other product candidates, we need to have sufficient quantities of product manufactured. For example, Siegfried has supplied us with both the API and finished product for our development activities involving solriamfetol, including our Phase 3 clinical trials. We expect that Siegfried will manufacture and supply solriamfetol drug product for commercial sale if solriamfetol receives regulatory approval and that, in the short term, Siegfried will be the sole provider of our commercial supply of solriamfetol. If Siegfried does not or is not able to supply us with solriamfetol for any reason, it may take time and resources to implement and execute the necessary technology transfer to another provider, and such delay could negatively impact our anticipated revenues from solriamfetol. If Siegfried does not or is not able to supply us with solriamfetol for any reason, including due to a failure to obtain any necessary DEA quotas, it may take time and resources to implement and execute the necessary technology transfer to another provider, and such delay could negatively impact our anticipated revenues from solriamfetol.
JZP-507 and JZP-258 are currently manufactured at our Athlone facility, and we expect to manufacture these products commercially at our Athlone facility should these candidates receive regulatory approval. However, there can be no assurance that we or our suppliers will be able to produce sufficient supplies of our product candidates in a timely manner or in accordance with applicable specifications. In addition, to obtain FDA approval of any product candidate, we or our supplier or suppliers for that product must obtain approval by the FDA to manufacture and supply product, in some cases based on qualification data provided to the FDA as part of our NDA submission. Any delay in generating, or failure to generate, data required in connection with submission of the CMC portions of any NDA could negatively impact our ability to meet our anticipated submission dates, and therefore our anticipated timing for obtaining FDA approval, or our ability to obtain FDA approval at all. In addition, any failure of us or a supplier to obtain approval by the FDA to manufacture and supply product or any delay in receiving, or failure to receive, adequate supplies of a product on a timely basis or in accordance with applicable specifications could negatively impact our ability to successfully launch and commercialize products and generate sales of products at the levels we expect.
Failure by us or our third party suppliers to comply with regulatory requirements could adversely affect our or their ability to supply products or ingredients. All facilities and manufacturing techniques used for the manufacture of pharmaceutical products must be operated in conformity with applicable cGMP requirements. DEA regulations also govern U.S. facilities where controlled substances such as sodium oxybate are manufactured. Our manufacturing facilities and manufacturing facilities of our suppliers have been and are subject to periodic unannounced inspection by the FDA, the EMA, the DEA, the Italian Health Authority and other regulatory authorities, including state authorities and similar authorities in other jurisdictions, to confirm compliance with cGMP and other requirements. We and our third party suppliers must
41
continually expend time, money and effort in production, record keeping and quality assurance and control to ensure that our products and product candidates meet applicable specifications and other requirements for product safety, efficacy and quality. Failure to comply with applicable legal and regulatory requirements subjects us and our suppliers to possible legal or regulatory action, including restrictions on supply or shutdown, which may adversely affect our or a supplier’s ability to supply the ingredients or finished products we need. Moreover, our or our third party suppliers’ facilities could be damaged by fire, flood, earthquake, power loss, telecommunication and information system failure, terrorism or similar events. Any of these events could cause a delay or interruption in manufacturing and potentially a supply shortage of our products, which could negatively impact our anticipated revenues.
If, for any reason, our suppliers, including any new suppliers, do not continue to supply us with our products or product candidates in a timely fashion and in compliance with applicable quality and regulatory requirements, or otherwise fail or refuse to comply with their obligations to us under our supply and manufacturing arrangements, we may not have adequate remedies for any breach, and their failure to supply us could result in a shortage of our products or product candidates, which could adversely affect our business, financial condition, results of operations and growth prospects.
In addition, if one of our suppliers fails or refuses to supply us for any reason, it would take a significant amount of time and expense to qualify a new supplier. The FDA and similar international regulatory bodies must approve manufacturers of the active and inactive pharmaceutical ingredients and certain packaging materials used in our products. The loss of one of our suppliers could require us to obtain regulatory clearance in the form of a “prior approval supplement” and to incur validation and other costs associated with the transfer of the API or product manufacturing process. We believe that it could take up to two years, or longer in certain cases, to qualify a new supplier, and we may not be able to obtain APIs or finished products from new suppliers on acceptable terms and at reasonable prices, or at all. If there are delays in qualifying new suppliers or facilities or a new supplier is unable to obtain a sufficient quota from the DEA, if required, or to otherwise meet FDA or similar international regulatory body’s requirements for approval, there could be a shortage of the affected products for the marketplace or for use in clinical studies, or both, particularly since we do not have secondary sources for supply and manufacture of the APIs for our products or backup suppliers for our finished products.
Our ability to develop and deliver products in a timely and competitive manner depends on our third party suppliers being able to continue to meet our ongoing commercial needs. Any delay in supplying, or failure to supply, products or product candidates by any of our suppliers could result in our inability to meet the commercial demand for our products, or our needs for use in clinical trials, and could adversely affect our business, financial condition, results of operations and growth prospects.
The commercial success of our products depends upon their market acceptance by physicians, patients, third party payors and the medical community.
If physicians do not prescribe our products, we cannot generate the revenues we anticipate from product sales. Market acceptance of any of our products by physicians, patients, third party payors and the medical community depends on:
|
•
|
the clinical indications for which a product is approved and any restrictions placed upon the product in connection with its approval, such as a REMS, patient registry requirements or labeling restrictions;
|
|
•
|
the prevalence of the disease or condition for which the product is approved and its diagnosis;
|
|
•
|
the severity of side effects;
|
|
•
|
acceptance by physicians and patients of each product as a safe and effective treatment;
|
|
•
|
the extent to which the product is approved for inclusion on formularies of hospitals and managed care organizations;
|
|
•
|
the conditions for reimbursement required by, and appropriate pricing and availability of reimbursement from, third party payors;
|
|
•
|
availability of sufficient product inventory to meet demand, particularly with respect to Erwinaze;
|
|
•
|
physicians’ decisions relating to treatment practices based on availability of product inventory, particularly with respect to Erwinaze;
|
|
•
|
perceived advantages over alternative treatments;
|
|
•
|
relative convenience and ease of administration;
|
|
•
|
with respect to Xyrem, physician and patient assessment of the burdens associated with obtaining or maintaining the certifications required under the Xyrem REMS;
|
|
•
|
the cost of treatment in relation to alternative treatments, including generic products; and
|
|
•
|
the availability of financial or other assistance for patients who are uninsured or underinsured.
|
Because of our dependence upon market acceptance of our products, any adverse publicity associated with harm to patients or other adverse events resulting from the use or misuse of our products or any similar products distributed by other companies, including generic versions of our products, could materially and adversely affect our business, financial condition, results of operations and growth prospects. For example, from time to time, there is negative publicity about illicit gamma-hydroxybutyrate, or GHB, and its effects, including with respect to illegal use, overdoses, serious injury and death. Because sodium oxybate, the API in Xyrem, is a derivative of GHB, Xyrem sometimes also receives negative mention in publicity relating to GHB. Patients, physicians and regulators may therefore view Xyrem as the same as or similar to illicit GHB. In
42
addition, there are regulators and some law enforcement agencies that oppose the prescription and use of Xyrem generally because of its connection to GHB. Xyrem’s label includes information about adverse events from GHB. Moreover, a sodium oxybate distribution system that is less restrictive than the Xyrem REMS, such as the generic sodium oxybate REMS approved by the FDA in January 2017, may increase the risks associated with sodium oxybate distribution, as patients, consumers and others may not differentiate generic sodium oxybate from Xyrem or differentiate between the different REMS programs. Any negative outcomes, including but not limited to risks to the public, caused by or otherwise related to the separate generic sodium oxybate REMS could have a significant negative impact in terms of product liability, goodwill, and prescribers’ willingness to prescribe, and patients’ willingness to take, Xyrem, any of which could have a material adverse effect on our Xyrem revenues.
In addition, we have periodically increased the price of Xyrem and may do so again in the future. We also have made and may in the future make similar price increases on our other products. Price increases on our products and negative publicity regarding pricing and price increases generally, whether on our products or products distributed by other pharmaceutical companies, could negatively affect market acceptance of our products. For additional discussion about payor acceptance, see the risk factor under the heading “
Access and adequate reimbursement coverage may not be available for our products, which could diminish our sales or affect our ability to sell our products profitably
” in this Part I, Item 1A.
We face substantial competition from other companies, including companies with greater resources, including larger sales organizations and more experience working with large and diverse product portfolios, than we have.
The commercial potential of our current products and any future products may be reduced or eliminated if our competitors develop or acquire and commercialize generic or branded products that are safer or more effective, have fewer side effects, are easier to administer or are less expensive than our products. The pharmaceutical industry is highly competitive and dominated by a number of large, established pharmaceutical companies, as well as specialty pharmaceutical companies that market products and develop product candidates in sleep, hematology/oncology, pain and other therapeutic areas. Many of our competitors, particularly large pharmaceutical and life sciences companies, have substantially greater financial, operational and human resources than we do. They can spend more on, and have more expertise in, research and development, regulatory, manufacturing, distribution and sales activities. As a result, our competitors may obtain FDA or other regulatory approvals for their product candidates more rapidly than we may and may market their products more effectively than we do. Smaller or earlier stage companies may also prove to be significant competitors, particularly through focused development programs and collaborative arrangements with large, established companies.
While Xyrem is the only product approved by the FDA and currently marketed in the U.S. for the treatment of both cataplexy and EDS in patients with narcolepsy, cataplexy is often treated with tricyclic antidepressants and selective serotonin reuptake inhibitors or selective norepinephrine reuptake inhibitors, even though these products are not approved by the FDA for the treatment of cataplexy. Other treatments for EDS in patients with narcolepsy include stimulants and wakefulness promoting agents, such as Provigil® (modafinil) and Nuvigil® (armodafinil), as well as generic versions of Provigil, the only other products both approved by the FDA and currently marketed for the treatment of EDS in patients with narcolepsy. Provigil, its generic equivalents and Nuvigil are also approved for improving wakefulness in patients with EDS associated with treated OSA or shift work disorder.
We are also aware of products being developed by others for use as treatment options in cataplexy and/or EDS in patients with narcolepsy, including a product to treat adult patients with narcolepsy with or without cataplexy that received marketing approval in Europe in 2016. While this product is currently not approved by the FDA for marketing in the U.S., the company that has exclusive U.S. commercialization rights to this product recently announced that it expects to establish an expanded access program for the product in early 2018 and submit an NDA to the FDA for the treatment of narcolepsy in adult patients during the first half of 2018. The receipt of marketing approval and commercialization of this product in the U.S. for the treatment of narcolepsy patients could, depending on the targeted patient population, negatively impact our ability to maintain and grow sales of Xyrem.
Nine companies have filed ANDAs with the FDA seeking to market generic versions of Xyrem. The FDA has approved or tentatively approved some of these ANDAs, and we believe that it is likely that the FDA will approve or tentatively approve additional ANDAs. We have settled lawsuits against five of these companies, and patent litigation is ongoing with the other four ANDA filers. For a description of these settlement agreements, ongoing litigation and the risks related to the launch of a generic sodium oxybate product, see “Legal Proceedings” in Part I, Item 3 of this Annual Report on Form 10-K and the risk factor under the heading “
The launch of a generic version of Xyrem or other sodium oxybate products that compete with Xyrem would adversely affect sales of Xyrem.
”
Other companies could also develop products that are similar, but not identical, to Xyrem, such as an alternative formulation or an alternative delivery technology, and seek approval in the U.S. through a Section 505(b)(2) NDA approval pathway, which allows companies to seek approval of a product that is similar, but not identical, to a previously-approved brand-name product, and to rely to some degree on the previously-approved product’s safety and efficacy data. For example,
43
Avadel has stated that it is conducting a Phase 3 pivotal trial pursuant to an FDA-approved special protocol assessment, and has indicated that it intends to seek approval of its product candidate using a Section 505(b)(2) NDA approval pathway referencing Xyrem. If Avadel successfully develops, obtains FDA approval of and is able to launch this product candidate, Avadel’s product may compete with Xyrem and could result in a substantial reduction of Xyrem sales, which could have the additional impact of potentially triggering acceleration of market entry of AG Products or other generic sodium oxybate products under our ANDA litigation settlement agreements.
We expect that the launch of an AG Product or a generic version of Xyrem, or the approval and launch of other products that compete with Xyrem, could have a material adverse effect on our sales of Xyrem and on our business, financial condition, results of operations and growth prospects. For further discussion regarding these and other risks and challenges we face with respect to Xyrem, see the risk factors under the headings “Risks Related to Xyrem and the Significant Impact of Xyrem Sales” and
“Risks Related to Our Intellectual Property” in this Part I, Item 1A.
While there is currently no direct competition to Erwinaze to treat ALL patients with hypersensitivity to
E. coli
-derived asparaginase, other companies have developed or are developing new treatments for ALL, including new asparaginase treatments that could reduce the rate of hypersensitivity in patients with ALL, and new treatment protocols are being developed for ALL that may not include asparaginase-containing regimens. For example, a number of companies are developing new immunotherapy treatments for relapsed or refractory ALL patients, including one treatment that was recently approved. The development of these new treatments could negatively impact our ability to grow sales of Erwinaze in patient populations where the benefit of an asparaginase-containing regimen is not well established. As a biologic product, Erwinaze also faces potential competition from biosimilar products.
AML, the cancer indication for which we commercialize Vyxeos, has alternative established therapies. A key consideration in the treatment of AML patients is the patient’s suitability for chemotherapy. The patient population studied in the Vyxeos Phase 3 clinical trial included AML patients deemed able to tolerate chemotherapy. The existing options for the treatment of newly-diagnosed t-AML patients who can tolerate chemotherapy include cytarabine in combination with an anthracycline (i.e., daunorubicin), known as 7+3. In addition, we are aware of several other products that have been recently approved by the FDA or are in development for use as treatment options for AML patients, such as targeted agents (FLT-3, IDH-1, IDH-2, CD-33, CAR T‑cell). Some of the patient populations being studied for, or treated by, these products overlap with the patient population studied in the Vyxeos Phase 3 clinical trial. The existence of established treatment options and the development of competing products for the treatment of newly-diagnosed t-AML or AML-MRC could negatively impact our ability to successfully commercialize Vyxeos and achieve the level of sales we expect, which could have a material adverse effect on our business, financial condition, results of operations and growth prospects.
In the fourth quarter of 2017, we submitted an NDA for solriamfetol to the FDA for the treatment of patients with ES in narcolepsy and ES in OSA. Other treatments for ES in patients with narcolepsy include stimulants and wake-promoting agents, such as Provigil and Nuvigil, and generic versions of stimulants and wake-promoting agents. We are also aware of off-label uses of stimulants for ES in patients with OSA. Solriamfetol, if approved by the FDA, will likely face competition from this genericized market. In addition, we are aware of several other products in development for use as potential treatment options for ES in patients with narcolepsy or OSA, including, for example, pitolisant, mazindol, modafinil combinations and Avadel’s once-nightly sodium oxybate formulation.
Many of our competitors are able to deploy more personnel to market and sell their products than we do. We currently have a relatively small number of sales representatives compared with the number of sales representatives of most other pharmaceutical companies with marketed products. Each of our sales representatives is responsible for a territory of significant size. The continued growth of our current products and the launch of any future products may require expansion of our sales force and sales support organization, and we may need to commit significant additional funds, management and other resources to the growth of our sales organization. We may not be able to achieve any necessary growth in a timely or cost-effective manner or realize a positive return on our investment, and we may not have the financial resources to achieve the necessary growth in a timely manner, or at all. In particular, we compete with a significant number of pharmaceutical and life sciences companies with extensive sales, marketing and promotional experience in hematology/oncology markets, and our failure to compete effectively in this area could negatively affect our sales of Erwinaze, Defitelio, Vyxeos and other products. We also have to compete with other pharmaceutical and life sciences companies to recruit, hire, train and retain sales and marketing personnel, and turnover in our sales force and marketing personnel could negatively affect sales of our products. If our specialty sales force and sales organization are not appropriately sized to adequately promote any current or potential future products, the commercial potential of our current products and any future products may be diminished.
Our products and product candidates may also compete in the future with new products currently under development by others. Any products that we develop are likely to be in a highly competitive market, and many of our competitors may succeed in developing products that may render our products obsolete or noncompetitive.
44
Our ability to continue to grow further requires that we compete successfully with specialty pharmaceutical companies for product and product candidate acquisition and in-licensing opportunities. These competitors include established companies that may have a competitive advantage over us due to their size and financial resources.
We may not be able to successfully identify and acquire, in-license or develop additional products or product candidates to grow our business, and, even if we are able to do so, we may not be able to successfully manage the risks associated with integrating any products or product candidates we may acquire in the future into our product portfolio, or we may otherwise fail to realize the anticipated benefits of these acquisitions.
We intend to grow our business over the long term by acquiring or in-licensing and developing additional products and product candidates that we believe have significant commercial potential. Future growth through acquisition or in-licensing will depend upon the availability of suitable products and product candidates for acquisition or in-licensing on acceptable prices, terms and conditions.
Even if appropriate opportunities are available, we may not be able to successfully identify them, or we may not have the financial resources necessary to pursue them. Other companies, many of which may have substantially greater financial, marketing and sales resources, compete with us for these opportunities. In order to compete successfully to acquire attractive products or product candidates in the current business climate, we may have to pay higher prices for assets than may have been paid historically, which may make it more difficult for us to realize an adequate return on any acquisition.
Even if we are able to successfully identify and acquire, in-license or develop additional products or product candidates, we cannot assure you that we will be able to successfully manage the risks associated with integrating any products or product candidates or the risks arising from anticipated and unanticipated problems in connection with an acquisition or in-licensing. We may not be able to realize the anticipated benefits of any acquisition or in-licensing for a variety of reasons, including if:
|
•
|
we are unable to obtain and maintain adequate funding to complete the development of, obtain regulatory approval for and commercialize an acquired product candidate;
|
|
•
|
a product candidate proves not to be safe or effective in later clinical trials;
|
|
•
|
a product fails to reach its forecasted commercial potential as a result of pricing pressures or for any other reason;
|
|
•
|
we experience negative publicity regarding actual or potential future price increases for that product or otherwise; or
|
|
•
|
the integration of a product or product candidate gives rise to unforeseen difficulties and expenditures.
|
Any failure to identify and manage these risks and uncertainties effectively could have a material adverse effect on our business.
In addition, product and product candidate acquisitions create other uncertainties and risks, particularly when the acquisition takes the form of a merger or other business consolidation. Our business acquisitions have required, and any similar future transactions will also require, significant efforts and expenditures, including with respect to transition activities and integrating the acquired business with our historical business. We may encounter unexpected difficulties, or incur unexpected costs, in connection with potential acquisitions and similar transactions, which include:
|
•
|
high acquisition costs;
|
|
•
|
the need to incur substantial debt or engage in dilutive issuances of equity securities to pay for acquisitions;
|
|
•
|
the potential disruption of our historical core business;
|
|
•
|
the strain on, and need to continue to expand, our existing operational, technical, financial and administrative infrastructure;
|
|
•
|
the difficulties in assimilating employees and corporate cultures;
|
|
•
|
the failure to retain key managers and other personnel;
|
|
•
|
the challenges in controlling additional costs and expenses in connection with and as a result of any acquisition;
|
|
•
|
the need to write down assets or recognize impairment charges;
|
|
•
|
the diversion of our management’s attention to integration of operations and corporate and administrative infrastructures; and
|
|
•
|
any unanticipated liabilities for activities of or related to the acquired business or its operations, products or product candidates.
|
If any of these or other factors impair our ability to integrate or otherwise manage an acquired business efficiently and successfully, we may be required to spend time or money on integration activities that otherwise would be spent on the development and expansion of our business. Resulting operating inefficiencies could increase costs and expenses more than we planned, could negatively impact the market price of our ordinary shares and could otherwise distract us from the execution of our strategy. Failure to maintain effective financial controls and reporting systems and procedures during and after integration of an acquired business could also impact our ability to produce timely and accurate financial statements.
45
Conducting clinical trials is costly and time-consuming, and the outcomes are uncertain. A failure to prove that our product candidates are safe and effective in clinical trials, or to generate data in clinical trials to support expansion of the therapeutic uses for our existing products, could materially and adversely affect our business, financial condition, results of operations and growth prospects.
Since 2014, we have made significant investments into expanding our product development pipeline and expect to continue to increase our research and development organization. Significant clinical, development and financial resources will be required to progress product candidates through clinical trials and the regulatory approval process to develop them into commercially viable products. We have a number of product candidates under development. We also intend to pursue clinical development of other product candidates that we may acquire or in-license in the future. Any failure or delay in completing clinical trials for our product candidates would prevent or delay the commercialization of our product candidates, which could materially and adversely affect our business, financial condition, results of operations and growth prospects.
As a condition to regulatory approval, each product candidate must undergo extensive and expensive preclinical studies and clinical trials to demonstrate to a statistically significant degree that the product candidate is safe and effective. The results at any stage of the development process may lack the desired safety, efficacy or pharmacokinetic characteristics. Results of limited preclinical studies, including studies of our product candidates in animal models, may not predict the results of human clinical trials of those product candidates. Similarly, results from early clinical trials may not be predictive of results obtained in later and larger clinical trials, and product candidates in later clinical trials may fail to show the desired safety and efficacy despite having progressed successfully through initial clinical testing. In that case, the FDA or any equivalent non-U.S. regulatory agency may determine our data is not sufficiently compelling to warrant marketing approval and may require us to engage in additional clinical trials or provide further analysis which may be costly and time-consuming. A number of companies in the pharmaceutical industry, including us, have suffered significant setbacks in clinical trials, even in advanced clinical trials after showing positive results in preclinical studies or earlier clinical trials. If a product candidate fails at any stage of development and does not receive regulatory approval, we will not be able to commercialize it and receive any return on our investment in that product candidate.
We submitted an NDA for solriamfetol to the FDA in the fourth quarter of 2017 based on positive results from our two Phase 3 clinical trials, but if the FDA determines that our safety or efficacy data do not warrant marketing approval, we may be required to conduct additional clinical trials, which could be costly and time-consuming, or we may not be able to commercialize solriamfetol, in which event we would not receive any return on our investment.
Our development pipeline projects may not be successful, and any adverse events or other information generated during the course of studies related to existing products could result in action by the FDA or a non-U.S. regulatory agency, which may restrict our ability to sell, or adversely affect sales of, currently marketed products, or such events or other information could otherwise have a material adverse effect on a related commercial product. Any failure or delay in completing clinical trials for line extensions or the generation of additional clinical data could materially and adversely affect the maintenance and growth of the markets for the related marketed products, which could adversely affect our business, financial condition, results of operations and overall growth prospects.
In addition to issues relating to the results generated in clinical trials, clinical trials can be delayed or halted for a variety of reasons, including:
|
•
|
delays or failures in obtaining regulatory authorization to commence a trial because of safety concerns of regulators relating to our product candidates or similar product candidates of our competitors or failure to follow regulatory guidelines;
|
|
•
|
delays or failures in obtaining clinical materials and manufacturing sufficient quantities of the product candidate for use in trials;
|
|
•
|
delays or failures in reaching agreement on acceptable terms with prospective study sites;
|
|
•
|
delays or failures in obtaining approval of our clinical trial protocol from an institutional review board, also known as an ethics committee in Europe, to conduct a clinical trial at a prospective study site;
|
|
•
|
delays or failures in recruiting patients to participate in a clinical trial;
|
|
•
|
failure of our clinical trials and clinical investigators to be in compliance with the FDA and other regulatory agencies’ requirements, commonly referred to as good clinical practices;
|
|
•
|
unforeseen safety issues, including negative results from ongoing preclinical studies and clinical trials and adverse events associated with product candidates;
|
|
•
|
inability to monitor patients adequately during or after treatment;
|
|
•
|
difficulty monitoring multiple study sites;
|
|
•
|
difficulty identifying or enrolling eligible patients, in some cases based on the number of clinical trials with enrollment criteria targeting the same patient population;
|
46
|
•
|
failure of our third party clinical trial managers to satisfactorily perform their contractual duties, comply with regulations or meet expected deadlines; or
|
|
•
|
insufficient funds to complete the trials.
|
We have substantially expanded our international footprint and operations, and we may expand further in the future, but we do not yet have substantial historical experience in international markets and may not achieve the results that we, our shareholders or analysts who cover our business expect.
We are headquartered in Dublin, Ireland and have multiple offices in the U.S., the UK, Italy and other countries in Europe. Our headcount has grown to approximately 1,210 as of February 2018. This includes employees in 14 countries in North America and Europe, a European commercial presence, a complex distribution network for products in Europe and additional territories, and manufacturing facilities in Italy and Ireland. In addition, we may expand our international operations into other countries in the future, either organically or by acquisition. While we have acquired significant management and other personnel with substantial international experience, conducting our business in multiple countries subjects us to a variety of risks and complexities that may materially and adversely affect our business, results of operations, financial condition and growth prospects, including, among other things:
|
•
|
the increased complexity and costs inherent in managing international operations;
|
|
•
|
diverse regulatory, financial and legal requirements, and any future changes to such requirements, in one or more countries where we are located or do business;
|
|
•
|
country-specific tax, labor and employment laws and regulations;
|
|
•
|
applicable trade laws, tariffs, export quotas, custom duties or other trade restrictions and any changes to them;
|
|
•
|
challenges inherent in efficiently managing employees in diverse geographies, including the need to adapt systems, policies, benefits and compliance programs to differing labor and other regulations, as well as maintaining positive interactions with unionized employees in one of our international locations;
|
|
•
|
liabilities for activities of, or related to, our international operations, products or product candidates;
|
|
•
|
changes in currency rates; and
|
|
•
|
regulations relating to data security and the unauthorized use of, or access to, commercial and personal information.
|
As a result of our rapid growth, our business and corporate structure has become substantially more complex. There can be no assurance that we will effectively manage the increased complexity without experiencing operating inefficiencies or control deficiencies. Significant management time and effort is required to effectively manage the increased complexity of our company, and our failure to successfully do so could have a material adverse effect on our business, financial condition, results of operations and growth prospects.
In recent years, the global economy has been impacted by the effects of an ongoing global financial crisis, including the European sovereign debt crisis, which has caused extreme disruption in the financial markets, including severely diminished liquidity and credit availability. In addition, we expect to continue to grow our product sales in Europe. Continuing worldwide economic instability, including challenges faced by the Eurozone and certain of the countries in Europe and the ongoing budgetary difficulties faced by a number of EU member states, including Greece and Spain, has led and may continue to lead to substantial delays in payment and payment partially with government bonds rather than cash for medicinal drug products, which could negatively impact our revenues and profitability.
In addition, in June 2016, eligible members of the electorate in the UK decided by referendum to leave the EU. On March 29, 2017, the government of the UK initiated the formal procedure for withdrawal from the EU. We have a significant office in Oxford, England, which focuses on commercialization of our products outside of the U.S., among other activities. We do not know to what extent, or when, the UK’s withdrawal from the EU or any other future changes to membership in the EU will impact our business, if at all. In particular, our ability to conduct international business out of the UK may be adversely affected. For a further discussion, see the risks under the heading “
The results of the UK’s referendum on withdrawal from the EU may have a negative effect on global economic conditions, financial markets and our business
” in this Part I, Item 1A.
We rely on third parties to conduct our clinical trials, and if they do not properly and successfully perform their legal and regulatory obligations, as well as their contractual obligations to us, we may not be able to obtain regulatory approvals for our product candidates.
We rely on contract research organizations and other third parties to assist us in designing, managing, monitoring and otherwise carrying out our clinical trials, including with respect to site selection, contract negotiation and data management. We do not control these third parties, and, as a result, they may not treat our clinical studies as a high priority, or in the manner in which we would prefer, which could result in delays. We are responsible for confirming that each of our clinical trials is conducted in accordance with its general investigational plan and protocol, as well as good clinical practices, for conducting, recording and reporting the results of clinical trials to ensure that the data and results are credible and accurate and that the trial participants are adequately protected. The FDA and non-U.S. regulatory agencies enforce good clinical practices through periodic inspections of trial sponsors, principal investigators and trial sites. If we, contract research organizations or other third
47
parties assisting us or our study sites fail to comply with applicable good clinical practices, the clinical data generated in our clinical trials may be deemed unreliable and the FDA or its non-U.S. counterparts may require us to perform additional clinical trials before approving our marketing applications. We cannot assure you that, upon inspection, the FDA or non-U.S. regulatory agencies will determine that any of our clinical trials comply with good clinical practices. In addition, our clinical trials must be conducted with product produced under the FDA’s cGMP regulations and similar regulations outside of the U.S. Our failure, or the failure of our product suppliers, to comply with these regulations may require us to repeat or redesign clinical trials, which would delay the regulatory approval process.
If third parties do not successfully carry out their duties under their agreements with us, if the quality or accuracy of the data they obtain is compromised due to failure to adhere to our clinical protocols, including dosing requirements, or regulatory requirements, or if they otherwise fail to comply with clinical trial protocols or meet expected deadlines, our clinical trials may not meet regulatory requirements. If our clinical trials do not meet regulatory requirements or if these third parties need to be replaced, our clinical trials may be extended, delayed, suspended or terminated. If any of these events occur, we may not be able to obtain regulatory approval of our product candidates or succeed in our efforts to create approved line extensions for certain of our existing products or generate additional useful clinical data in support of these products.
If we fail to attract, retain and motivate key personnel or to retain the members of our executive management team, our operations and our future growth may be adversely affected.
Our success and our ability to grow depend in part on our continued ability to attract, retain and motivate highly qualified personnel and on our ability to develop and maintain important relationships with leading academic institutions, clinicians and scientists. We are highly dependent upon our executive management team and other critical personnel, all of whom work on many complex matters that are essential to our success. We do not carry “key person” insurance. The loss of services of one or more members of our executive management team or other key personnel could delay or prevent the successful completion of some of our vital activities. Any employee may terminate his or her employment at any time without notice or with only short notice and without cause or good reason. The resulting loss of institutional knowledge may negatively impact our operations and future growth.
In addition, to grow our company we will need additional personnel. Competition for qualified personnel in the pharmaceutical industry is very intense. If we are unable to attract, retain and motivate quality individuals, including in our research and development operations, which are continuing to expand, our business, financial condition, results of operations and growth prospects could be adversely affected.
We also depend on the unique abilities, industry experience and institutional knowledge of the members of our board of directors to efficiently set company strategy and effectively guide our executive management team. We cannot be certain that future board turnover will not negatively affect our business.
Significant disruptions of information technology systems or data security breaches could adversely affect our business.
We are increasingly dependent on information technology systems and infrastructure, including mobile technologies, to operate our business. In the ordinary course of our business, we collect, store and transmit large amounts of confidential information, including intellectual property, proprietary business information and personal information. It is critical that we do so in a secure manner to maintain the confidentiality and integrity of such confidential information. We have also outsourced elements of our operations (including elements of our information technology infrastructure) to third parties, and as a result we manage a number of third party vendors who may or could have access to our confidential information. The size and complexity of our information technology systems, and those of third party vendors with whom we contract, and the large amounts of confidential information stored on those systems, make such systems potentially vulnerable to service interruptions or to security breaches from inadvertent or intentional actions by our employees, third party vendors, and/or business partners, or from cyber-attacks by malicious third parties. Cyber-attacks
are increasing in their frequency, sophistication and intensity. Cyber-attacks could include the deployment of harmful malware, denial-of-service attacks, social engineering and other means to affect service reliability and threaten the confidentiality, integrity and availability of information. Although the aggregate impact on our operations and financial condition has not been material to date, we have been the target of events of this nature and expect them to continue.
Significant disruptions of our, our third party vendors’ and/or business partners’ information technology systems or security breaches could adversely affect our business operations and/or result in the loss, misappropriation, and/or unauthorized access, use or disclosure of, or the prevention of access to, confidential information (including trade secrets or other intellectual property, proprietary business information and personal information), and could result in financial, legal, business and reputational harm to us. Any such event that leads to unauthorized access, use or disclosure of personal information, including personal information regarding our patients or employees, could harm our reputation, compel us to comply with federal and/or state breach notification laws and foreign law equivalents, subject us to mandatory corrective action, require us to verify the correctness of database contents and otherwise subject us to liability under laws and regulations that protect the privacy and security of personal information, which could disrupt our business, result in increased costs or loss of revenue, and/or result in
48
significant legal and financial exposure. In addition, security breaches and other inappropriate access can be difficult to detect, and any delay in identifying them may lead to increased harm of the type described above. Moreover, the prevalent use of mobile devices to access confidential information increases the risk of security breaches. While we have implemented security measures to protect our information technology systems and infrastructure, there can be no assurance that such measures will prevent service interruptions or security breaches that could adversely affect our business.
The results of the UK’s referendum on withdrawal from the EU may have a negative effect on global economic conditions, financial markets and our business.
On March 29, 2017, the government of the UK initiated the formal procedure for withdrawal from the EU. The procedure involves a two-year negotiation period in which the UK and the EU must conclude an agreement setting out the terms of the UK's withdrawal and the arrangements for the UK's future relationship with the EU. This negotiation period could be extended by a unanimous decision of the European Council in agreement with the UK.
The referendum has created significant uncertainty concerning the future relationship between the UK and the EU. This includes the laws and regulations that will apply as the UK determines which EU laws to replace or replicate in the event of a withdrawal. From a regulatory perspective, the UK's withdrawal could result in significant complexity and risks. The tax consequences of the UK’s withdrawal from the EU are uncertain as well.
The UK referendum has also given rise to calls for the governments of other EU member states to consider withdrawal from the EU. These developments, or the perception that they could occur, have had and may continue to have a material adverse effect on global economic conditions and the stability of global financial markets. They may significantly reduce global market liquidity and restrict the ability of key market participants to operate in certain financial markets.
We have a significant office in Oxford, England, which focuses on commercialization of our products outside of the U.S., among other activities. We do not know to what extent, or when, the UK’s withdrawal from the EU or any other future changes to membership in the EU will impact our business, if at all. In particular, our ability to conduct international business out of the UK may be adversely affected. For a further discussion, see the risks under the headings “
We have substantially expanded our international footprint and operations, and we may expand further in the future, but we do not yet have substantial historical experience in international markets and may not achieve the results that we, our shareholders or analysts who cover our business expect
”
and
“
The regulatory approval process is expensive, time-consuming and uncertain and may prevent us or our partners from obtaining approvals for the commercialization of some or all of our product candidates
” in this Part I, Item 1A.
We cannot predict whether historical revenues from named patient programs for our hematology/oncology products will continue or whether we will be able to continue to distribute those products on a named patient basis.
In certain European countries, reimbursement for products that have not yet received marketing authorization may be provided through national named patient programs. Erwinase, Defitelio and Vyxeos are available on a named patient basis in many countries where they are not commercially available. Such reimbursement may cease to be available if authorization for a named patient program expires or is terminated. While we generate revenue from the distribution of these products through named patient programs, we cannot predict whether historical revenues from these programs will continue, whether we will be able to continue to distribute our products on a named patient basis in these countries, whether we will be able to commercialize our products in countries where the products have historically been available on a named patient basis, or whether commercial revenues will exceed revenues historically generated from sales on a named patient basis. Any failure to maintain revenues from sales of Erwinase and/or Defitelio on a named patient basis and/or to generate revenues from commercial sales of these products exceeding historical sales on a named patient basis could have a material adverse effect on our business, financial condition, results of operations and growth prospects.
Risks Related to Our Intellectual Property
It is difficult and costly to protect our proprietary rights, and we may not be able to ensure their protection.
Our commercial success depends in part on obtaining and maintaining patent protection of our products and product candidates and their use and the methods used to manufacture and distribute them, as well as successfully defending these patents against third party challenges, and successfully protecting our trade secrets. Our ability to protect our products and product candidates from unauthorized making, using, selling, offering to sell or importation by third parties depends on the extent to which we have rights under valid and enforceable patents or have adequately protected trade secrets that cover these activities. We cannot be certain that any of our patent applications, or those of our licensors, will result in issued patents, that the patents we own and license, or any additional patents we may own or license, will prevent other companies from developing similar or therapeutically equivalent products, or that others will not be issued patents that may prevent the sale of our products or require licensing and the payment of significant fees or royalties.
49
The patent position of pharmaceutical companies can be highly uncertain and involve complex and often changing legal, regulatory and factual questions. We own a portfolio of U.S. and non-U.S. patents and patent applications and have licensed rights to a number of issued patents and patent applications that cover or relate to our products and product candidates, including Xyrem, Defitelio, Vyxeos and solriamfetol. Changes in either the patent laws or in interpretations of patent laws in the U.S. and other countries may diminish the value of our intellectual property. Even if we are able to obtain patents covering our products and product candidates, any patent may be challenged, invalidated, held unenforceable or circumvented, potentially including by FDA approval of an ANDA or Section 505(b)(2) application that avoids infringement of our intellectual property.
Although Xyrem is covered by patents covering its formulation, distribution system and method of use, and the last U.S. patent expires in 2033, third parties are seeking to introduce generic versions of Xyrem, and additional third parties may also attempt to invalidate or design around the patents, or assert that they are invalid or otherwise unenforceable, and seek to introduce generic versions of Xyrem or other sodium oxybate products for treatment of cataplexy and/or EDS in narcolepsy. Notwithstanding our patents and the terms of settlement agreements licensing those patents as of future dates, it is possible that any non-settling company that obtains and maintains FDA approval of an ANDA for a generic version of Xyrem or an NDA for another sodium oxybate product could introduce such product before our patents expire or before the entry dates specified in our settlement agreements, including if such company obtains a final judicial determination that its product does not infringe our patents, if it is determined that our patents are invalid or unenforceable, or if such company decides, before applicable patent litigation is concluded, to launch a sodium oxybate product at risk of being held liable for damages for patent infringement. In addition, even if we prevail in such litigation at trial or on appeal, we cannot guarantee that a court will grant an injunction that prevents a defendant from marketing a product that infringes our patents. Instead the court may order a party that is found to infringe to pay damages, which could be significant. If a non-settling company launches a product in any of these scenarios, it could accelerate the launch dates for AG Products and generic sodium oxybate products under our ANDA litigation settlement agreements, depending on the circumstances. For a description of our ongoing patent proceedings in the District Court and related regulatory matters and further discussion regarding the risks associated with our ANDA settlement agreements, the potential launch of AG Products or generic versions of Xyrem, or the approval and launch of other sodium oxybate or other products that compete with Xyrem, as well as other risks and challenges we face with respect to Xyrem, see “Legal Proceedings” in Part I, Item 3 of this Annual Report on Form 10-K, “Business-Government Regulation-
The Hatch-Waxman Act
” in Part I, Item 1 of this Annual Report on Form 10-K and the risk factors under the headings “Risks Related to Xyrem and the Significant Impact of Xyrem Sales” and “
We have incurred and expect to continue to incur substantial costs as a result of litigation or other proceedings relating to patents, other intellectual property rights and related matters, and we may be unable to protect our rights to, or commercialize, our products”
in this Part I, Item 1A.
The existence of a patent will not necessarily prevent other companies from developing similar or therapeutically equivalent products or protect us from claims of third parties that our products infringe their issued patents, which may require licensing and the payment of significant fees or royalties. Competitors may successfully challenge our patents, produce similar products that do not infringe our patents, or manufacture products in countries where we have not applied for patent protection or that have a different scope of patent protection or that do not respect our patents. Accordingly, we cannot predict the breadth of claims that may be allowed or enforced in our patents, our licensed patents or in third party patents.
The degree of future protection to be afforded by our proprietary rights is uncertain because legal means afford only limited protection and may not adequately protect our rights or permit us to gain or keep our competitive advantage. For example:
|
•
|
others may independently develop similar or alternative products without infringing our intellectual property rights, such as products that are not covered by the claims of our patents, or for which we do not have adequate exclusive rights under our license agreements;
|
|
•
|
we or our licensors or partners might not have been the first to invent or file, as appropriate, subject matters covered by our issued patents or pending patent applications or the pending patent applications or issued patents of our licensors or partners;
|
|
•
|
our pending patent applications may not result in issued patents;
|
|
•
|
our issued patents and the issued patents of our licensors or partners may not provide us with any competitive advantages, or may be held invalid or unenforceable as a result of legal challenges by third parties;
|
|
•
|
our issued patents and the issued patents of our licensors or partners may be vulnerable to legal challenges as a result of changes in applicable law;
|
|
•
|
we may not develop additional proprietary products that are patentable; or
|
|
•
|
the patents of others may have an adverse effect on our business.
|
50
We also rely on trade secrets and other unpatented proprietary information to protect our products and commercial position, particularly with respect to our products with limited or no patent protection, such as Erwinaze. We seek to protect our trade secrets and other unpatented proprietary information in part through confidentiality agreements with our employees, consultants, advisors and partners. Nevertheless, our employees, consultants, advisors and partners may unintentionally or willfully disclose our proprietary information to competitors, and we may not have adequate remedies for such disclosures. In addition, if our employees, consultants, advisors or partners develop inventions or processes independently, or jointly with us, that may be applicable to our products, disputes may arise about ownership or proprietary rights to those inventions and processes. Such inventions and processes will not necessarily become our property, but may remain the property of those third parties or their employers. Enforcing a claim that a third party illegally obtained or is using any of our inventions or trade secrets is expensive and time-consuming, and the outcome is unpredictable. In addition, courts outside of the U.S. are sometimes less willing to protect trade secrets. Moreover, our competitors may independently develop equivalent knowledge, methods and know-how. Failure to obtain or maintain patent and/or trade secret protection, for any reason, could have a material adverse effect on our business.
We have patents covering many of our products in Europe and other parts of the world where patent laws operate differently than in the U.S., and provide a different scope of protection for our products than in the United States. In the EU, approval of a generic pharmaceutical product can occur independently of whether the reference brand product is covered by patents, and enforcement of such patents generally must await approval and an indication that the generic product is being offered for sale. Patent enforcement generally must be sought on a country by country basis, and issues of patent validity and infringement may be judged differently in different countries. Xyrem’s regulatory exclusivity expired in the EU, and we are aware that generic or hybrid generic applications have been submitted, and additional generic or hybrid generic applications may be submitted, to various EU regulatory authorities. We cannot predict whether we will be able to enforce our European patents or any patents we may be granted in the future, or other intellectual property against generic or hybrid generic filers in the EU.
Certain of the products we sell have no patent protection and, as a result, potential competitors face fewer barriers in introducing competing products. We rely on trade secrets and other unpatented proprietary information to protect our commercial position with respect to such products, which we may be unable to do. In some instances, we also rely on regulatory exclusivity. For example, Erwinaze has no patent protection. In addition to protection using trade secrets, Erwinaze has been granted orphan drug exclusivity by the FDA for the treatment of ALL in the U.S. for a seven-year period from its FDA approval, which precludes approval of another product with the same principal molecular structure for the same indication until November 2018. Erwinaze, as a biologic product approved under a BLA, is also subject to the U.S. Biologics Price Competition and Innovation Act, or BPCIA. We believe that Erwinaze is protected by exclusivity that prevents approval of a biosimilar in the U.S. through late 2023 under the BPCIA. However, the BPCIA may evolve over time based on FDA issuance of guidance documents, proposed regulations, and decisions in the course of considering specific applications. In addition, the BPCIA exclusivity period does not prevent another company from independently developing a product that is highly similar to Erwinaze, generating all the data necessary for a full BLA and seeking approval. BPCIA exclusivity only assures that another company cannot rely on the FDA’s prior approvals of Erwinaze to support the biosimilar product’s approval. As a result, it is possible that a potential competing drug product might obtain FDA approval before the orphan drug and expected BCPIA exclusivity periods have expired, which would adversely affect sales of Erwinaze. In the EU, the regulatory data protection and thus regulatory exclusivity period for Erwinase has lapsed. This also means that any new marketing authorizations for Erwinase in other EU member states will not receive any regulatory data protection. If a biosimilar product to Erwinaze is approved as interchangeable to Erwinaze in the U.S. or in other countries where Erwinaze is sold, a significant percentage of the prescriptions that would have been written for Erwinaze may be filled with the biosimilar version, resulting in a loss in sales of Erwinaze, and there may be a decrease in the price at which Erwinaze can be sold. Competition from a biosimilar product to Erwinaze could have a material adverse effect on our business, financial condition, results of operations and growth prospects.
Our research and development collaborators may have rights to publish data and other information to which we have rights. In addition, we sometimes engage individuals or entities to conduct research that may be relevant to our business. While the ability of these individuals or entities to publish or otherwise publicly disclose data and other information generated during the course of their research is subject to contractual limitations, these contractual provisions may be insufficient or inadequate to protect our trade secrets and may impair our patent rights. If we do not apply for patent protection prior to such publication, or if we cannot otherwise maintain the confidentiality of our innovations and other confidential information, then our ability to obtain patent protection or protect our proprietary information may be jeopardized. Moreover, a dispute may arise with our business partners over the ownership of rights to jointly developed intellectual property. Such disputes, if not successfully resolved, could lead to a loss of rights and possibly prevent us from pursuing certain new products or product candidates.
51
We have incurred and expect to continue to incur substantial costs as a result of litigation or other proceedings relating to patents, other intellectual property rights and related matters, and we may be unable to protect our rights to, or commercialize, our products.
Our ability, and that of our partners, to commercialize any approved products will depend, in part, on our ability to obtain patents, enforce those patents and operate without infringing the proprietary rights of third parties. The patent positions of pharmaceutical companies can be highly uncertain and involve complex legal and factual questions. We have filed multiple U.S. patent applications and non-U.S. counterparts, and may file additional U.S. and non-U.S. patent applications. There can be no assurance that any issued patents we own or control will provide sufficient protection to conduct our business as presently conducted or as proposed to be conducted. Moreover, for a variety of reasons, including the existence of relevant prior research performed and the existence of conflicting patent applications submitted in the same manner or similar fields, there can be no assurance that any patents will issue from the patent applications owned by us, or that we will remain free from infringement claims by third parties.
If we choose to go to court to stop a third party from infringing our patents, our licensed patents or our partners’ patents, that third party has the right to ask the court or an administrative agency to rule that these patents are invalid and/or should not be enforced. These lawsuits and administrative proceedings are expensive and consume time and other resources, and we may not be successful in these proceedings or in stopping infringement. In addition, the IPR process under the Leahy-Smith America Invents Act permits any person, whether they are accused of infringing the patent at issue or not, to challenge the validity of certain patents. As a result, entities associated with hedge funds as well as ANDA litigants have challenged valuable pharmaceutical patents through the IPR process. There is a risk that a court will decide that our patents are not valid or infringed, or that the PTAB will decide that certain patents are not valid, and that we do not have the right to stop a third party from using the patented subject matter. In addition, even if we prevail in establishing that another product infringes a valid claim of one of our patents, a court may determine that we can be compensated for the infringement in damages, and refuse to issue an injunction. As a result, we may not be entitled to stop another party from infringing our patents for their full term. For a description of our ongoing patent proceedings in the District Court and related regulatory matters and further discussion regarding the risks associated with our settlement agreements with certain of the Xyrem ANDA filers, the potential launch of the AG Products or generic versions of Xyrem, or the approval and launch of other sodium oxybate or other products that compete with Xyrem, as well as other risks and challenges we face with respect to Xyrem, see “Legal Proceedings” in Part I, Item 3 of this Annual Report on Form 10-K, “Business-Government Regulation-
The Hatch-Waxman Act
” in Part I, Item 1 of this Annual Report on Form 10-K and the risk factors under the headings “Risks Related to Xyrem and the Significant Impact of Xyrem Sales” and “
It is difficult and costly to protect our proprietary rights, and we may not be able to ensure their protection”
in this Part I, Item 1A. We cannot assure you that our pending lawsuits, other lawsuits or proceedings we may file in the future, or our defense against any lawsuits or other proceeding that have been or will be brought against us will be successful in stopping the infringement of our patents, that any such litigation or other proceedings will be cost-effective, or that any of them will have a satisfactory result for us.
Litigation involving patent matters is frequently settled between the parties, rather than continuing to a court ruling, and we have settled patent litigation with five of the Xyrem ANDA filers. The FTC has publicly stated that, in its view, certain types of agreements between branded and generic pharmaceutical companies related to the settlement of patent litigation or the manufacture, marketing and sale of generic versions of branded drugs violate the antitrust laws and has commenced investigations and brought actions against some companies that have entered into such agreements. In particular, the FTC has expressed its intention to take aggressive action to challenge settlements that include an alleged transfer of value from the brand company to the generic company (so-called “pay for delay” patent litigation settlements) and to call on legislators to pass stronger laws prohibiting such settlements. Because there is currently no precise legal standard with respect to the lawfulness of such settlements, there could be extensive litigation over whether any settlement that we have entered into or might enter into in the future constitutes a reasonable and lawful patent settlement. Parties to such settlement agreements in the U.S. are required by law to file the agreements with the FTC and the DOJ for review. Accordingly, we have submitted our Xyrem patent settlement agreements to the FTC and the DOJ for review. We may receive formal or informal requests from the FTC regarding our Xyrem patent settlements, and there is a risk that the FTC may commence a formal investigation or action against us, or a third party may initiate civil litigation regarding this settlement, which could divert the attention of management and cause us to incur significant costs, regardless of the outcome. Any claim or finding that we or our business partners have failed to comply with applicable laws and regulations could be costly to us and could have a material adverse effect on our business, financial condition, results of operations and growth prospects.
A third party may claim that we or our manufacturing or commercialization partners are using inventions covered by the third party’s patent rights, or that we or such partners are infringing, misappropriating or otherwise violating other intellectual property rights, and may go to court to stop us from engaging in our normal operations and activities, including making or selling our products. Such lawsuits are costly and could affect our results of operations and divert the attention of management and development personnel. There is a risk that a court could decide that we or our partners are infringing, misappropriating or
52
otherwise violating third party patent or other intellectual property rights, which could be very costly to us and have a material adverse effect on our business.
In the pharmaceutical and life sciences industry, like other industries, it is not always clear to industry participants, including us, which patents cover various types of products or methods. The coverage of patents is subject to interpretation by the courts, and the interpretation is not always uniform. If we are sued for patent infringement, we would need to demonstrate that our products or methods do not infringe the patent claims of the relevant patent and/or that the patent claims are invalid or unenforceable, which we may not be able to do.
Because some patent applications in the U.S. may be maintained in secrecy until the patents are issued, because patent applications in the U.S. and many non-U.S. jurisdictions are typically not published until 18 months after their priority date, and because publications in the scientific literature often lag behind actual discoveries, we cannot be certain that others have not filed patent applications for inventions covered by our or our licensors’ issued patents or pending applications, or that we or our licensors were the first inventors. Our competitors may have filed, and may in the future file, patent applications covering subject matter similar to ours. Any such patent application may have priority over our or our licensors’ patents or applications and could further require us to obtain rights to issued patents covering such subject matter. If another party has filed a U.S. patent application on inventions similar to ours, we may have to participate in an interference proceeding declared by the USPTO to determine priority of invention in the U.S. The costs of these proceedings could be substantial, and it is possible that such efforts would be unsuccessful, resulting in a loss of our U.S. patent position with respect to such inventions. Patent interferences are limited or unavailable for patent applications filed after March 16, 2013.
Some of our competitors may be able to sustain the costs of complex patent and other intellectual property litigation more effectively than we can because they have substantially greater resources. In addition, any uncertainties resulting from the initiation and continuation of any litigation could have a material adverse effect on our ability to raise the funds necessary to continue our operations.
In September 2016, Jazz Pharmaceuticals, Inc., our wholly owned subsidiary, submitted a Citizen Petition to the FDA requesting that, for safety reasons, the FDA refuse to approve any sodium oxybate ANDA with a proposed package insert or REMS that omits the portions of the Xyrem package insert and the Xyrem REMS that instruct prescribers on adjusting the dose of the product when it is co-administered with divalproex sodium (also known as valproate or valproic acid). Our Xyrem patents include three DDI patents covering these instructions on the Xyrem package insert and Xyrem REMS. Our lawsuits against each of the Xyrem ANDA filers allege infringement of multiple patents, including the DDI patents, and seek a permanent injunction to prevent these Xyrem ANDA filers from introducing a generic version of Xyrem that would infringe our patents. In January 2017, the FDA granted the Citizen Petition with respect to the Xyrem package insert. The FDA concluded that it will not approve any sodium oxybate ANDA referencing Xyrem that does not include in its package insert the portions of the currently approved Xyrem package insert related to the DDI with divalproex sodium. We cannot predict whether one or more of the non-settling ANDA filers, or a company that files a Section 505(b)(2) application for a drug referencing Xyrem, may pursue regulatory strategies to avoid infringing our method of administration patents notwithstanding the FDA’s response to the Citizen Petition, or whether any such strategy would be successful. Likewise, we cannot predict whether we will be able to maintain the validity of any of our patents or will otherwise obtain a judicial determination that a generic or other sodium oxybate product, its package insert or the generic sodium oxybate REMS or another separate REMS will infringe any of our patents or, if we prevail in proving infringement, whether a court will grant an injunction that prevents any non-settling ANDA filer or other company introducing a different sodium oxybate product from marketing its product, or instead require that party to pay damages in the form of lost profits or a reasonable royalty. For a description of these matters, see “Legal Proceedings” in Part I, Item 3 of this Annual Report on Form 10-K, “Business-Government Regulation-
The Hatch-Waxman Act
” in Part I, Item 1 of this Annual Report on Form 10-K, and the risk factors under the headings “Risks Related to Xyrem and the Significant Impact of Xyrem Sales” and
“Risks Related to Our Intellectual Property” in this Part I, Item 1A.
We also own method of use patents and trade secrets that cover elements of the Xyrem REMS, including patents that cover the use of a single central pharmacy to distribute Xyrem. In July 2016, the PTAB issued final decisions that the claims of six of seven REMS patents are unpatentable. In March 2016, the PTAB partially instituted an IPR on three claims of a seventh REMS patent, declining to review 25 of 28 claims, and in March 2017, the PTAB issued a final decision that the three claims they reviewed are unpatentable. The July 2016 and March 2017 PTAB decisions are part of a consolidated appeal currently pending before the Federal Circuit. If the Federal Circuit upholds the PTAB decisions on appeal, we will not be able to enforce claims the PTAB found unpatentable. For a description of these matters, see “Legal Proceedings” in Part I, Item 3 of this Annual Report on Form 10‑K. We cannot predict whether additional post-grant patent review challenges will be filed by any of the non-settling ANDA filers or any other entity, the outcome of any proceeding, including any appeal, or the impact any IPR or other proceeding might have on ongoing ANDA litigation proceedings or other aspects of our Xyrem business.
In the FDA’s letter approving the Xyrem REMS, the FDA stated that (i) the approval action should not be construed or understood as agreement with what the FDA stated was our position that dispensing through a single pharmacy is the only way to ensure that the benefits of Xyrem outweigh its risks, and that the FDA has continuing concerns that limiting the distribution
53
of Xyrem to one pharmacy imposes burdens on patient access and the healthcare delivery system, and (ii) as with all REMS, the FDA intends to evaluate the Xyrem REMS on an ongoing basis and will require modifications as may be appropriate. We cannot predict whether the FDA will request, seek to require or ultimately require modifications to, or impose additional requirements on, the Xyrem REMS, including in connection with the submission of applications for new oxybate indications or products, or whether FDA will permit modifications to the Xyrem REMS that we consider warranted in connection with the submission of applications for new oxybate indications or products.
Any modifications required or rejected by the FDA could make it more difficult or expensive for us to distribute Xyrem, make distribution easier for sodium oxybate competitors, impair the safety profile of Xyrem, disrupt continuity of care for Xyrem patients and/or negatively affect sales of Xyrem. In particular, depending on the nature of any such modifications or additional requirements, the ability of our existing patents and other intellectual property to protect our Xyrem distribution system from sodium oxybate competitors may be reduced. In addition, the extent of protection provided by our patents and other intellectual property related to the distribution of Xyrem depends on the nature of the distribution system that may be used by any sodium oxybate competitor. If the generic sodium oxybate REMS that has been approved by the FDA in connection with its approval of West-Ward’s ANDA or any other sodium oxybate REMS that may be approved by the FDA does not fall within the scope of any of the claims of our patents, those patents will not be a barrier to any non-settling ANDA filer’s or other unlicensed sodium oxybate product manufacturer’s entry into the market. We cannot be certain whether our existing patents, patents that may be granted in the future or other intellectual property will be construed to cover the generic sodium oxybate REMS or any other sodium oxybate REMS that may be approved by the FDA. The interpretation of intellectual property protections and the effect of these protections are extremely complex, and we cannot predict the impact of any of these matters on our business.
Risks Related to Our Industry
The regulatory approval process is expensive, time-consuming and uncertain and may prevent us or our partners from obtaining approvals for the commercialization of some or all of our product candidates.
We are not permitted to market a pharmaceutical product in the U.S. or in the EU member states until we receive approval from the FDA, the EC or the competent authorities of the EU member states, as applicable. An application for marketing approval must contain information demonstrating the quality, safety and efficacy of the pharmaceutical product, including data from preclinical and clinical trials, information pertaining to the preparation and manufacture of the API, analytical methods, product formulation, details on the manufacture and stability of the finished pharmaceutical product and proposed product packaging and labeling. Submission of an application for marketing authorization does not assure approval for marketing in any jurisdiction, and we may encounter significant difficulties or costs in our efforts to obtain approval to market products.
We submitted an MAA for Vyxeos to the EMA in the fourth quarter of 2017, and we cannot predict whether we will be able to obtain approval of our MAA for Vyxeos in Europe in a timely manner, or at all. The EMA granted accelerated assessment of our MAA, but if we are unable to respond to any EMA questions or resolve any EMA issues relating to our regulatory application in a timely manner, we or the EMA could decide to convert our accelerated assessment review for Vyxeos to a standard review timetable, which could delay the approval of our MAA. Similarly, we submitted an NDA for solriamfetol to the FDA in the fourth quarter of 2017, and we cannot predict whether we will be able to obtain approval of our NDA for solriamfetol in the U.S. in a timely manner, or at all. If the applicable regulatory authority for such applications determines that our safety or efficacy data do not warrant marketing approval, we could be required to conduct additional clinical trials, which could be costly and time-consuming and could delay the approval of our application, or we may not be able to commercialize Vyxeos in Europe and/or solriamfetol in the U.S. If we are unable to obtain regulatory approval of our product candidates, we will not be able to commercialize them and recoup our research and development costs. Any delay or failure in obtaining approval of a drug candidate, or receipt of approval for narrower indications than sought, can have a negative impact on our financial performance.
An approved drug product or drug candidate that has not yet been approved by the FDA or equivalent authorities in other countries may be subject to scheduling as a controlled substance under the U.S. Controlled Substances Act, or CSA, depending on the drug’s potential for abuse. We expect that solriamfetol will be subject to scheduling under the CSA before it can be commercially launched. Moreover, depending on its scheduling, the manufacture, importation, exportation, domestic distribution, storage, sale and legitimate use of solriamfetol may be subject to a significant degree of regulation by the DEA. For a description of the DEA scheduling process, see “Business-Government Regulation-Post-Approval Regulation” in Part I, Item 1 of this Annual Report on Form 10-K.
If the FDA, the EC or the competent authorities of the EU member states determine that a REMS or the imposition of post-marketing obligations is necessary to ensure that the benefits of the drug outweigh the risks, we may be required to include a proposed REMS as part of an NDA or BLA or to propose post-marketing obligations to be included in the marketing
54
authorization for our products in the EU. In non-EU countries, we may also be required to include a patient package insert or a medication guide to provide information to consumers about the product’s risks and benefits, a plan for communication to healthcare providers, and restrictions on the product’s distribution. For example, the FDA requires a REMS for Xyrem, discussed in detail in the risk factor under the heading “
The distribution and sale of Xyrem are subject to significant regulatory oversight and restrictions and the requirements of a risk evaluation and mitigation strategy, and these restrictions and requirements, as well as the potential impact of changes to these restrictions and requirements, subject us to increased risks and uncertainties, any of which could negatively impact sales of Xyrem
” in this Part I, Item 1A, and other products that we sell are or may become subject to a REMS specific to our product or shared with other products in the same class of drug. We cannot predict the impact that any new REMS requirements applicable to any of our products would have on our business.
The FDA approved the BLA for Erwinaze in the U.S. in November 2011, subject to certain post-marketing requirements, which have been completed, and compliance with multiple post-marketing commitments, including certain commitments that must be met by the product’s manufacturer with respect to product manufacturing, which are outside of our control. While activities are underway to complete the post-marketing commitments, any inability to comply with regulatory requirements, including compliance with manufacturing-related post-marketing commitments that are part of the BLA approval, as well as other requirements monitored by the FDA, could adversely affect Erwinaze supply, particularly in light of our extremely limited product inventory, and could result in FDA approval being revoked, product release being delayed resulting in product shortage or product recalls, any of which could have a material adverse effect on our sales of and revenues from Erwinaze and limit our future maintenance and potential growth of the market for this product. See also the discussion under the heading “
The loss of our single source suppliers, delays or problems in the supply of our products for commercial sale or our product candidates for use in our clinical trials, or our or our suppliers’ failure to comply with manufacturing regulations, could materially and adversely affect our business, financial condition, results of operations and growth prospects.
” in this Part I, Item 1A.
As another example, the marketing authorization in the EU for Defitelio requires us to comply with a number of post-marketing obligations, including obligations relating to the establishment of a patient registry to investigate the long-term safety, health outcomes and patterns of utilization of Defitelio during normal use. In January 2017, we enrolled the first patient in the Defitelio post-authorization study in the EU to provide further data on long-term safety, health outcomes and patterns of utilization of Defitelio in normal use. The FDA imposed several post-marketing commitments and requirements in connection with its approval of our NDA for Defitelio in March 2016, including the requirement that we conduct a clinical trial, or the Defitelio post-marketing trial, to analyze the safety of defibrotide versus best supportive care in the prevention of VOD in adult and pediatric patients. If we fail to complete any of these post-marketing obligations, including our failure to satisfactorily complete the Defitelio post-authorization study, the ongoing validity of the marketing authorization may be called into question, our sales of and revenues from Defitelio could be materially adversely affected and our future maintenance and potential growth of the market for this product may be limited.
A significant proportion of the regulatory framework in the UK is derived from EU laws. For that reason, the results of the formal procedure of withdrawal from the EU, initiated by the UK in March 2017, could materially change the regulatory regime applicable to our operations, including with respect to the approval of our product candidates, as there is significant uncertainty concerning the future relationship between the UK and the EU. This includes the laws and regulations that will apply as the UK determines which EU laws to replace or replicate in the event of a withdrawal. From a regulatory perspective, the UK’s withdrawal could result in significant complexity and risks. A basic requirement related to the grant of a marketing authorization for a medicinal product in the EU is the requirement that the applicant is established in the EU. Following withdrawal of the UK from the EU, marketing authorizations previously granted to applicants established in the UK through the centralized, mutual recognition or decentralized procedures may no longer be valid. Moreover, depending upon the exact terms of the UK's withdrawal, there is an arguable risk that the scope of a marketing authorization for a medicinal product granted by the EC pursuant to the centralized procedure would not, in the future, include the UK. In these circumstances, an authorization granted by the UK’s competent authorities would be required to place medicinal products on the UK market.
In addition, the laws and regulations that will apply after the UK withdraws from the EU may have implications for manufacturing sites that hold certification issued by the UK competent authorities. Our capability to rely on these manufacturing sites for products intended for the EU market would also depend upon the exact terms of the UK's withdrawal.
Any such changes to the regulatory regime could have a material adverse effect on the pharmaceutical industry generally and on our ability to obtain approval for our product candidates or, if approved, to successfully commercialize our product candidates. For a further discussion, see the risks under the heading “
The results of the UK’s referendum on withdrawal from the EU may have a negative effect on global economic conditions, financial markets and our business
” in this Part I, Item 1A.
55
Changes in healthcare law and implementing regulations, including those based on recently enacted legislation, as well as changes in healthcare policy, may impact our business in ways that we cannot currently predict, and these changes could have a material adverse effect on our business and financial condition.
The Patient Protection and Affordable Care Act, as amended by the Healthcare and Education Reconciliation Act of 2010, together, the Healthcare Reform Act, is a sweeping measure intended to expand healthcare coverage within the U.S., primarily through the imposition of health insurance mandates on employers and individuals, the provision of subsidies to eligible individuals enrolled in plans offered on the health insurance exchanges, and the expansion of the Medicaid program. This law has substantially changed the way healthcare is financed by both governmental and private insurers, and significantly impacts the pharmaceutical industry. Changes that may affect our business include those governing enrollment in federal healthcare programs, reimbursement changes, benefits for patients within a coverage gap in the Medicare Part D prescription drug program (commonly known as the “donut hole”), rules regarding prescription drug benefits under the health insurance exchanges, changes to the Medicaid Drug Rebate program, expansion of the Public Health Service’s 340B drug pricing program, or the 340B program, fraud and abuse and enforcement. These changes have impacted previously existing government healthcare programs and have resulted in the development of new programs, including Medicare payment for performance initiatives and improvements to the physician quality reporting system and feedback program.
Details of the changes to the Medicaid Drug Rebate program and the 340B program are discussed in the risk factor under the heading “
If we fail to comply with our reporting and payment obligations under the Medicaid Drug Rebate program or other governmental pricing programs, we could be subject to additional reimbursement requirements, penalties, sanctions and fines, which could have a material adverse effect on our business, financial condition, results of operations and growth prospects
” in this Part I, Item 1A. Congress could enact additional legislation that further increases Medicaid drug rebates or other costs and charges associated with participating in the Medicaid Drug Rebate program. The issuance of regulations and coverage expansion by various governmental agencies relating to the Medicaid Drug Rebate program has increased and will continue to increase our costs and the complexity of compliance, has been and will be time-consuming, and could have a material adverse effect on our results of operations.
Some states have elected not to expand their Medicaid programs by raising the income limit to 133% of the federal poverty level, as is permitted under the Healthcare Reform Act. For each state that does not choose to expand its Medicaid program, there may be fewer insured patients overall, which could impact our sales, business and financial condition. Where Medicaid patients receive insurance coverage under any of the new options made available through the Healthcare Reform Act, the possibility exists that manufacturers may be required to pay Medicaid rebates on drugs used under these circumstances, a decision that could impact manufacturer revenues. In addition, there have been delays in the implementation of key provisions of the Healthcare Reform Act, including the excise tax on generous employer-based health plans. The implications of these delays for our sales, business and financial condition, if any, are not yet clear.
Moreover, additional legislative changes to or regulatory changes under the Healthcare Reform Act remain possible and appear likely in the 115th U.S. Congress and under the Trump Administration. In this regard, the U.S. Tax Cuts and Jobs Act of 2017, or U.S. Tax Act, signed into law in December 2017, includes a provision repealing, effective January 1, 2019, the tax-based shared responsibility payment imposed by the Healthcare Reform Act on certain individuals who fail to maintain qualifying health coverage for all or part of a year that is commonly referred to as the “individual mandate.” The nature and extent of any additional legislative or regulatory changes to the Healthcare Reform Act are uncertain at this time. We expect that the Healthcare Reform Act, as currently enacted or as it may be amended in the future, and other healthcare reform measures that may be adopted in the future could have a material adverse effect on our industry generally and on our ability to maintain or increase sales of our existing products or to successfully commercialize our product candidates, if approved. In addition to the Healthcare Reform Act, there will continue to be proposals by legislators at both the federal and state levels, regulators and third party payors to keep healthcare costs down while expanding individual healthcare benefits.
Likewise, in the countries in the EU, legislators, policymakers and healthcare insurance funds continue to propose and implement cost-containing measures to keep healthcare costs down, due in part to the attention being paid to healthcare cost containment in the EU. Certain of these changes could impose limitations on the prices we will be able to charge for our products and any approved product candidates or the amounts of reimbursement available for these products from governmental agencies or third party payors, may increase the tax obligations on pharmaceutical companies such as ours, or may facilitate the introduction of generic competition with respect to our products. Further, an increasing number of EU member states and other foreign countries use prices for medicinal products established in other countries as “reference prices” to help determine the price of the product in their own territory. Consequently, a downward trend in prices of medicinal products in some countries could contribute to similar downward trends elsewhere. In addition, the ongoing budgetary difficulties faced by a number of EU member states, including Greece and Spain, have led and may continue to lead to substantial delays in payment and payment partially with government bonds rather than cash for medicinal drug products, which could negatively impact our revenues and profitability. Moreover, in order to obtain reimbursement for our products in some countries, including some EU member states, we may be required to conduct clinical trials that compare the cost-
56
effectiveness of our products to other available therapies. There can be no assurance that our products will obtain favorable reimbursement status in any country.
In the U.S., to help patients afford our products, we have various programs to assist them, including patient assistance programs, a Xyrem free product voucher program and co-pay coupon programs for Xyrem and certain other products. Additionally, we make grants to independent charitable foundations that help financially needy patients with their premium, co-pay, and co-insurance obligations. Co-pay coupon programs, including our program for Xyrem, have received some negative publicity related to allegations regarding their use to promote branded pharmaceutical products over other less costly alternatives. In recent years, pharmaceutical manufacturers were named in class action lawsuits challenging the legality of their co-pay programs under a variety of federal and state laws. In addition, at least one insurer has directed its network pharmacies to no longer accept co-pay coupons for certain specialty drugs the insurer identified. Our co-pay coupon programs could become the target of similar lawsuits or insurer actions. In addition, in November 2013, the Centers for Medicare and Medicaid Services, or CMS, issued guidance to the issuers of qualified health plans sold through the Healthcare Reform Act’s marketplaces encouraging such plans to reject patient cost-sharing support from third parties and indicating that CMS intends to monitor the provision of such support and may take regulatory action to limit it in the future. CMS subsequently issued a rule requiring individual market qualified health plans to accept third-party premium and cost-sharing payments from certain government-related entities. In September 2014, the Office of Inspector General, or OIG, of the U.S. Department of Health and Human Services, or HHS, issued a Special Advisory Bulletin warning manufacturers that they may be subject to sanctions under the federal anti-kickback statute and/or civil monetary penalty laws if they do not take appropriate steps to exclude Medicare Part D beneficiaries from using co-pay coupons. It is possible that changes in insurer policies regarding co-pay coupons and/or the introduction and enactment of new legislation or regulatory action could restrict or otherwise negatively affect these patient support programs, which could result in fewer patients using affected products, including Xyrem, and therefore could have a material adverse effect on our sales, business and financial condition.
Patient assistance programs that receive financial support from companies have become the subject of enhanced government and regulatory scrutiny. The OIG has established guidelines that permit pharmaceutical manufacturers to make donations to charitable organizations who provide co-pay assistance to Medicare patients, provided that such organizations, among other things, are
bona fide
charities, are entirely independent of and not controlled by the manufacturer, provide aid to applicants on a first-come basis according to consistent financial criteria, and do not link aid to use of a donor’s product. If we or our vendors or donation recipients are deemed to fail to comply with relevant laws, regulations or evolving government guidance in the operation of these programs, we could be subject to damages, fines, penalties or other criminal, civil or administrative sanctions or enforcement actions. We cannot ensure that our compliance controls, policies and procedures will be sufficient to protect against acts of our employees, business partners or vendors that may violate the laws or regulations of the jurisdictions in which we operate. In May and October 2016 and February 2017, we received subpoenas from the U.S. Attorney’s Office for the District of Massachusetts requesting documents related to our support of 501(c)(3) organizations that provide financial assistance to Medicare patients and documents concerning the provision of financial assistance to Medicare patients taking drugs sold by us. Regardless of whether we have complied with the law, a government investigation could impact our business practices, harm our reputation, divert the attention of management, increase our expenses and reduce the availability of foundation support for our patients who need assistance. For more information, see the risk factor under the heading “
We are subject to significant ongoing regulatory obligations and oversight, which may result in significant additional expense and limit our ability to commercialize our products
” in this Part I, Item 1A.
We are subject to significant ongoing regulatory obligations and oversight, which may result in significant additional expense and limit our ability to commercialize our products.
FDA and Equivalent Non-U.S. Regulatory Authorities
We are subject to significant ongoing regulatory obligations with respect to our marketed products, such as safety reporting requirements and additional post-marketing obligations, including regulatory oversight of the promotion and marketing of our products. In addition, research, testing, manufacturing, labeling, packaging, adverse event reporting, storage, advertising, promotion, sale, distribution, record keeping, importing and exporting of our products are, and any of our product candidates that may be approved by the FDA, the EC, the competent authorities of the EU member states and other non-U.S. regulatory authorities will be, subject to extensive and ongoing regulatory requirements. These requirements apply both to us and to third parties we contract with to perform services and supply us with products. Failure by us or any of our third party partners, including suppliers, distributors and our central pharmacy for Xyrem, to comply with applicable requirements could subject us to administrative or judicial sanctions or other negative consequences, such as delays in approval or refusal to approve a product candidate, withdrawal, suspension or variation of product approval, untitled letters, warning letters, fines and other monetary penalties, unanticipated expenditures, product recall, withdrawal or seizure, total or partial suspension of production or distribution, interruption of manufacturing or clinical trials, operating restrictions, injunctions; suspension of licenses, civil penalties and/or criminal prosecution, any of which could have a significant impact on our sales, business and financial condition.
57
We monitor adverse events resulting from the use of our commercial products, as do the regulatory authorities, and we file periodic reports with the authorities concerning adverse events. The authorities review these events and reports, and if they determine that any events and/or reports indicate a trend or signal, they can require a change in a product label, restrict sales and marketing and/or require or conduct other actions, potentially including withdrawal or suspension of the product from the market, any of which could result in reduced market acceptance and demand for our products, could harm our reputation and our ability to market our products in the future, and could have a material adverse effect on our business, financial condition, results of operations and growth prospects.
The FDA and the competent authorities of the EU member states on behalf of the EMA also periodically inspect our records related to safety reporting. Following such inspections, the FDA may issue notices on FDA Form 483 and warning letters that could cause us to modify certain activities. The EMA’s Pharmacovigilance Risk Assessment Committee, or the PRAC, may propose to the Committee for Human Medicinal Products that the marketing authorization holder be required to take specific steps or advise that the existing marketing authorization be varied, suspended, or withdrawn. An FDA Form 483 notice, if issued at the conclusion of an FDA inspection, can list conditions the FDA investigators believe may have violated relevant FDA regulations or guidance. Failure to adequately and promptly correct the observation(s) can result in further regulatory enforcement action. The failure to adequately address any matters identified by the FDA or other regulatory agencies in the future could have a material adverse effect on our business, financial condition, results of operations and growth prospects.
If we receive regulatory approvals to sell our products, the FDA, the EC, the competent authorities of the EU member states and other non-U.S. regulatory authorities where our products are approved may impose significant restrictions on the indicated uses or marketing of our products, or impose requirements for burdensome post-approval clinical studies or trials. The terms of any product approval, including labeling, may be more restrictive than we desire and could affect the commercial potential of the product. If we become aware of problems with any of our products in the U.S., the EU or elsewhere in the world or at our third party suppliers’ facilities, a regulatory agency may impose restrictions on our products, our suppliers, our other partners or us. In such an instance, we could experience a significant drop in the sales of the affected products, our product revenues and reputation in the marketplace may suffer, and we could become the target of lawsuits.
EU legislation related to pharmacovigilance, or the assessment and monitoring of the safety of medicinal products, provides that the EMA and the competent authorities of the EU member states have the authority to require companies to conduct additional post-authorization efficacy studies and post-authorization safety studies. The legislation also governs the obligations of marketing authorization holders with respect to additional monitoring, adverse event management and reporting. Under the legislation and its related regulations and guidelines, we may be required to conduct a labor intensive collection of data regarding the risks and benefits of marketed products and may be required to engage in ongoing assessments of those risks and benefits, including the possible requirement to conduct additional clinical studies, which may be time-consuming and expensive and could impact our profitability. Non-compliance with such obligations can lead to the variation, suspension or withdrawal of marketing authorization or imposition of financial penalties or other enforcement measures.
The FDA approved the BLA for Erwinaze in the U.S. in November 2011, subject to certain post-marketing requirements, which have been completed, and compliance with multiple post-marketing commitments, including certain commitments that must be met by the product’s manufacturer with respect to product manufacturing, which are outside of our control. While activities are underway to complete the post-marketing commitments, any inability to comply with regulatory requirements, including compliance with manufacturing-related post-marketing commitments that are part of the BLA approval, as well as other requirements monitored by the FDA, could adversely affect Erwinaze supply and could result in FDA approval being revoked or product recalls, all of which could have a material adverse effect on our sales of and revenues from Erwinaze and limit our future maintenance and potential growth of the market for this product.
The marketing authorization in the EU for Defitelio requires us to comply with a number of post-marketing obligations, including obligations relating to the establishment of a patient registry to investigate the long-term safety, health outcomes and patterns of utilization of Defitelio during normal use. In January 2017, we enrolled the first patient in the Defitelio post-authorization study in the EU to provide further data on long-term safety, health outcomes and patterns of utilization of Defitelio in normal use. The FDA imposed several post-marketing requirements and commitments in connection with its March 2016 approval of our NDA for Defitelio, including the requirement that we conduct the Defitelio post-marketing trial to analyze the safety of defibrotide versus best supportive care in the prevention of VOD in adult and pediatric patients. Additionally, the FDA imposed two post-marketing requirements in connection with its approval of our NDA for Vyxeos in August 2017, including the requirement that we conduct a safety study to characterize infusion-related reactions in patients treated with Vyxeos and a clinical trial to determine dosing to minimize toxicity in patients with moderate and severe renal impairment. If we fail to complete any of these post-marketing obligations for Defitelio or Vyxeos, including our failure to satisfactorily complete post-marketing studies and trials, the ongoing validity of the marketing authorizations may be called into question, our sales of and revenues from Defitelio and Vyxeos could be materially adversely affected and our future maintenance and potential growth of the markets for these products may be limited.
58
Erwinase and defibrotide are available on a named patient basis in many countries where they are not commercially available. If any such country’s regulatory authorities determine that we are promoting Erwinase or defibrotide without proper authorization, we could be found to be in violation of pharmaceutical advertising laws or the regulations permitting sales under named patient programs. In that case, we may be subject to financial or other penalties.
The FDA, the competent authorities of the EU member states and other governmental authorities require advertising and promotional labeling to be truthful and not misleading, and products to be marketed only for their approved indications and in accordance with the provisions of the approved label. The FDA routinely provides its interpretations of that authority in informal communications and also in more formal communications such as untitled letters or warning letters, and although such communications may not be considered final agency decisions, companies may decide not to contest the agency’s interpretations so as to avoid disputes with the FDA, even if they believe the claims to be truthful, not misleading and otherwise lawful. In recent years, certain courts have determined that the First Amendment of the U.S. Constitution permits communications regarding off-label uses of drug products, as long as such communications are truthful and not misleading. At the beginning of 2017, the FDA released proposed rule changes and draft guidance on the FDA’s interpretation on the limitations of such speech. These cases and regulatory actions create additional uncertainty regarding the limits of permissible communication regarding our products.
The FDA, the competent authorities of the EU member states and other governmental authorities also actively investigate allegations of off-label promotion activities in order to enforce regulations prohibiting these types of activities. A company that is found to have promoted an approved product for off-label uses may be subject to significant liability, including civil and administrative financial penalties and other remedies as well as criminal financial penalties and other sanctions. Even when a company is not determined to have engaged in off-label promotion, the allegation from government authorities or market participants that a company has engaged in such activities could have a significant impact on the company’s sales, business and financial condition. The U.S. government has also required companies to enter into complex corporate integrity agreements and/or non-prosecution agreements that impose significant reporting and other burdens on the affected companies. For all of our products, it is important that we maintain a comprehensive compliance program. Failure to maintain a comprehensive and effective compliance program, and to integrate the operations of acquired businesses into a combined comprehensive and effective compliance program on a timely basis, could subject us to a range of regulatory actions that could affect our ability to commercialize our products and could harm or prevent sales of the affected products, or could substantially increase the costs and expenses of commercializing and marketing our products.
Other U.S. Regulatory Authorities
We are also subject to regulation by other regional, national, state and local agencies, including the DEA, the DOJ, the FTC, the United States Department of Commerce, or DOC, the OIG and other regulatory bodies, as well as governmental authorities in those non-U.S. countries in which we commercialize our products. In addition to the FDCA, other federal, state and non-U.S. statutes and regulations govern to varying degrees the research, development, manufacturing and commercial activities relating to prescription pharmaceutical products, including preclinical testing, approval, production, labeling, sale, distribution, import, export, post-market surveillance, advertising, dissemination of information, promotion, marketing, and pricing to government purchasers and government healthcare programs. Our partners, including our suppliers and distributors and the central pharmacy for Xyrem, a controlled substance under the CSA, are also subject to DEA and state regulations relating to manufacturing, storage, distribution and physician prescription procedures, including limitations on prescription refills and are required to maintain necessary DEA registrations and state licenses. The DEA periodically inspects facilities for compliance with its rules and regulations. Failure to comply with current and future regulations of the DEA, relevant state authorities or any comparable international requirements could lead to a variety of sanctions, including revocation or denial of renewal of DEA registrations, fines, injunctions, or civil or criminal penalties, could result in, among other things, additional operating costs to us or delays in shipments outside or into the U.S. and could have an adverse effect on our business and financial condition.
In addition, a drug product approved by the FDA may be subject to scheduling as a controlled substance under the CSA, depending on the drug’s potential for abuse. Controlled substances that are pharmaceutical products are subject to a high degree of regulation under the CSA, which establishes, among other things, certain registration, manufacturing quotas, security, recordkeeping, reporting, import, export and other requirements administered by the DEA. The DEA classifies controlled substances into five schedules: Schedule I, II, III, IV or V. Schedule I substances by definition have a high potential for abuse, have no currently “accepted medical use” in the U.S., lack accepted safety for use under medical supervision, and may not be prescribed, marketed or sold in the U.S. Pharmaceutical products approved for use in the U.S. may be listed as Schedule II, III, IV or V, with Schedule II substances considered to present the highest potential for abuse or dependence and Schedule V substances the lowest relative risk of abuse among such substances. The DEA limits the quantity of certain Schedule I controlled substances that may be produced or procured in the U.S. in any given calendar year through a quota system. Accordingly, we require DEA quotas for Siegfried in the U.S. to manufacture sodium oxybate, a Schedule I controlled substance, and for Patheon, our U.S.-based Xyrem supplier, to procure the sodium oxybate from Siegfried in order to
59
manufacture and supply us with Xyrem. Because the DEA typically grants quotas on an annual basis, Siegfried and Patheon are required to request and justify allocation of sufficient annual DEA quotas as well as additional DEA quotas if our commercial or clinical requirements exceed the allocated quotas throughout the year. For the last few years, our suppliers were allocated only a portion of the published annual aggregate quota for the API. If one or more ANDA filers were to begin manufacturing a generic sodium oxybate product, generic manufacturers would need to obtain a portion of the annual aggregate API quota, which could decrease the DEA quota allocation obtained on our behalf by Siegfried and Patheon. In the past, we have also had to engage in lengthy efforts to obtain the needed quotas after the original annual quotas had first been allocated. For 2017, both Siegfried and Patheon have been allocated most, but not all, of their respective requested quotas. If, in the future, our suppliers cannot obtain the quotas that are needed on a timely basis, or at all, our business, financial condition, results of operations and growth prospects could be materially and adversely affected. We also expect that solriamfetol will be subject to scheduling by the DEA, which will need to be completed after NDA approval, and depending on the DEA’s scheduling classification, we may be required to obtain a DEA quota for Siegfried to manufacture an approved solriamfetol product. If we are unable to obtain the quotas that are needed for an approved solriamfetol product on a timely basis, or at all, our business, financial condition, results of operations and growth prospects could be materially and adversely affected.
The U.S. federal healthcare program anti-kickback statute prohibits, among other things, knowingly and willfully offering, paying, soliciting, or receiving remuneration to induce or in return for purchasing, leasing, ordering or arranging for or recommending the purchase, lease or order of any healthcare item or service reimbursable under Medicare, Medicaid or other federally financed healthcare programs. Liability may be established without a person or entity having actual knowledge of the federal Anti-Kickback Statute or specific intent to violate it. This statute has been interpreted to apply to arrangements between pharmaceutical companies on one hand and Medicare patients, prescribers, purchasers and formulary managers on the other. In addition, the government may assert that a claim including items or services resulting from a violation of the federal anti-kickback statute constitutes a false or fraudulent claim for purposes of the federal civil False Claims Act. Although there are a number of statutory exemptions and regulatory safe harbors protecting certain common manufacturer business arrangements and activities from prosecution and administrative sanction, the exemptions and safe harbors are drawn narrowly, and practices or arrangements that involve remuneration may be subject to scrutiny if they do not qualify for an exemption or safe harbor. Our practices may not in all cases meet all of the criteria for safe harbor protection, and therefore would be subject to a facts and circumstances analysis to determine potential anti-kickback statute liability.
The False Claims Act prohibits, among other things, any person from knowingly presenting, or causing to be presented, a false or fraudulent claim for payment of federal funds, or knowingly making, or causing to be made, a false statement to get a false claim paid. The False Claims Act also permits a private individual acting as a “whistleblower” to bring actions on behalf of the federal government alleging violations of the statute and to share in any monetary recovery. Many pharmaceutical and other healthcare companies have been investigated or subject to lawsuits by whistleblowers and have reached substantial financial settlements with the federal government under the False Claims Act for a variety of alleged improper marketing activities, including providing free product to customers with the expectation that the customers would bill federal programs for the product; providing consulting fees, grants, free travel, and other benefits to physicians to induce them to prescribe the company’s products; and inflating prices reported to private price publication services, which are used to set drug reimbursement rates under government healthcare programs. In addition, the government and private whistleblowers have pursued False Claims Act cases against pharmaceutical companies for causing false claims to be submitted as a result of the marketing of their products for unapproved uses. Pharmaceutical and other healthcare companies also are subject to other federal false claim laws, including federal criminal healthcare fraud and false statement statutes that extend to non-government health benefit programs.
In addition, the Physician Payment Sunshine Act, or Sunshine provisions, requires us to track and report to the federal government payments and transfers of value that we make to physicians and teaching hospitals and ownership interests held by physicians and their family, and provides for public disclosures of these data. Public reporting under the Sunshine provisions has resulted in increased scrutiny of the financial relationships between industry, teaching hospitals and physicians, and such scrutiny may negatively impact our ability to engage with physicians on matters of importance to us. In addition, if the data reflected in our reports are found to be in violation of any of the Sunshine provisions or any other U.S. federal, state or local laws or regulations that may apply, or if we otherwise fail to comply with the Sunshine provisions, we may be subject to significant civil, criminal and administrative penalties, damages or fines.
The majority of states also have statutes or regulations similar to the federal anti-kickback law and false claims laws, which apply to items and services reimbursed under Medicaid and other state programs, or, in several states, apply regardless of the payor. A number of states require pharmaceutical companies to report expenses relating to the marketing and promotion of pharmaceutical products and to report gifts and payments to individual physicians in the states. Other states restrict when pharmaceutical companies may provide meals or gifts to prescribers or engage in other marketing-related activities. Other states and cities require identification or licensing of sales representatives. Still other states require the posting of information relating to clinical studies and their outcomes. In addition, California, Connecticut, Massachusetts and Nevada require
60
pharmaceutical companies to implement compliance programs or marketing codes of conduct. Outside the U.S., we are subject to similar regulations in those countries where we market and sell products.
In May 2016, we received a subpoena from the U.S. Attorney’s Office for the District of Massachusetts requesting documents related to our support of 501(c)(3) organizations that provide financial assistance to Medicare patients, and, for Xyrem, documents concerning the provision of financial assistance to Medicare patients. In October 2016, we received a second subpoena updating and further specifying document requests regarding support to 501(c)(3) organizations that provide financial assistance to Medicare patients and the provision of financial assistance for Medicare patients taking drugs sold by us. In February 2017, we received a third subpoena requesting documents regarding our support to a specific 501(c)(3) organization that established a fund for narcolepsy patients in January 2017. Other companies have disclosed similar subpoenas and continuing inquiries.
The Office of the Inspector General has established guidelines that permit pharmaceutical manufacturers to make donations to charitable organizations who provide co-pay assistance to Medicare patients, provided that such organizations, among other things, are bona fide charities, are entirely independent of and not controlled by the manufacturer, provide aid to applicants on a first-come basis according to consistent financial criteria, and do not link aid to use of a donor’s product. If we or our vendors or donation recipients are deemed to fail to comply with relevant laws, regulations or evolving government guidance in the operation of these programs, such facts could be used as the basis for an enforcement action by the federal government. We are cooperating with the government’s investigation of our support of charitable organizations, and the outcome of this investigation could include an enforcement action or a settlement with the federal government. If the federal government were to file an enforcement action against us as a result of the investigation and could establish the elements of a violation of relevant laws, we could be subject to damages, fines and penalties, which could be substantial, along with other criminal, civil or administrative sanctions. Any settlement with the federal government could result in substantial payments and entry into a corporate integrity agreement, which would impose costs and burdens on the operation of our business. We are unable to predict how long this investigation will continue, whether we will receive additional subpoenas in connection with this investigation, or its outcome, but we expect that we will continue to incur significant costs in connection with the investigation, regardless of the outcome. We may also become subject to similar investigations by other state or federal governmental agencies or offices. Any additional investigations of our patient assistance programs or other business practices may result in damages, fines, penalties or other criminal, civil or administrative sanctions or enforcement actions against us or 501(c)(3) organizations that we support (including organizations that provide assistance to narcolepsy and chronic pain patients). Such investigations may also result in negative publicity or other negative actions as to us or 501(c)(3) organizations that we support that could harm our reputation, impact our business practices, reduce demand for, or patient access to, Xyrem and Prialt and/or reduce coverage of Xyrem and Prialt, including by federal health care programs and state health care programs. If any or all of these events occur, our business, financial condition, results of operations and stock price could be materially and adversely affected. For more information, see the risk factor under the heading “
Changes in healthcare law and implementing regulations, including those based on recently enacted legislation, as well as changes in healthcare policy, may impact our business in ways that we cannot currently predict, and these changes could have a material adverse effect on our business and financial condition
” in this Part I, Item 1A.
Other Regulatory Authorities
In the EU, the advertising and promotion of our products are subject to EU member states’ laws governing promotion of medicinal products, interactions with physicians, misleading and comparative advertising and unfair commercial practices. In addition, other legislation adopted by individual EU member states may apply to the advertising and promotion of medicinal products. These laws require that promotional materials and advertising in relation to medicinal products comply with the product’s Summary of Product Characteristics, or SmPC, as approved by the competent authorities. The SmPC is the document that provides information to physicians concerning the safe and effective use of the medicinal product. It forms an intrinsic and integral part of the marketing authorization granted for the medicinal product. Promotion of a medicinal product that does not comply with the SmPC is considered to constitute off-label promotion. The off-label promotion of medicinal products is prohibited in the EU. The applicable laws at EU level and in the individual EU member states also prohibit the direct-to-consumer advertising of prescription-only medicinal products. Violations of the rules governing the promotion of medicinal products in the EU could be penalized by administrative measures, fines and imprisonment. These laws may further limit or restrict the advertising and promotion of our products to the general public and may also impose limitations on our promotional activities with health care professionals.
Interactions between pharmaceutical companies and physicians are also governed by strict laws, regulations, industry self-regulation codes of conduct and physicians’ codes of professional conduct in the individual EU member states. The provision of benefits or advantages to physicians to induce or encourage the prescription, recommendation, endorsement, purchase, supply, order or use of medicinal products is prohibited in the EU. The provision of benefits or advantages to physicians is also governed by the national anti-bribery laws of the EU member states. One example is the UK Bribery Act. As further discussed below, the UK Bribery Act applies to any company incorporated in or “carrying on business” in the UK,
61
irrespective of where in the world the alleged bribery activity occurs, which could have implications for our interactions with physicians both in and outside of the UK Violation of these laws could result in substantial fines and imprisonment. Certain EU member states, such as France and Belgium, require that payments made to physicians be publicly disclosed. Moreover, agreements with physicians must often be the subject of prior notification and approval by the physician’s employer, his/her competent professional organization, and/or the competent authorities of the individual EU member states. Failure to comply with these requirements could result in reputational risk, public reprimands, administrative penalties, fines or imprisonment.
Our business activities outside of the U.S. are subject to the U.S. Foreign Corrupt Practices Act, or FCPA, and similar anti-bribery or anti-corruption laws, regulations or rules of other countries in which we operate, including the UK Bribery Act. The FCPA and similar anti-corruption laws generally prohibit the offering, promising, giving, or authorizing others to give anything of value, either directly or indirectly, to non-U.S. government officials in order to improperly influence any act or decision, secure any other improper advantage, or obtain or retain business. The FCPA also requires public companies to make and keep books and records that accurately and fairly reflect the transactions of the company and to devise and maintain an adequate system of internal accounting controls. The UK Bribery Act prohibits giving, offering, or promising bribes to any person, including both UK and non-UK government officials and private persons, as well as requesting, agreeing to receive, or accepting bribes from any person. In addition, under the UK Bribery Act, companies which carry on a business or part of a business in the UK may be held liable for bribes given, offered or promised to any person, including non-UK government officials and private persons, in another country by employees and persons associated with the company in order to obtain or retain business or a business advantage for the company. Liability is strict, with no element of a corrupt state of mind, but having in place adequate procedures designed to prevent bribery is an available defense. Furthermore, under the UK Bribery Act there is no exception for facilitation payments. As described above, our business is heavily regulated and therefore involves significant interaction with public officials, including officials of non-U.S. governments. Additionally, in many other countries, the health care providers who prescribe pharmaceuticals are employed by their government, and the purchasers of pharmaceuticals are government entities; therefore, our dealings with these prescribers and purchasers may be subject to regulation under the FCPA. Recently the U.S. Securities and Exchange Commission, or SEC, and the DOJ have increased their FCPA enforcement activities with respect to pharmaceutical companies. In addition, under the Dodd-Frank Wall Street Reform and Consumer Protection Act, private individuals who report to the SEC original information that leads to successful enforcement actions may be eligible for a monetary award. There is no certainty that all employees and third party business partners (including our distributors, wholesalers, agents, contractors, and other partners) will comply with anti-bribery laws. In particular, we do not control the actions of suppliers and other third party agents, although we may be liable for their actions. Violation of these laws may result in civil or criminal sanctions, which could include monetary fines, criminal penalties, and disgorgement of past profits, which could have a material adverse impact on our business and financial condition.
We are also subject to laws and regulations governing data privacy and the protection of health-related and other personal information. These laws include security breach notification requirements and protection of consumer health information. The legislative and regulatory landscape for privacy and data security continues to evolve, and there has been an increasing focus on privacy and data security issues which may affect our business. Numerous federal and state laws and regulations, including state security breach notification laws, state health information privacy laws, and federal and state consumer protection laws, govern the collection, use, disclosure, and protection of personal information. Although there are legal mechanisms to facilitate the transfer of personal data from the European Economic Area, or EEA, and Switzerland to the U.S., the decision of the European Court of Justice that invalidated the safe harbor framework on which we previously relied has increased uncertainty around compliance with EU privacy law requirements. As a result of the decision, it was no longer possible to rely on safe harbor certification as a legal basis for the transfer of personal data from the EU to entities in the U.S. In February 2016, the EC announced an agreement with the DOC to replace the invalidated safe harbor framework with a new EU-U.S. “Privacy Shield.” On July 12, 2016, the EC adopted a decision on the adequacy of the protection provided by the Privacy Shield. The Privacy Shield is intended to address the requirements set out by the European Court of Justice in its recent ruling by imposing more stringent obligations on companies, providing stronger monitoring and enforcement by the DOC and FTC and making commitments on the part of public authorities regarding access to information.
U.S.-based companies may certify compliance with the privacy principles of the Privacy Shield. Certification to the Privacy Shield, however, is not mandatory. If a U.S.-based company does not certify compliance with the Privacy Shield, it may rely on other authorized mechanisms to transfer personal data. In September 2016, we filed for certification for our U.S.-based subsidiaries under the Privacy Shield. This certification was approved in January 2017.
The privacy and data security landscape is still in flux. In October 2016, an action for annulment of the EC decision on the adequacy of Privacy Shield was brought before the European Court of Justice by three French digital rights advocacy groups, La Quadrature du Net, French Data Network and the Fédération FDN. This case, Case T-738/16, is currently pending before the European Court of Justice. Should the European Court of Justice invalidate the Privacy Shield, it will no longer be possible to transfer data from the EU to entities in the U.S. under a Privacy Shield certification, in which case other legal mechanisms would need to be put in place.
62
Healthcare providers who prescribe our products and research institutions that we collaborate with are subject to privacy and security requirements under the Health Insurance Portability and Accountability Act of 1996, as amended by the Health Information Technology for Economic and Clinical Health Act, or HIPAA. Although we are not directly subject to HIPAA other than with respect to providing certain employee benefits, we potentially could be subject to criminal penalties if we, our affiliates or our agents knowingly obtain or disclose individually identifiable health information maintained by a HIPAA-covered entity in a manner that is not authorized or permitted by HIPAA.
Failure to comply with current and future federal and state laws and regulations could result in government enforcement actions (including the imposition of significant penalties), criminal and civil liability for us and our officers and directors, private litigation and/or adverse publicity that negatively affects our business.
If we or our vendors fail to comply with applicable data privacy laws, or if the legal mechanisms we or our vendors rely upon to allow for the transfer of personal data from the EEA or Switzerland to the U.S. (or other countries not considered by the EC to provide an adequate level of data protection) are not considered adequate, we could be subject to government enforcement actions and significant penalties against us, and our business could be adversely impacted if our ability to transfer personal data outside of the EEA or Switzerland is restricted, which could adversely impact our operating results. The EU General Data Protection Regulation, which was officially adopted in April 2016 and will be applicable in May 2018, will introduce new data protection requirements in the EU, as well as substantial fines for breaches of the data protection rules. The EU General Data Protection Regulation will increase our responsibility and liability in relation to personal data that we process, and we may be required to put in place additional mechanisms to ensure compliance with the new EU data protection rules. In addition, data protection authorities of the different EU member states may interpret the EU Data Protection Directive and national laws differently, and guidance on implementation and compliance practices are often updated or otherwise revised, which adds to the complexity of processing personal data in the EU.
The number and complexity of both U.S. federal and state laws continue to increase, and additional governmental resources are being added to enforce these laws and to prosecute companies and individuals who are believed to be violating them. In addition, we expect private plaintiffs to continue to file lawsuits against pharmaceutical manufacturers under the whistleblower provisions of the False Claims Act and state equivalents and to seek out new theories of liability under those statutes. We also expect government enforcement agencies to continue to “intervene” in private whistleblower lawsuits, effectively converting the private lawsuit into a lawsuit by the government, which typically increases the likelihood that the lawsuit will result in increased expense for the company and/or a burdensome settlement. For example, federal enforcement agencies recently have shown interest in pharmaceutical companies’ product and patient assistance programs, including manufacturer reimbursement support services and relationships with specialty pharmacies. Some of these investigations have resulted in government enforcement authorities intervening in related whistleblower lawsuits and obtaining significant civil and criminal settlements. Other private whistleblowers have proceeded without government invention, causing considerable expense to targeted companies.
Recent changes in the law have reinforced and facilitated these trends. In particular, the Healthcare Reform Act includes a number of provisions aimed at strengthening the government’s ability to pursue anti-kickback and false claims cases against pharmaceutical manufacturers and other healthcare entities, including substantially increased funding for healthcare fraud enforcement activities, enhanced investigative powers, and amendments to the False Claims Act that make it easier for the government and whistleblowers to pursue cases for alleged kickback and false claim violations, such as defining a “false” claim to include any claim based on a violation of the anti-kickback statute. While we cannot say with certainty what effect these changes have had or will have on our business, we anticipate that increased enforcement and litigation, including through government intervention in whistleblower lawsuits and private whistleblowers proceeding on their own, will continue for the foreseeable future. Responding to a whistleblower lawsuit, government investigation or enforcement action, defending any claims raised, and paying any resulting fines, damages, penalties or settlement amounts would be expensive and time-consuming, and could have a material adverse effect on our reputation, business, financial condition, results of operations and growth prospects.
Several aspects of our business may subject us to antitrust scrutiny by the FTC or to civil litigation alleging violation of the antitrust laws. For example, REMS and the improper use of REMS as a means of improperly blocking or delaying competition for branded pharmaceutical products have increasingly drawn public scrutiny from Congress, the FTC and the FDA. Congress, for example, has introduced proposed legislation aimed at preventing companies from using REMS and other restricted distribution programs as a means to deny potential competitors access to product samples needed for bioequivalence testing. The FDA has stated that it will seek to coordinate with the FTC in identifying and publicizing practices the FTC finds to be anticompetitive and has further stated that the FDA has concerns related to the role of REMS programs in delaying approval of generic products. It is possible that the FTC, the FDA, other governmental authorities or other third parties could claim that, or launch an investigation into whether, we are using the Xyrem REMS in an anticompetitive manner (including in light of the FDA’s statement in the Xyrem REMS approval letter that the Xyrem REMS could be used in an anticompetitive manner inconsistent with applicable provisions of the FDCA) or have engaged in other anticompetitive practices. The FDCA
63
further states that a REMS shall not be used by an NDA holder to block or delay generic drugs or drugs covered by an application under Section 505(b)(2), from entering the market. Several of the ANDA applicants have asserted that our REMS patents should not have been listed in the Orange Book, and that the Xyrem REMS is blocking competition.
Another area of potential antitrust scrutiny relates to the settlement of patent litigation with potential generic competitors. Parties to such settlement agreements in the U.S. are required by law to file the agreements with the FTC and the DOJ for review. Accordingly, we have submitted our Xyrem patent settlement agreements to the FTC and the DOJ for review. The FTC has publicly stated that, in its view, certain brand-generic settlement agreements violate the antitrust laws and has brought actions against certain branded and generic companies that have entered into such agreements. In particular, the FTC has expressed its intention to take aggressive action to challenge settlements that include an alleged transfer of value from the brand company to the generic company (so-called “pay for delay” patent litigation settlements) and to call on legislators to pass stronger laws prohibiting such settlements. Because there is currently no precise legal standard with respect to the lawfulness of such settlements, there could be extensive litigation over whether any settlement that we have entered into or might enter into in the future constitutes a reasonable and lawful patent settlement. We may receive formal or informal requests from the FTC regarding our Xyrem patent settlements, and there is a risk that the FTC may commence a formal investigation or action against us, or a third party may initiate civil litigation regarding this settlement, which could divert the attention of management and cause us to incur significant costs, regardless of the outcome. Any claim or finding that we or our business partners have failed to comply with applicable laws and regulations could be costly to us and could have a material adverse effect on our business, financial condition, results of operations and growth prospects. We cannot predict the outcome of any potential government investigation of any antitrust claims, including those described above, or the impact of any such claims.
Compliance with U.S. federal and state, EU and EU member state national laws that apply to pharmaceutical manufacturers is difficult and time-consuming, and companies that violate these laws may face substantial penalties. The potential sanctions include civil monetary penalties, exclusion of a company’s products from reimbursement under government programs, criminal fines and imprisonment. Because of the breadth of these laws and, in some cases, the lack of extensive legal guidance in the form of regulations or court decisions, it is possible that some of our business activities could be subject to challenge under one or more of these laws. If we or the other parties with whom we work fail to comply with applicable regulatory requirements, we or they could be subject to a range of regulatory actions that could affect our ability to commercialize our products and could harm or prevent sales of the affected products, or could substantially increase the costs and expenses of commercializing and marketing our products. Any threatened or actual government enforcement action could also generate adverse publicity and require that we devote substantial resources that could otherwise be used in other aspects of our business.
We manufacture certain APIs, including the defibrotide drug substance, at our manufacturing facilities in Italy. In addition, we have engaged a third party supplier to process defibrotide into the finished product in Italy. Our manufacturing facilities and those of our third party manufacturer are subject to continuing regulation by the Italian Health Authority and other Italian regulatory authorities with respect to the manufacturing of APIs and drug products, including the defibrotide drug substance and its finished form. These facilities are also subject to inspection by the competent authorities of the EU member states and regulation by the EMA. Following initial approval in a jurisdiction, the competent authorities will continue to inspect our manufacturing facilities and those of our third party supplier, in some cases, unannounced, to confirm ongoing compliance with cGMP. The cGMP requirements govern quality control of the manufacturing process and documentation policies and procedures, and we and our third party suppliers will need to ensure that all of our processes, methods and equipment are compliant with cGMP. If these authorities determine that either our facilities or our third party supplier’s facility in Italy do not meet the standards of compliance required under applicable regulations, they may deny approval to manufacture our products, require us to stop manufacturing our products, deny approval to the sale of our products or suspend the sale of our products.
If we fail to comply with our reporting and payment obligations under the Medicaid Drug Rebate program or other governmental pricing programs, we could be subject to additional reimbursement requirements, penalties, sanctions and fines, which could have a material adverse effect on our business, financial condition, results of operations and growth prospects.
We participate in and have certain price reporting obligations to the Medicaid Drug Rebate program, several state Medicaid supplemental rebate programs and other governmental pricing programs, and we have obligations to report average sales price under the Medicare program. Under the Medicaid Drug Rebate program, we are required to pay a rebate to each state Medicaid program for our covered outpatient drugs that are dispensed to Medicaid beneficiaries and paid for by a state Medicaid program as a condition of having federal funds being made available to the states for our drugs under Medicaid and Medicare Part B. Those rebates are based on pricing data reported by us on a monthly and quarterly basis to CMS, the federal agency that administers the Medicaid Drug Rebate program. These data include the average manufacturer price and, in the case of innovator products, the best price for each drug which, in general, represents the lowest price available from the manufacturer to any entity in the U.S. in any pricing structure, calculated to include all sales and associated rebates, discounts
64
and other price concessions. Our failure to comply with these price reporting and rebate payment obligations could negatively impact our financial results.
The Healthcare Reform Act made significant changes to the Medicaid Drug Rebate program, such as expanding rebate liability from fee-for-service Medicaid utilization to include the utilization of Medicaid managed care organizations as well and changing the definition of average manufacturer price. The Healthcare Reform Act also increased the minimum Medicaid rebate; changed the calculation of the rebate for certain innovator products that qualify as line extensions of existing drugs; and capped the total rebate amount at 100% of the average manufacturer price. Finally, the Healthcare Reform Act requires pharmaceutical manufacturers of branded prescription drugs to pay a branded prescription drug fee to the federal government. Congress could enact additional legislation that further increases Medicaid drug rebates or other costs and charges associated with participating in the Medicaid Drug Rebate program. CMS recently issued a final regulation, which became effective on April 1, 2016, to implement the changes to the Medicaid Drug Rebate program under the Healthcare Reform Act. The issuance of the final regulation, as well as any other regulations and coverage expansion by various governmental agencies relating to the Medicaid Drug Rebate program, has increased and will continue to increase our costs and the complexity of compliance, has been and will continue to be time-consuming to implement, and could have a material adverse effect on our results of operations, particularly if CMS challenges the approach we take in our implementation of the final regulation.
Federal law requires that any company that participates in the Medicaid Drug Rebate program also participate in the Public Health Service’s 340B program in order for federal funds to be available for the manufacturer’s drugs under Medicaid and Medicare Part B. The 340B program requires participating manufacturers to agree to charge statutorily defined covered entities no more than the 340B “ceiling price” for the manufacturer’s covered outpatient drugs. These 340B covered entities include a variety of community health clinics and other entities that receive health services grants from the Public Health Service, as well as hospitals that serve a disproportionate share of low-income patients. The Healthcare Reform Act expanded the list of covered entities to include certain free-standing cancer hospitals, critical access hospitals, rural referral centers and sole community hospitals, but exempts “orphan drugs” from the ceiling price requirements for these covered entities. The 340B ceiling price is calculated using a statutory formula based on the average manufacturer price and rebate amount for the covered outpatient drug as calculated under the Medicaid Drug Rebate program, and in general, products subject to Medicaid price reporting and rebate liability are also subject to the 340B ceiling price calculation and discount requirement. Any additional future changes to the definition of average manufacturer price and the Medicaid rebate amount under the Healthcare Reform Act could affect our 340B ceiling price calculations and negatively impact our results of operations.
The Healthcare Reform Act obligates the Secretary of the HHS to update the agreement that manufacturers must sign to participate in the 340B program to obligate a manufacturer to offer the 340B price to covered entities if the manufacturer makes the drug available to any other purchaser at any price and to report to the government the ceiling prices for its drugs. The Health Resources and Services Administration, or HRSA, recently updated the agreement with participating manufacturers. The Healthcare Reform Act also obligates the Secretary of the HHS to create regulations and processes to improve the integrity of the 340B program. On January 5, 2017, HRSA issued a final regulation regarding the calculation of 340B ceiling price and the imposition of civil monetary penalties on manufacturers that knowingly and intentionally overcharge covered entities. The effective date of the regulation has been delayed until July 1, 2018. Implementation of this final rule and the issuance of any other final regulations and guidance could affect our obligations under the 340B program in ways we cannot anticipate. In addition, legislation may be introduced that, if passed, would further expand the 340B program to additional covered entities or would require participating manufacturers to agree to provide 340B discounted pricing on drugs used in an inpatient setting.
Federal law also requires that a company that participates in the Medicaid Drug Rebate program report average sales price information each quarter to CMS for certain categories of drugs that are paid under the Medicare Part B program. Manufacturers calculate the average sales price based on a statutorily defined formula as well as regulations and interpretations of the statute by CMS. CMS uses these submissions to determine payment rates for drugs under Medicare Part B. Statutory or regulatory changes or CMS guidance could affect the average sales price calculations for our products and the resulting Medicare payment rate, and could negatively impact our results of operations.
Pricing and rebate calculations vary across products and programs, are complex, and are often subject to interpretation by us, governmental or regulatory agencies and the courts. In the case of our Medicaid pricing data, if we become aware that our reporting for a prior quarter was incorrect, or has changed as a result of recalculation of the pricing data, we are obligated to resubmit the corrected data for up to three years after those data originally were due. Such restatements and recalculations increase our costs for complying with the laws and regulations governing the Medicaid Drug Rebate program and could result in an overage or underage in our rebate liability for past quarters. Price recalculations also may affect the ceiling price at which we are required to offer our products under the 340B program.
Civil monetary penalties can be applied if we are found to have knowingly submitted any false price information to the government, if we are found to have made a misrepresentation in the reporting of our average sales price, or if we fail to submit the required price data on a timely basis. Such conduct also could be grounds for CMS to terminate our Medicaid drug rebate
65
agreement, in which case federal payments may not be available under Medicaid or Medicare Part B for our covered outpatient drugs. We cannot assure you that our submissions will not be found by CMS to be incomplete or incorrect.
In order to be eligible to have our products paid for with federal funds under the Medicaid and Medicare Part B programs and purchased by certain federal agencies and grantees, we participate in the U.S. Department of Veterans Affairs, or VA, Federal Supply Schedule, or FSS, pricing program. As part of this program, we are obligated to make our products available for procurement on an FSS contract under which we must comply with standard government terms and conditions and charge a price that is no higher than the statutory Federal Ceiling Price, or FCP, to four federal agencies (VA, U.S. Department of Defense, or DOD, Public Health Service, and U.S. Coast Guard). The FCP is based on the Non-Federal Average Manufacturer Price, or Non-FAMP, which we calculate and report to the VA on a quarterly and annual basis. Pursuant to applicable law, knowing provision of false information in connection with a Non-FAMP filing can subject a manufacturer to penalties of $181,071 for each item of false information. These obligations also contain extensive disclosure and certification requirements.
We also participate in the Tricare Retail Pharmacy program, under which we pay quarterly rebates on utilization of innovator products that are dispensed through the Tricare Retail Pharmacy network to Tricare beneficiaries. The rebates are calculated as the difference between the annual Non-FAMP and FCP. We are required to list our covered products on a Tricare Agreement in order for these products to be eligible for DOD formulary inclusion. If we overcharge the government in connection with our FSS contract or Tricare Agreement, whether due to a misstated FCP or otherwise, we are required to refund the difference to the government. Failure to make necessary disclosures and/or to identify contract overcharges can result in allegations against us under the False Claims Act and other laws and regulations. Unexpected refunds to the government, and responding to a government investigation or enforcement action, would be expensive and time-consuming, and could have a material adverse effect on our business, financial condition, results of operations and growth prospects.
Access and adequate reimbursement coverage may not be available for our products, which could diminish our sales or affect our ability to sell our products profitably.
In both U.S. and non-U.S. markets, our ability to successfully commercialize and achieve market acceptance of our products, and to attract commercialization partners for our products, depends in significant part on access, the availability of adequate financial coverage and reimbursement from third party payors, including governmental payors (such as the Medicare and Medicaid programs in the U.S.), managed care organizations and private health insurers. The process for determining whether a third party payor will provide coverage for a product may be separate from the process for setting the price or reimbursement rate that the payor will pay for the product once coverage is approved. Without third party payor support, patients may not be able to obtain prescribed medications due to an inability to afford the medication.
Third party payors are increasingly examining the cost effectiveness of pharmaceutical products, in addition to their safety and efficacy, when making coverage, pricing and reimbursement decisions. We may need to conduct expensive pharmacoeconomic and/or clinical studies in order to demonstrate the cost-effectiveness of our products. Even with such studies, our products may be considered less safe, less effective or less cost-effective than other products, and third party payors may not provide and maintain price approvals, coverage and reimbursement for our products. If our competitors offer their products at prices that provide lower treatment costs than our products, or otherwise suggest that their products are safer, more effective or more cost-effective than our products, this may result in a greater level of access for their products relative to our products, which would reduce our sales and harm our results of operations. In some cases, for example, third party payors try to encourage the use of less expensive generic products through their prescription benefits coverage and reimbursement and co-pay policies. Because some of our products compete in a market with both branded and generic products, obtaining and maintaining access and reimbursement coverage for our products may be more challenging than for products that are new chemical entities for which no therapeutic alternatives exist.
Third party payors’ practices for establishing access and reimbursement coverage can be complex, time-consuming for patients and prescribing physicians and vary widely from payor to payor. Third party payors often require prior authorization for, and require reauthorization for continuation of, prescription products. Restrictive conditions for reimbursement and an increase in reimbursement-related activities can extend the time required to fill prescriptions and may discourage patients from seeking treatment. For example, we are experiencing increasingly restrictive conditions for reimbursement required by some third party payors for Xyrem, which may have a material effect on the overall level of reimbursement coverage for Xyrem. Increases in reimbursement-related activities have extended the time required to fill prescriptions and could continue to do so in the future. We cannot predict actions that third party payors may take, or whether they will limit the access and level of reimbursement for our products or refuse to provide any approvals or coverage. From time to time, third party payors have refused to provide reimbursement for our products, and others may do so in the future.
In addition, reimbursement guidelines and incentives provided to prescribing physicians by third party payors may have a significant impact on the prescribing physicians’ willingness to prescribe our products. For example, the U.S. federal government follows a Medicare severity diagnosis-related group, or MS-DRG, payment system for certain inpatient hospital services provided under Medicare, which some states also use for Medicaid. The MS-DRG system entitles a hospital to a fixed
66
reimbursement based on discharge diagnoses rather than actual costs incurred in providing inpatient treatment, thereby increasing the incentive for the facility to limit or control expenditures for many healthcare products. For our products used in the inpatient hospital setting, there may not be sufficient reimbursement under the MS-DRG to fully cover the cost of our products. Any failure to cover our products appropriately could impact our ability to maximize revenues in the federal marketplace. A significant portion of our revenue from Erwinaze is obtained through government payors, including Medicaid, and any failure to qualify for reimbursement for Erwinaze under those programs, including as a result of legislative changes to these programs, would have a material adverse effect on revenues from Erwinaze.
Third party payors are also increasingly considering new metrics as the basis for reimbursement rates, such as average net sales price, average manufacturer price and actual acquisition cost. Certain states have begun to survey acquisition cost data for the purpose of setting Medicaid reimbursement rates. CMS surveys and publishes retail community pharmacy acquisition cost information in the form of National Average Drug Acquisition Cost files to provide state Medicaid agencies with a basis of comparison for their own reimbursement and pricing methodologies and rates. It may be difficult to project the impact of these evolving reimbursement mechanics on the willingness of payors, including government payors, to cover our products.
Increasing consolidation among third party payors has led to fewer and larger third party payors with increased negotiating power. In particular, a small number of third party payors cover a significant portion of Xyrem patients. As a result, we may experience increasing pressure from third party payors to agree to discounts, rebates or other restrictive pricing terms for Xyrem. In the retail pharmacy sector, in which we expect that sales of an approved solriamfetol product would occur, a small number of third party payors and other third-party organizations known as pharmacy benefit managers, or PBMs, tasked with administrating prescription drug programs for large employers, health plans and government programs have market power and negotiating leverage to limit coverage to specific products on an approved list, or formulary, which might not include all of the approved products for a particular indication, and to exclude drugs from their formularies in favor of competitor drugs or alternative treatments, and/or to mandate stricter utilization criteria. Formulary exclusion effectively encourages patients and providers to seek alternative treatments or pay 100% of the cost of a drug. In the retail sector, if approved by the FDA, solriamfetol may face such conditions following its commercial launch, which could impact our other products. In highly competitive treatment markets, third party payors and PBMs may also exert negotiating leverage by requiring incremental rebates from manufacturers in order to maintain their formulary position.
If solriamfetol is approved by the FDA, the product will enter a competitive retail market of branded and generic products. Any delays or unforeseen difficulties in obtaining access or reimbursement approvals could delay or prevent our commercial launch and our ability to receive a return on our investment in solriamfetol. As part of the overall trend toward cost containment, third party payors could choose to require patients to try alternative, including generic, treatments before authorizing payment for solriamfetol, exclude solriamfetol from formulary coverage lists, limit the types of diagnoses for which coverage will be provided or demand rebates, discounts, exclusivity, or other concessions for solriamfetol and potentially our other products. We cannot predict market acceptance of, and our ability to obtain favorable formulary positions, access and reimbursement coverage for, solriamfetol. If we are unsuccessful in obtaining broad coverage for solriamfetol, our anticipated revenue from and growth prospects for an approved solriamfetol product could be negatively affected.
Political, economic and regulatory influences are subjecting the healthcare industry in the U.S. to fundamental changes, and we expect there will continue to be legislative and regulatory proposals to change the healthcare system in ways that could impact our ability to sell our products profitably. Several states have recently passed laws aimed at increasing transparency relating to drug pricing, and other states may do so in the future. We anticipate that the U.S. Congress, state legislatures and the private sector will continue to consider and may adopt healthcare policies and reforms intended to curb healthcare costs, particularly given the current atmosphere of mounting criticism of prescription drug costs in the U.S. These cost containment measures may include federal and state controls on government-funded reimbursement for drugs; new or increased requirements to pay prescription drug rebates to government health care programs; additional pharmaceutical cost transparency bills that aim to require drug companies to justify their prices through required disclosures; controls on healthcare providers; challenges to the pricing of drugs, or limits or prohibitions on reimbursement for specific products through other means; requirements to try less expensive products or generics before a more expensive branded product; changes in drug importation laws; expansion of use of managed care systems in which healthcare providers contract to provide comprehensive healthcare for a fixed cost per person; and public funding for cost effectiveness research, which may be used by government and private third party payors to make coverage and payment decisions.
Much attention has been paid to legislation proposing federal rebates on Medicare Part D and Medicare Advantage utilization for drugs issued to certain groups of lower income beneficiaries and the desire to change the provisions that treat these dual-eligible patients differently from traditional Medicare patients. Any such changes could have a negative impact on revenues from sales of our products. Beginning April 1, 2013, Medicare payments for all items and services, including drugs and biologics, were reduced by 2% under the sequestration (i.e., automatic spending reductions) required by the Budget Control Act of 2011, as amended by the American Taxpayer Relief Act of 2012. Subsequent legislation extended the 2% reduction, on average, to 2025. These cuts reduce reimbursement payments related to our products, which could potentially negatively
67
impact our revenue. Any failure to cover our products appropriately, in addition to legislative and regulatory changes and others that may occur in the future, could impact our ability to maximize revenues in the federal marketplace. A significant portion of our revenue from Erwinaze is obtained through government payors, including Medicaid, and any failure to qualify for reimbursement for Erwinaze under those programs, including as a result of legislative changes to these programs, would have a material adverse effect on revenues from Erwinaze. There also continue to be legislative proposals to amend U.S. laws to allow the importation into the U.S. of prescription drugs, which can be sold at prices that are regulated by the governments of various non-U.S. countries. The potential importation of prescription drugs could pose significant safety concerns for patients, increase the risk of counterfeit products becoming available in the market, and could also have a negative impact on prescription drug prices in the U.S.
If healthcare policies or reforms intended to curb healthcare costs are adopted or if we experience negative publicity with respect to pricing of our products or the pricing of pharmaceutical drugs generally, the prices that we charge for our products, including Xyrem, may be limited, our commercial opportunity may be limited and/or our revenues from sales of our products may be negatively impacted. We have periodically increased the price of Xyrem, most recently in January 2018, and we have made and may in the future make similar price increases on our other products. We cannot assure you that such price adjustments will not negatively affect our reputation and our ability to secure and maintain reimbursement coverage for our products, which could negatively impact our sales volumes and revenue. We expect to continue to experience pricing pressure in the U.S. in connection with the sale of our products due to third party payer actions, the increasing influence of health maintenance organizations, PBMs and managed healthcare generally, additional legislative proposals to curb healthcare costs and negative publicity regarding pricing and price increases generally, which could limit the prices that we charge for our products, including Xyrem, limit the commercial opportunities for our products and/or negatively impact revenues from sales of our products.
If we become the subject of any government investigation with respect to our drug pricing or other business practices, including as they relate to the Xyrem REMS, we could incur significant expense and could be distracted from operation of our business and execution of our strategy. Any such investigation could also result in reduced market acceptance and demand for our products, could harm our reputation and our ability to market our products in the future, and could have a material adverse effect on our business, financial condition, results of operations and growth prospects. In May and October 2016 and February 2017, we received subpoenas from the U.S. Attorney’s Office for the District of Massachusetts requesting documents related to our support of 501(c)(3) organizations that provide financial assistance to Medicare patients and documents concerning the provision of financial assistance to Medicare patients taking drugs sold by us. For more information, see the risk factors under the headings “
Changes in healthcare law and implementing regulations, including those based on recently enacted legislation, as well as changes in healthcare policy, may impact our business in ways that we cannot currently predict, and these changes could have a material adverse effect on our business and financial condition
” and
“
We are subject to significant ongoing regulatory obligations and oversight, which may result in significant additional expense and limit our ability to commercialize our products
” in this Part I, Item 1A.
In many countries outside the U.S., procedures to obtain price approvals, coverage and reimbursement can take considerable time after the receipt of marketing approval. The process of maintaining pricing and reimbursement approvals is complex and varies from country to country. Many European countries periodically review their reimbursement classes, which could have an adverse impact on the reimbursement status of Defitelio. We cannot predict the outcome of any periodic reviews required to maintain pricing and reimbursement approvals across Europe. If we are unable to maintain favorable pricing and reimbursement approvals in countries that represent significant markets, especially where a country’s reimbursed price influences other countries, our anticipated revenue from and growth prospects for Defitelio in the EU could be negatively affected. In addition, we submitted an MAA to the EMA for Vyxeos in the fourth quarter of 2017. If Vyxeos is approved by the MAA, we will need to make pricing and reimbursement submissions in European countries where pricing and reimbursement approvals are required for launch. If we experience delays or unforeseen difficulties in obtaining favorable pricing and reimbursement approvals, planned launches in the affected European countries would be delayed, which could negatively impact anticipated revenue from Vyxeos. If we are unable to obtain favorable pricing and reimbursement approvals in European countries that represent significant potential markets, our anticipated revenue from and growth prospects for Vyxeos in the EU could be negatively affected.
In various EU member states, we expect to be subject to continuous cost-cutting measures, such as lower maximum prices, lower or lack of reimbursement coverage and incentives to use cheaper, usually generic, products as an alternative. Health Technology Assessment, or HTA, of medicinal products is becoming an increasingly common part of the pricing and reimbursement procedures in some EU member states. These EU member states include the UK, France, Germany, Ireland, Italy, Spain, and Sweden. The HTA process, which is governed by the national laws of these countries, is the procedure according to which the assessment of the public health impact, therapeutic impact and the economic and societal impact of use of a given medicinal product in the national healthcare systems of the individual country is conducted. HTA generally focuses on the clinical efficacy and effectiveness, safety, cost, and cost-effectiveness of individual medicinal products, as well as their potential implications for the healthcare system. Those elements of medicinal products are compared with other treatment
68
options available on the market. The outcome of HTA regarding specific medicinal products will often influence the pricing and reimbursement status granted to these medicinal products by the competent authorities of individual EU member states. Pursuant to Directive 2011/24/EU, a voluntary network of national authorities or bodies responsible for HTA in the individual EU member states was established. The purpose of the network is to facilitate and support the exchange of scientific information concerning HTAs. This could lead to harmonization between EU member states of the criteria taken into account in the conduct of HTA and their impact on pricing and reimbursement decisions. The extent to which pricing and reimbursement decisions are influenced by the HTA of the specific medicinal product, however, still vary between EU member states and cannot be determined or anticipated in relation to our products at the present time. If we are unable to ultimately obtain favorable pricing and reimbursement approvals in countries that represent significant markets, especially where a country’s reimbursed price influences other countries, our growth prospects in Europe could be negatively affected.
In the EU, our products are marketed through various channels and within different legal frameworks. In certain EU member states, reimbursement for unauthorized products may be provided through national named patient programs. Such reimbursement may no longer be available if authorization for named patient programs expire or are terminated or when marketing authorization is granted. In other EU member states, authorization and reimbursement policies may also delay commercialization of our products, or may adversely affect our ability to sell our products on a profitable basis. After initial price and reimbursement approvals, reductions in prices and changes in reimbursement levels can be triggered by multiple factors, including reference pricing systems and publication of discounts by third party payors or authorities in other countries. In the EU, prices can be reduced further by parallel distribution and parallel trade, or arbitrage between low-priced and high-priced member states. Any cost containment measures, including those listed above, or other healthcare system reforms that are adopted, could negatively affect our growth prospects in Europe.
We are unable to predict what additional legislation, regulations or policies, if any, relating to the healthcare industry or third party coverage and reimbursement may be enacted in the future or what effect such legislation, regulations or policies would have on our business. Moreover, we cannot be sure that third party payor reimbursement amounts, or the lack of reimbursement, will not reduce the demand for, or the price of, our products. If reimbursement is not available or is available only at limited levels, we may not be able to effectively commercialize our products. Our business could be materially harmed if the Medicaid program, Medicare program or other third party payors in the U.S. or elsewhere were to deny reimbursement for our products, limit the indications for which our products will be reimbursed, or provide reimbursement only on unfavorable terms. Sales of our products depend on the availability and extent of access and reimbursement coverage from third party payors, but pricing and reimbursement pressures due to increasing media and government scrutiny of drug costs may affect our profitability.
Product liability and product recalls could harm our business.
The development, manufacture, testing, marketing and sale of pharmaceutical products are associated with significant risks of product liability claims or recalls. Side effects or adverse events known or reported to be associated with, or manufacturing defects in, the products sold by us could exacerbate a patient’s condition, or could result in serious injury or impairments or even death. This could result in product liability claims and/or recalls of one or more of our products. Some of our products, including Xyrem and Prialt, have boxed warnings in their labels. In addition, in the EU, Defitelio’s label includes an inverted black triangle that indicates the product is subject to additional monitoring to permit quick identification of new safety information, as a condition of authorization of Defitelio under “exceptional circumstances.” In many countries, including in EU member states, national laws provide for strict (no-fault) liability which applies even where damages are caused both by a defect in a product and by the act or omission of a third party.
Product liability claims may be brought by individuals seeking relief for themselves or by groups seeking to represent a class of injured patients. Further, third party payors, either individually or as a putative class, may bring actions seeking to recover monies spent on one of our products. The risk of product liability claims may also increase if a company receives a warning letter from a regulatory agency. Product liability claims are an inherent risk in our business, but we cannot predict the frequency, outcome or cost to defend any such claims.
Product liability insurance coverage is expensive, can be difficult to obtain and may not be available in the future on acceptable terms, or at all. Our product liability insurance may not cover all of the future liabilities we might incur in connection with the development, manufacture or sale of our products. In addition, we may not continue to be able to obtain insurance on satisfactory terms or in adequate amounts.
A successful claim or claims brought against us in excess of available insurance coverage could subject us to significant liabilities and could have a material adverse effect on our business, financial condition, results of operations and growth prospects. Such claims could also harm our reputation and the reputation of our products, adversely affecting our ability to market our products successfully. In addition, defending a product liability lawsuit is expensive and can divert the attention of key employees from operating our business.
69
Product recalls may be issued at our discretion or at the discretion of our suppliers, government agencies and other entities that have regulatory authority for pharmaceutical sales. Any recall of our products could materially adversely affect our business by rendering us unable to sell that product for some time and by adversely affecting our reputation. A recall could also result in product liability claims by individuals and third party payors. In addition, product liability claims could result in an investigation of the safety or efficacy of our products, our manufacturing processes and facilities, or our marketing programs conducted by the FDA, the EMA, or the competent authorities of the EU member states. Such investigations could also potentially lead to a recall of our products or more serious enforcement actions, limitations on the indications for which they may be used, or suspension, variation, or withdrawal of approval. Any such regulatory action by the FDA, the EC or the competent authorities of the EU member states could lead to product liability lawsuits as well.
We use hazardous materials in our manufacturing facilities, and any claims relating to the improper handling, storage, release or disposal of these materials could be time-consuming and expensive.
Our operations are subject to complex and increasingly stringent environmental, health and safety laws and regulations in the countries where we operate and, in particular, in Italy and Ireland where we have manufacturing facilities. Environmental and health and safety authorities in the relevant jurisdictions administer laws governing, among other matters, the emission of pollutants into the air (including the workplace), the discharge of pollutants into bodies of water, the storage, use, handling and disposal of hazardous substances, the exposure of persons to hazardous substances, and the general health, safety and welfare of employees and members of the public. In certain cases, laws may impose strict liability for pollution of the environment and contamination resulting from spills, disposals or other releases of hazardous substances or waste or any migration of such hazardous substances or waste. Costs, damages and/or fines may result from the presence, investigation and remediation of such contamination at properties currently or formerly owned, leased or operated by us or at off-site locations, including where we have arranged for the disposal of hazardous substances or waste. In addition, we may be subject to third party claims, including for natural resource damages, personal injury and property damage, in connection with such contamination. Our manufacturing activities in Italy and Ireland involve the controlled storage, use and disposal of chemicals and solvents. Even if our safety procedures for handling and disposing of these hazardous materials comply with the standards prescribed by EU laws, we cannot completely eliminate the risk of contamination or injury from hazardous materials. If an accident occurs, an injured party could seek to hold us liable for any damages that result and any liability could exceed the limits or fall outside the coverage of our insurance. We may not be able to maintain insurance on acceptable terms, or at all. We may incur significant costs to comply with current or future EU environmental laws.
Risks Related to Our Financial Condition and Results
We have incurred substantial debt, which could impair our flexibility and access to capital and adversely affect our financial position.
As of
December 31, 2017
, we had total indebtedness of approximately
$1.8 billion
, which included
$676.8 million
in outstanding term loan indebtedness under a secured credit agreement that we entered into in June 2015 and subsequently amended in July 2016, which we refer to as the amended credit agreement, $575.0 million of outstanding indebtedness under our 1.875% exchangeable senior notes due 2021, or the 2021 Notes, which were issued in August 2014, and $575.0 million of outstanding indebtedness under our 1.50% exchangeable senior notes due 2024, or the 2024 Notes, which were issued in August 2017 and which we refer to, together with the 2021 Notes, as the Exchangeable Senior Notes.
Our debt may:
|
•
|
limit our ability to borrow additional funds for working capital, capital expenditures, acquisitions or other general business purposes;
|
|
•
|
limit our ability to use our cash flow or obtain additional financing for working capital, capital expenditures, acquisitions or other general business purposes;
|
|
•
|
require us to use a substantial portion of our cash flow from operations to make debt service payments;
|
|
•
|
limit our flexibility to plan for, or react to, changes in our business and industry;
|
|
•
|
result in dilution to our existing shareholders in the event exchanges of the Exchangeable Senior Notes are settled in our ordinary shares;
|
|
•
|
place us at a competitive disadvantage compared to our less leveraged competitors; and
|
|
•
|
increase our vulnerability to the impact of adverse economic and industry conditions.
|
Our ability to meet our debt service obligations will depend on our future performance, which will be subject to financial, business and other factors affecting our operations, many of which are beyond our control. If we do not have sufficient funds to meet our debt service obligations, we may be required to refinance or restructure all or part of our existing debt, sell assets, borrow more money or sell securities, none of which we can assure you that we would be able to do in a timely manner, or at all.
70
Covenants in our amended credit agreement restrict our business and operations in many ways and if we do not effectively manage our covenants, our financial conditions and results of operations could be adversely affected.
The amended credit agreement provides for a $750.0 million principal amount term loan due in July 2021 and a $1.25 billion revolving credit facility, with any loans under such revolving credit facility due in July 2021, subject to early mandatory repayments under certain circumstances. The amended credit agreement contains various covenants that, among other things, limit our ability and/or our restricted subsidiaries’ ability to:
|
•
|
incur or assume liens or additional debt or provide guarantees in respect of obligations of other persons;
|
|
•
|
issue redeemable preferred stock;
|
|
•
|
pay dividends or distributions or redeem or repurchase capital stock;
|
|
•
|
prepay, redeem or repurchase certain debt;
|
|
•
|
make loans, investments, acquisitions (including acquisitions of exclusive licenses) and capital expenditures;
|
|
•
|
enter into agreements that restrict distributions from our subsidiaries;
|
|
•
|
sell assets and capital stock of our subsidiaries;
|
|
•
|
enter into certain transactions with affiliates; and
|
|
•
|
consolidate or merge with or into, or sell substantially all of our assets to, another person.
|
The amended credit agreement also includes financial covenants that require us to maintain a maximum secured leverage ratio and a minimum interest coverage ratio. Our ability to comply with these financial covenants may be affected by events beyond our control. In addition, the covenants under the amended credit agreement could restrict our operations, particularly our ability to respond to changes in our business or to take specified actions to take advantage of certain business opportunities that may be presented to us. Our failure to comply with any of the covenants could result in a default under the amended credit agreement, which could permit the lenders to declare all or part of any outstanding borrowings to be immediately due and payable, or to refuse to permit additional borrowings under the revolving credit facility. A default under the amended credit agreement could also lead to a default under other debt agreements or obligations, including the indentures governing the Exchangeable Senior Notes.
In addition, the holders of the Exchangeable Senior Notes have the ability to require us to repurchase their notes for cash if we undergo certain fundamental changes, such as specified change of control transactions, our liquidation or dissolution, or the delisting of our ordinary shares from The NASDAQ Global Select Market. Moreover, upon exchange of the Exchangeable Senior Notes, unless we elect to cause to be delivered solely ordinary shares to settle such exchange, we will be required to make cash payments in respect of the Exchangeable Senior Notes being exchanged. In this regard, it is our intent and policy to settle the principal amount of the Exchangeable Senior Notes in cash upon exchange. However, we may not have enough available cash or be able to obtain financing at the time we are required to make any required repurchases of surrendered Exchangeable Senior Notes or to pay cash upon exchanges of the Exchangeable Senior Notes. Our failure to repurchase the Exchangeable Senior Notes at a time when the repurchase is required by the indentures governing the Exchangeable Senior Notes or to pay any cash payable on future exchanges of the Exchangeable Senior Notes as required by the indentures governing the Exchangeable Senior Notes would constitute a default under that indenture. A default under those indentures could also lead to a default under other debt agreements or obligations, including the amended credit agreement. If the repayment of the related indebtedness were to be accelerated, we may not have sufficient funds to repay the related indebtedness, which could have a material adverse effect on our financial condition and our business. In this regard, if we are unable to repay amounts under the amended credit agreement, the lenders under the amended credit agreement could proceed against the collateral granted to them to secure that debt, which would seriously harm our business.
We may not be able to generate sufficient cash to service our debt obligations.
Our ability to make payments on and to refinance our debt will depend on our future financial and operating performance, which is subject to prevailing economic and competitive conditions and to certain financial, business and other factors beyond our control. We may be unable to maintain a level of positive cash flows from operating activities sufficient to permit us to pay the principal and interest on our debt.
If our cash flows and capital resources are insufficient to fund our debt service obligations, we may be forced to reduce or delay investments and capital expenditures, seek additional capital or restructure or refinance our debt. These alternative measures may not be successful and may not permit us to meet our scheduled debt service obligations. In the absence of such cash flows and resources, we could face substantial liquidity problems and might be required to dispose of material assets or operations to meet our debt service and other obligations. The amended credit agreement restricts our ability to dispose of assets, use the proceeds from any disposition of assets and refinance our indebtedness. We may not be able to consummate or obtain proceeds from such dispositions, and any such proceeds may not be adequate to meet any debt service obligations then due.
71
In addition, our borrowings under the amended credit agreement are, and are expected to continue to be, at variable rates of interest and expose us to interest rate risk. If interest rates increase, our debt service obligations on the variable rate indebtedness would increase even if the amount borrowed remained the same, and our net income would decrease.
To continue to grow our business, we will need to commit substantial resources, which could result in future losses or otherwise limit our opportunities or affect our ability to operate our business.
The scope of our business and operations has grown substantially since 2012 through a series of transactions, including the business combination between Jazz Pharmaceuticals, Inc. and Azur Pharma Public Limited Company, or Azur Pharma, which we refer to as the Azur Merger, our acquisition of EUSA Pharma Inc., the Gentium Acquisition and the Celator Acquisition. To continue to grow our business over the longer term, we will need to commit substantial additional resources to our business and execution of our strategy. Our ongoing capital requirements will depend on many factors, including:
|
•
|
the revenues from our commercial products, which may be affected by many factors, including the extent of generic or other competition for Xyrem or our other products;
|
|
•
|
the cost of acquiring and/or in-licensing any new products and product candidates;
|
|
•
|
the costs of our commercial operations;
|
|
•
|
the scope, rate of progress, results and costs of our development and clinical activities;
|
|
•
|
the cost and timing of obtaining regulatory approvals and of compliance with laws and regulations;
|
|
•
|
the cost of preparing, filing, prosecuting, defending and enforcing patent claims and other intellectual property rights;
|
|
•
|
the cost of investigations, litigation and/or settlements related to regulatory oversight and third party claims;
|
|
•
|
the costs of integration activities related to any future strategic transactions we may engage in; and
|
|
•
|
the costs arising from changes in laws and regulations, including, for example, healthcare reform legislation.
|
Our strategy includes the expansion of our business through the acquisition or in-licensing and development of additional marketed products or product candidates that are in late-stage development. We cannot assure you that we will continue to identify attractive opportunities. Even if appropriate opportunities are available, in order to compete successfully to acquire attractive products or product candidates in the current business climate, we may have to pay higher prices for assets than may have been paid historically, and we may not have the financial resources necessary to pursue them. As a result, we may be unable to expand our business if we do not have sufficient capital or cannot borrow or raise additional capital on attractive terms. Our substantial indebtedness may limit our ability to borrow additional funds for acquisitions or to use our cash flow or obtain additional financing for future acquisitions. In addition, if we use a substantial amount of our funds to acquire or in-license products or product candidates, we may not have sufficient additional funds to conduct all of our operations in the manner we would otherwise choose.
We may not be able to access the capital and credit markets on terms that are favorable to us, or at all.
During the past several years, domestic and international financial markets have experienced extreme disruption from time to time, including, among other things, high volatility and significant declines in stock prices and severely diminished liquidity and credit availability for both borrowers and investors. We expect to opportunistically seek access to the capital and credit markets to supplement our existing cash balances, cash we expect to generate from operations and funds available under our revolving credit facility to satisfy our needs for working capital, capital expenditures and debt service requirements or to continue to grow our business over the longer term through product acquisition and in-licensing, product development and clinical trials of product candidates, and expansion of our commercial operations. In the event of adverse capital and credit market conditions, including as a result of the UK’s withdrawal from the EU potentially contributing to instability in the global financial markets, we may not be able to obtain capital market financing or credit on favorable terms, or at all, which could have a material adverse effect on our business and growth prospects. Changes in our credit ratings issued by nationally recognized credit rating agencies could also adversely affect our cost of financing and have an adverse effect on the market price of our securities.
We may not be able to successfully maintain our tax rates, which could adversely affect our business and financial condition, results of operations and growth prospects.
We are incorporated in Ireland and maintain subsidiaries in North America and a number of other foreign jurisdictions. As a result, our effective tax rate is derived from a combination of applicable tax rates in the various jurisdictions where we operate. We are able to achieve a low average tax rate through the performance of certain functions and ownership of certain assets in tax-efficient jurisdictions, together with intra-group service and transfer pricing agreements, each on an arm’s length basis. However, changes in tax laws in any of these jurisdictions could adversely affect our ability to do so in the future. Taxing authorities, such as the U.S. Internal Revenue Service, or the IRS, actively audit and otherwise challenge these types of arrangements, and have done so in the pharmaceutical industry. We are subject to reviews and audits by the IRS and other taxing authorities from time to time, and the IRS or other taxing authority may challenge our structure and transfer pricing arrangements through an audit or lawsuit. For example, in December 2015, we received proposed tax assessment notices from the French tax authorities for 2012 and 2013 relating to certain transfer pricing adjustments. The notices propose additional
72
taxes of approximately
$45.9 million
, including interest and penalties, through the date of the assessment translated at the foreign exchange rate at December 31, 2017. Responding to or defending against this and other challenges from taxing authorities could be expensive and consume time and other resources, and divert management’s time and focus from operating our business. We generally cannot predict whether taxing authorities will conduct an audit or file a lawsuit challenging our structure, the cost involved in responding to any such audit or lawsuit, or the outcome. If we are unsuccessful, we may be required to pay taxes for prior periods, interest, fines or penalties, and may be obligated to pay increased taxes in the future, any of which could require us to reduce our operating expenses, decrease efforts in support of our products or seek to raise additional funds. Any of these actions could have a material adverse effect on our business, financial condition, results of operations and growth prospects.
In addition, on December 22, 2017, the U.S. Tax Act was signed into law. The legislation significantly changes U.S. tax law by, among other things, lowering the corporate income tax rate from a maximum of 35% to a flat 21%, implementing a modified territorial tax system, imposing a one-time transition tax on deemed repatriated earnings of foreign subsidiaries and changing the rules which determine whether a U.S. person is a U.S. shareholder of a controlled foreign corporation, or CFC, for 2017 and onwards. Notwithstanding the reduction in the corporate income tax rate, the overall impact of the new federal tax law is uncertain and our business and financial condition could be adversely affected. In addition, it is uncertain if and to what extent various states will conform to the newly enacted federal tax law. The impact of this tax reform on holders of our ordinary shares is also uncertain and could be adverse.
The IRS may not agree with the conclusion that we should be treated as a foreign corporation for U.S. federal tax purposes.
Although we are incorporated in Ireland, the IRS may assert that we should be treated as a U.S. corporation (and, therefore, a U.S. tax resident) for U.S. federal tax purposes pursuant to Section 7874 of the Code. For U.S. federal tax purposes, a corporation generally is considered a tax resident in the jurisdiction of its organization or incorporation. Because we are an Irish incorporated entity, we would be classified as a foreign corporation (and, therefore, a non-U.S. tax resident) under these rules. Section 7874 of the Code provides an exception under which a foreign incorporated entity may, in certain circumstances, be treated as a U.S. corporation for U.S. federal tax purposes. Because we indirectly acquired all of Jazz Pharmaceuticals, Inc.’s assets through the acquisition of the shares of Jazz Pharmaceuticals, Inc. common stock in the Azur Merger, the IRS could assert that we should be treated as a U.S. corporation for U.S. federal tax purposes under Section 7874. For us to be treated as a foreign corporation for U.S. federal tax purposes under Section 7874 of the Code, either (1) the former stockholders of Jazz Pharmaceuticals, Inc. must have owned (within the meaning of Section 7874 of the Code) less than 80% (by both vote and value) of our ordinary shares by reason of holding shares in Jazz Pharmaceuticals, Inc. after the Azur Merger (the “ownership test”), or (2) we must have substantial business activities in Ireland after the Azur Merger (taking into account the activities of our expanded affiliated group). The Jazz Pharmaceuticals, Inc. stockholders owned less than 80% of our share capital immediately after the Azur Merger by reason of their ownership of shares of Jazz Pharmaceuticals, Inc. common stock. As a result, we believe that we should be treated as a foreign corporation for U.S. federal tax purposes under current law. It is possible that the IRS could disagree with the position that the ownership test is satisfied and assert that Section 7874 of the Code applies to treat us as a U.S. corporation following the Azur Merger. There is limited guidance regarding the Code Section 7874 provisions, including the application of the ownership test described above. The IRS continues to scrutinize transactions that are potentially subject to Section 7874, and has issued several sets of final and temporary regulations under Section 7874 since 2012. In April 2016, the IRS issued temporary regulations under Section 7874 reflecting guidance that the IRS previously announced in notices dated September 2014 and November 2015, as well as additional rules. In January 2017, the IRS issued final and temporary regulations under Section 7874 making further revisions to the prior guidance. We do not expect these regulations to affect the U.S. tax consequences of the Azur Merger. Nevertheless, new statutory and/or regulatory provisions under Section 7874 of the Code or otherwise could be enacted that adversely affect our status as a foreign corporation for U.S. federal tax purposes, and any such provisions could have retroactive application to us, Jazz Pharmaceuticals, Inc., our respective shareholders and/or the Azur Merger. For more information, see the risk factor under the heading “
Future changes to the tax laws under which we expect to be treated as a foreign corporation for U.S. federal tax purposes or to other tax laws relating to multinational corporations could adversely affect us,
” in this Part I, Item 1A.
Section 7874 of the Code limits our U.S. affiliates’ ability to utilize their U.S. tax attributes to offset certain U.S. taxable income, if any, generated by certain taxable transactions.
Following certain acquisitions of a U.S. corporation by a foreign corporation, Section 7874 of the Code can limit the ability of the acquired U.S. corporation and its U.S. affiliates to utilize U.S. tax attributes such as net operating losses, or NOLs, to offset U.S. taxable income resulting from certain transactions. Based on the limited guidance available, this limitation applies to us. As a result, after the Azur Merger, our U.S. affiliates have not been able and will continue to be unable, for a period of time, to utilize their U.S. tax attributes to offset their U.S. taxable income, if any, resulting from certain taxable transactions. Notwithstanding this limitation, we plan to fully utilize our U.S. affiliates’ U.S. NOLs prior to their expiration. As a result of this limitation, however, it may take our U.S. affiliates longer to use their NOLs. Moreover, contrary to these plans, it is possible that the limitation under Section 7874 of the Code on the utilization of U.S. tax attributes could prevent our
73
U.S. affiliates from fully utilizing their U.S. tax attributes prior to their expiration if our U.S. affiliates do not generate sufficient taxable income.
Our U.S. affiliates’ ability to use their net operating losses to offset potential taxable income and related income taxes that would otherwise be due could be subject to further limitations if we do not generate taxable income in a timely manner or if the “ownership change” provisions of Sections 382 and 383 of the Code result in further annual limitations.
Our U.S. affiliates have a significant amount of NOLs. Our ability to use these NOLs to offset potential future taxable income and related income taxes that would otherwise be due is dependent upon our generation of future taxable income before the expiration dates of the NOLs, and we cannot predict with certainty when, or whether, our U.S. affiliates will generate sufficient taxable income to use all of the NOLs. Under the newly enacted U.S. Tax Act, federal NOLs incurred in 2018 and in future years may be carried forward indefinitely, but the deductibility of such federal NOLs is limited. It is uncertain if and to what extent various states will conform to the newly enacted federal tax law. In addition, realization of NOLs to offset potential future taxable income and related income taxes that would otherwise be due is subject to annual limitations under the “ownership change” provisions of Sections 382 and 383 of the Code and similar state provisions, which may result in the expiration of additional NOLs before future utilization. In general, an “ownership change” occurs if, during a three-year rolling period, there is a change of 50% or more in the percentage ownership of a company by 5% shareholders (and certain persons treated as 5% shareholders), as defined in the Code and the U.S. Treasury Department regulations, or Treasury Regulations, promulgated thereunder. In this regard, we currently estimate that, as a result of these ownership change provisions, we have an annual limitation on the utilization of certain NOLs and credits of $410.6 million, before tax effect, for 2018, $30.7 million, before tax effect, for 2019 and a combined total of $311.0 million, before tax effect, for 2020 to 2032.
However, Sections 382 and 383 of the Code are extremely complex provisions with respect to which there are many uncertainties, and we have not requested a ruling from the IRS to confirm our analysis of the ownership change limitations related to the NOLs generated by our U.S. affiliates. Therefore, we have not established whether the IRS would agree with our analysis regarding the application of Sections 382 and 383 of the Code. If the IRS were to disagree with our analysis, or if our U.S. affiliates were to experience additional ownership changes in the future, we could be subject to further annual limitations on the use of the NOLs to offset potential taxable income and related income taxes that would otherwise be due.
Future changes to the tax laws under which we expect to be treated as a foreign corporation for U.S. federal tax purposes or to other tax laws relating to multinational corporations could adversely affect us.
As described above, under current law, we believe that we should be treated as a foreign corporation for U.S. federal tax purposes. However, changes to the Code or the Treasury Regulations or other IRS guidance promulgated thereunder, including under Section 7874 of the Code, could adversely affect our status as a foreign corporation for U.S. federal tax purposes or could otherwise affect our effective tax rate, and any such changes could have prospective or retroactive application. Any future tax reform related to U.S. corporate tax residence, if enacted, could adversely affect our effective tax rate and our results of operations and financial condition.
The U.S. Congress, the EU, the Organization for Economic Co-operation and Development and other government agencies in jurisdictions where we and our affiliates do business have also had an extended focus on issues related to the taxation of multinational corporations. One example is in the area of “base erosion and profit shifting,” where payments are made between affiliates from a jurisdiction with high tax rates to a jurisdiction with lower tax rates. As a result, the tax laws in Ireland, the U.S. and other countries in which we and our affiliates do business could change on a prospective or retroactive basis, and any such changes could adversely affect us.
We have significant intangible assets and goodwill. Consequently, the future impairment of our intangible assets and goodwill may significantly impact our profitability.
Our intangible assets and goodwill are significant. As of December 31, 2017, we had recorded
$3.9 billion
of intangible assets and goodwill related to our past acquisitions. Intangible assets and goodwill are subject to an impairment analysis whenever events or changes in circumstances indicate the carrying amount of the asset may not be recoverable. Additionally, goodwill and indefinite-lived assets are subject to an impairment test at least annually.
Events giving rise to impairment are an inherent risk in the pharmaceutical industry and cannot be predicted. Our results of operations and financial position in future periods could be negatively impacted should future impairments of intangible assets or goodwill occur.
Our financial results have been and may continue to be adversely affected by foreign currency exchange rate fluctuations.
We have significant operations in Europe as well as in the U.S., but we report revenues, costs and earnings in U.S. dollars. Our primary currency translation exposure relates to our subsidiaries that have functional currencies denominated in the euro. Exchange rates between the U.S. dollar and the euro have fluctuated and are likely to continue to fluctuate from period to period. Because our financial results are reported in U.S. dollars, we are exposed to foreign currency exchange risk as
74
the functional currency financial statements of non-U.S. subsidiaries are translated to U.S. dollars for reporting purposes. To the extent that revenue and expense transactions are not denominated in the functional currency, we are also subject to the risk of transaction losses. For example, because our Defitelio and Erwinase product sales outside of the U.S. and potential future sales of Vyxeos are or will be primarily denominated in the euro, our sales of those products have been and may continue to be adversely affected by fluctuations in foreign currency exchange rates. In this regard, when the U.S. dollar strengthens against a foreign currency, the relative value of sales made in the foreign currency decreases. Conversely, when the U.S. dollar weakens against a foreign currency, the relative value of such sales increases. Accordingly, increases in the value of the U.S. dollar relative to foreign currencies, primarily the euro, could adversely affect our foreign revenues, perhaps significantly. In addition, as we continue to expand our international operations, we will conduct more transactions in currencies other than the U.S. dollar, which could increase our foreign currency exchange risk. Given the volatility of exchange rates, as well as our expanding operations, we cannot assure you that we will be able to effectively manage currency transaction and/or translation risks. We use foreign exchange forward contracts to manage currency risk primarily related to certain intercompany balances denominated in non-functional currencies. These foreign exchange forward contracts are not designated as hedges. Gains and losses on these derivative instruments are designed to offset gains and losses on the underlying balance sheet exposures. Fluctuations in foreign currency exchange rates could have a material adverse effect on our results of operations and financial condition.
Risks Related to Our Ordinary Shares
The market price of our ordinary shares has been volatile and may continue to be volatile in the future, and the value of your investment could decline significantly.
The market price for our ordinary shares has fluctuated significantly from time to time, for example, varying between a high of $163.75 on April 28, 2017 and low of $111.89 on January 3, 2017 during the period from December 31, 2016 through December 31, 2017. The market price of our ordinary shares is likely to continue to be volatile and subject to significant price and volume fluctuations in response to market, industry and other factors, including the risk factors described above. The stock market in general, including the market for life sciences companies, has experienced extreme price and volume fluctuations that have often been unrelated or disproportionate to the operating performance of those companies. In particular, negative publicity regarding pricing and price increases by pharmaceutical companies has negatively impacted, and may continue to negatively impact, the market for life sciences companies. These broad market and industry factors have harmed, and in the future may seriously harm, the market price of our ordinary shares, regardless of our operating performance.
Our share price may be dependent upon the valuations and recommendations of the analysts who cover our business. If our results do not meet these analysts’ forecasts, the expectations of our investors or the financial guidance we provide to investors in any period, the market price of our ordinary shares could decline. Our ability to meet analysts’ forecasts, investors’ expectations and our financial guidance is substantially dependent on our ability to maintain or increase sales of Xyrem and Defitelio and to successfully commercialize Vyxeos in the U.S. In addition, we will need to minimize future supply disruptions of Erwinaze in order to meet revenue expectations for Erwinaze. The risks and uncertainties associated with our ability to maintain or increase sales of Xyrem, Erwinaze, Defitelio and Vyxeos include those discussed elsewhere in these risk factors. In the past, following periods of volatility in the market or significant price decline, securities class-action litigation has often been instituted against companies. Such litigation, if instituted against us, could result in substantial costs and diversion of management’s attention and resources, which could materially and adversely affect our business, financial condition, results of operations and growth prospects.
In addition, the market price of our ordinary shares may decline if the effects of our transactions, including the Celator Acquisition and/or potential future acquisitions, on our financial or operating results are not consistent with the expectations of financial analysts or investors. The market price of our ordinary shares could also be affected by possible sales of our ordinary shares by holders of the Exchangeable Senior Notes who may view the Exchangeable Senior Notes as a more attractive means of equity participation in our company and by hedging or arbitrage trading activity involving our ordinary shares by the holders of the Exchangeable Senior Notes.
Future sales of our ordinary shares in the public market could cause our share price to fall.
Sales of a substantial number of our ordinary shares in the public market, including sales by members of our management or board of directors, or the perception that these sales might occur, could depress the market price of our ordinary shares and could impair our ability to raise capital through the sale of additional equity or equity-related securities. As of
February 20, 2018
, we had
59,803,396
ordinary shares outstanding, all of which shares are eligible for sale in the public market, subject in some cases to the volume limitations and manner of sale and other requirements under Rule 144. In addition, future issuances by us of our ordinary shares upon the exercise or settlement of equity-based awards and exchanges of the Exchangeable Senior Notes would dilute existing shareholders’ ownership interests in our company, and any sales in the public market of these
75
ordinary shares, or the perception that these sales might occur, could also adversely affect the market price of our ordinary shares.
Moreover, we have in the past and may in the future grant rights to some of our shareholders that require us to register the resale of our ordinary shares on behalf of these shareholders and/or facilitate offerings of ordinary shares held by these shareholders, including in connection with potential future acquisitions of additional products, product candidates or companies. We have also filed registration statements to register the sale of our ordinary shares reserved for issuance under our equity incentive and employee stock purchase plans, and we intend to file additional registration statements to register any shares automatically added each year to the share reserves under these plans.
We are subject to Irish law, which differs from the laws in effect in the U.S. and may afford less protection to holders of our securities.
It may not be possible to enforce court judgments obtained in the U.S. against us in Ireland based on the civil liability provisions of the U.S. federal or state securities laws. In addition, there is some uncertainty as to whether the courts of Ireland would recognize or enforce judgments of U.S. courts obtained against us or our directors or officers based on the civil liability provisions of the U.S. federal or state securities laws or hear actions against us or those persons based on those laws. We have been advised that the U.S. currently does not have a treaty with Ireland providing for the reciprocal recognition and enforcement of judgments in civil and commercial matters. Therefore, a final judgment for the payment of money rendered by any U.S. federal or state court based on civil liability, whether or not based solely on U.S. federal or state securities laws, would not automatically be enforceable in Ireland.
As an Irish company, we are governed by the Irish Companies Act 2014, which differs in some material respects from laws generally applicable to U.S. corporations and shareholders, including, among others, differences relating to interested director and officer transactions and shareholder lawsuits. Likewise, the duties of directors and officers of an Irish company are generally owed to the company only. Shareholders of Irish companies generally do not have a personal right of action against directors or officers of the company and may exercise such rights of action on behalf of the company only in limited circumstances. Accordingly, holders of our securities may have more difficulty protecting their interests than would holders of securities of a corporation incorporated in a U.S. jurisdiction.
Our articles of association, shareholder rights agreement, Irish law and the indentures governing the Exchangeable Senior Notes contain provisions that could delay or prevent a takeover of us by a third party.
Our articles of association could delay, defer or prevent a third party from acquiring us, despite the possible benefit to our shareholders, or otherwise adversely affect the price of our ordinary shares. For example, our articles of association:
|
•
|
impose advance notice requirements for shareholder proposals and nominations of directors to be considered at shareholder meetings;
|
|
•
|
stagger the terms of our board of directors into three classes;
|
|
•
|
require the approval of a supermajority of the voting power of the shares of our share capital entitled to vote generally at a meeting of shareholders to amend or repeal our articles of association; and
|
|
•
|
permit our board of directors to issue one or more series of preferred shares with rights and preferences, as our shareholders may determine by ordinary resolution.
|
In April 2017, we adopted a shareholder rights agreement, or rights agreement, with a 12-month term under which shareholders have certain ordinary share purchase rights if a person or group acquires 10% (or 20% in the case of a “13G Investor” as defined in the rights agreement) or more of our outstanding ordinary shares without the prior approval of our board of directors. Until its expiration, the rights agreement could make it more difficult for a person or group to acquire a majority of our outstanding ordinary shares, and could otherwise prevent or delay an acquisition of us. The rights agreement could also reduce the price that investors might be willing to pay for our ordinary shares and result in the market price of our ordinary shares being lower than it would be without the rights agreement. In addition, the existence of the rights agreement itself may deter a potential acquiror from pursuing any acquisition of us at all. As a result, either by operation of the rights agreement or by its potential deterrent effect, acquisitions of us that our shareholders may consider in their best interests may not occur.
In addition to our articles of association and the rights agreement, several mandatory provisions of Irish law could prevent or delay an acquisition of us. For example, Irish law does not permit shareholders of an Irish public limited company to take action by written consent with less than unanimous consent, and the shareholder approval requirements for certain types of transactions differ from those in the U.S., and in some cases are greater, under Irish law. We are also subject to various provisions of Irish law relating to mandatory bids, voluntary bids, requirements to make a cash offer and minimum price requirements, as well as substantial acquisition rules and rules requiring the disclosure of interests in our shares in certain circumstances. Furthermore, the indentures governing the Exchangeable Senior Notes require us to repurchase the Exchangeable Senior Notes for cash if we undergo certain fundamental changes and, in certain circumstances, to increase the exchange rate for a holder of 2021 Notes or 2024 Notes. A takeover of us may trigger the requirement that we purchase the
76
Exchangeable Senior Notes and/or increase the exchange rate, which could make it more costly for a potential acquiror to engage in a business combination transaction with us.
These provisions, whether alone or together, may discourage potential takeover attempts, discourage bids for our ordinary shares at a premium over the market price or adversely affect the market price of, and the voting and other rights of the holders of, our ordinary shares. These provisions, whether alone or together, could also discourage proxy contests and make it more difficult for our shareholders to elect directors other than the candidates nominated by our board.
We have never declared or paid dividends on our capital stock and we do not anticipate paying dividends in the foreseeable future.
Other than funds we have allocated for the purposes of supporting our share repurchase program authorized in November 2016, we anticipate that we will retain all earnings, if any, to support our operations and our proprietary drug development programs, acquire or in-license additional products and product candidates, and pursue other opportunities. If we propose to pay dividends in the future, we must do so in accordance with Irish law, which provides that distributions including dividend payments, share repurchases and redemptions be funded from “distributable reserves.” In addition, our ability to pay cash dividends on or repurchase our ordinary shares is restricted under the terms of the amended credit agreement. Any future determination as to the payment of dividends will, subject to Irish legal requirements, be at the sole discretion of our board of directors and will depend on our financial condition, results of operations, capital requirements, compliance with the terms of the amended credit agreement and other factors our board of directors deems relevant. Accordingly, holders of our ordinary shares must rely on increases in the trading price of their shares for returns on their investment in the foreseeable future.
A transfer of our ordinary shares may be subject to Irish stamp duty.
In certain circumstances, the transfer of shares in an Irish incorporated company will be subject to Irish stamp duty, which is a legal obligation of the buyer. This duty is currently charged at the rate of 1.0% of the price paid or the market value of the shares acquired, if higher. Because our ordinary shares are traded on a recognized stock exchange in the U.S., an exemption from this stamp duty is available in respect of transfers by shareholders who hold our ordinary shares beneficially through brokers which in turn hold those shares through the Depository Trust Company, or DTC, to holders who also hold through DTC. However, a transfer by or to a record holder who holds our ordinary shares directly in his, her or its own name could be subject to this stamp duty. We, in our absolute discretion and insofar as the Irish Companies Act 2014 or any other applicable law permits, may, or may provide that a subsidiary of ours will, pay Irish stamp duty arising on a transfer of our ordinary shares on behalf of the transferee of such ordinary shares. If stamp duty resulting from the transfer of our ordinary shares which would otherwise be payable by the transferee is paid by us or any of our subsidiaries on behalf of the transferee, then in those circumstances, we will, on our behalf or on behalf of our subsidiary (as the case may be), be entitled to (i) seek reimbursement of the stamp duty from the transferee, (ii) set-off the stamp duty against any dividends payable to the transferee of those ordinary shares and (iii) claim a first and permanent lien on the ordinary shares on which stamp duty has been paid by us or our subsidiary for the amount of stamp duty paid. Our lien shall extend to all dividends paid on those ordinary shares.
Dividends paid by us may be subject to Irish dividend withholding tax.
In certain circumstances, as an Irish tax resident company, we will be required to deduct Irish dividend withholding tax (currently at the rate of 20%) from dividends paid to our shareholders. Shareholders that are resident in the U.S., EU countries (other than Ireland) or other countries with which Ireland has signed a tax treaty (whether the treaty has been ratified or not) generally should not be subject to Irish dividend withholding tax so long as the shareholder has provided its broker, for onward transmission to our qualifying intermediary or other designated agent (in the case of shares held beneficially), or us or our transfer agent (in the case of shares held directly), with all the necessary documentation by the appropriate due date prior to payment of the dividend. However, some shareholders may be subject to withholding tax, which could adversely affect the price of our ordinary shares.
|
Item 1B.
|
Unresolved Staff Comments
|
There are no material unresolved written comments that were received from the SEC staff 180 days or more before the end of our
2017
fiscal year relating to our periodic or current reports under the Exchange Act.
|
Item 2.
|
Properties
|
Our corporate headquarters are located in Dublin, Ireland, and our U.S. operations are located in Palo Alto, California, Philadelphia, Pennsylvania and Ewing, New Jersey.
77
We lease approximately 44,000 square feet of office space in Dublin, Ireland. This lease expires in December 2036, with an option to terminate in December 2024 with no less than one year’s prior written notice and the payment of a termination fee, and a further option to terminate in December 2031 with no less than one year’s prior written notice. We own a 54,000 square foot manufacturing and development facility in Athlone, Ireland, which is primarily used for the manufacture of Xyrem and development-stage products.
In Palo Alto, California, we occupy a total of approximately 143,000 square feet of office space, 99,000 square feet of which is under a lease that expires in October 2029, or the Palo Alto Lease, and 44,000 square feet of which is under a lease that expires in August 2019. We have an option to extend the term of the Palo Alto Lease twice for a period of five years each and an option to terminate in October 2027 with no less than one year’s prior written notice and the payment of a termination fee. In September 2017, we entered into an agreement to lease approximately 99,000 to 100,000 square feet of office space in Palo Alto, California. We expect to occupy this office space by the end of 2019. This lease has a term of 12 years from commencement, and we have an option to extend the term of the lease twice for a period of five years each. We also have an option to terminate this lease in October 2029 with no less than one year’s prior written notice and the payment of a termination fee.
We occupy approximately 53,000 square feet of office space in Philadelphia, Pennsylvania, 23,000 square feet of which is under a lease that expires in April 2029, or the Philadelphia Lease, 19,000 square feet is under a lease that expires in April 2019 and 11,000 square feet is under a sublease that expires in March 2018. The Philadelphia Lease also provides for another 23,000 square feet, which we expect to occupy by the end of 2018. In addition, we have offices in Canada, Oxford, United Kingdom, Villa Guardia (Como), Italy, Lyon, France, and elsewhere in Europe. We occupy approximately 26,000 square feet of office space in Oxford, United Kingdom under a lease that expires in December 2027. We own a manufacturing facility in Villa Guardia (Como), Italy, which is primarily used for the manufacture of Defitelio. The manufacturing facility is approximately 25,000 square feet. We also lease approximately 52,000 square feet of office and laboratory space in Villa Guardia (Como), Italy under a lease that expires in December 2023.
We believe that our existing properties are in good condition and suitable for the conduct of our business. As we continue to expand our operations, we may need to lease additional or alternative facilities.
|
Item 3.
|
Legal Proceedings
|
Xyrem ANDA Litigation
. On December 10, 2012, we received a notice of Paragraph IV Patent Certification, or Paragraph IV Certification, from Amneal Pharmaceuticals, LLC, or Amneal, that it had submitted an abbreviated new drug application, or ANDA, to the U.S. Food and Drug Administration, or FDA, requesting approval to market a generic version of Xyrem. On January 18, 2013, we filed a lawsuit against Amneal in the U.S. District Court for the District of New Jersey, or the District Court, alleging that our patents covering Xyrem are infringed or will be infringed by Amneal’s ANDA and seeking a permanent injunction to prevent Amneal from introducing a generic version of Xyrem that would infringe these patents. On November 21, 2013, we received a notice of Paragraph IV Certification from Par Pharmaceutical, Inc., or Par, that it had submitted an ANDA to the FDA requesting approval to market a generic version of Xyrem. On December 27, 2013, we filed a lawsuit against Par in the District Court alleging that our patents covering Xyrem are infringed or will be infringed by Par’s ANDA and seeking a permanent injunction to prevent Par from introducing a generic version of Xyrem that would infringe these patents.
In May 2014, the District Court granted a request by Amneal to consolidate its case with the Par case. Additional patents covering Xyrem have been issued since May 2014 and have been listed in the FDA’s publication “Approved Drug Products with Therapeutic Equivalence Evaluations,” or the Orange Book, for Xyrem. Amneal and Par gave us additional notices of Paragraph IV Certifications regarding such patents, and we filed additional lawsuits against Amneal and Par in the District Court alleging that our patents covering Xyrem are infringed or will be infringed by Amneal’s and Par’s ANDAs and seeking a permanent injunction to prevent Amneal and Par from introducing a generic version of Xyrem that would infringe our patents. In August 2016, we and Par stipulated to dismiss claims relating to our patents covering the formulation of Xyrem on the grounds that Par had notified FDA that it had converted its Paragraph IV Certifications to Paragraph III Patent Certifications. In September 2017, we and Amneal stipulated to dismiss claims relating to certain of our patents covering the formulation of Xyrem on the grounds that Amneal had notified FDA that it had converted its Paragraph IV Certifications as to these patents to Paragraph III Patent Certifications.
On October 30, 2014, we received a notice of Paragraph IV Certification from Teva Pharmaceutical Industries Ltd., formerly known as Watson Laboratories, Inc., or Teva, that it had submitted an ANDA to the FDA requesting approval to market a generic version of Xyrem. On December 11, 2014, we filed a lawsuit against Teva in the District Court alleging that our patents covering Xyrem are or will be infringed by Teva’s ANDA and seeking a permanent injunction to prevent Teva from introducing a generic version of Xyrem that would infringe these patents. In March 2015, Teva moved to dismiss the portion of the case based on our Orange Book-listed risk evaluation and mitigation strategy, or REMS, patents on the grounds that these
78
patents do not cover patentable subject matter. In November 2015, the District Court administratively terminated this motion to dismiss (without prejudice) pending the outcome of inter partes review, or IPR, proceedings before the Patent Trial and Appeal Board, or PTAB, relating to the patents that were the subject of Teva’s motion. Since March 2015, we received an additional notice of Paragraph IV Certification from Teva regarding newly issued patents for Xyrem listed in the Orange Book, and we filed an additional lawsuit against Teva in the District Court alleging that our patents covering Xyrem are or will be infringed by Teva’s ANDA and seeking a permanent injunction to prevent Teva from introducing a generic version of Xyrem that would infringe these patents.
In April 2015, the District Court issued an order consolidating all then-pending lawsuits against Amneal, Par and Teva into one case.
On July 23, 2015, we received a notice of Paragraph IV Certification from Lupin Inc., or Lupin, that it had submitted an ANDA to the FDA requesting approval to market a generic version of Xyrem. On September 2, 2015, we filed a lawsuit in the District Court alleging that our patents covering Xyrem are or will be infringed by Lupin’s ANDA and seeking a permanent injunction to prevent Lupin from introducing a generic version of Xyrem that would infringe our patents.
In January, April and June 2016, the District Court issued orders consolidating all of the cases then pending against Amneal, Par, Teva and Lupin into a single case for all purposes. Although no trial date has been set for the consolidated case, discovery is scheduled to conclude in the third quarter of 2018, and the trial in this consolidated case could occur as early as the third quarter of 2018. As discussed in more detail below, in January 2018, we entered into a settlement agreement and related agreements resolving our patent infringement litigation against Par in the consolidated case, as well as related discovery proceedings and certain IPR proceedings currently on appeal to the Court of Appeal for the Federal Circuit, or the Federal Circuit.
On November 21, 2017, we received a notice of Paragraph IV Certification from Mallinckrodt Inc., or Mallinckrodt, that it had submitted an ANDA to the FDA requesting approval to market a generic version of Xyrem. On January 2, 2018, we filed a lawsuit in the District Court alleging that our patents covering Xyrem are or will be infringed by Mallinckrodt’s ANDA and seeking a permanent injunction to prevent Mallinckrodt from introducing a generic version of Xyrem that would infringe our patents.
We cannot predict whether additional generic manufacturers will file ANDAs and require new patent litigation, the specific timing or outcome of events with respect to the remaining defendants or the impact of developments involving any specific parties or patents on other ongoing proceedings with any ANDA filer.
Xyrem ANDA Litigation Settlements.
On April 5, 2017, we entered into a settlement agreement and related agreements resolving our patent infringement litigation against the first ANDA filer, Roxane Laboratories, Inc., which was acquired by West-Ward Pharmaceuticals Corp. (a wholly owned subsidiary of Hikma Pharmaceuticals PLC), or West-Ward. In connection with the settlement, we granted West-Ward the right to sell an authorized generic version of Xyrem, or the West-Ward AG Product, in the U.S. for an initial term of six months beginning on January 1, 2023, or earlier under certain circumstances. Such circumstances include events related to the licensing or market entry of another generic sodium oxybate product, a final decision that all unexpired claims of the Xyrem patents are invalid and/or unenforceable, or a substantial reduction in Xyrem net sales over specified periods of time. West-Ward has the right to extend the initial six-month term for the West-Ward AG Product, or the Initial Term, and continue to sell the West-Ward AG Product for up to a total of five years (the Initial Term, as it may be extended by West-Ward, is referred to as the West-Ward AG Sales Period). We are entitled to receive a meaningful royalty on net sales of the West-Ward AG Product, with the royalty rate increasing during the Initial Term based on increased net sales of the West-Ward AG Product. There will also be a substantial increase in the royalty rate should the West-Ward AG Sales Period be extended beyond one year. We will also receive payment for the supply of the West-Ward AG Product and reimbursement for a portion of the services costs associated with the operation of the Xyrem REMS and distribution of the West-Ward AG Product. We also granted West-Ward a non-exclusive license under the Xyrem patents to make, have made and market its own generic sodium oxybate product under the West-Ward ANDA in the U.S., effective at the end of the West-Ward AG Sales Period.
On January 9, 2018, we entered into a settlement agreement and related agreements resolving our patent infringement litigation against Par in the District Court, as well as related discovery proceedings and certain IPR proceedings currently on appeal to the Federal Circuit. In connection with the settlement, we granted Par the right to sell a limited volume of an authorized generic version of Xyrem, or the Par AG Product, in the U.S. for a term beginning on July 1, 2023, or earlier under certain circumstances, and ending on December 31, 2025, or the Par AG Sales Period. Such circumstances include events related to acceleration of the West-Ward AG Product launch date, the earlier launch of another party’s authorized generic or generic sodium oxybate product, or a final decision that all unexpired claims of the Xyrem patents are not infringed, invalid and/or unenforceable. The volume of the Par AG Product is limited to an annual amount equal to a low single-digit percentage of Xyrem sales volume during the calendar year preceding the entry date of the Par AG Product. We also granted Par a non-exclusive license under the Xyrem patents to make, have made and market its own generic sodium oxybate product under Par’s
79
ANDA (assuming FDA approval is obtained) effective December 31, 2025, or earlier under certain circumstances. Such circumstances include events related to launch of a generic sodium oxybate product by West-Ward or another party under its ANDA, or a final decision that all unexpired claims of the Xyrem patents are not infringed, invalid and/or unenforceable. If the Par license to market its own generic sodium oxybate product accelerates, then Par will have the option to elect to market the Par AG Product until December 31, 2025, but Par will not be entitled to market the Par AG Product and its own generic sodium oxybate product simultaneously. We are entitled to receive a meaningful royalty on net sales of the Par AG Product over the Par AG Sales Period, as well as payment for the supply of the Par AG Product and reimbursement for a portion of the services costs associated with the operation of the Xyrem REMS and distribution of the Par AG Product.
In addition to our settlement agreements with West-Ward and Par, we have also entered into settlements with three other ANDA filers, granting each of those filers the right to manufacture, market and sell its own sodium oxybate product on or after December 31, 2025, or earlier depending on the occurrence of certain events. The specific terms of all of the settlement agreements are confidential.
The settlements do not resolve the consolidated case against Amneal, Teva and Lupin, or the case against the most recent ANDA filer, Mallinckrodt, which remain pending.
Xyrem Post-Grant Patent Review Matters
.
In January 2015, certain of the ANDA filers filed petitions for IPR with respect to the validity of six of our seven patents associated with the Xyrem REMS, or REMS patents. The PTAB instituted IPR trials with respect to certain of these petitions. In July 2016, the PTAB issued final decisions that the claims of the six REMS patents are unpatentable. In March 2016, the PTAB partially instituted an IPR on three claims of a seventh REMS patent, declining to review 25 of 28 claims, and in March 2017, the PTAB issued a final decision that the three claims they reviewed are unpatentable. The July 2016 and March 2017 PTAB decisions are part of a consolidated appeal currently pending before the Federal Circuit. If the Federal Circuit upholds the PTAB decisions on appeal, we will not be able to enforce claims the PTAB found unpatentable. We cannot predict whether additional post-grant patent review challenges will be filed by any of the ANDA filers or any other entity, the outcome of any future IPR or other proceeding, the outcome of the appeal of the July 2016 and March 2017 PTAB decisions with respect to the REMS patents or the impact any IPR or other proceeding might have on ongoing ANDA litigation proceedings or other aspects of our Xyrem business.
Shareholder Litigation Matters Relating to Celator Acquisition
. On June 21, 2016, a putative class-action lawsuit challenging our acquisition of Celator Pharmaceuticals, Inc., or Celator, captioned
Dunbar v. Celator Pharmaceuticals, Inc
., or the Dunbar action, was filed in the Superior Court of New Jersey. We refer to our acquisition of Celator in this report as the Celator Acquisition. The complaint was filed against Celator, each member of the Celator board of directors, Jazz Pharmaceuticals plc and our wholly owned subsidiary Plex Merger Sub, Inc., or Plex. The complaint generally alleges that the Celator directors breached their fiduciary duties in connection with the Celator Acquisition, and that Jazz Pharmaceuticals plc and Plex aided and abetted these alleged breaches of fiduciary duty. The complaint also generally asserts that the Celator directors breached their fiduciary duties to Celator’s public stockholders by, among other things, (i) agreeing to sell Celator to us at an inadequate price, (ii) implementing an unfair process, (iii) agreeing to certain provisions of the merger agreement for the Celator Acquisition that allegedly favored us and deterred alternative bids, and (iv) failing to disclose purportedly material information in Celator’s Schedule 14D-9 filing with the U.S. Securities and Exchange Commission, or SEC. The plaintiff sought, among other things, an injunction against the consummation of the Celator Acquisition and an award of costs and expenses, including a reasonable allowance for attorneys’ and experts’ fees.
Between June 27, 2016 and June 29, 2016, two putative class-action lawsuits challenging the Celator Acquisition, captioned
Palmisciano v. Celator Pharmaceuticals, Inc.
, or the Palmisciano action, and Barreto v. Celator Pharmaceuticals, Inc., or the Barreto action, were filed in the District Court. The complaints were filed against Celator and each member of the Celator board of directors. The complaints assert causes of action under sections 14 and 20 of the Securities Exchange Act of 1934, as amended, predicated on Celator’s and the Celator directors’ alleged failure to disclose purportedly material information in Celator’s Schedule 14D-9 filing with the SEC. The plaintiffs sought, among other things, an injunction against the consummation of the Celator Acquisition and an award of costs and expenses, including a reasonable allowance for attorneys’ and experts’ fees. Neither Jazz Pharmaceuticals plc nor Plex were named defendants in these actions.
On July 6, 2016, the defendants to the Dunbar action, the Palmisciano action and the Barreto action entered into a memorandum of understanding, or MOU, regarding settlement of these actions with the plaintiffs. The MOU outlines the terms of the parties’ agreement in principle to settle and release all claims which were or could have been asserted in these actions. In consideration for such settlement and release, the parties to these actions agreed, among other things, that Celator would amend its Schedule 14D-9 to include certain supplemental disclosures. The Schedule 14D-9 was amended by Celator on July 6, 2016, and the Celator Acquisition was completed on July 12, 2016. In June 2017, the parties to the MOU agreed to terminate the MOU, and the plaintiffs agreed to voluntarily dismiss the remaining actions. Thereafter, the parties negotiated and ultimately agreed, in October 2017, on a mootness fee paid to plaintiffs’ counsel. The Dunbar, Palmisciano and Barreto actions have each been dismissed with prejudice.
80
Government Matter.
In May and October 2016 and in February 2017, we received subpoenas from the U.S. Attorney’s Office for the District of Massachusetts requesting documents related to our support of 501(c)(3) organizations that provide financial assistance to Medicare patients and documents concerning the provision of financial assistance to Medicare patients taking drugs sold by us. We are cooperating with this investigation. We are unable to predict the outcome of this investigation. For more information, see Note 13, Commitments and Contingencies, to our consolidated financial statements included in Part IV of this Annual Report on Form 10-K.
From time to time we are involved in legal proceedings arising in the ordinary course of business. We believe there is no other litigation pending that could have, individually or in the aggregate, a material adverse effect on our results of operations or financial condition.
|
Item 4.
|
Mine Safety Disclosures.
|
Not applicable.
|
Item 5.
|
Market for Registrant’s Common Equity, Related Stockholder Matters and Issuer Purchases of Equity Securities
|
Market Information
Our ordinary shares trade on The NASDAQ Global Select Market under the trading symbol “JAZZ.” The following table sets forth the high and low intraday sales prices of our ordinary shares on The NASDAQ Global Select Market for the periods indicated.
|
High
|
Low
|
||||||
|
Calendar Quarter—2016
|
|||||||
|
First Quarter
|
$
|
139.55
|
|
$
|
108.50
|
|
|
|
Second Quarter
|
$
|
160.00
|
|
$
|
129.00
|
|
|
|
Third Quarter
|
$
|
153.98
|
|
$
|
117.34
|
|
|
|
Fourth Quarter
|
$
|
126.36
|
|
$
|
95.80
|
|
|
|
Calendar Quarter—2017
|
|||||||
|
First Quarter
|
$
|
148.14
|
|
$
|
109.14
|
|
|
|
Second Quarter
|
$
|
163.75
|
|
$
|
139.72
|
|
|
|
Third Quarter
|
$
|
162.59
|
|
$
|
139.28
|
|
|
|
Fourth Quarter
|
$
|
151.45
|
|
$
|
128.58
|
|
|
On
February 20, 2018
, the last reported sales price per share of our ordinary shares was $144.78 per share.
Holders of Ordinary Shares
As of
February 20, 2018
, there were two holders of record of our ordinary shares. Because almost all of our ordinary shares are held by brokers, nominees and other institutions on behalf of shareholders, we are unable to estimate the total number of shareholders represented by these record holders.
Dividends
In
2017
and
2016
, we did not declare or pay cash dividends on our common equity and we do not currently plan to pay cash dividends in the foreseeable future. Under Irish law, dividends may only be paid, and share repurchases and redemptions must generally be funded only out of, “distributable reserves.” In addition, the terms of our credit agreement restrict our ability to make certain restricted payments, including dividends and other distributions by us in respect of our ordinary shares, subject to, among other exceptions, (1) a general exception for dividends and restricted payments up to $30 million in the aggregate and (2) an exception that allows for restricted payments, subject to a cap equal the sum of (i) $100 million plus (ii) so long as our secured leverage ratio (as defined in our credit agreement) does not exceed 2.5 to 1 after giving pro forma effect to the restricted payment, a formula-based amount tied to our consolidated net income; provided that such cap applies only if our total leverage ratio (as defined in our credit agreement) exceeds 2:1 after giving pro forma effect to the restricted payment. Any future determination as to the payment of dividends will, subject to Irish legal requirements, be at the sole discretion of our board of directors and will depend on our financial condition, results of operations, capital requirements, compliance with the terms of our credit agreement and other factors our board of directors deems relevant.
81
Unregistered Sales of Equity Securities
Except as previously reported in our Quarterly Reports on Form 10-Q and Current Reports on Form 8-K filed with the Securities and Exchange Commission, or SEC, during the year ended
December 31, 2017
, there were no unregistered sales of equity securities by us during the year ended
December 31, 2017
.
Irish Law Matters
As we are an Irish incorporated company, the following matters of Irish law are relevant to the holders of our ordinary shares.
Irish Restrictions on Import and Export of Capital
Except as indicated below, there are no restrictions on non-residents of Ireland dealing in Irish domestic securities, which includes ordinary shares of Irish companies. Dividends and redemption proceeds also continue to be freely transferable to non-resident holders of such securities. The Financial Transfers Act, 1992 gives power to the Minister for Finance of Ireland to restrict financial transfers between Ireland and other countries and persons. Financial transfers are broadly defined and include all transfers that would be movements of capital or payments within the meaning of the treaties governing the member states of the European Union, or EU. The acquisition or disposal of interests in shares issued by an Irish incorporated company and associated payments falls within this definition. In addition, dividends or payments on redemption or purchase of shares and payments on a liquidation of an Irish incorporated company would fall within this definition. At present the Financial Transfers Act, 1992 prohibits financial transfers involving the late Slobodan Milosevic and associated persons, Belarus, certain persons indicted by the International Criminal Tribunal for the former Yugoslavia, the late Osama bin Laden, Al-Qaida, the Taliban of Afghanistan, Democratic Republic of Congo, Democratic People’s Republic of Korea (North Korea), Iran, Iraq, Côte d’Ivoire, Lebanon, Liberia, Zimbabwe, Sudan, Somalia, Republic of Guinea, Republic of Guinea-Bissau, Afghanistan, Egypt, Eritrea, Libya, Syria, Tunisia, certain known terrorists and terrorist groups, countries that harbor certain terrorist groups and Ukraine without the prior permission of the Central Bank of Ireland.
Any transfer of, or payment in respect of, a share or interest in a share involving the government of any country that is currently the subject of United Nations sanctions, any person or body controlled by any of the foregoing, or by any person acting on behalf of the foregoing, may be subject to restrictions pursuant to such sanctions as implemented into Irish law.
Irish Taxes Applicable to U.S. Holders
Withholding Tax on Dividends.
While we have no current plans to pay dividends, dividends on our ordinary shares would generally be subject to Irish Dividend Withholding Tax, or DWT, at the standard rate of income tax (currently 20%), unless an exemption applies.
Dividends on our ordinary shares that are owned by residents of the U.S. and held beneficially through the Depositary Trust Company, or DTC, will not be subject to DWT provided that the address of the beneficial owner of the ordinary shares in the records of the broker is in the U.S.
Dividends on our ordinary shares that are owned by residents of the U.S. and held directly (outside of DTC) will not be subject to DWT provided that the shareholder has completed the appropriate Irish DWT form and this form remains valid. Such shareholders must provide the appropriate Irish DWT form to our transfer agent at least seven business days before the record date for the first dividend payment to which they are entitled.
If any shareholder who is resident in the U.S. receives a dividend subject to DWT, he or she should generally be able to make an application for a refund from the Irish Revenue Commissioners on the prescribed form.
While the U.S./Ireland Double Tax Treaty contains provisions regarding withholding, due to the wide scope of the exemptions from DWT available under Irish domestic law, it would generally be unnecessary for a U.S. resident shareholder to rely on the treaty provisions.
Income Tax on Dividends.
A shareholder who is neither resident nor ordinarily resident in Ireland and who is entitled to an exemption from DWT generally has no additional liability to Irish income tax or to the universal social charge on a dividend from us unless that shareholder holds our ordinary shares through a branch or agency in Ireland through which a trade is carried on.
A shareholder who is neither resident nor ordinarily resident in Ireland and who is not entitled to an exemption from DWT generally has no additional liability to Irish income tax or to the universal social charge on a dividend from us. The DWT deducted by us discharges the liability to Irish income tax and to the universal social charge. This however is not the case where the shareholder holds the ordinary shares through a branch or agency in Ireland through which a trade is carried on.
82
Irish Tax on Capital Gains
. A shareholder who is neither resident nor ordinarily resident in Ireland and does not hold our ordinary shares in connection with a trade or business carried on by such shareholder in Ireland through a branch or agency should not be within the charge to Irish tax on capital gains on a disposal of our ordinary shares.
Capital Acquisitions Tax
. Irish capital acquisitions tax, or CAT, is comprised principally of gift tax and inheritance tax. CAT could apply to a gift or inheritance of our ordinary shares irrespective of the place of residence, ordinary residence or domicile of the parties. This is because our ordinary shares are regarded as property situated in Ireland as our share register must be held in Ireland. The person who receives the gift or inheritance has primary liability for CAT.
CAT is levied at a rate of 33% above certain tax-free thresholds. The appropriate tax-free threshold is dependent upon (i) the relationship between the donor and the donee and (ii) the aggregation of the values of previous gifts and inheritances received by the donee from persons within the same category of relationship for CAT purposes. Gifts and inheritances passing between spouses are exempt from CAT. Our shareholders should consult their own tax advisers as to whether CAT is creditable or deductible in computing any domestic tax liabilities.
Stamp Duty.
Irish stamp duty (if any) may become payable in respect of ordinary share transfers. However, a transfer of our ordinary shares from a seller who holds shares through DTC to a buyer who holds the acquired shares through DTC will not be subject to Irish stamp duty. A transfer of our ordinary shares (i) by a seller who holds ordinary shares outside of DTC to any buyer or (ii) by a seller who holds the ordinary shares through DTC to a buyer who holds the acquired ordinary shares outside of DTC, may be subject to Irish stamp duty (currently at the rate of 1% of the price paid or the market value of the ordinary shares acquired, if greater). The person accountable for payment of stamp duty is the buyer or, in the case of a transfer by way of a gift or for less than market value, all parties to the transfer.
A shareholder who holds ordinary shares outside of DTC may transfer those ordinary shares into DTC without giving rise to Irish stamp duty provided that the shareholder would be the beneficial owner of the related book-entry interest in those ordinary shares recorded in the systems of DTC (and in exactly the same proportions) as a result of the transfer and at the time of the transfer into DTC there is no sale of those book-entry interests to a third party being contemplated by the shareholder. Similarly, a shareholder who holds ordinary shares through DTC may transfer those ordinary shares out of DTC without giving rise to Irish stamp duty provided that the shareholder would be the beneficial owner of the ordinary shares (and in exactly the same proportions) as a result of the transfer, and at the time of the transfer out of DTC there is no sale of those ordinary shares to a third party being contemplated by the shareholder. In order for the share registrar to be satisfied as to the application of this Irish stamp duty treatment where relevant, the shareholder must confirm to us that the shareholder would be the beneficial owner of the related book-entry interest in those ordinary shares recorded in the systems of DTC (and in exactly the same proportions) (or vice-versa) as a result of the transfer and there is no agreement being contemplated for the sale of the related book-entry interest or the ordinary shares or an interest in the ordinary shares, as the case may be, by the shareholder to a third party.
83
Performance Measurement Comparison (1)
The following graph shows the total shareholder return on the last day of each year of an investment of $100 in cash as if made on December 31, 2012 in (i) our ordinary shares; (ii) the NASDAQ Composite Index; and (iii) the NASDAQ Biotechnology Index through
December 31, 2017
. The shareholder return shown in the graph below is not necessarily indicative of future performance, and we do not make or endorse any predictions as to future shareholder returns.
COMPARISON OF FIVE YEAR CUMULATIVE TOTAL RETURN (2)
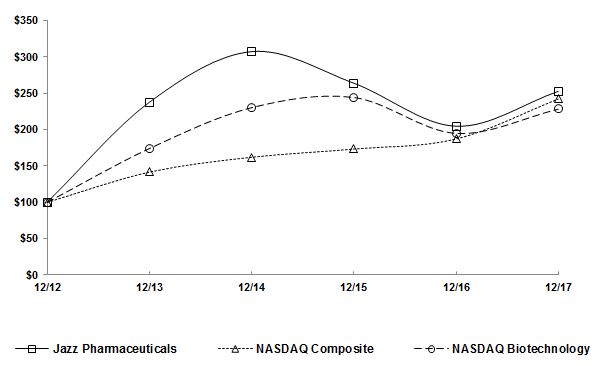
_________________________
|
(1)
|
This section is not “soliciting material,” is not deemed “filed” with the SEC and is not to be incorporated by reference into any of our filings under the Securities Act of 1933, as amended, or the Securities Exchange Act of 1934, as amended, or Exchange Act, whether made before or after the date hereof and irrespective of any general incorporation language in any such filing.
|
|
(2)
|
Information used in the graph was obtained from Research Data Group, Inc.
|
84
Issuer Purchases of Equity Securities
The following table summarizes purchases of our ordinary shares made by or on behalf of us or any of our “affiliated purchasers” as defined in Rule 10b-18(a)(3) under the Exchange Act during each fiscal month during the three-month period ended
December 31, 2017
:
|
Total Number of Shares Purchased (1)
|
Average Price Paid per Share (2)
|
Total Number of Shares Purchased as Part of Publicly Announced Plans or Programs (3)
|
Maximum Number (or Approximate Dollar Value) of Shares that May Yet Be Purchased Under the Plans or Programs (4)
|
||||||||||
|
October 1 - October 31, 2017
|
90,400
|
|
$
|
143.44
|
|
90,400
|
|
$
|
212,143,010
|
|
|||
|
November 1 - November 30, 2017
|
109,400
|
|
$
|
136.81
|
|
109,400
|
|
$
|
197,178,032
|
|
|||
|
December 1 - December 31, 2017
|
106,100
|
|
$
|
136.10
|
|
106,100
|
|
$
|
182,740,026
|
|
|||
|
Total
|
305,900
|
|
$
|
138.52
|
|
305,900
|
|
||||||
_________________________
|
(1)
|
This table does not include ordinary shares that we withheld in order to satisfy minimum tax withholding requirements in connection with the vesting of restricted stock units.
|
|
(2)
|
Average price paid per share includes brokerage commissions.
|
|
(3)
|
The ordinary shares reported in the table above were purchased pursuant to our publicly announced share repurchase program. In November 2016, we announced that our board of directors authorized the use of up to $300 million to repurchase our ordinary shares. This authorization has no expiration date.
|
|
(4)
|
The dollar amount shown represents, as of the end of each fiscal month, the approximate dollar value of ordinary shares that may yet be purchased under our publicly announced share repurchase program, exclusive of any brokerage commissions. The timing and amount of repurchases will depend on a variety of factors, including the price of our ordinary shares, alternative investment opportunities, restrictions under our credit agreement, corporate and regulatory requirements and market conditions, and may be modified, suspended or otherwise discontinued at any time without prior notice.
|
|
Item 6.
|
Selected Financial Data
|
The following selected consolidated financial data should be read together with our consolidated financial statements and accompanying notes and “Management’s Discussion and Analysis of Financial Condition and Results of Operations” appearing elsewhere in this Annual Report on Form 10-K. The selected consolidated financial data in this section is not intended to replace our consolidated financial statements and the accompanying notes. Our historical results are not necessarily indicative of our future results.
We derived the consolidated statements of income data for the years ended December 31, 2017, 2016 and 2015 and the consolidated balance sheet data as of December 31, 2017 and 2016 from the audited consolidated financial statements appearing elsewhere in this Annual Report on Form 10-K. The consolidated statements of income data for the years ended December 31, 2014 and 2013, and the selected consolidated balance sheet data as of December 31, 2015, 2014 and 2013 are derived from audited consolidated financial statements not included in this Annual Report on Form 10-K.
85
|
|
Year Ended December 31,
|
||||||||||||||||||
|
|
2017
|
2016(1)
|
2015
|
2014(2)
|
2013
|
||||||||||||||
|
|
(In thousands, except per share amounts)
|
||||||||||||||||||
|
Consolidated Statements of Income Data:
|
|||||||||||||||||||
|
Revenues:
|
|||||||||||||||||||
|
Product sales, net
|
$
|
1,601,399
|
|
$
|
1,477,261
|
|
$
|
1,316,819
|
|
$
|
1,162,716
|
|
$
|
865,398
|
|
||||
|
Royalties and contract revenues
|
17,294
|
|
10,712
|
|
7,984
|
|
10,159
|
|
7,025
|
|
|||||||||
|
Total revenues
|
1,618,693
|
|
1,487,973
|
|
1,324,803
|
|
1,172,875
|
|
872,423
|
|
|||||||||
|
Operating expenses:
|
|||||||||||||||||||
|
Cost of product sales (excluding amortization and impairment of intangible assets)
|
110,188
|
|
105,386
|
|
102,526
|
|
117,418
|
|
102,146
|
|
|||||||||
|
Selling, general and administrative
|
544,156
|
|
502,892
|
|
449,119
|
|
406,114
|
|
304,303
|
|
|||||||||
|
Research and development
|
198,442
|
|
162,297
|
|
135,253
|
|
85,181
|
|
41,632
|
|
|||||||||
|
Acquired in-process research and development
|
85,000
|
|
23,750
|
|
—
|
|
202,626
|
|
4,988
|
|
|||||||||
|
Intangible asset amortization
|
152,065
|
|
101,994
|
|
98,162
|
|
126,584
|
|
79,042
|
|
|||||||||
|
Impairment charges
|
—
|
|
—
|
|
31,523
|
|
39,365
|
|
—
|
|
|||||||||
|
Total operating expenses
|
1,089,851
|
|
896,319
|
|
816,583
|
|
977,288
|
|
532,111
|
|
|||||||||
|
Income from operations
|
528,842
|
|
591,654
|
|
508,220
|
|
195,587
|
|
340,312
|
|
|||||||||
|
Interest expense, net
|
(77,756
|
)
|
(61,942
|
)
|
(56,917
|
)
|
(52,713
|
)
|
(26,916
|
)
|
|||||||||
|
Foreign exchange gain (loss)
|
(9,969
|
)
|
3,372
|
|
1,445
|
|
8,683
|
|
(1,697
|
)
|
|||||||||
|
Loss on extinguishment and modification of debt
|
—
|
|
(638
|
)
|
(16,815
|
)
|
—
|
|
(3,749
|
)
|
|||||||||
|
Income before income tax provision (benefit) and equity in loss of investees
|
441,117
|
|
532,446
|
|
435,933
|
|
151,557
|
|
307,950
|
|
|||||||||
|
Income tax provision (benefit)
|
(47,740
|
)
|
135,236
|
|
106,399
|
|
94,231
|
|
91,638
|
|
|||||||||
|
Equity in loss of investees
|
1,009
|
|
379
|
|
—
|
|
—
|
|
—
|
|
|||||||||
|
Net income
|
487,848
|
|
396,831
|
|
329,534
|
|
57,326
|
|
216,312
|
|
|||||||||
|
Net loss attributable to noncontrolling interests
|
—
|
|
—
|
|
(1
|
)
|
(1,061
|
)
|
—
|
|
|||||||||
|
Net income attributable to Jazz Pharmaceuticals plc
|
$
|
487,848
|
|
$
|
396,831
|
|
$
|
329,535
|
|
$
|
58,387
|
|
$
|
216,312
|
|
||||
|
Net income attributable to Jazz Pharmaceuticals plc per ordinary share:
|
|||||||||||||||||||
|
Basic
|
$
|
8.13
|
|
$
|
6.56
|
|
$
|
5.38
|
|
$
|
0.98
|
|
$
|
3.71
|
|
||||
|
Diluted
|
$
|
7.96
|
|
$
|
6.41
|
|
$
|
5.23
|
|
$
|
0.93
|
|
$
|
3.51
|
|
||||
|
Weighted-average ordinary shares used in per share calculations - basic
|
60,018
|
|
60,500
|
|
61,232
|
|
59,746
|
|
58,298
|
|
|||||||||
|
Weighted-average ordinary shares used in per share calculations - diluted
|
61,317
|
|
61,870
|
|
63,036
|
|
62,614
|
|
61,569
|
|
|||||||||
86
|
|
As of December 31,
|
||||||||||||||||||
|
|
2017
|
2016(1)
|
2015
|
2014(2)
|
2013
|
||||||||||||||
|
|
(In thousands)
|
||||||||||||||||||
|
Consolidated Balance Sheet Data:
|
|||||||||||||||||||
|
Cash, cash equivalents and investments
|
$
|
601,035
|
|
$
|
425,963
|
|
$
|
988,785
|
|
$
|
684,042
|
|
$
|
636,504
|
|
||||
|
Working capital
|
674,330
|
|
490,663
|
|
1,031,025
|
|
799,044
|
|
660,589
|
|
|||||||||
|
Total assets
|
5,123,672
|
|
4,800,227
|
|
3,332,612
|
|
3,308,617
|
|
2,225,900
|
|
|||||||||
|
Long-term debt, current and non-current (1)(2)
|
1,581,038
|
|
2,029,625
|
|
1,188,444
|
|
1,313,161
|
|
539,436
|
|
|||||||||
|
Retained earnings
|
917,956
|
|
528,907
|
|
302,686
|
|
34,704
|
|
18,532
|
|
|||||||||
|
Total Jazz Pharmaceuticals plc shareholders’ equity
|
2,713,097
|
|
1,877,339
|
|
1,598,646
|
|
1,371,144
|
|
1,295,534
|
|
|||||||||
__________________________
|
(1)
|
On May 27, 2016, we entered into a definitive merger agreement with Celator Pharmaceuticals, Inc., or Celator, pursuant to which we made a cash tender offer of
$30.25
per share for all of the outstanding shares of Celator’s common stock. On July 12, 2016, we completed the acquisition of Celator, which acquisition we refer to in this report as the Celator Acquisition, under the terms of the merger agreement. Celator became an indirect wholly-owned subsidiary of Jazz Pharmaceuticals plc, and each share of Celator common stock then outstanding (other than shares owned by us or Celator) was converted into the right to receive
$30.25
, the same price per share offered in the tender offer. The aggregate cash consideration for the Celator Acquisition was
$1.5 billion
. The results of operations of the acquired Celator business, along with the estimated fair values of the assets acquired and liabilities assumed in the Celator Acquisition, have been included in our consolidated financial statements since the closing of the Celator Acquisition on July 12, 2016. On July 12, 2016, we entered into an amendment to our 2015 credit agreement, which amended agreement we refer to in this report as our amended credit agreement, that provides for a revolving credit facility of
$1.25 billion
, which replaced our prior revolving credit facility of
$750.0 million
, and a
$750.0 million
term loan facility. We used the proceeds of
$1.0 billion
of loans under the revolving credit facility, together with cash on hand, to fund the Celator Acquisition. The maturity date of both our revolving credit facility and term loan facility was extended from June 2020 to July 2021 pursuant to the amended credit facility. In the third quarter of 2017, we completed a private placement of $575.0 million aggregate principal amount of 1.50% exchangeable senior notes due 2024, or the 2024 Notes, resulting in net proceeds to us, after debt issuance costs, of $559.4 million. We used a portion of the net proceeds from the issuance of the 2024 Notes to repay all then outstanding borrowings under the revolving credit facility provided for under the amended credit agreement.
|
|
(2)
|
On January 23, 2014, pursuant to a tender offer, we became the indirect majority shareholder of Gentium S.r.l., or Gentium, acquiring control of Gentium on that date. In February 2014, we completed a subsequent offering period of the tender offer, resulting in total purchases pursuant to the tender offer of approximately
98%
of the fully diluted voting securities of Gentium. As of December 31, 2015, we had acquired the remaining
2%
interest in Gentium for cash consideration of
$17.9 million
, resulting in an aggregate acquisition cost to us of
$994.1 million
, comprising cash payments of
$1,011.2 million
offset by proceeds from the exercise of Gentium share options of
$17.1 million
. The results of operations of the acquired Gentium business, along with the estimated fair values of the assets acquired and liabilities assumed in the transaction, have been included in our consolidated financial statements since the completion of the acquisition of Gentium on January 23, 2014, which is referred to in this report as the Gentium Acquisition. In connection with the Gentium Acquisition, on January 23, 2014, we entered into a second amendment to the credit agreement we entered into in June 2012, or the previous credit agreement. We used the proceeds from incremental term loans of $350.0 million and $300.0 million of loans under the revolving credit facility provided for under the previous credit agreement, together with cash on hand, to finance the Gentium Acquisition. In August 2014, we completed a private placement of $575.0 million aggregate principal amount of 1.875% exchangeable senior notes due 2021, or the 2021 Notes, resulting in net proceeds to us, after debt issuance costs, of $558.9 million. We used a portion of the net proceeds from the issuance of the 2021 Notes to repay all then outstanding borrowings under the revolving credit facility provided for under the previous credit agreement.
|
|
Item 7.
|
Management’s Discussion and Analysis of Financial Condition and Results of Operations
|
The following discussion of our financial condition and results of operations should be read in conjunction with the consolidated financial statements and notes to consolidated financial statements included elsewhere in this Annual Report on Form 10-K. This discussion contains forward-looking statements that involve risks and uncertainties. When reviewing the discussion below, you should keep in mind the substantial risks and uncertainties that impact our business. In particular, we
87
encourage you to review the risks and uncertainties described in “Risk Factors” in Part I, Item 1A in this Annual Report on Form 10-K. These risks and uncertainties could cause actual results to differ materially from those projected in forward-looking statements contained in this report or implied by past results and trends.
Management Overview
Jazz Pharmaceuticals plc is an international biopharmaceutical company focused on improving patients’ lives by identifying, developing and commercializing meaningful products that address unmet medical needs.
We have a diverse portfolio of products and product candidates, with a focus in the areas of sleep and hematology/oncology. Our lead marketed products are:
|
•
|
Xyrem
®
(sodium oxybate) oral solution
, the only product approved by the U.S. Food and Drug Administration, or FDA, and marketed in the U.S. for the treatment of both cataplexy and excessive daytime sleepiness, or EDS, in patients with narcolepsy;
|
|
•
|
Erwinaze
®
(asparaginase
Erwinia chrysanthemi
)
, a treatment approved in the U.S. and in certain markets in Europe (where it is marketed as Erwinase
®
) for patients with acute lymphoblastic leukemia, or ALL, who have developed hypersensitivity to
E. coli
-derived asparaginase;
|
|
•
|
Defitelio
®
(defibrotide sodium)
, a product approved in the U.S. for the treatment of adult and pediatric patients with hepatic veno-occlusive disease, or VOD, also known as sinusoidal obstruction syndrome, or SOS, with renal or pulmonary dysfunction following hematopoietic stem cell transplantation, or HSCT, and in Europe (where it is marketed as Defitelio
®
(defibrotide)) for the treatment of severe VOD in adults and children undergoing HSCT therapy; and
|
|
•
|
Vyxeos
®
(daunorubicin and cytarabine) liposome for injection
, a product approved in the U.S. for the treatment of adults with newly-diagnosed therapy-related acute myeloid leukemia, or t-AML, or acute myeloid leukemia, or AML, with myelodysplasia-related changes, or AML-MRC.
|
Our strategy is to create shareholder value by:
|
•
|
Growing sales of the existing products in our portfolio, including by identifying and investing in growth opportunities such as new treatment indications and new geographic markets;
|
|
•
|
Acquiring or licensing rights to clinically meaningful and differentiated products on the market or product candidates at various stages of development; and
|
|
•
|
Pursuing targeted development of post-discovery differentiated product candidates.
|
We apply a disciplined approach to allocating our resources between investments in our current commercial and development portfolio and acquisitions or in-licensing of new assets.
Our total net product sales increased by
8%
in
2017
compared to
2016
, primarily due to an increase in Xyrem, Vyxeos and Defitelio product sales. We expect total net product sales to increase in
2018
over
2017
, primarily due to expected growth in sales of Xyrem, Vyxeos and Defitelio. Our ability to increase net product sales is subject to a number of risks and uncertainties as set forth below and under “Risk Factors” in Item I, Part 1A of this Annual Report on Form 10-K.
In 2017, we continued to increase our focus on research and development activities and achieved meaningful milestones in our clinical development of new product candidates, activities related to line extensions and new indications for existing products and the generation of additional clinical data for existing products, all in our sleep and hematology/oncology therapeutic areas.
A summary of our ongoing development activities is provided below:
|
Project
|
Disease Area
|
Status
|
|
Sleep
|
||
|
Solriamfetol (JZP-110)
|
Excessive sleepiness, or ES, in obstructive sleep apnea, or OSA
|
Submitted a new drug application, or NDA, to the FDA in fourth quarter of 2017; preparing to submit a marketing authorization application, or MAA, to the European Medicines Agency, or EMA, in late 2018
|
|
Solriamfetol (JZP-110)
|
ES in narcolepsy
|
Submitted an NDA to the FDA in fourth quarter of 2017; preparing to submit an MAA to EMA in late 2018
|
|
Solriamfetol (JZP-110)
|
ES in Parkinson’s disease
|
First patient enrolled in Phase 2 trial in first quarter of 2017; targeting completion of enrollment by late 2018
|
88
|
Project
|
Disease Area
|
Status
|
|
Xyrem
|
EDS and cataplexy in pediatric narcolepsy patients with cataplexy
|
Expect to submit a supplemental NDA, or sNDA, and pediatric written request report to the FDA in mid-2018
|
|
JZP-507
|
EDS and cataplexy in narcolepsy
|
Expect to be ready to submit an NDA to the FDA as early as mid-2018
|
|
JZP-258
|
EDS and cataplexy in narcolepsy
|
First patient enrolled in Phase 3 trial in first quarter of 2017; expect to complete enrollment in fourth quarter of 2018; subject to results of trial, expect to submit an NDA to the FDA in 2019
|
|
JZP-258
|
Idiopathic hypersomnia, or IH
|
Expect to initiate Phase 3 trial in second half of 2018
|
|
Oxybate once-nightly dosing
|
Narcolepsy
|
Program progressing; evaluation of deuterated oxybate and other formulation options continues as part of once-nightly development
process |
|
Hematology/Oncology
|
||
|
Vyxeos
|
High-risk AML
|
Submitted an MAA to the EMA in fourth quarter of 2017
|
|
Vyxeos
|
Myelodysplastic syndrome, or MDS
|
Preparing for Phase 2 trial with cooperative group with planned initiation in second half of 2018
|
|
Defibrotide
|
Prevention of VOD in high-risk patients following HSCT
|
First patient enrolled in Phase 3 trial in first quarter of 2017
|
|
Defibrotide
|
Prevention of acute Graft versus Host Disease, or aGvHD, following HSCT
|
First patient enrolled in Phase 2 proof of concept trial in first quarter of 2018
|
|
Defibrotide
|
Transplant-associated thrombotic microangiopathy, or TA-TMA
|
Expect to activate sites in pivotal Phase 2 trial in fourth quarter of 2018
|
|
Asparaginase
|
ALL and other hematological malignancies
|
Evaluation of early-stage product candidates
|
|
CombiPlex combinations
|
Oncology/hematological disorders
|
Pre-clinical evaluation of oncology therapeutic combinations
|
We are also engaged in a number of licensing and collaboration agreements, including a collaboration and option agreement with ImmunoGen, Inc., or ImmunoGen, granting us rights to opt into exclusive, worldwide licenses to develop and commercialize two early-stage, hematology-related antibody-drug conjugate, or ADC, programs, IMGN779 and IMGN632, as well as an additional ADC program to be designated during the term of the agreement. IMGN779 is a CD33-targeted ADC that ImmunoGen is investigating for the treatment of AML, and IMGN632 is a CD123-targeted ADC that ImmunoGen is investigating for the treatment of hematological malignancies, including AML and blastic plasmacytoid dendritic cell neoplasm. Both IMGN779 and IMGN632 are in Phase 1 testing.
For further details regarding these development activities, see “Business - Research and Development” in Part I, Item 1 of this Annual Report on Form 10-K.
For 2018 and beyond, we expect that our research and development expenses will continue to increase from historical levels, particularly as we prepare for a number of anticipated regulatory submissions, initiate and undertake additional clinical trials and related development work and potentially acquire rights to additional product candidates. Our ability to continue to undertake our planned development activities, as well as the success of these activities, are subject to a number of risks and uncertainties, including the risk factors under the headings “Risks Related to Our Business” and “Risks Related to Our Industry” in Risk Factors in Part I, Item 1A of this Annual Report on Form 10-K.
2017 Business Highlights
FDA Approval and Launch of Vyxeos.
In August 2017, the FDA approved our NDA for Vyxeos for the treatment of adults with newly-diagnosed t-AML or AML-MRC. We launched and began shipping Vyxeos in the U.S. in August 2017.
Settlement with First Xyrem ANDA Filer and Certain Other Filers.
On April 5, 2017, we entered into a settlement agreement and related agreements resolving our patent infringement litigation against the first Xyrem abbreviated new drug application, or ANDA, filer, Roxane Laboratories, Inc., which was acquired by West-Ward Pharmaceuticals Corp. (a wholly owned subsidiary of Hikma Pharmaceuticals PLC), or West-Ward. On January 9, 2018, we entered into a settlement agreement and related agreements resolving our patent infringement litigation against Par Pharmaceutical, Inc., or Par, as well as certain other proceedings. To date, we have settled lawsuits against five of the nine ANDA filers. These settlement agreements grant each of the settling filers rights to sell an authorized generic version of Xyrem, or AG Product, and/or its own generic sodium oxybate product as described in more detail below under “—
Challenges, Risks and Trends Related to Our Lead Marketed Products and Product Candidates Submitted for Regulatory Approval.
”
89
Significant Regulatory Filings
|
•
|
In December 2017, we submitted an NDA to the FDA for solriamfetol for potential treatment of ES in patients with narcolepsy and OSA.
|
|
•
|
In November 2017, we submitted an MAA for Vyxeos to the EMA for the treatment of t-AML or AML-MRC. We expect to launch Vyxeos, if approved, in the EU on a rolling basis shortly following approval, which could occur as early as mid-2018.
|
Issuance of Exchangeable Senior Notes
. In August 2017, Jazz Investments I Limited, our wholly owned subsidiary, completed a private placement of $500.0 million principal amount of 1.50% exchangeable senior notes due 2024, or the 2024 Notes, and in September 2017, sold an additional $75.0 million principal amount of 2024 Notes. We used the net proceeds from the issuance of the 2024 Notes to repay $500.0 million in outstanding borrowings under our revolving credit facility and to pay related fees and expenses. We used the remainder of the net proceeds for general corporate purposes.
Entry into Licensing and Collaboration Agreements
|
•
|
In March 2017, we executed license agreements granting Nippon Shinyaku Co., Ltd. exclusive rights to develop and commercialize Defitelio and Vyxeos in Japan.
|
|
•
|
In May 2017, we entered into a license agreement with XL-protein GmbH, or XLp, for the rights to develop, manufacture and commercialize products using XLp’s PASylation® technology to extend the plasma half-life of selected asparaginase product candidates.
|
|
•
|
In August 2017, we entered into a collaboration and option agreement with ImmunoGen granting us rights to opt into exclusive, worldwide licenses to develop and commercialize two early-stage, hematology-related programs, as well as an additional ADC program to be designated during the term of the agreement, as described above.
|
|
•
|
In December 2017, we amended our agreement with Pfenex, Inc., or Pfenex, which agreement grants us worldwide rights to develop and commercialize multiple early-stage hematology product candidates and an option for us to negotiate a license for a recombinant pegaspargase product candidate.
|
U.S. Tax Reform.
On December 22, 2017, the U.S. Tax Cuts and Jobs Act, or U.S. Tax Act, was signed into law. The legislation significantly changes U.S. tax law by, among other things, lowering the corporate income tax rate from a maximum of 35% to a flat 21% rate effective January 1, 2018, implementing a modified territorial tax system, imposing a one-time transition tax on deemed repatriated earnings of foreign subsidiaries and changing the rules which determine whether a U.S. person is a U.S. shareholder of a controlled foreign corporation for 2017 and onwards. As a result of these changes, we recognized a provisional $148.8 million tax benefit in our consolidated statement of income in 2017. We expect that the U.S. Tax Act will have a modest positive effect on our effective tax rate in 2018.
Challenges, Risks and Trends Related to Our Lead Marketed Products and Product Candidates Submitted for Regulatory Approval
Xyrem.
Xyrem is our largest selling product, and our financial results are significantly influenced by sales of Xyrem, which accounted for
74%
and
75%
of our net product sales for the years ended December 31, 2017 and 2016. As a result, we continue to place a high priority on seeking to increase sales of Xyrem in its approved indications, while remaining focused on ensuring the safe and effective use of the product. We also focus on enhancing and enforcing our intellectual property rights related to Xyrem, and on product development efforts to develop product, service and safety improvements for patients.
Our future plans assume that sales of Xyrem will increase, but we cannot assure you that we can maintain sales of Xyrem at or near current levels, or that Xyrem sales will continue to grow. We have periodically increased the price of Xyrem, most recently in January 2018, and we cannot assure you that price adjustments we have taken or may take in the future will not negatively affect Xyrem sales volumes.
Our ability to maintain or increase Xyrem product sales is subject to risks and uncertainties, including those discussed in “Risk Factors” in Part I, Item 1A of this Annual Report on Form 10-K, including those related to:
|
•
|
the potential U.S. introduction of a generic version of Xyrem before the entry dates specified in our settlements with certain ANDA filers or on terms that are different from those contemplated by the settlement agreements, as further described below;
|
|
•
|
the potential U.S. introduction of new products that compete with, or otherwise disrupt the market for, Xyrem in the treatment of cataplexy and/or EDS in narcolepsy;
|
|
•
|
changes to or uncertainties around regulatory restrictions, including, among other things, changes to our Xyrem risk evaluation and mitigation strategy, or REMS, as further described below;
|
90
|
•
|
challenges and potential challenges to our intellectual property around Xyrem, including uncertainty in ongoing ANDA litigation or the possibility of new ANDA filers and challenges;
|
|
•
|
any increase in pricing pressure from, changes in policies by, or restrictions on reimbursement imposed by, third party payors;
|
|
•
|
changes in healthcare laws and policy, including changes in requirements for patient assistance programs, rebates, reimbursement and coverage by federal healthcare programs, and changes resulting from increased scrutiny on pharmaceutical pricing and REMS programs by government entities;
|
|
•
|
operational disruptions at the Xyrem central pharmacy or any failure to comply with our REMS obligations to the satisfaction of the FDA;
|
|
•
|
any supply or manufacturing problems, including any problems with our sole source Xyrem active pharmaceutical ingredient, or API, provider;
|
|
•
|
continued acceptance of Xyrem by physicians and patients, including as a result of negative publicity that surfaces from time to time;
|
|
•
|
changes to our label, including new safety warnings or changes to our boxed warning, that further restrict how we market and sell Xyrem; and
|
|
•
|
our U.S.-based API and Xyrem suppliers’ ability to obtain sufficient quotas from the U.S. Drug Enforcement Administration, or DEA, to satisfy our needs for Xyrem.
|
Although Xyrem is protected by patents covering its manufacture, formulation, distribution system and method of use, nine companies have filed ANDAs with the FDA seeking approval to market a generic version of Xyrem. We filed patent lawsuits against each of the ANDA filers in the federal district court of New Jersey, or District Court, asserting that such generic products would violate our patents covering Xyrem. We have settled lawsuits against five of the ANDA filers. In our settlement with the first filer, West-Ward, we granted West-Ward the right to sell an AG Product, beginning on January 1, 2023, or earlier under certain circumstances, including circumstances related to the licensing or market entry of another generic sodium oxybate product, a final decision that all unexpired claims of the Xyrem patents are invalid and/or unenforceable, or a substantial reduction in Xyrem net sales over specified periods of time. We also granted West-Ward a license to launch its own generic sodium oxybate product as early as six months after it has the right to sell the AG Product, unless it elects to continue to sell the AG Product, which it may do for up to a total of five years. In our settlement with Par, we granted Par the right to sell a limited volume of an AG Product beginning on July 1, 2023, or earlier under certain circumstances, including acceleration of West-Ward’s AG Product launch date. We also granted Par a license to launch its own generic sodium oxybate product on or after December 31, 2025, or earlier under certain circumstances, including circumstances related to the launch of a generic sodium oxybate product by West-Ward or another company under its ANDA. We have also settled all lawsuits with three of the other ANDA filers, granting each of them a license to launch its own generic sodium oxybate product on or after December 31, 2025, or earlier under certain circumstances, including the launch by West-Ward or another company of a generic sodium oxybate product under its ANDA.
Patent lawsuits against three of the remaining non-settling ANDA filers have been consolidated as one case and remain pending. Although no trial date has been set, discovery is scheduled to conclude in the third quarter of 2018, and the trial in this consolidated case could occur as early as the third quarter of 2018. The most recent ANDA was filed in November 2017, and we filed a patent lawsuit against that filer in the District Court in January 2018. We cannot predict the timing or outcome of the ANDA litigation proceedings against the remaining non-settling ANDA filers. We do not know whether additional ANDAs have been or will be filed.
In July 2016, the Patent Trial and Appeal Board, or PTAB, issued final decisions that the claims of six patents associated with the Xyrem REMS are unpatentable. In March 2017, the PTAB issued a final decision that three claims of a seventh Xyrem patent associated with the Xyrem REMS are unpatentable. Those PTAB decisions are currently on appeal to the United States Court of Appeals for the Federal Circuit, or Federal Circuit. If the Federal Circuit upholds the PTAB decisions on appeal, we will not be able to enforce claims the PTAB found unpatentable.
For a further description of the legal proceedings and settlement agreements relating to Xyrem, see “Legal Proceedings” in Part I, Item 3 of this Annual Report on Form 10-K.
The actual timing of any commercial launch of an AG Product or a generic sodium oxybate product is uncertain. We do not believe a launch by an ANDA filer is likely to occur prior to either a date agreed in a settlement agreement between us and such ANDA filer or a final decision in patent litigation. However, notwithstanding our patents and the terms of settlement agreements licensing those patents as of future dates, it is possible that any non-settling company that obtains and maintains FDA approval of an ANDA for a generic version of Xyrem or an NDA for another sodium oxybate product could introduce such product before our patents expire or before the entry dates specified in our settlement agreements, including if it is
91
determined that our patents are invalid or unenforceable, if such company obtains a final judicial determination that its products do not infringe our patents, or if such company decides, before applicable patent litigation is concluded, to launch a sodium oxybate product at risk of being held liable for damages for patent infringement. In addition, even if we prevail in litigation at trial or on appeal, we cannot guarantee that a court will grant an injunction that prevents a defendant from marketing a product that infringes our patents. Instead the court may order a party that is found to infringe to pay damages, which could be significant. If a non-settling company launches a product in any of these scenarios, it could accelerate the launch dates for the AG Products and generic sodium oxybate products under our settlements agreements, depending on the circumstances.
In addition, Xyrem could also be subject to potential future competition from other products. Companies could develop and launch sodium oxybate or other products that are similar, but not identical, to Xyrem, such as an alternative formulation or an alternative delivery technology. For example, Avadel Pharmaceuticals plc, or Avadel, is using its proprietary technology for delivery of a sodium oxybate formulation to eliminate second nighttime dosing for narcolepsy patients. Avadel has stated that it is conducting a Phase 3 pivotal trial pursuant to an FDA-approved special protocol assessment, and has indicated that it intends to seek approval of its product candidate using a Section 505(b)(2) NDA approval pathway referencing Xyrem. We are also aware of products being developed by others for use as treatment options in cataplexy and/or EDS in patients with narcolepsy that have different safety profiles and mechanisms of action than Xyrem, including a product to treat adult patients with narcolepsy with or without cataplexy that received marketing approval in Europe in 2016. While this product is currently not approved by the FDA for marketing in the U.S., the company that has exclusive U.S. commercialization rights to this product recently announced that it expects to establish an expanded access program for the product in early 2018 and submit an NDA to the FDA for the treatment of narcolepsy in adult patients during the first half of 2018. If any company successfully develops, obtains FDA approval of and launches a product that is approved in the U.S. for the treatment of narcolepsy patients, it could result in a substantial reduction of Xyrem sales, which could have the additional impact of potentially triggering acceleration of market entry of AG Products or other generic sodium oxybate products under our ANDA litigation settlement agreements, as described elsewhere in this Annual Report on Form 10-K. We expect that the launch of an AG Product or a generic version of Xyrem, or the approval and launch of other products that compete with Xyrem, could have a material adverse effect on our sales of Xyrem and on our business, financial condition, results of operations and growth prospects.
In February 2015, the FDA approved the current Xyrem REMS, which requires, among other things, that Xyrem be distributed through a single pharmacy. In the FDA’s letter approving the Xyrem REMS, the FDA stated that (i) the approval action should not be construed or understood as agreement with what the FDA stated was our position that dispensing through a single pharmacy is the only way to ensure that the benefits of Xyrem outweigh its risks, and that the FDA has continuing concerns that limiting the distribution of Xyrem to one pharmacy imposes burdens on patient access and the healthcare delivery system, and (ii) as with all REMS, the FDA intends to evaluate the Xyrem REMS on an ongoing basis and will require modifications as may be appropriate. We cannot predict whether the FDA will request, seek to require or ultimately require modifications to, or impose additional requirements on, the Xyrem REMS, including in connection with the submission of applications for new oxybate indications or products, or whether FDA will permit modifications to the Xyrem REMS that we consider warranted in connection with the submission of applications for new oxybate indications or products. Any such modifications required or rejected by the FDA could make it more difficult or expensive for us to distribute Xyrem, make distribution easier for sodium oxybate competitors, impair the safety profile of Xyrem, disrupt continuity of care for Xyrem patients and/or negatively affect sales of Xyrem.
In January 2017, the FDA announced approval of West-Ward’s ANDA and waived the shared REMS requirement, permitting West-Ward to use a separate REMS program from the Xyrem REMS, or the generic sodium oxybate REMS, on the condition that the generic sodium oxybate REMS be open to all future sponsors of ANDAs or NDAs for sodium oxybate products. This could potentially include future sodium oxybate products approved under a Section 505(b)(2) approval pathway. We cannot predict whether a company marketing a sodium oxybate product approved under Section 505(b)(2) would be required or permitted to distribute its product through the generic sodium oxybate REMS or a separate REMS.
We were not involved in the development of the generic sodium oxybate REMS and were not consulted regarding any features of this REMS. A sodium oxybate distribution system that is less restrictive than the Xyrem REMS, such as the generic sodium oxybate REMS, which provides that generic sodium oxybate products could be distributed through multiple pharmacies, could increase the risks associated with sodium oxybate distribution. Any negative outcomes, including risks to the public, caused by or otherwise related to a separate sodium oxybate REMS, could have a significant negative impact in terms of product liability, public acceptance of Xyrem as a treatment for EDS and cataplexy in narcolepsy, and prescribers’ willingness to prescribe, and patients’ willingness to take, Xyrem, as patients, consumers and others may not differentiate generic sodium oxybate from Xyrem or differentiate between the different REMS programs, any of which could have a material adverse effect on our Xyrem business.
We may face pressure to modify the Xyrem REMS or to license or share intellectual property pertinent to the Xyrem REMS, including proprietary data required for the safe distribution of sodium oxybate, in connection with the FDA’s approval of the generic sodium oxybate REMS or otherwise. We continue to evaluate potential challenges based on the FDA’s waiver of
92
the requirement for a single, shared system REMS in connection with the approvals of the ANDAs, including whether the FDA’s waiver decision meets the conditions for such a waiver under applicable law. We cannot predict whether or when we may pursue any such challenges or whether any such challenges would be successful.
For further discussion regarding the risks associated with Xyrem, see the risk factors under the headings “Risks Related to Xyrem and the Significant Impact of Xyrem Sales,” “
We face substantial competition from other companies, including companies with greater resources, including larger sales organizations and more experience working with large and diverse product portfolios, than we have
” and “Risks Related to Our Intellectual Property” in Part I, Item 1A of this Annual Report on Form 10-K.
Erwinaze/Erwinase.
Sales of our second largest product, Erwinaze/Erwinase (which we refer to in this report as Erwinaze unless otherwise indicated or the context otherwise requires), accounted for
12%
of our net product sales in
2017
and
14%
of our net product sales in
2016
. A significant challenge to our ability to maintain current sales levels and to increase sales is our extremely limited inventory of Erwinaze, past and continuing supply disruptions and our need to minimize or avoid additional supply disruptions due to capacity constraints, production delays, quality or regulatory challenges and other manufacturing difficulties. Erwinaze is licensed from and manufactured by a single source, Porton Biopharma Limited, or PBL.
In January 2017, the FDA issued a warning letter to PBL indicating that it was not satisfied with PBL’s responses to the FDA Form 483 issued to PBL in March 2016 and citing significant violations of the FDA’s current Good Manufacturing Practices, or cGMP, for finished pharmaceuticals and significant deviations from cGMP for APIs. In March 2017, PBL filed a response to the warning letter with the FDA. PBL continues to address the issues identified by the FDA in the warning letter. Following a site inspection of PBL by the UK Medicines and Healthcare Products Regulatory Agency, or MHRA, in December 2017, MHRA issued an inspection report listing several major findings, including major deficiencies and failures by PBL to comply with cGMP. In January 2018, PBL filed a response to the report with the MHRA. We cannot predict if or when PBL will correct the violations and deviations to the satisfaction of the FDA and MHRA or whether the FDA and MHRA will be satisfied with PBL’s responses. Any failure by PBL to respond to the satisfaction of the FDA or MHRA could result in enforcement actions by the FDA or MHRA, including the FDA refusing admission of Erwinaze into the U.S. Any of these actions could have a material adverse effect on our sales of, and revenues from, Erwinaze and limit our future maintenance and potential growth of the market for this product.
Moreover, the current manufacturing capacity for Erwinaze is completely absorbed by demand for the product. As a consequence of constrained manufacturing capacity, we have had an extremely limited or no ability to build product inventory levels that can be used to absorb supply disruptions resulting from quality, regulatory or other issues. We have experienced product quality, manufacturing and inventory challenges that have resulted, and may continue to result from time to time, in disruptions in our ability to supply certain markets and have caused, and may in the future cause, us to implement batch-specific, modified product use instructions. Most recently, we have been experiencing temporary supply disruptions in the first quarter of 2018 in the U.S. and other countries. We cannot predict whether the required remediation activities in connection with the FDA warning letter or the MHRA report will further strain manufacturing capacity and adversely affect Erwinaze supply. As capacity constraints and supply disruptions continue, whether as a result of continued quality, manufacturing or regulatory issues or otherwise, we will be unable to build a desired excess level of product inventory, our ability to supply the market may continue to be compromised and physicians’ decisions to use Erwinaze have been, and in the future may continue to be, negatively impacted. If we fail to obtain a sufficient supply of Erwinaze, our sales of and revenues from Erwinaze, our future maintenance and potential growth of the market for this product, and our business, financial condition, results of operations and growth prospects could be materially adversely affected.
In addition, our agreement with PBL, including our license, expires in December 2020, subject to five-year extensions unless terminated by either party in writing by December 2018. We cannot predict whether the term of the agreement will be extended or, if extended, the terms of any such extension.
Our ability to successfully maintain sales of Erwinaze is subject to a number of other challenges, including the development of new asparaginase treatments or treatment protocols and potential competition from future biosimilar products. For further discussion of these and other risks and uncertainties associated with Erwinaze, see the risk factors set forth in “Risk Factors in Part I, Item 1A of this Annual Report on Form 10-K.
Defitelio/defibrotide.
Sales of Defitelio/defibrotide were
8%
of our net product sales for the year ended December 31,
2017
and
7%
of our net product sales for the year ended December 31,
2016
. We seek to increase sales of Defitelio through sales and marketing activities. However, our ability to maintain and grow sales and to realize the anticipated benefits from our investment in Defitelio is subject to a number of risks and uncertainties, including continued acceptance by hospital pharmacy and therapeutics committees in the U.S., the continued availability of favorable pricing and adequate coverage and reimbursement, the limited experience of, and need to educate, U.S. physicians in recognizing, diagnosing and treating VOD, and the limited size of the population of VOD patients who are indicated for treatment with Defitelio. If sales of Defitelio do
93
not reach the levels we expect, our anticipated revenue from the product will be negatively affected and our business, financial condition, results of operations and growth prospects could be materially adversely affected.
For further discussion of these and other risks and uncertainties associated with Defitelio, see the risk factors set forth in “Risks Factors” in Item 1, Part 1A of this Annual Report on Form 10-K.
Vyxeos
. We made a significant investment in Vyxeos through the acquisition of Celator Pharmaceuticals, Inc., or the Celator Acquisition. In August 2017, the FDA approved our NDA for Vyxeos for the treatment of adults with newly-diagnosed t-AML or AML-MRC. We launched and began shipping Vyxeos in the U.S. in August 2017, and our commercial launch in the U.S. is still at an early stage. Sales of Vyxeos were
2%
of our total net product sales for the year ended December 31,
2017
. In the fourth quarter of 2017, we submitted an MAA for Vyxeos in Europe for the treatment of t-AML or AML-MRC. We expect to launch Vyxeos, if approved, in the EU on a rolling basis shortly following approval, which could occur as early as mid-2018. We cannot predict whether we will be able to obtain approval in Europe in a timely manner, or at all.
Our ability to realize the anticipated benefits from our investment in Vyxeos is subject to a number of additional risks and uncertainties, including potential delays or problems in the supply or manufacture of Vyxeos, acceptance by hospital pharmacy and therapeutics committees in the U.S., the availability of adequate coverage, pricing and reimbursement approvals and potential competition from products in development. If sales of Vyxeos do not reach the levels we expect, or we are unable to obtain regulatory approval for Vyxeos in Europe in a timely manner, or at all, our anticipated revenue from the product will be negatively affected, which could have a material adverse effect on our business, financial condition, results of operations and growth prospects. For further discussion of these and other risks and uncertainties associated with Vyxeos, see the risk factors set forth in “Risks Factors” in Item 1, Part 1A of this Annual Report on Form 10-K.
Solriamfetol.
In the fourth quarter of 2017, we submitted an NDA to the FDA to seek approval for solriamfetol in the treatment of ES associated with OSA and narcolepsy. We cannot predict whether our NDA will be approved by the FDA in a timely manner, or at all. Our ability to realize the anticipated benefits from an approved solriamfetol product and our investment in solriamfetol is subject to a number of risks and uncertainties, including, among other things, the outcome of DEA scheduling review, which will need to be completed after NDA approval, if any, but before commercial launch, market acceptance for an approved solriamfetol product, potential competition from other products in development and the availability of adequate pricing, coverage and reimbursement by government programs and third party payors. For further discussion of these and other risks and uncertainties associated with solriamfetol, see the risk factors set forth in “Risks Factors” in Item 1, Part 1A of this Annual Report on Form 10-K.
Other Challenges and Risks
We anticipate that we will continue to face a number of other challenges and risks to our business and our ability to execute our strategy in 2018 and beyond. Some of these challenges and risks are specific to our business, and others are common to companies in the pharmaceutical industry with development and commercial operations.
Drug pricing by pharmaceutical companies is currently, and is expected to continue to be, under close scrutiny, including with respect to companies that have increased the price of products after acquiring those products from other companies. Several states have recently passed laws aimed at increasing transparency relating to drug pricing, and other states may do so in the future. Both the U.S. House of Representatives and the U.S. Senate have conducted several hearings with respect to pharmaceutical drug pricing practices, including in connection with the investigation of specific price increases by several pharmaceutical companies. Moreover, REMS and the improper use of REMS as a means of improperly blocking or delaying competition for branded pharmaceutical products has increasingly drawn public scrutiny from Congress, the Federal Trade Commission, or FTC, and the FDA. Congress, for example, has introduced proposed legislation aimed at preventing companies from using REMS and other restricted distribution programs as a means to deny potential competitors access to product samples needed for bioequivalence testing. The FDA has stated that it will seek to coordinate with the FTC in identifying and publicizing practices the FTC finds to be anticompetitive and has further stated that the FDA has concerns related to the role of REMS programs in delaying approval of generic products. If we become the subject of any government investigation with respect to our drug pricing or other business practices, including as they relate to the Xyrem REMS, we could incur significant expense and could be distracted from operation of our business and execution of our strategy.
In May and October 2016 and in February 2017, we received subpoenas from the U.S. Attorney’s Office for the District of Massachusetts requesting documents related to our support of 501(c)(3) organizations that provide financial assistance to Medicare patients and documents concerning the provision of financial assistance to Medicare patients taking drugs sold by us. We are cooperating with the government’s investigation of our support of charitable organizations, and the outcome of this investigation could include an enforcement action or a settlement with the federal government. The Office of the Inspector General has established guidelines that permit pharmaceutical manufacturers to make donations to charitable organizations who provide co-pay assistance to Medicare patients, provided that such organizations, among other things, are
bona fide
charities, are entirely independent of and not controlled by the manufacturer, provide aid to applicants on a first-come basis according to consistent financial criteria, and do not link aid to use of a donor’s product. If we or our vendors or donation recipients are
94
deemed to fail to comply with relevant laws, regulations or evolving government guidance in the operation of these programs, such facts could be used as the basis for an enforcement action by the federal government. If the federal government were to file an enforcement action against us as a result of the investigation and could establish the elements of a violation of relevant laws, we could be subject to damages, fines and penalties, which could be substantial, along with other criminal, civil or administrative sanctions. Any settlement with the federal government could result in substantial payments and entry into a corporate integrity agreement, which would impose costs and burdens on the operation of our business. For more information, see the risk factors under the headings “
Changes in healthcare law and implementing regulations, including those based on recently enacted legislation, as well as changes in healthcare policy, may impact our business in ways that we cannot currently predict, and these changes could have a material adverse effect on our business and financial condition
” and “
We are subject to significant ongoing regulatory obligations and oversight, which may result in significant additional expense and limit our ability to commercialize our products
” in Part I, Item 1A of this Annual Report on Form 10-K.
Other key challenges and risks that we face include risks and uncertainties related to:
|
•
|
the challenges of protecting and enhancing our intellectual property rights;
|
|
•
|
the challenges of achieving and maintaining commercial success of our products;
|
|
•
|
delays or problems in the supply or manufacture of our products and product candidates, particularly with respect to certain products as to which we maintain limited inventories, our dependence on single source suppliers for most of our products, product candidates and APIs, and the requirement that we and our product suppliers be qualified by the FDA to manufacture product and comply with applicable manufacturing regulations;
|
|
•
|
the need to obtain and maintain appropriate pricing and reimbursement for our products in an increasingly challenging environment due to, among other things, the attention being paid to healthcare cost containment and pharmaceutical pricing in the U.S. and worldwide, including the need to obtain and maintain reimbursement for Xyrem in the U.S. in an environment in which we are subject to increasingly restrictive conditions for reimbursement required by government programs and third party payors;
|
|
•
|
our ability to identify and acquire, in-license or develop additional products or product candidates to grow our business;
|
|
•
|
the challenges of compliance with the requirements of the FDA, the DEA and comparable non-U.S. regulatory agencies, including with respect to product labeling, requirements for distribution, obtaining sufficient DEA quotas where needed, marketing and promotional activities, patient assistance programs, adverse event reporting and product recalls or withdrawals;
|
|
•
|
the difficulty and uncertainty of pharmaceutical product development, including the timing thereof, and the uncertainty of clinical success, such as the risk that results from preclinical studies and/or early clinical trials may not be predictive of results obtained in later and larger clinical trials planned or anticipated to be conducted for our product candidates;
|
|
•
|
the inherent uncertainty associated with the regulatory approval process, especially as we continue to increase investment in our product pipeline development projects and undertake multiple planned regulatory submissions for our product candidates;
|
|
•
|
the risks associated with business combination or product or product candidate acquisition transactions, such as the challenges inherent in the integration of acquired businesses with our historical business, the increase in geographic dispersion among our centers of operation and the risks that we may acquire unanticipated liabilities along with acquired businesses or otherwise fail to realize the anticipated benefits (commercial or otherwise) from such transactions; and
|
|
•
|
possible restrictions on our ability and flexibility to pursue certain future opportunities as a result of our substantial outstanding debt obligations.
|
Any of these risks and uncertainties could have a material adverse effect on our business, financial condition, results of operations and growth prospects. All of these risks are discussed in greater detail, along with other risks, in “Risk Factors” in Part I, Item 1A of this Annual Report on Form 10-K.
95
Results of Operations
The following table presents revenues and expenses for the years ended
December 31, 2017
,
2016
and
2015
(in thousands except percentages):
|
2017
|
Change
|
2016 (1)
|
Change
|
2015
|
|||||||||||||
|
Product sales, net
|
$
|
1,601,399
|
|
8
|
%
|
$
|
1,477,261
|
|
12
|
%
|
$
|
1,316,819
|
|
||||
|
Royalties and contract revenues
|
17,294
|
|
61
|
%
|
10,712
|
|
34
|
%
|
7,984
|
|
|||||||
|
Cost of product sales (excluding amortization and impairment of intangible assets)
|
110,188
|
|
5
|
%
|
105,386
|
|
3
|
%
|
102,526
|
|
|||||||
|
Selling, general and administrative
|
544,156
|
|
8
|
%
|
502,892
|
|
12
|
%
|
449,119
|
|
|||||||
|
Research and development
|
198,442
|
|
22
|
%
|
162,297
|
|
20
|
%
|
135,253
|
|
|||||||
|
Acquired in-process research and development
|
85,000
|
|
258
|
%
|
23,750
|
|
N/A(2)
|
|
—
|
|
|||||||
|
Intangible asset amortization
|
152,065
|
|
49
|
%
|
101,994
|
|
4
|
%
|
98,162
|
|
|||||||
|
Impairment charges
|
—
|
|
N/A(2)
|
|
—
|
|
N/A(2)
|
|
31,523
|
|
|||||||
|
Interest expense, net
|
77,756
|
|
26
|
%
|
61,942
|
|
9
|
%
|
56,917
|
|
|||||||
|
Foreign exchange loss (gain)
|
9,969
|
|
(396
|
)%
|
(3,372
|
)
|
133
|
%
|
(1,445
|
)
|
|||||||
|
Loss on extinguishment and modification of debt
|
—
|
|
N/A(2)
|
|
638
|
|
(96
|
)%
|
16,815
|
|
|||||||
|
Income tax provision (benefit)
|
(47,740
|
)
|
(135
|
)%
|
135,236
|
|
27
|
%
|
106,399
|
|
|||||||
|
Equity in loss of investees
|
1,009
|
|
166
|
%
|
379
|
|
N/A(2)
|
|
—
|
|
|||||||
|
Net loss attributable to noncontrolling interests
|
—
|
|
N/A(2)
|
|
—
|
|
N/A(2)
|
|
(1
|
)
|
|||||||
_________________________
|
(1)
|
Our financial results include the financial results of the historical Celator business since the closing of the Celator Acquisition on July 12, 2016.
|
|
(2)
|
Comparison to prior period is not meaningful.
|
Revenues
The following table presents product sales, royalties and contract revenues, and total revenues for the years ended
December 31, 2017
,
2016
and
2015
(in thousands except percentages):
|
|
2017
|
Change
|
2016
|
Change
|
2015
|
||||||||||||
|
Xyrem
|
$
|
1,186,699
|
|
7
|
%
|
$
|
1,107,616
|
|
16
|
%
|
$
|
955,187
|
|
||||
|
Erwinaze/Erwinase
|
197,340
|
|
(2
|
)%
|
200,678
|
|
(1
|
)%
|
203,261
|
|
|||||||
|
Defitelio/defibrotide
|
133,650
|
|
23
|
%
|
108,952
|
|
54
|
%
|
70,731
|
|
|||||||
|
Vyxeos
|
33,790
|
|
N/A(1)
|
|
—
|
|
N/A(1)
|
|
—
|
|
|||||||
|
Prialt® (ziconotide) intrathecal infusion
|
27,361
|
|
(6
|
)%
|
29,120
|
|
10
|
%
|
26,440
|
|
|||||||
|
Other
|
22,559
|
|
(27
|
)%
|
30,895
|
|
(50
|
)%
|
61,200
|
|
|||||||
|
Product sales, net
|
1,601,399
|
|
8
|
%
|
1,477,261
|
|
12
|
%
|
1,316,819
|
|
|||||||
|
Royalties and contract revenues
|
17,294
|
|
61
|
%
|
10,712
|
|
34
|
%
|
7,984
|
|
|||||||
|
Total revenues
|
$
|
1,618,693
|
|
9
|
%
|
$
|
1,487,973
|
|
12
|
%
|
$
|
1,324,803
|
|
||||
_________________________
|
(1)
|
Comparison to prior period is not meaningful.
|
Product Sales, Net
Xyrem product sales increased by
7%
in 2017 compared to 2016 primarily due to higher average net selling prices partially offset by higher gross to net deductions. Sales volumes in 2017 were consistent with 2016; sales growth was impacted by payer mix throughout 2017 and by operational changes that delayed some prescription fulfillment in the second half of 2017. Xyrem product sales increased by
16%
in 2016 compared to 2015 primarily due to higher average net selling prices and, to a lesser extent, an increase in sales volume. Price increases were instituted in January and July 2017 and February 2016. Xyrem product sales volumes increased by
6%
in 2016 compared to 2015. The sales volume increase in 2016 was driven by an increase in the average number of patients on Xyrem, which includes new patients, patients who restarted Xyrem therapy and active patients who remained on Xyrem therapy. Erwinaze product sales decreased slightly in 2017 and in 2016 compared to the immediately preceding years primarily due to lower sales volume, partially offset by price increases instituted in November
96
2017, January 2016 and July 2015. The Erwinaze sales volume decrease in both years was primarily due to supply interruptions, which resulted in fluctuations in inventory levels and temporary disruptions to the company’s ability to supply certain markets. Defitelio/defibrotide product sales increased in 2017 and in 2016 compared to the immediately preceding years, primarily due to the launch of Defitelio in the U.S. in April 2016 and higher net sales outside the U.S primarily due to higher sales volume. Vyxeos product sales in 2017 were
$33.8 million
following its launch in August 2017. Prialt product sales decreased in 2017 compared to 2016, primarily due to a decrease in sales volume. Prialt product sales increased in 2016 compared to 2015, primarily due to an increase in sales volume. Other product sales decreased in 2017 and in 2016 compared to the immediately preceding years, primarily due to a decrease in sales of our psychiatry products due to generic competition. In addition, other product sales decreased in 2016 compared to 2015, partly due to our disposition, in March 2015, of certain products and the related business that we originally acquired in the EUSA Acquisition. We expect total product sales will increase in 2018 over 2017, primarily due to anticipated growth in sales of Xyrem, Vyxeos and Defitelio, partially offset by decreases in sales of certain other products.
Royalties and Contract Revenues
Royalties and contract revenues increased by
$6.6 million
in 2017 compared to 2016, primarily due to higher contract revenues from out-licensing agreements. Royalties and contract revenues increased by
$2.7 million
in 2016 compared to 2015, primarily due to sales-based milestone revenue of
$1.0 million
recognized in 2016 and higher sales of out-licensed products. We do not expect royalties and contract revenues to change materially in 2018 compared to 2017.
Cost of Product Sales
Cost of product sales increased in 2017 and in 2016 compared to the immediately preceding years, primarily due to changes in product mix and an increase in net product sales. Gross margins as a percentage of net product sales were
93.1%
,
92.9%
and
92.2%
in 2017, 2016 and 2015, respectively. The increase in the gross margin percentage in 2017 and in 2016 compared to the immediately preceding years was primarily due to changes in product mix. We expect that our gross margin as a percentage of net product sales will not change materially in 2018 compared to 2017.
Selling, General and Administrative Expenses
Selling, general and administrative expenses increased in 2017 compared to 2016, primarily due to an increase in compensation-related expenses of $39.9 million, primarily driven by higher headcount, and an increase in other expenses related to the expansion and support of our business, including expenses related to the launch of Vyxeos in the U.S of $6.4 million, partially offset by the impact in 2016 of transaction and integration expenses related to the Celator Acquisition of $13.1 million and a one-time contract termination fee of $11.6 million to eliminate a potential future royalty obligation related to Vyxeos. Selling, general and administrative expenses increased in 2016 compared to 2015, primarily due to an increase of $22.7 million in compensation-related expenses driven by higher headcount, transaction and integration expenses related to the Celator Acquisition of $13.1 million, a one-time contract termination fee of $11.6 million to eliminate a potential future royalty obligation related to Vyxeos, an increase of $8.5 million in legal fees and expenses related to certain legal proceedings and restructuring, and an increase in other expenses related to the expansion and support of our business, including expenses related to the launch of Defitelio in the U.S., partially offset by a one-time charge of $18.0 million in 2015 for settlement of a contract claim liability. We expect selling, general and administrative expenses in 2018 to increase compared to 2017, primarily due to an increase in compensation-related expenses driven by higher headcount and other expenses related to the expansion and support of our business and increase in expenses related to the preparation for the potential U.S. commercial launch of solriamfetol for the treatment of ES in OSA and in narcolepsy, continuation of the U.S launch of Vyxeos and the potential EU commercial launch of Vyxeos.
Research and Development Expenses
Research and development expenses consist primarily of costs related to clinical studies and outside services, personnel expenses, milestone payments and other research and development costs. Clinical study and outside services costs relate primarily to services performed by clinical research organizations, materials and supplies, and other third party fees. Personnel expenses relate primarily to salaries, benefits and share-based compensation. Other research and development expenses primarily include overhead allocations consisting of various support and facilities-related costs. We do not track fully-burdened research and development expenses on a project-by-project basis. We manage our research and development expenses by identifying the research and development activities that we anticipate will be performed during a given period and then prioritizing efforts based on our assessment of which development activities are important to our business and have a reasonable probability of success, and by dynamically allocating resources accordingly. We also continually review our development pipeline projects and the status of their development and, as necessary, reallocate resources among our development pipeline projects that we believe will best support the future growth of our business.
97
The following table provides a breakout of our research and development expenses by major categories of expense (in thousands):
|
|
Year Ended December 31,
|
||||||||||
|
|
2017
|
2016
|
2015
|
||||||||
|
Clinical studies and outside services
|
$
|
93,317
|
|
$
|
100,165
|
|
$
|
63,079
|
|
||
|
Personnel expenses
|
63,941
|
|
47,969
|
|
39,515
|
|
|||||
|
Milestone expenses
|
19,500
|
|
750
|
|
25,000
|
|
|||||
|
Other
|
21,684
|
|
13,413
|
|
7,659
|
|
|||||
|
Total
|
$
|
198,442
|
|
$
|
162,297
|
|
$
|
135,253
|
|
||
Research and development expenses increased by
$36.1 million
in 2017 compared to 2016. Clinical studies and outside services costs decreased in 2017 compared to 2016 primarily due to lower clinical trial costs for solriamfetol studies for ES associated with OSA and with narcolepsy following the completion of three Phase 3 clinical trials, partially offset by an increase in expenses related to our other ongoing clinical development programs and higher costs in respect of regulatory activities. Personnel expenses increased by
$16.0 million
in 2017 compared to 2016, primarily driven by increased headcount in support of our development programs. Milestone expense in 2017 related to payments made under the license and option agreement with Pfenex, which we entered into in July 2016 and amended in December 2017, for worldwide rights to develop and commercialize multiple early-stage hematology product candidates. Research and development expenses increased by
$27.0 million
in 2016 compared to 2015, primarily due to increased clinical studies and outside services costs related to three Phase 3 clinical trials for solriamfetol and development of other sleep product candidates and expenses related to initiation of a rolling submission of an NDA for Vyxeos. Personnel expenses increased by
$8.5 million
in 2016 compared to 2015, primarily due to salary and benefit-related expenses (including share-based compensation) primarily driven by increased headcount in support of our development programs and, to a lesser extent, increased headcount due to the Celator Acquisition.
For 2018 and beyond, we expect that our research and development expenses will continue to increase from historical levels, particularly as we prepare for a number of anticipated regulatory submissions, initiate additional clinical trials and related development work and potentially acquire rights to additional product candidates. A discussion of the risks and uncertainties with respect to our research and development activities, including completing the development of and regulatory submissions for our product candidates, and the consequences to our business, financial position and growth prospects can be found in “Risk Factors” in Part I, Item 1A of this Annual Report on Form 10-K.
Acquired In-Process Research and Development
In 2017, acquired in-process research and development, or IPR&D, expense was primarily related to an upfront payment of $75.0 million in connection with a collaboration and option agreement with ImmunoGen to acquire rights to opt into exclusive, worldwide licenses to develop and commercialize two early-stage, hematology-related ADC programs, as well as an additional program to be designated during the term of the agreement.
In 2016, acquired IPR&D expense was related to upfront and option payments. In March 2016 we obtained intellectual property and know-how related to recombinant crisantaspase for a payment of
$8.8 million
. In July 2016 we made upfront and option payments of
$15.0 million
to Pfenex.
Intangible Asset Amortization
Intangible asset amortization increased in 2017 compared to 2016 primarily due to the commencement of amortization of the Vyxeos intangible asset upon FDA approval in August 2017. Intangible asset amortization increased in 2016 compared to 2015, primarily due to the commencement of amortization of the Defitelio U.S. intangible asset upon FDA approval in March 2016, partially offset by the cessation of amortization of certain intangible assets that were fully amortized in 2015 and the impact of foreign exchange rates on euro-denominated assets. We expect intangible asset amortization to increase in 2018 compared to 2017 due to the full year amortization of the Vyxeos intangible asset.
Impairment Charges
In 2015, we recorded an impairment charge of $31.5 million related to our acquired IPR&D asset as a result of our decision to terminate a pivotal Phase 2 clinical trial of JZP-416.
Interest Expense, Net
In July 2016, we entered into the amended credit agreement providing for a revolving credit facility of $1.25 billion, of which $1.0 billion was drawn to partially fund the Celator Acquisition, and a $750.0 million term loan facility. As of
December 31, 2017
,
$676.8 million
principal amount of the term loan remained outstanding. In the third quarter of 2017, we issued $575.0 million principal amount of 2024 Notes, which remained outstanding at
December 31, 2017
. We used the net proceeds from the issuance of the 2024 Notes primarily to repay outstanding borrowings under the revolving credit facility.
98
Interest expense, net increased by
$15.8 million
in 2017 compared to 2016, primarily due to the increase in our average debt balance and higher interest rates in 2017. Interest expense, net increased by
$5.0 million
in 2016 compared to 2015, primarily due to the increase in our average debt balance and increased interest rates on borrowings under the amended credit agreement as compared to the 2015 credit agreement. We expect interest expense, net will be higher in 2018 compared to 2017 primarily due to the amortization of the debt discount on the 2024 Notes, partially offset by higher interest income.
Foreign Exchange Loss (Gain)
The foreign exchange loss (gain) is primarily related to the translation of euro-denominated net monetary liabilities, primarily intercompany balances, held by subsidiaries with a U.S. dollar functional currency.
Loss on Extinguishment and Modification of Debt
In 2016, we recorded a loss of $0.6 million in connection with our entry into the amended credit agreement in July 2016, which was primarily comprised of new third party fees associated with the modified debt. In 2015, we recorded a loss of $16.8 million in connection with the refinancing of our term loans and revolving credit facility in June 2015, which was comprised of
$16.0 million
related to the expensing of unamortized deferred financing costs and unamortized original issue discount associated with extinguished debt and
$0.8 million
related to new third party fees associated with the modification of existing debt.
Income Tax Provision (Benefit)
Our income tax benefit was
$47.7 million
in 2017, and our income tax provision was
$135.2 million
and
$106.4 million
in 2016 and 2015, respectively. The income tax benefit in 2017 included a benefit of
$148.8 million
relating to the impact of the recently enacted U.S. Tax Act. The effective tax rates for 2017, 2016 and 2015 were
(10.8)%
,
25.4%
and
24.4%
, respectively. The effective tax rate for 2017 excluding the impact of the U.S. Tax Act was
22.9%
. The effective tax rates for 2017 (excluding the impact of the U.S. Tax Act), 2016 and 2015 were higher than the Irish statutory rate of
12.5%
, primarily due to income taxable at a rate higher than the Irish statutory rate, unrecognized tax benefits, and various expenses not deductible for income tax purposes, partially offset by originating tax credits, the release of reserves related to unrecognized tax benefits upon the expiration of a statute of limitation and the release of a valuation allowance held against certain foreign net operating losses or NOLs. The decrease in the effective tax rate in 2017 (excluding the impact of the U.S. Tax Act) compared to 2016 was primarily due to the release of a valuation allowance held against certain foreign NOLs and the release of reserves related to unrecognized tax benefits upon the expiration of a statute of limitation, partially offset by a reduction in deductions available in relation to subsidiary equity. The increase in the effective tax rate in 2016 compared to 2015 was primarily due to a decrease in the impact of the reduction in tax rates in certain jurisdictions and a decrease in originating tax credits, partially offset by changes in income mix among the various jurisdictions in which we operate. We expect that the U.S. Tax Act will have a modest positive effect on our effective tax rate in 2018.
Equity in Loss of Investees
Equity in loss of investees relates to our share in the net loss of companies in which we have made investments accounted for under the equity method of accounting.
Net Loss Attributable to Noncontrolling Interests
Net loss attributable to noncontrolling interests relates to the portion of the net loss of Gentium not attributable, directly or indirectly, to our ownership interest. During 2015, we acquired the remaining noncontrolling interests in Gentium.
Liquidity and Capital Resources
As of
December 31, 2017
, we had cash, cash equivalents and investments of
$601.0 million
, borrowing availability under our revolving credit facility of
$1.25 billion
and long-term debt principal balance of
$1.8 billion
. Our long-term debt included
$676.8 million
aggregate principal amount term loan,
$575.0 million
principal amount of the 2021 Notes and
$575.0 million
principal amount of the 2024 Notes. During 2017, 2016 and 2015, we generated cash flows from operations of
$693.1 million
,
$592.4 million
and
$531.9 million
, respectively, and we expect to continue to generate positive cash flow from operations.
In the third quarter of 2017, we completed a private placement of the 2024 Notes resulting in net proceeds to us, after debt issuance costs, of
$559.4 million
. We used the net proceeds from the issuance of the 2024 Notes to repay
$500.0 million
in outstanding borrowings under our revolving credit facility and to pay related fees and expenses and the remainder of the net proceeds for general corporate purposes. As of December 31, 2017, we had no outstanding borrowings under our revolving credit facility.
We believe that our existing cash balances, cash we expect to generate from operations and funds available under our revolving credit facility will be sufficient to fund our operations and to meet our existing obligations for the foreseeable future.
99
The adequacy of our cash resources depends on many assumptions, including primarily our assumptions with respect to product sales and expenses, as well as the other factors set forth in “Risk Factors” in Part I, Item 1A of this Annual Report on Form 10-K under the headings “Risks Related to Xyrem and the Significant Impact of Xyrem Sales” and
“To continue to grow our business, we will need to commit substantial resources, which could result in future losses or otherwise limit our opportunities or affect our ability to operate our business.”
Our assumptions may prove to be wrong or other factors may adversely affect our business, and as a result we could exhaust or significantly decrease our available cash resources, and we may not be able to generate sufficient cash to service our debt obligations which could, among other things, force us to raise additional funds and/or force us to reduce our expenses, either of which could have a material adverse effect on our business.
To continue to grow our business over the longer term, we plan to commit substantial resources to product acquisition and in-licensing, product development, clinical trials of product candidates and expansion of our commercial, manufacturing and other operations. In this regard, we have evaluated and expect to continue to evaluate a wide array of strategic transactions as part of our strategy to acquire or in-license and develop additional products and product candidates. Acquisition opportunities that we pursue could materially affect our liquidity and capital resources and may require us to incur additional indebtedness, seek equity capital or both. In addition, we may pursue new operations or continue the expansion of our existing operations. Accordingly, we expect to continue to opportunistically seek access to additional capital to license or acquire additional products, product candidates or companies to expand our operations or for general corporate purposes. Raising additional capital could be accomplished through one or more public or private debt or equity financings, collaborations or partnering arrangements. Any equity financing would be dilutive to our shareholders, and the consent of the lenders under the amended credit agreement could be required for certain financings.
In May 2013, our board of directors authorized a share repurchase program pursuant to which we were authorized to repurchase a number of ordinary shares having an aggregate repurchase price of up to
$200 million
, exclusive of any brokerage commissions. In August 2015, we completed repurchases under the May 2013 share repurchase program. In November 2015, our board of directors authorized another share repurchase program pursuant to which we were authorized to repurchase a number of ordinary shares having an aggregate purchase price of up to
$300 million
, exclusive of any brokerage commissions. In September 2016, we completed repurchases under the November 2015 share repurchase program. In November 2016, our board of directors authorized a new share repurchase program pursuant to which we are authorized to repurchase a number of ordinary shares having an aggregate purchase price of up to
$300 million
, exclusive of any brokerage commissions. Under this program, which has no expiration date, we may repurchase ordinary shares from time to time on the open market. The timing and amount of repurchases will depend on a variety of factors, including the price of our ordinary shares, alternative investment opportunities, restrictions under the amended credit agreement, corporate and regulatory requirements and market conditions. The new share repurchase program may be modified, suspended or discontinued at any time without prior notice. In
2017
, we spent a total of
$98.8 million
to purchase
0.7 million
of our ordinary shares under the share repurchase program at an average total purchase price, including commissions, of
$140.34
per share. All ordinary shares repurchased were canceled. As of
December 31, 2017
, the remaining amount authorized under the November 2016 share repurchase program was
$182.7 million
.
The following table shows a summary of our cash flows for the periods indicated (in thousands):
|
|
Year Ended December 31,
|
||||||||||
|
|
2017
|
2016
|
2015
|
||||||||
|
Net cash provided by operating activities
|
$
|
693,087
|
|
$
|
592,391
|
|
$
|
531,943
|
|
||
|
Net cash used in investing activities
|
(268,950
|
)
|
(1,751,155
|
)
|
(2,255
|
)
|
|||||
|
Net cash provided by (used in) financing activities
|
(409,111
|
)
|
540,987
|
|
(214,323
|
)
|
|||||
|
Effect of exchange rates on cash and cash equivalents
|
5,046
|
|
(5,045
|
)
|
(10,622
|
)
|
|||||
|
Net increase (decrease) in cash and cash equivalents
|
$
|
20,072
|
|
$
|
(622,822
|
)
|
$
|
304,743
|
|
||
Net cash provided by operating activities of
$693.1 million
in 2017 related to net income of
$487.8 million
, adjusted for acquired IPR&D expense totaling
$85.0 million
and non-cash items of
$93.5 million
primarily related to intangible asset amortization, share-based compensation, amortization of debt discount and deferred financing costs and deferred income taxes. Net cash provided by operating activities of $592.4 million in 2016 related to net income of $396.8 million, adjusted for upfront and option payments totaling $23.8 million in connection with our acquisition of IPR&D assets and non-cash items of $192.7 million primarily related to intangible asset amortization, share-based compensation, amortization of debt discount and deferred financing costs and deferred income taxes. This was partially offset by $20.9 million of net cash outflow related to changes in operating assets and liabilities. Net cash provided by operating activities in 2015 related to net income of $329.5 million, adjusted for non-cash items of $201.4 million primarily related to intangible asset amortization, share-based compensation expense, impairment charges, amortization of debt discount and deferred financing costs and loss on extinguishment and modification of debt.
100
Net cash used in investing activities in 2017 primarily related to the net acquisition of investments of
$155.0 million
, upfront payments for acquired IPR&D of
$85.0 million
primarily related to a collaboration and option agreement with ImmunoGen and purchases of property and equipment of
$29.0 million
. Net cash used in investing activities in 2016 primarily related to the Celator Acquisition for $1.5 billion, a $150.0 million milestone payment to Sigma-Tau Pharmaceuticals, Inc. that was triggered by the FDA approval of Defitelio on March 30, 2016, net acquisition of investments of $65.3 million and upfront and option payments of $23.8 million to acquire IPR&D assets. Net cash used in investing activities in 2015 related to purchases of property and equipment of $36.0 million primarily related to the construction of a manufacturing and development facility in Ireland, partially offset by net proceeds of $33.7 million from the sale of certain products and the related business that we originally acquired as part of the EUSA Acquisition.
Net cash used in financing activities in 2017 primarily related to repayment of borrowings under our revolving credit facility of
$850.0 million
, repurchase of ordinary shares under our share repurchase program of
$98.8 million
, repayment of our term loan principal of
$36.1 million
and payment of employee withholding taxes of
$18.6 million
related to share-based awards, partially offset by net proceeds from issuance of debt of
$559.4 million
, proceeds from employee equity incentive and purchase plans of
$31.8 million
and proceeds from tenant improvement allowance on a build-to-suit lease of
$3.2 million
. Net cash provided by financing activities in 2016 primarily related to net proceeds from issuance of debt of $994.6 million and proceeds of $24.2 million from employee equity incentive and purchase plans, partially offset by $278.3 million used to repurchase our ordinary shares under our share repurchase program, $150.0 million and $28.3 million repayments of borrowings under our revolving credit facility and long-term debt, respectively, and payment of employee withholding taxes of $21.2 million related to share-based awards. Net cash used in financing activities in 2015 primarily related to repayments of long-term debt of $905.8 million primarily for the total principal amount of term loans outstanding under a previous credit agreement, repayment of $160.0 million of borrowings under the revolving credit facility provided for under the 2015 credit agreement, $61.6 million used to repurchase our ordinary shares under our previous and current share repurchase programs and payment of employee withholding taxes of $26.1 million related to share-based awards, partially offset by proceeds from borrowings totaling $898.6 million under the 2015 credit agreement and proceeds of $40.5 million from employee equity incentive and purchase plans.
Credit Agreement
On June 18, 2015, Jazz Pharmaceuticals plc, as guarantor, and certain of our wholly owned subsidiaries, as borrowers, entered into the 2015 credit agreement that provided for a
$750.0 million
principal amount term loan, which was drawn in full at closing, and a
$750.0 million
revolving credit facility, of which
$160.0 million
was drawn at closing and subsequently repaid. We used the proceeds from initial borrowings under the 2015 credit agreement to repay in full the
$893.1 million
principal amount of term loans outstanding under the previous credit agreement, and to pay related fees and expenses. The previous credit agreement was terminated upon repayment of the term loans outstanding thereunder.
On
July 12, 2016
, Jazz Pharmaceuticals plc, as guarantor, and certain of our wholly owned subsidiaries, as borrowers, entered into Amendment No. 1 to our 2015 credit agreement. The amended credit agreement provides for a revolving credit facility of
$1.25 billion
, which replaced the revolving credit facility of
$750.0 million
provided for under the 2015 credit agreement, and a
$750.0 million
term loan facility, of which
$676.8 million
principal amount was outstanding as of
December 31, 2017
. We used the proceeds of
$1.0 billion
of loans under the revolving credit facility, together with cash on hand, to fund the Celator Acquisition, and we expect to use the proceeds from future loans under the revolving credit facility, if any, for general corporate purposes, including corporate development activities. As of
December 31, 2017
, we did not have any outstanding borrowings under the revolving credit facility.
Under the amended credit agreement, the term loan matures on
July 12, 2021
and the revolving credit facility terminates, and any loans outstanding thereunder become due and payable, on
July 12, 2021
.
Borrowings under the amended credit agreement bear interest, at our option, at a rate equal to either (a) the LIBOR rate, plus an applicable margin ranging from
1.50%
to
2.25%
per annum, based upon our secured leverage ratio, or (b) the prime lending rate, plus an applicable margin ranging from
0.50%
to
1.25%
per annum, based upon our secured leverage ratio. The revolving credit facility has a commitment fee payable on the undrawn amount ranging from
0.25%
to
0.35%
per annum based upon our secured leverage ratio.
Jazz Pharmaceuticals plc and certain of our wholly owned subsidiaries are borrowers under the amended credit agreement. The borrowers’ obligations under the amended credit agreement and any hedging or cash management obligations entered into with a lender are guaranteed on a senior secured basis by Jazz Pharmaceuticals plc and certain of our subsidiaries (including the issuer of the 2024 Notes and the 2021 Notes, together referred to as the Exchangeable Senior Notes, as described below) and are secured by substantially all of Jazz Pharmaceuticals plc’s, the borrowers’ and the guarantor subsidiaries’ assets.
We may make voluntary prepayments of principal at any time without payment of a premium. We are required to make mandatory prepayments of the term loan (without payment of a premium) with (1) net cash proceeds from certain non-ordinary
101
course asset sales (subject to reinvestment rights and other exceptions), (2) net cash proceeds from issuances of debt (other than certain permitted debt), and (3) casualty proceeds and condemnation awards (subject to reinvestment rights and other exceptions).
Principal repayments of the term loan, which are due quarterly, began in December 2016 and are equal to
5.0%
per annum of the principal amount outstanding on
July 12, 2016
of
$721.9 million
during the first two years,
7.5%
per annum during the third year,
10.0%
per annum during the fourth year and
12.5%
per annum during the fifth year, with any remaining balance payable on the maturity date.
The amended credit agreement contains financial covenants that require Jazz Pharmaceuticals plc and its restricted subsidiaries to not (a) exceed a maximum secured net leverage ratio or (b) fall below a cash interest coverage ratio. As of
December 31, 2017
, we were in compliance with these financial covenants.
Exchangeable Senior Notes
2024 Notes.
In the third quarter of 2017, our wholly owned subsidiary Jazz Investments I Limited, completed a private placement of $575.0 million principal amount of 2024 Notes. We used the net proceeds from this offering to repay $500.0 million in outstanding loans under the revolving credit facility under the amended credit agreement and to pay related fees and expenses. We used the remainder of the net proceeds for general corporate purposes. The 2024 Notes are senior unsecured obligations of Jazz Investments I Limited and are fully and unconditionally guaranteed on a senior unsecured basis by Jazz Pharmaceuticals plc and will rank pari passu in right of payment with the existing 2021 Notes. Interest on the 2024 Notes is payable semi-annually in cash in arrears on February 15 and August 15 of each year, beginning on February 15, 2018, at a rate of 1.50% per year. In certain circumstances, we may be required to pay additional amounts as a result of any applicable tax withholding or deductions required in respect of payments on the 2024 Notes. The 2024 Notes mature on August 15, 2024, unless earlier exchanged, repurchased or redeemed.
The holders of the 2024 Notes have the ability to require us to repurchase all or a portion of their 2024 Notes for cash in the event we undergo certain fundamental changes, such as specified change of control transactions, our liquidation or dissolution or the delisting of our ordinary shares from The NASDAQ Global Select Market. Prior to August 15, 2024, we may redeem the 2024 Notes, in whole but not in part, subject to compliance with certain conditions, if we have, or on the next interest payment date would, become obligated to pay to the holder of any 2024 Notes additional amounts as a result of certain tax-related events. We also may redeem the 2024 Notes on or after August 20, 2021, in whole or in part, if the last reported sale price per ordinary share has been at least 130% of the exchange price then in effect for at least 20 trading days (whether or not consecutive) during any 30 consecutive trading day period ending on, and including, the trading day immediately preceding the date on which we provide the notice of redemption.
The 2024 Notes are exchangeable at an initial exchange rate of 4.5659 ordinary shares per $1,000 principal amount of 2024 Notes, which is equivalent to an initial exchange price of approximately $219.02 per ordinary share. Upon exchange, the 2024 Notes may be settled in cash, ordinary shares or a combination of cash and ordinary shares, at our election. Our intent and policy is to settle the principal amount of the 2024 Notes in cash upon exchange. The exchange rate will be subject to adjustment in some events but will not be adjusted for any accrued and unpaid interest. In addition, following certain make-whole fundamental changes occurring prior to the maturity date of the 2024 Notes or upon our issuance of a notice of redemption, we will in certain circumstances increase the exchange rate for holders of the 2024 Notes who elect to exchange their 2024 Notes in connection with that make-whole fundamental change or during the related redemption period. Prior to May 15, 2024, the 2024 Notes will be exchangeable only upon satisfaction of certain conditions and during certain periods, and thereafter, at any time until the close of business on the second scheduled trading day immediately preceding the maturity date.
2021 Notes.
In August 2014, Jazz Investments I Limited completed a private placement of $575.0 million principal amount of the 2021 Notes. The 2021 Notes are senior unsecured obligations of Jazz Investments I Limited and are fully and unconditionally guaranteed on a senior unsecured basis by Jazz Pharmaceuticals plc. Interest on the 2021 Notes is payable semi-annually in cash in arrears on February 15 and August 15 of each year, beginning on February 15, 2015, at a rate of 1.875% per year. In certain circumstances, we may be required to pay additional amounts as a result of any applicable tax withholding or deductions required in respect of payments on the 2021 Notes. The 2021 Notes mature on August 15, 2021, unless earlier exchanged, repurchased or redeemed.
The holders of the 2021 Notes have the ability to require us to repurchase all or a portion of their 2021 Notes for cash in the event we undergo certain fundamental changes, such as specified change of control transactions, our liquidation or dissolution or the delisting of our ordinary shares from The NASDAQ Global Select Market. Prior to August 15, 2021, we may redeem the 2021 Notes, in whole but not in part, subject to compliance with certain conditions, if we have, or on the next interest payment date would, become obligated to pay to the holder of any 2021 Note additional amounts as a result of certain tax-related events. We also may redeem the 2021 Notes on or after August 20, 2018, in whole or in part, if the last reported sale price per ordinary share has been at least 130% of the exchange price then in effect for at least 20 trading days (whether or not
102
consecutive) during any 30 consecutive trading day period ending on, and including, the trading day immediately preceding the date on which we provide the notice of redemption.
The 2021 Notes are exchangeable at an initial exchange rate of 5.0057 ordinary shares per $1,000 principal amount of 2021 Notes, which is equivalent to an initial exchange price of approximately $199.77 per ordinary share. Upon exchange, the 2021 Notes may be settled in cash, ordinary shares or a combination of cash and ordinary shares, at our election. Our intent and policy is to settle the principal amount of the 2021 Notes in cash upon exchange. The exchange rate will be subject to adjustment in some events but will not be adjusted for any accrued and unpaid interest. In addition, following certain make-whole fundamental changes occurring prior to the maturity date of the 2021 Notes or upon our issuance of a notice of redemption, we will in certain circumstances increase the exchange rate for holders of the 2021 Notes who elect to exchange their 2021 Notes in connection with that make-whole fundamental change or during the related redemption period. Prior to February 15, 2021, the 2021 Notes will be exchangeable only upon satisfaction of certain conditions and during certain periods, and thereafter, at any time until the close of business on the second scheduled trading day immediately preceding the maturity date.
Contractual Obligations
The table below presents a summary of our contractual obligations as of
December 31, 2017
(in thousands):
|
|
Payments Due by Period
|
||||||||||||||||||
|
Contractual Obligations (1)
|
Total
|
Less than
1 Year
|
1-3 Years
|
3-5 Years
|
More than
5 years
|
||||||||||||||
|
Term loan - principal
|
$
|
676,758
|
|
$
|
40,605
|
|
$
|
135,352
|
|
$
|
500,801
|
|
$
|
—
|
|
||||
|
Term loan - interest (2)
|
73,738
|
|
23,307
|
|
41,275
|
|
9,156
|
|
—
|
|
|||||||||
|
Exchangeable Senior Notes - principal
|
1,150,000
|
|
—
|
|
—
|
|
575,000
|
|
575,000
|
|
|||||||||
|
Exchangeable Senior Notes - interest (3)
|
103,333
|
|
19,239
|
|
38,813
|
|
28,031
|
|
17,250
|
|
|||||||||
|
Revolving credit facility - commitment fee (4)
|
13,417
|
|
3,802
|
|
7,615
|
|
2,000
|
|
—
|
|
|||||||||
|
Commitment to equity method investees
|
28,550
|
|
5,550
|
|
14,000
|
|
9,000
|
|
—
|
|
|||||||||
|
Purchase and other obligations (5)
|
134,702
|
|
46,324
|
|
33,882
|
|
37,358
|
|
17,138
|
|
|||||||||
|
Operating lease obligations (6)
|
46,351
|
|
9,102
|
|
14,277
|
|
10,219
|
|
12,753
|
|
|||||||||
|
Facility lease obligations (7)
|
195,397
|
|
6,297
|
|
23,534
|
|
30,093
|
|
135,473
|
|
|||||||||
|
Total
|
$
|
2,422,246
|
|
$
|
154,226
|
|
$
|
308,748
|
|
$
|
1,201,658
|
|
$
|
757,614
|
|
||||
__________________________
|
(1)
|
This table does not include potential future milestone payment or royalty obligations to third parties under asset purchase, product development, license and other agreements as the timing and likelihood of such milestone payments are not known, and, in the case of royalty obligations, as the amount of such obligations are not estimable. In 2014, we signed a definitive agreement with Aerial under which we acquired worldwide development, manufacturing and commercial rights to solriamfetol (other than in certain jurisdictions in Asia where SK retains rights). Aerial and SK are currently eligible to receive milestone payments up to an aggregate of $270 million based on development, regulatory and sales milestones and tiered royalties from high single digits to mid-teens based on potential future sales of solriamfetol. In July 2016, we entered into an agreement with Pfenex that granted us worldwide rights to develop and commercialize multiple early-stage hematology product candidates and an option for us to negotiate a license for a recombinant pegaspargase product candidate with Pfenex. This agreement was amended in December 2017. Under the amended agreement, Pfenex received upfront, option and development milestone payments totaling $35.3 million and may be eligible to receive additional payments of up to $189 million based on the achievement of development, regulatory and sales milestones. Potential future milestone payments to other third parties under other agreements could be up to an aggregate of $327 million, of which up to $120 million will become due and payable to Perrigo Company plc (formerly Elan Pharmaceuticals, Inc.) in tiered contingent payments, with the first such payment becoming due if net sales of Prialt of at least $75 million are achieved in a calendar year. The remainder would become due and payable to other third parties upon the achievement of certain developmental, clinical, regulatory and/or commercial milestones, the timing and likelihood of which are not known. We are also obligated under these agreements to pay royalties on net sales of certain products at specified rates, which royalties are dependent on future product sales and are not provided for in the table above as they are not estimable.
|
|
(2)
|
Estimated interest for variable rate debt was calculated based on the interest rates in effect as of
December 31, 2017
. The interest rate for our term loan borrowing was
3.32%
as of
December 31, 2017
.
I
nterest that is fixed, associated with our interest rate swaps, is calculated based on the fixed interest swap rate as of
December 31, 2017
.
|
103
|
(3)
|
We used the fixed interest rates of 1.875% on the 2021 Notes and 1.50% on the 2024 Notes to estimate interest owed as of
December 31, 2017
until the respective final maturity dates of these notes.
|
|
(4)
|
Our revolving credit facility has a commitment fee payable on the undrawn amount ranging from 0.25% to 0.35% per annum based upon our secured leverage ratio. In the table above, we used a rate of 0.30% and assumed undrawn amounts of
$1.25 billion
as of
December 31, 2017
to estimate commitment fees owed.
|
|
(5)
|
Consists primarily of non-cancelable commitments to ImmunoGen, under our collaboration and option agreement, and to third party manufacturers.
|
|
(6)
|
Consists primarily of the minimum lease payments for our office buildings and automobile lease payments for our sales force. Operating expenses associated with our leased office buildings are not included in table above.
|
(7) This includes a lease agreement we entered into in January 2015 to lease office space located in Palo Alto, California, in a building subsequently constructed by the landlord, which we began to occupy in October 2017, and a lease agreement we entered into in September 2017 to lease additional office space located in Palo Alto, California in a second building to be constructed by the same landlord, which we expect to occupy by the end of 2019. Not included in the table above are our estimated costs of approximately $20 million associated with the design, development and construction of tenant improvements under the lease agreement entered into in September 2017, which estimate does not include a tenant improvement allowance to be provided by the landlord.
We do not provide for Irish income taxes on undistributed earnings of our foreign operations that are intended to be indefinitely reinvested in our foreign subsidiaries. Cumulative unremitted earnings of our foreign subsidiaries totaled approximately
$1.7 billion
at
December 31, 2017
. In the event of the distribution of those earnings in the form of dividends or otherwise, we may be liable for income taxes, subject to an adjustment, if any, for foreign tax credits and foreign withholding taxes payable to certain foreign tax authorities. As of
December 31, 2017
, it is not practicable to determine the amount of the income tax liability related to these undistributed earnings due to a variety of factors.
In addition, our liability for unrecognized tax benefits has been excluded from the above contractual obligations table as the nature and timing of future payments, if any, cannot be reasonably estimated. As of
December 31, 2017
, our liability for unrecognized tax benefits amounted to
$106.2 million
(excluding interest and penalties). We do not anticipate that the amount of our existing liability for unrecognized tax benefits will significantly change in the next twelve months.
Critical Accounting Policies and Significant Estimates
A critical accounting policy is one that is both important to the portrayal of our financial condition and results of operations and requires management’s most difficult, subjective or complex judgments, often as a result of the need to make estimates about the effect of matters that are inherently uncertain. While our significant accounting policies are more fully described in Note 2 of the Notes to the Consolidated Financial Statements included in this Annual Report on Form 10-K, we believe the following accounting estimates and policies to be critical.
Revenue Recognition
Revenues are recognized when there is persuasive evidence that an arrangement exists, delivery has occurred, the price is fixed and determinable and collection is reasonably assured.
Product Sales, Net
Product sales revenue is recognized when title has transferred to the customer and the customer has assumed the risks and rewards of ownership, which is typically on delivery to the customer or, in the case of products that are subject to consignment agreements, when the customer removes product from our consigned inventory location for shipment directly to a patient.
A significant portion of our net product revenues is derived from sales of Xyrem. We sell Xyrem in the U.S. to a single central pharmacy, Express Scripts Specialty Distribution Services, Inc., or Express Scripts. In 2017, sales of Xyrem to Express Scripts accounted for
74%
of our net product sales. We recognize revenues from sales of Xyrem within the U.S. upon transfer of title, which occurs when Express Scripts removes product from our consigned inventory location at its facility for shipment directly to a patient. We do not accept returns of Xyrem from Express Scripts.
Items Deducted from Gross Product Sales
. Revenues from sales of products are recorded net of government rebates and rebates under managed care plans, estimated allowances for sales returns, government chargebacks, prompt payment discounts, patient coupon programs, and specialty distributor and wholesaler fees. Calculating certain of these items involves estimates and judgments based on sales or invoice data, contractual terms, historical utilization rates, new information regarding changes in applicable regulations and guidelines that would impact the amount of the actual rebates, our expectations regarding future utilization rates and channel inventory data. We review the adequacy of our provisions for sales deductions on a quarterly basis. Amounts accrued for sales deductions are adjusted when trends or significant events indicate that adjustment is appropriate and to reflect actual experience. Because we derive a significant portion of our revenues from sales of Xyrem in
104
the U.S. to one specialty pharmacy customer, Express Scripts, we have a much higher level of knowledge about each prescription than if we sold the product through the normal pharmaceutical wholesaler channel as we do with most of our other products. The most significant items deducted from gross product sales where we exercise judgment are rebates, sales returns and chargebacks.
The following table presents the activity and ending balances for our sales-related accruals and allowances (in thousands):
|
Rebates Payable
|
Sales Returns Reserve
|
Chargebacks
|
Discounts and Distributor Fees
|
Total
|
|||||||||||||||
|
Balance at December 31, 2014 (1)
|
$
|
44,433
|
|
$
|
14,039
|
|
$
|
4,544
|
|
$
|
5,875
|
|
$
|
68,891
|
|
||||
|
Provision, net
|
124,618
|
|
(4,444
|
)
|
39,124
|
|
46,533
|
|
205,831
|
|
|||||||||
|
Payments/credits
|
(107,013
|
)
|
(3,485
|
)
|
(38,772
|
)
|
(48,684
|
)
|
(197,954
|
)
|
|||||||||
|
Balance at December 31, 2015
|
62,038
|
|
6,110
|
|
4,896
|
|
3,724
|
|
76,768
|
|
|||||||||
|
Provision, net
|
129,608
|
|
(537
|
)
|
40,430
|
|
40,057
|
|
209,558
|
|
|||||||||
|
Payments/credits
|
(123,383
|
)
|
(1,207
|
)
|
(40,577
|
)
|
(39,582
|
)
|
(204,749
|
)
|
|||||||||
|
Balance at December 31, 2016
|
68,263
|
|
4,366
|
|
4,749
|
|
4,199
|
|
81,577
|
|
|||||||||
|
Provision, net
|
144,596
|
|
446
|
|
41,941
|
|
36,642
|
|
223,625
|
|
|||||||||
|
Payments/credits
|
(135,697
|
)
|
(1,161
|
)
|
(43,027
|
)
|
(36,532
|
)
|
(216,417
|
)
|
|||||||||
|
Balance at December 31, 2017
|
$
|
77,162
|
|
$
|
3,651
|
|
$
|
3,663
|
|
$
|
4,309
|
|
$
|
88,785
|
|
||||
__________________________
(1) Includes both continuing operations and discontinued operations to the date of disposal.
Total items deducted from gross product sales were
$223.6 million
, $209.6 million and $205.8 million, or
12.3%
, 12.4% and 13.5% as a percentage of gross product sales, in 2017, 2016 and 2015, respectively. Included in these amounts are immaterial adjustments related to prior-year sales due to changes in estimates. Such amounts represented less than 1% of net product sales for each of the years ended December 31, 2017, 2016 and 2015.
Rebates
We are subject to rebates on sales made under governmental and managed-care pricing programs in the U.S. The largest of these rebates is associated with sales covered by Medicaid. We participate in state government-managed Medicaid programs as well as certain other qualifying federal and state government programs under the terms of which discounts and rebates are provided to participating government entities. We offer rebates and discounts to managed health care organizations in the U.S. In estimating our provisions for rebates, we consider relevant statutes with respect to governmental pricing programs and contractual sales terms with managed-care providers and group purchasing organizations. We estimate the rebate provision based on historical utilization rates, historical payment experience, new information regarding changes in regulations and guidelines that would impact the amount of the actual rebates, our expectations regarding future utilization rates and channel inventory data obtained from our major U.S. wholesalers in accordance with our inventory management agreements. Estimating these rebates is complex, in part due to the time delay between the date of sale and the actual settlement of the liability. We believe that the methodology we use to estimate rebates on product sales made under governmental and managed-care pricing programs is reasonable and appropriate given current facts and circumstances. However, estimates may vary from actual experience.
Rebates were
$144.6 million
, $129.6 million and $124.6 million, or
7.9%
, 7.7% and 8.2% as a percentage of gross product sales, in 2017, 2016 and 2015, respectively. Rebates as a percentage of gross product sales did not change materially in 2017 compared to 2016. Rebates as a percentage of gross product sales decreased in 2016 compared to 2015 primarily due to decreased Medicaid expense for certain products with generic competition as a result of lower net product sales from those products in 2016, partially offset by increased Tricare per unit rebate amounts. We expect that rebates will continue to significantly impact our reported net sales. However, rebates as a percentage of gross product sales are not expected to change materially in 2018 compared to 2017.
Sales returns
For certain products, we allow customers to return product within a specified period before and after the applicable expiration date and issue credits which may be applied against existing or future invoices. We account for sales returns as a reduction in net revenue at the time a sale is recognized by establishing an accrual in an amount equal to the estimated value of products expected to be returned. The sales return accrual is estimated principally based on historical experience, the level and estimated shelf life of inventory in the distribution channel, our return policy and expected market events including generic competition.
105
Sales returns represented a charge of
$0.4 million
in 2017 and a credit of $0.5 million and $4.4 million in 2016 and 2015, respectively, or 0%, 0% and (0.3%) as a percentage of gross product sales in 2017, 2016 and 2015, respectively. Sales returns as a percentage of gross product sales did not change materially in 2017 and in 2016 compared to the immediately preceding years. Sales returns as a percentage of gross product sales are not expected to change materially in 2018 compared to 2017.
Chargebacks
We participate in chargeback programs with a number of entities, principally the U.S. Department of Defense, the U.S. Department of Veterans Affairs and other public parties, under which pricing on products below wholesalers’ list prices is provided to participating entities. These entities purchase product through wholesalers at the lower negotiated price and the wholesalers charge back to us the difference between their acquisition cost and the lower negotiated price. We record the difference as allowances against accounts receivable. We determine our estimate of the chargebacks provision primarily based on historical experience on a product and program basis, current contract prices under the chargeback programs and channel inventory data.
Chargebacks were
$41.9 million
, $40.4 million and $39.1 million, or
2.3%
, 2.4% and 2.6% as a percentage of gross product sales in 2017, 2016 and 2015, respectively. Chargebacks as a percentage of gross product sales did not change materially in 2017 and in 2016 compared to the immediately preceding years. We expect that chargebacks will continue to significantly impact our reported net product sales. Chargebacks as a percentage of gross product sales are not expected to change materially in 2018 compared to 2017.
Discounts and distributor fees
Discounts and distributor fees comprise prompt payment discounts, patient coupon programs and specialty distributor and wholesaler fees. We offer customers a cash discount on gross product sales as an incentive for prompt payment. We estimate provisions for prompt pay discounts based on contractual sales terms with customers and historical payment experience. To help patients afford our products, we have various programs to assist them, including patient assistance programs, a free product voucher program and co-pay coupon programs for certain products. We estimate provisions for these programs primarily based on expected program utilization, adjusted as necessary to reflect our actual experience on a product and program basis. Specialty distributor and wholesaler fees comprise fees for distribution of our products. We estimate provisions for distributor and wholesaler fees primarily based on sales volumes and contractual terms with our distributors.
Discounts and distributor fees were
$36.6 million
, $40.1 million and $46.5 million, or
2.0%
, 2.4% and 3.1% as a percentage of gross product sales in 2017, 2016 and 2015, respectively. Discounts and distributor fees as a percentage of gross product sales decreased in 2017 and in 2016 compared to the immediately preceding years primarily due to decreased distributor fees payable to the partner distributors in international markets. We expect that discounts and distributor fees as a whole will continue to significantly impact our reported net product sales. Discounts and distributor fees as a percentage of gross product sales are not expected to change materially in 2018 compared to 2017.
Goodwill and Intangible Assets
Goodwill
Goodwill represents the excess of the acquisition consideration over the fair value of assets acquired and liabilities assumed. We test goodwill for impairment annually in October and when events or changes in circumstances indicate that the carrying value may not be recoverable. We have determined that we operate in a single segment and have a single reporting unit associated with the development and commercialization of pharmaceutical products. The annual test for goodwill impairment is a two-step process. The first step is a comparison of the fair value of the reporting unit with its carrying amount, including goodwill. If this step indicates impairment, then in the second step, the loss is measured as the excess of recorded goodwill over its implied fair value. Implied fair value is the excess of the fair value of the reporting unit over the fair value of all identified assets and liabilities. We have determined the fair value of our single reporting unit to be equal to our market capitalization, as determined by our traded share price, plus a control premium. The control premium used was based on a review of such premiums identified in recent acquisitions of companies of similar size and in similar industries. We performed our annual goodwill impairment test in October 2017 and concluded that goodwill was not impaired as the fair value of the reporting unit significantly exceeded its carrying amount, including goodwill. As of
December 31, 2017
, we had
$947.5 million
of goodwill primarily resulting from the Azur Merger on January 18, 2012, the EUSA Acquisition on June 12, 2012, the Gentium Acquisition on January 23, 2014 and the Celator Acquisition on July 12, 2016.
Intangible Assets
In connection with the Azur Merger, the EUSA Acquisition, the Gentium Acquisition and the Celator Acquisition, we acquired a number of intangible assets, including intangible assets related to currently marketed products (developed technology) and intangible assets related to product candidates (IPR&D). When significant identifiable intangible assets are acquired, we engage an independent third party valuation firm to assist in determining the fair values of these assets as of the
106
acquisition date. Discounted cash flow models are typically used in these valuations, which require the use of significant estimates and assumptions, including but not limited to:
|
•
|
estimating the timing of and expected costs to complete the in-process projects;
|
|
•
|
projecting regulatory approvals;
|
|
•
|
estimating future cash flows from product sales resulting from completed products and in-process projects; and
|
|
•
|
developing appropriate discount rates and probability rates by project.
|
We believe the fair values that we assign to the intangible assets acquired are based upon reasonable estimates and assumptions given available facts and circumstances as of the acquisition dates. No assurance can be given, however, that the underlying assumptions used to estimate expected cash flows will transpire as estimated. In addition, we are required to estimate the period of time over which to amortize the intangible assets, which requires significant judgment.
Our finite-lived intangible assets are amortized on a straight-line basis over their estimated useful lives, which range from two to 18 years. The estimated useful lives associated with intangible assets are consistent with the estimated lives of the products and may be modified when circumstances warrant. Intangible assets with finite lives are reviewed for impairment whenever events or circumstances indicate that the carrying value of an asset may not be recoverable. Events giving rise to impairment are an inherent risk in the pharmaceutical industry and cannot be predicted. Factors that we consider in deciding when to perform an impairment review include significant under-performance of a product in relation to expectations, significant negative industry or economic trends, and significant changes or planned changes in our use of the assets. An impairment loss would be recognized when estimated undiscounted future cash flows expected to result from the use of the asset and its eventual disposition are less than its carrying amount. Estimating future cash flows related to an intangible asset involves estimates and assumptions. If our assumptions are not correct, there could be an impairment loss or, in the case of a change in the estimated useful life of the asset, a change in amortization expense.
IPR&D is not amortized but is tested for impairment annually or when events or circumstances indicate that the fair value may be below the carrying value of the asset. If the carrying value of the assets is not expected to be recovered, the assets are written down to their estimated fair values.
As of
December 31, 2017
, we had
$2.8 billion
of finite-lived intangible assets and
$0.1 billion
of IPR&D assets related to the marketed products and the IPR&D projects that we acquired in the Azur Merger, the EUSA Acquisition, the Gentium Acquisition and the Celator Acquisition. We did not recognize an impairment charge related to our intangible assets in 2017 and 2016. In 2015, we recorded an impairment charge of $31.5 million to our acquired IPR&D asset as a result of our decision to terminate a pivotal Phase 2 clinical trial of JZP-416.
Please refer to the Notes to Consolidated Financial Statements included elsewhere in this Annual Report on Form 10-K for further information about our intangible assets and the remaining useful lives of our finite-lived intangible assets as of
December 31, 2017
.
Income Taxes
We use the asset and liability method of accounting for income taxes. Under this method, deferred tax assets and liabilities are determined based on differences between the financial statement carrying amount and the tax basis of assets and liabilities and are measured using enacted tax rates and laws that will be in effect when the differences are expected to reverse. We provide a valuation allowance when it is more-likely-than-not that deferred tax assets will not be realized.
Our most significant tax jurisdictions are Ireland, the U.S., Italy and France. Significant estimates are required in determining our provision for income taxes. Some of these estimates are based on management’s interpretations of jurisdiction-specific tax laws or regulations and the likelihood of settlement related to tax audit issues. Various internal and external factors may have favorable or unfavorable effects on our future effective income tax rate. These factors include, but are not limited to, changes in tax laws, regulations and/or rates, changing interpretations of existing tax laws or regulations, changes in estimates of prior years’ items, the impact of accounting for share-based compensation, changes in our international organization, likelihood of settlement, and changes in overall levels of income before taxes.
Realization of our deferred tax assets is dependent upon the generation of future taxable income, the amount and timing of which are uncertain. In evaluating our ability to recover our deferred tax assets, we consider all available positive and negative evidence, including cumulative income in recent fiscal years, our forecast of future taxable income exclusive of certain reversing temporary differences and significant risks and uncertainties related to our business. In determining future taxable income, we are responsible for assumptions utilized including the amount of state, federal and international pre-tax operating income, the reversal of certain temporary differences and the implementation of feasible and prudent tax planning strategies. These assumptions require significant judgment about the forecasts of future taxable income and are consistent with the plans and estimates that we are using to manage our underlying business.
107
We maintain a valuation allowance against certain other deferred tax assets where realizability is not certain. We periodically evaluate the likelihood of the realization of deferred tax assets and reduce the carrying amount of these deferred tax assets by a valuation allowance to the extent we believe a portion will not be realized. This determination depends on a variety of factors, some of which are subjective, including our recent cumulative earnings experience by taxing jurisdiction, expectations of future taxable income, carryforward periods available to us for tax reporting purposes, various income tax strategies and other relevant factors. If we determine that the deferred tax assets are not realizable in a future period, we would record material changes to income tax expense in that period.
We have also provided for unrecognized tax benefits that we believe are not more-likely-than-not to be sustained upon examination by tax authorities. The evaluation of unrecognized tax benefits is based on factors that include, but are not limited to, changes in tax law, the measurement of tax positions taken or expected to be taken in tax returns, the effective settlement of matters subject to audit, new audit activity and changes in facts or circumstances related to a tax position. We evaluate unrecognized tax benefits on a quarterly basis and adjust the level of the liability to reflect any subsequent changes in the relevant facts surrounding the uncertain positions. Our liabilities for unrecognized tax benefits can be relieved only if the contingency becomes legally extinguished through either payment to the taxing authority or the expiration of the statute of limitations, the recognition of the benefits associated with the position meet the more-likely-than-not threshold or the liability becomes effectively settled through the examination process. We consider matters to be effectively settled once the taxing authority has completed all of its required or expected examination procedures, including all appeals and administrative reviews. We also accrue for potential interest and penalties related to unrecognized tax benefits in income tax provision (benefit).
Share-Based Compensation
We have elected to use the Black-Scholes option pricing model to calculate the fair value of share option grants under our equity incentive plans and grants under our employee stock purchase plan, or ESPP, and we are using the straight-line method to allocate compensation cost to reporting periods. The fair value of share options was estimated using the following assumptions:
|
Year Ended December 31,
|
||||||||
|
2017
|
2016
|
2015
|
||||||
|
Volatility
|
35
|
%
|
39
|
%
|
39
|
%
|
||
|
Expected term (years)
|
4.3
|
|
4.2
|
|
4.2
|
|
||
|
Range of risk-free rates
|
1.6-2.1%
|
|
0.8-1.6%
|
|
1.1-1.5%
|
|
||
|
Expected dividend yield
|
—
|
%
|
—
|
%
|
—
|
%
|
||
The two inputs which require the greatest judgment and have a large impact on fair values are volatility and expected term.
We rely only on a blend of the historical and implied volatilities of our own ordinary shares to determine expected volatility for share option grants. In addition, we use a single volatility estimate for each share option grant. The weighted-average volatility is determined by calculating the weighted average of volatilities for all share options granted in a given year.
The expected term of share option grants represents the weighted-average period the awards are expected to remain outstanding. We estimated the weighted-average expected term based on historical exercise data.
Recent Accounting Pronouncements
For a discussion of recent accounting pronouncements, please see Note 2, Summary of Significant Accounting Policies to our consolidated financial statements included in Part IV of this Annual Report on Form 10-K.
Off-Balance Sheet Arrangements
We do not have any off-balance sheet arrangements.
108
|
Item 7A.
|
Quantitative and Qualitative Disclosures About Market Risk
|
Interest Rate Risk
. The primary objectives of our investment policy, in order of priority, are as follows: safety and preservation of principal and diversification of risk; liquidity of investments sufficient to meet cash flow requirements; and competitive yield. Although our investments are subject to market risk, our investment policy specifies credit quality standards for our investments and limits the amount of credit exposure from any single issue, issuer or certain types of investment. Our investment policy allows us to maintain a portfolio of cash equivalents and short-term investments in a variety of securities, including U.S. federal government and federal agency securities, corporate bonds or commercial paper issued by U.S. corporations, money market instruments, certain qualifying money market mutual funds, certain repurchase agreements, and tax-exempt obligations of states, agencies and municipalities in the U.S. Our cash equivalents and investments as of
December 31, 2017
consisted of time deposits which are not subject to significant interest rate risk.
We are exposed to risks associated with changes in interest rates in connection with our term loan borrowings. On July 12, 2016, we entered into the amended credit agreement, which provides for a revolving credit facility of
$1.25 billion
replacing our prior revolving credit facility of
$750.0 million
, and a
$750.0 million
term loan facility, of which
$676.8 million
principal amount was outstanding as of
December 31, 2017
. There were no borrowings outstanding under the revolving credit facility as of
December 31, 2017
. To achieve a desired mix of floating and fixed interest rates on our term loan, we entered into interest rate swap agreements in March 2017 that are designated as cash flow hedges. These derivative instruments are utilized for risk management purposes, and we do not use these derivatives for speculative trading purposes. The interest rate swap agreements have a notional amount of $300.0 million and are effective from March 3, 2017 through July 12, 2021 and convert the floating rate on a portion of our term loan to a fixed rate of 1.895%, plus the borrowing spread. The impact of a hypothetical increase or decrease in interest rates on the fair value of our interest rate swap contracts would be offset by a change in the value of the underlying liability. If interest rates were to increase or decrease by 100 basis points, interest expense for 2018 would increase or decrease by approximately $4 million, based on the unhedged portion of our outstanding variable rate borrowings.
In August 2014, we completed a private placement of $575.0 million aggregate principal amount of the 2021 Notes. In the third quarter of 2017, we completed another private placement of $575.0 million aggregate principal amount of the 2024 Notes. The 2021 Notes and 2024 Notes have fixed annual interest rates of 1.875% and 1.50%, respectively, and we, therefore, do not have economic interest rate exposure on the Exchangeable Senior Notes. However, the fair values of the Exchangeable Senior Notes are exposed to interest rate risk. Generally, the fair values of the Exchangeable Senior Notes will increase as interest rates fall and decrease as interest rates rise. The fair values of the Exchangeable Senior Notes are also affected by volatility in our ordinary share price. As of
December 31, 2017
, the fair values of the 2021 Notes and the 2024 Notes were estimated to be
$577 million
and
$543 million
, respectively.
Foreign Exchange Risk
. We have significant operations in Europe as well as in the U.S. The functional currency of each foreign subsidiary is generally the local currency. We are exposed to foreign currency exchange risk as the functional currency financial statements of foreign subsidiaries are translated to U.S. dollars. The assets and liabilities of our foreign subsidiaries having a functional currency other than the U.S. dollar are translated into U.S. dollars at the exchange rate prevailing at the balance sheet date, and at the average exchange rate for the reporting period for revenue and expense accounts. The cumulative foreign currency translation adjustment is recorded as a component of accumulated other comprehensive loss in shareholders’ equity. The reported results of our foreign subsidiaries will be influenced by their translation into U.S. dollars by currency movements against the U.S. dollar. Our primary currency translation exposure is related to our subsidiaries that have functional currencies denominated in the euro. A 10% strengthening or weakening in the rates used to translate the results of our foreign subsidiaries that have functional currencies denominated in the euro would have increased or decreased net income for the year ended December 31, 2017 by approximately $9 million.
Transactional exposure arises where transactions occur in currencies other than the functional currency. Transactions in foreign currencies are recorded at the exchange rate prevailing at the date of the transaction. The resulting monetary assets and liabilities are translated into the appropriate functional currency at exchange rates prevailing at the balance sheet date and the resulting gains and losses are reported in foreign exchange gain (loss) in the consolidated statements of income. As of December 31, 2017, our primary exposure to transaction risk related to euro net monetary liabilities, including intercompany loans, held by subsidiaries with a U.S. dollar functional currency. We have entered into foreign exchange forward contracts to manage this currency risk. These foreign exchange forward contracts are not designated as hedges; gains and losses on these derivative instruments are designed to offset gains and losses on the underlying balance sheet exposures. As of December 31, 2017, we held foreign exchange forward contracts with notional amounts totaling
$98.7 million
. The net asset fair value of outstanding foreign exchange forward contracts was
$10.5 million
as of
December 31, 2017
. Based on our foreign currency exchange rate exposures as of December 31, 2017, a hypothetical 10% adverse fluctuation in exchange rates would decrease the fair value of our foreign exchange forward contracts by approximately $17 million as of December 31, 2017. The resulting loss on these forward contracts would be offset by a positive impact on the underlying monetary assets and liabilities.
109
|
Item 8.
|
Financial Statements and Supplementary Data
|
Our consolidated financial statements as listed below are included in this Annual Report on Form 10-K as pages F-1 through F-46.
|
|
Page
|
|
Jazz Pharmaceuticals plc
|
|
|
Report of Independent Registered Public Accounting Firm
|
F-1
|
|
Consolidated Balance Sheets
|
F-2
|
|
Consolidated Statements of Income
|
F-3
|
|
Consolidated Statements of Comprehensive Income
|
F-4
|
|
Consolidated Statements of Shareholders’ Equity
|
F-5
|
|
Consolidated Statements of Cash Flows
|
F-8
|
|
Notes to Consolidated Financial Statements
|
F-10
|
|
Item 9.
|
Changes in and Disagreements with Accountants on Accounting and Financial Disclosure
|
Not applicable.
|
Item 9A.
|
Controls and Procedures
|
Evaluation of Disclosure Controls and Procedures
. We have carried out an evaluation under the supervision and with the participation of management, including our principal executive officer and principal financial officer, of our disclosure controls and procedures (as defined in Rule 13a-15(e) of the Exchange Act) as of the end of the period covered by this Annual Report on Form 10-K. Based on their evaluation, our principal executive officer and principal financial officer concluded that our disclosure controls and procedures were effective as of
December 31, 2017
.
Limitations on the Effectiveness of Controls.
A control system, no matter how well conceived and operated, can provide only reasonable, not absolute, assurance that the objectives of the control system are met. Because of inherent limitations in all control systems, no evaluation of controls can provide absolute assurance that all control issues, if any, within an organization have been detected. Accordingly, our disclosure controls and procedures are designed to provide reasonable, not absolute, assurance that the objectives of our disclosure control system are met and, as set forth above, our principal executive officer and principal financial officer have concluded, based on their evaluation as of the end of the period covered by this report, that our disclosure controls and procedures were effective to provide reasonable assurance that the objectives of our disclosure control system were met.
Changes in Internal Control over Financial Reporting.
During the quarter ended
December 31, 2017
, there were no changes to our internal control over financial reporting that have materially affected, or are reasonably likely to materially affect, our internal control over financial reporting.
Management’s Report on Internal Control over Financial Reporting.
The following report is provided by management in respect of our internal control over financial reporting (as defined in Rule 13a-15(f) of the Exchange Act):
|
1.
|
Our management is responsible for establishing and maintaining adequate internal control over financial reporting.
|
|
2.
|
Our management used the Committee of Sponsoring Organizations of the Treadway Commission Internal Control - Integrated Framework (2013), or the COSO framework, to evaluate the effectiveness of internal control over financial reporting. Management believes that the COSO framework is a suitable framework for its evaluation of financial reporting because it is free from bias, permits reasonably consistent qualitative and quantitative measurements of our internal control over financial reporting, is sufficiently complete so that those relevant factors that would alter a conclusion about the effectiveness of our internal control over financial reporting are not omitted and is relevant to an evaluation of internal control over financial reporting.
|
|
3.
|
Management has assessed the effectiveness of our internal control over financial reporting as of
December 31, 2017
and has concluded that such internal control over financial reporting was effective. There were no material weaknesses in internal control over financial reporting identified by management.
|
|
4.
|
KPMG, our independent registered public accounting firm, has audited the consolidated financial statements of Jazz Pharmaceuticals plc as of and for the year ended
December 31, 2017
, included herein, and has issued an audit report on our internal control over financial reporting, which is included below.
|
110
Report of Independent Registered Public Accounting Firm
To the Shareholders and Board of Directors
Jazz Pharmaceuticals plc:
Opinion on Internal Control Over Financial Reporting
We have audited Jazz Pharmaceuticals plc’s and subsidiaries’ (the “Company”) internal control over financial reporting as of
December 31, 2017
, based on criteria established in
Internal Control – Integrated Framework (2013)
issued by the Committee of Sponsoring Organizations of the Treadway Commission (COSO). In our opinion, the Company maintained, in all material respects, effective internal control over financial reporting as of December 31, 2017, based on criteria established in
Internal Control - Integrated Framework (2013)
issued by the Committee of Sponsoring Organizations of the Treadway Commission.
We also have audited, in accordance with the standards of the Public Company Accounting Oversight Board (United States) (“PCAOB”), the consolidated balance sheets of the Company as of December 31, 2017 and 2016, and the related consolidated statements of income, comprehensive income, shareholders’ equity, and cash flows for each of the years in the three-year period ended December 31, 2017, and the related notes and financial statements schedule at Item 15(a)2 (collectively, the “consolidated financial statements”), and our report dated February 27, 2018 expressed an unqualified opinion on those consolidated financial statements.
Basis for Opinion
The Company’s management is responsible for maintaining effective internal control over financial reporting and for its assessment of the effectiveness of internal control over financial reporting, included in the accompanying Management’s Report on Internal Control over Financial Reporting. Our responsibility is to express an opinion on the Company’s internal control over financial reporting based on our audit. We are a public accounting firm registered with the PCAOB and are required to be independent with respect to the Company in accordance with the U.S. federal securities laws and the applicable rules and regulations of the Securities and Exchange Commission and the PCAOB.
We conducted our audit in accordance with the standards of the PCAOB. Those standards require that we plan and perform the audit to obtain reasonable assurance about whether effective internal control over financial reporting was maintained in all material respects. Our audit of internal control over financial reporting included obtaining an understanding of internal control over financial reporting, assessing the risk that a material weakness exists, and testing and evaluating the design and operating effectiveness of internal control based on the assessed risk. Our audit also included performing such other procedures as we considered necessary in the circumstances. We believe that our audit provides a reasonable basis for our opinion.
Definition and Limitations of Internal Control Over Financial Reporting
A company’s internal control over financial reporting is a process designed to provide reasonable assurance regarding the reliability of financial reporting and the preparation of financial statements for external purposes in accordance with generally accepted accounting principles. A company’s internal control over financial reporting includes those policies and procedures that (1) pertain to the maintenance of records that, in reasonable detail, accurately and fairly reflect the transactions and dispositions of the assets of the company; (2) provide reasonable assurance that transactions are recorded as necessary to permit preparation of financial statements in accordance with generally accepted accounting principles, and that receipts and expenditures of the company are being made only in accordance with authorizations of management and directors of the company; and (3) provide reasonable assurance regarding prevention or timely detection of unauthorized acquisition, use, or disposition of the company’s assets that could have a material effect on the financial statements.
Because of its inherent limitations, internal control over financial reporting may not prevent or detect misstatements. Also, projections of any evaluation of effectiveness to future periods are subject to the risk that controls may become inadequate because of changes in conditions, or that the degree of compliance with the policies or procedures may deteriorate.
/s/ KPMG
Dublin, Ireland
February 27, 2018
111
|
Item 9B.
|
Other Information
|
Not applicable.
Certain information required by Part III is omitted from this Annual Report on Form 10-K and incorporated by reference to our definitive proxy statement for our
2018
annual general meeting of shareholders, or our
2018
Proxy Statement, to be filed pursuant to Regulation 14A of the Securities Exchange Act of 1934, as amended, or Exchange Act. If our
2018
Proxy Statement is not filed within 120 days after the end of the fiscal year covered by this Annual Report on Form 10-K, the omitted information will be included in an amendment to this Annual Report on Form 10-K filed not later than the end of such 120-day period.
|
Item 10.
|
Directors, Executive Officers and Corporate Governance
|
The information required by this item is to be included in our
2018
Proxy Statement as follows:
|
•
|
The information relating to our directors and nominees for director is to be included in the section entitled “Proposal 1—Election of Directors;”
|
|
•
|
The information relating to our executive officers is to be included in the section entitled “Executive Officers;”
|
|
•
|
The information relating to our audit committee, audit committee financial expert and procedures by which shareholders may recommend nominees to our board of directors is to be included in the section entitled “Corporate Governance and Board Matters;” and
|
|
•
|
The information regarding compliance with Section 16(a) of the Exchange Act is to be included in the section entitled “Section 16(a) Beneficial Ownership Reporting Compliance.”
|
Such information is incorporated herein by reference to our
2018
Proxy Statement, provided that if the
2018
Proxy Statement is not filed within 120 days after the end of the fiscal year covered by this Annual Report on Form 10-K, the omitted information will be included in an amendment to this Annual Report on Form 10-K filed not later than the end of such 120-day period.
Our Code of Conduct applies to all of our employees, directors and officers, including our principal executive officer, principal financial officer, principal accounting officer or controller, or persons performing similar functions, and those of our subsidiaries. The Code of Conduct is available on our website at
www.jazzpharmaceuticals.com
under the section entitled “About” under “Corporate Ethics.” We intend to satisfy the disclosure requirements under Item 5.05 of the SEC Form 8-K regarding an amendment to, or waiver from, a provision of our Code of Conduct by posting such information on our website at the website address and location specified above.
|
Item 11.
|
Executive Compensation
|
The information required by this item is to be included in our
2018
Proxy Statement under the sections entitled “Executive Compensation,” “Director Compensation,” “Corporate Governance and Board Matters—Compensation Committee Interlocks and Insider Participation” and “Corporate Governance and Board Matters—Compensation Committee Report” and is incorporated herein by reference, provided that if the
2018
Proxy Statement is not filed within 120 days after the end of the fiscal year covered by this Annual Report on Form 10-K, the omitted information will be included in an amendment to this Annual Report on Form 10-K filed not later than the end of such 120-day period.
|
Item 12.
|
Security Ownership of Certain Beneficial Owners and Management and Related Stockholder Matters
|
The information required by this item with respect to equity compensation plans is to be included in our
2018
Proxy Statement under the section entitled “Equity Compensation Plan Information” and the information required by this item with respect to security ownership of certain beneficial owners and management is to be included in our
2018
Proxy Statement under the section entitled “Security Ownership of Certain Beneficial Owners and Management” and in each case is incorporated herein by reference, provided that if the
2018
Proxy Statement is not filed within 120 days after the end of the fiscal year covered by this Annual Report on Form 10-K, the omitted information will be included in an amendment to this Annual Report on Form 10-K filed not later than the end of such 120-day period.
112
|
Item 13.
|
Certain Relationships and Related Transactions, and Director Independence
|
The information required by this item is to be included in our
2018
Proxy Statement under the sections entitled “Certain Relationships and Related Party Transactions” and “Corporate Governance and Board Matters—Independence of the Board of Directors” and is incorporated herein by reference, provided that if the
2018
Proxy Statement is not filed within 120 days after the end of the fiscal year covered by this Annual Report on Form 10-K, the omitted information will be included in an amendment to this Annual Report on Form 10-K filed not later than the end of such 120-day period.
|
Item 14.
|
Principal Accountant Fees and Services
|
The information required by this item is to be included in our
2018
Proxy Statement under the section entitled “Proposal 2—On a Non-Binding Advisory Basis, Ratify Appointment of Independent Auditors and, On a Binding Basis, Authorize the Board of Directors, Acting Through the Audit Committee, to Determine the Independent Auditors’ Remuneration” and is incorporated herein by reference, provided that if the
2018
Proxy Statement is not filed within 120 days after the end of the fiscal year covered by this Annual Report on Form 10-K, the omitted information will be included in an amendment to this Annual Report on Form 10-K filed not later than the end of such 120-day period.
|
Item 15.
|
Exhibits and Financial Statement Schedules
|
(a) The following documents are filed as part of this Annual Report on Form 10-K:
|
1.
|
Index to Financial Statements:
|
See Index to Consolidated Financial Statements in Item 8 of this Annual Report on Form 10-K.
|
2.
|
Financial Statement Schedules:
|
The following financial statement schedule of Jazz Pharmaceuticals plc is filed as part of this Annual Report on Form 10-K on page F-46 and should be read in conjunction with the consolidated financial statements of Jazz Pharmaceuticals plc.
Schedule II: Valuation and Qualifying Accounts
All other schedules are omitted because they are not applicable, not required under the instructions, or the requested information is shown in the consolidated financial statements or related notes thereto.
(b) Exhibits—The following exhibits are included herein or incorporated herein by reference:
|
Exhibit
Number
|
Description of Document
|
||
|
2.1
|
|||
|
2.2
|
|||
|
2.3
|
|||
|
2.4
|
|||
|
2.5
|
|||
113
|
2.6†
|
|||
|
2.7†
|
|||
|
2.8
|
|||
|
2.9
|
|||
|
3.1
|
|||
|
4.1
|
|||
|
4.2
|
|||
|
4.3A
|
|||
|
4.3B
|
|||
|
4.4A
|
|||
|
4.4B
|
|||
|
4.5A
|
|||
|
4.5B
|
|||
|
10.1
|
|||
|
10.2†
|
|||
|
10.3†
|
|||
114
|
10.4†
|
|||
|
10.5
|
|||
|
10.6†
|
|||
|
10.7†
|
|||
|
10.8†
|
|||
|
10.9A
|
|||
|
10.9B
|
|||
|
10.10A
|
|||
|
10.10B
|
|||
|
10.10C
|
|||
|
10.11
|
|||
|
10.12
|
|||
|
10.13
|
|||
|
10.14+
|
|||
115
|
10.15+
|
|||
|
10.16+
|
|||
|
10.17A+
|
|||
|
10.17B+
|
|||
|
10.17C+
|
|||
|
10.17D+
|
|||
|
10.18+
|
|||
|
10.19A+
|
|||
|
10.19B+
|
|||
|
10.19C+
|
|||
|
10.19D+
|
|||
|
10.20+
|
|||
|
10.21+
|
|||
|
10.22A+
|
|||
|
10.22B+
|
|||
|
10.22C+
|
|||
|
10.22D+
|
|||
116
|
10.22E+
|
|||
|
10.22F+
|
|||
|
10.22G+
|
|||
|
10.22H+
|
|||
|
10.23A+
|
|||
|
10.23B+
|
|||
|
10.23C+
|
|||
|
10.23D+
|
|||
|
10.23E+
|
|||
|
10.23F+
|
|||
|
10.23G+
|
|||
|
10.23H+
|
|||
|
10.23I+
|
|||
|
10.23J+
|
|||
117
|
10.23K+
|
|||
|
10.23L+
|
|||
|
10.23M+
|
|
||
|
10.23N+
|
|||
|
10.23O+
|
|||
|
10.23P+
|
|||
|
10.23Q+
|
|||
|
10.23R+
|
|||
|
10.23S+
|
|||
|
10.24+
|
|||
|
10.24A+
|
|||
|
10.24B+
|
|||
|
10.24C+
|
|||
|
10.24D+
|
|||
118
|
10.24E+
|
|||
|
10.24F+
|
|||
|
10.24G+
|
|||
|
10.25A+
|
|||
|
10.25B+
|
|||
|
10.26A+
|
|||
|
10.26B+
|
|||
|
10.26C+
|
|||
|
10.27+
|
|||
|
10.28+
|
|||
|
10.29A+
|
|||
|
10.29B+
|
|||
|
21.1
|
|||
|
23.1
|
|||
|
24.1
|
|||
|
31.1
|
|||
|
31.2
|
|||
|
32.1*
|
|||
|
101.INS
|
XBRL Instance Document
|
||
|
101.SCH
|
XBRL Taxonomy Extension Schema Document
|
||
|
101.CAL
|
XBRL Taxonomy Extension Calculation Linkbase Document
|
||
|
101.DEF
|
XBRL Taxonomy Extension Definition Linkbase Document
|
||
119
|
101.LAB
|
XBRL Taxonomy Extension Labels Linkbase Document
|
||
|
101.PRE
|
XBRL Taxonomy Extension Presentation Linkbase Document
|
||
___________________
|
+
|
Indicates management contract or compensatory plan.
|
|
†
|
Confidential treatment has been granted for portions of this exhibit. Omitted portions have been filed separately with the Securities and Exchange Commission.
|
|
*
|
The certifications attached as Exhibit 32.1 accompany this Annual Report on Form 10-K pursuant to 18 U.S.C. Section 1350, as adopted pursuant to Section 906 of the Sarbanes-Oxley Act of 2002, and shall not be deemed “filed” by the Registrant for purposes of Section 18 of the Securities Exchange Act of 1934, as amended.
|
|
Item 16.
|
Form 10-K Summary
|
None.
120
SIGNATURES
Pursuant to the requirements of Section 13 or 15(d) of the Securities Exchange Act of 1934, the registrant has duly caused this report to be signed on its behalf by the undersigned, thereunto duly authorized.
|
Date: February 27, 2018
|
Jazz Pharmaceuticals public limited company
|
|
(Registrant)
|
|
|
/s/ B
RUCE
C. C
OZADD
|
|
|
Bruce C. Cozadd
Chairman and Chief Executive Officer and Director
(Principal Executive Officer)
|
|
|
/s/ M
ATTHEW
P. Y
OUNG
|
|
|
Matthew P. Young
Executive Vice President and Chief Financial Officer (Principal Financial Officer)
|
|
|
/s/ K
AREN
J. W
ILSON
|
|
|
Karen J. Wilson
Senior Vice President, Finance
(Principal Accounting Officer)
|
|
121
POWER OF ATTORNEY
KNOW ALL PERSONS BY THESE PRESENTS, that each person whose signature appears below constitutes and appoints Bruce C. Cozadd, Matthew P. Young, Suzanne Sawochka Hooper and Karen J. Wilson, and each of them, as his or her true and lawful attorneys-in-fact and agents, with full power of substitution for him or her, and in his or her name in any and all capacities, to sign any and all amendments to this Annual Report on Form 10-K, and to file the same, with exhibits thereto and other documents in connection therewith, with the Securities and Exchange Commission, granting unto said attorneys-in-fact and agents, and each of them, full power and authority to do and perform each and every act and thing requisite and necessary to be done therewith, as fully to all intents and purposes as he or she might or could do in person, hereby ratifying and confirming all that said attorneys-in-fact and agents, and any of them, his or her substitute or substitutes, may lawfully do or cause to be done by virtue hereof.
Pursuant to the requirements of the Securities Exchange Act of 1934, the following persons on behalf of the registrant and in the capacities and on the dates indicated have signed this report below:
|
Signature
|
Title
|
Date
|
||
|
/s/ B
RUCE
C. C
OZADD
|
Chairman, Chief Executive Officer and Director
(Principal Executive Officer)
|
February 27, 2018
|
||
|
Bruce C. Cozadd
|
||||
|
/s/ M
ATTHEW
P. Y
OUNG
|
Executive Vice President and Chief Financial Officer
(Principal Financial Officer)
|
February 27, 2018
|
||
|
Matthew P. Young
|
||||
|
/s/ K
AREN
J. W
ILSON
|
Senior Vice President, Finance
(Principal Accounting Officer)
|
February 27, 2018
|
||
|
Karen J. Wilson
|
||||
|
/s/ P
AUL
L. B
ERNS
|
Director
|
February 27, 2018
|
||
|
Paul L. Berns
|
||||
|
/s/ P
ATRICK
G. E
NRIGHT
|
Director
|
February 27, 2018
|
||
|
Patrick G. Enright
|
||||
|
/s/ P
ETER
G
RAY
|
Director
|
February 27, 2018
|
||
|
Peter Gray
|
||||
|
/s/ H
EATHER
A
NN
M
CSHARRY
|
Director
|
February 27, 2018
|
||
|
Heather Ann McSharry
|
||||
|
/s/ S
EAMUS
C. M
ULLIGAN
|
Director
|
February 27, 2018
|
||
|
Seamus C. Mulligan
|
||||
|
/s/ K
ENNETH
W. O’
KEEFE
|
Director
|
February 27, 2018
|
||
|
Kenneth W. O’Keefe
|
||||
|
/s/
N
ORBERT
G
.
R
IEDEL,
P
H.
D
.
|
Director
|
February 27, 2018
|
||
|
Norbert G. Riedel, Ph.D.
|
||||
|
/s/ E
LMAR
S
CHNEE
|
Director
|
February 27, 2018
|
||
|
Elmar Schnee
|
||||
|
/s/ C
ATHERINE
A. S
OHN,
P
HARM
.D.
|
Director
|
February 27, 2018
|
||
|
Catherine A. Sohn, Pharm.D.
|
||||
|
/s/ R
ICK
E W
INNINGHAM
|
Director
|
February 27, 2018
|
||
|
Rick E Winningham
|
||||
122
Report of Independent Registered Public Accounting Firm
To the Shareholders and Board of Directors
Jazz Pharmaceuticals plc:
Opinion on the Consolidated Financial Statements
We have audited the accompanying consolidated balance sheets of Jazz Pharmaceuticals plc and subsidiaries (the “Company”) as of December 31, 2017 and 2016, the related consolidated statements of income, comprehensive income, shareholders’ equity, and cash flows for each of the years in the three-year period ended December 31, 2017 and the related notes and financial statement schedule at Item 15(a)2 (collectively, the “consolidated financial statements”). In our opinion, the consolidated financial statements present fairly, in all material respects, the financial position of the Company as of December 31, 2017 and 2016, and the results of its operations and its cash flows for each of the years in the three-year period ended December 31, 2017, in conformity with U.S. generally accepted accounting principles.
We also have audited, in accordance with the standards of the Public Company Accounting Oversight Board (United States) (“PCAOB”), the Company’s internal control over financial reporting as of December 31, 2017, based on criteria established in
Internal Control - Integrated Framework (2013)
issued by the Committee of Sponsoring Organizations of the Treadway Commission, and our report dated February 27, 2018 expressed an unqualified opinion on the effectiveness of the Company’s internal control over financial reporting.
Basis for Opinion
These consolidated financial statements are the responsibility of the Company’s management. Our responsibility is to express an opinion on these consolidated financial statements based on our audits. We are a public accounting firm registered with the PCAOB and are required to be independent with respect to the Company in accordance with the U.S. federal securities laws and the applicable rules and regulations of the Securities and Exchange Commission and the PCAOB.
We conducted our audits in accordance with the standards of the PCAOB. Those standards require that we plan and perform the audit to obtain reasonable assurance about whether the consolidated financial statements are free of material misstatement, whether due to error or fraud. Our audits included performing procedures to assess the risks of material misstatement of the consolidated financial statements, whether due to error or fraud, and performing procedures that respond to those risks. Such procedures include examining, on a test basis, evidence regarding the amounts and disclosures in the consolidated financial statements. Our audits also include evaluating the accounting principles used and significant estimates made by management, as well as evaluating the overall presentation of the consolidated financial statements. We believe that our audits provide a reasonable basis for our opinion.
/s/ KPMG
We have served as the Company’s auditor since 2012.
Dublin, Ireland
February 27, 2018
F-1
JAZZ PHARMACEUTICALS PLC
(In thousands, except per share amounts)
|
|
December 31,
|
||||||
|
|
2017
|
2016
|
|||||
|
ASSETS
|
|||||||
|
Current assets:
|
|||||||
|
Cash and cash equivalents
|
$
|
386,035
|
|
$
|
365,963
|
|
|
|
Investments
|
215,000
|
|
60,000
|
|
|||
|
Accounts receivable, net of allowances of $4,162 and $5,154 at December 31, 2017 and 2016, respectively
|
224,129
|
|
234,244
|
|
|||
|
Inventories
|
43,245
|
|
34,051
|
|
|||
|
Prepaid expenses
|
23,182
|
|
24,501
|
|
|||
|
Other current assets
|
76,686
|
|
29,310
|
|
|||
|
Total current assets
|
968,277
|
|
748,069
|
|
|||
|
Property and equipment, net
|
170,080
|
|
107,490
|
|
|||
|
Intangible assets, net
|
2,979,127
|
|
3,012,001
|
|
|||
|
Goodwill
|
947,537
|
|
893,810
|
|
|||
|
Deferred tax assets, net
|
34,559
|
|
15,060
|
|
|||
|
Deferred financing costs
|
7,673
|
|
9,737
|
|
|||
|
Other non-current assets
|
16,419
|
|
14,060
|
|
|||
|
Total assets
|
$
|
5,123,672
|
|
$
|
4,800,227
|
|
|
|
LIABILITIES AND SHAREHOLDERS’ EQUITY
|
|||||||
|
Current liabilities:
|
|||||||
|
Accounts payable
|
$
|
24,368
|
|
$
|
22,415
|
|
|
|
Accrued liabilities
|
198,779
|
|
193,268
|
|
|||
|
Current portion of long-term debt
|
40,605
|
|
36,094
|
|
|||
|
Income taxes payable
|
21,577
|
|
4,506
|
|
|||
|
Deferred revenue
|
8,618
|
|
1,123
|
|
|||
|
Total current liabilities
|
293,947
|
|
257,406
|
|
|||
|
Deferred revenue, non-current
|
16,115
|
|
2,601
|
|
|||
|
Long-term debt, less current portion
|
1,540,433
|
|
1,993,531
|
|
|||
|
Deferred tax liabilities, net
|
383,472
|
|
556,733
|
|
|||
|
Other non-current liabilities
|
176,608
|
|
112,617
|
|
|||
|
Commitments and contingencies (Note 13)
|
|
|
|||||
|
Shareholders’ equity:
|
|||||||
|
Ordinary shares, nominal value $0.0001 per share; 300,000 shares authorized; 59,898 and 59,820 shares issued and outstanding at December 31, 2017 and 2016, respectively
|
6
|
|
6
|
|
|||
|
Non-voting euro deferred shares, €0.01 par value per share; 4,000 shares authorized, issued and outstanding at both December 31, 2017 and 2016
|
55
|
|
55
|
|
|||
|
Capital redemption reserve
|
472
|
|
472
|
|
|||
|
Additional paid-in capital
|
1,935,486
|
|
1,665,232
|
|
|||
|
Accumulated other comprehensive loss
|
(140,878
|
)
|
(317,333
|
)
|
|||
|
Retained earnings
|
917,956
|
|
528,907
|
|
|||
|
Total shareholders’ equity
|
2,713,097
|
|
1,877,339
|
|
|||
|
Total liabilities and shareholders’ equity
|
$
|
5,123,672
|
|
$
|
4,800,227
|
|
|
The accompanying notes are an integral part of these consolidated financial statements.
F-2
JAZZ PHARMACEUTICALS PLC
(In thousands, except per share amounts)
|
Year Ended December 31,
|
|||||||||||
|
2017
|
2016
|
2015
|
|||||||||
|
Revenues:
|
|||||||||||
|
Product sales, net
|
$
|
1,601,399
|
|
$
|
1,477,261
|
|
$
|
1,316,819
|
|
||
|
Royalties and contract revenues
|
17,294
|
|
10,712
|
|
7,984
|
|
|||||
|
Total revenues
|
1,618,693
|
|
1,487,973
|
|
1,324,803
|
|
|||||
|
Operating expenses:
|
|||||||||||
|
Cost of product sales (excluding amortization and impairment of intangible assets)
|
110,188
|
|
105,386
|
|
102,526
|
|
|||||
|
Selling, general and administrative
|
544,156
|
|
502,892
|
|
449,119
|
|
|||||
|
Research and development
|
198,442
|
|
162,297
|
|
135,253
|
|
|||||
|
Acquired in-process research and development
|
85,000
|
|
23,750
|
|
—
|
|
|||||
|
Intangible asset amortization
|
152,065
|
|
101,994
|
|
98,162
|
|
|||||
|
Impairment charges
|
—
|
|
—
|
|
31,523
|
|
|||||
|
Total operating expenses
|
1,089,851
|
|
896,319
|
|
816,583
|
|
|||||
|
Income from operations
|
528,842
|
|
591,654
|
|
508,220
|
|
|||||
|
Interest expense, net
|
(77,756
|
)
|
(61,942
|
)
|
(56,917
|
)
|
|||||
|
Foreign exchange gain (loss)
|
(9,969
|
)
|
3,372
|
|
1,445
|
|
|||||
|
Loss on extinguishment and modification of debt
|
—
|
|
(638
|
)
|
(16,815
|
)
|
|||||
|
Income before income tax provision (benefit) and equity in loss of investees
|
441,117
|
|
532,446
|
|
435,933
|
|
|||||
|
Income tax provision (benefit)
|
(47,740
|
)
|
135,236
|
|
106,399
|
|
|||||
|
Equity in loss of investees
|
1,009
|
|
379
|
|
—
|
|
|||||
|
Net income
|
487,848
|
|
396,831
|
|
329,534
|
|
|||||
|
Net loss attributable to noncontrolling interests
|
—
|
|
—
|
|
(1
|
)
|
|||||
|
Net income attributable to Jazz Pharmaceuticals plc
|
$
|
487,848
|
|
$
|
396,831
|
|
$
|
329,535
|
|
||
|
Net income attributable to Jazz Pharmaceuticals plc per ordinary share:
|
|||||||||||
|
Basic
|
$
|
8.13
|
|
$
|
6.56
|
|
$
|
5.38
|
|
||
|
Diluted
|
$
|
7.96
|
|
$
|
6.41
|
|
$
|
5.23
|
|
||
|
Weighted-average ordinary shares used in per share calculations - basic
|
60,018
|
|
60,500
|
|
61,232
|
|
|||||
|
Weighted-average ordinary shares used in per share calculations - diluted
|
61,317
|
|
61,870
|
|
63,036
|
|
|||||
The accompanying notes are an integral part of these consolidated financial statements.
F-3
JAZZ PHARMACEUTICALS PLC
CONSOLIDATED STATEMENTS OF COMPREHENSIVE INCOME
(In thousands)
|
|
Year Ended December 31,
|
||||||||||
|
|
2017
|
2016
|
2015
|
||||||||
|
Net income
|
$
|
487,848
|
|
$
|
396,831
|
|
$
|
329,534
|
|
||
|
Other comprehensive income (loss):
|
|||||||||||
|
Foreign currency translation adjustments
|
174,973
|
|
(49,861
|
)
|
(145,375
|
)
|
|||||
|
Unrealized gain on hedging activities, net of tax expense of $212, $0 and $0, respectively
|
1,482
|
|
—
|
|
—
|
|
|||||
|
Other comprehensive income (loss)
|
176,455
|
|
(49,861
|
)
|
(145,375
|
)
|
|||||
|
Total comprehensive income
|
664,303
|
|
346,970
|
|
184,159
|
|
|||||
|
Comprehensive loss attributable to noncontrolling interests
|
—
|
|
—
|
|
(1
|
)
|
|||||
|
Comprehensive income attributable to Jazz Pharmaceuticals plc
|
$
|
664,303
|
|
$
|
346,970
|
|
$
|
184,160
|
|
||
The accompanying notes are an integral part of these consolidated financial statements.
F-4
JAZZ PHARMACEUTICALS PLC
CONSOLIDATED STATEMENTS OF SHAREHOLDERS’ EQUITY
(In thousands)
|
|
Ordinary Shares
|
Non-voting Euro Deferred
|
Capital Redemp-tion Reserve
|
Additional
Paid-in
Capital
|
Accumu-lated
Other
Compre-hensive
Income (Loss)
|
Retained Earnings
|
Total Jazz Pharma-ceuticals plc
Share-holders’
Equity
|
Non-control-ling interest
|
Total
Equity
|
||||||||||||||||||||||||||||||||
|
Shares
|
Amount
|
Shares
|
Amount
|
||||||||||||||||||||||||||||||||||||||
|
Balance at December 31, 2014
|
60,643
|
|
$
|
6
|
|
4,000
|
|
$
|
55
|
|
$
|
471
|
|
$
|
1,458,005
|
|
$
|
(122,097
|
)
|
$
|
34,704
|
|
$
|
1,371,144
|
|
$
|
64
|
|
$
|
1,371,208
|
|
||||||||||
|
Acquisition of noncontrolling interest
|
—
|
|
—
|
|
—
|
|
—
|
|
—
|
|
(10
|
)
|
—
|
|
—
|
|
(10
|
)
|
(63
|
)
|
(73
|
)
|
|||||||||||||||||||
|
Issuance of ordinary shares in conjunction with exercise of share options
|
732
|
|
—
|
|
—
|
|
—
|
|
—
|
|
32,982
|
|
—
|
|
—
|
|
32,982
|
|
—
|
|
32,982
|
|
|||||||||||||||||||
|
Issuance of ordinary shares under employee stock purchase plan
|
75
|
|
—
|
|
—
|
|
—
|
|
—
|
|
7,541
|
|
—
|
|
—
|
|
7,541
|
|
—
|
|
7,541
|
|
|||||||||||||||||||
|
Issuance of ordinary shares in conjunction with vesting of restricted stock units
|
265
|
|
—
|
|
—
|
|
—
|
|
—
|
|
—
|
|
—
|
|
—
|
|
—
|
|
—
|
|
—
|
|
|||||||||||||||||||
|
Shares withheld for payment of employee's withholding tax liability
|
—
|
|
—
|
|
—
|
|
—
|
|
—
|
|
(26,102
|
)
|
—
|
|
—
|
|
(26,102
|
)
|
—
|
|
(26,102
|
)
|
|||||||||||||||||||
|
Share-based compensation
|
—
|
|
—
|
|
—
|
|
—
|
|
—
|
|
91,795
|
|
—
|
|
—
|
|
91,795
|
|
—
|
|
91,795
|
|
|||||||||||||||||||
|
Excess tax benefits from employee share options
|
—
|
|
—
|
|
—
|
|
—
|
|
—
|
|
(1,311
|
)
|
—
|
|
—
|
|
(1,311
|
)
|
—
|
|
(1,311
|
)
|
|||||||||||||||||||
|
Shares repurchased
|
(410
|
)
|
—
|
|
—
|
|
—
|
|
—
|
|
—
|
|
—
|
|
(61,553
|
)
|
(61,553
|
)
|
—
|
|
(61,553
|
)
|
|||||||||||||||||||
|
Other comprehensive loss
|
—
|
|
—
|
|
—
|
|
—
|
|
—
|
|
—
|
|
(145,375
|
)
|
—
|
|
(145,375
|
)
|
—
|
|
(145,375
|
)
|
|||||||||||||||||||
|
Net income
|
—
|
|
—
|
|
—
|
|
—
|
|
—
|
|
—
|
|
—
|
|
329,535
|
|
329,535
|
|
(1
|
)
|
329,534
|
|
|||||||||||||||||||
|
Balance at December 31, 2015
|
61,305
|
|
$
|
6
|
|
4,000
|
|
$
|
55
|
|
$
|
471
|
|
$
|
1,562,900
|
|
$
|
(267,472
|
)
|
$
|
302,686
|
|
$
|
1,598,646
|
|
$
|
—
|
|
$
|
1,598,646
|
|
||||||||||
F-5
JAZZ PHARMACEUTICALS PLC
CONSOLIDATED STATEMENTS OF SHAREHOLDERS’ EQUITY—(Continued)
(In thousands)
|
|
Ordinary Shares
|
Non-voting Euro Deferred
|
Capital Redemp-tion Reserve
|
Additional
Paid-in
Capital
|
Accumu-lated
Other
Compre-hensive
Income (Loss)
|
Retained Earnings
|
Total
Equity
|
||||||||||||||||||||||||||
|
Shares
|
Amount
|
Shares
|
Amount
|
||||||||||||||||||||||||||||||
|
Balance at December 31, 2015
|
61,305
|
|
$
|
6
|
|
4,000
|
|
$
|
55
|
|
$
|
471
|
|
$
|
1,562,900
|
|
$
|
(267,472
|
)
|
$
|
302,686
|
|
$
|
1,598,646
|
|
||||||||
|
Cumulative effect adjustment from adoption of ASU No. 2016-09
|
—
|
|
—
|
|
—
|
|
—
|
|
—
|
|
—
|
|
—
|
|
107,687
|
|
107,687
|
|
|||||||||||||||
|
Issuance of ordinary shares in conjunction with exercise of share options
|
399
|
|
—
|
|
—
|
|
—
|
|
—
|
|
16,880
|
|
—
|
|
—
|
|
16,880
|
|
|||||||||||||||
|
Issuance of ordinary shares under employee stock purchase plan
|
70
|
|
—
|
|
—
|
|
—
|
|
—
|
|
7,294
|
|
—
|
|
—
|
|
7,294
|
|
|||||||||||||||
|
Issuance of ordinary shares in conjunction with vesting of restricted stock units
|
289
|
|
—
|
|
—
|
|
—
|
|
—
|
|
—
|
|
—
|
|
—
|
|
—
|
|
|||||||||||||||
|
Shares withheld for payment of employee's withholding tax liability
|
—
|
|
—
|
|
—
|
|
—
|
|
—
|
|
(21,234
|
)
|
—
|
|
—
|
|
(21,234
|
)
|
|||||||||||||||
|
Share-based compensation
|
—
|
|
—
|
|
—
|
|
—
|
|
—
|
|
99,392
|
|
—
|
|
—
|
|
99,392
|
|
|||||||||||||||
|
Shares repurchased
|
(2,243
|
)
|
—
|
|
—
|
|
—
|
|
1
|
|
—
|
|
—
|
|
(278,297
|
)
|
(278,296
|
)
|
|||||||||||||||
|
Other comprehensive loss
|
—
|
|
—
|
|
—
|
|
—
|
|
—
|
|
—
|
|
(49,861
|
)
|
—
|
|
(49,861
|
)
|
|||||||||||||||
|
Net income
|
—
|
|
—
|
|
—
|
|
—
|
|
—
|
|
—
|
|
—
|
|
396,831
|
|
396,831
|
|
|||||||||||||||
|
Balance at December 31, 2016
|
59,820
|
|
$
|
6
|
|
4,000
|
|
$
|
55
|
|
$
|
472
|
|
$
|
1,665,232
|
|
$
|
(317,333
|
)
|
$
|
528,907
|
|
$
|
1,877,339
|
|
||||||||
F-6
JAZZ PHARMACEUTICALS PLC
CONSOLIDATED STATEMENTS OF SHAREHOLDERS’ EQUITY—(Continued)
(In thousands)
|
|
Ordinary Shares
|
Non-voting Euro Deferred
|
Capital Redemp-tion Reserve
|
Additional
Paid-in
Capital
|
Accumu-lated
Other
Compre-hensive
Income (Loss)
|
Retained Earnings
|
Total
Equity
|
||||||||||||||||||||||||||
|
Shares
|
Amount
|
Shares
|
Amount
|
||||||||||||||||||||||||||||||
|
Balance at December 31, 2016
|
59,820
|
|
$
|
6
|
|
4,000
|
|
$
|
55
|
|
$
|
472
|
|
$
|
1,665,232
|
|
$
|
(317,333
|
)
|
$
|
528,907
|
|
$
|
1,877,339
|
|
||||||||
|
Issuance of Exchangeable Senior Notes
|
—
|
|
—
|
|
—
|
|
—
|
|
—
|
|
149,767
|
|
—
|
|
—
|
|
149,767
|
|
|||||||||||||||
|
Issuance of ordinary shares in conjunction with exercise of share options
|
428
|
|
—
|
|
—
|
|
—
|
|
—
|
|
22,683
|
|
—
|
|
—
|
|
22,683
|
|
|||||||||||||||
|
Issuance of ordinary shares under employee stock purchase plan
|
104
|
|
—
|
|
—
|
|
—
|
|
—
|
|
9,141
|
|
—
|
|
—
|
|
9,141
|
|
|||||||||||||||
|
Issuance of ordinary shares in conjunction with vesting of restricted stock units
|
250
|
|
—
|
|
—
|
|
—
|
|
—
|
|
—
|
|
—
|
|
—
|
|
—
|
|
|||||||||||||||
|
Shares withheld for payment of employee's withholding tax liability
|
—
|
|
—
|
|
—
|
|
—
|
|
—
|
|
(18,589
|
)
|
—
|
|
—
|
|
(18,589
|
)
|
|||||||||||||||
|
Share-based compensation
|
—
|
|
—
|
|
—
|
|
—
|
|
—
|
|
107,252
|
|
—
|
|
—
|
|
107,252
|
|
|||||||||||||||
|
Shares repurchased
|
(704
|
)
|
—
|
|
—
|
|
—
|
|
—
|
|
—
|
|
—
|
|
(98,799
|
)
|
(98,799
|
)
|
|||||||||||||||
|
Other comprehensive income
|
—
|
|
—
|
|
—
|
|
—
|
|
—
|
|
—
|
|
176,455
|
|
—
|
|
176,455
|
|
|||||||||||||||
|
Net income
|
—
|
|
—
|
|
—
|
|
—
|
|
—
|
|
—
|
|
—
|
|
487,848
|
|
487,848
|
|
|||||||||||||||
|
Balance at December 31, 2017
|
59,898
|
|
$
|
6
|
|
4,000
|
|
$
|
55
|
|
$
|
472
|
|
$
|
1,935,486
|
|
$
|
(140,878
|
)
|
$
|
917,956
|
|
$
|
2,713,097
|
|
||||||||
The accompanying notes are an integral part of these consolidated financial statements.
F-7
JAZZ PHARMACEUTICALS PLC
(In thousands)
|
|
Year Ended December 31,
|
||||||||||
|
|
2017
|
2016
|
2015
|
||||||||
|
Operating activities
|
|||||||||||
|
Net income
|
$
|
487,848
|
|
$
|
396,831
|
|
$
|
329,534
|
|
||
|
Adjustments to reconcile net income to net cash provided by operating activities:
|
|||||||||||
|
Intangible asset amortization
|
152,065
|
|
101,994
|
|
98,162
|
|
|||||
|
Share-based compensation
|
106,900
|
|
98,771
|
|
91,550
|
|
|||||
|
Impairment charges
|
—
|
|
—
|
|
31,523
|
|
|||||
|
Depreciation
|
13,089
|
|
11,786
|
|
9,894
|
|
|||||
|
Acquired in-process research and development
|
85,000
|
|
23,750
|
|
—
|
|
|||||
|
Loss on disposal of property and equipment
|
473
|
|
47
|
|
172
|
|
|||||
|
Deferred income taxes
|
(225,591
|
)
|
(41,163
|
)
|
(68,358
|
)
|
|||||
|
Provision for losses on accounts receivable and inventory
|
2,190
|
|
2,209
|
|
4,062
|
|
|||||
|
Loss on extinguishment and modification of debt
|
—
|
|
638
|
|
16,815
|
|
|||||
|
Amortization of debt discount and deferred financing costs
|
30,026
|
|
22,133
|
|
22,738
|
|
|||||
|
Other non-cash transactions
|
14,321
|
|
(3,741
|
)
|
(5,187
|
)
|
|||||
|
Changes in assets and liabilities:
|
|||||||||||
|
Accounts receivable
|
12,278
|
|
(25,603
|
)
|
(24,841
|
)
|
|||||
|
Inventories
|
(8,667
|
)
|
(17,024
|
)
|
6,271
|
|
|||||
|
Prepaid expenses and other current assets
|
(26,874
|
)
|
(15,700
|
)
|
3,720
|
|
|||||
|
Other long-term assets
|
119
|
|
267
|
|
(4,573
|
)
|
|||||
|
Accounts payable
|
214
|
|
361
|
|
(2,280
|
)
|
|||||
|
Accrued liabilities
|
(6,578
|
)
|
11,989
|
|
2,986
|
|
|||||
|
Income taxes payable
|
16,331
|
|
2,962
|
|
(6,271
|
)
|
|||||
|
Deferred revenue
|
21,009
|
|
(1,315
|
)
|
(536
|
)
|
|||||
|
Other non-current liabilities
|
18,934
|
|
23,199
|
|
26,562
|
|
|||||
|
Net cash provided by operating activities
|
693,087
|
|
592,391
|
|
531,943
|
|
|||||
|
Investing activities
|
|||||||||||
|
Acquisition of investments
|
(385,000
|
)
|
(132,181
|
)
|
—
|
|
|||||
|
Proceeds from maturity of investments
|
230,000
|
|
66,906
|
|
—
|
|
|||||
|
Acquired in-process research and development
|
(85,000
|
)
|
(23,750
|
)
|
—
|
|
|||||
|
Purchases of property and equipment
|
(28,950
|
)
|
(9,687
|
)
|
(35,958
|
)
|
|||||
|
Acquisitions, net of cash acquired
|
—
|
|
(1,502,443
|
)
|
—
|
|
|||||
|
Acquisition of intangible assets
|
—
|
|
(150,000
|
)
|
—
|
|
|||||
|
Net proceeds from sale of business
|
—
|
|
—
|
|
33,703
|
|
|||||
|
Net cash used in investing activities
|
(268,950
|
)
|
(1,751,155
|
)
|
(2,255
|
)
|
|||||
|
Financing activities
|
|||||||||||
|
Net proceeds from issuance of debt
|
559,393
|
|
994,647
|
|
898,642
|
|
|||||
|
Proceeds from employee equity incentive and purchase plans
|
31,824
|
|
24,174
|
|
40,523
|
|
|||||
|
Share repurchases
|
(98,799
|
)
|
(278,296
|
)
|
(61,553
|
)
|
|||||
|
Payment of employee withholding taxes related to share-based awards
|
(18,589
|
)
|
(21,234
|
)
|
(26,102
|
)
|
|||||
|
Repayments of long-term debt
|
(36,094
|
)
|
(28,304
|
)
|
(905,760
|
)
|
|||||
|
Repayments under revolving credit facility
|
(850,000
|
)
|
(150,000
|
)
|
(160,000
|
)
|
|||||
|
Proceeds from tenant improvement allowance on build-to-suit lease
|
3,154
|
|
—
|
|
—
|
|
|||||
|
Acquisition of noncontrolling interests
|
—
|
|
—
|
|
(73
|
)
|
|||||
|
Net cash provided by (used in) financing activities
|
(409,111
|
)
|
540,987
|
|
(214,323
|
)
|
|||||
|
Effect of exchange rates on cash and cash equivalents
|
5,046
|
|
(5,045
|
)
|
(10,622
|
)
|
|||||
|
Net increase (decrease) in cash and cash equivalents
|
20,072
|
|
(622,822
|
)
|
304,743
|
|
|||||
|
Cash and cash equivalents, at beginning of period
|
365,963
|
|
988,785
|
|
684,042
|
|
|||||
|
Cash and cash equivalents, at end of period
|
$
|
386,035
|
|
$
|
365,963
|
|
$
|
988,785
|
|
||
F-8
JAZZ PHARMACEUTICALS PLC
CONSOLIDATED STATEMENTS OF CASH FLOWS—(Continued)
(In thousands)
|
Year Ended December 31,
|
|||||||||||
|
2017
|
2016
|
2015
|
|||||||||
|
Supplemental disclosure of cash flow information:
|
|||||||||||
|
Cash paid for interest
|
$
|
44,609
|
|
$
|
39,898
|
|
$
|
40,099
|
|
||
|
Cash paid for income taxes
|
174,124
|
|
160,306
|
|
145,597
|
|
|||||
|
Non-cash investing activities:
|
|||||||||||
|
Amounts capitalized in connection with facility lease obligations
|
40,970
|
|
23,799
|
|
4,351
|
|
|||||
The accompanying notes are an integral part of these consolidated financial statements.
F-9
JAZZ PHARMACEUTICALS PLC
NOTES TO CONSOLIDATED FINANCIAL STATEMENTS
1. Organization and Description of Business
Jazz Pharmaceuticals plc is an international biopharmaceutical company focused on improving patients’ lives by identifying, developing and commercializing meaningful products that address unmet medical needs.
We have a diverse portfolio of products and product candidates, with a focus in the areas of sleep and hematology/oncology. Our lead marketed products are:
|
•
|
Xyrem
®
(sodium oxybate) oral solution
, the only product approved by the U.S. Food and Drug Administration, or FDA, and marketed in the U.S. for the treatment of both cataplexy and excessive daytime sleepiness, or EDS, in patients with narcolepsy;
|
|
•
|
Erwinaze
®
(asparaginase
Erwinia chrysanthemi
)
, a treatment approved in the U.S. and in certain markets in Europe (where it is marketed as Erwinase
®
) for patients with acute lymphoblastic leukemia, or ALL, who have developed hypersensitivity to
E. coli
-derived asparaginase;
|
|
•
|
Defitelio
®
(defibrotide sodium)
, a product approved in the U.S. for the treatment of adult and pediatric patients with hepatic veno-occlusive disease, or VOD, also known as sinusoidal obstruction syndrome, or SOS, with renal or pulmonary dysfunction following hematopoietic stem cell transplantation, or HSCT, and in Europe (where it is marketed as Defitelio
®
(defibrotide)) for the treatment of severe VOD in adults and children undergoing HSCT therapy; and
|
|
•
|
Vyxeos
®
(daunorubicin and cytarabine) liposome for injection
, a product approved in the U.S. for the treatment of adults with newly-diagnosed therapy-related acute myeloid leukemia, or t-AML, or acute myeloid leukemia, or AML, with myelodysplasia-related changes, or AML-MRC.
|
Our strategy is to create shareholder value by:
|
•
|
Growing sales of the existing products in our portfolio, including by identifying and investing in growth opportunities such as new treatment indications and new geographic markets;
|
|
•
|
Acquiring or licensing rights to clinically meaningful and differentiated products on the market or product candidates at various stages of development; and
|
|
•
|
Pursuing targeted development of post-discovery differentiated product candidates.
|
We apply a disciplined approach to allocating our resources between investments in our current commercial and development portfolio and acquisitions or in-licensing of new assets.
Throughout this report, unless otherwise indicated or the context otherwise requires, all references to “Jazz Pharmaceuticals,” “the registrant,” “we,” “us,” and “our” refer to Jazz Pharmaceuticals plc and its consolidated subsidiaries. Throughout this report, all references to “ordinary shares” refer to Jazz Pharmaceuticals plc’s ordinary shares.
2. Summary of Significant Accounting Policies
Basis of Presentation
The consolidated financial statements have been prepared in accordance with U.S. generally accepted accounting principles, or U.S. GAAP, and include the accounts of Jazz Pharmaceuticals plc and our subsidiaries and intercompany transactions and balances have been eliminated. Our consolidated financial statements include the results of operations of businesses we have acquired from the date of each acquisition for the applicable reporting periods.
Significant Risks and Uncertainties
Our financial results are significantly influenced by sales of Xyrem. Our ability to maintain or increase Xyrem product sales is subject to a number of risks and uncertainties, including, without limitation, the potential introduction of a generic version of Xyrem before the entry dates specified in, or on terms different from those contemplated by, our settlements with companies seeking to obtain or that have obtained regulatory approval to market generic versions of Xyrem; the potential introduction of new products that compete with Xyrem; ongoing patent litigation and related proceedings; changed or increased regulatory restrictions, including with respect to the Xyrem risk evaluation and mitigation strategy, or REMS; any increase in pricing pressure from, changes in policies by, or restrictions on reimbursement imposed by, third party payors; operational disruptions at the Xyrem central pharmacy; and continued acceptance of Xyrem by physicians and patients.
F-10
In addition to risks related specifically to Xyrem, we are subject to other challenges and risks specific to our business and our ability to execute on our strategy, as well as risks and uncertainties common to companies in the pharmaceutical industry with development and commercial operations, including, without limitation, risks and uncertainties associated with: effectively commercializing our other products and product candidates; pharmaceutical product development and the inherent uncertainty of clinical success; the regulatory approval process; the challenges of protecting and enhancing our intellectual property rights; our dependence on sole source suppliers for most of our products, including the risk of delays or problems in the supply or manufacture of our products and product candidates; competition; complying with applicable regulatory requirements; changes in healthcare laws and policy and related reforms; government investigations and other actions; obtaining and maintaining appropriate pricing and reimbursement for our products; business combination or product or product candidate acquisition transactions; and possible restrictions on our ability and flexibility to pursue certain future opportunities as a result of our substantial outstanding debt obligations.
Business Acquisitions
Our consolidated financial statements include the results of operations of an acquired business from the date of acquisition. We account for acquired businesses using the acquisition method of accounting. The acquisition method of accounting for acquired businesses requires, among other things, that assets acquired, liabilities assumed and any noncontrolling interests in the acquired business be recognized at their estimated fair values as of the acquisition date, with limited exceptions, and that the fair value of acquired in-process research and development, or IPR&D, be recorded on the balance sheet. Also, transaction costs are expensed as incurred. Any excess of the acquisition consideration over the assigned values of the net assets acquired is recorded as goodwill. Contingent consideration is included within the acquisition cost and is recognized at its fair value on the acquisition date. A liability resulting from contingent consideration is remeasured to fair value at each reporting date until the contingency is resolved and changes in fair value are recognized in earnings.
Concentrations of Risk
Financial instruments that potentially subject us to concentrations of credit risk consist of cash, cash equivalents, investments and derivative contracts. Our investment policy permits investments in U.S. federal government and federal agency securities, corporate bonds or commercial paper issued by U.S. corporations, money market instruments, certain qualifying money market mutual funds, certain repurchase agreements, and tax-exempt obligations of U.S. states, agencies and municipalities and places restrictions on credit ratings, maturities, and concentration by type and issuer. We are exposed to credit risk in the event of a default by the financial institutions holding our cash, cash equivalents and investments to the extent recorded on the balance sheet.
We manage our foreign currency transaction risk and interest rate risk within specified guidelines through the use of derivatives. All of our derivative instruments are utilized for risk management purposes, and we do not use derivatives for speculative trading purposes. As of
December 31, 2017
, we had foreign exchange forward contracts with notional amounts totaling
$98.7 million
. As of
December 31, 2017
, the net asset fair value of outstanding foreign exchange forward contracts was
$10.5 million
. As of
December 31, 2017
, we had interest rate swap contracts with notional amounts totaling
$300.0 million
. These outstanding interest rate swap contracts had a net asset fair value of
$1.7 million
as of
December 31, 2017
. The counterparties to these contracts are large multinational commercial banks, and we believe the risk of nonperformance is not material.
We are also subject to credit risk from our accounts receivable related to our product sales. We monitor our exposure within accounts receivable and record a reserve against uncollectible accounts receivable as necessary. We extend credit to pharmaceutical wholesale distributors and specialty pharmaceutical distribution companies, primarily in the U.S., and to other international distributors and hospitals. Customer creditworthiness is monitored and collateral is not required. We monitor deteriorating economic conditions in certain European countries which may result in variability of the timing of cash receipts and an increase in the average length of time that it takes to collect accounts receivable outstanding. Historically, we have not experienced significant credit losses on our accounts receivable. As of
December 31, 2017
,
five
customers accounted for
90%
of gross accounts receivable including Express Scripts Specialty Distribution Services, Inc. and its affiliates, or Express Scripts, which accounted for
71%
of gross accounts receivable, and McKesson Corporation and affiliates, or McKesson, which accounted for
15%
of gross accounts receivable. As of
December 31, 2016
,
five
customers accounted for
90%
of gross accounts receivable including Express Scripts, which accounted for
73%
of gross accounts receivable, and McKesson, which accounted for
13%
of gross accounts receivable.
We depend on single source suppliers for most of our products, product candidates and their active pharmaceutical ingredients, or APIs. With respect to Xyrem, the API is manufactured for us by a single source supplier and the finished product is manufactured both by us in our facility in Athlone, Ireland and by our U.S.-based Xyrem supplier.
F-11
Cash Equivalents and Investments
We consider all highly liquid investments, readily convertible to cash, that mature within three months or less from date of purchase to be cash equivalents.
Investments consist of time deposits with initial maturities of greater than three months. Collectively, cash equivalents and investments are considered available-for-sale and are recorded at fair value. Unrealized gains and losses, net of tax, are recorded in accumulated other comprehensive loss in shareholders’ equity. We use the specific-identification method for calculating realized gains and losses on securities sold. Realized gains and losses and declines in value judged to be other than temporary on investments are included in interest expense, net in the consolidated statements of income.
Derivative Instruments and Hedging Activities
We record the fair value of derivative instruments as either assets or liabilities on the consolidated balance sheets. Changes in the fair value of derivative instruments are recorded each period in current earnings or other comprehensive income (loss), depending on whether a derivative instrument is designated as part of a hedging transaction and, if it is, the type of hedging transaction. For a derivative to qualify as a hedge at inception and throughout the hedged period, we formally document the nature and relationships between the hedging instruments and hedged item. We assess, both at inception and on an on-going basis, whether the derivative instruments that are used in cash flow hedging transactions are highly effective in offsetting the changes in cash flows of hedged items. We assess hedge ineffectiveness on a quarterly basis and record the gain or loss related to the ineffective portion of derivative instruments, if any, to current earnings. If we determine that a forecasted transaction is no longer probable of occurring, we discontinue hedge accounting and any related unrealized gain or loss on the derivative instrument is recognized in current earnings. Derivatives that are not designated and do not qualify as hedges are adjusted to fair value through current earnings.
Inventories
Inventories are valued at the lower of cost or net realizable value. Cost is determined using the first-in, first-out method for all inventories. Our policy is to write down inventory that has become obsolete, inventory that has a cost basis in excess of its expected net realizable value and inventory in excess of expected requirements. The estimate of excess quantities is subjective and primarily dependent on our estimates of future demand for a particular product. If our estimate of future demand changes, we consider the impact on the reserve for excess inventory and adjust the reserve as required. Increases in the reserve are recorded as charges in cost of product sales. For product candidates that have not been approved by the FDA, inventory used in clinical trials is expensed at the time of production and recorded as research and development expense. For products that have been approved by the FDA, inventory used in clinical trials is expensed at the time the inventory is packaged for the clinical trial. Prior to receiving FDA approval, costs related to purchases of the API and the manufacturing of the product candidate are recorded as research and development expense. All direct manufacturing costs incurred after approval are capitalized into inventory.
Property and Equipment
Property and equipment are stated at cost, less accumulated depreciation. Depreciation is computed using the straight-line method over the estimated useful lives of the assets. Estimated useful lives are as follows:
|
Buildings
|
40 years
|
|
Manufacturing equipment and machinery
|
5-10 years
|
|
Computer software and equipment
|
3 years
|
|
Furniture and fixtures
|
5 years
|
Leasehold improvements and the build-to-suit facility are amortized over the shorter of the noncancelable term of our leases or their economic useful lives. Maintenance and repairs are expensed as incurred.
Operating Leases and Financing Obligations
We recognize rent expense under operating leases on a straight-line basis over the term of the lease with the difference between the expense and cash payments recorded as deferred rent on the consolidated balance sheets.
For certain build-to-suit lease arrangements where we have concluded that we are the “deemed owner” of the building, for accounting purposes only, during the construction period, we are required to record an asset with a corresponding financing obligation for the construction costs incurred by the landlord. The financing obligation is recorded as a component of other non-current liabilities in the consolidated balance sheets. We increase the asset and financing obligation as additional building costs are incurred by the landlord during the construction period. Once construction is complete, we evaluate whether the asset
F-12
qualifies for sale-leaseback accounting treatment. If the lease meets the sale-leaseback criteria, we remove the asset and the related liability from the consolidated balance sheets and treat the lease as either an operating or capital lease based on an assessment of the accounting guidance. If the arrangement does not qualify for sale-leaseback treatment, we reduce the financing obligation over the lease term as payments are made and depreciate the asset over its estimated useful life or lease term, whichever is shorter. Future lease payments associated with build-to-suit leases where we are the deemed owner are allocated between the land and building components. The portion of the lease payments allocated to the land is treated for accounting purposes as operating lease payments, and therefore is recorded as rent expense in the consolidated statements of income. The portion of the lease payments allocated to the building is further bifurcated into a portion allocated to interest expense and a portion allocated to reduce the build-to-suit financing obligation.
Goodwill
Goodwill represents the excess of the acquisition consideration over the fair value of assets acquired and liabilities assumed. We have determined that we operate in a single segment and have a single reporting unit associated with the development and commercialization of pharmaceutical products. The annual test for goodwill impairment is a two-step process. The first step is a comparison of the fair value of the reporting unit with its carrying amount, including goodwill. If this step indicates impairment, then, in the second step, the loss is measured as the excess of recorded goodwill over its implied fair value. Implied fair value is the excess of the fair value of the reporting unit over the fair value of all identified assets and liabilities. We test goodwill for impairment annually in October and when events or changes in circumstances indicate that the carrying value may not be recoverable.
Acquired In-Process Research and Development
The initial costs of rights to IPR&D projects acquired in an asset acquisition are expensed as IPR&D unless the project has an alternative future use. The fair value of IPR&D projects acquired in a business combination are capitalized and accounted for as indefinite-lived intangible assets until the underlying project receives regulatory approval, at which point the intangible asset will be accounted for as a finite-lived intangible asset, or discontinued, at which point the intangible asset will be written off. Development costs incurred after an acquisition are expensed as incurred.
Intangible Assets
Intangible assets with finite useful lives consist primarily of purchased developed technology and are amortized on a straight-line basis over their estimated useful lives, which range from
two
to
18
years. The estimated useful lives associated with finite-lived intangible assets are consistent with the estimated lives of the associated products and may be modified when circumstances warrant. Such assets are reviewed for impairment when events or circumstances indicate that the carrying value of an asset may not be recoverable. An impairment loss would be recognized when estimated undiscounted future cash flows expected to result from the use of an asset and its eventual disposition are less than its carrying amount. The amount of any impairment is measured as the difference between the carrying amount and the fair value of the impaired asset.
Revenue Recognition
Revenues are recognized when there is persuasive evidence that an arrangement exists, delivery has occurred, the price is fixed and determinable and collection is reasonably assured.
Product Sales, Net
Product sales revenue is recognized when title has transferred to the customer and the customer has assumed the risks and rewards of ownership, which is typically on delivery to the customer or, in the case of products that are subject to consignment agreements, when the customer removes product from our consigned inventory location for shipment directly to a patient.
Revenue from sales transactions where the buyer has the right to return the product is recognized at the time of sale only if (i) the seller’s price to the buyer is substantially fixed or determinable at the date of sale, (ii) the buyer has paid the seller, or the buyer is obligated to pay the seller and the obligation is not contingent on resale of the product, (iii) the buyer’s obligation to the seller would not be changed in the event of theft or physical destruction or damage of the product, (iv) the buyer acquiring the product for resale has economic substance apart from that provided by the seller, (v) the seller does not have significant obligations for future performance to directly bring about resale of the product by the buyer, and (vi) the amount of future returns can be reasonably estimated.
Revenues from sales of products are recorded net of estimated allowances for returns, specialty distributor fees, wholesaler fees, prompt payment discounts, government rebates, government chargebacks, coupon programs and rebates under managed care plans. Provisions for returns, specialty distributor fees, wholesaler fees, government rebates, coupon programs and rebates under managed care plans are included within current liabilities in our consolidated balance sheets. Provisions for government chargebacks and prompt payment discounts are generally shown as a reduction in accounts receivable. Calculating
F-13
certain of these items involves estimates and judgments based on sales or invoice data, contractual terms, historical utilization rates, new information regarding changes in these programs’ regulations and guidelines that would impact the amount of the actual rebates, our expectations regarding future utilization rates for these programs and channel inventory data. Adjustments to estimates for these allowances have not been material.
Royalties and Contract Revenues
We receive royalties from third parties based on sales of our products under licensing and distribution arrangements. For those arrangements where royalties are reasonably estimable, we recognize revenues based on estimates of royalties earned during the applicable period, and adjust for differences between the estimated and actual royalties in the following quarter. Historically, these adjustments have not been significant.
Our contract revenues consist of fees and milestone payments. Non-refundable fees where we have no continuing performance obligations are recognized as revenues when there is persuasive evidence of an arrangement and collection is reasonably assured. In situations where we have continuing performance obligations, non-refundable fees are deferred and are recognized ratably over our projected performance period. We recognize at-risk milestone payments, which are typically related to regulatory, commercial or other achievements by us or our licensees and distributors, as revenues when the milestone is accomplished and collection is reasonably assured. Sales-based milestone payments are typically payments made to us that are triggered when aggregate net sales of a product by a collaborator for a specified period (for example, an annual period) reach an agreed upon threshold amount. We recognize sales-based milestone payments from a collaborator when the event which triggers the obligation of payment has occurred, there is no further obligation on our part in connection with the payment, and collection is reasonably assured. Refundable fees are deferred and recognized as revenues upon the later of when they become nonrefundable or when our performance obligations are completed.
Cost of Product Sales
Cost of product sales includes manufacturing and distribution costs, the cost of drug substance, royalties due to third parties on product sales, product liability and cargo insurance, FDA user fees, freight, shipping, handling and storage costs and salaries and related costs of employees involved with production. Excluded from cost of product sales shown on the consolidated statements of income is amortization of acquired developed technology of
$149.1 million
,
$99.0 million
and
$93.0 million
in
2017
,
2016
and
2015
, respectively.
Research and Development
Research and development expenses consist primarily of costs related to clinical studies and outside services, personnel expenses and other research and development costs, including milestone payments incurred prior to regulatory approval of products. Clinical study and outside services costs relate primarily to services performed by clinical research organizations, clinical studies performed at clinical sites, materials and supplies, and other third party fees. Personnel expenses relate primarily to salaries, benefits and share-based compensation. Other research and development expenses primarily include overhead allocations consisting of various support and facilities-related costs. Research and development costs are expensed as incurred. For product candidates that have not been approved by the FDA, inventory used in clinical trials is expensed at the time of production and recorded as research and development expense. For products that have been approved by the FDA, inventory used in clinical trials is expensed at the time the inventory is packaged for the trial.
Advertising Expenses
We expense the costs of advertising, including promotional expenses, as incurred. Advertising expenses were
$36.6 million
,
$29.5 million
and
$27.9 million
in
2017
,
2016
and
2015
, respectively.
Income Taxes
We use the asset and liability method of accounting for income taxes. Under this method, deferred tax assets and liabilities are determined based on differences between the financial statement carrying amount and the tax basis of assets and liabilities and are measured using enacted tax rates and laws that will be in effect when the differences are expected to reverse. A valuation allowance is provided when it is more-likely-than-not that some portion or all of a deferred tax asset will not be realized. We recognize the benefits of a tax position if it is “more-likely-than-not” of being sustained. A recognized tax benefit is then measured at the largest amount of benefit that is greater than fifty percent likely of being realized upon settlement. Interest and penalties related to unrecognized tax benefits are included in the income tax provision and classified with the related liability on the consolidated balance sheets.
F-14
Foreign Currency
Our functional and reporting currency is the U.S. dollar. The assets and liabilities of our subsidiaries that have a functional currency other than the U.S. dollar are translated into U.S. dollars at the exchange rate prevailing at the balance sheet date with the results of operations of subsidiaries translated at the average exchange rate for the reporting period. The cumulative foreign currency translation adjustment is recorded as a component of accumulated other comprehensive income (loss) in shareholders’ equity.
Transactions in foreign currencies are translated into the functional currency of the relevant subsidiary at the rate of exchange prevailing at the date of the transaction. Any monetary assets and liabilities arising from these transactions are translated into the relevant functional currency at exchange rates prevailing at the balance sheet date or on settlement. Resulting gains and losses are recorded in foreign exchange gain (loss) in our consolidated statements of income.
Deferred Financing Costs
Deferred financing costs are reported at cost, less accumulated amortization and are presented in the consolidated balance sheets as a direct deduction from the carrying value of the associated debt, with the exception of deferred financing costs associated with revolving-debt arrangements which are presented as assets. The related amortization expense is included in interest expense, net in our consolidated statements of income.
Contingencies
From time to time, we may become involved in claims and other legal matters arising in the ordinary course of business. We record accruals for loss contingencies to the extent that we conclude that it is probable that a liability has been incurred and the amount of the related loss can be reasonably estimated. Legal fees and other expenses related to litigation are expensed as incurred and included in selling, general and administrative expenses.
Use of Estimates
The preparation of financial statements in conformity with U.S. GAAP, requires management to make estimates and assumptions that affect the reported amounts of assets, liabilities, revenues and expenses, and related disclosures in the consolidated financial statements and accompanying notes. Management bases its estimates on historical experience and on assumptions believed to be reasonable under the circumstances. Actual results could differ materially from those estimates.
Net Income per Ordinary Share
Basic net income per ordinary share attributable to Jazz Pharmaceuticals plc is based on the weighted-average number of ordinary shares outstanding. Diluted net income per ordinary share attributable to Jazz Pharmaceuticals plc is based on the weighted-average number of ordinary shares outstanding and potentially dilutive ordinary shares outstanding.
Basic and diluted net income per ordinary share attributable to Jazz Pharmaceuticals plc were computed as follows (in thousands, except per share amounts):
|
|
Year Ended December 31,
|
||||||||||
|
|
2017
|
2016
|
2015
|
||||||||
|
Numerator:
|
|||||||||||
|
Net income attributable to Jazz Pharmaceuticals plc
|
$
|
487,848
|
|
$
|
396,831
|
|
$
|
329,535
|
|
||
|
Denominator:
|
|||||||||||
|
Weighted-average ordinary shares used in per share calculations - basic
|
60,018
|
|
60,500
|
|
61,232
|
|
|||||
|
Dilutive effect of employee equity incentive and purchase plans
|
1,299
|
|
1,370
|
|
1,804
|
|
|||||
|
Weighted-average ordinary shares used in per share calculations - diluted
|
61,317
|
|
61,870
|
|
63,036
|
|
|||||
|
Net income per ordinary share :
|
|||||||||||
|
Basic
|
$
|
8.13
|
|
$
|
6.56
|
|
$
|
5.38
|
|
||
|
Diluted
|
$
|
7.96
|
|
$
|
6.41
|
|
$
|
5.23
|
|
||
Potentially dilutive ordinary shares from our employee equity incentive and purchase plans, our
1.875%
exchangeable senior notes due 2021, or the 2021 Notes, and our
1.50%
exchangeable senior notes due 2024, or the 2024 Notes, are determined by applying the treasury stock method to the assumed exercise of share options and warrants, the assumed vesting
F-15
of outstanding restricted stock units, or RSUs, the assumed issuance of ordinary shares under our employee stock purchase plan, or ESPP, and the assumed issuance of ordinary shares upon exchange of the 2021 Notes and the 2024 Notes, which we refer to together as the Exchangeable Senior Notes. The potential issue of ordinary shares issuable upon exchange of the Exchangeable Senior Notes had no effect on diluted net income per ordinary share because the average price of our ordinary shares in
2017
,
2016
and
2015
did not exceed the effective exchange prices per ordinary share of the Exchangeable Senior Notes.
The following table represents the weighted-average ordinary shares that were excluded from the computation of diluted net income attributable to Jazz Pharmaceuticals plc per ordinary share for the years presented because including them would have an anti-dilutive effect (in thousands):
|
|
Year Ended December 31,
|
|||||||
|
|
2017
|
2016
|
2015
|
|||||
|
Exchangeable Senior Notes
|
3,805
|
|
2,878
|
|
2,878
|
|
||
|
Options to purchase ordinary shares and RSUs
|
3,319
|
|
3,010
|
|
1,609
|
|
||
|
Ordinary shares under ESPP
|
14
|
|
93
|
|
—
|
|
||
Share-Based Compensation
We account for compensation cost for all share-based awards at fair value on the date of grant. The fair value is recognized as expense over the service period, net of estimated forfeitures, using the straight-line method. The estimation of share-based awards that will ultimately vest requires judgment, and, to the extent actual results or updated estimates differ from current estimates, such amounts will be recorded as a cumulative adjustment in the period estimates are revised. We primarily consider historical experience when estimating expected forfeitures.
Recent Accounting Pronouncements
In August 2017, the Financial Accounting Standards Board, or FASB, issued ASU No. 2017-12, “Derivatives and Hedging (Topic 815): Targeted Improvements to Accounting for Hedging Activities”. ASU No. 2017-12 amends and simplifies existing guidance in order to allow companies to more accurately present the economic effects of risk management activities in their financial statements. ASU No. 2017-12 is effective for reporting periods beginning after December 15, 2018, with early adoption permitted. We have elected to early adopt this standard beginning in the first quarter of 2018 and do not expect adoption to have a material impact on our consolidated financial statements.
In January 2017, the FASB, issued ASU No. 2017-04, “Intangibles - Goodwill and Other (Topic 350): Simplifying the Test for Goodwill Impairment” which simplifies the accounting for goodwill impairment by eliminating Step 2 of the current goodwill impairment test. Goodwill impairment will now be the amount by which the reporting unit’s carrying value exceeds its fair value, limited to the carrying value of the goodwill. The standard is effective for us beginning January 1, 2020. Early adoption is permitted for any impairment tests performed after January 1, 2017. The new guidance is not expected to have a material impact on our consolidated financial statements.
In January 2017, the FASB issued ASU No. 2017-01, “Business Combinations (Topic 805): Clarifying the Definition of a Business” which provides clarification on the definition of a business and adds guidance to assist entities with evaluating whether transactions should be accounted for as acquisitions (or disposals) of assets or businesses. The standard is effective for us beginning January 1, 2018. Early adoption is permitted. We will adopt this standard beginning in the first quarter of 2018. The future impact of ASU No. 2017-01 will be dependent upon the nature of our future acquisition or disposition transactions, if any.
In October 2016, the FASB issued ASU No. 2016-16, “Income Taxes (Topic 740): Intra-Entity Transfers of Assets Other Than Inventory” which requires an entity to recognize the income tax consequences of an intra-entity asset transfer, other than an intra-entity asset transfer of inventory, when the transfer occurs. The standard is effective for us beginning January 1, 2018. Early adoption is permitted. We will adopt this standard beginning in the first quarter of 2018 and do not expect adoption to have a material impact on our consolidated financial statements.
In August 2016, the FASB issued ASU No. 2016-15, “Statement of Cash Flows (Topic 230): Classification of Certain Cash Receipts and Cash Payments”. ASU 2016-15 addresses how certain cash receipts and cash payments are presented and classified in the statement of cash flows. The standard is effective for us beginning January 1, 2018. Early adoption is permitted. We will adopt this standard beginning in the first quarter of 2018 and do not expect adoption to have a material impact on our consolidated financial statements.
F-16
In February 2016, the FASB issued ASU No. 2016-02, “Leases (Topic 842)”. Under the new guidance, lessees will be required to recognize a right-of-use asset, which represents the lessee’s right to use, or control the use of, a specified asset for the lease term, and a corresponding lease liability, which represents the lessee’s obligation to make lease payments under a lease, measured on a discounted basis. ASU No. 2016-02 is effective beginning January 1, 2019 and early adoption is permitted. ASU No. 2016-02 must be adopted on a modified retrospective transition basis for leases existing at, or entered into after, the beginning of the earliest comparative period presented in the consolidated financial statements. The adoption of ASU No. 2016-02 will result in a significant increase in our consolidated balance sheet for right-of-use assets and lease liabilities. While we are continuing to assess all potential impacts of the standard, we currently believe the most significant impact relates to our accounting for the lease agreements we entered into in January 2015 and September 2017 to lease office space located in Palo Alto, California in buildings constructed or to be constructed by the landlord, which are accounted for as build-to-suit arrangements under existing accounting standards, and the lease agreement we entered into in August 2016 for office space in Dublin, Ireland. The future minimum lease payments under these leases at
December 31, 2017
was
$215.2 million
.
In May 2014, the FASB issued ASU No. 2014-09, “Revenue from Contracts with Customers”. The standard states that an entity should recognize revenue to depict the transfer of promised goods or services to customers in an amount that reflects the consideration to which the entity expects to be entitled in exchange for those goods or services. To achieve this, an entity will need to identify the contract with a customer; identify the separate performance obligations in the contract; determine the transaction price; allocate the transaction price to the separate performance obligations in the contract; and recognize revenue when (or as) the entity satisfies each performance obligation. In August 2015, the FASB issued ASU No. 2015-14, “Revenue from Contracts with Customers: Deferral of the Effective Date”, which deferred the effective date of ASU No. 2014-09. ASU No. 2014-09 was effective for us beginning January 1, 2018 and could be adopted on a full retrospective basis or on a modified retrospective basis. In March 2016, the FASB issued ASU No. 2016-08, “Revenue from Contracts with Customers (Topic 606): Principal versus Agent Considerations”, which clarifies the implementation guidance on principal versus agent considerations. In April 2016, the FASB issued ASU No. 2016-10, “Revenue from Contracts with Customers (Topic 606): Identifying Performance Obligations and Licensing”, which clarifies certain aspects of identifying performance obligations and licensing implementation guidance. In May 2016, the FASB issued ASU No. 2016-12, “Revenue from Contracts with Customers (Topic 606): Narrow-Scope Improvements and Practical Expedients” related to disclosures of remaining performance obligations, as well as other amendments to guidance on collectability, non-cash consideration and the presentation of sales and other similar taxes collected from customers. We will adopt ASU No. 2014-09 beginning in the first quarter of 2018 on a modified retrospective basis. The adoption of ASU No. 2014-09 is not expected to have a material impact on our results of operations and financial position as the timing of revenue recognition for product sales, net, which is our primary revenue stream, is not expected to change. On adoption of the new standard, we expect to reclassify approximately
$2 million
of deferred revenue, related to historical upfront payments received under a licensing arrangement, directly to retained earnings. We will be required to provide additional revenue-related disclosures in the notes to the consolidated financial statements commencing with our consolidated financial statements for the quarter ending March 31, 2018. We have concluded that no significant changes are required to our existing internal controls, systems and processes in order to support revenue recognition and the additional revenue-related disclosures under the new standard.
3. Business Combination, Asset Acquisitions and Disposition
Celator Acquisition
On May 27, 2016, we entered into a definitive merger agreement with Celator Pharmaceuticals Inc., or Celator, pursuant to which we made a cash tender offer of
$30.25
per share for all of the outstanding shares of Celator’s common stock. As of the expiration of the offer period on July 12, 2016,
36,516,173
shares, which represented approximately
81%
of Celator’s then outstanding common stock, were properly tendered and not withdrawn in the tender offer. The condition to the tender offer that more than
50%
of Celator’s outstanding common stock be validly tendered and not withdrawn prior to the expiration of the tender offer was satisfied. In addition, notices of guaranteed delivery were delivered with respect to
2,016,237
additional shares, representing approximately
4%
of Celator’s outstanding common stock as of the expiration of the tender offer. On July 12, 2016, we completed the acquisition of Celator, or the Celator Acquisition, under the terms of the merger agreement, pursuant to which Celator became an indirect wholly owned subsidiary of Jazz Pharmaceuticals plc and each share of Celator common stock then outstanding (other than shares owned by us or Celator) was converted into the right to receive
$30.25
, the same price per share offered in the tender offer. The aggregate cash consideration for the Celator Acquisition was
$1.5 billion
.
On July 12, 2016, we entered into the amended credit agreement that provides for a revolving credit facility of
$1.25 billion
, which replaced our prior revolving credit facility of
$750.0 million
, and a
$750.0 million
term loan facility. Please see
F-17
Celator was an oncology-focused biopharmaceutical company seeking to transform the science of combination therapy
and develop products to improve patient outcomes in cancer. The Celator Acquisition broadened our hematology/oncology portfolio with the acquisition of worldwide development and commercialization rights to Vyxeos. In addition, the Celator Acquisition provided us with Celator’s proprietary technology platform, CombiPlex, which enables the rational design and rapid evaluation of optimized combinations of additional anti-cancer drugs.
The Celator Acquisition was accounted for as a business combination using the acquisition method under which assets and liabilities of Celator were recorded at their respective estimated fair values as of the closing date of the Celator Acquisition and added to the assets and liabilities of Jazz Pharmaceuticals plc, including an amount for goodwill representing the difference between the acquisition consideration and the estimated fair value of the identifiable net assets. The results of operations of Celator and the estimated fair values of the assets acquired and liabilities assumed have been included in our consolidated financial statements since the closing date of the Celator Acquisition.
In 2016, we incurred
$10.0 million
in acquisition-related costs related to the Celator Acquisition, which primarily consisted of banking, legal, accounting and valuation-related expenses. These expenses were recorded in selling, general and administrative expense in the accompanying consolidated statements of income. We did not recognize any revenues from the acquired Celator business in 2016. In 2017, we recognized revenue from the acquired Celator business of
$33.8 million
following the launch of Vyxeos in August 2017. The portion of total expenses and net loss associated with the acquired Celator business was not separately identifiable due to the integration with our operations.
The fair values of assets acquired and liabilities assumed at the closing date of the Celator Acquisition are summarized below (in thousands):
|
Cash and cash equivalents
|
$
|
26,137
|
|
|
Other receivables
|
386
|
|
|
|
Prepaid expenses and deposits
|
151
|
|
|
|
Property and equipment
|
767
|
|
|
|
Intangible assets
|
1,811,250
|
|
|
|
Goodwill
|
252,825
|
|
|
|
Other non-current assets
|
43
|
|
|
|
Accrued liabilities
|
(19,076
|
)
|
|
|
Deferred tax liability, net, non-current
|
(542,901
|
)
|
|
|
Other non-current liabilities
|
(1,002
|
)
|
|
|
Total acquisition consideration - cash paid
|
$
|
1,528,580
|
|
Identifiable intangible assets acquired comprised IPR&D, which represented incomplete research and development projects at Celator related to Vyxeos. Management estimated the fair value of Vyxeos IPR&D to be approximately
$1.8 billion
. The fair value of acquired IPR&D was determined using the income approach, including the application of probability factors related to the likelihood of success of Vyxeos reaching final development and commercialization. This approach also took into consideration information and certain program-related documents and forecasts prepared by management. The fair value of acquired IPR&D was capitalized as of the closing date of the Celator Acquisition. After receiving FDA approval of our new drug application, or NDA, for Vyxeos in August 2017, we reclassified the IPR&D balance of
$1.8 billion
from an indefinite-lived intangible asset to an acquired developed technology finite-lived intangible asset. This acquired developed technology asset is being amortized over its estimated useful life of
18
years.
The excess of the total acquisition consideration over the fair value amounts assigned to the assets acquired and the liabilities assumed represents the goodwill amount resulting from the Celator Acquisition. We believe that the factors that contributed to goodwill included the Celator workforce, which will complement our clinical experience in hematology/oncology and our expertise in reaching targeted physicians who treat serious medical conditions, and the deferred tax consequences of intangible assets recorded for financial statement purposes. We do not expect any portion of this goodwill to be deductible for tax purposes.
F-18
Pro Forma Financial Information (Unaudited)
The following unaudited supplemental pro forma information presents our combined historical results of operations with pro forma adjustments as if the Celator Acquisition had been completed on January 1, 2015. The primary pro forma adjustments include:
|
•
|
The exclusion of acquisition-related and integration expenses of
$13.6 million
in 2016 and the inclusion of these expenses in 2015.
|
|
•
|
An increase in interest expense of
$13.7 million
in 2016 and
$25.9 million
in 2015 incurred on additional borrowings made to partially fund the Celator Acquisition as if the borrowings had occurred on January 1, 2015.
|
The unaudited pro forma results do not assume any operating efficiencies as a result of the consolidation of operations and are as follows (in thousands, except per share data):
|
|
Year Ended December 31,
|
||||||
|
|
2016
|
2015
|
|||||
|
Revenues
|
$
|
1,488,118
|
|
$
|
1,326,246
|
|
|
|
Net income attributable to Jazz Pharmaceuticals plc
|
$
|
386,342
|
|
$
|
283,113
|
|
|
|
Net income attributable to Jazz Pharmaceuticals plc per ordinary share - basic
|
$
|
6.39
|
|
$
|
4.62
|
|
|
|
Net income attributable to Jazz Pharmaceuticals plc per ordinary share - diluted
|
$
|
6.24
|
|
$
|
4.49
|
|
|
Collaboration and Option Agreement
In August 2017, we entered into a collaboration and option agreement with ImmunoGen, Inc., or ImmunoGen, granting us rights to opt into exclusive, worldwide licenses to develop and commercialize
two
early-stage, hematology-related antibody-drug conjugate, or ADC, programs, as well as an additional program to be designated during the term of the agreement. The programs covered under the agreement include IMGN779, a CD33-targeted ADC for the treatment of AML in Phase 1 testing, and IMGN632, a CD123-targeted ADC for hematological malignancies expected to enter clinical testing before the end of 2017.
Under the terms of the agreement, ImmunoGen will be responsible for the development of the
three
ADC programs prior to any potential opt-in by us. Following any opt-in, we would be responsible for any further development as well as for potential regulatory submissions and commercialization.
As part of the agreement, we paid ImmunoGen a non-refundable upfront payment of
$75.0 million
, which was charged to acquired IPR&D expense upon closing of the transaction. Additionally, we will pay ImmunoGen up to
$100 million
in development funding over
seven years
to support the
three
ADC programs. For each program, we may exercise our opt-in right at any time prior to a pivotal study or any time prior to a biologics license application upon payment of an option exercise fee. The option exercise fee depends on the timing of exercise and certain other conditions. For each program to which we elect to opt-in, ImmunoGen would be eligible to receive milestone payments based on receiving regulatory approval of the applicable product, plus tiered royalties as a percentage of commercial sales. After opt-in, we will share with ImmunoGen the costs associated with developing and obtaining regulatory approvals of the applicable product in the U.S. and the European Union, or EU. ImmunoGen has the right to co-commercialize
one
product (or
two
products, under certain limited circumstances) with us in the U.S. with U.S. profit-sharing in lieu of our payment of applicable U.S. milestone and royalties to ImmunoGen.
License and Option Agreement
In July 2016, we entered into an agreement with Pfenex Inc., or Pfenex, that granted us worldwide rights to develop and commercialize multiple early-stage hematology product candidates and an option for us to negotiate a license for a recombinant pegaspargase product candidate. This agreement was amended in December 2017. Under the amended agreement, Pfenex received upfront, option and development milestone payments totaling
$35.3 million
and may be eligible to receive additional payments of up to
$189 million
based on the achievement of certain development, regulatory and sales milestones. In 2017, we recognized expense of
$19.5 million
within research and development expenses. In 2016, we recognized expenses of
$15.8 million
, of which
$15.0 million
was charged to acquired IPR&D expense upon closing of the transaction and
$0.8 million
was charged to research and development expenses.
Acquisition of Alizé Pharma II S.A.S.
In March 2016, we acquired all of the outstanding shares of Alizé Pharma II S.A.S., a privately held biotechnology company, for an upfront payment of
$8.8 million
. In connection with the acquisition, we obtained intellectual property and
F-19
know-how related to recombinant crisantaspase. The transaction includes contingent regulatory milestone payments of up to €
10 million
. The transaction was accounted for as an asset acquisition and the upfront payment was charged to acquired IPR&D expense upon closing of the transaction.
Disposition
In March 2015, we sold certain products and the related business that we originally acquired as part of our June 2012 acquisition of EUSA Pharma Inc., or the EUSA Acquisition. The purchase price for the products and related business was
$34.0 million
, subject to pre- and post-closing purchase price adjustments. In 2015, we recognized a loss on disposal of
$0.2 million
within selling, general and administrative expenses in our consolidated statements of income.
The related assets met the assets held for sale criteria and were reclassified to assets held for sale as of December 31, 2014. Goodwill was allocated to these assets using the relative fair value method. We have determined that the disposition of these assets did not qualify for reporting as a discontinued operation, because the sale did not represent a strategic shift that had or will have a major effect on our operations and financial results.
4. Cash and Available-for-Sale Securities
Cash and cash equivalents and investments consisted of the following (in thousands):
|
December 31, 2017
|
|||||||||||||||||||||||
|
Amortized
Cost |
Gross
Unrealized Gains |
Gross
Unrealized Losses |
Estimated
Fair Value |
Cash and Cash Equivalents
|
Investments
|
||||||||||||||||||
|
Cash
|
$
|
225,235
|
|
$
|
—
|
|
$
|
—
|
|
$
|
225,235
|
|
$
|
225,235
|
|
$
|
—
|
|
|||||
|
Time deposits
|
235,000
|
|
—
|
|
—
|
|
235,000
|
|
20,000
|
|
215,000
|
|
|||||||||||
|
Money market funds
|
140,800
|
|
—
|
|
—
|
|
140,800
|
|
140,800
|
|
—
|
|
|||||||||||
|
Totals
|
$
|
601,035
|
|
$
|
—
|
|
$
|
—
|
|
$
|
601,035
|
|
$
|
386,035
|
|
$
|
215,000
|
|
|||||
|
December 31, 2016
|
|||||||||||||||||||||||
|
Amortized
Cost |
Gross
Unrealized Gains |
Gross
Unrealized Losses |
Estimated
Fair Value |
Cash and Cash
Equivalents |
Investments
|
||||||||||||||||||
|
Cash
|
$
|
215,963
|
|
$
|
—
|
|
$
|
—
|
|
$
|
215,963
|
|
$
|
215,963
|
|
$
|
—
|
|
|||||
|
Time deposits
|
210,000
|
|
—
|
|
—
|
|
210,000
|
|
150,000
|
|
60,000
|
|
|||||||||||
|
Totals
|
$
|
425,963
|
|
$
|
—
|
|
$
|
—
|
|
$
|
425,963
|
|
$
|
365,963
|
|
$
|
60,000
|
|
|||||
Cash equivalents and investments are considered available-for-sale securities. We use the specific-identification method for calculating realized gains and losses on securities sold and include them in interest expense, net in the consolidated statements of income. Our investment balances represent time deposits with original maturities of greater than three months and less than one year.
F-20
5. Fair Value Measurement
The following table summarizes, by major security type, our available-for-sale securities and derivative contracts that were measured at fair value on a recurring basis and were categorized using the fair value hierarchy (in thousands):
|
December 31, 2017
|
December 31, 2016
|
||||||||||||||||||
|
Quoted
Prices in Active Markets for Identical Assets (Level 1) |
Significant
Other Observable Inputs (Level 2) |
Total
Estimated Fair Value |
Significant
Other Observable Inputs (Level 2) |
Total
Estimated Fair Value |
|||||||||||||||
|
Assets:
|
|||||||||||||||||||
|
Available-for-sale securities:
|
|||||||||||||||||||
|
Time deposits
|
$
|
—
|
|
$
|
235,000
|
|
$
|
235,000
|
|
$
|
210,000
|
|
$
|
210,000
|
|
||||
|
Money market funds
|
140,800
|
|
—
|
|
140,800
|
|
—
|
|
—
|
|
|||||||||
|
Interest rate contracts
|
—
|
|
2,138
|
|
2,138
|
|
—
|
|
—
|
|
|||||||||
|
Foreign exchange forward contracts
|
—
|
|
15,495
|
|
15,495
|
|
—
|
|
—
|
|
|||||||||
|
Totals
|
$
|
140,800
|
|
$
|
252,633
|
|
$
|
393,433
|
|
$
|
210,000
|
|
$
|
210,000
|
|
||||
|
Liabilities:
|
|||||||||||||||||||
|
Interest rate contracts
|
$
|
—
|
|
$
|
392
|
|
$
|
392
|
|
$
|
—
|
|
$
|
—
|
|
||||
|
Foreign exchange forward contracts
|
—
|
|
5,017
|
|
5,017
|
|
—
|
|
—
|
|
|||||||||
|
Totals
|
$
|
—
|
|
$
|
5,409
|
|
$
|
5,409
|
|
$
|
—
|
|
$
|
—
|
|
||||
As of
December 31, 2017
, our available-for-sale securities included time deposits and money market funds and their carrying values were approximately equal to their fair values. Time deposits were measured at fair value using Level 2 inputs and money market funds were measured using quoted prices in active markets, which represent Level 1 inputs. Level 2 inputs, obtained from various third party data providers, represent quoted prices for similar assets in active markets, or these inputs were derived from observable market data, or if not directly observable, were derived from or corroborated by other observable market data.
Our derivative assets and liabilities include interest rate and foreign exchange derivatives that are measured at fair value using observable market inputs such as forward rates, interest rates, our own credit risk as well as an evaluation of our counterparties’ credit risks. Based on these inputs, the derivative assets and liabilities are classified within Level 2 of the fair value hierarchy.
There were
no
transfers between the different levels of the fair value hierarchy in
2017
or in
2016
.
As of
December 31, 2017
, the estimated fair values of the 2021 Notes and the 2024 Notes, were approximately
$577 million
and
$543 million
, respectively. The fair values of the Exchangeable Senior Notes were estimated using quoted market prices obtained from brokers (Level 2). The estimated fair value of our borrowings under our term loan was approximately equal to its book value based on the borrowing rates currently available for variable rate loans (Level 2).
6. Derivative Instruments and Hedging Activities
We are exposed to certain risks arising from operating internationally, including fluctuations in interest rates on our outstanding term loan borrowings and fluctuations in foreign exchange rates primarily related to the translation of euro-denominated net monetary liabilities, including intercompany balances, held by subsidiaries with a U.S. dollar functional currency. We manage these exposures within specified guidelines through the use of derivatives. All of our derivative instruments are utilized for risk management purposes, and we do not use derivatives for speculative trading purposes.
To achieve a desired mix of floating and fixed interest rates on our variable rate debt, we entered into interest rate swap agreements in March 2017 which are effective from March 3, 2017 until July 12, 2021. These agreements hedge contractual term loan interest rates. As of
December 31, 2017
, the interest rate swap agreements had a notional amount of
$300.0 million
. As a result of these agreements, the interest rate on a portion of our term loan borrowings was fixed at
1.895%
, plus the borrowing spread, until July 12, 2021.
F-21
The effective portion of changes in the fair value of derivatives designated as and that qualify as cash flow hedges is recorded in accumulated other comprehensive loss and is subsequently reclassified into earnings in the period that the hedged forecasted transaction affects earnings. The ineffective portion of the change in fair value is recognized directly in earnings. The impact on accumulated other comprehensive loss and earnings from derivative instruments that qualified as cash flow hedges was as follows (in thousands):
|
Year Ended December 31,
|
|||||||
|
2017
|
2016
|
||||||
|
Loss recognized in accumulated other comprehensive loss, net of tax
|
$
|
(213
|
)
|
$
|
—
|
|
|
|
Loss reclassified from accumulated other comprehensive loss to interest expense, net of tax
|
$
|
1,695
|
|
$
|
—
|
|
|
A
ssuming no change in LIBOR-based interest rates from market rates as of
December 31, 2017
,
$0.4 million
of losses recognized in accumulated other comprehensive loss will be reclassified to earnings over the next 12 months. The gain related to the ineffective portion of derivative instruments that qualified as cash flow hedges for the twelve months ended
December 31, 2017
was
$0.1 million
.
We enter into foreign exchange forward contracts, with durations of up to
365
days, designed to limit the exposure to fluctuations in foreign exchange rates related to the translation of certain non-U.S. dollar denominated liabilities, including intercompany balances. Hedge accounting is not applied to these derivative instruments as gains and losses on these hedge transactions are designed to offset gains and losses on underlying balance sheet exposures.
As of
December 31, 2017
, the notional amount of foreign exchange contracts where hedge accounting is not applied was
$98.7 million
. The foreign exchange gain (loss) in our consolidated statements of income included gains of
$10.5 million
associated with foreign exchange contracts not designated as hedging instruments in
2017
. We did not enter into foreign exchange forward contracts in
2016
and
2015
.
The cash flow effects of our derivative contracts are included within net cash provided by operating activities in the consolidated statements of cash flows.
The following table summarizes the fair value of outstanding derivatives as of
December 31, 2017
(in thousands):
|
December 31, 2017
|
|||||||||||
|
Asset Derivatives
|
Liability Derivatives
|
||||||||||
|
Balance Sheet Location
|
Fair Value
|
Balance Sheet Location
|
Fair Value
|
||||||||
|
Derivatives designated as hedging instruments:
|
|||||||||||
|
Interest rate contracts
|
Other non-current assets
|
$
|
2,138
|
|
Accrued liabilities
|
$
|
392
|
|
|||
|
Derivatives not designated as hedging instruments:
|
|||||||||||
|
Foreign exchange forward contracts
|
Other current assets
|
15,495
|
|
Accrued liabilities
|
5,017
|
|
|||||
|
Total fair value of derivative instruments
|
$
|
17,633
|
|
$
|
5,409
|
|
|||||
F-22
Although we do not offset derivative assets and liabilities within our consolidated balance sheets, our International Swap and Derivatives Association agreements provide for net settlement of transactions that are due to or from the same counterparty upon early termination of the agreement due to an event of default or other termination event. The following table summarizes the potential effect on our consolidated balance sheets of offsetting our interest rate contracts and foreign exchange forward contracts subject to such provisions (in thousands):
|
December 31, 2017
|
|||||||||||||||||||||||
|
Gross Amounts of Recognized Assets/Liabilities
|
Gross Amounts Offset in the Consolidated Balance Sheet
|
Net Amounts of Assets/ Liabilities Presented in the Consolidated Balance Sheet
|
Gross Amounts Not Offset in the Consolidated Balance Sheet
|
||||||||||||||||||||
|
Description
|
Derivative Financial Instruments
|
Cash Collateral Received (Pledged)
|
Net Amount
|
||||||||||||||||||||
|
Derivative assets
|
$
|
1,639
|
|
$
|
—
|
|
$
|
1,639
|
|
$
|
(875
|
)
|
$
|
—
|
|
$
|
764
|
|
|||||
|
Derivative liabilities
|
$
|
(875
|
)
|
$
|
—
|
|
$
|
(875
|
)
|
$
|
875
|
|
$
|
—
|
|
$
|
—
|
|
|||||
There were no outstanding derivatives as of
December 31, 2016
.
7. Inventories
Inventories consisted of the following (in thousands):
|
December 31,
|
|||||||
|
2017
|
2016
|
||||||
|
Raw materials
|
$
|
3,542
|
|
$
|
1,547
|
|
|
|
Work in process
|
15,692
|
|
18,689
|
|
|||
|
Finished goods
|
24,011
|
|
13,815
|
|
|||
|
Total inventories
|
$
|
43,245
|
|
$
|
34,051
|
|
|
8. Property and Equipment
Property and equipment consisted of the following (in thousands):
|
December 31,
|
|||||||
|
2017
|
2016
|
||||||
|
Build-to-suit facility
|
$
|
51,721
|
|
$
|
—
|
|
|
|
Land and buildings
|
46,729
|
|
46,033
|
|
|||
|
Leasehold improvements
|
28,779
|
|
9,328
|
|
|||
|
Manufacturing equipment and machinery
|
23,586
|
|
19,596
|
|
|||
|
Construction-in-progress
|
21,738
|
|
33,427
|
|
|||
|
Computer software
|
19,969
|
|
17,832
|
|
|||
|
Computer equipment
|
12,814
|
|
10,980
|
|
|||
|
Furniture and fixtures
|
5,947
|
|
2,436
|
|
|||
|
Subtotal
|
211,283
|
|
139,632
|
|
|||
|
Less accumulated depreciation and amortization
|
(41,203
|
)
|
(32,142
|
)
|
|||
|
Property and equipment, net
|
$
|
170,080
|
|
$
|
107,490
|
|
|
Depreciation and amortization expense (including amortization expense related to a facility lease) on property and equipment amounted to
$13.1 million
,
$11.8 million
and
$9.9 million
for the years ended December 31, 2017, 2016 and 2015, respectively.
F-23
9. Goodwill and Intangible Assets
The gross carrying amount of goodwill was as follows (in thousands):
|
Balance at December 31, 2016
|
$
|
893,810
|
|
|
Foreign exchange
|
53,727
|
|
|
|
Balance at December 31, 2017
|
$
|
947,537
|
|
The gross carrying amounts and net book values of our intangible assets were as follows (in thousands):
|
December 31, 2017
|
December 31, 2016
|
||||||||||||||||||||||||
|
Remaining
Weighted- Average Useful Life (In years) |
Gross
Carrying Amount |
Accumulated
Amortization |
Net Book
Value |
Gross
Carrying Amount |
Accumulated
Amortization |
Net Book
Value |
|||||||||||||||||||
|
Acquired developed technologies
|
14.9
|
$
|
3,392,832
|
|
$
|
(562,473
|
)
|
$
|
2,830,359
|
|
$
|
1,477,618
|
|
$
|
(410,523
|
)
|
$
|
1,067,095
|
|
||||||
|
Manufacturing contracts
|
0.1
|
12,824
|
|
(12,634
|
)
|
190
|
|
11,278
|
|
(8,292
|
)
|
2,986
|
|
||||||||||||
|
Trademarks
|
—
|
2,910
|
|
(2,910
|
)
|
—
|
|
2,872
|
|
(2,872
|
)
|
—
|
|
||||||||||||
|
Total finite-lived intangible assets
|
3,408,566
|
|
(578,017
|
)
|
2,830,549
|
|
1,491,768
|
|
(421,687
|
)
|
1,070,081
|
|
|||||||||||||
|
Acquired IPR&D assets
|
148,578
|
|
—
|
|
148,578
|
|
1,941,920
|
|
—
|
|
1,941,920
|
|
|||||||||||||
|
Total intangible assets
|
$
|
3,557,144
|
|
$
|
(578,017
|
)
|
$
|
2,979,127
|
|
$
|
3,433,688
|
|
$
|
(421,687
|
)
|
$
|
3,012,001
|
|
|||||||
The increase in the gross carrying amount of intangible assets as of
December 31, 2017
compared to
December 31, 2016
reflected the positive impact of foreign currency translation adjustments, which was due to the strengthening of the euro against the U.S. dollar. Additionally, after receiving FDA approval of our NDA for Vyxeos in August 2017, we reclassified
$1.8 billion
of acquired IPR&D from an indefinite-lived intangible asset to an acquired developed technology finite-lived intangible asset. This acquired developed technology asset is being amortized over its estimated useful life of
18
years.
The assumptions and estimates used to determine future cash flows and remaining useful lives of our intangible and other long-lived assets are complex and subjective. They can be affected by various factors, including external factors, such as industry and economic trends, and internal factors such as changes in our business strategy and our forecasts for specific product lines.
As a result of our decision to terminate a pivotal Phase 2 clinical trial of JZP-416, we recognized an impairment charge of
$31.5 million
to our acquired IPR&D asset in 2015.
Based on finite-lived intangible assets recorded as of
December 31, 2017
, and assuming the underlying assets will not be impaired and that we will not change the expected lives of the assets, future amortization expenses were estimated as follows (in thousands):
|
Year Ending December 31,
|
Estimated Amortization Expense
|
||
|
2018
|
$
|
209,912
|
|
|
2019
|
209,674
|
|
|
|
2020
|
206,706
|
|
|
|
2021
|
205,655
|
|
|
|
2022
|
204,922
|
|
|
|
Thereafter
|
1,793,680
|
|
|
|
Total
|
$
|
2,830,549
|
|
F-24
10. Accrued Liabilities
Accrued liabilities consisted of the following (in thousands):
|
December 31,
|
|||||||
|
2017
|
2016
|
||||||
|
Rebates and other sales deductions
|
$
|
81,368
|
|
$
|
72,344
|
|
|
|
Employee compensation and benefits
|
54,930
|
|
43,363
|
|
|||
|
Royalties
|
8,058
|
|
11,643
|
|
|||
|
Accrued interest
|
7,297
|
|
5,179
|
|
|||
|
Derivative instrument liabilities
|
5,409
|
|
—
|
|
|||
|
Sales returns reserve
|
3,651
|
|
4,366
|
|
|||
|
Professional fees
|
3,213
|
|
4,596
|
|
|||
|
Selling and marketing accruals
|
3,189
|
|
3,924
|
|
|||
|
Inventory-related accruals
|
3,002
|
|
3,350
|
|
|||
|
Accrued construction-in-progress
|
2,827
|
|
1,597
|
|
|||
|
Clinical trial accruals
|
2,181
|
|
10,139
|
|
|||
|
Accrued contract termination fees
|
—
|
|
11,612
|
|
|||
|
Other
|
23,654
|
|
21,155
|
|
|||
|
Total accrued liabilities
|
$
|
198,779
|
|
$
|
193,268
|
|
|
The following table summarizes the carrying amount of our indebtedness (in thousands):
|
December 31,
|
|||||||
|
2017
|
2016
|
||||||
|
2021 Notes
|
$
|
575,000
|
|
$
|
575,000
|
|
|
|
Unamortized discount and debt issuance costs on 2021 Notes
|
(81,627
|
)
|
(101,094
|
)
|
|||
|
2021 Notes, net
|
493,373
|
|
473,906
|
|
|||
|
2024 Notes
|
575,000
|
|
—
|
|
|||
|
Unamortized discount and debt issuance costs on 2024 Notes
|
(158,680
|
)
|
—
|
|
|||
|
2024 Notes, net
|
416,320
|
|
—
|
|
|||
|
Term loan
|
671,345
|
|
705,719
|
|
|||
|
Borrowings under revolving credit facility
|
—
|
|
850,000
|
|
|||
|
Total debt
|
1,581,038
|
|
2,029,625
|
|
|||
|
Less current portion
|
40,605
|
|
36,094
|
|
|||
|
Total long-term debt
|
$
|
1,540,433
|
|
$
|
1,993,531
|
|
|
Credit Agreement
On June 18, 2015, Jazz Pharmaceuticals plc, as guarantor, and certain of our wholly owned subsidiaries, as borrowers, entered into a credit agreement, which we refer to in this report as the 2015 credit agreement, that provided for a
$750.0 million
principal amount term loan, which was drawn in full at closing, and a
$750.0 million
revolving credit facility, of which
$160.0 million
was drawn at closing and subsequently repaid. We used the proceeds from initial borrowings under the 2015 credit agreement to repay in full the
$893.1 million
principal amount of term loans outstanding under the credit agreement that we entered into in June 2012, as subsequently amended, which we refer to as the previous credit agreement, and to pay related fees and expenses. The previous credit agreement was terminated upon repayment of the term loans outstanding thereunder.
F-25
On
July 12, 2016
, Jazz Pharmaceuticals plc, as guarantor, and certain of our wholly owned subsidiaries, as borrowers, entered into the amended credit agreement. The amended credit agreement provides for a revolving credit facility of
$1.25 billion
, which replaced the revolving credit facility of
$750.0 million
provided for under the 2015 credit agreement, of which
no
amount was outstanding as of
December 31, 2017
, and a
$750.0 million
term loan facility, of which
$676.8 million
principal amount was outstanding as of
December 31, 2017
. We used the proceeds of
$1.0 billion
of loans under the revolving credit facility, together with cash on hand, to fund the Celator Acquisition and expect to use the proceeds from future loans under the revolving credit facility, if any, for general corporate purposes, including corporate development activities. Please see Note 3 for additional information regarding the Celator Acquisition.
Under the amended credit agreement, the term loan matures on
July 12, 2021
and the revolving credit facility terminates, and any loans outstanding thereunder become due and payable, on
July 12, 2021
.
Borrowings under the amended credit agreement bear interest, at our option, at a rate equal to either (a) the LIBOR rate, plus an applicable margin ranging from
1.50%
to
2.25%
per annum, based upon our secured leverage ratio, or (b) the prime lending rate, plus an applicable margin ranging from
0.50%
to
1.25%
per annum, based upon our secured leverage ratio. The revolving credit facility has a commitment fee payable on the undrawn amount ranging from
0.25%
to
0.35%
per annum based upon our secured leverage ratio.
As of
December 31, 2017
, the interest rate on the term loan was
3.32%
and the effective interest rate was
2.97%
. As of
December 31, 2017
, we had undrawn revolving credit facilities totaling
$1.25 billion
.
Jazz Pharmaceuticals plc and certain of our wholly owned subsidiaries are borrowers under the amended credit agreement. The borrowers’ obligations under the amended credit agreement and any hedging or cash management obligations entered into with a lender are guaranteed on a senior secured basis by Jazz Pharmaceuticals plc and certain of our subsidiaries (including the issuer of the Exchangeable Senior Notes as described below) and are secured by substantially all of Jazz Pharmaceuticals plc’s, the borrowers’ and the guarantor subsidiaries’ assets.
We may make voluntary prepayments of principal at any time without payment of a premium. We are required to make mandatory prepayments of the term loan (without payment of a premium) with (1) net cash proceeds from certain non-ordinary course asset sales (subject to reinvestment rights and other exceptions), (2) net cash proceeds from issuances of debt (other than certain permitted debt), and (3) casualty proceeds and condemnation awards (subject to reinvestment rights and other exceptions).
Principal repayments of the term loan, which are due quarterly, began in December 2016 and are equal to
5.0%
per annum of the principal amount outstanding on
July 12, 2016
of
$721.9 million
during the first two years,
7.5%
per annum during the third year,
10.0%
per annum during the fourth year and
12.5%
per annum during the fifth year, with any remaining balance payable on the maturity date.
The amended credit agreement contains financial covenants that require Jazz Pharmaceuticals plc and our restricted subsidiaries to not (a) exceed a maximum secured net leverage ratio or (b) fall below a cash interest coverage ratio. As of
December 31, 2017
, we were in compliance with these financial covenants.
In connection with our entry into the amended credit agreement, we recorded a loss on extinguishment and modification of debt of
$0.6 million
in 2016 primarily related to new third party fees associated with modified debt. In 2015, in connection with our entry into the 2015 credit agreement and termination of the previous credit agreement, we recorded a loss on extinguishment and modification of debt of
$16.8 million
, which was comprised of
$16.0 million
related to the expensing of unamortized deferred financing costs and unamortized original issue discount associated with extinguished debt and
$0.8 million
related to new third party fees associated with modified debt.
Exchangeable Senior Notes Due 2024
In the third quarter of 2017, we completed a private placement of
$575.0 million
principal amount of 2024 Notes. We used the net proceeds from this offering to repay
$500.0 million
in outstanding loans under the revolving credit facility and to pay related fees and expenses. We used the remainder of the net proceeds for general corporate purposes. Interest on the 2024 Notes is payable semi-annually in cash in arrears on February 15 and August 15 of each year, beginning on February 15, 2018, at a rate of
1.50%
per year. In certain circumstances, we may be required to pay additional amounts as a result of any applicable tax withholding or deductions required in respect of payments on the 2024 Notes. The 2024 Notes mature on August 15, 2024, unless earlier exchanged, repurchased or redeemed.
The holders of the 2024 Notes have the ability to require us to repurchase all or a portion of their 2024 Notes for cash in the event we undergo certain fundamental changes, such as specified change of control transactions, our liquidation or dissolution or the delisting of our ordinary shares from The NASDAQ Global Select Market. Prior to August 15, 2024, we may
F-26
redeem the 2024 Notes, in whole but not in part, subject to compliance with certain conditions, if we have, or on the next interest payment date would, become obligated to pay to the holder of any 2024 Notes additional amounts as a result of certain tax-related events. We also may redeem the 2024 Notes on or after August 20, 2021, in whole or in part, if the last reported sale price per ordinary share has been at least
130%
of the exchange price then in effect for at least
20
trading days (whether or not consecutive) during any
30
consecutive trading day period ending on, and including, the trading day immediately preceding the date on which we provide the notice of redemption.
The 2024 Notes are exchangeable at an initial exchange rate of
4.5659
ordinary shares per
$1,000
principal amount of 2024 Notes, which is equivalent to an initial exchange price of approximately
$219.02
per ordinary share. Upon exchange, the 2024 Notes may be settled in cash, ordinary shares or a combination of cash and ordinary shares, at our election. Our intent and policy is to settle the principal amount of the 2024 Notes in cash upon exchange. The exchange rate will be subject to adjustment in some events but will not be adjusted for any accrued and unpaid interest. In addition, following certain make-whole fundamental changes occurring prior to the maturity date of the 2024 Notes or upon our issuance of a notice of redemption, we will in certain circumstances increase the exchange rate for holders of the 2024 Notes who elect to exchange their 2024 Notes in connection with that make-whole fundamental change or during the related redemption period. Prior to May 15, 2024, the 2024 Notes will be exchangeable only upon satisfaction of certain conditions and during certain periods, and thereafter, at any time until the close of business on the second scheduled trading day immediately preceding the maturity date.
In accounting for the issuance of the 2024 Notes, we separated the 2024 Notes into liability and equity components. The carrying amount of the liability component was calculated by measuring the estimated fair value of a similar liability that does not have an associated exchange feature. The carrying amount of the equity component representing the exchange option was determined by deducting the fair value of the liability component from the face value of the 2024 Notes as a whole. The excess of the principal amount of the liability component over its carrying amount will be amortized to interest expense over the expected life of the 2024 Notes using the effective interest method with an effective interest rate of
6.8%
per annum. We have determined the expected life of the 2024 Notes to be equal to the original
seven
-year term. The equity component is not remeasured as long as it continues to meet the conditions for equity classification. As of
December 31, 2017
, the “if-converted value” did not exceed the principal amount of the 2024 Notes.
We allocated the total issuance costs incurred of
$15.6 million
to the liability and equity components based on their relative values. Issuance costs attributable to the liability component will be amortized to expense over the term of the 2024 Notes, and issuance costs attributable to the equity component were included with the equity component in our shareholders’ equity.
As of
December 31, 2017
, the carrying value of the equity component of the 2024 Notes, net of equity issuance costs, was
$149.8 million
.
Exchangeable Senior Notes Due 2021
In August 2014, we completed a private placement of the 2021 Notes. Interest on the 2021 Notes is
payable semi-annually in cash in arrears on February 15 and August 15 of each year
, beginning on February 15, 2015, at a rate of
1.875%
per year. In certain circumstances, we may be required to pay additional amounts as a result of any applicable tax withholding or deductions required in respect of payments on the 2021 Notes. The 2021 Notes mature on
August 15, 2021
, unless earlier exchanged, repurchased or redeemed.
The holders of the 2021 Notes have the ability to require us to repurchase all or a portion of their 2021 Notes for cash in the event Jazz Pharmaceuticals plc undergoes certain fundamental changes. Prior to
August 15, 2021
, we may redeem the 2021 Notes, in whole but not in part, subject to compliance with certain conditions, if we have, or on the next interest payment date would, become obligated to pay to the holder of any 2021 Note additional amounts as a result of certain tax-related events. We also may redeem the 2021 Notes on or after
August 20, 2018
, in whole or in part, if the last reported sale price per ordinary share has been at least
130%
of the exchange price then in effect for at least
20
trading days (whether or not consecutive) during any
30
consecutive trading day period ending on, and including, the trading day immediately preceding the date on which we provide the notice of redemption.
The 2021 Notes are exchangeable at an initial exchange rate of
5.0057
ordinary shares per
$1,000
principal amount of 2021 Notes, which is equivalent to an initial exchange price of approximately
$199.77
per ordinary share. Upon exchange, the 2021 Notes may be settled in cash, ordinary shares or a combination of cash and ordinary shares, at our election. Our intent and policy is to settle the principal amount of the 2021 Notes in cash upon exchange. The exchange rate will be subject to adjustment in some events but will not be adjusted for any accrued and unpaid interest. In addition, following certain make-whole fundamental changes occurring prior to the maturity date of the 2021 Notes or upon our issuance of a notice of redemption, we will in certain circumstances increase the exchange rate for holders of the 2021 Notes who elect to exchange their 2021 Notes in connection with that make-whole fundamental change or during the related redemption period. Prior to
F-27
February 15, 2021, the 2021 Notes will be exchangeable only upon satisfaction of certain conditions and during certain periods, and thereafter, at any time until the close of business on the second scheduled trading day immediately preceding the maturity date.
In accounting for the issuance of the 2021 Notes, we separated the 2021 Notes into liability and equity components. The carrying amount of the liability component was calculated by measuring the estimated fair value of a similar liability that does not have an associated exchange feature. The carrying amount of the equity component representing the exchange option was determined by deducting the fair value of the liability component from the face value of the 2021 Notes as a whole. The excess of the principal amount of the liability component over its carrying amount will be amortized to interest expense over the expected life of the 2021 Notes using the effective interest method with an effective interest rate of
6.4%
per annum. We have determined the expected life of the 2021 Notes to be equal to the original
seven
-year term. The equity component is not remeasured as long as it continues to meet the conditions for equity classification. As of
December 31, 2017
, the “if-converted value” did not exceed the principal amount of the 2021 Notes.
We allocated the total issuance costs incurred of
$16.1 million
to the liability and equity components based on their relative values. Issuance costs attributable to the liability component will be amortized to expense over the term of the 2021 Notes, and issuance costs attributable to the equity component were included with the equity component in our shareholders’ equity.
As of
December 31, 2017
, the carrying value of the equity component of the 2021 Notes, net of equity issuance costs, was
$126.9 million
.
The Exchangeable Senior Notes were issued by Jazz Investments I Limited, or the Issuer, a
100%
-owned finance subsidiary of Jazz Pharmaceuticals plc. The Exchangeable Senior Notes are senior unsecured obligations of the Issuer and are fully and unconditionally guaranteed on a senior unsecured basis by Jazz Pharmaceuticals plc. No subsidiary of Jazz Pharmaceuticals plc guaranteed the Exchangeable Senior Notes. Subject to certain local law restrictions on payment of dividends, among other things, and potential negative tax consequences, we are not aware of any significant restrictions on the ability of Jazz Pharmaceuticals plc to obtain funds from the Issuer or Jazz Pharmaceuticals plc’s other subsidiaries by dividend or loan, or any legal or economic restrictions on the ability of the Issuer or Jazz Pharmaceuticals plc’s other subsidiaries to transfer funds to Jazz Pharmaceuticals plc in the form of cash dividends, loans or advances. There is no assurance that in the future such restrictions will not be adopted.
For the years ended December 31,
2017
,
2016
and
2015
, we recognized
$37.8 million
,
$27.5 million
and
$26.5 million
, respectively, in interest expense, net related to the contractual coupon rate and amortization of the debt discount on the Exchangeable Senior Notes.
Scheduled maturities with respect to our long-term debt are as follows (in thousands):
|
Year Ending December 31,
|
Scheduled Long-Term Debt Maturities
|
||
|
2018
|
$
|
40,605
|
|
|
2019
|
58,652
|
|
|
|
2020
|
76,700
|
|
|
|
2021
|
1,075,801
|
|
|
|
Thereafter
|
575,000
|
|
|
|
Total
|
$
|
1,826,758
|
|
12. Deferred Revenue
The deferred revenue balance as of December 31, 2017 primarily related to deferred upfront fees received in connection with
two
license, development and commercialization agreements. We recognized contract revenues of
$5.6 million
during 2017 relating to these upfront payments. The deferred revenue balances are being recognized over an average of
four years
representing the period we expect to perform our research and developments obligations under each agreement.
The deferred revenue balance as of December 31, 2016 primarily related to agreements we have with UCB Pharma Limited, or UCB, under which UCB has the right to market Xyrem for certain indications in various countries outside of the U.S. We recognized contract revenues of
$1.1 million
during each of
2017
,
2016
and
2015
relating to
two
upfront payments received from UCB in 2006 totaling
$15.0 million
.
F-28
13. Commitments and Contingencies
Indemnification
In the normal course of business, we enter into agreements that contain a variety of representations and warranties and provide for general indemnification, including indemnification associated with product liability or infringement of intellectual property rights. Our exposure under these agreements is unknown because it involves future claims that may be made but have not yet been made against us. To date, we have not paid any claims or been required to defend any action related to these indemnification obligations.
We have agreed to indemnify our executive officers, directors and certain other employees for losses and costs incurred in connection with certain events or occurrences, including advancing money to cover certain costs, subject to certain limitations. The maximum potential amount of future payments we could be required to make under the indemnification obligations is unlimited; however, we maintain insurance policies that may limit our exposure and may enable us to recover a portion of any future amounts paid. Assuming the applicability of coverage, the willingness of the insurer to assume coverage, and subject to certain retention, loss limits and other policy provisions, we believe the fair value of these indemnification obligations is not significant. Accordingly, we have not recognized any liabilities relating to these obligations as of
December 31, 2017
and
December 31, 2016
. No assurances can be given that the covering insurers will not attempt to dispute the validity, applicability, or amount of coverage without expensive litigation against these insurers, in which case we may incur substantial liabilities as a result of these indemnification obligations.
Lease and Other Commitments
Facility Leases.
In January 2015, we entered into an agreement to lease office space located in Palo Alto, California in a building subsequently constructed by the landlord. The term of this lease is
12 years
from the commencement date as defined in the lease agreement and we have an option to extend the term twice for a period of
five years
each. We concluded we were the deemed owner of the building during the construction period, based on applicable accounting guidance for build-to-suit leases. Accordingly, the landlord’s costs of constructing the building during the construction period were capitalized, offset by a corresponding financing obligation in our consolidated balance sheets. We began to occupy this office space in October 2017. As such, we evaluated the lease to determine whether it had met the requirements for sale-leaseback accounting, including evaluating whether all risks of ownership have been transferred back to the landlord, as evidenced by a lack of continuing involvement in the build-to-suit lease property. We determined that the construction project did not qualify for sale-leaseback accounting and will instead be accounted for as a financing, given our continuing involvement after the conclusion of the construction period. As a result, the build-to-suit lease property remains on our consolidated balance sheets as of
December 31, 2017
and is being depreciated over its estimated useful life starting in the fourth quarter of 2017. As of
December 31, 2017
, the total amount of the related financing obligation was
$62.9 million
, which is classified within current liabilities and non-current liabilities in our consolidated balance sheets.
In September 2017, we entered into an agreement to lease office space located in Palo Alto, California in a second building to be constructed by the same landlord. We expect to occupy this office space by the end of 2019. This lease has a term of
12 years
from the commencement date as defined in the lease agreement and we have an option to extend the term of the lease twice for a period of
five years
each. In connection with this lease, the landlord is providing a tenant improvement allowance for the costs associated with the design, development and construction of tenant improvements for the leased facilities. We are obligated to fund all costs incurred in excess of the tenant improvement allowance. The scope of the planned tenant improvements do not qualify as “normal tenant improvements” under the lease accounting guidance. Accordingly, for accounting purposes, we have concluded we are the deemed owner of the building during the construction period. As of
December 31, 2017
, we recorded project construction costs of
$17.4 million
incurred by the landlord as construction-in-progress in property and equipment, net and a corresponding financing obligation in other non-current liabilities in our consolidated balance sheets. We will increase the asset and financing obligation as additional building costs are incurred by the landlord during the construction period.
For the years ended December 31, 2017, 2016 and 2015, we recorded rent expense associated with the ground lease on our facility leases of
$2.4 million
,
$1.9 million
and
$1.8 million
, respectively, in our consolidated statements of income.
F-29
Future minimum lease payments under our noncancelable facility leases as of
December 31, 2017
, were as follows (in thousands):
|
Year Ending December 31,
|
Lease Payments
|
||
|
2018
|
$
|
6,297
|
|
|
2019
|
9,142
|
|
|
|
2020
|
14,392
|
|
|
|
2021
|
14,824
|
|
|
|
2022
|
15,269
|
|
|
|
Thereafter
|
135,473
|
|
|
|
Total
|
$
|
195,397
|
|
Operating Leases.
We have noncancelable operating leases for our office buildings and we are obligated to make payments under noncancelable operating leases for automobiles used by our sales force.
Lease expense under our operating leases was as follows (in thousands):
|
|
Year Ended December 31,
|
||||||||||
|
|
2017
|
2016
|
2015
|
||||||||
|
Lease expense
|
$
|
14,982
|
|
$
|
11,600
|
|
$
|
10,479
|
|
||
Future minimum lease payments under our noncancelable operating leases as of
December 31, 2017
, were as follows (in thousands):
|
Year ending December 31,
|
Lease
Payments
|
||
|
2018
|
$
|
9,102
|
|
|
2019
|
8,166
|
|
|
|
2020
|
6,111
|
|
|
|
2021
|
5,212
|
|
|
|
2022
|
5,007
|
|
|
|
Thereafter
|
12,753
|
|
|
|
Total
|
$
|
46,351
|
|
In August 2016, we entered into an operating lease agreement for office space in Dublin, Ireland for a term of
20 years
, with an option to terminate at the end of
eight years
with no less than
one year
’s prior written notice and the payment of a termination fee, and a further option to terminate at the end of
15 years
with no less than
one year
’s prior written notice. We are obligated to make minimum lease payments totaling
$19.8 million
in connection with this lease.
Other Commitments.
As of
December 31, 2017
, we had
$46.3 million
of noncancelable purchase commitments due within one year, primarily related to agreements with third party manufacturers.
Legal Proceedings
We are involved in legal proceedings, including the following matters:
Xyrem ANDA Litigation.
On December 10, 2012, we received a notice of Paragraph IV Patent Certification, or Paragraph IV Certification, from Amneal Pharmaceuticals, LLC, or Amneal, that it had submitted an abbreviated new drug application, or ANDA, to the FDA requesting approval to market a generic version of Xyrem. On January 18, 2013, we filed a lawsuit against Amneal in the federal district court of New Jersey, or District Court, alleging that our patents covering Xyrem are infringed or will be infringed by Amneal’s ANDA and seeking a permanent injunction to prevent Amneal from introducing a generic version of Xyrem that would infringe these patents. On November 21, 2013, we received a notice of Paragraph IV Certification from Par Pharmaceutical, Inc., or Par, that it had submitted an ANDA to the FDA requesting approval to market a generic version of Xyrem. On December 27, 2013, we filed a lawsuit against Par in the District Court alleging that our patents covering Xyrem are infringed or will be infringed by Par’s ANDA and seeking a permanent injunction to prevent Par from introducing a generic version of Xyrem that would infringe these patents.
F-30
In May 2014, the District Court granted a request by Amneal to consolidate its case with the Par case. Additional patents covering Xyrem have been issued since May 2014 and have been listed in the FDA’s publication “Approved Drug Products with Therapeutic Equivalence Evaluations,” or the Orange Book, for Xyrem. Amneal and Par gave us additional notices of Paragraph IV Certifications regarding such patents, and we filed additional lawsuits against Amneal and Par in the District Court alleging that our patents covering Xyrem are infringed or will be infringed by Amneal’s and Par’s ANDAs and seeking a permanent injunction to prevent Amneal and Par from introducing a generic version of Xyrem that would infringe our patents. In August 2016, we and Par stipulated to dismiss claims relating to our patents covering the formulation of Xyrem on the grounds that Par had notified FDA that it had converted its Paragraph IV Certifications to Paragraph III Patent Certifications. In September 2017, we and Amneal stipulated to dismiss claims relating to certain of our patents covering the formulation of Xyrem on the grounds that Amneal had notified FDA that it had converted its Paragraph IV Certifications as to these patents to Paragraph III Patent Certifications.
On October 30, 2014, we received a notice of Paragraph IV Certification from Teva Pharmaceutical Industries Ltd., formerly known as Watson Laboratories, Inc., or Teva, that it had submitted an ANDA to the FDA requesting approval to market a generic version of Xyrem. On December 11, 2014, we filed a lawsuit against Teva in the District Court alleging that our patents covering Xyrem are or will be infringed by Teva’s ANDA and seeking a permanent injunction to prevent Teva from introducing a generic version of Xyrem that would infringe these patents. In March 2015, Teva moved to dismiss the portion of the case based on our Orange Book-listed REMS patents on the grounds that these patents do not cover patentable subject matter. In November 2015, the District Court administratively terminated this motion to dismiss (without prejudice) pending the outcome of IPR proceedings before the Patent Trial and Appeal Board, or PTAB, of the U.S. Patent and Trademark Office relating to the patents that were the subject of Teva’s motion. Since March 2015, we received an additional notice of Paragraph IV Certification from Teva regarding newly issued patents for Xyrem listed in the Orange Book, and we filed an additional lawsuit against Teva in the District Court alleging that our patents covering Xyrem are or will be infringed by Teva’s ANDA and seeking a permanent injunction to prevent Teva from introducing a generic version of Xyrem that would infringe these patents.
In April 2015, the District Court issued an order consolidating all then-pending lawsuits against Amneal, Par and Teva into
one
case.
On July 23, 2015, we received a notice of Paragraph IV Certification from Lupin Inc., or Lupin, that it had submitted an ANDA to the FDA requesting approval to market a generic version of Xyrem. On September 2, 2015, we filed a lawsuit in the District Court alleging that our patents covering Xyrem are or will be infringed by Lupin’s ANDA and seeking a permanent injunction to prevent Lupin from introducing a generic version of Xyrem that would infringe our patents.
In January, April and June 2016, the District Court issued orders consolidating all of the cases then pending against Amneal, Par, Teva and Lupin into a single case for all purposes. Although no trial date has been set for the consolidated case, discovery is scheduled to conclude in the third quarter of 2018, and the trial in this consolidated case could occur as early as the third quarter of 2018. As discussed in more detail below, in January 2018, we entered into a settlement agreement and related agreements resolving our patent infringement litigation against Par in the consolidated case, as well as related discovery proceedings and certain IPR proceedings currently on appeal to the Court of Appeal for the Federal Circuit, or the Federal Circuit.
On November 21, 2017, we received a notice of Paragraph IV Certification from Mallinckrodt Inc., or Mallinckrodt, that it had submitted an ANDA to the FDA requesting approval to market a generic version of Xyrem. On January 2, 2018, we filed a lawsuit in the District Court alleging that our patents covering Xyrem are or will be infringed by Mallinckrodt’s ANDA and seeking a permanent injunction to prevent Mallinckrodt from introducing a generic version of Xyrem that would infringe our patents.
We cannot predict whether additional generic manufacturers will file ANDAs and require new patent litigation, the specific timing or outcome of events with respect to the remaining defendants or the impact of developments involving any specific parties or patents on other ongoing proceedings with any ANDA filer.
Xyrem ANDA Litigation Settlements.
On April 5, 2017, we entered into a settlement agreement and related agreements resolving our patent infringement litigation against the first ANDA filer, Roxane Laboratories, Inc., which was acquired by West-Ward Pharmaceuticals Corp. (a wholly owned subsidiary of Hikma Pharmaceuticals PLC), or West-Ward. In connection with the settlement, we granted West-Ward the right to sell an authorized generic version of Xyrem, the West-Ward AG Product, in the U.S. for an initial term of
six
months beginning on January 1, 2023, or earlier under certain circumstances. Such circumstances include events related to the licensing or market entry of another generic sodium oxybate product, a final decision that all unexpired claims of the Xyrem patents are invalid and/or unenforceable, or a substantial reduction in Xyrem net sales over specified periods of time. West-Ward has the right to extend the initial
six
-month term for the West-Ward AG
F-31
Product, or the Initial Term, and continue to sell the West-Ward AG Product for up to a total of
five
years (the Initial Term, as it may be extended by West-Ward, is referred to as the West-Ward AG Sales Period). We are entitled to receive a meaningful royalty on net sales of the West-Ward AG Product, with the royalty rate increasing during the Initial Term based on increased net sales of the West-Ward AG Product. There will also be a substantial increase in the royalty rate should the West-Ward AG Sales Period be extended beyond
one year
. We will also receive payment for the supply of the West-Ward AG Product and reimbursement for a portion of the services costs associated with the operation of the Xyrem REMS and distribution of the West-Ward AG Product. We also granted West-Ward a non-exclusive license under the Xyrem patents to make, have made and market its own generic sodium oxybate product under the West-Ward ANDA in the U.S., effective at the end of the West-Ward AG Sales Period.
On January 9, 2018, we entered into a settlement agreement and related agreements resolving our patent infringement litigation against Par in the District Court, as well as related discovery proceedings and certain IPR proceedings currently on appeal to the Federal Circuit. In connection with the settlement, we granted Par the right to sell a limited volume of an authorized generic version of Xyrem, or the Par AG Product, in the U.S. for a term beginning on July 1, 2023, or earlier under certain circumstances, and ending on December 31, 2025, or the Par AG Sales Period. Such circumstances include events related to acceleration of the West-Ward AG Product launch date, the earlier launch of another party’s authorized generic or generic sodium oxybate product, or a final decision that all unexpired claims of the Xyrem patents are not infringed, invalid and/or unenforceable. The volume of the Par AG Product is limited to an annual amount equal to a low single-digit percentage of Xyrem sales volume during the calendar year preceding the entry date of the Par AG Product. We also granted Par a non-exclusive license under the Xyrem patents to make, have made and market its own generic sodium oxybate product under Par’s ANDA (assuming FDA approval is obtained) effective December 31, 2025, or earlier under certain circumstances. Such circumstances include events related to launch of a generic sodium oxybate product by West-Ward or another party under its ANDA, or a final decision that all unexpired claims of the Xyrem patents are not infringed, invalid and/or unenforceable. If the Par license to market its own generic sodium oxybate product accelerates, then Par will have the option to elect to market the Par AG Product until December 31, 2025, but Par will not be entitled to market the Par AG Product and its own generic sodium oxybate product simultaneously. We are entitled to receive a meaningful royalty on net sales of the Par AG Product over the Par AG Sales Period, as well as payment for the supply of the Par AG Product and reimbursement for a portion of the services costs associated with the operation of the Xyrem REMS and distribution of the Par AG Product.
In addition to our settlement agreements with West-Ward and Par, we have also entered into settlements with
three
other ANDA filers, granting each of those filers the right to manufacture, market and sell its own sodium oxybate product on or after December 31, 2025, or earlier depending on the occurrence of certain events. The specific terms of all of the settlement agreements are confidential.
The settlements do not resolve the consolidated case against Amneal, Teva and Lupin, or the case against the most recent ANDA filer, Mallinckrodt, which remain pending.
Xyrem Post-Grant Patent Review Matters
.
In January 2015, certain of the ANDA filers filed petitions for IPR with respect to the validity of
six
of our
seven
patents associated with the Xyrem REMS, or REMS patents. The PTAB instituted IPR trials with respect to certain of these petitions. In July 2016, the PTAB issued final decisions that the claims of the
six
REMS patents are unpatentable. In March 2016, the PTAB partially instituted an IPR on
three
claims of a seventh REMS patent, declining to review
25
of
28
claims, and in March 2017, the PTAB issued a final decision that the
three
claims they reviewed are unpatentable. The July 2016 and March 2017 PTAB decisions are part of a consolidated appeal currently pending before the Federal Circuit. If the Federal Circuit upholds the PTAB decisions on appeal, we will not be able to enforce claims the PTAB found unpatentable. We cannot predict whether additional post-grant patent review challenges will be filed by any of the ANDA filers or any other entity, the outcome of any future IPR or other proceeding, the outcome of the appeal of the July 2016 and March 2017 PTAB decisions with respect to the REMS patents or the impact any IPR or other proceeding might have on ongoing ANDA litigation proceedings or other aspects of our Xyrem business.
Shareholder Litigation Matters Relating to Celator Acquisition.
On June 21, 2016, a putative class-action lawsuit challenging our Celator Acquisition, captioned
Dunbar v. Celator Pharmaceuticals, Inc.,
or the Dunbar action, was filed in the Superior Court of New Jersey. The complaint was filed against Celator, each member of the Celator board of directors, Jazz Pharmaceuticals plc and our wholly owned subsidiary Plex Merger Sub, Inc., or Plex. The complaint generally alleges that the Celator directors breached their fiduciary duties in connection with the Celator Acquisition, and that Jazz Pharmaceuticals plc and Plex aided and abetted these alleged breaches of fiduciary duty. The complaint also generally asserts that the Celator directors breached their fiduciary duties to Celator’s public stockholders by, among other things, (i) agreeing to sell Celator to us at an inadequate price, (ii) implementing an unfair process, (iii) agreeing to certain provisions of the merger agreement for the Celator Acquisition that allegedly favored us and deterred alternative bids, and (iv) failing to disclose purportedly material information in Celator’s Schedule 14D-9 filing with the U.S. Securities and Exchange Commission, or SEC. The plaintiff
F-32
sought, among other things, an injunction against the consummation of the Celator Acquisition and an award of costs and expenses, including a reasonable allowance for attorneys’ and experts’ fees.
Between June 27, 2016 and June 29, 2016,
two
putative class-action lawsuits challenging the Celator Acquisition, captioned
Palmisciano v. Celator Pharmaceuticals, Inc.,
or the Palmisciano action, and
Barreto v. Celator Pharmaceuticals, Inc.
,
or the Barreto action
,
were filed in the District Court. The complaints were filed against Celator and each member of the Celator board of directors. The complaints assert causes of action under sections 14 and 20 of the Securities Exchange Act of 1934, as amended, predicated on Celator’s and the Celator directors’ alleged failure to disclose purportedly material information in Celator’s Schedule 14D-9 filing with the SEC. The plaintiffs sought, among other things, an injunction against the consummation of the Celator Acquisition and an award of costs and expenses, including a reasonable allowance for attorneys’ and experts’ fees. Neither Jazz Pharmaceuticals plc nor Plex were named defendants in these actions.
On July 6, 2016, the defendants to the Dunbar action, the Palmisciano action and the Barreto action entered into a memorandum of understanding, or MOU, regarding settlement of these actions with the plaintiffs. The MOU outlines the terms of the parties’ agreement in principle to settle and release all claims which were or could have been asserted in these actions. In consideration for such settlement and release, the parties to these actions agreed, among other things, that Celator would amend its Schedule 14D-9 to include certain supplemental disclosures. The Schedule 14D-9 was amended by Celator on July 6, 2016, and the Celator Acquisition was completed on July 12, 2016. In June 2017, the parties to the MOU agreed to terminate the MOU, and the plaintiffs agreed to voluntarily dismiss the remaining actions. Thereafter, the parties negotiated and ultimately agreed, in October 2017, on a mootness fee paid to plaintiffs’ counsel. The Dunbar, Palmisciano and Barreto actions have each been dismissed with prejudice.
From time to time we are involved in legal proceedings arising in the ordinary course of business. We believe there is no other litigation pending that could have, individually or in the aggregate, a material adverse effect on our results of operations or financial condition.
Other Contingencies
In May and October 2016 and in February 2017, we received subpoenas from the U.S. Attorney’s Office for the District of Massachusetts requesting documents related to our support of 501(c)(3) organizations that provide financial assistance to Medicare patients, and, for Xyrem, documents concerning the provision of financial assistance to Medicare patients. Other companies have disclosed similar subpoenas and continuing inquiries. We are cooperating with the government’s investigation of our support of charitable organizations, and the outcome of this investigation could include an enforcement action or a settlement with the federal government. We are unable to predict how long this investigation will continue, whether we will receive additional subpoenas in connection with this investigation, or its outcome, but we expect that we will continue to incur significant costs in connection with the investigation, regardless of the outcome. If the federal government were to file an enforcement action against us as a result of the investigation and could establish the elements of a violation of relevant laws, we could be subject to damages, fines and penalties, which could be substantial, along with other criminal, civil or administrative sanctions. Any settlement with the federal government could result in substantial payments and entry into a corporate integrity agreement, which would impose costs and burdens on the operation of our business.
14. Shareholders’ Equity
Share Repurchase Program
In May 2013, our board of directors authorized a share repurchase program pursuant to which we were authorized to repurchase a number of ordinary shares having an aggregate repurchase price of up to
$200.0 million
, exclusive of any brokerage commissions. In August 2015, we completed repurchases under the May 2013 share repurchase program. In November 2015, our board of directors authorized another share repurchase program pursuant to which we were authorized to repurchase a number of ordinary shares having an aggregate purchase price of up to
$300.0 million
, exclusive of any brokerage commissions. In September 2016, we completed repurchases under the November 2015 share repurchase program. In November 2016, our board of directors authorized a new share repurchase program pursuant to which we are authorized to repurchase a number of ordinary shares having an aggregate purchase price of up to
$300.0 million
, exclusive of any brokerage commissions. Under this program, which has no expiration date, we may repurchase ordinary shares from time to time on the open market. The timing and amount of repurchases will depend on a variety of factors, including the price of our ordinary shares, alternative investment opportunities, restrictions under the amended credit agreement, corporate and regulatory requirements and market conditions. The new share repurchase program may be modified, suspended or discontinued at any time without prior notice. In
2017
, under the November 2016 repurchase program, we spent a total of
$98.8 million
to repurchase
0.7 million
of our ordinary shares at an average total purchase price, including brokerage commissions, of
$140.34
F-33
per share. All ordinary shares repurchased were canceled. As of
December 31, 2017
, the remaining amount authorized under the November 2016 share repurchase program was
$182.7 million
.
Authorized But Unissued Ordinary Shares
We had reserved the following shares of authorized but unissued ordinary shares (in thousands):
|
December 31, 2017
|
||
|
2011 Equity Incentive Plan
|
16,026
|
|
|
Amended and Restated 2007 Non-Employee Directors Stock Award Plan
|
481
|
|
|
2007 Employee Stock Purchase Plan
|
339
|
|
|
Amended and Restated Directors Deferred Compensation Plan
|
178
|
|
|
2007 Equity Incentive Plan
|
17
|
|
|
Total
|
17,041
|
|
15. Comprehensive Income (Loss)
Comprehensive income (loss) includes net income and all changes in shareholders’ equity during a period, except for those changes resulting from investments by shareholders or distributions to shareholders.
Accumulated Other Comprehensive Loss
The components of accumulated other comprehensive loss as of
December 31, 2017
and
December 31, 2016
were as follows (in thousands):
|
Net Unrealized
Gain (Loss) From Hedging Activities |
Foreign
Currency Translation Adjustments |
Total
Accumulated Other Comprehensive Loss |
|||||||||
|
Balance at December 31, 2016
|
$
|
—
|
|
$
|
(317,333
|
)
|
$
|
(317,333
|
)
|
||
|
Other comprehensive income (loss) before reclassifications
|
(213
|
)
|
174,973
|
|
174,760
|
|
|||||
|
Amounts reclassified from accumulated other comprehensive loss
|
1,695
|
|
—
|
|
1,695
|
|
|||||
|
Other comprehensive income, net
|
1,482
|
|
174,973
|
|
176,455
|
|
|||||
|
Balance at December 31, 2017
|
$
|
1,482
|
|
$
|
(142,360
|
)
|
$
|
(140,878
|
)
|
||
In
2017
, other comprehensive income reflects foreign currency translation adjustments, primarily due to the strengthening of the euro against the U.S. dollar, and the net unrealized gain on derivatives that qualify as cash flow hedges.
F-34
16. Segment and Other Information
Our operating segment is reported in a manner consistent with the internal reporting provided to the chief operating decision maker or, CODM. Our CODM has been identified as our chief executive officer. We have determined that we operate in
one
business segment, which is the identification, development and commercialization of meaningful pharmaceutical products that address unmet medical needs. The following table presents a summary of total revenues (in thousands):
|
Year Ended December 31,
|
|||||||||||
|
2017
|
2016
|
2015
|
|||||||||
|
Xyrem
|
$
|
1,186,699
|
|
$
|
1,107,616
|
|
$
|
955,187
|
|
||
|
Erwinaze/Erwinase
|
197,340
|
|
200,678
|
|
203,261
|
|
|||||
|
Defitelio/defibrotide
|
133,650
|
|
108,952
|
|
70,731
|
|
|||||
|
Vyxeos
|
33,790
|
|
—
|
|
—
|
|
|||||
|
Prialt
®
(ziconotide) intrathecal infusion
|
27,361
|
|
29,120
|
|
26,440
|
|
|||||
|
Other
|
22,559
|
|
30,895
|
|
61,200
|
|
|||||
|
Product sales, net
|
1,601,399
|
|
1,477,261
|
|
1,316,819
|
|
|||||
|
Royalties and contract revenues
|
17,294
|
|
10,712
|
|
7,984
|
|
|||||
|
Total revenues
|
$
|
1,618,693
|
|
$
|
1,487,973
|
|
$
|
1,324,803
|
|
||
The following table presents a summary of total revenues attributed to geographic sources (in thousands):
|
Year Ended December 31,
|
|||||||||||
|
2017
|
2016
|
2015
|
|||||||||
|
United States
|
$
|
1,463,457
|
|
$
|
1,354,921
|
|
$
|
1,192,879
|
|
||
|
Europe
|
122,789
|
|
106,146
|
|
103,614
|
|
|||||
|
All other
|
32,447
|
|
26,906
|
|
28,310
|
|
|||||
|
Total revenues
|
$
|
1,618,693
|
|
$
|
1,487,973
|
|
$
|
1,324,803
|
|
||
The following table presents a summary of the percentage of total revenues from customers that represented more than 10% of our total revenues:
|
Year Ended December 31,
|
||||||||
|
2017
|
2016
|
2015
|
||||||
|
Express Scripts
|
73
|
%
|
74
|
%
|
72
|
%
|
||
|
McKesson
|
16
|
%
|
15
|
%
|
7
|
%
|
||
At the end of the second quarter of 2015, we transitioned the U.S. distribution of Erwinaze from Accredo Health Group, Inc. to McKesson.
The following table presents total long-lived assets by location (in thousands):
|
December 31,
|
|||||||
|
2017
|
2016
|
||||||
|
United States
|
$
|
95,570
|
|
$
|
35,791
|
|
|
|
Ireland
|
64,343
|
|
62,453
|
|
|||
|
Italy
|
8,220
|
|
7,000
|
|
|||
|
Other
|
1,947
|
|
2,246
|
|
|||
|
Total long-lived assets (1)
|
$
|
170,080
|
|
$
|
107,490
|
|
|
_________________________
|
(1)
|
Long-lived assets consist of property and equipment.
|
F-35
17. Share-Based Compensation
2011 Equity Incentive Plan
On January 18, 2012, the businesses of Jazz Pharmaceuticals, Inc. and Azur Pharma were combined in a merger transaction, or the Azur Merger. In connection with the Azur Merger, Jazz Pharmaceuticals, Inc.’s board of directors adopted the 2011 Equity Incentive Plan, or the 2011 Plan, in October 2011 and its stockholders approved the 2011 Plan at the special meeting of the stockholders held in December 2011 in connection with the Azur Merger. The 2011 Plan became effective immediately before the consummation of the Azur Merger and was assumed and adopted by us upon the consummation of the Azur Merger. The terms of the 2011 Plan provide for the grant of stock options, stock appreciation rights, restricted stock awards, RSUs, other stock awards, and performance awards that may be settled in cash, shares, or other property. All outstanding grants under the 2011 Plan were granted to employees and vest ratably over service periods of
four years
and expire no more than
10
years after the date of grant. As of
December 31, 2017
, a total of
21,729,232
of our ordinary shares had been authorized for issuance under the 2011 Plan. In addition, the share reserve under the 2011 Plan will automatically increase on January 1 of each year through January 1, 2022, by the least of (a)
4.5%
of the total number of ordinary shares outstanding on December 31 of the preceding calendar year, (b)
5,000,000
shares, or (c) such lesser number of ordinary shares as determined by our board of directors. On January 1, 2018, the share reserve under the 2011 Plan automatically increased by
2,695,413
ordinary shares pursuant to this provision.
2007 Equity Incentive Plan
The 2007 Equity Incentive Plan, or the 2007 Plan, which was initially adopted by the Jazz Pharmaceuticals, Inc. board of directors and approved by the Jazz Pharmaceuticals, Inc. stockholders in connection with its initial public offering, was continued and assumed by us upon consummation of the Azur Merger. The 2007 Plan provided for the grant of stock options, restricted stock awards, RSUs, stock appreciation rights, performance stock awards and other forms of equity compensation to employees, including officers, non-employee directors and consultants. Prior to the consummation of the Azur Merger, all of the grants under the 2007 Plan were granted to employees and vest ratably over service periods of
three
to
five
years and expire no more than
10
years after the date of grant. Effective as of the closing of the Azur Merger on January 18, 2012, the number of shares reserved for issuance under the 2007 Plan was set to
1,000,000
ordinary shares. The share reserve under the 2007 Plan will not automatically increase. Since the Azur Merger, all of the new grants under the 2007 Plan were granted to non-employee directors, vest ratably over service periods of
one
to
three
years and expire no more than
10 years
after the date of grant. The 2007 Plan expired in April 2017, and accordingly, no new grants can be awarded under the 2007 Plan. As of
December 31, 2017
, the number of shares reserved represents issuable shares from options granted but not yet exercised under the 2007 Plan.
2007 Employee Stock Purchase Plan
In 2007, Jazz Pharmaceuticals, Inc.’s employees became eligible to participate in the ESPP. The ESPP was amended and restated by Jazz Pharmaceuticals, Inc.’s board of directors in October 2011 and approved by its stockholders in December 2011. The amended and restated ESPP became effective immediately prior to the effective time of the Azur Merger and was assumed by us upon the consummation of the Azur Merger. The amended and restated ESPP allows our eligible employee participants (including employees of any of a parent or subsidiary company if our board of directors designates such company as eligible to participate) to purchase our ordinary shares at a discount of
15%
through payroll deductions. The ESPP consists of a fixed offering period of
24 months
with
four
purchase periods within each offering period. The number of shares available for issuance under our ESPP during any six-month purchase period is
175,000
shares. As of
December 31, 2017
, a total of
2,660,000
of our ordinary shares had been authorized for issuance under the ESPP. The share reserve under the ESPP will automatically increase on January 1 of each year through January 1, 2022, by the least of (a)
1.5%
of the total number of ordinary shares outstanding on December 31 of the preceding calendar year, (b)
1,000,000
shares, and (c) such lesser number of ordinary shares as determined by our board of directors or a duly-authorized committee thereof. On January 1, 2018, the share reserve under the ESPP automatically increased by
898,471
ordinary shares pursuant to this provision.
Amended and Restated 2007 Non-Employee Directors Stock Award Plan
The Amended and Restated 2007 Non-Employee Directors Stock Award Plan, or the 2007 Directors Award Plan, which was initially adopted by the Jazz Pharmaceuticals, Inc. board of directors and approved by the Jazz Pharmaceuticals, Inc. stockholders in connection with its initial public offering, was continued and assumed by us upon the consummation of the Azur Merger. Until October 2011, the 2007 Directors Award Plan provided for the automatic grant of stock options to purchase shares of Jazz Pharmaceuticals, Inc.’s common stock to its non-employee directors initially at the time any individual first became a non-employee director, which vest over
three
years, and then annually over their period of service on its board of directors, which vest over
one
year. On October 24, 2011, Jazz Pharmaceuticals, Inc.’s board of directors amended the 2007 Directors Award Plan to eliminate all future initial and annual automatic grants so that future automatic grants would not be
F-36
made that would be subject to the excise tax imposed by Section 4985 of the Internal Revenue Code of 1986, as amended, or the Internal Revenue Code, in connection with the Azur Merger. Accordingly, all future stock option grants under the 2007 Directors Award Plan will be at the discretion of our board of directors. Since the Azur Merger, all of the new grants under the 2007 Directors Award Plan were granted to non-employee directors and vest ratably over service periods of
one
to
three
years and expire no more than
10
years after the date of grant. In addition, the 2007 Directors Award Plan provides the source of shares to fund distributions made prior to August 15, 2010 under the Directors Deferred Compensation Plan described below. In August 2016, our shareholders approved our proposal to expand the types of stock awards that may be granted to our non-employee directors under the 2007 Directors Award Plan and eliminate the final automatic share reserve increase under the 2007 Directors Award Plan that was scheduled to occur on January 1, 2017. As of
December 31, 2017
, a total of
903,938
of our ordinary shares had been authorized for issuance under the 2007 Directors Award Plan.
Amended and Restated Directors Deferred Compensation Plan
In May 2007, the Jazz Pharmaceuticals, Inc. board of directors adopted the Directors Deferred Compensation Plan, or the Directors Deferred Plan, which was amended in December 2008 and was then amended and restated in August 2010, and which was continued and assumed by us upon consummation of the Azur Merger. The Directors Deferred Plan allows each non-employee director to elect to defer receipt of all or a portion of his or her annual retainer fees to a future date or dates. Amounts deferred under the Directors Deferred Plan are credited as shares of Jazz Pharmaceuticals, Inc.’s common stock (or our ordinary shares following the Azur Merger) to a phantom stock account, the number of which are based on the amount of the retainer fees deferred divided by the market value of Jazz Pharmaceuticals, Inc.’s common stock (or our ordinary shares following the Azur Merger) on the first trading day of the first open window period following the date the retainer fees are deemed earned. On the 10th business day following the day of separation from the board of directors or the occurrence of a change in control, or as soon thereafter as practical once the non-employee director has provided the necessary information for electronic deposit of the deferred shares, each non-employee director will receive (or commence receiving, depending upon whether the director has elected to receive distributions from his or her phantom stock account in a lump sum or in installments over time) a distribution of his or her phantom stock account, in our ordinary shares (i) reserved under the 2007 Directors Option Plan prior to August 15, 2010 and (ii) from a new reserve of
200,000
shares set up under the Directors Deferred Plan on August 15, 2010. Although we continue to maintain the Directors Deferred Plan, since the consummation of the Azur Merger we have not permitted and will not permit non-employee directors to defer any annual retainer fees under the Directors Deferred Plan. We recorded
no
expense in 2017, 2016 and 2015 related to retainer fees earned and deferred. As of
December 31, 2017
,
14,499
of our ordinary shares that were unissued related to retainer fees that were deferred under the Directors Deferred Plan.
Share-Based Compensation
The table below shows, for all share option grants, the weighted-average assumptions used in the Black-Scholes option pricing model and the resulting weighted-average grant date fair value of share options granted in each of the past three years:
|
Year Ended December 31,
|
|||||||||||
|
2017
|
2016
|
2015
|
|||||||||
|
Grant date fair value
|
$
|
42.72
|
|
$
|
40.45
|
|
$
|
57.19
|
|
||
|
Volatility
|
35
|
%
|
39
|
%
|
39
|
%
|
|||||
|
Expected term (years)
|
4.3
|
|
4.2
|
|
4.2
|
|
|||||
|
Range of risk-free rates
|
1.6-2.1%
|
|
0.8-1.6%
|
|
1.1-1.5%
|
|
|||||
|
Expected dividend yield
|
—
|
%
|
—
|
%
|
—
|
%
|
|||||
We rely on a blend of the historical and implied volatilities of our own ordinary shares to determine expected volatility for share option grants. In addition, we use a single volatility estimate for each share option grant. The weighted-average volatility is determined by calculating the weighted average of volatilities for all share options granted in a given year.
The expected term of share option grants represents the weighted-average period the awards are expected to remain outstanding and our estimates were based on historical exercise data. The risk-free interest rate assumption was based on zero coupon U.S. Treasury instruments whose term was consistent with the expected term of our share option grants. The expected dividend yield assumption was based on our history and expectation of dividend payouts.
F-37
Share-based compensation expense related to share options, RSUs and grants under our ESPP was as follows (in thousands):
|
Year Ended December 31,
|
|||||||||||
|
2017
|
2016
|
2015
|
|||||||||
|
Selling, general and administrative
|
$
|
83,218
|
|
$
|
79,037
|
|
$
|
74,653
|
|
||
|
Research and development
|
17,870
|
|
15,296
|
|
13,356
|
|
|||||
|
Cost of product sales
|
5,812
|
|
4,438
|
|
3,541
|
|
|||||
|
Total share-based compensation expense, pre-tax
|
106,900
|
|
98,771
|
|
91,550
|
|
|||||
|
Income tax benefit from share-based compensation expense (1)
|
(21,792
|
)
|
(30,022
|
)
|
(20,071
|
)
|
|||||
|
Total share-based compensation expense, net of tax
|
$
|
85,108
|
|
$
|
68,749
|
|
$
|
71,479
|
|
||
__________________________
|
(1)
|
Following adoption of ASU No. 2016-09 “Improvements to Employee Share-Based Payment Accounting” in 2016, the 2017 and 2016 income tax benefit includes excess tax benefits recognized.
|
We recognized income tax benefits related to share option exercises of
$8.9 million
and
$8.3 million
in
2017
and
2016
, respectively, and realized
$0.4 million
in
2015
.
Share Options
The following table summarizes information as of
December 31, 2017
and activity during
2017
related to our share option plans:
|
Shares
Subject to
Outstanding
Options
(In thousands)
|
Weighted-
Average
Exercise
Price
|
Weighted-
Average
Remaining
Contractual
Term (Years)
|
Aggregate
Intrinsic
Value
(In thousands)
|
|||||||||
|
Outstanding at January 1, 2017
|
4,513
|
|
$
|
111.52
|
|
|||||||
|
Options granted
|
1,402
|
|
137.46
|
|
||||||||
|
Options exercised
|
(428
|
)
|
53.03
|
|
||||||||
|
Options forfeited
|
(241
|
)
|
140.04
|
|
||||||||
|
Options expired
|
(101
|
)
|
165.49
|
|
||||||||
|
Outstanding at December 31, 2017
|
5,145
|
|
121.06
|
|
6.8
|
$
|
124,032
|
|
||||
|
Vested and expected to vest at December 31, 2017
|
4,896
|
|
120.27
|
|
6.7
|
123,206
|
|
|||||
|
Exercisable at December 31, 2017
|
2,976
|
|
108.45
|
|
5.6
|
116,822
|
|
|||||
Aggregate intrinsic value shown in the table above is equal to the difference between the exercise price of the underlying share options and the fair value of our ordinary shares for share options that were in the money. The aggregate intrinsic value changes based on the fair market value of our ordinary shares. The aggregate intrinsic value of share options exercised was
$38.9 million
,
$36.1 million
and
$93.3 million
during
2017
,
2016
and
2015
, respectively. We issued new ordinary shares upon exercise of share options.
As of
December 31, 2017
, total compensation cost not yet recognized related to unvested share options was
$73.4 million
, which is expected to be recognized over a weighted-average period of
2.6
years.
As of
December 31, 2017
, total compensation cost not yet recognized related to grants under the ESPP was
$2.8 million
, which is expected to be recognized over a weighted-average period of less than
one year
.
Restricted Stock Units
In
2017
, we granted RSUs covering an equal number of our ordinary shares to employees with a weighted-average grant date fair value of
$137.46
. The fair value of RSUs is determined on the date of grant based on the market price of our ordinary shares as of that date. The fair value of the RSUs is recognized as an expense ratably over the vesting period of
four years
. In
2017
,
385,000
RSUs were released with
250,000
ordinary shares issued and
135,000
ordinary shares withheld for tax purposes. The total fair value of shares vested was
$53.2 million
,
$59.2 million
and
$72.2 million
during
2017
,
2016
and
2015
, respectively.
As of
December 31, 2017
, total compensation cost not yet recognized related to unvested RSUs was
$88.6 million
, which is expected to be recognized over a weighted-average period of
2.4
years.
F-38
The following table summarizes information as of
December 31, 2017
and activity during
2017
related to our RSUs:
|
Number of RSUs (in thousands)
|
Weighted-
Average Grant-Date Fair Value |
Weighted-
Average Remaining Contractual Term (Years) |
Aggregate
Intrinsic Value (In thousands) |
|||||||||
|
Outstanding at January 1, 2017
|
997
|
|
$
|
137.50
|
|
|||||||
|
RSUs granted
|
561
|
|
137.46
|
|
||||||||
|
RSUs released
|
(385
|
)
|
128.19
|
|
||||||||
|
RSUs forfeited
|
(110
|
)
|
141.18
|
|
||||||||
|
Outstanding at December 31, 2017
|
1,063
|
|
140.46
|
|
1.3
|
$
|
143,113
|
|
||||
18. Employee Benefit Plans
We operate a number of defined contribution retirement plans. The costs of these plans are charged to the consolidated statements of income in the period they are incurred. We recorded expense related to our defined contribution plans of
$5.5 million
,
$3.4 million
and
$2.2 million
in
2017
,
2016
and
2015
, respectively. In Ireland, we operate a defined contribution plan in which we contribute up to
8%
of an employee’s eligible earnings. We recorded expense of
$1.0 million
,
$0.8 million
and
$0.6 million
in
2017
,
2016
and
2015
, respectively, in connection with the contributions we made under the Irish defined contribution plan. In the U.S., we provide a qualified 401(k) savings plan for our U.S.-based employees. All U.S.-based employees are eligible to participate, provided they meet the requirements of the plan. In 2013, we elected to match certain employee contributions under the 401(k) savings plan. We recorded expense of
$3.7 million
,
$1.9 million
and
$1.1 million
in
2017
,
2016
and
2015
, respectively. In the United Kingdom, or UK, we operate a defined contribution plan in which we contribute up to
12%
of an employee’s eligible earnings. We recorded expense of
$0.7 million
,
$0.6 million
and
$0.4 million
in
2017
,
2016
and
2015
, respectively, in connection with contributions we made under the UK defined contribution plan. In France, we accrue for a potential liability which is payable if an employee retires. The accrued liability for France was
$0.3 million
as of
December 31, 2017
and
2016
. In Italy, we accrue for a potential liability which is payable if an employee leaves employment. The accrued liability for Italy was
$0.3 million
as of
December 31, 2017
and
2016
.
19. Restructuring
In 2016 and 2015, we recorded severance costs of
$1.5 million
for terminated employees in connection with the reorganization of our operations, primarily in France, Italy and the United Kingdom. These one-time termination benefits were recorded over the remaining service period where employees were required to stay through their termination date to receive the benefits and included within cost of product sales and selling, general and administrative expenses in our consolidated statements of income. As of
December 31, 2017
, we had incurred total termination benefit costs of
$3.0 million
in connection with these reorganizations. In addition, we incurred facility closure costs of
$0.2 million
in 2015 which were recorded within selling, general and administrative expenses in our consolidated statements of income. We completed these restructuring activities in 2017.
The following table summarizes the amounts related to restructuring through
December 31, 2017
(in thousands):
|
Termination Benefits
|
Facility Closure Costs
|
Total
|
|||||||||
|
Balance at December 31, 2014
|
$
|
1,823
|
|
$
|
118
|
|
$
|
1,941
|
|
||
|
Expense
|
1,469
|
|
172
|
|
1,641
|
|
|||||
|
Payments
|
(2,187
|
)
|
(290
|
)
|
(2,477
|
)
|
|||||
|
Balance at December 31, 2015
|
1,105
|
|
—
|
|
1,105
|
|
|||||
|
Expense
|
1,516
|
|
—
|
|
1,516
|
|
|||||
|
Payments
|
(2,590
|
)
|
—
|
|
(2,590
|
)
|
|||||
|
Balance at December 31, 2016
|
31
|
|
—
|
|
31
|
|
|||||
|
Expense
|
14
|
|
—
|
|
14
|
|
|||||
|
Payments
|
(45
|
)
|
—
|
|
(45
|
)
|
|||||
|
Balance at December 31, 2017
|
$
|
—
|
|
$
|
—
|
|
$
|
—
|
|
||
F-39
The balances as of December 31,
2016
and
2015
were included within accrued liabilities in our consolidated balance sheets.
20. Income Taxes
The components of income before the income tax provision (benefit) and equity in loss of investees were as follows (in thousands):
|
Year Ended December 31,
|
|||||||||||
|
2017
|
2016
|
2015
|
|||||||||
|
Ireland
|
$
|
77,476
|
|
$
|
179,570
|
|
$
|
233,785
|
|
||
|
United States
|
271,440
|
|
312,904
|
|
285,420
|
|
|||||
|
Other
|
92,201
|
|
39,972
|
|
(83,272
|
)
|
|||||
|
Total
|
$
|
441,117
|
|
$
|
532,446
|
|
$
|
435,933
|
|
||
The following table sets forth the details of the income tax provision (benefit) (in thousands):
|
Year Ended December 31,
|
|||||||||||
|
2017
|
2016
|
2015
|
|||||||||
|
Current
|
|||||||||||
|
Ireland
|
$
|
28,045
|
|
$
|
26,420
|
|
$
|
29,748
|
|
||
|
United States
|
135,608
|
|
140,061
|
|
116,301
|
|
|||||
|
Other
|
14,198
|
|
9,918
|
|
28,708
|
|
|||||
|
Total current tax expense
|
177,851
|
|
176,399
|
|
174,757
|
|
|||||
|
Deferred, exclusive of other components below
|
|||||||||||
|
Ireland
|
(19,709
|
)
|
(7,776
|
)
|
(6,655
|
)
|
|||||
|
United States
|
(27,559
|
)
|
(9,120
|
)
|
332
|
|
|||||
|
Other
|
(19,108
|
)
|
(13,720
|
)
|
(40,532
|
)
|
|||||
|
Total deferred, exclusive of other components
|
(66,376
|
)
|
(30,616
|
)
|
(46,855
|
)
|
|||||
|
Deferred, change in tax rates
|
|||||||||||
|
United States
|
(155,679
|
)
|
109
|
|
294
|
|
|||||
|
Other
|
(3,536
|
)
|
(10,656
|
)
|
(21,797
|
)
|
|||||
|
Total deferred, change in tax rates
|
(159,215
|
)
|
(10,547
|
)
|
(21,503
|
)
|
|||||
|
Total deferred tax benefit
|
(225,591
|
)
|
(41,163
|
)
|
(68,358
|
)
|
|||||
|
Total income tax provision (benefit)
|
$
|
(47,740
|
)
|
$
|
135,236
|
|
$
|
106,399
|
|
||
On December 22, 2017, the U.S. Tax Cuts and Jobs Act, or U.S. Tax Act, was signed into law. The legislation significantly changes U.S. tax law by, among other things, lowering corporate income tax rates, implementing a modified territorial tax system, imposing a one-time transition tax on deemed repatriated earnings of foreign subsidiaries and changing the rules which determine whether a U.S. person is a U.S. shareholder of a controlled foreign corporation, or CFC, for 2017 and onwards. The U.S. Tax Act reduces the U.S. corporate income tax rate from a maximum of 35% to a flat 21% rate, effective January 1, 2018.
We use the asset and liability method of accounting for income taxes. Under this method, deferred tax assets and liabilities are recognized for the future tax consequences attributable to differences between the financial statement carrying amounts of existing assets and liabilities and their respective tax basis. Deferred tax assets and liabilities are measured using enacted tax rates expected to apply to taxable income in the years in which those temporary differences are expected to reverse. As a result of the reduction in the U.S. corporate income tax rate from 35% to 21% under the U.S. Tax Act, we remeasured our ending net deferred tax liabilities as of December 31, 2017 and recognized a
$155.1 million
tax benefit in our consolidated statement of income in 2017.
F-40
The U.S. Tax Act provided for a one-time transition tax on the mandatory deemed repatriation of post-1986 undistributed foreign subsidiary earnings and profits through the year ended December 31, 2017 and also changed the rules which determine whether a U.S. person is a U.S. shareholder of a CFC for 2017 and onwards. In relation to these changes, we recognized a provisional
$6.3 million
of income tax expense in our consolidated statement of income in 2017, which is composed of state current tax expense and deferred tax expense.
While the U.S. Tax Act provides for a territorial tax system, beginning in 2018, it includes two new U.S. tax base erosion provisions, the global intangible low-taxed income, or GILTI, provisions and the base-erosion and anti-abuse tax, or BEAT, provisions. The GILTI provisions require us to include in our U.S. income tax return foreign subsidiary earnings in excess of an allowable return on the foreign subsidiary’s tangible assets. Additional analysis is required to determine the application of GILTI for us and no estimate for this has been recorded or policy election made regarding the recognition of GILTI as of and for the year ended December 31, 2017.
The BEAT provisions in the U.S. Tax Act eliminates the deduction of certain base-erosion payments made to related foreign corporations, and impose a minimum tax if greater than regular tax. We have not yet fully determined the application of BEAT for us, and it is not effective until 2018. There was no tax impact of BEAT recorded in our consolidated financial statements in 2017.
On December 22, 2017, the SEC staff issued Staff Accounting Bulletin No. 118 to address the application of U.S. GAAP in situations when a registrant does not have the necessary information available, prepared, or analyzed (including computations) in reasonable detail to complete the accounting for certain income tax effects of the U.S. Tax Act. We have recognized the provisional tax impact related to the one-time transition tax on foreign earnings (including the recognition of a provisional valuation allowance), changes to the rules regarding the deductibility of certain executive compensation (including the recognition of a related provisional deferred tax asset of
$7.5 million
) and changes to the rules which determine whether a U.S. person is a U.S. shareholder of a CFC, and included these amounts in our consolidated financial statements in 2017. The ultimate impact may differ from these provisional amounts, possibly materially, due to, among other things, additional analysis, changes in interpretations and assumptions we have made, additional regulatory guidance that may be issued, and actions we may take as a result of the U.S. Tax Act. The accounting is expected to be complete when the 2017 U.S. corporate income return is filed in 2018.
Our income tax benefit was
$47.7 million
in
2017
, and our income tax provision was
$135.2 million
and
$106.4 million
in
2016
and
2015
, respectively, related to tax arising on income in Ireland, the U.S. and certain other foreign jurisdictions, certain unrecognized tax benefits and various expenses not deductible for income tax purposes. The income tax benefit in 2017 included a provisional net benefit of
$148.8 million
relating to the impact of the recently enacted U.S Tax Act.
The effective tax rates for
2017
,
2016
and
2015
were
(10.8)%
,
25.4%
and
24.4%
, respectively. The effective tax rate for 2017 excluding the impact of the U.S. Tax Act was
22.9%
. The effective tax rates for 2017 (excluding the impact of the U.S. Tax Act), 2016 and 2015 were higher than the Irish statutory rate of
12.5%
, primarily due to income taxable at a rate higher than the Irish statutory rate, unrecognized tax benefits, and various expenses not deductible for income tax purposes, partially offset by originating tax credits, the release of reserves related to unrecognized tax benefits from the expiration of a statute of limitation and the release of a valuation allowance held against certain foreign net operating losses, or NOLs. The decrease in the effective tax rate in 2017 (excluding the impact of the U.S. Tax Act) compared to 2016 was primarily due to the release of a valuation allowance held against certain foreign NOLs and the release of reserves related to unrecognized tax benefits upon the expiration of a statute of limitation, partially offset by a reduction in deductions available in relation to subsidiary equity. The increase in the effective tax rate in 2016 compared to 2015 was primarily due to a decrease in the impact of the reduction in tax rates in certain jurisdictions and a decrease in originating tax credits, partially offset by changes in income mix among the various jurisdictions in which we operate. We are currently paying taxes in Ireland, the U.S. and certain other foreign jurisdictions where we have operations and either all NOLs have been utilized, or are restricted as a result of the Azur Merger.
F-41
The reconciliation between the statutory income tax rate applied to income before income tax provision (benefit) and equity in loss of investees and our effective income tax rate was as follows:
|
Year Ended December 31,
|
||||||||
|
2017
|
2016
|
2015
|
||||||
|
Statutory income tax rate
|
12.5
|
%
|
12.5
|
%
|
12.5
|
%
|
||
|
Impact of U.S. Tax Act
|
(33.7
|
)%
|
—
|
%
|
—
|
%
|
||
|
Foreign income tax rate differential
|
20.3
|
%
|
16.7
|
%
|
19.1
|
%
|
||
|
Financing costs
|
(5.6
|
)%
|
(2.9
|
)%
|
(0.4
|
)%
|
||
|
Change in unrecognized tax benefits
|
2.8
|
%
|
3.3
|
%
|
3.6
|
%
|
||
|
Change in valuation allowance
|
(2.8
|
)%
|
(0.1
|
)%
|
(0.6
|
)%
|
||
|
Non-deductible compensation
|
2.6
|
%
|
1.8
|
%
|
1.9
|
%
|
||
|
Research and other tax credits
|
(2.6
|
)%
|
(2.8
|
)%
|
(3.8
|
)%
|
||
|
Change in estimates
|
(2.1
|
)%
|
—
|
%
|
(1.0
|
)%
|
||
|
Excess tax benefits from share-based compensation
|
(1.5
|
)%
|
(1.5
|
)%
|
—
|
%
|
||
|
Deduction on subsidiary equity
|
(0.7
|
)%
|
(2.4
|
)%
|
(2.7
|
)%
|
||
|
Change in tax rate
|
(0.4
|
)%
|
(1.8
|
)%
|
(4.5
|
)%
|
||
|
Acquisition-related costs
|
—
|
%
|
2.1
|
%
|
—
|
%
|
||
|
Other
|
0.4
|
%
|
0.5
|
%
|
0.3
|
%
|
||
|
Effective income tax rate
|
(10.8
|
)%
|
25.4
|
%
|
24.4
|
%
|
||
Significant components of our net deferred tax assets/(liabilities) were as follows (in thousands):
|
December 31,
|
|||||||
|
2017
|
2016
|
||||||
|
Deferred tax assets:
|
|||||||
|
Net operating loss carryforwards
|
$
|
125,966
|
|
$
|
202,758
|
|
|
|
Tax credit carryforwards
|
130,782
|
|
114,192
|
|
|||
|
Intangible assets
|
23,536
|
|
15,965
|
|
|||
|
Share-based compensation
|
23,128
|
|
27,522
|
|
|||
|
Accruals
|
45,088
|
|
49,187
|
|
|||
|
Other
|
92,968
|
|
56,739
|
|
|||
|
Total deferred tax assets
|
441,468
|
|
466,363
|
|
|||
|
Valuation allowance
|
(52,144
|
)
|
(53,184
|
)
|
|||
|
Net deferred tax assets
|
389,324
|
|
413,179
|
|
|||
|
Deferred tax liabilities:
|
|||||||
|
Acquired intangible assets
|
(655,347
|
)
|
(910,460
|
)
|
|||
|
Other
|
(82,890
|
)
|
(44,392
|
)
|
|||
|
Total deferred tax liabilities
|
(738,237
|
)
|
(954,852
|
)
|
|||
|
Net deferred tax liabilities
|
$
|
(348,913
|
)
|
$
|
(541,673
|
)
|
|
The net change in valuation allowance was a decrease of
$1.0 million
in
2017
and an increase of
$19.2 million
and
$4.3 million
in
2016
and
2015
, respectively.
The following table presents the breakdown between deferred tax assets and liabilities (in thousands):
|
Year Ended December 31,
|
|||||||
|
2017
|
2016
|
||||||
|
Deferred tax assets
|
$
|
34,559
|
|
$
|
15,060
|
|
|
|
Deferred tax liabilities
|
(383,472
|
)
|
(556,733
|
)
|
|||
|
Net deferred tax liabilities
|
$
|
(348,913
|
)
|
$
|
(541,673
|
)
|
|
F-42
As of
December 31, 2017
, we had NOL carryforwards and tax credit carryforwards for U.S. federal income tax purposes of approximately
$388.8 million
and
$117.6 million
, respectively, available to reduce future income subject to income taxes. The NOL carryforwards are inclusive of
$93.4 million
from the EUSA Acquisition in 2012 and
$213.6 million
from the Celator Acquisition in 2016. The federal NOL carryforwards will expire, if not utilized, in the tax years
2018
to
2035
, and the federal tax credits will expire, if not utilized, in the tax years
2018
to
2037
, with the exception of alternative minimum tax credits, which have no expiration date. In addition, we had approximately
$124.4 million
of NOL carryforwards and
$10.5 million
of tax credit carryforwards as of
December 31, 2017
available to reduce future taxable income for state income tax purposes. The state NOL carryforwards will expire, if not utilized, in the tax years
2018
to
2034
. In addition, as of
December 31, 2017
, there were NOL carryforwards for income tax purposes of approximately
$84.0 million
and
$59.0 million
available to reduce future income subject to income taxes in Luxembourg and the United Kingdom, respectively. The NOLs generated in Luxembourg and the United Kingdom have no expiration period. We also had excess foreign tax credits, as of
December 31, 2017
, of
$4.6 million
, which may only be utilized against certain sources of income. The excess foreign tax credits have no expiration period.
Utilization of certain of our NOL and tax credit carryforwards in the U.S. is subject to an annual limitation due to the ownership change limitations provided by Sections 382 and 383 of the Internal Revenue Code and similar state provisions. Such an annual limitation may result in the expiration of certain NOLs and tax credits before future utilization. We currently estimate that we have an annual limitation on the utilization of certain acquired federal NOLs and credits of
$410.6 million
, before tax effect, for 2018,
$30.7 million
, before tax effect, for 2019 and a combined total of
$311.0 million
, before tax effect, for 2020 to 2032. In addition, as a result of the Azur Merger, until 2022 we are subject to certain limitations under the Internal Revenue Code in relation to the utilization of U.S. NOLs to offset U.S. taxable income resulting from certain transactions.
Valuation allowances require an assessment of both positive and negative evidence when determining whether it is more likely than not that deferred tax assets are recoverable. Such assessment is required on a jurisdiction-by-jurisdiction basis. Our valuation allowance was
$52.1 million
and
$53.2 million
as of
December 31, 2017
and
2016
, respectively, for certain Irish, U.S. (federal and state) and foreign deferred tax assets which we maintain until sufficient positive evidence exists to support reversal. During 2017, as part of the overall change in valuation allowance, we recognized a net income tax benefit of
$6.6 million
relating to the net release of a valuation allowance against certain deferred tax assets primarily associated with NOLs, partially offset by the creation of a provisional valuation allowance of
$5.9 million
against certain deferred tax assets primarily associated with excess foreign tax credits generated during the year as a result of the U.S. Tax Act. The
$6.6 million
net income tax benefit includes a benefit of
$9.1 million
relating to the utilization of NOL carryforwards against which a valuation allowance was carried. During 2016, as part of the overall change in valuation allowance, we recognized a net income tax expense of
$17.9 million
relating to the creation of a valuation allowance against certain deferred tax assets primarily associated with NOLs recognized during the year, partially offset by a release of a valuation allowance due to the impact of the reduction of tax rates in certain jurisdictions and utilization of certain deferred tax assets primarily associated with NOLs. During 2015, as part of the overall change in valuation allowance, we recognized a net income tax expense of
$2.4 million
relating to the creation of a valuation allowance against certain deferred tax assets primarily associated with NOLs arising during the year, partially offset by a release of a valuation allowance due to the impact of the reduction of tax rates in certain jurisdictions on certain deferred tax assets primarily associated with NOLs. We periodically evaluate the likelihood of the realization of deferred tax assets and will adjust such amounts in light of changing facts and circumstances including, but not limited to, future projections of taxable income, tax legislation, rulings by relevant tax authorities, the progress of tax audits and the regulatory approval of products currently under development. Realization of substantially all the deferred tax assets is dependent on future book income.
Temporary differences related to foreign subsidiaries that are considered indefinitely reinvested totaled approximately
$1.7 billion
and
$1.2 billion
as of
December 31, 2017
and
2016
, respectively. In the event of the distribution of those earnings in the form of dividends, a sale of the subsidiaries, or certain other transactions, we may be liable for income taxes, subject to an adjustment, if any, for foreign tax credits and foreign withholding taxes payable to certain foreign tax authorities. As of
December 31, 2017
, it was not practicable to determine the amount of the unrecognized deferred tax liability related to these earnings.
We are required to recognize the financial statement effects of a tax position when it is more likely than not, based on the technical merits, that the position will be sustained upon examination. As a result, we have recorded an unrecognized tax benefit for certain tax benefits which we judge may not be sustained upon examination.
F-43
A reconciliation of our gross unrecognized tax benefits follows (in thousands):
|
|
December 31,
|
||||||||||
|
|
2017
|
2016
|
2015
|
||||||||
|
Balance at the beginning of the year
|
$
|
90,910
|
|
$
|
66,385
|
|
$
|
40,802
|
|
||
|
Increases related to current year tax positions
|
27,875
|
|
26,873
|
|
23,664
|
|
|||||
|
Increases related to prior year tax positions
|
1,620
|
|
1,191
|
|
2,833
|
|
|||||
|
Decreases related to prior year tax positions
|
(1,075
|
)
|
(255
|
)
|
(646
|
)
|
|||||
|
Lapse of the applicable statute of limitations
|
(13,168
|
)
|
(3,284
|
)
|
(268
|
)
|
|||||
|
Balance at the end of the year
|
$
|
106,162
|
|
$
|
90,910
|
|
$
|
66,385
|
|
||
The unrecognized tax benefits were included in other non-current liabilities and deferred tax assets, net, in our consolidated balance sheets. Interest related to our unrecognized tax benefits is recorded in the income tax provision in our consolidated statements of income. As of
December 31, 2017
and
2016
, our accrued interest and penalties related to unrecognized tax benefits were not significant. Included in the balance of unrecognized tax benefits were potential benefits of
$73.5 million
and
$61.0 million
at
December 31, 2017
and
2016
, respectively, that, if recognized, would affect the effective tax rate on income.
We file income tax returns in multiple tax jurisdictions, the most significant of which are Ireland, the U.S. (both at the federal level and in various state jurisdictions), Italy and France. These jurisdictions have statute of limitations ranging from three to five years. However, in the U.S. (at the federal level and in most states), carryforward tax attributes that were generated in 2013 and earlier may still be adjusted upon examination by the tax authorities. Certain of our subsidiaries are currently under examination by the French tax authorities for the years ended December 31, 2012 and 2013. These examinations may lead to ordinary course adjustments or proposed adjustments to our taxes. In December 2015, we received proposed tax assessment notices from the French tax authorities for 2012 and 2013 relating to certain transfer pricing adjustments. The notices propose additional French tax of approximately
$45.9 million
, including interest and penalties through the date of the assessment, translated at the foreign exchange rate at
December 31, 2017
. We disagree with the proposed assessment and are contesting it vigorously.
21. Quarterly Financial Data (Unaudited)
The following interim financial information presents our
2017
and
2016
results of operations on a quarterly basis (in thousands, except per share amounts):
|
|
2017
|
||||||||||||||
|
|
March 31
|
June 30
|
September 30
|
December 31
|
|||||||||||
|
Revenues
|
$
|
376,053
|
|
$
|
394,386
|
|
$
|
411,855
|
|
$
|
436,399
|
|
|||
|
Gross margin (1)
|
348,613
|
|
360,983
|
|
376,768
|
|
404,847
|
|
|||||||
|
Net income
|
86,511
|
|
105,604
|
|
63,526
|
|
232,207
|
|
|||||||
|
Net income per ordinary share, basic
|
1.44
|
|
1.76
|
|
1.06
|
|
3.87
|
|
|||||||
|
Net income per ordinary share, diluted
|
1.41
|
|
1.72
|
|
1.03
|
|
3.79
|
|
|||||||
|
2016
|
|||||||||||||||
|
|
March 31
|
June 30
|
September 30
|
December 31
|
|||||||||||
|
Revenues
|
$
|
336,010
|
|
$
|
381,161
|
|
$
|
374,181
|
|
$
|
396,621
|
|
|||
|
Gross margin (1)
|
310,477
|
|
355,130
|
|
347,310
|
|
358,958
|
|
|||||||
|
Net income
|
75,812
|
|
114,502
|
|
89,828
|
|
116,689
|
|
|||||||
|
Net income per ordinary share, basic
|
1.24
|
|
1.89
|
|
1.49
|
|
1.95
|
|
|||||||
|
Net income per ordinary share, diluted
|
1.21
|
|
1.85
|
|
1.45
|
|
1.91
|
|
|||||||
__________________________
|
(1)
|
Gross margin is computed by subtracting cost of product sales (excluding amortization and impairment of intangible assets) from product sales, net.
|
F-44
The interim financial information above includes the following items:
|
•
|
Upfront and milestone payments of
$75.0 million
and
$26.5 million
in the third and fourth quarters of 2017, respectively, and
$8.8 million
and
$15.0 million
in the first and third quarters of 2016, respectively;
|
|
•
|
Expenses related to certain legal proceedings and restructuring of
$6.0 million
in the first quarter of 2017 and
$6.1 million
in the first quarter of 2016;
|
|
•
|
Transaction and integration related costs of
$2.2 million
,
$10.8 million
and
$0.7 million
in the second, third and fourth quarters of 2016, respectively;
|
|
•
|
A loss on extinguishment and modification of debt of
$0.6 million
in the third quarter of 2016;
|
|
•
|
A one-time charge of
$11.6 million
in respect of a contract termination in the fourth quarter of 2016; and
|
|
•
|
A net benefit of
$148.8 million
in respect of the impact of the U.S. Tax Act in the fourth quarter of 2017.
|
F-45
Schedule II
Valuation and Qualifying Accounts
(In thousands)
|
Balance at
beginning
of period
|
Additions
charged to
costs and
expenses
|
Other Additions
|
Deductions
|
Balance at
end of
period
|
|||||||||||||||||
|
For the year ended December 31, 2017
|
|||||||||||||||||||||
|
Allowance for doubtful accounts
|
(1)
|
$
|
287
|
|
$
|
231
|
|
$
|
—
|
|
$
|
(122
|
)
|
$
|
396
|
|
|||||
|
Allowance for sales discounts
|
(1)
|
118
|
|
1,087
|
|
—
|
|
(1,102
|
)
|
103
|
|
||||||||||
|
Allowance for chargebacks
|
(1)
|
4,749
|
|
41,941
|
|
—
|
|
(43,027
|
)
|
3,663
|
|
||||||||||
|
Deferred tax asset valuation allowance
|
(2)(3)(4)
|
53,184
|
|
7,509
|
|
5,581
|
|
(14,130
|
)
|
52,144
|
|
||||||||||
|
For the year ended December 31, 2016
|
|||||||||||||||||||||
|
Allowance for doubtful accounts
|
(1)
|
$
|
489
|
|
$
|
168
|
|
$
|
—
|
|
$
|
(370
|
)
|
$
|
287
|
|
|||||
|
Allowance for sales discounts
|
(1)
|
181
|
|
1,334
|
|
—
|
|
(1,397
|
)
|
118
|
|
||||||||||
|
Allowance for chargebacks
|
(1)
|
3,023
|
|
41,991
|
|
—
|
|
(40,265
|
)
|
4,749
|
|
||||||||||
|
Deferred tax asset valuation allowance
|
(2)(3)(4)
|
33,949
|
|
19,328
|
|
5,544
|
|
(5,637
|
)
|
53,184
|
|
||||||||||
|
For the year ended December 31, 2015
|
|||||||||||||||||||||
|
Allowance for doubtful accounts
|
(1)
|
$
|
530
|
|
$
|
—
|
|
$
|
—
|
|
$
|
(41
|
)
|
$
|
489
|
|
|||||
|
Allowance for sales discounts
|
(1)
|
238
|
|
2,900
|
|
—
|
|
(2,957
|
)
|
181
|
|
||||||||||
|
Allowance for chargebacks
|
(1)
|
2,715
|
|
39,079
|
|
—
|
|
(38,771
|
)
|
3,023
|
|
||||||||||
|
Deferred tax asset valuation allowance
|
(2)(3)(4)
|
29,697
|
|
5,044
|
|
1,888
|
|
(2,680
|
)
|
33,949
|
|
||||||||||
__________________________
|
(1)
|
Shown as a reduction of accounts receivable. Charges related to sales discounts and chargebacks are reflected as a reduction of revenue.
|
|
(2)
|
Additions to the deferred tax asset valuation allowance relate to movements on certain Irish, U.S. (federal and state) and other foreign deferred tax assets where we continue to maintain a valuation allowance until sufficient positive evidence exists to support reversal.
|
|
(3)
|
Deductions to the deferred tax asset valuation allowance include movements relating to utilization of NOLs and tax credit carryforwards, release in valuation allowance and other movements including adjustments following finalization of tax returns.
|
|
(4)
|
Other additions to the deferred tax asset valuation allowance relate to currency translation adjustments recorded directly in other comprehensive income and a valuation allowance recognized in 2016 on purchase accounting.
|
F-46
TABLE OF CONTENTS
Part IItem 1. BusinessItem 1A. Risk FactorsItem 1B. Unresolved Staff CommentsItem 2. PropertiesItem 3. Legal ProceedingsItem 4. Mine Safety DisclosuresPart IIItem 5. Market For Registrant S Common Equity, Related Stockholder Matters and Issuer Purchases Of Equity SecuritiesItem 6. Selected Financial DataItem 7. Management S Discussion and Analysis Of Financial Condition and Results Of OperationsItem 7A. Quantitative and Qualitative Disclosures About Market RiskItem 8. Financial Statements and Supplementary DataItem 9. Changes in and Disagreements with Accountants on Accounting and Financial DisclosureItem 9A. Controls and ProceduresItem 9B. Other InformationPart IIIItem 10. Directors, Executive Officers and Corporate GovernanceItem 11. Executive CompensationItem 12. Security Ownership Of Certain Beneficial Owners and Management and Related Stockholder MattersItem 13. Certain Relationships and Related Transactions, and Director IndependenceItem 14. Principal Accountant Fees and ServicesPart IVItem 15. Exhibits and Financial Statement SchedulesItem 16. Form 10-k SummaryNote 11 For Further Information Regarding The 2015 Credit Agreement and The Amended Credit Agreement. We Used The Proceeds Of