JETBLUE AIRWAYS CORP
10-Ks and 10-Qs
|
|
|
|
|
|
|
|
|
|
|
|
|
|
|
|
|
|
|
|
|
|
|
|
|
|
|
|
|
|
|
|
|
|
|
|
|
|
|
|
|
|
|
|
|
|
|
|
|
|
|
|
|
|
|
|
UNITED STATES
SECURITIES AND EXCHANGE COMMISSION
Washington, D.C. 20549
FORM 10-K
|
ý
|
ANNUAL REPORT PURSUANT TO SECTION 13 OR 15(d) OF THE SECURITIES EXCHANGE ACT OF 1934
|
For the fiscal year ended
December 31, 2017
|
o
|
TRANSITION REPORT PURSUANT TO SECTION 13 OR 15(d) OF THE SECURITIES EXCHANGE ACT OF 1934
|
For the transition period from
to
.
Commission file number 000-49728
JETBLUE AIRWAYS CORPORATION
(Exact name of registrant as specified in its charter)
|
Delaware
(State or other jurisdiction of incorporation or organization)
|
87-0617894
(I.R.S. Employer Identification No.)
|
27-01 Queens Plaza North, Long Island City, New York 11101
(Address, including zip code, of registrant's principal executive offices)
(718) 286-7900
Registrant's telephone number, including area code:
Securities registered pursuant to Section 12(b) of the Act:
|
Title of each class
|
Name of each exchange on which registered
|
|
|
Common Stock, $0.01 par value
|
The NASDAQ Global Select Market
|
|
Indicate by check mark if the registrant is a well-known seasoned issuer, as defined in Rule 405 of the Securities Act. Yes
ý
No
o
Indicate by check mark if the registrant is not required to file reports pursuant to Section 13 or Section 15(d) of the Act. Yes
o
No
ý
Indicate by check mark whether the registrant (1) has filed all reports required to be filed by Section 13 or 15(d) of the Securities Exchange Act of 1934 during the preceding 12 months (or for such shorter period that the registrant was required to file such reports), and (2) has been subject to such filing requirements for the past 90 days. Yes
ý
No
o
Indicate by checkmark whether the registrant has submitted electronically and posted on its corporate Website, if any, every Interactive Data File required to be submitted and posted pursuant to Rule 405 of Regulation S-T (§232.405 of this chapter) during the preceding 12 months (or for such shorter period that the registrant was required to submit and post such files). Yes
ý
No
o
Indicate by check mark if disclosure of delinquent filers pursuant to Item 405 of Regulation S-K (§229.405 of this chapter) is not contained herein, and will not be contained, to the best of registrant's knowledge, in definitive proxy or information statements incorporated by reference in Part III of this Form 10-K or any amendment to this Form 10-K.
o
Indicate by check mark whether the registrant is a large accelerated filer, an accelerated filer, a non-accelerated filer, a smaller reporting company, or emerging growth company. See the definitions of ''large accelerated filer,” “accelerated filer'', “smaller reporting company,” and "emerging growth company" in Rule 12b-2 of the Exchange Act.
|
Large accelerated filer
þ
|
Accelerated filer
o
|
|
|
Non-accelerated filer
o
(Do not check if a smaller reporting company)
|
||
|
Smaller reporting company
o
|
Emerging growth company
o
|
|
If an emerging growth company, indicate by check mark if the registrant has elected not to use the extended transition period for complying with any new or revised financial accounting standards provided pursuant to Section 13(a) of the Exchange Act.
o
Indicate by check mark whether the registrant is a shell company (as defined in Rule 12b-2 of the Exchange Act). Yes
o
No
ý
The aggregate market value of the registrant's common stock held by non-affiliates of the registrant as of
June 30, 2017
was approximately
$7.5 billion
(based on the last reported sale price on the NASDAQ Global Select Market on that date). The number of shares outstanding of the registrant's common stock as of
January 31, 2018
was
321,859,269
shares.
DOCUMENTS INCORPORATED BY REFERENCE
Designated portions of the Registrant's Proxy Statement for its
2018
Annual Meeting of Stockholders, which is to be filed subsequent to the date hereof, are incorporated by reference into Part III of this Annual Report on Form 10-K, or the Report, to the extent described therein.
|
Table of Contents
|
||
|
PART I.
|
||
|
Item 1.
|
||
|
Item 1A.
|
||
|
Item 1B.
|
||
|
Item 2.
|
||
|
Item 3.
|
||
|
Item 4.
|
||
|
PART II.
|
||
|
Item 5.
|
||
|
Item 6.
|
||
|
Item 7.
|
||
|
Item 7A.
|
||
|
Item 8.
|
||
|
Item 9.
|
||
|
Item 9A.
|
||
|
Item 9B.
|
||
|
PART III.
|
||
|
Item 10.
|
||
|
Item 11.
|
||
|
Item 12.
|
||
|
Item 13.
|
||
|
Item 14.
|
||
|
PART IV.
|
||
|
Item 15.
|
||
|
Item 16.
|
||
1
FORWARD-LOOKING INFORMATION
Statements in this Report (or otherwise made by JetBlue or on JetBlue’s behalf) contain various forward-looking statements within the meaning of Section 27A of the Securities Act of 1933, as amended, or the Securities Act, and Section 21E of the Securities Exchange Act of 1934, as amended, or the Exchange Act, which represent our management’s beliefs and assumptions concerning future events. When used in this document and in documents incorporated herein by reference, the words “expects,” “plans,” “anticipates,” “indicates,” “believes,” “forecast,” “guidance,” “outlook,” “may,” “will,” “should,” “seeks,” “targets” and similar expressions are intended to identify forward-looking statements. Forward-looking statements involve risks, uncertainties and assumptions, and are based on information currently available to us. Actual results may differ materially from those expressed in the forward-looking statements due to many factors, including, without limitation, our extremely competitive industry; volatility in financial and credit markets which could affect our ability to obtain debt and/or lease financing or to raise funds through debt or equity issuances; our significant fixed obligations and substantial indebtedness; volatility in fuel prices, maintenance costs and interest rates; our reliance on high daily aircraft utilization; our ability to implement our growth strategy; our ability to attract and retain qualified personnel and maintain our culture as we grow; our reliance on a limited number of suppliers; our dependence on the New York and Boston metropolitan markets and the effect of increased congestion in these markets; our reliance on automated systems and technology; our being subject to potential unionization, work stoppages, slowdowns or increased labor costs; our presence in some international emerging markets that may experience political or economic instability or may subject us to legal risk; reputational and business risk from information security breaches or cyber-attacks; changes in or additional domestic or foreign government regulation; changes in our industry due to other airlines' financial condition; acts of war or terrorism; global economic conditions or an economic downturn leading to a continuing or accelerated decrease in demand for air travel; the spread of infectious diseases; adverse weather conditions or natural disasters; and external geopolitical events and conditions. It is routine for our internal projections and expectations to change as the year or each quarter in the year progresses, and therefore it should be clearly understood that the internal projections, beliefs and assumptions upon which we base our expectations may change prior to the end of each quarter or year.
Given the risks and uncertainties surrounding forward-looking statements, you should not place undue reliance on these statements. You should understand that many important factors, in addition to those discussed or incorporated by reference in this Report, could cause our results to differ materially from those expressed in the forward-looking statements. Potential factors that could affect our results include, in addition to others not described in this Report, those described in Item 1A of this Report under “Risks Related to JetBlue” and “Risks Associated with the Airline Industry.” In light of these risks and uncertainties, the forward-looking events discussed in this Report might not occur. Our forward-looking statements speak only as of the date of this Report. Other than as required by law, we undertake no obligation to update or revise forward-looking statements, whether as a result of new information, future events, or otherwise.
2
OVERVIEW
General
JetBlue Airways Corporation, or JetBlue, is New York's Hometown Airline™. In
2017
, JetBlue carried over
40 million
Customers with an average of
1,000
daily flights and served
101
destinations in the United States, the Caribbean and Latin America.
JetBlue was incorporated in Delaware in August 1998 and commenced service on February 11, 2000. As of the end of
2017
, we were the
sixth
largest passenger carrier in the U.S. based on available seat miles, or ASMs. We believe our differentiated product and culture combined with our competitive cost structure enables us to compete effectively in the high-value geographies we serve. Looking to the future, we plan to continue to grow in our high-value geographies, invest in industry leading products and provide award winning service by our more than
21,000
dedicated employees, whom we refer to as Crewmembers. Going forward we believe we will continue to differentiate ourselves from other airlines enabling us to continue to attract a greater mix of Customers and to drive further profitable growth. We are focused on delivering solid results for our Shareholders, our Customers and our Crewmembers.
As used in this Report, the terms “JetBlue,” the “Company,” “we,” “us,” “our” and similar terms refer to JetBlue Airways Corporation and its subsidiaries, unless the context indicates otherwise. Our principal executive offices are located at 27-01 Queens Plaza North, Long Island City, New York 11101 and our telephone number is (718) 286-7900.
Our Industry and Competition
The U.S. airline industry is extremely competitive, challenging and results are often volatile. It is uniquely susceptible to external factors such as fuel costs, downturns in domestic and international economic conditions, weather-related disruptions, the spread of infectious diseases, the impact of airline restructurings or consolidations, military actions or acts of terrorism. We operate in a capital and energy intensive industry that has high fixed costs as well as heavy taxation and fees. Airline returns are sensitive to slight changes in fuel prices, average fare levels and passenger demand. The industry's principal competitive factors include fares, brand and customer service, route networks, flight schedules, aircraft types, safety records, code-sharing and interline relationships, in-flight entertainment and connectivity systems and frequent flyer programs.
Price competition is intense in our industry. Our ability to operate successfully and grow in this environment depends on, among other things, our ability to operate at costs equal to or lower than our competitors.
Since 2001, the majority of traditional network airlines have undergone significant financial restructuring including bankruptcies, mergers and consolidations. These types of restructurings typically result in a lower cost structure through a reduction of labor costs, restructuring of commitments including debt terms, leases and fleet, modification or termination of pension plans, increased workforce flexibility, and innovative offerings. These actions also have provided the restructured airline significant opportunities for realignment of route networks, alliances and frequent flyer programs. Each factor has had a significant influence on the industry's improved profitability.
2017
OPERATIONAL HIGHLIGHTS
We believe our differentiated product and culture, competitive costs and high-value geography relative to other airlines contributed to our continued success in
2017
. Our
2017
operational highlights include:
•
Product enhancements
- Throughout
2017
we continued to invest in industry-leading products which we believe will continue to differentiate our offerings from the other airlines.
◦
During
2017
, we continued to expand Mint
TM
service, our premium product which includes 16 fully lie-flat seats, four of which are in suites with a privacy door, a first in the U.S. domestic market, by adding flights from John F. Kennedy International Airport, or JFK, to Las Vegas and San Diego, along with Boston to San Diego. We continually enhance our onboard Mint
TM
experience through new offerings to our Mint
TM
Customers such as new products like locally curated artisanal ice creams based in some of our Mint
TM
BlueCities and a new exclusive chocolate bar from Raaka. During 2018, we expect to further expand our Mint
TM
service with flights from JFK and Boston to Seattle.
3
◦
During
2017
, we enhanced our free Fly-Fi™ in-flight internet service, available on our entire fleet, to set our experience apart from other airlines by becoming the first in the U.S. to offer gate-to-gate internet connectivity on every aircraft. Gate-to-gate Fly-Fi™ eliminates the need to wait until reaching cruising altitude to get connected. Instead, Customers can email, surf, stream, tweet and shop from the moment they board until they reach the arrival gate.
•
Fleet
- In conjunction with our intention to expand our Mint™ experience, we amended our purchase agreement with Airbus in April 2017 which changed the timing of certain of our Airbus A321ceo and Airbus A321neo deliveries. Specifically, we deferred eight A321neo deliveries from 2019 to 2023 and five from 2020 to 2024. We also moved up the delivery of three A321ceo Aircraft from 2019 to 2018, while deferring three A321neo deliveries to 2019. We retain flexibility to make further changes in our order book. We have the option to take certain A321neo deliveries with the long range configuration, the A321-LR.
During
2017
, we took delivery of 16 Airbus A321 aircraft, 15 of which were equipped with our Mint™ cabin layout.
During the second half of 2016, we introduced Airbus' new innovative galley and lavatory module on our single cabin layout Airbus A321 with 200 seats. We believe our cabin restyling program across our Airbus fleet will improve Customer experience while freeing up valuable onboard space. As part of our cabin restyling program we expect to increase the seat density on our Airbus A320 fleet. Our reconfigured Airbus A320 aircraft will have new seats, larger TV screens with up to 100 channels of free DIRECTV
®
, and free gate-to-gate Fly-Fi
™
. Our reconfiguring of our Airbus A320 aircraft will result in 162 seats. The industry has experienced design failures with the space efficient lavatory module that we have installed on certain of our A321 aircraft and were planning to install on A320 aircraft. During the fourth quarter of 2017, we made significant progress in addressing certain quality issues with our business partners. As a result, our first Airbus A320 entered modifications for prototyping during the first quarter of 2018, coinciding with a scheduled heavy maintenance check for operational efficiency. We believe this multi-year restyling program will allow us to increase capacity in a capital-efficient and customer-focused way.
We are continuing to evaluate our E190 fleet as part of our fleet-wide review, and are making progress exploring our future fleet options with aircraft and engine manufacturers. Our options range from maintaining our current fleet of E190s to replacing it with alternative aircraft types. The commercial aircraft landscape has recently changed, requiring us to spend more time assessing our options. We examine all fleet and capital decisions through the lens of aiming to achieve superior margins and drive Shareholder value.
•
Network
- We continued to expand and grow in our high-value geography. In 2017, we expanded our network with
one
new BlueCity, bringing our total as of the end of December 2017 to
101
BlueCities, and added several connect-the-dot routes.
We began service in March from Boston to Atlanta, our 101
st
BlueCity. Atlanta became the 63
rd
nonstop destination from Boston. The addition of nonstop Atlanta service, which was the most requested destination by our Boston Customers, is part of our plan to reach 200 daily flights in the coming years. Customers in both cities benefit from convenient, five times daily service between Boston and Atlanta. In December 2017, we moved our LaGuardia operation from the airport's Central Terminal B to our new home at the historic Marine Air Terminal. We’re New York’s Hometown Airline™ and we believe moving into the Marine Air Terminal further exemplifies JetBlue’s leadership in our largest focus city. The move to the Marine Air Terminal will also enhance the Customer experience at LaGuardia by allowing Customers to avoid the congestion and traffic associated with the Central Terminal – a particularly significant benefit for Customers traveling on our popular LaGuardia-Boston route.
In May 2018, we plan to begin three daily roundtrip services from Boston to Minneapolis, making Minneapolis our 102
nd
BlueCity, and the 65
th
nonstop destination from Boston.
•
Customer Service -
JetBlue and our Crewmembers were recognized in 2017 for industry leading customer service.
JetBlue received the top score on the American Customer Satisfaction Index (ACSI) among airlines. Our score of 82 was the highest for any domestic airline. Additionally, Airline Ratings awarded us 7 out of 7 stars for safety, and 5 out of 5 stars for our product offerings.
•
Our Crewmembers -
During
2017
, our Crewmembers recognized JetBlue as one of America's "Best Employers" by Forbes. JetBlue ranked #12 through a survey that asked individuals how likely they would be to recommend their employer to someone else. We are proud that for a sixth year we have achieved a top score of 100 on the Corporate Equality Index, which rates major U.S. companies and their policies and practices related to the LGBT community, earning us the designation of one of the "Best Places to Work for LGBT Equality."
Effective January 1, 2017, profit sharing eligible Crewmembers received an 8% raise and a modified profit sharing plan. We believe this recognition and change to our compensation structure reflects industry trends and ensures that our
4
Crewmember compensation and rewards are fair and competitive. Under the modified profit sharing plan, non-management Crewmembers are eligible to receive profit sharing, calculated as 10% of adjusted pre-tax income before profit sharing and special items, up to a pre-tax margin of 18% with the result reduced by Retirement Plus contributions. If JetBlue's resulting pre-tax margin exceeds 18%, non-management Crewmembers will receive 20% profit sharing on amounts above an 18% pre-tax margin.
We believe the recent U.S. tax reform changes will be positive for our company, and provide JetBlue with the opportunity to pass on the benefit to our Crewmembers, Customers and Shareholders. With tax reform in mind, we announced a $1,000 bonus for every Crewmember employed as of December 31, 2017.
JETBLUE EXPERIENCE
We offer our Customers a distinctive flying experience which we refer to as the "JetBlue Experience." We believe we deliver award winning service that focuses on the entire Customer experience, from booking an itinerary to arrival at the final destination. Typically, our Customers are neither high-traffic business travelers nor ultra-price sensitive travelers. Rather, we believe we are the carrier of choice for the majority of travelers who have been underserved by other airlines as we offer a differentiated product and award winning customer service.
Differentiated Product and Culture
Delivering the JetBlue Experience to our Customers through our differentiated product and culture is core to our mission to inspire humanity. We look to attract new Customers to our brand and provide current Customers with a reason to come back by continuing to innovate and evolve the JetBlue Experience. We believe we can adapt to the changing needs of our Customers and a key element of our success is the belief that competitive fares and quality air travel need not be mutually exclusive.
Our award winning service begins from the moment our Customers purchase a ticket through one of our distribution channels such as
www.jetblue.com
, our mobile applications or our reservations centers. Customers can purchase tickets under our Fare Options pricing model, at one of three branded fares: Blue, Blue Plus, and Blue Flex. Each fare includes different offerings such as free checked bags, reduced change fees, and additional TrueBlue
®
points, with all fares including our core offering of free in-flight entertainment, free brand name snacks and free non-alcoholic beverages. Customers can choose to “buy up” to an option with additional offerings. These different fares allow Customers to select the products or services they need or value when they travel, without having to pay for the things they do not need or value.
Upon arrival at the airport, our Customers are welcomed by our dedicated Crewmembers and can choose to purchase one or more of our ancillary options such as Even More
™
Speed, allowing them to enjoy an expedited security experience in most domestic JetBlue locations. Customers who select our Blue Flex option or purchase a Mint
™
seat receive Even More
™
Speed as part of their fare. We additionally have mobile applications for both Apple and Android devices which have robust features including real-time flight information updates and mobile check-in for certain routes. Our applications are designed to enhance our Customers' travel experience and are in keeping with the JetBlue Experience.
Our self-service initiative in select BlueCities redesigned the physical layout of the airport lobby and the way our Customers travel through it. Our new user-friendly kiosks are the first point of contact for each Customer traveling through the airport lobby. While all Customers are encouraged to use the kiosks, our new lobby layout allows them to choose the check-in experience they prefer. Customers who choose to use our kiosk receive a virtually queue-less experience. For Customers who prefer a more traditional experience, our Help Desk offers full-service check-in. The self-service model allows Crewmembers to get out from behind the ticket counter and move through the lobby to guide our Customers through the check-in process. The self-service lobby opens up the opportunity for our Crewmembers to make personal connections with our Customers, to assist with bag tagging, to answer Customer questions and direct them to their next step in the travel ribbon.
Once onboard our aircraft, Customers enjoy seats in a comfortable layout with the most legroom in the main cabin of all U.S. airlines, based on average fleet-wide seat pitch. Our Even More
™
Space seats are available for purchase across our fleet, giving Customers the opportunity to enjoy additional legroom. Customers on certain transcontinental or Caribbean flights have the option to purchase our premium service, Mint
™
, which has 16 fully lie-flat seats, including four suites with privacy doors.
5
Our in-flight entertainment system onboard our Airbus A320 and Embraer E190 aircraft includes 36 channels of free DIRECTV
®
, 100 channels of free SiriusXM
®
satellite radio and premium movie channel offerings from JetBlue Features
®
. Customers on our Airbus A321 aircraft have access to 100 channels of DIRECTV
®
, 100+ channels of SiriusXM
®
radio and premium movie channel offerings from JetBlue Features
®
. Our Mint
™
Customers enjoy 15-inch flat screen televisions to experience our in-flight entertainment offerings. Our entire fleet is equipped with Fly-Fi
™
, a broadband product, with connectivity that we believe is significantly faster than airlines featuring K
U
-band satellites and older ground to air technology. Customers also have access to the Fly-Fi
™
Hub, a content portal where Customers can access a wide range of movies, television shows and additional content from their own personal devices. In 2017, we became the first in the U.S. to offer gate-to-gate internet connectivity on every aircraft. Gate-to-gate Fly-Fi
™
eliminates the need to wait until reaching cruising altitude to get connected. Instead, Customers can email, surf, stream, tweet and shop from the moment they board until they reach the arrival gate.
All Customers may enjoy an assortment of free and unlimited brand name snacks and non-alcoholic beverages and have the option to purchase additional products such as blankets, pillows, headphones, premium beverages and premium food selections. Our Mint
™
Customers have access to an assortment of complimentary food, beverages and products including a small-plates menu, artisanal snacks, alcoholic beverages, a blanket, pillows and headphones.
Our Airbus A321 aircraft in a single cabin layout have 200 seats and those with our Mint
™
offering have 159 seats. Our Airbus A320 aircraft have 150 seats while our Embraer E190 aircraft have 100 seats. As part of our cabin restyling program we expect to increase the seat density on our Airbus A320 fleet. Our reconfiguring of our Airbus A320 aircraft will result in 162 seats. Regarding our cabin restyling program, the industry has experienced design failures with the space efficient lavatories that we have installed on certain of our A321s, and are planning to install on the A320s. During the fourth quarter of 2017, we made significant progress in addressing certain quality issues with our business partners. As a result, our first Airbus A320 entered modifications for prototyping during the first quarter of 2018, coinciding with a scheduled heavy maintenance check for operational efficiency. We believe this multi-year restyling program will allow us to increase capacity in a capital-efficient and customer-focused way.
Because of our network strength in leisure destinations, we also sell vacation packages through JetBlue
®
Vacations, a one-stop, value-priced vacation service for self-directed packaged travel planning. These packages offer competitive fares for air travel on JetBlue along with a selection of JetBlue-recommended hotels and resorts, car rentals and local attractions. In 2018, we created a standalone wholly-owned subsidiary, JetBlue Travel Products, LLC that will absorb the JetBlue
®
Vacations business.
We work to provide a superior air travel experience, including communicating openly and honestly with Customers about delays and service disruptions. We are the only major U.S. airline to have a Customer Bill of Rights. This program was introduced in 2007 to provide compensation to Customers who experience inconveniences. This Customer Bill of Rights commits us to high service standards and holds us accountable if we fall short.
In
2017
, we completed
97.3%
of our scheduled flights. Unlike most other airlines, we have a policy of not overbooking flights.
Our Customers have repeatedly indicated the distinctive JetBlue Experience is an important reason why they select us over other carriers. We measure and monitor customer feedback regularly which helps us to continuously improve customer satisfaction. One way we do so is by measuring our net promoter score, or NPS. This metric is used by companies in a broad range of industries to measure and monitor the customer experience. Many of the leading consumer brands that are recognized for great customer service receive high NPS scores. We believe a higher NPS score has positive effects on customer loyalty and ultimately leads to increased revenue.
Network/ High-Value Geography
We are a predominately point-to-point system carrier, with the majority of our routes touching at least one of our six Focus Cities: New York, Boston, Fort Lauderdale-Hollywood, Orlando, Long Beach and San Juan, Puerto Rico. During
2017
, over
92%
of our Customers flew on nonstop itineraries.
Leisure traveler focused airlines are often faced with high seasonality. As a result, we continually work to manage our mix of Customers to include both business travelers and travelers visiting friends and relatives, or VFR. VFR travelers tend to be slightly less seasonal and less susceptible to economic downturns than traditional leisure destination travelers. Understanding the purpose of our Customers' travel helps us optimize destinations, strengthen our network and increase unit revenues. All six of our Focus Cities are in regions with a diverse mix of traffic and were profitable in
2017
.
As of
December 31, 2017
, our network served
101
BlueCities in
30
states, the District of Columbia, the Commonwealth of Puerto Rico, the U.S. Virgin Islands, and
21
countries in the Caribbean and Latin America.
6
We also made changes across our network by announcing new routes between existing BlueCities. We group our capacity distribution based upon geographical regions rather than on a mileage or a length-of-haul basis. The historic distribution of ASMs, or capacity, by region for the years ending
December 31
was:
|
Capacity Distribution
|
2017
|
2016
|
2015
|
||||||
|
Florida
|
30.1
|
%
|
29.1
|
%
|
29.2
|
%
|
|||
|
Transcontinental
|
28.6
|
|
28.8
|
|
28.5
|
|
|||
|
Caribbean & Latin America
(1)
|
28.3
|
|
30.1
|
|
30.2
|
|
|||
|
East
|
6.4
|
|
5.4
|
|
5.7
|
|
|||
|
Central
|
3.8
|
|
4.1
|
|
3.8
|
|
|||
|
West
|
2.8
|
|
2.5
|
|
2.6
|
|
|||
|
Total
|
100.0
|
%
|
100.0
|
%
|
100.0
|
%
|
|||
(1) Domestic operations as defined by the U.S. Department of Transport, or DOT, include Puerto Rico and the U.S. Virgin Islands, but for the purposes of the capacity distribution table above we have included these locations in the Caribbean and Latin America region.
During the past decade we invested in our network, which had been dominated by the New York metropolitan area with over half of our ASMs. Our network growth over the past few years has been focused on the business traveler in Boston as well as travelers to the Caribbean and Latin America region. We expect to focus on increasing our presence in Fort Lauderdale-Hollywood where we believe there is an opportunity to increase our operations to destinations throughout the Caribbean and Latin America. Our plan is supported by significant investment from the Broward County Aviation Department in the airport and surrounding facilities. We believe our increased focus on Boston and Fort Lauderdale-Hollywood makes our ASMs more balanced and the overall network is stronger.
In 2018, we anticipate further expanding our network and have previously announced service to the following new destination:
|
Destination
|
|
Service Scheduled to Commence
|
|
Minneapolis, MN
|
May 3, 2018
|
|
Airline Commercial Partnerships
Airlines frequently participate in commercial partnerships with other carriers in order to increase Customer convenience by providing interline-connectivity, code-sharing, coordinated flight schedules, frequent flyer program reciprocity and other joint marketing activities. As of
December 31, 2017
, we had
48
airline commercial partnerships. Our commercial partnerships typically begin as an interline agreement allowing a Customer to book one itinerary with tickets on multiple airlines. During
2017
, we entered into one new code-sharing agreement. Code-sharing is a practice by which one airline places its name and flight number on flights operated by another airline. In 2018, we expect to continue to seek additional strategic opportunities through new commercial partners as well as assess ways to deepen existing airline partnerships. We plan to do this by expanding code-share relationships and other areas of cooperation such as frequent flyer programs. We believe these commercial partnerships allow us to better leverage our strong network and drive incremental traffic and revenue while improving off-peak travel.
Marketing
JetBlue is a widely recognized and respected global brand. JetBlue created a new category in air travel and our brand stands for high service quality at a reasonable cost.
We believe this brand has evolved into an important and valuable asset which identifies us as a safe, reliable, high value airline. Similarly, we believe customer awareness of our brand has contributed to the success of our marketing efforts. It enables us to promote ourselves as a preferred marketing partner with companies across many different industries.
We market our services through advertising and promotions in various media forms including popular social media outlets. We engage in large multi-market programs, local events and sponsorships across our route network as well as mobile marketing programs. Our targeted public and community relations efforts reflect our commitment to the communities we serve, as well as promoting brand awareness and complementing our strong reputation.
Distribution
Our primary and preferred distribution channel to Customers is through our website,
www.jetblue.com
, our lowest cost channel. Our website allows us to more closely control and deliver the JetBlue Experience while also offering the full suite of
7
JetBlue Fare Options, EvenMore™ Space and Speed, and other ancillary services. In the first half of 2015, we introduced a new merchandising platform for
www.jetblue.com
with our business partner Datalex, in addition to merchandising capabilities on our kiosks and in our self-service channels with our business partner IBM.
Our participation in global distribution systems, or GDS, supports our profitable growth, particularly in the business market. We find business Customers are more likely to book through a travel agency or a booking product which relies on a GDS platform. Although the cost of sales through this channel is higher than through our website, the average fare purchased through GDS is generally higher and often covers the increased distribution costs. We currently participate in several major GDS and online travel agents, or OTA. Due to the majority of our Customers booking travel on our website, we maintain relatively low distribution costs despite our increased participation in GDS and OTA in recent years.
Customer Loyalty Program
TrueBlue
®
is our customer loyalty program designed to reward and recognize loyal Customers. Members earn points based upon the amount paid for JetBlue flights and services from certain commercial partners. Our points do not expire, the program has no black-out dates or seat restrictions, and any JetBlue destination can be booked if the TrueBlue
®
member has enough points to exchange for the value of an open seat. Mosaic
®
is an additional level for our most loyal Customers who either (1) fly a minimum of 30 times with JetBlue and acquire at least 12,000 base flight points within a calendar year or (2) accumulate 15,000 base flight points within a calendar year. Over
2 million
TrueBlue
®
one-way redemption awards were flown during
2017
, representing approximately
5%
of our total revenue passenger miles.
We currently have co-branded loyalty credit cards available to eligible U.S. residents, as well as co-brand agreements in Puerto Rico and the Dominican Republic to allow cardholders to earn TrueBlue
®
points. Our current co-branded credit card partnership with Barclaycard
®
on the MasterCard
®
network exceeded expectations for conversion rates and has exceeded our expectations for new member enrollments.
We also have co-branded loyalty credit cards issued by Banco Santander Puerto Rico and MasterCard
®
in Puerto Rico as well as Banco Popular Dominicano and MasterCard
®
in the Dominican Republic. These credit cards allow Customers in Puerto Rico and the Dominican Republic to take full advantage of our TrueBlue
®
loyalty program.
We have a separate agreement with American Express
®
that allows any American Express
®
cardholder to convert Membership Rewards
®
points into TrueBlue
®
points. In 2016, we added a partnership agreement with Citibank
®
to convert Citi ThankYou® Rewards points into TrueBlue
®
points. We have various agreements with other loyalty partners, including hotels and car rental companies, that allow their Customers to earn TrueBlue
®
points through participation in our partners’ programs. Customers can link their TrueBlue account with Lyft, to take advantage of unique discounts, travel perks, and earn TrueBlue loyalty points on any Lyft ride to and from any airport nationwide. We intend to continue to develop the footprint of our co-branded credit cards and pursue other loyalty partnerships in the future.
OPERATIONS AND COST STRUCTURE
Historically, our cost structure has allowed us to price fares lower than many of our competitors and is a principal reason for our profitable growth. Our current cost advantage relative to some of our competitors is due to, among other factors, high aircraft utilization, new and efficient aircraft, relatively low distribution costs, and a productive workforce. Because our network initiatives and growth plans require a low cost platform, we strive to stay focused on our competitive costs, operational excellence, efficiency improvements and enhancing critical elements of the JetBlue Experience.
During 2016 we introduced an initiative to reduce our structural cost with the goal of saving $250 to $300 million by 2020. The program aims to cover all cost categories including our technical operations, corporate services, airports and our distribution network. Through a combination of strategic sourcing, planning, automation and a review of our distribution channel strategy we anticipate delivering structural cost savings which will continue to allow us to deliver the JetBlue Experience to our Customers while maintaining a competitive cost structure. In 2017, we made significant progress in the initial stages of achieving this target and have already secured approximately $90 million of the goal. In order to minimize distribution costs, we have been proactively reducing the number of online travel agencies that sell our tickets. This is the first phase of a broader strategy to drive our most price-sensitive Customers towards direct distribution, our lowest cost and best merchandise channel.
Route Structure
Our point-to-point system is the foundation of our operational structure, with the majority of our routes touching at least one of our six focus cities. This structure allows us to optimize costs as well as accommodate Customers' preference for nonstop itineraries. A vast majority of our operations are centered in and around the heavily populated northeast corridor of the U.S., which includes the New York and Boston metropolitan areas. This airspace is some of the world's most congested and drives certain operational constraints.
8
Our peak levels of traffic over the course of the year vary by route; the East Coast to Florida/Caribbean routes peak from October through April and the West Coast routes peak in the summer months. Many of our areas of operations in the Northeast experience poor winter weather conditions, resulting in increased costs associated with de-icing aircraft, canceled flights and accommodating displaced Customers. Many of our Florida and Caribbean routes experience bad weather conditions in the summer and fall due to thunderstorms and hurricanes. As we enter new markets we could be subject to additional seasonal variations along with competitive responses by other airlines.
•
New York metropolitan area -
We are New York's Hometown Airline
TM
. The majority of our flights originate in the New York metropolitan area, the nation's largest travel market. JFK is New York's largest airport, and we are the second largest airline at JFK as measured by domestic seats. Our 2017 operations accounted for more than 37% of seats offered on domestic routes from JFK. As JFK is a slot controlled airport we have been able to continue to grow our operations by adding more seats per departure with the delivery of the Airbus A321 aircraft, as well as continuing to optimize routes based upon load factor and costs. We operate from Terminal 5, or T5, which includes an international arrivals facility within our current T5 footprint. We believe T5 enables us to increase operational efficiencies, provide savings, streamline our operations and improve the overall travel experience for our Customers arriving from international destinations. We also serve New Jersey's Newark Liberty International Airport, or Newark, New York City's LaGuardia Airport, or LaGuardia, Newburgh, New York's Stewart International Airport and White Plains, New York's Westchester County Airport. We are the leading carrier in the average number of flights flown per day between the New York metropolitan area and Florida. In December, we moved our operation at LaGuardia from the Central Terminal to the historic Marine Air Terminal, also known as Terminal A bringing our Customers greater convenience and an improved ground experience while the Central Terminal undergoes reconstruction. We also added year-round Mint™ service from New York to Las Vegas and San Diego this year.
•
Boston -
We are the largest carrier in terms of flights and capacity at Boston's Logan International Airport. By the end of
2017
we flew to
63
nonstop destinations from Boston and our operations accounted for more than 27% of all seats offered in Boston. We continue to capitalize on opportunities in the changing competitive landscape by adding routes, frequencies and increasing our relevance to local travelers. Our plan is to grow Boston with a general target of 200 flights per day. In August 2017, we announced nonstop service will be offered to Syracuse, NY, in January 2018. In October 2017, we announced nonstop service to be offered to Minneapolis in the second quarter of 2018.
With the success of our existing Mint™ routes, we announced additional Boston Mint™ service to San Francisco, which began in the third quarter of 2017, to San Diego, which began in the fourth quarter of 2017, and seasonal Mint™ service to St. Maarten, which began in the fourth quarter of 2017.
In November 2015, we unveiled Phase I of our $50 million Logan Terminal C upgrade which included new kiosks and ticket counters. Twenty-five kiosks and thirty check-in counters are in use in the North Pod of the terminal. Phase II of the upgrade, funded by the Massachusetts Port Authority, or Massport, was completed on the South Pod in 2016 which mirrors the check-in experience of the North Pod. Updated digital flight information displays and a connector between Terminal C and international flights at Terminal E were also completed during 2016. We lease 23 gates, and completed installation of self-service kiosks in Boston in early 2017.
•
Caribbean and Latin America -
At the end of
2017
we had 38 BlueCities in the Caribbean and Latin America and we expect our presence to continue to grow. San Juan, Puerto Rico is our only focus city outside of the Continental U.S. We are the largest airline in Puerto Rico serving more nonstop destinations than any other carrier. We are also the largest airline in the Dominican Republic, serving five airports. While the Caribbean and Latin American region is a growing part of our network, operating in this region can present challenges, including working with less developed airport infrastructure, political instability and vulnerability to corruption. The second half of 2017 brought extraordinary weather conditions due to several strong hurricanes. We believe full recovery in Puerto Rico in the wake of Hurricane Maria will take many months. As the largest airline in the Commonwealth, we are working closely with the authorities and the community to support short-term needs and help in the long-term recovery. In September 2017, we launched a companywide initiative, 100x35JetBlue, including daily relief flights, transportation of essential items and fund raising initiatives. We plan to continue our efforts and commitment to providing support during 2018.
9
•
Fort Lauderdale-Hollywood -
We are the largest carrier at Fort Lauderdale-Hollywood International Airport, or Fort Lauderdale-Hollywood, with approximately 25% of all seats offered in
2017
. We expect Fort Lauderdale-Hollywood to continue to be our fastest growing focus city. Flying out of Fort Lauderdale-Hollywood instead of nearby Miami International Airport helps preserve our competitive cost advantage through lower enplanement costs. In 2012, Broward County authorities commenced a multi-year, $2.3 billion refurbishment effort at the airport and surrounding facilities including the construction of a new south runway. We operate primarily out of Terminal 3 which is scheduled to be refurbished and connected to the upgraded and expanded international terminal by 2018. We will have additional facilities in the new international terminal to support our international arrivals. Terminal 3 allows for easy access to the expanded and enhanced airfield. We expect the connection of these terminals to streamline operations for both Crewmembers and Customers. Due to these factors, we believe Fort Lauderdale-Hollywood an ideal location between the U.S. and Latin America as well as South Florida's high-value geography. We intend to focus on Fort Lauderdale-Hollywood growth going forward. During 2017, we launched our Mint
™
service from Fort Lauderdale to Los Angeles and San Francisco, and we launched nonstop service to Salt Lake City. The new route continues to grow our presence in Fort Lauderdale where we're the largest airline. Salt Lake City will become the 56
th
nonstop destination from Fort Lauderdale. We expect to add new service to Atlanta in March of 2018.
•
Orlando -
We are the third largest carrier in terms of capacity at Orlando International Airport, or Orlando, with 13% of all seats offered in
2017
. Orlando is JetBlue's fourth largest focus city with
30
nonstop destinations and a growing mix of traffic including leisure, VFR and business travelers. Our centralized training center, known as JetBlue University, is based in Orlando. In 2015, we opened the Lodge at OSC which is adjacent to our training center and is used for lodging our Crewmembers when they attend training.
•
Los Angeles area -
We are the sixth largest carrier in the Los Angeles area measured by seats, operating from Long Beach Airport, or Long Beach, Los Angeles International Airport, or LAX, and Burbank's Bob Hope Airport. We are the largest carrier in Long Beach, with almost 80% of all seats offered in
2017
operated by JetBlue. We worked with the city of Long Beach and the community to request the U.S. Customs and Border Protection to add a Federal Inspection Site, or FIS, at the airport, which would have enabled us to serve international destinations from Long Beach. However, in January 2017, the Long Beach City Council voted against moving forward with the plans for the FIS facility. Long Beach remains an important BlueCity for JetBlue and is part of our broader strategy.
In June 2014, we started operating our premium service, Mint™, from LAX, which continued to grow during 2017. We currently offer up to eleven daily round trips between JFK and LAX and up to four daily round trips between Boston and LAX. While international service is not possible at Long Beach due to Federal regulations, we remain committed to Long Beach and to growing across California. We are now operating more flights than we ever have in our 15-year history at Long Beach and we continue to grow our LAX operation with the expansion of Mint™. Elsewhere in the region, we serve Burbank and are now on the waiting list for slots at John Wayne Airport in Orange County.
Fleet Structure
We currently operate Airbus A321, Airbus A320 and Embraer E190 aircraft types. In
2017
, our fleet had an average age of
9.2
years and operated an average of
11.7
hours per day. By scheduling and operating our aircraft more efficiently we are able to spread related fixed costs over a greater number of ASMs.
The reliability of our fleet is essential to ensuring our operations run efficiently and we are continually working with our aircraft and engine manufacturers to enhance our performance.
Our comprehensive fleet review continues as we explore all options. Regarding our cabin restyling program, the industry experienced design failures with the space efficient lavatories that we have installed on our A321s, and are planning to install on the A320s. During the fourth quarter of 2017, we made significant progress in addressing certain quality issues with our business partners. As a result, our first Airbus A320 entered modifications for prototyping during the first quarter of 2018, coinciding with a scheduled heavy maintenance check for operational efficiency. We believe this multi-year restyling program will allow us to increase capacity in a capital-efficient and customer-focused way.
10
We are working with the Federal Aviation Administration, or FAA, in efforts towards implementing the Next Generation Air Transportation System, or NextGen, by 2020. NextGen technology is expected to improve operational efficiency in the congested airspaces in which we operate. In 2012, we equipped 35 of our Airbus A320 aircraft to test ADS-B Out, a satellite based technology aimed to facilitate the communication between pilots and air traffic controllers. Even though it is still in the testing phase we have already seen benefits from the ADS-B Out equipment including being able to reroute flights over the Gulf of Mexico to avoid bad weather, an area where the current FAA radar coverage is not complete. In 2012, we also became the first FAA certified Airbus A320 carrier in the U.S. to use satellite-based Special Required Navigation Performance Authorization Required, or RNP AR, approaches at two of JFK's prime and most used runways, 13L and 13R. As part of NextGen, our aircraft will also be outfitted with the following:
•
Satellite-based Communications
: We are putting satellite-based voice and data communications (SATCOM) on our Airbus fleet. Every aircraft will be assigned a unique phone number, similar to a cell network. This will give us positive contact with aircraft anywhere in the world.
•
Data Comm
: Data Comm makes departures more efficient by dramatically speeding up the process of aircraft pilots obtaining clearance from air traffic controllers. With Data Comm, controllers can simply push clearance details to the aircraft and dispatcher, which the pilot can confirm and automatically input into the flight computer with the push of a button. We recently received approval to equip our entire Airbus fleet with Data Comm. Data Comm is currently installed on 35 of our Airbus A321 aircraft and will be equipped on all future deliveries.
In addition, we also plan to upgrade our entire fleet to the latest version of the Traffic Collision & Avoidance System (TCAS), a critical safety system that reduces the chance of a mid-air collision.
Fleet Maintenance
Consistent with our core value of safety, our FAA-approved maintenance programs are administered by our technical operations department. We use qualified maintenance personnel and ensure they have comprehensive training. We maintain our aircraft and associated maintenance records in accordance with, if not exceeding, FAA regulations. Fleet maintenance work is divided into three categories: line maintenance, heavy maintenance and component maintenance.
The bulk of our line maintenance is handled by JetBlue technicians and inspectors. It consists of daily checks, overnight and weekly checks, or "A" checks, diagnostics and routine repairs.
Heavy maintenance checks, or "C" checks, consist of a series of more complex tasks taking from one to four weeks to complete and are typically performed once every 15 months. All of our aircraft heavy maintenance work is performed by third party FAA-approved facilities such as Embraer, Haeco, Aeromantenimiento S.A. and Lufthansa Technik AG, and are subject to direct oversight by JetBlue personnel. We outsource heavy maintenance as the costs are lower than if we performed the tasks internally.
Component maintenance on equipment such as engines, auxiliary power units, landing gears, pumps and avionic computers are all performed by a number of different FAA-approved third party repair stations. We have an agreement with Lufthansa Technik AG for the repair, overhaul, modification and logistics of our Airbus aircraft engines and certain Airbus components. We also have a maintenance agreement with GE Engine Services, LLC for our Embraer E190 aircraft engines. Many of our maintenance service agreements are based on a fixed cost per flight hour. These fixed costs vary based upon the age of the aircraft and other operating factors impacting the related component. Required maintenance not otherwise covered by these agreements is performed on a time and materials basis. All other maintenance activities are sub-contracted to qualified maintenance, repair and overhaul facilities.
Aircraft Fuel
Aircraft fuel continues to be one of our largest expenses. Its price and availability has been extremely volatile due to global economic and geopolitical factors which we can neither control nor accurately predict. We use a third party to assist with fuel management service and to procure most of our fuel. Our historical fuel consumption and costs for the years ended December 31 were:
|
2017
|
2016
|
2015
|
||||||||||
|
Gallons consumed (millions)
|
792
|
|
760
|
|
700
|
|
||||||
|
Total cost (millions)
(1)
|
$
|
1,363
|
|
$
|
1,074
|
|
$
|
1,348
|
|
|||
|
Average price per gallon
(1)
|
$
|
1.72
|
|
$
|
1.41
|
|
$
|
1.93
|
|
|||
|
Percent of operating expenses
|
22.7
|
%
|
20.2
|
%
|
25.9
|
%
|
||||||
(1) Total cost and average price per gallon each include related fuel taxes as well as effective fuel hedging gains and losses.
11
We attempt to protect ourselves against the volatility of fuel prices by entering into a variety of derivative instruments. These include swaps, caps, collars, and basis swaps with underlyings of jet fuel, crude and heating oil.
Financial Health
We strive to maintain financial strength and a cost structure that enables us to grow profitably and sustainably. In the first years of our history, we relied on financing activities to fund much of our growth. Starting in 2007, our growth has largely been funded through internally generated cash from operations. Since 2014, while we have invested approximately $4.1 billion in capital assets, we have also generated approximately $5.6 billion in cash from operations, resulting in approximately $1.5 billion in free cash flow. Our improved financial results have resulted in better credit ratings, which in turn allows for more attractive financing terms. Since 2014, we have also reduced our total debt balance by nearly $1 billion.
JetBlue Technology Ventures
JetBlue has a new wholly-owned subsidiary, JetBlue Technology Ventures, L.L.C., or JTV, that incubates, invests in and partners with early stage startups at the intersection of technology, travel and hospitality.
JetBlue Travel Products
In 2018, we launched JBTP, LLC, or JetBlue Travel Products, which includes our JetBlue
®
Vacations brand and we plan to introduce a new booking flow on our website to better merchandise our existing travel products.
TWA Flight Center Hotel Development
In 2015, the Board of Commissioners of the Port Authority of New York & New Jersey, or the PANYNJ approved a construction plan to redevelop the TWA Flight Center at JFK on its nearly six-acre site into a hotel with over 500 rooms, meeting spaces, restaurants, a spa and an observation deck. The complex is planned to feature two six-story hotel towers. As part of the plan, a 75-year lease agreement involves Flight Center Hotel LLC, a partnership of MCR Development, LLC and JetBlue. We estimate our ultimate ownership in the hotel to be approximately 5% to 10% of the final total investment. During December 2016, the TWA Flight Center Hotel officially broke ground. The hotel is scheduled to open in early 2019. It will be the first hotel on airport property at JFK since 2009. The only other hotels near the airport are budget accommodations a short drive away by shuttle bus or taxi.
CULTURE
Our People
Our success depends on our Crewmembers delivering a terrific Customer experience in the sky and on the ground. One of our competitive strengths is a service orientated culture grounded in our five key values: safety, caring, integrity, passion and fun. We believe a highly productive and engaged workforce enhances customer loyalty. Our goal is to hire, train and retain a diverse workforce of caring, passionate, fun and friendly people who share our mission to inspire humanity.
Our culture is first introduced to new Crewmembers during the screening process and then at an extensive new hire orientation program at JetBlue University, our training center in Orlando. Orientation focuses on the JetBlue strategy and emphasizes the importance of customer service, productivity and cost control. We provide continuous training for our Crewmembers including technical training, a specialized captain leadership training program unique in the industry, a leadership program for current company managers, an emerging managers program, regular training focused on the safety value and front line training for our customer service teams.
Our growth plans necessitate and facilitate opportunities for talent development. In 2008, we launched the University Gateway Program, one of our many pilot recruitment initiatives, which made us the first airline to provide a training program for undergraduate students interested in becoming JetBlue First Officers. In 2016, we launched Gateway Select, a program for prospective pilots to join us for a rigorous, approximately four-year training program that incorporates classroom learning, extensive real-world flying experience and instruction in full flight simulators.
12
We believe a direct relationship between Crewmembers and our leadership is in the best interests of our Crewmembers, our Customers and our Shareholders. Except for our pilots, our Crewmembers do not have third-party representation. In April 2014, JetBlue pilots elected to be solely represented by the Air Line Pilots Association, or ALPA. The National Mediation Board, or NMB, certified ALPA as the representative body for JetBlue pilots and we are working with ALPA to reach our first collective bargaining agreement. We have individual employment agreements with each of our non-unionized FAA licensed Crewmembers which consist of dispatchers, technicians, inspectors and air traffic controllers. Each employment agreement is for a term of five years and renews for an additional five-year term, unless the Crewmember is terminated for cause or the Crewmember elects not to renew. Pursuant to these employment agreements, Crewmembers can only be terminated for cause. In the event of a downturn in our business, resulting in a reduction of flying and related work hours, we are obligated to pay these Crewmembers a guaranteed level of income and to continue their benefits. We believe that through these agreements we provide what we believe to be industry-leading job protection. We believe these agreements provide JetBlue and Crewmembers flexibility and allow us to react to Crewmember needs more efficiently than collective bargaining agreements.
In December 2017, The Transport Workers Union of America (TWU) filed for an election, the next step in its long-running effort to unionize our Inflight Crewmembers. We continue to monitor this process as it affects our Crewmembers. Our Inflight Crewmembers have an important choice to make and our focus remains on keeping our culture and values intact.
A key feature of the direct relationship with our Crewmembers is our Values Committees which are made up of peer-elected frontline Crewmembers from each of our major work groups, other than pilots. They represent the interests of our workgroups and help us run our business in a productive and efficient manner. We believe this direct relationship with Crewmembers drives higher levels of engagement and alignment with JetBlue’s strategy, culture and overall goals.
We believe the efficiency and engagement of our Crewmembers is a result of our flexible and productive work rules. We are cognizant of the competition for productive labor in key industry positions and new government rules requiring higher qualifications as well as more restricted hours that may result in potential labor shortages in the upcoming years.
Our leadership team communicates on a regular basis with all Crewmembers in order to maintain a direct relationship and to keep them informed about news, strategy updates and challenges affecting the airline and the industry. Effective and frequent communication throughout the organization is fostered through various means including email messages from our CEO and other senior leaders at least weekly, weekday news updates to all Crewmembers, employee engagement surveys, a quarterly Crewmember magazine and active leadership participation in new hire orientations. Leadership is also heavily involved in periodic open forum meetings across our network, called “pocket sessions” which are often videotaped and posted on our intranet. By soliciting feedback for ways to improve our service, teamwork and work environment, our leadership team works to keep Crewmembers engaged and makes our business decisions transparent. Additionally, we believe cost and revenue improvements are best recognized by Crewmembers on the job.
Our average number of full-time equivalent Crewmembers for the year ended
December 31, 2017
consisted of
3,211
pilots,
4,251
inflight (whom other airlines may refer to as flight attendants),
4,512
airport operations personnel,
585
technicians (whom other airlines may refer to as mechanics),
1,430
reservation agents, and
3,129
management and other personnel. For the year ended
December 31, 2017
, we employed an average of
14,870
full-time and
5,108
part-time Crewmembers.
Crewmember Programs
We are committed to supporting our Crewmembers through a number of programs including:
•
Crewmember Resource Groups (CRGs) -
These are groups formed by and consisting of Crewmembers to act as a resource for both the group members as well as JetBlue. The groups serve as an avenue to embrace and encourage different perspectives, thoughts and ideas. At the end of
2017
, we had four CRGs in place: JetPride, Women in Flight, Vets in Blue, and BlueConexion. In 2018, we welcome the JetBlue African Diaspora Experience (JADE), our fifth CRG.
•
JetBlue Crewmember Crisis Fund (JCCF) -
This organization, originally formed in 2002, is a non-profit corporation independent from JetBlue and recognized by the IRS as of that date as a tax-exempt entity. JCCF was created to assist JetBlue Crewmembers and their immediate family members (IRS Dependents) in times of crisis. Funds for JCCF grants come directly from Crewmember donations via a tax-deductible payroll deduction. During 2017 we witnessed several unprecedented weather challenges including various hurricanes. JCCF helped provide over $2 million in relief to Crewmembers impacted by Hurricanes Harvey, Irma and Maria. The assistance process is confidential with only the fund administrator and coordinator knowing the identity of the Crewmembers in need.
•
JetBlue Scholars
-
Developed in 2015, this program offers a new and innovative model to our Crewmembers wishing to further their education. Crewmembers enrolled in the program can earn a bachelor's degree through self-directed online college courses facilitated by JetBlue. In November 2017 we celebrated the graduation of 60 of our Crewmembers who took the initiative and successfully completed their undergraduate college degrees. This reemphasizes our continuous effort to help provide assistance to our most valued asset, our people.
13
•
Lift Recognition Program -
Formed in 2012, this Crewmember recognition program encourages Crewmembers to celebrate their peers for living JetBlue's values by sending e-thanks through an on-line platform. Our senior leadership team periodically hosts an event for the Crewmembers who receive the highest number of Lift award recognitions in each quarter of the year. In
2017
, we saw more than
100,000
Lift awards.
Community Programs
JetBlue is strongly committed to supporting the communities and BlueCities we serve through a variety of community programs including:
•
100x35JetBlue
-
As the airline with more service than any other carrier in Puerto Rico and nearly 500 local Crewmembers, we take our commitment to the community very seriously. 100x35JetBlue, an initiative JetBlue launched following Hurricane Maria making landfall in the Caribbean, we supported our Crewmembers, Customers, and communities to meet urgent needs and ongoing rebuilding efforts after the devastating impact of Hurricane Maria. JetBlue's support included helping replenish vegetation and the ecosystem, hosting free meal events, donating school supplies, partnering with community leaders and influencers to raise awareness and funds, and offering advertising space to promote Puerto Rican tourism.
•
Corporate Social Responsibility (CSR) -
The CSR team supports not-for-profit organizations focusing on youth and education, environment, and community in the BlueCities we serve. The team organizes and supports community service projects, charitable giving and non-profit partnerships such as KaBOOM!, which builds, opens and improves playgrounds to benefit millions of young children, and Soar with Reading, which works to get books into the hands of children who need them most including free book vending machines.
•
JetBlue Foundation -
Organized in 2013 as a non-profit corporation, this foundation is a JetBlue-sponsored organization to advance aviation-related education and to continue our efforts to promote aviation as a career choice for students. The foundation intends to do this by igniting interest in science, technology, engineering and mathematics. The foundation is legally independent from JetBlue and has a Board of Directors as well as an Advisory Committee, both of which are made up of Crewmembers. The foundation is recognized by the IRS as a tax-exempt entity.
•
USO Center T5/JFK -
Continuing our tradition of proudly supporting the men, women and families of the U.S. military, in September 2014 we opened a USO Center in T5 at JFK. The USO Center is open seven days a week, 365 days per year for military members and their families traveling on any airline at JFK, not just JetBlue. This USO Center is fully stocked with computers, televisions, gaming devices/stations, furniture, iPads, food, beverages and much more. In conjunction with leading airport design firm Gensler, Turner Construction Company, the PANYNJ and more than 28 contractors and individual donors, 100% of the space, services, labor and materials were donated to ensure the USO Center would be free of any financial burden. Crewmembers donate time to help run the USO Center.
•
T5 Farm
-
Creating a healthier airport environment is a core pillar of JetBlue's sustainability philosophy. Through a partnership with TERRA brand and support from GrowNYC and the PANYNJ, we created the T5 Farm, a blue potato farm and produce garden on the roof of T5. The T5 Farm aims to serve as an agricultural and educational resource for the community, as well as a mechanism to absorb rainwater and runoff, reducing the possibility of flooding in the adjacent areas. Produce from the T5 Farm is donated to local food pantries.
REGULATION
Airlines are heavily regulated, with rules and regulations set by various federal, state and local agencies. We also operate under specific regulations due to our operations within the high density airspace of the northeast U.S. Most of our airline operations are regulated by U.S. governmental agencies including:
DOT -
The DOT primarily regulates economic issues affecting air service including, but not limited to, certification and fitness, insurance, consumer protection and competitive practices. They set the requirement that carriers cannot permit domestic flights to remain on the tarmac for more than three hours. The DOT also requires that the advertised price for an airfare or a tour package including airfare (such as a hotel/air vacation package) has to be the total price to be paid by the Customer, including all government taxes and fees. It has the authority to investigate and institute proceedings to enforce its economic regulations and may assess civil penalties, revoke operating authority and seek criminal sanctions.
14
FAA -
The FAA primarily regulates flight operations, in particular, matters affecting air safety. This includes but is not limited to airworthiness requirements for aircraft, the licensing of pilots, mechanics and dispatchers, and the certification of flight attendants. It requires each airline to obtain an operating certificate authorizing the airline to operate at specific airports using specified equipment. Like all U.S. certified carriers, JetBlue cannot fly to new destinations without the prior authorization of the FAA. After providing notice and a hearing, it has the authority to modify, suspend temporarily or revoke permanently our authority to provide air transportation or that of our licensed personnel for failure to comply with FAA regulations. It can additionally assess civil penalties for such failures as well as institute proceedings for the imposition and collection of monetary fines for the violation of certain FAA regulations. When significant safety issues are involved, it can revoke a U.S. carrier's authority to provide air transportation on an emergency basis, without providing notice and a hearing. It monitors our compliance with maintenance as well as flight operations and safety regulations. It maintains on-site representatives and performs frequent spot inspections of our aircraft, Crewmembers and records. It also has the authority to issue airworthiness directives and other mandatory orders. This includes the inspection of aircraft and engines, fire retardant and smoke detection devices, collision and windshear avoidance systems, noise abatement and the mandatory removal and replacement of aircraft parts that have failed or may fail in the future. We have and maintain FAA certificates of airworthiness for all of our aircraft and have the necessary FAA authority to fly to all of the destinations we currently serve.
TSA and U.S. Customs and Border Protection
-
The TSA and the U.S. Customs and Boarder Protection, or CBP, operate under the Department of Homeland Security and are responsible for all civil aviation security. This includes passenger and baggage screening; cargo security measures; airport security; assessment and distribution of intelligence; security research and development; international passenger screening; customs; and agriculture. It also has law enforcement powers and the authority to issue regulations, including in cases of national emergency, without a notice or comment period. It can also assess civil penalties for such failures as well as institute proceedings for the imposition and collection of monetary fines for the violation of certain regulations.
Taxes & Fees -
The airline industry is one of the most heavily taxed in the U.S., with taxes and fees accounting for approximately 17% of the total fare charged to a Customer. Airlines are obligated to fund all of these taxes and fees regardless of their ability to pass these charges on to the Customer. The September 11 Security Fee which is set by the TSA and is passed through to the Customer, is currently $5.60 per enplanement, regardless of the number of connecting flights and a round trip fee is limited to a maximum of $11.20. Effective December 28, 2015, the Animal and Plant Health Inspection Service Aircraft Inspection fee increased from $70.75 to $225 per international aircraft arriving in the U.S.
State and Local -
We are subject to state and local laws and regulations in a number of states in which we operate and the regulations of various local authorities operating the airports we serve.
Airport Access -
JFK, LaGuardia, and Ronald Reagan Washington National Airport, or Reagan National, are slot-controlled airports subject to the "High Density Rule" and successor rules issued by the FAA, or Slots. These rules were implemented due to the high volume of traffic at these popular airports located in the northeast corridor airspace. The rules limit the air traffic in and out of these airports during specific times; however, even with the rules in place, delays remain among the highest in the nation due to continuing airspace congestion. We additionally have Slots at other Slot-controlled airports governed by unique local ordinances not subject to the High Density Rule, including Westchester County Airport in White Plains, NY and Long Beach (California) Municipal Airport. We started flying to Atlanta in the first half of 2017 and were not granted the agreed upon number of gates as originally promised, another common issue at certain airports.
Airport Infrastructure -
The northeast corridor of the U.S. contains some of the most congested airspaces in the world. The airports in this region are some of the busiest in the country, the majority of which are more than 60 years old. Due to high usage and aging infrastructure, issues arise at these airports that are not necessarily seen in other parts of the country. At JFK, the completion of high-speed taxiways, in addition to the runway renovations finished in 2015, enables landing aircraft the ability to exit the runway faster. We renovated our lobby layout as part of our self-service initiative with our new user friendly kiosks. At LaGuardia, in late 2017 we moved from Central Terminal B to the historic Marine Air Terminal A. The Marine Air Terminal has a beautiful historic design which we plan to honor while adding our own modern touches to create an airport experience in line with the award-winning service our Customers receive onboard. We expect out makeover of the Terminal to continue into 2018 and to include updated and additional concessions post-security, more seating, and technology upgrades. The Terminal is scheduled to feature an expanded check-in area with self-bag-tagging kiosks and a dedicated TSA Pre-Check lane with JetBlue as the main tenant, occupying four gates.
Foreign Operations -
International air transportation is subject to extensive government regulation. The availability of international routes to U.S. airlines is regulated by treaties and related agreements between the U.S. and foreign governments. We currently operate international service to Antigua and Barbuda, Aruba, the Bahamas, Barbados, Bermuda, the Cayman Islands, Colombia, Costa Rica, Cuba, Curaçao, the Dominican Republic, Ecuador, Grenada, Haiti, Jamaica, Mexico, Peru, Saint Lucia, St. Maarten, Trinidad and Tobago and the Turks and Caicos Islands. To the extent we seek to provide air transportation to additional international markets in the future, we would be required to obtain necessary authority from the DOT and the applicable foreign government.
15
We believe we are operating in material compliance with DOT, FAA, TSA, CBP and applicable international regulations as well as hold all necessary operating and airworthiness authorizations and certificates. Should any of these authorizations or certificates be modified, suspended or revoked, our business could be materially adversely affected.
Other
Environmental -
We are subject to various federal, state and local laws relating to the protection of the environment. This includes the discharge or disposal of materials and chemicals as well as the regulation of aircraft noise administered by numerous state and federal agencies.
The Airport Noise and Capacity Act of 1990 recognizes the right of airport operators with special noise problems to implement local noise abatement procedures as long as those procedures do not interfere unreasonably with the interstate and foreign commerce of the national air transportation system. Certain airports, including San Diego and Long Beach airports in California, have established restrictions to limit noise which can include limits on the number of hourly or daily operations and the time of such operations. These limitations are intended to protect the local noise-sensitive communities surrounding the airport. Our scheduled flights at Long Beach and San Diego are in compliance with the noise curfew limits, but on occasion when we experience irregular operations, we may violate these curfews. In 2017, we entered into an agreement with the Long Beach City Prosecutor which requires us to pay a $6,000 fine per violation. The payments resulting from curfew violations go to support the Long Beach Public Library Foundation. This local ordinance has not had, and we believe it will not have, a negative effect on our operations.
We report annually on environmental, social, governance (ESG) issues and our response to them uses the Sustainable Accounting Standards Board (SASB) framework. The report can be found on our Investor Relations website at
http://blueir.investproductions.com
In 2017, JetBlue focused our sustainability efforts on three areas: Climate Leadership, Sustainable Operations, and Sustainable Tourism. Climate Leadership encompasses climate change related risk and greenhouse gases associated with the burning of jet fuel, our biggest environmental impact and regulatory exposure. Sustainable Operations encompasses implementation of operational change and new technologies to reduce our cost of natural resources associated with the operations. Sustainable Tourism encompasses commercial and environmental research to forecast future demand for tourism. more can be found on
www.jetblue.com/green/
During 2016, we entered into a partnership to buy renewable jet fuel produced from plant derived oils. This marked the largest, long-term, commitment globally by any airline for a jet fuel based on fatty acids. Early engagement with a renewable jet fuel supply positions JetBlue to reduce costs associated with CO
2
emissions.
Concern over climate change, including the impact of global warming, has led to significant U.S. and international legislative and regulatory efforts to limit GHG emissions, including our aircraft and diesel engine emissions. In October 2016, the International Civil Aviation Organization (“ICAO”) passed a resolution adopting the Carbon Offsetting and Reduction Scheme for International Aviation (“CORSIA”), which is a global, market-based emissions offset program to encourage carbon-neutral growth beyond 2020. CORSIA is scheduled to take effect by 2021. ICAO continues to develop details regarding implementation, but we believe compliance with CORSIA will increase our operating costs.
Foreign Ownership -
Under federal law and DOT regulations, we must be controlled by U.S. citizens. In this regard, our president and at least two-thirds of our board of directors must be U.S. citizens. Further, no more than 24.99% of our outstanding common stock may be voted by non-U.S. citizens. We believe we are currently in compliance with these ownership provisions.
Other Regulations -
All airlines are subject to certain provisions of the Communications Act of 1934 due to their extensive use of radio and other communication facilities. They are also required to obtain an aeronautical radio license from the FCC. To the extent we are subject to FCC requirements, we take all necessary steps to comply with those requirements.
Our labor relations are covered under Title II of the Railway Labor Act of 1926 and are subject to the jurisdiction of the NMB. In addition, during periods of fuel scarcity, access to aircraft fuel may be subject to federal allocation regulations.
Civil Reserve Air Fleet -
We are a participant in the Civil Reserve Air Fleet Program, which permits the U.S. Department of Defense to utilize our aircraft during national emergencies when the need for military airlift exceeds the capability of military aircraft. By participating in this program, we are eligible to bid on and be awarded peacetime airlift contracts with the U.S. military.
16
Insurance
We carry insurance of types customary in the airline industry and at amounts deemed adequate to protect us and our property as well as comply with both federal regulations and certain credit and lease agreements. As a result of the terrorist attacks of September 11, 2001, aviation insurers significantly reduced the amount of insurance coverage available to commercial airlines for liability to persons other than Crewmembers or passengers for claims resulting from acts of terrorism, war or similar events. This is known as war risk coverage. At the same time, these insurers significantly increased the premiums for aviation insurance in general. The U.S. government agreed to provide commercial war-risk insurance for U.S. based airlines, covering losses to Crewmembers, passengers, third parties and aircraft. Prior to the end of U.S. government war-risk insurance coverage, JetBlue obtained comparable coverage in the commercial market starting in 2014 as part of our overall hull and liability insurance coverage.
WHERE YOU CAN FIND OTHER INFORMATION
Our website is
www.jetblue.com
. Information contained on our website is not part of this Report. Information we furnish or file with the SEC, including our Annual Reports on Form 10-K, Quarterly Reports on Form 10-Q, Current Reports on Form 8-K and any amendments to or exhibits included in these reports are available for download, free of charge, on our website soon after such reports are filed with or furnished to the SEC. Our SEC filings, including exhibits filed therewith, are also available at the SEC’s website at
www.sec.gov
. You may obtain and copy any document we furnish or file with the SEC at the SEC’s public reference room at 100 F Street, NE, Room 1580, Washington, D.C. 20549. You may obtain information on the operation of the SEC’s public reference facilities by calling the SEC at 1-800-SEC-0330. You may request copies of these documents, upon payment of a duplicating fee, by writing to the SEC at its principal office at 100 F Street, NE, Room 1580, Washington, D.C. 20549.
Risks Related to JetBlue
We operate in an extremely competitive industry.
The domestic airline industry is characterized by low profit margins, high fixed costs and significant price competition in an increasingly concentrated competitive field. We currently compete with other airlines on all of our routes. Most of our competitors are larger and have greater financial resources and name recognition than we do. Following our entry into new markets or expansion of existing markets, some of our competitors have chosen to add service or engage in extensive price competition. Unanticipated shortfalls in expected revenues as a result of price competition or in the number of passengers carried would negatively impact our financial results and harm our business. The extremely competitive nature of the airline industry could prevent us from attaining the level of passenger traffic or maintaining the level of fares required to maintain profitable operations in new and existing markets and could impede our profitable growth strategy, which would harm our business.
Furthermore, there have been numerous mergers and acquisitions within the airline industry in recent years. The industry may continue to change. Any business combination could significantly alter industry conditions and competition within the airline industry and could cause fares of our competitors to be reduced. Additionally, if a traditional network airline were to fully develop a low cost structure, or if we were to experience increased competition from low cost carriers, our business could be materially adversely affected.
Our business is highly dependent on the availability of fuel and fuel is subject to price volatility.
Our results of operations are heavily impacted by the price and availability of fuel. Fuel costs comprise a substantial portion of our total operating expenses. Historically, fuel costs have been subject to wide price fluctuations based on geopolitical factors as well as supply and demand. The availability of fuel is not only dependent on crude oil but also on refining capacity. When even a small amount of the domestic or global oil refining capacity becomes unavailable, supply shortages can result for extended periods of time. The availability of fuel is also affected by demand for home heating oil, gasoline and other petroleum products, as well as crude oil reserves, dependence on foreign imports of crude oil and potential hostilities in oil producing areas of the world. Because of the effects of these factors on the price and availability of fuel, the cost and future availability of fuel cannot be predicted with any degree of certainty.
17
Our aircraft fuel purchase agreements do not protect us against price increases or guarantee the availability of fuel. Additionally, some of our competitors may have more leverage than we do in obtaining fuel. We have and may continue to enter into a variety of option contracts and swap agreements for crude oil, heating oil, and jet fuel to partially protect against significant increases in fuel prices. However, such contracts and agreements do not completely protect us against price volatility, are limited in volume and duration in the respective contract, and can be less effective during volatile market conditions and may carry counterparty risk. Under the fuel hedge contracts we may enter from time to time, counterparties to those contracts may require us to fund the margin associated with any loss position on the contracts if the price of crude oil falls below specified benchmarks. Meeting our obligations to fund these margin calls could adversely affect our liquidity.
Due to the competitive nature of the domestic airline industry, at times we have not been able to adequately increase our fares to offset the increases in fuel prices nor may we be able to do so in the future. Future fuel price increases, continued high fuel price volatility or fuel supply shortages may result in a curtailment of scheduled services and could have a material adverse effect on our financial condition and results of operations.
We have a significant amount of fixed obligations and we will incur significantly more fixed obligations which could harm our ability to service our current obligations or satisfy future fixed obligations.
As of
December 31, 2017
, our debt of
$1.2 billion
accounted for
21%
of our total capitalization. In addition to long-term debt, we have a significant amount of other fixed obligations under operating leases related to our aircraft, airport terminal space, airport hangers, other facilities and office space. As of
December 31, 2017
, future minimum payments under noncancelable leases and other financing obligations were approximately
$3.3 billion
for
2018
through
2022
and an aggregate of
$1.6 billion
for the years thereafter. T5 at JFK is under a lease with the PANYNJ that ends on the 28th anniversary of the date of beneficial occupancy of T5i. The minimum payments under this lease are being accounted for as a financing obligation and have been included in the future minimum payment totals above.
As of
December 31, 2017
, we had commitments of approximately
$7.3 billion
to purchase
119
additional aircraft,
ten
spare engines and various aircraft modifications through
2024
, including estimated amounts for contractual price escalations. We may incur additional debt and other fixed obligations as we take delivery of new aircraft or finance unencumbered aircraft in our fleet and other equipment and continue to expand into new or existing markets. In an effort to limit the incurrence of significant additional debt, we may seek to defer some of our scheduled deliveries, sell or lease aircraft to others, or pay cash for new aircraft, to the extent necessary or possible. The amount of our existing debt, and other fixed obligations, and potential increases in the amount of our debt and other fixed obligations could have important consequences to investors and could require a substantial portion of cash flows from operations for debt service payments, thereby reducing the availability of our cash flow to fund working capital, capital expenditures and other general corporate purposes.
Our level of debt and other fixed obligations could:
•
impact our ability to obtain additional financing to support capital expansion plans and for working capital and other purposes on acceptable terms or at all;
•
divert substantial cash flow from our operations, execution of our commercial initiatives and expansion plans in order to service our fixed obligations;
•
require us to incur significantly more interest expense than we currently do if rates were to increase, since approximately
15%
of our debt has floating interest rates; and
•
place us at a possible competitive disadvantage compared to less leveraged competitors and competitors with better access to capital resources or more favorable financing terms.
Our ability to make scheduled payments on our debt and other fixed obligations will depend on our future operating performance and cash flows, which in turn will depend on prevailing economic and political conditions and financial, competitive, regulatory, business and other factors, many of which are beyond our control. We are principally dependent upon our operating cash flows and access to the capital markets to fund our operations and to make scheduled payments on debt and other fixed obligations. We cannot assure you we will be able to generate sufficient cash flows from our operations or from capital market activities to pay our debt and other fixed obligations as they become due. If we fail to do so our business could be harmed. If we are unable to make payments on our debt and other fixed obligations, we could be forced to renegotiate those obligations or seek to obtain additional equity or other forms of additional financing.
18
Our level of indebtedness may limit our ability to incur additional debt to obtain future financing needs.
We typically finance our aircraft through either secured debt, lease financing or through cash from operations. The impact on financial institutions from global economic conditions may adversely affect the availability and cost of credit to JetBlue as well as to prospective purchasers of our aircraft should we undertake to sell in the future, including financing commitments we have already obtained for purchases of new aircraft or financing or refinancing of existing aircraft. To the extent we finance our activities with additional debt, we may become subject to financial and other covenants that may restrict our ability to pursue our strategy or otherwise constrain our operations.
Our maintenance costs will increase as our fleet ages.
Our maintenance costs will increase as our fleet ages. In the past, we have incurred lower maintenance expenses because most of the parts on our aircraft were under multi-year warranties, but many of these warranties have expired. If any maintenance provider with whom we have a flight hour agreement fails to perform or honor such agreements, we could incur higher interim maintenance costs until we negotiate new agreements.
Furthermore we expect to implement various fleet modifications over the next several years to ensure our aircraft's continued efficiency, modernization, brand consistency and safety. Our plans to restyle our Airbus aircraft with new cabins, for example, may require significant modification time. These fleet modifications may require significant investment over several years, including taking aircraft out of service for several weeks at a time.
Our salaries, wages and benefits costs will increase as our workforce ages.
As our Crewmembers' tenure with JetBlue matures, our salaries, wages and benefits costs increase. As our overall workforce ages, we expect our medical and related benefits to increase as well, despite an increased corporate focus on Crewmember wellness.
We may be subject to unionization, work stoppages, slowdowns or increased labor costs and the unionization of the Company’s pilots could result in increased labor costs.
Our business is labor intensive and the unionization of any of our Crewmembers could result in demands that may increase our operating expenses and adversely affect our financial condition and results of operations. Any of the different crafts or classes of our Crewmembers could unionize at any time, which would require us to negotiate in good faith with the Crewmember group’s certified representative concerning a collective bargaining agreement. In addition, we may be subject to disruptions by unions protesting the non-union status of our other Crewmembers. Any of these events would be disruptive to our operations and could harm our business.
In general, unionization has increased costs in the airline industry. On April 22, 2014, approximately 74% of our pilots voted to be represented by the Airlines Pilot Association, or ALPA. During 2015, we began negotiations with the union regarding a collective bargaining agreement which remain ongoing. If we are unable to reach agreement on the terms of a collective bargaining agreement, or we experience wide-spread Crewmember dissatisfaction, we could be subject to adverse actions. In December 2017, the Transport Workers Union of America (TWU) filed for an election, the next step in its long-running effort to unionize our Inflight workgroup. Any of these events could result in increased labor costs or reduced efficiency, which could have a material adverse effect on the Company’s business, financial condition and results of operations.
There are risks associated with our presence in some of our international emerging markets, including political or economic instability and failure to adequately comply with existing legal and regulatory requirements.
Expansion into new international emerging markets may have risks due to factors specific to those markets. Emerging markets are countries which have less developed economies and may be vulnerable to economic and political instability, such as significant fluctuations in gross domestic product, interest and currency exchange rates, civil disturbances, government instability, nationalization and expropriation of private assets, trafficking and the imposition of taxes or other charges by governments. The occurrence of any of these events in markets served by us and the resulting instability may adversely affect our business.
19
We have expanded and expect to continue to expand our service to countries in the Caribbean and Latin America, some of which have less developed legal systems, financial markets, and business and political environments than the United States, and therefore present greater political, legal, regulatory, economic and operational risks. We emphasize legal compliance and have implemented and continue to implement and refresh policies, procedures and certain ongoing training of Crewmembers with regard to business ethics and compliance, anti-corruption policies and many key legal requirements; however, there can be no assurance our Crewmembers or third party service providers in such locations will adhere to our code of business conduct, anti-corruption policies, other Company policies, or other legal requirements. If we fail to enforce our policies and procedures properly or maintain adequate record-keeping and internal accounting practices to accurately record our transactions, we may be subject to sanctions. In the event we believe or have reason to believe our Crewmembers have or may have violated applicable laws or regulations, we may be subject to investigation costs, potential penalties and other related costs which in turn could negatively affect our reputation, and our results of operations and cash flow.
In addition, to the extent we continue to grow our business both domestically and internationally, opening new markets requires us to commit a substantial amount of resources even before the new services commence. Expansion is also dependent upon our ability to maintain a safe and secure operation and requires additional personnel, equipment and facilities.
Our high aircraft utilization rate helps us keep our costs low, but also makes us vulnerable to delays and cancellations; such delays and cancellations could reduce our profitability.
We maintain a high daily aircraft utilization rate which is the amount of time our aircraft spend in the air carrying passengers. High daily aircraft utilization is achieved in part by reducing turnaround times at airports so we can fly more hours on average in a day. Aircraft utilization is reduced by delays and cancellations from various factors, many of which are beyond our control, including adverse weather conditions, security requirements, air traffic congestion and unscheduled maintenance events. The majority of our operations are concentrated in the Northeast and Florida, which are particularly vulnerable to weather and congestion delays. Reduced aircraft utilization may limit our ability to achieve and maintain profitability as well as lead to Customer dissatisfaction.
Our business is highly dependent on the New York metropolitan market and increases in competition or congestion or a reduction in demand for air travel in this market, or governmental reduction of our operating capacity at JFK, would harm our business.
We are highly dependent on the New York metropolitan market where we maintain a large presence with approximately
one-half of our daily flights having JFK, LaGuardia, Newark, Westchester County Airport or Newburgh’s Stewart International Airport as either their origin or destination. We have experienced an increase in flight delays and cancellations at these airports due to airport congestion which has adversely affected our operating performance and results of operations. Our business could be further harmed by an increase in the amount of direct competition we face in the New York metropolitan market or by continued or increased congestion, delays or cancellations. Our business would also be harmed by any circumstances causing a reduction in demand for air transportation in the New York metropolitan area, such as adverse changes in local economic conditions, health concerns, negative public perception of New York City, acts of terrorism or significant price or tax increases linked to increases in airport access costs and fees imposed on passengers.
Extended interruptions or disruptions in service at one or more of our focus cities could have a material adverse impact on our operations.
Our business is heavily dependent on our operations in the New York Metropolitan area, particularly at JFK, and at our other focus cities in Boston, Orlando, Fort Lauderdale, the Los Angeles basin and San Juan, Puerto Rico. Each of these operations includes flights that gather and distribute traffic to other major cities. A significant interruption or disruption in service at one or more of our focus cities could have a serious impact on our business, financial condition and results of operations.
The second half of 2017 had unprecedented weather events, particularly in Florida and the Caribbean. Hurricanes Irma and Maria resulted in over 2,500 canceled flights or 3% of departures. Following large weather events, it is common to see lingering demand impact similar to what we experienced in New York, following superstorm Sandy in 2012. In the Caribbean, we believe the full recovery in Puerto Rico, in the wake of Hurricane Maria, will take several more months.
We rely heavily on automated systems to operate our business; any failure of these systems could harm our business.
20
We are dependent on automated systems and technology to operate our business, enhance the JetBlue Experience and achieve low operating costs. The performance and reliability of our automated systems and data centers is critical to our ability to operate our business and compete effectively. These systems include our computerized airline reservation system, flight operations system, telecommunications systems, website, maintenance systems, check-in kiosks, and our primary and redundant data centers. Our website and reservation system must be able to securely accommodate a high volume of traffic and deliver important flight information. These systems require upgrades or replacement periodically, which involve implementation and other operational risks. Our business may be harmed if we fail to operate, replace or upgrade our systems or data center infrastructure successfully.
We rely on third party providers of our current automated systems and data center infrastructure for technical support. If our current providers were to fail to adequately provide technical support for any one of our key existing systems or if new or updated components were not integrated smoothly, we could experience service disruptions, which could result in the loss of important data, increase our expenses, decrease our revenues and generally harm our business, reputation and brand. Furthermore, our automated systems cannot be completely protected against events beyond our control, including natural disasters, computer viruses, cyber-attacks, other security breaches, or telecommunications failures. Substantial or sustained system failures could impact customer service and result in our Customers purchasing tickets from other airlines. We have implemented security measures and change control procedures and have disaster recovery plans. We also require our third party providers to have disaster recovery plans; however, we cannot assure you these measures are adequate to prevent disruptions, which, if they were to occur, could result in the loss of important data, increase our expenses, decrease our revenues and generally harm our business, reputation and brand.
We may be impacted by increases in airport expenses relating to infrastructure and facilities.
In order to operate within our current markets as well as continue to grow in new markets, we must be able to obtain adequate infrastructure and facilities within the airports we serve. This includes gates, check-in facilities, operations facilities and landing slots, where applicable. The costs associated with these airports are often negotiated on a short-term basis with the airport authority and we could be subject to increases in costs on a regular basis with or without our approval.
In addition, our operations concentrated in older airports may be harmed if the infrastructure at those older airports fails to operate as expected due to age, overuse or significant unexpected weather events.
Our reputation and business may be harmed and we may be subject to legal claims if there is loss, unlawful disclosure or misappropriation of, or unsanctioned access to, our Customers’, Crewmembers’, business partners’ or our own information or other breaches of our information security.
In the current environment, there are numerous and evolving risks to cybersecurity and privacy, including criminal hackers, hactivists, state-sponsored intrusions, industrial espionage, employee malfeasance and human or technological error. High-profile security breaches at other companies and in government agencies have increased in recent years, and security industry experts and government officials have warned about the risks of hackers and cyberattacks targeting businesses such as ours. Computer hackers and others routinely attempt to breach the security of technology products, services and systems, and to fraudulently induce employees, customers, or others to disclosure information or unwittingly provide access to systems or data. We make extensive use of online services and centralized data processing, including through third party service providers or business providers. The secure maintenance and transmission of Customer and Crewmember information is a critical element of our operations. Our information technology and other systems and those of service providers or business partners, that maintain and transmit customer information, may be compromised by a malicious third party penetration of our network security, or of a business partner, or impacted by deliberate or inadvertent actions or inactions by our Crewmembers, or those of a business partner. The risk of cyberattacks to our Company also includes attempted breaches of contractors, business partners, vendors and other third parties. As a result, personal information may be lost, disclosed, accessed or taken without consent.
We transmit confidential credit card information by way of secure private retail networks and rely on encryption and authentication technology licensed from third parties to provide the security and authentication necessary to effect secure transmission and storage of confidential information. The Company has made significant efforts to secure its computer network. If any compromise of our security or computer network were to occur, it could have a material adverse effect on the reputation, business, operating results and financial condition of the Company, and could result in a loss of Customers. Additionally, any material failure by the Company to achieve or maintain compliance with the Payment Card Industry, or PCI, security requirements or rectify a security issue may result in fines and the imposition of restrictions on the Company's ability to accept credit cards as a form of payment.
21
Any such loss, disclosure or misappropriation of, or access to, Customers’, Crewmembers’ or business partners’ information or other breach of our information security can result in legal claims or legal proceedings, including regulatory investigations and actions, may have a negative impact on our reputation, may lead to regulatory enforcement actions against us, and may materially adversely affect our business, operating results and financial condition. Furthermore, the loss, disclosure or misappropriation of our business information may materially adversely affect our business, operating results and financial condition. The regulations in this area continue to develop and evolve. International regulation adds complexity as we expand our service and include more passengers from other countries.
Data security compliance requirements could increase our costs, and any significant data breach could disrupt our operations and harm our reputation, business, results of operations and financial condition.
The Company is subject to increasing legislative, regulator and customer focus on privacy issues and data security. Our business requires the appropriate and secure utilization of Customer, Crewmember, business partner and other sensitive information. We cannot be certain that advances in criminal capabilities (including cyber-attacks or cyber intrusions over the Internet, malware, computer viruses and the like), discovery of new vulnerabilities or attempts to exploit existing vulnerabilities in our systems, other data thefts, physical system or network break-ins or inappropriate access, or other developments will not compromise or breach the technology protecting the networks that access and store sensitive information. The risk of a security breach or disruption, particularly through cyber-attack or cyber intrusion, including by computer hackers, foreign governments and cyber terrorists, has increased as the number, intensity and sophistication of attempted attacks and intrusions from around the world have increased.
Furthermore, there has been heightened legislative and regulatory focus on data security in the U.S. and abroad, including requirements for varying levels of customer notification in the event of a data breach.Many of our commercial partners, including credit card companies, have imposed data security standards that we must meet. In particular, we are required by the Payment Card Industry Security Standards Council, founded by the credit card companies, to comply with their highest level of data security standards. The Company will continue its efforts to meet its privacy and data security obligations; however, it is possible that certain new obligations may be difficult to meet and could increase the Company's costs.
A significant data security breach or our failure to comply with applicable U.S. or foreign data security regulations or other data security standards may expose us to litigation, claims for contract breach, fines, sanctions or other penalties, which could disrupt our operations, harm our reputation and materially and adversely affect our business, results of operations and financial condition. Failure to address these issues appropriately could also give rise to additional legal risks, which, in turn, could increase the size and number of litigation claims and damages asserted or subject us to enforcement actions, fines and penalties and cause us to incur further related costs and expenses.
Our liquidity could be adversely impacted in the event one or more of our credit card processors were to impose material reserve requirements for payments due to us from credit card transactions.
We currently have agreements with organizations that process credit card transactions arising from purchases of air travel tickets by our Customers. Credit card processors have financial risk associated with tickets purchased for travel which can occur several weeks after the purchase. Our credit card processing agreements provide for reserves to be deposited with the processor in certain circumstances. We do not currently have reserves posted for our credit card processors. If circumstances were to occur requiring us to deposit reserves, the negative impact on our liquidity could be significant which could materially adversely affect our business.
If we are unable to attract and retain qualified personnel or fail to maintain our company culture, our business could be harmed.
We compete against other major U.S. airlines for pilots, mechanics and other skilled labor; some of them offer wage and benefit packages exceeding ours. As more pilots in the industry approach mandatory retirement age, the U.S. airline industry may be affected by a pilot shortage. We may be required to increase wages and/or benefits in order to attract and retain qualified personnel or risk considerable Crewmember turnover. If we are unable to hire, train and retain qualified Crewmembers, our business could be harmed and we may be unable to implement our growth plans.
In addition, as we hire more people and grow, we believe it may be increasingly challenging to continue to hire people who will maintain our company culture. We believe one of our competitive strengths is our service-oriented company culture which emphasizes friendly, helpful, team-oriented and customer-focused Crewmembers. Our company culture is important to providing high quality customer service and having a productive workforce in order to help keep our costs low. As we continue to grow, we may be unable to identify, hire or retain enough people who meet the above criteria, including those in management or other key positions. Our company culture could otherwise be adversely affected by our growing operations and broader geographic diversity. If we fail to maintain the strength of our company culture, our competitive ability and our business may be harmed.
22
Our results of operations fluctuate due to seasonality, weather and other factors.
We expect our quarterly operating results to fluctuate due to seasonality including high vacation and leisure demand occurring on our Florida routes between October and April and on our western routes during the summer. Actions of our competitors may also contribute to fluctuations in our results. We are more susceptible to adverse weather conditions, including snow storms and hurricanes, as a result of our operations being concentrated on the East Coast, than some of our competitors. Our Florida and Caribbean operations are subject to hurricanes. As we enter new markets we could be subject to additional seasonal variations along with any competitive responses to our entry by other airlines. Price changes in aircraft fuel as well as the timing and amount of maintenance and advertising expenditures also impact our operations. As a result of these factors, quarter-to-quarter comparisons of our operating results may not be a good indicator of our future performance. In addition, it is possible in any future period our operating results could be below the expectations of investors and any published reports or analysis regarding JetBlue. In such an event, the price of our common stock could decline, perhaps substantially.
We are subject to the risks of having a limited number of suppliers for our aircraft, engines and our Fly-Fi
™
product.
Our current dependence on three types of aircraft and engines for all of our flights makes us vulnerable to significant problems associated with the International Aero Engines, or IAE V2533-A5 engine on our Airbus A321 fleet, the International Aero Engines, or IAE V2527-A5 engine on our Airbus A320 fleet and the General Electric Engines CF34-10 engine on our Embraer E190 fleet. This could include design defects, mechanical problems, contractual performance by the manufacturers, or adverse perception by the public which would result in Customer avoidance or in actions by the FAA resulting in an inability to operate our aircraft. Carriers operating a more diversified fleet are better positioned than we are to manage such events.
Our Fly-Fi
™
service uses technology and satellite access through our agreement with LiveTV. An integral component of the Fly-Fi
™
system is the antenna, which is supplied to us by LiveTV. If LiveTV were to stop supplying us with its antennas for any reason, we would have to incur significant costs to procure an alternate supplier. Additionally, if the satellites Fly-Fi
™
uses were to become inoperable for any reason, we would have to incur significant costs to replace the service.
Our reputation and financial results could be harmed in the event of an accident or incident involving our aircraft.
An accident or incident involving one of our aircraft could involve significant potential claims of injured passengers or others in addition to repair or replacement of a damaged aircraft and its consequential temporary or permanent loss from service. We are required by the DOT to carry liability insurance. Although we believe we currently maintain liability insurance in amounts and of the type generally consistent with industry practice, the amount of such coverage may not be adequate and we may be forced to bear substantial losses from an accident or incident. Substantial claims resulting from an accident or incident in excess of our related insurance coverage would harm our business and financial results. Moreover, any aircraft accident or incident, even if fully insured, could cause a public perception we are less safe or reliable than other airlines which would harm our business.
Our business depends on our strong reputation and the value of the JetBlue brand.
The JetBlue brand name symbolizes high-quality friendly customer service, innovation, fun, and a pleasant travel experience. JetBlue is a widely recognized and respected global brand; the JetBlue brand is one of our most important and valuable assets. The JetBlue brand name and our corporate reputation are powerful sales and marketing tools and we devote significant resources to promoting and protecting them. Adverse publicity, whether or not justified, relating to activities by our Crewmembers, contractors or agents could tarnish our reputation and reduce the value of our brand. Damage to our reputation and loss of brand equity could reduce demand for our services and thus have an adverse effect on our financial condition, liquidity and results of operations, as well as require additional resources to rebuild our reputation and restore the value of our brand.
We may be subject to competitive risks due to the long term nature of our fleet order book.
At present, we have existing aircraft commitments through
2024
. As technological evolution occurs in our industry, through the use of composites and other innovations, we may be competitively disadvantaged because we have existing extensive fleet commitments that would prohibit us from adopting new technologies on an expedited basis.
23
Risks Associated with the Airline Industry
The airline industry is particularly sensitive to changes in economic condition.
Fundamental and permanent changes in the domestic airline industry have been ongoing over the past several years as a result of several years of repeated losses, among other reasons. These losses resulted in airlines renegotiating or attempting to renegotiate labor contracts, reconfiguring flight schedules, furloughing or terminating Crewmembers, as well as considering other efficiency and cost-cutting measures. Despite these actions, several airlines have reorganized under Chapter 11 of the U.S. Bankruptcy Code to permit them to reduce labor rates, restructure debt, terminate pension plans and generally reduce their cost structure. Since 2005, the U.S. airline industry has experienced significant consolidation and liquidations. A global economic recession and related unfavorable general economic conditions, such as higher unemployment rates, a constrained credit market, housing-related pressures, and increased business operating costs can reduce spending for both leisure and business travel. Unfavorable economic conditions could also impact an airline’s ability to raise fares to counteract increased fuel, labor, and other costs. It is possible that further airline reorganizations, consolidation, bankruptcies or liquidations may occur in the current global economic environment, the effects of which we are unable to predict. We cannot assure you the occurrence of these events, or potential changes resulting from these events, will not harm our business or the industry.
A future act of terrorism, the threat of such acts or escalation of U.S. military involvement overseas could adversely affect our industry.
Acts of terrorism, the threat of such acts or escalation of U.S. military involvement overseas could have an adverse effect on the airline industry. In the event of an act of terrorism, whether or not successful, the airline industry would likely experience increased security requirements and significantly reduced demand. We cannot assure you these actions, or consequences resulting from these actions, will not harm our business or the industry.
Changes in government regulations imposing additional requirements and restrictions on our operations could increase our operating costs and result in service delays and disruptions.
Airlines are subject to extensive regulatory and legal requirements, both domestically and internationally, involving significant compliance costs. In the last several years, Congress has passed laws, and the agencies of the federal government, including, but not limited to, the DOT, FAA, CBP and the TSA have issued regulations relating to the operation of airlines that have required significant expenditures. We expect to continue to incur expenses in connection with complying with government regulations. Additional laws including executive orders, regulations, taxes and airport rates and charges have been proposed from time to time that could significantly increase the cost of airline operations or reduce the demand for air travel. If adopted or materially amended, these measures could have the effect of raising ticket prices affecting the perception of the airline industry, reducing air travel demand and/or revenue and increasing costs. We cannot assure you these and other laws including executive orders, regulations or taxes enacted in the future will not harm our business.
In addition, the U.S. Environmental Protection Agency, or EPA, has proposed changes to underground storage tank regulations that could affect certain airport fuel hydrant systems. In addition to the proposed EPA and state regulations, several U.S. airport authorities are actively engaged in efforts to limit discharges of de-icing fluid to local groundwater, often by requiring airlines to participate in the building or reconfiguring of airport de-icing facilities.
Federal budget constraints or federally imposed furloughs due to budget negotiation deadlocks may adversely affect our industry, business, results of operations and financial position.
Many of our airline operations are regulated by governmental agencies, including the FAA, the DOT, the CBP, the TSA and others. If the federal government were to experience issues in reaching budgetary consensus in the future resulting in mandatory furloughs and/or other budget constraints, our operations and results of operations could be materially negatively impacted. The travel behaviors of the flying public could also be affected, which may materially adversely impact our industry and our business.
Compliance with future environmental regulations may harm our business.
Many aspects of airlines’ operations are subject to increasingly stringent environmental regulations, and growing concerns about climate change may result in the imposition of additional regulation. Since the domestic airline industry is increasingly price sensitive, we may not be able to recover the cost of compliance with new or more stringent environmental laws and regulations from our Customers, which could adversely affect our business. Although it is not expected the costs of complying with current environmental regulations will have a material adverse effect on our financial position, results of operations or cash flows, no assurance can be made the costs of complying with environmental regulations in the future will not have such an effect.
24
We may be affected by global climate change or by legal, regulatory or market responses to such change.
Concern over climate change, including the impact of global warming, has led to significant U.S. and international legislative and regulatory efforts to limit greenhouse gas ("GHG") emissions, including our aircraft emissions. In October 2016, the ICOA passed a resolution adopting the Carbon Offsetting and Reduction Scheme for International Aviation ("CORSIA"), which is a global, market-based emissions offset program to encourage carbon-neutral grown beyond 2020. CORISA is scheduled to take effect by 2021. ICAO continues to develop details regarding implementation, but we believe compliance with CORSIA will increase our operating costs.
We could be adversely affected by an outbreak of a disease or an environmental disaster that significantly affects travel behavior.
Any outbreak of a disease affecting travel behavior could have a material adverse impact on airlines. In addition, outbreaks of disease could result in quarantines of our personnel or an inability to access facilities or our aircraft, which could adversely affect our operations. Similarly, if an environmental disaster were to occur and adversely impact any of our destination cities, travel behavior could be affected and in turn, could materially adversely impact our business.
None.
Aircraft
As of
December 31, 2017
, we operated a fleet consisting of
53
Airbus A321 aircraft,
130
Airbus A320 aircraft and
60
Embraer E190 aircraft as summarized below:
|
Aircraft
|
Seating Capacity
|
Owned
|
Capital Leased
|
Operating Leased
|
Total
|
Average Age in Years
|
|||||||||||||
|
Airbus A320
|
150
|
|
(1)
|
114
|
|
4
|
|
12
|
|
130
|
|
12.3
|
|
||||||
|
Airbus A321
|
200 / 159
|
|
(2)
|
49
|
|
2
|
|
2
|
|
53
|
|
1.9
|
|
||||||
|
Embraer E190
|
100
|
|
30
|
|
—
|
|
30
|
|
60
|
|
9.2
|
|
|||||||
|
193
|
|
6
|
|
44
|
|
243
|
|
9.2
|
|
||||||||||
(1) During
2017
, we completed the buyout of three of our aircraft leases.
(2) Our Airbus A321 with a single cabin layout has a seating capacity of 200 seats. Our Airbus A321 with our Mint
™
premium service has a seating capacity of 159 seats.
As of
December 31, 2017
, our aircraft leases had an average remaining term of approximately
6 years
, with expiration dates between
2018
and
2028
. We have the option to extend most of these leases for additional periods or to purchase the aircraft at the end of the related lease term. We have
74
owned aircraft subject to secured debt financing;
119
of our owned aircraft and
37
owned spare engines are unencumbered.
In July 2016, we amended our purchase agreement with Airbus by adding
30
incremental Airbus A321 aircraft deliveries between 2017 and 2023;
15
of these aircraft are scheduled to be A321ceo to be delivered between 2017 and 2019 and the remaining
15
are scheduled to be A321neos to be delivered between 2020 and 2023.
We amended our purchase agreement with Airbus in April 2017. The amendment changed the timing of several of our Airbus A321ceo and Airbus A321neo deliveries. We deferred eight A321neo deliveries from 2019 to 2023 and five from 2020 to 2024. We also moved up the delivery of three A321ceo aircraft from 2019 to 2018, while deferring three A321neo deliveries to 2019. We retain flexibility to make further changes in our order book. We have the option to take certain
A321neo deliveries with the long range configuration, the A321-LR.
As of
December 31, 2017
, we had
119
aircraft on order scheduled for delivery through
2024
. Our future aircraft delivery schedule is as follows:
25
|
Year
|
Airbus A320neo
|
Airbus A321ceo
|
Airbus A321neo
|
Embraer 190
|
Total
|
|||||
|
2018
|
—
|
10
|
—
|
—
|
10
|
|||||
|
2019
|
—
|
—
|
13
|
—
|
13
|
|||||
|
2020
|
6
|
—
|
7
|
10
|
23
|
|||||
|
2021
|
16
|
—
|
4
|
7
|
27
|
|||||
|
2022
|
3
|
—
|
17
|
7
|
27
|
|||||
|
2023
|
—
|
—
|
14
|
—
|
14
|
|||||
|
2024
|
—
|
—
|
5
|
—
|
5
|
|||||
|
Total
|
25
|
10
|
60
|
24
|
119
|
|||||
Ground Facilities
Airports
All of our facilities at the airports we serve are under leases or other occupancy agreements. This space is leased directly or indirectly from the local airport authority on varying terms dependent on prevailing practices at each airport. Our passenger terminal service facilities consisting of ticket counters, gate space, operations support area and baggage service offices generally have agreement terms ranging from less than one year to five years. They can contain provisions for periodic adjustments of rental rates, landing fees and other charges applicable under the type of lease. Under some of these agreements we are responsible for the maintenance, insurance, utilities and certain other facility-related expenses and services.
A summary of our most significant lease agreements are:
•
JFK -
We have a lease agreement with the PANYNJ for T5 and T5i. We have the option to terminate the agreement in 2033, five years prior to the end of the original scheduled lease term of October 2038. In December 2010, we executed a supplement to this lease agreement for the T6 property, our original base of operations at JFK, for a term of five years, which afforded us the exclusive right to develop on the T6 property. T5i, our expansion of T5 that we use as an international arrivals facility opened to Customers in November 2014. Another supplement of the original T5 lease was executed in 2013. The lease, as amended, now incorporates a total of approximately 19 acres of space for our T5 facilities.
•
Boston -
We had an initial five year lease agreement with Massport for five gates in Terminal C that started on May 1, 2005 and allowed JetBlue to grow to 11 gates by 2008. We negotiated an extension as of May 1, 2010 whereby the lease had 20 successive one-year automatic renewals, each from May 1 through to April 30. With the continued growth of our operations in Boston, we increased the number of leased gates from Massport to 16 and signed an amendment in May 2014 to lease an additional eight gates and related support spaces in Terminal C that were previously occupied by United Airlines. We further amended our lease in December 2017, which allows us to gradually lease up to six additional gates. and related support spaces. As of
December 31, 2017
, we leased 25 gates in Boston.
We have entered into use arrangements at each of the airports we serve providing for the non-exclusive use of runways, taxiways and other airport facilities. Landing fees under these agreements are typically based on the number of aircraft landings and the weight of the aircraft.
Other
We lease the following hangars and airport support facilities at our focus cities:
•
New York -
At JFK we have a ground lease agreement which expires in 2030 for an aircraft maintenance hangar, an adjacent office and warehouse facility, including a storage facility for aircraft parts. These facilities accommodate our technical support operations. We also lease a building from the PANYNJ which is mainly used for ground equipment maintenance work.
•
Boston -
We have a ground lease agreement which expires in 2022 for a building which includes an aircraft maintenance hangar and support space. We also have a lease for a facility to accommodate our ground support equipment maintenance.
•
Orlando -
We have a ground lease agreement for a hanger which expires in 2035. We also occupy a training center, JetBlue University, with a lease agreement expiring in 2035 which we use for the initial and recurrent training of our pilots and in-flight Crewmembers, as well as support training for our technical operations and airport Crewmembers. This facility is equipped with seven full flight simulators, ten cabin trainers, a training pool, classrooms and support areas. In 2015, we opened the Lodge at OSC which is adjacent to JetBlue University and is used for lodging our Crewmembers when they attend training.
26
Our primary corporate offices are located in Long Island City, New York with our lease expiring in 2023. Our offices in Salt Lake City, Utah contain a core team of Crewmembers who are responsible for group sales, customer service, at-home reservation agent supervision, disbursements and certain other finance functions. The lease for our Salt Lake City facility expires in 2022. We also maintain other facilities that are necessary to support our operations in the cities we serve.
In the ordinary course of our business, we are party to various legal proceedings and claims which we believe are incidental to the operation of our business. Other than as described under Note 11 to our consolidated financial statements included in Part II, Item 8 of this Annual Report on Form 10-K, we believe the ultimate outcome of these proceedings to which we are currently a party will not have a material adverse effect on our business, financial position, results of operations or cash flows.
Not applicable.
27
Market Information and Stockholder Matters
Our common stock is traded on the NASDAQ Global Select Market under the symbol JBLU. The table below shows the high and low closing prices for our common stock.
|
High
|
Low
|
|||||||
|
2017 Quarter Ended
|
||||||||
|
March 31
|
$
|
22.78
|
|
$
|
18.86
|
|
||
|
June 30
|
23.36
|
|
20.51
|
|
||||
|
September 30
|
23.75
|
|
18.25
|
|
||||
|
December 31
|
22.58
|
|
18.51
|
|
||||
|
2016 Quarter Ended
|
||||||||
|
March 31
|
$
|
23.37
|
|
$
|
19.34
|
|
||
|
June 30
|
21.33
|
|
15.15
|
|
||||
|
September 30
|
18.71
|
|
15.76
|
|
||||
|
December 31
|
22.79
|
|
16.93
|
|
||||
As of January 31, 2018, there were approximately 433 holders of record of our common stock.
We have not paid cash dividends on our common stock and have no current intention to do so. Any future determination to pay cash dividends would be at the discretion of our Board of Directors, subject to applicable limitations under Delaware law. This decision would be dependent upon our results of operations, financial condition and other factors deemed relevant by our Board of Directors.
Purchases of Equity Securities by the Issuer and Affiliated Purchases
In September 2015, the Board of Directors authorized a three year share repurchase program starting in 2016, of up to
$250 million
worth of JetBlue common stock. This authorization replaced our prior 2012 authorization. On
December 7, 2016
, the Board approved changes to our share repurchase program to increase the aggregate authorization to
$500 million
worth of JetBlue common stock, and extended the term of the program through
December 31, 2019
. The 2015 authorization was completed during the three months ended September 30, 2017 and no shares were repurchased during the three months ended December 2017.
On
December 8, 2017
, the Board of Directors approved a
two
year share repurchase authorization starting on
January 1, 2018
, of up to
$750 million
worth of JetBlue common stock. The authorization can be executed through repurchases in open market transactions pursuant to Rules 10b-18 and/or 10b5-1 of the Securities and Exchange Act of 1934, as amended, and/or one or more privately-negotiated accelerated stock repurchase transactions. We may adjust or change our share repurchase practices based on market conditions and other alternatives.
28
Stock Performance Graph
This performance graph shall not be deemed “filed” with the SEC or subject to Section 18 of the Exchange Act, nor shall it be deemed incorporated by reference in any of our filings under the Securities Act of 1933, as amended.
The following line graph compares the cumulative total stockholder return on our common stock with the cumulative total return of the Standard & Poor’s 500 Stock Index and the NYSE Arca Airline Index from December 31, 2013 to
December 31, 2017
. The comparison assumes the investment of $100 in our common stock and in each of the foregoing indices and reinvestment of all dividends. The stock performance shown represents historical performance and is not representative of future stock performance.
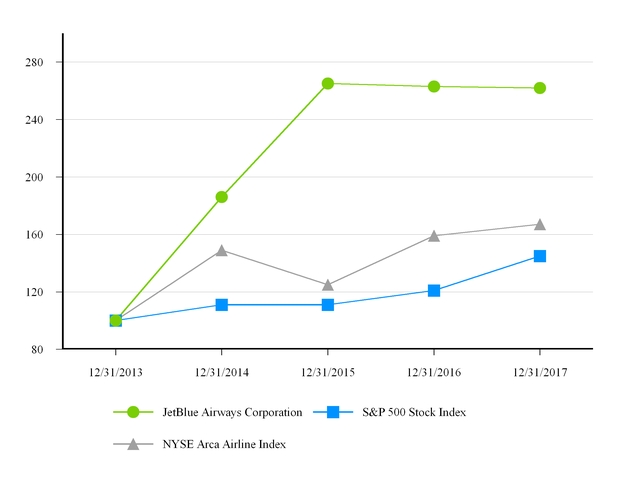
|
12/31/2013
|
12/31/2014
|
12/31/2015
|
12/31/2016
|
12/31/2017
|
||||||||||||||||
|
JetBlue Airways Corporation
|
$
|
100
|
|
$
|
186
|
|
$
|
265
|
|
$
|
263
|
|
$
|
262
|
|
|||||
|
S&P 500 Stock Index
|
100
|
|
111
|
|
111
|
|
121
|
|
145
|
|
||||||||||
|
NYSE Arca Airline Index
|
100
|
|
149
|
|
125
|
|
159
|
|
167
|
|
||||||||||
29
The following financial information for each of the prior five years ending on
December 31
has been derived from our consolidated financial statements. This information should be read in conjunction with the consolidated financial statements and related notes thereto included elsewhere in this Report.
|
(in millions except per share data)
|
2017
|
2016
|
2015
|
2014
|
2013
|
|||||||||||||||
|
Statements of Operations Data
|
||||||||||||||||||||
|
Operating revenues
|
$
|
7,015
|
|
$
|
6,632
|
|
$
|
6,416
|
|
$
|
5,817
|
|
$
|
5,441
|
|
|||||
|
Operating expenses:
|
||||||||||||||||||||
|
Aircraft fuel and related taxes
|
1,363
|
|
1,074
|
|
1,348
|
|
1,912
|
|
1,899
|
|
||||||||||
|
Salaries, wages and benefits
|
1,887
|
|
1,698
|
|
1,540
|
|
1,294
|
|
1,135
|
|
||||||||||
|
Landing fees and other rents
|
397
|
|
357
|
|
342
|
|
321
|
|
305
|
|
||||||||||
|
Depreciation and amortization
|
446
|
|
393
|
|
345
|
|
320
|
|
290
|
|
||||||||||
|
Aircraft rent
|
100
|
|
110
|
|
122
|
|
124
|
|
128
|
|
||||||||||
|
Sales and marketing
|
267
|
|
259
|
|
264
|
|
231
|
|
223
|
|
||||||||||
|
Maintenance, materials and repairs
|
622
|
|
563
|
|
490
|
|
418
|
|
432
|
|
||||||||||
|
Other operating expenses
|
933
|
|
866
|
|
749
|
|
682
|
|
601
|
|
||||||||||
|
Total operating expenses
|
6,015
|
|
5,320
|
|
5,200
|
|
5,302
|
|
5,013
|
|
||||||||||
|
Operating income
|
1,000
|
|
1,312
|
|
1,216
|
|
515
|
|
428
|
|
||||||||||
|
Other income (expense)
(1)
|
(79
|
)
|
(96
|
)
|
(119
|
)
|
108
|
|
(149
|
)
|
||||||||||
|
Income before income taxes
|
921
|
|
1,216
|
|
1,097
|
|
623
|
|
279
|
|
||||||||||
|
Income tax expense (benefit)
(2)
|
(226
|
)
|
457
|
|
420
|
|
222
|
|
111
|
|
||||||||||
|
Net income
|
$
|
1,147
|
|
$
|
759
|
|
$
|
677
|
|
$
|
401
|
|
$
|
168
|
|
|||||
|
Earnings per common share:
|
||||||||||||||||||||
|
Basic
|
$
|
3.49
|
|
$
|
2.32
|
|
$
|
2.15
|
|
$
|
1.36
|
|
$
|
0.59
|
|
|||||
|
Diluted
(2)
|
$
|
3.47
|
|
$
|
2.22
|
|
$
|
1.98
|
|
$
|
1.19
|
|
$
|
0.52
|
|
|||||
|
Other Financial Data:
|
||||||||||||||||||||
|
Operating margin
|
14.3
|
%
|
19.8
|
%
|
19.0
|
%
|
8.9
|
%
|
7.9
|
%
|
||||||||||
|
Pre-tax margin
(1)
|
13.1
|
%
|
18.3
|
%
|
17.1
|
%
|
10.7
|
%
|
5.1
|
%
|
||||||||||
|
Ratio of earnings to fixed charges
|
6.23x
|
|
7.03x
|
|
5.71x
|
|
3.59x
|
|
2.05x
|
|
||||||||||
|
Net cash provided by operating activities
|
$
|
1,398
|
|
$
|
1,632
|
|
$
|
1,598
|
|
$
|
912
|
|
$
|
758
|
|
|||||
|
Net cash used in investing activities
|
(975
|
)
|
(1,045
|
)
|
(1,134
|
)
|
(379
|
)
|
(476
|
)
|
||||||||||
|
Net cash used in financing activities
|
(553
|
)
|
(472
|
)
|
(487
|
)
|
(417
|
)
|
(239
|
)
|
||||||||||
(1) In 2014, we had a gain of $241 million from the sale of LiveTV. Pre-tax margin excluding the gain on the sale of LiveTV is 6.6%.
(2) Our 2017 results include a $570 million tax benefit, or $1.72 of diluted earnings per share, from the remeasurement of our deferred taxes to reflect the impact of the enactment of the Tax Cuts and Jobs Act of 2017.
30
|
(in millions)
|
2017
|
2016
|
2015
|
2014
|
2013
|
|||||||||||||||
|
Balance Sheet Data:
|
||||||||||||||||||||
|
Cash and cash equivalents
|
$
|
303
|
|
$
|
433
|
|
$
|
318
|
|
$
|
341
|
|
$
|
225
|
|
|||||
|
Investment securities
|
392
|
|
628
|
|
607
|
|
427
|
|
516
|
|
||||||||||
|
Total assets
(1)
|
9,781
|
|
9,323
|
|
8,499
|
|
7,643
|
|
7,203
|
|
||||||||||
|
Total long-term debt and capital leases
|
1,199
|
|
1,384
|
|
1,827
|
|
2,211
|
|
2,558
|
|
||||||||||
|
Common stockholders’ equity
|
4,834
|
|
4,013
|
|
3,210
|
|
2,529
|
|
2,134
|
|
||||||||||
|
2017
|
2016
|
2015
|
2014
|
2013
|
||||||||||||||||
|
Operating Statistics:
|
||||||||||||||||||||
|
Revenue passengers (thousands)
|
40,038
|
|
38,263
|
|
35,101
|
|
32,078
|
|
30,463
|
|
||||||||||
|
Revenue passenger miles (millions)
|
47,240
|
|
45,619
|
|
41,711
|
|
37,813
|
|
35,836
|
|
||||||||||
|
Available seat miles (ASMs) (millions)
|
56,007
|
|
53,620
|
|
49,258
|
|
44,994
|
|
42,824
|
|
||||||||||
|
Load factor
|
84.3
|
%
|
85.1
|
%
|
84.7
|
%
|
84.0
|
%
|
83.7
|
%
|
||||||||||
|
Aircraft utilization (hours per day)
|
11.7
|
|
12.0
|
|
11.9
|
|
11.8
|
|
11.9
|
|
||||||||||
|
Average fare
|
$
|
157.07
|
|
$
|
157.14
|
|
$
|
167.89
|
|
$
|
166.57
|
|
$
|
163.19
|
|
|||||
|
Yield per passenger mile (cents)
|
13.31
|
|
13.18
|
|
14.13
|
|
14.13
|
|
13.87
|
|
||||||||||
|
Passenger revenue per ASM (cents)
|
11.23
|
|
11.21
|
|
11.96
|
|
11.88
|
|
11.61
|
|
||||||||||
|
Operating revenue per ASM (cents)
|
12.53
|
|
12.37
|
|
13.03
|
|
12.93
|
|
12.71
|
|
||||||||||
|
Operating expense per ASM (cents)
|
10.74
|
|
9.92
|
|
10.56
|
|
11.78
|
|
11.71
|
|
||||||||||
|
Operating expense per ASM, excluding fuel
(2)
|
8.30
|
|
7.92
|
|
7.82
|
|
7.53
|
|
7.28
|
|
||||||||||
|
Departures
|
353,681
|
|
337,302
|
|
316,505
|
|
294,800
|
|
282,133
|
|
||||||||||
|
Average stage length (miles)
|
1,072
|
|
1,093
|
|
1,092
|
|
1,088
|
|
1,090
|
|
||||||||||
|
Average number of operating aircraft during period
|
233.5
|
|
218.9
|
|
207.9
|
|
196.2
|
|
185.2
|
|
||||||||||
|
Average fuel cost per gallon, including fuel taxes
|
$
|
1.72
|
|
$
|
1.41
|
|
$
|
1.93
|
|
$
|
2.99
|
|
$
|
3.14
|
|
|||||
|
Fuel gallons consumed (millions)
|
792
|
|
760
|
|
700
|
|
639
|
|
604
|
|
||||||||||
|
Average number of full-time equivalent Crewmembers
(3)
|
17,118
|
|
15,696
|
|
14,537
|
|
13,280
|
|
12,447
|
|
||||||||||
(1)
Retrospective application to all prior periods as required under ASU 2015-17
Income Taxes, Balance Sheet Classification of Deferred Taxes.
See Note 1 to the Consolidated Financial Statements for additional information.
(2)
Refer to our “Regulation G Reconciliation” section for more information on this non-GAAP measure.
(3)
Excludes results of operations and employees of LiveTV, LLC, which were unrelated to our airline operations and are immaterial to our consolidated operating results. As of June 10, 2014, employees of LiveTV, LLC were no longer part of JetBlue.
31
Glossary of Airline terminology
Airline terminology used in this section and elsewhere in this Report:
•
Aircraft utilization -
The average number of block hours operated per day per aircraft for the total fleet of aircraft.
•
Available seat miles -
The number of seats available for passengers multiplied by the number of miles the seats are flown.
•
Average fare -
The average one-way fare paid per flight segment by a revenue passenger.
•
Average fuel cost per gallon -
Total aircraft fuel costs, including fuel taxes and effective portion of fuel hedging, divided by the total number of fuel gallons consumed.
•
Average stage length -
The average number of miles flown per flight.
•
Load factor -
The percentage of aircraft seating capacity actually utilized, calculated by dividing revenue passenger miles by available seat miles.
•
Operating expense per available seat mile -
Operating expenses divided by available seat miles.
•
Operating expense per available seat mile, excluding fuel -
Operating expenses, less aircraft fuel and other non-airline expenses, divided by available seat miles.
•
Operating revenue per available seat mile -
Operating revenues divided by available seat miles.
•
Passenger revenue per available seat mile -
Passenger revenue divided by available seat miles.
•
Revenue passengers -
The total number of paying passengers flown on all flight segments.
•
Revenue passenger miles -
The number of miles flown by revenue passengers.
•
Yield per passenger mile -
The average amount one passenger pays to fly one mile.
32
OVERVIEW
In
2017
, we experienced the persistent competitiveness of the airline industry. Even with these external factors,
2017
was one of the most profitable years in our history. We generated operating revenue growth of almost
5.8%
year-over-year. We remain committed to striving to deliver a safe and reliable JetBlue Experience for our Customers and increasing returns for our Shareholders. We believe our continued focus on cost discipline, product innovation and network enhancements, combined with our commitment to service excellence, will drive our future success.
2017
Highlights
•
We generated over
$7.0 billion
in operating revenue, an increase of
$383 million
compared to
2016
due primarily to a
4.6%
increase
in revenue passengers.
•
Our earnings per diluted share were
$3.47
, including a benefit from tax reform of $570 million or $1.72.
•
We generated
$1.4 billion
in cash from operations. The significant amount of cash we generated provided the opportunity to pay cash for all 2017 aircraft deliveries, buy out
three
aircraft leases, reduce existing debt balances and execute share repurchases.
•
Operating expenses per available seat mile
increase
d
8.2%
to
10.74
cents, primarily driven by an increase in aircraft fuel expenses. Excluding fuel and related taxes, as well as operating expenses related to our non-airline operations, our cost per available seat mile
increase
d
4.8%
in
2017
. Effective January 1, 2017, non-management profit sharing eligible Crewmembers received an 8% raise and a modified profit sharing plan. We believe this recognition and change to our compensation structure reflects industry trends and ensures that our Crewmember compensation and rewards are fair and competitive.
Company Initiatives
We ended the year with unrestricted cash, cash equivalents and short-term investments of
$693 million
and undrawn lines of credit of approximately $625 million. In June 2017, Moody's Investor Service upgraded our debt rating to Ba1 from Ba3 with a stable outlook reflecting the strength of our financial position. In November 2017, Standard & Poor's Rating Services upgraded our debt rating to BB from BB- with a stable outlook. At December 31,
2017
, unrestricted cash, cash equivalents and short-term investments was approximately
10%
of trailing twelve months revenue. We reduced our overall debt and capital lease obligations by
$185 million
. As a result,
three
aircraft became unencumbered. We increased the number of unencumbered aircraft in
2017
bringing total unencumbered aircraft to
119
and spare engines to
37
as of
December 31, 2017
. During
2017
, we acquired approximately
18.7 million
shares of our common stock for approximately
$380 million
under our share repurchase program.
Aircraft and Airport Infrastructure Investments
During 2017, we took delivery of 16 Airbus A321 aircraft, all of which were purchased with cash.
In November 2015, we unveiled Phase I of our $50 million Terminal C upgrade at Boston Logan International Airport. This upgrade included new kiosks and ticket counters. At December 31, 2017 twenty-five kiosks and thirty check-in counters were in use in the North Pod of the terminal. Phase II of the upgrade, funded by the Massachusetts Port Authority, or Massport, was completed on the South Pod in 2016, mirroring the check-in experience of the North Pod. Updated digital flight information displays and a connector between Terminal C and international flights at Terminal E were also completed during 2016.
We introduced self-tagging kiosks to nine BlueCities in 2017: Boston, Newark, Atlanta, Long Beach, Los Angeles, Buffalo, Jacksonville, Orlando and La Guardia. These kiosks helped streamline the airport experience for our Customers and we plan to continue the improvements to other BlueCities in 2018.
Network
As part of our ongoing network initiatives and route optimization efforts, we continued to make schedule and frequency adjustments throughout
2017
. During 2017, we added Atlanta to our growing network. Due to the unprecedented weather in Puerto Rico and throughout the Caribbean, we temporarily redeployed inbound leisure flying to other destinations. We expect to return to a full operation by the end of 2018. We will also continue to watch booking trends closely and expect to adjust our plans as needed. We also added new routes between existing BlueCities.
33
Outlook for
2018
We believe we will improve our long term return for Shareholders as we implement our structural cost initiatives. We plan to add new destinations and route pairings based upon market demand. We are continuously looking to expand our other ancillary revenue opportunities, improve our TrueBlue
®
loyalty program and deepen our portfolio of commercial partnerships. As in the past, we intend to invest in infrastructure and product enhancements, which we believe will enable us to reap future benefits. We also plan to continue to strengthening the balance sheet.
We will adopt the requirements of ASU 2014-09,
Revenue from Contracts with Customers
topic of the Codification, as of January 1, 2018 utilizing the full retrospective method of transition. Please see Note 1 on the specific changes related to revenue recognition.
The Tax Cuts and Jobs Act of 2017, or The Act, was enacted on December 22, 2017. The Act made significant changes to the Federal tax code, including a reduction in the Federal corporate statutory rate from 35% to 21%. The Act also made changes to the Federal taxation of foreign earnings, to the timing of recognition of certain revenue and expenses, and the deductibility of certain business expenses. During 2018, the Company will continue to gain a more thorough understanding of The Act and additional regulatory guidance that may be issued. As a result of The Act, we expect the reduction in the corporate tax rate will result in an effective annual tax rate for JetBlue between 24% to 26%. However, the actual tax rate could differ due to a number of factors.
For the full year
2018
, we estimate our operating capacity will increase by approximately 6.5% to 8.5% over
2017
with the addition of
10
Airbus A321 aircraft to our operating fleet. We are expecting our cost per available seat mile, excluding fuel and related taxes, and operating expenses related to other non-airline expenses, for
2018
to increase by between approximately (1.0)% to 1.0% over the level in
2017
.
34
RESULTS OF OPERATIONS
Year
2017
compared to Year
2016
Overview
We reported net income of
$1.1 billion
, operating income of
$1.0 billion
and operating margin of
14.3%
for the
year ended December 31, 2017
. This compares to net income of
$759 million
, operating income of
$1,312 million
and operating margin of
19.8%
for the
year ended December 31, 2016
. Diluted earnings per share were
$3.47
for
2017
compared to
$2.22
for the same period in
2016
. This included a benefit from tax reform of $570 million or $1.72 per share.
Approximately 75% of our operations are centered in and around the heavily populated northeast corridor of the U.S., which includes the New York and Boston metropolitan areas. During the third quarter of 2017, we saw unprecedented weather challenges for JetBlue and the entire airline industry, with two large hurricanes impacting our network. We estimate that, due to the severe hurricane season, revenue was negatively impacted by approximately $110 million for the full year 2017. Revenue per available seat mile (RASM) was negatively impacted by approximately 0.3 points for the full year by the hurricanes. Operating income was negatively impacted by approximately $82 million.
Operating Revenues
|
(revenues in millions; percent changes based on unrounded numbers)
|
Year-over-Year Change
|
||||||||||||||
|
2017
|
2016
|
$
|
%
|
||||||||||||
|
Passenger revenue
|
$
|
6,288
|
|
$
|
6,013
|
|
275
|
|
4.6
|
|
|||||
|
Other revenue
|
727
|
|
619
|
|
108
|
|
17.3
|
|
|||||||
|
Operating revenues
|
7,015
|
|
6,632
|
|
383
|
|
5.8
|
|
|||||||
|
Average fare
|
$
|
157.07
|
|
$
|
157.14
|
|
(0.08
|
)
|
—
|
|
|||||
|
Yield per passenger mile (cents)
|
13.31
|
|
13.18
|
|
0.13
|
|
1.0
|
|
|||||||
|
Passenger revenue per ASM (cents)
|
11.23
|
|
11.21
|
|
0.02
|
|
0.1
|
|
|||||||
|
Operating revenue per ASM (cents)
|
12.53
|
|
12.37
|
|
0.16
|
|
1.3
|
|
|||||||
|
Average stage length (miles)
|
1,072
|
|
1,093
|
|
(21
|
)
|
(1.9
|
)
|
|||||||
|
Revenue passengers (thousands)
|
40,038
|
|
38,263
|
|
1,775
|
|
4.6
|
|
|||||||
|
Revenue passenger miles (millions)
|
47,240
|
|
45,619
|
|
1,621
|
|
3.6
|
|
|||||||
|
Available seat miles (ASMs) (millions)
|
56,007
|
|
53,620
|
|
2,387
|
|
4.5
|
|
|||||||
|
Load factor
|
84.3
|
%
|
85.1
|
%
|
(0.8
|
)
|
pts
|
||||||||
Passenger revenue accounted for
89.6%
of our total operating revenue for the year ended
December 31, 2017
. In addition to seat revenue, passenger revenue includes revenue from our ancillary product offerings such as EvenMore
™
Space. Revenue generated from international routes, including Puerto Rico, accounted for
28.7%
of our passenger revenues in
2017
. Revenue is recognized either when transportation is provided or after the ticket or customer credit expires. We measure capacity in terms of available seat miles, which represents the number of seats available for passengers multiplied by the number of miles the seats are flown. Yield, or the average amount one passenger pays to fly one mile, is calculated by dividing Passenger revenue by Revenue passenger miles. We attempt to increase Passenger revenue primarily by increasing our yield per flight which produces higher revenue per available seat mile. Our objective is to optimize our fare mix to increase our overall average fare while continuing to provide our Customers with competitive fares.
In
2017
, the
increase
in Passenger revenue was mainly attributable to a
4.6%
increase
in revenue passengers. Our largest ancillary product remains the EvenMore
™
Space seats, generating approximately $246 million in revenue, an increase of over 3% compared to
2016
.
The primary component of Other revenue is fees from reservation changes and excess baggage charged to Customers in accordance with our published policies. We also include the marketing component of TrueBlue
®
point sales, onboard product sales, ground handling fees of other airlines and rental income.
35
Operating Expenses
|
(in millions; per ASM data in cents; percentages based on unrounded numbers)
|
Year-over-Year Change
|
per ASM
|
||||||||||||||||||||||
|
2017
|
2016
|
$
|
%
|
2017
|
2016
|
% Change
|
||||||||||||||||||
|
Aircraft fuel and related taxes
|
$
|
1,363
|
|
$
|
1,074
|
|
$
|
289
|
|
26.9
|
|
2.43
|
|
2.00
|
|
21.5
|
|
|||||||
|
Salaries, wages and benefits
|
1,887
|
|
1,698
|
|
189
|
|
11.1
|
|
3.37
|
|
3.17
|
|
6.4
|
|
||||||||||
|
Landing fees and other rents
|
397
|
|
357
|
|
40
|
|
11.1
|
|
0.71
|
|
0.67
|
|
6.3
|
|
||||||||||
|
Depreciation and amortization
|
446
|
|
393
|
|
53
|
|
13.7
|
|
0.80
|
|
0.73
|
|
8.9
|
|
||||||||||
|
Aircraft rent
|
100
|
|
110
|
|
(10
|
)
|
(9.0
|
)
|
0.18
|
|
0.21
|
|
(12.9
|
)
|
||||||||||
|
Sales and marketing
|
267
|
|
259
|
|
8
|
|
2.9
|
|
0.48
|
|
0.48
|
|
(1.5
|
)
|
||||||||||
|
Maintenance, materials and repairs
|
622
|
|
563
|
|
59
|
|
10.5
|
|
1.11
|
|
1.04
|
|
5.8
|
|
||||||||||
|
Other operating expenses
|
933
|
|
866
|
|
67
|
|
7.6
|
|
1.66
|
|
1.62
|
|
3.0
|
|
||||||||||
|
Total operating expenses
|
$
|
6,015
|
|
$
|
5,320
|
|
$
|
695
|
|
13.1
|
|
10.74
|
|
9.92
|
|
8.2
|
|
|||||||
Aircraft Fuel and Related Taxes
Aircraft fuel and related taxes represented
23%
of our total operating expenses in
2017
compared to
20%
in
2016
. The average fuel price
increase
d
21.8%
in
2017
to
$1.72
per gallon. This was coupled with an
increase
in our fuel consumption of approximately
32 million
gallons. Additional fuel consumption was mainly due to our increase in capacity. Based on our expected fuel volume for
2018
, a 10% per gallon increase in the cost of aircraft fuel would increase our annual fuel expense by approximately
$170 million
.
In
2017
, we recorded fuel hedge gains of
$15 million
compared to
$9 million
in fuel hedge gains in
2016
which were recorded in Aircraft fuel and related taxes. We did not have any fuel hedging contracts outstanding as of December 31, 2017.
Salaries, Wages and Benefits
Salaries, wages and benefits represent approximately
31%
of our total operating expenses in
2017
compared to
32%
in
2016
. The increase in salaries, wages and benefits was primarily driven by an increase in our Crewmember headcount and an 8% raise for profit sharing eligible Crewmembers effective January 1, 2017 and a modified profit sharing plan.
Our profit sharing is calculated as
10%
of adjusted pre-tax income, reduced by
Retirement Plus
contributions and special items. Profit sharing
decrease
d by
$133 million
in
2017
compared to
2016
, primarily driven by our change in policy. During
2017
, the average number of full-time equivalent Crewmembers increased by
9%
and the average tenure of our Crewmembers was 6.6 years.
Retirement Plus
contributions, which equate to
5%
of all of our eligible Crewmembers wages,
increase
d by
$13 million
and our
3%
retirement contribution for a certain portion of our FAA-licensed Crewmembers, which we refer to as
Retirement Advantage,
increase
d by approximately
$3 million
. The increasing tenure of our Crewmembers, rising healthcare costs and efforts to maintain competitiveness in our overall compensation packages will continue to pressure our costs in
2018
.
Landing Fees and Other Rents
Landing fees and other rents include landing fees, which are at a premium in the heavily trafficked northeast corridor of the U.S. where approximately 75% of our operations center. Other rents primarily consist of rent for airports in our
101
BlueCities. Landing fees and other rents
increase
d
$40 million
, or
11.1%
, in
2017
primarily due to our increased departures.
Depreciation and Amortization
Depreciation and amortization primarily include depreciation for our owned and capital leased aircraft, engines, and in-flight entertainment systems. Depreciation and amortization
increase
d
$53 million
, or
13.7%
, primarily driven by a
6.7%
increase in the average number of aircraft operating in 2017 compared to the same period in 2016.
Maintenance, Materials and Repairs
Maintenance, materials and repairs are generally expensed when incurred unless covered by a long-term flight hour services contract. The average age of our aircraft in
2017
was
9.2
years which is relatively young compared to our competitors. However, as our fleet ages our maintenance costs will increase significantly, both on an absolute basis and as a percentage of our unit costs, as older aircraft require additional, more expensive repairs over time. We had an average of
14.6
additional total operating aircraft in
2017
compared to
2016
.
36
In
2017
, Maintenance, materials and repairs
increase
d by
$59 million
, or
10.5%
compared to
2016
, primarily driven by increased flight hours on our engine flight-hour based maintenance repair agreements and by the number of airframe heavy maintenance repairs.
Other Operating Expenses
Other operating expenses consist of the following categories: outside services (including expenses related to fueling, ground handling, skycap, security and janitorial services), insurance, personnel expenses, professional fees, onboard supplies, shop and office supplies, bad debts, communication costs and taxes other than payroll and fuel taxes.
In
2017
, Other operating expenses
increase
d by
$67 million
, or
7.6%
, compared to
2016
, primarily due to an increase in airport services and passenger onboard supplies resulting from an increased number of passengers flown.
Income Taxes
Our effective tax rate was a benefit of
24.5%
in
2017
, compared to our effective tax rate of
37.6%
in
2016
. Our effective tax rate decreased primarily due to a one-time benefit of $570 million from the remeasurement of our deferred taxes to reflect the enactment of the Tax Cuts and Jobs Act of 2017.
37
Year
2016
compared to Year
2015
Overview
We reported net income of
$759 million
, operating income of
$1,312 million
and operating margin of
19.8%
for the
year ended December 31, 2016
. This compares to net income of
$677 million
, operating income of
$1,216 million
and operating margin of
19.0%
for the
year ended December 31, 2015
. Diluted earnings per share were
$2.22
for
2016
compared to
$1.98
for the same period in
2015
.
Approximately 77% of our operations are centered in and around the heavily populated northeast corridor of the U.S., which includes the New York and Boston metropolitan areas. During the first quarter of 2015, a series of winter storms impacted the New York and Boston metropolitan areas, with Boston’s Logan Airport experiencing record breaking snowfall totals. Despite the adverse weather conditions, our operational performance improved over prior years with fewer flight cancellations. We estimate that winter storms reduced our operating income by approximately $10 million in the first quarter of 2015.
Operating Revenues
|
(revenues in millions; percent changes based on unrounded numbers)
|
Year-over-Year Change
|
|||||||||||||||
|
2016
|
2015
|
$
|
%
|
|||||||||||||
|
Passenger revenue
|
$
|
6,013
|
|
$
|
5,893
|
|
$
|
120
|
|
2.0
|
|
|||||
|
Other revenue
|
619
|
|
523
|
|
96
|
|
18.5
|
|
||||||||
|
Operating revenues
|
6,632
|
|
6,416
|
|
216
|
|
3.4
|
|
||||||||
|
Average fare
|
$
|
157.14
|
|
$
|
167.89
|
|
$
|
(10.75
|
)
|
(6.4
|
)
|
|||||
|
Yield per passenger mile (cents)
|
13.18
|
|
14.13
|
|
(0.95
|
)
|
(6.7
|
)
|
||||||||
|
Passenger revenue per ASM (cents)
|
11.21
|
|
11.96
|
|
(0.75
|
)
|
(6.3
|
)
|
||||||||
|
Operating revenue per ASM (cents)
|
12.37
|
|
13.03
|
|
(0.66
|
)
|
(5.0
|
)
|
||||||||
|
Average stage length (miles)
|
1,093
|
|
1,092
|
|
1
|
|
0.1
|
|
||||||||
|
Revenue passengers (thousands)
|
38,263
|
|
35,101
|
|
3,162
|
|
9.0
|
|
||||||||
|
Revenue passenger miles (millions)
|
45,619
|
|
41,711
|
|
3,908
|
|
9.4
|
|
||||||||
|
Available seat miles (ASMs) (millions)
|
53,620
|
|
49,258
|
|
4,362
|
|
8.9
|
|
||||||||
|
Load factor
|
85.1
|
%
|
84.7
|
%
|
0.4
|
|
pts
|
|||||||||
Passenger revenue accounted for over
90.7%
of our total operating revenues for the
year ended December 31, 2016
. In addition to seat revenue, passenger revenue includes revenue from our ancillary product offerings such as EvenMore
™
Space. Revenue generated from international routes, including Puerto Rico, accounted for 28.4% of our passenger revenues in
2016
. Revenue is recognized either when transportation is provided or after the ticket or passenger credit expires. We measure capacity in terms of available seat miles, which represents the number of seats available for passengers multiplied by the number of miles the seats are flown. Yield, or the average amount one passenger pays to fly one mile, is calculated by dividing Passenger revenue by Revenue passenger miles. We attempt to increase Passenger revenue primarily by increasing our yield per flight which produces higher Revenue per available seat mile. Our objective is to optimize our fare mix to increase our overall average fare while continuing to provide our Customers with competitive fares.
In
2016
, the increase in Passenger revenue was mainly attributable to a
9.0%
increase
in revenue passengers and a
6.4%
decrease
in average fare. Our largest ancillary product was EvenMore
™
Space, generating approximately $238 million in revenue, an increase of over 4% compared to
2015
.
The primary component of Other revenue is the fees from reservation changes and excess baggage charged to Customers in accordance with our published policies. We also include the marketing component of TrueBlue® point sales, onboard product sales, charters, ground handling fees of other airlines and rental income.
In
2016
, Other revenue
increase
d by
$96 million
compared to
2015
. The
increase
in Other revenue was primarily due to an increase in bag fees partly attributable to a full year of our Fare Options pricing structure compared to half a year during 2015.
38
Operating Expenses
|
(in millions; per ASM data in cents; percentages based on unrounded numbers)
|
Year-over-Year Change
|
per ASM
|
||||||||||||||||||||||
|
2016
|
2015
|
$
|
%
|
2016
|
2015
|
% Change
|
||||||||||||||||||
|
Aircraft fuel and related taxes
|
$
|
1,074
|
|
$
|
1,348
|
|
(274
|
)
|
(20.3
|
)
|
2.00
|
|
2.74
|
|
(26.8
|
)
|
||||||||
|
Salaries, wages and benefits
|
1,698
|
|
1,540
|
|
158
|
|
10.2
|
|
3.17
|
|
3.13
|
|
1.2
|
|
||||||||||
|
Landing fees and other rents
|
357
|
|
342
|
|
15
|
|
4.3
|
|
0.67
|
|
0.70
|
|
(4.2
|
)
|
||||||||||
|
Depreciation and amortization
|
393
|
|
345
|
|
48
|
|
13.9
|
|
0.73
|
|
0.70
|
|
4.7
|
|
||||||||||
|
Aircraft rent
|
110
|
|
122
|
|
(12
|
)
|
(9.6
|
)
|
0.21
|
|
0.25
|
|
(17.0
|
)
|
||||||||||
|
Sales and marketing
|
259
|
|
264
|
|
(5
|
)
|
(1.7
|
)
|
0.48
|
|
0.54
|
|
(9.7
|
)
|
||||||||||
|
Maintenance, materials and repairs
|
563
|
|
490
|
|
73
|
|
14.9
|
|
1.04
|
|
0.99
|
|
5.6
|
|
||||||||||
|
Other operating expenses
|
866
|
|
749
|
|
117
|
|
15.7
|
|
1.62
|
|
1.51
|
|
6.3
|
|
||||||||||
|
Total operating expenses
|
$
|
5,320
|
|
$
|
5,200
|
|
$
|
120
|
|
2.3
|
|
9.92
|
|
10.56
|
|
(6.0
|
)
|
|||||||
Aircraft Fuel and Related Taxes
Aircraft fuel and related taxes represented
20%
of our total operating expenses in
2016
compared to
26%
in
2015
. The average fuel price
decrease
d
26.9%
in
2016
to
$1.41
per gallon. This was partially offset by an
increase
in our fuel consumption of approximately
60 million
gallons. Additional fuel consumption was mainly due to our increase in capacity.
In
2016
, we recorded fuel hedge gains of
$9 million
compared to
$126 million
in fuel hedge losses in
2015
which was recorded in Aircraft fuel and related taxes. We are unable to predict what the amount of ineffectiveness will be related to these instruments, or the potential loss of hedge accounting which is determined on a derivative-by-derivative basis, due to the volatility in the forward markets for these commodities.
Salaries, Wages and Benefits
Salaries, wages and benefits represented approximately
32%
of our total operating expenses in
2016
compared to
30%
in
2015
. The increase in salaries, wages and benefits was primarily driven by profit sharing and an increase in our Crewmember headcount.
Our profit sharing was calculated as
15%
of adjusted pre-tax income, reduced by
Retirement Plus
contributions and special items. Profit sharing
increase
d by
$25 million
in
2016
compared to
2015
, primarily driven by lower aircraft fuel and related taxes and increased revenues. During
2016
, the average number of full-time equivalent Crewmembers
increase
d by
8%
and the average tenure of our Crewmembers was 6.3 years.
Retirement Plus
contributions, which equate to
5%
of all of our eligible Crewmembers wages,
increase
d by
$4 million
and our
3%
retirement contribution for a certain portion of our FAA-licensed Crewmembers, which we refer to as
Retirement Advantage,
increase
d by approximately $1 million.
Landing Fees and Other Rents
Landing fees and other rents include landing fees, which are at a premium in the heavily trafficked northeast corridor of the U.S. where approximately 77% of our operations centered in 2016. Other rents primarily consisted of rent for airports in our 100 BlueCities. Landing fees and other rents
increase
d
$15 million
, or
4.3%
, in
2016
primarily due to increased departures.
Depreciation and Amortization
Depreciation and amortization primarily include depreciation for our owned and capital leased aircraft, engines, and in-flight entertainment systems. Depreciation and amortization
increase
d
$48 million
, or
13.9%
, primarily due to our ten owned A321 deliveries during 2016 resulting in an average of 160 owned and capital leased aircraft in 2016 compared to 149 in 2015.
Maintenance, Materials and Repairs
Maintenance, materials and repairs are generally expensed when incurred unless covered by a long-term flight hour services contract. The average age of our aircraft in
2016
was 8.9 years which was relatively young compared to our competitors. We had an average of
11
additional total operating aircraft in
2016
compared to
2015
. In
2016
, Maintenance, materials and repairs
increase
d by
$73 million
, or
14.9%
compared to
2015
, primarily driven by increased flight hours on our engine flight-hour based maintenance repair agreements and by the number of airframe heavy maintenance repairs.
39
Other Operating Expenses
Other operating expenses consist of the following categories: outside services (including expenses related to fueling, ground handling, skycap, security and janitorial services), insurance, personnel expenses, professional fees, onboard supplies, shop and office supplies, bad debts, communication costs and taxes other than payroll and fuel taxes.
In
2016
, Other operating expenses
increase
d by
$117 million
, or
15.7%
, compared to
2015
, primarily due to an increase in airport services and the non-recurrence of the $9 million gain in 2015 related to an insurance recovery for a damaged engine, a $6 million legal settlement and a $6 million gain on sale of an engine.
Income Taxes
Our effective tax rate was
37.6%
in
2016
and
38.3%
in
2015
. Our effective tax rate decreased primarily due to the adoption of Accounting Standards Update, or ASU, 2016-09, Improvements to Employee Share-Based Payment Accounting.
LIQUIDITY AND CAPITAL RESOURCES
The airline business is capital intensive. Our ability to successfully execute our profitable growth plans is largely dependent on the continued availability of capital on attractive terms. In addition, our ability to successfully operate our business depends on maintaining sufficient liquidity. We believe we have adequate resources from a combination of cash and cash equivalents, investment securities on-hand and two available lines of credit. Additionally, as of
December 31, 2017
, we had
119
unencumbered aircraft and
37
unencumbered spare engines which we believe could be an additional source of liquidity, if necessary.
We believe a healthy liquidity position is a crucial element of our ability to weather any part of the economic cycle while continuing to execute on our plans for profitable growth and increased returns. Our goal is to continue to be diligent with our liquidity, maintaining financial flexibility and allowing for prudent capital spending.
As of
December 31, 2017
, we had unrestricted cash and cash equivalents of
$303 million
and short-term investments of
$390 million
. We believe our current level of unrestricted cash, cash equivalents and short-term investments of approximately
10%
of trailing twelve months revenue, combined with our approximately
$625 million
in available lines of credit and portfolio of unencumbered assets, provides a strong liquidity position and the potential for higher returns on cash deployment. We believe we have taken several important steps during 2017 in solidifying our strong balance sheet and overall liquidity position.
Our highlights for 2017 included:
•
Increased the number of unencumbered aircraft from 97 as of
December 31, 2016
, to
119
as of
December 31, 2017
. This was principally accomplished by paying cash for the purchase of 16 Airbus A321 aircraft, buying out the leases on
three
of our aircraft.
Three
of our Airbus A320 aircraft became unencumbered in 2017 as a result of regularly scheduled debt payments.
•
Our adjusted debt to capitalization ratio improved from 35% in 2016 to 28% in 2017.
Analysis of Cash Flows
We had cash and cash equivalents of
$303 million
as of December 31, 2017. This compares to
$433 million
and
$318 million
as of December 31, 2016 and 2015, respectively. We held both short and long term investments in 2017, 2016 and 2015. Our short-term investments totaled
$390 million
as of December 31, 2017 compared to
$538 million
and
$558 million
as of December 31, 2016 and 2015, respectively. Our long-term investments totaled
$2 million
as of December 31, 2017 compared to
$90 million
and
$49 million
as of December 31, 2016 and 2015, respectively.
Operating Activities
Cash flows provided by operating activities totaled approximately
$1.4 billion
in 2017 and $1.6 billion in each of 2016 and 2015. There was a
$234 million
decrease in cash flows from operating activities in 2017 compared to 2016 which was primarily driven by a
21.8%
increase in the price of fuel, partially offset by a
4.5%
increase in capacity during 2017. The
$34 million
increase in cash flows from operations in 2016 compared to 2015 was primarily a result of a
8.9%
increase in capacity and a decrease of
26.9%
in the price of fuel which both helped to improve operating cash flows. As of December 31, 2017, our unrestricted cash, cash equivalents and short-term investments as a percentage of trailing twelve months revenue was approximately
10%
. We rely primarily on cash flows from operations to provide working capital for current and future operations.
40
Investing Activities
During
2017
, capital expenditures related to our purchase of flight equipment included
$128 million
for flight equipment deposits, $759 million for the purchase of 16 new Airbus A321 aircraft and the buyout of
three
aircraft leases, $61 million for spare part purchases, and $156 million for flight equipment work-in-progress. Other property and equipment capital expenditures also included ground equipment purchases and facilities improvements for $98 million. Investing activities also included the net purchase of
$236 million
in investment securities.
During 2016, capital expenditures related to our purchase of flight equipment included $161 million for flight equipment deposits, $588 million for the purchase of 10 new Airbus A321 aircraft and the buyout of nine aircraft leases, $18 million for spare part purchases, and $96 million for flight equipment work-in-progress. Other property and equipment capital expenditures also included ground equipment purchases and facilities improvements for $148 million. Investing activities also included the net purchase of $23 million in investment securities.
During 2015, capital expenditures related to our purchase of flight equipment included $104 million for flight equipment deposits, $450 million for the purchase of 12 new Airbus A321 aircraft, $110 for the buyout of six aircraft leases, $120 million for spare part purchases, and $29 million for flight equipment work-in-progress. Other property and equipment capital expenditures also included ground equipment purchases and facilities improvements for $128 million. Investing activities also included the net purchase of $187 million in investment securities.
We currently anticipate 2018 capital expenditures to be between $900 million and $1.1 billion, including approximately $750 million and $900 million for aircraft and predelivery deposits. The remaining capital expenditures of approximately $150 million to $200 million relate to non-aircraft projects such as our initiative to reduce our structural cost with the goal of saving $250 to $300 million by 2020.
Financing Activities
Financing activities during
2017
consisted of the scheduled repayment of
$194 million
relating to debt and capital lease obligations, as a result,
three
aircraft became unencumbered. In addition, we acquired
$390 million
in treasury shares of which
$380 million
related to our accelerated share repurchases during 2017. During this period, we realized
$47 million
in proceeds from the issuance of stock related to employee share-based compensation.
Financing activities during 2016 consisted of the scheduled repayment of $368 million relating to debt and capital lease obligations, as a result, 17 aircraft became unencumbered. In addition, we acquired $134 million in treasury shares of which $120 million related to our accelerated share repurchase in the fourth quarter of 2016. During this period, we realized $45 million in proceeds from the issuance of stock related to employee share-based compensation. During 2016, $86 million of Series B 6.75% convertible debentures were converted by holders, as a result, we issued approximately 17.6 million shares of our common stock.
Financing activities during 2015 consisted of the scheduled repayment of $196 million relating to debt and capital lease obligations. We prepaid $100 million of outstanding principal relating to 10 Airbus A320 aircraft. As a result, four aircraft became unencumbered and six have lower principal balances. We also prepaid the outstanding balance of $32 million on a special facility revenue bond for JFK that was issued by the New York City Industrial Development Agency in December 2006. In addition, we acquired $241 million in treasury shares of which $150 million related to our accelerated share repurchase in June 2015. During this period, we realized $84 million in proceeds from the issuance of stock related to employee share-based compensation. During 2015, $68 million of our Series B 5.5% convertible debentures were converted by holders, as a result, we issued approximately 15 million shares of our common stock.
In November 2015, we filed an automatic shelf registration statement with the SEC. Under this shelf registration statement, we, or one or more selling security holders, have the capacity to offer and sell from time to time common stock, preferred stock, debt securities, depositary shares, warrants, stock purchase contracts, stock purchase units, subscription rights, and pass-through certificates. The net proceeds of any securities we sell under this registration statement may be used for general corporate purposes, including among other possible uses, the acquisition of aircraft and construction of facilities on or near airports, the repayment or repurchase of short-term or long-term debt or lease obligations and other capital expenditures. We may also use the proceeds for temporary investments until we need them for general corporate purposes. We will not receive any of the proceeds from the sale of securities by any selling security holders who may be named in a prospectus supplement. Through to December 31, 2017, we had not issued any securities under this registration statement. We may utilize this universal shelf registration statement, or a replacement filed with the SEC, in the future to raise capital to fund the continued development of our products and services, the commercialization of our products and services or for other general corporate purposes.
None of our lenders or lessors are affiliated with us.
41
Capital Resources
We have been able to generate sufficient funds from operations to meet our working capital requirements and we have historically paid cash or financed our aircraft through either secured debt or lease financing. As of December 31, 2017, we operated a fleet of
243
aircraft which included
43
Airbus A321 aircraft and
76
Airbus A320 aircraft that were unencumbered. Of our remaining aircraft,
44
were under operating leases,
six
were financed under capital leases and 80 were financed by private and public secured debt. Additionally we have
37
unencumbered spare engines. Approximately 29% of our property and equipment is pledged as security under various loan arrangements.
Dependent on market conditions, we anticipate using a mix of cash and debt financing for the
10
Airbus A321 aircraft scheduled for delivery in 2018. To the extent we cannot secure financing on terms we deem attractive, we may be required to pay in cash, further modify our aircraft acquisition plans or incur higher than anticipated financing costs. Although we believe debt and/or lease financing should be available to us if needed, we cannot give assurance we will be able to secure financing on terms attractive to us, if at all.
Working Capital
We had a working capital deficit of
$1.2 billion
as of December 31,
2017
compared to a deficit of $656 million as of December 31,
2016
and a deficit of $902 million as of December 31,
2015
. Working capital deficits can be customary in the airline industry since air traffic liability is classified as a current liability. Our working capital deficit increased
$379 million
in 2017 primarily due to using cash and short-term investments on hand to cover the difference of our cash from operations and our capital expenditures and share repurchases.
In 2012, we entered into a revolving line of credit with Morgan Stanley for up to $100 million which was subsequently increased to $200 million in December 2012. This line of credit is secured by a portion of our investment securities held by Morgan Stanley and the borrowing amount may vary accordingly. This line of credit bears interest at a floating rate based upon the London Interbank Offered Rate, or LIBOR, plus a margin. We did not borrow on this facility in 2017 or 2016 and the line was undrawn as of December 31, 2017.
In April 2017, we increased our Credit and Guaranty Agreement with Citibank, N.A. as the administrative agent to $425 million. The term of the Amended and Restated Facility runs through April 6, 2021. Borrowing under the Amended and Restated Facility bears interest at a variable rate equal to LIBOR, plus a margin. The Amended and Restated Facility is secured by Slots at JFK, LaGuardia, Reagan National and certain other assets. The Amended and Restated Facility includes covenants that require us to maintain certain minimum balances in unrestricted cash, cash equivalents, and unused commitments available under all revolving credit facilities. In addition, the covenants restrict our ability to incur additional indebtedness, issue preferred stock or pay dividends. During 2017 and 2016, we did not borrow on this facility and the line was undrawn as of December 31, 2017.
We expect to meet our obligations as they become due through available cash, investment securities and internally generated funds, supplemented as necessary by financing activities, as they may be available to us. We expect to generate positive working capital through our operations. However, we cannot predict what the effect on our business might be from the extremely competitive environment we are operating in or from events beyond our control, such as volatile fuel prices, economic conditions, weather-related disruptions, the spread of infectious diseases, the impact of airline bankruptcies, restructurings or consolidations, U.S. military actions or acts of terrorism. We believe there is sufficient liquidity available to us to meet our cash requirements for at least the next 12 months.
As part of our efforts to effectively manage our balance sheet and improve ROIC, we expect to continue to actively manage our debt balances. Our approach to debt management includes managing the mix of fixed vs. floating rate debt, annual maturities of debt and the weighted average cost of debt. We intend to continue to opportunistically pre-purchase outstanding debt when market conditions and terms are favorable as well as when excess liquidity is available. Additionally, our unencumbered assets, including
119
aircraft and
37
engines, allow some flexibility in managing our cost of debt and capital requirements.
42
CONTRACTUAL OBLIGATIONS
Our noncancelable contractual obligations at
December 31, 2017
include:
|
Payments due in
|
||||||||||||||||||||||||||||
|
(in billions)
|
Total
|
2018
|
2019
|
2020
|
2021
|
2022
|
Thereafter
|
|||||||||||||||||||||
|
Long-term debt and
capital lease obligations (1) |
$
|
1.4
|
|
$
|
0.2
|
|
$
|
0.3
|
|
$
|
0.2
|
|
$
|
0.2
|
|
$
|
0.2
|
|
$
|
0.3
|
|
|||||||
|
Lease commitments
|
1.2
|
|
0.2
|
|
0.2
|
|
0.1
|
|
0.1
|
|
0.1
|
|
0.5
|
|
||||||||||||||
|
Flight equipment obligations
|
7.3
|
|
0.8
|
|
1.0
|
|
1.4
|
|
1.5
|
|
1.5
|
|
1.1
|
|
||||||||||||||
|
Other obligations
(2)
|
2.3
|
|
0.5
|
|
0.3
|
|
0.3
|
|
0.2
|
|
0.2
|
|
0.8
|
|
||||||||||||||
|
Total
|
$
|
12.2
|
|
$
|
1.7
|
|
$
|
1.8
|
|
$
|
2.0
|
|
$
|
2.0
|
|
$
|
2.0
|
|
$
|
2.7
|
|
|||||||
|
(1)
|
Includes actual interest and estimated interest for floating-rate debt based on
December 31, 2017
rates.
|
|
(2)
|
Amounts include noncancelable commitments for the purchase of goods and services.
|
The interest rates are fixed for
$1.1 billion
of our debt and capital lease obligations, with the remaining
$0.2 billion
having floating interest rates. The floating interest rates adjust either quarterly or semi-annually based on LIBOR. The weighted average maturity of all of our debt was six years as of
December 31, 2017
.
As of
December 31, 2017
, we were in compliance with all of our covenants in relation to our debt and lease agreements and 29% of our owned property and equipment were pledged as security under various loan agreements.
As of
December 31, 2017
, we had operating lease obligations for
44
aircraft with lease terms that expire between
2018
and
2028
. None of these leases have a variable-rate rent payments which adjust semi-annually based on LIBOR. Our aircraft lease agreements contain termination provisions which include standard maintenance and return conditions. Our policy is to record these lease return conditions when they are probable and the costs can be estimated. We also lease airport terminal space and other airport facilities in each of our markets, as well as office space and other equipment. We have approximately
$30 million
of restricted assets pledged under standby letters of credit related to certain of our leases which will expire at the end of the related leases. As of
December 31, 2017
, the average age of our operating fleet was
9.2
years.
Our firm aircraft order as of
December 31, 2017
is as follows:
|
Year
|
Airbus A320neo
|
Airbus A321ceo
|
Airbus A321neo
|
Embraer 190
|
Total
|
|||||
|
2018
|
—
|
10
|
—
|
—
|
10
|
|||||
|
2019
|
—
|
—
|
13
|
—
|
13
|
|||||
|
2020
|
6
|
—
|
7
|
10
|
23
|
|||||
|
2021
|
16
|
—
|
4
|
7
|
27
|
|||||
|
2022
|
3
|
—
|
17
|
7
|
27
|
|||||
|
2023
|
—
|
—
|
14
|
—
|
14
|
|||||
|
2024
|
—
|
—
|
5
|
—
|
5
|
|||||
|
Total
|
25
|
10
|
60
|
24
|
119
|
|||||
Committed expenditures for our firm aircraft and spare engines include estimated amounts for contractual price escalations and predelivery deposits. We expect to meet our predelivery deposit requirements for our aircraft by paying cash or by using short-term borrowing facilities for deposits generally required six to 24 months prior to delivery. Any predelivery deposits paid by the issuance of notes are fully repaid at the time of delivery of the related aircraft.
43
Our Terminal at JFK, T5, is governed by a lease agreement we entered into with the PANYNJ in 2005. We are responsible for making various payments under the lease. This includes ground rents for the terminal site which began at the time of the lease execution in 2005 and facility rents commenced in October 2008 upon our occupancy of T5. The facility rents are based on the number of passengers enplaned out of the terminal, subject to annual minimums. The PANYNJ reimbursed us for construction costs of this project in accordance with the terms of the lease, except for approximately $76 million in leasehold improvements provided by us. In 2013, we amended this lease to include additional ground space for our international arrivals facility, T5i, which we opened in November 2014. For financial reporting purposes, the T5 project is being accounted for as a financing obligation, with the constructed asset and related liability being reflected on our consolidated balance sheets. The T5i project was accounted for at cost. Minimum ground and facility rents at JFK totaling $299 million are included in the commitments table above as lease commitments and financing obligations.
We enter into individual employment agreements with each of our non-unionized FAA-licensed Crewmembers, inspectors and air traffic controllers. Each employment agreement is for a term of five years and automatically renews for an additional five-year term unless the Crewmember is terminated for cause or the Crewmember elects not to renew it. Pursuant to these agreements, these Crewmembers can only be terminated for cause. In the event of a downturn in our business requiring a reduction in flying and related work hours, we are obligated to pay these Crewmembers a guaranteed level of income and to continue their benefits. As we are not currently obligated to pay this guaranteed income and benefits, no amounts related to these guarantees are included in the contractual obligations table above. Our pilots voted to be represented by ALPA during 2014.
OFF-BALANCE SHEET ARRANGEMENTS
None of our operating lease obligations are reflected on our consolidated balance sheets. Although some of our aircraft lease arrangements are with variable interest entities, as defined by the
Consolidations
topic of the Codification, none of them require consolidation in our financial statements. The decision to finance these aircraft through operating leases rather than through debt was based on an analysis of the cash flows and tax consequences of each financing alternative and a consideration of liquidity implications. We are responsible for all maintenance, insurance and other costs associated with operating these aircraft. However, we are not obligated to provide any residual value or other guarantees to our lessors.
We have determined that we hold a variable interest in, but are not the primary beneficiary of, certain pass-through trusts. The beneficiaries of these pass-through trusts are the purchasers of equipment notes issued by us to finance the acquisition of aircraft. Each trust maintains a liquidity facility whereby a third party agrees to make payments sufficient to pay up to 18 months of interest on the applicable certificates if a payment default occurs.
We have also made certain guarantees and indemnities to other unrelated parties that are not reflected on our consolidated balance sheets, which we believe will not have a significant impact on our results of operations, financial condition or cash flows. We have no other off-balance sheet arrangements. See Notes 2, 3 and 11 to our consolidated financial statements for a more detailed discussion of our variable interests and other contingencies, including guarantees and indemnities.
CRITICAL ACCOUNTING POLICIES AND ESTIMATES
The preparation of our consolidated financial statements in conformity with U.S. GAAP requires management to adopt accounting policies as well as make estimates and judgments to develop amounts reported in our financial statements and accompanying notes. We maintain a thorough process to review the application of our accounting policies and to evaluate the appropriateness of the estimates that are required to prepare our financial statements. We believe our estimates and judgments are reasonable; however, actual results and the timing of recognition of such amounts could differ from those estimates. In addition, estimates routinely require adjustment based on changing circumstances and the receipt of new or better information.
Critical accounting policies and estimates are defined as those that are reflective of significant judgments and uncertainties that could potentially result in materially different results under different assumptions and conditions. The policies and estimates discussed below have been reviewed with our independent registered public accounting firm and with the Audit Committee of our Board of Directors. For a discussion of these and other significant accounting policies, see Note 1 to our consolidated financial statements.
Passenger revenue
Passenger ticket sales are initially deferred in air traffic liability. Revenue is recognized when transportation is provided or when a ticket or customer credit expires. Air traffic liability also includes customer credits issued and unused tickets whose travel date has passed. Credit for unused tickets and customer credits can each be applied towards another ticket within 12 months of the original scheduled service or 12 months from the issuance of the customer credit. We also defer in the air traffic liability account an estimate for customer credits issued in conjunction with the JetBlue Airways Customer Bill of Rights that we expect to be ultimately redeemed. These estimates are based on historical experience and are periodically evaluated, and adjusted if necessary, based on actual credit usage.
44
Frequent flyer accounting
We utilize a number of estimates in accounting for our TrueBlue
®
customer loyalty program, or TrueBlue
®
. We record a liability for the estimated incremental cost of outstanding points earned from JetBlue purchases that we expect to be redeemed. This liability was
$37 million
and
$30 million
as of December 31, 2017 and 2016, respectively. The estimated cost includes incremental fuel, insurance, passenger food and supplies, in-flight entertainment and reservation costs. We adjust this liability, which is included in air traffic liability, based on points earned and redeemed, points that will ultimately go unused, or breakage, changes in the estimated incremental costs associated with providing travel and changes in the TrueBlue
®
program. Customers earn points based on the value paid for a trip rather than the length of the trip and never expire. In addition, there is no longer an automatic generation of a travel award once minimum award levels are reached, but instead the points are maintained in the account until used by the member. Customers can pool points between small groups of people, branded as Family Pooling
TM
. Periodically we evaluate our assumptions for appropriateness, including comparison of the cost estimates to actual costs incurred as well as the expiration and redemption assumptions to actual experience. Changes in the minimum award levels or in the lives of the awards would also require us to reevaluate the liability, potentially resulting in a significant impact in the year of change as well as in future years.
TrueBlue
®
points can also be sold to participating companies, including credit card and car rental companies. These sales are accounted for as multiple-element arrangements.
Upon the re-launch of the TrueBlue
®
program in November 2009, we extended our co-branded credit card and membership rewards participation agreements with American Express
®
. Under this arrangement, which ended in 2015, we identified two elements, with one element representing the fair value of the travel that will ultimately be provided when the points are redeemed and the other consisting of marketing related activities we conduct with the participating company. The fair value of the transportation portion of these point sales is deferred and recognized as passenger revenue when transportation is provided. The marketing portion, which is the excess of the total sales proceeds over the estimated fair value of the transportation to be provided, is recognized in other revenue when the points are sold.
In 2015, we announced a co-branded credit card partnership with Barclaycard®, which commenced in March 2016. The agreement is a multiple-element arrangement subject to ASU, 2009-13, Multiple Deliverable
Revenue Arrangements.
ASU 2009-13 requires the allocation of the overall consideration received to each deliverable using the estimated selling price. We identified the following deliverables: air transportation; use of the JetBlue brand name and access to our frequent flyer customer lists; advertising; and other airline benefits. In determining the estimated selling price, JetBlue considered multiple inputs, methods and assumptions, including: discounted cash flows; estimated equivalent ticket value, net of fulfillment discount; points expected to be awarded and redeemed; estimated annual spending by cardholder; estimated annual royalty for use of JetBlue's frequent flyer customer lists; and estimated utilization of other airline benefits. The overall consideration received is allocated to each deliverable based on their relative selling prices. The air transportation element will be deferred and recognized as passenger revenue when the points are utilized. The other elements will generally be recognized as other revenue when earned.
TrueBlue
®
points sold to participating companies which are not redeemed are recognized as revenue when management determines the probability of redemption is remote. Deferred revenue was
$263 million
and
$211 million
at December 31, 2016 and 2015, respectively.
Accounting for long-lived assets
In accounting for long-lived assets we make estimates about the expected useful lives, projected residual values and the potential for impairment. In estimating useful lives and residual values of our aircraft, we have relied upon actual industry experience with the same or similar aircraft types and our anticipated utilization of the aircraft. Changing market prices of new and used aircraft, government regulations and changes in our maintenance program or operations could result in changes to these estimates.
Our long-lived assets are evaluated for impairment when events and circumstances indicate the assets may be impaired. Indicators include operating or cash flow losses, significant decreases in market value or changes in technology. As our assets are all relatively new and we continue to have positive operating cash flows, we have not identified any significant impairment related to our long-lived assets at this time.
45
Intangible assets
Our intangible assets consist of acquired take-off and landing Slots at certain domestic airports. Slots are rights to take-off or land at a specific airport during a specific time period during the day and are a means by which airport capacity and congestion can be managed. The Federal government controls Slots at three domestic airports under the High Density rule, including Reagan National Airport in Washington D.C. and LaGuardia and JFK Airports in New York City. In accounting for our Slot-related intangible assets we make estimates about their expected useful lives. Slots at High Density Airports are indefinite lived intangible assets. Slots at other airports will continue to be amortized on a straight-line basis over their expected useful lives of up to 15 years. Changes in our operations, government regulations or demand for air travel at these airports could result in changes to these estimates.
We evaluate our intangible assets for impairment at least annually or when events and circumstances indicate they may be impaired. Indicators include operating or cash flow losses as well as significant decreases in market value.
Lease accounting
We operate airport facilities, office buildings and aircraft under operating leases with minimum lease payments. We recognize the costs associated with these agreements as rent expense on a straight-line basis over the expected lease term. Within the provisions of certain leases there are minimum escalations in payments over the base lease term. There are also periodic adjustments of lease rates, landing fees, and other charges applicable under such agreements, as well as renewal periods. The effects of the escalations and other adjustments have been reflected in rent expense on a straight-line basis over the lease term. This includes renewal periods when it is deemed to be reasonably assured at the inception of the lease that we would incur an economic penalty for not renewing. The amortization period for leasehold improvements is the term used in calculating straight-line rent expense or their estimated economic life, whichever is shorter.
Derivative instruments used for aircraft fuel
We utilize financial derivative instruments to manage the risk of changing aircraft fuel prices. We do not purchase or hold any derivative instrument for trading purposes. Fair values are determined using commodity prices provided to us by independent third parties. When possible, we designate these instruments as cash flow hedges for accounting purposes, as defined by the
Derivatives and Hedging
topic of the Codification which permits the deferral of the effective portions of gains or losses until contract settlement.
The
Derivatives and Hedging
topic is a complex accounting standard. It requires us to develop and maintain a significant amount of documentation related to:
(1) our fuel hedging program and fuel management approach,
(2) statistical analysis supporting a highly correlated relationship between the underlying commodity in the derivative financial instrument and the risk being hedged, i.e. aircraft fuel, on both a historical and prospective basis, and
(3) cash flow designation for each hedging transaction executed, to be developed concurrently with the hedging transaction.
This documentation requires us to estimate forward aircraft fuel prices since there is no reliable forward market for aircraft fuel. These prices are developed through the observation of similar commodity futures prices, such as crude oil and/or heating oil, and adjusted based on variations to those like commodities. Historically, our hedges have settled within 24 months; therefore, the deferred gains and losses have been recognized into earnings over a relatively short period of time.
46
REGULATION G RECONCILIATIONS OF NON-GAAP FINANCIAL MEASURES
We sometimes use non-GAAP measures that are derived from the consolidated financial statements, but that are not presented in accordance with generally accepted accounting principles in the U.S., or U.S. GAAP. We believe these non-GAAP measures provide a meaningful comparison of our results to others in the airline industry and our prior year results. Investors should consider these non-GAAP financial measures in addition to, and not as a substitute for, our financial performance measures prepared in accordance with U.S. GAAP. Further, our non-GAAP information may be different from the non-GAAP information provided by other companies.
Operating Expenses per Available Seat Mile, excluding fuel
Operating expenses per available seat mile, or CASM, is a common metric used in the airline industry. Our CASM for
2017
through 2013 are summarized in the table below. We exclude aircraft fuel and related taxes, and operating expenses related to other non-airline expenses, such as JetBlue Technology Ventures, from operating expenses to determine CASM ex-fuel. We believe that CASM ex-fuel provides investors with the ability to measure financial performance excluding items beyond our control, such as fuel costs which are subject to many economic and political factors beyond our control, or not related to the generation of an available seat mile, such as operating expense related to other non-airline expenses. We believe this non-GAAP measure is more indicative of our ability to manage airline costs and is more comparable to measures reported by other major airlines.
|
Reconciliation of Operating expense per ASM, excluding fuel
|
|||||||||||||||||||||||||||||||||||
|
(in millions; per ASM data in cents)
|
2017
|
2016
|
2015
|
2014
|
2013
|
||||||||||||||||||||||||||||||
|
$
|
per ASM
|
$
|
per ASM
|
$
|
per ASM
|
$
|
per ASM
|
$
|
per ASM
|
||||||||||||||||||||||||||
|
Total operating expenses
|
$
|
6,015
|
|
10.74
|
|
$
|
5,320
|
|
9.92
|
|
$
|
5,200
|
|
10.56
|
|
$
|
5,302
|
|
11.78
|
|
$
|
5,013
|
|
11.71
|
|
||||||||||
|
Less:
|
|||||||||||||||||||||||||||||||||||
|
Aircraft fuel and related taxes
|
1,363
|
|
2.43
|
|
1,074
|
|
2.00
|
|
1,348
|
|
2.74
|
|
1,912
|
|
4.25
|
|
1,899
|
|
4.43
|
|
|||||||||||||||
|
Other non-airline expenses
|
4
|
|
0.01
|
|
1
|
|
—
|
|
—
|
|
—
|
|
—
|
|
—
|
|
—
|
|
—
|
|
|||||||||||||||
|
Operating expenses, excluding fuel
|
$
|
4,648
|
|
8.30
|
|
$
|
4,245
|
|
7.92
|
|
$
|
3,852
|
|
7.82
|
|
$
|
3,390
|
|
7.53
|
|
$
|
3,114
|
|
7.28
|
|
||||||||||
47
Return on Invested Capital
Return on invested capital, or ROIC, is an important financial metric which we believe provides meaningful information as to how well we generate returns relative to the capital invested in our business. During
2017
, our ROIC was
10.3%
from
14.3%
in 2016, primarily due to fuel prices. We are committed to taking appropriate actions which will allow us to produce returns greater than our cost of capital while adding capacity and continuing to grow.
We believe this non-GAAP measure provides a meaningful comparison of our results to the airline industry and our prior year results. Investors should consider this non-GAAP financial measure in addition to, and not as a substitute for, our financial performance measures prepared in accordance with GAAP.
|
Reconciliation of Return on Invested Capital (Non-GAAP)
|
||||||||
|
(in millions, except as otherwise noted)
|
Twelve Months Ended
December 31,
|
|||||||
|
2017
|
2016
|
|||||||
|
Numerator
|
||||||||
|
Operating Income
|
$
|
1,000
|
|
$
|
1,312
|
|
||
|
Add: Interest income (expense) and other
|
6
|
|
7
|
|
||||
|
Add: Interest component of capitalized aircraft rent
(1)
|
53
|
|
58
|
|
||||
|
Subtotal
|
1,059
|
|
1,377
|
|
||||
|
Less: Income tax expense impact
|
395
|
|
520
|
|
||||
|
Operating Income After Tax, Adjusted
|
$
|
664
|
|
$
|
857
|
|
||
|
Denominator
|
||||||||
|
Average Stockholders' equity
|
$
|
4,424
|
|
$
|
3,611
|
|
||
|
Average total debt
|
1,291
|
|
1,606
|
|
||||
|
Capitalized aircraft rent
(1)
|
702
|
|
771
|
|
||||
|
Invested Capital
|
$
|
6,417
|
|
$
|
5,988
|
|
||
|
Return on Invested Capital
|
10.3
|
%
|
14.3
|
%
|
||||
|
(1) Capitalized Aircraft Rent
|
||||||||
|
Aircraft rent, as reported
|
$
|
100
|
|
$
|
110
|
|
||
|
Capitalized aircraft rent (7 * aircraft rent)
(2)
|
702
|
|
771
|
|
||||
|
Interest component of capitalized aircraft rent (Imputed interest at 7.5%)
|
53
|
|
58
|
|
||||
(2) In determining the Invested Capital component of ROIC we include a non-GAAP adjustment for aircraft operating leases, as operating lease obligations are not reflected on our balance sheets but do represent a significant financing obligation. In making the adjustment we used a multiple of seven times our aircraft rent as this is the multiple which is routinely used within the airline community to represent the financing component of aircraft operating lease obligations.
48
Free Cash Flow (Non-GAAP)
The table below reconciles cash provided by operations determined in accordance with U.S. GAAP to Free Cash Flow, a non-GAAP measure. Management believes that Free Cash Flow is a relevant metric in measuring our financial strength and is useful in assessing our ability to fund future capital commitments and other obligations. Investors should consider this non-GAAP financial measure in addition to, and not as a substitute for, our financial measures prepared in accordance with U.S. GAAP.
|
Reconciliation of Free Cash Flow (Non-GAAP)
|
||||||||||||||||||||
|
(in millions)
|
Year Ended December 31,
|
|||||||||||||||||||
|
2017
|
2016
|
2015
|
2014
|
2013
|
||||||||||||||||
|
Net cash provided by operating activities
|
$
|
1,398
|
|
$
|
1,632
|
|
$
|
1,598
|
|
$
|
912
|
|
$
|
758
|
|
|||||
|
Less: Capital expenditures
(1)
|
(1,074
|
)
|
(850
|
)
|
(837
|
)
|
(806
|
)
|
(615
|
)
|
||||||||||
|
Less: Predelivery deposits for flight equipment
|
(128
|
)
|
(161
|
)
|
(104
|
)
|
(127
|
)
|
(22
|
)
|
||||||||||
|
Free Cash Flow
|
$
|
196
|
|
$
|
621
|
|
$
|
657
|
|
$
|
(21
|
)
|
$
|
121
|
|
|||||
(1) The capital expenditures in 2014 included two capital leases for approximately $76 million which were classified as a non-cash financing activity in the consolidated statements of cash flows.
The risk inherent in our market risk sensitive instruments and positions is the potential loss arising from adverse changes to the price of fuel and interest rates as discussed below. The sensitivity analyses presented do not consider the effects such adverse changes may have on the overall economic activity, nor do they consider additional actions we may take to mitigate our exposure to such changes. Variable-rate leases are not considered market sensitive financial instruments and, therefore, are not included in the interest rate sensitivity analysis below. Actual results may differ. See Notes 1, 2 and 13 to our consolidated financial statements for accounting policies and additional information.
Aircraft fuel
Our results of operations are affected by changes in the price and availability of aircraft fuel. Market risk is estimated as a hypothetical 10% increase in the
December 31, 2017
cost per gallon of fuel. Based on projected 2018 fuel consumption, such an increase would result in an increase to aircraft fuel expense of approximately
$170 million
in 2018. This is compared to an estimated
$133 million
for
2017
measured as of
December 31, 2016
. We did not have any hedge contracts outstanding as of
December 31, 2017
.
The financial derivative instrument agreements we have with our counterparties may require us to fund all, or a portion of, outstanding loss positions related to these contracts prior to their scheduled maturities. The amount of collateral posted, if any, is periodically adjusted based on the fair value of the hedge contracts.
Interest
Our earnings are affected by changes in interest rates due to the impact those changes have on interest expense from variable-rate debt instruments and on interest income generated from our cash and investment balances. The interest rate is fixed for
$1.1 billion
of our debt and capital lease obligations, with the remaining
$153 million
having floating interest rates. If interest rates were on average 100 basis points higher in 2018 than they were during
2017
, our interest expense would increase by approximately
$2 million
. This is determined by considering the impact of the hypothetical change in interest rates on our variable rate debt.
If interest rates were an average 10% lower in 2018 than they were during
2017
, our interest income from cash and investment balances would decrease by approximately
$1 million
. These amounts are determined by considering the impact of the hypothetical interest rates on our cash and cash equivalents and short term investment securities balances as of
December 31, 2017
and
2016
.
49
Report of Independent Registered Public Accounting Firm
To the Stockholders and the Board of Directors of JetBlue Airways Corporation
Opinion on the Financial Statements
We have audited the accompanying consolidated balance sheets of JetBlue Airways Corporation (the Company) as of
December 31, 2017
and
2016
, and the related consolidated statements of operations, comprehensive income, cash flows and stockholders’ equity for each of the three years in the period ended
December 31, 2017
, and the related notes (collectively referred to as the "financial statements"). In our opinion, the financial statements present fairly, in all material respects, the consolidated financial position of the Company at
December 31, 2017
and
2016
, and the consolidated results of its operations and its cash flows for each of the three years in the period ended
December 31, 2017
, in conformity with U.S. generally accepted accounting principles.
We also have audited, in accordance with the standards of the Public Company Accounting Oversight Board (United States) (PCAOB), the Company's internal control over financial reporting as of
December 31, 2017
, based on criteria established in Internal Control-Integrated Framework issued by the Committee of Sponsoring Organizations of the Treadway Commission (2013 framework) and our report dated
February 16, 2018
expressed an unqualified opinion thereon.
Basis for Opinion
These financial statements are the responsibility of the Company's management. Our responsibility is to express an opinion on the Company's financial statements based on our audits. We are a public accounting firm registered with the PCAOB and are required to be independent with respect to the Company in accordance with the U.S. federal securities laws and the applicable rules and regulations of the Securities and Exchange Commission and the PCAOB.
We conducted our audits in accordance with the standards of the PCAOB. Those standards require that we plan and perform the audit to obtain reasonable assurance about whether the financial statements are free of material misstatement, whether due to fraud or error. Our audits included performing procedures to assess the risks of material misstatement of the financial statements, whether due to error or fraud, and performing procedures that respond to those risks. Such procedures included examining, on a test basis, evidence regarding the amounts and disclosures in the financial statements. Our audit also included evaluating the accounting principles used and significant estimates made by management, as well as evaluating the overall presentation of the financial statements. We believe that our audits provide a reasonable basis for our opinion.
/s/ Ernst & Young LLP
We have served as the Company's auditor since 2001.
New York, New York
February 16, 2018
50
Report of Independent Registered Public Accounting Firm
To the Stockholders and the Board of Directors of JetBlue Airways Corporation
Opinion on Internal Control over Financial Reporting
We have audited JetBlue Airways Corporation’s internal control over financial reporting as of
December 31, 2017
, based on criteria established in Internal Control-Integrated Framework issued by the Committee of Sponsoring Organizations of the Treadway Commission (2013 framework) (the COSO criteria). In our opinion, JetBlue Airways Corporation (the Company) maintained, in all material respects, effective internal control over financial reporting as of
December 31, 2017
, based on the COSO criteria.
We have also audited, in accordance with the standards of the Public Company Accounting Oversight Board (United States) (PCAOB), the 2017 consolidated financial statements of the Company and our report dated
February 16, 2018
expressed an unqualified opinion thereon.
Basis for Opinion
The Company's management is responsible for maintaining effective internal control over financial reporting and for its assessment of the effectiveness of internal control over financial reporting included in the accompanying Management's Report on Internal Control Over Financial Reporting. Our responsibility is to express an opinion on the Company's internal control over financial reporting based on our audit. We are a public accounting firm registered with the PCAOB and are required to be independent with respect to the Company in accordance with U.S. federal securities laws and the applicable rules and regulations of the Securities and Exchange Commission and the PCAOB.
We conducted our audit in accordance with the standards of the PCAOB. Those standards require that we plan and perform the audit to obtain reasonable assurance about whether effective internal control over financial reporting was maintained in all material respects.
Our audit included obtaining an understanding of internal control over financial reporting, assessing the risk that a material weakness exists, testing and evaluating the design and operating effectiveness of internal control based on the assessed risk, and performing such other procedures as we considered necessary in the circumstances. We believe that our audit provides a reasonable basis for our opinion.
Definition and Limitations of Internal Control Over Financial Reporting
A company’s internal control over financial reporting is a process designed to provide reasonable assurance regarding the reliability of financial reporting and the preparation of financial statements for external purposes in accordance with generally accepted accounting principles. A company’s internal control over financial reporting includes those policies and procedures that (1) pertain to the maintenance of records that, in reasonable detail, accurately and fairly reflect the transactions and dispositions of the assets of the company; (2) provide reasonable assurance that transactions are recorded as necessary to permit preparation of financial statements in accordance with generally accepted accounting principles, and that receipts and expenditures of the company are being made only in accordance with authorizations of management and directors of the company; and (3) provide reasonable assurance regarding prevention or timely detection of unauthorized acquisition, use, or disposition of the company’s assets that could have a material effect on the financial statements.
Because of its inherent limitations, internal control over financial reporting may not prevent or detect misstatements. Also, projections of any evaluation of effectiveness to future periods are subject to the risk that controls may become inadequate because of changes in conditions, or that the degree of compliance with the policies or procedures may deteriorate.
/s/ Ernst & Young LLP
New York, New York
February 16, 2018
51
JETBLUE AIRWAYS CORPORATION
CONSOLIDATED BALANCE SHEETS
(in millions, except per share data)
|
|
December 31,
|
|||||||
|
|
2017
|
2016
|
||||||
|
ASSETS
|
||||||||
|
CURRENT ASSETS
|
||||||||
|
Cash and cash equivalents
|
$
|
303
|
|
$
|
433
|
|
||
|
Investment securities
|
390
|
|
538
|
|
||||
|
Receivables, less allowance (2017-$1; 2016-$5)
|
245
|
|
172
|
|
||||
|
Inventories, less allowance (2017-$14; 2016-$12)
|
55
|
|
47
|
|
||||
|
Prepaid expenses and other
|
213
|
|
213
|
|
||||
|
Total current assets
|
1,206
|
|
1,403
|
|
||||
|
PROPERTY AND EQUIPMENT
|
|
|
||||||
|
Flight equipment
|
8,980
|
|
7,868
|
|
||||
|
Predelivery deposits for flight equipment
|
204
|
|
223
|
|
||||
|
Total flight equipment and predelivery deposits, gross
|
9,184
|
|
8,091
|
|
||||
|
Less accumulated depreciation
|
2,125
|
|
1,823
|
|
||||
|
Total flight equipment and predelivery deposits, net
|
7,059
|
|
6,268
|
|
||||
|
Other property and equipment
|
1,041
|
|
972
|
|
||||
|
Less accumulated depreciation
|
405
|
|
345
|
|
||||
|
Total other property and equipment, net
|
636
|
|
627
|
|
||||
|
Assets constructed for others
|
561
|
|
561
|
|
||||
|
Less accumulated depreciation
|
207
|
|
185
|
|
||||
|
Total assets constructed for others, net
|
354
|
|
376
|
|
||||
|
Total property and equipment, net
|
8,049
|
|
7,271
|
|
||||
|
OTHER ASSETS
|
|
|
|
|
||||
|
Investment securities
|
2
|
|
90
|
|
||||
|
Restricted cash
|
56
|
|
62
|
|
||||
|
Other
|
468
|
|
497
|
|
||||
|
Total other assets
|
526
|
|
649
|
|
||||
|
TOTAL ASSETS
|
$
|
9,781
|
|
$
|
9,323
|
|
||
See accompanying notes to consolidated financial statements.
52
JETBLUE AIRWAYS CORPORATION
CONSOLIDATED BALANCE SHEETS
(in millions, except per share data)
|
|
December 31,
|
|||||||
|
|
2017
|
2016
|
||||||
|
LIABILITIES AND STOCKHOLDERS’ EQUITY
|
||||||||
|
CURRENT LIABILITIES
|
||||||||
|
Accounts payable
|
$
|
378
|
|
$
|
242
|
|
||
|
Air traffic liability
|
1,215
|
|
1,120
|
|
||||
|
Accrued salaries, wages and benefits
|
313
|
|
342
|
|
||||
|
Other accrued liabilities
|
293
|
|
321
|
|
||||
|
Current maturities of long-term debt and capital leases
|
196
|
|
189
|
|
||||
|
Total current liabilities
|
2,395
|
|
2,214
|
|
||||
|
LONG-TERM DEBT AND CAPITAL LEASE OBLIGATIONS
|
1,003
|
|
1,195
|
|
||||
|
CONSTRUCTION OBLIGATION
|
441
|
|
457
|
|
||||
|
DEFERRED TAXES AND OTHER LIABILITIES
|
|
|||||||
|
Deferred income taxes
|
1,033
|
|
1,354
|
|
||||
|
Other
|
75
|
|
90
|
|
||||
|
Total deferred taxes and other liabilities
|
1,108
|
|
1,444
|
|
||||
|
COMMITMENTS AND CONTINGENCIES (Notes 10 & 11)
|
|
|
|
|||||
|
STOCKHOLDERS’ EQUITY
|
|
|
||||||
|
Preferred stock, $0.01 par value; 25 shares authorized, none issued
|
—
|
|
—
|
|
||||
|
Common stock, $0.01 par value; 900 shares authorized, 418 and 414 shares issued and 321 and 337 shares outstanding at 2017 and 2016, respectively
|
4
|
|
4
|
|
||||
|
Treasury stock, at cost; 97 and 77 shares at 2017 and 2016, respectively
|
(890
|
)
|
(500
|
)
|
||||
|
Additional paid-in capital
|
2,127
|
|
2,050
|
|
||||
|
Retained earnings
|
3,593
|
|
2,446
|
|
||||
|
Accumulated other comprehensive income
|
—
|
|
13
|
|
||||
|
Total stockholders’ equity
|
4,834
|
|
4,013
|
|
||||
|
TOTAL LIABILITIES AND STOCKHOLDERS’ EQUITY
|
$
|
9,781
|
|
$
|
9,323
|
|
||
See accompanying notes to consolidated financial statements.
53
JETBLUE AIRWAYS CORPORATION
(in millions, except per share amounts)
|
|
Years Ended December 31,
|
|||||||||||
|
|
2017
|
2016
|
2015
|
|||||||||
|
OPERATING REVENUES
|
||||||||||||
|
Passenger
|
$
|
6,288
|
|
$
|
6,013
|
|
$
|
5,893
|
|
|||
|
Other
|
727
|
|
619
|
|
523
|
|
||||||
|
Total operating revenues
|
7,015
|
|
6,632
|
|
6,416
|
|
||||||
|
OPERATING EXPENSES
|
||||||||||||
|
Aircraft fuel and related taxes
|
1,363
|
|
1,074
|
|
1,348
|
|
||||||
|
Salaries, wages and benefits
|
1,887
|
|
1,698
|
|
1,540
|
|
||||||
|
Landing fees and other rents
|
397
|
|
357
|
|
342
|
|
||||||
|
Depreciation and amortization
|
446
|
|
393
|
|
345
|
|
||||||
|
Aircraft rent
|
100
|
|
110
|
|
122
|
|
||||||
|
Sales and marketing
|
267
|
|
259
|
|
264
|
|
||||||
|
Maintenance, materials and repairs
|
622
|
|
563
|
|
490
|
|
||||||
|
Other operating expenses
|
933
|
|
866
|
|
749
|
|
||||||
|
Total operating expenses
|
6,015
|
|
5,320
|
|
5,200
|
|
||||||
|
OPERATING INCOME
|
1,000
|
|
1,312
|
|
1,216
|
|
||||||
|
OTHER INCOME (EXPENSE)
|
||||||||||||
|
Interest expense
|
(95
|
)
|
(111
|
)
|
(128
|
)
|
||||||
|
Capitalized interest
|
10
|
|
8
|
|
8
|
|
||||||
|
Interest income and other
|
6
|
|
7
|
|
1
|
|
||||||
|
Total other income (expense)
|
(79
|
)
|
(96
|
)
|
(119
|
)
|
||||||
|
INCOME BEFORE INCOME TAXES
|
921
|
|
1,216
|
|
1,097
|
|
||||||
|
Income tax expense (benefit)
|
(226
|
)
|
457
|
|
420
|
|
||||||
|
NET INCOME
|
$
|
1,147
|
|
$
|
759
|
|
$
|
677
|
|
|||
|
EARNINGS PER COMMON SHARE
|
||||||||||||
|
Basic
|
$
|
3.49
|
|
$
|
2.32
|
|
$
|
2.15
|
|
|||
|
Diluted
|
$
|
3.47
|
|
$
|
2.22
|
|
$
|
1.98
|
|
|||
See accompanying notes to consolidated financial statements.
54
JETBLUE AIRWAYS CORPORATION
CONSOLIDATED STATEMENTS OF COMPREHENSIVE INCOME
(in millions)
|
Years Ended December 31,
|
|||||||||||
|
|
2017
|
2016
|
2015
|
||||||||
|
NET INCOME
|
$
|
1,147
|
|
$
|
759
|
|
$
|
677
|
|
||
|
Changes in fair value of derivative instruments, net of reclassifications into earnings (net of $(8), $8, and $38 of taxes in 2017, 2016 and 2015, respectively)
|
(13
|
)
|
16
|
|
60
|
|
|||||
|
Total other comprehensive income (loss)
|
(13
|
)
|
16
|
|
60
|
|
|||||
|
COMPREHENSIVE INCOME
|
$
|
1,134
|
|
$
|
775
|
|
$
|
737
|
|
||
See accompanying notes to consolidated financial statements.
55
JETBLUE AIRWAYS CORPORATION
(in millions)
|
Years Ended December 31,
|
||||||||||||
|
2017
|
2016
|
2015
|
||||||||||
|
CASH FLOWS FROM OPERATING ACTIVITIES
|
||||||||||||
|
Net income
|
$
|
1,147
|
|
$
|
759
|
|
$
|
677
|
|
|||
|
Adjustments to reconcile net income to net cash provided by operating activities:
|
|
|||||||||||
|
Deferred income taxes
|
(313
|
)
|
270
|
|
377
|
|
||||||
|
Depreciation
|
383
|
|
337
|
|
288
|
|
||||||
|
Amortization
|
63
|
|
56
|
|
57
|
|
||||||
|
Stock-based compensation
|
29
|
|
23
|
|
20
|
|
||||||
|
Collateral returned for derivative instruments
|
—
|
|
—
|
|
52
|
|
||||||
|
Changes in certain operating assets and liabilities:
|
||||||||||||
|
(Increase) decrease in receivables
|
(50
|
)
|
(21
|
)
|
11
|
|
||||||
|
Decrease (increase) in inventories, prepaid and other
|
15
|
|
1
|
|
(5
|
)
|
||||||
|
Increase in air traffic liability
|
95
|
|
67
|
|
80
|
|
||||||
|
Increase in accounts payable and other accrued liabilities
|
53
|
|
157
|
|
64
|
|
||||||
|
Other, net
|
(24
|
)
|
(17
|
)
|
(23
|
)
|
||||||
|
Net cash provided by operating activities
|
1,398
|
|
1,632
|
|
1,598
|
|
||||||
|
CASH FLOWS FROM INVESTING ACTIVITIES
|
|
|
||||||||||
|
Capital expenditures
|
(1,074
|
)
|
(850
|
)
|
(837
|
)
|
||||||
|
Predelivery deposits for flight equipment
|
(128
|
)
|
(161
|
)
|
(104
|
)
|
||||||
|
Purchase of held-to-maturity investments
|
(207
|
)
|
(276
|
)
|
(370
|
)
|
||||||
|
Proceeds from the maturities of held-to-maturity investments
|
244
|
|
333
|
|
313
|
|
||||||
|
Purchase of available-for-sale securities
|
(245
|
)
|
(597
|
)
|
(372
|
)
|
||||||
|
Proceeds from the sale of available-for-sale securities
|
444
|
|
517
|
|
242
|
|
||||||
|
Other, net
|
(9
|
)
|
(11
|
)
|
(6
|
)
|
||||||
|
Net cash used in investing activities
|
(975
|
)
|
(1,045
|
)
|
(1,134
|
)
|
||||||
|
CASH FLOWS FROM FINANCING ACTIVITIES
|
|
|
||||||||||
|
Proceeds from:
|
|
|
||||||||||
|
Issuance of common stock
|
47
|
|
45
|
|
84
|
|
||||||
|
Repayment of:
|
||||||||||||
|
Long-term debt and capital lease obligations
|
(194
|
)
|
(368
|
)
|
(328
|
)
|
||||||
|
Acquisition of treasury stock
|
(390
|
)
|
(134
|
)
|
(241
|
)
|
||||||
|
Other, net
|
(16
|
)
|
(15
|
)
|
(2
|
)
|
||||||
|
Net cash used in financing activities
|
(553
|
)
|
(472
|
)
|
(487
|
)
|
||||||
|
INCREASE (DECREASE) IN CASH AND CASH EQUIVALENTS
|
(130
|
)
|
115
|
|
(23
|
)
|
||||||
|
Cash and cash equivalents at beginning of period
|
433
|
|
318
|
|
341
|
|
||||||
|
Cash and cash equivalents at end of period
|
$
|
303
|
|
$
|
433
|
|
$
|
318
|
|
|||
See accompanying notes to consolidated financial statements.
56
JETBLUE AIRWAYS CORPORATION
CONSOLIDATED STATEMENTS OF STOCKHOLDERS' EQUITY
(in millions)
|
Common
Shares |
Common
Stock |
Treasury
Shares |
Treasury
Stock |
Additional
Paid-In Capital |
Retained
Earnings |
Accumulated
Other Comprehensive Income (Loss) |
Total
|
||||||||||||||||||||||||
|
Balance at December 31, 2014
|
369
|
|
$
|
4
|
|
59
|
|
$
|
(125
|
)
|
$
|
1,711
|
|
$
|
1,002
|
|
$
|
(63
|
)
|
$
|
2,529
|
|
|||||||||
|
Net income
|
—
|
|
—
|
|
—
|
|
—
|
|
—
|
|
677
|
|
—
|
|
677
|
|
|||||||||||||||
|
Other comprehensive income
|
—
|
|
—
|
|
—
|
|
—
|
|
—
|
|
—
|
|
60
|
|
60
|
|
|||||||||||||||
|
Vesting of restricted stock units
|
2
|
|
—
|
|
1
|
|
(14
|
)
|
—
|
|
—
|
|
—
|
|
(14
|
)
|
|||||||||||||||
|
Exercise of stock options
|
5
|
|
—
|
|
—
|
|
—
|
|
59
|
|
—
|
|
—
|
|
59
|
|
|||||||||||||||
|
Stock compensation expense
|
—
|
|
—
|
|
—
|
|
—
|
|
20
|
|
—
|
|
—
|
|
20
|
|
|||||||||||||||
|
Stock issued under Crewmember stock purchase plan
|
1
|
|
—
|
|
—
|
|
—
|
|
25
|
|
—
|
|
—
|
|
25
|
|
|||||||||||||||
|
Shares repurchased under 2012 share repurchase plan
|
—
|
|
—
|
|
10
|
|
(227
|
)
|
—
|
|
—
|
|
—
|
|
(227
|
)
|
|||||||||||||||
|
Convertible debt redemption
|
15
|
|
—
|
|
—
|
|
—
|
|
67
|
|
—
|
|
—
|
|
67
|
|
|||||||||||||||
|
Other
|
—
|
|
—
|
|
—
|
|
—
|
|
14
|
|
—
|
|
—
|
|
14
|
|
|||||||||||||||
|
Balance at December 31, 2015
|
392
|
|
$
|
4
|
|
70
|
|
$
|
(366
|
)
|
$
|
1,896
|
|
$
|
1,679
|
|
$
|
(3
|
)
|
$
|
3,210
|
|
|||||||||
|
Cumulative Effect for the adoption of ASU 2016-09
|
—
|
|
—
|
|
—
|
|
—
|
|
—
|
|
—
|
|
8
|
|
—
|
|
8
|
|
|||||||||||||
|
Net income
|
—
|
|
—
|
|
—
|
|
—
|
|
—
|
|
759
|
|
—
|
|
759
|
|
|||||||||||||||
|
Other comprehensive income
|
—
|
|
—
|
|
—
|
|
—
|
|
—
|
|
—
|
|
16
|
|
16
|
|
|||||||||||||||
|
Vesting of restricted stock units
|
1
|
|
—
|
|
1
|
|
(14
|
)
|
—
|
|
—
|
|
—
|
|
(14
|
)
|
|||||||||||||||
|
Exercise of stock options
|
1
|
|
—
|
|
—
|
|
—
|
|
10
|
|
—
|
|
—
|
|
10
|
|
|||||||||||||||
|
Stock compensation expense
|
—
|
|
—
|
|
—
|
|
—
|
|
23
|
|
—
|
|
—
|
|
23
|
|
|||||||||||||||
|
Stock issued under Crewmember stock purchase plan
|
2
|
|
—
|
|
—
|
|
—
|
|
35
|
|
—
|
|
—
|
|
35
|
|
|||||||||||||||
|
Shares repurchased under 2016 share repurchase plan
|
—
|
|
—
|
|
6
|
|
(120
|
)
|
—
|
|
—
|
|
—
|
|
(120
|
)
|
|||||||||||||||
|
Convertible debt redemption
|
18
|
|
—
|
|
—
|
|
—
|
|
86
|
|
—
|
|
—
|
|
86
|
|
|||||||||||||||
|
Balance at December 31, 2016
|
414
|
|
$
|
4
|
|
77
|
|
$
|
(500
|
)
|
$
|
2,050
|
|
$
|
2,446
|
|
$
|
13
|
|
$
|
4,013
|
|
|||||||||
|
Net income
|
—
|
|
—
|
|
—
|
|
—
|
|
—
|
|
1,147
|
|
—
|
|
1,147
|
|
|||||||||||||||
|
Other comprehensive loss
|
—
|
|
—
|
|
—
|
|
—
|
|
—
|
|
—
|
|
(13
|
)
|
(13
|
)
|
|||||||||||||||
|
Vesting of restricted stock units
|
1
|
|
—
|
|
1
|
|
(10
|
)
|
—
|
|
—
|
|
—
|
|
(10
|
)
|
|||||||||||||||
|
Exercise of stock options
|
—
|
|
—
|
|
—
|
|
—
|
|
4
|
|
—
|
|
—
|
|
4
|
|
|||||||||||||||
|
Stock compensation expense
|
—
|
|
—
|
|
—
|
|
—
|
|
29
|
|
—
|
|
—
|
|
29
|
|
|||||||||||||||
|
Stock issued under Crewmember stock purchase plan
|
3
|
|
—
|
|
—
|
|
—
|
|
44
|
|
—
|
|
—
|
|
44
|
|
|||||||||||||||
|
Shares repurchased under 2016 share repurchase plan
|
—
|
|
—
|
|
19
|
|
(380
|
)
|
—
|
|
—
|
|
—
|
|
(380
|
)
|
|||||||||||||||
|
Balance at December 31, 2017
|
418
|
|
|
$
|
4
|
|
|
97
|
|
|
$
|
(890
|
)
|
|
$
|
2,127
|
|
|
$
|
3,593
|
|
|
$
|
—
|
|
|
$
|
4,834
|
|
||
See accompanying notes to consolidated financial statements.
57
JetBlue Airways Corporation, or JetBlue, is New York's Hometown Airline
™
. We believe our differentiated product and service offerings combined with our competitive cost advantage enables us to effectively compete in the high-value geography we serve. As of December 31, 2017, we served
101
destinations in
30
states, the District of Columbia, the Commonwealth of Puerto Rico, the U.S. Virgin Islands, and 21 countries in the Caribbean and Latin America. In December 2015, JetBlue created a new wholly-owned subsidiary, JetBlue Technology Ventures, LLC, or JTV. JTV will invest in or partner with emerging companies in the development of innovative products and services within the travel, hospitality and lifestyle industries.
Basis of Presentation
JetBlue provides air transportation services across the United States, the Caribbean and Latin America. Our consolidated financial statements have been prepared in accordance with accounting principles generally accepted in the U.S., or U.S. GAAP, and include the accounts of JetBlue and our subsidiaries. All majority-owned subsidiaries are consolidated with all intercompany transactions and balances being eliminated.
Use of Estimates
The preparation of our consolidated financial statements and accompanying notes in conformity with U.S. GAAP require us to make certain estimates and assumptions. Actual results could differ from those estimates.
Fair Value
The
Fair Value Measurements and Disclosures
topic of the Financial Accounting Standards Board’s, or FASB, Accounting Standards Codification
™
, or Codification,
establishes a framework for measuring fair value and requires enhanced disclosures about fair value measurements. This topic clarifies that fair value is an exit price, representing the amount that would be received to sell an asset or paid to transfer a liability in an orderly transaction between market participants. The topic also requires disclosure about how fair value is determined for assets and liabilities and establishes a hierarchy for which these assets and liabilities must be grouped, based on significant levels of inputs. Refer to Note 13 for more information.
Cash and Cash Equivalents
Our cash and cash equivalents include short-term, highly liquid investments which are readily convertible into cash. These investments include money market securities and commercial papers with maturities of three months or less when purchased.
Restricted Cash
Restricted cash primarily consists of security deposits, funds held in escrow for estimated workers’ compensation obligations and performance bonds for aircraft and facility leases.
Accounts and Other Receivables
Accounts and other receivables are carried at cost. They primarily consist of amounts due from credit card companies associated with sales of tickets for future travel. We estimate an allowance for doubtful accounts based on known troubled accounts, if any, and historical experience of losses incurred.
Investment Securities
Investment securities consist of available-for-sale investment securities and held-to-maturity investment securities. When sold, we use a specific identification method to determine the cost of the securities.
Available-for-sale investment securities
Our available-for-sale investment securities include highly liquid investments such as certificates of deposits with maturities between three and twelve months which are stated at fair value.
58
Held-to-maturity investment securities
Our held-to-maturity investments consist of investment-grade interest bearing instruments, primarily treasury notes and bills, which are stated at amortized cost. We do not intend to sell these investment securities and the contractual maturities are not greater than 24 months. Those with maturities less than twelve months are included in short-term investments on our consolidated balance sheets. Those with remaining maturities in excess of twelve months are included in long-term investments on our consolidated balance sheets. We did
not
record any material gains or losses on these securities during the years ended
December 31, 2017
,
2016
or
2015
. The estimated fair value of these investments approximated their carrying value as of
December 31, 2017
and
2016
.
The carrying values of investment securities consisted of the following at
December 31, 2017
and
2016
(in millions):
|
2017
|
2016
|
|||||||
|
Available-for-sale securities
|
|
|||||||
|
Time deposits
|
$
|
130
|
|
$
|
160
|
|
||
|
Debt Securities
|
6
|
|
—
|
|
||||
|
Treasury bills
|
—
|
|
115
|
|
||||
|
Commercial paper
|
—
|
|
60
|
|
||||
|
Total available-for-sale securities
|
136
|
|
335
|
|
||||
|
Held-to-maturity securities
|
||||||||
|
Treasury notes
|
220
|
|
283
|
|
||||
|
Corporate bonds
|
36
|
|
10
|
|
||||
|
Total held-to-maturity securities
|
256
|
|
293
|
|
||||
|
TOTAL INVESTMENT SECURITIES
|
$
|
392
|
|
$
|
628
|
|
||
Derivative Instruments
Derivative instruments, including fuel hedge contracts, fuel basis swap agreements and interest rate swap agreements are stated at fair value, net of any collateral postings. Derivative instruments are included in other current assets and other current liabilities in our consolidated balance sheets. Refer to Note 12 for more information.
Inventories
Inventories consist of expendable aircraft spare parts and supplies that are stated at average cost as well as aircraft fuel that is accounted for on a first-in, first-out basis. These items are expensed when used or consumed. An allowance for obsolescence on aircraft spare parts is provided over the remaining useful life of the related aircraft fleet.
Property and Equipment
We record our property and equipment at cost and depreciate these assets on a straight-line basis over their estimated useful lives to their estimated residual values. We capitalize additions, modifications enhancing the operating performance of our assets and the interest related to predelivery deposits used to acquire new aircraft and the construction of our facilities.
Estimated useful lives and residual values for our property and equipment are as follows:
|
Property and Equipment Type
|
Estimated Useful Life
|
Residual Value
|
|||
|
Aircraft
|
25 years
|
20
|
%
|
||
|
In-flight entertainment systems
|
5-10 years
|
0
|
%
|
||
|
Aircraft parts
|
Fleet life
|
10
|
%
|
||
|
Flight equipment leasehold improvements
|
Lower of lease term or economic life
|
0
|
%
|
||
|
Ground property and equipment
|
2-10 years
|
0
|
%
|
||
|
Leasehold improvements—other
|
Lower of lease term or economic life
|
0
|
%
|
||
|
Buildings on leased land
|
Lease term
|
0
|
%
|
||
59
Property under capital leases is initially recorded at an amount equal to the present value of future minimum lease payments which is computed on the basis of our incremental borrowing rate or, when known, the interest rate implicit in the lease. Amortization of property under capital leases is on a straight-line basis over the expected useful life and is included in depreciation and amortization expense.
We record impairment losses on long-lived assets used in operations when events and circumstances indicate the assets may be impaired and the undiscounted future cash flows estimated to be generated by the assets are less than the assets’ net book value. If impairment occurs, the loss is measured by comparing the fair value of the asset to its carrying amount. Impairment losses are recorded in depreciation and amortization expense.
Software
We capitalize certain costs related to the acquisition and development of computer software. We amortize these costs using the straight-line method over the estimated useful life of the software, which is generally between
five
and
ten
years. The net book value of computer software, which is included in other assets on our consolidated balance sheets, was
$92 million
and
$97 million
as of
December 31, 2017
and
2016
, respectively. Amortization expense related to computer software was
$41 million
,
$32 million
and
$34 million
for the years ended
December 31, 2017
,
2016
and
2015
, respectively. As of
December 31, 2017
, amortization expense related to computer software is expected to be approximately
$37 million
in
2018
,
$28 million
in
2019
,
$11 million
in
2020
,
$7 million
in
2021
, and
$4 million
in
2022
.
Intangible Assets
Our intangible assets consist primarily of acquired take-off and landing slots, or Slots, at certain domestic airports. Slots are the rights to take-off or land at a specific airport during a specific time period of the day and are a means by which airport capacity and congestion can be managed. We account for Slots at High Density Airports, including Reagan National Airport in Washington, D.C., LaGuardia Airport, and JFK Airport, both in New York City as indefinite life intangible assets which results in no amortization expense. Slots at other airports are amortized on a straight-line basis over their expected useful lives of up to
15 years
. We evaluate our intangible assets for impairment at least annually or when events and circumstances indicate they may be impaired. Indicators include operating or cash flow losses as well as significant decreases in market value. As of
December 31,
2017
and
2016
, our intangible assets for Slots at High Density Airports with indefinite lives was
$139 million
.
Passenger Revenue
Passenger revenue is recognized when the transportation is provided or after the ticket or passenger credit issued upon payment of a change fee expires. It is recognized net of the taxes that we are required to collect from our Customers, including federal transportation taxes, security taxes and airport facility charges. Tickets sold but not yet recognized as revenue and unexpired credits are included in air traffic liability on the consolidated balance sheets.
Loyalty Program
We account for our customer loyalty program, TrueBlue
®
, by recording a liability for the estimated incremental cost of outstanding points earned from JetBlue purchases that we expect to be redeemed. The estimated cost includes incremental fuel, insurance, passenger food and supplies, in-flight entertainment and reservation costs. We adjust this liability, which is included in air traffic liability, based on points earned and redeemed, points that will ultimately go unused, or breakage, changes in the estimated incremental costs associated with providing travel and changes in the TrueBlue
®
program. This liability was
$37 million
and
$30 million
as of December 31, 2017 and 2016, respectively. We estimate breakage based on historical point redemptions. In June 2013, we amended the program so points earned by members never expire. Customers earn points based on the value paid for a trip rather than the length of the trip, and Customers can pool points between small groups of people, branded as Family Pooling
™
. We believe Family Pooling
™
has not had a material impact on the breakage calculation.
TrueBlue
®
points can also be sold to participating companies, including credit card and car rental companies. These sales are accounted for as multiple-element arrangements.
Upon the re-launch of the TrueBlue
®
program in November 2009, we extended our co-branded credit card and membership rewards participation agreements with American Express
®
. Under this agreement, which ended in 2015, we identified two elements, with one element representing the fair value of the travel that will ultimately be provided when the points are redeemed and the other consisting of marketing related activities that we conduct with the participating company. The fair value of the transportation portion of these point sales is deferred and recognized as passenger revenue when transportation is provided. The marketing portion, which is the excess of the total sales proceeds over the estimated fair value of the transportation to be provided, is recognized in other revenue when the points are sold.
60
In 2015, we announced a co-branded credit card partnership with Barclaycard
®
, which commenced in March 2016. The agreement is a multiple-element arrangement subject to Accounting Standards Update, or ASU, 2009-13,
Multiple Deliverable Revenue Arrangements.
ASU 2009-13 requires the allocation of the overall consideration received to each deliverable using the estimated selling price. We identified the following deliverables: air transportation; use of the JetBlue brand name and access to our frequent flyer customer lists; advertising; and other airline benefits. In determining the estimated selling price, JetBlue considered multiple inputs, methods and assumptions, including: discounted cash flows; estimated equivalent ticket value, net of fulfillment discount; points expected to be awarded and redeemed; estimated annual spending by cardholder; estimated annual royalty for use of JetBlue's frequent flyer customer lists; and estimated utilization of other airline benefits. The overall consideration received is allocated to each deliverable based on their relative selling prices. The air transportation element is deferred and recognized as passenger revenue when the points are utilized. The other elements are recognized as other revenue when earned.
TrueBlue
®
points sold to participating companies which are not redeemed are recognized as revenue when management determines the probability of redemption is remote. Deferred revenue was
$263 million
and
$211 million
at December 31, 2017 and 2016, respectively.
Airframe and Engine Maintenance and Repair
Regular airframe maintenance for owned and leased flight equipment is charged to expense as incurred unless covered by a third-party long-term flight hour service agreement. We have separate service agreements in place covering scheduled and unscheduled repairs of certain airframe line replacement unit components as well as the engines in our fleet. These agreements, whose original terms generally range from
10
to
15
years, require monthly payments at rates based either on the number of cycles each aircraft was operated during each month or the number of flight hours each engine was operated during each month, subject to annual escalations. These power by the hour agreements transfer certain risks, including cost risks, to the third-party service providers. They generally fix the amount we pay per flight hour or number of cycles in exchange for maintenance and repairs under a predefined maintenance program, which are representative of the time and materials that would be consumed. These costs are expensed as the related flight hours or cycles are incurred.
Advertising Costs
Advertising costs, which are included in sales and marketing, are expensed as incurred. Advertising expense was
$66 million
in
2017
,
$65 million
in
2016
and
$69 million
in
2015
.
Share-Based Compensation
We record compensation expense for share-based awards based on the grant date fair value of those awards. Share-based compensation expense includes an estimate for pre-vesting forfeitures and is recognized over the requisite service periods of the awards on a straight-line basis.
Income Taxes
We account for income taxes utilizing the liability method. Deferred income taxes are recognized for the tax consequences of temporary differences between the tax and financial statement reporting bases of assets and liabilities. A valuation allowance for deferred tax assets is provided unless realizability is judged by us to be more likely than not. Our policy is to recognize interest and penalties accrued on any unrecognized tax benefits as a component of income tax expense.
New Accounting Standards
New accounting rules and disclosure requirements can impact our financial results and the comparability of our financial statements. The authoritative literature which has recently been issued and that we believe will impact our consolidated financial statements is described below. There are also several new proposals under development. If and when enacted, these proposals may have a significant impact on our financial statements.
During the first quarter of 2017, we adopted Accounting Standards Update, or ASU, 2015-17,
Income Taxes, Balance Sheet Classification of Deferred Taxes
topic of the FASB Codification, or Codification. This standard requires all deferred tax assets and liabilities to be classified as non-current on the balance sheet instead of separating deferred taxes into current and non-current amounts. In addition, valuation allowance allocations between current and non-current deferred tax assets are no longer required because those allowances also will be classified as non-current. Our condensed consolidated balance sheet as of December 31, 2016 reflects retrospective application. As a result of the adoption,
$9 million
of deferred tax liabilities previously included within other accrued liabilities and
$164 million
of deferred tax assets previously included within current assets have been moved to long-term liabilities on our December 31, 2016 balance sheet.
61
In February 2016, the FASB issued ASU 2016-02,
Leases (Topic 842)
. Under ASU 2016-02, a lessee will recognize liabilities for lease payments and right-of-use assets representing its right to use the underlying asset for the lease term. While we are still evaluating the full impact of adopting the amendments on our consolidated financial statements and disclosures, we have determined that the most significant impact will be our accounting for leased aircraft and other leasing agreements, requiring the presentation of those leases with durations of greater than twelve months on the balance sheet. See Note 3 with respect to our operating leases not currently presented on the balance sheet. The amendments are effective for fiscal years beginning after December 15, 2018 and includes interim periods within those fiscal years. Early adoption is permitted, and companies are required to use a modified retrospective approach at the earliest period presented.
In November 2016, the FASB issued ASU 2016-18,
Statement of Cash Flows (Topic 230), Restricted Cash.
The amendments clarified how entities should present restricted cash and restricted cash equivalents in the statement of cash flows. ASU 2016-18 requires entities to show the changes in the total of cash, cash equivalents, restricted cash and restricted cash equivalents in the statement of cash flows. As a result, entities will no longer present transfers between cash and cash equivalents and restricted cash and restricted cash equivalents in the statement of cash flows. The amendments are effective for fiscal years beginning after December 15, 2017 and includes interim periods within those years.
In May 2014, the FASB issued ASU 2014-09,
Revenue from Contracts with Customers
, which supersedes existing revenue recognition guidance. Under the new standard, a company will recognize revenue when it transfers goods or services to Customers in an amount that reflects the consideration to which the company expects to be entitled to in exchange for those goods or services. The standard allows for either full retrospective or modified retrospective adoption. In July 2015, the FASB voted to defer the effective date of ASU 2014-09 by one year to interim and annual reporting periods beginning after December 15, 2017 and permitted early adoption of the standard, but not prior to December 15, 2016.
We have closely assessed the new standard and monitored FASB activity, including the interpretations by the FASB Transition Resource Group for Revenue Recognition throughout 2017. In the fourth quarter of 2017, we substantially completed our assessment of the new standard, and we expect to adopt the requirements of ASU 2014-09 as of January 1, 2018 utilizing the full retrospective method of transition. We will record a cumulative adjustment to retained earnings as of January 1, 2016 for the impacts of the new accounting standard.
For JetBlue, we believe the most significant impact of the new standard relates to the accounting for our TrueBlue® Loyalty Program. The standard eliminates the incremental cost method for loyalty program accounting which we previously used. We will be required to re-value the liability for points earned on qualifying JetBlue purchases using a relative fair value approach. The application of a relative fair value approach is expected to increase our air traffic liability by approximately
$270 million
to
$300 million
, net of breakage, as of the beginning of the retrospective reporting period.
In addition, we currently have a liability for outstanding points that were earned in conjunction with our previous co-branded credit card agreement had been recorded using the residual method. The new standard does not permit the usage of the residual method for this contract and instead, the transaction price will be allocated to the performance obligations on a relative selling price basis. This change is expected to decrease the relative value allocated to the transportation performance obligation and will result in a decrease of approximately
$160 million
to
$170 million
, net of breakage, to the liability as of the beginning of the retrospective reporting period.
Under the new standard, passenger revenue from unused tickets and passenger credits will be recognized in proportion to flown revenue based on estimates of expected expiration or when the likelihood of the Customer exercising their remaining rights becomes remote. Currently, recognition of passenger revenue was at expiration. This change will increase passenger revenue by approximately
$20 million
to
$25 million
.
We also expect this standard to result in a change in the timing and classification of our revenue recognition for certain ancillary fees directly related to passenger tickets. As a result, we expect that these revenues, which were approximately
$470 million
and
$425 million
, in 2017 and 2016, respectively, will be reclassified from other revenue under the current presentation to passenger revenue after adoption.
The estimated impact of this ASU is expected to be less than
one
percent reduction to Operating revenues for both full year 2017 and 2016, and do not expect it to impact any of the Company's existing debt covenants.
62
Long-term debt and capital lease obligations and the related weighted average interest rate at
December 31, 2017
and
2016
consisted of the following (in millions):
|
|
2017
|
2016
|
||||||||||||
|
Secured Debt
|
||||||||||||||
|
Floating rate equipment notes, due through 2025
(1)
|
$
|
153
|
|
4.7
|
%
|
$
|
173
|
|
4.2
|
%
|
||||
|
Fixed rate enhanced equipment notes, due through 2023
(2)
|
171
|
|
4.5
|
%
|
189
|
|
4.5
|
%
|
||||||
|
Fixed rate equipment notes, due through 2026
|
716
|
|
5.4
|
%
|
850
|
|
5.5
|
%
|
||||||
|
Fixed rate specialty bonds, due through 2036
(3)
|
43
|
|
4.9
|
%
|
43
|
|
4.9
|
%
|
||||||
|
Capital Leases
(4)
|
124
|
|
4.5
|
%
|
140
|
|
4.3
|
%
|
||||||
|
Total debt and capital lease obligations
|
1,207
|
|
1,395
|
|
||||||||||
|
Less: Current maturities
|
(196
|
)
|
(189
|
)
|
||||||||||
|
Less: Debt acquisition cost
|
(8
|
)
|
(11
|
)
|
||||||||||
|
Long-term debt and capital lease obligations
|
$
|
1,003
|
|
$
|
1,195
|
|
||||||||
(1)
Interest rates adjust quarterly or semi-annually based on
LIBOR, plus a margin
.
(2)
In March 2014, we completed a private placement of
$226 million
in pass-through certificates, Series 2013-1. The certificates were issued by a pass-through trust and are not obligations of JetBlue. The proceeds from the issuance of the pass-through certificates were used to purchase equipment notes issued by JetBlue and secured by
14
of our previously unencumbered aircraft. Principal and interest are payable
semi-annually
, starting in September 2014.
(3)
In November 2005, the Greater Orlando Aviation Authority, or GOAA, issued special purpose airport facilities revenue bonds to JetBlue as reimbursement for certain airport facility construction and other costs. In April 2013, GOAA issued
$42 million
in special purpose airport facility revenue bonds to refund the bonds issued in 2005. The proceeds from the refunded bonds were loaned to us and we recorded the issuance of
$43 million
, net of
$1 million
premium, as long term debt on our consolidated balance sheets. In December 2006, the New York City Industrial Development Agency issued special facility revenue bonds for JFK to us as reimbursement to us for certain airport facility construction and other costs. We recorded the principal amount of the bond, net of discounts, as long-term debt on our consolidated balance sheets because we have issued a guarantee of the debt payments on the bond. This fixed rate debt is secured by leasehold mortgages of our airport facilities. During June 2015, we prepaid the full
$32 million
principal outstanding on the JFK special facility revenue bonds.
(4) As of
December 31, 2017
and
2016
,
four
capital leased Airbus A320 aircraft and
two
capital leased Airbus A321 aircraft were included in property and equipment at a cost of
$253 million
with accumulated amortization of
$64 million
and
$56 million
, respectively. The future minimum lease payments under these non-cancelable leases are
$23 million
in
2018
,
$23 million
in
2019
,
$35 million
in
2020
,
$39 million
in
2021
,
$9 million
in
2022
and
$14 million
in the years thereafter. Included in the future minimum lease payments is
$20 million
representing interest, resulting in a present value of capital leases of
$124 million
with a current portion of
$17 million
and a long-term portion of
$107 million
.
As of
December 31, 2017
, we were in compliance with all of our covenants in relation to our debt and lease agreements.
Maturities of long-term debt and capital leases for the next five years are as follows (in millions):
|
Year
|
Maturities
|
|
||
|
2018
|
$
|
194
|
|
|
|
2019
|
215
|
|
||
|
2020
|
179
|
|
||
|
2021
|
164
|
|
||
|
2022
|
142
|
|
||
|
Thereafter
|
305
|
|
||
63
Aircraft, engines, and other equipment and facilities having a net book value of
$2.3 billion
at
December 31, 2017
were pledged as security under various financing arrangements. Cash payments for interest related to debt and capital lease obligations, net of capitalized interest, aggregated
$60 million
,
$78 million
and
$93 million
in
2017
,
2016
and
2015
, respectively.
The carrying amounts and estimated fair values of our long-term debt at
December 31, 2017
and
2016
were as follows (in millions):
|
December 31, 2017
|
December 31, 2016
|
|||||||||||||||
|
Carrying Value
|
Estimated Fair Value
|
Carrying Value
|
Estimated Fair Value
|
|||||||||||||
|
Public Debt
|
||||||||||||||||
|
Fixed rate special facility bonds, due through 2036
|
42
|
|
46
|
|
42
|
|
45
|
|
||||||||
|
Non-Public Debt
|
||||||||||||||||
|
Fixed rate enhanced equipment notes, due through 2023
|
169
|
|
178
|
|
188
|
|
197
|
|
||||||||
|
Floating rate equipment notes, due through 2025
|
152
|
|
159
|
|
171
|
|
179
|
|
||||||||
|
Fixed rate equipment notes, due through 2026
|
712
|
|
771
|
|
843
|
|
915
|
|
||||||||
|
Total
(1)
|
$
|
1,075
|
|
$
|
1,154
|
|
$
|
1,244
|
|
$
|
1,336
|
|
||||
(1) Total excludes capital lease obligations of
$124 million
and
$140 million
for
December 31,
2017
and
2016
, respectively.
The estimated fair values of our publicly held long-term debt are classified as Level 2 in the fair value hierarchy. The fair values of our EETC transactions and our special facility bonds were based on quoted market prices in markets with low trading volumes. The fair value of our non-public debt was estimated using a discounted cash flow analysis based on our borrowing rates for instruments with similar terms and therefore classified as Level 3 in the fair value hierarchy. The fair values of our other financial instruments approximate their carrying values. Refer to Note 13 for additional information on fair value.
We have financed certain aircraft with EETCs as one of the benefits is being able to finance several aircraft at one time, rather than individually. The structure of EETC financing is that we create pass-through trusts in order to issue pass-through certificates. The proceeds from the issuance of these certificates are then used to purchase equipment notes which are issued by us and are secured by our aircraft. These trusts meet the definition of a variable interest entity, or VIE, as defined in the
Consolidations
topic of the Codification, and must be considered for consolidation in our consolidated financial statements. Our assessment of the EETCs considers both quantitative and qualitative factors including the purpose for which these trusts were established and the nature of the risks in each. The main purpose of the trust structure is to enhance the credit worthiness of our debt obligation through certain bankruptcy protection provisions, liquidity facilities and lower our total borrowing cost. We concluded that we are not the primary beneficiary in these trusts due to our involvement in them being limited to principal and interest payments on the related notes, the trusts were not set up to pass along variability created by credit risk to us and the likelihood of our defaulting on the notes. Therefore, we have not consolidated these trusts in our consolidated financial statements.
Short-term Borrowings
We have several lines of credit which bear interest at a floating rate based upon
LIBOR plus a margin
range of between
1.0%
and
2.0%
.
Citibank Line of Credit
We have a revolving Credit and Guaranty Agreement with Citibank, N.A. as the administrative agent for up to approximately
$425 million
. The term of the facility runs through April 2021. Borrowings under the Credit and Guaranty Agreement bear interest at a variable rate equal to
LIBOR, plus a margin
. The Credit and Guaranty Agreement is secured by Slots at John F. Kennedy International Airport, LaGuardia Airport and Reagan National Airport as well as certain other assets. Slots are rights to take-off or land at a specific airport during a specific time period during the day and a means by which airport capacity and congestion can be managed. The Credit and Guaranty Agreement includes covenants that require us to maintain certain minimum balances in unrestricted cash, cash equivalents, and unused commitments available under all revolving credit facilities. In addition, the covenants restrict our ability to, among other things, dispose of certain collateral, or merge, consolidate, or sell assets. As of and for the years ended
December 31, 2017
and 2016, we did
not
have a balance outstanding or borrowings under this line of credit.
64
Morgan Stanley Line of Credit
We have a revolving line of credit with Morgan Stanley for up to approximately
$200 million
. This line of credit is secured by a portion of our investment securities held by Morgan Stanley and the amount available to us under this line of credit may vary accordingly. This line of credit bears interest at a floating rate based upon
LIBOR, plus a margin
. As of and for the years ended
December 31, 2017
and 2016, we did
not
have a balance outstanding or borrowings under this line of credit.
We lease aircraft, all of our facilities at the airports we serve, office space and other equipment. These leases have varying terms and conditions, with some having early termination clauses which we determine to be the lease expiration date. The length of the lease depends upon the type of asset being leased, with the latest lease expiring in
2035
. Total rental expense for all of our operating leases was
$315 million
in
2017
,
$294 million
in
2016
and
$298 million
in
2015
. As of
December 31, 2017
, we have approximately
$30 million
in assets that serve as collateral for letters of credit. These letters of credit relate to a certain number of our leases and are included in restricted cash.
As of
December 31, 2017
,
44
of the
243
aircraft in our fleet were leased under operating leases, with lease expiration dates ranging from
2018
to
2028
.
None
of the
44
aircraft operating leases have variable rate rent payments based on
LIBOR
. Leases for
40
of our aircraft can generally be renewed at rates based on fair market value at the end of the lease term for one or two years. We have purchase options for
42
of our aircraft leases at the end of their lease term. These purchase options are at fair market value and have a one-time option during the term at fixed amounts that were expected to approximate the fair market value at lease inception.
We bought out the operating leases on
three
Airbus A320 aircraft for approximately
$51 million
,
nine
Airbus A320 aircraft for approximately
$164 million
, and
six
Airbus 320 aircraft for approximately
$110 million
, during 2017, 2016, and 2015 respectively.
Future minimum lease payments under noncancelable operating leases, including those described above, with initial or remaining terms in excess of one year at
December 31, 2017
, are as follows (in millions):
|
Aircraft
|
Other
|
Total
|
||||||||||
|
2018
|
$
|
71
|
|
$
|
99
|
|
$
|
170
|
|
|||
|
2019
|
59
|
|
91
|
|
150
|
|
||||||
|
2020
|
57
|
|
74
|
|
131
|
|
||||||
|
2021
|
51
|
|
66
|
|
117
|
|
||||||
|
2022
|
45
|
|
62
|
|
107
|
|
||||||
|
Thereafter
|
139
|
|
378
|
|
517
|
|
||||||
|
Total minimum operating lease payments
|
$
|
422
|
|
$
|
770
|
|
$
|
1,192
|
|
|||
In the past we have entered into sale-leaseback arrangements with a third party lender for
40
of our operating aircraft. The sale-leasebacks occurred simultaneously with the delivery of the related aircraft to us from their manufacturers. Each sale-leaseback transaction was structured with a separate trust set up by the third party lender, the assets of which consist of the one aircraft initially transferred to it following the sale by us and the subsequent lease arrangement with us. Because of their limited capitalization and the potential need for additional financial support, these trusts are VIEs as defined in the
Consolidations
topic of the Codification and must be considered for consolidation in our financial statements. Our assessment of each trust considers both quantitative and qualitative factors, including whether we have the power to direct the activities and to what extent we participate in the sharing of benefits and losses of the trusts. JetBlue does not retain any equity interests in any of these trusts and our obligations to them are limited to the fixed rental payments we are required to make to them. These were approximately
$316 million
as of
December 31, 2017
and are reflected in the future minimum lease payments in the table above. Our only interest in these entities is the purchase options to acquire the aircraft as specified above. Since there are no other arrangements, either implicit or explicit, between us and the individual trusts that would result in our absorbing additional variability from the trusts, we concluded we are not the primary beneficiary of these trusts. We account for these leases as operating leases, following the appropriate lease guidance as required by the
Leases
topic in the Codification.
65
We operate out of T5 at JFK and our occupancy is governed by various lease agreements with the PANYNJ. Under the terms of the facility lease agreement we were responsible for the construction of the
635,000
square foot
26
-gate terminal, a parking garage, roadways and an AirTrain Connector, all of which are owned by the PANYNJ and collectively referred to as the T5 Project. In 2014, we completed construction of our an international arrivals facility and additional gates, T5i. T5i includes
six
international arrival gates comprised of
three
new gates and
three
converted gates from T5, as well as an international arrivals hall with full U.S. Customs and Border Protection services.
We executed an extension to the original T5 lease in 2013. The lease, as amended, now incorporates a total of approximately
19
acres of space for our T5 facilities and ends on the 28th anniversary of the date of beneficial occupancy of T5i. We have the option to terminate the agreement in
2033
, five years prior to the end of the original scheduled lease term of October 2038. We are responsible for various payments under the leases, including ground rents which are reflected in the future minimum lease payments table in Note 3, and facility rents which are included below. The facility rents are based upon the number of passengers enplaned out of the terminal, subject to annual minimums.
We were considered the owner of the T5 Project for financial reporting purposes only and have been required to reflect an asset and liability for the T5 Project on our consolidated balance sheets since construction commenced in 2005. The cost of the T5 Project and the related liability are being accounted for as a financing obligation. Our construction of T5i is accounted for at cost with no financing obligation.
Total costs incurred for the elements of the T5 Project were
$637 million
, of which
$561 million
is classified as Assets Constructed for Others and the remaining
$76 million
is classified as leasehold improvements in our consolidated balance sheets. Assets Constructed for Others are being amortized over the shorter of the
25
year non-cancelable lease term or their economic life. We recorded amortization expense of
$22 million
,
$23 million
, and
$23 million
during in
2017
,
2016
and
2015
, respectively. Our total expenditures relating to T5i were approximately
$207 million
, all of which were incurred prior to 2016 and are classified as leasehold improvements in our consolidated balance sheets.
The PANYNJ has reimbursed us for the amounts currently included in Assets Constructed for Others. These reimbursements and related interest are reflected as Construction Obligation in our consolidated balance sheets. When the facility rents are paid they are treated as a debt service on the Construction Obligation, with the portion not relating to interest reducing the principal balance. Minimum estimated facility payments including escalations associated with the facility lease are estimated to be
$40 million
per year in
2018
through
2022
and
$456 million
thereafter. The portion of these scheduled payments serving to reduce the principal balance of the Construction Obligation is
$17 million
in
2018
,
$18 million
in
2019
,
$19 million
in
2020
,
$20 million
in
2021
and
$21 million
in
2022
. Payments could exceed these amounts depending on future enplanement levels at JFK. Scheduled facility payments representative of interest totaled
$24 million
in
2017
,
$25 million
in
2016
and
$25 million
in
2015
.
In September 2012, our Board of Directors authorized a share repurchase program for up to
25 million
shares of common stock over a
5
year period.
On June 16, 2015, we entered into an accelerated share repurchase agreement, or ASR, with Goldman, Sachs & Co., or Goldman Sachs, paying
$150 million
for an initial delivery of approximately
6.1 million
shares. The terms of the ASR concluded on September 15, 2015 with Goldman Sachs delivering approximately
0.7 million
additional shares to JetBlue. A total of approximately
6.8 million
shares was repurchased under this ASR, with an average price paid per share of
$22.06
.
In September 2015, JetBlue entered into an agreement for the repurchase of up to
778,460
shares per day, structured pursuant to Rule 10b5-1 and 10b-18 under the Securities Exchange Act of 1934 as amended, with a maximum of
3 million
shares to be repurchased. The repurchases commenced on October 30, 2015 and terminated on November 18, 2015 with
3 million
shares repurchased for approximately
$77 million
.
On September 10, 2015, our Board of Directors authorized a share repurchase program for up to
$250 million
worth of shares of common stock over a
three
year period beginning on January 1, 2016. On December 7, 2016, the Board approved certain changes to our share repurchase program, or the 2016 Repurchase Authorization, to increase the aggregate authorization in the value of the program, to up to
$500 million
worth of shares, and extended the term of the program through
December 31, 2019
. The program includes authorization for repurchases in open market transactions pursuant to Rules 10b-18 and/or 10b5-1 of the Securities and Exchange Act of 1934, as amended and/or one or more accelerated stock repurchase programs through privately-negotiated accelerated stock repurchase transactions.
66
On November 7, 2016, we entered into an ASR agreement with Goldman Sachs paying
$60 million
for an initial delivery of approximately
2.7 million
shares. The terms of the ASR concluded on December 29, 2016 with Goldman Sachs delivering approximately
0.2 million
additional shares to JetBlue. A total of approximately
2.9 million
shares was repurchased under this ASR, with an average price paid per share of
$20.74
.
Also on November 7, 2016, we entered into a separate ASR agreement with Morgan Stanley & Co. LLC, or Morgan Stanley, paying
$60 million
for an initial delivery of approximately
2.7 million
shares. The terms of the ASR concluded on December 30, 2016 with Morgan Stanley delivering approximately
0.2 million
additional shares to JetBlue. A total of approximately
2.9 million
shares was repurchased under this ASR, with an average price paid per share of
$20.93
.
On March 6, 2017, JetBlue entered into an ASR agreement with Barclays Bank PLC, or Barclays, paying
$100 million
for an initial delivery of approximately
4.1 million
shares. The terms of the ASR concluded on April 24, 2017 with Barclays delivering approximately
0.8 million
additional shares to JetBlue. A total of
4.9 million
shares, at an average price of
$20.23
per share, were repurchased under the agreement.
On April 27, 2017, JetBlue entered into an ASR agreement with Goldman Sachs, paying
$150 million
for an initial delivery of approximately
5.4 million
shares. The terms of the ASR concluded on July 24, 2017 with Goldman Sachs delivering approximately
1.4 million
additional shares to JetBlue. A total of
6.8 million
shares, at an average price of
$21.99
per share, were repurchased under the agreement.
On September 11, 2017, JetBlue entered into an ASR agreement with Morgan Stanley, paying
$130 million
for an initial delivery of approximately
5.4 million
shares. The terms of the ASR concluded on September 26, 2017 with Morgan Stanley delivering approximately
1.5 million
additional shares to JetBlue. A total of
6.9 million
shares, at an average price of
$18.86
per share, were repurchased under the agreement. The Morgan Stanley ASR completed our 2016 Repurchase Authorization.
The total shares purchased by JetBlue under each of the ASRs in 2017, 2016 and 2015 were based on the volume weighted average prices of JetBlue's common stock during the terms of the respective agreements.
On
December 8, 2017
, the Board of Directors approved a
two
year share repurchase authorization starting on
January 1, 2018
, of up to
$750 million
worth of shares. The authorization can be executed through repurchases in open market transactions pursuant to Rules 10b-18 and/or 10b5-1 of the Securities and Exchange Act of 1934, as amended, and/or one or more privately-negotiated accelerated stock repurchase transactions.
As of
December 31, 2017
, we had a total of
26.6 million
shares of our common stock reserved for issuance. These shares are primarily related to our equity incentive plans. Refer to Note 7 for further details on our share-based compensation.
As of
December 31, 2017
, we had a total of
96.6 million
shares of treasury stock, the majority of which relate to shares repurchased under our share repurchase program and the return of borrowed shares under our share lending agreement with Morgan Stanley which was terminated in January 2016.
67
The following table shows how we computed basic and diluted earnings per common share for the years ended
December 31
(dollars and share data in millions):
|
2017
|
2016
|
2015
|
||||||||||
|
Numerator:
|
|
|||||||||||
|
Net income
|
$
|
1,147
|
|
$
|
759
|
|
$
|
677
|
|
|||
|
Effect of dilutive securities:
|
||||||||||||
|
Interest on convertible debt, net of income taxes and profit sharing
|
—
|
|
2
|
|
4
|
|
||||||
|
Net income applicable to common stockholders after assumed conversions for diluted earnings per share
|
$
|
1,147
|
|
$
|
761
|
|
$
|
681
|
|
|||
|
Denominator:
|
|
|||||||||||
|
Weighted average shares outstanding for basic earnings per share
|
328.7
|
|
326.5
|
|
315.1
|
|
||||||
|
Effect of dilutive securities:
|
||||||||||||
|
Employee stock options and restricted stock units
|
1.7
|
|
2.1
|
|
2.8
|
|
||||||
|
Convertible debt
|
—
|
|
13.6
|
|
26.9
|
|
||||||
|
Adjusted weighted average shares outstanding and assumed conversions for diluted earnings per share
|
330.4
|
|
342.2
|
|
344.8
|
|
||||||
As of
December 31, 2015
, a total of approximately
1.4 million
shares of our common stock, which were lent to Morgan Stanley, our share borrower pursuant to the terms of our share lending agreement were issued and outstanding for corporate law purposes, but were returned during January 2016. Holders of the borrowed shares had all the rights of a holder of our common stock. However, because the share borrower had to return all borrowed shares to us, or identical shares or, in certain circumstances of default by the counterparty, the cash value thereof, the borrowed shares were not considered outstanding for the purpose of computing and reporting basic or diluted earnings per share.
During 2016 holders voluntarily converted approximately
$86 million
in principal amount of the 6.75% Series B convertible debentures. As a result, we issued
17.6 million
shares of our common stock. During 2015 holders voluntarily converted approximately
$68 million
in principal amount of the 5.5% Series B convertible debentures. As a result, we issued
15.2 million
shares of our common stock.
As discussed in Note 5, JetBlue entered into ASRs in 2017, 2016 and 2015 and purchased approximately
18.7 million
,
5.8 million
, and
6.8 million
shares, respectively, for
$380 million
,
$120 million
and
$150 million
, respectively. The number of shares repurchased are based on the volume weighted average prices of JetBlue's common stock during the term of the ASR agreements. JetBlue also repurchased
3 million
shares pursuant to Rule 10b5-1 and 10b-18 under the Securities Exchange Act of 1934 as amended, during the fourth quarter of 2015.
We have various equity incentive plans under which we have granted stock awards to our eligible Crewmembers and members of our Board of Directors. These include the JetBlue Airways Corporation Restated and Amended 2002 Stock Incentive Plan, or 2002 Plan, which was replaced by the JetBlue Airways Corporation 2011 Incentive Compensation Plan, or 2011 Plan. We additionally have a Crewmember Stock Purchase Plan, or CSPP, that is available to all eligible Crewmembers. Both the 2011 Plan and CSPP were amended in 2015 by Shareholders at our annual meeting.
Unrecognized stock-based compensation expense, which was approximately
$21.6 million
as of
December 31, 2017
, related to a total of
2.1 million
unvested restricted stock units, or RSUs, performance stock units, or PSUs, and deferred stock units, or DSUs, under our 2011 Plan. We expect to recognize this stock-based compensation expense over a weighted average period of approximately
one
year.
The total stock-based compensation expense for the years ended
December 31, 2017
,
2016
and
2015
was
$29 million
,
$23 million
, and
$20 million
, respectively.
68
2011 Incentive Compensation Plan
At our Annual Shareholders Meeting held on May 26, 2011, our Shareholders approved the JetBlue Airways Corporation 2011 Incentive Compensation Plan. This replaced the Restated and Amended 2002 Stock Incentive Plan, or 2002 Plan, which was set to expire at the end of 2011. Upon inception, the 2011 Plan had
15.0 million
shares of our common stock reserved for issuance. The 2011 Plan, by its terms, will terminate no later than May 2021. RSUs vest in annual installments over
three
years which can be accelerated upon the occurrence of a change in control. Under this plan, we grant RSUs to certain Crewmembers and members of our Board of Directors. Our policy is to grant RSUs based on the market price of the underlying common stock on the date of grant. Under this plan we grant DSUs to members of our Board of Directors and PSUs to certain members of our executive leadership team.
The 2011 Plan was amended and restated effective January 1, 2014, to include the definition of retirement eligibility. Once a Crewmember meets the definition they will continue to vest their shares as if they remained employed by JetBlue, regardless of their actual employment status with the Company. In accordance with the
Compensation-Stock Compensation
topic of the Codification, the grant’s explicit service condition is non-substantive and the grant has effectively vested at the time retirement eligibility is met.
At our Annual Shareholders Meeting held on May 21, 2015, our Shareholders approved amendments to the 2011 Plan increasing the number of shares of Company common stock that remain available for issuance under the plan by
7.5 million
.
Restricted Stock Units
The following is a summary of RSU activity under the 2011 Plan for the year ended
December 31, 2017
(in millions except per share data):
|
|
Shares
|
Weighted Average Grant Date Fair Value
|
||||
|
Nonvested at beginning of year
|
1.8
|
|
$16.77
|
|||
|
Granted
|
0.9
|
|
19.76
|
|
||
|
Vested
|
(1.0
|
)
|
14.04
|
|
||
|
Forfeited
|
(0.1
|
)
|
19.69
|
|
||
|
Nonvested at end of year
|
1.6
|
|
$20.14
|
|||
The total intrinsic value, determined as of the date of vesting, for all RSUs that vested and converted to shares of common stock during the
year ended December 31, 2017
,
2016
and
2015
was
$20 million
,
$30 million
and
$33 million
, respectively. The weighted average grant-date fair value of share awards during the years ended
December 31, 2017
,
2016
and
2015
was
$19.76
,
$22.95
, and
$17.09
, respectively.
The vesting period for DSUs under the 2011 Plan is either
one
or
three
years of service. Once vested, shares are issued
six months and one day
following a Director’s departure from our Board of Directors. During the years ended
December 31, 2017
,
2016
and
2015
, we granted a nominal amount of DSUs, almost all of which remain outstanding at
December 31, 2017
. In
2017
,
2016
and
2015
, we granted a nominal amount of PSUs to members of our executive leadership team which are based upon certain performance criteria.
Amended and Restated 2002 Stock Incentive Plan
The 2002 Plan included stock options issued during 1999 through 2001 under a previous plan as well as all options issued from 2002 through adoption of the 2011 Plan. It provided for incentive and non-qualified stock options and RSUs to be granted to certain Crewmembers and members of our Board of Directors. Additionally, it provided for DSUs to be granted to members of our Board of Directors. The 2002 Plan became effective following our initial public offering in April 2002. We began issuing RSUs in 2007 and DSUs in 2008. Prior to 2011, the DSUs vested immediately upon being granted. The RSUs vested in annual installments over
three
years which could be accelerated upon the occurrence of a change in control as defined in the 2002 Plan. Our policy to grant RSUs was based on the market price of the underlying common stock on the date of grant. No additional grants were made from this plan after the adoption of the 2011 Plan. Since December 31, 2014, there were no RSUs outstanding under the 2002 Plan.
69
Stock Options
All options issued under the 2002 Plan expire
ten
years from the date of grant, with the last options vesting in 2012. Our policy is to grant options with an exercise price equal to the market price of the underlying common stock on the date of grant.
The following is a summary of stock option activity for the year ended
December 31, 2017
(in millions except per share data):
|
|
Shares
|
Weighted Average Grant Date Fair Value
|
||||
|
Outstanding at beginning of year
|
0.4
|
|
$10.90
|
|||
|
Exercised
|
(0.4
|
)
|
10.90
|
|
||
|
Outstanding at end of year
|
—
|
|
—
|
|
||
|
Vested at end of year
|
—
|
|
—
|
|
||
The total intrinsic value, determined as of the date of exercise, of options exercised during the years ended
December 31,
2017
,
2016
and
2015
was
$4 million
,
$6 million
and
$34 million
, respectively. Total cash received from option exercises during the years ended
December 31,
2017
,
2016
and
2015
was
$4 million
,
$10 million
and
$59 million
, respectively. We have
not
granted any stock options since 2008 and those previously granted became fully expensed in 2012. Following Shareholder approval of the 2011 Plan, we stopped granting new equity awards under the 2002 Plan.
Crewmember Stock Purchase Plan
In May 2011, our Shareholders approved the 2011 Crewmember Stock Purchase Plan, or the CSPP. At inception, the CSPP had
8.0 million
shares of our common stock reserved for issuance. The CSPP, by its terms, will terminate no later than the last business day of April 2021.
At our Annual Shareholders Meeting held on May 21, 2015, our Shareholders approved amendments to the CSPP increasing the number of shares of Company common stock that remain available for issuance under the plan by
15 million
.
The CSPP has a series of
six
month offering periods, with a new offering period beginning on the first business day of May and November each year. Crewmembers can only join an offering period on the start date. Crewmembers may contribute up to
10%
of their pay towards the purchase of common stock via payroll deductions. Purchase dates occur on the last business day of April and October each year. The purchase price is the stock price on the purchase date, less a
15%
discount. The compensation cost relating to the discount is recognized over the offering period. The total expense recognized relating to the CSPP for the years ended
December 31, 2017
,
2016
and
2015
was approximately
$8 million
,
$6 million
and
$5 million
, respectively. Under this plan, Crewmembers purchased
2.5 million
,
2.2 million
, and
1.3 million
new shares for the years ended
December 31, 2017
,
2016
and
2015
, respectively, at weighted average prices of
$17.46
,
$15.88
, and
$19.25
per share, respectively.
Under the CSPP, should we be acquired by merger or sale of substantially all of our assets or sale of more than
50%
of our outstanding voting securities, all outstanding purchase rights will automatically be exercised immediately prior to the effective date of the acquisition at a price equal to
85%
of the fair market value per share immediately prior to the acquisition.
Taxation
The
Compensation-Stock Compensation
topic of the FASB Codification requires deferred taxes be recognized on temporary differences that arise with respect to stock-based compensation attributable to nonqualified stock options and awards. However, no tax benefit is recognized for stock-based compensation attributable to incentive stock options, or ISO, or CSPP shares until there is a disqualifying disposition, if any, for income tax purposes. A portion of our historical stock-based compensation was attributable to ISO and CSPP shares; therefore, our effective tax rate was subject to fluctuation.
70
Our income tax (benefit) expense consisted of the following for the years ended
December 31
(in millions):
|
2017
|
2016
|
2015
|
||||||||||
|
Deferred:
|
||||||||||||
|
Federal
|
$
|
(361
|
)
|
$
|
245
|
|
$
|
351
|
|
|||
|
State
|
25
|
|
25
|
|
26
|
|
||||||
|
Foreign
|
23
|
|
—
|
|
—
|
|
||||||
|
Deferred income tax (benefit) expense
|
(313
|
)
|
270
|
|
377
|
|
||||||
|
Current:
|
||||||||||||
|
Federal
|
94
|
|
129
|
|
20
|
|
||||||
|
State
|
18
|
|
26
|
|
16
|
|
||||||
|
Foreign
|
(25
|
)
|
32
|
|
7
|
|
||||||
|
Current income tax expense
|
87
|
|
187
|
|
43
|
|
||||||
|
Total income tax (benefit) expense
|
$
|
(226
|
)
|
$
|
457
|
|
$
|
420
|
|
|||
The Tax Cuts and Jobs Act, or The Act, was enacted on December 22, 2017. The Act made significant changes to the Federal tax code, including a reduction in the Federal corporate statutory tax rate from
35%
to
21%
. At December 31, 2017, the Company was able to make a reasonable estimate of the tax effects of enactment of The Act as written, on the existing deferred tax balances. As a result of these estimates, the Company recognized a provisional benefit in the amount of
$570 million
. During 2018, the Company will continue to refine the calculations as we gain a more thorough understanding of the Act, including those related to the deductibility of purchased assets, state tax treatment, amounts related to Crewmember compensation as well as changes in interpretations of The Act and additional regulatory guidance that may be issued.
The effective tax rate on income before income taxes differed from the federal income tax statutory rate for the years ended December 31 for the following reasons (in millions):
|
2017
|
2016
|
2015
|
||||||||||
|
Income tax expense at statutory rate
|
$
|
322
|
|
$
|
425
|
|
$
|
384
|
|
|||
|
State income tax, net of federal benefit
|
28
|
|
34
|
|
28
|
|
||||||
|
Adjustment of net deferred tax liability from enacted tax rate change
|
(570
|
)
|
—
|
|
—
|
|
||||||
|
Other, net
|
(6
|
)
|
(2
|
)
|
8
|
|
||||||
|
Total income tax (benefit) expense
|
$
|
(226
|
)
|
$
|
457
|
|
$
|
420
|
|
|||
Cash payments for income taxes were
$139 million
in
2017
,
$173 million
in
2016
and
$42 million
in
2015
.
71
The components of our deferred tax assets and liabilities as of
December 31
are as follows (in millions):
|
2017
|
2016
|
|||||||
|
Deferred tax assets:
|
||||||||
|
Deferred revenue/gains
|
95
|
|
121
|
|
||||
|
Terminal 5 lease
|
45
|
|
38
|
|
||||
|
Employee benefits
|
32
|
|
41
|
|
||||
|
Foreign tax credit
|
23
|
|
—
|
|
||||
|
Rent expense
|
22
|
|
34
|
|
||||
|
Other
|
6
|
|
8
|
|
||||
|
Deferred tax assets, net
|
223
|
|
242
|
|
||||
|
Deferred tax liabilities:
|
||||||||
|
Accelerated depreciation
|
(1,256
|
)
|
(1,596
|
)
|
||||
|
Deferred tax liabilities
|
(1,256
|
)
|
(1,596
|
)
|
||||
|
Net deferred tax liability
|
$
|
(1,033
|
)
|
$
|
(1,354
|
)
|
||
In evaluating the realizability of the deferred tax assets, we assess whether it is more likely than not that some portion, or all, of the deferred tax assets, will be realized. We consider, among other things, the generation of future taxable income (including reversals of deferred tax liabilities) during the periods in which the related temporary differences will become deductible.
A reconciliation of the beginning and ending amount of unrecognized tax benefits is as follow (in millions):
|
2017
|
2016
|
2015
|
||||||||||
|
Unrecognized tax benefits at January 1,
|
$
|
26
|
|
$
|
21
|
|
$
|
16
|
|
|||
|
Increases for tax positions taken during a prior period
|
2
|
|
10
|
|
—
|
|
||||||
|
Increases for tax positions taken during the period
|
6
|
|
5
|
|
6
|
|
||||||
|
Decreases for tax positions taken during a prior period
|
(3
|
)
|
(4
|
)
|
(1
|
)
|
||||||
|
Decreases for settlement with tax authorities during the period
|
—
|
|
(6
|
)
|
—
|
|
||||||
|
Unrecognized tax benefits December 31,
|
$
|
31
|
|
$
|
26
|
|
$
|
21
|
|
|||
Interest and penalties accrued on unrecognized tax benefits were not significant. If recognized,
$15 million
of the unrecognized tax benefits as of
December 31, 2017
would impact our effective tax rate. We do not expect any significant change in the amount of the unrecognized tax benefits within the next twelve months. As a result of net operating losses and statute of limitations in our major tax jurisdictions, years 2004 through 2016 remain subject to examination by the relevant tax authorities.
We sponsor a retirement savings 401(k) defined contribution plan, or the Plan, covering all of our Crewmembers where we match
100%
of our Crewmember contributions up to
5%
of their eligible wages. The contributions vest over
five
years and are measured from a Crewmember’s hire date. Crewmembers are immediately vested in their voluntary contributions.
Another component of the Plan is a Company discretionary contribution of
5%
of eligible non-management Crewmember compensation, which we refer to as
Retirement Plus
.
Retirement Plus
contributions vest over
three
years and are measured from a Crewmember’s hire date.
72
For years of service prior to 2017, our non-management Crewmembers were also eligible to receive profit sharing, calculated as
15%
of adjusted pre-tax income before profit sharing and special items with the result reduced by
Retirement Plus
contributions. Beginning with 2017, non-management Crewmembers are eligible to receive profit sharing, calculated as
10%
of adjusted pre-tax income before profit sharing and special items up to a pre-tax margin of
18%
. If JetBlue's resulting pre-tax margin exceeds
18%
, non-management Crewmembers will receive
20%
profit sharing on amounts above an
18%
pre-tax margin. The result is reduced by
Retirement Plus
contributions and Crewmembers may elect to have their profit sharing contributed directly to the Plan.
Certain Federal Aviation Administration, or FAA-licensed Crewmembers, receive an additional contribution of
3%
of eligible compensation, which we refer to as
Retirement Advantage.
Total 401(k) company match,
Retirement Plus,
profit sharing and
Retirement Advantage
expensed in for the years ended
December 31,
2017
,
2016
and
2015
were
$182 million
,
$290 million
and
$256 million
, respectively.
Flight Equipment Commitments
As of December 31, 2017
, our firm aircraft orders consisted of
10
Airbus A321 current engine option (ceo) aircraft,
25
Airbus A320 new engine option (neo) aircraft,
60
Airbus A321neo aircraft,
24
Embraer E190 aircraft and
10
spare engines scheduled for delivery through
2024
. Committed expenditures for these aircraft and related flight equipment, including estimated amounts for contractual price escalations and predelivery deposits, will be approximately
$0.8 billion
in
2018
,
$1.0 billion
in
2019
,
$1.4 billion
in
2020
,
$1.5 billion
in
2021
,
$1.5 billion
in
2022
and
$1.1 billion
thereafter. We are scheduled to receive
10
new Airbus A321ceo aircraft in
2018
, and depending on market conditions, we anticipate paying cash for some portion of our
2018
deliveries.
We amended our purchase agreement with Airbus in April 2017 which changed the timing of certain of our Airbus A321ceo and Airbus A321neo deliveries.
In conjunction with our intention to expand our Mint™ experience, we amended our purchase agreement with Airbus during July 2016 to add
30
incremental Airbus A321 aircraft with scheduled deliveries between 2017 and 2023. We expect
15
of the incremental
30
Airbus A321 aircraft to be delivered with the current engine option. Our amendment includes flexibility to take deliveries in our Mint™ or all-core configuration. We anticipate the remaining
15
aircraft to be Airbus A321neo, scheduled to be delivered beginning in 2020. We have the option to take certain A321neo deliveries with the Long Range configuration, the A321-LR.
Other Commitments
We utilize several credit card processors to process our ticket sales. Our agreements with these processors do not contain covenants, but do generally allow the processor to withhold cash reserves to protect the processor from potential liability for tickets purchased, but not yet used for travel. While we currently do not have any collateral requirements related to our credit card processors, we may be required to issue collateral to our credit card processors, or other key business partners, in the future.
As of December 31, 2017
, we had approximately
$24 million
pledged related to our workers compensation insurance policies and other business partner agreements, which will expire according to the terms of the related policies or agreements.
Except for our pilots, our Crewmembers do not have third-party representation. In April 2014, JetBlue pilots elected to be solely represented by ALPA. The NMB certified ALPA as the representative body for JetBlue pilots and we are working with ALPA to reach our first collective bargaining agreement. We enter into individual employment agreements with each of our non-unionized FAA-licensed Crewmembers which include dispatchers, technicians and inspectors as well as air traffic controllers. Each employment agreement is for a term of
five years
and automatically renews for an additional
five years
unless either the Crewmember or we elect not to renew it by giving at least
90 days
' notice before the end of the relevant term. Pursuant to these agreements, these Crewmembers can only be terminated for cause. In the event of a downturn in our business that would require a reduction in work hours, we are obligated to pay these Crewmembers a guaranteed level of income and to continue their benefits if they do not obtain other aviation employment.
73
We self-insure a portion of our losses from claims related to workers’ compensation, environmental issues, property damage, medical insurance for Crewmembers and general liability. Losses are accrued based on an estimate of the ultimate aggregate liability for claims incurred, using standard industry practices and our actual experience.
We are a party to many routine contracts under which we indemnify third parties for various risks. These indemnities consist of the following:
All of our bank loans, including our aircraft and engine mortgages obligate us to reimburse the bank for any increased costs arising from regulatory changes, including changes in reserve requirements and bank capital requirements; these obligations are standard terms present in loans of this type. These indemnities would increase the interest rate on our debt if they were to be triggered. In all cases, we have the option to repay the loan and avoid the increased costs. These terms match the length of the related loan up to
15 years
.
Under both aircraft leases with foreign lessors and aircraft and engine mortgages with foreign lenders, we have agreed to customary indemnities concerning withholding tax law changes. Under these contracts we are responsible, should withholding taxes be imposed, for paying such amount of additional rent or interest as is necessary to ensure that the lessor or lender still receives, after taxes, the rent stipulated in the lease or the interest stipulated under the loan. The term of these indemnities matches the length of the related lease up to
20 years
.
We have various leases with respect to real property as well as various agreements among airlines relating to fuel consortia or fuel farms at airports. Under these contracts we have agreed to standard language indemnifying the lessor against environmental liabilities associated with the real property or operations described under the agreement, even if we are not the party responsible for the initial event that caused the environmental damage. In the case of fuel consortia at airports, these indemnities are generally joint and several among the participating airlines. We have purchased a standalone environmental liability insurance policy to help mitigate this exposure. Our existing aviation hull and liability policy includes some limited environmental coverage when a cleanup is part of an associated single identifiable covered loss.
Under certain contracts, we indemnify specified parties against legal liability arising out of actions by other parties. The terms of these contracts range up to
25 years
. Generally, we have liability insurance protecting ourselves for the obligations we have undertaken relative to these indemnities.
Under a certain number of our operating lease agreements we are required to restore certain property or equipment to its original form upon expiration of the related agreement. We have recorded the estimated fair value of these retirement obligations of approximately
$4 million
as of
December 31, 2017
. This liability may increase over time.
We are unable to estimate the potential amount of future payments under the foregoing indemnities and agreements.
Legal Matters
Occasionally we are involved in various claims, lawsuits, regulatory examinations, investigations and other legal matters arising, for the most part, in the ordinary course of business. The outcome of litigation and other legal matters is always uncertain. The Company believes it has valid defenses to the legal matters currently pending against it, is defending itself vigorously and has recorded accruals determined in accordance with U.S. GAAP, where appropriate. In making a determination regarding accruals, using available information, we evaluate the likelihood of an unfavorable outcome in legal or regulatory proceedings to which we are a party to and record a loss contingency when it is probable a liability has been incurred and the amount of the loss can be reasonably estimated. These subjective determinations are based on the status of such legal or regulatory proceedings, the merits of our defenses and consultation with legal counsel. Actual outcomes of these legal and regulatory proceedings may materially differ from our current estimates. It is possible that resolution of one or more of the legal matters currently pending or threatened could result in losses material to our consolidated results of operations, liquidity or financial condition.
To date, none of these types of litigation matters has had a material impact on our operations or financial condition. We have insured and continue to insure against most of these types of claims. A judgment on any claim not covered by, or in excess of, our insurance coverage could materially adversely affect our financial condition or results of operations.
74
As part of our risk management techniques, we periodically purchase over the counter energy derivative instruments and enter into fixed forward price agreements, or FFPs, to manage our exposure to the effect of changes in the price of aircraft fuel. Prices for the underlying commodities have historically been highly correlated to aircraft fuel, making derivatives of them effective at providing short-term protection against volatility in average fuel prices. We also periodically enter into jet fuel basis swaps for the differential between heating oil and jet fuel to further limit the variability in fuel prices at various locations.
To manage the variability of the cash flows associated with our variable rate debt, we have also entered into interest rate swaps. We do not hold or issue any derivative financial instruments for trading purposes.
Aircraft fuel derivatives
We attempt to obtain cash flow hedge accounting treatment for each aircraft fuel derivative that we enter into. This treatment is provided for under the
Derivatives and Hedging
topic of the Codification. It allows for gains and losses on the effective portion of qualifying hedges to be deferred until the underlying planned jet fuel consumption occurs, rather than recognizing the gains and losses on these instruments into earnings during each period they are outstanding. The effective portion of realized aircraft fuel hedging derivative gains and losses is recognized in aircraft fuel expense in the period the underlying fuel is consumed.
Ineffectiveness can occur in certain circumstances, when the change in the total fair value of the derivative instrument differs from the change in the value of our expected future cash outlays for the purchase of aircraft fuel and is recognized immediately in interest income and other. Likewise, if a hedge does not qualify for hedge accounting, the periodic changes in its fair value are recognized in the period of the change in interest income and other. When aircraft fuel is consumed and the related derivative contract settles, any gain or loss previously recorded in other comprehensive income is recognized in aircraft fuel expense. All cash flows related to our fuel hedging derivatives are classified as operating cash flows.
Our current approach to fuel hedging is to enter into hedges on a discretionary basis without a specific target of hedge percentage needs. We view our hedge portfolio as a form of insurance to help mitigate the impact of price volatility and protect us against severe spikes in oil prices, when possible.
We did
not
have any fuel hedging contracts outstanding as of
December 31, 2017
.
Interest rate swaps
The final interest payment relating to our interest rate swaps took place in August 2016. As such, as of
December 31, 2017
, we did
not
have any notional debt outstanding related to these swaps. These interest rate hedges effectively swapped floating rate debt for fixed rate debt. They took advantage of lower borrowing rates in existence at the time of the hedge transaction as compared to the date our original debt instruments were executed. The notional amount decreased over time to match scheduled repayments of the related debt.
All of our interest rate swap contracts qualified as cash flow hedges in accordance with the
Derivatives and Hedging
topic of the Codification. Since all of the critical terms of our swap agreements matched the debt to which they pertain, there was
no
ineffectiveness relating to these interest rate swaps for the years ended
December 31,
2016
or
2015
, and all related unrealized losses were deferred in accumulated other comprehensive income. We recognized approximately a
$1 million
gain in interest expense for the year ended December 31, 2016 and we recognized approximately
$1 million
in additional interest expense as the related interest payments were made during the year ended December 31, 2015.
75
The table below reflects quantitative information related to our derivative instruments and where these amounts are recorded in our financial statements (dollar amounts in millions).
|
As of December 31,
|
||||||||
|
2017
|
2016
|
|||||||
|
Fuel derivatives
|
|
|
||||||
|
Asset fair value recorded in prepaid expense and other
(1)
|
$
|
—
|
|
$
|
22
|
|
||
|
Longest remaining term (months)
|
—
|
|
12
|
|
||||
|
Hedged volume (barrels, in thousands)
|
—
|
|
1,920
|
|
||||
|
Estimated amount of existing (gains) expected to be reclassified into earnings in the next 12 months
|
—
|
|
(22
|
)
|
||||
|
|
2017
|
2016
|
2015
|
|||||||||
|
Fuel derivatives
|
|
|||||||||||
|
Hedge effectiveness (gains) losses recognized in aircraft fuel expense
|
$
|
(15
|
)
|
$
|
(9
|
)
|
$
|
126
|
|
|||
|
(Gains) losses on derivatives not qualifying for hedge accounting recognized in other expense
|
—
|
|
—
|
|
1
|
|
||||||
|
Hedge (gains) losses on derivatives recognized in comprehensive income
|
6
|
|
(34
|
)
|
29
|
|
||||||
|
Percentage of actual consumption economically hedged
|
10
|
%
|
12
|
%
|
17
|
%
|
||||||
|
(1)
|
Gross asset of each contract prior to consideration of offsetting positions with each counterparty and prior to impact of collateral paid.
|
Any outstanding derivative instrument exposes us to credit loss in connection with our fuel contracts in the event of nonperformance by the counterparties to the agreements, but we do not expect any of our counterparties will fail to meet their obligations. The amount of such credit exposure is generally the fair value of our outstanding contracts for which we are in a liability position. To manage credit risks we select counterparties based on credit assessments, limit our overall exposure to any single counterparty and monitor the market position with each counterparty. Some of our agreements require cash deposits from either counterparty if market risk exposure exceeds a specified threshold amount.
We have master netting arrangements with our counterparties allowing us the right of offset to mitigate credit risk in derivative transactions. The financial derivative instrument agreements we have with our counterparties may require us to fund all, or a portion of, outstanding loss positions related to these contracts prior to their scheduled maturities. The amount of collateral posted, if any, is periodically adjusted based on the fair value of the hedge contracts. Our policy is to offset the liabilities represented by these contracts with any cash collateral paid to the counterparties.
The impact of offsetting derivative instruments is depicted below (in millions):
|
Gross Amount of Recognized
|
Gross Amount of Cash Collateral
|
Net Amount Presented on Balance Sheet
|
||||||||||||||||||
|
Assets
|
Liabilities
|
Offset
|
Assets
|
Liabilities
|
||||||||||||||||
|
Fuel derivatives
|
||||||||||||||||||||
|
As of December 31, 2017
|
$
|
—
|
|
$
|
—
|
|
$
|
—
|
|
$
|
—
|
|
$
|
—
|
|
|||||
|
As of December 31, 2016
|
$
|
22
|
|
$
|
—
|
|
$
|
—
|
|
$
|
22
|
|
$
|
—
|
|
|||||
76
Under the
Fair Value Measurements and Disclosures
topic of the Codification, disclosures are required about how fair value is determined for assets and liabilities and a hierarchy for which these assets and liabilities must be grouped is established, based on significant levels of inputs as follows:
Level 1
quoted prices in active markets for identical assets or liabilities;
Level 2
quoted prices in active markets for similar assets and liabilities and inputs that are observable for the asset or liability; or
Level 3
unobservable inputs for the asset or liability, such as discounted cash flow models or valuations.
The determination of where assets and liabilities fall within this hierarchy is based upon the lowest level of input that is significant to the fair value measurement.
The following is a listing of our assets and liabilities required to be measured at fair value on a recurring basis and where they are classified within the fair value hierarchy (in millions):
|
As of December 31, 2017
|
||||||||||||||||
|
Level 1
|
Level 2
|
Level 3
|
Total
|
|||||||||||||
|
Cash equivalents
|
$
|
173
|
|
$
|
—
|
|
$
|
—
|
|
$
|
173
|
|
||||
|
Available-for-sale investment securities
|
—
|
|
136
|
|
—
|
|
136
|
|
||||||||
|
As of December 31, 2016
|
||||||||||||||||
|
Level 1
|
Level 2
|
Level 3
|
Total
|
|||||||||||||
|
Cash equivalents
|
$
|
313
|
|
$
|
—
|
|
$
|
—
|
|
$
|
313
|
|
||||
|
Available-for-sale investment securities
|
115
|
|
220
|
|
—
|
|
335
|
|
||||||||
|
Aircraft fuel derivatives
|
—
|
|
22
|
|
—
|
|
22
|
|
||||||||
The carrying values of all other financial instruments approximated their fair values at
December 31, 2017
and
2016
. Refer to Note 2 for fair value information related to our outstanding debt obligations as of
December 31, 2017
and
2016
.
Cash equivalents
Our cash equivalents include money market securities and commercial paper which are readily convertible into cash, have maturities of 90 days or less when purchased and are considered to be highly liquid and easily tradable. These securities are valued using inputs observable in active markets for identical securities and are therefore classified as Level 1 within our fair value hierarchy.
Available-for-sale investment securities
Included in our available-for-sale investment securities are U.S. treasury bills, time deposits, commercial paper and debt securities. The fair values of these instruments are based on observable inputs in non-active markets, which are therefore classified as Level 2 in the hierarchy. We did
not
record any material gains or losses on these securities during the year ended
December 31, 2017
or
2016
.
Aircraft fuel derivatives
Our aircraft fuel derivatives include swaps, caps, collars, and basis swaps which are not traded on public exchanges. Their fair values are determined using a market approach based on inputs that are readily available from public markets for commodities and energy trading activities; therefore, they are classified as Level 2 inputs. The data inputs are combined into quantitative models and processes to generate forward curves and volatilities related to the specific terms of the underlying hedge contracts. There were
no
aircraft fuel derivatives outstanding as of December 31, 2017.
77
Comprehensive income (loss) includes changes in fair value of our aircraft fuel derivatives and interest rate swap agreements, which qualify for hedge accounting. A rollforward of the amounts included in accumulated other comprehensive income (loss), net of taxes for the years ended
December 31, 2017
,
2016
and
2015
is as follows (in millions):
|
Aircraft Fuel Derivatives
(1)
|
Interest Rate Swaps
(2)
|
Total
|
||||||||||
|
Balance of accumulated (losses), at December 31, 2014
|
(63
|
)
|
—
|
|
(63
|
)
|
||||||
|
Reclassifications into earnings (net of $49 of taxes)
|
77
|
|
1
|
|
78
|
|
||||||
|
Change in fair value (net of $(11) of taxes)
|
(18
|
)
|
—
|
|
(18
|
)
|
||||||
|
Balance of accumulated income (losses), at December 31, 2015
|
(4
|
)
|
1
|
|
(3
|
)
|
||||||
|
Reclassifications into earnings (net of $(4) of taxes)
|
(5
|
)
|
(1
|
)
|
(6
|
)
|
||||||
|
Change in fair value (net of $12 of taxes)
|
22
|
|
—
|
|
22
|
|
||||||
|
Balance of accumulated income, at December 31, 2016
|
$
|
13
|
|
$
|
—
|
|
$
|
13
|
|
|||
|
Reclassifications into earnings (net of $(6) of taxes)
|
(9
|
)
|
—
|
|
(9
|
)
|
||||||
|
Change in fair value (net of $(2) of taxes)
|
(4
|
)
|
—
|
|
(4
|
)
|
||||||
|
Balance of accumulated income, at December 31, 2017
|
—
|
|
—
|
|
—
|
|
||||||
|
(1) Reclassified to aircraft fuel expense
|
||||||||||||
|
(2) Reclassified to interest expense
|
||||||||||||
Under the
Segment Reporting
topic of the Codification, disclosures are required for operating segments that are regularly reviewed by chief operating decision makers. Air transportation services accounted for substantially all the Company’s operations in
2017
,
2016
and
2015
.
Operating revenues are allocated to geographic regions, as defined by the Department of Transportation, or DOT, based upon the origination and destination of each flight segment. We currently serve
33
locations in the Caribbean and Latin American region, or Latin America as defined by the DOT. However, our management includes our
three
destinations in Puerto Rico and
two
destinations in the U.S. Virgin Islands in our Caribbean and Latin America allocation of revenues. Therefore, we have reflected these locations within the Caribbean and Latin America region in the table below. Operating revenues by geographic regions for the years ended
December 31
are summarized below (in millions):
|
2017
|
2016
|
2015
|
||||||||||
|
Domestic
|
$
|
5,001
|
|
$
|
4,751
|
|
$
|
4,521
|
|
|||
|
Caribbean & Latin America
|
2,014
|
|
1,881
|
|
1,895
|
|
||||||
|
Total
|
$
|
7,015
|
|
$
|
6,632
|
|
$
|
6,416
|
|
|||
Our tangible assets primarily consist of our fleet of aircraft, which is deployed system wide, with no individual aircraft dedicated to any specific route or region; therefore our assets do not require any allocation to a geographic area.
78
Quarterly results of operations for the years ended
December 31, 2017
and
2016
are summarized below (in millions, except per share amounts):
|
First
Quarter |
Second
Quarter |
Third
Quarter |
Fourth
Quarter |
|||||||||||||
|
2017
|
||||||||||||||||
|
Operating revenues
|
$
|
1,604
|
|
$
|
1,842
|
|
$
|
1,813
|
|
$
|
1,756
|
|
||||
|
Operating income
|
147
|
|
354
|
|
310
|
|
189
|
|
||||||||
|
Net income
(1)
|
85
|
|
211
|
|
179
|
|
672
|
|
||||||||
|
Basic earnings per share
|
$
|
0.25
|
|
$
|
0.64
|
|
$
|
0.55
|
|
$
|
2.09
|
|
||||
|
Diluted earnings per share
(1)
|
$
|
0.25
|
|
$
|
0.64
|
|
$
|
0.55
|
|
$
|
2.08
|
|
||||
|
2016
|
||||||||||||||||
|
Operating revenues
|
$
|
1,616
|
|
$
|
1,643
|
|
$
|
1,732
|
|
$
|
1,641
|
|
||||
|
Operating income
|
349
|
|
313
|
|
354
|
|
296
|
|
||||||||
|
Net income
|
207
|
|
181
|
|
199
|
|
172
|
|
||||||||
|
Basic earnings per share
|
$
|
0.64
|
|
$
|
0.56
|
|
$
|
0.61
|
|
$
|
0.51
|
|
||||
|
Diluted earnings per share
|
$
|
0.61
|
|
$
|
0.53
|
|
$
|
0.58
|
|
$
|
0.50
|
|
||||
(1) During the fourth quarter of 2017, we recorded a one-time tax benefit of
$570 million
or
$1.76
per diluted share related to the enactment of The Tax Cuts and Jobs Act.
The sum of the quarterly earnings per share amounts does not equal the annual amount reported since per share amounts are computed independently for each quarter and for the full year based on respective weighted-average common shares outstanding and other dilutive potential common shares.
79
None.
Disclosure Controls and Procedures
We maintain disclosure controls and procedures (as defined in Rule 13a-15(e) or Rule 15d-15(e) under the Exchange Act) that are designed to ensure that information required to be disclosed by us in reports that we file under the Exchange Act is recorded, processed, summarized and reported within the time periods specified in the SEC’s rules and forms and that such information required to be disclosed by us in reports that we file under the Exchange Act is accumulated and communicated to our management, including our Chief Executive Officer, or CEO, and our Chief Financial Officer, or CFO, to allow timely decisions regarding required disclosure. Management, with the participation of our CEO and CFO, performed an evaluation of the effectiveness of our disclosure controls and procedures as of
December 31, 2017
. Based on that evaluation, our CEO and CFO concluded that our disclosure controls and procedures were effective as of
December 31, 2017
.
Management’s Report on Internal Control Over Financial Reporting
Our management is responsible for establishing and maintaining adequate internal control over financial reporting (as defined in Rule 13a-15(f) or Rule 15d-15(f) under the Exchange Act). Under the supervision and with the participation of our management, including our CEO and CFO, we conducted an evaluation of the effectiveness of our internal control over financial reporting based on the framework in Internal Control—Integrated Framework issued by the Committee of Sponsoring Organizations of the Treadway Commission (2013 Framework). Based on that evaluation, our management concluded that our internal control over financial reporting was effective as of
December 31, 2017
to provide reasonable assurance regarding the reliability of financial reporting and the preparation of consolidated financial statements for external reporting purposes in accordance with U.S. GAAP.
Ernst & Young LLP, the independent registered public accounting firm that audited our Consolidated Financial Statements included in this Annual Report on Form 10-K, audited the effectiveness of our internal control over financial reporting as of
December 31, 2017
. Ernst & Young LLP has issued their report which is included elsewhere herein.
Changes in Internal Control Over Financial Reporting
During the quarter ended
December 31, 2017
, there were no changes in our internal control over financial reporting (as defined in Rule 13a-15(f) and Rule 15d-15(f) under the Exchange Act) identified in connection with the evaluation of our controls performed during the quarter ended
December 31, 2017
that have materially affected, or are reasonably likely to materially affect, our internal control over financial reporting.
None.
80
Code of Ethics
We adopted a Code of Ethics within the meaning of Item 406(b) of SEC Regulation S-K. This Code of Ethics applies to our principal executive officer, principal financial officer and principal accounting officer. This Code of Ethics is publicly available on our website at
http://investor.jetblue.com
. If we make substantive amendments to this Code of Ethics or grant any waiver, including any implicit waiver, we will disclose the nature of such amendment or waiver on our website or in a report on Form 8-K within four days of such amendment or waiver.
Executive Officers of the Registrant
Certain information concerning JetBlue’s executive officers as of the date of this Report follows. There are no family relationships between any of our executive officers.
Robin Hayes
, age 51, is our Chief Executive Officer and President. He was promoted to President on January 1, 2014 and Chief Executive Officer on February 16, 2015. He joined JetBlue, as its Chief Commercial Officer in 2008, after nineteen years at British Airways. In his last role at British Airways, Mr. Hayes served as Executive Vice President for The Americas and before that he served in a number of operational and commercial positions in the UK and Germany.
Steve Priest,
age 47,
is our Chief Financial Officer, a position he has held since February 2017
.
Mr. Priest joined JetBlue in August 2015 as our Vice President Structural Programs. Prior to JetBlue, he worked at British Airways from 1996 to 2015 where he served as Senior Vice President of the carrier’s North Atlantic joint business with American Airlines, Iberia, and Finnair, as well as several other leadership roles.
James Hnat
, age 47, is our Executive Vice President Corporate Affairs, General Counsel and Secretary and has served in this capacity since April 2007. Previously, he served as our Senior Vice President, General Counsel and Assistant Secretary from March 2006, as General Counsel and Assistant Secretary from February 2003 to March 2006 and as Associate General Counsel from June 2001 to January 2003. Prior to joining JetBlue, Mr. Hnat worked as an attorney at Milbank, Tweed, Hadley & McCloy LLP, where he specialized in aircraft finance transactions and at Condon & Forsyth LLP where he specialized in airline defense litigation. Mr. Hnat is a member of the bar of New York and Massachusetts.
Marty St. George,
age 54, is our Executive Vice President Commercial and Planning, a position he has held since February 2015 and is responsible for airline and network planning, marketing, sales and revenue. Prior to this appointment, Mr. St. George served as our Senior Vice President - Commercial. Mr. St. George joined JetBlue in July 2006 and has held several roles including Senior Vice President - Marketing and Commercial Strategy and Vice President - Planning. Prior to JetBlue, Mr. St. George held marketing and network planning roles at United Airlines and US Airways.
Alexander Chatkewitz
,
age 53, is our Vice President and Chief Accounting Officer, a position he has held since December 2014. Prior to joining JetBlue, Mr. Chatkewitz worked at Philip Morris International, where he served as Vice President & Controller - Financial Reporting & Accounting Research since 2008. Prior to Phillip Morris, he served for a decade as Altria Group’s Vice President Assistant Controller - Financial Reporting & Consolidations. Mr. Chatkewitz also held positions at Marsh & McLennan Companies as well as the audit practice of Deloitte & Touche.
The other information required by this Item will be included in and is incorporated herein by reference from our definitive proxy statement for our
2018
Annual Meeting of Stockholders to be filed with the SEC pursuant to Regulation 14A within 120 days after the end of our
2017
fiscal year, or our 2018 Proxy Statement.
The information required by this Item will be included in and is incorporated herein by reference from our 2018 Proxy Statement.
The table below provides information relating to our equity compensation plans, including individual compensation arrangements, under which our common stock is authorized for issuance as of
December 31, 2017
, as adjusted for stock splits:
81
|
Plan Category
|
Number of securities to
be issued upon exercise
of outstanding options,
warrants and rights
|
Weighted-average
exercise price of
outstanding
options, warrants
and rights
|
Number of securities
remaining available
for future issuance
under equity
compensation plans
(excluding securities
reflected in first
column)
|
|||||||
|
Equity compensation plans approved by security holders
|
2,450,000
|
|
$
|
18.23
|
|
24,105,221
|
|
|||
|
Equity compensation plans not approved by security holders
|
—
|
|
—
|
|
—
|
|
||||
|
Total
|
2,450,000
|
|
$
|
18.23
|
|
24,105,221
|
|
|||
Refer to Note 7 to our consolidated financial statements for further information regarding the material features of the above plans.
Other information required by this Item will be included in and is incorporated herein by reference from our Proxy Statement.
The information required by this Item will be included in and is incorporated herein by reference from our 2018 Proxy Statement.
The information required by this Item will be included in and is incorporated herein by reference from our 2018 Proxy Statement.
82
|
1.
|
|
Financial statements:
|
|
|
|
Reports of Independent Registered Public Accounting Firm
|
||||
|
|
Consolidated Balance Sheets — December 31, 2017 and December 31, 2016
|
|
||
|
|
Consolidated Statements of Operations — For the years ended December 31, 2017, 2016 and 2015
|
|
||
|
Consolidated Statements of Comprehensive Income — For the years ended December 31, 2017, 2016 and 2015
|
||||
|
|
Consolidated Statements of Cash Flows — For the years ended December 31, 2017, 2016 and 2015
|
|
||
|
|
Consolidated Statements of Stockholders’ Equity — For the years ended December 31, 2017, 2016 and 2015
|
|
||
|
|
Notes to Consolidated Financial Statements
|
|
||
|
2.
|
|
Financial Statement Schedules:
|
|
|
|
Report of Independent Registered Public Accounting Firm on Financial Statement Schedule
|
S-1
|
|||
|
|
Schedule II — Valuation of Qualifying Accounts and Reserves
|
S-2
|
||
|
Quarterly Financial Data
|
S-3
|
|||
|
|
All other schedules have been omitted because they are inapplicable, not required, or the information is included elsewhere in the consolidated financial statements or notes thereto.
|
|
||
|
3.
|
|
Exhibits: See accompanying Exhibit Index included after the signature page of this Report for a list of the exhibits filed or furnished with or incorporated by reference in this Report.
|
|
|
Omitted.
SIGNATURES
Pursuant to the requirements of Section 13 or 15(d) of the Securities Exchange Act of 1934, the registrant has duly caused this Report to be signed on its behalf by the undersigned, thereunto duly authorized.
|
|
|
JETBLUE AIRWAYS CORPORATION
|
||||||
|
|
|
(Registrant)
|
||||||
|
Date:
|
February 16, 2018
|
|
|
By:
|
|
/s/ Alexander Chatkewitz
|
||
|
|
Vice President, Controller, and Chief Accounting Officer (Principal Accounting Officer)
|
|||||||
83
KNOW ALL PERSONS BY THESE PRESENTS, that each person whose signature appears below constitutes and appoints James G. Hnat his or her attorney-in-fact with power of substitution for him or her in any and all capacities, to sign any amendments, supplements or other documents relating to this Annual Report on Form 10-K which he or she deems necessary or appropriate, and to file the same, with exhibits thereto, and other documents in connection therewith, with the Securities and Exchange Commission, hereby ratifying and confirming all that such attorney-in-fact or their substitute may do or cause to be done by virtue hereof.
Pursuant to the requirements of the Securities Exchange Act of 1934, this Report has been signed below by the following persons on behalf of the registrant and in the capacities and on the dates indicated (and, as indicated with an asterisk, representing at least a majority of the members of the Board of Directors).
|
Signature
|
|
Capacity
|
|
Date
|
|
/S/ ROBIN HAYES
|
|
Chief Executive Officer and Director
(Principal Executive Officer) |
February 16, 2018
|
|
|
Robin Hayes
|
||||
|
/S/ STEVE PRIEST
|
|
Chief Financial Officer (Principal Financial Officer)
|
February 16, 2018
|
|
|
Steve Priest
|
||||
|
/S/ ALEXANDER CHATKEWITZ
|
Vice President, Controller, and Chief Accounting Officer (Principal Accounting Officer)
|
February 16, 2018
|
||
|
Alexander Chatkewitz
|
||||
|
/S/ PETER BONEPARTH
|
|
Director
|
February 16, 2018
|
|
|
Peter Boneparth *
|
||||
|
/S/ DAVID CHECKETTS
|
|
Director
|
February 16, 2018
|
|
|
David Checketts *
|
||||
|
/S/ VIRGINIA GAMBALE
|
|
Director
|
February 16, 2018
|
|
|
Virginia Gambale *
|
||||
|
/S/ STEPHAN GEMKOW
|
|
Director
|
February 16, 2018
|
|
|
Stephan Gemkow *
|
||||
|
/S/ STANLEY MCCHRYSTAL
|
|
Director
|
February 16, 2018
|
|
|
Stanley McChrystal *
|
||||
|
/S/ JOEL PETERSON
|
|
Director
|
February 16, 2018
|
|
|
Joel Peterson *
|
||||
|
/S/ FRANK SICA
|
Director
|
February 16, 2018
|
||
|
Frank Sica *
|
||||
|
/S/ THOMAS WINKELMANN
|
Director
|
February 16, 2018
|
||
|
Thomas Winkelmann *
|
||||
84
Exhibit Index
|
2.1
|
|
|
|
2.1(a)
|
||
|
2.1(b)
|
||
|
3.1
|
|
|
|
3.2
|
|
|
|
3.3
|
|
|
|
4.1
|
|
|
|
4.2
|
|
|
|
4.2(a)
|
|
|
|
4.2(b)
|
|
|
|
4.2(c)
|
|
|
|
4.2(d)
|
|
|
|
4.4
|
||
85
|
4.5
|
||
|
4.5(a)
|
||
|
4.9
|
||
|
4.9(f)
|
||
|
4.9(g)
|
||
|
4.9(h)
|
||
|
4.9(i)
|
||
|
4.10
|
||
|
4.10(a)
|
||
|
4.11
|
||
|
4.12
|
||
|
4.13
|
||
|
10.3**
|
||
|
10.3(a)**
|
||
|
10.3(b)**
|
||
86
|
10.3(c)**
|
||
|
10.3(d)**
|
||
|
10.3(e)**
|
||
|
10.3(f)**
|
||
|
10.3(g)**
|
||
|
10.3(h)**
|
||
|
10.3(i)**
|
||
|
10.3(j)**
|
||
|
10.3(k)**
|
||
|
10.3(l)**
|
||
|
10.3(m)**
|
||
|
10.3(n)**
|
||
|
10.3(o)**
|
||
|
10.3(p)**
|
||
87
|
10.3(q)**
|
||
|
10.3(r)**
|
||
|
10.3(s)**
|
||
|
10.3(t)**
|
||
|
10.3(u)**
|
||
|
10.3(v)**
|
||
|
10.3(w)**
|
||
|
10.3(x)**
|
||
|
10.3(y)**
|
||
|
10.3(z)**
|
||
|
10.3(aa)**
|
||
|
10.3(ab)**
|
||
|
10.3(ac)**
|
||
|
10.3(ad)**
|
||
88
|
10.3(ae)**
|
||
|
10.3(af)**
|
||
|
10.4**
|
||
|
10.5**
|
||
|
10.15
|
||
|
10.17**
|
||
|
10.17(a)**
|
||
|
10.17(b)**
|
||
|
10.17(c)**
|
||
|
10.17(d)**
|
||
|
10.17(e)**
|
||
|
10.17(f)**
|
||
|
10.17(g)**
|
||
89
|
10.17(h)**
|
||
|
10.17(i)**
|
||
|
10.17(j)**
|
||
|
10.17(k)**
|
||
|
10.17(l)**
|
||
|
10.17(m)**
|
||
|
10.17(n)**
|
||
|
10.17(o)**
|
||
|
10.17(p)**
|
||
|
10.17(q)**
|
||
|
10.17(r)**
|
||
90
|
10.17(s)**
|
||
|
10.17(t)**
|
||
|
10.18**
|
||
|
10.18(a)**
|
||
|
10.18(b)**
|
||
|
10.18(c)**
|
||
|
10.18(d)**
|
||
|
10.18(e)**
|
||
|
10.18(f)**
|
||
|
10.18(g)**
|
||
|
10.18(h)**
|
||
|
10.18(i)**
|
||
91
|
10.18(j)**
|
||
|
10.18(k)**
|
||
|
10.20
|
||
|
10.20(a)
|
||
|
10.21*
|
||
|
10.22*
|
||
|
10.22(a)*
|
||
|
10.30**
|
||
|
10.31*
|
|
|
|
10.31(a)*
|
||
|
10.31(b)*
|
||
|
10.31(c)*
|
||
|
10.31(d)*
|
||
|
10.31(e)*
|
||
|
10.31(f)*
|
||
92
|
10.31(g)*
|
||
|
10.31(h)*
|
||
|
10.31(i)*
|
||
|
10.31(j)*
|
||
|
10.33**
|
||
|
10.33(a)**
|
||
|
10.33(b)**
|
||
|
10.33(c)**
|
||
|
10.33(d)**
|
||
|
10.33(e)**
|
||
|
10.33(f)**
|
||
|
10.33(g)**
|
||
|
10.33(h)**
|
||
|
10.33(i)***
|
||
93
|
10.34**
|
||
|
10.34(a)**
|
||
|
10.35*
|
||
|
10.36
|
||
|
10.37
|
||
|
10.37(a)
|
||
|
10.38**
|
||
|
10.38(a)**
|
||
|
10.39*
|
||
|
10.41*
|
||
|
10.41(a)*
|
||
|
10.42*
|
||
|
10.43
|
||
|
12.1
|
||
|
21.1
|
||
94
|
23
|
||
|
31.1
|
||
|
31.2
|
||
|
32
|
||
|
99.2
|
||
|
101.INS
|
XBRL Instance Document
|
|
|
101.SCH
|
XBRL Taxonomy Extension Schema Document
|
|
|
101.DEF
|
XBRL Taxonomy Extension Definition Linkbase Document
|
|
|
101.CAL
|
XBRL Taxonomy Extension Calculation Linkbase Document
|
|
|
101.LAB
|
XBRL Taxonomy Extension Labels Linkbase Document
|
|
|
101.PRE
|
XBRL Taxonomy Extension Presentation Linkbase Document
|
|
|
*
|
Compensatory plans in which the directors and executive officers of JetBlue participate.
|
|
**
|
Pursuant to a Confidential Treatment Request under Rule 24b-2 filed with and approved by the SEC, portions of this exhibit have been omitted.
|
|
***
|
Pursuant to 17 CFR 240.24b-2, confidential information has been omitted and has been provided separately to the Securities and Exchange Commission pursuant to a Confidential Treatment Request filed with the Commission.
|
|
(1)
|
Documents substantially identical in all material respects to the document filed as Exhibit 4.4 to our Current Report on Form 8-K dated March 24, 2004 (which exhibit relates to formation of JetBlue Airways Pass Through Trust, Series 2004-1G-1-O and the issuance of Three-Month LIBOR plus 0.375% JetBlue Airways Pass Through Trust, Series 2004-1G-1-O, Pass Through Certificates) have been entered into with respect to formation of each of JetBlue Airways Pass Through Trusts, Series 2004-1G-2-O and Series 2004-1C-O and the issuance of each of Three-Month LIBOR plus 0.420% JetBlue Airways Pass Through Trust, Series 2004-1G-2-O and Three-Month LIBOR plus 4.250% JetBlue Airways Pass Through Trust, Series 2004-1C-O. Pursuant to Instruction 2 of Item 601 of Regulation S-K, Exhibit 99.1, incorporated by reference to our Current Report on Form 8-K dated March 24, 2004 (File No. 000-49728), sets forth the terms by which such substantially identical documents differ from Exhibit 4.7(c).
|
|
(2)
|
Documents substantially identical in all material respects to the document filed as Exhibit 4.14 our Current Report on Form 8-K dated March 24, 2004 (which exhibit relates to an above-cap liquidity facility provided on behalf of the JetBlue Airways Corporation Pass Through Trust 2004-1G-1-O) have been entered into with respect to the above-cap liquidity facilities provided on behalf of the JetBlue Airways Corporation Pass Through Trust 2004-1G-2-O and the JetBlue Airways Corporation Pass Through Trust 2004-1C-O. Pursuant to Instruction 2 of Item 601 of Regulation S-K, Exhibit 99.2, incorporated by reference to our Current Report on Form 8-K dated March 24, 2004 (File No. 000-49728), sets forth the terms by which such substantially identical documents differ from Exhibit 4.7(m).
|
|
(3)
|
Documents substantially identical in all material respects to the document filed as Exhibit 4.4 to our Current Report on Form 8-K dated November 9, 2004 (which exhibit relates to formation of JetBlue Airways Pass Through Trust, Series 2004-2G-1-O and the issuance of Three-Month LIBOR plus 0.375% JetBlue Airways Pass Through Trust, Series
|
95
2004-2G-1-O, Pass Through Certificates) have been entered into with respect to formation of each of the JetBlue Airways Pass Through Trusts, Series 2004-2G-2-O and Series 2004-2C-O and the issuance of each of Three-Month LIBOR plus 0.450% JetBlue Airways Pass Through Trust, Series 2004-2G-2-O and Three-Month LIBOR plus 3.100% JetBlue Airways Pass Through Trust, Series 2004-2C-O. Pursuant to Instruction 2 of Item 601 of Regulation S-K, Exhibit 99.1, incorporated by reference to our Current Report on Form 8-K dated November 9, 2004 (File No. 000-49728), sets forth the terms by which such substantially identical documents differ from Exhibit 4.8(c).
|
(4)
|
Documents substantially identical in all material respects to the document filed as Exhibit 4.14 to our Current Report on Form 8-K dated November 9, 2004 (which exhibit relates to an above-cap liquidity facility provided on behalf of the JetBlue Airways Corporation Pass Through Trust 2004-2G-1-O) have been entered into with respect to the above-cap liquidity facilities provided on behalf of the JetBlue Airways Corporation Pass Through Trust 2004-2G-2-O and the JetBlue Airways Corporation Pass Through Trust 2004-2C-O. Pursuant to Instruction 2 of Item 601 of Regulation S-K, Exhibit 99.2, incorporated by reference to our Current Report on Form 8-K dated November 9, 2004 (File No. 000-49728), sets forth the terms by which such substantially identical documents differ from Exhibit 4.8(m).
|
96
Financial Statement Schedule
Report of Independent Registered Public Accounting Firm
To the Stockholders and the Board of Directors of JetBlue Airways Corporation
Opinion on the Financial Statement Schedules
We have audited the consolidated financial statements of JetBlue Airways Corporation (the Company) as of
December 31, 2017
and
2016
, and for each of the three years in the period ended
December 31, 2017
, and have issued our report thereon dated
February 16, 2018
(included elsewhere in this Annual Report on Form 10-K). Our audits also included the financial statement schedule listed in Item 15(2) of this Annual Report on Form 10-K. In our opinion, the financial statement schedule, when considered in relation to the basic financial statements taken as a whole, presents fairly, in all material respects the information set forth therein.
Basis for Opinion
This schedule is the responsibility of the Company's management. Our responsibility is to express an opinion on the Company's schedule based on our audits. We believe that our audits provide a reasonable basis for our opinion.
/s/ Ernst & Young LLP
New York, New York
February 16, 2018
S-1
97
JETBLUE AIRWAYS CORPORATION
SCHEDULE II—VALUATION AND QUALIFYING ACCOUNTS
(in millions)
|
Balance at
beginning of period |
Additions Charged to
Costs and Expenses |
Deductions
|
|
Balance at
end of period |
||||||||||||
|
Year Ended December 31, 2017
|
||||||||||||||||
|
Allowance for doubtful accounts
|
$
|
5
|
|
$
|
—
|
|
$
|
4
|
|
(1)
|
$
|
1
|
|
|||
|
Allowance for obsolete inventory parts
|
12
|
|
2
|
|
—
|
|
(2)
|
14
|
|
|||||||
|
Total
|
17
|
|
2
|
|
4
|
|
15
|
|
||||||||
|
Year Ended December 31, 2016
|
||||||||||||||||
|
Allowance for doubtful accounts
|
$
|
6
|
|
$
|
—
|
|
$
|
1
|
|
(1)
|
$
|
5
|
|
|||
|
Allowance for obsolete inventory parts
|
10
|
|
2
|
|
—
|
|
(2)
|
12
|
|
|||||||
|
Total
|
16
|
|
2
|
|
1
|
|
17
|
|
||||||||
|
Year Ended December 31, 2015
|
||||||||||||||||
|
Allowance for doubtful accounts
|
$
|
6
|
|
$
|
4
|
|
$
|
4
|
|
(1)
|
$
|
6
|
|
|||
|
Allowance for obsolete inventory parts
|
8
|
|
2
|
|
—
|
|
(2)
|
10
|
|
|||||||
|
Total
|
14
|
|
6
|
|
4
|
|
16
|
|
||||||||
|
(1)
|
Uncollectible accounts written off, net of recoveries.
|
|
(2)
|
Inventory scrapped.
|
S-2
98
TABLE OF CONTENTS
Part IItem 1. BusinessItem 1A. Risk FactorsItem 1B. Unresolved Staff CommentsItem 2. PropertiesItem 3. Legal ProceedingsItem 4. Mine Safety DisclosuresPart IIItem 5. Market For Registrant S Common Equity; Related Stockholder Matters and Issuer Purchases Of Equity SecuritiesItem 6. Selected Financial DataItem 7. Management S Discussion and Analysis Of Financial Condition and Results Of OperationsItem 7A. Quantitative and Qualitative Disclosures About Market RiskItem 8. Financial Statements and Supplementary DataNote 1 Summary Of Significant Accounting PoliciesNote 2 Long-term Debt, Short-term Borrowings and Capital Lease ObligationsNote 3 Operating LeasesNote 4 Jfk Terminal 5Note 5 Stockholders EquityNote 6 Earnings Per ShareNote 7 Share-based CompensationNote 8 Income TaxesNote 9 Employee Retirement PlanNote 10 CommitmentsNote 11 ContingenciesNote 12 Financial Derivative Instruments and Risk ManagementNote 13 Fair ValueNote 14 Accumulated Other Comprehensive Income (loss)Note 15 Geographic InformationNote 16 Quarterly Financial Data (unaudited)Item 9. Changes and Disagreements with Accountants on Accounting and Financial DisclosureItem 9A. Controls and ProceduresItem 9B. Other InformationPart IIIItem 10. Directors, Executive Officers and Corporate GovernanceItem 11. Executive CompensationItem 12. Security Ownership Of Certain Beneficial Owners and Management and Related Stockholder MattersItem 13. Certain Relationships and Related Transactions, and Director IndependenceItem 14. Principal Accounting Fees and ServicesPart IVItem 15. Exhibits, Financial Statement SchedulesItem 16. Form 10-k Summary