SANFILIPPO JOHN B & SON INC
10-Ks and 10-Qs
|
|
|
|
|
|
|
|
|
|
|
|
|
|
|
|
|
|
|
|
|
|
|
|
|
|
|
|
|
|
|
|
|
|
|
|
|
|
|
|
|
|
|
|
|
|
|
|
|
|
|
|
|
UNITED STATES
SECURITIES AND EXCHANGE COMMISSION
Washington, D.C. 20549
FORM
10-Q
(Mark one)
|
|
QUARTERLY REPORT PURSUANT TO SECTION 13 OR 15(d) OF THE SECURITIES EXCHANGE ACT OF 1934
|
For the quarterly period ended
March 25,
2021
OR
|
|
TRANSITION REPORT PURSUANT TO SECTION 13 OR 15(d) OF THE SECURITIES EXCHANGE ACT OF 1934
|
Commission File Number
0-19681
(Exact Name of Registrant as Specified in Its Charter)
|
|
|
|
|
(State or Other Jurisdiction of
Incorporation or Organization)
|
(I.R.S. Employer
Identification No.)
|
|
|
|
|
|
(Address of Principal Executive Offices)
|
(Zip Code)
|
(
847
)
289-1800
(Registrant’s Telephone Number, Including Area Code)
Securities registered pursuant to Section 12(b) of the Act:
|
Title of Each Class
|
Trading
Symbol |
Name of Each Exchange
on Which Registered |
||
|
, $.01 par value per share
|
|
|
|
The NASDAQ
Stock Market LLC
(NASDAQ Global Select Market)
|
Securities registered pursuant to Section 12(g) of the Act: None
Indicate by check mark whether the registrant: (1) has filed all reports required to be filed by Section 13 or 15(d) of the Securities Exchange Act of 1934 during the preceding 12 months (or for such shorter period that the registrant was required to file such reports), and (2) has been subject to such filing requirements for the past
90 days. ☒
☐ No
Indicate by check mark whether the registrant has submitted electronically every Interactive Data File required to be submitted pursuant to Rule 405 of Regulation
S-T
during the preceding 12 months (or for such shorter period that the registrant was required to submit such files). ☒
☐ No
Indicate by check mark whether the registrant is a large accelerated filer, an accelerated filer, a
non-accelerated
filer, a smaller reporting company, or an emerging growth company. See the definitions of “large accelerated filer,” “accelerated filer”, “smaller reporting company” and “emerging growth company” in Rule
12b-2
of the Exchange Act. (Check One)
|
|
☒ | Accelerated filer | ☐ | |||
| Non-accelerated filer | ☐ | Smaller reporting company |
|
|||
| Emerging growth company |
|
|||||
If an emerging growth company, indicate by check mark if the registrant has elected not to use the extended transition period for complying with any new or revised financial accounting standards provided pursuant to Section 13(a) of the Exchange Act. ☐
Indicate by check mark whether the registrant is a shell company (as defined in Rule
☒
No
12b-2
of the Exchange Act). ☐ Yes
As of April 22, 2021,
8,870,912
shares of the Registrant’s Common Stock, $0.01 par value per share and
2,597,426
shares of the Registrant’s Class A Common Stock, $0.01 par value per share, were outstanding.
JOHN B. SANFILIPPO & SON, INC.
FORM
10-Q
FOR THE QUARTER ENDED MARCH 25, 2021
INDEX
|
|
|
Page
|
|
|
|
|
||||
|
|
||||
|
|
|
3
|
|
|
|
|
|
4
|
|
|
|
|
|
6
|
|
|
|
|
|
7
|
|
|
|
|
|
8
|
|
|
|
|
|
18
|
|
|
|
|
|
30
|
|
|
|
|
|
30
|
|
|
|
|
||||
|
|
|
30
|
|
|
|
|
|
30
|
|
|
|
|
|
30
|
|
|
|
|
|
31
|
|
|
|
|
|
35
|
|
|
2
PART I—FINANCIAL INFORMATION
Item 1. Financial Statements
JOHN B. SANFILIPPO & SON, INC.
CONSOLIDATED STATEMENTS OF COMPREHENSIVE INCOME
(Unaudited)
(Dollars in thousands, except share and per share amounts)
|
For the Quarter Ended
|
For the Thirty-Nine Weeks
Ended |
|||||||||||||||
|
March 25,
2021
|
March 26,
2020
|
March 25,
2021 |
March 26,
2020 |
|||||||||||||
|
Net sales
|
$ |
|
$ |
|
$ |
|
$ |
|
||||||||
|
Cost of sales
|
|
|
|
|
||||||||||||
|
|
|
|
|
|
|
|
|
|||||||||
|
Gross profit
|
|
|
|
|
||||||||||||
|
|
|
|
|
|
|
|
|
|||||||||
|
Operating expenses:
|
||||||||||||||||
|
Selling expenses
|
|
|
|
|
||||||||||||
|
Administrative expenses
|
|
|
|
|
||||||||||||
|
|
|
|
|
|
|
|
|
|||||||||
|
Total operating expenses
|
|
|
|
|
||||||||||||
|
|
|
|
|
|
|
|
|
|||||||||
|
Income from operations
|
|
|
|
|
||||||||||||
|
|
|
|
|
|
|
|
|
|||||||||
|
Other expense:
|
||||||||||||||||
|
Interest expense including $
|
|
|
|
|
||||||||||||
|
Rental and miscellaneous expense, net
|
|
|
|
|
||||||||||||
|
Other expense
|
|
|
|
|
||||||||||||
|
|
|
|
|
|
|
|
|
|||||||||
|
Total other expense, net
|
|
|
|
|
||||||||||||
|
|
|
|
|
|
|
|
|
|||||||||
|
Income before income taxes
|
|
|
|
|
||||||||||||
|
Income tax expense
|
|
|
|
|
||||||||||||
|
|
|
|
|
|
|
|
|
|||||||||
|
Net income
|
$ |
|
$ |
|
$ |
|
$ |
|
||||||||
|
Other comprehensive income:
|
||||||||||||||||
|
Amortization of prior service cost and actuarial loss included in net periodic pension cost
|
|
|
|
|
||||||||||||
|
Income tax expense related to pension adjustments
|
(
|
) |
(
|
) |
(
|
) |
(
|
) | ||||||||
|
|
|
|
|
|
|
|
|
|||||||||
|
Other comprehensive income, net of tax
|
|
|
|
|
||||||||||||
|
|
|
|
|
|
|
|
|
|||||||||
|
Comprehensive income
|
$ |
|
$ |
|
$ |
|
$ |
|
||||||||
|
|
|
|
|
|
|
|
|
|||||||||
|
Net income per common share-basic
|
$ |
|
$ |
|
$ |
|
$ |
|
||||||||
|
|
|
|
|
|
|
|
|
|||||||||
|
Net income per common share-diluted
|
$ |
|
$ |
|
$ |
|
$ |
|
||||||||
|
|
|
|
|
|
|
|
|
|||||||||
The accompanying unaudited notes are an integral part of these consolidated financial statements.
3
JOHN B. SANFILIPPO & SON, INC.
CONSOLIDATED BALANCE SHEETS
(Unaudited)
(Dollars in thousands, except share and per share amounts)
|
March 25,
2021
|
June 25,
2020
|
March 26,
2020
|
||||||||||
|
ASSETS
|
||||||||||||
|
CURRENT ASSETS:
|
||||||||||||
|
Cash
|
$ |
|
$ |
|
$ |
|
||||||
|
Accounts receivable, less allowance for doubtful accounts of $
|
|
|
|
|||||||||
|
Inventories
|
|
|
|
|||||||||
|
Prepaid expenses and other current assets
|
|
|
|
|||||||||
|
|
|
|
|
|
|
|||||||
|
TOTAL CURRENT ASSETS
|
|
|
|
|||||||||
|
PROPERTY, PLANT AND EQUIPMENT:
|
||||||||||||
|
Land
|
|
|
|
|||||||||
|
Buildings
|
|
|
|
|||||||||
|
Machinery and equipment
|
|
|
|
|||||||||
|
Furniture and leasehold improvements
|
|
|
|
|||||||||
|
Vehicles
|
|
|
|
|||||||||
|
Construction in progress
|
|
|
|
|||||||||
|
|
|
|
||||||||||
|
Less: Accumulated depreciation
|
|
|
|
|||||||||
|
|
|
|
||||||||||
|
Rental investment property, less accumulated depreciation of $
|
|
|
|
|||||||||
|
|
|
|
|
|
|
|||||||
|
TOTAL PROPERTY, PLANT AND EQUIPMENT
|
|
|
|
|||||||||
|
|
|
|
|
|
|
|||||||
|
Intangible assets, net
|
|
|
|
|||||||||
|
Cash surrender value of officers’ life insurance and other assets
|
|
|
|
|||||||||
|
Deferred income taxes
|
|
|
|
|||||||||
|
Goodwill
|
|
|
|
|||||||||
|
Operating lease
right-of-use
|
|
|
|
|||||||||
|
|
|
|
|
|
|
|||||||
|
TOTAL ASSETS
|
$ |
|
$ |
|
$ |
|
||||||
|
|
|
|
|
|
|
|||||||
The accompanying unaudited notes are an integral part of these consolidated financial statements.
4
JOHN B. SANFILIPPO & SON, INC.
CONSOLIDATED BALANCE SHEETS
(Unaudited)
(Dollars in thousands, except share and per share amounts)
|
March 25,
2021
|
June 25,
2020
|
March 26,
2020
|
||||||||||
|
LIABILITIES & STOCKHOLDERS’ EQUITY
|
||||||||||||
|
CURRENT LIABILITIES:
|
||||||||||||
|
Revolving credit facility borrowings
|
$ |
|
$ |
|
$ |
|
||||||
|
Current maturities of long-term debt, including related party debt of $
|
|
|
|
|||||||||
|
Accounts payable
|
|
|
|
|||||||||
|
Bank overdraft
|
|
|
|
|||||||||
|
Accrued payroll and related benefits
|
|
|
|
|||||||||
|
Other accrued expenses
|
|
|
|
|||||||||
|
TOTAL CURRENT LIABILITIES
|
|
|
|
|||||||||
|
|
|
|
|
|
|
|||||||
|
LONG-TERM LIABILITIES:
|
||||||||||||
|
Long-term debt, less current maturities, including related party debt of $
|
|
|
|
|||||||||
|
Retirement plan
|
|
|
|
|||||||||
|
Long-term operating lease liabilities, net of current portion
|
|
|
|
|||||||||
|
Other
|
|
|
|
|||||||||
|
|
|
|
|
|
|
|||||||
|
TOTAL LONG-TERM LIABILITIES
|
|
|
|
|||||||||
|
|
|
|
|
|
|
|||||||
|
TOTAL LIABILITIES
|
|
|
|
|||||||||
|
|
|
|
|
|
|
|||||||
|
COMMITMENTS AND CONTINGENCIES
|
|
|
|
|||||||||
|
STOCKHOLDERS’ EQUITY:
|
||||||||||||
|
Class A Common Stock, convertible to Common Stock on a per share basis, cumulative voting rights of ten votes per share, $
par value;
|
|
|
|
|||||||||
|
Common Stock,
non-cumulative
voting rights of one vote per share, $
par value;
|
|
|
|
|||||||||
|
Capital in excess of par value
|
|
|
|
|||||||||
|
Retained earnings
|
|
|
|
|||||||||
|
Accumulated other comprehensive loss
|
(
|
) |
(
|
) |
(
|
) | ||||||
|
Treasury stock, at cost;
|
(
|
) |
(
|
) |
(
|
) | ||||||
|
|
|
|
|
|
|
|||||||
|
TOTAL STOCKHOLDERS’ EQUITY
|
|
|
|
|||||||||
|
|
|
|
|
|
|
|||||||
|
TOTAL LIABILITIES & STOCKHOLDERS’ EQUITY
|
$ |
|
$ |
|
$ |
|
||||||
|
|
|
|
|
|
|
|||||||
The accompanying unaudited notes
are
an integral part of these consolidated financial statements.
5
JOHN B. SANFILIPPO & SON, INC.
CONSOLIDATED STATEMENTS OF STOCKHOLDERS’ EQUITY
(Unaudited)
(Dollars in thousands, except share and per share amounts)
|
Class A Common
Stock |
Common Stock
|
Capital in
Excess of Par Value |
Retained
Earnings |
Accumulated
Other Comprehensive Loss |
Treasury
Stock |
||||||||||||||||||||||||||||||||||||||||
|
Shares
|
Amount
|
Shares
|
Amount
|
Total
|
|||||||||||||||||||||||||||||||||||||||||
|
Balance, June 25, 2020
|
|
$ |
|
|
$ |
|
$ |
|
$ |
|
$ |
(
|
) | $ |
(
|
) | $ |
|
|||||||||||||||||||||||||||
|
Net income
|
|
|
|||||||||||||||||||||||||||||||||||||||||||
|
Cash dividends ($
|
(
|
) |
(
|
) | |||||||||||||||||||||||||||||||||||||||||
|
Pension liability amortization, net of income tax expense of $
|
|
|
|||||||||||||||||||||||||||||||||||||||||||
|
Equity award exercises
|
|
— | — | — | |||||||||||||||||||||||||||||||||||||||||
|
Stock-based compensation expense
|
|
|
|||||||||||||||||||||||||||||||||||||||||||
|
|
|
|
|
|
|
|
|
|
|
|
|
|
|
|
|
|
|
||||||||||||||||||||||||||||
|
Balance, September 24, 2020
|
|
$ |
|
|
$ |
|
$ |
|
$ |
|
$ |
(
|
) | $ |
(
|
) | $ |
|
|||||||||||||||||||||||||||
|
Net income
|
|
|
|||||||||||||||||||||||||||||||||||||||||||
|
Pension liability amortization, net of income tax expense of $
|
|
|
|||||||||||||||||||||||||||||||||||||||||||
|
Equity award exercises , net of shares withheld for employee taxes
|
|
|
(
|
) |
(
|
) | |||||||||||||||||||||||||||||||||||||||
|
Stock-based compensation expense
|
|
|
|||||||||||||||||||||||||||||||||||||||||||
|
|
|
|
|
|
|
|
|
|
|
|
|
|
|
|
|
|
|
||||||||||||||||||||||||||||
|
Balance, December 24, 2020
|
|
$ |
|
|
$ |
|
$ |
|
$ |
|
$ |
(
|
) | $ |
(
|
) | $ |
|
|||||||||||||||||||||||||||
|
Net income
|
|
|
|||||||||||||||||||||||||||||||||||||||||||
|
Cash dividends ($
|
(
|
) |
(
|
) | |||||||||||||||||||||||||||||||||||||||||
|
Pension liability amortization, net of income tax expense of $
|
|
|
|||||||||||||||||||||||||||||||||||||||||||
|
Equity award exercises , net of shares withheld for employee taxes
|
|
— |
(
|
) |
(
|
) | |||||||||||||||||||||||||||||||||||||||
|
Stock-based compensation expense
|
|
|
|||||||||||||||||||||||||||||||||||||||||||
|
|
|
|
|
|
|
|
|
|
|
|
|
|
|
|
|
|
|
||||||||||||||||||||||||||||
|
Balance, March 25, 2021
|
|
$ |
|
|
$ |
|
$ |
|
$ |
|
$ |
(
|
) | $ |
(
|
) | $ |
|
|||||||||||||||||||||||||||
|
|
|
|
|
|
|
|
|
|
|
|
|
|
|
|
|
|
|
|
|
|
|
|
|
|
|
|
|
|
|
|
|
|
|
|
|
|
|
|
|
|
|
|
|
|
|
|
|
|
|
|
|
|
|
|
|
|
|
|
|
|
|
|
|
|
||||||||||||||||||||||||||||
|
Class A Common
Stock |
Common Stock
|
Capital in
Excess of Par Value |
Retained
Earnings |
Accumulated
Other Comprehensive Loss |
Treasury
Stock |
|||||||||||||||||||||||||||||||||
|
Shares
|
Amount
|
Shares
|
Amount
|
Total
|
||||||||||||||||||||||||||||||||||
|
Balance, June 27, 2019
|
|
$ |
|
|
$ |
|
$ |
|
$ |
|
$ |
(
|
) | $ |
(
|
) | $ |
|
||||||||||||||||||||
|
Net income
|
|
|
||||||||||||||||||||||||||||||||||||
|
Cash dividends ($
|
(
|
) |
(
|
) | ||||||||||||||||||||||||||||||||||
|
Pension liability amortization, net of income tax expense of $
|
|
|
||||||||||||||||||||||||||||||||||||
|
Impact of adopting ASU
2018-02
|
|
(
|
) |
|
||||||||||||||||||||||||||||||||||
|
Stock-based compensation expense
|
|
|
||||||||||||||||||||||||||||||||||||
|
|
|
|
|
|
|
|
|
|
|
|
|
|
|
|
|
|
|
|||||||||||||||||||||
|
Balance, September 26, 2019
|
|
$ |
|
|
$ |
|
$ |
|
$ |
|
$ |
(
|
) | $ |
(
|
) | $ |
|
||||||||||||||||||||
|
Net income
|
|
|
||||||||||||||||||||||||||||||||||||
|
Cash dividends ($
|
(
|
) |
(
|
) | ||||||||||||||||||||||||||||||||||
|
Pension liability amortization, net of income tax expense of $
|
|
|
||||||||||||||||||||||||||||||||||||
|
Equity award exercises , net of shares withheld for employee taxes
|
|
— |
(
|
) |
(
|
) | ||||||||||||||||||||||||||||||||
|
Stock-based compensation expense
|
|
|
||||||||||||||||||||||||||||||||||||
|
|
|
|
|
|
|
|
|
|
|
|
|
|
|
|
|
|
|
|||||||||||||||||||||
|
Balance, December 26, 2019
|
|
$ |
|
|
$ |
|
$ |
|
$ |
|
$ |
(
|
) | $ |
(
|
) | $ |
|
||||||||||||||||||||
|
Net income
|
|
|
||||||||||||||||||||||||||||||||||||
|
Pension liability amortization, net of income tax expense of $
|
|
|
||||||||||||||||||||||||||||||||||||
|
Equity award exercises , net of shares withheld for employee taxes
|
|
— |
(
|
) |
(
|
) | ||||||||||||||||||||||||||||||||
|
Stock-based compensation expense
|
|
|
||||||||||||||||||||||||||||||||||||
|
|
|
|
|
|
|
|
|
|
|
|
|
|
|
|
|
|
|
|||||||||||||||||||||
|
Balance, March 26, 2020
|
|
$ |
|
|
$ |
|
$ |
|
$ |
|
$ |
(
|
) | $ |
(
|
) | $ |
|
||||||||||||||||||||
|
|
|
|
|
|
|
|
|
|
|
|
|
|
|
|
|
|
|
|
|
|
|
|
|
|
|
|
|
|
|
|
|
|
|
|
|
|
|
|
|
|
|
|
|
|
|
|
|
|
|
|
|
|
|
|
|
|
|
|||||||||||||||||||||
The accompanying unaudited notes are an integral part of these consolidated financial statements.
6
JOHN B. SANFILIPPO & SON, INC.
CONSOLIDATED STATEMENTS OF CASH FLOWS
(Unaudited)
(Dollars in thousands)
|
For the Thirty-Nine
|
||||||||
|
March 25,
|
March 26,
|
|||||||
|
CASH FLOWS FROM OPERATING ACTIVITIES:
|
||||||||
|
Net income
|
$ |
|
$ |
|
||||
|
Depreciation and amortization
|
|
|
||||||
|
Gain on disposition of assets, net
|
(
|
) |
(
|
) | ||||
|
Deferred income tax expense (benefit)
|
|
(
|
) | |||||
|
Stock-based compensation expense
|
|
|
||||||
|
Change in assets and liabilities:
|
||||||||
|
Accounts receivable, net
|
(
|
) |
(
|
) | ||||
|
Inventories
|
|
(
|
) | |||||
|
Prepaid expenses and other current assets
|
|
|
||||||
|
Accounts payable
|
|
|
||||||
|
Accrued expenses
|
(
|
) |
(
|
) | ||||
|
Income taxes payable
|
(
|
) |
|
|||||
|
Other long-term assets and liabilities
|
|
|
||||||
|
Other, net
|
|
|
||||||
|
|
|
|
|
|||||
|
Net cash provided by operating activities
|
|
|
||||||
|
|
|
|
|
|||||
|
CASH FLOWS FROM INVESTING ACTIVITIES:
|
||||||||
|
Purchases of property, plant and equipment
|
(
|
) |
(
|
) | ||||
|
Proceeds from insurance recoveries
|
|
|
||||||
|
Other
|
(
|
) |
(
|
) | ||||
|
Net cash used in investing activities
|
(
|
) |
(
|
) | ||||
|
CASH FLOWS FROM FINANCING ACTIVITIES:
|
||||||||
|
Net short-term (repayments) borrowings
|
(
|
) |
|
|||||
|
Debt issue costs
|
— |
(
|
) | |||||
|
Principal payments on long-term debt
|
(
|
) |
(
|
) | ||||
|
(Decrease) increase in bank overdraft
|
(
|
) |
|
|||||
|
Dividends paid
|
(
|
) |
(
|
) | ||||
|
Taxes paid related to net share settlement of equity awards
|
(
|
) |
(
|
) | ||||
|
|
|
|
|
|||||
|
Net cash used in financing activities
|
(
|
) |
(
|
) | ||||
|
NET DECREASE IN CASH
|
(
|
) |
(
|
) | ||||
|
Cash, beginning of period
|
|
|
||||||
|
|
|
|
|
|||||
|
Cash, end of period
|
$ |
|
$ |
|
||||
|
|
|
|
|
|||||
|
Supplemental disclosure of
non-cash
activities:
|
||||||||
|
Right-of-use
No. 2016-02
transition
|
— | $ |
|
|||||
The accompanying unaudited notes are an integral part of these consolidated financial statements.
7
JOHN B. SANFILIPPO & SON, INC.
NOTES TO CONSOLIDATED FINANCIAL STATEMENTS
(Unaudited)
(Dollars in thousands, except where noted and per share data)
Note 1 – Basis of Presentation and Description of Business
As used herein, unless the context otherwise indicates, the terms “we”, “us”, “our” or “Company” collectively refer to John B. Sanfilippo & Son, Inc. and our wholly-owned subsidiary, JBSS Ventures, LLC. Our fiscal year ends on the final Thursday of June each year, and typically consists of
fifty-two
weeks (four thirteen-week quarters). Additional information on the comparability of the periods presented is as follows:
| • |
References herein to fiscal 2021 and fiscal 2020 are to the fiscal year ending June 24, 2021 and the fiscal year ended June 25, 2020, respectively.
|
| • |
References herein to the third quarter of fiscal 2021 and fiscal 2020 are to the quarters ended March 25, 2021 and March 26, 2020, respectively.
|
| • |
References herein to the first three quarters or first thirty-nine weeks of fiscal 2021 and fiscal 2020 are to the thirty-nine weeks ended March 25, 2021 and March 26, 2020, respectively.
|
We are one of the leading processors and distributors of peanuts, pecans, cashews, walnuts, almonds, and other nuts in the United States. These nuts are sold under our
,
,
,
and
brand names and under a variety of private brands. We also market and distribute, and in most cases, manufacture or process, a diverse product line of food and snack products, including peanut butter, almond butter, cashew butter, candy and confections, snacks and trail mixes, snack bites, sunflower kernels, dried fruit, corn snacks, chickpea snacks, sesame sticks and other sesame snack products under our brand names and under private brands. Our products are sold through
three
primary distribution channels, including food retailers in the consumer channel, commercial ingredient users and contract packaging customers.
Fisher
Orchard Valley Harvest
Squirrel Brand
Southern Style Nuts
Sunshine Country
The accompanying unaudited financial statements fairly present the consolidated statements of comprehensive income, consolidated balance sheets, consolidated statements of stockholders’ equity and consolidated statements of cash flows, and reflect all adjustments, consisting only of normal recurring adjustments which are necessary for the fair statement of the results of the interim periods. Preparing financial statements requires management to make estimates and assumptions that affect the reported amounts of assets, liabilities, revenues and expenses.
The interim results of operations are not necessarily indicative of the results to be expected for a full year. The balance sheet data as of June 25, 2020 was derived from audited financial statements, but does not include all disclosures required by accounting principles generally accepted in the United States of America (“GAAP”). Accordingly, these unaudited financial statements and related notes should be read in conjunction with the audited consolidated financial statements and notes thereto included in our 2020 Annual Report on Form
10-K
for the fiscal year ended June 25, 2020.
Note 2 – Revenue Recognition
We recognize revenue to depict the transfer of promised goods or services to customers in an amount that reflects the consideration to which we expect to be entitled in exchange for those goods or services. For each customer contract, a five-step process is followed in which we identify the contract, identify performance obligations, determine the transaction price, allocate the contract transaction price to the performance obligations, and recognize the revenue when (or as) the performance obligation is transferred to the customer.
When Performance Obligations Are Satisfied
A performance obligation is a promise in a contract to transfer a distinct good or service to the customer and is the unit of account for revenue recognition. A contract’s transaction price is allocated to each distinct performance obligation and recognized as revenue when, or as, the performance obligation is satisfied. The Company’s performance obligations are primarily for the delivery of raw and processed recipe and snack nuts, nut butters and trail mixes.
8
Our customer contracts do not include more than one performance obligation. If a contract were to contain more than one performance obligation, we are required to allocate the contract’s transaction price to each performance obligation based on its relative standalone selling price. The standalone selling price for each distinct good is generally determined by directly observable data.
Revenue recognition is generally completed at a point in time when product control is transferred to the customer. For virtually all of our revenues, control transfers to the customer when the product is shipped or delivered to the customer based upon applicable shipping terms, as the customer can then direct the use and obtain substantially all of the remaining benefits from the asset at that point in time. Therefore, the timing of our revenue recognition requires little judgment.
Variable Consideration
Some of our products are sold through specific incentive programs consisting of promotional allowances, volume and customer rebates,
in-store
display incentives and marketing allowances, among others, to consumer and some commercial ingredient customers. The ultimate cost of these programs is dependent on certain factors such as actual purchase volumes or customer activities and is dependent on significant management judgment when determining estimates. The Company accounts for these programs as variable consideration and recognizes a reduction in revenue (and a corresponding reduction in the transaction price) in the same period as the underlying program based upon the terms of the specific arrangements.
Trade promotions, consisting primarily of customer pricing allowances, merchandising funds and consumer coupons, are also offered through various programs to customers and consumers. A provision for estimated trade promotions is recorded as a reduction of revenue (and a reduction in the transaction price) in the same period when the sale is recognized. Revenues are also recorded net of expected customer deductions which are provided for based upon past experiences. Evaluating these estimates requires management judgment.
We generally use the most likely amount method to determine the variable consideration. We believe there will not be significant changes to our estimates of variable consideration when any related uncertainties are resolved with our customers. The Company reviews and updates its estimates and related accruals of variable consideration and trade promotions at least quarterly based on the terms of the agreements and historical experience. Any uncertainties in the ultimate resolution of variable consideration due to factors outside of the Company’s influence are typically resolved within a short timeframe, therefore, no additional constraint on the variable consideration is required.
Contract Balances
Contract assets or liabilities result from transactions with revenue recorded over time. If the measure of remaining rights exceeds the measure of the remaining performance obligations the Company records a contract asset. Conversely, if the measure of the remaining performance obligations exceeds the measure of the remaining rights, the Company records a contract liability. There was
no
contract asset balance for any periods presented. The Company generally does not have material deferred revenue or contract liability balances arising from transactions with customers.
Disaggregation of Revenue
Revenue disaggregated by sales channel is as follows:
|
For the Quarter Ended
|
For the Thirty-Nine
Ended |
|||||||||||||||
|
Distribution Channel
|
March 25,
2021
|
March 26,
2020
|
March 25,
2021
|
March 26,
2020
|
||||||||||||
|
Consumer
|
$ |
|
$ |
|
$ |
|
$ |
|
||||||||
|
Commercial Ingredients
|
|
|
|
|
||||||||||||
|
Contract Packaging
|
|
|
|
|
||||||||||||
|
|
|
|
|
|
|
|
|
|||||||||
|
Total
|
$ |
|
$ |
|
$ |
|
$ |
|
||||||||
|
|
|
|
|
|
|
|
|
|||||||||
9
Note 3 – Leases
Description of Leases
We lease equipment used in the transportation of goods in our warehouses, as well as a limited number of automobiles and a small warehouse near our Bainbridge, Georgia facility. Our leases generally do not contain
non-lease
components and do not contain any explicit guarantees of residual value. Our leases for warehouse transportation equipment generally require the equipment to be returned to the lessor in good working order.
We determine if an arrangement is a lease at inception and analyze the lease to determine if it is operating or finance. Operating lease
assets represent our right to use an underlying asset for the lease term and lease liabilities represent our obligation to make lease payments arising from the lease. Operating lease
assets and liabilities are recognized at the lease commencement date based on the present value of lease payments over the lease term. As most of our leases do not provide an implicit rate, we use our incremental collateralized borrowing rate based on the information available at the commencement date in determining the present value of lease payments. Implicit rates are used when readily determinable. None of our leases currently contain options to extend the term. In the event of an option to extend the term of a lease, the lease term used in measuring the liability would include options to extend or terminate the lease if it is reasonably certain that the Company will exercise that option. Lease expense for operating lease payments is recognized on a straight-line basis over the respective lease term. Our leases have remaining terms of up to
5.3
years.
right-of-use
right-of-use
It is our accounting policy to not apply lease recognition requirements to short term leases, defined as leases with an initial term of 12 months or less. As such, leases with an initial term of 12 months or less are not recorded in the Consolidated Balance Sheet. We have also made the policy election to not separate lease and
non-lease
components for all leases.
The following table provides supplemental information related to operating lease
assets and liabilities:
right-of-use
|
March 25,
2021
|
June 25,
2020
|
March 26,
2020 |
Affected Line Item in
Consolidated Balance Sheet |
|||||||||||||
|
Assets
|
||||||||||||||||
|
Operating lease
right-of-use
|
$ |
|
$ |
|
$ |
|
Operating lease
right-of-use
|
|||||||||
|
|
|
|
|
|
|
|||||||||||
|
Total lease
right-of-use
|
$ |
|
$ |
|
$ |
|
||||||||||
|
|
|
|
|
|
|
|||||||||||
|
Liabilities
|
||||||||||||||||
|
Current:
|
||||||||||||||||
|
Operating leases
|
$ |
|
$ |
|
$ |
|
Other accrued expenses
|
|||||||||
|
Noncurrent:
|
||||||||||||||||
|
Operating leases
|
|
|
|
Long-term operating lease liabilities
|
||||||||||||
|
|
|
|
|
|
|
|||||||||||
|
Total lease liabilities
|
$ |
|
$ |
|
$ |
|
||||||||||
|
|
|
|
|
|
|
|||||||||||
The following tables summarize the Company’s total lease costs and other information arising from operating lease transactions:
|
For the Quarter Ended
|
For the Thirty-nine
|
|||||||||||||||
|
March 25,
2021
|
March 26,
2020
|
March 25,
2021
|
March 26,
2020 |
|||||||||||||
|
Operating lease costs
(a)
|
$ |
|
$ |
|
$ |
|
$ |
|
||||||||
|
Variable lease costs
(b)
|
|
|
|
|
||||||||||||
|
Total Lease Cost
|
$ |
|
$ |
|
$ |
|
$ |
|
||||||||
|
|
|
|
|
|
|
|
|
|||||||||
|
(a)
|
Includes short-term leases which are immaterial.
|
|
(b)
|
Variable lease costs consist of sales tax.
|
10
Supplemental cash flow and other information related to leases was as follows:
|
For the Thirty-nine
|
||||||||
|
March 25,
2021 |
March 26,
2020 |
|||||||
|
Operating cash flows information:
|
||||||||
|
Cash paid for amounts included in measurements for lease liabilities
|
$ |
|
$ |
|
||||
|
Non-cash
activity:
|
||||||||
|
Right-of-use
|
$ |
|
$ |
|
||||
|
March 25,
2021 |
June 25,
2020
|
March 26,
2020 |
||||||||||
|
Weighted Average Remaining Lease Term (in years)
|
|
|
|
|||||||||
|
Weighted Average Discount Rate
|
|
% |
|
% |
|
% | ||||||
Maturities of operating lease liabilities as of March 25, 2021 are as follows:
|
Fiscal year ending
|
||||
|
June 24, 2021 (excluding the thirty-nine weeks ended March 25, 2021)
|
$ |
|
||
|
June 30, 2022
|
|
|||
|
June 29, 2023
|
|
|||
|
June 27, 2024
|
|
|||
|
June 26, 2025
|
|
|||
|
June 25, 2026
|
|
|||
|
Thereafter
|
|
|||
|
|
|
|||
|
Total lease payment
|
|
|||
|
Less imputed interest
|
(
|
) | ||
|
|
|
|||
|
Present value of operating lease liabilities
|
$ |
|
||
|
|
|
Lessor Accounting
We lease office space in our four-story office building located in Elgin, Illinois. As a lessor, we retain substantially all of the risks and benefits of ownership of the investment property and under Topic 842 we continue to account for all of our leases as operating leases. Lease agreements may include options to renew. We accrue fixed lease income on a
straight-line
basis over the terms of the leases. There is generally no variable lease consideration and an immaterial amount of
non-lease
components such as recurring utility and storage fees. Leases between related parties are immaterial.
Leasing revenue is as follows:
|
For the Quarter ended
|
For the Thirty-nine
|
|||||||||||||||
|
March 25,
2021 |
March 26,
2020 |
March 25,
2021 |
March 26,
2020 |
|||||||||||||
|
Lease income related to lease payments
|
$ |
|
$ |
|
$ |
|
$ |
|
||||||||
11
The future minimum, undiscounted fixed cash flows under
non-cancelable
tenant operating leases for each of the next five years and thereafter is presented below.
|
Fiscal year ending
|
||||
|
June 24, 2021 (excluding the thirty-nine weeks ended March 25, 2021)
|
$ |
|
||
|
June 30, 2022
|
|
|||
|
June 29, 2023
|
|
|||
|
June 27, 2024
|
|
|||
|
June 26, 2025
|
|
|||
|
June 25, 2026
|
|
|||
|
Thereafter
|
|
|||
|
|
|
|||
| $ |
|
Note 4 – Inventories
Inventories consist of the following:
|
March 25,
2021
|
June 25,
2020
|
March 26,
2020
|
||||||||||
|
Raw material and supplies
|
$ |
|
$ |
|
$ |
|
||||||
|
Work-in-process
|
|
|
|
|||||||||
|
|
|
|
|
|
|
|||||||
|
Total
|
$ |
|
$ |
|
$ |
|
||||||
|
|
|
|
|
|
|
|||||||
Note 5 – Goodwill and Intangible Assets
Identifiable intangible assets that are subject to amortization consist of the following:
|
March 25,
|
June 25,
|
March 26,
|
||||||||||
|
Customer relationships
|
$ |
|
$ |
|
$ |
|
||||||
|
Brand names
|
|
|
|
|||||||||
|
Non-compete
agreement
|
|
|
|
|||||||||
|
|
|
|
|
|
|
|||||||
|
|
|
|
||||||||||
|
Less accumulated amortization:
|
||||||||||||
|
Customer relationships
|
(
|
) |
(
|
) |
(
|
) | ||||||
|
Brand names
|
(
|
) |
(
|
) |
(
|
) | ||||||
|
Non-compete
agreement
|
(
|
) |
(
|
) |
(
|
) | ||||||
|
|
|
|
|
|
|
|||||||
|
(
|
) |
(
|
) |
(
|
) | |||||||
|
|
|
|
|
|
|
|||||||
|
Net intangible assets
|
$ |
|
$ |
|
$ |
|
||||||
|
|
|
|
|
|
|
|||||||
Customer relationships are being amortized on an accelerated basis. The brand names remaining to be amortized consist of the
and
brand names.
Squirrel Brand
Southern Style Nuts
Total amortization expense related to intangible assets, which is recorded within Administrative expense, was $
504
and $
1,661
for the quarter and thirty-nine weeks ended March 25, 2021, respectively. Amortization expense for the remainder of fiscal 2021 is expected to be approximately $
504
and
expected amortization expense the next five fiscal years is as follows:
|
Fiscal year ending
|
||||
|
June 30, 2022
|
$ |
|
||
|
June 29, 2023
|
|
|||
|
June 27, 2024
|
|
|||
|
June 26, 2025
|
|
|||
|
June 25, 2026
|
|
|||
12
Our net goodwill of $
9,650
relates entirely to the Squirrel Brand acquisition completed in the second quarter of fiscal 2018. There was no change in the carrying amount of goodwill during the thirty-nine weeks ended March 25, 2021.
Note 6 – Credit Facility
Our Amended and Restated Credit Agreement dated March 5, 2020 provides for a $
117,500
senior secured revolving credit facility (the “Credit Facility”). The Credit Facility is secured by substantially all our assets other than machinery and equipment, real property and fixtures.
At March 25, 2021, we had $
88,310
of available credit under the Credit Facility which reflects borrowings of $
26,005
and reduced availability as a result of $
3,185
in outstanding letters of credit. As of March 25, 2021, we were in compliance with all financial covenants under the Credit Facility and Mortgage Facility (as defined below).
Note 7 – Earnings Per Common Share
The following table presents the reconciliation of the weighted average shares outstanding used in computing basic and diluted earnings per share:
|
For the Quarter Ended
|
For the Thirty-Nine Weeks
Ended |
|||||||||||||||
|
March 25,
2021
|
March 26,
2020
|
March 25,
2021
|
March 26,
2020
|
|||||||||||||
|
Weighted average number of shares outstanding – basic
|
|
|
|
|
||||||||||||
|
Effect of dilutive securities:
|
||||||||||||||||
|
Stock options and restricted stock units
|
|
|
|
|
||||||||||||
|
|
|
|
|
|
|
|
|
|||||||||
|
Weighted average number of shares outstanding – diluted
|
|
|
|
|
||||||||||||
|
|
|
|
|
|
|
|
|
|||||||||
The following table presents a summary of anti-dilutive awards excluded from the computation of diluted earnings per share:
|
For the Quarter Ended
|
For the Thirty-Nine Weeks
Ended
|
|||||||||||||||
|
March 25,
2021
|
March 26,
2020
|
March 25,
2021
|
March 26,
2020
|
|||||||||||||
|
Weighted average number of anti-dilutive awards:
|
|
|
|
|
||||||||||||
|
Weighted average exercise price per award:
|
$ |
|
$ |
|
$ |
|
$ |
|
||||||||
Note 8 – Stock-Based Compensation Plans
The following is a summary of restricted stock unit (“RSU”) activity for the first thirty-nine weeks of fiscal 2021:
|
Restricted Stock Units
|
Shares
|
Weighted
Average Grant Date Fair Value |
||||||
|
Outstanding at June 25,
|
|
$ |
|
|||||
|
Activity:
|
||||||||
|
Granted
|
|
|
||||||
|
Vested
(a)
|
(
|
) |
|
|||||
|
Forfeited
|
(
|
) |
|
|||||
|
|
|
|
|
|||||
|
Outstanding at March 25, 2021
|
|
$ |
|
|||||
|
|
|
|
|
|||||
|
(a)
|
The number of RSUs vested includes shares that were withheld on behalf of employees to satisfy the statutory income tax withholding requirements.
|
13
At March 25, 2021, there are
47,127
RSUs outstanding that are vested but deferred.
The following table summarizes compensation expense charged to earnings for all equity compensation plans for the periods presented:
|
For the Quarter Ended
|
For the Thirty-Nine
Ended
|
|||||||||||||||
|
March 25,
2021
|
March 26,
2020
|
March 25,
2021
|
March 26,
2020
|
|||||||||||||
|
Stock-based compensation expense
|
$ |
|
$ |
|
$ |
|
$ |
|
||||||||
As of March 25, 2021, there was $
4,602
of total unrecognized compensation expense related to
1.6
years.
non-vested
RSUs granted under our stock-based compensation plans. We expect to recognize that cost over a weighted average period of
Note 9 – Retirement Plan
The Supplemental Employee Retirement Plan is an unfunded,
The components of net periodic benefit cost are as follows:
non-qualified
deferred compensation plan that will provide eligible participants with monthly benefits upon retirement, disability or death, subject to certain conditions. The monthly benefit is based upon each participant’s earnings and his or her number of years of service.
|
For the Quarter Ended
|
For the Thirty-Nine
Ended |
|||||||||||||||
|
March 25,
2021
|
March 26,
2020
|
March 25,
2021
|
March 26,
2020
|
|||||||||||||
|
Service cost
|
$ |
|
$ |
|
$ |
|
$ |
|
||||||||
|
Interest cost
|
|
|
|
|
||||||||||||
|
Amortization of prior service cost
|
|
|
|
|
||||||||||||
|
Amortization of loss
|
|
|
|
|
||||||||||||
|
|
|
|
|
|
|
|
|
|||||||||
|
Net periodic benefit cost
|
$ |
|
$ |
|
$ |
|
$ |
|
||||||||
|
|
|
|
|
|
|
|
|
|||||||||
The components of net periodic benefit cost other than the service cost component are included in the line item “Other expense” in the Consolidated Statements of Comprehensive Income.
Note 10 – Accumulated Other Comprehensive Loss
The table below sets forth the changes to accumulated other comprehensive loss (“AOCL”) for the thirty-nine weeks ended March 25, 2021 and March 26, 2020.
These changes are all related to our defined benefit pension plan.
|
For the Thirty-Nine
Weeks Ended |
||||||||
|
Changes to AOCL
(a)
|
March 25,
2021
|
March 26,
2020
|
||||||
|
Balance at beginning of period
|
$ |
(
|
) | $ |
(
|
) | ||
|
Other comprehensive income before reclassifications
|
|
|
||||||
|
Amounts reclassified from accumulated other comprehensive loss
|
|
|
||||||
|
Tax effect
|
(
|
) |
(
|
) | ||||
|
|
|
|
|
|||||
|
Net current-period other comprehensive income
|
|
|
||||||
|
Impact of adopting ASU
2018-02
|
— |
(
|
) | |||||
|
|
|
|
|
|||||
|
Balance at end of period
|
$ |
(
|
) | $ |
(
|
) | ||
|
|
|
|
|
|||||
|
(a)
|
Amounts in parenthesis indicate debits/expense.
|
14
The reclassifications out of AOCL for the quarter and thirty-nine weeks ended March 25, 2021 and March 26, 2020 were as follows:
|
|
|
|
|
|
|
|
|
|
|
|
|
|
|
Affected line
item in
the Consolidated
Statements of Comprehensive Income |
|
|||||
|
Reclassifications from AOCL to earnings
(b)
|
|
For the Quarter Ended
|
|
|
For the Thirty-Nine Weeks
Ended |
|
||||||||||||||
|
|
March 25,
2021
|
|
|
March 26,
2020
|
|
|
March 25,
2021
|
|
|
March 26,
2020
|
|
|||||||||
|
Amortization of defined benefit pension items:
|
|
|
|
|
|
|||||||||||||||
|
Unrecognized prior service cost
|
|
$
|
(
|
)
|
|
$
|
(
|
)
|
|
$
|
(
|
)
|
|
$
|
(
|
)
|
|
|
Other expense
|
|
|
Unrecognized net loss
|
|
|
(
|
)
|
|
|
(
|
)
|
|
|
(
|
)
|
|
|
(
|
)
|
|
|
Other expense
|
|
|
|
|
|
|
|
|
|
|
|
|
|
|
|
|
|
|
|
||||
|
Total before tax
|
|
|
(
|
)
|
|
|
(
|
)
|
|
|
(
|
)
|
|
|
(
|
)
|
|
|||
|
Tax effect
|
|
|
|
|
|
|
|
|
|
|
|
|
|
|
|
|
|
|
Income tax expense
|
|
|
|
|
|
|
|
|
|
|
|
|
|
|
|
|
|
|
|
||||
|
Amortization of defined pension items, net of tax
|
|
$
|
(
|
)
|
|
$
|
(
|
)
|
|
$
|
(
|
)
|
|
$
|
(
|
)
|
|
|||
|
|
|
|
|
|
|
|
|
|
|
|
|
|
|
|
|
|
||||
|
(b)
|
Amounts in parenthesis indicate debits to expense. See Note 9 – “Retirement Plan” above for additional details.
|
Note 11 – Commitments and Contingent Liabilities
We are currently a party to various legal proceedings in the ordinary course of business. While management presently believes that the ultimate outcomes of these proceedings, individually and in the aggregate, will not materially affect our Company’s financial position, results of operations or cash flows, legal proceedings are subject to inherent uncertainties, and unfavorable outcomes could occur. Unfavorable outcomes could include substantial monetary damages in excess of any appropriate accruals, which management has established. Where such unfavorable final outcomes to occur, there exists the possibility of a material adverse effect on our financial position, results of operations and cash flows.
Note 12 – Fair Value of Financial Instruments
The Financial Accounting Standards Board (“FASB”) defines fair value as the price that would be received for an asset or paid to transfer a liability in an orderly transaction between market participants on the measurement date. The guidance establishes a fair value hierarchy that prioritizes observable and unobservable inputs used to measure fair value into three broad levels:
|
Level 1
|
|
–
|
|
Quoted prices in active markets that are accessible at the measurement date for identical assets and liabilities.
|
|
Level 2
|
|
–
|
|
Observable inputs other than quoted prices in active markets. For example, quoted prices for similar assets or liabilities in active markets or quoted prices for identical assets or liabilities in inactive markets.
|
|
Level 3
|
|
–
|
|
Unobservable inputs for which there is little or no market data available.
|
The carrying values of cash, trade accounts receivable and accounts payable approximate their fair values at each balance sheet date because of the short-term maturities and nature of these balances.
The carrying value of our revolving credit facility borrowings approximates fair value at each balance sheet date because interest rates on this instrument approximate current market rates (Level 2 criteria), and because of the short-term maturity and nature of this balance. In addition, there has been no significant change in our inherent credit risk.
15
The following table summarizes the carrying value and fair value estimate of our current and long-term debt, excluding unamortized debt issuance costs:
|
March 25,
2021 |
June 25,
2020
|
March 26,
2020
|
||||||||||
|
Carrying value of long-term debt:
|
$ |
|
$ |
|
$ |
|
||||||
|
Fair value of long-term debt:
|
|
|
|
|||||||||
The estimated fair value of our long-term debt was determined using a market approach based upon Level 2 observable inputs, which estimates fair value based on interest rates currently offered on loans with similar terms to borrowers of similar credit quality or broker quotes. In addition, there have been no significant changes in the underlying assets securing our long-term debt.
Note 13 – Related Party Transaction
In connection with the acquisition of the Squirrel Brand business in the second quarter of fiscal 2018, we incurred $
11,500
of unsecured debt pursuant to a promissory note (the “Promissory Note”) to the principal owner and seller of the Squirrel Brand business, who was subsequently appointed as an executive officer of the Company and was considered a related party. Late in the second quarter of fiscal 2020, the employment of this executive officer with the Company ceased. He is no longer considered a related party, and therefore the outstanding bala
, 2021 or the quarter ended March
127
for the thirty-nine weeks ended March
n
ce on the Promissory Note is not reflected as related party debt on our Consolidated Balance Sheet for any periods presented. There was no related party interest paid to this former executive officer during the thirty-nine weeks ended March
25
26
, 2020. Interest paid while the former executive officer was a related party was $
26
, 2020.
Note 14 – Garysburg, North Carolina Facility
On October 7, 2019 we experienced a fire at our peanut processing facility located in Garysburg, North Carolina. The fire occurred in our roasting room where all of the roasting equipment was destroyed. The fire also damaged some equipment in our packaging room and a portion of the roof. During fiscal 2020, the building and roof were repaired and brought back to their original condition.
After evaluating our options with regard to our peanut production operations, the Company currently plans to cease all operations permanently at the Garysburg facility. We completed shelling of the 2019 peanut crop during the second quarter of this fiscal year and the facility will continue to be used to store and ship inshell peanuts through the remainder of fiscal 2021. During fiscal 2020 we manufactured and sold approximately
6
million pounds of inshell peanuts from this facility and plan to discontinue that product line at the end of the current fiscal year. We also expect to spend the remainder of the 2021 fiscal year cleaning and preparing the facility for sale or other utilization in our operations. Employee separation and related closure costs were immaterial for all periods presented.
Insurance proceeds totaling $
2,934
were received from the insurance carrier in fiscal 2020, and the final payment of $
2,730
was received during the current third quarter. Insurance proceeds received for damage to capital equipment are recorded as investing activities on the Consolidated Statements of Cash Flows when received.
Note 15 – Recent Accounting Pronouncements
The following recent accounting pronouncements have been adopted in the current fiscal year:
In August 2018, the FASB issued ASU
”. The amendments in this Update align the requirements for capitalizing implementation costs incurred in a hosting arrangement that is a service contract with the requirements for capitalizing implementation costs incurred to develop or obtain
No. 2018-15
“
Intangibles – Goodwill and Other –
Internal-Use
Software (Subtopic
350-40):
Customer’s Accounting for Implementation Costs Incurred in a Cloud Computing Arrangement that is a Service Contract
internal-use
software (and hosting arrangements that include an internal use software license). ASU
No. 2018-15
was adopted using the prospective method in the first quarter of fiscal 2021 and did not have a material impact on our Consolidated Financial Statements.
16
In August 2018, the FASB issued ASU
”. The amendments in this Update modify the disclosure requirements for employers that sponsor defined benefit pension or other postretirement plans. The amendments in this Update remove disclosures that no longer are considered cost beneficial, clarify the specific requirements of disclosures, and add disclosure requirements identified as relevant. ASU
No. 2018-14
“
Compensation – Retirement Benefits – Defined Benefit Plans – General (Subtopic
715-20):
Disclosure Framework – Changes to the Disclosure Requirements for Defined Benefit Plans
No. 2018-14
was adopted on a retrospective basis to all periods presented in the first quarter of fiscal 2021 and had no impact on our quarterly Consolidated Financial Statements.
In January 2017, the FASB issued ASU
The amendments in this Update eliminate the need for entities to calculate the implied fair value of goodwill by assigning the fair value of a reporting unit to all of its assets and liabilities as if that reporting unit had been acquired in a business combination, commonly referred to as “Step 2”. Under this amendment, an entity will perform its goodwill impairment test by comparing the fair value of a reporting unit with its carrying amount. An impairment charge is recognized for the amount by which the carrying value exceeds the reporting unit’s fair value. ASU
No. 2017-04
“Intangibles—Goodwill and Other (Topic 350): Simplifying the Test for Goodwill Impairment”.
No. 2017-04
was adopted in the first quarter of fiscal 2021 and did not have a material impact on our Consolidated Financial Statements.
In June 2016, the FASB issued ASU
”. The main objective of this Update is to provide financial statement users with more decision-useful information about the expected credit losses on financial instruments and other commitments to extend credit held by a reporting entity at each reporting date. The amendments in this Update replace the incurred loss impairment methodology in current GAAP with a methodology that reflects expected credit losses and requires consideration of a broader range of reasonable and supportable information to inform credit loss estimates. ASU
No. 2016-13
“
Financial Instruments—Credit Losses (Topic 326): Measurement of Credit Losses on Financial Instruments
No. 2016-13
was adopted using a modified retrospective transition method in the first quarter of fiscal 2021 and did not have a material impact on our Consolidated Financial Statements.
There are no recent accounting pronouncements that have been issued and not yet adopted that are expected to have a material impact on our Consolidated Financial Statements.
17
Item 2. Management’s Discussion and Analysis of Financial Condition and Results of Operations
OVERVIEW
The following discussion and analysis should be read in conjunction with the unaudited Consolidated Financial Statements and the Notes to Consolidated Financial Statements.
Our fiscal year ends on the final Thursday of June each year, and typically consists of
fifty-two
weeks (four thirteen-week quarters). Additional information on the comparability of the periods presented is as follows:
| • |
References herein to fiscal 2021 and fiscal 2010 are to the fiscal year ending June 24, 2021 and the fiscal year ended June 25, 2020, respectively.
|
| • |
References herein to the third quarter of fiscal 2021 and fiscal 2020 are to the quarters ended March 25, 2021 and March 26, 2020, respectively.
|
| • |
References herein to the first three quarters or first thirty-nine weeks of fiscal 2021 and fiscal 2021 are to the thirty-nine weeks ended March 25, 2021 and March 26, 2020, respectively.
|
As used herein, unless the context otherwise indicates, the terms “we”, “us”, “our” or “Company” collectively refer to John B. Sanfilippo & Son, Inc. and our wholly-owned subsidiary, JBSS Ventures, LLC. Our Company’s Credit Facility and Mortgage Facility, as defined below, are sometimes collectively referred to as “our financing arrangements.”
We are one of the leading processors and distributors of peanuts, pecans, cashews, walnuts, almonds and other nuts in the United States. These nuts are sold under our
and
brand names and under a variety of private brands. We also market and distribute, and in most cases, manufacture or process, a diverse product line of food and snack products, including peanut butter, almond butter, cashew butter, candy and confections, snacks and trail mixes, snack bites, sunflower kernels, dried fruit, corn snacks, chickpea snacks, sesame sticks and other sesame snack products under our brand names and under private brands. We distribute our products in the consumer, commercial ingredients and contract packaging distribution channels.
Fisher, Orchard Valley Harvest,
Squirrel Brand, Southern Style Nuts
Sunshine Country
The Company’s long-term objective to drive profitable growth, as identified in our strategic plan (the “Strategic Plan”), includes continuing to grow
and
into leading brands and providing integrated nut solutions to grow
Fisher,
Orchard Valley Harvest, Squirrel Brand
Southern Style Nuts
non-branded
business across key customers. We plan to execute on our Strategic Plan to grow our branded business by reaching new consumers via product and packaging innovation, expanding distribution across current and alternative channels, diversifying our product offerings and focusing on new ways for consumers to buy our products, with an emphasis on increasing our sales via
e-commerce
platforms and retailers. In addition, during fiscal 2021 we have invested in our people and facilities in order to research, develop, market and sell new products in snack categories we currently are not in for our branded business and private brand partners.
We face a number of challenges in the future which include intensified competition on pricing and for market share from both private brand and name brand nut products. Our
recipe nut sales have been negatively impacted due to this increased competition for market share. We also face changing industry trends as consumer preferences evolve into shopping in smaller store formats like grocery and online. Additionally, the wooden pallet industry has been impacted for several months with low inventory levels, due in part to labor and lumber shortages. The pallet shortage has impacted our operations, primarily at our Elgin, IL facility, and led to some cost increases. We anticipate the industry to see some relief in the coming quarters. In the interim, we are working with our vendors, customers and JBSS facilities in other regions of the country to source additional supply. If the shortage continues, and we cannot secure an adequate supply of wooden pallets to fulfill customer orders, this shortage could have an unfavorable impact on net sales in our fourth quarter.
Fisher
18
We will continue to focus on seeking profitable business opportunities to maximize the utilization of our production capacity at our primary manufacturing, processing and distribution facility located in Elgin, Illinois. We expect to redirect our promotional and advertising activity with respect to our brands to focus on more digital and
branded products and expect that there will be additional opportunities to connect these brands to consumers’ desires for more functional snacking, baking and cooking ideas. We will continue to face the ongoing challenges specific to our business, such as food safety and regulatory compliance and the maintenance and growth of our customer base for branded and private label products. See the information referenced in Part II, Item 1A — “Risk Factors” of this report for additional information about our risks, challenges and uncertainties.
e-commerce
platforms to match consumer behavior. We continue to see strong
e-commerce
performance across several of our
COVID-19
Impacts
We will continue to face challenges in the remainder of our fiscal 2021 (and into fiscal year 2022) as result of the
COVID-19
pandemic and the uncertainty of future local, state and federal restrictions aimed to mitigate and control the pandemic. As many of these restrictions were eased near the conclusion of our fiscal 2020, we saw a gradual (albeit limited) increase in demand from our foodservice, restaurant, convenience store and
non-essential
retail customers. However, as conditions surrounding the pandemic deteriorated during the fall and winter of calendar 2020 and so far during calendar 2021, consumers were and continue to be limited in their ability to purchase meals outside their homes. As indoor dining restrictions continued due to the impact of
COVID-19,
consumers continued to snack, cook and bake more at home. While this trend has had a positive impact on certain aspects of our consumer business, demand continued to be suppressed from our foodservice, restaurant and
non-essential
retail customers. Additionally,
COVID-19
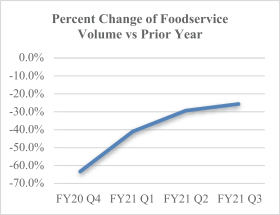
has had an unfavorable impact on a major customer’s business in our contract packaging distribution channel due to reduced foot traffic in convenience stores as people continue to work from home. Although demand has been suppressed from our foodservice customers, the chart below indicates that the rate of decline is recovering from its low point in our fourth quarter of fiscal 2020, and we believe that as the
COVID-19
vaccine becomes more widely distributed and accepted by the public, and restrictions are again loosened, sales volume with our foodservice, restaurant, convenience store and
non-essential
retail customers will continue to improve.
Also, during fiscal 2021, we have seen signs of a shortage in capacity in the transportation industry, which our transportation service providers believe is due, in part, to driver concerns related to the impacts of
COVID-19.
Compounding this driver shortage is an increase in demand driven by additional spending on consumer goods. This tightening in transportation capacity, including rail and ocean freight, is expected to continue into fiscal 2022, has led to increased transportation costs and may lead to potential disruptions in service to our customers and from our suppliers.
The Company’s
COVID-19
crisis team continues to meet on a regular basis to discuss risks faced by the Company and mitigation strategies. We continue to follow recommendations made by state and federal regulators and health agencies to ensure the safety and health of our employees as those recommendations change and evolve. We have implemented (among other things) a temporary work from home option for the majority of our office employees, staggered shifts and breaks, installed partitions on production lines and office space where social distancing could not be consistently maintained and installed thermal scanners to measure temperature for all employees upon arrival. We update and enhance these measures as new guidance is provided. In addition, we extended personal time off for those employees who are in self-quarantine or ill and have organized a free, voluntary
COVID-19
immunization clinic, which will be
on-site
at our Elgin, IL facility during our fourth fiscal quarter for interested employees and their families.
19
We have worked closely with our domestic and global suppliers to source and maintain a consistent supply of raw materials, ingredients and packaging. To date, none of our manufacturing facilities have been significantly impacted by this pandemic. We have contingency plans in place to help reduce the negative impact if one or more of our manufacturing facilities encounters a partial or full shut down.
20
QUARTERLY HIGHLIGHTS
Our net sales of $207.9 million for the third quarter of fiscal 2021 decreased 1.8% from our net sales of $211.6 million for the third quarter of fiscal 2020. Net sales for the first thirty-nine weeks of fiscal 2021 decreased $24.2 million, or 3.6%, to $651.7 million compared to the first thirty-nine weeks of fiscal 2020.
Sales volume, measured as pounds sold to customers, decreased 0.9 million pounds, or 1.2%, in the third quarter of fiscal 2021, compared to the third quarter of fiscal 2020. Sales volume for the first thirty-nine weeks of fiscal 2021 decreased 1.9 million pounds, or 0.9%, compared to the first thirty-nine weeks of fiscal 2020.
Gross profit increased $3.2 million, and our gross profit margin, as a percentage of net sales, increased to 22.1% for the third quarter of fiscal 2021 compared to 20.2% for the third quarter of fiscal 2020. Gross profit increased $3.1 million and our gross profit margin increased to 21.2% from 20.0% for the first thirty-nine weeks of fiscal 2021 compared to the first thirty-nine weeks of fiscal 2020.
Total operating expenses for the third quarter of fiscal 2021 increased $1.5 million, or 6.6%, compared to the third quarter of fiscal 2020. As a percentage of net sales, total operating expenses in the third quarter of fiscal 2021 increased to 12.0% from 11.1% for the third quarter of fiscal 2020. For the first thirty-nine weeks of fiscal 2021, total operating expenses decreased $1.7 million, and total operating expenses as a percentage of net sales increased to 10.8% from 10.7% compared to the first thirty-nine weeks of fiscal 2020.
The total value of inventories on hand at the end of the third quarter of fiscal 2021 decreased $36.8 million, or 19.5%, in comparison to the total value of inventories on hand at the end of the third quarter of fiscal 2020.
We have seen acquisition costs for all major tree nuts decrease in the 2020 crop year (which falls into our 2021 fiscal year). We have completed procurement of inshell walnuts during the first half of fiscal 2021, and the final total payments due to our walnut growers were determined in the current quarter. The final prices paid, and remaining to be paid to the walnut growers, were based upon current market prices and other factors, such as crop size and export demand. A large majority of payments to walnut growers were completed in the third quarter of fiscal 2021. Remaining amounts to be paid to walnut growers as of March 25, 2021 are final and are not subject to revision. We increased our walnut grower liability by approximately $0.7 million during the third quarter of fiscal 2021, as the final payments to walnut growers were slightly more than the amounts estimated at the end of last quarter. This increase is insignificant compared to our total inshell walnut procurement costs for the year, and the adjustment to cost of sales was immaterial to our results of operations.
21
RESULTS OF OPERATIONS
Net Sales
Our net sales decreased 1.8% to $207.9 million in the third quarter of fiscal 2021 compared to net sales of $211.6 million for the third quarter of fiscal 2020. The decrease in net sales was primarily attributable to a 1.2% decrease in sales volume, which is defined as pounds sold to customers. The decline in sales volume was due to a reduction in sales volume for almonds and peanuts, which was offset in part by increased sales volume for trail and snack mixes.
For the first thirty-nine weeks of fiscal 2021 our net sales were $651.7 million, a decrease of $24.2 million, or 3.6%, compared to the same period of fiscal 2020. The decrease in net sales was primarily attributable to a 2.7% decline in the weighted average selling price per pound. The decrease in the weighted average selling price per pound was attributable to lower selling prices for tree nuts, which were due to lower commodity acquisition costs. A 0.9% decrease in sales volume, due to the same reasons cited in the quarterly comparison, also contributed to the overall decline in net sales.
The following table summarizes sales by product type as a percentage of total gross sales. The information is based upon gross sales, rather than net sales, because certain adjustments, such as promotional discounts, are not allocable to product type.
|
For the Quarter Ended
|
For the Thirty-Nine Weeks
Ended |
|||||||||||||||
|
Product Type
|
March 25,
2021
|
March 26,
2020
|
March 25,
2021
|
March 26,
2020
|
||||||||||||
|
Peanuts
|
19.5 | % | 19.5 | % | 19.2 | % | 17.7 | % | ||||||||
|
Pecans
|
7.8 | 7.0 | 10.7 | 11.2 | ||||||||||||
|
Cashews & Mixed Nuts
|
23.1 | 23.0 | 23.3 | 22.8 | ||||||||||||
|
Walnuts
|
5.4 | 6.1 | 6.4 | 7.4 | ||||||||||||
|
Almonds
|
10.5 | 16.1 | 10.7 | 15.2 | ||||||||||||
|
Trail & Snack Mixes
|
27.8 | 22.6 | 24.1 | 20.3 | ||||||||||||
|
Other
|
5.9 | 5.7 | 5.6 | 5.4 | ||||||||||||
|
|
|
|
|
|
|
|
|
|||||||||
|
Total
|
100.0 | % | 100.0 | % | 100.0 | % | 100.0 | % | ||||||||
|
|
|
|
|
|
|
|
|
|||||||||
The following table shows a comparison of net sales by distribution channel (dollars in thousands):
|
For the Quarter Ended
|
||||||||||||||||||||||||
|
Distribution Channel
|
March 25,
2021
|
Percentage
of Total |
March 26,
2020
|
Percentage
of Total |
$
Change
|
Percent
Change
|
||||||||||||||||||
|
Consumer
(1)
|
$ | 169,415 | 81.5 | % | $ | 158,616 | 75.0 | % | $ | 10,799 | 6.8 | % | ||||||||||||
|
Commercial Ingredients
|
21,052 | 10.1 | 30,312 | 14.3 | (9,260 | ) | (30.5 | ) | ||||||||||||||||
|
Contract Packaging
|
17,425 | 8.4 | 22,696 | 10.7 | (5,271 | ) | (23.2 | ) | ||||||||||||||||
|
|
|
|
|
|
|
|
|
|
|
|
|
|||||||||||||
|
Total
|
$ | 207,892 | 100.0 | % | $ | 211,624 | 100.0 | % | $ | (3,732 | ) | (1.8 | )% | |||||||||||
|
|
|
|
|
|
|
|
|
|
|
|
|
|||||||||||||
| (1) |
Sales of branded products were approximately 20% and 24% of total consumer sales during the third quarter of fiscal 2021 and fiscal 2020, respectively.
Fisher
Orchard Valley Harvest
|
22
The following table shows a comparison of net sales by distribution channel (dollars in thousands):
|
For the Thirty-nine Weeks Ended
|
||||||||||||||||||||||||
|
Distribution Channel
|
March 25,
2021
|
Percentage
of Total |
March 26,
2020
|
Percentage
of Total |
$
Change
|
Percent
Change
|
||||||||||||||||||
|
Consumer
(1)
|
$ | 528,201 | 81.0 | % | $ | 503,848 | 74.6 | % | $ | 24,353 | 4.8 | % | ||||||||||||
|
Commercial Ingredients
|
64,399 | 9.9 | 101,447 | 15.0 | (37,048 | ) | (36.5 | ) | ||||||||||||||||
|
Contract Packaging
|
59,140 | 9.1 | 70,598 | 10.4 | (11,458 | ) | (16.2 | ) | ||||||||||||||||
|
|
|
|
|
|
|
|
|
|
|
|
|
|||||||||||||
|
Total
|
$ | 651,740 | 100.0 | % | $ | 675,893 | 100.0 | % | $ | (24,153 | ) | (3.6 | )% | |||||||||||
|
|
|
|
|
|
|
|
|
|
|
|
|
|||||||||||||
| (1) |
Sales of branded products were approximately 25% and 29% of total consumer sales during the first thirty-nine weeks of fiscal 2021 and fiscal 2020, respectively.
Fisher
Orchard Valley Harvest
|
Net sales in the consumer distribution channel increased 6.8% in dollars and 9.1% in sales volume in the third quarter of fiscal 2021 compared to the third quarter of fiscal 2020. The sales volume increase was driven by an 11.8% increase in sales volume for private brand products, specifically snack nuts and trail and snack mixes, from new distribution at existing customers, a shift in consumer preferences to lower priced private brand products and growth in snacking as many consumers continue to purchase food for consumption at home. Sales volume for
snack nuts decreased 3.1%, primarily as a result of reduced merchandising activity for
inshell peanuts as we are in the process of discontinuing that inshell peanut product line, which we expect will be completed by the end of the fourth quarter of fiscal 2021. Sales volume of
recipe nuts decreased 6.4% as a result of lost distribution at two grocery customers. Sales volume
of
products decreased 21.4% due to reduced foot traffic at a major customer in the
decreased 14.2% primarily due to the discontinuance of an item at a major customer.
Fisher
Fisher
Fisher
Orchard Valley Harvest
non-food
sector as a result of
COVID-19.
Sales volume of
Southern Style Nuts
In the first thirty-nine weeks of fiscal 2021, net sales in the consumer distribution channel increased 4.8% in dollars and 7.7% in sales volume, compared to the same period of fiscal 2020. The sales volume increase occurred for the same reasons cited in the quarterly comparison. Increased sales for
snack nuts also contributed to the sales volume increase in the consumer distribution channel.
Fisher
Net sales in the commercial ingredients distribution channel decreased 30.5% in dollars and 29.8% in sales volume in the third quarter of fiscal 2021 compared to the third quarter of fiscal 2020. The decline in sales volume was due to a 25.7% decrease in sales volume in our foodservice business and a decline in sales of peanut crushing stock to peanut oil processors. The sales volume decline in our foodservice business resulted from a decline in air travel and nationwide restrictions on indoor restaurant dining, which were attributable to
COVID-19.
In the first thirty-nine weeks of fiscal 2021, net sales in the commercial ingredients distribution channel decreased 36.5% in dollars and 27.1% in sales volume compared to the same period of fiscal 2020. The decline in sales volume was primarily due to a 32.5% decrease in sales volume in our foodservice business, which occurred for the same reasons cited in the quarterly comparison.
Net sales in the contract packaging distribution channel decreased 23.2% in dollars and 19.2% in sales volume in the third quarter of fiscal 2021 compared to the third quarter of fiscal 2020. The decline in sales volume was primarily attributable to the unfavorable impact of lower convenience store foot traffic on one customer’s business as a result of
COVID-19.
In the first thirty-nine weeks of fiscal 2021, net sales in the contract packaging distribution channel decreased 16.2% in dollars and 15.1% in sales volume compared to the first thirty-nine weeks of fiscal 2020. The decline in sales volume occurred for the same reason cited in the quarterly comparison, as well as the loss of peanut butter business with another customer due to a temporary peanut supply shortage that existed in the first quarter of fiscal 2021.
Gross Profit
Gross profit increased $3.2 million, or 7.6%, to $46.0 million for the third quarter of fiscal 2021 compared to the third quarter of fiscal 2020. Our gross profit margin, as a percentage of net sales, increased to 22.1% for the third quarter of fiscal 2021 compared to 20.2% for the third quarter of fiscal 2020. The increases in gross profit and gross profit margin were mainly attributable to lower commodity acquisition costs for all major tree nuts.
23
Gross profit increased $3.1 million, or 2.3%, to $138.2 million for the first thirty-nine weeks of fiscal 2021 compared to the first thirty-nine weeks of fiscal 2020. Our gross profit margin increased to 21.2% for the first thirty-nine weeks of fiscal 2021 compared to 20.0% for the first thirty-nine weeks of fiscal 2020. The increases in gross profit and gross profit margin in the year to date comparison occurred for the same reason cited in the quarterly comparison.
Operating Expenses
Total operating expenses for the third quarter of fiscal 2021 increased $1.5 million, or 6.6%, to $24.9 million. Operating expenses increased to 12.0% of net sales for the third quarter of fiscal 2021 compared to 11.1% of net sales for the third quarter of fiscal 2020.
Selling expenses for the third quarter of fiscal 2021 were $15.1 million, an increase of $1.2 million, or 8.7%, from the third quarter of fiscal 2020. The increase was driven by a $1.5 million increase in freight expense due to significantly higher freight rates compared to last year’s third quarter and, to a lesser extent, an increase in sales volume for our sales made on a delivered basis to customers. This increase was partially offset by a $0.3 million decrease in commission expense.
Administrative expenses for the third quarter of fiscal 2021 were $9.9 million, an increase of $0.3 million, or 3.5%, compared to the third quarter of fiscal 2020. The increase was primarily due to $0.7 million decrease in the gain on asset disposals due to an insurance recovery recognized in last year’s third quarter. The insurance recovery, which was the first of two recoveries, related to a fire in our Garysburg, North Carolina facility that occurred in the second quarter of fiscal 2020. This increase was largely offset by a $0.5 million decrease in incentive compensation expense.
Total operating expenses for the first thirty-nine weeks of fiscal 2021 decreased $1.7 million, or 2.4%, to $70.4 million. Operating expenses increased to 10.8% of net sales for the first three quarters of fiscal 2021 compared to 10.7% of net sales for the three quarters of fiscal 2020.
Selling expenses for the first thirty-nine weeks of fiscal 2021 were $44.9 million, an increase of $0.8 million, or 1.8%, from the amount recorded for the first thirty-nine weeks of fiscal 2020. The increase was driven by a $1.8 million increase in freight expense for the same reasons discussed in the quarterly comparison and was partially offset by a $1.0 million decrease in advertising expense due to less radio advertising.
Administrative expenses for the first thirty-nine weeks of fiscal 2021 were $25.5 million, a decrease of $2.5 million, or 8.8%, compared to the same period of fiscal 2020. The decrease was due to a $1.8 million increase in the gain on asset disposals, mainly resulting from a $2.3 million gain from the final insurance recovery recognized in the second quarter of fiscal 2021 for the Garysburg facility fire, and a $0.6 million decrease in compensation related expenses, primarily incentive compensation expense.
Income from Operations
Due to the factors discussed above, income from operations was $21.1 million, or 10.1% of net sales, for the third quarter of fiscal 2021 compared to $19.4 million, or 9.2% of net sales, for the third quarter of fiscal 2020.
Due to the factors discussed above, income from operations was $67.8 million, or 10.4% of net sales, for the first thirty-nine weeks of fiscal 2021 compared to $62.9 million, or 9.3% of net sales, for the first thirty-nine weeks of fiscal 2020.
Interest Expense
Interest expense was $0.3 million for the third quarter of fiscal 2021 compared to $0.6 million in the third quarter of fiscal 2020. Interest expense for the first three quarters of fiscal 2021 was $1.1 million compared to $1.5 million for the first three quarters of fiscal 2020. The decrease in interest expense for both the quarterly and year to date comparisons was a result of lower average debt levels.
24
Rental and Miscellaneous Expense, Net
Net rental and miscellaneous expense was $0.4 million for the third quarter of fiscal 2021 compared to $0.3 million for the third quarter of fiscal 2020. Net rental and miscellaneous expense was $1.2 million for the first thirty-nine weeks of fiscal 2021 compared to $1.0 million for the first thirty-nine weeks of fiscal 2020.
Other Expense
Other expense consists of pension related expenses other than the service cost component and was $0.6 million for both the third quarter of fiscal 2021 and fiscal 2020. Other expense was $1.9 million for the first thirty-nine weeks of fiscal 2021 compared to $1.7 million for the first thirty-nine weeks of fiscal 2020.
Income Tax Expense
Income tax expense was $5.1 million, or 25.7% of income before income taxes, for the third quarter of fiscal 2021 compared to $4.5 million, or 25.0% of income before income taxes, for the third quarter of fiscal 2020. For the first thirty-nine weeks of fiscal 2021, income tax expense was $16.2 million, or 25.4% of income before income taxes, compared to $14.9 million, or 25.3% of income before income taxes, for the comparable period last year.
Net Income
Net income was $14.7 million, or $1.28 per common share basic and $1.27 per common share diluted, for the third quarter of fiscal 2021, compared to $13.5 million, or $1.17 per common share basic and diluted, for the third quarter of fiscal 2020.
Net income was $47.4 million, or $4.12 per common share basic and $4.10 per common share diluted, for the first thirty-nine weeks of fiscal 2021, compared to net income of $43.9 million, or $3.83 per common share basic and $3.80 per common share diluted, for the first thirty-nine weeks of fiscal 2020.
25
LIQUIDITY AND CAPITAL RESOURCES
General
The primary uses of cash are to fund our current operations, fulfill contractual obligations, pursue our Strategic Plan through growing our branded and private label nut programs and repay indebtedness. Also, various uncertainties could result in additional uses of cash. The primary sources of cash are results of operations and availability under our Credit Facility. We anticipate that expected net cash flow generated from operations and amounts available pursuant to the Credit Facility will be sufficient to fund our operations for the next twelve months. Our available credit under our Credit Facility has allowed us to devote more funds to promote our products, consummate strategic investments and business acquisitions, such as the fiscal 2018 acquisition of the Squirrel Brand business, reinvest in the Company through capital expenditures, develop new products, pay cash dividends and explore other growth strategies outlined in our Strategic Plan.
Cash flows from operating activities have historically been driven by net income but are also significantly influenced by inventory requirements, which can change based upon fluctuations in both quantities and market prices of the various nuts and nut products we buy and sell. Current market trends in nut prices and crop estimates also impact nut procurement.
The following table sets forth certain cash flow information for the first three quarters of fiscal 2021 and 2020, respectively (dollars in thousands):
|
For the Thirty-Nine
Weeks Ended |
||||||||||||
|
March 25,
2021 |
March 26,
2020 |
$ Change
|
||||||||||
|
Operating activities
|
$ | 77,026 | $ | 34,962 | $ | 42,064 | ||||||
|
Investing activities
|
(13,620 | ) | (10,533 | ) | (3,087 | ) | ||||||
|
Financing activities
|
(63,898 | ) | (25,027 | ) | (38,871 | ) | ||||||
|
|
|
|
|
|
|
|||||||
|
Net decrease in cash
|
$ | (492 | ) | $ | (598 | ) | $ | 106 | ||||
|
|
|
|
|
|
|
|||||||
Operating Activities
Total inventories were $151.8 million at March 25, 2021, a decrease of $20.3 million, or 11.8%, from the inventory balance at June 25, 2020, and a decrease of $36.8 million, or 19.5%, from the inventory balance at March 26, 2020. The decrease in inventory at March 25, 2021 compared to June 25, 2020 was primarily due to lower commodity acquisition costs for all major tree nuts and lower quantities of peanuts and almonds on hand, which was partially offset by greater quantities of walnuts and pecans on hand. The decrease in inventories at March 25, 2021 compared to March 26, 2020 was primarily due to lower commodity acquisition costs for all major tree nuts, as well as lower quantities of peanuts, almonds and pecans on hand.
Raw nut and dried fruit input stocks, some of which are classified as
decreased 10.6 million pounds, or 14.7%, at March 25, 2021 compared to March 26, 2020. The weighted average cost per pound of raw nut input stocks on hand at the end of the third quarter of fiscal 2021 decreased 17.8% compared to the end of the third quarter of fiscal 2020 primarily due to lower commodity acquisition costs for all major tree nuts.
work-in-process,
Investing Activities
26
Financing Activities
Real Estate Matters
In August 2008, we completed the consolidation of our Chicago-based facilities into the Elgin Site. The Elgin Site includes both an office building and a warehouse. We are currently attempting to find additional tenants for the available space in the office building at the Elgin Site. Until additional tenant(s) are found, we will not receive the benefit of rental income associated with such space. Approximately 66% of the rentable area in the office building is currently vacant. Approximately 29% of the rentable area has not been
built-out.
There can be no assurance that we will be able to lease the unoccupied space and further capital expenditures will likely be necessary to lease the remaining space.
Financing Arrangements
On February 7, 2008, we entered into the Former Credit Agreement (as defined below) with a bank group (the “Bank Lenders”) providing a $117.5 million revolving loan commitment and letter of credit subfacility. Also on February 7, 2008, we entered into a Loan Agreement with an insurance company (the “Mortgage Lender”) providing us with two term loans, one in the amount of $36.0 million (“Tranche A”) and the other in the amount of $9.0 million (“Tranche B”), for an aggregate amount of $45.0 million (the “Mortgage Facility”).
On March 5, 2020, we entered into an Amended and Restated Credit Agreement (the “Amended and Restated Credit Agreement”) which amended and restated our Credit Agreement dated as of February 7, 2008 (the “Former Credit Agreement”). The Amended and Restated Credit Agreement provides for a $117.5 million senior secured revolving credit facility with the same borrowing capacity, interest rates and applicable margin as the Former Credit Agreement and extends the term of the Former Credit Agreement from July 7, 2021 to March 5, 2025.
The Amended and Restated Credit Facility is secured by substantially all of our assets other than machinery and equipment, real property, and fixtures and matures on March 5, 2025. The Mortgage Facility is secured by mortgages on essentially all of our owned real property located in Elgin, Illinois, Gustine, California and Garysburg, North Carolina (the “Encumbered Properties”).
Credit Facility
At our election, borrowings under the Credit Facility currently accrue interest at either (i) a rate determined pursuant to the administrative agent’s prime rate plus an applicable margin determined by reference to the amount of loans which may be advanced under the borrowing base calculation, ranging from 0.25% to 0.75% (“Base Rate”) or (ii) a rate based upon the London interbank offered rate (“LIBOR”) plus an applicable margin based upon the borrowing base calculation, ranging from 1.25% to 1.75%.
At March 25, 2021, the weighted average interest rate for the Credit Facility was 2.0%. The terms of the Credit Facility contain covenants that, among other things, require us to restrict investments, indebtedness, acquisitions and certain sales of assets and limit annual cash dividends or distributions, transactions with affiliates, redemptions of capital stock and prepayment of indebtedness (if such prepayment, among other things, is of a subordinate debt). If loan availability under the borrowing base calculation falls below $25.0 million, we will be required to maintain a specified fixed charge coverage ratio, tested on a monthly basis, until loan availability equals or exceeds $25.0 million for three consecutive months. All cash received from customers is required to be applied against the Credit Facility. The Bank Lenders have the option to accelerate and demand immediate repayment of our obligations under the Credit Facility in the event of default on the payments required under the Credit Facility, a change in control in the ownership of the Company,
non-compliance
with the financial covenant or upon the occurrence of other defaults by us under the Credit Facility (including a default under the Mortgage Facility). As of March 25, 2021, we were in compliance with all covenants under the Credit Facility and we currently expect to be in compliance with the financial covenant in the Credit Facility for the foreseeable future. At March 25, 2021, we had $88.3 million of available credit under the Credit Facility. If this entire amount were borrowed at March 25, 2021, we would still be in compliance with all restrictive covenants under the Credit Facility.
27
Mortgage Facility
The Mortgage Facility matures on March 1, 2023. On March 1, 2018 the interest rate on the Mortgage Facility was fixed at 4.25% per annum. Monthly principal payments on the Mortgage Facility in the amount of $0.3 million commenced on June 1, 2008.
The terms of the Mortgage Facility contain covenants that require us to maintain a specified net worth of $110.0 million and maintain the Encumbered Properties. The Mortgage Lender is entitled to require immediate repayment of our obligations under the Mortgage Facility in the event we default in the payments required under the Mortgage Facility,
non-compliance
with the covenants or upon the occurrence of certain other defaults by us under the Mortgage Facility. As of March 25, 2021, we were in compliance with all covenants under the Mortgage Facility and a total principal amount of $6.6 million was outstanding.
Selma Property
In September 2006, we sold our Selma, Texas properties (the “Selma Properties”) to two related party partnerships for $14.3 million and are leasing them back. The selling price was determined by an independent appraiser to be the fair market value which also approximated our carrying value. The lease for the Selma Properties has a
ten-year
term at a fair market value rent with three five-year renewal options. In September 2015, we exercised two of the five-year renewal options which extended the lease term to September 2026. The lease extension also reduced the monthly lease payment on the Selma Properties, beginning in September 2016, to reflect then current market conditions. One five-year renewal option remains. Also, we have an option to purchase the Selma Properties from the owner at 95% (100% in certain circumstances) of the then fair market value, but not less than the original $14.3 million purchase price. The provisions of the arrangement are not eligible for sale-leaseback accounting and the $14.3 million was recorded as a debt obligation. No gain or loss was recorded on the Selma Properties transaction. As of March 25, 2021, $9.1 million of the debt obligation was outstanding.
Squirrel Brand Seller-Financed Note
In November 2017 we completed the Squirrel Brand acquisition. The acquisition was financed by a combination of cash (drawn under the Credit Facility) and a three-year seller-financed note for $11.5 million, which was repaid in full during the second quarter of fiscal 2021.
Critical Accounting Policies and Estimates
For information regarding our Critical Accounting Policies and Estimates, see the “Critical Accounting Policies and Estimates” section of “Item 7 – Management’s Discussion and Analysis of Financial Condition and Results of Operations” in our Form
10-K
for the fiscal year ended June 25, 2020.
Recent Accounting Pronouncements
Refer to Note 15 – “Recent Accounting Pronouncements” of the Notes to Consolidated Financial Statements, contained in Part I, Item 1 of this form
10-Q,
for a discussion of recently issued and adopted accounting pronouncements.
28
FORWARD LOOKING STATEMENTS
Some of the statements in this report are forward-looking. These forward-looking statements may be generally identified by the use of forward-looking words and phrases such as “will”, “intends”, “may”, “believes”, “anticipates”, “should” and “expects” and are based on the Company’s current expectations or beliefs concerning future events and involve risks and uncertainties. Consequently, the Company’s actual results could differ materially. The Company undertakes no obligation to update publicly or otherwise revise any forward-looking statements, whether as a result of new information, future events or other factors that affect the subject of these statements, except where expressly required to do so by law. Among the factors that could cause results to differ materially from current expectations are: (i) the risks associated with our vertically integrated model with respect to pecans, peanuts and walnuts; (ii) sales activity for the Company’s products, such as a decline in sales to one or more key customers (of branded products, private label products or otherwise), or to customers generally, in some or all channels, a change in product mix to lower price products, a decline in sales of private brand products or changing consumer preferences, including a shift from higher margin products to lower margin products; (iii) changes in the availability and costs of raw materials and the impact of fixed price commitments with customers; (iv) the ability to pass on price increases to customers if commodity costs rise and the potential for a negative impact on demand for, and sales of, our products from price increases; (v) the ability to measure and estimate bulk inventory, fluctuations in the value and quantity of the Company’s nut inventories due to fluctuations in the market prices of nuts and bulk inventory estimation adjustments, respectively; (vi) the Company’s ability to appropriately respond to, or lessen the negative impact of, competitive and pricing pressures, including competition in the recipe nut category; (vii) losses associated with product recalls, product contamination, food labeling or other food safety issues, or the potential for lost sales or product liability if customers lose confidence in the safety of the Company’s products or in nuts or nut products in general, or are harmed as a result of using the Company’s products; (viii) the ability of the Company to control expenses, such as transportation, compensation, medical and administrative expenses; (ix) the potential negative impact of government regulations and laws and regulations pertaining to food safety, such as the Food Safety Modernization Act; (x) uncertainty in economic conditions, including the potential for economic downturn, particularly in light of the outbreak of
COVID-19;
(xi) the timing and occurrence (or nonoccurrence) of other transactions and events which may be subject to circumstances beyond the Company’s control; (xii) the adverse effect of labor unrest or disputes, litigation and/or legal settlements, including potential unfavorable outcomes exceeding any amounts accrued; (xiii) losses due to significant disruptions at any of our production or processing facilities or employee unavailability due to illness or quarantine; (xiv) the ability to implement our Strategic Plan, including growing our branded and private brand product sales and expanding into alternative sales channels; (xv) technology disruptions or failures, including disruptions due to employees working remotely; (xvi) the inability to protect the Company’s brand value, intellectual property or avoid intellectual property disputes; (xvii) the Company’s ability to manage successfully the price gap between its private brand products and those of its branded competitors; and (xviii) the ability of the Company to respond to or manage the outbreak of
COVID-19
or other infectious diseases and the various implications thereof.
29
Item 3. Quantitative and Qualitative Disclosures About Market Risk
There has been no material change in our assessment of our sensitivity to market risk since our presentation set forth in Part I—Item 7A “Quantitative and Qualitative Disclosures About Market Risk,” in our Annual Report on Form
10-K
for the fiscal year ended June 25, 2020.
Item 4. Controls and Procedures
Our management, with the participation of our Chief Executive Officer and Chief Financial Officer, has evaluated the effectiveness of our disclosure controls and procedures (as defined in Exchange Act Rule
13a-15(e))
as of March 25, 2021. Based on such evaluation, our Chief Executive Officer and Chief Financial Officer have concluded that, as of March 25, 2021, the Company’s disclosure controls and procedures were effective.
In connection with the evaluation by our management, including our Chief Executive Officer and Chief Financial Officer, there were no changes in our internal control over financial reporting (as defined in Exchange Act Rule
13a-15(f))
during the quarter ended March 25, 2021 that have materially affected or are reasonably likely to materially affect our internal control over financial reporting.
PART II—OTHER INFORMATION
Item 1. Legal Proceedings
For a discussion of legal proceedings, see Note 11 – “Commitments and Contingent Liabilities” in Part I, Item 1 of this Form
10-Q.
Item 1A. Risk Factors
In addition to the other information set forth in this report on Form
10-Q,
you should also consider the factors, risks and uncertainties which could materially affect our Company’s business, financial condition or future results as discussed in Part I, Item 1A – “Risk Factors” of our Annual Report on Form
10-K
for the fiscal year ended June 25, 2020. There were no significant changes to the risk factors identified on the Form
10-K
for the fiscal year ended June 25, 2020 during the third quarter of fiscal 2021.
See Part I, Item 2 — “Management’s Discussion and Analysis of Financial Condition and Results of Operations — Liquidity and Capital Resources” in this Form
10-Q,
and see Part II, Item 7 — “Management’s Discussion and Analysis of Financial Condition and Results of Operations — Liquidity and Capital Resources” in the Company’s Annual Report on Form
10-K
for the fiscal year ended June 25, 2020.
Item 5. Other Information
Increase in Board Size; Appointment of New Director
On April 28, 2021, the Board of Directors (the “Board”) of the Company increased the size of the Board from nine to ten members and, in accordance with the terms of its Amended and Restated Certificate of Incorporation and Amended and Restated Bylaws, the Class A Directors of the Company elected Lisa A. Sanfilippo as a Class A Director of the Company to serve until the next annual meeting of stockholders of the Company and until her respective successor is duly elected and qualified or until her death, resignation or removal.
Ms. Sanfilippo is a
Co-Director
of The Global Society for Female Entrepreneurs in Beverly Hills, California and
Co-Owner
of Acceptance Recovery Center in Scottsdale, Arizona. Previously, Ms. Sanfilippo served as Director of Business Development & Innovation Trends at the Company from 2011 to 2017. Before that, Ms. Sanfilippo served in several other roles at the Company, including Senior Business Manager in charge of Alternative Channels from 2009 to 2011, Director of Customer Service from 2007 to 2009, and Senior Business Manager for Industrial Sales from 1991 to 2007.
30
Ms. Sanfilippo is eligible to participate in all compensation programs applicable to
non-employee
members of the Board, as described in the Proxy Statements filed by the Company from time to time. In accordance with the compensation program for
non-employee
directors, Ms. Sanfilippo will receive an annual cash retainer for Board service, prorated for the initial year of service. In addition, upon joining the Board, Ms. Sanfilippo received a grant of Restricted Stock Units, which were granted pursuant to a form of
Non-Employee
Director Restricted Stock Unit Award Agreement previously approved by the Board. Ms. Sanfilippo (as with the other current directors) is also expected to enter into an Indemnification Agreement with the Company in the form previously approved by the Board.
Ms. Sanfilippo was elected pursuant to an understanding with Messrs. Jeffrey T. Sanfilippo, Jasper B. Sanfilippo, Jr., James J. Sanfilippo, John E. Sanfilippo and Michael J. Valentine, as holders or beneficial owners of the Company’s Class A Common Stock and/or Class A Directors of the Company.
Ms. Sanfilippo has not entered into any transactions with the Company that are required to be disclosed pursuant to Item 404(a) of Regulation
S-K
in accordance with the rules and regulations of the SEC applicable hereto.
Item 6. Exhibits
The exhibits filed herewith are listed in the exhibit index below.
31
EXHIBIT INDEX
(Pursuant to Item 601 of Regulation
S-K)
|
Exhibit
No.
|
Description
|
|
| 3.1 | ||
| 3.2 | ||
| *10.1 | ||
| *10.2 | ||
| *10.3 | ||
| *10.4 | ||
| *10.5 | ||
| *10.6 | ||
| *10.7 | Form of Non-Employee Director Restricted Stock Unit Award Agreement (non-deferral) under 2014 Omnibus Plan (fiscal 2018, 2019, 2020 and 2021 awards cycle) (incorporated by reference from Exhibit 10.38 to the Form 10-Q for the quarter ended December 24, 2015) | |
32
33
|
Exhibit
No.
|
Description
|
|
| 101.INS |
Inline eXtensible Business Reporting Language (XBRL) Instance Document - the instance document does not appear in the Interactive Data File because its XBRL tags are embedded within the Inline XBRL document.
|
|
| 101.SCH | Inline XBRL Taxonomy Extension Schema Document | |
| 101.CAL | Inline XBRL Taxonomy Extension Calculation Linkbase Document | |
| 101.DEF | Inline XBRL Taxonomy Extension Definition Linkbase Document | |
| 101.LAB | Inline XBRL Taxonomy Extension Label Linkbase Document | |
| 101.PRE | Inline XBRL Taxonomy Extension Presentation Linkbase Document | |
| 104 | Cover Page Interactive Data File (embedded within the Inline XBRL document) | |
| * |
Indicates a management contract or compensatory plan or arrangement.
|
34
SIGNATURE
Pursuant to the requirements of the Securities Exchange Act of 1934, the registrant has duly caused this report to be signed on its behalf by the undersigned thereunto duly authorized on April 28, 2021.
| JOHN B. SANFILIPPO & SON, INC. | ||
| By |
/s/ M
ICHAEL
J. V
ALENTINE
|
|
| Michael J. Valentine | ||
| Chief Financial Officer, Group President and Secretary | ||
35
TABLE OF CONTENTS
Part I Financial InformationItem 1. Financial StatementsNote 1 Basis Of Presentation and Description Of BusinessNote 2 Revenue RecognitionNote 3 LeasesNote 4 InventoriesNote 5 Goodwill and Intangible AssetsNote 6 Credit FacilityNote 7 Earnings Per Common ShareNote 8 Stock-based Compensation PlansNote 9 Retirement PlanNote 10 Accumulated Other Comprehensive LossNote 11 Commitments and Contingent LiabilitiesNote 12 Fair Value Of Financial InstrumentsNote 13 Related Party TransactionNote 14 Garysburg, North Carolina FacilityNote 15 Recent Accounting PronouncementsItem 2. Management S Discussion and Analysis Of Financial Condition and Results Of OperationsItem 3. Quantitative and Qualitative Disclosures About Market RiskItem 4. Controls and ProceduresPart II Other InformationItem 1. Legal ProceedingsItem 1A. Risk FactorsItem 5. Other InformationItem 6. Exhibits