JOHNSON CONTROLS INTERNATIONAL PLC
10-Ks and 10-Qs
|
|
|
|
|
|
|
|
|
|
|
|
|
|
|
|
|
|
|
|
|
|
|
|
|
|
|
|
|
|
|
|
|
|
|
|
|
|
|
|
|
|
|
|
|
|
|
|
|
|
|
|
|
|
|
|
|
|
|
UNITED STATES
SECURITIES AND EXCHANGE COMMISSION
Washington, D.C. 20549
________________________________________________________________________________________________________________________________
FORM 10-K
|
(Mark One)
|
|
|
|
ý
|
|
ANNUAL REPORT PURSUANT TO SECTION 13 OR 15(d) OF THE SECURITIES EXCHANGE ACT OF 1934
|
|
For the fiscal year ended September 26, 2014
|
||
|
OR
|
||
|
o
|
|
TRANSITION REPORT PURSUANT TO SECTION 13 OR 15(d) OF THE SECURITIES EXCHANGE ACT OF 1934
|
(Commission File Number) 001-13836
________________________________________________________________________________________________________________________________
TYCO INTERNATIONAL LTD.
(Exact Name of Registrant as Specified in its Charter)

|
Switzerland
(Jurisdiction of Incorporation)
|
|
98-0390500
(I.R.S. Employer Identification Number)
|
Victor von Bruns-Strasse 21
CH-8212 Neuhausen am Rheinfall, Switzerland
(Address of registrant's principal executive office)
41-52-633-02-44
(Registrant's telephone number)
Securities registered pursuant to Section 12 (b) of the Act:
|
Title of each class
|
|
Name of each exchange on which registered
|
|
Common Shares, Par Value CHF 0.50
|
|
New York Stock Exchange
|
Securities registered pursuant to Section 12 (g) of the Act:
None
________________________________________________________________________________________________________________________________
Indicate by check mark if the registrant is a well-known seasoned issuer, as defined in Rule 405 of the Securities Act. Yes
ý
No
o
Indicate by check mark if the registrant is not required to file reports pursuant to Section 13 or Section 15(d) of the Act. Yes
o
No
ý
Indicate by check mark whether the registrant (1) has filed all reports required to be filed by Section 13 or 15(d) of the Securities Exchange Act of 1934 during the preceding 12 months (or for such shorter period that the registrant was required to file such reports), and (2) has been subject to such filing requirements for the past 90 days. Yes
ý
No
o
Indicate by check mark whether the registrant has submitted electronically and posted on its corporate Website, if any, every Interactive Data File required to be submitted and posted pursuant to Rule 405 of Regulation S-T during the preceding 12 months (or for such shorter period that the registrant was required to submit and post such files). Yes
ý
No
o
Indicate by check mark if disclosure of delinquent filers pursuant to Item 405 of Regulation S-K is not contained herein, and will not be contained, to the best of registrant's knowledge, in definitive proxy or information statements incorporated by reference in Part III or this Form 10-K or any amendment to this Form 10-K
o
Indicate by check mark whether the registrant is a large accelerated filer, an accelerated filer, a non-accelerated filer, or a smaller reporting company. See definitions of "large accelerated filer," "accelerated filer," and "smaller reporting company" in Rule 12b-2 of the Exchange Act. (Check one):
|
Large accelerated filer
ý
|
|
Accelerated filer
o
|
|
Non-accelerated filer
o
(Do not check if a
smaller reporting company)
|
|
Smaller reporting company
o
|
Indicate by check mark whether the registrant is a shell company (as defined in Rule 12b-2 of the Exchange Act). Yes
o
No
ý
The aggregate market value of voting common shares held by non-affiliates of the registrant as of March 28, 2014 was approximately
$19,024,092,777
.
The number of common shares outstanding as of
November 7, 2014
was
418,465,546
.
DOCUMENTS INCORPORATED BY REFERENCE
Portions of the registrant's proxy statement filed within 120 days of the close of the registrant's fiscal year in connection with the registrant's 2015 annual general meeting of shareholders are incorporated by reference into Part III of this Form 10-K.
See page 61 to 63 for the exhibit index.
TABLE OF CONTENTS
|
|
|
Page
|
|
Part I
|
|
|
|
Part II
|
|
|
|
Part III
|
|
|
|
Part IV
|
|
|
General
Tyco International Ltd. (hereinafter referred to as "we," the "Company" or "Tyco") is a leading global provider of security products and services, fire detection and suppression products and services and life safety products. Our broad portfolio of products and services, sold under well-known brands such as Tyco, SimplexGrinnell, Sensormatic, Wormald, Ansul, Simplex, Scott and ADT (in jurisdictions outside of North America) serve security, fire detection and suppression and life safety needs across commercial, industrial, retail, institutional and governmental markets, as well as non-U.S. residential and small business markets. We hold market-leading positions in large, fragmented industries and we believe that we are well positioned to leverage our global footprint, deep industry experience, strong customer relationships and innovative technologies to expand our business in both developed and emerging markets. We operate and report financial and operating information in the following three operating segments:
|
•
|
North America Installation & Services ("NA Installation & Services")
designs, sells, installs, services and monitors electronic security systems and fire detection and suppression systems for commercial, industrial, retail, institutional and governmental customers in North America.
|
|
•
|
Rest of World ("ROW") Installation & Services ("ROW Installation & Services")
designs, sells, installs, services and monitors electronic security systems and fire detection and suppression systems for commercial, industrial, retail, residential, small business, institutional and governmental customers in the ROW regions.
|
|
•
|
Global Products
designs, manufactures and sells fire protection, security and life safety products, including intrusion security, anti-theft devices, breathing apparatus and access control and video management systems, for commercial, industrial, retail, residential, small business, institutional and governmental customers worldwide, including products installed and serviced by our NA and ROW Installation & Services segments.
|
We also provide general corporate services to our segments and these costs are reported as Corporate and Other.
Certain prior period amounts have been reclassified to conform with current period presentation. Specifically, the Company has reclassified the operations of its South Korean security business and several businesses in the ROW Installation & Services segment to income from discontinued operations in the Consolidated Statements of Operations and the assets and liabilities as held for sale within the Consolidated Balance Sheets as they satisfied the criteria to be presented as discontinued operations. See Note 3 to our Consolidated Financial Statements for additional information.
Net revenue by segment for
2014
is as follows ($ in millions):
|
Net
Revenue
|
Percent of
Total
Net
Revenue
|
Key Brands
|
||||||
|
NA Installation & Services
|
$
|
3,876
|
|
37
|
%
|
Tyco Fire & Security, Tyco Integrated Security, SimplexGrinnell, Sensormatic
|
||
|
ROW Installation & Services
|
3,920
|
|
38
|
%
|
Tyco Fire & Security, Wormald, Sensormatic, ADT
|
|||
|
Global Products
|
2,544
|
|
25
|
%
|
Tyco, Simplex, Ansul, DSC, Scott, American Dynamics, Software House, Visonic, Chemguard, Exacq
|
|||
|
$
|
10,340
|
|
100
|
%
|
|
|||
Unless otherwise indicated, references in this Annual Report to
2014
,
2013
and
2012
are to Tyco's fiscal years ended
September 26, 2014
,
September 27, 2013
and
September 28, 2012
, respectively. The Company has a 52 or 53-week fiscal year that ends on the last Friday in September. Fiscal 2014, 2013, and 2012 were 52-week years.
For a detailed discussion of revenue, operating income and total assets by segment for fiscal years
2014
,
2013
and
2012
see Item 7. Management's Discussion and Analysis and Note 17 to the Consolidated Financial Statements.
History and Development
Tyco International Ltd.
Tyco International Ltd. is a Company organized under the laws of Switzerland. The Company was created as a result of the July 1997 acquisition of Tyco International Ltd., a Massachusetts corporation, by ADT Limited, a public company
1
organized under the laws of Bermuda, at which time ADT Limited changed its name to Tyco International Ltd. Effective March 17, 2009, the Company became a Swiss corporation under articles 620 et seq. of the Swiss Code of Obligations (the "Change of Domicile").
Effective September 28, 2012, the Company completed the spin-offs of The ADT Corporation ("ADT") and Pentair Ltd. (formerly known as Tyco Flow Control International Ltd. ("Tyco Flow Control")), formerly our North American residential security and flow control businesses, respectively, into separate, publicly traded companies in the form of a distribution to Tyco shareholders. Immediately following the spin-off, Pentair, Inc. was merged with a subsidiary of Tyco Flow Control in a tax-free, all-stock merger (the "Merger"), with Pentair Ltd. ("Pentair") succeeding Pentair Inc. as an independent publicly traded company. The distributions, the Merger and related transactions are collectively referred to herein as the "2012 Separation". As a result of the distribution, the operations of Tyco's former flow control and North American residential security businesses are now classified as discontinued operations in all periods presented.
Tyco's registered and principal office is located at Victor von Bruns-Strasse 21, CH-8212 Neuhausen am Rheinfall, Switzerland. Its management office in the United States is located at 9 Roszel Road, Princeton, New Jersey 08540.
On May 30, 2014, Tyco entered into a Merger Agreement ("Merger Agreement") with Tyco International plc, a newly-formed Irish public limited company and a wholly-owned subsidiary of Tyco ("Tyco Ireland"). Under the Merger Agreement, Tyco will merge with and into Tyco Ireland, with Tyco Ireland being the surviving company. This Merger will result in Tyco Ireland becoming Tyco's publicly-traded parent company and change the jurisdiction of organization of Tyco from Switzerland to Ireland. Tyco's shareholders are expected to receive one ordinary share of Tyco Ireland for each common share of Tyco held immediately prior to the Merger. Upon completion of the Merger, Tyco Ireland is expected to conduct, through its subsidiaries, the same businesses as conducted by Tyco before the Merger. The Merger is subject to certain conditions including shareholder approval, which was received at the special general meeting of shareholders held on September 9, 2014. The Merger is expected to become effective in November 2014.
Segments
Each of our three segments serves a highly diverse customer base and none is dependent upon a single customer or group of customers. For fiscal year
2014
, no customer accounted for more than 10% of our revenues, and approximately 47% of our revenues were derived from customers outside of North America.
Our end-use customers, to whom we may sell directly or through wholesalers, distributors, commercial builders or contractors, can generally be grouped in the following categories:
|
•
|
Commercial customers, including residential and commercial property developers, financial institutions, food service businesses and commercial enterprises;
|
|
•
|
Industrial customers, including companies in the oil and gas, power generation, mining, petrochemical and other industries;
|
|
•
|
Retail customers, including international, regional and local consumer outlets;
|
|
•
|
Institutional customers, including a broad range of healthcare facilities, academic institutions, museums and foundations;
|
|
•
|
Governmental customers, including federal, state and local governments, defense installations, mass transportation networks, public utilities and other government-affiliated entities and applications; and
|
|
•
|
Residential and small business customers outside of North America, including owners of single-family homes and local providers of a wide range of goods and services.
|
As discussed under "Competition" below, the markets in which we compete are generally highly fragmented. We therefore compete with many other businesses in markets throughout the world, including other large global businesses, significant regional businesses and many smaller local businesses.
Installation & Services
NA Installation & Services and ROW Installation & Services (collectively, "Installation & Services") designs, sells, installs, services and monitors electronic security and fire detection and suppression systems for retail, commercial, industrial, governmental and institutional customers around the world. Additionally, ROW Installation & Services designs, sells, installs, services and monitors security systems for residential and small business customers under the ADT brand name outside of North America.
2
Security Services
Our Installation & Services segments design, sell, install and service security systems to detect intrusion, control access and react to movement, fire, smoke, flooding, environmental conditions, industrial processes and other hazards. These electronic security systems include detection devices that are usually connected to a monitoring center that receives and records alarm signals where security monitoring specialists verify alarm conditions and initiate a range of response scenarios. For most systems, control panels identify the nature of the alarm and the areas where a sensor was triggered. Our other security solutions include access control systems for sensitive areas such as government facilities and banks; video surveillance systems designed to deter theft and fraud and help protect employees and customers; and asset protection and security management systems designed to monitor and protect physical assets as well as proprietary electronic data. Our offerings also include anti-theft systems utilizing acousto-magnetic and radio frequency identification tags and labels in the retail industry as well as store performance solutions to enhance retailer performance. Many of the world's leading retailers use our
Sensormatic
anti-theft systems to help protect against shoplifting and employee theft. Many of the products that we install for our Installation & Services security customers are designed and manufactured by our Global Products segment. Additionally, our deep experience in designing, integrating, deploying and maintaining large-scale security systems—including, for example, centrally managed security systems that span large commercial and institutional campuses—allows us to install and/or service products manufactured by third parties.
Purchasers of our intrusion systems typically contract for ongoing security system monitoring and maintenance at the time of initial equipment installation. These contracts are generally for a term of one to three years. Systems installed at customers' premises may be owned by us or by our customers. Monitoring center personnel may respond to alarms by relaying appropriate information to local fire or police departments, notifying the customer or taking other appropriate action. In certain markets, we directly provide the alarm response services with highly trained and professionally equipped employees. In some instances, alarm systems are connected directly to local fire or police departments.
In addition, our ROW Installation & Services segment is a leading provider of monitored residential and small business security systems. In addition to traditional burglar alarm and fire detection systems, installation and monitoring services, ROW Installation & Services provides patrol and response services in select geographies, including South Africa. Our ROW Installation & Services segment continues to expand its offering of value-added residential services worldwide, such as an interactive services platform. The interactive services platform allows for remote management of the home security system, as well as lifestyle applications, which currently include remote video, lighting control, and energy management.
Our customers are often prompted to purchase security systems by their insurance carriers, which may offer lower insurance premium rates if a security system is installed or require that a system be installed as a condition of coverage.
Fire Protection Services
Our Installation & Services segments design, sell, install and service fire detection and fire suppression systems in both new and existing facilities. Commercial construction as well as legislation mandating the installation and service of fire detection and suppression systems are significant drivers of demand for our products. Our Installation & Services segments offer a wide range of fire detection and suppression systems, including those designed and manufactured by our Global Products segment and those designed by third parties. These detection systems include fire alarm control panels, advanced fire alarm monitoring systems, smoke and flame detection systems, heat and carbon monoxide detectors and voice evacuation systems. Our Installation & Services segments also offer a wide range of standard water-based sprinkler and chemical suppression systems and custom designed special hazard suppression systems, which incorporate specialized extinguishing agents such as foams, dry chemicals and gases in addition to spill control products designed to absorb, neutralize and solidify spills of hazardous materials. These systems are often especially suited to fire suppression in industrial and commercial applications, including oil and gas, power generation, mining, petrochemical, manufacturing, transportation, data processing, telecommunications, commercial food preparation and marine applications. Our Installation & Services segments continue to focus on system maintenance and inspection, which have become increasingly important parts of our business.
Customers
Our Installation & Services customers range from Fortune 500 companies with diverse worldwide operations who look to us to provide integrated, global solutions for their fire and security needs, to single location commercial customers and individual homeowners. Our Installation & Services customer relationships generally are in the market for new construction or retrofit projects, which represented 47% of Installation & Services fiscal
2014
net revenue, and the market for aftermarket products and services, which accounted for the remaining 53% of Installation & Services fiscal
2014
net revenue. New construction projects are inherently long-lead in nature and we strive to become involved in the planning process for these projects as early as possible. We believe that by actively participating in the preliminary design stages of a new construction project and by offering our design services that combine our global expertise and knowledge of local codes and standards, we
3
can increase our value to customers relative to many smaller local and regional competitors. With respect to fire detection and suppression installations, we prefer to become involved at the time an architectural or engineering design firm is selected. With respect to security system design and installation, we generally become involved in the later stages of a construction project or as tenants take occupancy.
Our relationships with customers in the aftermarket may include any combination of alarm monitoring, fire and security maintenance and or testing and inspection services. We also provide aftermarket services to many customers whose fire and security systems were manufactured or installed by third parties.
Global Products
Our Global Products segment designs, manufactures and sells fire protection, security and life safety products, including intrusion security, anti-theft devices, breathing apparatus, and access control and video management systems.
Fire Protection Products
Fire Protection Products designs, manufactures, distributes and sells fire alarm and fire detection systems, automatic fire sprinkler systems and special hazard suppression systems, including many of the fire protection products that our Installation & Services segments install and service. Fire Protection Products also manufactures and sells grooved products for the rapid joining of piping in both the fire and non-fire markets. Fire Protection Products are marketed under various leading trade names, including
Simplex, Wormald, Ansul and Tyco
and include fire alarm control panels, advanced fire alarm monitoring systems, smoke, heat and carbon monoxide detectors and voice evacuation systems. Fire Protection Products also offers a wide range of water-based sprinkler systems and custom designed special hazard suppression systems, which incorporate specialized extinguishing agents such as foams, dry chemicals and gases. These systems are often especially suited to fire suppression in industrial and commercial applications, including oil and gas, power generation, mining, petrochemical, manufacturing, transportation, data processing, telecommunications, commercial food preparation and marine applications.
Fire Protection Products' systems often are purchased by facility owners through construction engineers and electrical contractors, as well as mechanical or general contractors. In recent years, retrofitting of existing buildings has increased as a result of legislation mandating the installation of fire detection and fire suppression systems, especially in hotels, restaurants, healthcare facilities and educational establishments. The 2009 edition of the International Residential Code, developed by the International Code Council, a non-profit association that develops model codes that are the predominant building and fire safety regulations followed by state and local jurisdictions in the United States, adopted a proposal advanced by firefighters and other life-safety advocates that requires sprinkler systems in new one and two-family homes and townhouses as of January 2011. This national code is not binding on state and local jurisdictions and must be adopted locally before it becomes mandatory for new homes being built in these areas. The timing and extent of adoption, if at all, will vary by jurisdiction. However, we believe that this development may offer opportunities to expand our residential fire suppression business in the United States.
Security Products
Security Products designs and manufactures a wide array of electronic security products, including integrated video surveillance and access control systems to enable businesses to manage their security and enhance business performance. Our global access control solutions include integrated security management systems for enterprise applications, access control solutions applications, alarm management panels, door controllers, readers, keypads and cards. Our global video system solutions include digital video management systems, matrix switchers and controllers, digital multiplexers, programmable cameras, monitors and liquid crystal interactive displays. Our security products for homes and businesses range from basic burglar alarms to comprehensive interactive security systems including alarm control panels, keypads, sensors and central station receiving equipment used in security monitoring centers. Our offerings also include anti-theft systems utilizing acousto magnetic and radio frequency identification tags and labels in the retail industry. Our security products are marketed under various leading trade names, including
Software House, DSC, American Dynamics, Sensormatic, Visonic and Exacq
. Many of the world's leading retailers use our
Sensormatic
anti-theft systems to help protect against shoplifting and employee theft. Security Products manufactures many of the security products that our Installation & Services business installs and services.
Life Safety Products
Life Safety Products manufactures life safety products, including self-contained breathing apparatus designed for firefighter, industrial and military use, supplied air respirators, air-purifying respirators, thermal imaging cameras, gas detection equipment, gas masks and personal protection equipment. The Life Safety Products business operates under various leading trade names, including
Scott Safety
and
Protector
. Our breathing apparatus are used by the military forces of several countries and many U.S. firefighters rely on the
Scott Air-Pak
brand of self-contained breathing apparatus.
4
Customers
Global Products sells products through our Installation & Service segments and indirect distribution channels around the world. Some of Global Products' channel business partners act as dealers selling to smaller fire and security contractors that install fire detection and suppression, security and theft protection systems, whereas others act as integrators that install the products themselves. Builders, contractors and developers are customers for our sprinkler products. End customers for our breathing apparatus and related products include fire departments, municipal and state governments and military forces as well as major companies in the industrial sector.
Competition
The markets that we serve are generally highly competitive and fragmented with a small number of large, global firms and thousands of smaller regional and local companies. Competition is based on price, specialized product capacity, breadth of product line, training, support and delivery, with the relative importance of these factors varying depending on the project complexity, product line, the local market and other factors. Rather than compete primarily on price, we emphasize the quality of our products and services, the reputation of our brands and our knowledge of customers' fire and security needs. Among large industrial, commercial, governmental and institutional customers, we believe that our comprehensive global coverage and product and service offerings provide a competitive advantage. We also believe that our systems integration capabilities, which allow us to offer global solutions to customers that fully integrate our security and/or fire offerings into existing information technology networks, business operations and management tools, and process automation and control systems, set us apart from all but a small number of other large, global competitors.
Competitive dynamics in the fire and security industry generally result in more direct competition and lower margins for installation projects compared to aftermarket products and services. We generally face the greatest competitive pricing pressure for the installation of products that have become more commoditized over time, including standard commercial sprinkler systems and closed-circuit television systems.
Backlog
See Item 7. Management's Discussion and Analysis of Financial Condition and Results of Operations for information relating to our backlog.
Intellectual Property
Patents, trademarks, copyrights and other proprietary rights are important to our business. We also rely upon trade secrets, manufacturing know-how, continuing technological innovations and licensing opportunities to maintain and improve our competitive position. We review third-party proprietary rights, including trademarks, patents and patent applications, in an effort to develop an effective intellectual property strategy, avoid infringement of third-party proprietary rights, identify licensing opportunities and misappropriation of our proprietary rights, and monitor the intellectual property claims of others.
We own a portfolio of patents that principally relates to: electronic security products and systems for intrusion detection, access control, electronic identification tags & video surveillance; fire protection products and systems, including fire detection and fire suppression with chemical, gas, foam and water agents; personal protective products and systems for fire and other hazards. We also own a portfolio of trademarks and are a licensee of various patents and trademarks. Patents for individual products extend for varying periods according to the date of patent filing or grant and the legal term of patents in the various countries where patent protection is obtained. Trademark rights may potentially extend for longer periods of time and are dependent upon national laws and use of the marks.
While we consider our patents to be valuable assets that help prevent or delay the commoditization of our products and thus extend their life cycles, we do not believe that our overall operations are dependent upon any single patent or group of related patents. We share the ADT® trademark with ADT and operate under a brand governance agreement between the two companies.
5
Research and Development
We are engaged in research and development in an effort to introduce new products, to enhance the effectiveness, ease of use, safety and reliability of our existing products and to expand the applications for which the uses of our products are appropriate. For example, in order to position ourselves to participate in and lead the development of residential interactive platforms, enterprise-wide integrated access control platforms and transition IP video platforms, we have made significant investments in our security products portfolio. In addition, we continually evaluate developing technologies in areas that we believe will enhance our business for possible investment. Our research and development expense was $
193 million
in
2014
, $
172
million in
2013
and $
145
million in
2012
related to new product development.
Raw and Other Purchased Materials
We are a large buyer of metals and other commodities, including fuel for our vehicle fleet. We purchase materials from a large number of independent sources around the world and have experienced no shortages that have had a material adverse effect on our businesses. We enter into long-term supply contracts, using fixed or variable pricing to manage our exposure to potential supply disruptions. Significant changes in certain raw material, including steel, brass and certain flurochemicals used in our fire suppression agents, may have an adverse impact on costs and operating margins.
Governmental Regulation and Supervision
Our operations are subject to numerous federal, state and local laws and regulations, both within and outside the United States, in areas such as: consumer protection, government contracts, international trade, environmental protection, labor and employment, tax, licensing and others. For example, most U.S. states and non-U.S. jurisdictions in which we operate have licensing laws directed specifically toward the alarm and fire suppression industries. Our security businesses currently rely extensively upon the use of wireline and wireless telephone service to communicate signals. Wireline and wireless telephone companies in the United States are regulated by the federal and state governments. In addition, government regulation of fire safety codes can impact our fire businesses. These and other laws and regulations impact the manner in which we conduct our business, and changes in legislation or government policies can affect our worldwide operations, both favorably and unfavorably. For a more detailed description of the various laws and regulations that affect our business, see Item 1A. Risk Factors—Risks Related to Legal, Regulatory and Compliance Matters.
Environmental Matters
We are involved in various stages of investigation and cleanup related to environmental remediation matters at a number of sites. The ultimate cost of site cleanup is difficult to predict given the uncertainties regarding the extent of the required cleanup, the interpretation of applicable laws and regulations and alternative cleanup methods. As of
September 26, 2014
, we concluded that it was probable that we would incur remedial costs in the range of approximately
$38 million
to
$79 million
. As of
September 26, 2014
, Tyco concluded that the best estimate within this range is approximately
$42 million
, of which
$23 million
is included in Accrued and other current liabilities and Accounts payable and
$19 million
is included in Other liabilities in the Company's Consolidated Balance Sheet.
The majority of the liabilities described above relate to ongoing remediation efforts at a facility in the Company's Global Products segment located in Marinette, Wisconsin, which the Company acquired in 1990 in connection with its acquisition of, among other things, the Ansul product line. Prior to Tyco's acquisition, Ansul manufactured arsenic-based agricultural herbicides at the Marinette facility, which resulted in significant arsenic contamination of soil and groundwater on the Marinette site and in parts of the adjoining Menominee River. Ansul has been engaged in ongoing remediation efforts at the Marinette site since 1990, and in February 2009 entered into an Administrative Consent Order (the "Consent Order") with the U.S. Environmental Protection Agency to address the presence of arsenic at the Marinette site. Under this agreement, Ansul's principal obligations are to contain the arsenic contamination on the site, pump and treat on-site groundwater, dredge, treat and properly dispose of contaminated sediments in the adjoining river areas, and monitor contamination levels on an ongoing basis. Activities completed under the Consent Order since 2009 include the installation of a subsurface barrier wall around the facility to contain contaminated groundwater, the installation of a groundwater extraction and treatment system and the dredging and offsite disposal of treated river sediment. As of
September 26, 2014
, the Company concluded that its remaining remediation and monitoring costs related to the Marinette facility were in the range of approximately
$27 million
to
$54 million
. The Company's best estimate within that range is approximately
$30 million
, of which
$18 million
is included in Accrued and other current liabilities and
$12 million
is included in Other liabilities in the Company's Consolidated Balance Sheet. During the years ended September 26, 2014, September 27, 2013, and September 28, 2012, the Company recorded charges of nil, $100 million, and $17 million, respectively, in Selling, general and administrative expenses in the Consolidated Statement of Operations. Although the Company has recorded its best estimate of the costs that it will incur to remediate and monitor the arsenic contamination at the Marinette facility, it is possible that technological, regulatory or enforcement developments, the results of environmental studies or other factors could change the Company's expectations with respect to future charges and
6
cash outlays, and such changes could be material to the Company's future results of operations, financial condition or cash flows.
Employees
As of
September 26, 2014
, we employed approximately
57,000
people worldwide, of which approximately
20,000
were employed in the United States and approximately
37,000
were outside the United States. Approximately
8,000
employees are covered by collective bargaining agreements or works councils and we believe that our relations with the labor unions are generally good.
Available Information
Tyco is required to file annual, quarterly and special reports, proxy statements and other information with the SEC. Investors may read and copy any document that Tyco files, including this Annual Report on Form 10-K, at the SEC's Public Reference Room at 100 F Street, N.E., Room 1580, Washington, DC 20549. Investors may obtain information on the operation of the Public Reference Room by calling the SEC at 1-800-SEC-0330. In addition, the SEC maintains an Internet site at
http://www.sec.gov
that contains reports, proxy and information statements and other information regarding issuers that file electronically with the SEC, from which investors can electronically access Tyco's SEC filings.
Our Internet website is
www.tyco.com
. We make available free of charge on or through our website our Annual Reports on Form 10-K, Quarterly Reports on Form 10-Q, Current Reports on Form 8-K, reports filed pursuant to Section 16 and any amendments to those reports filed or furnished pursuant to section 13(a) or 15(d) of the Exchange Act as soon as reasonably practicable after we electronically file or furnish such materials to the SEC. In addition, we have posted the charters for our Audit Committee, Compensation and Human Resources Committee, and Nominating and Governance Committee, as well as our Board Governance Principles and Guide to Ethical Conduct, on our website under the headings "About—Board of Directors" and "About—Corporate Social Responsibility." The annual report to shareholders, charters and principles are not incorporated in this report by reference. We will also provide a copy of these documents free of charge to shareholders upon request.
You should carefully consider the risks described below before investing in our publicly traded securities. The risks described below are not the only ones facing us. Our business is also subject to the risks that affect many other companies, such as technological obsolescence, labor relations, geopolitical events, climate change and international operations.
Risks Relating to Our Businesses
General economic and cyclical industry conditions may adversely affect our financial condition, results of operations or cash flows.
Our operating results have been and may in the future be adversely affected by general economic conditions and the cyclical pattern of certain markets that we serve. For example, demand for our services and products is significantly affected by the level of commercial and residential construction, industrial capital expenditures for facility expansions and maintenance and the amount of discretionary business and consumer spending, each of which historically has displayed significant cyclicality. Even if demand for our products is not negatively affected, the liquidity and financial position of our customers could impact their ability to pay in full and/or on a timely basis.
Much of the demand for installation of security products and fire detection and suppression solutions is driven by commercial and residential construction and industrial facility expansion and maintenance projects. Commercial and residential construction projects are heavily dependent on general economic conditions, localized demand for commercial and residential real estate and availability of credit. In recent years, many commercial and residential real estate markets have experienced significant fluctuations in supply and demand, and this volatility may continue indefinitely. In addition, most commercial and residential real estate developers rely heavily on project financing from banks and other institutional lenders in order to initiate and complete projects. Declines in real estate values in many parts of the world have led to significant reductions in the availability of project financing, even in markets where demand may otherwise be sufficient to support new construction. These factors have in turn hampered demand for new fire detection and suppression and security installations.
Levels of industrial capital expenditures for facility expansions and maintenance turn on general economic conditions, economic conditions within specific industries we serve, expectations of future market behavior and available financing. Additionally, volatility in commodity prices can negatively affect the level of these activities and can result in postponement of capital spending decisions or the delay or cancellation of existing orders.
7
The businesses of many of our industrial customers, particularly oil and gas companies, chemical and petrochemical companies, mining and general industrial companies, are to varying degrees cyclical and have experienced periodic downturns. During such economic downturns, customers in these industries historically have tended to delay major capital projects, including greenfield construction, expensive maintenance projects and upgrades. Additionally, demand for our products and services may be affected by volatility in energy and commodity prices and fluctuating demand forecasts, as our customers may be more conservative in their capital planning, which may reduce demand for our products and services. Although our industrial customers tend to be less dependent on project financing than real estate developers, disruptions in financial markets and banking systems, could make credit and capital markets difficult for our customers to access, and could raise the cost of new debt for our customers to prohibitive levels. Any difficulty in accessing these markets and the increased associated costs can have a negative effect on investment in large capital projects, including necessary maintenance and upgrades, even during periods of favorable end-market conditions.
Many of our customers outside of the industrial and commercial sectors, including governmental and institutional customers, have experienced budgetary constraints as sources of revenue, including tax receipts, general obligation and construction bonds, endowments and donations, have been negatively impacted by adverse economic conditions. These budgetary constraints have in the past and may in the future reduce demand for our products and services among governmental and institutional customers.
Reduced demand for our products and services could result in the delay or cancellation of existing orders or lead to excess capacity, which unfavorably impacts our absorption of fixed costs. This reduced demand may also erode average selling prices in the industries we serve. Any of these results could materially and adversely affect our business, financial condition, results of operations and cash flows.
We face competition in each of our businesses, which results in pressure on our profit margins and limits our ability to maintain or increase the market share of our products and services. If we cannot successfully compete in an increasingly global market-place, our operating results may be adversely affected.
We operate in competitive domestic and international markets and compete with many highly competitive manufacturers and service providers, both domestically and on a global basis. Our manufacturing businesses face competition from lower cost manufacturers in Asia and elsewhere and our service businesses face competition from alternative service providers around the world. Currently, key components of our competitive position are our ability to bring to market industry-leading products and services, to adapt to changing competitive environments and to manage expenses successfully. These factors require continuous management focus on maintaining our competitive position through technological innovation, cost reduction, productivity improvement and a regular appraisal of our asset portfolio. If we are unable to maintain our position as a market leader, or to achieve appropriate levels of scalability or cost-effectiveness, or if we are otherwise unable to manage and react to changes in the global marketplace, our business, financial condition, results of operations and cash flows could be materially and adversely affected.
Our future growth is largely dependent upon our ability to continue to adapt our products, services and organization to meet the demands of local markets in both developed and emerging economies and by developing or acquiring new technologies that achieve market acceptance with acceptable margins.
Our businesses operate in global markets that are characterized by evolving industry standards. Although many of our largest competitors are also global industrial companies, we compete with thousands of smaller regional and local companies that may be positioned to offer products and services at lower cost than ours, particularly in emerging markets, or to capitalize on highly localized relationships and knowledge that are difficult for us to replicate. We have found that in several emerging markets potential customers prefer local suppliers, in some cases because of existing relationships and in other cases because of local legal restrictions or incentives that favor local businesses.
Accordingly, our future success depends upon a number of factors, including our ability to: adapt our products, services, organization, workforce and sales strategies to fit localities throughout the world, particularly in high growth emerging markets; identify emerging technological and other trends in our target end-markets; and develop or acquire, manufacture and bring competitive products and services to market quickly and cost-effectively. Adapting our businesses to serve more local markets will require us to invest considerable resources in building our distribution channels and engineering and manufacturing capabilities in those markets to ensure that we can address customer demand. Even when we invest in growing our business in local markets, we may not be successful for any number of reasons, including competitive pressure from regional and local businesses that may have superior local capabilities or products that are produced more locally at lower cost. Our ability to develop or acquire new products and services can affect our competitive position and requires the investment of significant resources. These acquisitions and development efforts divert resources from other potential investments in our businesses, and they may not lead to the development of new technologies, products or services on a timely basis. Moreover, as we introduce new products, we may be unable to detect and correct defects in the design of a product or in its application to a specified use,
8
which could result in loss of sales or delays in market acceptance. Even after introduction, new or enhanced products may not satisfy consumer preferences and product failures may cause consumers to reject our products. As a result, these products may not achieve market acceptance and our brand images could suffer. In addition, the markets for our products and services may not develop or grow as we anticipate. As a result, the failure to effectively adapt our products and services to the needs of local markets, the failure of our technology, products or services to gain market acceptance, the potential for product defects or the obsolescence of our products and services could significantly reduce our revenues, increase our operating costs or otherwise materially and adversely affect our business, financial condition, results of operations and cash flows.
We are exposed to greater risks of liability for employee acts or omissions, or system failure, than may be inherent in other businesses.
If a customer or third party believes that he or she has suffered harm to person or property due to an actual or alleged act or omission of one of our employees or a security or fire system failure, he or she may pursue legal action against us, and the cost of defending the legal action and of any judgment could be substantial. In particular, because our products and services are intended to protect lives and real and personal property, we may have greater exposure to litigation risks than businesses that provide other products and services. We could face liability for failure to respond adequately to alarm activations or failure of our fire protection systems to operate as expected. The nature of the services we provide exposes us to the risks that we may be held liable for employee acts or omissions or system failures. In an attempt to reduce this risk, our installation, service and monitoring agreements and other contracts contain provisions limiting our liability in such circumstances, and we typically maintain product liability insurance to mitigate the risk that our products and services fail to operate as expected. However, in the event of litigation with respect to such matters, it is possible that contract limitations may be deemed not applicable or unenforceable, that our insurance coverage is not adequate, or that insurance carriers deny coverage of our claims. As a result, such employee acts or omissions or system failures could have a material adverse effect on our business, financial condition, results of operations and cash flows.
We face risks relating to doing business internationally that could adversely affect our business.
Our business operates and serves consumers worldwide. There are certain risks inherent in doing business internationally, including:
|
•
|
economic volatility and the impact of economic conditions in various regions;
|
|
•
|
the difficulty of enforcing agreements, collecting receivables and protecting assets, especially our intellectual property rights, through non-U.S. legal systems;
|
|
•
|
possibility of unfavorable circumstances from host country laws, regulations or licensing requirements;
|
|
•
|
fluctuations in revenues, operating margins and other financial measures due to currency exchange rate fluctuations and restrictions on currency and earnings repatriation;
|
|
•
|
trade protection measures, import or export restrictions, licensing requirements and local fire and security codes and standards;
|
|
•
|
increased costs and risks of developing, staffing and simultaneously managing a number of foreign operations as a result of distance as well as language and cultural differences;
|
|
•
|
issues related to occupational safety and adherence to local labor laws and regulations;
|
|
•
|
potentially adverse tax developments;
|
|
•
|
longer payment cycles;
|
|
•
|
changes in the general political, social and economic conditions in the countries where we operate, particularly in emerging markets;
|
|
•
|
the threat of nationalization and expropriation, as well as new or changed restrictions regarding foreign ownership of assets - in particular with respect to security products or services that may be viewed by certain governments as sovereign security interests;
|
|
•
|
the presence of corruption in certain countries; and
|
|
•
|
fluctuations in available municipal funding in those instances where a project is government financed.
|
One or more of these factors could adversely affect our business and financial condition.
In order to manage our day-to-day operations, we must overcome cultural and language barriers and assimilate different business practices. In addition, we are required to create compensation programs, employment policies and other administrative programs that comply with laws of multiple countries. We also must communicate and monitor standards and directives across our global network. Our failure to successfully manage our geographically diverse operations could impair our ability to react quickly to changing business and market conditions and to enforce compliance with standards and procedures, any of which could adversely impact our financial condition, results of operations and cash flows.
9
Volatility in currency exchange rates, commodity prices and interest rates may adversely affect our financial condition, results of operations or cash flows.
A significant portion of our revenue and certain of our costs, assets and liabilities, are denominated in currencies other than the U.S. dollar. Certain of the foreign currencies to which we have exposure have undergone significant devaluation in the past, which can reduce the value of our local monetary assets, reduce the U.S. dollar value of our local cash flow and potentially reduce the U.S. dollar value of future local net income. Although we intend to enter into forward exchange contracts to economically hedge some of our risks associated with transactions denominated in certain foreign currencies, no assurances can be made that exchange rate fluctuations will not adversely affect our financial condition, results of operations and cash flows.
In addition, we are a large buyer of metals and other non-metal commodities, including fossil fuels for our manufacturing operations and our vehicle fleet, the prices of which have fluctuated significantly in recent years. Increases in the prices of some of these commodities could increase the costs of manufacturing our products and providing our services. We may not be able to pass on these costs to our customers or otherwise effectively manage price volatility and this could have a material adverse effect on our financial condition, results of operations or cash flows. Further, in a declining price environment, our operating margins may contract because we account for inventory using the first-in, first-out method.
We monitor these exposures as an integral part of our overall risk management program. In some cases, we may enter into hedge contracts to insulate our results of operations from these fluctuations. These hedges are subject to the risk that our counterparty may not perform. As a result, changes in currency exchange rates, commodity prices and interest rates could have a material adverse effect on our business, financial condition, results of operations and cash flows.
Our business strategy includes acquiring companies and making investments that complement our existing business. These acquisitions and investments could be unsuccessful or consume significant resources, which could adversely affect our operating results.
We will continue to analyze and evaluate the acquisition of strategic businesses or product lines with the potential to strengthen our industry position or enhance our existing set of product and services offerings. These acquisitions are likely to include businesses in emerging markets, which are often riskier than acquisitions in developed markets. We cannot assure you that we will identify or successfully complete transactions with suitable acquisition candidates in the future. Nor can we assure you that completed acquisitions will be successful.
Acquisitions and investments may involve significant cash expenditures, debt incurrence, operating losses and expenses that could have a material adverse effect on our business, financial condition, results of operations and cash flows. Acquisitions involve numerous other risks, including:
|
•
|
diversion of management time and attention from daily operations;
|
|
•
|
difficulties integrating acquired businesses, technologies and personnel into our business;
|
|
•
|
inability to obtain required regulatory approvals and/or required financing on favorable terms;
|
|
•
|
potential loss of key employees, key contractual relationships, or key customers of acquired companies or of us;
|
|
•
|
assumption of the liabilities and exposure to unforeseen liabilities of acquired companies; and
|
|
•
|
dilution of interests of holders of our common shares through the issuance of equity securities or equity-linked securities.
|
It may be difficult for us to complete transactions quickly and to integrate acquired operations efficiently into our current business operations. Moreover, we may be unable to obtain strategic or operational benefits that are expected from our acquisitions. Any acquisitions or investments may ultimately harm our business or financial condition, as such acquisitions may not be successful and may ultimately result in impairment charges.
A significant percentage of our future growth is anticipated to come from emerging markets, and if we are unable to expand our operations in emerging markets, our growth rate could be negatively affected.
One aspect of our growth strategy is to seek significant growth in emerging markets, including China, India, Latin America and the Middle East, through both organic investments and through acquisitions. Emerging markets generally involve greater financial and operational risks than more mature markets, where legal systems are more developed and familiar to us. In some cases, emerging markets have greater political and economic volatility, greater vulnerability to infrastructure and labor disruptions, are more susceptible to corruption, and are locations where it may be more difficult to impose corporate standards and procedures and the extraterritorial laws of the United States. Negative or uncertain political climates and military disruptions in developing and emerging markets could also adversely affect us.
10
We cannot guarantee that our growth strategy will be successful. If we are unable to manage the risks inherent in our growth strategy in emerging markets, including civil unrest, international hostilities, natural disasters, security breaches and failure to maintain compliance with multiple legal and regulatory systems, our results of operations and ability to grow could be materially adversely affected.
Failure to maintain and upgrade the security of our information and technology networks, including personally identifiable and other information; non-compliance with our contractual or other legal obligations regarding such information; or a violation of the Company's privacy and security policies with respect to such information, could adversely affect us.
We are dependent on information technology networks and systems, including the Internet, to process, transmit and store electronic information. In the normal course of our business, we collect and retain significant volumes of certain types of personally identifiable and other information pertaining to our customers, stockholders and employees, including video and other customer data obtained in connection with monitoring and analytical services. The legal, regulatory and contractual environment surrounding information security and privacy is constantly evolving and companies that collect and retain such information are under increasing attack by cyber-criminals around the world. A significant actual or potential theft, loss, fraudulent use or misuse of customer, stockholder, employee or our data, whether by third parties or as a result of employee malfeasance or otherwise, non-compliance with our contractual or other legal obligations regarding such data or a violation of our privacy and security policies with respect to such data could adversely impact our reputation and could result in significant costs, fines, litigation or regulatory action against us. In addition, we depend on our information technology infrastructure for business-to-business and business-to-consumer electronic commerce. Security breaches of this infrastructure can create system disruptions and shutdowns that could result in disruptions to our operations. Increasingly, our security products and services are accessed wirelessly and through the Internet, and security breaches in connection with the delivery of our services wirelessly or via the Internet may affect us and could be detrimental to our reputation, business, operating results and financial condition. We cannot be certain that advances in criminal capabilities, new discoveries in the field of cryptography or other developments will not compromise or breach the technology protecting the networks that access our products and services.
Failure to maintain, upgrade and consolidate our information and technology networks could adversely affect us.
We are continuously upgrading and consolidating our systems, including making changes to legacy systems, replacing legacy systems with successor systems with new functionality, acquiring new systems with new functionality and moving to cloud-based technology solutions. These types of activities subject us to inherent costs and risks associated with replacing and changing these systems, including impairment of our ability to fulfill customer orders, potential disruption of our internal control structure, substantial capital expenditures, additional administration and operating expenses, retention of sufficiently skilled personnel to implement and operate the new systems, demands on management time, and other risks and costs of delays or difficulties in transitioning to new systems or of integrating new systems into our current systems. Our system implementations may not result in productivity improvements at a level that outweighs the costs of implementation, or at all. In addition, the implementation of new technology systems may cause disruptions in our business operations and have an adverse effect on our business and operations, if not anticipated and appropriately mitigated.
If we cannot obtain sufficient quantities of materials, components and equipment required for our manufacturing activities at competitive prices and quality and on a timely basis, or if our manufacturing capacity does not meet demand, our financial condition, results of operations and cash flows may suffer.
We purchase materials, components and equipment from unrelated parties for use in our manufacturing operations. If we cannot obtain sufficient quantities of these items at competitive prices and quality and on a timely basis, we may not be able to produce sufficient quantities of product to satisfy market demand, product shipments may be delayed or our material or manufacturing costs may increase. In addition, because we cannot always immediately adapt our cost structures to changing market conditions, our manufacturing capacity may at times exceed or fall short of our production requirements. Any of these problems could result in the loss of customers, provide an opportunity for competing products to gain market acceptance and otherwise materially and adversely affect our business, financial condition, results of operations and cash flows.
Failure to attract, motivate, train and retain qualified personnel could adversely affect our business.
Our culture and guiding principles focus on continuously training, motivating and developing employees, and in particular we strive to attract, motivate, train and retain qualified engineers and managers to handle the day-to-day operations of a highly diversified organization. Many of our manufacturing processes, and many of the integrated solutions we offer, are highly technical in nature. Our ability to expand or maintain our business depends on our ability to hire, train and retain engineers and other technical professionals with the skills necessary to understand and adapt to the continuously developing needs of our customers. This includes developing talent and leadership capabilities in emerging markets, where the depth of skilled employees is often limited and competition for resources is intense. Our geographic expansion strategy in emerging
11
markets depends on our ability to attract, retain and integrate qualified managers and engineers. If we fail to attract, motivate, train and retain qualified personnel, or if we experience excessive turnover, we may experience declining sales, manufacturing delays or other inefficiencies, increased recruiting, training and relocation costs and other difficulties, and our business, financial condition, results of operations and cash flows could be materially and adversely affected.
We may be required to recognize substantial impairment charges in the future.
Pursuant to accounting principles generally accepted in the United States, we are required to assess our goodwill, intangibles and other long-lived assets periodically to determine whether they are impaired. Disruptions to our business, unfavorable end-market conditions and protracted economic weakness, unexpected significant declines in operating results of reporting units, divestitures and market capitalization declines may result in material charges for goodwill and other asset impairments. We maintain significant goodwill and intangible assets on our balance sheet, and we believe these balances are recoverable. However, fair value determinations require considerable judgment and are sensitive to change. Impairments to one or more of our reporting units could occur in future periods whether or not connected with the annual impairment analysis. Future impairment charges could materially affect our reported earnings in the periods of such charges and could adversely affect our financial condition and results of operations.
Our residential and commercial security businesses may experience higher rates of customer attrition, which may reduce our future revenue and cause us to change the estimated useful lives of assets related to our security monitoring customers, increasing our depreciation and amortization expense.
If our residential or commercial security customers are dissatisfied with our products or services and switch to competitive products or services, or disconnect for other reasons, our recurring revenue and results of operations may be materially adversely affected. The risk is more pronounced in times of economic uncertainty, as customers may reduce amounts spent on the products and services we provide. We amortize the costs of acquired monitoring contracts and related customer relationships based on the estimated life of the customer relationships. Internally generated residential and commercial pools are similarly depreciated. If customer disconnect rates were to rise significantly, we may be required to accelerate the depreciation and amortization of subscriber system assets and intangible assets, which could cause a material adverse effect on our financial condition or results of operations.
Divestitures of some of our businesses or product lines may materially adversely affect our financial condition, results of operations or cash flows.
We continually evaluate the performance of all of our businesses and may sell businesses or product lines. Divestitures involve risks, including difficulties in the separation of operations, services, products and personnel, the diversion of management's attention from other business concerns, the disruption of our business, the potential loss of key employees and the retention of uncertain environmental or other contingent liabilities related to the divested business. In addition, divestitures may result in significant asset impairment charges, including those related to goodwill and other intangible assets, which could have a material adverse effect on our financial condition and results of operations. We cannot assure you that we will be successful in managing these or any other significant risks that we encounter in divesting a business or product line, and any divestiture we undertake could materially and adversely affect our business, financial condition, results of operations and cash flows.
Our business may be adversely affected by work stoppages, union negotiations, labor disputes and other matters associated with our labor force.
We employ over 57,000 people worldwide. Approximately 14% of these employees are covered by collective bargaining agreements or works council. Although we believe that our relations with the labor unions and works councils that represent our employees are generally good and we have experienced no material strikes or work stoppages recently, no assurances can be made that we will not experience in the future these and other types of conflicts with labor unions, works council, other groups representing employees or our employees generally, or that any future negotiations with our labor unions will not result in significant increases in our cost of labor. Additionally, a work stoppage at one of our suppliers could materially and adversely affect our operations if an alternative source of supply were not readily available. Stoppages by employees of our customers could also result in reduced demand for our products.
A material disruption of our operations, particularly at our monitoring and/or manufacturing facilities, could adversely affect our business.
If our operations, particularly at our monitoring facilities and/or manufacturing facilities, were to be disrupted as a result of significant equipment failures, natural disasters, power outages, fires, explosions, terrorism, sabotage, adverse weather conditions, public health crises, labor disputes or other reasons, we may be unable to effectively respond to alarm signals, fill
12
customer orders and otherwise meet obligations to or demand from our customers, which could adversely affect our financial performance.
Interruptions in production could increase our costs and reduce our sales. Any interruption in production capability could require us to make substantial capital expenditures or purchase alternative material at higher costs to fill customer orders, which could negatively affect our profitability and financial condition. We maintain property damage insurance that we believe to be adequate to provide for reconstruction of facilities and equipment, as well as business interruption insurance to mitigate losses resulting from any production interruption or shutdown caused by an insured loss. However, any recovery under our insurance policies may not offset the lost sales or increased costs that may be experienced during the disruption of operations, which could adversely affect our business, financial condition, results of operations and cash flow.
We may be unable to execute on our strategic priorities.
In connection with the spin-offs of our former North American residential and small business security business and flow control businesses in September 2012, we anticipated certain financial, operational, managerial and other benefits to Tyco, and in particular we commenced certain productivity and other strategic initiatives following the spin-offs intended to reduce complexity, restructure operations and leverage Tyco’s scale in certain areas such as sourcing. We may not be able to achieve the anticipated results of these actions on the scale that we expected, and the anticipated benefits of the spin-offs, and the productivity and other strategic initiatives may not be fully realized.
We and ADT have entered into non-compete and non-solicit restrictions that prohibited us from competing with ADT in the residential and small business security business in the United States and Canada, and prohibited ADT from competing with us in the commercial fire and security businesses, in each case until September 29, 2014.
The non-compete provisions included in the ADT Separation and Distribution Agreement entered into in connection with the spin-offs have expired. These provisions (i) prohibited us from competing with ADT in the residential and small business security business in the United States and Canada and (ii) prohibited ADT from competing with Tyco in the commercial fire and security businesses, subject to certain small business related exceptions, in each case until September 29, 2014. In addition, the ADT Separation and Distribution Agreement contains non-solicitation provisions that prevented (i) us from soliciting ADT’s residential small business customers in the United States and Canada and (ii) ADT from soliciting our security customers, in each case until September 29, 2014. These provisions effectively prevented us from expanding into ADT’s business, and ADT from expanding into our business, in these jurisdictions until September 29, 2014. Because these restrictions have expired, ADT is no longer contractually prohibited from competing with us for commercial security customers, especially smaller businesses. ADT has begun to compete with us and, if it is successful in this regard, it could materially and adversely affect our business, financial condition, results and operations and cash flows.
In connection with the 2012 Separation, we re-branded our North American commercial security business to Tyco Integrated Security and we no longer own the right to use the ADT
®
brand name in the United States and Canada.
Prior to the spin-off of ADT in September 2012, we re-branded our North American commercial security business to Tyco Integrated Security. There is no assurance that we will be able to achieve name recognition or status under our new brand that is comparable to the recognition and status previously enjoyed. The failure of these initiatives could adversely affect our ability to attract and retain customers, resulting in reduced revenues. In addition, as a result of the spin-offs, we own the ADT
®
brand name in jurisdictions outside of the United States and Canada, and ADT owns the brand name in the United States and Canada. Although we have entered agreements with ADT designed to protect the value of the ADT
®
brand, we cannot assure you that actions taken by ADT will not negatively impact the value of the brand outside of the United States and Canada. These factors expose us to the risk that the ADT
®
brand name could suffer reputational damage or devaluation for reasons outside of our control, including ADT's business conduct in the United States and Canada. Any of these factors may materially and adversely affect our business, financial condition, results of operations and cash flows.
Risks Related to Legal, Regulatory and Compliance Matters
We are subject to a variety of claims and litigation that could cause a material adverse effect on our financial condition, results of operations and cash flows.
In the normal course of our business, we are subject to claims and lawsuits, including from time to time claims for damages related to product liability and warranties, litigation alleging the infringement of intellectual property rights, litigation alleging anti-competitive behavior, and litigation related to employee matters, wages and commercial disputes. In certain circumstances, patent infringement and anti-trust laws permit successful plaintiffs to recover treble damages. Furthermore, we face exposure to product liability claims in the event that any of our products results in personal injury or property damage. The defense of these lawsuits may involve significant expense and diversion of our management's attention. In addition, we
13
may be required to pay damage awards or settlements, become subject to injunctions or other equitable remedies or suffer from adverse publicity that could have a material adverse effect on our business, financial condition, results of operations and cash flows.
We are subject to product liability claims relating to products we manufacture or install. These claims could result in significant costs and liabilities and reduce our profitability.
We face exposure to product liability claims in the event that any of our products results in personal injury or property damage. In addition, if any of our products prove to be defective, we may be required to recall or redesign such products, which could result in significant unexpected costs. Any insurance we maintain may not be available on terms acceptable to us, such coverage may not be adequate for liabilities actually incurred, and our insurance carriers may deny coverage for claims made by us. Any claim or product recall could result in adverse publicity against us, which could adversely affect our financial condition, results of operations or cash flows.
In addition, we could face liability for failure to respond adequately to alarm activations or failure of our fire protection systems to operate as expected. The nature of the services we provide exposes us to the risks that we may be held liable for employee acts or omissions or system failures. In an attempt to reduce this risk, our alarm monitoring agreements and other contracts contain provisions limiting our liability in such circumstances. We cannot provide assurance, however, that these limitations will be enforced. Losses from such litigation could be material to our financial condition, results of operations or cash flows.
Our businesses operate in regulated industries and are subject to a variety of complex and continually changing laws and regulations.
Our operations and employees are subject to various U.S. federal, state and local licensing laws, fire and security codes and standards and other laws and regulations. In certain jurisdictions, we are required to obtain licenses or permits to comply with standards governing employee selection and training and to meet certain standards in the conduct of our business. The loss of such licenses, or the imposition of conditions to the granting or retention of such licenses, could have a material adverse effect on us. Furthermore, our systems generally must meet fire and building codes in order to be installed, and it is possible that our current or future products will fail to meet such codes, which could require us to make costly modifications to our products or to forgo marketing in certain jurisdictions.
Changes in laws or regulations could require us to change the way we operate or to utilize resources to maintain compliance, which could increase costs or otherwise disrupt operations. In addition, failure to comply with any applicable laws or regulations could result in substantial fines or revocation of our operating permits and licenses. If laws and regulations were to change or if we or our products failed to comply, our business, financial condition and results of operations could be materially and adversely affected.
Due to the international scope of our operations, the system of laws and regulations to which we are subject is complex and includes regulations issued by the U.S. Customs and Border Protection, the U.S. Department of Commerce's Bureau of Industry and Security, the U.S. Treasury Department's Office of Foreign Assets Control and various non U.S. governmental agencies, including applicable export controls, customs, currency exchange control and transfer pricing regulations, and laws regulating the foreign ownership of assets. No assurances can be made that we will continue to be found to be operating in compliance with, or be able to detect violations of, any such laws or regulations. In addition, we cannot predict the nature, scope or effect of future regulatory requirements to which our international operations might be subject or the manner in which existing laws might be administered or interpreted.
We could be adversely affected by violations of the U.S. Foreign Corrupt Practices Act and similar anti-bribery laws outside the United States.
The U.S. Foreign Corrupt Practices Act (the "FCPA") and similar anti-bribery laws in other jurisdictions generally prohibit companies and their intermediaries from making improper payments to government officials or other persons for the purpose of obtaining or retaining business. Recent years have seen a substantial increase in anti-bribery law enforcement activity, with more frequent and aggressive investigations and enforcement proceedings by both the Department of Justice ("DOJ") and the U.S. Securities and Exchange Commission ("SEC"), increased enforcement activity by non-U.S. regulators, and increases in criminal and civil proceedings brought against companies and individuals. Our policies mandate compliance with these anti-bribery laws. We operate in many parts of the world that are recognized as having governmental and commercial corruption and in certain circumstances, strict compliance with anti-bribery laws may conflict with local customs and practices. Because many of our customers and end users are involved in infrastructure construction and energy production, they are often subject to increased scrutiny by regulators. We cannot assure you that our internal control policies and procedures will always protect us from reckless or criminal acts committed by our employees or third party intermediaries. In the event that we believe or have reason to believe that our employees or agents have or may have violated applicable anti-
14
corruption laws, including the FCPA, we may be required to investigate or have outside counsel investigate the relevant facts and circumstances, which can be expensive and require significant time and attention from senior management. Violations of these laws may result in criminal or civil sanctions, which could disrupt our business and result in a material adverse effect on our reputation, business, results of operations or financial condition.
Furthermore, in September 2012 we agreed to the settlement of charges related to alleged FCPA violations with the DOJ and SEC. In connection with the settlement, we entered into a consent agreement with the SEC and a non-prosecution agreement with the DOJ, and a subsidiary of ours (which is no longer part of Tyco as a result of the 2012 Separation) pleaded guilty to one count of conspiracy to violate the FCPA. Pursuant to the three-year non-prosecution agreement, we have acknowledged that a number of our subsidiaries made payments, both directly and indirectly, to government officials in order to obtain and retain business with private and state-owned entities, and falsely described the payments in the subsidiaries' books, records and accounts. The non-prosecution agreement also acknowledges Tyco's timely, voluntary and complete disclosure to the DOJ, and our cooperation with the DOJ's investigation-including a global internal investigation concerning bribery and related misconduct-and extensive remediation. Under the non-prosecution and other agreements, we have agreed to cooperate with and report periodically to the DOJ and other governmental authorities on matters related to our compliance efforts, including informing the DOJ when we become aware of possible violations of the FCPA as a result of our global audit program, and to continue to implement an enhanced compliance program and internal controls designed to prevent and detect FCPA violations. Notwithstanding our settlement of the DOJ and SEC investigations, we may be subject to allegations of FCPA violations in the future and we may be subject to commercial impacts such as lost revenue from customers who decline to do business with us as a result of these compliance matters. If so, or if we are unable to comply with the provisions of the non-prosecution and other agreements, we may be subject to additional investigation or enforcement by the DOJ or SEC. In such a case, we could be subject to material fines, injunctions on future conduct, the imposition of a compliance monitor, or suffer other criminal or civil penalties or adverse impacts, including being subject to lawsuits brought by private litigants, each of which could have a material adverse effect on our business, financial condition, results of operations and cash flows.
Our failure to satisfy international trade compliance regulations may adversely affect us.
Our global operations require importing and exporting goods and technology across international borders on a regular basis. From time to time, we obtain or receive information alleging improper activity in connection with imports or exports. Our policy mandates strict compliance with U.S. and international trade laws. When we receive information alleging improper activity, our policy is to investigate that information and respond appropriately, including, if warranted, reporting our findings to relevant governmental authorities. Nonetheless, we cannot provide assurance that our policies and procedures will always protect us from actions that would violate U.S. and/or foreign laws. Such improper actions could subject the Company to civil or criminal penalties, including material monetary fines, or other adverse actions including denial of import or export privileges, and could damage our reputation and our business prospects.
We are party to asbestos-related product litigation that could adversely affect our financial condition, results of operations and cash flows.
We and certain of our subsidiaries, including Yarway Corporation (“Yarway”) and Grinnell LLC (“Grinnell”), along with numerous other third parties, are named as defendants in personal injury lawsuits based on alleged exposure to asbestos containing materials. Over 90% of cases pending against affiliates of the Company have been filed against Yarway or Grinnell, and have typically involved product liability claims based primarily on allegations of manufacture, sale or distribution of industrial products that either contained asbestos or were used with asbestos containing components. Claims filed against Yarway derive from Yarway’s purported use of asbestos-containing gaskets and packing in the sale or distribution of steam valves and traps and from its alleged manufacture of asbestos-containing expansion joint packing. Yarway’s alleged manufacture, distribution and/or sale of asbestos-containing materials ceased by 1988, and Yarway ceased substantially all of its manufacturing, distribution and sales operations in 2003. Claims filed against Grinnell typically allege that it manufactured, sold or distributed valves, gaskets, piping and sprinkler systems containing asbestos.
On April 22, 2013, Yarway filed a voluntary petition for relief under Chapter 11 of the U.S. Bankruptcy Code (“Chapter 11”) in the United States Bankruptcy Court for the District of Delaware (“Bankruptcy Court”), and on October 9, 2014, the Company reached an agreement in principle with Yarway and the representatives of current and future Yarway asbestos claimants to fund a section 524(g) trust for the resolution and payment of current and future Yarway asbestos claims. Under the Chapter 11 plan to implement the trust, an asbestos settlement trust (the “Yarway Trust”) that conforms to the provisions of Section 524(g) of the U.S. Bankruptcy Code will be established and, on the effective date of the Chapter 11 plan, the Company and Yarway will contribute to the Yarway Trust a total of $325 million in cash (“Settlement Consideration”). In exchange for the Settlement Consideration, the Company and its affiliates will receive the benefit of a release from Yarway and an injunction under section 524(g) of the Bankruptcy Code permanently enjoining the assertion of Yarway Asbestos Claims against those Parties. The agreement in principle is subject, among other things, to the negotiation and filing of a Chapter 11 plan of reorganization for Yarway incorporating the terms of such agreement (the “Plan”), acceptance of the Plan by at least 75% of
15
Yarway’s current asbestos claimants voting on such Plan, confirmation of the Plan by the Bankruptcy Court and approval of the injunction in favor of the Company and its affiliates by the United States District Court for the District of Delaware (“District Court”). Although the Company has agreed in principle to the terms of the Plan with representatives of current and future Yarway asbestos claimants, there can be no assurance that all of the conditions to implementation of the Plan will be met, or that the final Plan will reflect all of the terms agreed to in principle. If the Plan were not implemented in accordance with the terms agreed in principle, the Company and its affiliates may not receive the benefit of the injunction described above, and the relief ultimately granted by the Bankruptcy Court may not be satisfactory to Yarway, the Company or its affiliates. A failure to obtain satisfactory relief could have a material adverse impact on our business, financial condition, results of operations and cash flows.
During the fourth quarter of fiscal 2014, the Company performed a revised valuation of its non-Yarway asbestos-related liabilities and corresponding insurance assets and recorded a net charge, excluding Yarway, of $240 million. Although the Company’s methodology established a range of estimates of reasonably possible outcomes, the Company recorded its best estimate within such range based upon information known at the time. The Company's estimated gross asbestos liability, excluding Yarway, of $538 million was recorded within the Company's Consolidated Balance Sheet as a liability for pending and future claims and related defense costs, and separately as an asset for insurance recoveries of $245 million. The amounts recorded by the Company for asbestos-related liabilities and insurance-related assets are based on the Company's strategies for resolving its asbestos claims, currently available information, and a number of estimates and assumptions. Key variables and assumptions include the number and type of new claims that are filed each year, the average cost of resolution of claims, the identity of defendants, the resolution of coverage issues with insurance carriers, amount of insurance, and the solvency risk with respect to the Company's insurance carriers. Many of these factors are closely linked, such that a change in one variable or assumption will impact one or more of the others, and no single variable or assumption predominately influences the determination of the Company's asbestos-related liabilities and insurance-related assets. Furthermore, predictions with respect to these variables are subject to greater uncertainty in the later portion of the projection period. Other factors that may affect the Company's liability and cash payments for asbestos-related matters include uncertainties surrounding the litigation process from jurisdiction to jurisdiction and from case to case, reforms of state or federal tort legislation and the applicability of insurance policies among subsidiaries. As a result, actual liabilities or insurance recoveries could be significantly higher or lower than those recorded if assumptions used in the Company's calculations vary significantly from actual results. If actual liabilities are significantly higher than those recorded, the cost of resolving such liabilities claims could have a material adverse effect on our financial position, results of operations or cash flows.
Our operations expose us to the risk of material environmental liabilities, litigation and violations.
We have received notification from the United States Environmental Protection Agency and from other environmental agencies that conditions at several sites where we and others disposed of hazardous substances require cleanup and other possible remedial action and may require that we reimburse the government or otherwise pay for the cost of cleanup of those sites and/or for natural resource damages. We have projects underway at several current and former manufacturing facilities to investigate and remediate environmental contamination resulting from past operations by us or by other businesses that previously owned or used the properties. These projects relate to a variety of activities, including:
|
•
|
solvent, oil, metal and other hazardous substance contamination cleanup; and
|
|
•
|
structure decontamination and demolition, including asbestos abatement.
|
These projects involve both remediation expenses and capital improvements. In addition, we remain responsible for certain environmental issues at manufacturing locations previously sold by us.
Certain environmental laws assess liability on current or previous owners or operators of real property for the cost of removal or remediation of hazardous substances at their properties or at properties at which they have disposed of hazardous substances. In addition to cleanup actions brought by governmental authorities, private parties could bring personal injury or other claims due to the presence of, or exposure to, hazardous substances.
The ultimate cost of cleanup at disposal sites and manufacturing facilities is difficult to predict given uncertainties regarding the extent of the required cleanup, the interpretation of applicable laws and regulations and alternative cleanup methods. Environmental laws are complex, change frequently and have tended to become more stringent over time. While we have budgeted for future capital and operating expenditures to maintain compliance with such laws, we cannot provide assurance that our costs of complying with current or future environmental protection and health and safety laws, or our liabilities arising from past or future releases of, or exposures to, hazardous substances will not exceed our estimates or materially adversely affect our financial condition, results of operations and cash flows. We may also be subject to material liabilities for additional environmental claims for personal injury or cleanup in the future based on our past, present or future business activities or for existing environmental conditions of which we are not presently aware.
16
We depend on third-party licenses for our products and services.
We rely on certain software technology that we license from third parties and use in our products and services to perform key functions and provide critical functionality, particularly in our commercial security business. Because our products and services incorporate software developed and maintained by third parties we are, to a certain extent, dependent upon such third parties' ability to maintain or enhance their current products and services, to ensure that their products are free of defects or security vulnerabilities, to develop new products and services on a timely and cost-effective basis, and to respond to emerging industry standards and other technological changes. Further, these third-party technology licenses may not always be available to us on commercially reasonable terms or at all. If our agreements with third-party vendors are not renewed or the third-party software fails to address the needs of our software products and services, we would be required to find alternative software products and services or technologies of equal performance or functionality. We cannot assure that we would be able to replace the functionality provided by third-party software if we lose the license to this software, it becomes obsolete or incompatible with future versions of our products and services or is otherwise not adequately maintained or updated. Furthermore, even if we obtain licenses to alternative software products or services that provide the functionality we need, we may be required to replace hardware installed at our monitoring centers and at our customers' sites, including security system control panels and peripherals, in order to effect our integration of or migration to alternative software products. Any of these factors could materially and adversely affect our business, financial condition, results of operations and cash flows.
Infringement or expiration of our intellectual property rights, or allegations that we have infringed the intellectual property rights of third parties, could negatively affect us.
We rely on a combination of patents, copyrights, trademarks, trade secrets, know-how, confidentiality provisions and licensing arrangements to establish and protect our proprietary rights. We cannot guarantee, however, that the steps we have taken to protect our intellectual property will be adequate to prevent infringement of our rights or misappropriation of our technology, trade secrets or know-how. For example, effective patent, trademark, copyright and trade secret protection may be unavailable or limited in some of the countries in which we operate. In addition, while we generally enter into confidentiality agreements with our employees and third parties to protect our trade secrets, know-how, business strategy and other proprietary information, such confidentiality agreements could be breached or otherwise may not provide meaningful protection for our trade secrets and know-how related to the design, manufacture or operation of our products. If it became necessary for us to resort to litigation to protect our intellectual property rights, any proceedings could be burdensome and costly, and we may not prevail. Further, adequate remedies may not be available in the event of an unauthorized use or disclosure of our trade secrets and manufacturing expertise. Finally, for those products in our portfolio that rely on patent protection, once a patent has expired, the product is generally open to competition. Products under patent protection usually generate significantly higher revenues than those not protected by patents. If we fail to successfully enforce our intellectual property rights, our competitive position could suffer, which could harm our business, financial condition, results of operations and cash flows.
In addition, we are, from time to time, subject to claims of intellectual property infringement by third parties, including practicing entities and non-practicing entities. Regardless of the merit of such claims, responding to infringement claims can be expensive and time-consuming, and the litigation process is subject to inherent uncertainties, and we may not prevail in litigation matters regardless of the merits of our position. Intellectual property lawsuits or claims may become extremely disruptive if the plaintiffs succeed in blocking the trade of our products and services and they may have a material adverse effect on our business, financial condition, results of operations and cash flows.
Police departments could refuse to respond to calls from monitored security service companies.
Police departments in a limited number of jurisdictions do not respond to calls from monitored security service companies, either as a matter of policy or by local ordinance. We have offered affected customers the option of receiving responses from private guard companies, in most cases through contracts with us, which increases the overall cost to customers. If more police departments, whether inside or outside the U.S., were to refuse to respond or be prohibited from responding to calls from monitored security service companies, our ability to attract and retain customers could be negatively impacted and our results of operations and cash flow could be adversely affected.
The Company may be subject to risks arising from regulations applicable to companies doing business with the United States government.
The Company’s customers include many Federal, state and local government authorities. Doing business with the United States government and state and local authorities subjects the Company to unusual risks, including dependence on the level of government spending and compliance with and changes in governmental procurement and security regulations. Agreements relating to the sale of products to government entities may be subject to termination, reduction or modification, either at the convenience of the government or for the Company's failure to perform under the applicable contract. The Company is subject to government investigations of business practices and compliance with government procurement and security regulations. If
17
the Company were charged with wrongdoing as a result of any such investigation, it could be suspended from bidding on or receiving awards of new government contracts, which could have a material adverse effect on the Company's results of operations.
Risks Related to Our Liquidity and Financial Markets
Disruptions in the financial markets could have adverse effects on us, our customers and our suppliers, by increasing our funding costs or reducing the availability of credit.
In the normal course of our business, we may access credit markets for general corporate purposes, which may include repayment of indebtedness, acquisitions, additions to working capital, repurchase of common shares, capital expenditures and investments in our subsidiaries. Although we believe we have sufficient liquidity to meet our foreseeable needs, our access to and the cost of capital could be negatively impacted by disruptions in the credit markets. In 2009 and 2010, credit markets experienced significant dislocations and liquidity disruptions, and similar disruptions in the credit markets could make financing terms for borrowers unattractive or unavailable. These factors may make it more difficult or expensive for us to access credit markets if the need arises. In addition, these factors may make it more difficult for our suppliers to meet demand for their products or for prospective customers to commence new projects, as customers and suppliers may experience increased costs of debt financing or difficulties in obtaining debt financing. Disruptions in the financial markets have had adverse effects on other areas of the economy and have led to a slowdown in general economic activity that may continue to adversely affect our businesses. These disruptions may have other unknown adverse effects. Based on these conditions, our profitability and our ability to execute our business strategy may be adversely affected.
Covenants in our debt instruments may adversely affect us.
Our bank credit agreements contain customary financial covenants, including a limit on the ratio of debt to earnings before interest, taxes, depreciation, and amortization and limits on incurrence of liens and subsidiary debt. In addition, the indentures governing our bonds contain customary covenants including limits on negative pledges, subsidiary debt and sale-leaseback transactions.
Although we believe none of these covenants are restrictive to our operations, our ability to meet the financial covenants can be affected by events beyond our control, and we cannot provide assurance that we will meet those tests. A breach of any of these covenants could result in a default under our credit agreements or indentures. Upon the occurrence of an event of default under any of our credit facilities or indentures, the lenders or trustees could elect to declare all amounts outstanding thereunder to be immediately due and payable and, in the case of credit facility lenders, terminate all commitments to extend further credit. If the lenders or trustees accelerate the repayment of borrowings, we cannot provide assurance that we will have sufficient assets to repay our credit facilities and our other indebtedness. Furthermore, acceleration of any obligation under any of our material debt instruments will permit the holders of our other material debt to accelerate their obligations, which could have a material adverse affect on our financial condition.
Material adverse legal judgments, fines, penalties or settlements could adversely affect our financial health and prevent us from fulfilling our obligations under our outstanding indebtedness.
We estimate that our available cash, our cash flow from operations and amounts available to us under our credit facilities will be adequate to fund our operations and service our debt for the foreseeable future. However, material adverse legal judgments, fines, penalties or settlements arising from litigation and similar contingencies could require additional funding. If such developments require us to obtain additional funding, we cannot provide assurance that we will be able to obtain the additional funding that we need on commercially reasonable terms or at all, which could have a material adverse effect on our financial condition, results of operations or cash flows.
Such an outcome could have important consequences to you. For example, it could:
|
•
|
require us to dedicate a substantial portion of our cash flow from operations to payments on our indebtedness, thereby reducing the availability of our cash flow to fund working capital, capital expenditures, research and development efforts and other corporate purposes, including dividend payments;
|
|
•
|
increase our vulnerability to adverse economic and industry conditions;
|
|
•
|
limit our flexibility in planning for, or reacting to, changes in our businesses and the industries in which we operate;
|
|
•
|
restrict our ability to introduce new technologies or exploit business opportunities;
|
|
•
|
make it more difficult for us to satisfy our payment obligations with respect to our outstanding indebtedness; and
|
|
•
|
increase the difficulty and/or cost to us of refinancing our indebtedness.
|
18
We may increase our debt or raise additional capital in the future, which could affect our financial health, and may decrease our profitability.
We may increase our debt or raise additional capital in the future, subject to restrictions in our debt agreements. If our cash flow from operations is less than we anticipate, or if our cash requirements are more than we expect, we may require more financing. However, debt or equity financing may not be available to us on terms acceptable to us, if at all. If we incur additional debt or raise equity through the issuance of additional capital stock, the terms of the debt or capital stock issued may give the holders rights, preferences and privileges senior to those of holders of our common stock, particularly in the event of liquidation. The terms of the debt may also impose additional and more stringent restrictions on our operations than we currently have. If we raise funds through the issuance of additional equity, your percentage ownership in us would decline. If we are unable to raise additional capital when needed, it could affect our financial health, which could negatively affect your investment in us.
Risks Relating to Tax Matters
Examinations and audits by tax authorities, including the IRS, could result in additional tax payments for prior periods.
Tyco’s and its subsidiaries' income tax returns periodically are examined by various tax authorities. In connection with these examinations, tax authorities, including the IRS, have raised issues and proposed tax adjustments, in particular, with respect to tax years preceding the 2007 Separation. We previously disclosed that in connection with U.S. federal tax audits, the IRS has raised a number of issues and proposed tax adjustments for periods beginning with the 1997 tax year. In particular, we have been unable to resolve with the IRS matters related to the treatment of certain intercompany debt transactions in existence prior to the 2007 Separation. As a result, on June 20, 2013, we received Notices of Deficiency from the IRS asserting that several of our former U.S. subsidiaries owe additional taxes of $883.3 million plus penalties of $154 million based on audits of the 1997 through 2000 tax years of Tyco and its subsidiaries as they existed at that time. In addition, we received Final Partnership Administrative Adjustments for certain U.S. partnerships owned by former U.S. subsidiaries with respect to which an additional tax deficiency of approximately $30 million is expected to be asserted. These amounts exclude interest and do not reflect the impact on subsequent periods if the IRS position described below is ultimately proved correct. In addition, the adjustments proposed by the IRS are subject to the sharing provisions of a tax sharing agreement entered in 2007 with Covidien and TE Connectivity (the "2007 Tax Sharing Agreement") under which Tyco, Covidien and TE Connectivity share 27%, 42% and 31%, respectively, of shared income tax liabilities that arise from adjustments made by tax authorities to Tyco's, Covidien's and TE Connectivity's U.S. and certain non-U.S. income tax returns.
The IRS asserted in the Notices of Deficiency that substantially all of Tyco’s intercompany debt originated during the 1997 - 2000 period should not be treated as debt for U.S. federal income tax purposes, and disallowed interest and related deductions recognized on U.S. income tax returns totaling approximately $2.9 billion. We strongly disagree with the IRS position and have filed petitions with the U.S. Tax Court contesting the IRS proposed adjustments. A trial date has been set for February 2016. We believe that we have meritorious defenses for our tax filings, that the IRS positions with regard to these matters is inconsistent with the applicable tax laws and existing Treasury regulations, and that the previously reported taxes for the years in question are appropriate. Furthermore, we believe that Tyco’s income tax reserves and the liabilities recorded in the Consolidated Balance Sheet for the tax sharing arrangements are appropriate. However, the ultimate resolution of these matters, and the impact of that resolution, are uncertain and could have a materially adverse impact on our financial condition, results of operations and cash flows. In particular, if the IRS is successful in asserting its claim, it would have an adverse impact on interest deductions related to the same intercompany debt in subsequent time periods, totaling approximately $6.6 billion, which is expected to be disallowed by the IRS.
We share responsibility for certain of our, Covidien's and TE Connectivity's income tax liabilities for tax periods prior to and including June 29, 2007.
In connection with the 2007 Separation, Tyco entered into the 2007 Tax Sharing Agreement, which governs the rights and obligations of each party with respect to certain pre-2007 Separation tax liabilities and certain tax liabilities arising in connection with the 2007 Separation. As noted above, Tyco, Covidien and TE Connectivity share 27%, 42% and 31%, respectively, of income tax liabilities that arise from adjustments made by tax authorities to Tyco's, Covidien's and TE Connectivity's U.S. and certain non-U.S. income tax returns and certain taxes attributable to internal transactions undertaken in anticipation of the 2007 Separation. In the event the 2007 Separation, or certain related transactions, is determined to be taxable as a result of actions taken after the 2007 Separation by Tyco, Covidien, or TE Connectivity, the party responsible for such failure would be responsible for all taxes imposed on Tyco, Covidien, or TE Connectivity as a result thereof. If none of the companies is responsible for such failure, then Tyco, Covidien, and TE Connectivity would be responsible for such taxes in the
19
same manner and in the same proportions as other shared tax liabilities under the 2007 Tax Sharing Agreement. Costs and expenses associated with the management of these shared tax liabilities are generally shared equally among the parties.
If any party to the 2007 Tax Sharing Agreement were to default in its obligation to another party to pay its share of the distribution taxes that arise as a result of no party's fault, each non-defaulting party would be required to pay, equally with any other non-defaulting party, the amounts in default. In addition, if another party to the 2007 Tax Sharing Agreement that is responsible for all or a portion of an income tax liability were to default in its payment of such liability to a taxing authority, we could be legally liable under applicable tax law for such liabilities and required to make additional tax payments. Accordingly, under certain circumstances, we may be obligated to pay amounts in excess of our agreed-upon share of our, Covidien's and TE Connectivity's tax liabilities.
We share responsibility for certain of our, Pentair's and ADT's income tax liabilities for tax periods prior to and including the Distribution date.
In connection with the Distributions, we entered into the 2012 Tax Sharing Agreement with Pentair and ADT that is separate from the 2007 Tax Sharing Agreement and which governs the rights and obligations of Tyco, ADT and Pentair for certain tax liabilities before the Distributions, including Tyco's obligations under the 2007 Tax Sharing Agreement. Under the 2012 Tax Sharing Agreement Tyco, Pentair and ADT share (i) certain pre-Distribution income tax liabilities that arise from adjustments made by tax authorities to ADT's U.S., Tyco Flow Control's and Tyco's income tax returns, and (ii) payments required to be made by Tyco with respect to the 2007 Tax Sharing Agreement, excluding approximately $175 million of pre-2012 Separation related tax liabilities that were anticipated to be paid prior to the 2012 Separation (collectively, "Shared Tax Liabilities"). Tyco will be responsible for the first $500 million of Shared Tax Liabilities. Pentair and ADT will share 42% and 58%, respectively, of the next $225 million of Shared Tax Liabilities. Tyco, Pentair and ADT will share 52.5% 20% and 27.5%, respectively, of Shared Tax Liabilities above $725 million. All costs and expenses associated with the management of these shared tax liabilities will generally be shared 20%, 27.5%, and 52.5% by Pentair, ADT and Tyco, respectively. As of September 28, 2012, Tyco established liabilities representing the fair market value of its obligations under the 2012 Tax Sharing Arrangement which is recorded in Other liabilities in the Company's Consolidated Balance Sheet with an offset to Tyco shareholders' equity. In addition, we entered into a non-income tax sharing agreement with ADT in connection with the ADT Distribution. To the extent we are responsible for any liability under these agreements, there could be a material adverse impact on our financial position, results of operations, cash flows or our effective tax rate in future reporting periods.
The 2012 Tax Sharing Agreement provides that, if any party were to default in its obligation to another party to pay its share of certain taxes that may arise as a result of the failure of the Distributions to be tax free (such taxes, as defined in the 2012 Tax Sharing Agreement, "Distribution Taxes"), each non-defaulting party would be required to pay, equally with any other non-defaulting party, the amounts in default. In addition, if another party to the 2012 Tax Sharing Agreement that is responsible for all or a portion of an income tax liability were to default in its payment of such liability to a taxing authority, we could be legally liable under applicable tax law for such liabilities and required to make additional tax payments. Accordingly, under certain circumstances, we may be obligated to pay amounts in excess of our agreed-upon share of our, Pentair's and ADT's tax liabilities.
If the Distributions or certain internal transactions undertaken in anticipation of the Distributions are determined to be taxable for U.S. federal income tax purposes, we, our shareholders that are subject to U.S. federal income tax and/or both ADT and Pentair could incur significant U.S. federal income tax liabilities.
Tyco has received a private letter ruling from the IRS regarding the U.S. federal income tax consequences of the Distributions to the effect that, for U.S. federal income tax purposes, the Distributions will qualify as tax-free under Sections 355 and/or 361 of the Code, except for cash received in lieu of a fractional share of ADT common stock or of Pentair common shares. The private letter ruling also provides that certain internal transactions undertaken in anticipation of the Distributions will qualify for favorable treatment under the Code. In addition to obtaining the private letter ruling, Tyco has received an opinion from the law firm of McDermott Will & Emery LLP confirming the tax-free status of the Distributions for U.S. federal income tax purposes. The private letter ruling and the opinion rely on certain facts and assumptions, and certain representations and undertakings, from us, Pentair and ADT regarding the past and future conduct of our respective businesses and other matters.
Notwithstanding the private letter ruling and the opinion, the IRS could determine on audit that the Distributions or the internal transactions should be treated as taxable transactions if it determines that any of these facts, assumptions, representations or undertakings is not correct or has been violated, or that the Distributions or the internal transactions should be taxable for other reasons, including as a result of significant changes in stock ownership (which might take into account changes in Pentair stock ownership resulting from the Merger) or asset ownership after the Distributions. An opinion of counsel represents counsel's best legal judgment, is not binding on the IRS or the courts, and the IRS or the courts may not agree with the opinion. In addition, the opinions will be based on current law, and cannot be relied upon if current law changes with
20
retroactive effect. If the Distributions ultimately are determined to be taxable, the Distributions could be treated as a taxable dividend or capital gain to you for U.S. federal income tax purposes, and you could incur significant U.S. federal income tax liabilities. In addition, we would recognize gain in an amount equal to the excess of the fair market value of the Pentair common shares and the shares of ADT common stock distributed to our shareholders on the distribution date over our tax basis in such common shares, but such gain, if recognized, generally would not be subject to U.S. federal income tax. However, we, Pentair or ADT could incur significant U.S. federal income tax liabilities if it is ultimately determined that certain internal transactions undertaken in anticipation of the Distributions are taxable.
In addition, under the terms of the 2012 Tax Sharing Agreement, in the event the Distributions or the internal transactions were determined to be taxable as a result of actions taken after the Distributions by us, Pentair or ADT, the party responsible for such failure would be responsible for all taxes imposed on us, Pentair or ADT as a result thereof. If such failure is not the result of actions taken after the Distributions by us, Pentair or ADT, then we, Pentair and ADT will share the liability in the manner and according to the sharing percentages set forth in the 2012 Tax Sharing Agreement. Such tax amounts could be significant. In the event that any party to the 2012 Tax Sharing Agreement defaults in its obligation to pay Distribution Taxes to another party that arise as a result of no party's fault, each non-defaulting party would be responsible for an equal amount of the defaulting party's obligation to make a payment to another party in respect of such other party's taxes.
We might not be able to engage in desirable strategic transactions and equity issuances as a result of the Distributions because of restrictions relating to U.S. federal income tax requirements for tax-free distributions.
Our ability to engage in significant equity transactions could be limited or restricted as a result of the Distributions in order to preserve, for U.S. federal income tax purposes, the tax-free nature of the Distributions. Even if the Distributions otherwise qualify for tax-free treatment under Section 355 of the Code, it may result in corporate-level gain to Tyco and certain of its affiliates under Section 355(e) of the Code if 50% or more, by vote or value, of our shares, Pentair's shares or ADT's shares are acquired or issued as part of a plan or series of related transactions that includes the Distributions. Any acquisitions or issuances of our shares, Pentair's shares or ADT's shares within two years after the Distributions generally will be presumed to be part of such a plan, although we, Pentair or ADT may be able to rebut that presumption.
To preserve the tax-free treatment to us of the Distributions, under the 2012 Tax Sharing Agreement that we entered with Pentair and ADT, we are prohibited from taking or failing to take any action that prevents the Distributions and related transactions from being tax-free. These restrictions may limit our ability to pursue strategic transactions or engage in new business or other transactions that may maximize the value of our business. Moreover, the 2012 Tax Sharing Agreement also provides that we will be responsible for any taxes imposed on Pentair or any of its affiliates or on ADT or any of its affiliates as a result of the failure of the Distributions or the internal transactions to qualify for favorable treatment under the Code if such failure is attributable to certain actions taken after the Distributions by or in respect of us, any of our affiliates or our shareholders.
Risks Relating to Our Jurisdiction of Incorporation
The anticipated benefits of our change in jurisdiction of incorporation may not be realized.
At a special general meeting held on September 9, 2014, our shareholders approved a merger agreement, dated May 30, 2014, between Tyco International Ltd. and Tyco Ireland, as described in more detail in the proxy statement / prospectus mailed to shareholders on August 1, 2014 related to the merger. We expect this merger to close in November 2014. We may not realize the benefits we anticipate from the merger, and our failure to realize those benefits could have an adverse effect on our business, results of operations or financial condition.
Legislative action in the United States could materially and adversely affect us.
Tax-Related Legislation
Legislative action may be taken by the U.S. Congress which, if ultimately enacted, could limit the availability of tax benefits or deductions that we currently claim, override tax treaties upon which we rely, or otherwise affect the taxes that the United States imposes on our worldwide operations. Such changes could have a material adverse effect on our effective tax rate and/or require us to take further action, at potentially significant expense, to seek to preserve our effective tax rate. In addition, if proposals were enacted that had the effect of disregarding or limiting our ability, currently as a Swiss company and in the near future as an Irish company, to take advantage of tax treaties with the United States, we could incur additional tax expense and/or otherwise incur business detriment.
21
Legislation Relating to Governmental Contracts
Various U.S. federal and state legislative proposals that would deny governmental contracts to U.S. companies that move their corporate location abroad may affect us. We are unable to predict the likelihood that, or final form in which, any such proposed legislation might become law, the nature of regulations that may be promulgated under any future legislative enactments, or the effect such enactments and increased regulatory scrutiny may have on our business.
Your rights as a shareholder will change as a result of the Merger.
The completion of the merger between the Company and Tyco Ireland will change the governing law that applies to our shareholders from Swiss law (which applies to the Company and its common shares) to Irish law (which applies to Tyco Ireland and its ordinary shares). Many of the principal attributes of Tyco International Ltd. common shares and Tyco Ireland ordinary shares will be materially similar. However, when the merger is completed, your future rights as a shareholder under Irish corporate law will differ from your current rights as a shareholder under Swiss corporate law. In addition, Tyco Ireland’s proposed articles of association will differ from Tyco International Ltd.’s articles of association and organizational regulations. See “Comparison of Rights of Shareholders” in the proxy statement / prospectus related to the merger for more details.
Irish law differs from the laws in effect in the United States and may afford less protection to holders of our securities.
It may not be possible to enforce court judgments obtained in the United States against us in Ireland based on the civil liability provisions of the U.S. federal or state securities laws. In addition, there is some uncertainty as to whether the courts of Ireland would recognize or enforce judgments of U.S. courts obtained against us or our directors or officers based on the civil liabilities provisions of the U.S. federal or state securities laws or hear actions against us or those persons based on those laws. We have been advised that the United States currently does not have a treaty with Ireland providing for the reciprocal recognition and enforcement of judgments in civil and commercial matters. Therefore, a final judgment for the payment of money rendered by any U.S. federal or state court based on civil liability, whether or not based solely on U.S. federal or state securities laws, would not automatically be enforceable in Ireland.
As an Irish company, Tyco Ireland will be governed by the Irish Companies Acts, which differ in some material respects from laws generally applicable to U.S. corporations and shareholders, including, among others, differences relating to interested director and officer transactions and shareholder lawsuits. Likewise, the duties of directors and officers of an Irish company generally are owed to the company only. Shareholders of Irish companies generally do not have a personal right of action against directors or officers of the company and may exercise such rights of action on behalf of the company only in limited circumstances. Accordingly, holders of Tyco International plc securities may have more difficulty protecting their interests than would holders of securities of a corporation incorporated in a jurisdiction of the United States.
Our effective tax rate may increase.
Although we expect that the merger between Tyco International Ltd. and Tyco Ireland will not have a material effect on our worldwide effective tax rate, there is uncertainty regarding the tax policies of the jurisdictions where we operate, including the potential legislative actions described in these risk factors and our effective tax rate may increase. Additionally, the tax laws of Ireland and other jurisdictions could change in the future, and such changes could cause a material increase in our effective tax rate.
Tyco Ireland will seek Irish High Court approval of the creation of distributable reserves. Tyco Ireland expects this will be forthcoming but cannot guarantee this.
Under Irish law, dividends may only be paid (and share repurchases and redemptions must generally be funded) out of “distributable reserves,” which Tyco Ireland will not have immediately following the closing of the merger between Tyco International Ltd. and Tyco Ireland. The creation of distributable reserves of Tyco Ireland by way of a capital reduction of Tyco Ireland requires the approval of the Irish High Court. The approval of the Irish High Court is expected within approximately six to twelve weeks following the closing of the merger between Tyco International Ltd. and Tyco Ireland. We are not aware of any reason why the Irish High Court would not approve the creation of distributable reserves. However, the issuance of the required order is a matter for the discretion of the Irish High Court. Approval of the creation of distributable reserves by the Irish High Court may also take substantially longer than we anticipate. In the event that distributable reserves of Tyco Ireland are not created, no distributions by way of dividends, share repurchases or otherwise will be permitted under Irish law until such time as the group has created sufficient distributable reserves from its trading activities.
Transfers of Tyco Ireland ordinary shares may be subject to Irish stamp duty.
For the majority of transfers of Tyco Ireland ordinary shares, there will not be any Irish stamp duty. However, Irish stamp duty will become payable in respect of certain share transfers occurring after completion of the merger between Tyco International Ltd. and Tyco Ireland. A transfer of Tyco Ireland ordinary shares from a seller who holds shares beneficially (i.e.
22
through DTC) to a buyer who holds the acquired shares beneficially will not be subject to Irish stamp duty (unless the transfer involves a change in the nominee that is the record holder of the transferred shares). A transfer of Tyco Ireland ordinary shares by a seller who holds shares directly (i.e. not through DTC) to any buyer, or by a seller who holds the shares beneficially to a buyer who holds the acquired shares directly, may be subject to Irish stamp duty (currently at the rate of 1% of the price paid or the market value of the shares acquired, if higher) payable by the buyer. A shareholder who directly holds shares may transfer those shares into his or her own broker account to be held through DTC without giving rise to Irish stamp duty provided that the shareholder has confirmed to Tyco Ireland’s transfer agent that there is no change in the ultimate beneficial ownership of the shares as a result of the transfer and, at the time of the transfer, there is no agreement in place for a sale of the shares.
Because of the potential Irish stamp duty on transfers of Tyco Ireland ordinary shares, we strongly recommend that all directly registered Tyco International Ltd. shareholders open broker accounts so they can transfer their shares into a broker account as soon as possible, and in any event prior to completion of the merger with Tyco Ireland. We also strongly recommend that any person who wishes to acquire Tyco Ireland ordinary shares after completion of the merger acquire such shares as a beneficial holder.
We currently intend to pay, or cause one of our affiliates to pay, stamp duty in connection with share transfers made in the ordinary course of trading by a seller who holds shares directly to a buyer who holds the acquired shares beneficially. In other cases Tyco Ireland may, in its absolute discretion, pay or cause one of its affiliates to pay any stamp duty. Tyco Ireland’s Memorandum and Articles of Association as they will be in effect after the merger provide that, in the event of any such payment, Tyco Ireland (i) may seek reimbursement from the buyer, (ii) may have a lien against the Tyco Ireland ordinary shares acquired by such buyer and any dividends paid on such shares and (iii) may set-off the amount of the stamp duty against future dividends on such shares. Parties to a share transfer may assume that any stamp duty arising in respect of a transaction in Tyco Ireland ordinary shares has been paid unless one or both of such parties is otherwise notified by Tyco Ireland.
Dividends you receive may be subject to Irish dividend withholding tax.
In certain circumstances, as an Irish tax resident company, we may be required to deduct Irish dividend withholding tax (currently at the rate of 20%) from dividends paid to our shareholders. Whether Tyco Ireland will be required to deduct Irish dividend withholding tax from dividends paid to a shareholder will depend largely on whether that shareholder is resident for tax purposes in a “relevant territory.” A list of the “relevant territories” is included as Annex C to the proxy statement/prospectus related to the merger between Tyco International Ltd. and Tyco Ireland.
Dividends received by you could be subject to Irish income tax.
Dividends paid in respect of Tyco Ireland’s ordinary shares generally will not be subject to Irish income tax where the beneficial owner of these dividends is exempt from dividend withholding tax, unless the beneficial owner of the dividend has some connection with Ireland other than his or her shareholding in Tyco Ireland.
Tyco Ireland shareholders who receive their dividends subject to Irish dividend withholding tax generally will have no further liability to Irish income tax on the dividend unless the beneficial owner of the dividend has some connection with Ireland other than his or her shareholding in Tyco.
If Tyco Ireland ordinary shares are not eligible for deposit and clearing within the facilities of DTC, then transactions in Tyco Ireland’s securities may be disrupted.
The facilities of DTC are a widely-used mechanism that allow for rapid electronic transfers of securities between the participants in the DTC system, which include many large banks and brokerage firms. Upon the completion of the merger between Tyco International Ltd. and Tyco Ireland, Tyco Ireland ordinary shares will be eligible for deposit and clearing within the DTC system. Tyco Ireland has entered into arrangements with DTC whereby Tyco Ireland will agree to indemnify DTC for any stamp duty that may be assessed upon it as a result of its service as a depository and clearing agency for Tyco Ireland’s ordinary shares.
DTC is not obligated to accept Tyco Ireland ordinary shares for deposit and clearing within its facilities at the closing and, even if DTC does initially accept Tyco Ireland ordinary shares, it will generally have discretion to cease to act as a depository and clearing agency for Tyco Ireland ordinary shares. If DTC determines at any time after the completion of the merger that Tyco Ireland ordinary shares are not eligible for continued deposit and clearance within its facilities, then we believe Tyco Ireland ordinary shares would not be eligible for continued listing on a U.S. securities exchange or inclusion in the Standard & Poor’s 500 Index and trading in Tyco Ireland ordinary shares would be disrupted. While Tyco Ireland would pursue alternative arrangements to preserve its listing and maintain trading, any such disruption could have a material adverse effect on the trading price of the Tyco Ireland ordinary shares.
23
None.
Our locations include research and development facilities, manufacturing facilities, warehouse and distribution centers, sales and service offices and corporate offices. Additionally, our locations include approximately 30 monitoring call centers located around the world. All of our monitoring facilities operate 24 hours a day on a year-round basis. Incoming alarm signals are routed via an internal communications network to the next available operator. Operators are quickly updated with information including the name and location of the customer and site, and the nature of the alarm signal. Depending upon the type of service specified by the customer contract, operators respond to emergency-related alarms by calling the customer by telephone (for verification purposes) and relaying information to local fire or police departments, as necessary. Additional action may be taken by the operators as needed, depending on the specific situation.
We operate from approximately
900
locations in about
50
countries. These properties total approximately
14
million square feet, of which
10
million square feet are leased and
4
million square feet are owned.
NA Installation & Services operates through a network of offices, warehouse and distribution centers, and service and manufacturing facilities located in North America. The group occupies approximately
5
million square feet, of which
4
million square feet are leased and
1
million square feet are owned.
ROW Installation & Services operates through a network of offices, warehouse and distribution centers, and service and manufacturing facilities located in Central America, South America, Europe, the Middle East, Africa and the Asia-Pacific region. The group occupies approximately
4
million square feet, of which
3
million square feet are leased and
1
million square feet are owned.
Global Products has manufacturing facilities, network of offices, and warehouses and distribution centers throughout North America, Central America, South America, Europe, the Middle East, Africa and the Asia-Pacific region. The group occupies approximately
5
million square feet, of which
3
million square feet are leased and
2
million square feet are owned.
In the opinion of management, our properties and equipment are in good operating condition and are adequate for our present needs. We do not anticipate difficulty in renewing existing leases as they expire or in finding alternative facilities. See Item 7. Management's Discussion and Analysis of Financial Condition and Results of Operations and Note 13 to the Consolidated Financial Statements for a description of our operating lease obligations.
Legacy Matters Related to Former Management
The Company has been a party to several lawsuits involving disputes with former management, including its former chief executive officer, Mr. L. Dennis Kozlowski, and its former chief financial officer, Mr. Mark Swartz. The Company filed civil complaints against Mr. Kozlowski and Mr. Swartz for breach of fiduciary duty and other wrongful conduct relating to alleged abuses of the Company's Key Employee Loan Program and relocation program, unauthorized bonuses, unauthorized payments, self-dealing transactions and other improper conduct. In connection with Tyco's affirmative actions against Mr. Kozlowski and Mr. Swartz, Mr. Kozlowski, through counterclaims, and Mr. Swartz, through a separate lawsuit, sought an aggregate of approximately
$140 million
allegedly due in connection with their compensation and retention arrangements and under the Employee Retirement Income Security Act ("ERISA").
With respect to Mr. Kozlowski, in the first quarter of fiscal 2014, the parties signed an agreement resolving all outstanding disputes with Mr. Kozlowski, and with Mr. Kozlowski agreeing to release the Company from any claims to monetary amounts related to compensation, retention or other arrangements, including the Key Employee Loan Program, that were alleged to have existed between him and the Company. As a result, in the first quarter of fiscal 2014, the Company reversed the net liability of approximately
$92 million
, which was recorded in Selling, general and administrative expenses in the Consolidated Statement of Operations for the amounts allegedly due to him. Additionally, the Company will be entitled to a portion of the proceeds, if any, from the future sale of certain assets owned by Mr. Kozlowski, the timing and amount of which is uncertain at this time. During the quarter ended June 27, 2014, the Company received a $4 million recovery from the sale of property owned by Mr. Kozlowski, which was recognized as a reduction to Selling, general and administrative expenses.
With respect to Mr. Swartz, during the second quarter of fiscal 2012, the Company reversed a $50 million liability related to Mr. Swartz's pay and benefits due to the expiration of the statute of limitations and in July 2013, the parties reached an agreement in principle to resolve the matter, with Mr. Swartz agreeing to release the Company from any claims to monetary
24
amounts related to compensation, retention or other arrangements alleged to have existed between him and the Company. In November 2014, the parties executed a definitive settlement agreement and the Company received approximately $12 million in cash from Mr. Swartz, a portion of which will be shared with the members of the class action settlement.
Environmental Matters
Tyco is involved in various stages of investigation and cleanup related to environmental remediation matters at a number of sites. The ultimate cost of site cleanup is difficult to predict given the uncertainties regarding the extent of the required cleanup, the interpretation of applicable laws and regulations and alternative cleanup methods. As of
September 26, 2014
, Tyco concluded that it was probable that it would incur remedial costs in the range of approximately
$38 million
to
$79 million
. As of
September 26, 2014
, Tyco concluded that the best estimate within this range is approximately
$42 million
, of which
$23 million
is included in Accrued and other current liabilities and Accounts payable and
$19 million
is included in Other liabilities in the Company's Consolidated Balance Sheet.
The majority of the liabilities described above relate to ongoing remediation efforts at a facility in the Company's Global Products segment located in Marinette, Wisconsin, which the Company acquired in 1990 in connection with its acquisition of, among other things, the Ansul product line. Prior to Tyco's acquisition, Ansul manufactured arsenic-based agricultural herbicides at the Marinette facility, which resulted in significant arsenic contamination of soil and groundwater on the Marinette site and in parts of the adjoining Menominee River. Ansul has been engaged in ongoing remediation efforts at the Marinette site since 1990, and in February 2009 entered into an Administrative Consent Order (the "Consent Order") with the U.S. Environmental Protection Agency to address the presence of arsenic at the Marinette site. Under this agreement, Ansul's principal obligations are to contain the arsenic contamination on the site, pump and treat on-site groundwater, dredge, treat and properly dispose of contaminated sediments in the adjoining river areas, and monitor contamination levels on an ongoing basis. Activities completed under the Consent Order since 2009 include the installation of a subsurface barrier wall around the facility to contain contaminated groundwater, the installation of a groundwater extraction and treatment system and the dredging and offsite disposal of treated river sediment. As of
September 26, 2014
, the Company concluded that its remaining remediation and monitoring costs related to the Marinette facility were in the range of approximately
$27 million
to
$54 million
. The Company's best estimate within that range is approximately
$30 million
, of which
$18 million
is included in Accrued and other current liabilities and
$12 million
is included in Other liabilities in the Company's Consolidated Balance Sheet. During the years ended September 26, 2014, September 27, 2013, and September 28, 2012, the Company recorded nil, $100 million, and $17 million of charges, respectively, in Selling, general and administrative expenses in the Consolidated Statement of Operations. Although the Company has recorded its best estimate of the costs that it will incur to remediate and monitor the arsenic contamination at the Marinette facility, it is possible that technological, regulatory or enforcement developments, the results of environmental studies or other factors could change the Company's expectations with respect to future charges and cash outlays, and such changes could be material to the Company's future results of operations, financial condition or cash flows.
Asbestos Matters
The Company and certain of its subsidiaries, including Yarway Corporation (“Yarway”) and Grinnell LLC (“Grinnell”), along with numerous other third parties, are named as defendants in personal injury lawsuits based on alleged exposure to asbestos containing materials. Over 90% of cases pending against affiliates of the Company have been filed against Yarway or Grinnell, and have typically involved product liability claims based primarily on allegations of manufacture, sale or distribution of industrial products that either contained asbestos or were used with asbestos containing components. Claims filed against Yarway derive from Yarway’s purported use of asbestos-containing gaskets and packing in the sale or distribution of steam valves and traps and from its alleged manufacture of asbestos-containing expansion joint packing. Yarway’s alleged manufacture, distribution and/or sale of asbestos-containing materials ceased by 1988, and Yarway ceased substantially all of its manufacturing, distribution and sales operations in 2003. Claims filed against Grinnell typically allege that it manufactured, sold or distributed valves, gaskets, piping and sprinkler systems containing asbestos.
As of September 26, 2014, the Company has determined that there were approximately 5,600 claims pending against it, which includes approximately 3,200 claims pending against Yarway. This amount reflects the Company's current estimate of the number of viable claims made against it and includes adjustments for claims that are not actively being prosecuted, identify incorrect defendants, are duplicative of other actions or for which the Company is indemnified by third parties. Additionally, as a result of the Yarway bankruptcy filing described below, claims against Yarway have been stayed since April 2013.
25
The following table summarizes the activity in the asset and liability accounts related to these asbestos matters for the year ended September 26, 2014 ($ in millions):
|
As of September 27, 2013
|
(Charge)/Benefit
|
Payments/(Receipts)
|
As of September 26, 2014
|
|||||||||||||
|
Yarway:
|
||||||||||||||||
|
Insurance assets
|
$
|
—
|
|
$
|
—
|
|
$
|
—
|
|
$
|
—
|
|
||||
|
Gross asbestos liabilities
|
(90
|
)
|
(225
|
)
|
—
|
|
(315
|
)
|
||||||||
|
Net liability position
|
$
|
(90
|
)
|
$
|
(225
|
)
|
$
|
—
|
|
$
|
(315
|
)
|
||||
|
Other Claims:
|
||||||||||||||||
|
Insurance assets
|
$
|
152
|
|
$
|
93
|
|
$
|
—
|
|
$
|
245
|
|
||||
|
Gross asbestos liabilities
|
(231
|
)
|
(325
|
)
|
18
|
|
(538
|
)
|
||||||||
|
Net liability position
|
$
|
(79
|
)
|
$
|
(232
|
)
|
$
|
18
|
|
$
|
(293
|
)
|
||||
|
Total Tyco:
|
||||||||||||||||
|
Insurance assets
|
$
|
152
|
|
$
|
93
|
|
$
|
—
|
|
$
|
245
|
|
||||
|
Gross asbestos liabilities
|
(321
|
)
|
(550
|
)
|
18
|
|
(853
|
)
|
||||||||
|
Total net liability position
|
$
|
(169
|
)
|
$
|
(457
|
)
|
$
|
18
|
|
$
|
(608
|
)
|
||||
Yarway
As previously disclosed, on April 22, 2013, Yarway filed a voluntary petition for relief under Chapter 11 of the U.S. Bankruptcy Code (“Chapter 11”) in the United States Bankruptcy Court for the District of Delaware (“Bankruptcy Court”). As a result of this filing, the continuation or commencement of asbestos-related litigation against Yarway has been enjoined by the automatic stay imposed by the U.S. Bankruptcy Code. Yarway's goal has been to negotiate, obtain approval of, and consummate a plan of reorganization that establishes a trust to fairly and equitably value and pay current and future Yarway asbestos claims, and that, in exchange for funding of the trust by the Company and/or its subsidiaries, provides permanent injunctive relief protecting the Company, each of its current and former affiliates and various other parties (the “Company Protected Parties”) from any further asbestos claims based on products manufactured, sold, and/or distributed by Yarway. On October 9, 2014, the Company reached an agreement in principle with Yarway, the Official Committee of Asbestos Claimants (“ACC”) appointed in the Yarway Chapter 11 case as the representative of current Yarway asbestos claimants, and the Future Claimants Representative (“FCR”) appointed in the Yarway Chapter 11 case as the representative of future Yarway asbestos claimants, to fund a section 524(g) trust for the resolution and payment of current and future Yarway asbestos claims. The agreement in principle, which will be implemented through a Chapter 11 plan for Yarway, will resolve the potential liability of the Company Protected Parties for pending and future derivative personal injury claims related to exposure to asbestos-containing products that were allegedly manufactured, distributed, and/or sold by Yarway (“Yarway Asbestos Claims”). Under the Chapter 11 plan, an asbestos settlement trust (the “Yarway Trust”) that conforms to the provisions of Section 524(g) of the U.S. Bankruptcy Code will be established and, on the effective date of the Chapter 11 plan, the Company and Yarway will contribute to the Yarway Trust a total of $325 million in cash (“Settlement Consideration”), which includes approximately $100 million relating to the settlement of intercompany amounts allegedly due to Yarway. In exchange for the Settlement Consideration, each of the Company Protected Parties will receive the benefit of a release from Yarway and an injunction under section 524(g) of the Bankruptcy Code permanently enjoining the assertion of Yarway Asbestos Claims against those Parties. The agreement in principle is subject, among other things, to the negotiation and filing of a Chapter 11 plan of reorganization for Yarway incorporating the terms of such agreement (the “Plan”), acceptance of the Plan by at least 75% of Yarway’s current asbestos claimants voting on such Plan, confirmation of the Plan by the Bankruptcy Court and approval of the injunction in favor of the Company Protected Parties by the United States District Court for the District of Delaware (“District Court”). On the effective date of the Plan, which is anticipated to occur in the second half of fiscal 2015, the Company and Yarway will pay the Settlement Consideration and Yarway Asbestos Claims against the Company Protected Parties will be permanently enjoined. Yarway is anticipated to become a wholly-owned subsidiary of the Yarway Trust and, accordingly, would no longer be owned by or be part of a consolidated group with the Company. Unless extended by a further agreement, the agreement in principle will expire if the order confirming the Plan and implementing the injunction has not been entered or affirmed by the District Court by April 30, 2015, or if the effective date of the Plan has not occurred by September 15, 2016. As a result of the agreement in principle to settle, the Company has recorded a charge of $225 million in Selling, general and administrative expenses in the Consolidated Statement of Operations during the fourth fiscal quarter of 2014.
26
As a result of filing the voluntary bankruptcy petition during the third quarter of fiscal 2013, the Company recorded an expected loss upon deconsolidation of $10 million related to the Yarway Chapter 11 filing, which continues to represent the Company’s best estimate of its loss.
Other Claims
The Company continuously assesses the sufficiency of its estimated liability for pending and future asbestos claims and defense costs. On a quarterly basis, the Company evaluates actual experience regarding asbestos claims filed, settled and dismissed, amounts paid in settlements, and the recoverability of its insurance assets. If and when data from actual experience demonstrate an unfavorable discernible trend, the Company performs a valuation of its asbestos related liabilities and corresponding insurance assets including a comprehensive review of the underlying assumptions. In addition, the Company evaluates its ability to reasonably estimate claim activity beyond its current look-forward period in order to assess whether such period is appropriate. In addition to claims and litigation experience, the Company considers additional qualitative and quantitative factors such as changes in legislation, the legal environment, the Company’s strategy in managing claims and obtaining insurance, including its defense strategy, and health related trends in the overall population of individuals potentially exposed to asbestos. The Company evaluates all of these factors and determines whether a change in the estimate of its liability for pending and future claims and defense costs or insurance assets is warranted.
During the fourth quarter of fiscal 2014, the Company concluded that an unfavorable trend had developed in actual claim filing activity compared to projected claim filing activity established during the Company’s most recent valuation. Accordingly, the Company, with the assistance of independent actuarial service providers, performed a revised valuation of its asbestos-related liabilities and corresponding insurance assets. As part of the revised valuation, the Company assessed whether a change in its look-forward period was appropriate, taking into consideration its more extensive history and experience with asbestos-related claims and litigation (including its experience with Yarway), and determined that it was now possible to make a reasonable estimate of the actuarially determined ultimate risk of loss for pending and unasserted potential future asbestos-related claims through 2056. In connection with the revised valuation, the Company considered a recent settlement with one of its insurers calling for the establishment of a qualified settlement fund, and the results of a separate independent actuarial consulting firm report conducted in the fourth quarter to assist the Company in obtaining insurance to fully fund all estimable asbestos-related claims (excluding Yarway claims) incurred through 2056.
The independent actuarial service firm calculated a total estimated liability for asbestos-related claims of the Company, which reflects the Company’s best estimate of its ultimate risk of loss to resolve all pending and future claims (excluding Yarway claims) through 2056, which is the Company’s reasonable best estimate of the actuarially determined time period through which asbestos-related claims will be filed against Company affiliates.
In conjunction with determining the total estimated liability, the Company retained an independent third party to assist it in valuing its insurance assets responsive to asbestos-related claims, excluding Yarway claims. These insurance assets represent amounts due to the Company for previously settled claims and the probable reimbursements relating to its total liability for pending and unasserted potential future asbestos claims and defense costs. In calculating this amount, the Company used the estimated asbestos liability for pending and projected future claims and defense costs described above, and it also considered the amount of insurance available, the solvency risk with respect to the Company's insurance carriers, resolution of insurance coverage issues, gaps in coverage, allocation methodologies, and the terms of existing settlement agreements with insurance carriers.
As a result of the activity described above, the Company recorded a net charge, in addition to the amounts described above for Yarway, of $240 million in Selling, general and administrative expenses in the Consolidated Statement of Operations during the quarter ended September 26, 2014. Although the Company’s methodology established a range of estimates of reasonably possible outcomes, the Company recorded its best estimate within such range based upon currently known information. The Company's estimated gross asbestos liability, excluding Yarway, of $538 million was recorded within the Company's Consolidated Balance Sheet as a liability for pending and future claims and related defense costs, and separately as an asset for insurance recoveries of $245 million. The aforementioned total estimated liability is on a pre-tax basis, not discounted for the time-value of money, and includes defense costs, which is consistent with the Company’s historical accounting practices.
The effect of the change in our look-forward period reduced income from continuing operations before income taxes and net income by approximately $116 million and $71 million, respectively. In addition, the effect of the change decreased the Company's basic income from continuing operations and net income by $0.16 per share, and decreased the Company's diluted income from continuing operations and net income by $0.15 per share.
The amounts recorded by the Company for asbestos-related liabilities and insurance-related assets are based on the Company's strategies for resolving its asbestos claims, currently available information, and a number of estimates and
27
assumptions. Key variables and assumptions include the number and type of new claims that are filed each year, the average cost of resolution of claims, the identity of defendants, the resolution of coverage issues with insurance carriers, amount of insurance, and the solvency risk with respect to the Company's insurance carriers. Many of these factors are closely linked, such that a change in one variable or assumption will impact one or more of the others, and no single variable or assumption predominately influences the determination of the Company's asbestos-related liabilities and insurance-related assets. Furthermore, predictions with respect to these variables are subject to greater uncertainty in the later portion of the projection period. Other factors that may affect the Company's liability and cash payments for asbestos-related matters include uncertainties surrounding the litigation process from jurisdiction to jurisdiction and from case to case, reforms of state or federal tort legislation and the applicability of insurance policies among subsidiaries. As a result, actual liabilities or insurance recoveries could be significantly higher or lower than those recorded if assumptions used in the Company's calculations vary significantly from actual results.
In connection with the foregoing, during the third quarter of fiscal 2014, the Company resolved disputes with certain of its historical insurers and agreed that certain insurance proceeds will be used to establish and fund a qualified settlement fund (“QSF”), within the meaning of the Internal Revenue Code, which will be used for the resolution of asbestos liabilities of the Company, other than Yarway asbestos claims. It is intended that the QSF will receive future insurance payments and proceeds from third party insurers and, in addition, will fund and manage liabilities for certain historical operations of the Company. In addition, the Company expects to make cash contributions to the QSF structure within the next 12 months of approximately $275 million to purchase insurance that will be dedicated to, and is expected to fully fund, these liabilities.
Tax Matters
Tyco and its subsidiaries' income tax returns are examined periodically by various tax authorities. In connection with these examinations, tax authorities, including the IRS, have raised issues and proposed tax adjustments, in particular with respect to years preceding the 2007 Separation. The issues and proposed adjustments related to such years are generally subject to the sharing provisions of a tax sharing agreement entered in 2007 with Covidien and TE Connectivity (the "2007 Tax Sharing Agreement") under which Tyco, Covidien and TE Connectivity share
27%
,
42%
and
31%
, respectively, of shared income tax liabilities that arise from adjustments made by tax authorities to Tyco's, Covidien's and TE Connectivity's U.S. and certain non-U.S. income tax returns. The costs and expenses associated with the management of these shared tax liabilities are generally shared equally among the parties. Tyco has previously disclosed that in connection with U.S. federal tax audits, the IRS has raised a number of issues and proposed tax adjustments for periods beginning with the 1997 tax year. Although Tyco has been able to resolve substantially all of the issues and adjustments proposed by the IRS for tax years through 2007, it has not been able to resolve matters related to the treatment of certain intercompany debt transactions during the period. As a result, on June 20, 2013, Tyco received Notices of Deficiency from the IRS asserting that several of Tyco's former U.S. subsidiaries owe additional taxes of
$883.3 million
plus penalties of
$154 million
based on audits of the 1997 through 2000 tax years of Tyco and its subsidiaries as they existed at that time. In addition, Tyco received Final Partnership Administrative Adjustments for certain U.S. partnerships owned by former U.S. subsidiaries with respect to which an additional tax deficiency of approximately
$30 million
is expected to be asserted. These amounts exclude interest and do not reflect the impact on subsequent periods if the IRS position described below is ultimately proved correct.
The IRS asserted in the Notices of Deficiency that substantially all of Tyco's intercompany debt originated during the 1997 - 2000 period should not be treated as debt for U.S. federal income tax purposes, and has disallowed interest and related deductions recognized on U.S. income tax returns totaling approximately
$2.9 billion
. Tyco strongly disagrees with the IRS position and has filed petitions with the U.S. Tax Court contesting the IRS proposed adjustments. A trial date has been set for February 2016. Tyco believes that it has meritorious defenses for its tax filings, that the IRS positions with regard to these matters are inconsistent with the applicable tax laws and existing Treasury regulations, and that the previously reported taxes for the years in question are appropriate.
No payments with respect to these matters would be required until the dispute is definitively resolved, which, based on the experience of other companies, could take several years. Tyco believes that its income tax reserves and the liabilities recorded in the Consolidated Balance Sheet for the tax sharing agreements continue to be appropriate. However, the ultimate resolution of these matters, and the impact of that resolution, are uncertain and could have a material impact on Tyco's financial condition, results of operations and cash flows. In particular, if the IRS is successful in asserting its claim, it would have an adverse impact on interest deductions related to the same intercompany debt in subsequent time periods, totaling approximately
$6.6 billion
, which is expected to be disallowed by the IRS.
See Note 6 to the Consolidated Financial Statements for additional information related to income tax matters.
28
Other Matters
During the fourth quarter of fiscal 2012, Tyco disclosed the improper recording of revenue in the Company's ROW Installation & Services segment related to security contracts in China. The Company pursued collection under its insurance policy and in the second fiscal quarter of 2014, the Company recorded a $21 million insurance recovery within the ROW Installation & Services segment as a result of a settlement with the insurance carrier. The insurance recovery was recorded in Selling, general and administrative expenses in the Consolidated Statement of Operations.
During the first quarter of fiscal 2014, Tyco settled a tax dispute with its former subsidiary, CIT Group, Inc. ("CIT"). Under the terms of the settlement agreement, Tyco received $60 million during the first quarter of 2014, which was subject to the sharing provisions of the 2007 Tax Sharing Agreement. As a result, the Company recorded a $16 million gain in Selling, general and administrative expenses in the Consolidated Statement of Operations and established payables of $25 million and $19 million due to Covidien and TE Connectivity, respectively, as of December 27, 2013. The Company paid these amounts to Covidien and TE Connectivity during the second fiscal quarter of 2014.
SimplexGrinnell LP (“SG”), a subsidiary of the Company in the North America Installation & Services segment, has been named as a defendant in several lawsuits seeking damages for SG’s alleged failure to pay prevailing wages in connection with work performed on state and local municipal projects. In New York, the U.S. District Court had granted SG’s motion for summary judgment dismissing plaintiffs’ claims for prevailing wages on testing and inspection work, which was based primarily on a 2009 opinion of the New York Department of Labor (“DOL”) that testing and inspection work would be considered covered by the prevailing wage law only on a prospective basis. Plaintiffs appealed this decision to the U.S. Court of Appeals for the Second Circuit, which in turn asked the NY Court of Appeals whether the lower court should have given deference to the DOL’s prospective-only application of law. The NY Court of Appeals recently ruled that the lower court did not have to give deference to the DOL based on an amicus brief submitted by the DOL in which it stated the Court need not have given it deference. As a result, the Company recorded a $10 million charge in Cost of services in the Consolidated Statement of Operations during the fourth quarter of fiscal 2014. SG also is a defendant in two other lawsuits related to prevailing wages in New Jersey and California. SG has agreed in principle to settle the California lawsuit for approximately $5 million subject to Court approval, which the Company had previously reserved.
In November 2014, the Company received and responded to recent inquiries from the US Department of the Navy regarding the formulation of certain aqueous film forming foam (AFFF) concentrates. The Company is investigating such matters and ceased selling certain AFFF and other foam products pending the outcome of its investigation. One AFFF product has been removed from the Navy’s Qualified Products List (QPL). The Company is in communication with appropriate governmental authorities about its investigation and is also communicating with the government regarding the qualification of these products. At this time, we cannot predict the outcome of these inquiries and whether this will result in further action by the Navy or other governmental authorities, but it is possible that the Company could be required to pay material fines, consent to injunctions on future conduct, experience suspension or debarment from government contracts, or suffer other criminal or civil penalties or adverse impacts, including being subject to lawsuits brought by private litigants, each of which may have a material adverse effect on the Company’s financial position, results of operations or cash flows.
In addition to the foregoing, the Company is subject to claims and suits, including from time to time, contractual disputes and product and general liability claims, incidental to present and former operations, acquisitions and dispositions. With respect to many of these claims, the Company either self-insures or maintains insurance through third-parties, with varying deductibles. While the ultimate outcome of these matters cannot be predicted with certainty, the Company believes that the resolution of any such proceedings, whether the underlying claims are covered by insurance or not, will not have a material adverse effect on the Company's financial condition, results of operations or cash flows beyond amounts recorded for such matters.
Not applicable.
29
The number of registered holders of Tyco's common shares as of November 7, 2014 was 20,460.
Tyco common shares are listed and traded on the NYSE under the symbol "TYC." The following table sets forth the high and low closing sales prices of Tyco common shares as reported by the NYSE, and the dividends declared on Tyco common shares, for the quarterly periods presented below.
|
|
Year Ended September 26, 2014
|
Year Ended September 27, 2013
|
|||||||||||||||||||||
|
|
Market Price
Range
|
|
Market Price
Range
|
|
|||||||||||||||||||
|
|
Dividends Declared
Per Common
Share
(1)
|
Dividends Declared
Per Common
Share
(1)
|
|||||||||||||||||||||
|
Quarter
|
High
|
Low
|
High
|
Low
|
|||||||||||||||||||
|
First
|
$
|
41.21
|
|
$
|
34.20
|
|
$
|
0.16
|
|
$
|
29.48
|
|
$
|
26.50
|
|
$
|
0.15
|
|
|||||
|
Second
|
43.82
|
|
39.40
|
|
0.16
|
|
32.34
|
|
29.25
|
|
0.15
|
|
|||||||||||
|
Third
|
46.46
|
|
40.61
|
|
0.18
|
|
34.50
|
|
30.70
|
|
0.16
|
|
|||||||||||
|
Fourth
|
45.95
|
|
42.70
|
|
0.18
|
|
35.91
|
|
32.93
|
|
0.16
|
|
|||||||||||
|
|
|
|
|
$
|
0.68
|
|
|
|
|
|
$
|
0.62
|
|
||||||||||
_______________________________________________________________________________
|
(1)
|
Dividends proposed by Tyco's Board of Directors are subject to shareholder approval. Shareholders approved an annual cash dividend of $0.72 at the Company's annual general meeting on March 5, 2014, covering quarterly dividend payments from May 2014 through February 2015. Shareholders approved an annual cash dividend of $0.64 at the Company's annual general meeting on March 6, 2013, covering quarterly dividend payments from May 2013 through February 2014. Shareholders approved cash dividends of $0.50 (pre-2012 Separation) and $0.30 (reflecting the impact of the 2012 Separation) at the annual meeting held on March 7, 2012 and the special general meeting held on September 17, 2012, respectively, covering quarterly dividend payments through February 2013.
|
Dividend Policy
The Company makes dividend payments from its contributed surplus equity position. These payments are made free of Swiss withholding taxes and are effectively denominated in U.S. dollars. Under Swiss law, the authority to declare dividends is vested in the Company's general meeting of shareholders.
Upon the closing of the merger transaction between Tyco International Ltd. and its wholly-owned subsidiary, Tyco Ireland, which is expected to occur in November 2014, our jurisdiction of incorporation will change from Switzerland to Ireland. As a result, the authority to declare and pay dividends will be vested in the Board of Directors. The timing, declaration and payment of future dividends to holders of our common shares will be determined by our Board of Directors and will depend upon many factors, including our financial condition and results of operations, the capital requirements of our businesses, industry practice and any other relevant factors.
Under Irish law, dividends may only be paid (and share repurchases and redemptions must generally be funded) out of “distributable reserves,” which Tyco Ireland will not have immediately following the closing of the merger between Tyco International Ltd. and Tyco Ireland. The creation of distributable reserves of Tyco Ireland by way of a capital reduction of Tyco Ireland requires the approval of the Irish High Court and, in connection with seeking such court approval, we have obtained the approval of our shareholder to create distributable reserves for Tyco Ireland (through the reduction of the share premium account of Tyco Ireland).
The approval of the Irish High Court is expected within approximately six to twelve weeks following the closing of the merger between Tyco International Ltd. and Tyco Ireland. We are not aware of any reason why the Irish High Court would not approve the creation of distributable reserves. However, the issuance of the required order is a matter for the discretion of the Irish High Court. In the event that distributable reserves of Tyco Ireland are not created, no distributions by way of dividends, share repurchases or otherwise will be permitted under Irish law (with the exception of the dividend that is scheduled to be paid in February 2015) until such time as the group has created sufficient distributable reserves from its trading activities.
30
Performance Graph
Set forth below is a graph comparing the cumulative total shareholder return on Tyco's common shares against the cumulative return on the S&P 500 Index and the S&P 500 Industrials Index, assuming investment of $100 on September 25, 2009, including the reinvestment of dividends. The graph shows the cumulative total return as of the fiscal years ended
September 24, 2010
,
September 30, 2011
, September 28, 2012, September 27, 2013 and
September 26, 2014
.
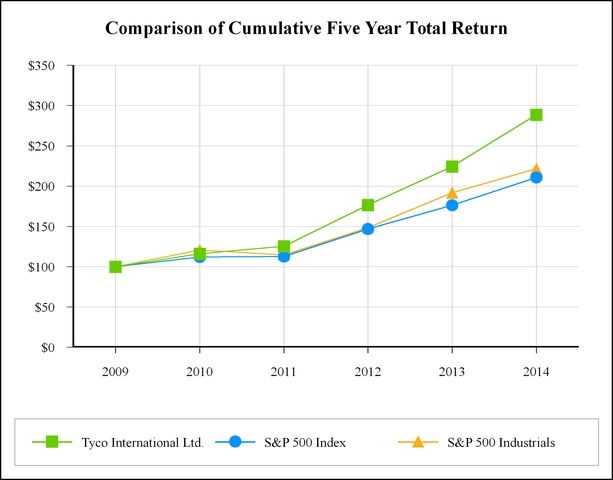
31
Comparison of Cumulative Five Year Total Return
Total Return To Shareholders
(Includes reinvestment of dividends)
|
|
Annual Return Percentage Years Ended
|
|||||||||||||
|
Company/Index
|
9/10
|
9/11
|
9/12
|
9/13
|
9/14
|
|||||||||
|
Tyco International Ltd.
|
16.16
|
|
8.06
|
|
40.85
|
|
26.95
|
|
28.66
|
|
||||
|
S&P 500 Index
|
12.23
|
|
0.49
|
|
30.20
|
|
20.06
|
|
19.64
|
|
||||
|
S&P 500 Industrials Index
|
20.95
|
|
(5.28
|
)
|
29.60
|
|
29.29
|
|
15.42
|
|
||||
|
9/09
|
9/10
|
9/11
|
9/12
|
9/13
|
9/14
|
||||||||||||||||||
|
Tyco International Ltd.
|
$
|
100
|
|
$
|
116.16
|
|
$
|
125.52
|
|
$
|
176.79
|
|
$
|
224.44
|
|
$
|
288.76
|
|
|||||
|
S&P 500 Index
|
100
|
|
112.23
|
|
112.77
|
|
146.83
|
|
176.29
|
|
210.91
|
|
|||||||||||
|
S&P 500 Industrials Index
|
100
|
|
120.95
|
|
114.57
|
|
148.49
|
|
191.98
|
|
221.59
|
|
|||||||||||
Equity Compensation Plan Information
The following table provides information as of
September 26, 2014
with respect to Tyco's common shares issuable under its equity compensation plans:
|
|
Equity Compensation Plan
|
||||||||
|
Plan Category
|
Number of
securities to be
issued upon
exercise of
outstanding
options
(a)
|
Weighted-average
exercise price of
outstanding
options
(b)
|
Number of
securities remaining
available for future
issuance under
equity compensation plans
(excluding securities
reflected in column (a))
(c)
|
||||||
|
Equity compensation plans approved by shareholders:
|
|
||||||||
|
2012 Stock and Incentive Plan
(1)
|
8,519,966
|
|
$
|
30.83
|
|
35,087,826
|
|
||
|
2004 Stock and Incentive Plan
(2)
|
10,461,375
|
|
20.54
|
|
—
|
|
|||
|
ESPP
(3)
|
—
|
|
2,919,845
|
|
|||||
|
18,981,341
|
|
38,007,671
|
|
||||||
|
Equity compensation plans not approved by shareholders:
|
|
|
|||||||
|
Broadview Security Plans
(4)
|
19,526
|
|
12.00
|
|
—
|
|
|||
|
19,526
|
|
—
|
|
||||||
|
Total
|
19,000,867
|
|
38,007,671
|
|
|||||
32
|
(1)
|
The Tyco International Ltd. 2012 Stock and Incentive Plan ("2012 Plan") provides for the award of stock options, restricted stock units, performance share units and other equity and equity-based awards to members of the Board of Directors, officers and non-officer employees. The amount in column (a) consists of:
|
|
5,555,909
|
|
Shares that may be issued upon the exercise of stock options;
|
|
1,573,753
|
|
Shares that may be issued upon the vesting of restricted stock units;
|
|
1,387,651
|
|
Shares that may be issued upon the vesting of performance share units; and
|
|
2,653
|
|
Dividend equivalents earned on deferred stock units ("DSU") granted under the Company’s Long Term Incentive Plan ("LTIP I") and its 2004 Stock and Incentive Plan ("2004 Plan").
|
|
8,519,966
|
|
Total
|
The amount in column (c) includes the aggregate shares available under the 2012 Plan and includes shares that were subject to awards under the 2004 Plan that were outstanding between September 28, 2013 and September 26, 2014, but which had been forfeited for any reason as of September 26, 2014 (other than by reason of exercise or settlement of the awards).
|
(2)
|
The 2004 Plan provided for the award of stock options, restricted stock units, performance share units and other equity and equity-based awards to members of the Board of Directors, officers and non-officer employees. The amount in column (a) consists of:
|
|
9,550,930
|
|
Shares that may be issued upon the exercise of stock options;
|
|
837,547
|
|
Shares that may be issued upon the vesting of restricted stock units; and
|
|
72,898
|
|
DSUs and dividend equivalents earned on DSUs.
|
|
10,461,375
|
|
Total
|
As of October 1, 2012, the 2004 Plan was effectively terminated and no new awards are permitted to be granted under the 2004 Plan as it was replaced with the 2012 Plan. Shares subject, as of October 1, 2012, to outstanding awards under the 2004 Plan that cease for any reason to be subject to such awards (other than by reason of exercise or settlement of the awards) shall be available under the 2012 Plan.
|
(3)
|
Shares available for future issuance under the Tyco Employee Stock Purchase Plan ("ESPP"), which represents the number of remaining shares registered for issuance under this plan. All of the shares delivered to participants under the ESPP were purchased in the open market. The ESPP was suspended indefinitely during the fourth quarter of 2009.
|
|
(4)
|
In connection with the acquisition of Broadview Security in May 2010, options outstanding under the Brink's Home Security Holdings, Inc. 2008 Equity Incentive Plan and the Brink's Home Security Holdings, Inc. Non-Employee Director's Equity Plan were converted into options to purchase Tyco common shares.
|
Issuer Purchases of Equity Securities
|
Period
|
Total Number of
Shares
Purchased
|
Average
Price Paid
Per Share
|
Total Number of
Shares Purchased as
Part of Publicly
Announced
Plans or Programs
|
Maximum Approximate Dollar
Value of Shares that
May Yet Be Purchased
Under Publicly
Announced
Plans or Programs
(1)
|
|||||||||
|
6/28/2014 - 7/25/2014
|
7,034,189
|
|
$
|
45.44
|
|
7,029,336
|
|
|
|
||||
|
7/26/2014 - 8/29/2014
|
8,068,419
|
|
44.18
|
|
8,068,419
|
|
|
|
|||||
|
8/30/2014 - 9/26/2014
|
7,896,692
|
|
44.44
|
|
7,894,970
|
|
$
|
1,416,789,994
|
|
||||
(1)
The Company's Board of Directors approved a $1 billion share repurchase program in September 2014.
The transactions in the table above represent the repurchase of common shares on the New York Stock Exchange. During the fourth quarter of 2014, there were approximately 23 million common shares repurchased on the New York Stock Exchange under the existing share repurchase authority. In addition, certain transactions in the table above represent the acquisition of shares by the Company from certain employees in order to satisfy employee tax withholding requirements in connection with the vesting of restricted shares. The average price paid per share is calculated by dividing the total cash paid
33
for the shares by the total number of shares repurchased. As of
September 26, 2014
, after including the $1 billion approved authority described above, approximately $1.4 billion in share repurchase authority remained outstanding.
The following table sets forth selected consolidated financial data of Tyco. This data is derived from Tyco's Consolidated Financial Statements for the years ended
September 26, 2014
,
September 27, 2013
,
September 28, 2012
,
September 30, 2011
, and
September 24, 2010
, respectively. Tyco has a 52 or 53-week fiscal year that ends on the last Friday in September. Fiscal years 2014, 2013, 2012, and 2010 were all 52-week years, while fiscal 2011 was a 53-week year.
Certain prior period amounts have been reclassified to conform with current period presentation. Specifically, the Company has reclassified the operations of its South Korean security business and several businesses in the ROW Installation & Services segment to income from discontinued operations in the Consolidated Statements of Operations and the assets and liabilities as held for sale within the Consolidated Balance Sheets as they satisfied the criteria to be presented as discontinued operations. See Note 3 to our Consolidated Financial Statements for additional information.
|
2014
|
2013
|
2012
(3)(4)
|
2011
|
2010
|
|||||||||||||||
|
Consolidated Statements of Operations Data:
|
|
|
|
|
|
||||||||||||||
|
Net revenue
|
$
|
10,340
|
|
$
|
10,073
|
|
$
|
9,892
|
|
$
|
10,081
|
|
$
|
10,610
|
|
||||
|
Income (loss) from continuing operations attributable to Tyco common shareholders
(1)
|
794
|
|
443
|
|
(412
|
)
|
548
|
|
233
|
|
|||||||||
|
Net income attributable to Tyco common shareholders
(2)
|
1,838
|
|
536
|
|
472
|
|
1,719
|
|
1,130
|
|
|||||||||
|
Basic earnings per share attributable to Tyco
common shareholders:
|
|
|
|
|
|||||||||||||||
|
Income (loss) from continuing operations
|
1.74
|
|
0.96
|
|
(0.89
|
)
|
1.16
|
|
0.48
|
|
|||||||||
|
Net income
|
4.04
|
|
1.15
|
|
1.02
|
|
3.63
|
|
2.33
|
|
|||||||||
|
Diluted earnings per share attributable to Tyco common shareholders:
|
|
|
|
|
|||||||||||||||
|
Income (loss) from continuing operations
|
1.71
|
|
0.94
|
|
(0.89
|
)
|
1.14
|
|
0.48
|
|
|||||||||
|
Net income
|
3.97
|
|
1.14
|
|
1.02
|
|
3.59
|
|
2.31
|
|
|||||||||
|
Cash dividends per share
|
0.68
|
|
0.62
|
|
0.90
|
|
0.99
|
|
0.86
|
|
|||||||||
|
Consolidated Balance Sheet Data (End of Year):
|
|
|
|
|
|||||||||||||||
|
Total assets
|
$
|
11,809
|
|
$
|
12,176
|
|
$
|
12,365
|
|
$
|
26,702
|
|
$
|
27,066
|
|
||||
|
Long-term debt
|
1,443
|
|
1,443
|
|
1,481
|
|
4,105
|
|
3,608
|
|
|||||||||
|
Total Tyco shareholders' equity
|
4,647
|
|
5,098
|
|
4,994
|
|
14,149
|
|
14,066
|
|
|||||||||
_______________________________________________________________________________
|
(1)
|
Income (loss) from continuing operations attributable to Tyco common shareholders for the fiscal years 2014 and 2012 includes asbestos related charges of $462 million and $111 million, respectively. Fiscal 2014 also includes $96 million of legacy legal reversal and recoveries. In addition, fiscal 2013 includes $100 million in environmental remediation costs related to our Marinette facility. See Note 13 to the Consolidated Financial Statements.
|
|
(2)
|
Net income attributable to Tyco common shareholders for the fiscal years 2014, 2013, 2012, 2011 and 2010 includes Income from discontinued operations of $1,044 million, $93 million, $80 million, $69 million and $62 million primarily related to ADT Korea. Net income (loss) attributable to Tyco common shareholders for the fiscal years 2012, 2011, and 2010 also includes Income from discontinued operations of $804 million, $1,102 million, and $835 million, respectively, which is primarily related to ADT and Tyco Flow Control. The increase in net income attributable to common shareholders for 2014 also includes a gain of $216 million relating to the sale of Atkore. See Note 3 to the Consolidated Financial Statements.
|
|
(3)
|
The decrease in total assets and total Tyco shareholders' equity in fiscal 2012 is due to the distribution of our former North American residential security and flow control businesses.
|
|
(4)
|
The decrease in long-term debt is due to the $2.6 billion redemption of various debt securities in connection with the 2012 Separation. See Note 10 to the Consolidated Financial Statements.
|
34
Results of Operations
The following discussion and analysis of the Company's financial condition and results of operations should be read together with the Selected Financial Data and our Consolidated Financial Statements and the related notes included elsewhere in this Annual Report. This discussion and analysis contains forward-looking statements that involve risks, uncertainties and assumptions. The Company's actual results may differ materially from those anticipated in these forward-looking statements as a result of many factors, including but not limited to those under the headings "Risk Factors" and "Forward-Looking Information".
Organization
The Consolidated Financial Statements include the consolidated results of Tyco International Ltd., a company organized under the laws of Switzerland, and its subsidiaries (hereinafter collectively referred to as "we", the "Company" or "Tyco"). The financial statements have been prepared in United States dollars ("USD"), in accordance with accounting principles generally accepted in the United States ("GAAP").
On May 30, 2014, we entered into a Merger Agreement ("Merger Agreement") with Tyco International plc, a newly-formed Irish public limited company and a wholly-owned subsidiary of Tyco ("Tyco Ireland"). Under the Merger Agreement, Tyco will merge with and into Tyco Ireland, with Tyco Ireland being the surviving company. This Merger will result in Tyco Ireland becoming Tyco's publicly-traded parent company and change the jurisdiction of organization of Tyco from Switzerland to Ireland. The Merger received shareholder approval at the special general meeting of shareholders on September 9, 2014. We expect the Merger to become effective in November 2014.
We operate and report financial and operating information in the following three segments:
|
•
|
North America Installation & Services ("NA Installation & Services")
designs, sells, installs, services and monitors electronic security systems and fire detection and suppression systems for commercial, industrial, retail, institutional and governmental customers in North America.
|
|
•
|
Rest of World Installation & Services ("ROW Installation & Services")
designs, sells, installs, services and monitors electronic security systems and fire detection and suppression systems for commercial, industrial, retail, residential, small business, institutional and governmental customers in the Rest of World ("ROW") regions.
|
|
•
|
Global Products
designs, manufactures and sells fire protection, security and life safety products, including intrusion security, anti-theft devices, breathing apparatus and access control and video management systems, for commercial, industrial, retail, residential, small business, institutional and governmental customers worldwide, including products installed and serviced by our NA and ROW Installation & Services segments.
|
We also provide general corporate services to our segments which is reported as a fourth, non-operating segment, Corporate and Other. References to the segment data are to the Company's continuing operations.
Certain prior period amounts have been reclassified to conform with current period presentation. Specifically, the Company has reclassified the operations of its ADT Korea business and several other ROW Installation & Services businesses to Income from discontinued operations in the Consolidated Statements of Operations and the Assets and liabilities as held for sale within the Consolidated Balance Sheets as they satisfied the criteria to be presented as discontinued operations. We completed the sale of ADT Korea on May 22, 2014 and we expect to complete the sale of the other identified ROW Installation & Services businesses by the third quarter of fiscal 2015. See Note 3 to our Consolidated Financial Statements for additional information.
Recent Transactions
On May 22, 2014, the Company, together with its wholly-owned subsidiary Tyco Far East Holdings Ltd. (the “Seller”) completed the sale of Tyco Fire & Security Services Korea Co. Ltd. and its subsidiaries that form and operate the Company’s ADT Korea business to an affiliate of The Carlyle Group. The transaction took the form of a sale by the Seller of all of the stock of Tyco Fire & Security Services Korea Co. Ltd. for an aggregate purchase price of $1.93 billion.
On March 6, 2014, the Company announced Atkore International Group Inc.'s (“Atkore”) intention to redeem all of the Company’s remaining common equity stake in Atkore. The redemption was completed on April 9, 2014 for aggregate cash proceeds of $250 million.
Effective September 28, 2012, Tyco completed the spin-offs of The ADT Corporation ("ADT") and Pentair Ltd. (formerly known as Tyco Flow Control International Ltd. ("Tyco Flow Control")), formerly our North American residential security and
35
flow control businesses, respectively, into separate, publicly traded companies in the form of a distribution to Tyco shareholders. Immediately following the spin-off, Pentair, Inc. was merged with a subsidiary of Tyco Flow Control in a tax-free, all-stock merger ("the Merger"), with Pentair Ltd. ("Pentair") succeeding Pentair Inc. as an independent publicly traded company. The distribution was made on September 28, 2012, to Tyco shareholders of record on September 17, 2012. The distributions, the Merger and related transactions are collectively referred to herein as the "2012 Separation".
As a result of the 2012 Separation, we incurred separation related costs during fiscal 2014, 2013 and 2012 including professional services, marketing and information technology related costs, and we expect to continue to incur separation related costs during fiscal 2015. During fiscal
2014
, the Company incurred pre-tax costs related to the 2012 Separation of $53 million recorded within continuing operations (primarily in Selling, general and administrative expenses) and pre-tax costs of $1 million within discontinued operations. During
2013
, the Company incurred pre-tax costs related to the 2012 Separation of $69 million recorded within continuing operations (primarily within Selling, general and administrative expenses) and pre-tax gain of $8 million within discontinued operations. During 2012, we incurred separation related costs including debt refinancing, tax restructuring, professional services, restructuring and impairment charges and employee-related costs. During
2012
, the Company incurred pre-tax costs related to the 2012 Separation of $561 million recorded within continuing operations and $278 million within discontinued operations. Costs incurred within continuing operations in fiscal
2012
include a charge of $453 million due to the early extinguishment of debt, as the Company refinanced its long-term debt as a result of the 2012 Separation.
During fiscal
2014
and
2013
, respectively, the Company paid $58 million and
$165 million
in separation costs, all of which is included within continuing operations. During fiscal
2012
, the Company paid $186 million in separation costs, $18 million of which is included within continuing operations. See Note 2 to the Consolidated Financial Statements.
Business Overview
We are a leading global provider of security products and services, fire detection and suppression products and services and life safety products. We utilize our extensive global footprint of approximately 900 locations, including manufacturing facilities, service and distribution centers, monitoring centers and sales offices, to provide solutions and localized expertise to our global customer base. We provide an extensive range of product and service offerings to over 3 million customers in more than 100 countries through multiple channels. Our revenues are broadly diversified across the United States and Canada (collectively “North America”); Central America and South America (collectively “Latin America”); Europe, the Middle East, and Africa (collectively “EMEA”) and the Asia-Pacific geographic areas. The following chart reflects our fiscal
2014
net revenue by geographic area.
36
Fiscal
2014
Net Revenue by Geographic Area
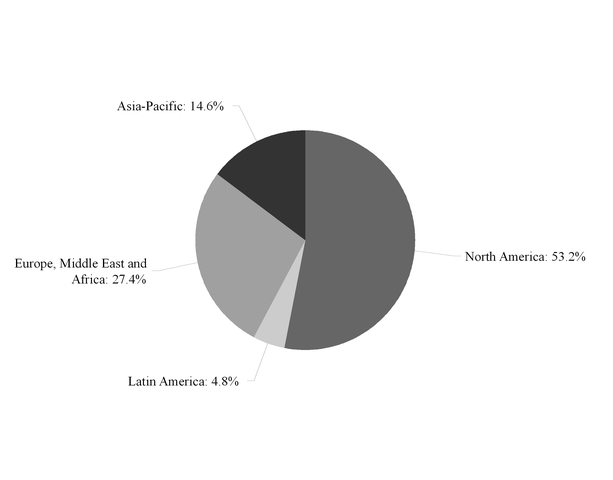
Our end-use customers, to whom we may sell directly or through wholesalers, distributors, commercial builders or contractors, are also broadly diversified and include:
|
•
|
Commercial customers, including residential and commercial property developers, financial institutions, food service businesses and commercial enterprises;
|
|
•
|
Industrial customers, including companies in the oil and gas, power generation, mining, petrochemical and other industries;
|
|
•
|
Retail customers, including international, regional and local consumer outlets, from national chains to specialty stores;
|
|
•
|
Institutional customers, including a broad range of healthcare facilities, academic institutions, museums and foundations;
|
|
•
|
Governmental customers, including federal, state and local governments, defense installations, mass transportation networks, public utilities and other government-affiliated entities and applications; and
|
|
•
|
Residential and small business customers outside of North America, including owners of single family homes and local providers of a wide range of goods and services.
|
As a global business with a varied customer base and an extensive range of products and services, our operations and results are impacted by global, regional and industry specific factors, and by political factors. Our geographic diversity and the diversity in our customer base and our products and services has helped mitigate the impact of any one industry or the economy of any single country on our consolidated operating results, financial condition and cash flows. Due to the global nature of our business and the variety of our customers, products and services, no single factor is predominantly used to forecast Company results. Rather, management monitors a number of factors to develop expectations regarding future results, including the activity of key competitors and customers, order rates for longer lead time projects, and capital expenditure budgets and spending patterns of our customers. We also monitor trends throughout the commercial and residential fire and security markets, including building codes and fire-safety standards. Our commercial installation businesses are impacted by trends in
37
commercial construction starts, while our residential business, which is located outside of North America, is impacted by new housing starts.
Results of Operations
Consolidated financial information is as follows:
|
|
For the Years Ended
|
|||||||||||
|
($ in millions)
|
September 26, 2014
|
September 27, 2013
|
September 28, 2012
|
|||||||||
|
Net revenue
|
$
|
10,340
|
|
$
|
10,073
|
|
$
|
9,892
|
|
|||
|
Net revenue growth
|
2.7
|
%
|
1.8
|
%
|
NA
|
|
||||||
|
Organic revenue growth
|
2.6
|
%
|
0.8
|
%
|
NA
|
|
||||||
|
Operating income
|
$
|
697
|
|
$
|
709
|
|
$
|
578
|
|
|||
|
Operating margin
|
6.7
|
%
|
7.0
|
%
|
5.8
|
%
|
||||||
|
Interest income
|
$
|
14
|
|
$
|
16
|
|
$
|
18
|
|
|||
|
Interest expense
|
97
|
|
100
|
|
209
|
|
||||||
|
Other expense, net
|
1
|
|
29
|
|
454
|
|
||||||
|
Income tax expense
|
(24
|
)
|
(108
|
)
|
(320
|
)
|
||||||
|
Equity income (loss) in earnings of unconsolidated subsidiaries
|
206
|
|
(48
|
)
|
(26
|
)
|
||||||
|
Income (loss) from continuing operations attributable to Tyco common shareholders
|
794
|
|
443
|
|
(412
|
)
|
||||||
Net Revenue:
Fiscal
2014
Net revenue for the year ended
September 26, 2014
increased
by
$267 million
, or
2.7%
, to
$10,340 million
as compared to net revenue of
$10,073 million
for the year ended
September 27, 2013
. On an organic basis, net revenue grew by
$255
million, or
2.6%
, year over year as a result of growth in all three segments, led primarily by Global Products and to a lesser extent ROW and NA Installation & Services. Net revenue was favorably impacted by
$201
million, or
2.0%
, as a result of acquisitions primarily within our ROW Installation & Services and Global Products segments. Net revenue growth was unfavorably impacted by divestitures of
$107
million, or
1.1%
, primarily in our ROW and NA Installation & Services segments. Changes in foreign currency exchange rates, primarily in our ROW Installation & Services segment, unfavorably impacted net revenue by
$82
million, or
0.8%
.
Fiscal
2013
Net revenue for the year ended
September 27, 2013
increased
by
$181 million
, or
1.8%
, to
$10,073 million
as compared to net revenue of
$9,892 million
for the year ended
September 28, 2012
. On an organic basis, net revenue grew by
$82 million
, or
0.8%
, year over year, primarily as a result of revenue growth in our Global Products segment, partially offset by a decline in our NA Installation & Services segment driven by our security business. Net revenue was favorably impacted by acquisitions of
$168 million
, or
1.7%
, primarily within our ROW Installation & Services and Global Products segments. Changes in foreign currency exchange rates, primarily in our ROW Installation & Services segment, unfavorably impacted net revenue by
$70 million
, or
0.7%
. Net revenue growth was also unfavorably impacted by divestitures of
$38 million
, or
0.4%
, primarily in our NA Installation & Services segment.
Operating Income:
Operating income for the year ended
September 26, 2014
decreased
$12 million
, or
1.7%
, to
$697 million
, as compared to operating income of
$709 million
for the year ended
September 27, 2013
. Operating income for the year ended
September 26, 2014
was unfavorably impacted by asbestos related charges of $225 million relating to an agreement in principle reached with creditors of Yarway, an indirect subsidiary of the Company, and $240 million as a result of an updated valuation performed over the Company's estimated liability for asbestos related claims (excluding Yarway claims). Operating income for the year ended
September 26, 2014
was favorably impacted by the reversal of a compensation reserve of $92 million established in respect of legacy litigation with former management, a gain of $16 million relating to a settlement with CIT, a former subsidiary of the Company, and a $21 million insurance recovery related to China. In addition, the year ended
September 26, 2014
was also favorably impacted by a $100 million decline in environmental remediation costs related to our Global Products facility in Marinette, Wisconsin and a decrease in restructuring charges of $62 million. See Note 13 to our Consolidated Financial Statements for further information on our asbestos, environmental and legacy legal matters.
38
Operating income for the year ended
September 27, 2013
increased
$131 million
, or
22.7%
, to
$709 million
, as compared to operating income of
$578 million
for the year ended
September 28, 2012
. Operating income for the year ended
September 27, 2013
was favorably impacted by our net revenue growth, a smaller corporate footprint as a result of the 2012 Separation, as well as a higher mix of service revenue and operational improvements across all of our businesses. Operating income for the year ended
September 27, 2013
was also favorably impacted by a $99 million decline in net asbestos charges. Operating income for the year ended
September 27, 2013
was unfavorably impacted by an $83 million increase in environmental remediation charges as well as an increase in restructuring charges. Operating income for the year ended
September 27, 2013
was also unfavorably impacted by a charge of
$27 million
resulting from the write-off of an insurance receivable that had been established in respect of a legacy claim.
Items impacting operating income for fiscal
2014
,
2013
and
2012
are as follows:
|
|
For the Years Ended
|
||||||||||||
|
($ in millions)
|
September 26, 2014
|
September 27, 2013
|
September 28, 2012
|
||||||||||
|
Restructuring, repositioning and asset impairment charges, net
|
$
|
93
|
|
$
|
131
|
|
$
|
104
|
|
||||
|
Environmental remediation costs - Marinette
|
—
|
|
100
|
|
17
|
|
|||||||
|
Asbestos related charges
|
462
|
|
12
|
|
111
|
|
|||||||
|
(Gain) loss on divestitures
|
(2
|
)
|
20
|
|
14
|
|
|||||||
|
Separation costs
|
53
|
|
69
|
|
75
|
|
|||||||
|
Legacy legal (gains) charges
|
(96
|
)
|
27
|
|
(4
|
)
|
|||||||
|
China insurance recovery
|
(21
|
)
|
—
|
|
—
|
|
|||||||
|
CIT settlement gain
|
(16
|
)
|
—
|
|
—
|
|
|||||||
|
Loss on sale of investment
|
7
|
|
—
|
|
—
|
|
|||||||
|
Acquisition and integration costs
|
3
|
|
4
|
|
9
|
|
|||||||
|
IRS litigation costs
|
4
|
|
—
|
|
—
|
|
|||||||
We continue to identify and pursue opportunities for cost savings through restructuring activities and workforce reductions to improve operating efficiencies across our businesses. Additionally, we initiated certain global actions during fiscal 2013 designed to reduce our cost structure and improve future profitability by streamlining operations and better aligning functions, which we refer to as repositioning actions. The Company expects to incur approximately $100 million to $150 million of restructuring and repositioning charges in fiscal 2015. See Note 4 to the Consolidated Financial Statements.
Income (loss) from continuing operations attributable to Tyco common shareholders:
Interest Income and Expense
Interest income was
$14 million
in
2014
, as compared to
$16 million
and
$18 million
in
2013
and
2012
, respectively. Interest income decreased in
2014
compared to
2013
primarily due to interest income received in fiscal 2013 related to a working capital adjustment related to the 2012 spin-off of Tyco Flow Control.
Interest expense was
$97 million
in
2014
, as compared to
$100 million
and
$209 million
in
2013
and
2012
, respectively. The weighted-average interest rate on total debt outstanding was 6.5% for all three fiscal years. The decrease in interest expense from 2012 to 2013 was primarily related to savings realized from the $2.6 billion debt redemptions in 2012. See Note 10 to the Consolidated Financial Statements.
39
Other Income (Expense), Net
Significant components of other income (expense), net for fiscal
2014
,
2013
and
2012
are as follows:
|
|
For the Years Ended
|
||||||||||
|
($ in millions)
|
September 26, 2014
|
September 27, 2013
|
September 28, 2012
|
||||||||
|
Loss on extinguishment of debt (see Note 10 to the Consolidated Financial Statements)
|
$
|
—
|
|
$
|
—
|
|
$
|
(453
|
)
|
||
|
2012 Tax Sharing Agreement income (see Note 6 to the Consolidated Financial Statements)
|
15
|
|
(32
|
)
|
—
|
|
|||||
|
2007 Tax Sharing Agreement loss (see Note 6 to the Consolidated Financial Statements)
|
(21
|
)
|
—
|
|
(4
|
)
|
|||||
|
Other
|
5
|
3
|
3
|
|
|||||||
|
Total
|
$
|
(1
|
)
|
$
|
(29
|
)
|
$
|
(454
|
)
|
||
Effective Income Tax Rate
Our effective income tax rate was 3.9% during the year ended
September 26, 2014
. Our effective tax rate is affected by the mix of jurisdictions in which income is earned. Our effective tax rate for the year was favorably impacted by asbestos related charges that generated a tax benefit in a high tax jurisdiction, partially offset by a reversal of a compensation reserve established in respect of legacy litigation with former management that generated tax expense in a high tax jurisdiction.
Our effective income tax rate was 18.1% during the year ended
September 27, 2013
. Our effective tax rate for the year was favorably impacted by taxes on the environmental remediation charges incurred during the second quarter of 2013, partially offset by Tax Sharing Agreement adjustments incurred throughout the year and enacted tax law changes in the fourth quarter of 2013.
Our effective income tax rate for the year ended
September 28, 2012
was not meaningful primarily as a result of separation related charges which were incurred for which no tax benefit was recognized, as well as a valuation allowance of $235 million recorded due to net operating loss carryforwards which we do not expect to realize in future periods. Additionally, our effective income tax rate for the year ended
September 28, 2012
was impacted by enacted tax law changes, favorable audit resolutions in multiple jurisdictions and a non-recurring item generating a tax benefit.
The rate can vary from period to period due to discrete items such as the settlement of income tax audits and changes in tax laws, as well as recurring factors, such as the geographic mix of income before taxes.
The valuation allowance for deferred tax assets of $2.0 billion and $1.9 billion as of
September 26, 2014
and
September 27, 2013
, respectively, relates principally to the uncertainty of the utilization of certain deferred tax assets, primarily tax loss and credit carryforwards in various jurisdictions. Specifically, the valuation allowance as of
September 26, 2014
and
September 27, 2013
includes separation related charges associated with the early extinguishment of debt which further increased a net operating loss carryforward which the Company does not expect to realize in future periods. The valuation allowance was calculated and recorded when the Company determined that it was more-likely-than-not that all or a portion of our deferred tax assets would not be realized. The Company believes that it will generate sufficient future taxable income to realize the tax benefits related to the remaining net deferred tax assets on the Company's Consolidated Balance Sheets.
The calculation of our tax liabilities involves dealing with uncertainties in the application of complex tax regulations in a multitude of jurisdictions across our global operations. We record tax liabilities for anticipated tax audit issues in the U.S. and other tax jurisdictions based on our estimate of whether, and the extent to which, additional taxes will be due. These tax liabilities are reflected net of related tax loss carryforwards. We adjust these liabilities in light of changing facts and circumstances; however, due to the complexity of some of these uncertainties, the ultimate resolution may result in a payment that is materially different from our current estimate of the tax liabilities. Substantially all of these potential tax liabilities are recorded in Other liabilities in the Consolidated Balance Sheets as payment is not expected within one year.
Equity Income (Loss) in Earnings of Unconsolidated Subsidiaries
Equity income (loss) in earnings of unconsolidated subsidiaries in
2014
,
2013
and
2012
reflects our share of Atkore International Group Inc.'s ("Atkore") net income or loss, which is accounted for under the equity method of accounting. Equity income (loss) in earnings of unconsolidated subsidiaries during the years ended
September 26, 2014
,
September 27, 2013
and
September 28, 2012
was a gain of $206 million, and losses of $48 million and $26 million, respectively.
40
On March 6, 2014, we announced Atkore's intention to redeem all of our remaining common equity stake in Atkore, and on April 9, 2014, the redemption was completed for aggregate cash proceeds of $250 million. We recognized a net gain of $216 million related to this transaction, which is comprised of a $227 million gain on the sale of the equity investment, partially offset by an $11 million loss, which is our share of loss on Atkore's debt extinguishment undertaken in connection with the redemption. See Note 3 to the Consolidated Financial Statements for additional information.
Segment Results
The following chart reflects our net revenue by operating segment, as well as the percent of net revenue by operating segment, for the years ended
September 26, 2014
,
September 27, 2013
and
September 28, 2012
, respectively.
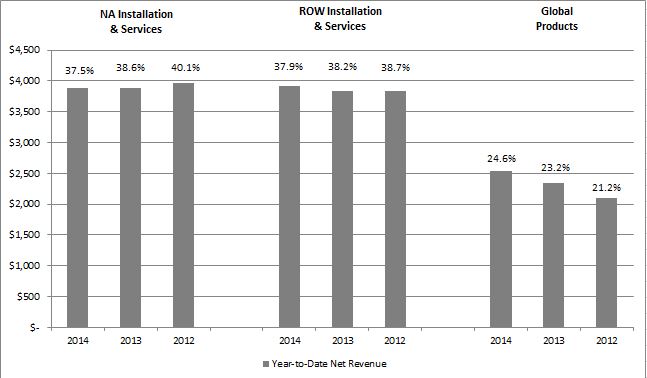
The segment discussions that follow describe the significant factors contributing to the changes in results for each of our segments included in continuing operations.
NA Installation & Services
NA Installation & Services designs, sells, installs, services and monitors electronic security systems and fire detection and suppression systems for commercial, industrial, retail, institutional and governmental customers in North America.
Financial information for NA Installation & Services for the years ended
September 26, 2014
,
September 27, 2013
and
September 28, 2012
were as follows:
|
|
For the Years Ended
|
||||||||||
|
($ in millions)
|
September 26, 2014
|
September 27, 2013
|
September 28, 2012
|
||||||||
|
Net revenue
|
$
|
3,876
|
|
$
|
3,891
|
|
$
|
3,962
|
|
||
|
Net revenue decline
|
(0.4
|
)%
|
(1.8
|
)%
|
NA
|
|
|||||
|
Organic revenue growth (decline)
|
1.0
|
%
|
(1.1
|
)%
|
NA
|
|
|||||
|
Operating income
|
$
|
450
|
|
$
|
388
|
|
$
|
374
|
|
||
|
Operating margin
|
11.6
|
%
|
10.0
|
%
|
9.4
|
%
|
|||||
41
The change in net revenue compared to the prior periods is attributable to the following:
|
Factors Contributing to Year-Over-Year Change
|
Fiscal 2014
Compared to
Fiscal 2013
|
Fiscal 2013
Compared to
Fiscal 2012
|
|||||
|
Organic revenue growth (decline)
|
$
|
37
|
|
$
|
(45
|
)
|
|
|
Acquisitions
|
19
|
|
7
|
|
|||
|
Divestitures
|
(42
|
)
|
(28
|
)
|
|||
|
Impact of foreign currency
|
(29
|
)
|
(3
|
)
|
|||
|
Other
|
—
|
|
(2
|
)
|
|||
|
Total change
|
$
|
(15
|
)
|
$
|
(71
|
)
|
|
Net revenue
decreased
$15 million
, or
0.4%
, to
$3,876 million
for the year ended
September 26, 2014
as compared to
$3,891 million
for the year ended
September 27, 2013
. The organic revenue growth for the year ended
September 26, 2014
was primarily driven by an increase in both service and installation revenue. The impact of acquisitions was
$19 million
, or
0.5%
, due to the acquisition of Westfire, Inc. ("Westfire"), a fire protection services company, in the first quarter of fiscal 2014, which was integrated into the NA Installation & Services and ROW Installation and Services segments. See Note 5 to our Consolidated Financial Statements. Net revenue was unfavorably impacted by
$42 million
, or
1.1%
, primarily due to the divestiture of our North America guarding business in the third quarter of fiscal 2013. Changes in foreign currency exchange rates unfavorably impacted net revenue by $29 million, or 0.7%.
Net revenue
decreased
$71 million
, or
1.8%
to
$3,891 million
for the year ended
September 27, 2013
as compared to
$3,962 million
for the year ended
September 28, 2012
. Organic revenue decline for the year ended
September 27, 2013
was primarily driven by a decline in revenue in the North America security business as a result of the non-residential construction market and project selectivity, partially offset by increased service revenue growth in our North America fire business. Net revenue was unfavorably impacted by
$28 million
, or
0.7%
, primarily due to the divestiture of our North America guarding business in the third quarter of fiscal 2013.
Operating Income
Operating income for the year ended
September 26, 2014
increased
$62 million
, or
16.0%
, to
$450 million
, as compared to operating income of
$388 million
for the year ended
September 27, 2013
. Operating income for the year ended
September 26, 2014
increased due to a higher mix of service revenue, improved execution, lower restructuring costs, and savings realized from restructuring activities and productivity initiatives.
Operating income for the year ended
September 27, 2013
increased
$14 million
, or
3.7%
, to
$388 million
, as compared to operating income of
$374 million
for the year ended
September 28, 2012
. Operating income for the year ended
September 27, 2013
increased due to a higher mix of service revenue and efficiencies gained through improved installation execution and project selectivity for the North American security business. Additionally, the year ended
September 28, 2012
included a charge of
$29 million
for the settlement of an ERISA partial withdrawal liability assessment. These items were partially offset by unfavorable impacts due to separation costs as well as dis-synergy costs related to the 2012 separation.
Key items impacting operating income for the years ended
September 26, 2014
,
September 27, 2013
and
September 28, 2012
were as follows:
|
|
For the Years Ended
|
||||||||||
|
($ in millions)
|
September 26, 2014
|
September 27, 2013
|
September 28, 2012
|
||||||||
|
Separation costs
|
$
|
51
|
|
$
|
49
|
|
$
|
2
|
|
||
|
Restructuring, repositioning and asset impairment charges, net
|
13
|
|
36
|
|
45
|
|
|||||
|
Legacy legal charges
|
—
|
|
—
|
|
29
|
|
|||||
ROW Installation & Services:
ROW Installation & Services designs, sells, installs, services and monitors electronic security systems and fire detection and suppression systems for commercial, industrial, retail, residential, small business, institutional and governmental customers in our Continental Europe, United Kingdom, Asia, Pacific and Growth Markets regions, which are collectively our ROW regions.
42
Financial information for ROW Installation & Services for the years ended
September 26, 2014
,
September 27, 2013
and
September 28, 2012
were as follows:
|
|
For the Years Ended
|
||||||||||
|
($ in millions)
|
September 26, 2014
|
September 27, 2013
|
September 28, 2012
|
||||||||
|
Net revenue
|
$
|
3,920
|
|
$
|
3,843
|
|
$
|
3,830
|
|
||
|
Net revenue growth (decline)
|
2.0
|
%
|
0.3
|
%
|
NA
|
|
|||||
|
Organic revenue growth
|
1.9
|
%
|
(0.2
|
)%
|
NA
|
|
|||||
|
Operating income
|
$
|
409
|
|
$
|
333
|
|
$
|
349
|
|
||
|
Operating margin
|
10.4
|
%
|
8.7
|
%
|
9.1
|
%
|
|||||
The change in net revenue compared to the prior periods is attributable to the following:
|
Factors Contributing to Year-Over-Year Change
|
Fiscal 2014
Compared to
Fiscal 2013
|
Fiscal 2013
Compared to
Fiscal 2012
|
|||||
|
Organic revenue growth
|
$
|
71
|
|
$
|
(6
|
)
|
|
|
Acquisitions
|
119
|
|
93
|
|
|||
|
Divestitures
|
(67
|
)
|
(10
|
)
|
|||
|
Impact of foreign currency
|
(46
|
)
|
(64
|
)
|
|||
|
Total change
|
$
|
77
|
|
$
|
13
|
|
|
Net revenue
increased
$77 million
, or
2.0%
, to
$3,920 million
for the year ended
September 26, 2014
as compared to
$3,843 million
for the year ended
September 27, 2013
. Organic revenue growth for the year ended
September 26, 2014
was driven by service and installation growth in Growth Markets and installation growth in Asia. Growth in these regions were offset by declines in both service and installation revenue in our Pacific, and to a lesser extent, Continental Europe regions. Net revenue was favorably impacted by
$119 million
, or
3.1%
, primarily due to the acquisitions within the Growth Markets and our Pacific regions during fiscal 2013. Net revenue was unfavorably impacted by
$67 million
, or
1.7%
due to divestitures in the Pacific region. Changes in foreign currency exchanges rates unfavorably impacted net revenue by
$46 million
or
1.2%
.
Net revenue
increased
$13 million
, or
0.3%
, to
$3,843 million
for the year ended
September 27, 2013
as compared to
$3,830 million
for the year ended
September 28, 2012
. Organic revenue decline for the year ended
September 27, 2013
was primarily driven by declines in the United Kingdom, Pacific and Continental Europe, partially offset by an increase in Growth Markets. Net revenue was favorably impacted by the impact of acquisitions of
$93 million
, or
2.4%
, primarily due to the acquisitions within the United Kingdom and our Pacific regions during fiscal 2013 as well as acquisitions in Asia during fiscal 2012. Net revenue was unfavorably impacted by the impact of divestitures of
$10 million
, or
0.3%
. Changes in foreign currency exchanges rates unfavorably impacted net revenue by
$64 million
, or
1.7%
.
Operating Income
Operating income for the year ended
September 26, 2014
increased
$76 million
, or
22.8%
, to
$409 million
, as compared to operating income of
$333 million
for the year ended
September 27, 2013
. Operating income for the year ended
September 26, 2014
was favorably impacted by a decrease in restructuring charges and loss on divestitures, a $21 million insurance recovery related to China and the benefit of ongoing productivity initiatives, partially offset by a lower mix of high-margin service revenue in the Pacific region.
Operating income for the year ended
September 27, 2013
decreased
$16 million
, or
4.6%
, to
$333 million
, as compared to operating income of
$349 million
for the year ended
September 28, 2012
. Operating income for the year ended
September 27, 2013
declined primarily due higher restructuring costs, partially offset by increased price focus on higher margin products and services and the ongoing benefit of cost containment and restructuring savings in most regions.
43
Key items impacting operating income for the years ended
September 26, 2014
,
September 27, 2013
and
September 28, 2012
were as follows:
|
|
For the Years Ended
|
||||||||||
|
($ in millions)
|
September 26, 2014
|
September 27, 2013
|
September 28, 2012
|
||||||||
|
Restructuring, repositioning and asset impairment charges, net
|
$
|
31
|
|
$
|
64
|
|
$
|
36
|
|
||
|
China insurance recovery
|
(21
|
)
|
—
|
|
—
|
|
|||||
|
Loss on divestitures
|
1
|
|
14
|
|
7
|
|
|||||
|
Acquisition and integration costs
|
3
|
|
2
|
|
4
|
|
|||||
|
Loss on sale of investment
|
7
|
|
—
|
|
—
|
|
|||||
Global Products:
Global Products designs, manufactures and sells fire protection, security and life safety products, including intrusion security, anti-theft devices, breathing apparatus and access control and video management systems, for commercial, industrial, retail, residential, small business, institutional and governmental customers worldwide, including products installed and serviced by our NA and ROW Installation & Services segments.
Financial information for Global Products for the years ended
September 26, 2014
,
September 27, 2013
and
September 28, 2012
were as follows:
|
|
For the Years Ended
|
||||||||||
|
($ in millions)
|
September 26, 2014
|
September 27, 2013
|
September 28, 2012
|
||||||||
|
Net revenue
|
$
|
2,544
|
|
$
|
2,339
|
|
$
|
2,100
|
|
||
|
Net revenue growth
|
8.8
|
%
|
11.4
|
%
|
NA
|
|
|||||
|
Organic revenue growth
|
6.3
|
%
|
6.3
|
%
|
NA
|
|
|||||
|
Operating income
|
$
|
458
|
|
$
|
307
|
|
$
|
353
|
|
||
|
Operating margin
|
18.0
|
%
|
13.1
|
%
|
16.8
|
%
|
|||||
The change in net revenue compared to the prior periods is attributable to the following:
|
Factors Contributing to Year-Over-Year Change
|
Fiscal 2014
Compared to
Fiscal 2013
|
Fiscal 2013
Compared to
Fiscal 2012
|
|||||
|
Organic revenue growth
|
$
|
147
|
|
$
|
133
|
|
|
|
Acquisitions
|
63
|
|
68
|
|
|||
|
Impact of foreign currency
|
(7
|
)
|
(3
|
)
|
|||
|
Other
|
2
|
|
41
|
|
|||
|
Total change
|
$
|
205
|
|
$
|
239
|
|
|
Net revenue
increased
$205 million
, or
8.8%
, to
$2,544 million
for the year ended
September 26, 2014
as compared to
$2,339 million
for the year ended
September 27, 2013
. Organic revenue growth for the year ended
September 26, 2014
was driven by growth across all three of our product platforms, particularly in security products. The impact of acquisitions was
$63 million
, or
2.7%
, primarily due to the acquisition of Exacq Technologies ("Exacq"), a developer of open architecture video management systems for security and surveillance applications, during 2013. Exacq has been integrated into the Global Products segment. See Note 5 to our Consolidated Financial Statements.
Net revenue
increased
$239 million
, or
11.4%
, to
$2,339 million
for the year ended
September 27, 2013
as compared to
$2,100 million
for the year ended
September 28, 2012
. Organic revenue growth for the year ended
September 27, 2013
was driven by growth across all three of our product platforms. Net revenue was favorably impacted by acquisitions of
$68 million
, or
3.2%
, primarily due to acquisitions within our fire and security products businesses during fiscal 2013 and 2012. Net revenue was also favorably impacted by contractual revenue from ADT under the 2012 Separation and Distribution Agreement of
$39 million
or
1.9%
, included within Other above.
44
Operating Income
Operating income for the year ended
September 26, 2014
increased
$151 million
, or
49.2%
, to
$458 million
, as compared to operating income of
$307 million
for the year ended
September 27, 2013
. The increase was driven by net revenue growth in the current year and the unfavorable impact of an environmental remediation charge in the comparable period, partially offset by additional investments in research and development and sales and marketing costs. See Note 13 to our Consolidated Financial Statements for further information.
Operating income for the year ended
September 27, 2013
decreased
$46 million
, or
13.0%
, to
$307 million
, as compared to operating income of
$353 million
for the year ended
September 28, 2012
. Operating income for the year ended
September 27, 2013
was unfavorably impacted by charges of $100 million recorded in the first half of fiscal 2013 for additional environmental remediation activities planned for a facility located in Marinette, Wisconsin. Our operating income for the year ended
September 27, 2013
was favorably impacted by net revenue growth and operational improvements partially offset by additional investments in research and development and sales and marketing costs.
Key items impacting operating income for the years ended
September 26, 2014
,
September 27, 2013
and
September 28, 2012
are as follows:
|
|
For the Years Ended
|
||||||||||
|
($ in millions)
|
September 26, 2014
|
September 27, 2013
|
September 28, 2012
|
||||||||
|
Environmental remediation costs - Marinette
|
$
|
—
|
|
$
|
100
|
|
$
|
17
|
|
||
|
Restructuring, repositioning and asset impairment charges, net
|
12
|
|
12
|
|
10
|
|
|||||
|
Acquisition and integration costs
|
—
|
|
2
|
|
4
|
|
|||||
Corporate and Other
Corporate expense
increased
$301 million
, or
94.4%
, to
$620 million
for the year ended
September 26, 2014
as compared to
$319 million
for the year ended
September 27, 2013
. The increase in Corporate expense for the year ended
September 26, 2014
was primarily due to asbestos related charges of $225 million relating to an agreement in principle reached with creditors of Yarway, an indirect subsidiary of the Company, and $240 million as a result of an updated valuation performed over the Company's estimated liability for asbestos related claims (excluding Yarway claims). The increase in expense was also due to higher restructuring, repositioning and asset impairment charges, partially offset by a $96 million reversal and recoveries from settlements with former management. The increase in expense was also partially offset to a lesser extent by lower separation costs and a gain related to a legal settlement with CIT. See Note 13 to our Consolidated Financial Statements for additional information related to our asbestos and legacy legal matters.
Corporate expense
decreased
$179 million
, or
35.9%
, to
$319 million
for the year ended
September 27, 2013
as compared to
$498 million
for the year ended
September 28, 2012
. The decrease in Corporate expense for the year ended
September 27, 2013
was primarily due to a smaller corporate footprint as a result of the 2012 Separation as well as lower separation costs. Corporate expense also decreased due to a decline in net asbestos charges to
$12 million
in the year ended
September 27, 2013
from
$111 million
in the prior year period. The net asbestos charges for the year ended
September 27, 2013
primarily relate to the Yarway Corporation, which filed for bankruptcy protection during the third quarter of fiscal 2013. The net asbestos charges during the year ended
September 28, 2012
were primarily due to the Company revising its look-back period for historical claim experience and its look-forward period related to the projection of future claims. The decreases in Corporate expense were partially offset by a charge of
$27 million
resulting from the write-off of an insurance receivable that had been established in respect of a legacy claim as well as a net benefit in the prior year period of approximately
$33 million
, primarily resulting from the reversal of a compensation reserve established in respect of legacy litigation with former management. See Note 13 to the Consolidated Financial Statements for additional information related to our asbestos and legacy legal matters.
45
Key items included in corporate expense for the years ended
September 26, 2014
,
September 27, 2013
and
September 28, 2012
were as follows:
|
|
For the Years Ended
|
||||||||||
|
($ in millions)
|
September 26, 2014
|
September 27, 2013
|
September 28, 2012
|
||||||||
|
Legacy legal (gains) charges
|
$
|
(96
|
)
|
$
|
27
|
|
$
|
17
|
|
||
|
Separation costs
|
2
|
|
20
|
|
70
|
|
|||||
|
Restructuring, repositioning and asset impairment charges, net
|
37
|
|
19
|
|
13
|
|
|||||
|
Asbestos related charges
|
462
|
|
12
|
|
111
|
|
|||||
|
(Gain) loss on divestitures
|
(3
|
)
|
5
|
|
7
|
|
|||||
|
Former management compensation reversal
|
—
|
|
—
|
|
(50
|
)
|
|||||
|
CIT settlement gain
|
(16
|
)
|
—
|
|
—
|
|
|||||
|
IRS litigation costs
|
4
|
|
—
|
|
—
|
|
|||||
Critical Accounting Policies and Estimates
The preparation of the Consolidated Financial Statements in conformity with U.S. GAAP requires management to use judgment in making estimates and assumptions that affect the reported amounts of assets and liabilities, disclosure of contingent assets and liabilities and the reported amounts of revenue and expenses. The following accounting policies are based on, among other things, judgments and assumptions made by management that include inherent risks and uncertainties. Management's estimates are based on the relevant information available at the end of each period.
Depreciation and Amortization Methods for Security Monitoring-Related Assets
—Tyco considers assets related to the acquisition of new customers in its electronic security business in three asset categories: internally generated residential subscriber systems outside of North America, internally generated commercial subscriber systems (collectively referred to as subscriber system assets) and customer accounts acquired through the ADT dealer program primarily outside of North America (referred to as dealer intangibles). Subscriber system assets include installed property, plant and equipment for which Tyco retains ownership and deferred costs directly related to the customer acquisition and system installation. Subscriber system assets and any deferred revenue resulting from the customer acquisition are accounted for over the expected life of the subscriber. In certain geographical areas where the Company has a large number of customers that behave in a similar manner over time, the Company accounts for subscriber system assets and related deferred revenue using pools, with separate pools for the components of subscriber system assets and any related deferred revenue based on the month and year of acquisition. The Company depreciates its pooled subscriber system assets and related deferred revenue using an accelerated method with lives up to 15 years. The accelerated method utilizes declining balance rates based on geographical area ranging from 140% to 360% for commercial subscriber pools and dealer intangibles and converts to a straight line methodology when the resulting depreciation charge is greater than that from the accelerated method. The Company uses a straight-line method with a 14-year life for non-pooled subscriber system assets (primarily in Europe, Latin America and Asia) and related deferred revenue, with remaining balances written off upon customer termination.
Revenue Recognition
—Contract sales for the installation of fire protection systems, large security intruder systems and other construction-related projects are recorded primarily under the percentage-of-completion method. Profits recognized on contracts in process are based upon estimated contract revenue and related total cost of the project at completion. The risk of this methodology is its dependence upon estimates of costs at completion, which are subject to the uncertainties inherent in long-term contracts. Provisions for anticipated losses are made in the period in which they become determinable.
Sales of security monitoring systems may have multiple elements, including equipment, installation, monitoring services and maintenance agreements. We assess our revenue arrangements to determine the appropriate units of accounting. When ownership of the system is transferred to the customer, each deliverable provided under the arrangement is considered a separate unit of accounting. Revenues associated with sale of equipment and related installations are recognized once delivery, installation and customer acceptance is completed, while the revenue for monitoring and maintenance services are recognized as services are rendered. Amounts assigned to each unit of accounting are based on an allocation of total arrangement consideration using a hierarchy of estimated selling price for the deliverables. The selling price used for each deliverable will be based on Vendor Specific Objective Evidence ("VSOE") if available, Third Party Evidence ("TPE") if VSOE is not available, or estimated selling price if neither VSOE or TPE is available. Revenue recognized for equipment and installation is limited to the lesser of their allocated amounts under the estimated selling price hierarchy or the non-contingent up-front consideration received at the time of installation, since collection of future amounts under the arrangement with the customer is contingent upon the delivery of monitoring and maintenance services.
46
Product discounts granted are based on the terms of arrangements with direct, indirect and other market participants. Rebates are estimated based on sales terms, historical experience and trend analysis.
Loss Contingencies
—Accruals are recorded for various contingencies including legal proceedings, self-insurance and other claims that arise in the normal course of business. The accruals are based on judgment, the probability of losses and, where applicable, the consideration of opinions of internal and/or external legal counsel and actuarially determined estimates. Additionally, the Company records receivables from third party insurers when recovery has been determined to be probable.
Asbestos-Related Contingencies and Insurance Receivables
—We and certain of our subsidiaries along with numerous other companies are named as defendants in personal injury lawsuits based on alleged exposure to asbestos-containing materials. We estimate the liability and corresponding insurance recovery for pending and future claims and defense costs based on the Company's historical claim experience, and estimates of the number and resolution cost of potential future claims that may be filed. The Company's legal strategy for resolving claims also impacts these estimates. The Company considers various trends and developments in evaluating the period of time (the look-back period) over which historical claim and settlement experience is used to estimate and value claims reasonably projected to be made in the future during a defined period of time (the look-forward period). On a quarterly basis, the Company assesses the sufficiency of its estimated liability for pending and future claims and defense costs by evaluating actual experience regarding claims filed, settled and dismissed, and amounts paid in settlements. In addition to claims and settlement experience, the Company considers additional quantitative and qualitative factors such as changes in legislation, the legal environment, and the Company's defense strategy. The Company also evaluates the recoverability of its insurance receivable on a quarterly basis. The Company evaluates all of these factors and determines whether a change in the estimate of its liability for pending and future claims and defense costs or insurance receivable is warranted.
In connection with the recognition of liabilities for asbestos-related matters, we record asbestos-related insurance recoveries that are probable. The estimate of asbestos-related insurance recoveries represents estimated amounts due to us for previously paid and settled claims and the probable reimbursements relating to estimated liability for pending and future claims. In determining the amount of insurance recoverable, we consider available insurance, allocation methodologies, solvency and creditworthiness of the insurers. See Note 13 to the Consolidated Financial Statements for a discussion on management's judgments applied in the recognition and measurement of asbestos-related assets and liabilities.
Insurable Liabilities
—The Company records liabilities for its workers' compensation, product, general and auto liabilities. The determination of these liabilities and related expenses is dependent on claims experience. For most of these liabilities, claims incurred but not yet reported are estimated by utilizing actuarial valuations based upon historical claims experience. Certain insurable liabilities are discounted using a risk-free rate of return when the pattern and timing of the future obligation is reliably determinable. The Company records receivables from third party insurers when recovery has been determined to be probable.
Income Taxes
—In determining taxable income for financial statement purposes, we must make certain estimates and judgments. These estimates and judgments affect the calculation of certain tax liabilities and the determination of the recoverability of certain of the deferred tax assets, which arise from temporary differences between the tax and financial statement recognition of revenue and expense.
In evaluating our ability to recover our deferred tax assets we consider all available positive and negative evidence including our past operating results, the existence of cumulative losses in the most recent years and our forecast of future taxable income. In estimating future taxable income, we develop assumptions including the amount of future pre-tax operating income, the reversal of temporary differences and the implementation of feasible and prudent tax planning strategies. These assumptions require significant judgment about the forecasts of future taxable income and are consistent with the plans and estimates we are using to manage the underlying businesses.
We currently have recorded valuation allowances that we will maintain until it is more-likely-than-not the deferred tax assets will be realized. Our income tax expense recorded in the future may be reduced to the extent of decreases in our valuation allowances. The realization of our remaining deferred tax assets is primarily dependent on future taxable income in the appropriate jurisdiction. Any reduction in future taxable income including but not limited to any future restructuring activities may require that we record an additional valuation allowance against our deferred tax assets. An increase in the valuation allowance could result in additional income tax expense in such period and could have a significant impact on our future earnings.
Changes in tax laws and rates could also affect recorded deferred tax assets and liabilities in the future. Management records the effect of a tax rate or law change on the Company's deferred tax assets and liabilities in the period of enactment. Future tax rate or law changes could have a material effect on the Company's financial condition, results of operations or cash flows.
47
In addition, the calculation of our tax liabilities involves dealing with uncertainties in the application of complex tax regulations in a multitude of jurisdictions across our global operations. We recognize potential liabilities and record tax liabilities for anticipated tax audit issues in the U.S. and other tax jurisdictions based on our estimate of whether, and the extent to which, additional taxes will be due. These tax liabilities are reflected net of related tax loss carryforwards. We adjust these reserves in light of changing facts and circumstances; however, due to the complexity of some of these uncertainties, the ultimate resolution may result in a payment that is materially different from our current estimate of the tax liabilities. If our estimate of tax liabilities proves to be less than the ultimate assessment, an additional charge to expense would result. If payment of these amounts ultimately proves to be less than the recorded amounts, the reversal of the liabilities would result in tax benefits being recognized in the period when we determine the liabilities are no longer necessary.
Goodwill and Indefinite-Lived Intangible Asset Impairments
—Goodwill and indefinite-lived intangible assets are assessed for impairment annually and more frequently if triggering events occur. In performing these assessments, management relies on and considers a number of factors, including operating results, business plans, economic projections, anticipated future cash flows, comparable market transactions (to the extent available), other market data and the Company's overall market capitalization. We elected to make the first day of the fourth quarter the annual impairment assessment date for all goodwill and indefinite-lived intangible assets.
When testing for goodwill impairment, we first assess qualitative factors to determine whether it is more likely than not that the fair value of a reporting unit is less than its carrying amount. If we conclude it is more likely than not that the fair value of a reporting unit is less than its carrying amount, a quantitative fair value test is performed. Based upon our most recent annual impairment test completed as of June 30, 2014, it is more likely than not that the fair value of each reporting unit was in excess of its carrying value.
We recorded no goodwill impairments in conjunction with our annual goodwill impairment assessment performed during the fourth quarter of fiscal 2014.
Fair value determinations require considerable judgment and are sensitive to changes in underlying assumptions and factors. As a result, there can be no assurance that the estimates and assumptions made for purposes of the annual goodwill impairment test will prove to be accurate predictions of the future. Examples of events or circumstances that could reasonably be expected to negatively affect the underlying key assumptions and ultimately impact the estimated fair value of the aforementioned reporting units may include such items as follows:
|
•
|
A prolonged downturn in the business environment in which the reporting units operate (i.e. sales volumes and prices) especially in the commercial construction and retailer end markets;
|
|
•
|
An economic recovery that significantly differs from our assumptions in timing or degree;
|
|
•
|
Volatility in equity and debt markets resulting in higher discount rates; and
|
|
•
|
Unexpected regulatory changes.
|
While historical performance and current expectations have resulted in fair values of goodwill in excess of carrying values, if our assumptions are not realized, it is possible that in the future an impairment charge may need to be recorded. However, it is not possible at this time to determine if an impairment charge would result or if such a charge would be material.
Long-Lived Assets
—Asset groups held and used by the Company, including property, plant and equipment and amortizable intangible assets, are reviewed for impairment whenever events or changes in business circumstances indicate that the carrying amount of the asset group may not be fully recoverable. Tyco performs undiscounted operating cash flow analyses to determine if impairment exists. For purposes of recognition and measurement of an impairment for assets held for use, Tyco groups assets and liabilities at the lowest level for which cash flows are separately identified. If an impairment is determined to exist, any related impairment loss is calculated based on fair value. Impairments to long-lived assets to be disposed of are recorded based upon the fair value less cost to sell of the applicable assets. The calculation of the fair value of long-lived assets is based on assumptions concerning the amount and timing of estimated future cash flows and assumed discount rates, reflecting varying degrees of perceived risk. Since judgment is involved in determining the fair value and useful lives of long-lived assets, there is a risk that the carrying value of our long-lived assets may be overstated or understated.
Pension and Postretirement Benefits
—Our pension expense and obligations are developed from actuarial valuations. Two critical assumptions in determining pension expense and obligations are the discount rate and expected long-term return on plan assets. We evaluate these assumptions at least annually. Other assumptions reflect demographic factors such as retirement, mortality and turnover and are evaluated periodically and updated to reflect our actual experience. Actual results may differ from actuarial assumptions resulting in actuarial gains and losses. For active plans, such actuarial gains and losses will be amortized over the average expected service period of the participants and in the case of inactive plans over the average remaining life expectancy of participants. The discount rate represents the market rate for high-quality fixed income investments and is used to calculate the present value of the expected future cash flows for benefit obligations under our
48
pension plans. A decrease in the discount rate increases the present value of pension benefit obligations. A 25 basis point decrease in the discount rate would increase the present value of pension obligations by approximately $87 million and increase our annual pension expense by approximately $2 million. We consider the relative weighting of plan assets by class, historical performance of asset classes over long-term periods, asset class performance expectations as well as current and future economic conditions in determining the expected long-term return on plan assets. A 25 basis point decrease in the expected long-term return on plan assets would increase our annual pension expense by approximately $5 million.
Liquidity and Capital Resources
A fundamental objective of the Company is to have sufficient liquidity, balance sheet strength, and financial flexibility to fund the operating and capital requirements of its core businesses around the world. The primary source of funds to finance our operations and capital expenditures is cash generated by operations. In addition, we maintain a commercial paper program, have access to a committed revolving credit facility and have access to equity and debt capital from public and private sources. We continue to balance our operating, investing and financing uses of cash through investments and acquisitions in our core businesses, dividends and share repurchases. In addition, we believe our cash position, amounts available under our credit facility, commercial paper program and cash provided by operating activities will be adequate to cover our operational and business needs in the foreseeable future.
As of
September 26, 2014
and
September 27, 2013
, our cash and cash equivalents, short- and long-term debt, and Tyco shareholder's equity are as follows:
|
|
As of
|
||||||
|
($ in millions)
|
September 26, 2014
|
September 27, 2013
|
|||||
|
Cash and cash equivalents
|
$
|
892
|
|
$
|
563
|
|
|
|
Total debt
|
$
|
1,463
|
|
$
|
1,463
|
|
|
|
Shareholders' equity
|
$
|
4,647
|
|
$
|
5,098
|
|
|
|
Total debt as a % of total capital
(1)
|
23.9
|
%
|
22.3
|
%
|
|||
(1)
Total capital represents the aggregate amount of total debt and total shareholders' equity which was $6,110 million and $6,561 million as of
September 26, 2014
and
September 27, 2013
, respectively.
Sources and uses of cash
In summary, our cash flows from operating, investing, and financing from continuing operations for fiscal
2014
,
2013
and
2012
were as follows:
|
|
For the Years Ended
|
||||||||||
|
($ in millions)
|
September 26, 2014
|
September 27, 2013
|
September 28, 2012
|
||||||||
|
Net cash provided by operating activities
|
$
|
831
|
|
$
|
694
|
|
$
|
556
|
|
||
|
Net cash used in investing activities
|
(221
|
)
|
(545
|
)
|
(470
|
)
|
|||||
|
Net cash used in financing activities
|
(261
|
)
|
(419
|
)
|
(475
|
)
|
|||||
Cash flow from operating activities
Cash flow from operating activities can fluctuate significantly from period to period as working capital needs and the timing of payments for items such as restructuring activities, pension funding, income taxes and other items impact reported cash flow.
The net change in working capital reduced operating cash flow by
$53 million
in fiscal
2014
. The significant changes in working capital included a
$93 million
increase
in accounts receivable, a
$98 million
increase
in contracts in progress and a $
91 million
increase
in prepaid expenses and other assets, partially offset by a
$205 million
increase
in accrued expenses and other liabilities and a
$53 million
increase
in accounts payable.
The net change in working capital reduced operating cash flow by
$393 million
in fiscal
2013
. The significant changes in working capital included a
$226 million
decrease
in accrued expenses and other liabilities, a
$75 million
increase
in accounts receivable, a
$36 million
increase
in inventories, a
$32 million
decrease
in deferred revenue and a
$31 million
decrease
in income taxes payable, partially offset by a
$31 million
decrease
in prepaid expenses and other assets.
49
The net change in working capital reduced operating cash flow by $481 million in fiscal
2012
. The significant changes in working capital included a $179 million decrease in income taxes payable, a $121 million increase in accounts receivable, an $81 million decrease in accrued and other liabilities, and a $71 million increase in inventories, partially offset by a $44 million increase in accounts payable.
During fiscal
2014
,
2013
and
2012
, we paid approximately $74 million, $81 million and $89 million, respectively, in cash related to restructuring activities. See Note 4 to our Consolidated Financial Statements for further information regarding our restructuring activities.
In connection with the 2012 Separation, we paid $58 million, $165 million and
$18 million
in separation costs during fiscal
2014
,
2013
and
2012
, respectively.
During fiscal
2014
,
2013
and
2012
, we made environmental remediation payments related to environmental remediation activities for a facility located in Marinette, Wisconsin, of $63 million,
$51 million
and
$10 million
, respectively.
During the years ended
September 26, 2014
,
September 27, 2013
and
September 28, 2012
we made required contributions of $54 million, $50 million and $81 million, respectively, to our U.S. and non-U.S. pension plans. We also made voluntary contributions of nil during the years ended
September 26, 2014
,
September 27, 2013
and
September 28, 2012
to our U.S. plans. The Company anticipates that it will contribute at least the minimum required to its pension plans in 2015 of $13 million for the U.S. plans and $23 million for non-U.S. plans.
Income taxes paid, net of refunds, related to continuing operations were $102 million, $134 million and $129 million in fiscal
2014
,
2013
and
2012
, respectively.
Net interest paid related to continuing operations was $84 million, $80 million and $202 million in fiscal
2014
,
2013
and
2012
, respectively.
Cash flow from investing activities
Cash flows related to investing activities consist primarily of cash used for capital expenditures and acquisitions, proceeds derived from divestitures of businesses and assets and the purchase and sales and maturities of investments.
We made capital expenditures of
$288 million
,
$270 million
and
$295 million
during fiscal
2014
,
2013
and
2012
, respectively. The level of capital expenditures in fiscal year 2015 is expected to exceed the spending levels in fiscal year 2014 and is also expected to exceed depreciation expense.
During
2014
, we paid cash for acquisitions included in continuing operations totaling $65 million, net of $1 million cash acquired, which is related to acquisitions included in our NA Installation & Services and ROW Installation & Services segments. During
2013
, we paid cash for acquisitions included in continuing operations totaling $229 million, net of $9 million cash acquired, which primarily related to the acquisition of Exacq Technologies within our Global Products segment. During
2012
, we paid cash for acquisitions included in continuing operations totaling $217 million, net of cash acquired of $17 million, which primarily related to the acquisition of Visonic Ltd. within our Global Products segment.
During fiscal 2014 and 2013, we received cash proceeds, net of cash divested, of $1 million and $17 million, respectively, for divestitures. During 2012, cash paid related to divestitures was $5 million. See Note 3 to our Consolidated Financial Statements for further information.
We maintain captive insurance companies to manage certain of our insurable liabilities. The captive insurance companies held certain investment accounts for the purposes of providing collateral for our insurable liabilities. During fiscal 2014, the portfolio of investments was liquidated and we now provide letters of credit as collateral.
During fiscal
2014
, we made net purchases of investments of $103 million. This represented the purchase of time deposits of $275 million, and $62 million of trading securities which will serve to partially offset changes in the market value of liabilities for an unfunded non-qualified defined contribution pension plan. These purchases were partially offset by the liquidation of the portfolio of investments held by the captive insurance companies. During fiscal 2013 and 2012, we made purchases of investments of $45 million, and sales of investments of $41 million, respectively. See Note 12 to our Consolidated Financial Statements for further information.
During fiscal
2014
, we also generated $250 million in proceeds from the sale of our equity method investment in Atkore, as described in Note 3 to our Consolidated Financial Statements.
50
Cash flow from financing activities
Cash flows from financing activities relate primarily to proceeds received from incurring debt and issuing stock, and cash used to repay debt, repurchase stock, and make dividend payments to shareholders.
During the fourth quarter of 2012, in connection with the Separation, Tyco and its finance subsidiary, Tyco International Finance S.A. ("TIFSA"), redeemed various debt securities maturing from 2013 to 2023 issued by TIFSA and/or Tyco, in an aggregate principal amount of $2.6 billion. See Note 10 to our Consolidated Financial Statements for further information.
On June 22, 2012, TIFSA, as the Borrower, and the Company as the Guarantor, entered into a Five-Year Senior Unsecured Credit Agreement providing for revolving credit commitments in the aggregate amount of $1.0 billion. As of
September 26, 2014
, there were no amounts drawn under this revolving credit facility.
TIFSA's revolving credit facility contains customary terms and conditions, and financial covenants that limit the ratio of our debt to earnings before interest, taxes, depreciation, and amortization and that limit our ability to incur subsidiary debt or grant liens on our property. Our indentures contain customary covenants including limits on negative pledges, subsidiary debt and sale/leaseback transactions. None of these covenants are considered restrictive to our business.
During 2014, 2013 and 2012, TIFSA issued commercial paper to U.S. institutional accredited investors and qualified institutional buyers. Borrowings under the commercial paper program are available for general corporate purposes. As of
September 26, 2014
and
September 27, 2013
, TIFSA had no commercial paper outstanding. The maximum aggregate amount of unsecured commercial paper notes available to be issued, on a private placement basis, under the commercial paper program is $1 billion as of
September 26, 2014
.
Pursuant to our share repurchase program, we may repurchase Tyco shares from time to time in open market purchases at prevailing market prices, in negotiated transactions off the market, or pursuant to an approved trading plan in accordance with applicable regulations. In January 2013, the Company's Board of Directors approved a $600 million share repurchase program. In March 2014, and September 2014, the Company's Board of Directors authorized an additional $1.75 billion and $1 billion in share repurchases. During the year ended September 26, 2014, we repurchased approximately 42 million common shares for approximately $1.8 billion. During the year ended September 27, 2013, we repurchased approximately 10 million common shares for approximately $300 million. During the year ended September 28, 2012, we repurchased approximately 11 million common shares for approximately $500 million.
On March 5, 2014, our shareholders approved a cash dividend of $0.72 per common share payable to shareholders in four quarterly installments of $0.18 in May 2014, August 2014, November 2014 and February 2015. During fiscal years
2014
,
2013
and
2012
, we paid cash dividends of approximately $311 million, $288 million and $461 million, respectively. See Note 15 to our Consolidated Financial Statements for further information.
During fiscal 2014, we paid $66 million in cash to purchase the remaining ownership interest of a joint venture in Brazil, which is part of the Company's ROW Installation & Services segment.
Management believes that cash generated by or available to us should be sufficient to fund our capital and operational business needs for the foreseeable future, including capital expenditures, quarterly dividend payments, share repurchases, separation-related and other expenses.
Commitments and Contingencies
For a detailed discussion of contingencies related to tax and litigation matters and governmental investigations, see Notes 6 and 13 to our Consolidated Financial Statements.
51
Contractual Obligations
Contractual obligations and commitments for debt, minimum lease payment obligations under non-cancelable operating leases and purchase obligations as of
September 26, 2014
are as follows ($ in millions):
|
|
Fiscal Year
|
|
|
||||||||||||||||||||||||
|
|
2015
|
2016
|
2017
|
2018
|
2019
|
Thereafter
|
Total
|
||||||||||||||||||||
|
Debt principal
(1)
|
$
|
—
|
|
$
|
258
|
|
$
|
—
|
|
$
|
67
|
|
$
|
364
|
|
$
|
746
|
|
$
|
1,435
|
|
||||||
|
Interest payments
(2)
|
93
|
|
88
|
|
84
|
|
83
|
|
66
|
|
63
|
|
477
|
|
|||||||||||||
|
Operating leases
|
185
|
|
163
|
|
122
|
|
81
|
|
44
|
|
82
|
|
677
|
|
|||||||||||||
|
Purchase obligations
(3)
|
375
|
|
66
|
|
28
|
|
1
|
|
1
|
|
—
|
|
471
|
|
|||||||||||||
|
Total contractual cash obligations
(4)
|
$
|
653
|
|
$
|
575
|
|
$
|
234
|
|
$
|
232
|
|
$
|
475
|
|
$
|
891
|
|
$
|
3,060
|
|
||||||
_______________________________________________________________________________
|
(1)
|
Debt principal consists of the aggregate principal amount of our public debt outstanding, excluding debt discount, swap activity and interest.
|
|
(2)
|
Interest payments consist of interest on our fixed interest rate debt.
|
|
(3)
|
Purchase obligations consist of commitments for purchases of goods and services.
|
|
(4)
|
Other long-term liabilities excluded from the above contractual obligation table primarily consist of the following: pension and postretirement costs (see Note 14 to the Consolidated Financial Statements), income taxes (see Note 6 to the Consolidated Financial Statements), contingent consideration (see Note 5 to the Consolidated Financial Statements), warranties (see Note 11 to the Consolidated Financial Statements) and environmental liabilities (see Note 13 to the Consolidated Financial Statements). We are unable to estimate the timing of payment for these items due to the inherent uncertainties related to these obligations. However, the minimum required contributions to our pension plans are expected to be approximately $36 million in 2015 and we do not expect to make any material contributions in 2015 related to other postretirement benefit plans.
|
As of
September 26, 2014
, we recorded gross unrecognized tax benefits of $267 million and gross interest and penalties of $36 million. We are unable to make a reasonably reliable estimate of the timing for the remaining payments in future years; therefore, such amounts have been excluded from the above contractual obligation table. However, based on the current status of our income tax audits, we believe that it is reasonably possible that between nil and $20 million in unrecognized tax benefits may be resolved in the next twelve months. Although the Company had unrecognized tax benefits that, if recognized, would affect the effective tax rate, the Company had net operating loss carryforwards which would offset the cash impact of any such recognition of unrecognized tax benefits relating to the current year.
In the normal course of business, we are liable for contract completion and product performance. In the opinion of management, such obligations will not significantly affect our financial position, results of operations or cash flows.
In connection with the 2012 Separation we entered into a liability sharing agreement regarding certain actions that were pending against Tyco prior to the 2012 Separation. Under the 2012 Tax Sharing Agreement, Pentair, Tyco and ADT share (i) certain pre-Distribution income tax liabilities that arise from adjustments made by tax authorities to Tyco Flow Control's, Tyco's and ADT's U.S. income tax returns, and (ii) payments required to be made by Tyco with respect to the 2007 Tax Sharing Agreement, excluding approximately $175 million of pre-2012 Separation related tax liabilities that were anticipated to be paid prior to the 2012 Separation (collectively, "Shared Tax Liabilities"). The Company will be responsible for the first $500 million of Shared Tax Liabilities. Pentair and ADT will share 42% and 58%, respectively, of the next $225 million of Shared Tax Liabilities. Pentair, ADT and Tyco will share 20%, 27.5% and 52.5%, respectively, of Shared Tax Liabilities above $725 million. The Company expects to pay $21 million to settle certain pre-2012 Separation related tax liabilities. The timing and amounts of these payments are subject to a number of uncertainties and could change. See Notes 13 and 6, respectively, to the Consolidated Financial Statements.
In connection with the 2007 Separation, we entered into a liability sharing agreement regarding certain actions that were pending against Tyco prior to the 2007 Separation. Under the 2007 Separation and Distribution Agreement and 2007 Tax Sharing Agreement, we have assumed 27%, Covidien has assumed 42% and TE Connectivity has assumed 31% of certain Tyco pre-Separation contingent and other corporate liabilities, which, as of
September 26, 2014
, primarily relate to tax contingencies and potential actions with respect to the spin-offs or the distributions made or brought by any third party.
52
Backlog
We had a backlog of unfilled orders of $4,862 million and $4,812 million as of
September 26, 2014
and
September 27, 2013
, respectively.
The Company's backlog includes recurring revenue-in-force and long-term deferred revenue for upfront fees from its NA and ROW Installation & Services segments. Revenue-in-force represents 12 months' revenue associated with monitoring and maintenance services under contract in the security and fire business. Backlog by segment was as follows ($ in millions):
|
NA Installation
& Services
|
ROW
Installation
& Services
|
Global
Products
|
Total
|
||||||||||||
|
As of September 27, 2013
|
|
|
|
|
|||||||||||
|
Backlog
|
$
|
908
|
|
$
|
939
|
|
$
|
196
|
|
$
|
2,043
|
|
|||
|
Recurring Revenue in Force
|
1,239
|
|
1,194
|
|
—
|
|
2,433
|
|
|||||||
|
Deferred Revenue
|
296
|
|
40
|
|
—
|
|
336
|
|
|||||||
|
Total Backlog
|
$
|
2,443
|
|
$
|
2,173
|
|
$
|
196
|
|
$
|
4,812
|
|
|||
|
As of September 26, 2014
|
|||||||||||||||
|
Backlog
|
$
|
992
|
|
$
|
999
|
|
$
|
181
|
|
$
|
2,172
|
|
|||
|
Recurring Revenue in Force
|
1,243
|
|
1,143
|
|
—
|
|
2,386
|
|
|||||||
|
Deferred Revenue
|
266
|
|
38
|
|
—
|
|
304
|
|
|||||||
|
Total Backlog
|
$
|
2,501
|
|
$
|
2,180
|
|
$
|
181
|
|
$
|
4,862
|
|
|||
Backlog increased $50 million, or 1.0%, to $4,862 million as of
September 26, 2014
as compared to $4,812 million in the prior year. The net increase in backlog as of
September 26, 2014
was primarily due to a $58 million increase in total backlog in our NA Installation & Services segment relating to our fire business. This increase was partially offset by a decline in recurring revenue in force and deferred revenue in our security business. The $7 million increase in our ROW Installation & Services segment total backlog was driven by an increase in Growth Markets and Asia, which was further improved by the Westfire and other acquisitions. Total backlog for our Global Products segment declined by $15 million due to our fire products and life safety businesses, which was partially offset by growth in our security business. Changes in foreign currency had an unfavorable impact on backlog of $128 million, or 2.7%, and primarily related to the ROW Installation & Services segment.
Guarantees
Certain of our business segments have guaranteed the performance of third-parties and provided financial guarantees for uncompleted work and financial commitments. The terms of these guarantees vary with end dates ranging from fiscal year 2015 through the completion of such transactions and would typically be triggered in the event of nonperformance. The Company's performance under the guarantees, if required, would not have a material effect on our financial position, results of operations or cash flows.
There are certain guarantees or indemnifications extended among Tyco, Covidien, TE Connectivity, ADT and Pentair in accordance with the terms of the 2007 and 2012 Separation and Distribution Agreements and the Tax Sharing Agreements. The guarantees primarily relate to certain contingent tax liabilities included in the Tax Sharing Agreements. At the time of the 2007 and 2012 Separations, we recorded liabilities necessary to recognize the fair value of such guarantees and indemnifications. See Note 6 to the Consolidated Financial Statements for further discussion of the Tax Sharing Agreements. In addition, prior to the 2007 and 2012 Separations we provided support in the form of financial and/or performance guarantees to various Covidien, TE Connectivity, ADT and Tyco Flow Control operating entities. To the extent these guarantees were not assigned in connection with the 2007 and 2012 Separations, we assumed primary liability on any remaining such support. See Note 11 to the Consolidated Financial Statements for a discussion of these liabilities.
In disposing of assets or businesses, we often provide representations, warranties and/or indemnities to cover various risks including, for example, unknown damage to the assets, environmental risks involved in the sale of real estate, liability to investigate and remediate environmental contamination at waste disposal sites and manufacturing facilities, and unidentified tax liabilities and legal fees related to periods prior to disposition. We have no reason to believe that these uncertainties would have a material adverse effect on our financial position, results of operations or cash flows. We have recorded liabilities for known indemnifications included as part of environmental liabilities.
53
In the normal course of business, we are liable for contract completion and product performance. We record estimated product warranty costs at the time of sale. In the opinion of management, such obligations will not significantly affect our financial position, results of operations or cash flows.
During the year ended
September 26, 2014
, Tyco replaced available for sale investments held as collateral for the Company's insurable liabilities with letters of credit of approximately $137 million. As of
September 26, 2014
and September 27, 2013, we had total outstanding letters of credit and bank guarantees of approximately $662 million and $424 million, respectively.
For a detailed discussion of guarantees and indemnifications, see Note 11 to the Consolidated Financial Statements.
Accounting Pronouncements
See Note 1 to the Consolidated Financial Statements for Recently Adopted Accounting Pronouncements and Recently Issued Accounting Pronouncements.
Non-U.S. GAAP Measure
In an effort to provide investors with additional information regarding our results as determined by U.S. GAAP, we also disclose the non-U.S. GAAP measure of organic revenue growth (decline). We believe that this measure is useful to investors in evaluating our operating performance for the periods presented. When read in conjunction with our U.S. GAAP revenue, it enables investors to better evaluate our operations without giving effect to fluctuations in foreign exchange rates and acquisition and divestiture activity, either of which may be significant from period to period. In addition, organic revenue growth (decline) is a factor we use in internal evaluations of the overall performance of our business. This measure is not a financial measure under U.S. GAAP and should not be considered as a substitute for revenue as determined in accordance with U.S. GAAP, and it may not be comparable to similarly titled measures reported by other companies. Organic revenue growth (decline) presented herein is defined as revenue growth (decline) excluding the effects of foreign currency fluctuations, acquisitions and divestitures and other changes that may not reflect underlying results and trends. Our organic growth (decline) calculations incorporate an estimate of prior year reported net revenue associated with acquired entities that have been fully integrated within the first year, and exclude prior year net revenue associated with entities that do not meet the criteria for discontinued operations which have been divested within the past year ("adjusted number"). We calculate the rate of organic growth (decline) based on the adjusted number to better reflect the rate of growth (decline) of the combined business, in the case of acquisitions, or the remaining business, in the case of dispositions. We base the rate of organic growth (decline) for acquired businesses that are not fully integrated within the first year upon unadjusted historical net revenue. Foreign currency fluctuations are calculated by subtracting (i) the U.S. dollar equivalent of local currencies for the current period using monthly weighted average exchange rates for the prior period from (ii) the U.S. dollar equivalent of local currencies for the current period using monthly weighted average exchange rates for the current period. We may use organic revenue growth (decline) as a component of our compensation programs.
The table below details the components of organic revenue growth and reconciles the non-U.S. GAAP measure to U.S. GAAP net revenue growth.
Fiscal
2014
|
Net
Revenue
for
Fiscal 2013
|
Base Year
Adjustments
(Divestitures)
|
Adjusted
Fiscal 2013
Base Revenue
|
Foreign
Currency
|
Acquisitions
|
Organic
Revenue
|
Organic Growth
Percentage
(1)
|
Net
Revenue
for
Fiscal 2014
|
|||||||||||||||||||||||
|
|
($ in millions)
|
|||||||||||||||||||||||||||||
|
NA Installation & Services
|
$
|
3,891
|
|
$
|
(42
|
)
|
$
|
3,849
|
|
$
|
(29
|
)
|
$
|
19
|
|
$
|
37
|
|
1.0
|
%
|
$
|
3,876
|
|
|||||||
|
ROW Installation & Services
|
3,843
|
|
(67
|
)
|
3,776
|
|
(46
|
)
|
119
|
|
71
|
|
1.9
|
%
|
3,920
|
|
||||||||||||||
|
Global Products
|
2,339
|
|
2
|
|
2,341
|
|
(7
|
)
|
63
|
|
147
|
|
6.3
|
%
|
2,544
|
|
||||||||||||||
|
Total Net Revenue
|
$
|
10,073
|
|
$
|
(107
|
)
|
$
|
9,966
|
|
$
|
(82
|
)
|
$
|
201
|
|
$
|
255
|
|
2.6
|
%
|
$
|
10,340
|
|
|||||||
_______________________________________________________________________________
|
(1)
|
Organic revenue growth percentage based on adjusted fiscal 2013 base revenue.
|
54
Fiscal
2013
|
Net
Revenue
for
Fiscal 2012
|
Base Year
Adjustments
(Divestitures)
|
Adjusted
Fiscal 2012
Base Revenue
|
Foreign
Currency
|
Acquisitions
|
Other
(2)
|
Organic
Revenue
|
Organic
Growth (Decline)
Percentage
(1)
|
Net
Revenue
for
Fiscal 2013
|
||||||||||||||||||||||||||
|
|
($ in millions)
|
|||||||||||||||||||||||||||||||||
|
NA Installation & Services
|
$
|
3,962
|
|
$
|
(30
|
)
|
$
|
3,932
|
|
$
|
(3
|
)
|
$
|
7
|
|
$
|
—
|
|
$
|
(45
|
)
|
(1.1
|
)%
|
$
|
3,891
|
|
||||||||
|
ROW Installation & Services
|
3,830
|
|
(10
|
)
|
3,820
|
|
(64
|
)
|
93
|
|
—
|
|
(6
|
)
|
(0.2
|
)%
|
3,843
|
|
||||||||||||||||
|
Global Products
|
2,100
|
|
2
|
|
2,102
|
|
(3
|
)
|
68
|
|
39
|
|
133
|
|
6.3
|
%
|
2,339
|
|
||||||||||||||||
|
Total Net Revenue
|
$
|
9,892
|
|
$
|
(38
|
)
|
$
|
9,854
|
|
$
|
(70
|
)
|
$
|
168
|
|
$
|
39
|
|
$
|
82
|
|
0.8
|
%
|
$
|
10,073
|
|
||||||||
_______________________________________________________________________________
|
(1)
|
Organic revenue growth percentage based on adjusted fiscal 2012 base revenue.
|
|
(2)
|
Amount represents contractual revenue from ADT under the 2012 Separation and Distribution Agreement which is excluded from the organic revenue calculation
|
Forward-Looking Information
Certain statements in this report are "forward-looking statements" within the meaning of the U.S. Private Securities Litigation Reform Act of 1995. All forward-looking statements involve risks and uncertainties. In many cases forward-looking statements are identified by words, and variations of words, such as “anticipate,” “estimate,” “believe,” “commit,” “continue,” “could,” “intend,” “may,” “plan,” “potential,” “predict,” “positioned,” “should,” “will,” “expect,” “objective,” “projection,” “forecast,” “goal,” “guidance,” “outlook,” “effort,” “target” and other similar words. However, the absence of these words does not mean that the statements are not forward-looking. Any forward-looking statement contained herein, in press releases, written statements or other documents filed with the SEC, or in Tyco's communications and discussions with investors and analysts in the normal course of business through meetings, webcasts, phone calls and conference calls, regarding expectations with respect to future events, including sales, earnings, cash flows, operating and tax efficiencies, product expansion, backlog, the consummation and benefits of acquisitions and divestitures, as well as financings and repurchases of debt or equity securities, are subject to known and unknown risks, uncertainties and contingencies. Many of these risks, uncertainties and contingencies are beyond our control, and may cause actual results, performance or achievements to differ materially from anticipated results, performances or achievements. Factors that might affect such forward-looking statements include, among other things:
|
•
|
overall economic and business conditions, and overall demand for Tyco's goods and services;
|
|
•
|
economic and competitive conditions in the industries, end markets and regions served by our businesses;
|
|
•
|
changes in legal and tax requirements (including tax rate changes, new tax laws or treaties and revised tax law interpretations);
|
|
•
|
our, and our employees' and agents' ability to comply with complex and continually changing laws and regulations that govern our international operations, including the U.S. Foreign Corrupt Practices Act, similar anti-bribery laws in other jurisdictions, a variety of export control, customs, currency exchange control and transfer pricing regulations, and our corporate policies governing these matters;
|
|
•
|
the outcome of litigation, arbitrations and governmental proceedings;
|
|
•
|
effect of income tax audits, litigation, settlements and appeals;
|
|
•
|
our ability to repay or refinance our outstanding indebtedness as it matures;
|
|
•
|
our ability to operate within the limitations imposed by financing arrangements and to maintain our credit ratings;
|
|
•
|
interest rate fluctuations and other changes in borrowing costs, or other consequences of volatility in the capital or credit markets;
|
|
•
|
other capital market conditions, including availability of funding sources and currency exchange rate fluctuations;
|
|
•
|
availability of and fluctuations in the prices of key raw materials;
|
|
•
|
changes affecting customers or suppliers;
|
|
•
|
economic and political conditions in international markets, including governmental changes and restrictions on the ability to transfer capital across borders;
|
|
•
|
our ability to achieve anticipated cost savings;
|
|
•
|
our ability to execute our portfolio refinement and acquisition strategies, including successfully integrating acquired operations;
|
55
|
•
|
potential impairment of our goodwill, intangibles and/or our long-lived assets;
|
|
•
|
our ability to realize the intended benefits of the 2012 Separation, including the integration of our commercial security and fire protection businesses;
|
|
•
|
other risks associated with the 2012 Separation, for example the risk that we may be liable for certain contingent liabilities of the spun-off entities if they were to become insolvent;
|
|
•
|
risks associated with our jurisdiction of incorporation, including the possibility of reduced flexibility with respect to certain aspects of capital management and corporate governance, increased or different regulatory burdens, and the possibility that we may not realize anticipated tax benefits;
|
|
•
|
the possible effects on Tyco of future legislation in the United States that may limit or eliminate potential U.S. tax benefits resulting from Tyco International's incorporation outside of the U.S. or deny U.S. government contracts to Tyco based upon its jurisdiction of incorporation;
|
|
•
|
risks associated with the proposed change in our global headquarters to Ireland; and
|
|
•
|
natural events such as severe weather, fires, floods and earthquakes, or acts of terrorism or cyber-attacks.
|
In the normal course of conducting business, we are exposed to certain risks associated with potential changes in market conditions. These risks include fluctuations in foreign currency exchange rates, interest rates and commodity prices. Accordingly, we have established a comprehensive risk management process to monitor, evaluate and manage the principal exposures to which we believe we are subject. We seek to manage these risks through the use of financial derivative instruments. Our portfolio of derivative financial instruments may, from time to time, include forward foreign currency exchange contracts, foreign currency options, interest rate swaps, commodity swaps and forward commodity contracts. Derivative financial instruments related to interest rate sensitivity of debt obligations, intercompany cross border transactions and anticipated non-functional currency cash flows are used with the goal of mitigating a significant portion of these exposures when it is cost effective to do so.
We do not execute transactions or utilize derivative financial instruments for trading or speculative purposes. Further, to reduce the risk that a counterparty will be unable to honor its contractual obligations to us, we only enter into contracts with counterparties having strong investment grade long-term credit ratings from Standard & Poor's and Moody's. These counterparties are generally financial institutions and there is no significant concentration of exposure with any one party.
Foreign Currency Exposures
We hedge our exposure to fluctuations in foreign currency exchange rates related to operating entities through the use of forward foreign currency exchange contracts. Additionally, for our corporate financing entities we manage the foreign currency exposure through a combination of multi-currency notional pool and forward contracts. Our largest exposure to foreign exchange rates exists primarily with the British pound, Euro, Australian dollar and Canadian dollar against the U.S. dollar. The market risk related to the forward foreign currency exchange contract is measured by estimating the potential impact of a 10% change in the value of the U.S. dollar relative to the local currency exchange rates. The rates used to perform this analysis were based on the market rates in effect on
September 26, 2014
. A 10% appreciation of the U.S. dollar relative to the local currency exchange rates would result in a $3 million net increase in the fair value of the contracts. Conversely, a 10% depreciation of the U.S. dollar relative to the local currency exchange rates would result in a $3 million net decrease in the fair value of the contracts. However, gains or losses on these derivative instruments are economically offset by the gains or losses on the underlying transactions.
As of
September 26, 2014
and
September 27, 2013
, respectively, $1.5 billion and $1.4 billion of intercompany loans have been designated as permanent in nature. For the fiscal years ended
September 26, 2014
,
September 27, 2013
and
September 28, 2012
, we recorded a cumulative translation loss of $28 million, a gain of $3 million and a gain of $48 million, respectively, through accumulated other comprehensive loss related to these loans.
Interest Rate Exposures
We manage interest rate risk typically by using, from time to time, interest rate swap transactions with financial institutions acting as principal counterparties, which are designated as fair value hedges for accounting purposes. These swap transactions typically convert interest rates of fixed-rate debt to variable rates. Since September 28, 2012, TIFSA has had no outstanding interest rate swaps. Accordingly, as of
September 26, 2014
and
September 27, 2013
, the total gross notional amount of our interest rate swap contracts was nil for both periods.
56
The following consolidated financial statements and schedule specified by this Item, together with the report thereon of Deloitte & Touche LLP, are presented following Item 15 of this report:
Financial Statements:
|
Management's Responsibility for Financial Statements
|
|
Reports of Independent Registered Public Accounting Firm
|
|
Consolidated Statements of Operations for the years ended September 26, 2014, September, 27, 2013 and September 28, 2012
|
|
Consolidated Statements of Comprehensive Income for the years ended September, 26, 2014, September 27, 2013 and September 28, 2012
|
|
Consolidated Balance Sheets as of the years ended September 26, 2014 and September 27, 2013
|
|
Consolidated Statements of Shareholders' Equity for the years ended September 26, 2014, September 27, 2013 and September 28, 2012
|
|
Consolidated Statements of Cash Flows for the years ended September 26, 2014, September 27, 2013 and September 28, 2012
|
|
Notes to Consolidated Financial Statements
|
Supplementary Financial Information
Selected Quarterly Financial Data
Financial Statement Schedule:
Schedule II—Valuation and Qualifying Accounts
All other financial statements and schedules have been omitted since the information required to be submitted has been included in the Consolidated Financial Statements and related Notes or because they are either not applicable or not required under the rules of Regulation S-X.
None.
Conclusion Regarding the Effectiveness of Disclosure Controls and Procedures
We maintain disclosure controls and procedures that are designed to provide reasonable assurance that information required to be disclosed in our Exchange Act reports is recorded, processed, summarized and reported within the time periods specified in the SEC's rules and forms, and that such information is accumulated and communicated to our management, including our Chief Executive Officer and Chief Financial Officer, as appropriate, to allow timely decisions regarding required disclosure.
Under the supervision and with the participation of our management, including our Chief Executive Officer and our Chief Financial Officer, we conducted an evaluation of the effectiveness of our disclosure controls and procedures, as defined under Exchange Act Rule 13a-15(e). Based on this evaluation, our Chief Executive Officer and our Chief Financial Officer concluded that, as of
September 26, 2014
, our disclosure controls and procedures were effective to provide reasonable assurance that information required to be disclosed in our Exchange Act reports is recorded, processed, summarized and reported as and when required.
There were no changes in our internal controls over financial reporting that occurred during the quarter ended
September 26, 2014
that have materially affected, or are reasonably likely to materially affect, these internal controls.
57
Management's Report on Internal Control over Financial Reporting
Our management is responsible for establishing and maintaining adequate internal control over financial reporting, as defined under Exchange Act Rules 13a-15(f) and 15d-15(f). Our internal control over financial reporting is a process designed to provide reasonable assurance regarding the reliability of financial reporting and the preparation of financial statements for external purposes in accordance with accounting principles generally accepted in the United States of America. Internal control over financial reporting includes those policies and procedures that (1) pertain to the maintenance of records that, in reasonable detail, accurately and fairly reflect the transactions and dispositions of the Company's assets, (2) provide reasonable assurance that transactions are recorded as necessary to permit preparation of financial statements in accordance with generally accepted accounting principles, and that the Company's receipts and expenditures are being made only in accordance with authorizations of the Company's management and directors and (3) provide reasonable assurance regarding prevention or timely detection of unauthorized acquisition, use, or disposition of the Company's assets that could have a material effect on the financial statements.
Because of its inherent limitations, internal control over financial reporting may not prevent or detect misstatements. Also, projections of any evaluation of effectiveness to future periods are subject to the risk that controls may become inadequate because of changes in conditions, or that the degree of compliance with the policies or procedures may deteriorate.
Management assessed the effectiveness of our internal control over financial reporting as of
September 26, 2014
. In making this assessment, management used the criteria set forth by the Committee of Sponsoring Organizations of the Treadway Commission (COSO) in its framework,
Internal Control—Integrated Framework (1992)
. Management's assessment included an evaluation of the design of the Company's internal control over financial reporting and testing of the operational effectiveness of its internal control over financial reporting. Management reviewed the results of its assessment with the Audit Committee of our Board of Directors. Based on our assessment and those criteria, management believes that the Company maintained effective internal controls over financial reporting as of
September 26, 2014
.
Our internal control over financial reporting as of
September 26, 2014
, has been audited by Deloitte & Touche LLP, the independent registered public accounting firm that audited and reported on the Consolidated Financial Statements included in this Form 10-K, and their report is also included in this Form 10-K.
58
REPORT OF INDEPENDENT REGISTERED PUBLIC ACCOUNTING FIRM
To the Board of Directors and Shareholders of
Tyco International Ltd.:
We have audited the internal control over financial reporting of Tyco International Ltd. and subsidiaries (the "Company") as of September 26, 2014, based on criteria established in
Internal Control - Integrated Framework (1992)
issued by the Committee of Sponsoring Organizations of the Treadway Commission. The Company's management is responsible for maintaining effective internal control over financial reporting and for its assessment of the effectiveness of internal control over financial reporting, included in the accompanying Management’s Report on Internal Control over Financial Reporting. Our responsibility is to express an opinion on the Company's internal control over financial reporting based on our audit.
We conducted our audit in accordance with the standards of the Public Company Accounting Oversight Board (United States). Those standards require that we plan and perform the audit to obtain reasonable assurance about whether effective internal control over financial reporting was maintained in all material respects. Our audit included obtaining an understanding of internal control over financial reporting, assessing the risk that a material weakness exists, testing and evaluating the design and operating effectiveness of internal control based on the assessed risk, and performing such other procedures as we considered necessary in the circumstances. We believe that our audit provides a reasonable basis for our opinion.
A company's internal control over financial reporting is a process designed by, or under the supervision of, the company's principal executive and principal financial officers, or persons performing similar functions, and effected by the company's board of directors, management, and other personnel to provide reasonable assurance regarding the reliability of financial reporting and the preparation of financial statements for external purposes in accordance with generally accepted accounting principles. A company's internal control over financial reporting includes those policies and procedures that (1) pertain to the maintenance of records that, in reasonable detail, accurately and fairly reflect the transactions and dispositions of the assets of the company; (2) provide reasonable assurance that transactions are recorded as necessary to permit preparation of financial statements in accordance with generally accepted accounting principles, and that receipts and expenditures of the company are being made only in accordance with authorizations of management and directors of the company; and (3) provide reasonable assurance regarding prevention or timely detection of unauthorized acquisition, use, or disposition of the company's assets that could have a material effect on the financial statements.
Because of the inherent limitations of internal control over financial reporting, including the possibility of collusion or improper management override of controls, material misstatements due to error or fraud may not be prevented or detected on a timely basis. Also, projections of any evaluation of the effectiveness of the internal control over financial reporting to future periods are subject to the risk that the controls may become inadequate because of changes in conditions, or that the degree of compliance with the policies or procedures may deteriorate.
In our opinion, the Company maintained, in all material respects, effective internal control over financial reporting as of September 26, 2014, based on the criteria established in
Internal Control - Integrated Framework (1992)
issued by the Committee of Sponsoring Organizations of the Treadway Commission.
We have also audited, in accordance with the standards of the Public Company Accounting Oversight Board (United States), the consolidated financial statements and financial statement schedule as of and for the fiscal year ended September 26, 2014 of the Company and our report dated November 13, 2014 expressed an unqualified opinion on those financial statements and financial statement schedule.
/s/ DELOITTE & TOUCHE LLP
New York, New York
November 13, 2014
59
None.
Information concerning Directors and Executive Officers may be found under the proposal regarding the election of directors and under the captions "—Committees of the Board of Directors," and "—Executive Officers" in our definitive proxy statement for our
2015
Annual General Meeting of Shareholders (the "
2015
Proxy Statement"), which will be filed with the Commission within 120 days after the close of our fiscal year. Such information is incorporated herein by reference. The information in the
2015
Proxy Statement set forth under the caption "Section 16(a) Beneficial Ownership Reporting Compliance" is incorporated herein by reference. Information regarding shareholder communications with our Board of Directors may be found under the caption "Governance of the Company" in our
2015
Proxy Statement and is incorporated herein by reference.
Code of Ethics
We have adopted the Tyco Guide to Ethical Conduct, which applies to all employees, officers and directors of Tyco. Our Guide to Ethical Conduct meets the requirements of a "code of ethics" as defined by Item 406 of Regulation S-K and applies to our Chief Executive Officer, Chief Financial Officer and Chief Accounting Officer, as well as all other employees. Our Guide to Ethical Conduct also meets the requirements of a code of business conduct and ethics under the listing standards of the New York Stock Exchange. Our Guide to Ethical Conduct is posted on our website at
www.tyco.com
under the heading "About—Corporate Social Responsibility." We will also provide a copy of our Guide to Ethical Conduct to shareholders upon request. We disclose any amendments to our Guide to Ethical Conduct, as well as any waivers for executive officers or directors, on our website.
Information concerning executive compensation may be found under the captions "Executive Officer Compensation," "Compensation of Non-Employee Directors," and "Governance of the Company" of our
2015
Proxy Statement. Such information is incorporated herein by reference.
The information in our 2015 Proxy Statement set forth under the captions "Executive Officer Compensation" and "Security Ownership of Certain Beneficial Owners and Management" is incorporated herein by reference.
The information in our
2015
Proxy Statement set forth under the captions "Governance of the Company" and "Committees of the Board" is incorporated herein by reference.
The information in our
2015
Proxy Statement set forth under the proposal related to the election of auditors is incorporated herein by reference.
60
|
(a)
|
(1) and (2) Financial Statements and Supplementary Data—See Item 8.
|
|
(b)
|
Exhibit Index:
|
|
Exhibit
Number
|
|
|
|
2.1
|
|
Separation and Distribution Agreement by and among Tyco International Ltd., Covidien Ltd., and Tyco Electronics Ltd., dated as of June 29, 2007 (Incorporated by reference to Exhibit 2.1 to Tyco International Ltd.'s Current Report on Form 8-K filed on July 6, 2007).
|
|
2.2
|
|
Amended and Restated Separation and Distribution Agreement, dated September 27, 2012 among Tyco International Ltd., Pentair Ltd. and The ADT Corporation (Incorporated by reference to Exhibit 2.1 to Tyco International Ltd.'s current Report on Form 8-K filed on October 1, 2012).
|
|
2.3
|
|
Separation and Distribution Agreement, dated September 26, 2012 among Tyco International Ltd., Tyco International Finance S.A., The ADT Corporation and ADT LLC (Incorporated by reference to Exhibit 2.2 to Tyco International Ltd.'s Current Report on Form 8-K filed on October 1, 2012).
|
|
2.4
|
|
Merger Agreement, dated as of March 30, 2014, between Tyco International Ltd., and Tyco International plc (Incorporated by reference to Exhibit 2.1 to Tyco International Ltd.'s Current Report on Form 8-K filed on June 4, 2014).
|
|
3.1
|
|
Articles of Association of Tyco International Ltd. (Tyco International AG) (Tyco International SA) (Incorporated by reference to Exhibit 3.1 to Tyco International Ltd.'s Current Report on Form 8-K filed on May 17, 2013).
|
|
3.2
|
|
Organizational Regulations (Incorporated by reference to Exhibit 3.2 of Tyco International Ltd.'s Current Report on Form 8-K filed on March 17, 2009).
|
|
4.1
|
|
Form of Indenture, dated as of June 9, 1998, among Tyco International Group S.A., Tyco and Wilmington Trust Company as successor to The Bank of New York, as trustee (Incorporated by reference to Exhibit 4.1 to Post-effective Amendment No.1 to Tyco's and Tyco International Group S.A.'s Co-Registration Statement on Form S-3 (No. 333-50855) filed on June 9, 1998).
|
|
4.2
|
|
Supplemental Indenture 2008-2 by and among Tyco International Ltd., Tyco International Finance S.A. and Wilmington Trust Company, as trustee, dated as of May 15, 2008 relating to the co-obligor's 6.875% Notes due 2021 (Incorporated by reference to Exhibit 4.3 to Tyco International Ltd.'s Current Report on Form 8-K filed on June 5, 2008).
|
|
4.3
|
|
Supplemental Indenture 2008-3 by and among Tyco International Ltd., Tyco International Finance S.A. and Wilmington Trust Company, as trustee, dated as of May 15, 2008 relating to the co-obligor's 7.0% Notes due 2019 (Incorporated by reference to Exhibit 4.4 to Tyco International Ltd.'s Current Report on Form 8-K filed on June 5, 2008).
|
61
|
Exhibit
Number
|
|
|
|
4.4
|
|
Indenture, dated as of January 9, 2009, by and among Tyco International Finance S.A., as issuer, Tyco International Ltd., as guarantor, and Deutsche Bank Trust Company Americas, as trustee (Incorporated by reference to Exhibit 4.1 to Tyco International Ltd.'s Current Report on Form 8-K filed on January 9, 2009).
|
|
4.5
|
|
Supplemental Indenture, dated as of January 9, 2009, by and among Tyco International Finance S.A., as issuer, Tyco International Ltd., as guarantor, and Deutsche Bank Trust Company Americas, as trustee relating to the issuer's 8.5% notes due 2019 (Incorporated by reference to Exhibit 4.1 to Tyco International Ltd.'s Current Report on Form 8-K filed on January 9, 2009).
|
|
4.6
|
|
Third Supplemental Indenture, dated as of May 5, 2010, by and among Tyco International Finance S.A., as issuer, Tyco International Ltd., as guarantor, and Deutsche Bank Trust Company Americas, as trustee relating to the issuer's 3.375% notes due 2015 (Incorporated by reference to Exhibit 4.1 to Tyco International Ltd.'s Current Report on Form 8-K filed on May 5, 2010).
|
|
4.7
|
|
Fourth Supplemental Indenture, dated as of January 12, 2011, by and among Tyco International Finance S.A., as issuer, Tyco International Ltd., as guarantor, and Deutsche Bank Trust Company Americas, as trustee relating to the issuer's 3.75% notes due 2018 (Incorporated by reference to Exhibit 4.1 to Tyco International Ltd.'s Current Report on Form 8-K filed on January 12, 2011).
|
|
4.8
|
|
Fifth Supplemental Indenture, dated as of January 12, 2011, by and among Tyco International Finance S.A., as issuer, Tyco International Ltd., as guarantor, and Deutsche Bank Trust Company Americas, as trustee relating to the issuer's 4.625% notes due 2023 (Incorporated by reference to Exhibit 4.2 to Tyco International Ltd.'s Current Report on Form 8-K filed on January 12, 2011).
|
|
10.1
|
|
Tyco International Ltd. 2004 Stock and Incentive Plan amended and restated effective January 1, 2009 (Incorporated by reference to Appendix A to Tyco International Ltd.'s Definitive Proxy Statement on Schedule 14A for the Annual General Meeting of Shareholders on March 12, 2009 filed on January 16, 2009).
(1)
|
|
10.2
|
|
Tyco International Ltd. 2012 Stock and Incentive Plan (Incorporated by reference to Exhibit 10.4 to Tyco International Ltd.'s Current Report on Form 8-K filed on October 1, 2012).
(1)
|
|
10.3
|
|
Change in Control Severance Plan for Certain U.S. Officers and Executives, amended and restated as of October 1, 2012 (Incorporated by reference to Exhibit 10.3 to Tyco International Ltd.'s Annual Report on Form 10-K for the year ended September 28, 2012 filed on November 16, 2012).
(1)
|
|
10.4
|
|
Tyco International (US) Inc. Severance Plan for U.S. Officers and Executives Plan, amended and restated as of October 1, 2012 (Incorporated by reference to Exhibit 10.4 to Tyco International Ltd.'s Annual Report on Form 10-K for the year ended September 28, 2012 filed on November 16, 2012).
(1)
|
|
10.5
|
|
Employment Offer Letter dated April 2, 2012 between Tyco International Ltd. and George R. Oliver (Incorporated by reference to Exhibit 10.5 to Tyco International Ltd.'s Annual Report on Form 10-K for the year ended September 28, 2012 filed on November 16, 2012).
(1)
|
|
10.6
|
|
Employment Offer Letter dated May 3, 2012 between Tyco International Ltd. and Arun Nayar (Incorporated by reference to Exhibit 10.1 to Tyco International Ltd.'s Current Report on Form 8-K filed on May 8, 2012).
(1)
|
|
10.7
|
|
Tyco Supplemental Savings and Retirement Plan, amended and restated effective January 1, 2005 (Incorporated by reference to Exhibit 10.27 to Tyco International Ltd.'s Annual Report on Form 10-K for the year ended September 30, 2005 filed on December 9, 2005).
(1)
|
62
|
Exhibit
Number
|
|
|
|
10.8
|
|
Agreement and General Release dated September 28, 2012 between Tyco International Ltd. and Edward D. Breen (Incorporated by reference to Exhibit 10.4 to Tyco International Ltd.'s Annual Report on Form 10-K for the year ended September 28, 2012 filed on November 16, 2012).
(1)
|
|
10.9
|
|
Form of terms and conditions for Option Awards, Restricted Unit Awards, Performance Share Awards under the 2012 Stock and Incentive Plan for fiscal 2015 (filed herewith).
(1)
|
|
10.10
|
|
Form of terms and conditions for Option Awards, Restricted Unit Awards, Performance Share Awards under the 2012 Stock and Incentive Plan for fiscal 2014 (Incorporated by reference to Exhibit 10.9 to Tyco International Ltd's Annual Report on Form 10-K for the year ended September 27, 2013 filed on November 14, 2013).
(1)
|
|
10.10
|
|
Form of terms and conditions for Option Awards, Restricted Unit Awards and Performance Share Awards under the 2012 Stock and Incentive Plan for fiscal 2013 (Incorporated by reference to Exhibit 10.11 to Tyco International Ltd.'s Annual Report on Form 10-K for the year ended September 28, 2012 filed on November 16, 2012).
(1)
|
|
10.11
|
|
Form of terms and conditions for Option Awards, Restricted Unit Awards and Performance Share Awards under the 2004 Stock and Incentive Plan for fiscal 2012 (Incorporated by reference to Exhibits 99.1, 99.2 and 99.3 to Tyco International Ltd.'s Current Report on Form 8-K filed on October 14, 2011).
(1)
|
|
10.12
|
|
Form of terms and conditions for Restricted Stock Unit Awards for Directors under the 2012 Stock and Incentive Plan (Incorporated by reference to Exhibit 10.13 to Tyco International Ltd.'s Annual Report on Form 10-K for the year ended September 28, 2012 filed on November 16, 2012).
(1)
|
|
10.13
|
|
Credit Agreement, dated as of June 22, 2012, among Tyco International Finance S.A., Tyco International Ltd., the Lenders party thereto, and Citibank, N.A. as Administrative Agent (Incorporated by reference to Exhibit 10.1 to Tyco International Ltd.'s Current Report on Form 8-K filed on June 27, 2012).
|
|
10.14
|
|
Tax Sharing Agreement by and among Tyco International Ltd., Covidien Ltd., and Tyco Electronics Ltd., dated June 29, 2007 (Incorporated by reference to Exhibit 10.1 to Tyco International Ltd.'s Current Report on Form 8-K filed on July 6, 2007).
|
|
10.15
|
|
Tax Sharing Agreement, dated September 28, 2012 by and among Pentair Ltd., Tyco International Ltd., Tyco International Finance S.A. and The ADT Corporation (Incorporated by reference to Exhibit 10.1 to Tyco International Ltd.'s Current Report on Form 8-K filed on October 1, 2012).
|
|
10.16
|
|
Non-Income Tax Sharing Agreement dated September 28, 2012 by and among Tyco International Ltd., Tyco International Finance S.A. and The ADT Corporation (Incorporated by reference to Exhibit 10.2 to Tyco International Ltd.'s Current Report on Form 8-K filed on October 1, 2012).
|
|
10.17
|
|
Trademark Agreement, dated as of September 25, 2012, by and among ADT Services GmbH, ADT US Holdings, Inc., Tyco International Ltd. and The ADT Corporation (Incorporated by reference to Exhibit 10.3 to Tyco International Ltd.'s Current Report on Form 8-K filed on October 1, 2012).
|
|
21.1
|
|
Subsidiaries of Tyco International Ltd. (Filed herewith).
|
|
23.1
|
|
Consent of Deloitte & Touche LLP (Filed herewith).
|
|
24.1
|
|
Power of Attorney with respect to Tyco International Ltd. signatories (filed herewith).
|
|
31.1
|
|
Certification by the Chief Executive Officer pursuant to 18 U.S.C. Section 1350, as Adopted Pursuant to Section 302 of the Sarbanes-Oxley Act of 2002 (Filed herewith).
|
|
31.2
|
|
Certification by the Chief Financial Officer pursuant to 18 U.S.C. Section 1350, as Adopted Pursuant to Section 302 of the Sarbanes-Oxley Act of 2002 (Filed herewith).
|
|
32.1
|
|
Certification by the Chief Executive Officer and Chief Financial Officer pursuant to 18 U.S.C. Section 1350, as Adopted Pursuant to Section 906 of the Sarbanes-Oxley Act of 2002 (Filed herewith).
|
|
101
|
|
Financial statements from the Annual Report on Form 10-K of Tyco International Ltd. for the fiscal year ended September 26, 2014 formatted in XBRL: (i) the Consolidated Statements of Operations, (ii) the Consolidated Statements of Comprehensive Income, (iii) the Consolidated Balance Sheets, (iv) the Consolidated Statements of Cash Flows, (v) the Consolidated Statements of Shareholders' Equity, and (vi) the Notes to Consolidated Financial Statements.
|
_______________________________________________________________________________
|
(1)
|
Management contract or compensatory plan.
|
|
(2)
|
See Item 15(a)(3) above.
|
|
(3)
|
See Item 15(a)(2) above.
|
63
SIGNATURES
Pursuant to the requirements of Section 13 or 15(d) of the Securities Exchange Act of 1934, the registrant has duly caused this report to be signed on its behalf by the undersigned, thereunto duly authorized.
|
|
TYCO INTERNATIONAL LTD.
|
|
|
By:
|
/s/ ARUN NAYAR
|
|
|
|
Arun Nayar
Executive Vice President and
Chief Financial Officer
(Principal Financial Officer)
|
|
Date:
November 13, 2014
Pursuant to the requirements of the Securities Exchange Act of 1934, this report has been signed below by the following persons on behalf of the registrant on
November 13, 2014
in the capacities indicated below.
|
Name
|
|
Title
|
|
|
|
|
|
/s/ GEORGE R. OLIVER
|
Chief Executive Officer and Director (Principal
Executive Officer)
|
|
|
George R. Oliver
|
|
|
|
/s/ ARUN NAYAR
|
Executive Vice President and Chief Financial
Officer (Principal Financial Officer)
|
|
|
Arun Nayar
|
|
|
|
/s/ SAM ELDESSOUKY
|
Senior Vice President, Controller and Chief Accounting Officer (Principal Accounting Officer)
|
|
|
Sam Eldessouky
|
|
|
64
|
Name
|
|
Title
|
|
|
|
|
|
*
|
||
|
Edward D. Breen
|
|
Director
|
|
*
|
||
|
Herman E. Bulls
|
|
Director
|
|
*
|
||
|
Michael E. Daniels
|
|
Director
|
|
*
|
||
|
Frank M. Drendel
|
|
Director
|
|
*
|
||
|
Brian Duperreault
|
|
Director
|
|
*
|
||
|
Rajiv L. Gupta
|
|
Director
|
|
*
|
||
|
Dr. Brendan R. O'Neill
|
|
Director
|
|
*
|
||
|
Jürgen Tinggren
|
|
Director
|
|
*
|
||
|
Sandra S. Wijnberg
|
|
Director
|
|
*
|
||
|
R. David Yost
|
|
Director
|
*Judith A. Reinsdorf, by signing her name hereto, does sign this document on behalf of the above noted individuals, pursuant to powers of attorney duly executed by such individuals, which have been filed as Exhibit 24.1 to this Report.
|
/s/ JUDITH A. REINSDORF
|
||||
|
|
|
By:
|
|
Judith A. Reinsdorf
Attorney-in-fact
|
65
TYCO INTERNATIONAL LTD.
Index to Consolidated Financial Statements
|
|
Page
|
66
MANAGEMENT'S RESPONSIBILITY FOR FINANCIAL STATEMENTS
Discussion of Management's Responsibility
We are responsible for the preparation, integrity and fair presentation of the Consolidated Financial Statements and related information appearing in this report. We take these responsibilities very seriously and are committed to being recognized as a leader in governance, controls, clarity and transparency of financial statements. We are committed to making honesty, integrity and transparency the hallmarks of how we run Tyco. We believe that to succeed in today's environment requires more than just compliance with laws and regulations—it requires a culture based upon the highest levels of integrity and ethical values. Expected behavior starts with our Board of Directors and our senior management team leading by example and includes every one of Tyco's global employees, as well as our customers, suppliers and business partners. One of our most crucial objectives is continuing to maintain and build on the public, employee and shareholder confidence that has been restored in Tyco. We believe this is being accomplished; first, by issuing financial information and related disclosures that are accurate, complete and transparent so investors are well informed; second, by supporting a leadership culture based on an ethic of uncompromising integrity and accountability; and third, by recruiting, training and retaining high-performance individuals who have the highest ethical standards. We take full responsibility for meeting this objective. We maintain appropriate accounting standards and disclosure controls and devote our full commitment and the necessary resources to these items.
Dedication to Governance, Controls and Financial Reporting
Throughout 2014, we continued to maintain and enhance internal controls over financial reporting, disclosures and corporate governance practices. We believe that a strong control environment is a dynamic process. Therefore, we intend to continue to devote the necessary resources to maintain and improve our internal controls and corporate governance.
Our Audit Committee meets regularly and separately with management, Deloitte & Touche LLP, our independent registered public accounting firm, and our internal auditors to discuss financial reports, controls and auditing.
We, our Board and our Audit Committee are all committed to excellence in governance, financial reporting and controls.
|
/s/ GEORGE R. OLIVER
|
/s/ ARUN NAYAR
|
|
|
George R. Oliver
Chief Executive Officer and Director
|
|
Arun Nayar
Executive Vice President and
Chief Financial Officer
|
67
REPORT OF INDEPENDENT REGISTERED PUBLIC ACCOUNTING FIRM
To the Board of Directors and Shareholders of
Tyco International Ltd.:
We have audited the accompanying consolidated balance sheets of Tyco International Ltd. and subsidiaries (the "Company") as of September 26, 2014 and September 27, 2013, and the related consolidated statements of operations, comprehensive income, shareholders' equity, and cash flows for each of the three fiscal years in the period ended September 26, 2014. Our audits also included the financial statement schedule listed in the Index at Item 15. These financial statements and financial statement schedule are the responsibility of the Company's management. Our responsibility is to express an opinion on the financial statements and financial statement schedule based on our audits.
We conducted our audits in accordance with the standards of the Public Company Accounting Oversight Board (United States). Those standards require that we plan and perform the audit to obtain reasonable assurance about whether the financial statements are free of material misstatement. An audit includes examining, on a test basis, evidence supporting the amounts and disclosures in the financial statements. An audit also includes assessing the accounting principles used and significant estimates made by management, as well as evaluating the overall financial statement presentation. We believe that our audits provide a reasonable basis for our opinion.
In our opinion, such consolidated financial statements present fairly, in all material respects, the financial position of Tyco International Ltd. and subsidiaries as of September 26, 2014 and September 27, 2013, and the results of their operations and their cash flows for each of the three fiscal years in the period ended September 26, 2014, in conformity with accounting principles generally accepted in the United States of America. Also, in our opinion, such financial statement schedule, when considered in relation to the basic consolidated financial statements taken as a whole, present fairly, in all material respects, the information set forth therein.
We have also audited, in accordance with the standards of the Public Company Accounting Oversight Board (United States), the Company's internal control over financial reporting as of September 26, 2014, based on the criteria established in
Internal Control-Integrated Framework (1992)
issued by the Committee of Sponsoring Organizations of the Treadway Commission and our report dated November 13, 2014 expressed an unqualified opinion on the Company's internal control over financial reporting.
/s/ DELOITTE & TOUCHE LLP
New York, New York
November 13, 2014
68
TYCO INTERNATIONAL LTD.
Years Ended
September 26, 2014
,
September 27, 2013
and
September 28, 2012
(in millions, except per share data)
|
2014
|
2013
|
2012
|
|||||||||
|
Revenue from product sales
|
$
|
6,221
|
|
$
|
5,855
|
|
$
|
5,763
|
|
||
|
Service revenue
|
4,119
|
|
4,218
|
|
4,129
|
|
|||||
|
Net revenue
|
10,340
|
|
10,073
|
|
9,892
|
|
|||||
|
Cost of product sales
|
4,253
|
|
3,990
|
|
3,905
|
|
|||||
|
Cost of services
|
2,302
|
|
2,412
|
|
2,411
|
|
|||||
|
Selling, general and administrative expenses
|
3,040
|
|
2,843
|
|
2,823
|
|
|||||
|
Separation costs (see Note 2)
|
1
|
|
8
|
|
71
|
|
|||||
|
Restructuring and asset impairment charges, net (see Note 4)
|
47
|
|
111
|
|
104
|
|
|||||
|
Operating income
|
697
|
|
709
|
|
578
|
|
|||||
|
Interest income
|
14
|
|
16
|
|
18
|
|
|||||
|
Interest expense
|
(97
|
)
|
(100
|
)
|
(209
|
)
|
|||||
|
Other expense, net
|
(1
|
)
|
(29
|
)
|
(454
|
)
|
|||||
|
Income (loss) from continuing operations before income taxes
|
613
|
|
596
|
|
(67
|
)
|
|||||
|
Income tax expense
|
(24
|
)
|
(108
|
)
|
(320
|
)
|
|||||
|
Equity income (loss) in earnings of unconsolidated subsidiaries
|
206
|
|
(48
|
)
|
(26
|
)
|
|||||
|
Income (loss) from continuing operations
|
795
|
|
440
|
|
(413
|
)
|
|||||
|
Income from discontinued operations, net of income taxes
|
1,044
|
|
93
|
|
884
|
|
|||||
|
Net income
|
1,839
|
|
533
|
|
471
|
|
|||||
|
Less: noncontrolling interest in subsidiaries net income (loss)
|
1
|
|
(3
|
)
|
(1
|
)
|
|||||
|
Net income attributable to Tyco common shareholders
|
$
|
1,838
|
|
$
|
536
|
|
$
|
472
|
|
||
|
Amounts attributable to Tyco common shareholders:
|
|
|
|
||||||||
|
Income (loss) from continuing operations
|
$
|
794
|
|
$
|
443
|
|
$
|
(412
|
)
|
||
|
Income from discontinued operations
|
1,044
|
|
93
|
|
884
|
|
|||||
|
Net income attributable to Tyco common shareholders
|
$
|
1,838
|
|
$
|
536
|
|
$
|
472
|
|
||
|
Basic earnings per share attributable to Tyco common shareholders:
|
|
|
|
||||||||
|
Income (loss) from continuing operations
|
$
|
1.74
|
|
$
|
0.96
|
|
$
|
(0.89
|
)
|
||
|
Income from discontinued operations
|
2.30
|
|
0.19
|
|
1.91
|
|
|||||
|
Net income attributable to Tyco common shareholders
|
$
|
4.04
|
|
$
|
1.15
|
|
$
|
1.02
|
|
||
|
Diluted earnings per share attributable to Tyco common shareholders:
|
|
|
|
||||||||
|
Income (loss) from continuing operations
|
$
|
1.71
|
|
$
|
0.94
|
|
$
|
(0.89
|
)
|
||
|
Income from discontinued operations
|
2.26
|
|
0.20
|
|
1.91
|
|
|||||
|
Net income attributable to Tyco common shareholders
|
$
|
3.97
|
|
$
|
1.14
|
|
$
|
1.02
|
|
||
|
Weighted average number of shares outstanding:
|
|
|
|
||||||||
|
Basic
|
455
|
|
465
|
|
463
|
|
|||||
|
Diluted
|
463
|
|
472
|
|
463
|
|
|||||
See Notes to Consolidated Financial Statements.
69
TYCO INTERNATIONAL LTD.
CONSOLIDATED STATEMENTS OF COMPREHENSIVE INCOME
Years Ended
September 26, 2014
,
September 27, 2013
and
September 28, 2012
(in millions)
|
|
2014
|
2013
|
2012
|
||||||||
|
Net income
|
$
|
1,839
|
|
$
|
533
|
|
$
|
471
|
|
||
|
Other comprehensive (loss) income, net of tax
|
|
|
|||||||||
|
Foreign currency translation
|
(174
|
)
|
(100
|
)
|
93
|
|
|||||
|
Defined benefit and post retirement plans
|
(64
|
)
|
79
|
|
(163
|
)
|
|||||
|
Total other comprehensive loss, net of tax
|
(238
|
)
|
(21
|
)
|
(70
|
)
|
|||||
|
Comprehensive income
|
1,601
|
|
512
|
|
401
|
|
|||||
|
Less: comprehensive income (loss) attributable to noncontrolling interests
|
1
|
|
(3
|
)
|
(1
|
)
|
|||||
|
Comprehensive income attributable to Tyco common shareholders
|
$
|
1,600
|
|
$
|
515
|
|
$
|
402
|
|
||
See Notes to Consolidated Financial Statements.
70
TYCO INTERNATIONAL LTD.
As of
September 26, 2014
and
September 27, 2013
(in millions, except per share data)
|
September 26, 2014
|
September 27, 2013
|
||||||
|
Assets
|
|
|
|||||
|
Current Assets:
|
|
|
|||||
|
Cash and cash equivalents
|
$
|
892
|
|
$
|
563
|
|
|
|
Accounts receivable, less allowance for doubtful accounts of $75 and $80, respectively
|
1,750
|
|
1,704
|
|
|||
|
Inventories
|
628
|
|
645
|
|
|||
|
Prepaid expenses and other current assets
|
1,153
|
|
839
|
|
|||
|
Deferred income taxes
|
307
|
|
250
|
|
|||
|
Assets held for sale
|
21
|
|
856
|
|
|||
|
Total Current Assets
|
4,751
|
|
4,857
|
|
|||
|
Property, plant and equipment, net
|
1,269
|
|
1,284
|
|
|||
|
Goodwill
|
4,126
|
|
4,162
|
|
|||
|
Intangible assets, net
|
737
|
|
791
|
|
|||
|
Other assets
|
926
|
|
1,082
|
|
|||
|
Total Assets
|
$
|
11,809
|
|
$
|
12,176
|
|
|
|
Liabilities and Equity
|
|
|
|||||
|
Current Liabilities:
|
|
|
|||||
|
Loans payable and current maturities of long-term debt
|
$
|
20
|
|
$
|
20
|
|
|
|
Accounts payable
|
871
|
|
848
|
|
|||
|
Accrued and other current liabilities
|
2,167
|
|
1,852
|
|
|||
|
Deferred revenue
|
400
|
|
393
|
|
|||
|
Liabilities held for sale
|
13
|
|
236
|
|
|||
|
Total Current Liabilities
|
3,471
|
|
3,349
|
|
|||
|
Long-term debt
|
1,443
|
|
1,443
|
|
|||
|
Deferred revenue
|
335
|
|
370
|
|
|||
|
Other liabilities
|
1,877
|
|
1,881
|
|
|||
|
Total Liabilities
|
7,126
|
|
7,043
|
|
|||
|
Commitments and Contingencies (see Note 13)
|
|
|
|||||
|
Redeemable noncontrolling interest
|
13
|
|
12
|
|
|||
|
Tyco Shareholders' Equity:
|
|
|
|||||
|
Common shares, CHF 0.50 par value, 825,222,070 shares authorized, 486,363,050 shares issued as of September 26, 2014 and September 27, 2013
|
208
|
|
208
|
|
|||
|
Common shares held in treasury, 59,460,486 and 22,902,706 shares as of September 26, 2014 and September 27, 2013, respectively
|
(2,515
|
)
|
(912
|
)
|
|||
|
Contributed surplus
|
3,306
|
|
3,754
|
|
|||
|
Accumulated earnings
|
4,873
|
|
3,035
|
|
|||
|
Accumulated other comprehensive loss
|
(1,225
|
)
|
(987
|
)
|
|||
|
Total Tyco Shareholders' Equity
|
4,647
|
|
5,098
|
|
|||
|
Nonredeemable noncontrolling interest
|
23
|
|
23
|
|
|||
|
Total Equity
|
4,670
|
|
5,121
|
|
|||
|
Total Liabilities, Redeemable Noncontrolling Interest and Equity
|
$
|
11,809
|
|
$
|
12,176
|
|
|
See Notes to Consolidated Financial Statements.
71
TYCO INTERNATIONAL LTD.
CONSOLIDATED STATEMENTS OF SHAREHOLDERS' EQUITY
Years Ended
September 26, 2014
,
September 27, 2013
and
September 28, 2012
(in millions)
|
Number of
Common Shares |
Common
Shares at Par Value (see Note 15) |
Treasury
Shares |
Contributed
Surplus |
Accumulated
Earnings |
Accumulated
Other Comprehensive Loss |
Total Tyco
Shareholders' Equity |
Non-
redeemable Non- controlling Interest |
Total
Equity |
||||||||||||||||||||||||||
|
Balance as of September 30, 2011
|
465
|
|
$
|
2,792
|
|
$
|
(951
|
)
|
$
|
10,717
|
|
$
|
2,027
|
|
$
|
(436
|
)
|
$
|
14,149
|
|
$
|
5
|
|
$
|
14,154
|
|
||||||||
|
Comprehensive income:
|
|
|
|
|
|
|
|
|
|
|||||||||||||||||||||||||
|
Net income attributable to Tyco common shareholders
|
|
|
|
|
|
|
|
|
472
|
|
|
|
472
|
|
(1
|
)
|
471
|
|
||||||||||||||||
|
Other comprehensive loss, net of tax
|
(70
|
)
|
(70
|
)
|
(70
|
)
|
||||||||||||||||||||||||||||
|
Dividends declared (see Note 15)
|
|
|
|
|
|
|
(368
|
)
|
|
|
|
|
(368
|
)
|
|
|
(368
|
)
|
||||||||||||||||
|
Shares issued from treasury for vesting of share based equity awards
|
9
|
|
|
|
382
|
|
(156
|
)
|
|
|
|
|
226
|
|
|
|
226
|
|
||||||||||||||||
|
Repurchase of common shares
|
(11
|
)
|
|
|
(500
|
)
|
|
|
|
|
|
|
(500
|
)
|
|
|
(500
|
)
|
||||||||||||||||
|
Compensation expense
|
|
|
|
|
|
|
140
|
|
|
|
|
|
140
|
|
|
|
140
|
|
||||||||||||||||
|
Noncontrolling interest related to acquisitions (See Note 5)
|
|
|
|
|
|
|
|
|
|
|
|
|
—
|
|
13
|
|
13
|
|
||||||||||||||||
|
Distribution of Tyco Flow Control and ADT
|
|
|
|
|
|
|
(8,570
|
)
|
|
|
(460
|
)
|
(9,030
|
)
|
|
|
(9,030
|
)
|
||||||||||||||||
|
Other
|
(1
|
)
|
|
|
(25
|
)
|
|
|
|
|
|
|
(25
|
)
|
(1
|
)
|
(26
|
)
|
||||||||||||||||
|
Balance as of September 28, 2012
|
462
|
|
$
|
2,792
|
|
$
|
(1,094
|
)
|
$
|
1,763
|
|
$
|
2,499
|
|
$
|
(966
|
)
|
$
|
4,994
|
|
$
|
16
|
|
$
|
5,010
|
|
||||||||
|
Comprehensive income:
|
|
|
|
|||||||||||||||||||||||||||||||
|
Net income attributable to Tyco common shareholders
|
536
|
|
536
|
|
(3
|
)
|
533
|
|
||||||||||||||||||||||||||
|
Other comprehensive loss, net of tax
|
(21
|
)
|
(21
|
)
|
(21
|
)
|
||||||||||||||||||||||||||||
|
Reallocation of share capital to contributed surplus
|
(2,584
|
)
|
2,584
|
|
—
|
|
—
|
|
||||||||||||||||||||||||||
|
Dividends declared (See Note 15)
|
(298
|
)
|
(298
|
)
|
|
|
(298
|
)
|
||||||||||||||||||||||||||
|
Shares issued from treasury for vesting of share based equity awards
|
12
|
|
512
|
|
(359
|
)
|
153
|
|
|
|
153
|
|
||||||||||||||||||||||
|
Repurchase of common shares
|
(10
|
)
|
(300
|
)
|
(300
|
)
|
|
|
(300
|
)
|
||||||||||||||||||||||||
|
Compensation expense
|
63
|
|
63
|
|
|
|
63
|
|
||||||||||||||||||||||||||
|
Noncontrolling interest related to acquisitions (See Note 5)
|
—
|
|
10
|
|
10
|
|
||||||||||||||||||||||||||||
|
Other
|
(1
|
)
|
(30
|
)
|
1
|
|
(29
|
)
|
(29
|
)
|
||||||||||||||||||||||||
|
Balance as of September 27, 2013
|
463
|
|
$
|
208
|
|
$
|
(912
|
)
|
$
|
3,754
|
|
$
|
3,035
|
|
$
|
(987
|
)
|
$
|
5,098
|
|
$
|
23
|
|
$
|
5,121
|
|
||||||||
See Notes to Consolidated Financial Statements.
72
TYCO INTERNATIONAL LTD.
CONSOLIDATED STATEMENTS OF SHAREHOLDERS' EQUITY (Continued)
Years Ended
September 26, 2014
,
September 27, 2013
and
September 28, 2012
(in millions)
|
Number of
Common Shares |
Common
Shares at Par Value (see Note 15) |
Treasury
Shares |
Contributed
Surplus |
Accumulated
Earnings |
Accumulated
Other Comprehensive Loss |
Total Tyco
Shareholders' Equity |
Non-
redeemable Non- controlling Interest |
Total
Equity |
||||||||||||||||||||||||||
|
Balance as of September 27, 2013
|
463
|
|
$
|
208
|
|
$
|
(912
|
)
|
$
|
3,754
|
|
$
|
3,035
|
|
$
|
(987
|
)
|
$
|
5,098
|
|
$
|
23
|
|
$
|
5,121
|
|
||||||||
|
Comprehensive income:
|
|
|
|
|||||||||||||||||||||||||||||||
|
Net income attributable to Tyco common shareholders
|
1,838
|
|
1,838
|
|
|
|
1,838
|
|
||||||||||||||||||||||||||
|
Other comprehensive loss, net of tax
|
(238
|
)
|
(238
|
)
|
(238
|
)
|
||||||||||||||||||||||||||||
|
Dividends declared (See Note 15)
|
(316
|
)
|
(316
|
)
|
|
|
(316
|
)
|
||||||||||||||||||||||||||
|
Shares issued from treasury for vesting of share based equity awards
|
6
|
|
240
|
|
(149
|
)
|
91
|
|
|
|
91
|
|
||||||||||||||||||||||
|
Repurchase of common shares
|
(42
|
)
|
(1,833
|
)
|
(1,833
|
)
|
|
|
(1,833
|
)
|
||||||||||||||||||||||||
|
Compensation expense
|
72
|
|
72
|
|
|
|
72
|
|
||||||||||||||||||||||||||
|
Purchase of noncontrolling interest (See Note 5)
|
(55
|
)
|
(55
|
)
|
|
|
(55
|
)
|
||||||||||||||||||||||||||
|
Other
|
|
|
(10
|
)
|
|
|
|
|
(10
|
)
|
(10
|
)
|
||||||||||||||||||||||
|
Balance as of September 26, 2014
|
427
|
|
$
|
208
|
|
$
|
(2,515
|
)
|
$
|
3,306
|
|
$
|
4,873
|
|
$
|
(1,225
|
)
|
$
|
4,647
|
|
$
|
23
|
|
$
|
4,670
|
|
||||||||
See Notes to Consolidated Financial Statements.
73
TYCO INTERNATIONAL LTD.
Years Ended
September 26, 2014
,
September 27, 2013
and
September 28, 2012
(in millions)
|
2014
|
2013
|
2012
|
|||||||||
|
Cash Flows From Operating Activities:
|
|
|
|
||||||||
|
Net income attributable to Tyco common shareholders
|
$
|
1,838
|
|
$
|
536
|
|
$
|
472
|
|
||
|
Noncontrolling interest in subsidiaries net income (loss)
|
1
|
|
(3
|
)
|
(1
|
)
|
|||||
|
Income from discontinued operations, net of income taxes
|
(1,044
|
)
|
(93
|
)
|
(884
|
)
|
|||||
|
Income (loss) from continuing operations
|
795
|
|
440
|
|
(413
|
)
|
|||||
|
Adjustments to reconcile income (loss) from continuing operations to net cash provided by operating activities:
|
|
|
|
||||||||
|
Depreciation and amortization
|
361
|
|
382
|
|
379
|
|
|||||
|
Non-cash compensation expense
|
72
|
|
63
|
|
113
|
|
|||||
|
Deferred income taxes
|
(106
|
)
|
5
|
|
370
|
|
|||||
|
Provision for losses on accounts receivable and inventory
|
44
|
|
70
|
|
54
|
|
|||||
|
Loss on the retirement of debt
|
—
|
|
—
|
|
453
|
|
|||||
|
Non-cash restructuring and asset impairment charges, net
|
2
|
|
1
|
|
25
|
|
|||||
|
Legacy legal matters
|
(92
|
)
|
—
|
|
—
|
|
|||||
|
(Gain) loss on divestitures
|
(2
|
)
|
20
|
|
14
|
|
|||||
|
(Gain) loss on sale of investments
|
(215
|
)
|
42
|
|
11
|
|
|||||
|
Other non-cash items
|
25
|
|
64
|
|
31
|
|
|||||
|
Changes in assets and liabilities, net of the effects of acquisitions and divestitures:
|
|
|
|||||||||
|
Accounts receivable
|
(93
|
)
|
(75
|
)
|
(121
|
)
|
|||||
|
Contracts in progress
|
(98
|
)
|
(20
|
)
|
(39
|
)
|
|||||
|
Inventories
|
(13
|
)
|
(36
|
)
|
(71
|
)
|
|||||
|
Prepaid expenses and other assets
|
(91
|
)
|
31
|
|
(10
|
)
|
|||||
|
Accounts payable
|
53
|
|
(12
|
)
|
44
|
|
|||||
|
Accrued and other liabilities
|
205
|
|
(226
|
)
|
(81
|
)
|
|||||
|
Deferred revenue
|
(24
|
)
|
(32
|
)
|
(3
|
)
|
|||||
|
Income taxes, net
|
28
|
|
(31
|
)
|
(179
|
)
|
|||||
|
Other
|
(20
|
)
|
8
|
|
(21
|
)
|
|||||
|
Net cash provided by operating activities
|
831
|
|
694
|
|
556
|
|
|||||
|
Net cash provided by discontinued operating activities
|
81
|
|
156
|
|
2,030
|
|
|||||
|
Cash Flows From Investing Activities:
|
|
|
|||||||||
|
Capital expenditures
|
(288
|
)
|
(270
|
)
|
(295
|
)
|
|||||
|
Proceeds from disposal of assets
|
10
|
|
5
|
|
4
|
|
|||||
|
Acquisition of businesses, net of cash acquired
|
(65
|
)
|
(229
|
)
|
(217
|
)
|
|||||
|
Acquisition of dealer generated customer accounts and bulk account purchases
|
(25
|
)
|
(19
|
)
|
(23
|
)
|
|||||
|
Divestiture of businesses, net of cash divested
|
1
|
|
17
|
|
(5
|
)
|
|||||
|
Sales and maturities of investments
|
283
|
|
182
|
|
128
|
|
|||||
|
Purchases of investments
|
(386
|
)
|
(227
|
)
|
(87
|
)
|
|||||
|
Sale of equity investment
|
250
|
|
—
|
|
—
|
|
|||||
|
Decrease (increase) in restricted cash
|
3
|
|
(8
|
)
|
(2
|
)
|
|||||
|
Other
|
(4
|
)
|
4
|
|
27
|
|
|||||
|
Net cash used in investing activities
|
(221
|
)
|
(545
|
)
|
(470
|
)
|
|||||
|
Net cash provided by (used in) discontinued investing activities
|
1,789
|
|
(110
|
)
|
(1,316
|
)
|
|||||
|
Cash Flows From Financing Activities:
|
|
|
|||||||||
|
Proceeds from issuance of short-term debt
|
830
|
|
475
|
|
2,008
|
|
|||||
|
Repayment of short-term debt
|
(831
|
)
|
(505
|
)
|
(2,009
|
)
|
|||||
|
Proceeds from issuance of long-term debt
|
—
|
|
—
|
|
19
|
|
|||||
|
Repayment of long-term debt
|
—
|
|
—
|
|
(3,040
|
)
|
|||||
|
Proceeds from exercise of share options
|
91
|
|
153
|
|
226
|
|
|||||
|
Dividends paid
|
(311
|
)
|
(288
|
)
|
(461
|
)
|
|||||
74
|
Repurchase of common shares by treasury
|
(1,833
|
)
|
(300
|
)
|
(500
|
)
|
|||||
|
Purchase of noncontrolling interest
|
(66
|
)
|
—
|
|
—
|
|
|||||
|
Transfer from discontinued operations
|
1,870
|
|
76
|
|
3,307
|
|
|||||
|
Other
|
(11
|
)
|
(30
|
)
|
(25
|
)
|
|||||
|
Net cash used in financing activities
|
(261
|
)
|
(419
|
)
|
(475
|
)
|
|||||
|
Net cash used in discontinued financing activities
|
(1,870
|
)
|
(76
|
)
|
(284
|
)
|
|||||
|
Effect of currency translation on cash
|
(20
|
)
|
(11
|
)
|
4
|
|
|||||
|
Effect of currency translation on cash related to discontinued operations
|
—
|
|
—
|
|
4
|
|
|||||
|
Net increase (decrease) in cash and cash equivalents
|
329
|
|
(311
|
)
|
49
|
|
|||||
|
Less: net (decrease) increase in cash and cash equivalents related to discontinued operations
|
—
|
|
(30
|
)
|
434
|
|
|||||
|
Cash and cash equivalents at beginning of period
|
563
|
|
844
|
|
1,229
|
|
|||||
|
Cash and cash equivalents at end of period
|
$
|
892
|
|
$
|
563
|
|
$
|
844
|
|
||
|
Supplementary Cash Flow Information:
|
|
|
|
||||||||
|
Interest paid
|
$
|
100
|
|
$
|
99
|
|
$
|
222
|
|
||
|
Income taxes paid, net of refunds
|
102
|
|
134
|
|
129
|
|
|||||
See Notes to Consolidated Financial Statements.
75
TYCO INTERNATIONAL LTD.
NOTES TO CONSOLIDATED FINANCIAL STATEMENTS
1. Basis of Presentation and Summary of Significant Accounting Policies
Basis of Presentation
—The Consolidated Financial Statements include the consolidated accounts of Tyco International Ltd., a corporation organized under the laws of Switzerland, and its subsidiaries (Tyco and all its subsidiaries, hereinafter collectively referred to as the "Company" or "Tyco"). The financial statements have been prepared in United States dollars ("USD") and in accordance with generally accepted accounting principles in the United States ("GAAP"). Unless otherwise indicated, references to
2014
,
2013
and
2012
are to Tyco's fiscal years ending
September 26, 2014
,
September 27, 2013
and
September 28, 2012
, respectively.
Effective September 28, 2012, Tyco completed the spin-offs of The ADT Corporation ("ADT") and Pentair Ltd. (formerly known as Tyco Flow Control International Ltd. ("Tyco Flow Control")), formerly the North American residential security and flow control businesses of Tyco, respectively, into separate, publicly traded companies in the form of a distribution to Tyco shareholders. Immediately following the spin-off, Pentair, Inc. was merged with a subsidiary of Tyco Flow Control in a tax-free, all-stock merger (the "Merger"), with Pentair Ltd. ("Pentair") succeeding Pentair Inc. as an independent publicly traded company. The distribution was made on September 28, 2012, to Tyco shareholders of record on September 17, 2012. Each Tyco shareholder received
0.50
of a common share of ADT and approximately
0.24
of a common share of Pentair for each Tyco common share held on the record date. The distribution was structured to be tax-free to Tyco shareholders except to the extent of cash received in lieu of fractional shares. The distributions, the Merger and related transactions are collectively referred to herein as the "2012 Separation". As a result of the distribution, the operations of Tyco's former flow control and North American residential security businesses are classified as discontinued operations in all periods prior to the 2012 Separation.
The Company operates and reports financial and operating information in the following
three
segments: North America Installation & Services ("NA Installation & Services"), Rest of World Installation & Services ("ROW Installation & Services") and Global Products. The Company also provides general corporate services to its segments which is reported as a fourth, non-operating segment, Corporate and Other.
Change of Jurisdiction
— On May 30, 2014, Tyco entered into a Merger Agreement ("Merger Agreement") with Tyco International plc, a newly-formed Irish public limited company and a wholly-owned subsidiary of Tyco ("Tyco Ireland"). Under the Merger Agreement, Tyco will merge with and into Tyco Ireland, with Tyco Ireland being the surviving company. This Merger will result in Tyco Ireland becoming Tyco's publicly-traded parent company and change the jurisdiction of organization of Tyco from Switzerland to Ireland. Tyco's shareholders are expected to receive
one
ordinary share of Tyco Ireland for each common share of Tyco held immediately prior to the Merger. Upon completion of the Merger, Tyco Ireland is expected to conduct, through its subsidiaries, the same businesses as conducted by Tyco before the Merger. The Merger is subject to certain conditions including shareholder approval, which was received at the special general meeting of shareholders held on September 9, 2014. The Merger is expected to become effective in November 2014.
Reclassifications
— Certain prior period amounts have been reclassified to conform with current period presentation as discussed below.
During the third quarter of fiscal 2014, the Company completed the sale of its South Korean security business (“ADT Korea”) to an affiliate of The Carlyle Group. The Company has reclassified the operations of its South Korean security business to Income from discontinued operations in the Consolidated Statements of Operations for all periods presented, and the assets and liabilities as held for sale within the Consolidated Balance Sheets as of September 27, 2013 as it satisfied the criteria to be presented as a discontinued operation for those periods. See Note 3 for additional information.
In addition, the Company has reclassified several businesses in the Rest of World ("ROW") Installation & Services segment to Income from discontinued operations in the Consolidated Statements of Operations, and the assets and liabilities as held for sale within the Consolidated Balance Sheets as they satisfied the criteria to be presented as discontinued operations. The Company expects to complete the sale of these businesses by the end of the third quarter of fiscal 2015. See Note 3 for additional information.
Principles of Consolidation
—Tyco conducts business through its operating subsidiaries. The Company consolidates companies in which it owns or controls more than fifty percent of the voting shares or has the ability to control through similar rights. Also, the Company consolidates variable interest entities ("VIE") in which the Company has the power to direct the significant activities of the entity and the obligation to absorb losses or receive benefits from the entity that may be significant. The VIEs which the Company consolidates, individually or in the aggregate, did not have a material impact on the Company's
76
financial position, results of operations or cash flows. All intercompany transactions have been eliminated. The results of companies acquired or disposed of during the year are included in the Consolidated Financial Statements from the effective date of acquisition or up to the date of disposal.
The Company has a
52
or
53
-week fiscal year that ends on the last Friday in September. Fiscal
2014
,
2013
and
2012
were
52
week years which ended on
September 26, 2014
,
September 27, 2013
and
September 28, 2012
, respectively.
Use of Estimates
—The preparation of the Consolidated Financial Statements in conformity with GAAP requires management to make estimates and assumptions that affect the reported amount of assets and liabilities, disclosure of contingent assets and liabilities and reported amounts of revenues and expenses. Significant estimates in these Consolidated Financial Statements include restructuring charges, allowances for doubtful accounts receivable, estimates of future cash flows associated with asset impairments, useful lives for depreciation and amortization, loss contingencies (including legal, environmental and asbestos reserves), insurance reserves, net realizable value of inventories, fair values of financial instruments, estimated contract revenue and related costs, income taxes and tax valuation allowances, and pension and postretirement employee benefit liabilities and expenses. Actual results could differ materially from these estimates.
Revenue Recognition
—The Company recognizes revenue principally on
four
types of transactions—sales of products, security systems, monitoring and maintenance services, and contract sales, including the installation of fire and security systems and other construction-related projects.
Revenue from the sales of products is recognized at the time title and risks and rewards of ownership pass. This is generally when the products reach the free-on-board shipping point, the sales price is fixed and determinable and collection is reasonably assured.
Provisions for certain rebates, sales incentives, trade promotions, product returns and discounts to customers are accounted for as reductions in determining net revenue in the same period the related sales are recorded. These provisions are based on terms of arrangements with direct, indirect and other market participants. Rebates are estimated based on sales terms, historical experience and trend analysis.
Sales of security monitoring systems may have multiple elements, including equipment, installation, monitoring services and maintenance agreements. The Company assesses its revenue arrangements to determine the appropriate units of accounting. When ownership of the system is transferred to the customer, each deliverable provided under the arrangement is considered a separate unit of accounting. Revenues associated with sale of equipment and related installations are recognized once delivery, installation and customer acceptance is completed, while the revenue for monitoring and maintenance services are recognized as services are rendered. Amounts assigned to each unit of accounting are based on an allocation of total arrangement consideration using a hierarchy of estimated selling price for the deliverables. The selling price used for each deliverable will be based on Vendor Specific Objective Evidence ("VSOE") if available, Third Party Evidence ("TPE") if VSOE is not available, or estimated selling price if neither VSOE or TPE is available. Revenue recognized for equipment and installation is limited to the lesser of their allocated amounts under the estimated selling price hierarchy or the non-contingent up-front consideration received at the time of installation, since collection of future amounts under the arrangement with the customer is contingent upon the delivery of monitoring and maintenance services. While the Company does not expect situations where VSOE is not available for sales of security systems and services, if such cases were to arise the Company would follow the selling price hierarchy to allocate arrangement consideration. For transactions in which the Company retains ownership of the subscriber system asset, fees for monitoring and maintenance services are recognized on a straight-line basis over the contract term. Non-refundable fees received in connection with the initiation of a monitoring contract, along with associated direct and incremental selling costs, are deferred and amortized over the estimated life of the customer relationship.
Revenue from the sale of services is recognized as services are rendered. Customer billings for services not yet rendered are deferred and recognized as revenue as the services are rendered and the associated deferred revenue is included in current liabilities or long-term liabilities, as appropriate.
Contract sales for the installation of fire protection systems, large security intruder systems and other construction-related projects are recorded primarily under the percentage-of-completion method. Profits recognized on contracts in process are based upon estimated contract revenue and related total cost of the project at completion. The extent of progress toward completion is generally measured based on the ratio of actual cost incurred to total estimated cost at completion. Revisions to cost estimates as contracts progress have the effect of increasing or decreasing profits each period. Provisions for anticipated losses are made in the period in which they become determinable. Estimated warranty costs are included in total estimated contract costs and are accrued over the construction period of the respective contracts under percentage-of-completion accounting.
77
The Company recorded retainage receivables of
$53 million
and
$48 million
as of
September 26, 2014
and
September 27, 2013
, respectively, of which
$42 million
were unbilled during both periods. The retainage provisions consist primarily of fire protection contracts which become due upon contract completion and acceptance. The Company expects approximately
$41 million
to be collected during fiscal 2015, which are reflected within Accounts receivable on the Consolidated Balance Sheet as of
September 26, 2014
.
Research and Development
—Research and development expenditures are expensed when incurred and are included in cost of product sales, which amounted to
$193 million
,
$172 million
and
$145 million
for fiscal years
2014
,
2013
and
2012
, respectively, related to new product development. Research and development expenses include salaries, direct costs incurred and building and overhead expenses.
Advertising
—Advertising costs are expensed when incurred and are included in selling, general and administrative expenses, which amounted to
$48 million
,
$60 million
and
$39 million
for fiscal years
2014
,
2013
and
2012
, respectively.
Acquisition Costs
—Costs incurred to acquire new businesses, new product lines or similar assets are expensed when incurred and are included in Selling, general and administrative expenses. See Note 5 for additional information.
Translation of Foreign Currency
—For the Company's non-U.S. subsidiaries whose books are in a functional currency other than U.S. dollars, assets and liabilities are translated into U.S. dollars using period-end exchange rates. Revenue and expenses are translated at the average exchange rates in effect during the period. Foreign currency translation gains and losses are included as a component of accumulated other comprehensive loss in Tyco's shareholders' equity.
Cash and Cash Equivalents
—All highly liquid investments with original maturities of
three
months or less are considered to be cash equivalents.
Allowance for Doubtful Accounts
—The allowance for doubtful accounts receivable reflects the best estimate of probable losses inherent in Tyco's receivable portfolio determined on the basis of historical experience, specific allowances for known troubled accounts and other currently available evidence.
Inventories
—Inventories are recorded at the lower of cost (primarily first-in, first-out) or market value.
Property, Plant and Equipment, Net
—Property, Plant and Equipment, net is recorded at cost less accumulated depreciation. Depreciation expense for fiscal years
2014
,
2013
and
2012
was
$268 million
,
$287 million
and
$281 million
, respectively, and is recorded in Selling, general and administrative expenses in the Consolidated Statement of Operations. Maintenance and repair expenditures are charged to expense when incurred. Except for pooled subscriber systems which are depreciated on an accelerated basis over a period of up to
15
years, depreciation is calculated using the straight-line method over the estimated useful lives of the related assets as follows:
|
Buildings and related improvements
|
Up to 50 years
|
|
Leasehold improvements
|
Lesser of remaining term of the lease or economic useful life
|
|
Subscriber systems
|
Up to 14 years
|
|
Other machinery, equipment and furniture and fixtures
|
Up to 21 years
|
See below for discussion of depreciation method and estimated useful lives related to subscriber systems.
Subscriber System Assets, Dealer Intangibles and Related Deferred Revenue Accounts
—The Company considers assets related to the acquisition of new customers in its electronic security business in
three
asset categories: internally generated residential subscriber systems outside of North America, internally generated commercial subscriber systems (collectively referred to as subscriber system assets) and customer accounts acquired through the ADT dealer program, primarily outside of North America (referred to as dealer intangibles). Subscriber system assets include installed property, plant and equipment for which Tyco retains ownership and deferred costs directly related to the customer acquisition and system installation. Subscriber system assets represent capitalized equipment (e.g. security control panels, touchpad, motion detectors, window sensors, and other equipment) and installation costs associated with electronic security monitoring arrangements under which the Company retains ownership of the security system assets in a customer's place of business or, outside of North America, residence. Installation costs represent costs incurred to prepare the asset for its intended use. The Company pays property taxes on the subscriber system assets and upon customer termination, may retrieve such assets. These assets embody a probable future economic benefit as they generate future monitoring revenue for the Company.
Costs related to the subscriber system equipment and installation are categorized as property, plant and equipment rather than deferred costs. Deferred costs associated with subscriber system assets represent direct and incremental selling expenses
78
(i.e. commissions) related to acquiring the customer. Commissions related to up-front consideration paid by customers in connection with the establishment of the monitoring arrangement are determined based on a percentage of the up-front fees and do not exceed deferred revenue. Such deferred costs are recorded as non-current assets and are included in Other assets within the Consolidated Balance Sheets.
Subscriber system assets and any deferred revenue resulting from the customer acquisition are accounted for over the expected life of the subscriber. In certain geographical areas where the Company has a large number of customers that behave in a similar manner over time, the Company accounts for subscriber system assets and related deferred revenue using pools, with separate pools for the components of subscriber system assets and any related deferred revenue based on the same month and year of acquisition. The Company depreciates its pooled subscriber system assets and related deferred revenue using an accelerated method with lives up to
15
years. The accelerated method utilizes declining balance rates based on geographical area ranging from
140%
to
360%
for commercial subscriber pools and dealer intangibles and converts to a straight-line methodology when the resulting depreciation charge is greater than that from the accelerated method. The Company uses a straight-line method with a
14
-year life for non-pooled subscriber system assets (primarily in Europe, Latin America and Asia) and related deferred revenue, with remaining balances written off upon customer termination.
Certain contracts and related customer relationships result from purchasing residential security monitoring contracts from an external network of independent dealers who operate under the ADT dealer program, primarily outside of North America. Acquired contracts and related customer relationships are recorded at their contractually determined purchase price.
During the first
6
months (
12
months in certain circumstances) after the purchase of the customer contract, any cancellation of monitoring service, including those that result from customer payment delinquencies, results in a chargeback by the Company to the dealer for the full amount of the contract purchase price. The Company records the amount charged back to the dealer as a reduction of the previously recorded intangible asset.
Intangible assets arising from the ADT dealer program described above are amortized in pools determined by the same month and year of contract acquisition on an accelerated basis over the period and pattern of economic benefit that is expected to be obtained from the customer relationship.
The estimated useful life of dealer intangibles ranges from
12
to
15
years. The Company amortizes dealer intangible assets on an accelerated basis.
Other Amortizable Intangible Assets, Net
—Intangible assets primarily include contracts and related customer relationships (dealer accounts discussed above) and intellectual property.
Other contracts and related customer relationships, as well as intellectual property consisting primarily of patents, trademarks, copyrights and unpatented technology, are amortized on a straight-line basis over
4
to
40
years. The Company evaluates the amortization methods and remaining useful lives of intangible assets on a periodic basis to determine whether events and circumstances warrant a revision to the amortization method or remaining useful lives.
Long-Lived Asset Impairments
—The Company reviews long-lived assets, including property, plant and equipment and amortizable intangible assets, for impairment whenever events or changes in business circumstances indicate that the carrying amount of the asset may not be fully recoverable. Tyco performs undiscounted operating cash flow analyses to determine if impairment exists. For purposes of recognition and measurement of an impairment for assets held for use, Tyco groups assets and liabilities at the lowest level for which cash flows are separately identified. If an impairment is determined to exist, any related impairment loss is calculated based on fair value. Impairment losses on assets to be disposed of, if any, are based on the estimated proceeds to be received, less costs of disposal.
79
Goodwill and Indefinite-Lived Intangible Asset Impairments
—Goodwill and indefinite-lived intangible assets are assessed for impairment annually and more frequently if triggering events occur (see Note 8 for additional information). In performing these assessments, management relies on and considers a number of factors, including operating results, business plans, economic projections, anticipated future cash flows, comparable market transactions (to the extent available), other market data and the Company's overall market capitalization. There are inherent uncertainties related to these factors which require judgment in applying them to the analysis of goodwill and indefinite-lived intangible assets for impairment. The Company elected to make the first day of the fourth quarter the annual impairment assessment date for all goodwill and indefinite-lived intangible assets.
When testing for goodwill impairment, the Company first assesses qualitative factors to determine whether it is more likely than not that the fair value of a reporting unit is less than its carrying amount. If the Company concludes it is more likely than not that the fair value of a reporting unit is less than its carrying amount, a quantitative fair value test is performed. Based upon the Company’s most recent annual impairment test completed as of June 30, 2014, it is not more likely than not that the fair value of each reporting unit was less than its carrying value.
Indefinite-lived intangible assets consisting primarily of trade names and franchise rights are tested for impairment using either a relief-from-royalty method or excess earnings method, respectively.
Investments
—The Company invests in debt and equity securities. Long-term investments in marketable equity securities that represent less than
twenty percent
ownership are marked to market at the end of each accounting period. Unrealized gains and losses are recognized in Accumulated other comprehensive loss within Tyco shareholders' equity for available for sale securities unless an unrealized loss is deemed to be other than temporary, in which case such loss is charged to earnings. Unrealized gains and losses are recognized in Other income (expense), net for trading securities. Management determines the proper classification of investments at the time of purchase and reevaluates such classifications as of each balance sheet date. Realized gains and losses on sales of investments are recorded in Other income (expense), net in the Consolidated Statements of Operations.
Other equity investments for which the Company does not have the ability to exercise significant influence and for which there is not a readily determinable market value are accounted for under the cost method of accounting. Each reporting period, the Company evaluates the carrying value of its investments accounted for under the cost method of accounting, such that they are recorded at the lower of cost or estimated net realizable value. For equity investments in which the Company exerts significant influence over operating and financial policies but does not control, the equity method of accounting is used. The Company's share of net income or losses of equity investments is included in Equity income (loss) in earnings of unconsolidated subsidiaries or Selling, general and administrative expenses in the Consolidated Statements of Operations, depending on the nature of the investment.
Product Warranty
—The Company records estimated product warranty costs at the time of sale. Products are warranted against defects in material and workmanship when properly used for their intended purpose, installed correctly, and appropriately maintained. Generally, product warranties are implicit in the sale; however, the customer may purchase an extended warranty. However, in most instances the warranty is either negotiated in the contract or sold as a separate component. The warranty liability is determined based on historical information such as past experience, product failure rates or number of units repaired, estimated cost of material and labor, and in certain instances estimated property damage.
Environmental Costs
—The Company is subject to laws and regulations relating to protecting the environment. Tyco provides for expenses associated with environmental remediation obligations when such amounts are probable and can be reasonably estimated.
Income Taxes
—Deferred tax liabilities and assets are recognized for the expected future tax consequences of events that have been reflected in the Consolidated Financial Statements. Deferred tax liabilities and assets are determined based on the differences between the book and tax bases of particular assets and liabilities and operating loss carryforwards, using tax rates in effect for the years in which the differences are expected to reverse. A valuation allowance is provided to offset deferred tax assets if, based upon the available evidence, including consideration of tax planning strategies, it is more-likely-than-not that some or all of the deferred tax assets will not be realized.
Asbestos-Related Contingencies and Insurance Receivables
—The Company and certain of its subsidiaries along with numerous other companies are named as defendants in personal injury lawsuits based on alleged exposure to asbestos-containing materials. The Company's estimate of the liability and corresponding insurance recovery for pending and future claims and defense costs is based on the Company's historical claim experience, and estimates of the number and resolution cost of potential future claims that may be filed. The Company's legal strategy for resolving claims also impacts these estimates.
80
The Company considers various trends and developments in evaluating the period of time (the look-back period) over which historical claim and settlement experience is used to estimate and value claims reasonably projected to be made in the future during a defined period of time (the look-forward period). On a quarterly basis, the Company assesses the sufficiency of its estimated liability for pending and future claims and defense costs by evaluating actual experience regarding claims filed, settled and dismissed, and amounts paid in settlements. In addition to claims and settlement experience, the Company considers additional quantitative and qualitative factors such as changes in legislation, the legal environment, and the Company's defense strategy. The Company also evaluates the recoverability of its insurance receivable on a quarterly basis. The Company evaluates all of these factors and determines whether a change in the estimate of its liability for pending and future claims and defense costs or insurance receivable is warranted.
In connection with the recognition of liabilities for asbestos-related matters, the Company records asbestos-related insurance recoveries that are probable. The Company's estimate of asbestos-related insurance recoveries represents estimated amounts due to the Company for previously paid and settled claims and the probable reimbursements relating to its estimated liability for pending and future claims. In determining the amount of insurance recoverable, the Company considers a number of factors, including available insurance, allocation methodologies, solvency and creditworthiness of the insurers. See Note 13 for additional information.
Insurable Liabilities
—The Company records liabilities for its workers' compensation, product, general and auto liabilities. The determination of these liabilities and related expenses is dependent on claims experience. For most of these liabilities, claims incurred but not yet reported are estimated by utilizing actuarial valuations based upon historical claims experience. Certain insurable liabilities, such as workers' compensation, are discounted using a risk-free rate of return when the pattern and timing of the future obligation is reliably determinable. The impact of the discount on the Consolidated Balance Sheets was to reduce the obligation by
$17 million
to
$74 million
as of
September 26, 2014
and by
$14 million
to
$58 million
as of
September 27, 2013
. The Company records receivables from third party insurers when recovery has been determined to be probable. The Company maintains captive insurance companies to manage certain of its insurable liabilities. During fiscal 2013 and a portion of 2014, the captive insurance companies held certain investment accounts for the purpose of providing collateral for the Company's insurable liabilities. These investment accounts were liquidated during fiscal 2014 and replaced with other investments. See Note 12 for additional information.
Fair Value of Financial Instruments
—Authoritative guidance for fair value measurements establishes a three-level hierarchy that ranks the quality and reliability of information used in developing fair value estimates for financial instruments. The hierarchy gives the highest priority to quoted prices in active markets and the lowest priority to unobservable data. In cases where two or more levels of inputs are used to determine fair value, a financial instrument's level is determined based on the lowest level input that is considered significant to the fair value measurement in its entirety. The three levels of the fair value hierarchy are summarized as follows:
|
•
|
Level 1—inputs are based upon quoted prices (unadjusted) in active markets for identical assets or liabilities which are accessible as of the measurement date.
|
|
•
|
Level 2—inputs are based upon quoted prices for similar assets or liabilities in active markets, quoted prices for identical or similar assets or liabilities in markets that are not active, and model-derived valuations for the asset or liability that are derived principally from or corroborated by market data for which the primary inputs are observable, including forward interest rates, yield curves, credit risk and exchange rates.
|
|
•
|
Level 3—inputs for the valuations are unobservable and are based on management's estimates and assumptions that market participants would use similar inputs in pricing the asset or liability. The fair values are therefore determined using model-based techniques such as option pricing models and discounted cash flow models.
|
Financial Instruments
—The Company may use interest rate swaps, currency swaps, forward and option contracts and commodity swaps to manage risks generally associated with interest rate risk, foreign exchange risk and commodity prices. Derivatives used for hedging purposes are designated and effective as a hedge of the identified risk exposure at the inception of the contract. Accordingly, changes in fair value of the derivative contract are highly effective at offsetting the changes in the fair value of the underlying hedged item at inception of the hedge and are expected to remain highly effective over the life of the hedge contract.
All derivative financial instruments are reported on the Consolidated Balance Sheets at fair value. Derivatives used to economically hedge foreign currency denominated balance sheet items related to operating activities are reported in Selling, general and administrative expenses along with offsetting transaction gains and losses on the items being hedged. Derivatives used to manage the exposure to changes in interest rates are reported in interest expense along with offsetting transaction gains and losses on the items being hedged. Gains and losses on net investment hedges are included in the cumulative translation adjustment component of accumulated other comprehensive loss to the extent they are effective. Gains and losses on derivatives
81
designated as cash flow hedges are recorded in accumulated other comprehensive loss and reclassified to earnings in a manner that matches the timing of the earnings impact of the hedged transactions. The Company classifies cash flows associated with the settlement of derivatives consistent with the nature of the transaction being hedged. The ineffective portion of all hedges, if any, is recognized currently in earnings. Instruments that do not qualify for hedge accounting are marked to market with changes recognized in current earnings. See Note 12 for additional information.
Redeemable Noncontrolling Interests
—Noncontrolling interest with redemption features, such as put options, that are not solely within the Company's control are considered redeemable noncontrolling interests. The Company accretes changes in the redemption value through noncontrolling interest in subsidiaries net income attributable to the noncontrolling interest over the period from the date of issuance to the earliest redemption date. Redeemable noncontrolling interest is considered to be temporary equity and is therefore reported in the mezzanine section between liabilities and equity on the Company's Consolidated Balance Sheet at the greater of the initial carrying amount increased or decreased for the noncontrolling interest's share of net income or loss or its redemption value.
Recently Adopted Accounting Pronouncements
—In January 2013, the Financial Accounting Standards Board ("FASB") issued authoritative guidance clarifying the scope of disclosures about offsetting assets and liabilities. The guidance clarifies that the scope of the disclosures applies to derivatives accounted for in accordance with authoritative guidance for derivatives and hedging, including bifurcated embedded derivatives, repurchase agreements and reverse repurchase agreements, and securities borrowing and securities lending transactions that either offset or are subject to an enforceable master netting agreement or similar agreement. The guidance is applied retrospectively and became effective for Tyco in the first quarter of fiscal 2014. The adoption of this guidance did not have a material impact on the Company's disclosures.
In February 2013, the FASB issued authoritative guidance for the reporting of amounts reclassified out of Accumulated other comprehensive income ("AOCI"). The amendment did not change the current requirements for reporting net income or Other comprehensive income ("OCI") in the financial statements. The guidance requires the presentation, either on the face of the statement where net income is presented or in the notes, of the significant reclassifications out of AOCI by the respective line items of net income if the amount reclassified is required under GAAP to be reclassified to net income in its entirety in the same reporting period. For other amounts that are not required under GAAP to be reclassified in their entirety to net income, the amendment requires a cross-reference to other disclosures under GAAP that provide additional detail about those amounts. The guidance became effective for Tyco in the first quarter of fiscal 2014 and additional disclosures are provided in Note 15.
Recently Issued Accounting Pronouncements
—In March 2013, the FASB issued authoritative guidance to resolve diversity in practice on the accounting for cumulative translation adjustment ("CTA") when a parent either sells a part or all of its investment in a foreign entity or no longer holds a controlling financial interest in a subsidiary or group of assets within a foreign entity. The guidance requires that the parent release any CTA into net income when the parent ceases to have a controlling financial interest in a subsidiary or group of assets within a foreign entity which results in a substantially complete liquidation of the foreign entity; when the sale of an investment in a foreign entity results in the loss of a controlling financial interest; or where an acquirer obtains control of an acquiree in which it had an equity interest immediately before the acquisition date. The guidance does not change the requirement to release a pro rata portion of the CTA into net income upon a partial sale of an equity method investment that is a foreign entity. The guidance will be effective for Tyco in the first quarter of fiscal 2015. The adoption of this guidance is not expected to have a significant impact on the Company's disclosures.
In July 2013, the FASB issued authoritative guidance for the presentation of an unrecognized tax benefit when a net operating loss (“NOL”) carryforward, a similar tax loss, or a tax credit carryforward exists. The guidance requires an entity to present an unrecognized tax benefit, or a portion of an unrecognized tax benefit, in the financial statements as a reduction to a deferred tax asset for a NOL carryforward, a similar tax loss, or a tax credit carryforward. If the NOL carryforward, a similar tax loss, or a tax credit carryforward is not available at the reporting date under the tax law of the jurisdiction or the tax law of the jurisdiction does not require the entity to use, and the entity does not intend to use, the deferred tax asset for such purpose, the unrecognized tax benefit will be presented in the financial statements as a liability and will not be combined with deferred tax assets. This guidance will be effective for Tyco the first fiscal quarter of fiscal 2015. The Company does not expect the guidance to have a significant impact on its disclosures.
In April 2014, the FASB issued authoritative guidance to change the criteria for reporting discontinued operations. Under the new guidance, only disposals representing a strategic shift in a company's operations and financial results should be reported as discontinued operations, with expanded disclosures. In addition, disclosure of the pre-tax income attributable to a disposal of a significant part of an organization that does not qualify as a discontinued operation is required. This guidance is effective for Tyco in the first quarter of fiscal 2016, with early adoption permitted. The Company is currently assessing the impact, if any, the guidance will have upon adoption.
82
In May 2014, the FASB issued authoritative guidance for revenue from contracts with customers, which provides a single comprehensive revenue recognition model to apply in determining how and when to recognize revenue. The core principle of the guidance is that an entity should recognize revenue to depict the transfer of promised goods or services to customers in an amount that reflects the consideration to which the entity expects to be entitled in exchange for those goods or services. When applying the new revenue model to contracts with customers the guidance requires five steps to be applied, which include: 1) identify the contract(s) with a customer, 2) identify the performance obligations in the contract, 3) determine the transaction price, 4) allocate the transaction price to the performance obligations in the contract and 5) recognize revenue when (or as) the entity satisfies a performance obligation. The guidance also requires both quantitative and qualitative disclosures, which are more comprehensive than existing revenue standards. The disclosures are intended to enable financial statement users to understand the nature, timing and uncertainty of revenue and the related cash flow. This guidance will be effective for Tyco in the first fiscal quarter of 2018, with early adoption not permitted. The Company is currently assessing the impact the guidance will have upon adoption.
In August 2014, the FASB issued authoritative guidance to determine when and how a company is required to disclose going-concern uncertainties in the financial statements. The guidance requires management to perform interim and annual assessments of an entity’s ability to continue as a going concern within one year of the date the financial statements are issued. An entity must provide certain disclosures if conditions or events raise substantial doubt about the entity’s ability to continue as a going concern. This guidance is effective for Tyco in the first quarter of fiscal 2018, with early adoption permitted. The Company is currently assessing the impact the guidance will have upon adoption.
2. 2012 Separation Transaction
On September 28, 2012, the Company completed the spin-offs of ADT and Tyco Flow Control, formerly the North American residential security and flow control businesses of Tyco, respectively, into separate, publicly traded companies in the form of a distribution to Tyco shareholders. In connection with activities taken to complete the 2012 Separation and to create the revised organizational structure of the Company, the Company incurred pre-tax charges ("Separation Charges") of
$54 million
,
$61 million
and
$839 million
for the years ended
September 26, 2014
,
September 27, 2013
and
September 28, 2012
respectively. The amounts presented within discontinued operations are costs directly related to the 2012 Separation that are not expected to provide a future benefit to the Company. The components of the Separation Charges incurred within continuing operations and discontinued operations consisted of the following ($ in millions):
83
|
|
For the Year Ended
September 26, 2014
|
For the Year Ended
September 27, 2013
|
For the Year Ended
September 28, 2012 |
||||||||||||||||||||||||||||||||
|
|
Continuing
Operations
|
Discontinued
Operations
|
Total
|
Continuing
Operations
|
Discontinued
Operations
|
Total
|
Continuing
Operations |
Discontinued
Operations |
Total
|
||||||||||||||||||||||||||
|
Loss on extinguishment of debt (See Note 10)
|
$
|
—
|
|
$
|
—
|
|
$
|
—
|
|
$
|
—
|
|
$
|
—
|
|
$
|
—
|
|
$
|
453
|
|
$
|
—
|
|
$
|
453
|
|
||||||||
|
Professional fees
|
2
|
|
—
|
|
2
|
|
5
|
|
1
|
|
6
|
|
—
|
|
191
|
|
191
|
|
|||||||||||||||||
|
Non-cash impairment charges
|
—
|
|
—
|
|
—
|
|
—
|
|
—
|
|
—
|
|
23
|
|
—
|
|
23
|
|
|||||||||||||||||
|
Information technology related costs
|
12
|
|
—
|
|
12
|
|
10
|
|
—
|
|
10
|
|
—
|
|
30
|
|
30
|
|
|||||||||||||||||
|
Employee compensation costs
|
—
|
|
1
|
|
1
|
|
3
|
|
1
|
|
4
|
|
74
|
|
17
|
|
91
|
|
|||||||||||||||||
|
Marketing costs
|
32
|
|
—
|
|
32
|
|
40
|
|
—
|
|
40
|
|
3
|
|
5
|
|
8
|
|
|||||||||||||||||
|
Interest expense
|
—
|
|
—
|
|
—
|
|
—
|
|
—
|
|
—
|
|
—
|
|
3
|
|
3
|
|
|||||||||||||||||
|
Other costs (income)
|
7
|
|
—
|
|
7
|
|
11
|
|
(10
|
)
|
1
|
|
8
|
|
32
|
|
40
|
|
|||||||||||||||||
|
Total pre-tax separation charges (income)
|
53
|
|
1
|
|
54
|
|
69
|
|
(8
|
)
|
61
|
|
561
|
|
278
|
|
839
|
|
|||||||||||||||||
|
Tax-related separation charges (income)
|
9
|
|
—
|
|
9
|
|
22
|
|
—
|
|
22
|
|
266
|
|
(2
|
)
|
264
|
|
|||||||||||||||||
|
Tax benefit on pre-tax separation charges
|
(15
|
)
|
—
|
|
(15
|
)
|
(13
|
)
|
—
|
|
(13
|
)
|
(5
|
)
|
(5
|
)
|
(10
|
)
|
|||||||||||||||||
|
Total separation charges, net of tax benefit
|
$
|
47
|
|
$
|
1
|
|
$
|
48
|
|
$
|
78
|
|
$
|
(8
|
)
|
$
|
70
|
|
$
|
822
|
|
$
|
271
|
|
$
|
1,093
|
|
||||||||
Pre-tax separation charges were classified in continuing operations within the Company's Consolidated Statement of Operations as follows ($ in millions):
|
For the Years Ended
|
|||||||||||
|
|
September 26, 2014
|
September 27, 2013
|
September 28, 2012
|
||||||||
|
Selling, general and administrative expenses ("SG&A")
|
$
|
52
|
|
$
|
61
|
|
$
|
4
|
|
||
|
Separation costs
|
1
|
|
8
|
|
71
|
|
|||||
|
Restructuring and asset impairment charges, net
|
—
|
|
—
|
|
33
|
|
|||||
|
Other expense, net
|
—
|
|
—
|
|
453
|
|
|||||
|
Total
|
$
|
53
|
|
$
|
69
|
|
$
|
561
|
|
||
84
3. Divestitures
The Company has continued to assess the strategic fit of its various businesses and has pursued the divestiture of certain businesses which do not align with its long-term strategy.
Fiscal 2014
On May 22, 2014, the Company, together with its wholly-owned subsidiary Tyco Far East Holdings Ltd. (the “Seller”) completed the sale of Tyco Fire & Security Services Korea Co. Ltd. and its subsidiaries that formed and operated the Company’s ADT Korea business to an affiliate of The Carlyle Group. The transaction took the form of a sale by the Seller of all of the stock of Tyco Fire & Security Services Korea Co. Ltd. for an aggregate purchase price of
$1.93 billion
, subject to customary adjustments as set forth in the stock purchase agreement. During the third quarter of fiscal 2014, the Company recognized a gain of
$1.0 billion
, net of a
$212 million
charge related to the indemnification at fair value for certain tax related matters borne by the buyer that are probable of being paid. The net gain was recorded in Income from discontinued operations, net of income taxes, on the Consolidated Statements of Operations for the year ended September 26, 2014. During the fourth quarter of fiscal 2014, the Company recorded a working capital adjustment, which reduced the net gain by
$15 million
. This business was accounted for as held for sale on the Consolidated Balance Sheets as of September 27, 2013, and its results of operations have been presented within discontinued operations on the Consolidated Statements of Operations for the years ended
September 26, 2014
,
September 27, 2013
and
September 28, 2012
.
The Company intends to sell several businesses in the ROW Installation and Services segment by the end of the third quarter of fiscal 2015. The businesses are accounted for as held for sale on the Consolidated Balance Sheets as of
September 26, 2014
and
September 27, 2013
, and their results of operations have been presented as discontinued operations on the Consolidated Statements of Operations during the years ended
September 26, 2014
and
September 27, 2013
. During the quarter ended June 27, 2014, the Company recorded a
$1 million
impairment loss related to writing down the net assets to their fair value.
On March 6, 2014, the Company announced Atkore International Group Inc.'s (“Atkore”) intention to redeem all of the Company’s remaining common equity stake in Atkore. The redemption was completed on April 9, 2014 for aggregate cash proceeds of
$250 million
. This amount may be adjusted upward by up to
$25 million
if, prior to December 31, 2014, there is a sale or merger of Atkore, a sale of substantially all of Atkore's assets or an initial public offering of Atkore's stock. The Company recognized a net gain of
$216 million
related to this transaction, which is included in Equity income (loss) in earnings of unconsolidated subsidiaries in the Consolidated Statement of Operations for the year ended
September 26, 2014
. The net gain is comprised of a
$227 million
gain on the sale of the equity investment, partially offset by an
$11 million
loss, which is the Company's share of loss on Atkore's debt extinguishment undertaken in connection with the redemption.
Fiscal 2013
During the fourth quarter of fiscal 2013, the Company approved a plan to sell its armored guard business in New Zealand and its fire and security business in Fiji, both of which were in its ROW Installation & Services segment. The sale was completed during the first quarter of fiscal 2014. The assets and liabilities have not been presented separately as held-for-sale in the Consolidated Balance Sheets as the amounts were not material to the presentation of all periods. A pre-tax loss of approximately
$13 million
for the write-down to fair value, less cost to sell was recorded in Restructuring and asset impairment charges, net in the Company's Consolidated Statements of Operations for the year ended
September 27, 2013
. This business has not been presented in discontinued operations as the amounts were not material to the Consolidated Financial Statements.
During the third quarter of fiscal 2013, the Company completed the sale of its North America guarding business in its NA Installation & Services segment for approximately
$25 million
of cash proceeds, net of
$2 million
of cash divested on sale. The pre-tax loss for the write-down to fair value, less cost to sell, was not material. This business was accounted for as held for sale during the second quarter of fiscal 2013; however, its results of operations have not been presented in discontinued operations as the amounts were not material to the Consolidated Financial Statements.
Fiscal 2012
On
September 28, 2012
, Tyco completed the 2012 Separation and has presented its former North American residential security and flow control businesses as discontinued operations in all periods prior to the completion of the 2012 Separation. See Note 2 for additional information regarding the 2012 Separation. At the time of the 2012 Separation, the Company used available information to develop its best estimates for certain assets and liabilities related to the Separation. In limited instances, final determination of the balances will be made in subsequent periods, such as in the case of when final income tax returns are filed in certain jurisdictions where those returns include a combination of Tyco, ADT and/or Tyco Flow Control legal entities.
85
During the year ended
September 27, 2013
, a net increase of
$1 million
was recorded within the Consolidated Statement of Shareholders' Equity as Other, primarily related to a cash true-up adjustment received from Pentair in the third quarter of fiscal 2013, offset by a cash true-up adjustment paid to ADT during the first quarter of fiscal 2013 and adjustments for the impact of filing final income tax returns. Any additional adjustments are not expected to be material.
During the year ended
September 28, 2012
, the Company sold its Fire Equipment de Mexico, S.A. business, which was part of the Company's Global Products segment. The sale was completed for approximately
$1 million
of cash consideration and a pre-tax loss of
$3 million
was recorded in Income from discontinued operations, net of income taxes in the Company's Consolidated Statements of Operations.
Discontinued Operations
The components of income from discontinued operations, net of income taxes are as follows ($ in millions):
|
|
For the Years Ended
|
||||||||||
|
|
September 26, 2014
|
September 27,
2013
|
September 28,
2012 |
||||||||
|
Net revenue
|
$
|
395
|
|
$
|
573
|
|
$
|
7,657
|
|
||
|
Pre-tax income from discontinued operations
|
$
|
58
|
|
$
|
101
|
|
$
|
1,316
|
|
||
|
Pre-tax separation (income) charges included within discontinued operations (See Note 2)
|
(1
|
)
|
8
|
|
(278
|
)
|
|||||
|
Pre-tax gain on sale of discontinued operations
|
1,160
|
|
—
|
|
4
|
|
|||||
|
Income tax expense
|
(173
|
)
|
(16
|
)
|
(158
|
)
|
|||||
|
Income from discontinued operations, net of income taxes
|
$
|
1,044
|
|
$
|
93
|
|
$
|
884
|
|
||
Total assets and total liabilities of discontinued operations as of
September 26, 2014
and
September 27, 2013
were as follows ($ in millions):
|
As of
|
|||||||
|
September 26,
2014 |
September 27,
2013 |
||||||
|
Accounts receivables, net
|
$
|
11
|
|
$
|
34
|
|
|
|
Inventories
|
3
|
|
10
|
|
|||
|
Prepaid expenses and other current assets
|
5
|
|
22
|
|
|||
|
Property, plant and equipment, net
|
—
|
|
393
|
|
|||
|
Goodwill and intangible assets, net
|
—
|
|
370
|
|
|||
|
Other assets
|
2
|
|
27
|
|
|||
|
Total assets
|
$
|
21
|
|
$
|
856
|
|
|
|
Accounts payable
|
2
|
|
52
|
|
|||
|
Accrued and other current liabilities
|
9
|
|
66
|
|
|||
|
Other liabilities
|
2
|
|
118
|
|
|||
|
Total liabilities
|
$
|
13
|
|
$
|
236
|
|
|
Other Matters
The Company has used available information to develop its best estimates for certain assets and liabilities related to the 2007 Separation. In limited instances, final determination of the balances will be made in subsequent periods. There were no adjustments recorded through Tyco shareholders' equity for the years ended
September 26, 2014
,
September 27, 2013
, and
September 28, 2012
. Adjustments in the future for the impact of filing final income tax returns in certain jurisdictions where those returns include a combination of Tyco, Covidien and/or TE Connectivity legal entities and for certain amended income tax returns for the periods prior to the 2007 Separation may be recorded to either Tyco shareholders' equity or the Consolidated Statement of Operations depending on the specific item giving rise to the adjustment.
Additionally, the year ended
September 28, 2012
included
$21 million
of income tax expense associated with pre-2007 Separation tax liabilities, which was recorded in Income from discontinued operations, net of income taxes in the Company's Consolidated Statements of Operations. There was no income tax expense associated with pre-2007 Separation tax
86
liabilities for both years ended
September 26, 2014
and
September 27, 2013
. During the year ended
September 28, 2012
, the Company was reimbursed
$8 million
pursuant to a tax sharing agreement entered into in conjunction with the 2007 Separation (the "2007 Tax Sharing Agreement"), which has been recorded in Income from discontinued operations, net of income taxes in the Company's Consolidated Statements of Operations. See Note 6 for additional information.
Divestiture (Gains) Charges, Net
During
2014
,
2013
and
2012
, the Company recorded a net gain of
$2 million
, and net losses of
$20 million
and
$14 million
, respectively, in Selling, general and administrative expenses in the Company's Consolidated Statements of Operations. The net gain for the year ended
September 26, 2014
was primarily the result of a favorable court judgment relating to a divested business in our ROW Installation & Services segment. The net loss for the year ended
September 27, 2013
primarily resulted from the write-down to fair value, less cost to sell, of the armored guard business in New Zealand and the fire and security business in Fiji, both of which are in our ROW Installation & Services segment. The net loss for the year ended
September 28, 2012
primarily resulted from an indemnification resulting from the divestiture of the Company's Electrical and Metal products business.
4. Restructuring and Asset Impairment Charges, Net
During fiscal 2014, the Company identified and pursued opportunities for cost savings through restructuring activities and workforce reductions to improve operating efficiencies across the Company's businesses. The Company expects to incur restructuring and restructuring related charges of in the range of
$75 million
to
$100 million
in fiscal 2015, which does not include repositioning charges as discussed below.
The Company recorded restructuring and asset impairment charges by action and Consolidated Statement of Operations classification as follows ($ in millions):
|
|
For the Years Ended
|
||||||||||
|
|
September 26, 2014
|
September 27, 2013
|
September 28, 2012
|
||||||||
|
2014 actions
|
$
|
44
|
|
$
|
—
|
|
$
|
—
|
|
||
|
2013 actions
|
6
|
|
99
|
|
—
|
|
|||||
|
2012 and prior actions
|
(1
|
)
|
12
|
|
104
|
|
|||||
|
Total restructuring and asset impairment charges, net
|
$
|
49
|
|
$
|
111
|
|
$
|
104
|
|
||
|
Charges reflected in SG&A
|
2
|
|
—
|
|
—
|
|
|||||
|
Charges reflected in restructuring and asset impairment charges, net
|
$
|
47
|
|
$
|
111
|
|
$
|
104
|
|
||
87
2014 Actions
Restructuring and asset impairment charges, net, during the year ended
September 26, 2014
related to the 2014 actions are as follows ($ in millions):
|
|
For the Year Ended
September 26, 2014
|
||||||||||||||
|
|
Employee
Severance and
Benefits
|
Facility Exit
and Other
Charges
|
Charges Reflected in SG&A
|
Total
|
|||||||||||
|
NA Installation & Services
|
$
|
16
|
|
$
|
—
|
|
$
|
—
|
|
$
|
16
|
|
|||
|
ROW Installation & Services
|
18
|
|
5
|
|
—
|
|
23
|
|
|||||||
|
Global Products
|
3
|
|
—
|
|
2
|
|
5
|
|
|||||||
|
Total
|
$
|
37
|
|
$
|
5
|
|
$
|
2
|
|
$
|
44
|
|
|||
The rollforward of the reserves related to 2014 actions from
September 27, 2013
to
September 26, 2014
is as follows ($ in millions):
|
Balance as of September 27, 2013
|
$
|
—
|
|
|
Charges
|
43
|
|
|
|
Reversals
|
(1
|
)
|
|
|
Utilization
|
(12
|
)
|
|
|
Currency translation
|
(1
|
)
|
|
|
Balance as of September 26, 2014
|
$
|
29
|
|
Restructuring reserves for businesses that are included within Liabilities held for sale on the Consolidated Balance Sheets are excluded from the table above. See Note 3 for additional information.
2013 Actions
Restructuring and asset impairment charges, net, during the years ended
September 26, 2014
and
September 27, 2013
related to the 2013 actions are as follows ($ in millions):
|
|
For the Year Ended
September 26, 2014 |
||||||||||
|
|
Employee
Severance and
Benefits
|
Facility Exit
and Other
Charges
|
Total
|
||||||||
|
NA Installation & Services
|
$
|
(3
|
)
|
$
|
1
|
|
$
|
(2
|
)
|
||
|
ROW Installation & Services
|
3
|
|
—
|
|
3
|
|
|||||
|
Global Products
|
4
|
|
1
|
|
5
|
|
|||||
|
Total
|
$
|
4
|
|
$
|
2
|
|
$
|
6
|
|
||
|
|
For the Year Ended
September 27, 2013
|
||||||||||
|
|
Employee
Severance and
Benefits
|
|
Facility Exit
and Other
Charges
|
|
Total
|
||||||
|
NA Installation & Services
|
$
|
34
|
|
|
$
|
1
|
|
|
$
|
35
|
|
|
ROW Installation & Services
|
46
|
|
|
4
|
|
|
50
|
|
|||
|
Global Products
|
9
|
|
|
2
|
|
|
11
|
|
|||
|
Corporate and Other
|
3
|
|
|
—
|
|
|
3
|
|
|||
|
Total
|
$
|
92
|
|
|
$
|
7
|
|
|
$
|
99
|
|
88
Restructuring and asset impairment charges, net, incurred cumulative to date from initiation of the 2013 actions are as follows ($ in millions):
|
|
Employee
Severance and Benefits |
Facility Exit
and Other Charges |
Total
|
||||||||
|
NA Installation & Services
|
$
|
31
|
|
$
|
2
|
|
$
|
33
|
|
||
|
ROW Installation & Services
|
49
|
|
4
|
|
53
|
|
|||||
|
Global Products
|
13
|
|
3
|
|
16
|
|
|||||
|
Corporate and Other
|
3
|
|
—
|
|
3
|
|
|||||
|
Total
|
$
|
96
|
|
$
|
9
|
|
$
|
105
|
|
||
The rollforward of the reserves related to 2013 actions from
September 27, 2013
to
September 26, 2014
is as follows ($ in millions):
|
Balance as of September 27, 2013
|
$
|
68
|
|
|
Charges
|
13
|
|
|
|
Reversals
|
(8
|
)
|
|
|
Utilization
|
(40
|
)
|
|
|
Currency translation
|
(1
|
)
|
|
|
Balance as of September 26, 2014
|
$
|
32
|
|
Restructuring reserves for businesses that are included within Liabilities held for sale on the Consolidated Balance Sheets are excluded from the table above. See Note 3 for additional information.
2012 and prior actions
The Company continues to maintain restructuring reserves related to actions initiated prior to fiscal 2013. The total amount of these reserves was
$38 million
,
$62 million
and
$102 million
as of
September 26, 2014
,
September 27, 2013
and
September 28, 2012
, respectively. The Company recorded
$1 million
of restructuring reversals, net and
$12 million
and
$104 million
of restructuring charges, net, and utilized
$22 million
,
$52 million
and
$89 million
for the year ended
September 26, 2014
,
September 27, 2013
and
September 28, 2012
, respectively, related to 2012 and prior actions. The aggregate remaining reserves primarily relate to facility exit costs for long-term non-cancelable lease obligations primarily within the Company's ROW Installation & Services segment.
Total Restructuring Reserves
As of
September 26, 2014
and
September 27, 2013
, restructuring reserves related to all actions were included in the Company's Consolidated Balance Sheets as follows ($ in millions):
|
|
As of
|
||||||
|
|
September 26,
2014
|
September 27,
2013
|
|||||
|
Accrued and other current liabilities
|
$
|
83
|
|
$
|
112
|
|
|
|
Other liabilities
|
16
|
|
18
|
|
|||
|
Total
|
$
|
99
|
|
$
|
130
|
|
|
Restructuring reserves for businesses that are included within Liabilities held for sale on the Consolidated Balance Sheets are excluded from the table above. See Note 3 for additional information.
Repositioning
The Company has initiated certain global actions designed to reduce its cost structure and improve future profitability by streamlining operations and better aligning functions, which the Company refers to as repositioning actions. These actions may or may not lead to a future restructuring action. During the years ended
September 26, 2014
and
September 27, 2013
, the Company recorded repositioning charges of
$44 million
and
$20 million
, respectively, primarily related to professional fees which have
89
been reflected in Selling, general and administrative expenses in the Consolidated Statement of Operations. There were
no
repositioning charges incurred during fiscal 2012.
5. Acquisitions
Acquisitions
During the year ended September 26, 2014, total consideration for acquisitions included in continuing operations was
$66 million
, which was comprised of
$65 million
of cash paid, net of cash acquired of
$1 million
, and
$1 million
of contingent consideration. This was primarily comprised of
$53 million
of cash paid, net of
$1 million
cash acquired, and
$1 million
of contingent consideration for the acquisition of Westfire, Inc. ("Westfire") on November 8, 2013. Westfire, a fire protection services company with operations in the United States, Chile and Peru, provides critical special-hazard suppression and detection applications in mining, telecommunications and other vertical markets and has been integrated with the NA Installation & Services and ROW Installation & Services segments. The balance of the acquisitions for the year ended September 26, 2014 were included in the Company's ROW Installation & Services segment, none of which were material individually or in the aggregate.
During the quarter ended September 26, 2014, the Company also paid
$66 million
in cash to purchase the remaining ownership interest of a joint venture in Brazil, which has been consolidated into the Company's ROW Installation & Services segment. In connection with Tyco’s acquisition of the remaining ownership interest in this joint venture, the Company recorded an indemnification asset of approximately
$11 million
relating to the indemnification of Tyco for certain pre-acquisition tax liabilities, in accordance with the purchase agreement.
During the year ended September 27, 2013, total consideration for acquisitions included in continuing operations was
$257 million
, which was comprised of
$229 million
cash paid, net of cash acquired of
$9 million
, and
$28 million
of consideration that is primarily contingent on the successful transfer of a business license in China to Tyco. The transfer of this license occurred during the first quarter of fiscal 2015. Cash paid for acquisitions primarily related to the acquisition of Exacq Technologies ("Exacq") on July 26, 2013 by the Company's Global Products segment. Exacq is a developer of open architecture video management systems for security and surveillance applications. Cash paid for Exacq totaled approximately
$148 million
, net of cash acquired of
$2 million
. The balance of the acquisitions for the year ended September 27, 2013 were included within the Company's NA Installation & Services and ROW Installation & Services segments, none of which were material individually or in the aggregate.
During the year ended September 28, 2012, cash paid for acquisitions included in continuing operations totaled
$217 million
, net of cash acquired of
$17 million
, which primarily related to the acquisition of Visonic Ltd. ("Visonic") on December 6, 2011. Visonic is a global developer and manufacturer of electronic security systems and components. Cash paid for Visonic totaled approximately
$94 million
, net of cash acquired of
$5 million
by the Company's Global Products segment. The balance of the acquisitions for the year ended September 28, 2012, were included within the Company's NA and ROW Installation & Services and Global Products segments, none of which were material individually or in the aggregate.
The Company recorded redeemable noncontrolling interest of
$12 million
related to an acquisition in the second quarter of 2012. Net loss and adjustments related to changes in the redemption value were immaterial during the years ended September 26, 2014 and September 27, 2013. The Company's redeemable noncontrolling interest balance was
$13 million
as of September 26, 2014 and
$12 million
as of September 27, 2013.
Acquisition and Integration Related Costs
Acquisition and integration costs are expensed as incurred. During the years ended
September 26, 2014
,
September 27, 2013
and
September 28, 2012
, the Company incurred acquisition and integration costs of
$3 million
,
$4 million
and
$9 million
, respectively. Such costs are recorded in Selling, general and administrative expenses in the Company's Consolidated Statements of Operations.
90
6. Income Taxes
Significant components of the income tax provision for fiscal
2014
,
2013
and
2012
are as follows ($ in millions):
|
For the Years Ended
|
|||||||||||
|
September 26, 2014
|
September 27, 2013
|
September 28, 2012
|
|||||||||
|
Current:
|
|
|
|
||||||||
|
United States:
|
|
|
|
||||||||
|
Federal
|
$
|
10
|
|
$
|
14
|
|
$
|
(4
|
)
|
||
|
State
|
18
|
|
8
|
|
6
|
|
|||||
|
Non U.S.
|
95
|
|
81
|
|
147
|
|
|||||
|
Current income tax provision
|
$
|
123
|
|
$
|
103
|
|
$
|
149
|
|
||
|
Deferred:
|
|
|
|
||||||||
|
United States:
|
|
|
|
||||||||
|
Federal
|
$
|
(79
|
)
|
$
|
(12
|
)
|
$
|
(10
|
)
|
||
|
State
|
(24
|
)
|
5
|
|
(2
|
)
|
|||||
|
Non U.S.
|
4
|
|
12
|
|
183
|
|
|||||
|
Deferred income tax provision
|
$
|
(99
|
)
|
$
|
5
|
|
$
|
171
|
|
||
|
$
|
24
|
|
$
|
108
|
|
$
|
320
|
|
|||
Non-U.S. income from continuing operations before income taxes was
$1.1 billion
,
$844 million
and
$87 million
for fiscal
2014
,
2013
and
2012
, respectively.
The reconciliation between U.S. federal income taxes at the statutory rate and the Company's provision for income taxes on continuing operations for the years ended
September 26, 2014
,
September 27, 2013
and
September 28, 2012
is as follows ($ in millions):
_______________________________________________________________________________
|
For the Years Ended
|
|||||||||||
|
September 26, 2014
|
September 27, 2013
|
September 28, 2012
|
|||||||||
|
Notional U.S. federal income tax expense at the statutory rate
|
$
|
215
|
|
$
|
206
|
|
$
|
(24
|
)
|
||
|
Adjustments to reconcile to the income tax provision:
|
|
|
|
||||||||
|
U.S. state income tax provision, net
|
(12
|
)
|
(3
|
)
|
6
|
|
|||||
|
Non U.S. net earnings
(1)
|
(232
|
)
|
(172
|
)
|
33
|
|
|||||
|
Nondeductible charges
|
47
|
|
78
|
|
61
|
|
|||||
|
Valuation allowance
|
4
|
|
4
|
|
235
|
|
|||||
|
Other
|
2
|
|
(5
|
)
|
9
|
|
|||||
|
Provision for income taxes
|
$
|
24
|
|
$
|
108
|
|
$
|
320
|
|
||
|
(1)
|
Excludes nondeductible charges and other items which are broken out separately in the table.
|
91
2012 Separation related charges associated with the early extinguishment of debt further increased a net operating loss carryforward in 2012, which the Company does not expect to realize in future periods. The valuation allowance on this loss carryforward is included in the Valuation allowance line of the table above.
Nondeductible charges during fiscal 2013 and 2012 are primarily related to separation costs incurred.
Deferred income taxes result from temporary differences between the amount of assets and liabilities recognized for financial reporting and tax purposes. The components of the net deferred income tax asset as of
September 26, 2014
and
September 27, 2013
are as follows ($ in millions):
|
As of
|
|||||||
|
September 26, 2014
|
September 27, 2013
|
||||||
|
Deferred tax assets:
|
|
|
|||||
|
Accrued liabilities and reserves
|
$
|
483
|
|
$
|
285
|
|
|
|
Tax loss and credit carryforwards
|
2,312
|
|
2,432
|
|
|||
|
Postretirement benefits
|
106
|
|
183
|
|
|||
|
Deferred revenue
|
120
|
|
111
|
|
|||
|
Other
|
173
|
|
102
|
|
|||
|
3,194
|
|
3,113
|
|
||||
|
Deferred tax liabilities:
|
|||||||
|
Property, plant and equipment
|
(92
|
)
|
(132
|
)
|
|||
|
Intangibles assets
|
(537
|
)
|
(566
|
)
|
|||
|
Other
|
(160
|
)
|
(167
|
)
|
|||
|
(789
|
)
|
(865
|
)
|
||||
|
Net deferred tax asset before valuation allowance
|
2,405
|
|
2,248
|
|
|||
|
Valuation allowance
|
(1,995
|
)
|
(1,948
|
)
|
|||
|
Net deferred tax asset
|
$
|
410
|
|
$
|
300
|
|
|
The valuation allowance for deferred tax assets of
$2.0 billion
and
$1.9 billion
as of
September 26, 2014
and
September 27, 2013
, respectively, relates principally to the uncertainty of the utilization of certain deferred tax assets, primarily tax loss and credit carryforwards in various jurisdictions. The valuation allowance as of
September 26, 2014
and
September 27, 2013
includes separation related charges associated with the early extinguishment of debt which further increased a net operating loss carryforward which the Company does not expect to realize in future periods. The valuation allowance was calculated and recorded when the Company determined that it was more-likely-than-not that all or a portion of our deferred tax assets would not be realized. The Company believes that it will generate sufficient future taxable income to realize the tax benefits related to the remaining net deferred tax assets on the Company's Consolidated Balance Sheets.
As of
September 26, 2014
, deferred tax assets of approximately
$140 million
relate to certain operating loss carryforwards resulting from the exercise of employee stock options and restricted stock vestings, the tax benefit of which, when recognized, will be accounted for as a credit to additional paid-in capital rather than a reduction of income tax provision.
As of
September 26, 2014
, the Company had
$7,713 million
of net operating loss carryforwards in certain non-U.S. jurisdictions. Of these,
$7,140 million
have no expiration, and the remaining
$573 million
will expire in future years through 2034. In the U.S., there were approximately
$352 million
of federal and
$223 million
of state net operating loss carryforwards as of
September 26, 2014
, which will expire in future years through 2034.
As of
September 26, 2014
and
September 27, 2013
, the Company had unrecognized tax benefits of
$267 million
and
$256 million
, respectively, of which
$247 million
and
$235 million
, if recognized, would affect the effective tax rate. The Company recognizes interest and penalties related to unrecognized tax benefits in income tax expense. The Company accrued interest and penalties related to the unrecognized tax benefits of
$36 million
and
$39 million
as of
September 26, 2014
and
September 27, 2013
, respectively. The Company recognized
$1 million
,
$1 million
and
$2 million
of income tax expense for interest and penalties related to unrecognized tax benefits for the years ended
September 26, 2014
,
September 27, 2013
and
September 28, 2012
, respectively.
92
A rollforward of unrecognized tax benefits as of
September 26, 2014
,
September 27, 2013
and
September 28, 2012
is as follows ($ in millions):
|
As of
|
|||||||||||
|
September 26, 2014
|
September 27, 2013
|
September 28, 2012
|
|||||||||
|
Balance as of beginning of year
|
$
|
256
|
|
$
|
120
|
|
$
|
144
|
|
||
|
Additions based on tax positions related to the current year
|
46
|
|
137
|
|
18
|
|
|||||
|
Additions based on tax positions related to prior years
|
7
|
|
7
|
|
7
|
|
|||||
|
Reductions based on tax positions related to prior years
|
(39
|
)
|
(6
|
)
|
(38
|
)
|
|||||
|
Reductions related to settlements
|
(1
|
)
|
—
|
|
(1
|
)
|
|||||
|
Reductions related to lapse of the applicable statute of limitations
|
(2
|
)
|
(2
|
)
|
(3
|
)
|
|||||
|
Foreign currency translation adjustments
|
—
|
|
—
|
|
(7
|
)
|
|||||
|
Balance as of end of year
|
$
|
267
|
|
$
|
256
|
|
$
|
120
|
|
||
Certain of Tyco's uncertain tax positions relate to tax years that remain subject to audit by the taxing authorities in the U.S. federal, state and local or foreign jurisdictions. Open tax years in significant jurisdictions are as follows:
|
Jurisdiction
|
Years
Open To Audit
|
|
Australia
|
2004-2013
|
|
Canada
|
2006-2013
|
|
Germany
|
2005-2013
|
|
Switzerland
|
2004-2013
|
|
United Kingdom
|
2012-2013
|
|
United States
|
1997-2013
|
Based on the current status of its income tax audits, the Company believes that it is reasonably possible that between
nil
and
$20 million
in unrecognized tax benefits may be resolved in the next twelve months.
Tax Sharing Agreements and Other Income Tax Matters
In connection with the 2012 and 2007 Separations, the Company entered into the 2012 and 2007 Tax Sharing Agreements, respectively, that govern the respective rights, responsibilities, and obligations of Tyco, Pentair and ADT after the 2012 Separation and Tyco, Covidien and TE Connectivity after the 2007 Separation with respect to taxes. Specifically this includes ordinary course of business taxes and taxes, if any, incurred as a result of any failure of the distribution of all of the shares of Pentair, ADT, Covidien or TE Connectivity to qualify as a tax-free distribution for U.S. federal income tax purposes within the meaning of Section 355 of the Internal Revenue Code ("the Code") or certain internal transactions undertaken in anticipation of the spin-offs to qualify for tax-favored treatment under the Code.
Under the 2012 Tax Sharing Agreement Tyco, Pentair and ADT share (i) certain pre-Distribution income tax liabilities that arise from adjustments made by tax authorities to ADT's, Tyco Flow Control's and Tyco's income tax returns, and (ii) payments required to be made by Tyco with respect to the 2007 Tax Sharing Agreement, excluding approximately
$175 million
of pre-2012 Separation related tax liabilities that were anticipated to be paid prior to the 2012 Separation (collectively, "Shared Tax Liabilities"). Tyco will be responsible for the first
$500 million
of Shared Tax Liabilities. Pentair and ADT will share
42%
and
58%
, respectively, of the next
$225 million
of Shared Tax Liabilities. Tyco, Pentair and ADT will share
52.5%
20%
and
27.5%
, respectively, of Shared Tax Liabilities above
$725 million
. All costs and expenses associated with the management of these shared tax liabilities will generally be shared
20%
,
27.5%
, and
52.5%
by Pentair, ADT and Tyco, respectively. In connection with the execution of the 2012 Tax Sharing Arrangement, Tyco established liabilities representing the fair market value of its obligations which was recorded in other liabilities in the Company's Consolidated Balance Sheet with an offset to Tyco shareholders' equity.
Under the 2007 Tax Sharing Agreement, Tyco shares responsibility for certain of its, Covidien's and TE Connectivity's income tax liabilities, which result in cash payments, based on a sharing formula for periods prior to and including June 29, 2007. More specifically, Tyco, Covidien and TE Connectivity share
27%
,
42%
and
31%
, respectively, of shared income tax liabilities that arise from adjustments made by tax authorities to Tyco's, Covidien's and TE Connectivity's U.S. and certain
93
non-U.S. income tax returns. The costs and expenses associated with the management of these shared tax liabilities are generally shared equally among the parties. In connection with the execution of the 2007 Tax Sharing Agreement, Tyco established a net receivable from Covidien and TE Connectivity representing the amount Tyco expected to receive for pre-2007 Separation uncertain tax positions, including amounts owed to the Internal Revenue Service ("IRS"). Tyco also established liabilities representing the fair market value of its share of Covidien's and TE Connectivity's estimated obligations, primarily to the IRS, for their pre-2007 Separation taxes covered by the 2007 Tax Sharing Agreement. During the year ended
September 26, 2014
, Tyco made a net cash payment of
$155 million
to Covidien under the terms of the 2007 Tax Sharing Agreement. The cash exchanged was a reimbursement between the parties for various payments made to the IRS for federal income taxes related to the audit of fiscal years 2005 through 2007. During the year ended September 27, 2013, Tyco made a net cash payment of
$16 million
to Covidien and TE Connectivity related to the resolution of certain IRS audit and pre-Separation tax matters.
Tyco assesses the shared tax liabilities and guarantee liabilities related to both the 2012 and 2007 Tax Sharing Agreements at each reporting period. Tyco will provide payment to Pentair and ADT under the 2012 Tax Sharing Agreement and to Covidien and TE Connectivity under the 2007 Tax Sharing Agreement as the shared income tax liabilities are settled. Settlement is expected to occur as the tax, audit and legal processes are completed for the impacted years and cash payments are made. Due to the nature of the unresolved adjustments described in the next paragraph, the maximum amount of future payments under the 2012 and 2007 Tax Sharing Agreements is not known. Such cash payments, when they occur, will reduce the guarantor liability as such payments represent an equivalent reduction of risk. Tyco also assesses the sufficiency of the 2012 and 2007 Tax Sharing Agreements guarantee liabilities on a quarterly basis and will increase the liability when it is probable that cash payments expected to be made under the 2012 or 2007 Tax Sharing Agreements exceed the recorded balance.
Tyco and its subsidiaries' income tax returns are examined periodically by various tax authorities. In connection with these examinations, tax authorities, including the IRS, have raised issues and proposed tax adjustments, in particular with respect to years preceding the 2007 Separation. The issues and proposed adjustments related to such years are generally subject to the sharing provisions of the 2007 Tax Sharing Agreement and Tyco's liabilities under the 2007 Tax Sharing Agreement are further subject to the sharing provisions in the 2012 Tax Sharing Agreement. Tyco has previously disclosed that in connection with U.S. federal tax audits, the IRS has raised a number of issues and proposed tax adjustments for periods beginning with the 1997 tax year. Although Tyco has been able to resolve substantially all of the issues and adjustments proposed by the IRS for tax years through 2007, it has not been able to resolve matters related to the treatment of certain intercompany debt transactions during the period. As a result, on June 20, 2013, Tyco received Notices of Deficiency from the IRS asserting that several of Tyco's former U.S. subsidiaries owe additional taxes of
$883.3 million
plus penalties of
$154 million
based on audits of the 1997 through 2000 tax years of Tyco and its subsidiaries as they existed at that time. In addition, Tyco received Final Partnership Administrative Adjustments for certain U.S. partnerships owned by former U.S. subsidiaries with respect to which an additional tax deficiency of approximately
$30 million
is expected to be asserted. These amounts exclude interest and do not reflect the impact on subsequent periods if the IRS position described below is ultimately proved correct.
The IRS asserted in the Notices of Deficiency that substantially all of Tyco's intercompany debt originated during the 1997 - 2000 period should not be treated as debt for U.S. federal income tax purposes, and has disallowed interest and related deductions recognized on U.S. income tax returns totaling approximately
$2.9 billion
. Tyco strongly disagrees with the IRS position and had filed petitions with the U.S. Tax Court contesting the IRS proposed adjustments. A trial date has been set for February 2016. Tyco believes that it has meritorious defenses for its tax filings, that the IRS positions with regard to these matters are inconsistent with the applicable tax laws and existing Treasury regulations, and that the previously reported taxes for the years in question are appropriate.
No payments with respect to these matters would be required until the dispute is definitively resolved, which, based on the experience of other companies, could take several years. Tyco believes that its income tax reserves and the liabilities recorded in the Consolidated Balance Sheet for the tax sharing agreements continue to be appropriate. However, the ultimate resolution of these matters, and the impact of that resolution, are uncertain and could have a material impact on Tyco's financial condition, results of operations and cash flows. In particular, if the IRS is successful in asserting its claim, it would have an adverse impact on interest deductions related to the same intercompany debt in subsequent time periods, totaling approximately
$6.6 billion
, which is also expected to be disallowed by the IRS.
As noted above, Tyco has assessed its obligations under the 2007 Tax Sharing Agreement to determine that its recorded liability is sufficient to cover the indemnifications made by it under such agreement. In the absence of observable transactions for identical or similar guarantees, Tyco determined the fair value of these guarantees and indemnifications utilizing expected
94
present value measurement techniques. Significant assumptions utilized to determine fair value included determining a range of potential outcomes, assigning a probability weighting to each potential outcome and estimating the anticipated timing of resolution. The probability weighted outcomes were discounted using Tyco's incremental borrowing rate. However, the ultimate resolution of these matters is uncertain and could result in a material adverse impact to the Company's financial position, results of operations, cash flows, or the effective tax rate in future reporting periods.
In connection with the aforementioned audits, the IRS has assessed a civil fraud penalty of
$21 million
during the first quarter of fiscal 2013 against a prior subsidiary that was distributed to TE Connectivity in connection with the 2007 Separation. The penalties arise from actions of former executives taken in connection with intercompany transfers of stock of Simplex Technologies in 1998 and 1999. This is a pre-2007 Separation tax liability that is covered by the provisions of the 2007 Tax Sharing Agreement.
In addition to dealing with tax liabilities for periods prior to the respective Separations, the 2012 and 2007 Tax Sharing Agreements contain sharing provisions to address the contingencies that the 2012 or 2007 Separations, or internal transactions related thereto, may be deemed taxable by U.S. or non U.S. taxing authorities. In the event the 2012 Separation is determined to be taxable and such determination was the result of actions taken after the 2012 Separations by Tyco, ADT or Pentair, the party responsible for such failure would be responsible for all taxes imposed on each company as a result thereof. If such determination is not the result of actions taken by Tyco, ADT or Pentair after the 2012 Separation, then Tyco, ADT and Pentair would be responsible for any taxes imposed on any of the companies as a result of such determination in the same manner and in the same proportions as described above. Similar provisions exist in the 2007 Tax Sharing Agreement. If either of the 2007 or 2012 Separation, or internal transactions taken in anticipation thereof, were deemed taxable, the associated liability could be significant. Tyco is responsible for all of its own taxes that are not shared pursuant to the 2012 and 2007 Tax Sharing Agreements' sharing formulas. In addition, Pentair and ADT, and Covidien and TE Connectivity are responsible for their tax liabilities that are not subject to the 2012 or 2007 Tax Sharing Agreements' sharing formula, respectively.
Each of the 2012 and 2007 Tax Sharing Agreements provides that, if any party to such agreement were to default in its obligation to another party to pay its share of the distribution taxes that arise as a result of no party's fault, each non-defaulting party to the agreement would be required to pay, equally with any other non-defaulting party to the agreement, the amounts in default. In addition, if another party to the 2012 or 2007 Tax Sharing Agreements that is responsible for all or a portion of an income tax liability were to default in its payment of such liability to a taxing authority, Tyco could be liable under applicable tax law for such liabilities and required to make additional tax payments. Accordingly, under certain circumstances, Tyco may be obligated to pay amounts in excess of its agreed-upon share of its tax liabilities under either of the 2012 or 2007 Tax Sharing Agreements.
The receivables and liabilities related to the 2012 and 2007 Tax Sharing Agreements as of
September 26, 2014
and
September 27, 2013
are as follows ($ in millions):
|
|
2012 Tax Sharing Agreement
|
2007 Tax Sharing Agreement
|
|||||||||||||
|
|
As of
September 26,
2014
|
As of
September 27, 2013 |
As of
September 26, 2014 |
As of
September 27, 2013 |
|||||||||||
|
Net receivable:
|
|
|
|||||||||||||
|
Prepaid expenses and other current assets
|
$
|
—
|
|
$
|
—
|
|
$
|
3
|
|
$
|
—
|
|
|||
|
Other assets
|
—
|
|
—
|
|
23
|
|
67
|
|
|||||||
|
—
|
|
—
|
|
26
|
|
67
|
|
||||||||
|
Tax sharing agreement related liabilities
|
|||||||||||||||
|
Accrued and other current liabilities
|
—
|
|
(33
|
)
|
(21
|
)
|
(130
|
)
|
|||||||
|
Other liabilities
|
(46
|
)
|
(36
|
)
|
(194
|
)
|
(254
|
)
|
|||||||
|
(46
|
)
|
(69
|
)
|
(215
|
)
|
(384
|
)
|
||||||||
|
Net liability
|
$
|
(46
|
)
|
$
|
(69
|
)
|
$
|
(189
|
)
|
$
|
(317
|
)
|
|||
95
The Company recorded (expense) income in conjunction with the 2012 and 2007 Tax Sharing Agreements for the years ended
September 26, 2014
,
September 27, 2013
and
September 28, 2012
as follows ($ in millions):
|
For the Years Ended
|
|||||||||||
|
September 26, 2014
|
September 27, 2013
|
September 28, 2012
|
|||||||||
|
(Expense)/income
|
|
|
|
||||||||
|
2007 Tax Sharing Agreement
|
$
|
(21
|
)
|
$
|
—
|
|
$
|
(4
|
)
|
||
|
2012 Tax Sharing Agreement
|
15
|
|
(32
|
)
|
—
|
|
|||||
As a result of the 2012 Separation, equity awards of certain employees were converted into the
three
companies. Pursuant to the terms of the 2012 Separation and Distribution Agreement, each of the
three
companies is responsible for issuing its own shares upon employee exercise of a stock option award or vesting of a restricted unit award. However, the 2012 Tax Sharing Agreement provides that any allowable compensation tax deduction for such awards is to be claimed by the employee's current employer. The 2012 Tax Sharing Agreement requires the employer claiming a tax deduction for shares issued by the other companies to pay a percentage of the allowable tax deduction to the company issuing the equity.
During 2014, Tyco incurred a charge of
$6 million
, to make payments to ADT and Pentair based on estimated allowable deductions for ADT and Pentair shares issued to Company employees, offset by income of
$1 million
to be received from ADT and Pentair for Company shares issued to their employees, resulting in a net impact of approximately
$5 million
which was recorded in Other expense, net within Tyco's Consolidated Statement of Operations. Offsetting this charge was approximately
$20 million
related to the finalization of audits of fiscal years 2005 through 2007. Additionally, a charge of
$21 million
was recorded primarily related to the finalization of various audits under the 2007 Tax Sharing Agreement.
During 2013, Tyco incurred a charge of
$38 million
, to make payments to ADT and Pentair based on estimated allowable deductions for ADT and Pentair shares issued to Company employees, offset by income of
$6 million
to be received from ADT and Pentair for Company shares issued to their employees, resulting in a net impact of approximately
$32 million
which was recorded in Other expense, net within Tyco's Consolidated Statement of Operations.
Other Income Tax Matters
Except for earnings that are currently distributed, no additional material provision has been made for U.S. or non-U.S. income taxes on the undistributed earnings of subsidiaries or for deferred tax liabilities for temporary differences related to investments in subsidiaries, since the earnings are expected to be permanently reinvested, the investments are essentially permanent in duration, or Tyco has concluded that no additional tax liability will arise as a result of the distribution of such earnings. A liability could arise if amounts are distributed by such subsidiaries or if such subsidiaries are ultimately disposed. It is not practicable to estimate the additional income taxes related to permanently reinvested earnings or the basis differences related to investments in subsidiaries.
96
7. Earnings Per Share
The reconciliations between basic and diluted earnings per share attributable to Tyco common shareholders for the years ended
September 26, 2014
,
September 27, 2013
and
September 28, 2012
are as follows (in millions, except per share data):
|
For the Years Ended
|
||||||||||||||||||||||||||||||||
|
|
September 26, 2014
|
September 27, 2013
|
September 28, 2012
|
|||||||||||||||||||||||||||||
|
|
Income
|
Shares
|
Per
Share
Amount
|
Income
|
Shares
|
Per
Share
Amount
|
(Loss)
|
Shares
|
Per
Share
Amount
|
|||||||||||||||||||||||
|
Basic earnings per share attributable to Tyco common shareholders:
|
|
|
|
|
|
|
|
|
|
|||||||||||||||||||||||
|
Income (loss) from continuing operations
|
$
|
794
|
|
455
|
|
$
|
1.74
|
|
$
|
443
|
|
465
|
|
$
|
0.96
|
|
$
|
(412
|
)
|
463
|
|
$
|
(0.89
|
)
|
||||||||
|
Share options and restricted share awards
|
|
|
8
|
|
|
|
|
|
7
|
|
|
|
|
|
|
|
|
|
||||||||||||||
|
Diluted earnings per share attributable to Tyco common shareholders:
|
|
|
|
|
|
|
|
|
|
|||||||||||||||||||||||
|
Income (loss) from continuing operations attributable to Tyco common shareholders, giving effect to dilutive adjustments
|
$
|
794
|
|
463
|
|
$
|
1.71
|
|
$
|
443
|
|
472
|
|
$
|
0.94
|
|
$
|
(412
|
)
|
463
|
|
$
|
(0.89
|
)
|
||||||||
The computation of diluted earnings per share for the years ended
September 26, 2014
,
September 27, 2013
and
September 28, 2012
excludes the effect of the potential exercise of share options to purchase approximately
2 million
,
4 million
, and
12 million
shares, respectively, and excludes restricted share awards of
2 million
,
1 million
, and
2 million
shares, respectively, because the effect would be anti-dilutive.
97
8. Goodwill and Intangible Assets
There were no goodwill impairments as a result of performing the Company's
2014
,
2013
and
2012
annual impairment tests. The changes in the carrying amount of goodwill by segment for
2014
and
2013
are as follows ($ in millions):
|
NA Installation
& Services
|
ROW
Installation
& Services
|
Global
Products
|
Total
|
||||||||||||
|
|
|
|
|
||||||||||||
|
Gross goodwill
|
$
|
2,127
|
|
$
|
1,972
|
|
$
|
1,696
|
|
$
|
5,795
|
|
|||
|
Accumulated impairment
|
(126
|
)
|
(1,068
|
)
|
(567
|
)
|
(1,761
|
)
|
|||||||
|
Carrying amount of goodwill as of September 28, 2012
|
$
|
2,001
|
|
$
|
904
|
|
$
|
1,129
|
|
$
|
4,034
|
|
|||
|
2013 activity:
|
|||||||||||||||
|
Acquisitions/ Purchase accounting adjustments
|
24
|
|
42
|
|
90
|
|
156
|
|
|||||||
|
Transfers
|
(39
|
)
|
—
|
|
39
|
|
—
|
|
|||||||
|
Currency translation
|
(8
|
)
|
(19
|
)
|
(1
|
)
|
(28
|
)
|
|||||||
|
Gross goodwill
|
$
|
2,104
|
|
$
|
1,995
|
|
$
|
1,824
|
|
$
|
5,923
|
|
|||
|
Accumulated impairment
|
(126
|
)
|
(1,068
|
)
|
(567
|
)
|
(1,761
|
)
|
|||||||
|
Carrying amount of goodwill as of September 27, 2013
|
$
|
1,978
|
|
$
|
927
|
|
$
|
1,257
|
|
$
|
4,162
|
|
|||
|
2014 activity:
|
|||||||||||||||
|
Acquisitions/ Purchase accounting adjustments
|
10
|
|
15
|
|
(4
|
)
|
21
|
|
|||||||
|
Currency translation
|
(12
|
)
|
(34
|
)
|
(11
|
)
|
(57
|
)
|
|||||||
|
Gross goodwill
|
$
|
2,102
|
|
$
|
1,976
|
|
$
|
1,809
|
|
$
|
5,887
|
|
|||
|
Accumulated impairment
|
(126
|
)
|
(1,068
|
)
|
(567
|
)
|
(1,761
|
)
|
|||||||
|
Carrying amount of goodwill as of September 26, 2014
|
$
|
1,976
|
|
$
|
908
|
|
$
|
1,242
|
|
$
|
4,126
|
|
|||
Intangible Assets
There were no indefinite-lived intangible asset impairments as a result of performing the Company's
2014
,
2013
and
2012
annual impairment tests.
The following table sets forth the gross carrying amount and accumulated amortization of the Company's intangible assets as of
September 26, 2014
and
September 27, 2013
($ in millions):
|
|
As of
|
||||||||||||||
|
|
September 26, 2014
|
September 27, 2013
|
|||||||||||||
|
|
Gross Carrying
Amount
|
Accumulated
Amortization
|
Gross Carrying
Amount
|
Accumulated
Amortization
|
|||||||||||
|
Amortizable:
|
|
|
|
|
|||||||||||
|
Contracts and related customer relationships
|
$
|
1,405
|
|
$
|
1,117
|
|
$
|
1,420
|
|
$
|
1,101
|
|
|||
|
Intellectual property
|
622
|
|
492
|
|
623
|
|
477
|
|
|||||||
|
Other
|
38
|
|
16
|
|
40
|
|
13
|
|
|||||||
|
Total
|
$
|
2,065
|
|
$
|
1,625
|
|
$
|
2,083
|
|
$
|
1,591
|
|
|||
|
Non-Amortizable:
|
|
|
|
|
|||||||||||
|
Intellectual property
|
$
|
221
|
|
|
|
$
|
223
|
|
|
|
|||||
|
Franchise rights
|
76
|
|
|
|
76
|
|
|
|
|||||||
|
Total
|
$
|
297
|
|
|
|
$
|
299
|
|
|
|
|||||
Intangible asset amortization expense for
2014
,
2013
and
2012
was
$93 million
,
$95 million
and
$99 million
, respectively, and was recorded in Selling, general and administrative expense in the Consolidated Statements of Operations.
98
The estimated aggregate amortization expense on intangible assets is expected to be approximately
$66 million
for
2015
,
$62 million
for
2016
,
$53 million
for
2017
,
$51 million
for
2018
and
$208 million
for
2019
and thereafter.
9. Related Party Transactions
The Company has amounts due related to loans and advances issued to employees in prior years under the Company's Key Employee Loan Program, relocation programs and other advances made to executives. Loans were provided to employees under the Company's Key Employee Loan Program, which is now discontinued, except for outstanding loans for the payment of taxes upon the vesting of shares granted under our Restricted Share Ownership Plans. During the fourth quarter of 2002, the Board of Directors and new senior management at that time adopted a policy under which no new loans are allowed to be granted to any officers of the Company and existing loans are not allowed to be extended or modified. There have been no loans made to any of the Company's current executives. The outstanding loans are not collateralized and bear interest, payable annually, at a rate based on the
six-month LIBOR
, calculated annually as the average of the rates in effect on the first day of each of the preceding
12
months. Loans are generally repayable in
10
years; however, earlier payments are required under certain circumstances, such as when an employee is terminated. In addition, the Company made mortgage loans to certain employees under employee relocation programs. These loans are generally payable in
15
years and are collateralized by the underlying property. The maximum amount outstanding under these programs was
nil
and
$21 million
as of
September 26, 2014
and
September 27, 2013
. Loans receivable under these programs, as well as other unsecured advances outstanding, were
nil
and
$21 million
as of
September 26, 2014
and
September 27, 2013
. As of September 27, 2013, the total outstanding loans receivable included loans to L. Dennis Kozlowski, the Company's former chairman and chief executive officer (until June 2002). The amount outstanding under these loans, plus accrued interest, was
nil
and
$28 million
as of
September 26, 2014
and
September 27, 2013
and the rate of interest charged on such loans was
0.4%
in 2013. Interest income on these interest bearing loans was not material for all periods presented. Certain of the above loans totaling
nil
and
$1 million
as of
September 26, 2014
and
September 27, 2013
are non-interest bearing.
The Company filed civil complaints against Mr. Kozlowski, its former chief financial officer, Mark Swartz, and Frank E. Walsh, Jr., a former director for breach of fiduciary duty and other wrongful conduct. The Company has resolved each of these matters. See Note 13 for additional information.
During 2014, 2013 and 2012, the Company engaged in commercial transactions in the normal course of business with companies where the Company's Directors were employed and served as officers. Purchases from these companies during each year aggregated less than
1%
of consolidated net revenue.
Debt as of
September 26, 2014
and
September 27, 2013
is as follows ($ in millions):
|
As of
September 26,
2014
|
As of
September 27,
2013
|
||||||
|
3.375% public notes due 2015
|
$
|
258
|
|
$
|
258
|
|
|
|
3.75% public notes due 2018
|
67
|
|
67
|
|
|||
|
8.5% public notes due 2019
|
364
|
|
364
|
|
|||
|
7.0% public notes due 2019
|
245
|
|
246
|
|
|||
|
6.875% public notes due 2021
|
465
|
|
466
|
|
|||
|
4.625% public notes due 2023
|
42
|
|
42
|
|
|||
|
Other
(1)
|
22
|
|
20
|
|
|||
|
Total debt
|
1,463
|
|
1,463
|
|
|||
|
Less: current portion
|
20
|
|
20
|
|
|||
|
Long-term debt
|
$
|
1,443
|
|
$
|
1,443
|
|
|
_______________________________________________________________________________
|
(1)
|
$
20 million
of the amount shown as other, comprises the current portion of the Company's total debt as of both
September 26, 2014
and
September 27, 2013
.
|
99
Fair Value
The carrying amount of Tyco's debt subject to the fair value disclosure requirements as of
September 26, 2014
and
September 27, 2013
was
$1,441 million
and
$1,443 million
, respectively. The Company utilizes various valuation methodologies to determine the fair value of its debt, which is primarily dependent on the type of market in which the Company's debt is traded. When available, the Company uses quoted market prices to determine the fair value of its debt that is traded in active markets. As of
September 26, 2014
and
September 27, 2013
, the fair value of the Company's debt which was actively traded was
$1,670 million
and
$1,676 million
, respectively. As of
September 26, 2014
and
September 27, 2013
, the Company's debt that was subject to the fair value disclosure requirements was all actively traded and is classified as Level 1 in the fair value hierarchy. See Note 1 for further details on the fair value hierarchy.
Commercial Paper
From time to time, TIFSA may issue commercial paper for general corporate purposes. The maximum aggregate amount of unsecured commercial paper notes available to be issued, on a private placement basis, under the commercial paper program was
$1 billion
as of
September 26, 2014
. As of
September 26, 2014
and
September 27, 2013
, TIFSA had
no
commercial paper outstanding.
Fiscal 2014 and 2013 Debt Issuance/Repayment
During fiscal years 2014 and 2013, except for the issuance of commercial paper as described above, there were
no
material debt issuances or repayments.
Fiscal 2012 Debt Issuance/Repayment
During the fourth quarter of 2012, in connection with the Separation, Tyco and its finance subsidiary, Tyco International Finance S.A. ("TIFSA"), redeemed various debt securities maturing from 2013 to 2023 issued by TIFSA and/or Tyco, in an aggregate principal amount of
$2.6 billion
as set forth below ($ in millions):
|
6.0% public notes due 2013
|
$
|
656
|
|
|
4.125% public notes due 2014
|
500
|
|
|
|
3.375% public notes due 2015
|
242
|
|
|
|
3.750% public notes due 2018
|
183
|
|
|
|
8.5% public notes due 2019
|
386
|
|
|
|
7.0% public notes due 2019
|
180
|
|
|
|
6.875% public notes due 2021
|
245
|
|
|
|
4.625% public notes due 2023
|
208
|
|
|
|
Total amounts redeemed
|
$
|
2,600
|
|
In conjunction with the debt redemptions, the Company terminated associated interest rate swap contracts related to the
6.0%
Notes due 2013 and
4.125%
Notes due 2014. As a result of the debt redemptions, the Company recorded a loss on extinguishment of debt of
$453 million
which was recorded within Other expense, net in the Company's Consolidated Statement of Operations for the year ended September 28, 2012. The charge was comprised of the premium paid in the tender offers, write-off of the unamortized debt issuance costs and discount related to the extinguished notes, and a net gain recognized upon termination of the associated interest rate swap contracts.
Credit Facilities
On June 22, 2012, TIFSA, as the Borrower, and the Company as the Guarantor, entered into a
Five
-Year Senior Unsecured Credit Agreement, expiring June 22, 2017, and providing for revolving credit commitments in the aggregate amount of
$1.0 billion
(the "2012 Credit Agreement"). In connection with entering into the 2012 Credit Agreement, TIFSA and the Company terminated the existing
Four
-Year Senior Unsecured Credit Agreement, dated March 24, 2011, which provided for revolving credit commitments in the aggregate amount of
$750 million
. Additionally, the Company's Five-Year Senior Unsecured Credit Agreement, dated April 25, 2007 and as amended, terminated on September 28, 2012.
As a result of entering into the 2012 Credit Agreement, the Company's committed revolving credit facility totaled
$1.0 billion
as of
September 26, 2014
. This revolving credit facility may be used for working capital, capital expenditures and general corporate purposes. As of
September 26, 2014
and
September 27, 2013
, there were
no
amounts drawn under the
100
Company's revolving credit facilities. Interest under the revolving credit facilities is variable and is calculated by reference to
LIBOR
or an alternate base rate.
Other Debt Information
The aggregate amounts of principal public debt maturing during the next five fiscal years and thereafter are as follows:
nil
in 2015,
$258 million
in 2016,
nil
in 2017,
$67 million
in 2018,
$364 million
in 2019 and
$746 million
thereafter.
As of
September 26, 2014
, the weighted-average interest rate on total debt was
6.5%
. As of
September 27, 2013
, the weighted-average interest rate on total debt, excluding the impact of interest rate swaps, was
6.5%
. There was
no
public short-term debt outstanding as of
September 26, 2014
and
September 27, 2013
. As of
September 28, 2012
, the Company had terminated all interest rate swaps. The impact of the Company's interest rate swap agreements on reported interest expense prior to termination was a net decrease of
$18 million
for the year ended
September 28, 2012
.
11. Guarantees
Certain of the Company's business segments have guaranteed the performance of third-parties and provided financial guarantees for uncompleted work and financial commitments. The terms of these guarantees vary with end dates ranging from the fiscal year 2015 through the completion of such transactions and would typically be triggered in the event of nonperformance. The Company's performance under the guarantees, if required, would not have a material effect on the Company's financial position, results of operations or cash flows.
There are certain guarantees or indemnifications extended among Tyco, Covidien, TE Connectivity, ADT and Pentair in accordance with the terms of the 2007 and 2012 Separation and Distribution Agreements and Tax Sharing Agreements. These guarantees primarily relate to certain contingent tax liabilities included in the Tax Sharing Agreements. See Note 6 for additional information.
In addition, Tyco historically provided support in the form of financial and/or performance guarantees to various Covidien, TE Connectivity, ADT and Tyco Flow Control operating entities. In connection with both the 2007 and 2012 Separations, the Company worked with the guarantee counterparties to cancel or assign these guarantees to Covidien, TE Connectivity, ADT or Pentair, as appropriate. To the extent these guarantees were not assigned prior to the Separation dates, Tyco assumed primary liability on any remaining such support. The Company's obligations related to the 2012 Separation were
$3 million
, which were included in Other liabilities on the Company's Consolidated Balance Sheets as of both
September 26, 2014
and
September 27, 2013
, with an offset to Tyco shareholders' equity on the 2012 Separation date. The Company's obligations related to the 2007 Separation were
$3 million
, which were included in Other liabilities on the Company's Consolidated Balance Sheets as of both
September 26, 2014
and
September 27, 2013
, respectively, with an offset to Tyco shareholders' equity on the 2007 Separation date.
In disposing of assets or businesses, the Company often provides representations, warranties and/or indemnities to cover various risks including, for example, unknown damage to the assets, environmental risks involved in the sale of real estate, liability to investigate and remediate environmental contamination at waste disposal sites and manufacturing facilities and unidentified tax liabilities and legal fees related to periods prior to disposition. The Company has no reason to believe that these uncertainties would have a material adverse effect on the Company's financial position, results of operations or cash flows.
In the normal course of business, the Company is liable for contract completion and product performance. In the opinion of management, such obligations will not significantly affect the Company's financial position, results of operations or cash flows.
During the year ended September 26, 2014, Tyco replaced available for sale investments held as collateral for the Company's insurable liabilities with letters of credit of approximately
$137 million
. As of
September 26, 2014
and
September 27, 2013
, the Company had total outstanding letters of credit and bank guarantees of approximately
$662 million
and
$424 million
respectively.
The Company records estimated product warranty costs at the time of sale. See Note 1 for additional information.
101
The changes in the carrying amount of the Company's warranty accrual from
September 27, 2013
to
September 26, 2014
were as follows ($ in millions):
|
Balance as of September 27, 2013
|
$
|
31
|
|
|
Warranties issued
|
8
|
|
|
|
Changes in estimates
|
(5
|
)
|
|
|
Settlements
|
(6
|
)
|
|
|
Balance as of September 26, 2014
|
$
|
28
|
|
Warranty accruals for businesses that are included within Liabilities held for sale on the Consolidated Balance Sheets are excluded from the table above. See Note 3 for additional information.
12. Financial Instruments
The Company's financial instruments consist primarily of cash and cash equivalents, accounts receivable, investments, accounts payable, debt and derivative financial instruments. The fair value of cash and cash equivalents, accounts receivable and accounts payable approximated book value as of
September 26, 2014
and
September 27, 2013
. The fair value of derivative financial instruments was not material to any of the periods presented. See below for the fair value of investments and Note 10 for the fair value of debt.
Derivative Instruments
In the normal course of business, Tyco is exposed to market risk arising from changes in currency exchange rates, interest rates and commodity prices. The Company may use derivative financial instruments to manage exposures to foreign currency, commodity and interest rate risks. The Company's objective for utilizing derivative financial instruments is to manage these risks using the most effective methods to eliminate or reduce the impacts of these exposures. The Company does not use derivative financial instruments for trading or speculative purposes. Additionally, the Company did not have any derivative instruments designated as hedging instruments for accounting purposes during the years ended
September 26, 2014
and
September 27, 2013
. During the year ended September 28, 2012, the Company terminated its interest rate swaps.
Foreign Currency Exposures
The Company manages foreign currency exchange rate risk through the use of derivative financial instruments comprised principally of forward contracts on foreign currency which are not designated as hedging instruments for accounting purposes. The objective of the derivative instruments is to minimize the income statement impact and potential variability in cash flows associated with intercompany loans, accounts receivable, accounts payable and forecasted transactions that are denominated in certain foreign currencies. As of
September 26, 2014
and
September 27, 2013
, the total gross notional amount of the Company's foreign exchange contracts was
$258 million
and
$278 million
, respectively, including contracts of
nil
and
$60 million
, respectively, related to the South Korean security business.
Counterparty Credit Risk
The use of derivative financial instruments exposes the Company to counterparty credit risk. Tyco has established policies and procedures to limit the potential for counterparty credit risk, including establishing limits for credit exposure and continually assessing the creditworthiness of counterparties. As a matter of practice, the Company deals with major banks worldwide having strong investment grade long-term credit ratings. To further reduce the risk of loss, the Company generally enters into International Swaps and Derivatives Association master agreements with substantially all of its counterparties. The Company's derivative contracts do not contain any credit risk related contingent features and do not require collateral or other security to be furnished by the Company or the counterparties. The Company's exposure to credit risk associated with its derivative instruments is measured on an individual counterparty basis, as well as by groups of counterparties that share similar attributes. The Company does not anticipate any non-performance by any of our counterparties and the concentration of risk with financial institutions does not present significant credit risk to the Company.
102
Investments
Investments primarily include marketable securities such as U.S. government obligations, U.S. government agency securities and corporate debt securities, equity securities and time deposits with banks.
When available, the Company uses quoted market prices to determine the fair value of investment securities. Such investments are included in Level 1. When quoted market prices are not readily available, pricing determinations are made based on the results of market approach valuation models using observable market data such as recently reported trades, bid and offer information and benchmark securities. These investments are included in Level 2 and consist primarily of U.S. government agency securities and corporate debt securities.
During the year ended
September 26, 2014
, the Company liquidated its portfolio of corporate and U.S. Government debt securities and recorded a
$1 million
gain on the sale of investments related to this liquidation. As of
September 26, 2014
, the Company held time deposits with original time to maturity greater than three months of
$275 million
, which are recorded in Prepaid expenses and other current assets in the Consolidated Balance Sheet.
During the year ended
September 26, 2014
, the Company also purchased
$62 million
of trading securities that will serve to partially offset changes in the market value of liabilities for an unfunded non-qualified defined contribution pension plan. These securities, which primarily consist of exchange traded equity funds, are recorded in Prepaid expenses and other current assets in the Consolidated Balance Sheet, and gains or losses are recorded in Other income, expense (net) in the Consolidated Statement of Operations. For the year ended
September 26, 2014
, the trading securities had a realized gain of
nil
.
The following tables present the cost and fair market value of the Company's investments measured at fair value, by type of security, by level, and by classification on the Company's Consolidated Balance Sheets as of
September 26, 2014
and
September 27, 2013
.
As of
September 26, 2014
($ in millions):
|
|
Fair Value
|
Consolidated
Balance Sheet
Classification
|
||||||||||||||||||
|
Investment Assets:
|
Level 1
|
Level 2
|
Total
|
Prepaids
and Other
Current
Assets
|
Other
Assets
|
|||||||||||||||
|
Time deposits
|
$
|
275
|
|
$
|
—
|
|
$
|
275
|
|
$
|
275
|
|
$
|
—
|
|
|||||
|
Exchange traded equity funds
|
62
|
|
—
|
|
62
|
|
62
|
|
—
|
|
||||||||||
|
$
|
337
|
|
$
|
—
|
|
$
|
337
|
|
$
|
337
|
|
$
|
—
|
|
||||||
As of
September 27, 2013
($ in millions):
|
|
Fair Value
|
Consolidated
Balance Sheet
Classification
|
||||||||||||||||||
|
Available-for-sale securities:
|
Level 1
|
Level 2
|
Total
|
Prepaids
and Other
Current
Assets
|
Other
Assets
|
|||||||||||||||
|
Corporate debt securities
|
$
|
—
|
|
$
|
34
|
|
$
|
34
|
|
$
|
11
|
|
$
|
23
|
|
|||||
|
U.S. Government debt securities
|
171
|
|
38
|
|
209
|
|
89
|
|
120
|
|
||||||||||
|
$
|
171
|
|
$
|
72
|
|
$
|
243
|
|
$
|
100
|
|
$
|
143
|
|
||||||
During
2014
and
2013
, the Company did not have any significant transfers within the fair value hierarchy.
Investments with continuous unrealized losses for less than
12 months
and
12 months
or greater as of
September 26, 2014
and
September 27, 2013
were not material. The Company did not record any other-than-temporary impairments for the years
2014
,
2013
and
2012
.
Derivative Financial Instruments
The fair values for the Company's derivative financial instruments are derived from market approach pricing models that take into account the contractual terms and features of each instrument and forward foreign currency rates for the Company's
103
foreign exchange contracts. Valuations are adjusted to reflect creditworthiness of the counterparty for assets and the creditworthiness of the Company for liabilities. Such adjustments are based on observable market evidence and are categorized as Level 2 exposures. Derivative financial instruments fair value details are not presented as the derivative financial instruments were not material to any of the periods presented.
Other
In addition to the gain related to the liquidation of the Company's investment portfolio as described above, the year ended
September 26, 2014
also included a
$7 million
loss on the sale of an investment related to the Company's ROW Installation and Services business.
The Company had
$1.5 billion
and
$1.4 billion
of intercompany loans designated as permanent in nature as of
September 26, 2014
and
September 27, 2013
, respectively. For the years ended
September 26, 2014
and
September 27, 2013
, and
September 28, 2012
the Company recorded a cumulative translation loss of
$28 million
, gain of
$3 million
and gain of
$48 million
, respectively, through Accumulated other comprehensive loss related to these loans.
13. Commitments and Contingencies
The Company has facility, vehicle and equipment leases that expire at various dates beyond fiscal
2015
. Rental expense under these leases was
$280 million
,
$284 million
and
$292 million
for fiscal years 2014, 2013 and 2012, respectively. Following is a schedule of minimum lease payments for non-cancelable operating leases as of
September 26, 2014
($ in millions):
|
|
Operating
Leases
|
||
|
2015
|
$
|
185
|
|
|
2016
|
163
|
|
|
|
2017
|
122
|
|
|
|
2018
|
81
|
|
|
|
2019
|
44
|
|
|
|
Thereafter
|
82
|
|
|
|
$
|
677
|
|
|
The Company also has purchase obligations related to commitments to purchase certain goods and services. As of
September 26, 2014
, such obligations were as follows:
$375 million
in 2015,
$66 million
in 2016,
$28 million
in 2017,
$1 million
in 2018 and
$1 million
in 2019 and thereafter.
In the normal course of business, the Company is liable for contract completion and product performance. In the opinion of management, such obligations will not significantly affect the Company's financial position, results of operations or cash flows.
Legacy Matters Related to Former Management
The Company has been a party to several lawsuits involving disputes with former management, including its former chief executive officer, Mr. L. Dennis Kozlowski, and its former chief financial officer, Mr. Mark Swartz. The Company filed civil complaints against Mr. Kozlowski and Mr. Swartz for breach of fiduciary duty and other wrongful conduct relating to alleged abuses of the Company's Key Employee Loan Program and relocation program, unauthorized bonuses, unauthorized payments, self-dealing transactions and other improper conduct. In connection with Tyco's affirmative actions against Mr. Kozlowski and Mr. Swartz, Mr. Kozlowski, through counterclaims, and Mr. Swartz, through a separate lawsuit, sought an aggregate of approximately
$140 million
allegedly due in connection with their compensation and retention arrangements and under the Employee Retirement Income Security Act ("ERISA").
With respect to Mr. Kozlowski, in the first quarter of fiscal 2014, the parties signed an agreement resolving all outstanding disputes with Mr. Kozlowski, and with Mr. Kozlowski agreeing to release the Company from any claims to monetary amounts related to compensation, retention or other arrangements, including the Key Employee Loan Program, that were alleged to have existed between him and the Company. As a result, in the first quarter of fiscal 2014, the Company reversed the net liability of approximately
$92 million
, which was recorded in Selling, general and administrative expenses in the Consolidated Statement of Operations for the amounts allegedly due to him. Additionally, the Company will be entitled to a portion of the proceeds, if any, from the future sale of certain assets owned by Mr. Kozlowski, the timing and amount of which
104
is uncertain at this time. During the quarter ended June 27, 2014, the Company received a
$4 million
recovery from the sale of property owned by Mr. Kozlowski, which was recognized as a reduction to Selling, general and administrative expenses.
With respect to Mr. Swartz, during the second quarter of fiscal 2012, the Company reversed a
$50 million
liability related to Mr. Swartz's pay and benefits due to the expiration of the statute of limitations and in July 2013, the parties reached an agreement in principle to resolve the matter, with Mr. Swartz agreeing to release the Company from any claims to monetary amounts related to compensation, retention or other arrangements alleged to have existed between him and the Company. In November 2014, the parties executed a definitive settlement agreement and the Company received approximately
$12 million
in cash from Mr. Swartz, a portion of which will be shared with the members of the class action settlement.
Environmental Matters
Tyco is involved in various stages of investigation and cleanup related to environmental remediation matters at a number of sites. The ultimate cost of site cleanup is difficult to predict given the uncertainties regarding the extent of the required cleanup, the interpretation of applicable laws and regulations and alternative cleanup methods. As of
September 26, 2014
, Tyco concluded that it was probable that it would incur remedial costs in the range of approximately
$38 million
to
$79 million
. As of
September 26, 2014
, Tyco concluded that the best estimate within this range is approximately
$42 million
, of which
$23 million
is included in Accrued and other current liabilities and Accounts payable and
$19 million
is included in Other liabilities in the Company's Consolidated Balance Sheet.
The majority of the liabilities described above relate to ongoing remediation efforts at a facility in the Company's Global Products segment located in Marinette, Wisconsin, which the Company acquired in 1990 in connection with its acquisition of, among other things, the Ansul product line. Prior to Tyco's acquisition, Ansul manufactured arsenic-based agricultural herbicides at the Marinette facility, which resulted in significant arsenic contamination of soil and groundwater on the Marinette site and in parts of the adjoining Menominee River. Ansul has been engaged in ongoing remediation efforts at the Marinette site since 1990, and in February 2009 entered into an Administrative Consent Order (the "Consent Order") with the U.S. Environmental Protection Agency to address the presence of arsenic at the Marinette site. Under this agreement, Ansul's principal obligations are to contain the arsenic contamination on the site, pump and treat on-site groundwater, dredge, treat and properly dispose of contaminated sediments in the adjoining river areas, and monitor contamination levels on an ongoing basis. Activities completed under the Consent Order since 2009 include the installation of a subsurface barrier wall around the facility to contain contaminated groundwater, the installation of a groundwater extraction and treatment system and the dredging and offsite disposal of treated river sediment. As of
September 26, 2014
, the Company concluded that its remaining remediation and monitoring costs related to the Marinette facility were in the range of approximately
$27 million
to
$54 million
. The Company's best estimate within that range is approximately
$30 million
, of which
$18 million
is included in Accrued and other current liabilities and
$12 million
is included in Other liabilities in the Company's Consolidated Balance Sheet. During the years ended September 26, 2014, September 27, 2013, and September 28, 2012, the Company recorded charges of
nil
,
$100 million
, and
$17 million
, respectively, in Selling, general and administrative expenses in the Consolidated Statement of Operations. Although the Company has recorded its best estimate of the costs that it will incur to remediate and monitor the arsenic contamination at the Marinette facility, it is possible that technological, regulatory or enforcement developments, the results of environmental studies or other factors could change the Company's expectations with respect to future charges and cash outlays, and such changes could be material to the Company's future results of operations, financial condition or cash flows.
Asbestos Matters
The Company and certain of its subsidiaries, including Yarway Corporation (“Yarway”) and Grinnell LLC (“Grinnell”), along with numerous other third parties, are named as defendants in personal injury lawsuits based on alleged exposure to asbestos containing materials. Over
90%
of cases pending against affiliates of the Company have been filed against Yarway or Grinnell, and have typically involved product liability claims based primarily on allegations of manufacture, sale or distribution of industrial products that either contained asbestos or were used with asbestos containing components. Claims filed against Yarway derive from Yarway’s purported use of asbestos-containing gaskets and packing in the sale or distribution of steam valves and traps and from its alleged manufacture of asbestos-containing expansion joint packing. Yarway’s alleged manufacture, distribution and/or sale of asbestos-containing materials ceased by 1988, and Yarway ceased substantially all of its manufacturing, distribution and sales operations in 2003. Claims filed against Grinnell typically allege that it manufactured, sold or distributed valves, gaskets, piping and sprinkler systems containing asbestos.
As of September 26, 2014, the Company has determined that there were approximately
5,600
claims pending against it, which includes approximately
3,200
claims pending against Yarway. This amount reflects the Company's current estimate of the number of viable claims made against it and includes adjustments for claims that are not actively being prosecuted, identify
105
incorrect defendants, are duplicative of other actions or for which the Company is indemnified by third parties. Additionally, as a result of the Yarway bankruptcy filing described below, claims against Yarway have been stayed since April 2013.
The following table summarizes the activity in the asset and liability accounts related to these asbestos matters for the year ended September 26, 2014 ($ in millions):
|
As of September 27, 2013
|
(Charge)/Benefit
|
Payments/(Receipts)
|
As of September 26, 2014
|
|||||||||||||
|
Yarway:
|
||||||||||||||||
|
Insurance assets
|
$
|
—
|
|
$
|
—
|
|
$
|
—
|
|
$
|
—
|
|
||||
|
Gross asbestos liabilities
|
(90
|
)
|
(225
|
)
|
—
|
|
(315
|
)
|
||||||||
|
Net liability position
|
$
|
(90
|
)
|
$
|
(225
|
)
|
$
|
—
|
|
$
|
(315
|
)
|
||||
|
Other Claims:
|
||||||||||||||||
|
Insurance assets
|
$
|
152
|
|
$
|
93
|
|
$
|
—
|
|
$
|
245
|
|
||||
|
Gross asbestos liabilities
|
(231
|
)
|
(325
|
)
|
18
|
|
(538
|
)
|
||||||||
|
Net liability position
|
$
|
(79
|
)
|
$
|
(232
|
)
|
$
|
18
|
|
$
|
(293
|
)
|
||||
|
Total Tyco:
|
||||||||||||||||
|
Insurance assets
|
$
|
152
|
|
$
|
93
|
|
$
|
—
|
|
$
|
245
|
|
||||
|
Gross asbestos liabilities
|
(321
|
)
|
(550
|
)
|
18
|
|
(853
|
)
|
||||||||
|
Total net liability position
|
$
|
(169
|
)
|
$
|
(457
|
)
|
$
|
18
|
|
$
|
(608
|
)
|
||||
Yarway
As previously disclosed, on April 22, 2013 Yarway filed a voluntary petition for relief under Chapter 11 of the U.S. Bankruptcy Code (“Chapter 11”) in the United States Bankruptcy Court for the District of Delaware (“Bankruptcy Court”). As a result of this filing, the continuation or commencement of asbestos-related litigation against Yarway has been enjoined by the automatic stay imposed by the U.S. Bankruptcy Code. Yarway's goal has been to negotiate, obtain approval of, and consummate a plan of reorganization that establishes a trust to fairly and equitably value and pay current and future Yarway asbestos claims, and that, in exchange for funding of the trust by the Company and/or its subsidiaries, provides permanent injunctive relief protecting the Company, each of its current and former affiliates and various other parties (the “Company Protected Parties”) from any further asbestos claims based on products manufactured, sold, and/or distributed by Yarway. On October 9, 2014, the Company reached an agreement in principle with Yarway, the Official Committee of Asbestos Claimants (“ACC”) appointed in the Yarway Chapter 11 case as the representative of current Yarway asbestos claimants, and the Future Claimants Representative (“FCR”) appointed in the Yarway Chapter 11 case as the representative of future Yarway asbestos claimants, to fund a section 524(g) trust for the resolution and payment of current and future Yarway asbestos claims. The agreement in principle, which will be implemented through a Chapter 11 plan for Yarway, will resolve the potential liability of the Company Protected Parties for pending and future derivative personal injury claims related to exposure to asbestos-containing products that were allegedly manufactured, distributed, and/or sold by Yarway (“Yarway Asbestos Claims”). Under the Chapter 11 plan, an asbestos settlement trust (the “Yarway Trust”) that conforms to the provisions of Section 524(g) of the U.S. Bankruptcy Code will be established and, on the effective date of the Chapter 11 plan, the Company and Yarway will contribute to the Yarway Trust a total of
$325 million
in cash (“Settlement Consideration”), which includes approximately
$100 million
relating to the settlement of intercompany amounts allegedly due to Yarway. In exchange for the Settlement Consideration, each of the Company Protected Parties will receive the benefit of a release from Yarway and an injunction under section 524(g) of the Bankruptcy Code permanently enjoining the assertion of Yarway Asbestos Claims against those Parties. The agreement in principle is subject, among other things, to the negotiation and filing of a Chapter 11 plan of reorganization for Yarway incorporating the terms of such agreement (the “Plan”), acceptance of the Plan by at least
75%
of Yarway’s current asbestos claimants voting on such Plan, confirmation of the Plan by the Bankruptcy Court and approval of the injunction in favor of the Company Protected Parties by the United States District Court for the District of Delaware (“District Court”). On the effective date of the Plan, which is anticipated to occur in the second half of fiscal 2015, the Company and Yarway will pay the Settlement Consideration and Yarway Asbestos Claims against the Company Protected Parties will be permanently enjoined. Yarway is anticipated to become a wholly-owned subsidiary of the Yarway Trust and, accordingly, would no longer be owned
106
by or be part of a consolidated group with the Company. Unless extended by a further agreement, the agreement in principle will expire if the order confirming the Plan and implementing the injunction has not been entered or affirmed by the District Court by April 30, 2015, or if the effective date of the Plan has not occurred by September 15, 2016. As a result of the agreement in principle to settle, the Company has recorded a charge of
$225 million
in Selling, general and administrative expenses in the Consolidated Statement of Operations during the fourth fiscal quarter of 2014.
As a result of filing the voluntary bankruptcy petition during the third quarter of fiscal 2013, the Company recorded an expected loss upon deconsolidation of
$10 million
related to the Yarway Chapter 11 filing, which continues to represent the Company’s best estimate of its loss.
Other Claims
The Company continuously assesses the sufficiency of its estimated liability for pending and future asbestos claims and defense costs. On a quarterly basis, the Company evaluates actual experience regarding asbestos claims filed, settled and dismissed, amounts paid in settlements, and the recoverability of its insurance assets. If and when data from actual experience demonstrate an unfavorable discernible trend, the Company performs a valuation of its asbestos related liabilities and corresponding insurance assets including a comprehensive review of the underlying assumptions. In addition, the Company evaluates its ability to reasonably estimate claim activity beyond its current look-forward period in order to assess whether such period is appropriate. In addition to claims and litigation experience, the Company considers additional qualitative and quantitative factors such as changes in legislation, the legal environment, the Company’s strategy in managing claims and obtaining insurance, including its defense strategy, and health related trends in the overall population of individuals potentially exposed to asbestos. The Company evaluates all of these factors and determines whether a change in the estimate of its liability for pending and future claims and defense costs or insurance assets is warranted.
During the fourth quarter of fiscal 2014, the Company concluded that an unfavorable trend had developed in actual claim filing activity compared to projected claim filing activity established during the Company’s most recent valuation. Accordingly, the Company, with the assistance of independent actuarial service providers, performed a revised valuation of its asbestos-related liabilities and corresponding insurance assets. As part of the revised valuation, the Company assessed whether a change in its look-forward period was appropriate, taking into consideration its more extensive history and experience with asbestos-related claims and litigation (including its experience with Yarway), and determined that it was now possible to make a reasonable estimate of the actuarially determined ultimate risk of loss for pending and unasserted potential future asbestos-related claims through 2056. In connection with the revised valuation, the Company considered a recent settlement with one of its insurers calling for the establishment of a qualified settlement fund, and the results of a separate independent actuarial consulting firm report conducted in the fourth quarter to assist the Company in obtaining insurance to fully fund all estimable asbestos-related claims (excluding Yarway claims) incurred through 2056.
The independent actuarial service firm calculated a total estimated liability for asbestos-related claims of the Company, which reflects the Company’s best estimate of its ultimate risk of loss to resolve all pending and future claims (excluding Yarway claims) through 2056, which is the Company’s reasonable best estimate of the actuarially determined time period through which asbestos-related claims will be filed against Company affiliates.
In conjunction with determining the total estimated liability, the Company retained an independent third party to assist it in valuing its insurance assets responsive to asbestos-related claims, excluding Yarway claims. These insurance assets represent amounts due to the Company for previously settled claims and the probable reimbursements relating to its total liability for pending and unasserted potential future asbestos claims and defense costs. In calculating this amount, the Company used the estimated asbestos liability for pending and projected future claims and defense costs described above, and it also considered the amount of insurance available, the solvency risk with respect to the Company's insurance carriers, resolution of insurance coverage issues, gaps in coverage, allocation methodologies, and the terms of existing settlement agreements with insurance carriers.
As a result of the activity described above, the Company recorded a net charge, in addition to the amounts described above for Yarway, of
$240 million
in Selling, general and administrative expenses in the Consolidated Statement of Operations during the quarter ended September 26, 2014. Although the Company’s methodology established a range of estimates of reasonably possible outcomes, the Company recorded its best estimate within such range based upon currently known information. The Company's estimated gross asbestos liability, excluding Yarway, of
$538 million
was recorded within the Company's Consolidated Balance Sheet as a liability for pending and future claims and related defense costs, and separately as an asset for insurance recoveries of
$245 million
. The aforementioned total estimated liability is on a pre-tax basis, not discounted for the time-value of money, and includes defense costs, which is consistent with the Company’s historical accounting practices.
107
The effect of the change in our look-forward period reduced income from continuing operations before income taxes and net income by approximately
$116 million
and
$71 million
, respectively. In addition, the effect of the change decreased the Company's basic income from continuing operations and net income by
$0.16
per share, and decreased the Company's diluted income from continuing operations and net income by
$0.15
per share.
The amounts recorded by the Company for asbestos-related liabilities and insurance-related assets are based on the Company's strategies for resolving its asbestos claims, currently available information, and a number of estimates and assumptions. Key variables and assumptions include the number and type of new claims that are filed each year, the average cost of resolution of claims, the identity of defendants, the resolution of coverage issues with insurance carriers, amount of insurance, and the solvency risk with respect to the Company's insurance carriers. Many of these factors are closely linked, such that a change in one variable or assumption will impact one or more of the others, and no single variable or assumption predominately influences the determination of the Company's asbestos-related liabilities and insurance-related assets. Furthermore, predictions with respect to these variables are subject to greater uncertainty in the later portion of the projection period. Other factors that may affect the Company's liability and cash payments for asbestos-related matters include uncertainties surrounding the litigation process from jurisdiction to jurisdiction and from case to case, reforms of state or federal tort legislation and the applicability of insurance policies among subsidiaries. As a result, actual liabilities or insurance recoveries could be significantly higher or lower than those recorded if assumptions used in the Company's calculations vary significantly from actual results.
In connection with the foregoing, during the third quarter of fiscal 2014, the Company resolved disputes with certain of its historical insurers and agreed that certain insurance proceeds will be used to establish and fund a qualified settlement fund (“QSF”), within the meaning of the Internal Revenue Code, which will be used for the resolution of asbestos liabilities of the Company, other than Yarway asbestos claims. It is intended that the QSF will receive future insurance payments and proceeds from third party insurers and, in addition, will fund and manage liabilities for certain historical operations of the Company. In addition, the Company expects to make cash contributions to the QSF structure within the next
12
months of approximately
$275 million
to purchase insurance that will be dedicated to, and is expected to fully fund, these liabilities.
Tax Matters
Tyco and its subsidiaries' income tax returns are examined periodically by various tax authorities. In connection with these examinations, tax authorities, including the IRS, have raised issues and proposed tax adjustments, in particular with respect to years preceding the 2007 Separation. The issues and proposed adjustments related to such years are generally subject to the sharing provisions of a tax sharing agreement entered in 2007 with Covidien and TE Connectivity (the "2007 Tax Sharing Agreement") under which Tyco, Covidien and TE Connectivity share
27%
,
42%
and
31%
, respectively, of shared income tax liabilities that arise from adjustments made by tax authorities to Tyco's, Covidien's and TE Connectivity's U.S. and certain non-U.S. income tax returns. The costs and expenses associated with the management of these shared tax liabilities are generally shared equally among the parties. Tyco has previously disclosed that in connection with U.S. federal tax audits, the IRS has raised a number of issues and proposed tax adjustments for periods beginning with the 1997 tax year. Although Tyco has been able to resolve substantially all of the issues and adjustments proposed by the IRS for tax years through 2007, it has not been able to resolve matters related to the treatment of certain intercompany debt transactions during the period. As a result, on June 20, 2013, Tyco received Notices of Deficiency from the IRS asserting that several of Tyco's former U.S. subsidiaries owe additional taxes of
$883.3 million
plus penalties of
$154 million
based on audits of the 1997 through 2000 tax years of Tyco and its subsidiaries as they existed at that time. In addition, Tyco received Final Partnership Administrative Adjustments for certain U.S. partnerships owned by former U.S. subsidiaries with respect to which an additional tax deficiency of approximately
$30 million
is expected to be asserted. These amounts exclude interest and do not reflect the impact on subsequent periods if the IRS position described below is ultimately proved correct.
The IRS asserted in the Notices of Deficiency that substantially all of Tyco's intercompany debt originated during the 1997 - 2000 period should not be treated as debt for U.S. federal income tax purposes, and has disallowed interest and related deductions recognized on U.S. income tax returns totaling approximately
$2.9 billion
. Tyco strongly disagrees with the IRS position and has filed petitions with the U.S. Tax Court contesting the IRS proposed adjustments. A trial date has been set for February 2016. Tyco believes that it has meritorious defenses for its tax filings, that the IRS positions with regard to these matters are inconsistent with the applicable tax laws and existing Treasury regulations, and that the previously reported taxes for the years in question are appropriate.
No payments with respect to these matters would be required until the dispute is definitively resolved, which, based on the experience of other companies, could take several years. Tyco believes that its income tax reserves and the liabilities recorded in the Consolidated Balance Sheet for the tax sharing agreements continue to be appropriate. However, the ultimate resolution of these matters, and the impact of that resolution, are uncertain and could have a material impact on Tyco's financial condition,
108
results of operations and cash flows. In particular, if the IRS is successful in asserting its claim, it would have an adverse impact on interest deductions related to the same intercompany debt in subsequent time periods, totaling approximately
$6.6 billion
, which is expected to be disallowed by the IRS.
See Note 6 for additional information related to income tax matters.
Other Matters
During the fourth quarter of fiscal 2012, Tyco disclosed the improper recording of revenue in the Company's ROW Installation & Services segment related to security contracts in China. The Company pursued collection under its insurance policy and in the second fiscal quarter of 2014, the Company recorded a
$21 million
insurance recovery within the ROW Installation & Services segment as a result of a settlement with the insurance carrier. The insurance recovery was recorded in Selling, general and administrative expenses in the Consolidated Statement of Operations.
During the first quarter of fiscal 2014, Tyco settled a tax dispute with its former subsidiary, CIT Group, Inc. ("CIT"). Under the terms of the settlement agreement, Tyco received
$60 million
during the first quarter of 2014, which was subject to the sharing provisions of the 2007 Tax Sharing Agreement. As a result, the Company recorded a
$16 million
gain in Selling, general and administrative expenses in the Consolidated Statement of Operations and established payables of
$25 million
and
$19 million
due to Covidien and TE Connectivity, respectively, as of December 27, 2013. The Company paid these amounts to Covidien and TE Connectivity during the second fiscal quarter of 2014.
SimplexGrinnell LP (“SG”), a subsidiary of the Company in the North America Installation & Services segment, has been named as a defendant in several lawsuits seeking damages for SG’s alleged failure to pay prevailing wages in connection with work performed on state and local municipal projects. In New York, the U.S. District Court had granted SG’s motion for summary judgment dismissing plaintiffs’ claims for prevailing wages on testing and inspection work, which was based primarily on a 2009 opinion of the New York Department of Labor (“DOL”) that testing and inspection work would be considered covered by the prevailing wage law only on a prospective basis. Plaintiffs appealed this decision to the U.S. Court of Appeals for the Second Circuit, which in turn asked the NY Court of Appeals whether the lower court should have given deference to the DOL’s prospective-only application of law. The NY Court of Appeals recently ruled that the lower court did not have to give deference to the DOL based on an amicus brief submitted by the DOL in which it stated the Court need not have given it deference. As a result, the Company recorded a
$10 million
charge in Cost of services in the Consolidated Statement of Operations during the fourth quarter of fiscal 2014. SG also is a defendant in two other lawsuits related to prevailing wages in New Jersey and California. SG has agreed in principle to settle the California lawsuit for approximately
$5 million
subject to Court approval, which the Company had previously reserved.
In November 2014, the Company received and responded to recent inquiries from the US Department of the Navy regarding the formulation of certain aqueous film forming foam (AFFF) concentrates. The Company is investigating such matters and ceased selling certain AFFF and other foam products pending the outcome of its investigation. One AFFF product has been removed from the Navy’s Qualified Products List (QPL). The Company is in communication with appropriate governmental authorities about its investigation and is also communicating with the government regarding the qualification of these products. At this time, we cannot predict the outcome of these inquiries and whether this will result in further action by the Navy or other governmental authorities, but it is possible that the Company could be required to pay material fines, consent to injunctions on future conduct, experience suspension or debarment from government contracts, or suffer other criminal or civil penalties or adverse impacts, including being subject to lawsuits brought by private litigants, each of which may have a material adverse effect on the Company’s financial position, results of operations or cash flows.
In addition to the foregoing, the Company is subject to claims and suits, including from time to time, contractual disputes and product and general liability claims, incidental to present and former operations, acquisitions and dispositions. With respect to many of these claims, the Company either self-insures or maintains insurance through third-parties, with varying deductibles. While the ultimate outcome of these matters cannot be predicted with certainty, the Company believes that the resolution of any such proceedings, whether the underlying claims are covered by insurance or not, will not have a material adverse effect on the Company's financial condition, results of operations or cash flows beyond amounts recorded for such matters.
14. Retirement Plans
The Company sponsors a number of pension plans. The Company measures its pension plans as of its fiscal year end. The following disclosures exclude the impact of plans which are immaterial individually and in the aggregate.
109
Defined Benefit Pension Plans
—The Company has a number of noncontributory and contributory defined benefit retirement plans covering certain of its U.S. and non-U.S. employees, designed in accordance with conditions and practices in the countries concerned. Net periodic pension benefit cost is based on periodic actuarial valuations which use the projected unit credit method of calculation and is charged to the Consolidated Statements of Operations on a systematic basis over the expected average remaining service lives of current participants. Contribution amounts are determined based on local regulations and the advice of professionally qualified actuaries in the countries concerned. The benefits under the defined benefit plans are based on various factors, such as years of service and compensation.
The net periodic benefit cost for material U.S. and non-U.S. defined benefit pension plans for
2014
,
2013
and
2012
is as follows ($ in millions):
|
|
U.S. Plans
|
Non-U.S. Plans
|
|||||||||||||||||||||
|
|
2014
|
2013
|
2012
|
2014
|
2013
|
2012
|
|||||||||||||||||
|
Service cost
|
$
|
8
|
|
$
|
6
|
|
$
|
5
|
|
$
|
9
|
|
$
|
8
|
|
$
|
6
|
|
|||||
|
Interest cost
|
38
|
|
33
|
|
35
|
|
57
|
|
50
|
|
53
|
|
|||||||||||
|
Expected return on plan assets
|
(51
|
)
|
(48
|
)
|
(42
|
)
|
(76
|
)
|
(67
|
)
|
(60
|
)
|
|||||||||||
|
Amortization of initial net (asset)
|
—
|
|
—
|
|
—
|
|
—
|
|
—
|
|
(1
|
)
|
|||||||||||
|
Amortization of net actuarial loss
|
9
|
|
14
|
|
13
|
|
13
|
|
11
|
|
7
|
|
|||||||||||
|
Plan settlements, curtailments and special termination benefits
|
—
|
|
—
|
|
—
|
|
1
|
|
—
|
|
—
|
|
|||||||||||
|
Net periodic benefit cost
|
$
|
4
|
|
$
|
5
|
|
$
|
11
|
|
$
|
4
|
|
$
|
2
|
|
$
|
5
|
|
|||||
|
Weighted-average assumptions used to determine net periodic pension cost during the year:
|
|
|
|
|
|
||||||||||||||||||
|
Discount rate
|
4.9
|
%
|
3.6
|
%
|
4.5
|
%
|
4.2
|
%
|
4.2
|
%
|
5.2
|
%
|
|||||||||||
|
Expected return on plan assets
|
8.0
|
%
|
8.0
|
%
|
8.0
|
%
|
6.7
|
%
|
6.8
|
%
|
6.8
|
%
|
|||||||||||
|
Rate of compensation increase
|
N/A
|
|
N/A
|
|
N/A
|
|
2.8
|
%
|
2.8
|
%
|
2.7
|
%
|
|||||||||||
During fiscal 2011, the Company froze its last remaining active U.S. pension plan. For inactive plans the Company amortizes its actuarial gains and losses over the average remaining life expectancy of the pension plan participants.
The estimated net loss for material U.S. and non-U.S. pension benefit plans that will be amortized from accumulated other comprehensive loss into net periodic benefit cost over the next fiscal year is expected to be
$9 million
, and
$14 million
, respectively.
110
The change in benefit obligations, plan assets and the amounts recognized on the Consolidated Balance Sheets for material U.S. and non-U.S. defined benefit plans as of
September 26, 2014
and
September 27, 2013
is as follows ($ in millions):
|
|
U.S. Plans
|
Non-U.S. Plans
|
|||||||||||||
|
|
2014
|
2013
|
2014
|
2013
|
|||||||||||
|
Change in benefit obligations:
|
|
|
|
|
|||||||||||
|
Benefit obligations as of beginning of year
|
$
|
792
|
|
$
|
931
|
|
$
|
1,327
|
|
$
|
1,219
|
|
|||
|
Service cost
|
8
|
|
6
|
|
9
|
|
8
|
|
|||||||
|
Interest cost
|
38
|
|
33
|
|
57
|
|
50
|
|
|||||||
|
Employee contributions
|
—
|
|
—
|
|
2
|
|
2
|
|
|||||||
|
Actuarial loss (gain)
|
55
|
|
(132
|
)
|
106
|
|
93
|
|
|||||||
|
Acquisitions and mergers
|
—
|
|
—
|
|
2
|
|
5
|
|
|||||||
|
Benefits and administrative expenses paid
|
(47
|
)
|
(46
|
)
|
(50
|
)
|
(54
|
)
|
|||||||
|
Plan settlements, curtailments and special termination benefits
|
—
|
|
—
|
|
(10
|
)
|
(2
|
)
|
|||||||
|
Currency translation
|
—
|
|
—
|
|
7
|
|
6
|
|
|||||||
|
Benefit obligations as of end of year
|
$
|
846
|
|
$
|
792
|
|
$
|
1,450
|
|
$
|
1,327
|
|
|||
|
Change in plan assets:
|
|
|
|||||||||||||
|
Fair value of plan assets as of beginning of year
|
$
|
652
|
|
$
|
623
|
|
$
|
1,119
|
|
$
|
1,016
|
|
|||
|
Actual return on plan assets
|
90
|
|
66
|
|
98
|
|
114
|
|
|||||||
|
Employer contributions
|
25
|
|
9
|
|
29
|
|
41
|
|
|||||||
|
Employee contributions
|
—
|
|
—
|
|
2
|
|
2
|
|
|||||||
|
Acquisitions and mergers
|
—
|
|
—
|
|
2
|
|
1
|
|
|||||||
|
Benefits and administrative expenses paid
|
(47
|
)
|
(46
|
)
|
(50
|
)
|
(54
|
)
|
|||||||
|
Plan settlements, curtailments and special termination benefits
|
—
|
|
—
|
|
(10
|
)
|
(2
|
)
|
|||||||
|
Currency translation
|
—
|
|
—
|
|
12
|
|
1
|
|
|||||||
|
Fair value of plan assets as of end of year
|
$
|
720
|
|
$
|
652
|
|
$
|
1,202
|
|
$
|
1,119
|
|
|||
|
Funded status
|
$
|
(126
|
)
|
$
|
(140
|
)
|
$
|
(248
|
)
|
$
|
(208
|
)
|
|||
|
Net amount recognized
|
$
|
(126
|
)
|
$
|
(140
|
)
|
$
|
(248
|
)
|
$
|
(208
|
)
|
|||
|
|
U.S. Plans
|
Non-U.S. Plans
|
|||||||||||||
|
|
2014
|
2013
|
2014
|
2013
|
|||||||||||
|
Amounts recognized in the Consolidated Balance Sheets consist of:
|
|
|
|
|
|||||||||||
|
Current liabilities
|
$
|
(3
|
)
|
$
|
(3
|
)
|
$
|
(6
|
)
|
$
|
(6
|
)
|
|||
|
Non-current liabilities
|
(123
|
)
|
(137
|
)
|
(242
|
)
|
(202
|
)
|
|||||||
|
Net amount recognized
|
$
|
(126
|
)
|
$
|
(140
|
)
|
$
|
(248
|
)
|
$
|
(208
|
)
|
|||
|
Amounts recognized in accumulated other comprehensive loss (before income taxes) consist of:
|
|
|
|||||||||||||
|
Transition asset
|
$
|
—
|
|
$
|
—
|
|
$
|
2
|
|
$
|
2
|
|
|||
|
Net actuarial loss
|
(278
|
)
|
(271
|
)
|
(491
|
)
|
(418
|
)
|
|||||||
|
Total loss recognized
|
$
|
(278
|
)
|
$
|
(271
|
)
|
$
|
(489
|
)
|
$
|
(416
|
)
|
|||
|
Weighted-average assumptions used to determine pension benefit obligations at year end:
|
|
|
|||||||||||||
|
Discount rate
|
4.3
|
%
|
4.9
|
%
|
3.7
|
%
|
4.2
|
%
|
|||||||
|
Rate of compensation increase
|
N/A
|
|
N/A
|
|
2.9
|
%
|
2.8
|
%
|
|||||||
The accumulated and aggregate benefit obligation and fair value of plan assets with accumulated benefit obligations in excess of plan assets as of
September 26, 2014
and
September 27, 2013
were as follows ($ in millions):
111
|
|
U.S. Plans
|
Non-U.S. Plans
|
|||||||||||||
|
|
As of
September 26,
2014
|
As of
September 27, 2013 |
As of
September 26, 2014 |
As of
September 27, 2013 |
|||||||||||
|
Accumulated benefit obligation
|
$
|
846
|
|
$
|
792
|
|
$
|
1,431
|
|
$
|
1,312
|
|
|||
|
Accumulated benefit obligation and fair value of plan assets for plans with accumulated benefit obligations in excess of plan assets:
|
|
|
|||||||||||||
|
Accumulated benefit obligation
|
$
|
846
|
|
$
|
792
|
|
$
|
1,429
|
|
$
|
1,291
|
|
|||
|
Fair value of plan assets
|
720
|
|
652
|
|
1,200
|
|
1,095
|
|
|||||||
|
Aggregate benefit obligation and fair value of plan assets for plans with benefit obligations in excess of plan assets:
|
|
|
|||||||||||||
|
Aggregate benefit obligation
|
$
|
846
|
|
$
|
792
|
|
$
|
1,449
|
|
$
|
1,323
|
|
|||
|
Fair value of plan assets
|
720
|
|
652
|
|
1,202
|
|
1,108
|
|
|||||||
In determining the expected return on plan assets, the Company considers the relative weighting of plan assets by asset class, historical performance of asset classes over long-term periods, asset class performance expectations as well as current and future economic conditions.
The Company's investment strategy for its pension plans is to manage the plans on a going-concern basis. Current investment policy is to maintain an adequate level of diversification while maximizing the return on assets, subject to a prudent level of portfolio risk, for the purpose of enhancing the security of benefits for participants as well as providing adequate liquidity to meet immediate and future benefit payment requirements. In addition, local regulations and local financial considerations are factors in determining the appropriate investment strategy in each country. For U.S. pension plans, this policy targets a
60%
allocation to equity securities and a
40%
allocation to debt securities. Various asset allocation strategies are in place for non-U.S. pension plans, with a weighted-average target allocation of
51%
to equity securities,
44%
to debt securities and
5%
to other asset classes.
Pension plans have the following weighted-average asset allocations:
|
|
U.S. Plans
|
Non-U.S.
Plans
|
|||||||||
|
|
2014
|
2013
|
2014
|
2013
|
|||||||
|
Asset Category:
|
|
|
|
|
|||||||
|
Equity securities
|
62
|
%
|
63
|
%
|
51
|
%
|
52
|
%
|
|||
|
Debt securities
|
36
|
%
|
35
|
%
|
49
|
%
|
48
|
%
|
|||
|
Cash and cash equivalents
|
2
|
%
|
2
|
%
|
—
|
|
—
|
|
|||
|
Total
|
100
|
%
|
100
|
%
|
100
|
%
|
100
|
%
|
|||
Although the Company does not buy or sell any of its own securities as a direct investment for its pension funds, due to external investment management in certain commingled funds, the plans may indirectly hold Tyco securities. The aggregate amount of the securities would not be considered material relative to the total fund assets.
The Company evaluates its defined benefit plans' asset portfolios for the existence of significant concentrations of risk. Types of investment concentration risks that are evaluated include, but are not limited to, concentrations in a single entity, industry, foreign country and individual fund manager. As of
September 26, 2014
, there were no significant concentrations of risk in the Company's defined benefit plan assets.
The Company's plan assets are accounted for at fair value and are classified in their entirety based on the lowest level of input that is significant to the fair value measurement. The Company's assessment of the significance of a particular input to the fair value measurement requires judgment, and may affect the valuation of fair value of assets and their placement within the fair value hierarchy levels. The Company's asset allocations by level within the fair value hierarchy as of
September 26, 2014
and
September 27, 2013
are presented in the table below for the Company's material defined benefit plans.
112
|
|
As of
September 26, 2014
|
||||||||||
|
($ in millions)
|
Level 1
|
Level 2
|
Total
|
||||||||
|
Equity securities:
|
|
|
|
||||||||
|
U.S. equity securities
|
$
|
207
|
|
$
|
326
|
|
$
|
533
|
|
||
|
Non-U.S. equity securities
|
165
|
|
363
|
|
528
|
|
|||||
|
Fixed income securities:
|
|||||||||||
|
Government and government agency securities
|
45
|
|
325
|
|
370
|
|
|||||
|
Corporate debt securities
|
—
|
|
408
|
|
408
|
|
|||||
|
Mortgage and other asset-backed securities
|
—
|
|
69
|
|
69
|
|
|||||
|
Cash and cash equivalents
|
14
|
|
—
|
|
14
|
|
|||||
|
Total
|
$
|
431
|
|
$
|
1,491
|
|
$
|
1,922
|
|
||
|
|
As of
September 27, 2013
|
||||||||||
|
($ in millions)
|
Level 1
|
Level 2
|
Total
|
||||||||
|
Equity securities:
|
|
|
|
||||||||
|
U.S. equity securities
|
$
|
187
|
|
$
|
296
|
|
$
|
483
|
|
||
|
Non-U.S. equity securities
|
165
|
|
351
|
|
516
|
|
|||||
|
Fixed income securities:
|
|
||||||||||
|
Government and government agency securities
|
34
|
|
292
|
|
326
|
|
|||||
|
Corporate debt securities
|
—
|
|
379
|
|
379
|
|
|||||
|
Mortgage and other asset-backed securities
|
—
|
|
54
|
|
54
|
|
|||||
|
Cash and cash equivalents
|
13
|
|
—
|
|
13
|
|
|||||
|
Total
|
$
|
399
|
|
$
|
1,372
|
|
$
|
1,771
|
|
||
Equity securities consist primarily of publicly traded U.S. and non-U.S. equities. Publicly traded securities are valued at the last trade or closing price reported in the active market in which the individual securities are traded. Certain equity securities are held within commingled funds which are valued at the unitized net asset value ("NAV") or percentage of the net asset value as determined by the custodian of the fund. These values are based on the fair value of the underlying net assets owned by the fund.
Fixed income securities consist primarily of government and government agency securities, corporate debt securities, and mortgage and other asset-backed securities. When available, fixed income securities are valued at the closing price reported in the active market in which the individual security is traded. Government and government agency securities and corporate debt securities are valued using the most recent bid prices or occasionally the mean of the latest bid and ask prices when markets are less liquid. Asset-backed securities including mortgage backed securities are valued using broker/dealer quotes when available. When quotes are not available, fair value is determined utilizing a discounted cash flow approach, which incorporates other observable inputs such as cash flows, underlying security structure and market information including interest rates and bid evaluations of comparable securities. Certain fixed income securities are held within commingled funds which are valued unitizing NAV determined by the custodian of the fund. These values are based on the fair value of the underlying net assets owned by the fund.
Cash and cash equivalents consist primarily of short-term commercial paper, bonds and other cash or cash-like instruments including settlement proceeds due from brokers, stated at cost, which approximates fair value.
113
The following tables set forth a summary of pension plan assets valued using NAV or its equivalent as of
September 26, 2014
and
September 27, 2013
($ in millions):
|
|
As of
September 26, 2014
|
||||||
|
Investment ($ in millions)
|
Fair
Value
|
Redemption
Frequency
|
Redemption
Notice
Period
|
||||
|
U.S. equity securities
|
$
|
323
|
|
Daily
|
1 day, 5 days
|
||
|
Non-U.S. equity securities
|
403
|
|
Daily, Semi-monthly
|
1 day, 2 days
|
|||
|
Government and government agency securities
|
159
|
|
Daily
|
1 day, 2 days
|
|||
|
Corporate debt securities
|
136
|
|
Daily
|
1 day, 2 days
|
|||
|
$
|
1,021
|
|
|||||
|
|
As of
September 27, 2013 |
||||||
|
Investment ($ in millions)
|
Fair
Value
|
Redemption
Frequency
|
Redemption
Notice
Period
|
||||
|
U.S. equity securities
|
$
|
292
|
|
Daily
|
1 day, 5 days
|
||
|
Non-U.S. equity securities
|
390
|
|
Daily, Semi-monthly
|
1 day, 2 days, 3 days
|
|||
|
Government and government agency securities
|
148
|
|
Daily
|
1 day, 2 days
|
|||
|
Corporate debt securities
|
121
|
|
Daily
|
1 day, 2 days
|
|||
|
$
|
951
|
|
|
|
|||
The strategy of the Company's investment managers with regard to the investments valued using NAV or its equivalent is to either match or exceed relevant benchmarks associated with the respective asset category. None of the investments valued using NAV or its equivalent contain any redemption restrictions or unfunded commitments.
During 2014, the Company contributed
$25 million
to its U.S. and
$29 million
to its non-U.S. pension plans, which represented the Company's minimum required contributions to its pension plans for fiscal year 2014. The Company did not make any voluntary contributions to its U.S. and non-U.S. plans during 2014.
The Company's funding policy is to make contributions in accordance with the laws and customs of the various countries in which it operates as well as to make voluntary contributions from time-to-time. The Company anticipates that it will contribute at least the minimum required to its pension plans in
2015
of
$13 million
for the U.S. plans and
$23 million
for non-U.S. plans.
Benefit payments, including those amounts to be paid out of corporate assets and reflecting future expected service as appropriate, are expected to be paid as follows ($ in millions):
|
U.S. Plans
|
Non-U.S. Plans
|
||||||
|
2015
|
$
|
43
|
|
$
|
52
|
|
|
|
2016
|
44
|
|
50
|
|
|||
|
2017
|
45
|
|
51
|
|
|||
|
2018
|
47
|
|
53
|
|
|||
|
2019
|
47
|
|
54
|
|
|||
|
2020 - 2023
|
251
|
|
296
|
|
|||
The Company also participates in a number of multi-employer defined benefit plans on behalf of certain employees. Pension expense related to multi-employer plans was not material for
2014
,
2013
and
2012
.
Executive Retirement Arrangements
—Messrs. Kozlowski and Swartz participated in individual Executive Retirement Arrangements maintained by Tyco (the "ERA"). Under the ERA, Messrs. Kozlowski and Swartz would have fixed lifetime benefits commencing at their normal retirement age of
65
. Due to the legal settlements as described in Note 13, the Company reversed the liabilities to Messrs. Kozlowski and Swartz in fiscal years 2014 and 2012, respectively.
114
Defined Contribution Retirement Plans
—The Company maintains several defined contribution retirement plans, which include 401(k) matching programs, as well as qualified and nonqualified profit sharing and share bonus retirement plans. Expense for the defined contribution plans is computed as a percentage of participants' compensation and was
$65 million
,
$63 million
and
$58 million
for
2014
,
2013
and
2012
, respectively. The Company maintained an unfunded Supplemental Executive Retirement Plan ("SERP") for fiscal years 2012. This plan was nonqualified and restored the employer match that certain employees lost due to IRS limits on eligible compensation under the defined contribution plans. The expense related to the SERP was not material for 2012. The SERP was merged with the other nonqualified deferred compensation plans, discussed in the next paragraph, as of September 28, 2012.
Deferred Compensation Plans
—The Company has nonqualified deferred compensation plans, which permit eligible employees to defer a portion of their compensation. A record keeping account is set up for each participant and the participant chooses from a variety of measurement funds for the deemed investment of their accounts. The measurement funds correspond to a number of funds in the Company's 401(k) plans and the account balance fluctuates with the investment returns on those funds. Deferred compensation liabilities were
$95 million
and
$113 million
as of
September 26, 2014
and
September 27, 2013
, respectively. Deferred compensation expense was not material for
2014
,
2013
and
2012
.
Postretirement Benefit Plans
—The Company generally does not provide postretirement benefits other than pensions for its employees. However, certain acquired operations provide these benefits to employees who were eligible at the date of acquisition, and a small number of U.S. and Canadian operations provide ongoing eligibility for such benefits.
Net periodic postretirement benefit cost was not material for
2014
,
2013
and
2012
. The Company's Consolidated Balance Sheets include unfunded postretirement benefit obligations of
$32 million
and
$33 million
as of
September 26, 2014
and
September 27, 2013
, respectively within other liabilities. The Company's Consolidated Balance Sheets include
nil
of postretirement benefit assets as of both
September 26, 2014
and
September 27, 2013
. In addition, the Company recorded a net actuarial gain of
$6 million
and
$8 million
within accumulated other comprehensive loss as of
September 26, 2014
and
September 27, 2013
, respectively.
The Company expects to make contributions to its postretirement benefit plans of
$3 million
in
2015
.
Benefit payments, including those amounts to be paid out of corporate assets and reflecting future expected service as appropriate, are expected to be paid as follows ($ in millions):
|
2015
|
$
|
3
|
|
|
2016
|
3
|
|
|
|
2017
|
3
|
|
|
|
2018
|
3
|
|
|
|
2019
|
3
|
|
|
|
2020-2023
|
11
|
|
|
15. Shareholders' Equity and Comprehensive Income
Dividends
The Company makes dividend payments from its contributed surplus equity position in its Swiss statutory accounts. These payments are made free of Swiss withholding taxes and are effectively denominated in U.S. dollars.
Under Swiss law, the authority to declare dividends is vested in the general meeting of shareholders. On March 5, 2014, the Company's shareholders approved an annual cash dividend of
$0.72
per common share. Payment of the dividend is to be made in
four
quarterly installments of
$0.18
from May 2014 through February 2015. As a result, during the quarter ended March 28, 2014, the Company recorded an accrued dividend of
$332 million
within Accrued and other current liabilities and a corresponding reduction to Contributed surplus on the Company's Consolidated Balance Sheet. The first installment was paid on May 21, 2014 to shareholders of record on April 25, 2014. The second installment was paid on August 20, 2014 to shareholders of record on July 25, 2014. The third installment was paid on November 13, 2014 to stockholders of record on October 24, 2014. The fourth installment will be paid in February 2015.
Upon the closing of the merger transaction between Tyco International Ltd. and its wholly-owned subsidiary, Tyco Ireland, which is expected to occur in November 2014, the Company's jurisdiction of incorporation will change from Switzerland to Ireland. As a result, the authority to declare and pay dividends will be vested in the Board of Directors. The
115
timing, declaration and payment of future dividends to holders of our common shares will be determined by the Company's Board of Directors and will depend upon many factors, including the Company's financial condition and results of operations, the capital requirements of the Company's businesses, industry practice and any other relevant factors.
Under Irish law, dividends may only be paid (and share repurchases and redemptions must generally be funded) out of “distributable reserves,” which Tyco Ireland will not have immediately following the closing of the merger between Tyco International Ltd. and Tyco Ireland. The creation of distributable reserves of Tyco Ireland by way of a capital reduction of Tyco Ireland requires the approval of the Irish High Court and, in connection with seeking such court approval, the Company has obtained the approval of its shareholders to create distributable reserves for Tyco Ireland (through the reduction of the share premium account of Tyco Ireland).
The approval of the Irish High Court is expected within approximately six to twelve weeks following the closing of the merger between Tyco International Ltd. and Tyco Ireland. The Company is not aware of any reason why the Irish High Court would not approve the creation of distributable reserves. However, the issuance of the required order is a matter for the discretion of the Irish High Court. In the event that distributable reserves of Tyco Ireland are not created, no distributions by way of dividends, share repurchases or otherwise will be permitted under Irish law (with the exception of the dividend that is scheduled to be paid in February 2015) until such time as the group has created sufficient distributable reserves from its trading activities.
On March 6, 2013, the Company's shareholders approved a cash dividend of
$0.64
per share, payable to shareholders in
four
quarterly installments of
$0.16
in May 2013, August 2013, November 2013 and February 2014. As a result, during the quarter ended March 29, 2013, the Company recorded an accrued dividend of
$296 million
within Accrued and other current liabilities and a corresponding reduction to Contributed surplus on the Company's Consolidated Balance Sheet. The first installment of
$0.16
was paid on May 22, 2013 to shareholders of record on April 26, 2013. The second installment of
$0.16
was paid on August 21, 2013 to shareholders of record on July 26, 2013. The third installment of
$0.16
was paid on November 14, 2013 to shareholders of record on October 25, 2013. The fourth installment of
$0.16
was paid on February 19, 2014 to shareholders of record on January 24, 2014.
On March 7, 2012, the Company's shareholders approved a cash dividend of
$0.50
per share, payable to shareholders in
two
quarterly installments of
$0.25
on May 23, 2012 and August 22, 2012. The first installment of
$0.25
of the
$0.50
dividend was paid on May 23, 2012 to shareholders on record on April 27, 2012. The second installment of
$0.25
of the
$0.50
dividend was paid on August 22, 2012 to shareholders on record on July 27, 2012. On September 17, 2012, the Company's shareholders approved a cash dividend of
$0.30
per share, payable to shareholders in
two
quarterly installments of
$0.15
on November 15, 2012 and February 20, 2013. The
$0.30
dividend reflects the impact of the 2012 Separation on the Company's dividend policy. The first installment of
$0.15
of the
$0.30
dividend was paid on November 15, 2012 to shareholders of record on October 16, 2012. The second installment of
$0.15
of the $0.30 dividend was paid on February 20, 2013 to shareholders of record on January 25, 2013. As a result, the Company recorded an accrued dividend of
$231 million
as of March 7, 2012 and an additional accrued dividend of
$139 million
as of September 17, 2012 within Accrued and other current liabilities and a corresponding reduction to Contributed surplus on the Company's Consolidated Balance Sheet.
Common Stock
As of
September 26, 2014
, the Company's share capital amounted to CHF
243,181,525
, or
486,363,050
registered common shares with a par value of CHF
0.50
per share. Until March 6, 2015, the Board of Directors may increase the Company's share capital by a maximum amount of CHF
121,500,000
by issuing a maximum of
243,000,000
shares. In addition, (i) the share capital of the Company may be increased by an amount not exceeding CHF
23,964,755
through the issue of a maximum of
47,929,510
shares through the exercise of conversion and/or option or warrant rights granted in connection with bonds, notes or similar instruments and (ii) the share capital of the Company may be increased by an amount not exceeding CHF
23,964,755
through the issue of a maximum of
47,929,510
shares to employees and other persons providing services to the Company. Although the Company states its par value in Swiss francs, it continues to use the U.S. dollar as its reporting currency for preparing its Consolidated Financial Statements.
On March 6, 2013, shareholders of the Company approved a reduction of the Company's registered share capital from CHF
3,258,632,435
to CHF
243,181,525
by reducing the par value of each share from CHF
6.70
to CHF
0.50
per share and correspondingly increasing the Company's contributed surplus by CHF
3,015,450,910
. The reduction in registered share capital and corresponding increase in contributed surplus, which did not result in any changes to total Shareholders' Equity, was recorded during the year ended September 27, 2013.
116
On September 9, 2014, shareholders of the Company approved the merger between the Company and Tyco Ireland, and the merger is expected to be completed in November 2014. Upon completion of the merger, the Company’s authorized share capital will be
$11,000,000
and
€40,000
, divided into
1,000,000,000
ordinary shares with a par value of
$0.01
per share,
100,000,000
preferred shares with a par value of
$0.01
per share and
40,000
ordinary A shares with a par value of
€1.00
per share. Based on the number of Company shares outstanding as of November 7, 2014, Tyco Ireland is expected to issue
418,465,546
ordinary shares with a nominal value of
$0.01
per share to the former shareholders of the Company on the completion of the Merger, which will constitute all of the Company’s outstanding share capital.
Share Repurchase Program
The Company's Board of Directors approved the
$1 billion
and
$1.75 billion
2014 share repurchase programs and the
$600 million
2013 share repurchase program in September 2014, March 2014 and January 2013, respectively. Share repurchases reduce the amount of common shares outstanding and decrease the dividends declared on the Consolidated Statement of Shareholders' Equity. Shares repurchased by the Company by fiscal year and share repurchase program are provided below:
|
|
2014 Share
Repurchase Programs |
2013 Share
Repurchase Program |
2011 Share
Repurchase Program |
|||||||||||||||||
|
|
Shares
(in millions) |
Amounts
($ in billions) |
Shares
(in millions) |
Amounts
($ in billions) |
Shares
(in millions) |
Amounts
($ in billions) |
||||||||||||||
|
Approved Repurchase Amount
|
|
|
$
|
2.8
|
|
|
|
$
|
0.6
|
|
|
|
$
|
1.0
|
|
|||||
|
Repurchases
|
|
|
|
|
|
|
||||||||||||||
|
Fiscal 2014
|
30.0
|
|
1.4
|
|
12.0
|
|
0.5
|
|
||||||||||||
|
Fiscal 2013
|
N/A
|
|
N/A
|
|
3.0
|
|
0.1
|
|
7.0
|
|
0.2
|
|
||||||||
|
Fiscal 2012
|
N/A
|
|
N/A
|
|
N/A
|
|
N/A
|
|
11.0
|
|
0.5
|
|
||||||||
|
Fiscal 2011
|
N/A
|
|
N/A
|
|
N/A
|
|
N/A
|
|
6.0
|
|
0.3
|
|
||||||||
|
Remaining Amount Available
|
|
$
|
1.4
|
|
|
$
|
—
|
|
|
$
|
—
|
|
||||||||
Comprehensive Income
|
|
2014
|
2013
|
2012
|
||||||||
|
Net income
|
$
|
1,839
|
|
$
|
533
|
|
$
|
471
|
|
||
|
Foreign currency translation
|
(133
|
)
|
(85
|
)
|
92
|
|
|||||
|
Liquidation of foreign entities
(1)
|
(40
|
)
|
(9
|
)
|
2
|
|
|||||
|
Income tax expense
(2)
|
(1
|
)
|
(6
|
)
|
(1
|
)
|
|||||
|
Foreign currency translation, net of tax
|
(174
|
)
|
(100
|
)
|
93
|
|
|||||
|
Net actuarial (losses) gains
|
(102
|
)
|
109
|
|
(212
|
)
|
|||||
|
Amortization reclassified into earnings
(3)
|
22
|
|
26
|
|
22
|
|
|||||
|
Foreign currency and other
|
(2
|
)
|
(2
|
)
|
(15
|
)
|
|||||
|
Income tax benefit (expense)
|
18
|
|
(54
|
)
|
42
|
|
|||||
|
Defined benefit and post retirement plans, net of tax
|
(64
|
)
|
79
|
|
(163
|
)
|
|||||
|
Unrealized (loss) gain on marketable securities and derivative instruments
(4)
|
(1
|
)
|
2
|
|
(1
|
)
|
|||||
|
Income tax benefit (expense)
|
1
|
|
(2
|
)
|
1
|
|
|||||
|
Unrealized loss on marketable securities and derivative instruments, net of tax
|
—
|
|
—
|
|
—
|
|
|||||
|
Total other comprehensive loss, net of tax
|
(238
|
)
|
(21
|
)
|
(70
|
)
|
|||||
|
Comprehensive income
|
1,601
|
|
512
|
|
401
|
|
|||||
|
Less: comprehensive gain (loss) attributable to noncontrolling interests
|
1
|
|
(3
|
)
|
(1
|
)
|
|||||
|
Comprehensive income attributable to Tyco common shareholders
|
$
|
1,600
|
|
$
|
515
|
|
$
|
402
|
|
||
|
(1)
|
During the years ended
September 26, 2014
,
September 27, 2013
and
September 28, 2012
,
$40 million
of cumulative translation gains,
$9 million
of cumulative translation gains and
$2 million
of cumulative translation losses,
|
117
respectively, were transferred from currency translation adjustments as a result of the sale of foreign entities. Of these amounts,
$40 million
,
nil
and
$2 million
, respectively, are included in Income from discontinued operations in the Consolidated Statements of Operations.
|
(2)
|
Income tax expense on the net investment hedge was
$1 million
,
$6 million
, and
$1 million
for the years ended
September 26, 2014
,
September 27, 2013
and
September 28, 2012
.
|
|
(3)
|
Reclassified to net periodic benefit cost. See Note 14 Retirement Plans for additional information. During the year ended
September 26, 2014
,
$6 million
of net actuarial losses were transferred from amortization of net actuarial losses and included in Income from discontinued operations in the Consolidated Statements of Operations as a result of the sale of foreign entities.
|
|
(4)
|
Reclassified realized gain (loss) on marketable securities and derivative instruments to Other expense, net.
|
Accumulated Other Comprehensive Loss
The components of Accumulated other comprehensive loss are as follows ($ in millions):
|
Currency
Translation Adjustments |
Retirement
Plans |
Accumulated Other
Comprehensive Loss |
|||||||||
|
Balance as of September 30, 2011
|
$
|
70
|
|
$
|
(506
|
)
|
$
|
(436
|
)
|
||
|
Other comprehensive income (loss), net of tax
|
93
|
|
(163
|
)
|
(70
|
)
|
|||||
|
Distribution of Tyco Flow Control and ADT
|
(582
|
)
|
122
|
|
(460
|
)
|
|||||
|
Balance as of September 28, 2012
|
(419
|
)
|
(547
|
)
|
(966
|
)
|
|||||
|
Other comprehensive (loss) income, net of tax
|
(100
|
)
|
79
|
|
(21
|
)
|
|||||
|
Balance as of September 27, 2013
|
(519
|
)
|
(468
|
)
|
(987
|
)
|
|||||
|
Other comprehensive loss, net of tax
|
(174
|
)
|
(64
|
)
|
(238
|
)
|
|||||
|
Balance as of September 26, 2014
|
$
|
(693
|
)
|
$
|
(532
|
)
|
$
|
(1,225
|
)
|
||
16. Share Plans
Total share-based compensation cost recognized within continuing and discontinued operations during 2014, 2013 and 2012 consisted of the following ($ in millions):
|
2014
|
2013
|
2012
|
|||||||||
|
Selling, general and administrative expenses
|
$
|
72
|
|
$
|
63
|
|
$
|
81
|
|
||
|
Separation costs
|
—
|
|
—
|
|
28
|
|
|||||
|
Restructuring and asset impairments charges, net
|
—
|
|
—
|
|
4
|
|
|||||
|
Total share-based compensation costs included in continuing operations
|
72
|
|
63
|
|
113
|
|
|||||
|
Discontinued operations
|
—
|
|
—
|
|
27
|
|
|||||
|
Total share-based compensation costs
|
$
|
72
|
|
$
|
63
|
|
$
|
140
|
|
||
The Company has recognized a related tax benefit associated with its share-based compensation arrangements during 2014, 2013 and 2012 of
$25 million
, and
$20 million
and
$43 million
, of which
nil
,
nil
and
$8 million
is included in Discontinued operations, respectively.
The share-based compensation disclosures were not recast for the divestiture of the South Korean security business as the amounts were not material.
In connection with the 2012 Separation, most employees' outstanding stock option awards were converted into options to acquire the stock of the employee's post-Separation employer in a manner designed to preserve the intrinsic value of such awards. However, for certain corporate employees and for all terminated employees, all or a portion of such employees' stock option awards were converted into options to acquire the stock of each of the Company, Pentair and ADT. The modifications made to the share options as a result of the 2012 Separation constituted a modification under the authoritative guidance for accounting for stock compensation, which requires a comparison of fair values of the stock option awards immediately before the 2012 Separation and the fair values immediately after the 2012 Separation. In certain instances, the fair value immediately after the 2012 Separation was higher. As a result, the modification resulted in incremental compensation cost of
$1 million
, the
118
majority of which was recorded in Discontinued operations within the Consolidated Statement of Operations for the year ended September 28, 2012. Except for the changes described, the material terms of the stock option awards remained unchanged from the original grant. While the equity awards held by employees were converted as of September 28, 2012, the 2012 grant date fair values, intrinsic values, vested values and Black-Scholes assumptions are on a pre-conversion basis.
Also in connection with the 2012 Separation, restricted stock units held by Tyco employees and deferred stock units held by Tyco directors were converted, in some cases, into restricted stock units in the Company, Pentair and ADT, and in other cases, solely into restricted stock units of the employee's post-Separation employer. All such modifications were designed in a manner to preserve the intrinsic value of such awards. Except for the changes described, the material terms of the restricted stock units and deferred stock units remained unchanged from the original grant.
On July 12, 2012, in connection with the 2012 Separation, the Board of Directors approved the conversion of all outstanding performance share units of the Company into restricted stock units based on performance achieved through June 29, 2012. Each performance share unit converted into a number of restricted stock units at a ratio determined by the Compensation Committee on August 2, 2012 based on its review and certification of performance results through June 29, 2012. Upon vesting of the resulting restricted stock units, each award will be settled in stock. All awards maintained their original vesting terms. The modifications made to the market-based condition of outstanding performance share units as a result of the 2012 Separation also constituted a modification similar to the modification described above. As a result, the modification resulted in incremental compensation cost of
$8 million
, of which
$7 million
was recorded in Separation costs and
$1 million
in Discontinued operations within the Consolidated Statement of Operations for the year ended September 28, 2012. In addition, incremental expense was recognized in the same quarter the performance was achieved through June 29, 2012. Such expense totaled
$7 million
, of which
$6 million
was recorded in Separation costs and
$1 million
in Discontinued operations within the Consolidated Statement of Operations for the year ended September 28, 2012.
On September 17, 2012, shareholders approved the Tyco International 2012 Stock and Incentive Plan (the "2012 Plan") which replaced the 2004 Tyco International Ltd. Stock and Incentive Plan (the "2004 Plan"). The 201
2
Plan provides for the award of stock options, stock appreciation rights, annual performance bonuses, long term performance awards, restricted units, restricted shares, deferred stock units, promissory stock and other stock-based awards (collectively, "Awards"). Pursuant to the 2012 Plan, effective October 1, 2012,
50 million
common shares were available for equity-based awards, subject to adjustments as provided under the terms of the 2012 Plan. No additional awards may be granted under the 2004 Plan. In addition, any common shares which have been awarded under the 2004 Plan but which are not issued, owing to expiration, forfeiture, cancellation, return to the Company or settlement in cash in lieu of common shares on or after January 1, 2004 and which are no longer available for any reason will also be available for issuance under the 2012 Plan. When common shares are issued pursuant to a grant of a full value award (for example, restricted stock units and performance share units), the total number of common shares remaining available for grant will be decreased by
3.32
shares under the 2012 Plan. As of
September 26, 2014
, there were approximately
35 million
shares available for grant under the 2012 Plan.
Share Options
—Options are granted to purchase common shares at prices that are equal to or greater than the closing market price of the common shares on the date the option is granted. Conditions of vesting are determined at the time of grant. Options are generally exercisable in equal annual installments over a period of
four
years and will generally expire
10
years after the date of grant. Historically, the Company's practice has been to settle stock option exercises through either newly issued shares or from shares held in treasury.
The grant-date fair value of each option grant is estimated using the Black-Scholes option pricing model. The fair value is then amortized on a straight-line basis over the requisite service period of the awards, which is generally the vesting period. Use of a valuation model requires management to make certain assumptions with respect to selected model inputs. Expected volatility is calculated based on an analysis of historic and implied volatility measures for a set of peer companies. The average expected life is based on the contractual term of the option and expected employee exercise and post-vesting employment termination behavior. The risk-free interest rate is based on U.S. Treasury zero-coupon issues with a remaining term equal to the expected life assumed at the date of grant. The compensation expense recognized is net of estimated forfeitures. Forfeitures are estimated based on voluntary termination behavior, as well as an analysis of actual share option forfeitures. The weighted-average assumptions used in the Black-Scholes option pricing model for 2014, 2013 and 2012 are as follows:
119
|
2014
|
2013
|
2012
|
|||||||||
|
Expected stock price volatility
|
33
|
%
|
35
|
%
|
36
|
%
|
|||||
|
Risk free interest rate
|
1.64
|
%
|
0.87
|
%
|
1.46
|
%
|
|||||
|
Expected annual dividend per share
|
$
|
0.64
|
|
$
|
0.60
|
|
$
|
1.00
|
|
||
|
Expected life of options (years)
|
5.5
|
|
5.8
|
|
5.8
|
|
|||||
The weighted-average grant-date fair values of options granted during 2014, 2013 and 2012 was
$10.24
,
$7.21
and
$12.56
, respectively. The total intrinsic value of options exercised during 2014, 2013 and 2012 was
$76 million
,
$73 million
and
$85 million
, respectively. The related excess cash tax benefit classified as a financing cash inflow for 2014, 2013 and 2012 was not material.
A summary of the option activity as of
September 26, 2014
, and changes during the year then ended is presented below:
|
Shares
|
Weighted-
Average
Exercise Price
|
Weighted-
Average
Remaining
Contractual Term
(in years)
|
Aggregate
Intrinsic
Value
($ in millions)
|
|||||||||
|
Outstanding as of September 27, 2013
|
17,799,189
|
|
$
|
22.34
|
|
|||||||
|
Granted
|
1,996,237
|
|
37.56
|
|
||||||||
|
Exercised
|
(4,148,851
|
)
|
21.96
|
|
||||||||
|
Expired
|
(476,722
|
)
|
26.39
|
|
||||||||
|
Forfeited
|
(43,488
|
)
|
24.46
|
|
||||||||
|
Outstanding as of September 26, 2014
|
15,126,365
|
|
24.31
|
|
6.07
|
$
|
301
|
|
||||
|
Vested and unvested expected to vest as of September 26, 2014
|
14,536,978
|
|
24.08
|
|
6.00
|
$
|
293
|
|
||||
|
Exercisable as of September 26, 2014
|
7,936,033
|
|
20.75
|
|
4.33
|
$
|
185
|
|
||||
As of
September 26, 2014
, there was
$30 million
of total unrecognized compensation cost related to unvested options granted. The cost is expected to be recognized over a weighted-average period of
2.5
fiscal years.
Employee Stock Purchase Plans
—The Tyco Employee Stock Purchase Plan ("ESPP") was suspended indefinitely during the fourth quarter of 2009. As of
September 26, 2014
, there were approximately
3 million
shares available for grant under the ESPP.
Restricted Share Awards
—Restricted share awards, including restricted stock units and performance share units are granted subject to certain restrictions. Conditions of vesting are determined at the time of grant. Restrictions on the award generally lapse upon normal retirement, if more than twelve months from the grant date, death or disability of the employee.
The fair market value of restricted awards, both time vesting and those subject to specific performance criteria, are expensed over the period of vesting. Restricted stock units, which vest based solely upon passage of time generally vest over a period of
four
years. The fair value of restricted stock units is determined based on the closing market price of the Company's shares on the grant date. Performance share units, which are restricted share awards that vest dependent upon attainment of various levels of performance that equal or exceed targeted levels generally vest in their entirety
three
years from the grant date. The fair value of performance share units is determined based on the Monte Carlo valuation model. The compensation expense recognized for all restricted share awards is net of estimated forfeitures.
Recipients of restricted stock units have no voting rights and receive dividend equivalent units ("DEUs"). Recipients of performance share units have no voting rights and receive DEUs depending on the attainment of performance levels.
120
A summary of the activity of the Company's restricted stock unit awards as of
September 26, 2014
and changes during the year then ended is presented in the tables below:
|
Non-vested Restricted Stock Units
|
Shares
|
Weighted-Average
Grant-Date
Fair Value
|
||||
|
Non-vested as of September 27, 2013
|
3,969,127
|
|
$
|
22.63
|
|
|
|
Granted
|
717,217
|
|
38.73
|
|
||
|
Vested
|
(1,990,298
|
)
|
20.63
|
|
||
|
Forfeited
|
(284,746
|
)
|
24.25
|
|
||
|
Non-vested as of September 26, 2014
|
2,411,300
|
|
28.59
|
|
||
The weighted-average grant-date fair value of restricted stock units granted during 2014, 2013 and 2012 was
$38.73
,
$27.66
and
$45.54
, respectively. The total fair value of restricted stock units vested during 2014, 2013 and 2012 was
$79 million
,
$64 million
and
$90 million
, respectively.
As of
September 26, 2014
, there was
$37 million
of total unrecognized compensation cost related to all unvested restricted share awards. The cost is expected to be recognized over a weighted-average period of
2.5
fiscal years.
A summary of the activity of the Company's performance share unit awards as of
September 26, 2014
and changes during the year then ended is presented in the table below:
|
Non-vested Performance Share Units
|
Shares
|
Weighted-Average
Grant-Date
Fair Value
|
||||
|
Non-vested as of September 27, 2013
|
855,842
|
|
|
|
||
|
Granted
|
631,373
|
|
$
|
39.01
|
|
|
|
Vested
|
—
|
|
|
|
||
|
Forfeited
|
(99,564
|
)
|
32.40
|
|
||
|
Non-vested as of September 26, 2014
|
1,387,651
|
|
34.10
|
|
||
The weighted-average grant-date fair value of performance share units granted during 2014, 2013 and 2012 was
$39.01
,
$30.36
and
$48.86
, respectively. The total fair value of performance share units vested during 2014, 2013 and 2012 was
$22 million
,
$25 million
and
nil
. As of August 2, 2012, all performance share units then outstanding were converted to restricted stock units; the outstanding shares at that time have been moved to the restricted stock units reporting table.
As of
September 26, 2014
, there was
$22 million
of total unrecognized compensation cost related to all unvested performance share awards. The cost is expected to be recognized over a weighted-average period of
1.8
fiscal years.
Deferred Stock Units
—Deferred Stock Units ("DSUs") are notional units that are tied to the value of Tyco common shares with distribution deferred until termination of employment or service to the Company. Distribution, when made, will be in the form of actual shares on a one-for-one basis. Similar to restricted stock units that vest over time, the fair value of DSUs is determined based on the closing market price of the Company's shares on the grant date and is amortized to expense over the vesting period. Recipients of DSUs do not have the right to vote and do not receive cash dividends. However, they have the right to receive dividend equivalent units. Conditions of vesting are determined at the time of grant. Under the 2004 Plan, grants made to executives generally vested in equal annual installments over
three
years while DSUs granted to the Board of Directors were immediately vested. The Company had
1.1 million
DSUs outstanding as of September 28, 2012, all of which are fully vested and
1.0 million
of which were delivered six months following September 28, 2012.
There were no DSU awards granted during 2014, 2013 and 2012; however, participants continue to earn DEUs on their existing awards. The total fair value of DSUs including DEUs vested during 2014, 2013 and 2012 was
nil
,
nil
and
$1 million
, respectively.
121
17. Consolidated Segment Data
Segment information is consistent with how management reviews the businesses, make investing and resource allocation decisions and assesses operating performance. The Company operates and reports financial and operating information in the following
three
segments:
|
•
|
NA Installation & Services
designs, sells, installs, services and monitors electronic security systems and fire detection and suppression systems for commercial, industrial, retail, institutional and governmental customers in North America.
|
|
•
|
ROW Installation & Services
designs, sells, installs, services and monitors electronic security systems and fire detection and suppression systems for commercial, industrial, retail, residential, small business, institutional and governmental customers in the Rest of World ("ROW") regions.
|
|
•
|
Global Products
designs, manufactures and sells fire protection, security and life safety products, including intrusion security, anti-theft devices, breathing apparatus and access control and video management systems, for commercial, industrial, retail, residential, small business, institutional and governmental customers worldwide, including products installed and serviced by our NA and ROW Installation & Services segments.
|
The Company also provides general corporate services to its segments which are reported as a fourth, non-operating segment, Corporate and Other.
Selected information by segment is presented in the following tables ($ in millions):
|
2014
|
2013
|
2012
|
|||||||||
|
Net Revenue
(1)
:
|
|
|
|
||||||||
|
NA Installation & Services
|
$
|
3,876
|
|
$
|
3,891
|
|
$
|
3,962
|
|
||
|
ROW Installation & Services
|
3,920
|
|
3,843
|
|
3,830
|
|
|||||
|
Global Products
|
2,544
|
|
2,339
|
|
2,100
|
|
|||||
|
$
|
10,340
|
|
$
|
10,073
|
|
$
|
9,892
|
|
|||
_______________________________________________________________________________
|
(1)
|
Net revenue by operating segment excludes intercompany transactions.
|
|
2014
|
2013
|
2012
|
|||||||||
|
Operating income (loss):
|
|
|
|
||||||||
|
NA Installation & Services
|
$
|
450
|
|
$
|
388
|
|
$
|
374
|
|
||
|
ROW Installation & Services
|
409
|
|
333
|
|
349
|
|
|||||
|
Global Products
|
458
|
|
307
|
|
353
|
|
|||||
|
Corporate and Other
(1)
|
(620
|
)
|
(319
|
)
|
(498
|
)
|
|||||
|
$
|
697
|
|
$
|
709
|
|
$
|
578
|
|
|||
_______________________________________________________________________________
|
(1)
|
Operating loss for fiscal 2014 includes asbestos related charges of
$225 million
related to the Yarway settlement and
$240 million
related to an updated valuation performed over the Company's liability for asbestos related claims (excluding Yarway claims), partially offset by
$96 million
of legacy legal reversal and recoveries. See Note 13 to the Consolidated Financial Statements.
|
122
Total assets by segment as of
September 26, 2014
,
September 27, 2013
and
September 28, 2012
are as follows ($ in millions):
|
2014
|
2013
|
2012
|
|||||||||
|
Total Assets:
|
|
|
|
||||||||
|
NA Installation & Services
|
$
|
3,870
|
|
$
|
3,842
|
|
$
|
3,965
|
|
||
|
ROW Installation & Services
|
3,188
|
|
3,113
|
|
3,152
|
|
|||||
|
Global Products
|
2,676
|
|
2,726
|
|
2,377
|
|
|||||
|
Corporate and Other
|
2,054
|
|
1,639
|
|
2,058
|
|
|||||
|
Assets held for sale
|
21
|
|
856
|
|
813
|
|
|||||
|
$
|
11,809
|
|
$
|
12,176
|
|
$
|
12,365
|
|
|||
Depreciation and amortization and capital expenditures by segment for the years ended
September 26, 2014
,
September 27, 2013
and
September 28, 2012
are as follows ($ in millions):
|
2014
|
2013
|
2012
|
|||||||||
|
Depreciation and amortization:
|
|
|
|
||||||||
|
NA Installation & Services
|
$
|
137
|
|
$
|
139
|
|
$
|
137
|
|
||
|
ROW Installation & Services
|
144
|
|
178
|
|
172
|
|
|||||
|
Global Products
|
72
|
|
58
|
|
63
|
|
|||||
|
Corporate and Other
|
8
|
|
7
|
|
7
|
|
|||||
|
$
|
361
|
|
$
|
382
|
|
$
|
379
|
|
|||
|
2014
|
2013
|
2012
|
|||||||||
|
Capital expenditures
|
|
|
|
||||||||
|
NA Installation & Services
|
$
|
133
|
|
$
|
92
|
|
$
|
107
|
|
||
|
ROW Installation & Services
|
102
|
|
110
|
|
|
100
|
|
||||
|
Global Products
|
45
|
|
58
|
|
74
|
|
|||||
|
Corporate and Other
|
8
|
|
10
|
|
14
|
|
|||||
|
$
|
288
|
|
$
|
270
|
|
$
|
295
|
|
|||
Net revenue by geographic area for the years ended
September 26, 2014
,
September 27, 2013
and
September 28, 2012
is as follows ($ in millions):
|
2014
|
2013
|
2012
|
|||||||||
|
Net Revenue
(1)
:
|
|
|
|
||||||||
|
North America
(2)
|
$
|
5,496
|
|
$
|
5,343
|
|
$
|
5,257
|
|
||
|
Latin America
|
500
|
|
456
|
|
427
|
|
|||||
|
Europe, Middle East and Africa
(3)
|
2,836
|
|
2,758
|
|
2,766
|
|
|||||
|
Asia-Pacific
|
1,508
|
|
1,516
|
|
1,442
|
|
|||||
|
$
|
10,340
|
|
$
|
10,073
|
|
$
|
9,892
|
|
|||
_______________________________________________________________________________
|
(1)
|
Net revenue is attributed to individual countries based on the reporting entity that records the transaction.
|
|
(2)
|
Includes U.S. net revenue of
$4,717 million
,
$4,568 million
and
$4,478 million
for 2014, 2013 and 2012, respectively.
|
|
(3)
|
The U.K. represents the largest portion of net revenue in the Europe, Middle East and Africa region with net revenue of
$1,262 million
,
$1,168 million
and
$1,162 million
for 2014, 2013 and 2012, respectively.
|
123
Long-lived assets by geographic area as of
September 26, 2014
,
September 27, 2013
and
September 28, 2012
are as follows ($ in millions):
|
2014
|
2013
|
2012
|
|||||||||
|
Long-lived assets
(1)
:
|
|
|
|
||||||||
|
North America
(2)
|
$
|
905
|
|
$
|
905
|
|
$
|
936
|
|
||
|
Latin America
|
113
|
|
129
|
|
151
|
|
|||||
|
Europe, Middle East and Africa
|
338
|
|
340
|
|
359
|
|
|||||
|
Asia-Pacific
|
144
|
|
163
|
|
198
|
|
|||||
|
Corporate and Other
|
20
|
|
32
|
|
29
|
|
|||||
|
$
|
1,520
|
|
$
|
1,569
|
|
$
|
1,673
|
|
|||
_______________________________________________________________________________
|
(1)
|
Long-lived assets are comprised primarily of subscriber system assets, net, property, plant and equipment, net, deferred subscriber acquisition costs, net and dealer intangibles. They exclude goodwill, other intangible assets and other assets.
|
|
(2)
|
Includes U.S. long-lived assets of
$836 million
,
$828 million
and
$856 million
for 2014, 2013 and 2012, respectively.
|
18. Supplementary Consolidated Balance Sheet Information
Selected supplementary Consolidated Balance Sheet information as of
September 26, 2014
and
September 27, 2013
is as follows ($ in millions):
|
As of
September 26,
2014
|
As of
September 27,
2013
|
||||||
|
Contracts in process
|
$
|
470
|
|
$
|
370
|
|
|
|
Other
|
683
|
|
469
|
|
|||
|
Prepaid expenses and other current assets
|
$
|
1,153
|
|
$
|
839
|
|
|
|
Accrued payroll and payroll related costs
|
$
|
318
|
|
$
|
311
|
|
|
|
Accrued guarantees
|
218
|
|
25
|
|
|||
|
Accrued insurance commitments - asbestos
|
346
|
|
58
|
|
|||
|
Other
|
1,285
|
|
1,458
|
|
|||
|
Accrued and other current liabilities
|
$
|
2,167
|
|
$
|
1,852
|
|
|
|
Accrued insurance commitments - asbestos
|
$
|
487
|
|
$
|
250
|
|
|
|
Long-term pension and postretirement liabilities
|
417
|
|
391
|
|
|||
|
Other
|
973
|
|
1,240
|
|
|||
|
Other liabilities
|
$
|
1,877
|
|
$
|
1,881
|
|
|
124
19. Inventory
Inventories consisted of the following ($ in millions):
|
As of
September 26,
2014
|
As of
September 27,
2013
|
||||||
|
Purchased materials and manufactured parts
|
$
|
159
|
|
$
|
157
|
|
|
|
Work in process
|
86
|
|
93
|
|
|||
|
Finished goods
|
383
|
|
395
|
|
|||
|
Inventories
|
$
|
628
|
|
$
|
645
|
|
|
Inventories are recorded at the lower of cost (primarily first-in, first-out) or market value.
20. Property, Plant and Equipment
Property, plant and equipment consisted of the following ($ in millions):
|
As of
September 26,
2014
|
As of
September 27,
2013
|
||||||
|
Land
|
$
|
36
|
|
$
|
35
|
|
|
|
Buildings
|
417
|
|
376
|
|
|||
|
Subscriber systems
|
2,213
|
|
2,414
|
|
|||
|
Machinery and equipment
|
1,271
|
|
1,203
|
|
|||
|
Construction in progress
|
90
|
|
67
|
|
|||
|
Accumulated depreciation
|
(2,758
|
)
|
(2,811
|
)
|
|||
|
Property, Plant and Equipment, net
|
$
|
1,269
|
|
$
|
1,284
|
|
|
21. Tyco International Finance S.A.
TIFSA, a
100%
owned subsidiary of the Company, has public debt securities outstanding which are fully and unconditionally guaranteed by Tyco. See Note 10 for additional information. The following tables present condensed consolidating financial information for Tyco, TIFSA and all other subsidiaries. Condensed financial information for Tyco and TIFSA on a stand-alone basis is presented using the equity method of accounting for subsidiaries.
125
CONDENSED CONSOLIDATING STATEMENT OF OPERATIONS
For the Year Ended
September 26, 2014
($ in millions)
|
Tyco
International
Ltd.
|
Tyco
International
Finance S.A.
|
Other
Subsidiaries
|
Consolidating
Adjustments
|
Total
|
|||||||||||||||
|
Net revenue
|
$
|
—
|
|
$
|
—
|
|
$
|
10,340
|
|
$
|
—
|
|
$
|
10,340
|
|
||||
|
Cost of product sales
|
—
|
|
—
|
|
4,253
|
|
—
|
|
4,253
|
|
|||||||||
|
Cost of services
|
—
|
|
—
|
|
2,302
|
|
—
|
|
2,302
|
|
|||||||||
|
Selling, general and administrative expenses
|
(7
|
)
|
4
|
|
3,043
|
|
—
|
|
3,040
|
|
|||||||||
|
Separation costs
|
—
|
|
—
|
|
1
|
|
—
|
|
1
|
|
|||||||||
|
Restructuring and asset impairment charges, net
|
—
|
|
—
|
|
47
|
|
—
|
|
47
|
|
|||||||||
|
Operating income (loss)
|
7
|
|
(4
|
)
|
694
|
|
—
|
|
697
|
|
|||||||||
|
Interest income
|
—
|
|
—
|
|
14
|
|
—
|
|
14
|
|
|||||||||
|
Interest expense
|
—
|
|
(95
|
)
|
(2
|
)
|
—
|
|
(97
|
)
|
|||||||||
|
Other (expense) income, net
|
(6
|
)
|
—
|
|
5
|
|
—
|
|
(1
|
)
|
|||||||||
|
Equity in net income of subsidiaries
|
1,866
|
|
1,761
|
|
—
|
|
(3,627
|
)
|
—
|
|
|||||||||
|
Intercompany interest and fees
|
(28
|
)
|
105
|
|
(72
|
)
|
(5
|
)
|
—
|
|
|||||||||
|
Income from continuing operations before income taxes
|
1,839
|
|
1,767
|
|
639
|
|
(3,632
|
)
|
613
|
|
|||||||||
|
Income tax benefit (expense)
|
1
|
|
(1
|
)
|
(24
|
)
|
—
|
|
(24
|
)
|
|||||||||
|
Equity gain in earnings of unconsolidated subsidiaries
|
—
|
|
—
|
|
206
|
|
—
|
|
206
|
|
|||||||||
|
Income from continuing operations
|
1,840
|
|
1,766
|
|
821
|
|
(3,632
|
)
|
795
|
|
|||||||||
|
(Loss) income from discontinued operations, net of income taxes
|
(2
|
)
|
—
|
|
1,041
|
|
5
|
|
1,044
|
|
|||||||||
|
Net income
|
1,838
|
|
1,766
|
|
1,862
|
|
(3,627
|
)
|
1,839
|
|
|||||||||
|
Less: noncontrolling interest in subsidiaries net income
|
—
|
|
—
|
|
1
|
|
—
|
|
1
|
|
|||||||||
|
Net income attributable to Tyco common shareholders
|
$
|
1,838
|
|
$
|
1,766
|
|
$
|
1,861
|
|
$
|
(3,627
|
)
|
$
|
1,838
|
|
||||
126
CONDENSED CONSOLIDATING STATEMENT OF COMPREHENSIVE INCOME
For the Year Ended
September 26, 2014
($ in millions)
|
Tyco
International
Ltd.
|
Tyco
International
Finance S.A.
|
Other
Subsidiaries
|
Consolidating
Adjustments
|
Total
|
|||||||||||||||
|
Net income
|
$
|
1,838
|
|
$
|
1,766
|
|
$
|
1,862
|
|
$
|
(3,627
|
)
|
$
|
1,839
|
|
||||
|
Other comprehensive loss, net of tax
|
|||||||||||||||||||
|
Foreign currency translation
|
(174
|
)
|
—
|
|
(174
|
)
|
174
|
|
(174
|
)
|
|||||||||
|
Defined benefit and post retirement plans
|
(64
|
)
|
—
|
|
(64
|
)
|
64
|
|
(64
|
)
|
|||||||||
|
Total other comprehensive loss, net of tax
|
(238
|
)
|
—
|
|
(238
|
)
|
238
|
|
(238
|
)
|
|||||||||
|
Comprehensive income
|
1,600
|
|
1,766
|
|
1,624
|
|
(3,389
|
)
|
1,601
|
|
|||||||||
|
Less: comprehensive income attributable to noncontrolling interests
|
—
|
|
—
|
|
1
|
|
—
|
|
1
|
|
|||||||||
|
Comprehensive income attributable to Tyco common shareholders
|
$
|
1,600
|
|
$
|
1,766
|
|
$
|
1,623
|
|
$
|
(3,389
|
)
|
$
|
1,600
|
|
||||
127
CONDENSED CONSOLIDATING STATEMENT OF OPERATIONS
For the Year Ended
September 27, 2013
($ in millions)
|
Tyco
International
Ltd.
|
Tyco
International
Finance S.A.
|
Other
Subsidiaries
|
Consolidating
Adjustments
|
Total
|
|||||||||||||||
|
Net revenue
|
$
|
—
|
|
$
|
—
|
|
$
|
10,073
|
|
$
|
—
|
|
$
|
10,073
|
|
||||
|
Cost of product sales
|
—
|
|
—
|
|
3,990
|
|
—
|
|
3,990
|
|
|||||||||
|
Cost of services
|
—
|
|
—
|
|
2,412
|
|
—
|
|
2,412
|
|
|||||||||
|
Selling, general and administrative expenses
|
11
|
|
1
|
|
2,831
|
|
—
|
|
2,843
|
|
|||||||||
|
Separation costs
|
3
|
|
—
|
|
5
|
|
—
|
|
8
|
|
|||||||||
|
Restructuring and asset impairment charges, net
|
—
|
|
—
|
|
111
|
|
—
|
|
111
|
|
|||||||||
|
Operating (loss) income
|
(14
|
)
|
(1
|
)
|
724
|
|
—
|
|
709
|
|
|||||||||
|
Interest income
|
2
|
|
—
|
|
14
|
|
—
|
|
16
|
|
|||||||||
|
Interest expense
|
(1
|
)
|
(95
|
)
|
(4
|
)
|
—
|
|
(100
|
)
|
|||||||||
|
Other (expense) income, net
|
(31
|
)
|
—
|
|
2
|
|
—
|
|
(29
|
)
|
|||||||||
|
Equity in net (loss) income of subsidiaries
|
(12,666
|
)
|
575
|
|
—
|
|
12,091
|
|
—
|
|
|||||||||
|
Intercompany interest and fees
|
13,248
|
|
122
|
|
(13,362
|
)
|
(8
|
)
|
—
|
|
|||||||||
|
Income (loss) from continuing operations before income taxes
|
538
|
|
601
|
|
(12,626
|
)
|
12,083
|
|
596
|
|
|||||||||
|
Income tax expense
|
(2
|
)
|
(2
|
)
|
(104
|
)
|
—
|
|
(108
|
)
|
|||||||||
|
Equity loss in earnings of unconsolidated subsidiaries
|
—
|
|
—
|
|
(48
|
)
|
—
|
|
(48
|
)
|
|||||||||
|
Income (loss) from continuing operations
|
536
|
|
599
|
|
(12,778
|
)
|
12,083
|
|
440
|
|
|||||||||
|
Income from discontinued operations, net of income taxes
|
—
|
|
—
|
|
85
|
|
8
|
|
93
|
|
|||||||||
|
Net income (loss)
|
536
|
|
599
|
|
(12,693
|
)
|
12,091
|
|
533
|
|
|||||||||
|
Less: noncontrolling interest in subsidiaries net loss
|
—
|
|
—
|
|
(3
|
)
|
—
|
|
(3
|
)
|
|||||||||
|
Net income (loss) attributable to Tyco common shareholders
|
$
|
536
|
|
$
|
599
|
|
$
|
(12,690
|
)
|
$
|
12,091
|
|
$
|
536
|
|
||||
128
CONDENSED CONSOLIDATING STATEMENT OF COMPREHENSIVE INCOME
For the Year Ended
September 27, 2013
($ in millions)
|
Tyco
International
Ltd.
|
Tyco
International
Finance S.A.
|
Other
Subsidiaries
|
Consolidating
Adjustments
|
Total
|
|||||||||||||||
|
Net income (loss)
|
$
|
536
|
|
$
|
599
|
|
$
|
(12,693
|
)
|
$
|
12,091
|
|
$
|
533
|
|
||||
|
Other comprehensive (loss) income, net of tax
|
|||||||||||||||||||
|
Foreign currency translation
|
(100
|
)
|
—
|
|
(100
|
)
|
100
|
|
(100
|
)
|
|||||||||
|
Defined benefit and post retirement plans
|
79
|
|
—
|
|
79
|
|
(79
|
)
|
79
|
|
|||||||||
|
Total other comprehensive loss, net of tax
|
(21
|
)
|
—
|
|
(21
|
)
|
21
|
|
(21
|
)
|
|||||||||
|
Comprehensive income (loss)
|
515
|
|
599
|
|
(12,714
|
)
|
12,112
|
|
512
|
|
|||||||||
|
Less: comprehensive loss attributable to noncontrolling interests
|
—
|
|
—
|
|
(3
|
)
|
—
|
|
(3
|
)
|
|||||||||
|
Comprehensive income (loss) attributable to Tyco common shareholders
|
$
|
515
|
|
$
|
599
|
|
$
|
(12,711
|
)
|
$
|
12,112
|
|
$
|
515
|
|
||||
129
CONDENSED CONSOLIDATING STATEMENT OF OPERATIONS
For the Year Ended
September 28, 2012
($ in millions)
|
Tyco
International
Ltd.
|
Tyco
International
Finance S.A.
|
Other
Subsidiaries
|
Consolidating
Adjustments
|
Total
|
|||||||||||||||
|
Net revenue
|
$
|
—
|
|
$
|
—
|
|
$
|
9,892
|
|
$
|
—
|
|
$
|
9,892
|
|
||||
|
Cost of product sales
|
—
|
|
—
|
|
3,905
|
|
—
|
|
3,905
|
|
|||||||||
|
Cost of services
|
—
|
|
—
|
|
2,411
|
|
—
|
|
2,411
|
|
|||||||||
|
Selling, general and administrative expenses
|
15
|
|
15
|
|
2,793
|
|
—
|
|
2,823
|
|
|||||||||
|
Separation costs
|
3
|
|
1
|
|
67
|
|
—
|
|
71
|
|
|||||||||
|
Restructuring and asset impairment charges, net
|
1
|
|
—
|
|
103
|
|
—
|
|
104
|
|
|||||||||
|
Operating (loss) income
|
(19
|
)
|
(16
|
)
|
613
|
|
—
|
|
578
|
|
|||||||||
|
Interest income
|
—
|
|
—
|
|
18
|
|
—
|
|
18
|
|
|||||||||
|
Interest expense
|
—
|
|
(204
|
)
|
(5
|
)
|
—
|
|
(209
|
)
|
|||||||||
|
Other (expense) income, net
|
(4
|
)
|
(453
|
)
|
3
|
|
—
|
|
(454
|
)
|
|||||||||
|
Equity in net income of subsidiaries
|
913
|
|
1,065
|
|
—
|
|
(1,978
|
)
|
—
|
|
|||||||||
|
Intercompany interest and fees
|
(412
|
)
|
282
|
|
230
|
|
(100
|
)
|
—
|
|
|||||||||
|
Income (loss) from continuing operations before income taxes
|
478
|
|
674
|
|
859
|
|
(2,078
|
)
|
(67
|
)
|
|||||||||
|
Income tax expense
|
(2
|
)
|
(2
|
)
|
(316
|
)
|
—
|
|
(320
|
)
|
|||||||||
|
Equity loss in earnings of unconsolidated subsidiaries
|
—
|
|
—
|
|
(26
|
)
|
—
|
|
(26
|
)
|
|||||||||
|
Income (loss) from continuing operations
|
476
|
|
672
|
|
517
|
|
(2,078
|
)
|
(413
|
)
|
|||||||||
|
(Loss) income from discontinued operations, net of income taxes
|
(4
|
)
|
—
|
|
788
|
|
100
|
|
884
|
|
|||||||||
|
Net income
|
472
|
|
672
|
|
1,305
|
|
(1,978
|
)
|
471
|
|
|||||||||
|
Less: noncontrolling interest in subsidiaries net loss
|
—
|
|
—
|
|
(1
|
)
|
—
|
|
(1
|
)
|
|||||||||
|
Net income attributable to Tyco common shareholders
|
$
|
472
|
|
$
|
672
|
|
$
|
1,306
|
|
$
|
(1,978
|
)
|
$
|
472
|
|
||||
130
CONDENSED CONSOLIDATING STATEMENT OF COMPREHENSIVE INCOME
For the Year Ended
September 28, 2012
($ in millions)
|
Tyco
International
Ltd.
|
Tyco
International
Finance S.A.
|
Other
Subsidiaries
|
Consolidating
Adjustments
|
Total
|
|||||||||||||||
|
Net income
|
$
|
472
|
|
$
|
672
|
|
$
|
1,305
|
|
$
|
(1,978
|
)
|
$
|
471
|
|
||||
|
Other comprehensive income (loss), net of tax
|
|||||||||||||||||||
|
Foreign currency translation
|
93
|
|
11
|
|
82
|
|
(93
|
)
|
93
|
|
|||||||||
|
Defined benefit and post retirement plans
|
(163
|
)
|
—
|
|
(163
|
)
|
163
|
|
(163
|
)
|
|||||||||
|
Total other comprehensive (loss) income, net of tax
|
(70
|
)
|
11
|
|
(81
|
)
|
70
|
|
(70
|
)
|
|||||||||
|
Comprehensive income
|
402
|
|
683
|
|
1,224
|
|
(1,908
|
)
|
401
|
|
|||||||||
|
Less: comprehensive loss attributable to noncontrolling interests
|
—
|
|
—
|
|
(1
|
)
|
—
|
|
(1
|
)
|
|||||||||
|
Comprehensive income attributable to Tyco common shareholders
|
$
|
402
|
|
$
|
683
|
|
$
|
1,225
|
|
$
|
(1,908
|
)
|
$
|
402
|
|
||||
131
CONDENSED CONSOLIDATING BALANCE SHEET
As of
September 26, 2014
($ in millions)
|
Tyco
International
Ltd.
|
Tyco
International
Finance S.A.
|
Other
Subsidiaries
|
Consolidating
Adjustments
|
Total
|
|||||||||||||||
|
Assets
|
|
|
|
|
|
||||||||||||||
|
Current Assets:
|
|
|
|
|
|
||||||||||||||
|
Cash and cash equivalents
|
$
|
—
|
|
$
|
—
|
|
$
|
892
|
|
$
|
—
|
|
$
|
892
|
|
||||
|
Accounts receivable, net
|
—
|
|
—
|
|
1,750
|
|
—
|
|
1,750
|
|
|||||||||
|
Inventories
|
—
|
|
—
|
|
628
|
|
—
|
|
628
|
|
|||||||||
|
Intercompany receivables
|
18
|
|
245
|
|
8,102
|
|
(8,365
|
)
|
—
|
|
|||||||||
|
Prepaid expenses and other current assets
|
7
|
|
62
|
|
1,084
|
|
—
|
|
1,153
|
|
|||||||||
|
Deferred income taxes
|
—
|
|
—
|
|
307
|
|
—
|
|
307
|
|
|||||||||
|
Assets held for sale
|
—
|
|
—
|
|
21
|
|
—
|
|
21
|
|
|||||||||
|
Total current assets
|
25
|
|
307
|
|
12,784
|
|
(8,365
|
)
|
4,751
|
|
|||||||||
|
Property, plant and equipment, net
|
—
|
|
—
|
|
1,269
|
|
—
|
|
1,269
|
|
|||||||||
|
Goodwill
|
—
|
|
—
|
|
4,126
|
|
—
|
|
4,126
|
|
|||||||||
|
Intangible assets, net
|
—
|
|
—
|
|
737
|
|
—
|
|
737
|
|
|||||||||
|
Investment in subsidiaries
|
12,738
|
|
16,258
|
|
—
|
|
(28,996
|
)
|
—
|
|
|||||||||
|
Intercompany loans receivable
|
—
|
|
3,693
|
|
5,346
|
|
(9,039
|
)
|
—
|
|
|||||||||
|
Other assets
|
26
|
|
4
|
|
896
|
|
—
|
|
926
|
|
|||||||||
|
Total Assets
|
$
|
12,789
|
|
$
|
20,262
|
|
$
|
25,158
|
|
$
|
(46,400
|
)
|
$
|
11,809
|
|
||||
|
Liabilities and Equity
|
|
|
|
|
|
||||||||||||||
|
Current Liabilities:
|
|
|
|
|
|
||||||||||||||
|
Loans payable and current maturities of long-term debt
|
$
|
—
|
|
$
|
—
|
|
$
|
20
|
|
$
|
—
|
|
$
|
20
|
|
||||
|
Accounts payable
|
1
|
|
—
|
|
870
|
|
—
|
|
871
|
|
|||||||||
|
Accrued and other current liabilities
|
191
|
|
23
|
|
1,953
|
|
—
|
|
2,167
|
|
|||||||||
|
Deferred revenue
|
—
|
|
—
|
|
400
|
|
—
|
|
400
|
|
|||||||||
|
Intercompany payables
|
3,517
|
|
4,593
|
|
255
|
|
(8,365
|
)
|
—
|
|
|||||||||
|
Liabilities held for sale
|
—
|
|
—
|
|
13
|
|
—
|
|
13
|
|
|||||||||
|
Total current liabilities
|
3,709
|
|
4,616
|
|
3,511
|
|
(8,365
|
)
|
3,471
|
|
|||||||||
|
Long-term debt
|
—
|
|
1,441
|
|
2
|
|
—
|
|
1,443
|
|
|||||||||
|
Intercompany loans payable
|
4,180
|
|
1,888
|
|
2,971
|
|
(9,039
|
)
|
—
|
|
|||||||||
|
Deferred revenue
|
—
|
|
—
|
|
335
|
|
—
|
|
335
|
|
|||||||||
|
Other liabilities
|
253
|
|
—
|
|
1,624
|
|
—
|
|
1,877
|
|
|||||||||
|
Total Liabilities
|
8,142
|
|
7,945
|
|
8,443
|
|
(17,404
|
)
|
7,126
|
|
|||||||||
|
Redeemable noncontrolling interest
|
—
|
|
—
|
|
13
|
|
—
|
|
13
|
|
|||||||||
|
Tyco Shareholders' Equity:
|
|
|
|
|
|
||||||||||||||
|
Common shares
|
208
|
|
—
|
|
—
|
|
—
|
|
208
|
|
|||||||||
|
Common shares held in treasury
|
—
|
|
—
|
|
(2,515
|
)
|
—
|
|
(2,515
|
)
|
|||||||||
|
Other shareholders' equity
|
4,439
|
|
12,317
|
|
19,194
|
|
(28,996
|
)
|
6,954
|
|
|||||||||
|
Total Tyco Shareholders' Equity
|
4,647
|
|
12,317
|
|
16,679
|
|
(28,996
|
)
|
4,647
|
|
|||||||||
|
Nonredeemable noncontrolling interest
|
—
|
|
—
|
|
23
|
|
—
|
|
23
|
|
|||||||||
|
Total Equity
|
4,647
|
|
12,317
|
|
16,702
|
|
(28,996
|
)
|
4,670
|
|
|||||||||
|
Total Liabilities, Redeemable Noncontrolling Interest and Equity
|
$
|
12,789
|
|
$
|
20,262
|
|
$
|
25,158
|
|
$
|
(46,400
|
)
|
$
|
11,809
|
|
||||
132
CONDENSED CONSOLIDATING BALANCE SHEET
As of
September 27, 2013
($ in millions)
|
Tyco
International
Ltd.
|
Tyco
International
Finance S.A.
|
Other
Subsidiaries
|
Consolidating
Adjustments
|
Total
|
|||||||||||||||
|
Assets
|
|
|
|
|
|
||||||||||||||
|
Current Assets:
|
|
|
|
|
|
||||||||||||||
|
Cash and cash equivalents
|
$
|
—
|
|
$
|
—
|
|
$
|
563
|
|
$
|
—
|
|
$
|
563
|
|
||||
|
Accounts receivable, net
|
—
|
|
—
|
|
1,704
|
|
—
|
|
1,704
|
|
|||||||||
|
Inventories
|
—
|
|
—
|
|
645
|
|
—
|
|
645
|
|
|||||||||
|
Intercompany receivables
|
22
|
|
2,079
|
|
7,354
|
|
(9,455
|
)
|
—
|
|
|||||||||
|
Prepaid expenses and other current assets
|
9
|
|
—
|
|
830
|
|
—
|
|
839
|
|
|||||||||
|
Deferred income taxes
|
—
|
|
—
|
|
250
|
|
—
|
|
250
|
|
|||||||||
|
Assets held for sale
|
—
|
|
—
|
|
856
|
|
—
|
|
856
|
|
|||||||||
|
Total current assets
|
31
|
|
2,079
|
|
12,202
|
|
(9,455
|
)
|
4,857
|
|
|||||||||
|
Property, plant and equipment, net
|
—
|
|
—
|
|
1,284
|
|
—
|
|
1,284
|
|
|||||||||
|
Goodwill
|
—
|
|
—
|
|
4,162
|
|
—
|
|
4,162
|
|
|||||||||
|
Intangible assets, net
|
—
|
|
—
|
|
791
|
|
—
|
|
791
|
|
|||||||||
|
Investment in subsidiaries
|
12,826
|
|
14,690
|
|
—
|
|
(27,516
|
)
|
—
|
|
|||||||||
|
Intercompany loans receivable
|
—
|
|
1,141
|
|
5,310
|
|
(6,451
|
)
|
—
|
|
|||||||||
|
Other assets
|
68
|
|
6
|
|
1,008
|
|
—
|
|
1,082
|
|
|||||||||
|
Total Assets
|
$
|
12,925
|
|
$
|
17,916
|
|
$
|
24,757
|
|
$
|
(43,422
|
)
|
$
|
12,176
|
|
||||
|
Liabilities and Equity
|
|
|
|
|
|
||||||||||||||
|
Current Liabilities:
|
|
|
|
|
|
||||||||||||||
|
Loans payable and current maturities of long-term debt
|
$
|
—
|
|
$
|
—
|
|
$
|
20
|
|
$
|
—
|
|
$
|
20
|
|
||||
|
Accounts payable
|
1
|
|
—
|
|
847
|
|
—
|
|
848
|
|
|||||||||
|
Accrued and other current liabilities
|
353
|
|
23
|
|
1,476
|
|
—
|
|
1,852
|
|
|||||||||
|
Deferred revenue
|
—
|
|
—
|
|
393
|
|
—
|
|
393
|
|
|||||||||
|
Intercompany payables
|
3,515
|
|
3,845
|
|
2,095
|
|
(9,455
|
)
|
—
|
|
|||||||||
|
Liabilities held for sale
|
—
|
|
—
|
|
236
|
|
—
|
|
236
|
|
|||||||||
|
Total current liabilities
|
3,869
|
|
3,868
|
|
5,067
|
|
(9,455
|
)
|
3,349
|
|
|||||||||
|
Long-term debt
|
—
|
|
1,443
|
|
—
|
|
—
|
|
1,443
|
|
|||||||||
|
Intercompany loans payable
|
3,660
|
|
1,852
|
|
939
|
|
(6,451
|
)
|
—
|
|
|||||||||
|
Deferred revenue
|
—
|
|
—
|
|
370
|
|
—
|
|
370
|
|
|||||||||
|
Other liabilities
|
298
|
|
—
|
|
1,583
|
|
—
|
|
1,881
|
|
|||||||||
|
Total Liabilities
|
7,827
|
|
7,163
|
|
7,959
|
|
(15,906
|
)
|
7,043
|
|
|||||||||
|
Redeemable noncontrolling interest
|
—
|
|
—
|
|
12
|
|
—
|
|
12
|
|
|||||||||
|
Tyco Shareholders' Equity:
|
|
|
|
|
|
||||||||||||||
|
Common shares
|
208
|
|
—
|
|
—
|
|
—
|
|
208
|
|
|||||||||
|
Common shares held in treasury
|
—
|
|
—
|
|
(912
|
)
|
—
|
|
(912
|
)
|
|||||||||
|
Other shareholders' equity
|
4,890
|
|
10,753
|
|
17,675
|
|
(27,516
|
)
|
5,802
|
|
|||||||||
|
Total Tyco Shareholders' Equity
|
5,098
|
|
10,753
|
|
16,763
|
|
(27,516
|
)
|
5,098
|
|
|||||||||
|
Nonredeemable noncontrolling interest
|
—
|
|
—
|
|
23
|
|
—
|
|
23
|
|
|||||||||
|
Total Equity
|
5,098
|
|
10,753
|
|
16,786
|
|
(27,516
|
)
|
5,121
|
|
|||||||||
|
Total Liabilities, Redeemable Noncontrolling Interest and Equity
|
$
|
12,925
|
|
$
|
17,916
|
|
$
|
24,757
|
|
$
|
(43,422
|
)
|
$
|
12,176
|
|
||||
133
CONDENSED CONSOLIDATING STATEMENT OF CASH FLOWS
For the Year Ended
September 26, 2014
($ in millions)
|
Tyco
International
Ltd.
|
Tyco
International
Finance S.A.
|
Other
Subsidiaries
|
Consolidating
Adjustments
|
Total
|
|||||||||||||||
|
Cash Flows From Operating Activities:
|
|
|
|
|
|
||||||||||||||
|
Net cash (used in) provided by operating activities
|
$
|
(205
|
)
|
$
|
592
|
|
$
|
444
|
|
$
|
—
|
|
$
|
831
|
|
||||
|
Net cash provided by discontinued operating activities
|
—
|
|
—
|
|
81
|
|
—
|
|
81
|
|
|||||||||
|
Cash Flows From Investing Activities:
|
|
|
|
|
|
||||||||||||||
|
Capital expenditures
|
—
|
|
—
|
|
(288
|
)
|
—
|
|
(288
|
)
|
|||||||||
|
Proceeds from disposal of assets
|
—
|
|
—
|
|
10
|
|
—
|
|
10
|
|
|||||||||
|
Acquisition of businesses, net of cash acquired
|
—
|
|
—
|
|
(65
|
)
|
—
|
|
(65
|
)
|
|||||||||
|
Acquisition of dealer generated customer accounts and bulk account purchases
|
—
|
|
—
|
|
(25
|
)
|
—
|
|
(25
|
)
|
|||||||||
|
Divestiture of businesses, net of cash divested
|
—
|
|
—
|
|
1
|
|
—
|
|
1
|
|
|||||||||
|
Net increase in intercompany loans
|
—
|
|
(521
|
)
|
—
|
|
521
|
|
—
|
|
|||||||||
|
(Increase) decrease in investment in subsidiaries
|
(4
|
)
|
(9
|
)
|
4
|
|
9
|
|
—
|
|
|||||||||
|
Sales and maturities of investments
|
—
|
|
—
|
|
283
|
|
—
|
|
283
|
|
|||||||||
|
Purchases of investments
|
—
|
|
(62
|
)
|
(324
|
)
|
—
|
|
(386
|
)
|
|||||||||
|
Sale of equity investment
|
—
|
|
—
|
|
250
|
|
—
|
|
250
|
|
|||||||||
|
Decrease in restricted cash
|
—
|
|
—
|
|
3
|
|
—
|
|
3
|
|
|||||||||
|
Other
|
—
|
|
—
|
|
(4
|
)
|
—
|
|
(4
|
)
|
|||||||||
|
Net cash used in investing activities
|
(4
|
)
|
(592
|
)
|
(155
|
)
|
530
|
|
(221
|
)
|
|||||||||
|
Net cash provided by discontinued investing activities
|
—
|
|
—
|
|
1,789
|
|
—
|
|
1,789
|
|
|||||||||
|
Cash Flows From Financing Activities:
|
|
|
|
|
|
||||||||||||||
|
Proceeds from issuance of short-term debt
|
—
|
|
830
|
|
—
|
|
—
|
|
830
|
|
|||||||||
|
Repayments of short-term debt
|
—
|
|
(830
|
)
|
(1
|
)
|
—
|
|
(831
|
)
|
|||||||||
|
Proceeds from exercise of share options
|
—
|
|
—
|
|
91
|
|
—
|
|
91
|
|
|||||||||
|
Dividends paid
|
(311
|
)
|
—
|
|
—
|
|
—
|
|
(311
|
)
|
|||||||||
|
Repurchase of common shares by treasury
|
—
|
|
—
|
|
(1,833
|
)
|
—
|
|
(1,833
|
)
|
|||||||||
|
Net intercompany loan borrowings
|
520
|
|
—
|
|
1
|
|
(521
|
)
|
—
|
|
|||||||||
|
Increase in equity from parent
|
—
|
|
—
|
|
9
|
|
(9
|
)
|
—
|
|
|||||||||
|
Purchase of noncontrolling interest
|
|
|
|
|
(66
|
)
|
|
|
(66
|
)
|
|||||||||
|
Transfer from discontinued operations
|
—
|
|
—
|
|
1,870
|
|
—
|
|
1,870
|
|
|||||||||
|
Other
|
—
|
|
—
|
|
(11
|
)
|
—
|
|
(11
|
)
|
|||||||||
|
Net cash provided by (used in) financing activities
|
209
|
|
—
|
|
60
|
|
(530
|
)
|
(261
|
)
|
|||||||||
|
Net cash used in discontinued financing activities
|
—
|
|
—
|
|
(1,870
|
)
|
—
|
|
(1,870
|
)
|
|||||||||
|
Effect of currency translation on cash
|
—
|
|
—
|
|
(20
|
)
|
—
|
|
(20
|
)
|
|||||||||
|
Net increase in cash and cash equivalents
|
—
|
|
—
|
|
329
|
|
—
|
|
329
|
|
|||||||||
|
Cash and cash equivalents at beginning of period
|
—
|
|
—
|
|
563
|
|
—
|
|
563
|
|
|||||||||
|
Cash and cash equivalents at end of period
|
$
|
—
|
|
$
|
—
|
|
$
|
892
|
|
$
|
—
|
|
$
|
892
|
|
||||
134
CONDENSED CONSOLIDATING STATEMENT OF CASH FLOWS
For the Year Ended
September 27, 2013
($ in millions)
|
Tyco
International
Ltd.
|
Tyco
International
Finance S.A.
|
Other
Subsidiaries
|
Consolidating
Adjustments
|
Total
|
|||||||||||||||
|
Cash Flows From Operating Activities:
|
|
|
|
|
|
||||||||||||||
|
Net cash (used in) provided by operating activities
|
$
|
(251
|
)
|
$
|
452
|
|
$
|
493
|
|
$
|
—
|
|
$
|
694
|
|
||||
|
Net cash provided by discontinued operating activities
|
—
|
|
—
|
|
156
|
|
—
|
|
156
|
|
|||||||||
|
Cash Flows From Investing Activities:
|
|
|
|
|
|
||||||||||||||
|
Capital expenditures
|
—
|
|
—
|
|
(270
|
)
|
—
|
|
(270
|
)
|
|||||||||
|
Proceeds from disposal of assets
|
—
|
|
—
|
|
5
|
|
—
|
|
5
|
|
|||||||||
|
Acquisition of businesses, net of cash acquired
|
—
|
|
—
|
|
(229
|
)
|
—
|
|
(229
|
)
|
|||||||||
|
Acquisition of dealer generated customer accounts and bulk account purchases
|
—
|
|
—
|
|
(19
|
)
|
—
|
|
(19
|
)
|
|||||||||
|
Divestiture of businesses, net of cash divested
|
—
|
|
—
|
|
17
|
|
—
|
|
17
|
|
|||||||||
|
Intercompany dividend from subsidiary
|
—
|
|
32
|
|
—
|
|
(32
|
)
|
—
|
|
|||||||||
|
Net increase in intercompany loans
|
—
|
|
(431
|
)
|
—
|
|
431
|
|
—
|
|
|||||||||
|
Decrease in investment in subsidiaries
|
—
|
|
8
|
|
—
|
|
(8
|
)
|
—
|
|
|||||||||
|
Sales and maturities of investments
|
—
|
|
—
|
|
182
|
|
—
|
|
182
|
|
|||||||||
|
Purchases of investments
|
—
|
|
—
|
|
(227
|
)
|
—
|
|
(227
|
)
|
|||||||||
|
Increase in restricted cash
|
—
|
|
—
|
|
(8
|
)
|
—
|
|
(8
|
)
|
|||||||||
|
Other
|
—
|
|
—
|
|
4
|
|
—
|
|
4
|
|
|||||||||
|
Net cash used in investing activities
|
—
|
|
(391
|
)
|
(545
|
)
|
391
|
|
(545
|
)
|
|||||||||
|
Net cash used in discontinued investing activities
|
—
|
|
—
|
|
(110
|
)
|
—
|
|
(110
|
)
|
|||||||||
|
Cash Flows From Financing Activities:
|
|
|
|
|
|
||||||||||||||
|
Proceeds from issuance of short term debt
|
—
|
|
475
|
|
—
|
|
—
|
|
475
|
|
|||||||||
|
Repayment of short term debt
|
—
|
|
(475
|
)
|
(30
|
)
|
—
|
|
(505
|
)
|
|||||||||
|
Proceeds from exercise of share options
|
—
|
|
—
|
|
153
|
|
—
|
|
153
|
|
|||||||||
|
Dividends paid
|
(288
|
)
|
—
|
|
—
|
|
—
|
|
(288
|
)
|
|||||||||
|
Intercompany dividend to parent
|
—
|
|
—
|
|
(32
|
)
|
32
|
|
—
|
|
|||||||||
|
Repurchase of common shares by treasury
|
—
|
|
—
|
|
(300
|
)
|
—
|
|
(300
|
)
|
|||||||||
|
Net intercompany loan borrowings (repayments)
|
449
|
|
—
|
|
(18
|
)
|
(431
|
)
|
—
|
|
|||||||||
|
Decrease in equity from parent
|
—
|
|
—
|
|
(8
|
)
|
8
|
|
—
|
|
|||||||||
|
Transfer from (to) discontinued operations
|
90
|
|
(61
|
)
|
47
|
|
—
|
|
76
|
|
|||||||||
|
Other
|
—
|
|
—
|
|
(30
|
)
|
—
|
|
(30
|
)
|
|||||||||
|
Net cash provided by (used in) financing activities
|
251
|
|
(61
|
)
|
(218
|
)
|
(391
|
)
|
(419
|
)
|
|||||||||
|
Net cash used in discontinued financing activities
|
—
|
|
—
|
|
(76
|
)
|
—
|
|
(76
|
)
|
|||||||||
|
Effect of currency translation on cash
|
—
|
|
—
|
|
(11
|
)
|
—
|
|
(11
|
)
|
|||||||||
|
Net decrease in cash and cash equivalents
|
—
|
|
—
|
|
(311
|
)
|
—
|
|
(311
|
)
|
|||||||||
|
Less: net decrease in cash and cash equivalents related to discontinued operations
|
—
|
|
—
|
|
(30
|
)
|
—
|
|
(30
|
)
|
|||||||||
|
Cash and cash equivalents at beginning of period
|
—
|
|
—
|
|
844
|
|
—
|
|
844
|
|
|||||||||
|
Cash and cash equivalents at end of period
|
$
|
—
|
|
$
|
—
|
|
$
|
563
|
|
$
|
—
|
|
$
|
563
|
|
||||
135
CONDENSED CONSOLIDATING STATEMENT OF CASH FLOWS
For the Year Ended
September 28, 2012
($ in millions)
|
Tyco
International
Ltd.
|
Tyco
International
Finance S.A.
|
Other
Subsidiaries
|
Consolidating
Adjustments
|
Total
|
|||||||||||||||
|
Cash Flows From Operating Activities:
|
|
|
|
|
|
||||||||||||||
|
Net cash (used in) provided by operating activities
|
$
|
(467
|
)
|
$
|
3,542
|
|
$
|
(2,519
|
)
|
$
|
—
|
|
$
|
556
|
|
||||
|
Net cash provided by discontinued operating activities
|
—
|
|
—
|
|
2,030
|
|
—
|
|
2,030
|
|
|||||||||
|
Cash Flows From Investing Activities:
|
|
|
|
|
|
||||||||||||||
|
Capital expenditures
|
—
|
|
—
|
|
(295
|
)
|
—
|
|
(295
|
)
|
|||||||||
|
Proceeds from disposal of assets
|
—
|
|
—
|
|
4
|
|
—
|
|
4
|
|
|||||||||
|
Acquisition of businesses, net of cash acquired
|
—
|
|
—
|
|
(217
|
)
|
—
|
|
(217
|
)
|
|||||||||
|
Acquisition of dealer generated customer accounts and bulk account purchases
|
—
|
|
—
|
|
(23
|
)
|
—
|
|
(23
|
)
|
|||||||||
|
Divestiture of businesses, net of cash divested
|
—
|
|
—
|
|
(5
|
)
|
—
|
|
(5
|
)
|
|||||||||
|
Intercompany dividend from subsidiary
|
—
|
|
409
|
|
—
|
|
(409
|
)
|
—
|
|
|||||||||
|
Net increase in intercompany loans
|
—
|
|
(1,119
|
)
|
—
|
|
1,119
|
|
—
|
|
|||||||||
|
(Increase) decrease in investment in subsidiaries
|
(495
|
)
|
207
|
|
16
|
|
272
|
|
—
|
|
|||||||||
|
Sales and maturities of investments
|
—
|
|
—
|
|
128
|
|
—
|
|
128
|
|
|||||||||
|
Purchases of investments
|
—
|
|
—
|
|
(87
|
)
|
—
|
|
(87
|
)
|
|||||||||
|
Increase in restricted cash
|
—
|
|
—
|
|
(2
|
)
|
—
|
|
(2
|
)
|
|||||||||
|
Other
|
—
|
|
—
|
|
27
|
|
—
|
|
27
|
|
|||||||||
|
Net cash used in investing activities
|
(495
|
)
|
(503
|
)
|
(454
|
)
|
982
|
|
(470
|
)
|
|||||||||
|
Net cash used in discontinued investing activities
|
—
|
|
—
|
|
(1,327
|
)
|
11
|
|
(1,316
|
)
|
|||||||||
|
Cash Flows From Financing Activities:
|
|
|
|
|
|
||||||||||||||
|
Proceeds from issuance of short term debt
|
—
|
|
2,008
|
|
—
|
|
—
|
|
2,008
|
|
|||||||||
|
Repayment of short term debt
|
—
|
|
(2,008
|
)
|
(1
|
)
|
—
|
|
(2,009
|
)
|
|||||||||
|
Proceeds from issuance of long term debt
|
—
|
|
—
|
|
19
|
|
—
|
|
19
|
|
|||||||||
|
Repayment of long term debt
|
—
|
|
(3,039
|
)
|
(1
|
)
|
—
|
|
(3,040
|
)
|
|||||||||
|
Proceeds from exercise of share options
|
—
|
|
—
|
|
226
|
|
—
|
|
226
|
|
|||||||||
|
Dividends paid
|
(461
|
)
|
—
|
|
—
|
|
—
|
|
(461
|
)
|
|||||||||
|
Repurchase of common shares by treasury
|
—
|
|
—
|
|
(500
|
)
|
—
|
|
(500
|
)
|
|||||||||
|
Net intercompany loan borrowings (repayments)
|
1,423
|
|
—
|
|
(304
|
)
|
(1,119
|
)
|
—
|
|
|||||||||
|
Increase in equity from parent
|
—
|
|
—
|
|
71
|
|
(71
|
)
|
—
|
|
|||||||||
|
Transfer from discontinued operations
|
—
|
|
—
|
|
3,099
|
|
208
|
|
3,307
|
|
|||||||||
|
Other
|
—
|
|
—
|
|
(25
|
)
|
—
|
|
(25
|
)
|
|||||||||
|
Net cash provided by (used in) financing activities
|
962
|
|
(3,039
|
)
|
2,584
|
|
(982
|
)
|
(475
|
)
|
|||||||||
|
Net cash used in discontinued financing activities
|
—
|
|
—
|
|
(481
|
)
|
197
|
|
(284
|
)
|
|||||||||
|
Effect of currency translation on cash
|
—
|
|
—
|
|
4
|
|
—
|
|
4
|
|
|||||||||
|
Effect of currency translation on cash related to discontinued operations
|
—
|
|
—
|
|
4
|
|
—
|
|
4
|
|
|||||||||
|
Net (decrease) increase in cash and cash equivalents
|
—
|
|
—
|
|
(159
|
)
|
208
|
|
49
|
|
|||||||||
|
Less: net increase in cash and cash equivalents related to discontinued operations
|
—
|
|
—
|
|
226
|
|
208
|
|
434
|
|
|||||||||
|
Cash and cash equivalents at beginning of period
|
—
|
|
—
|
|
1,229
|
|
—
|
|
1,229
|
|
|||||||||
|
Cash and cash equivalents at end of period
|
$
|
—
|
|
$
|
—
|
|
$
|
844
|
|
$
|
—
|
|
$
|
844
|
|
||||
136
22. Subsequent Events
Subsequent to
September 26, 2014
, the Company repurchased approximately
10 million
common shares for approximately
$417 million
which completed the
$1.75 billion
share repurchase authority approved by the Company's Board of Directors in March 2014.
137
TYCO INTERNATIONAL LTD.
SUPPLEMENTARY FINANCIAL INFORMATION
Selected Quarterly Financial Data (Unaudited)
Selected quarterly financial data for the years ended
September 26, 2014
and
September 27, 2013
is as follows ($ in millions, except per share data):
|
|
2014
|
||||||||||||||
|
|
1st Qtr.
|
2nd Qtr.
|
3rd Qtr.
|
4th Qtr.
|
|||||||||||
|
Net revenue
(1)
|
$
|
2,493
|
|
$
|
2,481
|
|
$
|
2,662
|
|
$
|
2,704
|
|
|||
|
Gross profit
|
918
|
|
901
|
|
984
|
|
982
|
|
|||||||
|
Income (loss) from continuing operations attributable to Tyco common shareholders
(2)
|
246
|
|
190
|
|
434
|
|
(76
|
)
|
|||||||
|
Income (loss) from discontinued operations, net of income taxes
(3)
|
24
|
|
17
|
|
1,016
|
|
(13
|
)
|
|||||||
|
Net income (loss) attributable to Tyco common shareholders
|
$
|
270
|
|
$
|
207
|
|
$
|
1,450
|
|
$
|
(89
|
)
|
|||
|
Basic earnings per share attributable to Tyco common shareholders:
|
|
|
|
||||||||||||
|
Income (loss) from continuing operations
|
$
|
0.53
|
|
$
|
0.41
|
|
$
|
0.95
|
|
$
|
(0.17
|
)
|
|||
|
Income (loss) from discontinued operations, net of income taxes
|
0.05
|
|
0.04
|
|
2.22
|
|
(0.03
|
)
|
|||||||
|
Net income (loss) attributable to Tyco common shareholders
|
$
|
0.58
|
|
$
|
0.45
|
|
$
|
3.17
|
|
$
|
(0.20
|
)
|
|||
|
Diluted earnings per share attributable to Tyco common shareholders:
|
|
|
|
||||||||||||
|
Income (loss) from continuing operations
|
$
|
0.52
|
|
$
|
0.40
|
|
$
|
0.93
|
|
$
|
(0.17
|
)
|
|||
|
Income (loss) from discontinued operations, net of income taxes
|
0.05
|
|
0.04
|
|
2.18
|
|
(0.03
|
)
|
|||||||
|
Net income (loss) attributable to Tyco common shareholders
|
$
|
0.57
|
|
$
|
0.44
|
|
$
|
3.11
|
|
$
|
(0.20
|
)
|
|||
|
(1)
|
Net revenue excludes $154 million, $151 million, $85 million and $5 million of net revenue related to discontinued operations for the first, second, third and fourth quarters of 2014, respectively.
|
|
(2)
|
Income (loss) from continuing operations attributable to Tyco common shareholders for the first quarter of fiscal 2014 includes $92 million related to a legacy legal reversal; for the third quarter of 2014 includes a $216 million gain on the sale of Atkore and for the fourth quarter of 2014 includes asbestos related charges of $225 million related to the Yarway settlement and $240 million related to an updated valuation performed over the Company's liability for asbestos related claims (excluding Yarway claims).
|
|
(3)
|
Income (loss) from discontinued operations, net of income taxes is primarily related to ADT Korea.
|
138
TYCO INTERNATIONAL LTD.
SUPPLEMENTARY FINANCIAL INFORMATION (Continued)
Selected Quarterly Financial Data (Unaudited) (Continued)
|
|
2013
|
||||||||||||||
|
|
1st Qtr.
|
2nd Qtr.
|
3rd Qtr.
|
4th Qtr.
|
|||||||||||
|
Net revenue
(1)
|
$
|
2,463
|
|
$
|
2,463
|
|
$
|
2,537
|
|
$
|
2,610
|
|
|||
|
Gross profit
|
881
|
|
882
|
|
931
|
|
977
|
|
|||||||
|
Income from continuing operations attributable to Tyco common shareholders
(2)
|
143
|
|
53
|
|
112
|
|
135
|
|
|||||||
|
Income from discontinued operations, net of income taxes
(3)
|
20
|
|
19
|
|
23
|
|
31
|
|
|||||||
|
Net income attributable to Tyco common shareholders
|
$
|
163
|
|
$
|
72
|
|
$
|
135
|
|
$
|
166
|
|
|||
|
Basic earnings per share attributable to Tyco common shareholders:
|
|
|
|
|
|||||||||||
|
Income from continuing operations
|
$
|
0.31
|
|
$
|
0.12
|
|
$
|
0.24
|
|
$
|
0.29
|
|
|||
|
Income from discontinued operations, net of income taxes
|
0.04
|
|
0.04
|
|
0.05
|
|
0.07
|
|
|||||||
|
Net income attributable to Tyco common shareholders
|
$
|
0.35
|
|
$
|
0.16
|
|
$
|
0.29
|
|
$
|
0.36
|
|
|||
|
Diluted earnings per share attributable to Tyco common shareholders:
|
|
|
|
|
|||||||||||
|
Income from continuing operations
|
$
|
0.30
|
|
$
|
0.11
|
|
$
|
0.24
|
|
$
|
0.29
|
|
|||
|
Income from discontinued operations, net of income taxes
|
0.04
|
|
0.05
|
|
0.04
|
|
0.06
|
|
|||||||
|
Net income attributable to Tyco common shareholders
|
$
|
0.34
|
|
$
|
0.16
|
|
$
|
0.28
|
|
$
|
0.35
|
|
|||
|
(1)
|
Net revenue excludes $138 million, $144 million, $141 million and $150 million of net revenue related to discontinued operations for the first, second, third and fourth quarters of 2013, respectively.
|
|
(2)
|
Income from continuing operations attributable to Tyco common shareholders for the second quarter of fiscal 2014 includes a charge of $94 million related to environmental remediation costs for the Marinette facility.
|
|
(3)
|
Income from discontinued operations, net of income taxes is primarily related to ADT Korea.
|
139
TYCO INTERNATIONAL LTD.
SCHEDULE II—VALUATION AND QUALIFYING ACCOUNTS
($ in millions)
|
Description
|
Balance at
Beginning
of Year
|
Additions
Charged to
Income
|
Acquisitions
(Divestitures)
and Other
|
Deductions
(1)
|
Balance at
End of
Year
|
||||||||||||||
|
Accounts Receivable:
|
|
|
|
|
|
||||||||||||||
|
Year Ended September 28, 2012
|
$
|
54
|
|
$
|
40
|
|
$
|
6
|
|
$
|
(40
|
)
|
$
|
60
|
|
||||
|
Year Ended September 27, 2013
|
$
|
60
|
|
55
|
|
1
|
|
(36
|
)
|
$
|
80
|
|
|||||||
|
Year Ended September 26, 2014
|
$
|
80
|
|
30
|
|
1
|
|
(36
|
)
|
$
|
75
|
|
|||||||
_______________________________________________________________________________
|
(1)
|
Deductions represent uncollectible accounts written off, net of recoveries.
|
140
TABLE OF CONTENTS
Part IItem 1. BusinessItem 1A. Risk FactorsItem 1B. Unresolved Staff CommentsItem 2. PropertiesItem 3. Legal ProceedingsItem 4. Mine Safety DisclosuresPart IIItem 5. Market For Registrant's Common Equity, Related Stockholder Matters and Issuer Purchases Of Equity SecuritiesItem 6. Selected Financial DataItem 7. Management's Discussion and Analysis Of Financial Condition and Results Of OperationsItem 7A. Quantitative and Qualitative Disclosures About Market RiskItem 8. Financial Statements and Supplementary DataItem 9. Changes in and Disagreements with Accountants on Accounting and Financial DisclosureItem 9A. Controls and ProceduresItem 9B. Other InformationPart IIIItem 10. Directors, Executive Officers and Corporate GovernanceItem 11. Executive CompensationItem 12. Security Ownership Of Certain Beneficial Owners and Management and Related Stockholder MattersItem 13. Certain Relationships and Related Transactions, and Director IndependenceItem 14. Principal Accountant Fees and ServicesPart IVItem 15. Exhibits and Financial Statement Schedules